Embed Size (px)
Citation preview
Forests 2019, 10, 703; doi:10.3390/f10080703 www.mdpi.com/journal/forests
Article
Socioeconomic Impacts of the Billion Trees
Afforestation Program in Khyber Pakhtunkhwa
Province (KPK), Pakistan
Naveed Khan 1, Syed Jamal Shah 2, Tariq Rauf 1, Muhammad Zada 1, Yukun Cao 1,*
and Jun Harbi 1,3
1 School of Economics & Management, Northeast Forestry University, Harbin 150040, China 2 School of Management, Harbin Institute of Technology, Harbin 150001, China 3 Forestry Program Study, Muhammadiyah University of Palembang, Palembang city 30263, Indonesia
* Correspondence: [email protected] or [email protected]; Tel.: +86‐136‐0488‐1358
Received: 7 July 2019; Accepted: 16 August 2019; Published: 19 August 2019
Abstract: In recent decades, the terrestrial ecosystem in Khyber Pakhtunkhwa Province (KPK),
Pakistan, has undergone tremendous destruction. To restore environmental conditions, the
government implemented the Billion Tree Afforestation Program (BTAP), with a high target to
impact multidimensional aspects of the terrestrial ecosystem. The government claims that it is local
residents who have benefited the most from the BTAP. Hence, the objective of this research was to
examine the socioeconomic impact and local rural perception of the BTAP in three districts of KPK.
Primary data were collected from 406 households. Fundamental orientation theory was used to
assess the social impacts of the BTAP, while cost–benefit analysis was applied to examine its
economic impact. The results show that the overall social impacts of the BTAP are satisfactory and
beneficial, increasing social sustainability by 69% between 2014 and 2018. Additionally, based on
the cost–benefit analysis and perception‐based analysis, it was found that the BTAP positively
affects the economic conditions of rural households. The community livelihood increased during
the program, with a total net income of 6.9 million USD in the three districts of KPK. It is concluded
that the majority of respondents have benefited from participation in the BTAP. The sustainability
of rural livelihood is one of the main concerns related to the establishment of the BTAP. Effort is
needed by the government and other parties to both increase rural household income and to protect
the environment.
Keywords: afforestation; Billion Trees Afforestation Program (BTAP); social impact; community
livelihood; deforestation; KPK Pakistan
1. Introduction
In Pakistan, the terrestrial ecosystem has undergone tremendous destruction in recent decades
as a result of population expansion, poor governance, and economic instability [1,2]. Deforestation,
grassland degradation, and desertification, among other reasons, have caused severe environmental
disturbance, such as wildlife habitat loss, dust storms, increased soil erosion, and reduced water
resources [3–7]. Furthermore, people’s livelihoods have been badly affected, as shown by the
prevalence of food insecurity and poverty, and a decrease in employment [8–12].
More recently, researchers have increasingly recognized that deforestation has negative impacts
in many aspects [13]. Deforestation makes the environment unfavorable in many ways. For example,
it accelerates soil erosion, increasing the chances of flooding, which in turn destroys crops and
livestock [14]. The solution to deforestation is afforestation/reforestation at various intervention
Forests 2019, 10, 703 2 of 21
levels (modest, intensive, and prohibitive) [15]. Each level has different time and capital (especially
financial capital) requirements, and uses different forestation techniques. Afforestation can increase
forest and tree cover, which improves ecosystem quality and thus positively affects living organisms
and confers socioeconomic benefits to human society, (e.g., increasing daily income and improving
human livelihood) [16].
Qamer, Shehzad [2] stated that, because of the extensive deforestation in Pakistan, about 170,684
ha of forest was depleted between 1990 and 2010. Deforestation in Pakistan is driven by diverse
factors [17]. To tackle these challenges, in 2014, the provincial government of Khyber Pakhtunkhwa
Province (KPK) launched a project named the Billion Trees Afforestation Project (BTAP) [18]. The
BTAP is recognized as one of the largest afforestation projects in Pakistan in terms of public
investment, geographic scope, and the number of local people impacted [19]. Hence, it has been
considered an important step towards promoting sustainable land use and forest restoration [20].
The BTAP covers 28 forest and watershed divisions of the three forest regions (Southern forest
(region 1), Northern forest (region 2), and Malakand forest (region 3)) in KPK. During Phase 1 (2014
to 2016), the government allocated a budget of Rs 1815.18 million, which helped to initiate the
activities of the program. Subsequently, Phase 2 (January 2016 to June 2017) was approved, with a
budget of Rs 8217.25 million; this phase was the main period of execution and implementation [21].
During these two periods, commercial logging and grazing were completely banned, while forest
burning and timber production were substantially reduced. In the meantime, about 593,232 ha of
suitable grassland and barren land were planted with different species of trees (via mountain closure
and planting). Specifically, 263,153 ha were allotted for afforestation, 306,983 ha were set aside for
natural regeneration by banning logging and grazing, and 23,096 hectares were used for sowing and
aerial seeding. According to the third‐party monitoring report Word Wide Fund [22], the overall
average survival rate of a plantation of the BTAP project in July 2017 was 88.75%.
According to the KPK government, BTAP differs from other forest programs in Pakistan for a
couple of reasons. First, the program objectives are not only to restore degraded forestland, but also
to enhance human livelihoods by engaging poor people from the local communities in the different
project tasks [23–25]. In particular, the program engages millions of rural residents as core agents of
project implementation, including a large private nursery scheme. Two types of nurseries were
established—potted nurseries and bare‐rooted nurseries. Each nursery produced approximately
25,000 seedlings, with seedlings from the potted nurseries and bare‐rooted nurseries having a value
of RS 6 and RS 9, respectively. About 13,000 nurseries were distributed across the districts of KPK
[22,26]. According to the KPK Forest Department, the target of planting one billion seedlings was
achieved in 2017; in Phase 3 (2017–2020), the forest department is supposed to invest Rs 7710 million
in order to maintain and protect the built assets [27]. To do so, a total of 4509 ad hoc forest guards
from the peripheral local communities (forest Nighabaan) were hired to watch and patrol the forests
by restraining illegal cutting. Another vital step that has been taken by the Forest Department is the
construction of fencing, which helps prevent trespassing. Under the principles of range management,
local forest officials are supposed to take the responsibility of protection, and are likely to transfer the
successful area of the BTAP project to the local community at the end of Phase 3 [19,23].
Government reports indicate that the BTAP has generated over 0.5 million employment
opportunities [22,28]. That is, local residents have benefited from the project, as Nighabaan were
recruited, nurseries were financed, contractors were assigned, and laborers were employed for
afforestation activities [26]. Hence, the objective of the present investigation was to examine the
socioeconomic impact of the BTAP on the local community. First, in order to assess the social impact,
we applied the orientors theory framework of Bossel [29], which has been extensively applied in
ecosystem studies (Müller, M. Leupelt (eds.), 1998). According to Bossel [29], orientors are the set of
criteria that are relevant for the evaluation of systems performance and sustainability. A system that
satisfies all of its basic orientors with respect to viability and performance will have better fitness and
sustainability. It is obligatory to obtain the minimum satisfaction for each orientor, otherwise the
sustainability of the whole system would be compromised. We utilized these orientors to create a
formal and deeper understanding of the behavior of the BTAP.
Forests 2019, 10, 703 3 of 21
Second, we examined the improvement in the livelihoods of the local communities by
employing two different approaches—a cost‐benefit analysis (CBA) [30] and a perception‐based
appraisal [31]. CBA is an effective method to evaluate the economic impacts of projects [32–35], while
perception‐based appraisal is often used to evaluate the success of any project based on the subjective
judgment of local communities [36,37]. To the best of our knowledge, the current study is the first to
investigate the socioeconomic impact of the BTAP on local communities. We believe that this study
is important and timely to understand the potential ramifications of the BTAP, allowing it to be more
effectively implemented.
The remainder of this paper is structured as follows. In Section 2, we introduce the research
setting, data sources, and methodology. In Section 3, we present our results, including the
socioeconomic impacts of the BTAP and the perceptions of local households on their livelihood. In
Section 4, we present our discussion and conclusion. Finally, in Section 5, future research directions
are given.
2. Materials and Methods
2.1. Study Area
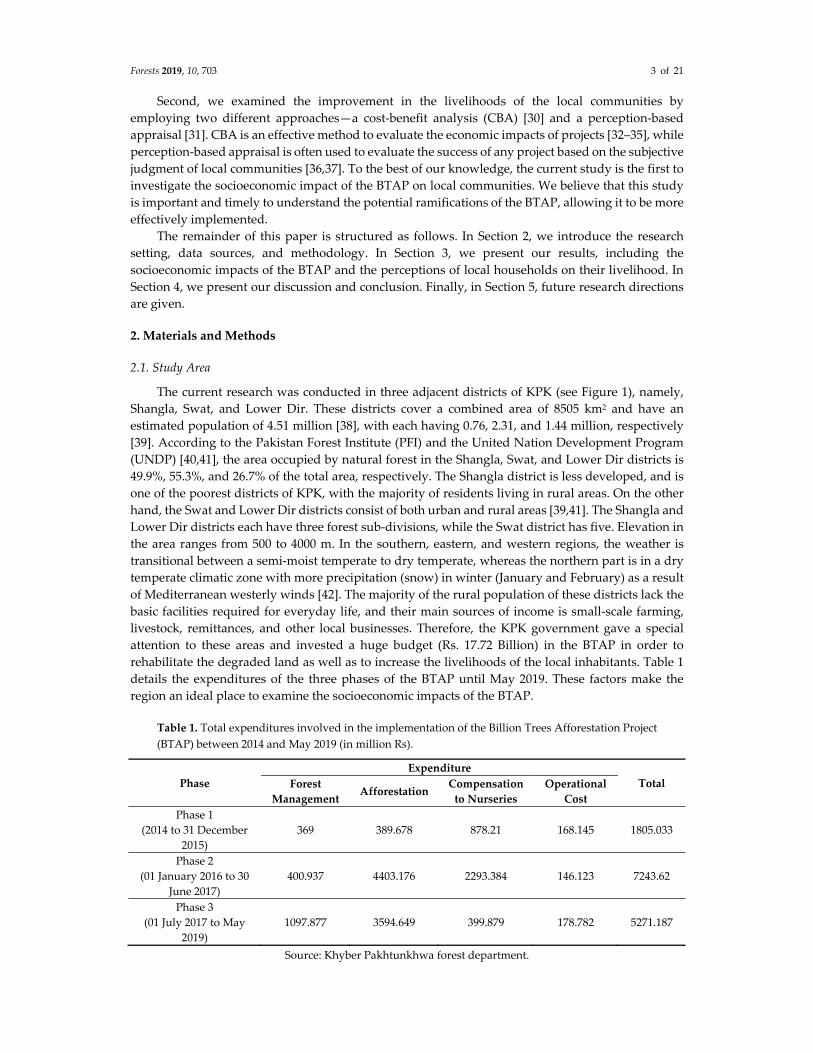
The current research was conducted in three adjacent districts of KPK (see Figure 1), namely,
Shangla, Swat, and Lower Dir. These districts cover a combined area of 8505 km2 and have an
estimated population of 4.51 million [38], with each having 0.76, 2.31, and 1.44 million, respectively
[39]. According to the Pakistan Forest Institute (PFI) and the United Nation Development Program
(UNDP) [40,41], the area occupied by natural forest in the Shangla, Swat, and Lower Dir districts is
49.9%, 55.3%, and 26.7% of the total area, respectively. The Shangla district is less developed, and is
one of the poorest districts of KPK, with the majority of residents living in rural areas. On the other
hand, the Swat and Lower Dir districts consist of both urban and rural areas [39,41]. The Shangla and
Lower Dir districts each have three forest sub‐divisions, while the Swat district has five. Elevation in
the area ranges from 500 to 4000 m. In the southern, eastern, and western regions, the weather is
transitional between a semi‐moist temperate to dry temperate, whereas the northern part is in a dry
temperate climatic zone with more precipitation (snow) in winter (January and February) as a result
of Mediterranean westerly winds [42]. The majority of the rural population of these districts lack the
basic facilities required for everyday life, and their main sources of income is small‐scale farming,
livestock, remittances, and other local businesses. Therefore, the KPK government gave a special
attention to these areas and invested a huge budget (Rs. 17.72 Billion) in the BTAP in order to
rehabilitate the degraded land as well as to increase the livelihoods of the local inhabitants. Table 1
details the expenditures of the three phases of the BTAP until May 2019. These factors make the
region an ideal place to examine the socioeconomic impacts of the BTAP.
Table 1. Total expenditures involved in the implementation of the Billion Trees Afforestation Project
(BTAP) between 2014 and May 2019 (in million Rs).
Phase
Expenditure
Total Forest
Management Afforestation
Compensation
to Nurseries
Operational
Cost
Phase 1
(2014 to 31 December
2015)
369 389.678 878.21 168.145 1805.033
Phase 2
(01 January 2016 to 30
June 2017)
400.937 4403.176 2293.384 146.123 7243.62
Phase 3
(01 July 2017 to May
2019)
1097.877 3594.649 399.879 178.782 5271.187
Source: Khyber Pakhtunkhwa forest department.
Forests 2019, 10, 703 4 of 21
Figure 1. Map of the study area (Khyber Pakhtunkhwa Province (KPK)).
2.2. Questionnaire Design, Sample Size, and Data Collection
The data used in this study were obtained in 2018 from a household survey based on a stratified
random sampling strategy [9], using a pre‐designed questionnaire (see Appendix C for details). To
avoid the possible misinterpretations of items or ambiguities in the response categories, in the first
week of January 2018, a pre‐tested of 50 households in KPK was done. In mid‐February 2018, a six‐
person investigation team surveyed the three districts. Of the 11 forest sub‐divisions in these districts,
we randomly chose seven forest sub‐divisions based on the geographic coverage of the program and
our personal knowledge of the general regional conditions. The sample districts were not of a
uniform geographical size, with the Swat district being bigger than the other two. Therefore, we
randomly chose three out of the five in the Swat district, and two out of the three from each of the
Shangla and Lower Dir districts. The forest sub‐divisions chosen from the Swat district were
Mingora, Matta, and Kabal; those from the Shangla district were Alpuri and Karora; and those from
the Lower Dir district were Timergrra and Chakdara. Then, union councils, villages, and households
were randomly selected from each of the chosen forest sub‐divisions. In general, two union councils
were selected from each forest sub‐division (2 × 7 = 14 union councils), three villages were selected
from each union council (3 × 14 = 42 villages), and around 10 households were randomly selected
from each village (10 × 42 = 420 households). A total of 420 questionnaires were executed (i.e., one
per household) and 406 were considered valid to be used in the analysis (Table 2).
Table 2. Number of respondents in the sample districts.
No. Targeted District Forest Sub‐Division Total Area under
the BTAP (km2)
Number of
Respondents
1 Shangla Alpuri 49 58
Karora 50 58
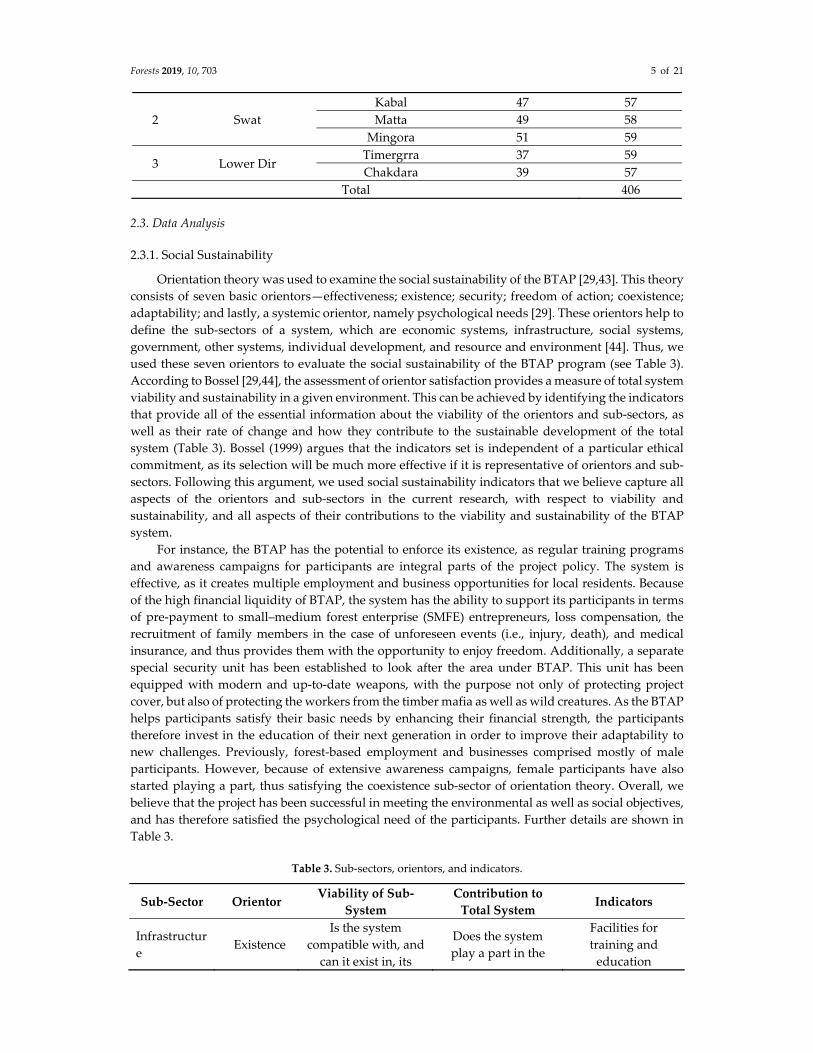
Forests 2019, 10, 703 5 of 21
2 Swat
Kabal 47 57
Matta 49 58
Mingora 51 59
3 Lower Dir Timergrra 37 59
Chakdara 39 57
Total 406
2.3. Data Analysis
2.3.1. Social Sustainability
Orientation theory was used to examine the social sustainability of the BTAP [29,43]. This theory
consists of seven basic orientors—effectiveness; existence; security; freedom of action; coexistence;
adaptability; and lastly, a systemic orientor, namely psychological needs [29]. These orientors help to
define the sub‐sectors of a system, which are economic systems, infrastructure, social systems,
government, other systems, individual development, and resource and environment [44]. Thus, we
used these seven orientors to evaluate the social sustainability of the BTAP program (see Table 3).
According to Bossel [29,44], the assessment of orientor satisfaction provides a measure of total system
viability and sustainability in a given environment. This can be achieved by identifying the indicators
that provide all of the essential information about the viability of the orientors and sub‐sectors, as
well as their rate of change and how they contribute to the sustainable development of the total
system (Table 3). Bossel (1999) argues that the indicators set is independent of a particular ethical
commitment, as its selection will be much more effective if it is representative of orientors and sub‐
sectors. Following this argument, we used social sustainability indicators that we believe capture all
aspects of the orientors and sub‐sectors in the current research, with respect to viability and
sustainability, and all aspects of their contributions to the viability and sustainability of the BTAP
system.
For instance, the BTAP has the potential to enforce its existence, as regular training programs
and awareness campaigns for participants are integral parts of the project policy. The system is
effective, as it creates multiple employment and business opportunities for local residents. Because
of the high financial liquidity of BTAP, the system has the ability to support its participants in terms
of pre‐payment to small–medium forest enterprise (SMFE) entrepreneurs, loss compensation, the
recruitment of family members in the case of unforeseen events (i.e., injury, death), and medical
insurance, and thus provides them with the opportunity to enjoy freedom. Additionally, a separate
special security unit has been established to look after the area under BTAP. This unit has been
equipped with modern and up‐to‐date weapons, with the purpose not only of protecting project
cover, but also of protecting the workers from the timber mafia as well as wild creatures. As the BTAP
helps participants satisfy their basic needs by enhancing their financial strength, the participants
therefore invest in the education of their next generation in order to improve their adaptability to
new challenges. Previously, forest‐based employment and businesses comprised mostly of male
participants. However, because of extensive awareness campaigns, female participants have also
started playing a part, thus satisfying the coexistence sub‐sector of orientation theory. Overall, we
believe that the project has been successful in meeting the environmental as well as social objectives,
and has therefore satisfied the psychological need of the participants. Further details are shown in
Table 3.
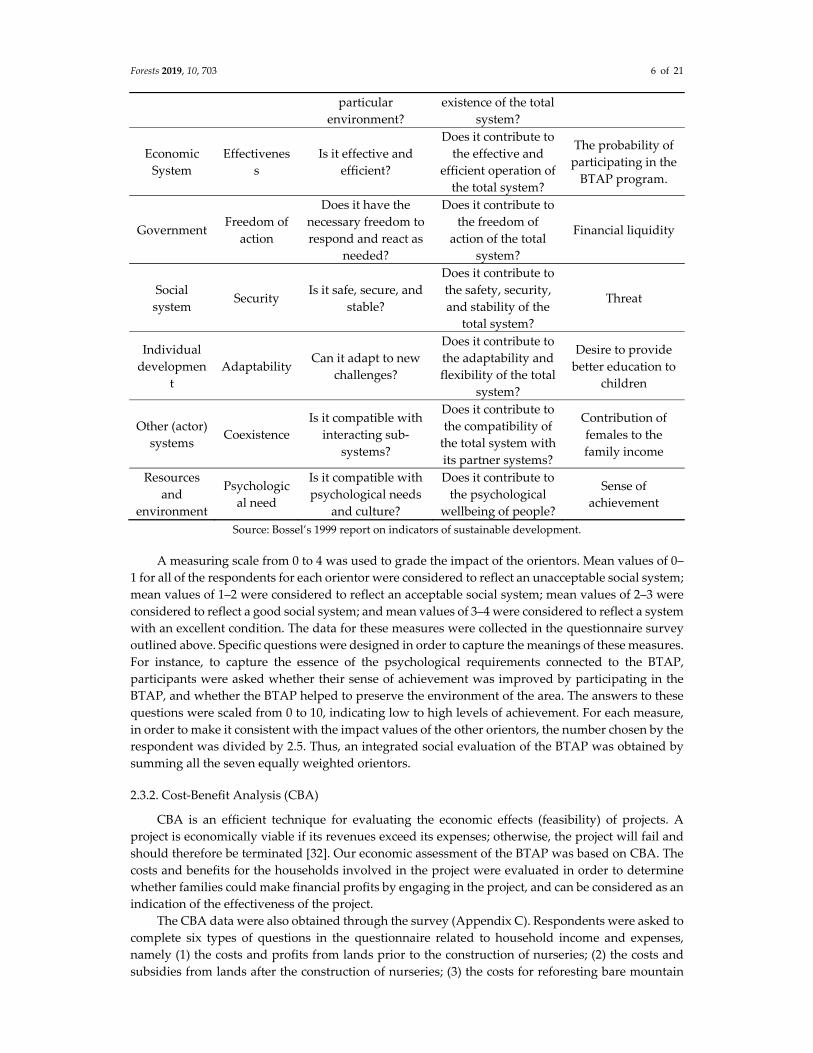
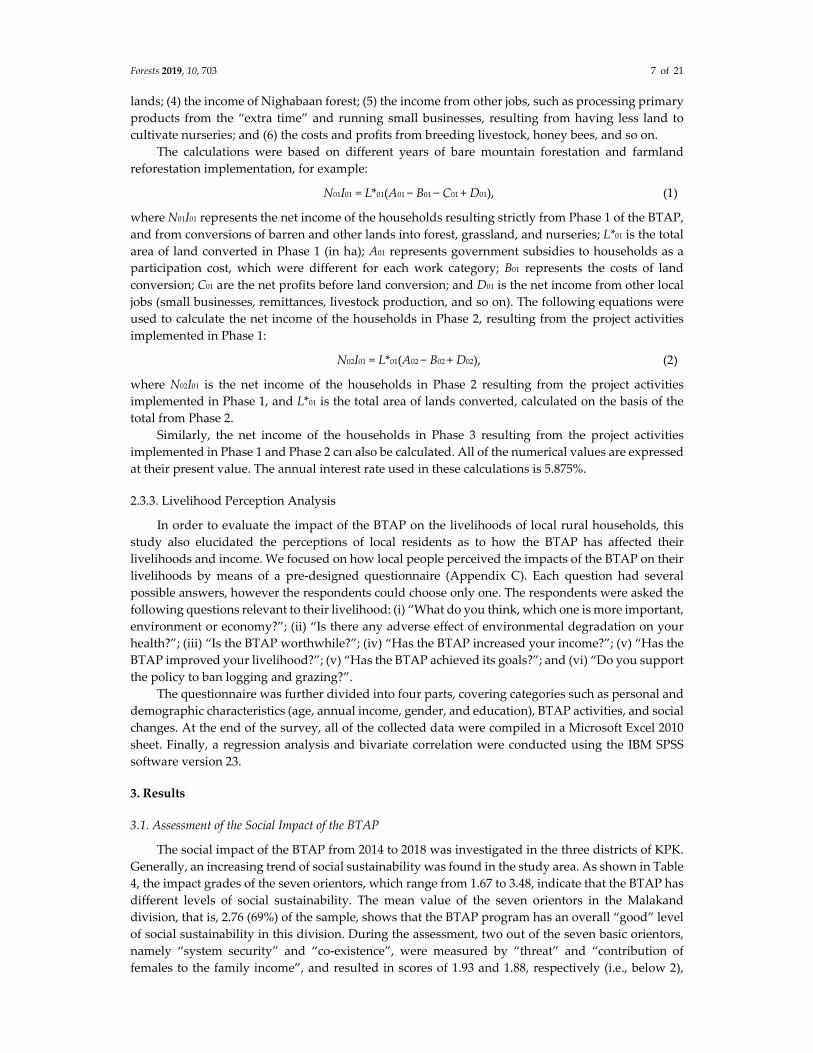
Table 3. Sub‐sectors, orientors, and indicators.
Sub‐Sector Orientor Viability of Sub‐
System
Contribution to
Total System Indicators
Infrastructur
e Existence
Is the system
compatible with, and
can it exist in, its
Does the system
play a part in the
Facilities for
training and
education
Forests 2019, 10, 703 6 of 21
particular
environment?
existence of the total
system?
Economic
System
Effectivenes
s
Is it effective and
efficient?
Does it contribute to
the effective and
efficient operation of
the total system?
The probability of
participating in the
BTAP program.
Government Freedom of
action
Does it have the
necessary freedom to
respond and react as
needed?
Does it contribute to
the freedom of
action of the total
system?
Financial liquidity
Social
system Security
Is it safe, secure, and
stable?
Does it contribute to
the safety, security,
and stability of the
total system?
Threat
Individual
developmen
t
Adaptability Can it adapt to new
challenges?
Does it contribute to
the adaptability and
flexibility of the total
system?
Desire to provide
better education to
children
Other (actor)
systems Coexistence
Is it compatible with
interacting sub‐
systems?
Does it contribute to
the compatibility of
the total system with
its partner systems?
Contribution of
females to the
family income
Resources
and
environment
Psychologic
al need
Is it compatible with
psychological needs
and culture?
Does it contribute to
the psychological
wellbeing of people?
Sense of
achievement
Source: Bossel’s 1999 report on indicators of sustainable development.
A measuring scale from 0 to 4 was used to grade the impact of the orientors. Mean values of 0–
1 for all of the respondents for each orientor were considered to reflect an unacceptable social system;
mean values of 1–2 were considered to reflect an acceptable social system; mean values of 2–3 were
considered to reflect a good social system; and mean values of 3–4 were considered to reflect a system
with an excellent condition. The data for these measures were collected in the questionnaire survey
outlined above. Specific questions were designed in order to capture the meanings of these measures.
For instance, to capture the essence of the psychological requirements connected to the BTAP,
participants were asked whether their sense of achievement was improved by participating in the
BTAP, and whether the BTAP helped to preserve the environment of the area. The answers to these
questions were scaled from 0 to 10, indicating low to high levels of achievement. For each measure,
in order to make it consistent with the impact values of the other orientors, the number chosen by the
respondent was divided by 2.5. Thus, an integrated social evaluation of the BTAP was obtained by
summing all the seven equally weighted orientors.
2.3.2. Cost‐Benefit Analysis (CBA)
CBA is an efficient technique for evaluating the economic effects (feasibility) of projects. A
project is economically viable if its revenues exceed its expenses; otherwise, the project will fail and
should therefore be terminated [32]. Our economic assessment of the BTAP was based on CBA. The
costs and benefits for the households involved in the project were evaluated in order to determine
whether families could make financial profits by engaging in the project, and can be considered as an
indication of the effectiveness of the project.
The CBA data were also obtained through the survey (Appendix C). Respondents were asked to
complete six types of questions in the questionnaire related to household income and expenses,
namely (1) the costs and profits from lands prior to the construction of nurseries; (2) the costs and
subsidies from lands after the construction of nurseries; (3) the costs for reforesting bare mountain
Forests 2019, 10, 703 7 of 21
lands; (4) the income of Nighabaan forest; (5) the income from other jobs, such as processing primary
products from the “extra time” and running small businesses, resulting from having less land to
cultivate nurseries; and (6) the costs and profits from breeding livestock, honey bees, and so on.
The calculations were based on different years of bare mountain forestation and farmland
reforestation implementation, for example:
N01I01 = L*01(A01 − B01 − C01 + D01), (1)
where N01I01 represents the net income of the households resulting strictly from Phase 1 of the BTAP,
and from conversions of barren and other lands into forest, grassland, and nurseries; L*01 is the total
area of land converted in Phase 1 (in ha); A01 represents government subsidies to households as a
participation cost, which were different for each work category; B01 represents the costs of land
conversion; C01 are the net profits before land conversion; and D01 is the net income from other local
jobs (small businesses, remittances, livestock production, and so on). The following equations were
used to calculate the net income of the households in Phase 2, resulting from the project activities
implemented in Phase 1:
N02I01 = L*01(A02 − B02 + D02), (2)
where N02I01 is the net income of the households in Phase 2 resulting from the project activities
implemented in Phase 1, and L*01 is the total area of lands converted, calculated on the basis of the
total from Phase 2.
Similarly, the net income of the households in Phase 3 resulting from the project activities
implemented in Phase 1 and Phase 2 can also be calculated. All of the numerical values are expressed
at their present value. The annual interest rate used in these calculations is 5.875%.
2.3.3. Livelihood Perception Analysis
In order to evaluate the impact of the BTAP on the livelihoods of local rural households, this
study also elucidated the perceptions of local residents as to how the BTAP has affected their
livelihoods and income. We focused on how local people perceived the impacts of the BTAP on their
livelihoods by means of a pre‐designed questionnaire (Appendix C). Each question had several
possible answers, however the respondents could choose only one. The respondents were asked the
following questions relevant to their livelihood: (i) “What do you think, which one is more important,
environment or economy?”; (ii) “Is there any adverse effect of environmental degradation on your
health?”; (iii) “Is the BTAP worthwhile?”; (iv) “Has the BTAP increased your income?”; (v) “Has the
BTAP improved your livelihood?”; (v) “Has the BTAP achieved its goals?”; and (vi) “Do you support
the policy to ban logging and grazing?”.
The questionnaire was further divided into four parts, covering categories such as personal and
demographic characteristics (age, annual income, gender, and education), BTAP activities, and social
changes. At the end of the survey, all of the collected data were compiled in a Microsoft Excel 2010
sheet. Finally, a regression analysis and bivariate correlation were conducted using the IBM SPSS
software version 23.
3. Results
3.1. Assessment of the Social Impact of the BTAP
The social impact of the BTAP from 2014 to 2018 was investigated in the three districts of KPK.
Generally, an increasing trend of social sustainability was found in the study area. As shown in Table
4, the impact grades of the seven orientors, which range from 1.67 to 3.48, indicate that the BTAP has
different levels of social sustainability. The mean value of the seven orientors in the Malakand
division, that is, 2.76 (69%) of the sample, shows that the BTAP program has an overall “good” level
of social sustainability in this division. During the assessment, two out of the seven basic orientors,
namely “system security” and “co‐existence”, were measured by “threat” and “contribution of
females to the family income”, and resulted in scores of 1.93 and 1.88, respectively (i.e., below 2),
Forests 2019, 10, 703 8 of 21
indicating a barely acceptable or poor condition. The three orientors of existence, adaptability, and
psychological need were measured by facilities for training and education, as well as by the desire to
provide a better education to children, and obtained sense of achievement scores of 2.9, 2.92, and 2.91,
respectively. The fact that the scores of the orientors range from 2–3 indicates the good condition of
the program. In our social assessment of the BTAP, two basic system orientors, namely “freedom of
action” and “effectiveness”, were measured by “financial liquidity” and “probability of participating
in the BTAP program”; the scores of these orientors were between 3.33 and 3.48, indicating an
excellent condition of the program. Overall, the results of the assessment show that the BTAP has a
positive influence on rural households in the study area.
Table 4. Assessment of the social impacts of the BTAP in the Malakand Division of KPK, as a
“sustainable indicator”.
Basic/Define
Orientors
Indicators for Orientors
(Sub‐Sector) Measures
Impact
Grade (0–4) Score (0–4)
Final
Assessment
Effectiveness
Probability of
participating in the BTAP
program
4 3.48 Excellent
Freedom of action Financial liquidity 4 3.33 Excellent
Existence Facilities for training and
education 4 2.9 Good
Security Threat 4 1.93 Acceptable
Adaptability Desire to provide better
education to children 4 2.92 Good
Coexistence Contribution of females to
the family income 4 1.88 Acceptable
Psychological need Sense of achievement 4 2.91 Good
total sustainability of the program 4 2.76 Good
3.2. Economical Assessment
Since the implementation of the BTAP, the households in the study area have experienced a
change in household income (see Table 5). In the BTAP, a total of 593,232 ha of barren land and
degraded mountains were converted to forest land. Local households involved in the BTAP, such as
private and government nurseries, as well as Nighabaan forest; afforestation; and other economic
sectors, were financially subsidized by the provincial government. These subsidies included 150,000
Rs for one unit (25,000 seeds) of tube nursery, Rs 225,000 for bare‐rooted nurseries, and Rs 13,000 for
Nighabaan forest per month (as of July 2019, 1 USD = 158 Rs). In Phases 1–3, only the subsidy for
Nighabaan increased, to Rs 15,000 per month. By combining the economic benefits from the other
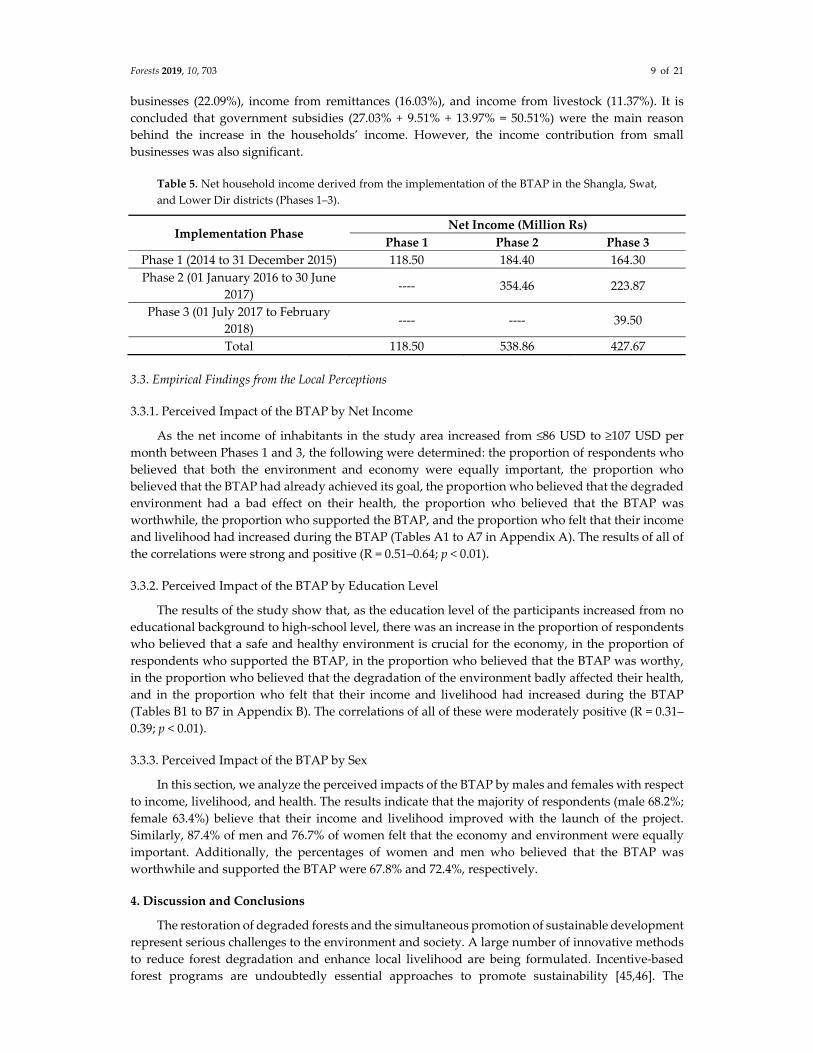
sectors and government subsidies, it is estimated that in Phase 1, a total of 118.50 million rupees of
income was generated for rural households in these three districts. These local households continued
to receive economic benefits in Phase 2 and Phase 3, when the total income of these households was
184.40 million and 164.30 million rupees, respectively. As Phase 2 was the main execution period, a
second batch of households participated in different activities of the BTAP. The economic income of
these households in Phase 2 and Phase 3 was 354.46 million and 223.87 million rupees, respectively.
At the end of Phase 2, almost all of the nursery seedlings were fully grown and sold, and the planting
had also been completed. Therefore, the income of these households decreased in Phase 3, to 39.50
million rupees.
This study has found an overall economic benefit from the implementation of the BTAP in the
study area. Between Phases 1 and 3, an estimated total of 1085.03 million rupees (around 6.9 million
USD) of household income was generated by the rural households involved in the BTAP in the three
studied districts. This income gains comprised government subsidies, such as support for nurseries
(27.03%), Nighabaan income (9.51%), plantation establishment income (13.97%), income from small
Forests 2019, 10, 703 9 of 21
businesses (22.09%), income from remittances (16.03%), and income from livestock (11.37%). It is
concluded that government subsidies (27.03% + 9.51% + 13.97% = 50.51%) were the main reason
behind the increase in the households’ income. However, the income contribution from small
businesses was also significant.
Table 5. Net household income derived from the implementation of the BTAP in the Shangla, Swat,
and Lower Dir districts (Phases 1–3).
Implementation Phase Net Income (Million Rs)
Phase 1 Phase 2 Phase 3
Phase 1 (2014 to 31 December 2015) 118.50 184.40 164.30
Phase 2 (01 January 2016 to 30 June
2017) ‐‐‐‐ 354.46 223.87
Phase 3 (01 July 2017 to February
2018) ‐‐‐‐ ‐‐‐‐ 39.50
Total 118.50 538.86 427.67
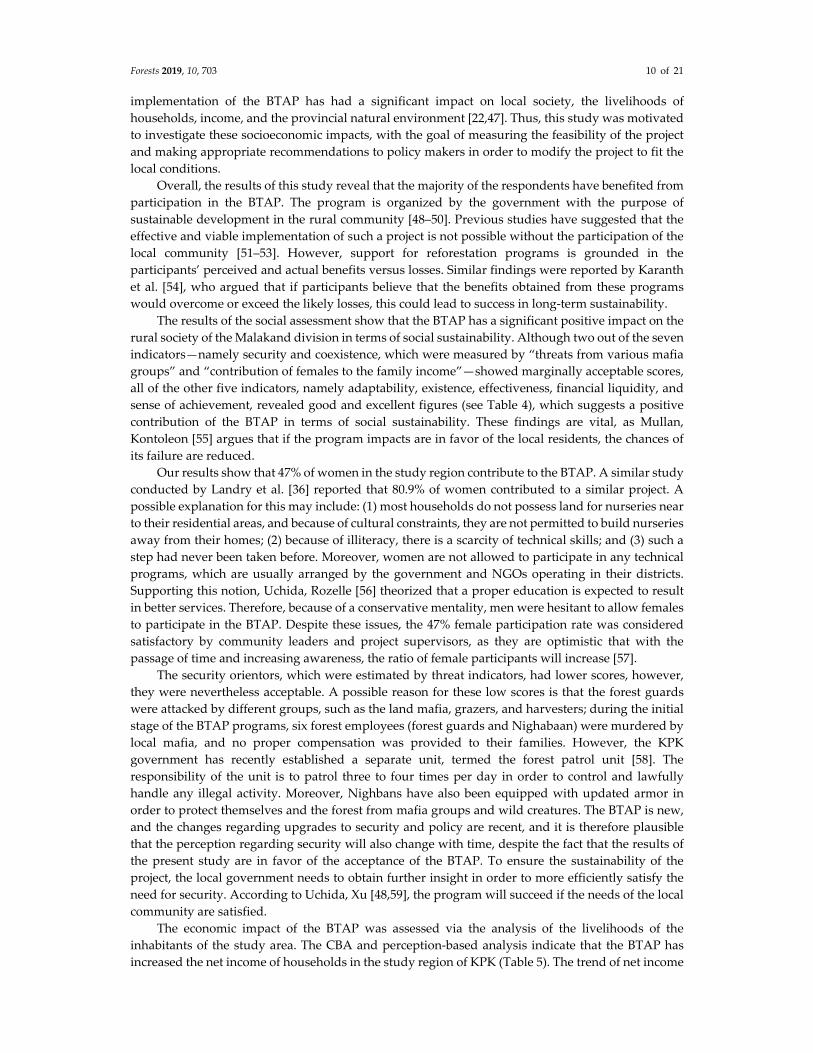
3.3. Empirical Findings from the Local Perceptions
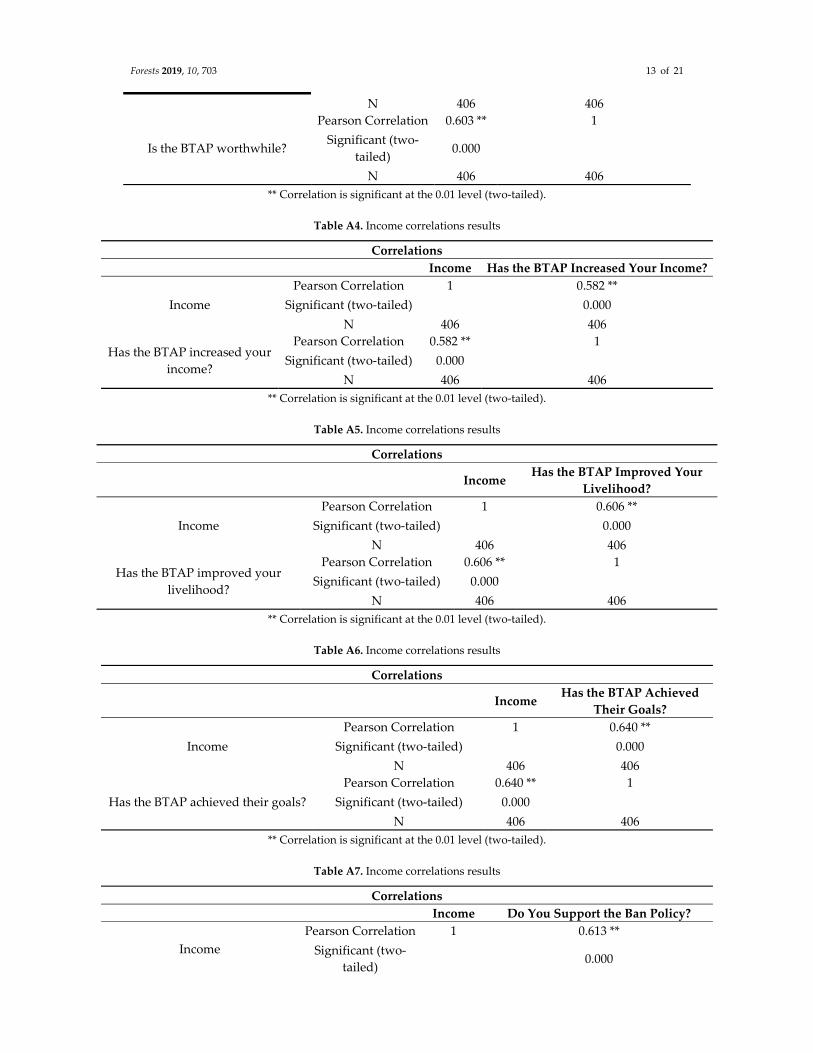
3.3.1. Perceived Impact of the BTAP by Net Income
As the net income of inhabitants in the study area increased from ≤86 USD to ≥107 USD per
month between Phases 1 and 3, the following were determined: the proportion of respondents who
believed that both the environment and economy were equally important, the proportion who
believed that the BTAP had already achieved its goal, the proportion who believed that the degraded
environment had a bad effect on their health, the proportion who believed that the BTAP was
worthwhile, the proportion who supported the BTAP, and the proportion who felt that their income
and livelihood had increased during the BTAP (Tables A1 to A7 in Appendix A). The results of all of
the correlations were strong and positive (R = 0.51–0.64; p < 0.01).
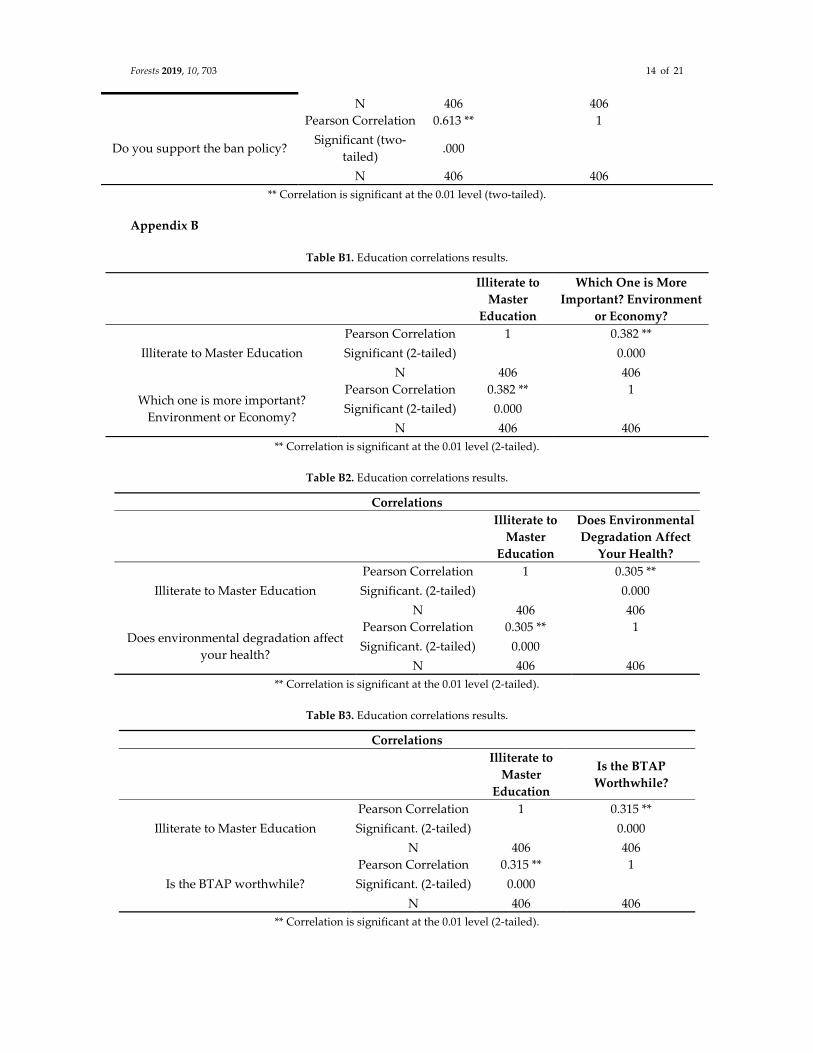
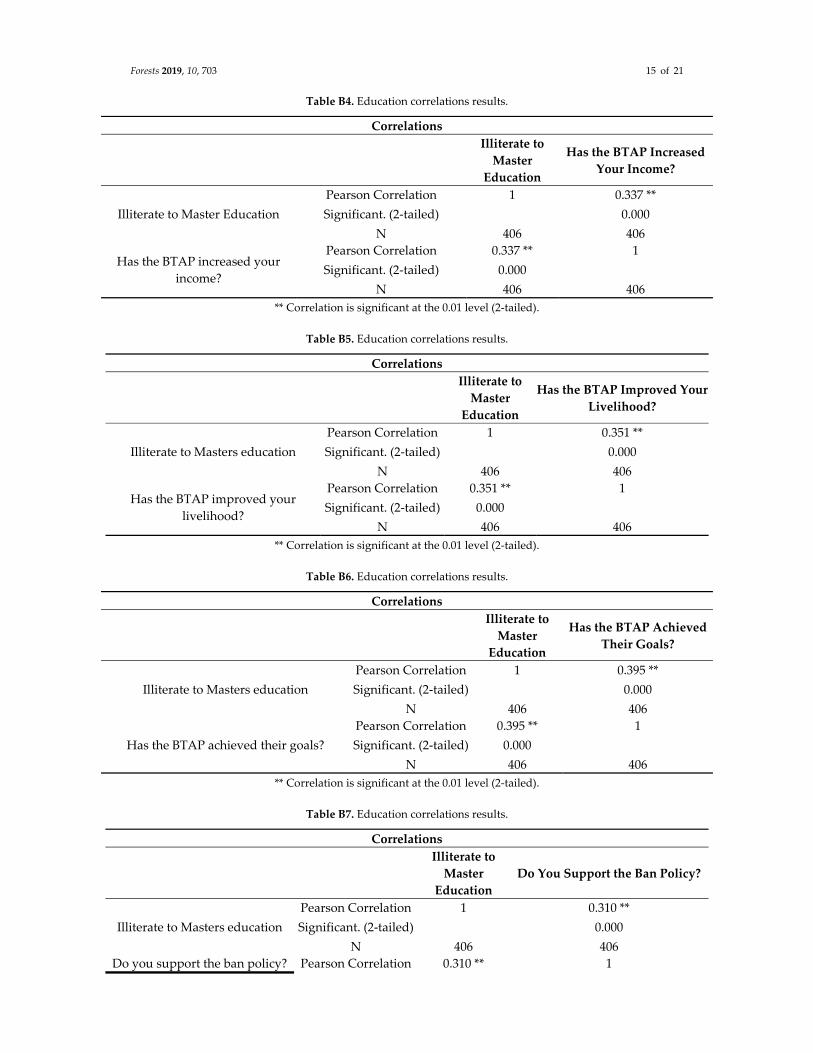
3.3.2. Perceived Impact of the BTAP by Education Level
The results of the study show that, as the education level of the participants increased from no
educational background to high‐school level, there was an increase in the proportion of respondents
who believed that a safe and healthy environment is crucial for the economy, in the proportion of
respondents who supported the BTAP, in the proportion who believed that the BTAP was worthy,
in the proportion who believed that the degradation of the environment badly affected their health,
and in the proportion who felt that their income and livelihood had increased during the BTAP
(Tables B1 to B7 in Appendix B). The correlations of all of these were moderately positive (R = 0.31–
0.39; p < 0.01).
3.3.3. Perceived Impact of the BTAP by Sex
In this section, we analyze the perceived impacts of the BTAP by males and females with respect
to income, livelihood, and health. The results indicate that the majority of respondents (male 68.2%;
female 63.4%) believe that their income and livelihood improved with the launch of the project.
Similarly, 87.4% of men and 76.7% of women felt that the economy and environment were equally
important. Additionally, the percentages of women and men who believed that the BTAP was
worthwhile and supported the BTAP were 67.8% and 72.4%, respectively.
4. Discussion and Conclusions
The restoration of degraded forests and the simultaneous promotion of sustainable development
represent serious challenges to the environment and society. A large number of innovative methods
to reduce forest degradation and enhance local livelihood are being formulated. Incentive‐based
forest programs are undoubtedly essential approaches to promote sustainability [45,46]. The
Forests 2019, 10, 703 10 of 21
implementation of the BTAP has had a significant impact on local society, the livelihoods of
households, income, and the provincial natural environment [22,47]. Thus, this study was motivated
to investigate these socioeconomic impacts, with the goal of measuring the feasibility of the project
and making appropriate recommendations to policy makers in order to modify the project to fit the
local conditions.
Overall, the results of this study reveal that the majority of the respondents have benefited from
participation in the BTAP. The program is organized by the government with the purpose of
sustainable development in the rural community [48–50]. Previous studies have suggested that the
effective and viable implementation of such a project is not possible without the participation of the
local community [51–53]. However, support for reforestation programs is grounded in the
participants’ perceived and actual benefits versus losses. Similar findings were reported by Karanth
et al. [54], who argued that if participants believe that the benefits obtained from these programs
would overcome or exceed the likely losses, this could lead to success in long‐term sustainability.
The results of the social assessment show that the BTAP has a significant positive impact on the
rural society of the Malakand division in terms of social sustainability. Although two out of the seven
indicators—namely security and coexistence, which were measured by “threats from various mafia
groups” and “contribution of females to the family income”—showed marginally acceptable scores,
all of the other five indicators, namely adaptability, existence, effectiveness, financial liquidity, and
sense of achievement, revealed good and excellent figures (see Table 4), which suggests a positive
contribution of the BTAP in terms of social sustainability. These findings are vital, as Mullan,
Kontoleon [55] argues that if the program impacts are in favor of the local residents, the chances of
its failure are reduced.
Our results show that 47% of women in the study region contribute to the BTAP. A similar study
conducted by Landry et al. [36] reported that 80.9% of women contributed to a similar project. A
possible explanation for this may include: (1) most households do not possess land for nurseries near
to their residential areas, and because of cultural constraints, they are not permitted to build nurseries
away from their homes; (2) because of illiteracy, there is a scarcity of technical skills; and (3) such a
step had never been taken before. Moreover, women are not allowed to participate in any technical
programs, which are usually arranged by the government and NGOs operating in their districts.
Supporting this notion, Uchida, Rozelle [56] theorized that a proper education is expected to result
in better services. Therefore, because of a conservative mentality, men were hesitant to allow females
to participate in the BTAP. Despite these issues, the 47% female participation rate was considered
satisfactory by community leaders and project supervisors, as they are optimistic that with the
passage of time and increasing awareness, the ratio of female participants will increase [57].
The security orientors, which were estimated by threat indicators, had lower scores, however,
they were nevertheless acceptable. A possible reason for these low scores is that the forest guards
were attacked by different groups, such as the land mafia, grazers, and harvesters; during the initial
stage of the BTAP programs, six forest employees (forest guards and Nighabaan) were murdered by
local mafia, and no proper compensation was provided to their families. However, the KPK
government has recently established a separate unit, termed the forest patrol unit [58]. The
responsibility of the unit is to patrol three to four times per day in order to control and lawfully
handle any illegal activity. Moreover, Nighbans have also been equipped with updated armor in
order to protect themselves and the forest from mafia groups and wild creatures. The BTAP is new,
and the changes regarding upgrades to security and policy are recent, and it is therefore plausible
that the perception regarding security will also change with time, despite the fact that the results of
the present study are in favor of the acceptance of the BTAP. To ensure the sustainability of the
project, the local government needs to obtain further insight in order to more efficiently satisfy the
need for security. According to Uchida, Xu [48,59], the program will succeed if the needs of the local
community are satisfied.
The economic impact of the BTAP was assessed via the analysis of the livelihoods of the
inhabitants of the study area. The CBA and perception‐based analysis indicate that the BTAP has
increased the net income of households in the study region of KPK (Table 5). The trend of net income
Forests 2019, 10, 703 11 of 21
rise can be attributed to the activities that were conducted in each phase of the program. The analysis
of the perception of rural households shows that the BTAP has had a significant impact on the
livelihood of the local community, despite the fact that the BTAP has a ban policy towards grazing
and logging. Our study indicates that the poor people living in the study area intend to support the
BTAP. During the field survey, local residents, leaders, and officials were asked why, despite a ban
on grazing and logging, their income and livelihood has not been adversely affected. Their reply was
three‐fold. First, most of the residents of the study area only have access to poor‐quality, inaccessible,
or immature timber, even before the project. Second, aligned with Qamer et al. [40], much of the land
in KPK was barren and deforested, but had recently been reforested by the government. Specifically,
the KPK forest department identified, targeted, and rehabilitated the degraded land, which was
already sidelined by the local community with respect to logging and grazing. The response to our
household survey also indicated that much of the timber on the respondents’ forestland had already
been harvested. Lastly, the people living in the area of the BTAP are receiving financial support from
the provincial government in the form of salaries and profit, and the ban on grazing and logging is
therefore irrelevant to them. These results are consistent with the study of Mullan [55], who argued
that bans on logging and grazing are perceived as irrelevant, and the overall livelihood of the
community increases when the government provides financial support. In a similar vein, other
researchers have suggested that individuals usually prefer the option of sustainable earning over
short‐term revenues [60]. Therefore, the loggers and timber mafia of the past have now been
transformed into tree planters and forest protectors.
With government subsidies accounting for 50.51% of the total rise in income in the study area
during the study period, household income depends heavily on government financial support. It is
unclear what will happen to rural household incomes when the government ends the subsidies after
Phase 3 of the BTAP. The large proportion of governmental financial support to the net income of the
households creates some difficulties for sustaining the long‐term household income level after the
BTAP. Therefore, the government should allow the community to manage forests by themselves, thus
producing a community forest, and should also present opportunities for locals to change their
livelihoods to ones that do not involve the use of timber—for example, harvesting NTFPs (non‐timber
forest products), planting fruit trees, and breeding livestock. This can be a win–win solution for forest
conservation and the fulfillment of human wellbeing [16,61]. To implement livelihood change
strategies, the academic sector, the business sector, the community NGOs and civil society
organizations, and the government can collaborate to provide technical and vocational training to
process the NTFP or other products and processing equipment. The government could also provide
means for the locals to access funding sources so that households can adopt desirable land use
practices that both accomplish the goals of the BTAP and provide them with sufficient income to
survive. Finally, rural residents must be given access to the same government funds for education,
health care, and pensions that are provided to urban residents. To ensure the sustainability of the
project over the period of five years, audit regarding funding and management is required. This will
highlight the shortcoming and will open a new window for the improvement in policies. If these
efforts can be properly made, the aims of increasing rural household incomes and protecting the
environment will be likely attained.
5. Future Directions
This study investigated the impacts of the BTAP based on the actual and perceived benefits of
the local people. Future research may also examine the possible negative social, economic, and
cultural impacts of the BTAP on the local inhabitants. It is believed that if the BTAP is properly
implemented, it is more likely to offset the negative results of logging bans. Apart from improving
people’s livelihoods and social sustainability, the BTAP is expected to mitigate problems such as
biodiversity loss, soil erosion, water runoff, and flooding. Thus, researchers ought to investigate the
environmental impacts of the BTAP as well.
Forests 2019, 10, 703 12 of 21
Finally, similar studies can be carried out on more aggregated secondary data with a longer
temporal scale, a broader spatial scale, and more complete area coverage, in order to obtain robust
empirical findings to more comprehensively understand the effects of the BTAP.
Author Contributions: The following is the description of authors’ contribution. First, N.K. and C.Y. helped in
conceptualizing the idea of the study design. Second, J.S. performed the statistical analysis and contributed to
writing (review and editing). Hence, N.K. and J.S. had an equal contribution. T.R., M.Z., and J.H. contributed in
the collection of data and provided their intellectual insight.
Funding: The study presented in this paper is supported by the National Social Science Foundation, grant
number 13BJY032.
Acknowledgments: We would like to acknowledge the financial support from National Social Science
Foundation as well as assistance from the School of Economics and Management of Northeast Forestry
University, we are grateful to Dawood Afridi, the “Evaluation and Monitoring Officer” of BTAP for support
during the field trips. The authors are grateful to the Area Editor and anonymous reviewers whose comments
have contributed to improving the quality of this paper and at last we are also very thankful for the valuable
suggestions and comments of Runsheng Yin of Michigan State University, USA.
Conflicts of Interest: The authors declare no conflict of interest.
Appendix A
Table A1. Income correlations results
Income Which One is More Important?
Environment or Economy?
Income
Pearson Correlation 1 0.518 **
Significant (two‐tailed) 0.000
N 406 406
Which one is more important?
Environment or economy?
Pearson Correlation 0.518 ** 1
Significant (two‐tailed) 0.000
N 406 406
** Correlation is significant at the 0.01 level (two‐tailed).
Table A2. Income correlations results
Correlations
Income
Does Environmental
Degradation Affect Your
Health?
Income
Pearson Correlation 1 0.501 **
Significant (two‐tailed) 0.000
N 406 406
Does environmental degradation
affect your health?
Pearson Correlation 0.501 ** 1
Significant (two‐tailed) 0.000
N 406 406
** Correlation is significant at the 0.01 level (two‐tailed).
Table A3. Income correlations results
Correlations
Income Is the BTAP Worthwhile?
Income
Pearson Correlation 1 0.603 **
Significant (two‐
tailed) 0.000
Forests 2019, 10, 703 13 of 21
N 406 406
Is the BTAP worthwhile?
Pearson Correlation 0.603 ** 1
Significant (two‐
tailed) 0.000
N 406 406
** Correlation is significant at the 0.01 level (two‐tailed).
Table A4. Income correlations results
Correlations
Income Has the BTAP Increased Your Income?
Income
Pearson Correlation 1 0.582 **
Significant (two‐tailed) 0.000
N 406 406
Has the BTAP increased your
income?
Pearson Correlation 0.582 ** 1
Significant (two‐tailed) 0.000
N 406 406
** Correlation is significant at the 0.01 level (two‐tailed).
Table A5. Income correlations results
Correlations
Income Has the BTAP Improved Your
Livelihood?
Income
Pearson Correlation 1 0.606 **
Significant (two‐tailed) 0.000
N 406 406
Has the BTAP improved your
livelihood?
Pearson Correlation 0.606 ** 1
Significant (two‐tailed) 0.000
N 406 406
** Correlation is significant at the 0.01 level (two‐tailed).
Table A6. Income correlations results
Correlations
Income Has the BTAP Achieved
Their Goals?
Income
Pearson Correlation 1 0.640 **
Significant (two‐tailed) 0.000
N 406 406
Has the BTAP achieved their goals?
Pearson Correlation 0.640 ** 1
Significant (two‐tailed) 0.000
N 406 406
** Correlation is significant at the 0.01 level (two‐tailed).
Table A7. Income correlations results
Correlations
Income Do You Support the Ban Policy?
Income
Pearson Correlation 1 0.613 **
Significant (two‐
tailed) 0.000
Forests 2019, 10, 703 14 of 21
N 406 406
Do you support the ban policy?
Pearson Correlation 0.613 ** 1
Significant (two‐
tailed) .000
N 406 406
** Correlation is significant at the 0.01 level (two‐tailed).
Appendix B
Table B1. Education correlations results.
Illiterate to
Master
Education
Which One is More
Important? Environment
or Economy?
Illiterate to Master Education
Pearson Correlation 1 0.382 **
Significant (2‐tailed) 0.000
N 406 406
Which one is more important?
Environment or Economy?
Pearson Correlation 0.382 ** 1
Significant (2‐tailed) 0.000
N 406 406
** Correlation is significant at the 0.01 level (2‐tailed).
Table B2. Education correlations results.
Correlations
Illiterate to
Master
Education
Does Environmental
Degradation Affect
Your Health?
Illiterate to Master Education
Pearson Correlation 1 0.305 **
Significant. (2‐tailed) 0.000
N 406 406
Does environmental degradation affect
your health?
Pearson Correlation 0.305 ** 1
Significant. (2‐tailed) 0.000
N 406 406
** Correlation is significant at the 0.01 level (2‐tailed).
Table B3. Education correlations results.
Correlations
Illiterate to
Master
Education
Is the BTAP
Worthwhile?
Illiterate to Master Education
Pearson Correlation 1 0.315 **
Significant. (2‐tailed) 0.000
N 406 406
Is the BTAP worthwhile?
Pearson Correlation 0.315 ** 1
Significant. (2‐tailed) 0.000
N 406 406
** Correlation is significant at the 0.01 level (2‐tailed).
Forests 2019, 10, 703 15 of 21
Table B4. Education correlations results.
Correlations
Illiterate to
Master
Education
Has the BTAP Increased
Your Income?
Illiterate to Master Education
Pearson Correlation 1 0.337 **
Significant. (2‐tailed) 0.000
N 406 406
Has the BTAP increased your
income?
Pearson Correlation 0.337 ** 1
Significant. (2‐tailed) 0.000
N 406 406
** Correlation is significant at the 0.01 level (2‐tailed).
Table B5. Education correlations results.
Correlations
Illiterate to
Master
Education
Has the BTAP Improved Your
Livelihood?
Illiterate to Masters education
Pearson Correlation 1 0.351 **
Significant. (2‐tailed) 0.000
N 406 406
Has the BTAP improved your
livelihood?
Pearson Correlation 0.351 ** 1
Significant. (2‐tailed) 0.000
N 406 406
** Correlation is significant at the 0.01 level (2‐tailed).
Table B6. Education correlations results.
Correlations
Illiterate to
Master
Education
Has the BTAP Achieved
Their Goals?
Illiterate to Masters education
Pearson Correlation 1 0.395 **
Significant. (2‐tailed) 0.000
N 406 406
Has the BTAP achieved their goals?
Pearson Correlation 0.395 ** 1
Significant. (2‐tailed) 0.000
N 406 406
** Correlation is significant at the 0.01 level (2‐tailed).
Table B7. Education correlations results.
Correlations
Illiterate to
Master
Education
Do You Support the Ban Policy?
Illiterate to Masters education
Pearson Correlation 1 0.310 **
Significant. (2‐tailed) 0.000
N 406 406
Do you support the ban policy? Pearson Correlation 0.310 ** 1
Forests 2019, 10, 703 16 of 21
Significant. (2‐tailed) 0.000
N 406 406
** Correlation is significant at the 0.01 level (2‐tailed).
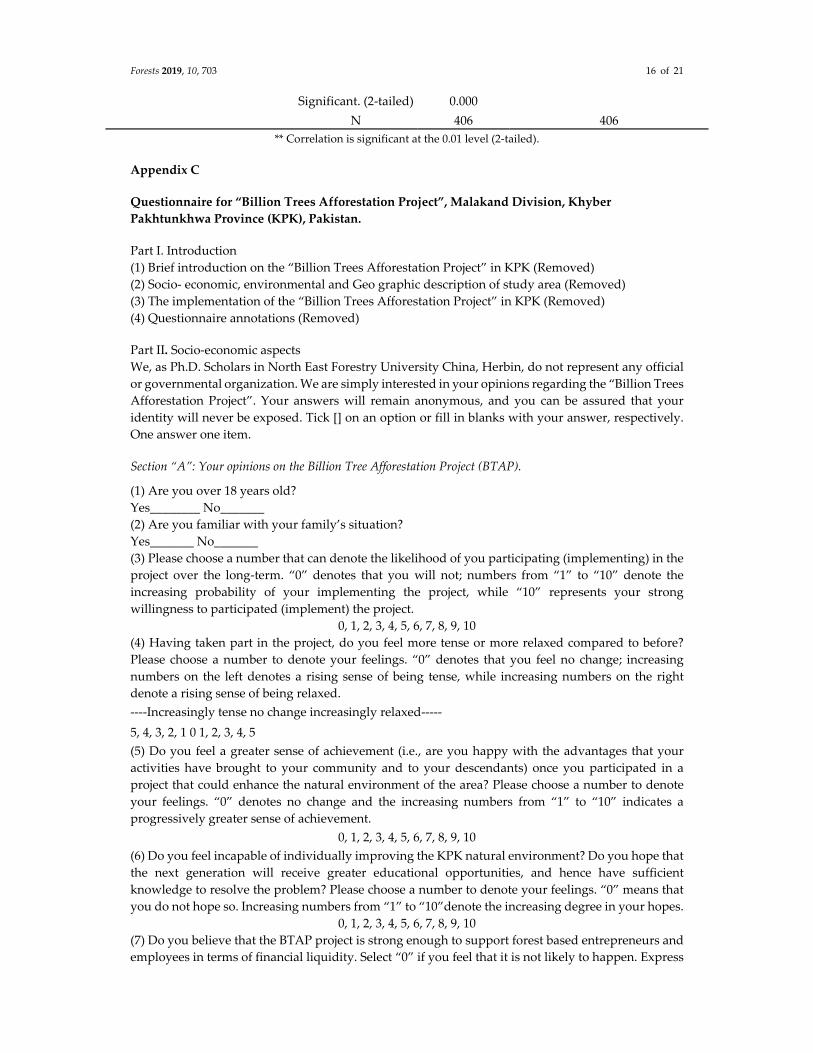
Appendix C
Questionnaire for “Billion Trees Afforestation Project”, Malakand Division, Khyber
Pakhtunkhwa Province (KPK), Pakistan.
Part I. Introduction
(1) Brief introduction on the “Billion Trees Afforestation Project” in KPK (Removed)
(2) Socio‐ economic, environmental and Geo graphic description of study area (Removed)
(3) The implementation of the “Billion Trees Afforestation Project” in KPK (Removed)
(4) Questionnaire annotations (Removed)
Part II. Socio‐economic aspects
We, as Ph.D. Scholars in North East Forestry University China, Herbin, do not represent any official
or governmental organization. We are simply interested in your opinions regarding the “Billion Trees
Afforestation Project”. Your answers will remain anonymous, and you can be assured that your
identity will never be exposed. Tick [] on an option or fill in blanks with your answer, respectively.
One answer one item.
Section “A”: Your opinions on the Billion Tree Afforestation Project (BTAP).
(1) Are you over 18 years old?
Yes________ No_______
(2) Are you familiar with your family’s situation?
Yes_______ No_______
(3) Please choose a number that can denote the likelihood of you participating (implementing) in the
project over the long‐term. “0” denotes that you will not; numbers from “1” to “10” denote the
increasing probability of your implementing the project, while “10” represents your strong
willingness to participated (implement) the project.
0, 1, 2, 3, 4, 5, 6, 7, 8, 9, 10
(4) Having taken part in the project, do you feel more tense or more relaxed compared to before?
Please choose a number to denote your feelings. “0” denotes that you feel no change; increasing
numbers on the left denotes a rising sense of being tense, while increasing numbers on the right
denote a rising sense of being relaxed.
‐‐‐‐Increasingly tense no change increasingly relaxed‐‐‐‐‐
5, 4, 3, 2, 1 0 1, 2, 3, 4, 5
(5) Do you feel a greater sense of achievement (i.e., are you happy with the advantages that your
activities have brought to your community and to your descendants) once you participated in a
project that could enhance the natural environment of the area? Please choose a number to denote
your feelings. “0” denotes no change and the increasing numbers from “1” to “10” indicates a
progressively greater sense of achievement.
0, 1, 2, 3, 4, 5, 6, 7, 8, 9, 10
(6) Do you feel incapable of individually improving the KPK natural environment? Do you hope that
the next generation will receive greater educational opportunities, and hence have sufficient
knowledge to resolve the problem? Please choose a number to denote your feelings. “0” means that
you do not hope so. Increasing numbers from “1” to “10”denote the increasing degree in your hopes.
0, 1, 2, 3, 4, 5, 6, 7, 8, 9, 10
(7) Do you believe that the BTAP project is strong enough to support forest based entrepreneurs and
employees in terms of financial liquidity. Select “0” if you feel that it is not likely to happen. Express
Forests 2019, 10, 703 17 of 21
your feelings of hope on a scale which ranges from 1 to 10, where 1 denote minimum and 10 indicate
maximum.
0, 1, 2, 3, 4, 5, 6, 7, 8, 9, 10
(8) Is the project organized enough to influence the local community to rely on BTAP for their
livelihood. Select “0” if you feel that the BTAP is incapable. Express your feelings of hope on a scale
which ranges from 1 to 10, where 1 denote minimum and 10 indicate maximum.
0, 1, 2, 3, 4, 5, 6, 7, 8, 9, 10
(9) Do you believe that system provides opportunities that were not possible before its existence.
For example, there were no earning opportunities for women before, does the system provide such
platform. Select “0” if you feel that the BTAP is incapable. Express your feelings of hope on a scale
that ranges from 1 to 10, where 1 denotes the minimum and 10 indicates the maximum.
0, 1, 2, 3, 4, 5, 6, 7, 8, 9, 10
Section “B”: Participation of Women, and Perceived Livelihood.
(10) How did participating in the project increased your family’s income?
a. Yes _________; b. No ________; c. Partly ________; d. No‐opinion ________.
Increased (or decreased) by ________%?
(11) Do mainly male or mainly female individuals in your family engage in project‐related work?
Male ___; Female ___; Share equally ___.
(12) Percentage of female individuals’ contribution to the family’s total earnings:
Before participation in the project: _______%; After participation in the project_______%.
(13) Have the female individuals in your family ever taken part in training or meetings about the
project?
Never ___; Sometimes ___; Often ___.
(14) What do you think, which one is more important?
a. Environment ______; b. Economy _____; c. Equally important _____; d. No‐opinion _______.
(15) Is there any adverse effect of the environmental degradation on your health?
a. Yes ______; b. No ________; c. Partly ________; d. No‐opinion ________.
If the answer to question (15) was “Yes”, please answer the following sub‐section.
(b). What do you think, BTAP would help to protect environment?
Yes ___________; No___________; No‐opinion__________.
(16) Is the BTAP worthwhile?
a. Yes _________; b. No ________; c. Partly ________; d. No‐opinion ________.
(17) Has BTAP increased your livelihood?
a. Yes _________; b. No ________; c. Partly ________; d. No‐opinion ________.
(18) Have the BTAP achieved its goals with respect to increasing income?
a. Yes _________; b. No ________; c. Partly ________; d. No‐opinion; ________.
(19) Are you supporting the ban policy on grazing and logging?
a. Yes _________; b. No ________; c. Partly ________; d. No‐opinion ________.
Section “C”: The cost and benefits of “Nursery grower, Nighabaan, and others” after BTAP implementation:
Definitions:
A. Nursery grower; government provided subsidies for nursery grower, raising seeds/trees for the
project.
B. Nighabaan; protected the plantation area or closure, and the government provided a salary. These
are also known as green jobs.
C. 1 ha = 20 kanals
(20) Nursery land costs and profits prior to conversion:
Area ______ hc; crop species _______; cash costs for one year (including costs of seeds, fertilizers,
pesticides, charges for water, farming machinery, agricultural taxes, contract fees, etc.) ______ Rs;
labor cost _______; total yield________ kg; price _________Rs. Kg1.
(21) Nursery land costs and profits after conversions:
Forests 2019, 10, 703 18 of 21
Area ______ hc; year of conversion 20___; species _______; cash cost of one year (including costs of
seedlings or seeds, fertilizers, pesticides, water charges, farming machinery, etc.)
Rs. _____; labor cost _______; total trees________ number; price _________Rs. per/tree.
(22) Nighabaan per month income before and after participation in the BTAP
Before_______ Rs.; After________ Rs.
(23) A part from nurseries and Nighabaan provided by the government, is there any other source of
income in your family?
Yes ______; No ______; No‐opinion________.
If the answer to question (23) was “Yes”, please fill in the following blank.
The family has other sources income (such as sheep, cattle, dry grass selling, or other business).
Income from livestock _________Rs; income from other business_________Rs; income from surplus
laborers_________ Rs.
(24) Costs for afforestation and reforestation on bare mountain lands:
Area ______ hc; year of conversion 20___; species _______; cash cost of one year (including costs of
seedlings or seeds, water charges, farming machinery, etc.) _____ Rs.; labor cost _______Rs.; total
trees________ number.
Section “D”: Demographics and Personal Information
The following questions will help in the analysis of the survey’s results. Your answers will be kept
secret confidential now and in the future. Tick on an option or fill in the blank with your answer.
(23) Sex: Male ____ Female ____
(24) Age: ________
(25) Religion: ________
(26) Address: ________ District_______
(27) Educational level:
Illiterate ____ Primary school ____ Middle school ________
High school and secondary school ______ Bachelor or Master ____
(28) How many members are there in your family? __________ individuals
(29) Your family’s net annual income is: ________for one year
(30) Please write any suggestions or advice you may have regarding the BTAP.
(31) Please write any suggestions or advice regarding the questionnaire.
Thank you very much!
Investigator’s signature: _______________
References
1. Khan, S.R.; Khan, S.R. Assessing poverty‐deforestation links: Evidence from Swat, Pakistan. Ecol. Econ.
2009, 68, 2607–2618.
2. Qamer, F.M.; Shehzad, K.; Abbas, S.; Murthy, M.S.R.; Xi, C.; Gilani, H.; Bajracharya, B. Mapping
deforestation and forest degradation patterns in western Himalaya, Pakistan. Remote Sens. 2016, 8, 385.
3. Liu, J.; Diamond, J. Revolutionizing China’s environmental protection. Science 2008, 319, 37–38.
4. Yin, R.; Yin, G. China’s primary programs of terrestrial ecosystem restoration: Initiation, implementation,
and challenges. Environ. Manag. 2010, 45, 429–441.
5. Shi, M.; Qi, J.; Yin, R. Has China’s Natural Forest Protection Program Protected Forests?—Heilongjiang’s
Experience. Forests 2016, 7, 218.
6. Ali, T.; Shahbaz, B.; Suleri, A. Analysis of myths and realities of deforestation in Northwest Pakistan:
Implications for forestry extension. Int. J. Agric. Biol. 2006, 8, 107–110.
7. Van Khuc, Q.; Tran, B.Q.; Meyfroidt, P.; Paschke, M.W. Drivers of deforestation and forest degradation in
Vietnam: An exploratory analysis at the national level. For. Policy Econ. 2018, 90, 128–141.
8. Uchida, E.; Xu, J.; Xu, Z.; Rozelle, S. Are the poor benefiting from China’s land conservation program?
Environ. Dev. Econ. 2007, 12, 593–620.
9. Yin, R.; Liu, C.; Zhao, M.; Yao, S.; Liu, H. The implementation and impacts of China’s largest payment for
ecosystem services program as revealed by longitudinal household data. Land Use Policy 2014, 40, 45–55.
Forests 2019, 10, 703 19 of 21
10. Xu, J.; Cao, Y. Efficiency and Sustainability of Converting Cropland to Forest and Grassland in the Western Region;
Implementing the Natural Forest Protection Program and the Sloping Land Conversion Program: Lessons
and Policy Implications; China Forestry Publishing House: Beijing, China, 2002.
11. Xu, J.; Tao, R.; Xu, Z.; Bennett, M.T. China’s sloping land conversion program: Does expansion equal
success? Land Econ. 2010, 86, 219–244.
12. Ali, A. Forest‐based livelihoods, income, and poverty: Empirical evidence from the Himalayan region of
rural Pakistan. J. Rural Stud. 2018, 57, 44–54.
13. Balmford, A.; Bruner, A.; Cooper, P.; Costanza, R.; Farber, S.; Green, R.E.; Jenkins, M.; Jefferiss, P.; Jessamy,
V.; Madden, J.; et al. Economic reasons for conserving wild nature. Science 2002, 297, 950–953.
14. Khan, N.; Ali, S.F. Critical Review on Past Literature of Deforestation in Rural Sector of Pakistan. Int. J. Adv.
Res. Publ. 2017, 1, 91–94.
15. Xu, W.; Khoshroo, N.; Bjornlund, H.; Yin, Y. Effects of “Grain for Green” reforestation program on rural
sustainability in China: An AHP approach to peasant consensus of public land use policies. Stoch. Environ.
Res. Risk Assess. 2014, 28, 867–880.
16. Harbi, J.; Erbaugh, J.T.; Sidiq, M.; Haasler, B.; Nurrochmat, D.R. Making a bridge between livelihoods and
forest conservation: Lessons from non‐timber forest products’ utilization in South Sumatera, Indonesia.
For. Policy Econ. 2018, 94, 1–10.
17. Qasim, M.; Hubacek, K.; Termansen, M. Underlying and proximate driving causes of land use change in
district Swat, Pakistan. Land Use Policy 2013, 34, 146–157.
18. Government of Khyber Pakhtunkhwa. One Billion Trees Afforestation Project, 103.240.220.71/btt/. 2014.
Available online: https://en.wikipedia.org/wiki/Billion_Tree_Tsunami (accessed on 15 July 2018).
19. WWF. Third Party Monitoring of Billion Trees Tsunami Afforestation Project in Khyber Pakhtunkhwa.
Available online: billiontreeproject.kp.gov.pk/ (accessed on 9 August 2018).
20. Government of Khyber Pakhtunkhwa. Plant Trees Save Nature. 2014. Available online:
billiontreeproject.kp.gov.pk/ (accessed on 22 September2018).
21. Government of Khyber Pakhtunkhwa. ADP Scheme PC‐1 Billion Trees Afforestation Project Phase 3;
Government of Khyber Pakhtunkhwa: Khyber Pakhtunkhwa Province, Pakistan 2017.
22. WWF. Third Party Monitoring of the Billion Trees Afforestation Project in Khyber Pakhtunkhwa; WWF: Morge,
Switzerland, 2017.
23. Gul, A. One Billion Trees Planted in Pakistan’s NW Province. Available online:
https://www.voanews.com/a/one‐billion‐trees‐planted‐in‐pakistan‐nw‐province/3983609.html (accessed
on 23 January 2018).
24. Kamal, A.; Yingjie, M.; Ali, A. Significance of Billion Tree Tsunami Afforestation Project and Legal
Developments in Forest Sector of Pakistan. Int. J. Law Soc. 2019, 1, 157.
25. Government of Khyber Pakhtunkhwa. Objectives and Outcomes of Billion Tree Tsunami Afforestation
Project (BTTAP). 2014. Available online: http://103.240.220.71/btt/objectives (accessed on 22 September
2018).
26. Kharl, S.; Xie, X. Green growth initative will lead toward sustainable development of natural resources in
Pakistan: An Investigation of “Billion tree tsunami afforestation project”. Sci. Int. 2017, 29, 841–843.
27. BTAP. PC‐1, Phase‐III. 2017. Available online: billiontreeproject.kp.gov.pk (accessed on 11 October 2018).
28. Reuters and Islamabad. Pakistan Aims to Add 100 Million Trees in 5 Years as Part of ‘Tree Tsunami’ across the
Country; Reuters, Islamabad Pakistan, 2017.
29. Bossel, H. Indicators for Sustainable Development: Theory, Method, Applications; IISD: Winnipeg, MB, Canada,
1999.
30. Boardman, A.E.; Greenberg, D.H.; Vining, A.R.; Weimer, D.L. Cost‐Benefit Analysis: Concepts and Practice;
Cambridge University Press: Cambridge, UK, 2017.
31. Bleyer, M.; Kniivilä, M.; Horne, P.; Sitoe, A.; Falcão, M.P. Socio‐economic impacts of private land use
investment on rural communities: Industrial forest plantations in Niassa, Mozambique. Land Use Policy
2016, 51, 281–289.
32. Zhou, X.‐N.; Wang, L.‐Y.; Chen, M.‐G.; Wang, T.‐P.; Guo, J.‐G.; Wu, X.‐H.; Jiang, Q.‐W.; Zheng, J.; Chen, X.‐
Y. An economic evaluation of the national schistosomiasis control Programme in China from 1992 to 2000.
Acta Trop. 2005, 96, 255–265.
33. Kirkpatrick, C.H.; Weiss, J. Cost‐Benefit Analysis and Project Appraisal in Developing Countries; New Horizons
in Environmental Economics Series; Edward Elgar Publishing: Trotschwan, UK, 1996.
Forests 2019, 10, 703 20 of 21
34. Omura, M. Cost‐benefit analysis revisited: Is it a useful tool for sustainable development. Kobe Univ. Econ.
Rev. 2004, 50, 43–58.
35. Munda, G. Cost‐benefit analysis in integrated environmental assessment: Some methodological issues.
Ecol. Econ. 1996, 19, 157–168.
36. Landry, J.; Chirwa, P.W. Analysis of the potential socio‐economic impact of establishing plantation forestry
on rural communities in Sanga district, Niassa province, Mozambique. Land Use Policy 2011, 28, 542–551.
37. Bennett, N.J.; Dearden, P. Why local people do not support conservation: Community perceptions of
marine protected area livelihood impacts, governance and management in Thailand. Mar. Policy 2014, 44,
107–116.
38. Pakistan of Government. Population of Pakistan Census 2017. 2017. Available online:
www.pakinformation.com/population/index.html (accessed on 3 April 2018).
39. Zada, M.; Shah, S.J.; Yukun, C.; Rauf, T.; Khan, N.; Shah, S.A.A. Impact of Small‐to‐Medium Size Forest
Enterprises on Rural Livelihood: Evidence from Khyber‐Pakhtunkhwa, Pakistan. Sustainability 2019, 11,
2989.
40. Ali, A. Economic cost of terrorism: A case study of Pakistan. Strategy. Stud. 2010, 30,
doi:10.1016/j.jpolmod.2019.02.002
41. PFI. Pakistan Forest Institute. 2012. Available online: www.pfi.gov.pk (accessed on 3 June 2018).
42. Qamer, F.M.; Abbas, S.; Saleem, R.; Shehzad, K.; Ali, H.; Gilani, H. Forest cover change assessment in
conflict‐affected areas of northwest Pakistan: The case of Swat and Shangla districts. J. Mt. Sci. 2012, 9, 297–
306.
43. Bossel, H. Assessing viability and sustainability: A systems‐based approach for deriving comprehensive
indicator sets. Conserv. Ecol. 2002, 5, doi:10.5751/ES‐00332‐050212.
44. Schneider, A.W.; Matthes, F. Using Orientor Theory for Coherent Decision Making for Application
Landscape Design. In Proceedings of the Poster Workshop at the 2014 Complex Systems Design and
Management Conference (CSD&M), Paris, France, 12 November 2014.
45. Jayachandran, S.; De Laat, J.; Audy, R.; Lambin, E.F.; Stanton, C.Y.; Thomas, N.E. Cash for carbon: A
randomized trial of payments for ecosystem services to reduce deforestation. Science 2017, 357, 267–273.
46. Xu, J.; Yin, R.; Li, Z.; Liu, C. China’s ecological rehabilitation: Unprecedented efforts, dramatic impacts, and
requisite policies. Ecol. Econ. 2006, 57, 595–607.
47. ZADA. Billion Tree Tsunami’ Surges across K‐P; ZADA: Peshawar Pakistan, 2017.
48. Uchida, E.; Xu, J.; Rozelle, S. Grain for green: Cost‐effectiveness and sustainability of China’s conservation
set‐aside program. Land Econ. 2005, 81, 247–264.
49. Yin, R.; Zhao, M.; Yao, S. Designing and Implementing Payments for Ecosystem Services Programs: What
Lessons Can Be Learned from China’s Experience of Restoring Degraded Cropland? Environ. Sci. Technol.
2014, 48, 19–20.
50. Yin, R.; Liu, T.; Yao, S.; Zhao, M. Designing and implementing payments for ecosystem services programs:
Lessons learned from China’s cropland restoration experience. For. Policy Econ. 2013, 35, 66–72.
51. Spash, C.L. Ethics and environmental attitudes with implications for economic valuation. J. Environ. Manag.
1997, 50, 403–416.
52. Wiggins, S.; Marfo, K.; Anchirinah, V. Protecting the forest or the people? Environmental policies and
livelihoods in the forest margins of Southern Ghana. World Dev. 2004, 32, 1939–1955.
53. Yin, R.; Liu, H.; Liu, C.; Lu, G. Households’ Decisions to Participate in China’s Sloping Land Conversion
Program and Reallocate Their Labour Times: Is There Endogeneity Bias? Ecol. Econ. 2018, 145, 380–390.
54. Karanth, K.K.; Kramer, R.A.; Qian, S.S.; Christensen, N.L., Jr. Examining conservation attitudes,
perspectives, and challenges in India. Biol. Conserv. 2008, 141, 2357–2367.
55. Mullan, K.; Kontoleon, A.; Swanson, T.; Zhang, S. An evaluation of the impact of the natural forest
protection Programme on rural household livelihoods. In An Integrated Assessment of China’s Ecological
Restoration Programs; Springer: Berlin/Heidelberg, Germany, 2009; pp. 175–199.
56. Uchida, E.; Rozelle, S.; Xu, J. Conservation payments, liquidity constraints, and off‐farm labor: Impact of
the Grain‐for‐Green Program on rural households in China. Am. J. Agric. Econ. 2009, 91, 70–86.
57. Saeed, A. Pakistani Women Nature Trees and Pride in Forest Drive. Available online:
https://www.reuters.com/article/pakistan‐women‐forests/pakistani‐women‐nurture‐trees‐and‐pride‐in‐
forest‐drive‐idUSL8N15917P (accessed on 25 January 2019).
Forests 2019, 10, 703 21 of 21
58. The Khyber Pakhtunkhwa Forest, Ordinance 2002, Ordinance No. Xix of 2002; An Ordinance to Consolidate and
Amend the Laws Relating to Protection, Conservation, Management, and Sustainable Development of
Forests and Natural Resources in the Khyber Pakhtunkhwa; Peshawar, Pakistan 2002.
59. Smil, V. Afforestation in China. Afforestation Policies Plan. Prog. 1993, 13, 105–117.
60. Shen, Y.; Liao, X.; Yin, R. Measuring the socioeconomic impacts of China’s Natural Forest Protection
program. Environ. Dev. Econ. 2006, 11, 769–788.
61. L’Roe, J.; Naughton‐Treves, L. Effects of a policy‐induced income shock on forest‐dependent households
in the Peruvian Amazon. Ecol. Econ. 2014, 97, 1–9.
© 2019 by the authors. Licensee MDPI, Basel, Switzerland. This article is an open access
article distributed under the terms and conditions of the Creative Commons Attribution
(CC BY) license (http://creativecommons.org/licenses/by/4.0/).


