Embed Size (px)
Citation preview

Developmental Brain Research 132 (2001) 159–174www.elsevier.com/ locate /bres
Research report
Sodium channel currents in maturing acutely isolated rat hippocampalCA1 neurones
*˜Jacqueline Fernandes, Pedro Marvao, Ana Isabel Santos, Pedro Freire Costaˆ ´Departamento de Fisiologia, Faculdade de Ciencias Medicas, U.N.L., Campo Santana 130, 1169-056 Lisboa, Portugal
Accepted 12 November 2001
Abstract
Sodium channel currents were recorded in excised inside-out patches from immature (P ) and older (P ) rat CA1 neurones.4–10 20–46
Channel conductance was 16.660.013 pS (P ) and 19.060.031 pS (P ). Opening patterns varied with step voltage and with age. In20–46 4–10
some patches bursting was apparent at voltages positive to 230 mV. Non-bursting behaviour was more dominant in patches from youngeranimals. In older animals mean open time (m.o.t.) was best described by two exponentials especially in the older cells; in the immature,there were fewer cases with two exponentials. The time constant of inactivation (t ) estimated in ensemble averages was best described byh
two exponentials (t and t ) in most patches from older cells. t decreased with depolarization; t increased in the range 230 to 0 mV.hf hs hf hs
The voltage dependence of t in the older cells is identical to that of the single t found in the younger; the results indicate a dominancehf h
of t in the younger. Patches from younger cells more often showed one apparent active channel; in such cases, m.o.t. was described by ahf
single exponential. However, in two cases, channels showed bursting behaviour with one of these channels showing a shift betweenbursting and non-bursting modes. Our findings are consistent with a heterogeneous channel population and with changes in the populationin the course of maturation. 2001 Elsevier Science B.V. All rights reserved.
Theme: Excitable membranes and synaptic transmission
Topic: Sodium channels
Keywords: Sodium channel; Mean open time; Time constant of inactivation; CA1; Maturation
1. Introduction known. Furthermore, little is known about the changes inchannel population that go with neuronal post-natal matu-
In the past two decades, the sodium channel has been ration.the object of diverse studies, some aiming at the definition Previous whole-cell studies in acutely isolated rat CA1of functional attributes of the channel molecule and the cells from this laboratory showed changes in kineticcharacterization of kinetic properties. Single channel elec- properties of different kinds of voltage-gated currents introphysiological characterizations have disclosed complex the first 4 weeks after birth [14,15,49,50]. Changes in themechanisms that deviate from the classical H-H [23] voltage-dependence accompanying maturation of centralmodel [2,11,24,37,41,42,45,55]. Hippocampal pyramidal neurones have been reported for the sodium currentcells have been the focus of numerous in vitro studies [16,26,40,54]. Findings in a study from our laboratorymeant to elucidate functional properties of central nervous concerned with macroscopic sodium currents in maturesystem neurones. Notwithstanding, the characteristics of and immature CA1 cells [14], indicated post-natal kineticthe sodium channel population in CA1 cells are not well modifications in macroscopic sodium currents suggestive
of changes in the population of channels in the course ofmaturation, namely the dominance of a different channelpopulation in older cells and the disclosure of a slowercurrent component in the older cells. Other reports on*Corresponding author. Tel.: 1351-21-880-3036; fax: 1351-21-880-mRNA and channel expression have shown that in the rat3078.
E-mail address: [email protected] (P.F. Costa). hippocampus, different sodium channel isoforms are ex-
0165-3806/01/$ – see front matter 2001 Elsevier Science B.V. All rights reserved.PI I : S0165-3806( 01 )00312-1

160 J. Fernandes et al. / Developmental Brain Research 132 (2001) 159 –174
pressed in the course of post-natal maturation final resistance of 15 to 27 MV. Micropipettes (final length[6,17,19,20,51]. of about 3 cm) were filled with recording solution only to
The purpose of the present research was to use single the shank and back-filled with liquid paraffin [7]. Thechannel recording to characterise the sodium channel relatively short length of the pipette, the use of Sylgard andpopulation in rat hippocampal CA1 neurones at two stages of paraffin back-filling and the location of the pipetteof maturation. Specifically, using inside-out excised pat- during recording (tip near the surface in the bath) wereches, we observed channel behaviour and opening patterns. found critical for relatively low recording noise [7]; thisWe measured channel conductance, mean open time and was typically between 0.12 and 0.20 pA r.m.s., often 0.14time constant of inactivation as estimated in ensemble to 0.18 pA r.m.s. Resistance of the seals ranged from 20 toaverages—both as functions of voltage—to compare chan- 100 GV, and was often greater than 50 GV.nel properties in immature (P ) and older (P ) CA1 Single-channel currents were recorded at 20 8C with an4–10 20–46
cells. The observations presently reported are consistent Axopatch-200B electrometer and pClamp 6.0 softwarewith the presence of a heterogeneous channel population (Axon Instruments) with a sampling interval of 25 ms, filterand with changes in the channel population in the course f 55 kHz (23 dB, 4 pole Bessel). Channel currents (I )c ch
of early post-natal maturation. were evoked with 35 ms depolarizing command pulses to260 to 140 mV (in 10 mV steps), depending on theexperimental requirements. Typically, patches were stable
2. Methods for about 30 min, occasionally for as long as 1 h.
2.1. Preparation2.3. Signal processing
Sub-slices from the mid-third of the CA1 layer wereprepared from the hippocampi of new-born (P ) and Capacitance transients were averaged in blank traces and4–10
older (P ) Wistar rats, and were incubated at 32 8C for subtracted from records with channel openings. Events20–46
15 min under moderate stirring in an oxygen saturated were detected using a conventional 50% I level (F ),ch
solution with the following composition (mM): NaCl 120, under the operator’s constant surveillance and deliberatelyKCl 5, PIPES 20, CaCl 1, MgCl 1, glucose 25 and without automaticity, to reduce the introduction of artifacts2 2
21trypsin 0.4 mg ml (Sigma type XI), pH 7.0 (NaOH). and to allow for event detection interpretation. Owing toThe sub-slices were subsequently transferred to the same uncertainty in their duration, openings persisting at the endoxygenated solution without enzyme and kept at room of the command pulse were not measured. In cases wheretemperature under moderate stirring. Cells were dispersed two events overlapped in time, pairs of transitions (openingin 3-cm-diameter culture Petri dishes by gentle trituration and closing) were randomly assigned [2]. Baseline Irms
of the sub-slices with fire polished Pasteur pipettes and noise (s) was measured in stretches of 1300 to 1500allowed to settle for about 5 min. sample points. Care was taken to confirm that the ratio
21F /s $ 5, thus aiming at fewer than 0.04 false events s
2.2. Signal recording of recorded data [12,13]. Whenever required, gaussianfiltering was subsequently applied to keep the ratio F /s $
Sodium channel current recordings were carried out in 5. Open time resolution was imposed on the data prior toexcised inside-out patches [22]. The composition of the histogram binning. This was applied consistently to bothbath solution was as follows (mM): NaCl 0.1, CsF 145, openings and closures, with event concatenation. In allCsCl 20, EGTA 5 and HEPES 10 (pH 7.2, CsOH). The cases, imposed time resolution was 1.3 of the effectivepipette filling solution had the following composition filter rise time (maximum time resolution: 86 ms). Thus,(mM): NaCl 150, KCl 5, HEPES 10, CaCl 1.8 and MgCl events whose amplitude did not reach 90% I were2 2 ch
0.8 (pH 7.4, CsOH). The junction potential for the filling rejected [12,13]. Histogram bin width was always aand bath solution combination is 8.7 mV. No correction multiple integer of the sampling interval. In order to reducewas applied for this junction potential. In some experi- distortion due to false or missing events, the first bin wasments, a filling solution with CaCl 0.9 mM was used. rejected prior to curve fitting. Mean open time (m.o.t.) was2
In experiments to confirm the nature of the currents, estimated from the exponential fit to the open dwell timebath sodium concentration was increased by 100 mM, by distribution histogram. Whenever it was possible to fit asubstitution of 100 mM CsF by the same amount of NaF. sum of exponentials, the significance of the second ex-Also, in some experiments, the local anaesthetic procaine ponential was tested with an F-test (a 50.05).(1 mM) was added to the bath control solution; this was In measurements meant to disclose the presence of morechanged during continuous perfusion. than one open state with different conductances, the mean-
Micropipettes were prepared from filamented borosili- variance method was used [42]. In such cases, timecate glass capillaries (Science Products GB150F-8P), windows of 5, 8, 20, 30 and 50 sample points weresylgarded to the tip (Dow Corning) and fire-polished to a applied; 3D histograms were generated using a bin width

J. Fernandes et al. / Developmental Brain Research 132 (2001) 159 –174 161
of 0.02 ms for amplitude and 20 bins /decade for variance dium concentration was increased to 100 mM (see Meth-(log scale). ods). With the decrease in sodium gradient there was a
Statistical deviations given in the text are S.E.M. values. 32% reduction in current amplitude at 0 mV. In two otherexperiments carried out in P37 cells (not shown), theapplication of procaine (1 mM) suppressed channel cur-
3. Results rent.Processing of the data meant to seek for subconduct-
The present paper concerns results obtained in a total of ances was carried out with the mean-variance histogram135 patches, of which 61 were from immature (P ) procedure [42] using time windows 5 to 50 sample points4–10
cells. The number of apparent active channels in the in width. In rare cases and with time windows of 20 and 30patches from which we recorded often varied between two sample points it was possible to disclose small fractions ofand four. In some cases, there was apparently only one signal with a different amplitude (not shown), but noactive channel; such cases were more frequent in prepara- obvious substate was found.tions from immature cells.
Fig. 1 depicts sodium channel unitary current as a 3.1. Opening patternsfunction of step command voltage (I–V plots) in patchesfrom younger (P ) and older (P ) cells. Current The records depicted in Fig. 2 illustrate channel open-4–10 20–46
amplitude was measured in fully resolved openings ob- ings obtained at command steps to various voltages intained in voltage steps ranging from 260 to 140 mV. patches from older cells. The observed opening patternsPoints in the plots are mean values. The results in Fig. 1 were voltage sensitive. Two patterns were distinguishable.concern measurements obtained in a total of 15 and 23 One pattern—here termed pattern-A, as illustrated in Fig.patches from older and younger cells, respectively. The 2A—had a non-bursting dominance at potentials positiveunitary conductance estimated from the slope of the to 230 mV, typically short latency single openings or withregression lines was 16.660.013 and 19.060.031 pS in few reopenings. At 260 and 250 mV there was aolder and younger cells, respectively. The slopes of the dominance of single brief openings dispersed along theregression lines differed statistically (t-test, a 50.05). pulse; at 240 mV there were series of reopenings early in
In two experiments meant to confirm the nature of the the pulse. The other pattern—here termed pattern-B, ascurrents—performed in P25 cells (not shown)—bath so- illustrated in Fig. 2B—had a bursting dominance at more
1Fig. 1. Single Na channel current as a function of voltage command step (I–V plots). Mean single channel current amplitude was accessed in fullyresolved openings in patches from older (P$20) and immature (P ) cells, in voltage command steps from 260 to 140 mV. Error bars are 6S.E.M.4–10

162 J. Fernandes et al. / Developmental Brain Research 132 (2001) 159 –174
1Fig. 2. Single Na channel currents in patches from P$20 cells, obtained at different voltage command steps (shown on the left of each trace of sectionsA and B). Opening patterns here termed pattern-A and pattern-B (see text) are illustrated in (A) and (B), respectively. Each of sections (A or B) illustratesdata collected in the same patch. Arrowheads (.) on the current traces at the top of each column correspond to the start and end of the voltage commandpulse.
depolarized potentials, i.e. one observed longer bursts of ing of data was often dedicated to one particular potentialreopenings at 230 mV (Fig. 2B), which would change to step. Exceptionally, in longer lasting patches, it waslonger openings and reopenings at potentials positive to possible to collect data at more than one potential (15220 mV. The bursting was intermittent, alternating with patches). Thus, a total of 127 histograms (49 concerningperiods of non-bursting activity. Bursting was also ob- P cells) were used for the characterization of m.o.t.4–10
served in cases where a low calcium pipette filling solution voltage dependence; 90 of such histograms were generated(see Methods) was used (not shown) and when occasion- from more than 1000 events; histograms with more thanally pulses were applied before excision (cell attached 3000 events were exceptional.configuration; not recorded). Fig. 4 depicts open dwell time histograms obtained at
Fig. 3 illustrates channel openings obtained at command 260, 240 and 210 mV command steps, in older cells. Insteps to various voltages in patches from younger cells. As the case illustrated at 260 mV (Fig. 4A) the exponentialin the older cells, the opening patterns were also voltage time constant (t ) of the distribution histogram wassingle
sensitive, essentially with the same characteristics; one 0.20 ms. At 240 mV (Fig. 4B) the histogram was best fitcould distinguish between two patterns as referred above by the sum of two exponentials; the second exponential(termed A and B, Fig. 3A and B1, B2, respectively). was significant (F-test). The faster (t ) and slower (t )f s
Nevertheless, pattern-A was more often found in patches components were 0.25 and 0.75 ms, respectively; thefrom younger cells. In 23 patches from P cells in which fraction of the area under the curve ascribed to t was4–10 f
scans of voltage steps were carried out, nine clearly fell 39%. At 210 mV (Fig. 4C) the histogram was also best fitinto category-A, where there was no evidence of bursting. by two exponentials: t 50.30 ms (35% of the area underf
Such pattern distinction was not so clear in the older cells. the curve) and t 51.15 ms. In cases where two significants
exponentials were obtained, m.o.t. was assessed with the3.2. Open dwell time following equation:
For the study of m.o.t. voltage dependence, open dwell m.o.t. 5O a t (1)i itime histograms were obtained in a total of 108 patches(41 concerning P cells). In order to provide a sufficient where a is the area coefficient of the corresponding4–10 i
number of events for the production of histograms, record- exponentials. In the cases illustrated in Fig. 4B and C

J. Fernandes et al. / Developmental Brain Research 132 (2001) 159 –174 163
1Fig. 3. Single Na channel currents in patches from P cells, obtained at different voltage command steps (as in Fig. 2). Opening patterns here termed4–10
pattern-A and pattern-B (see text) are illustrated in A and B1–B2, respectively. Each of sections (A, B1 or B2) illustrates data collected in the same patch.Arrowheads as in Fig. 2.
m.o.t. was calculated (Eq. (1)) as: 0.56 ms (240 mV) and 210 mV were t 50.2460.03 ms, t 51.0460.10 ms,f s
0.85 ms (210 mV). In the few cases where it was possible m.o.t.50.7560.08 ms (240 mV, n511) and t 5f
to collect events at more than one step potential, results 0.3760.05 ms, t 51.4560.18 ms, m.o.t.50.7460.09 mss
also differed according to the voltage. In one example (P37 (210 mV, n510).cell) in which recordings were carried out in steps to 260 Open dwell time histograms obtained in patches fromand 240 mV, one obtained a single exponential at 260 P cells at 260, 240 and 210 mV command steps are4–10
mV (t 50.22 ms) and two significant exponentials at 240 shown in Fig. 5. In the cases depicted, as in older cells, themV, with an m.o.t. of 0.61 ms (Eq. (1)); corresponding histograms at 240 and 210 mV were also best fit by avalues for t and t were 0.10 ms (21% area) and 0.75 ms, sum of two exponentials (Fig. 5B and C); m.o.t. (Eq. (1))f s
respectively (not shown). Given the sample concerning was 0.59 ms (240 mV) and 1.20 ms (210 mV). Theolder cells, the fraction of patches in which a second fraction of patches from younger cells in which a secondsignificant exponential was obtained was as follows: 2 /7 significant exponential was obtained was as follows: 1 /7(260 mV), 2 /8 (250 mV), 11/16 (240 mV), 8 /11 (230 (260 mV), 1 /3 (250 mV), 4 /6 (240 mV), 1 /8 (230 mV),mV), 10/13 (220 mV), 10/10 (210 mV), 11/13 (0 mV). 5 /9 (220 mV), 7 /9 (210 mV), 6 /7 (0 mV). In youngerThe proportion of the area ascribed to t changed with cells, the proportion of the area ascribed to t was asf f
voltage, as follows: 0.3860.05 (240 mV), 0.5360.07 follows: 0.5160.08 (240 mV), 0.5660.07 (220 mV),(230 mV), 0.6460.06 (220 mV), 0.6560.05 (210 mV), 0.7060.10 (210 mV), 0.7260.06 (0 mV). At 230 mV,0.6660.05 (0 mV). Mean values for the fast, slow ex- only one patch had a second statistically significantponential components and m.o.t. (Eq. (1)) at 240 and exponential in the sample concerning P cells. Mean4–10

164 J. Fernandes et al. / Developmental Brain Research 132 (2001) 159 –174
Fig. 4. Histograms of open dwell time and corresponding exponential fits in patches from P$20 cells in command steps to 260 mV (A, P42 cell, binwidthof 0.1 ms), 240 mV (B, P37 cell, binwidth 0.15 ms) and 210 mV (C, P32 cell, binwidth 0.15 ms); the first bin has been excluded in all histograms. In thecases illustrated in B (240 mV) and C (210 mV), the histograms were best fit with two exponentials (t and t ). The area under the curve corresponding tof s
t was 39% (B) and 35% (C). Sample records at the respective command steps are depicted in the insets. Arrowheads (.) as in Figs. 2 and 3.f
Fig. 5. Histograms of open dwell time and corresponding exponential fits in patches from P cells in command steps to 260 mV (A, P6 cell, binwidth of4–10
0.1 ms), 240 mV (B, P6 cell, binwidth 0.15 ms) and 210 mV (C, P5 cell, binwidth 0.15 ms). In the cases illustrated in B (240 mV) and C (210 mV), thehistograms were best fit with two exponentials (t and t ). The area under the curve corresponding to t was 69% (B) and 68% (C). Sample records at thef s f
respective command steps are depicted in the insets. Arrowheads (.) as in Figs. 2–4.

J. Fernandes et al. / Developmental Brain Research 132 (2001) 159 –174 165
values for the fast, slow exponential components and m.o.t. than three, given the dominance of cases with a single(Eq. (1)) in younger cells were t 50.2460.05 ms, t 5 exponential.f s
1.0360.23 ms, m.o.t.50.6760.19 ms (240 mV, n54) and From the plot in Fig. 6A (older cells) it is apparent thatt 50.3660.02 ms, t 52.2060.31 ms, m.o.t.51.0360.32 there was a sharp increase in m.o.t. from 260 to 240 mV.f s
ms (210 mV, n57). Apparently, from 230 to 0 mV m.o.t. (Eq. (1)) was notThe results from such experiments are summarized in voltage dependent, whereas t and t progressively in-f s
Fig. 6. The graphs depict m.o.t., t and t as a function of creased; from 240 to 0 mV there was roughly a 50%f s
voltage, in older (Fig. 6A) and younger cells (Fig. 6B). increase in the mean values of both t and t . In thef s
Data points obtained at 260 and 250 mV in Fig. 6A and younger cells (Fig. 6B) t appeared not to be voltagef
B and 230 mV in Fig. 6B correspond to a sample of less dependent in the range 260 to 220 mV; there was a 64%
Fig. 6. Voltage-dependence of mean open time (m.o.t.), t and t as measured in histograms in Figs. 4 and 5. (A) Mean values of fast (t ) and slow (t )f s f s
components and m.o.t. (Eq. (1)) in patches from P$20 cells. (B) Same as in (A) in patches from P cells. Error bars are 6S.E.M.; where no error bars4–10
are shown, sample was smaller than three. (C) Voltage-dependence of m.o.t. (pooled mean, see text) in older and immature cells.
166 J. Fernandes et al. / Developmental Brain Research 132 (2001) 159 –174
increase from 220 to 210 mV (0.2260.02 ms, n55 and (240 mV) and t 50.8 ms, t 51.8 ms (220 mV). Inhf hs
0.3660.02 ms, n57, respectively). In the same voltage older cells, the fraction of samples in which two exponen-range, t increased sharply from 0.9760.20 ms to tials were obtained in ensemble averages (from 260 to 0s
2.2060.31 ms. mV) was as follows: 0 /6 (260 mV), 2 /7 (250 mV), 5 /12Fig. 6C shows mean values obtained by pooling m.o.t. (240 mV), 7 /9 (230 mV), 11/11 (220 mV), 8 /10 (210
(from Eq. (1), i.e. two exponentials) and m.o.t. in the cases mV), 6 /7 (0 mV); a different proportion was found inwhere only one exponential was obtained. In both younger younger cells: 0 /6 (260 mV), 0 /3 (250 mV), 1 /5 (240and older cells mean open time increased in the range 260 mV), 2 /10 (230 mV), 1 /7 (220 mV), 5 /6 (210 mV), 6 /7to 240 mV. Mean open time in younger cells increased (0 mV).substantially in the range 230 to 210 mV. The voltage dependence of the time constant of inactiva-
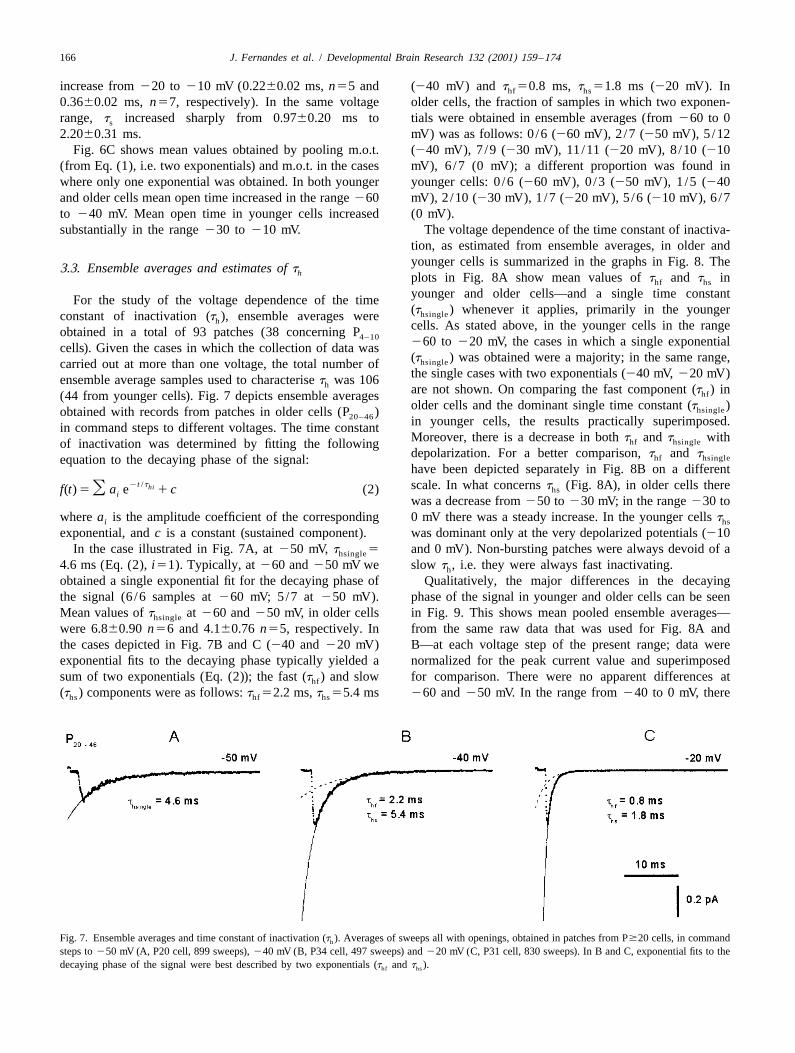
tion, as estimated from ensemble averages, in older andyounger cells is summarized in the graphs in Fig. 8. The3.3. Ensemble averages and estimates of th plots in Fig. 8A show mean values of t and t inhf hs
younger and older cells—and a single time constantFor the study of the voltage dependence of the time(t ) whenever it applies, primarily in the youngerhsingleconstant of inactivation (t ), ensemble averages wereh cells. As stated above, in the younger cells in the rangeobtained in a total of 93 patches (38 concerning P4–10 260 to 220 mV, the cases in which a single exponentialcells). Given the cases in which the collection of data was(t ) was obtained were a majority; in the same range,hsinglecarried out at more than one voltage, the total number ofthe single cases with two exponentials (240 mV, 220 mV)ensemble average samples used to characterise t was 106h are not shown. On comparing the fast component (t ) inhf(44 from younger cells). Fig. 7 depicts ensemble averagesolder cells and the dominant single time constant (t )hsingleobtained with records from patches in older cells (P )20–46 in younger cells, the results practically superimposed.in command steps to different voltages. The time constantMoreover, there is a decrease in both t and t withhf hsingleof inactivation was determined by fitting the followingdepolarization. For a better comparison, t and thf hsingleequation to the decaying phase of the signal:have been depicted separately in Fig. 8B on a different
2t /t scale. In what concerns t (Fig. 8A), in older cells therehi hsf(t) 5O a e 1 c (2)iwas a decrease from 250 to 230 mV; in the range 230 to
where a is the amplitude coefficient of the corresponding 0 mV there was a steady increase. In the younger cells ti hs
exponential, and c is a constant (sustained component). was dominant only at the very depolarized potentials (210In the case illustrated in Fig. 7A, at 250 mV, t 5 and 0 mV). Non-bursting patches were always devoid of ahsingle
4.6 ms (Eq. (2), i51). Typically, at 260 and 250 mV we slow t , i.e. they were always fast inactivating.h
obtained a single exponential fit for the decaying phase of Qualitatively, the major differences in the decayingthe signal (6 /6 samples at 260 mV; 5/7 at 250 mV). phase of the signal in younger and older cells can be seenMean values of t at 260 and 250 mV, in older cells in Fig. 9. This shows mean pooled ensemble averages—hsingle
were 6.860.90 n56 and 4.160.76 n55, respectively. In from the same raw data that was used for Fig. 8A andthe cases depicted in Fig. 7B and C (240 and 220 mV) B—at each voltage step of the present range; data wereexponential fits to the decaying phase typically yielded a normalized for the peak current value and superimposedsum of two exponentials (Eq. (2)); the fast (t ) and slow for comparison. There were no apparent differences athf
(t ) components were as follows: t 52.2 ms, t 55.4 ms 260 and 250 mV. In the range from 240 to 0 mV, therehs hf hs
Fig. 7. Ensemble averages and time constant of inactivation (t ). Averages of sweeps all with openings, obtained in patches from P$20 cells, in commandh
steps to 250 mV (A, P20 cell, 899 sweeps), 240 mV (B, P34 cell, 497 sweeps) and 220 mV (C, P31 cell, 830 sweeps). In B and C, exponential fits to thedecaying phase of the signal were best described by two exponentials (t and t ).hf hs

J. Fernandes et al. / Developmental Brain Research 132 (2001) 159 –174 167
In the younger group there were nine cases with oneapparent active channel, whereas in the older cells therewas only one such case. This section deals with in-formation to be drawn out of such exceptions.
Fig. 10 depicts samples of consecutive records from theolder (P37) cell in which apparently there was only oneactive channel. We were able to record in steps to 240 and220 mV (from a holding potential of 2120 mV) andcollect sufficient data to obtain open dwell time histo-grams. Only one exponential was obtained at both po-tentials and the corresponding m.o.t. were 0.31 ms (240mV) and 0.25 ms (220 mV). The depicted sequences ofsweeps (Fig. 10) are illustrative of the behaviour of thechannel, i.e. brief short latency openings, absence ofreopenings and occasional absence of openings; recordingtime for this patch was about 30 min, and bursts werenever observed.
Mean open time values concerning the nine patches withapparently one active channel found in preparations fromyounger cells are summarized in Table 1. In seven patches,m.o.t. was described by a single exponential and thechannel displayed single short latency openings; the be-haviour was similar to the case of the older cell presentedin Fig. 10.
Inspection of the records of the remaining two patcheseither showed short episodes of brief bursting and longsilent periods (not shown), or a combination of earlyopenings, long lasting openings, and bursts. The latter case(patch [19512, Table 1) is depicted in Fig. 11 (P6 cell,
Fig. 8. Voltage-dependence of the time constant of inactivation as command step to 210 mV). In this case we were able tomeasured in ensemble averages (Fig. 7). (A) Mean values of fast (t ) andhf apply average interval plots [9,10] to characterize patternsslow (t ) components in patches from P$20 cells in command stepshs of activity and to disclose modal behaviour. The currentfrom 250 mV to 0 mV, and in patches from P cells in command steps4–10 was averaged in the interval (35 ms) corresponding to theto 230 mV, 210 mV and 0 mV. The cases in which a single exponential
command pulse (Fig. 11a); the points in the plot represent(t ) was obtained (P ) were also included (m). (B) Fast componenthsingle 4–10
(t ) in P$20 cells and the single exponential (t ), whenever applied the mean current in the pulse interval per sweep, plottedhf hsingle
in P cells, superimposed for comparison (data taken from A). Error4–10 from consecutive sweeps (total recording time: 10 min 40bars are 6S.E.M.; where no error bars are shown, sample was less than s). From Fig. 11a, it is apparent that the channel wentthree.
through different patterns of activity as well as silentperiods. In order to discern the nature of the pattern,
was a dominant faster component in P cells, which measurements were also separately carried out in three4–10
accounts for the sharper drop in the decaying phase in the different segments of the pulse interval (each 11.6 ms inyounger cells. Furthermore, the presence of a sustained duration), i.e. in the first, mid and last third interval of thecomponent was obvious at 220 (older cells) and 210 mV command pulse (Fig. 11b–d, respectively segments 1, 2(younger cells). In order to quantify the sustained com- and 3). From the plots depicted in Fig. 11b–d, it is clearponent—and given the results of the fit (using Eq. (2)) to that the channel went through a period of short latencythe decaying phase of the mean pooled ensemble averages single openings with few reopenings (dominance of open-(not normalized)—the sustained to peak current ratio, i.e. ings in segment 1, Fig. 11b and e), followed by a silentc /(a 1 a 1 c) (Eq. (2)) was calculated. The results period, before entering another pattern: long lasting open-1 2
concerning the sustained to peak ratios at 220 and 210 ings, some corresponding to the whole duration of themV were, respectively, as follows: 0.035 and 0.023 (older pulse with occasional brief closures (openings in the threecells); 0.010 and 0.016 (younger cells). segments, Fig. 11b, c, d and f); the same pattern was
detected at the end of the recording period. In between,3.4. Exceptional cases there were series of bursts, with reopenings throughout the
pulse although with some dominance in the first andThe results presented above refer to patches with an second segments (Fig. 11b, c, d and g). These observations
apparent number of active channels between one and four. are consistent with mode shifting, as previously described

168 J. Fernandes et al. / Developmental Brain Research 132 (2001) 159 –174
Fig. 9. Pooled ensemble averages (mean values) normalized to peak current values in patches from P$20 cells (thinner trace) and P cells (thicker4–10
trace), obtained in command steps from 260 to 0 mV. For each voltage, the results for younger and older cells were superimposed for comparison.
[11,41]. Fig. 12 depicts ensemble averages obtained in the current amplitude was sensitive to a change in sodiumsame patch in the corresponding modes (as illustrated in gradient and the current was suppressed by the applicationFig. 11e, f and g). t was best described by a single of a local anaesthetic. From the observations presentlyh
exponential, as follows: 3.6 ms (Fig. 12a), 58 ms (Fig. reported, the major differences between younger and older12b) and 58 ms (Fig. 12c). cells can be summarized as follows: a difference in
channel conductance; differences in mean open time andtime constant of inactivation as a function of voltage;
4. Discussion differences in patterns of channel openings, and bursting.In older cells, m.o.t. increased with depolarization from
The purpose of the present paper is to give an account of 260 to 240 mV, then increasing progressively from 220the nature of the sodium channel population and some of to 0 mV. In the cases where we were able to collectits functional properties in rat CA1 hippocampal cells at sufficient data at more than one voltage in the same patch,two stages of post-natal maturation. In our study, channel m.o.t. differed accordingly. The presence of longer dura-

J. Fernandes et al. / Developmental Brain Research 132 (2001) 159 –174 169
Table 1Observations on the behaviour of the channel (1, 2, 3) and mean opentime data (m.o.t.) obtained in nine patches from younger cells in whichthe number of active channels was apparently one. In the cases with twoexponentials (t and t ), m.o.t. was calculated using Eq. (1)hf hs
aPatch [ Age Behaviour Step m.o.t. (ms) t tf s
(days) potential(mV) t Eq. (1)single
79513 7 1 230 0.25 – – –49601 5 1 230 0.31 – – –39428 5 1 220 0.28 – – –39511 5 1 220 0.24 – – –29414 6 1 210 0.24 – – –29427 4 1 210 0.32 – – –19602 6 1 0 0.37 – – –19512 6 2 210 – 2.88 0.44 3.4119427 4 3 0 – 0.80 0.24 1.38a 1, No bursts, no reopenings; 2, episodes of single openings, longopenings, and late bursts; 3, episodes of brief bursting and long silentperiods.
tion openings at more depolarized potentials determinedthe deviation from a bell-shaped curve, in the m.o.t. v.s.voltage curve [1,2,5,12]. Longer lasting currents andprolonged bursts of openings have been previously re-ported in cardiac and skeletal muscle and sensory as wellas central nervous system neurones [11,26,29,32,42–45]and ascribed to failure of fast inactivation. As such, theimpairment of fast inactivation shown in diverse prepara-tions is seen as a determining factor for increased burstingand late reopenings and an increase in open time at moredepolarized potentials. This disruption of inactivation canbe seen as a destabilization of the inactivation process andslowing entry into the inactivated state [4]; it has beeninduced either by site directed mutagenesis[21,28,34,47,56] or drugs affecting the III–IV linker fastinactivation loop [25,43,48,55]. In our results, the increasein m.o.t. at 220 mV and more depolarized potentials(particularly evident in older cells) as well as the concomi-tant bursting and channel reopening patterns are consistentwith failure of fast inactivation. Our results concerningP cells are also consistent with a report on immature4–10
cardiac myocytes, in which relatively rarer occurrences ofreopenings have been reported [31]. The functional rele-vance of the presently reported voltage dependence charac-teristic of m.o.t. in CA1 cells is difficult to correlate withthe functional behaviour concerning these cells and previ-ously reported elsewhere. A previous study using culturedhippocampal neurones [53] has described (besides theearly transient rapidly inactivating opening) two additionaltypes of sodium channel openings: bursts and brief lateopenings. Another study in cortical neurones [3] provides
Fig. 10. Samples of consecutive records obtained in a patch from an similar evidence. This is consistent with our findings.older (P37) cell. (A) Records were obtained with a command step to 240 In studies on sodium channels in muscle cells andand 220 mV (from a holding potential of 2120 mV). The apparent sensory and motor fibres, a trend to bursting behaviour andnumber of active channels in the patch was one. Arrowheads as in
the finding of two exponentials in the m.o.t. distributionprevious figures. (B) and (C) Corresponding ensemble averages for datahas been ascribed by some researchers to excision of therecorded at 240 and 220 mV, respectively. Inactivation was described
by a single exponential (0.54 ms and 0.37 ms, respectively). patch [35,38] and particularly to an effect of fluoride in the

170 J. Fernandes et al. / Developmental Brain Research 132 (2001) 159 –174
Fig. 11. Average interval plots in a patch from a younger (P6) cell. Records were obtained with a 35-ms command step to 210 mV (from a holdingpotential of 2110 mV). The apparent number of active channels in the patch was one. Total recording time was 10 min 40 s. The upper half of the figuredepicts average interval plots for the entire (35 ms) command pulse (a). The pulse interval was divided into three segments (11.6 ms each) and averageinterval plots were also obtained in the first third (b), mid-third (c) and last third (d) of the pulse interval. The lower half of the figure (e, f, g) depictssamples of consecutive sweeps taken from the different representative modes of the record, as shown by the long arrows. Arrowheads above the raw dataas in previous figures.

J. Fernandes et al. / Developmental Brain Research 132 (2001) 159 –174 171
Fig. 12. Ensemble averages obtained with records from the patch illustrated in Fig. 11, corresponding to the different modes. Averages shown in (a), (b)and (c) were obtained with the series of sweeps concerned with the modes depicted in Fig. 11 (e), (f) and (g), respectively.
bath [30], as in our experimental conditions. However, uncertain and we estimated the minimum number by theseveral studies reported bursting behaviour and a second highest level of superpositions of openings observedexponential describing open time distribution with solu- throughout the recording time at a particular voltage. Thetions lacking fluoride or without excision [9–11,46]. more one depolarizes the membrane—given the increase inKirsch and Brown [29] reported differences between the open probability—the higher the chances for superposi-cardiac and neuronal patches in this particular aspect, i.e. tions of openings to occur, especially earlier in thethe latter were found to be insensitive to excision in what command pulse interval [12,13]. Most of the cases summa-concerns gating and bursting behaviour; also, Alzheimer et rized in Table 1 were recorded with command steps toal. [3] could not detect a difference between cell-attached 220 to 0 mV, where one would expect a high probabilityand excised patches in cortical neurones. In the results of opening [14]. Should one have obtained only onepresently reported, we observed bursting or non-bursting exponential in all the cases in Table 1, we would bechannel behaviour in younger and older cells given the inclined to strenghten the notion that, in our data, twosame experimental procedures. Thus, and given the above, isoforms determined two exponentials in open time dis-we have reasons to accept that excision did not affect our tributions in many of the patches with more than oneresults, nor the comparison of the two groups of cells at active channel. The case illustrated in Fig. 11 drawsdifferent stages of maturation. attention to a different condition. Recording was carried
There are two possible explanations for the finding of a out in steps to 210 mV and displayed different patterns,second exponential in open time distributions: either a such as single short latency openings, long lasting open-heterogeneous channel population (two isoforms) or a ings, and bursting and reopenings; superposition of open-second open state or a combination of both. Most of the ings was never observed, even in sweeps with longreports referring to a second open state in sodium channels openings and prolonged bursts. Therefore, it is reasonableprovide evidence for a sub-conductance [27,37,39,42,52]. to assume that quite likely there was only one activeTo our knowledge, there are two reports in which one channel in this patch [12,13]; this showed mode shiftinginfers dwelling in a second open state apparently with the [9–11,33,45]. Furthermore, m.o.t. was best described bysame conductance as the main open state [8,36]. Our data two exponentials (Table 1). In the particular case depictedprovide no evidence for obvious and quantifiable sub- in Fig. 11, we could afford to disclose mode shifting givenconductances but, given the above, there are no reasons to the concurrence of the presence of only one channel and aexclude the possibility of having two open states with reasonable duration period of stable recording to applypractically indistinguishable conductances. In the present average interval plots.results, m.o.t. in patches from younger cells was more Mode shifting has been ascribed to occasional disruptionoften best described by a single exponential (in the range of fast inactivation, which leads to prolonged openings,230 to 210 mV). In records from younger cells, we found reopenings and bursting; this is seen to alternate eithermore often patches in which the apparent number of active with silent periods and periods with single brief openingschannels was one; this can be ascribed to a lower channel early in the depolarizing pulse [9–11,30,38,41,44,45,53].density in immature neurones. For the purpose of the In our experiments there could be other likely patches withpresent argument what matters is that the data from such mode shifting obscured by the uncertainty determined bypatches provided open dwell time histograms which were the presence of several active channels; these we could notdescribed by a single exponential, with two exceptions characterize applying average interval plots due to multiple(Table 1). active channels. Actually, we were able to identify two
The number of active channels in a patch is always patterns, non-bursting and bursting (here termed respec-
172 J. Fernandes et al. / Developmental Brain Research 132 (2001) 159 –174
tively A and B). In the younger cells, patches with non- with whole cell recording [14], particularly the increase inbursting behaviour were more clearly identifiable and more the slow component at more depolarized potentials in thelikely to be found. older cells (see Ref. [14] Fig. 2b). The relatively higher
In our data there are cases in which we obtained only proportion of t in the older cells—which is easily shownhs
one exponential (m.o.t.) apparently with one or more active by the superposition of pooled and scaled ensemblechannels in the patch. This would incline us to support the averages (Fig. 9)—can be ascribed to the more commonidea that the explanation for the findings of two exponen- occurrence of late openings, reopenings and long-lastingtials in m.o.t. distributions would be the presence of two reopenings in the older cells; the same applies to the higherisoforms. Nevertheless, from the present observations one proportion of a sustained component.cannot exclude the possibility of a second open state [8]; In what concerns t and the voltage dependence of t , ith h
quite likely, there is a combination of both. Whatever the is clear that a single component is more often found in thecondition, there is evidence for a change in channel immature cells. Furthermore, the curves of t vs.hsingle
population with maturation. Furthermore, our results pro- voltage in the immature and t vs. voltage in the olderhf
vide evidence for a significant difference in the channel cells superimpose (Fig. 8B). If we take into account suchconductance in immature and older cells. In fact, in the rat, results, as far as the change in channel population that goesthere is evidence for the expression of Types I, II, III and with maturation is concerned, we are inclined to proposeVI sodium channels in the hippocampus at different stages an addition of channel forms with the progress of matura-of development [6,17,19,20,51], type II being more typical tion. This, in turn, would change the proportion orof the mature rat hippocampus [20]. The ratio of types dominance of channels in a heterogeneous population ofII / III have also been found to change from neonatal to channels.adult [19]. In a study concerning different regions of CNS,including the hippocampus [18], evidence has been ob-tained for variations of Na channel II mRNA from P2 to AcknowledgementsP15 in CA1 cells, and a slow decrease of Na III mRNAwith maturation. Furthermore, and specifically in CA1 This project was supported by a Praxis XXI-FCT grant.cells, the same study showed that Na6 mRNA is also ˜J. Fernandes and P. Marvao were also supported by Praxisstrongly expressed in the first post-natal 2 weeks, and XXI fellowships. We are grateful to L. Goldman for hisreduces thereafter. Although it is generally difficult to helpful and enthusiastic discussions at the early stages ofaccurately correlate information obtained with molecular this research and P.R. Stanfield and H.G. Ferreira for theirbiology methods with those obtained electrophysiological- helpful comments on the manuscript.ly, our results are consistent with the view based onmolecular biology studies that point out changes in thesodium channel population in the course of maturation. References
The cases in which we obtained only one exponential,notwithstanding the fact that there were several active [1] R.W. Aldrich, C.F. Stevens, Voltage-dependent gating of singlechannels in the patch (taken together in consideration with sodium channels from mammalian neuroblastoma cells, J. Neurosci.
7 (1987) 418–431.the cases in which we obtained only one exponential for[2] R.W. Aldrich, D.P. Corey, C.F. Stevens, A reinterpretation ofapparently one active channel) would incline us to support
mammalian sodium channel gating based on single channel record-the idea that the explanation for the findings of two ing, Nature 306 (1983) 436–441.
1exponentials in m.o.t. distributions would be the presence [3] C.A. Alzheimer, P.C. Schwindt, W.E. Crill, Model gating of Na1of two isoforms, although—also from the present observa- channels as a mechanism of persistent Na current in pyramidal
neurons from rat and cat sensorimotor cortex, J. Neurosci. 13 (1993)tions—one cannot exclude the possibility of a second open660–673.state [8]; quite likely, there is a combination of both. 1[4] M.D. Baker, H. Bostok, Inactivation of macroscopic late Na
Whatever the condition, there is evidence for a change in 1current and characteristics of unitary late Na currents in sensorychannel population with maturation. Furthermore, our neurons, J. Neurophysiol. 80 (1998) 2538–2549.results provide evidence for a significant difference in the [5] C.M. Baumgarten, S.C. Dudley Jr., R.B. Rogart, H.A. Fozzard,
1Unitary conductance of Na channel isoforms in cardiac and NB2achannel conductance in immature and older cells.neuroblastoma cells, Am. J. Physiol. 269 (1995) C1356–C1363.The results of the estimates of t point out the followingh [6] S. Beckh, M. Noda, H. Lubbert, S. Numa, Differential regulation of
major observations: (a) there is a dominant single time three sodium channel messenger RNAs in the rat central nervousconstant (t ) in the younger cells; (b) the curves of system during development, EMBO J. 8 (1989) 3611–3616.hsingle
voltage dependence of t in the younger cells and t [7] K. Benndorf, Low-noise recording, in: B. Sackmann, E. Neherhsingle hf(Eds.), Single-channel Recording, Plenum Press, New York, 1995,in the older cells are practically superimposed; (c) there ispp. 129–145.a dominance of t in the younger cells evident in pooledhf [8] I. Benz, W. Beck, W. Kraas, D. Stoll, G. Jung, M. Kohlhardt, Two
ensemble averages; (d) there is an increase in t at more 1hs types of modified cardiac Na channels after cytosolic interventions1depolarized potentials in the older cells. These are con- at the a-subunit capable of removing Na inactivation, Eur.
sistent with previous results from this laboratory in a study Biophys. J. 25 (1997) 189–200.

J. Fernandes et al. / Developmental Brain Research 132 (2001) 159 –174 173
1[9] T. Bohle, K. Benndorf, Multimodal action of single Na channels in [29] G.E. Kirsch, A.M. Brown, Kinetic properties of single sodiummyocardial mouse cells, Biophys. J. 68 (1995) 121–130. channels in rat heart and rat brain, J. Gen. Physiol. 93 (1989)
85–99.[10] T. Bohle, K. Benndorf, Voltage-dependent properties of three1 1different gating modes in single cardiac Na channels, Biophys. J. [30] M. Kohlhardt, Gating properties of cardiac Na channels in cell-free
69 (1995) 873–882. conditions, J. Membr. Biol. 122 (1991) 11–21.[11] T. Bohle, M. Steinbis, C. Biskup, R. Koopmann, K. Benndorf, [31] M. Kohlhardt, H. Fichtner, U. Frobe, Predominance of poorly
1 1 1Inactivation of single cardiac Na channels in three different gating reopening single Na channels and lack of slow Na inactivation inmodels, Biophys. J. 75 (1998) 1740–1748. neonatal cardiocytes, J. Membr. Biol. 103 (1988) 283–291.
[12] D. Colquhoun, A.G. Hawkes, The principles of the stochastic [32] D.L. Kunze, A.E. Lacerda, D.L. Wilson, A.M. Brown, Cardiac Nainterpretation of ion-channel mechanisms, in: B. Sackmann, E. currents and the inactivating, reopening, and waiting properties ofNeher (Eds.), Single-channel Recording, Plenum Press, New York, single cardiac Na channels, J. Gen. Physiol. 86 (1985) 691–719.1995, pp. 397–482. [33] Y.-M. Liu, L.J. DeFelice, M. Mazzanti, Na channels that remain
[13] D. Colquhoun, F.J. Sigworth, Fitting and statistical analysis of open throughout the cardiac action potential plateau, Biophys. J. 63single-channel records, in: B. Sackmann, E. Neher (Eds.), Single- (1992) 654–662.channel Recording, Plenum Press, New York, 1995, pp. 483–587. [34] J.C. McPhee, D.S. Ragsdale, T. Scheuer, W.A. Catterall, A mutation
[14] P.F. Costa, The kinetic parameters of sodium currents in maturing in segment IVS6 disrupts fast inactivation of sodium channels, Proc.acutely isolated rat hippocampal CA1 neurones, Dev. Brain Res. 91 Natl. Acad. Sci. USA 91 (1994) 12346–12350.(1996) 29–40. [35] N. Mitrovic, S. Quasthoff, P. Grafe, Sodium channel inactivation
[15] P.F. Costa, A.I. Santos, M.A. Ribeiro, Potassium currents in acutely kinetics of rat sensory and motor nerve fibres and their modulationisolated maturing rat hippocampal CA1 neurones, Dev. Brain Res. by glutathione, Pflugers Arch. 425 (1993) 453–461.83 (1994) 216–223. [36] K. Nagy, Evidence for multiple open states of sodium channels in
[16] T.R. Cummins, Y. Xia, G.G. Haddad, Functional properties of rat neuroblastoma cells, J. Membr. Biol. 96 (1987) 251–262.and human neocortical voltage-sensitive sodium currents, J. Neuro- [37] K. Nagy, T. Kiss, D. Hof, Single Na channels in mouse neuro-physiol. 71 (1994) 1052–1064. blastoma cell membrane. Indications for two open states, Pflugers
[17] H. Denac, M. Mevissen, G. Scholtysik, Structure, function and Arch. 399 (1983) 302–308.pharmacology of voltage-gated sodium channels, Naunyn- [38] B. Nilius, Model gating behaviour of cardiac sodium channels inSchmiedeberg’s Arch. Pharmacol. 362 (2000) 453–479. cell-free membrane patches, Biophys. J. 53 (1988) 857–862.
[18] P.A. Felts, S. Yokoyama, S. Dib-Hajj, J.A. Black, S.G. Waxman, [39] B. Nilius, J. Vereecke, E. Carmeliet, Different conductance states of1Sodium channel a-subunit mRNAs I, II, III, NaG, Na6 and hNE the bursting Na channel in guinea-pig ventricular myocytes,
(PN1): different expression patterns in developing rat nervous Pflugers Arch. 413 (1989) 242–248.system, Mol. Brain Res. 45 (1997) 71–82. [40] C.C. Park, Z. Ahmed, Characterization of sodium current in
[19] M. Gastaldi, F. Bartolomei, A. Massacrier, R. Planells, A. Robaglia- developing rat diencephalic neurons in serum-free culture, J. Neuro-Schlupp, P. Cau, Increase in mRNAs encoding neonatal II and III physiol. 65 (1991) 1011–1021.
1sodium channel a-isoforms during kainate-induced seizures in adult [41] J.B. Patlak, Molecular kinetics of voltage-dependent Na channels,rat hippocampus, Brain Res. Mol. Brain Res. 44 (1997) 179–190. Physiol. Rev. 71 (1991) 1047–1080.
[20] B. Gong, K.J. Rhodes, Z. Bekele-Arcuri, J.S. Trimmer, Type I and [42] J.B. Patlak, Measuring kinetics of complex single ion channel datatype II Na(1) channel a-subunit polypeptides exhibit distinct using mean-variance histograms, Biophys. J. 65 (1993) 29–42.spatial and temporal patterning, and association with auxiliary [43] J.B. Patlak, R. Horn, Effect of N-bromoacetamide on single sodiumsubunits in rat brain, J. Comp. Neurol. 412 (1999) 342–352. channel currents in excised membrane patches, J. Gen. Physiol. 79
[21] A.O. Grant, J.E. John, V.V. Nesterenko, C.F. Starmer, J.R. Moorman, (1982) 333–351.The role of inactivation in open-channel block of the sodium [44] J.B. Patlak, M. Ortiz, Slow currents through single sodium channelschannel: studies with inactivation-deficient mutant channels, Mol. of the adult rat heart, J. Gen. Physiol. 86 (1985) 89–104.
1Pharmacol. 50 (1996) 1643–1650. [45] J.B. Patlak, M. Ortiz, Two modes of gating during late Na channel[22] O.P. Hamill, A. Marty, E. Neher, B. Sakmann, F.J. Sigworth, currents in frog sartorius muscle, J. Gen. Physiol. 87 (1986) 305–
Improved patch-clamp techniques for high-resolution current record- 326.1ing from cells and cell-free membrane patches, Pflugers Arch. 391 [46] J.B. Patlak, M. Ortiz, Kinetic diversity of Na channel bursts in frog
(1981) 85–100. skeletal muscle, J. Gen. Physiol. 94 (1989) 279–301.[23] A.L. Hodgkin, A.F. Huxley, A quantitative description of membrane [47] D.E. Patton, J.W. West, W.A. Catterall, A.L. Goldin, Amino acid
1current and its application to conduction and excitation in nerve, J. residues required for fast Na -channel inactivation: charge neutrali-Physiol. 117 (1952) 500–544. zations and deletions in the III–IV linker, Proc. Natl. Acad. Sci.
[24] R. Horn, C.A. Vandenberg, Statistical properties of single sodium USA 89 (1992) 10905–10909.channels, J. Gen. Physiol. 84 (1984) 505–534. [48] F.N. Quandt, Modification of slow inactivation of single sodium
[25] R. Horn, C.A. Vandenberg, K. Lange, Statistical analysis of single channels by phenytoin in neuroblastoma cells, Mol. Pharmacol. 34sodium channels. Effects of N-bromoacetamide, Biophys. J. 45 (1988) 557–565.(1984) 323–335. [49] M.A. Ribeiro, P.F. Costa, Kinetic parameters of calcium currents in
[26] J.R. Huguenard, O.P. Hamill, D.A. Prince, Developmental changes maturing acutely isolated CA1 cells, Dev. Brain Res. 124 (2000)1in Na conductances in rat neocortical neurons: appearance of a 11–23.
slowly inactivating component, J. Neurophysiol. 59 (1988) 778– [50] A.I. Santos, W.J. Wadman, P.F. Costa, Sustained potassium currents795. in maturing CA1 hippocampal neurones, Dev. Brain Res. 108
[27] G. Jeglitsch, K. Rein, D.G. Baden, D.J. Adams, Brevetoxin-3 (PbTx- (1998) 13–21.3) and its derivatives modulate single tetrodotoxin-sensitive sodium [51] K.L. Schaller, J.H. Caldwell, Developmental and regional expres-channels in rat sensory neurons, J. Pharmacol. Exp. Ther. 284 sion of sodium channel isoform NaCh6 in the rat central nervous(1998) 516–525. system, J. Comp. Neurol. 420 (2000) 84–97.
[28] S. Kellenberger, J.W. West, T. Scheuer, W.A. Catterall, Molecular [52] W. Schreibmayer, G. Jeglitsch, The sodium channel activatoranalysis of the putative inactivation particle in the inactivation gate Brevetoxin-3 uncovers a multiplicity of different open states of the
1of brain type IIA Na channels, J. Gen. Physiol. 109 (1997) cardiac sodium channel, Biochem. Biophys. Acta 1104 (1992)589–605. 233–242.

174 J. Fernandes et al. / Developmental Brain Research 132 (2001) 159 –174
[53] M.M. Segal, A.F. Douglas, Late sodium channel openings underly- [55] C.A. Vandenberg, R. Horn, Inactivation viewed through singleing epileptiform activity are preferentially diminished by the an- sodium channels, J. Gen. Physiol. 84 (1984) 535–564.ticonvulsant phenytoin, J. Neurophysiol. 77 (1997) 3021–3034. [56] J.W. West, D.E. Patton, T. Scheuer, Y. Wang, A.L. Goldin, W.A.
[54] H. Sontheimer, B.R. Ransom, A.H. Cornell-Bell, J.A. Black, S.G. Catterall, A cluster of hydrophobic amino acid residues required for1 1Waxman, Na -current expression in rat hippocampal astrocytes in fast Na -channel inactivation, Proc. Natl. Acad. Sci. USA 89 (1992)
vitro: alterations during development, J. Neurophysiol. 65 (1991) 10910–10914.3–19.


