Embed Size (px)
Citation preview

J. Physiol. (1983), 343, pp. 253-276 253With 14 text-fgure8Printed in Great Britain
SODIUM/CALCIUM EXCHANGE IN MAMMALIAN VENTRICULARMUSCLE: A STUDY WITH SODIUM-SENSITIVE MICRO-ELECTRODES
BY R. A. CHAPMAN*, A. CORAY AND J. A. S. McGUIGANFrom the Institute of Physiology, University of Berne, Biihlplatz 5,
CH-3012 Berne, Switzerlandt
(Received 27 January 1983)
SUMMARY
1. A method for mounting and rapidly perfusing small ventricular trabeculae(diameter around 250 ,um) from either ferret or guinea-pig is described. Tension,membrane potential (Em) and intracellular Na activity (ai a) were measured.
2. aia was measured using Na-sensitive micro-electrodes. At room temperature(22-26 0C), [Na]0 155 mmol/l and [Ca]o 5*4 mmol/l, aka was 10-9 mmol/l +S.D.4-2 mmol/l (n = 148).
3. When [Na]0 was reduced from 155 to 1-5 mmol/l contractures developed. Thesewere about twitch height in guinea-pig but less than the twitch height in ferret.Associated with the development of the contracture there was a decrease in aNa. Theaka halved within 30 s.
4. The decrease in ak5 was not influenced by changing pHo from 7-4 to 9*5, K-freesolution or strophanthidin 50 ,umol/l and was not passive since, even when the [Na]owas 1-5 mmol/l, the driving force for Na ions remained inward. The aka decreasedif [Ca]0 was increased and [Na]o decreased or vice versa. On the basis of these findingsit is concluded that the decrease in aia is mainly due to Na/Ca exchange.
5. Despite the large decrease in aia the [Ca]i, as monitored by tension changes,hardly increased. Since Ca uptake does occur in Na-free conditions in heart muscleit is proposed that the mitochondria take up Ca ions and so prevent an excessive risein cytoplasmic Ca.
6. Strophanthidin increased both aia and the withdrawal contracture, but collectedresults from a number of experiments showed no clear correlation between the initialaka and contracture amplitude. Strophanthidin may, therefore, have actionsadditional to increasing aiba.
INTRODUCTION
In both mammalian and frog heart a reduction of external Na ([Na]o) results ina substantial gain of Ca by the tissue which should be more than enough to saturateboth the contractile proteins and calmodulin (Niedergerke, 1963; Langer, 1964;Reuter & Seitz, 1968; Wendt & Langer, 1977; Holroyde, Robertson, Johnson, Solaro& Potter, 1980; Busselen, 1982; see also review by Langer, 1982). Consistent withthis gain ofCa, amphibian hearts give near maximal contractures in Na-free solutions
* Present address: Department of Physiology, University of Leicester, Leicester LEI 7RH.t Address for reprint requests.
) by guest on July 14, 2011jp.physoc.orgDownloaded from J Physiol (

R. A. CHAPMAN, A. CORA Y AND J. A. S. McGUIGAN
(Niedergerke, 1963; Chapman, 1974). By contrast, Na removal in mammalianventricular muscle generally fails to produce significant contracture tension (Scholz,1969; Bassingthwaighte, Fry & McGuigan, 1976; Marban, Rink, Tsien, & Tsien,1980). These studies on mammalian ventricle were carried out on preparations whichwere substantially larger than the frog preparations so that, in mammalianpreparations, the rate of diffusion out ofthe extracellular space could be an importantlimiting factor.
In the present work we have tried to minimize diffusional problems by usingtrabeculae of around 250 ,um in diameter, isolated from the hearts of either ferretsor guinea-pigs in conjunction with a rapid flow system. In these preparations we havemeasured not only membrane potential and tension but also the intracellular sodiumactivity (aNa) at rest and during the Na withdrawal contracture. We have also studiedthe effect of strophanthidin in augmenting the Na withdrawal contracture inrelationship to possible changes in aNa. The results show that the absence of largeNa withdrawal contractures in mammalian trabeculae is associated with a decreasein aika. The Ca that enters the cell is most probably taken up by intracellularorganelles. This uptake of Ca may mean that the ionized cytoplasmic Ca hardlyincreases.
Part of this work has been published in abstract form (Chapman, Cigada, Coray& McGuigan, 1981; Chapman, Coray & McGuigan, 1981; Chapman, Coray &McGuigan, 1982) and quoted in our review (Chapman, Coray & McGuigan, 1983).
METHODS
General methodsAnimals. Guinea-pigs obtained locally or ferrets imported from England were used. Guinea-pigs
were, in initial experiments, killed by cervical dislocation, but later by desanguinization followingether anaesthesia. In both cases the heart was removed and placed in oxygenated HEPES Tyrodesolution at 4 'C. Ferrets were anaesthetized with 4% halothane and the heart removed underanaesthesia, or more easily, anaesthetized by ether and killed by cervical dislocation and severalblows on the head. The heart was removed and placed in oxygenated HEPES Tyrode solution at4 'C. In later experiments the hearts were placed in bicarbonate Tyrode solution at roomtemperature, a method that gave better survival of the trabeculae. After about 1 h the bicarbonateTyrode solution bathing the excised heart was changed to HEPES Tyrode solution. In many casesthe ferret hearts could be stored successfully overnight in oxygenated HEPES Tyrode solution inthe refrigerator so that several preparations could be obtained from a single heart.
Preparations. Free-running trabeculae found near the apex of the right ventricle were mountedin the experimental chamber. Occasionally papillary muscles of a suitable small size, found underthe tricupsid valve, were used. Most preparations (74%) in this study had diameters between 100and 300 ,um. The remainder were between 300 and 400 sm except two which had diameters of 500and 600 ,um respectively.The diameter was estimated by an eye-piece micrometer. Tension is expressed as mN/mm2 on
the assumption of circular cross-sectional area. To convert to kg/cm2 the results in mN/mm2 shouldbe multiplied by 0 01.Chamber and perfusion system. The experimental chamber was similar to that described by
Chapman & Tunstall (1971) including the modifications suggested by Chapman & Leoty (1976) andis illustrated in Fig. 1. To obtain a constant but well oxygenated Tyrode solution flow, essentialfor the survival ofthe trabeculae, a perfusion method based on Persoff (1960) was used. To minimizemechanical disturbances the tap was separated from the chamber by a flexible tube which also actedas a flow limiter. Electrical artifacts due to lubricant in the tap were circumvented by using a tapof the type described by Cigada, Coray & McGuigan (1983). The flow rate was 15 ml/min
254
) by guest on July 14, 2011jp.physoc.orgDownloaded from J Physiol (

Na/Ca EXCHANGE IN MAMMALIAN VENTRICLE
A
-,
B
Tocham b
Tap
Fig. 1. A, experimental chamber with a mounted trabecula. Only part of the arm of thetransducer is shown. Stimulation was between the two silver wires embedded in thechamber wall. Fluid flow is from right to left. B, perfusion system. The flow rate couldbe set by changing the level of fluid (and hence pressure in the fluid reservoirs) in thepressure reservoir.
corresponding to a fluid velocity of 2-7 m/min (not 2-7 m/s as stated in Chapman, Cicaga, Coray& McGuigan, 1981).
Mounting. The trabecula was transferred on a cover slip in a drop of Tyrode solution to a poolof stationary fluid in the experimental chamber. One end of the trabecula was then fixed by means
of a U-shaped platinum or stainless-steel wire which fitted into two stainless-steel tubes or holesin the base of the chamber (Fig. 1). The fluid flow was then switched on and the other end of thetrabecula was snared by a 13 ,zm tungsten wire threaded through a stainless-steel tube fixed to thetip of the transducer. Once mounting was complete, the transducer arm was loosened (see Chapman,Cigada, Coray & McGuigan, 1981). Preparations were stimulated at 01 Hz with 5 ms pulses andperfused with Tyrode solution. Preparations showing spontaneous mechanical activity were
rejected if spontaneous activity did not cease within 1-2 h. Recovery often occurred in ferrettrabeculae but hardly ever in guinea-pig trabeculae. The final adjustment to the peak of thelength/twitch tension relationship was made once a satisfactory preparation was obtained.
Solutions. The composition ofthe solutions is given in Table 1. Analysis ofblood from seven ferretshad the following composition (mean +S.E. of mean) in mmol/l: Na, 148-4 1X7; K, 4 8 + 0-7; Ca,2X9 +0-1; Mg, 1-00± 0-04; Cl, 1 8-4 + 25. We initially based our Tyrode solution on this analysis
255
fI
) by guest on July 14, 2011jp.physoc.orgDownloaded from J Physiol (

256 R. A. CHAPMAN, A. CORA Y AND J. A. S. McGUIGAN
but experience showed that survival of the trabeculae was improved if Na and Ca concentrationswere increased.The experimental solutions were made from stock solutions. K stock consisted of KCI and KOH
in equal quantities so that the pH of the HEPES solutions could be titrated to pH 7-4 by 1 mol/lHCl.
TABLE 1 (Concentration mmol/l)Bicarbonate HEPES Na-poor
Na 149-2 155 15 (0)K 5.4 5 5Ca 5.4 5.4 5.4Mg 05 0.5 05Cl 154-1 169-5 171 (169-5)Pyruvate 5HEPES 5 5Glucose 5 5Tetramethylammonium - 155HCO3 11-9H2P04 0 4pH 7*4. Bicarbonate Tyrode solution was gassed with 95% 02/5% C02; HEPES and Na-poor
with 100% 02. Mean chloride concentration due to HCl titration was 0-2 mmol/l. The valuesin parentheses refer to concentrations in 0 Na Tyrode.
All solutions were filtered to remove particles that tended to stick to the electrode tips.Strophanthidin was dissolved in alcohol to give a concentration of 20 mmol/l. Adrenaline(10 mmol/l) tetracaine (0-2 mmol/l) and chlorpromazine (125 mmol/1) were added as aqueoussolutions. Monensin was dissolved in equal quantities of ethanol and dimethylsulphoxide to givea stock concentration of 10 mmol/l. Antazoline, 2-(O-diphenyloxymethyl)-imidazole and caffeinewere added as solids.
Temperature. Experiments were carried out at room temperature (22-26 °C). The temperaturewas maintained above 22 °C for below this temperature the trabeculae depolarized.
Electrical recording. Membrane potentials were measured with conventional micro-electrodes filledwith 3 mol/l KCl and having resistances between 10-15 MQl. The potential of the Na-sensitivemicro-electrode was measured using a 31 1J Analog Devices amplifier. The indifferent electrode,placed downstream, contained 3 mol/l KCI in Agar connected to an Ag/AgCl2 wire. Records oftension, membrane potential (Em), the potential of the Na electrode (UNa+Em) and the differenceof these two parameters (UNa) were displayed on a chart recorder. For dual impalements themicromanipulators from Zeiss (Jena, G.D.R.) proved advantageous.Upon insertion of the KCI micro-electrode the experiment was continued only if the Em was
greater than -70 mV. Only about a third of our preparations met this criterion. After this theNa-sensitive micro-electrode was inserted.
Transducer. The transducer has been described by Chapman et al. (1981) and used an AkkerAE802 element as the sensing device. The change in resistance was detected by either an a.c. ord.c. bridge circuit. The resonance frequency of the transducer was 100 Hz.
Na-sensitive micro-electrodesFabrication. These were made from borosilicate glass (Clark Medical Instruments, Pangbourne,
England, ref. GC 120 F-10), cleaned and hydrated by (1) storage for several days in 65% nitricacid, (2) washing for 2 h in running tap-water, (3) rinsing in distilled water, (4) placing in distilledwater for 12 h at 90 °C and finally dried.The treated glass was pulled and the micro-electrodes bevelled under acetone (Stiahli beveller,
Lapp Technik, Pieterlen, Switzerland) to a final tip diameter (microscopic control) ofless than 1 ,um.Electrodes were silanized, placed tip uppermost in an aluminium block inside a glass vessel. In anoven at 200 °C pure N2 was driven through the glass container. After 10 min the N2 was switched
) by guest on July 14, 2011jp.physoc.orgDownloaded from J Physiol (

Na/Ca EXCHANGE IN MAMMALIAN VENTRICLE
off and five drops of N,-N-dimethyltrimethylsilylamine were added to the dish. 30 min later N2was again switched on for 10 min. The electrodes were then left to cool.
Electrodes were back-filled with the neutral sodium carrier in O-nitrophenyloctylether containingsodium tetraphenylborate (Steiner, Oehme, Ammann & Simon, 1979) with a Hamilton syringe.After filling the electrodes were placed in a vessel for 10 min and the pressure reduced to removeair bubbles. The shaft of the electrodes was filled with 100 mmol/l NaCI.
Calibration. This was carried out using the chamber described by Tsien & Rink (1980). Tomaintain the ionic strength of the solutions constant the sum ofK and Na was always 140 mmol/l.The solution also contained 5 mmol/l HEPES, 3 mmol/l Mg and had a pH of 7-2. To convert from
A
0~~~~~~~~~e100
3 2 1 0-log [Na]
B
AUNa 0T* U~~~10mVI
8 7 6 5 4 3pCa
Fig. 2. A, mean calibration curve +S.E. of mean for fifty-four different Na-sensitivemicro-electrodes. The outer lines represent + 1 S.D. B, response of six different Na-sensitivemicro-electrodes to varying [Ca]0 at a [Na]0 of5 mmol/l. The results are presented as meanvalues. The S.E. of mean is less than the size of the point. The straight line was drawnthrough the mean at pCa 7-6 in order to make the deviations at higher Ca clearer. Cabuffered with EGTA. The apparent binding constant was 7-01.
concentration to activity at 22 0C a mean activity coefficient for Na (YNa) of 0-746 was used. TheYNa has been calculated according to the equation of Davies (1938) and, since the ionic strength ofthe HEPES Tyrode solution (0-177) and the calibrating solutions (0-150) were different, YNa was0-736 and 0-746 respectively. In the results this difference has been neglected.
Fifty-four different Na-sensitive micro-electrodes were used in the measurement of the restingai a. The combined calibration curve (mean + S.E. ofmean) as well as two outer lines which represent+ 1 S.D. are shown in Fig. 2A.The calibration curves for thirty-eight electrodes lie between the two outer lines and the slope
between Tyrode solution and 20 mmol/l Na varied from 45 to 64 mV/decade. Calibration was madebefore and after an experimental measurement. Normally they were similar but if there was adifference, the mean of the two measurements was used to determine aiba.The mean time response for 0-95% of the final signal on changing [Na]O from 10 to 1 mmol/l
in the experimental chamber was 13 s+S.E. of mean 3 s in nine electrodes.Reaction of the Na-sensitive micro-electrodes to other cations and strophanthidin. The measured
sensitivity to K and H ions was small and as found by Meier, Lanter, Ammann, Steiner & Simon(1982). A lack of sensitivity to K is implicit in our calibrating procedure. As shown in Fig. 2B theelectrode does respond to Ca above 500 nmol/l. This measurement is different from that of Bers& Ellis (1982), but their finding is based on a calculated sensitivity.
PHY 343
257
9) by guest on July 14, 2011jp.physoc.orgDownloaded from J Physiol (

258 R. A. CHAPMAN, A. CORA Y AND J. A. S. McGUIGAN
The rise in aia suggested by the contracture or measured in guinea-pig ventricle (Coray &McGuigan, 1981) and in ferret ventricle (Marban et al. 1980) suggest that the changes in intracellularCa were over a range unlikely to greatly affect the Na-sensitive micro-electrode.
Strophanthidin 10 ,mol/l and tetramethylammonium 155 mmol/l had no effect on the sensitivityof the Na-sensitive micro-electrode.
Drift of the electrodes. The drift of the electrodes was measured as part of the experiment. In 45%of all electrodes no drift was found. In 30% it was less than 0 5 mV/min. For the remainingelectrodes only three exceeded 2 mV/min having drifts of 2-9, 3-6 and 4-5 mV/min respectively.For the analysis of the results, drift, if present, was assumed to be linear.Time course of ala during changes in [Na]0 and [Ca]0. The time course of the changes in ai a was
obtained from the potential trace (UNa) of the Na-sensitive micro-electrode. A grid was placed overthe UNa curve and this curve converted directly to a a at either 10 or 30 s intervals by referenceto the corresponding calibration curve.
Guinea-pig FerretA B
Z jI
C DC. l _llLD L _i ,K _ -jEE
ELO
________ ~2 minE F
Es *E
E EE~~~~~~ .1L ~ ~ L
10 minFig. 3. Typical Na withdrawal contractures from guinea-pig and ferret ventriculartrabeculae. Guinea-pig trabecula 200 jam in diameter, Em -82 mV; ferret trabecula300 jsm in diameter, Em -84 mV. The time scale is the same in A, B, C and D. A, B [Na]0during the bar was reduced from 155 mmol/l to 1-5 mmol/l. C, D, during perfusion with[Na]0 1-5 mmol/l (upper bar) perfusion was switched to 1-5 mmol/l [Na]0 and caffeine10 mmol/l (lower bar). E, F, relaxation of the contractures on a slower time scale. Barshows period of [Na]0 1-5 mmol/l.
RESULTS
General properties of the preparationNa substitutes. A variety of Na substitutes have been used, viz. choline chloride,
Tris(hydroxymethyl) amino-methane, LiCl and tetramethylammonium chloride. Theability of the preparation to withstand multiple exposure to Na-poor solutions wasgreatest with tetramethylammonium chloride. The lenity of tetramethylammoniumchloride as a Na substitute has also been noted by Spring & Giebisch (1977) on kidney.
) by guest on July 14, 2011jp.physoc.orgDownloaded from J Physiol (

Na/Ca EXCHANGE IN MAMMALIAN VENTRICLE
AGuinea-pig
C
EX) Twitch812A r
1--° 4t-T0 LL -
0 4 8 12mN/mm2
C
ContractureWup
wE
E0
z
FerretB50 _
40 - Twitch30 -
20 -
10 L
0 10 20 30 40 50 60
,\l mN/mm2D
140
1201008060
40
200
12
8 L4-
0 4 8 12mN/mm2
E F60
4-1 ContractureE Twitch
' 12CDE 8 -fl n0 4-
z0 200 400
4030
Contracture
0 10 20 30 40 50 60mN/mm2
Contractu re x 100Twitch
0 20 40 60 80 100
Fig. 4. Histograms showing combined results of the contracture experiments. Ferret, 48experiments, 123 measurements; guinea-pig, 10 experiments, 24 measurements. A, B,twitch amplitude. C, D, contracture amplitude. E, F, contracture/twitch ratio expressedas a percentage. In these experiments we could find no difference between the contractureson 0 Na or in 1-5 mmol/l Na so in this and in subsequent results the findings from bothhave been combined.
Mechanical response. A number ofdifferences were found between the Na withdrawalcontractures, responses to caffeine and twitches in guinea-pig and ferret. Typicalresponses are shown in Fig. 3 and the collected data from all our experiments inFig. 4.
In both species the amplitude of the Na withdrawal contractures was less than10 mN/mm2 (Fig. 3A, B; Fig. 4C, D). Contractures in both guinea-pig and ferretspontaneously relaxed although the rate of relaxation was slower in the guinea-pig(Fig. 3E, F). Both showed a further increase in tension if caffeine 10 mmol/l wasapplied during the Na withdrawal contracture (Fig. 3C, D). In ferret the responsewas transient, but a slow relaxation also occurred in guinea-pig. In guinea-pig themean tension reached during the caffeine contracture was 14-6 mN/mm2 + S.E. ofmean 1-5 mN/mm2 (twenty-nine experiments). Because of the transient nature ofcaffeine contractures in ferret preparations the tension may not reach maximal
9-2
259
) by guest on July 14, 2011jp.physoc.orgDownloaded from J Physiol (

R. A. CHAPMAN, A. CORA Y AND J. A. S. McGUIGAN
tension, but a value of 67-5 mN/mm2 was reached in one experiment and over35 mN/mm2 in three other experiments.The twitches in ferret were generally larger than those in the guinea-pig (Fig. 3A,
B; Fig. 4A, B) and because of this the contracture/twitch ratio was greater inguinea-pigs (Fig. 4E, F).
Resting potential. In trabeculae perfused with [Ca]o 1-8 mmol/l multiple impalementoften resulted in a sudden depolarization of the membrane to around -40 mV,associated with onset of spontaneous mechanical activity. In [Ca]. 5-4 mmol/l thisproblem rarely occurred and hence this concentration has been used routinelythroughout these experiments. In the presence of [Ca]o 5-4 mmol/l the mean restingpotential in sixty-eight experiments (295 impalements) was 78-0 mV + S.E. of mean04 mV.When the bathing [Na]0 was reduced to 1-5 mmol/l there was a hyperpolarization
of the membrane which had a mean value of 4-3 mV + S.E. of mean 0-3 mV (n = 35).In preparations which were depolarized at rest (Em approximately -40 mV)reduction of the [Na]0 induced a large hyperpolarization to around -80 mV.
A number of procedures were used in an attempt to increase the size of the sodium withdrawalcontracture, chlorpromazine (1-50 ,umol/1), adrenaline (0 1 and 1 #smol/l) and tetracaine(0-2 mmol/l) had no effect on the amplitude of the Na withdrawal contracture. Antazoline(2-5 mmol/l) and 2-(O-diphenyloxymethyl-imidazole (2 mmol/l) increased resting tension, Nawithdrawal contracture and the subsequent caffeine contracture. Exposure to K-free solutioncaused an increase in the subsequent Na withdrawal contracture but also caused depolarizationand spontaneous activity. Strophanthidin (10-50jumol/l, ferret) and monensin (2-50,umol/1)caused large increases in the Na withdrawal contractures. In none of these experiments wasmaximal tension (as defined by the response to 10 mmol/l caffeine) arrived at during the Nawithdrawal contractures. Further details of these contractures are given in Chapman, Coray &McGuigan (1983).
aia measurements at rest and during the Na withdrawal contracture
Resting values. The resting values for aia are shown in Fig. 5 for 148 measurementsin thirty-five ferrets and seven guinea-pigs. The mean value was 10-9 mmol/l +S.D.4-2 mmol/l. The results gave no indication of a difference between the resting aka inferret and guinea-pig preparations.Na withdrawal contracture. Fig. 6A shows a typical experiment in which Em, the
Na potential (UNa) and tension were measured during reduction of [Na]o from155 mmol/l to 1 5 mmol/l. During the Na withdrawal contracture aka decreased from11-2 mmol/l to around 1 mmol/l in about 150 s. On readmittance of HEPES Tyrodesolution the muscle relaxed and aka increased to near its original value.A convenient test of the quality of the impalements of the electrodes is also shown
in this Figure. An increase of [K]0 to 20 mmol/l, although it depolarized the ventricle(Em trace), did not alter the UNa, showing that both the Em electrode and theNa-sensitive micro-electrode registered the same change in potential. A similarresponse was recorded in three other experiments.A decrease in aia on depolarization might be expected (see Eisner, Lederer &
Vaughan-Jones, 1980). However, the exposure to 20 mmol/l was for less than 1 minand hence may not have been long enough to show a slow change in aka.
In Fig. 6B the change in aNa with time produced by an experimental manoeuvre
similar to the experiment in Fig. 6A in thirty-two preparations is presented as mean
260
) by guest on July 14, 2011jp.physoc.orgDownloaded from J Physiol (

Na/Ca EXCHANGE IN MAMMALIAN VENTRICLE 261
+S.E. of mean at summing intervals of 30 s. The numbers on the curves representthe number of points summed. (The shape of the curve may be biased owing to therelatively large number of experiments up to 2 min.)
This decrease in aka observed during perfusion with Na-poor Tyrode solution couldbe due to a passive loss of Na ions, an active extrusion of Na ions or an exchangeof Na ions with either H or Ca ions. In the following experiments we have tried todistinguish amongst these possibilities.
32 -
Mean 10-9 mmol/ISD. 4-2 mmol/I
24 S.E. 0.3 mmol/I
C
E
16E0
6z
8
0 4 8 12 16 20aNa (mlI
Fig. 5. Histogram ofthe combined aia results (42 experiments, 148 different impalements).Temperature 22 TC; [Na]0 155 mmol/l; [Ca]o 5.4 mmol/l: pH. 7-4.
Passive loss. A passive loss of Na ions seems unlikely for the Na equilibriumpotential (ENa) calculated from the experiment in Fig. 6A for an extracellular sodiumactivity (aOa) of 1 1 mmol/l and an ai of 1-3 mmol/l is -58 mV at the beginningof the decrease. As aia decreases, ENa becomes less negative and the driving forcefor Na ions will be inward for the duration of the Na withdrawal contracture.
Active extrusion of Na. Application of 50 ,umol/l strophanthidin at least partiallyinhibits the Na pump in ferret trabeculae (Fig. 7) for in this experiment on applicationof strophanthidin the resting aia rose from 3-9 to 7-5 mmol/l over a 10 min period.On reduction of [Na]0 to 1-5 mmol/l a strong contracture occurred and the aia stilldeclined, in this example from 7.5 mmol/l to 0-8 mmol/l over 4-2 min. Essentiallysimilar results were obtained in six other experiments.Exposure to a Na-poor, K-free Tyrode did not cause depolarization, but under these
conditions aia still declined. In these experiments no difference in the rate of declinein aia in normal and in K-free solutions could be detected. This further supports theidea that the Na pump did not participate in the decline in aiNa (five experiments;see also Discussion).Na/H exchange. A Na/H exchange has been described for a variety of tissues (see
review by Roos & Boron, 1981). Under our conditions the measured mean pHi was
) by guest on July 14, 2011jp.physoc.orgDownloaded from J Physiol (

262 R. A. CHAPMAN, A. CORA Y AND J. A. S. McGUIGAN
A
E LE80
-
0° r- aN8 (mmol/I)E X40 20
]10
Tension [4 mN/mm2 L
1-5 mmol/I Na 20 mmol/I K
0 40 80 120 160 TyrodeTime (s)
B14
12 54
1008
E e 54E. 6 52o . 40 252o * 20 17 1312
0 1 2 3 4 5 6Time (min)
Fig. 6. A, decrease in a'a during perfusion with [Na]o 1-5 mmol/l. Ferret trabecula, smallband, 100 ,sm by 200 ,um. B, combined result from thirty-two different experiments. Thepoints are the mean and the number beside each point represents the number ofmeasurements summed. Only the s.E. at time zero and at 30 s are shown. Thereafter theS.E. were smaller than the size of the point. The line through the points has been calculatedusing eqn. (2) with Jmax 90 pmol/cm2 . s and a Km of 7-1 mmol/l. The initial aia was11-3 mmol/l. The arrow represents the mean time to the peak of the contracture. The s.E.of mean is too small to be included.
7'31 (Coray & McGuigan, 1983) equivalent to an EH of -5-2 mV, i.e. the passivedriving force for protons at the normal Em is inward. Fig. 8 shows the effect ofreducing [Na]o to 1-5 mmol/l at pHo 7*4 (Fig. 8A), 1 min after changing to pHo 9.5(Fig. 8B) and on return to pHo 7-4 (Fig. 8C). This change in pHo had little effecton size or time course of the changes in aka. Similar effects were found in three otherexperiments.Na/Ca exchange. If the decrease in ai a produced by reducing [Na]o is related to
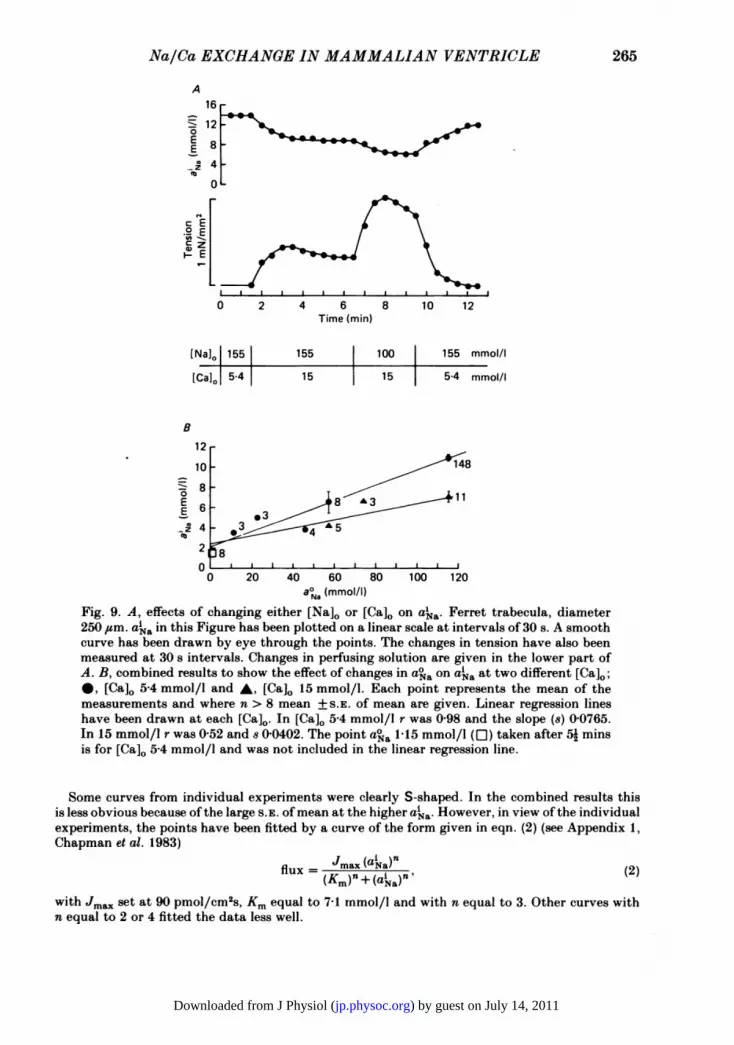
a Na/Ca exchange across the sarcolemmal membrane, then it would be anticipatedthat changes in either [Na]o or [Ca]o or both would influence ai a (cf. Ellis, 1977; Sheu& Fozzard, 1982). A typical experiment showing changes in aia produced by raising[Ca]o from 5-4 to 15 mmol/l and by lowering [Na]o from 155 to 100 mmol/l is shownin Fig. 9A. Both manipulations caused a reduction in aka but only small increases
) by guest on July 14, 2011jp.physoc.orgDownloaded from J Physiol (

Na/Ca EXCHANGE IN MAMMALIAN VENTRICLE
~E
iE -180
z 1-
a -120 L4
cE.9 E E
10m1 1 mmol/ NaV) ~~
C1411
50 pmol/I Strophanthidin 50 pmol/I Strophanthidin5 min
Fig. 7. The effect of strophanthidin on aia at rest and during [Na]o 1-5 mmol/l. Ferrettrabecula, diameter 140 /sm. The traces from above downward are Em; potential of theNa-sensitive micro-electrode (UNa+ Em); Na potential UNa and tension. Note the breakin the voltage scale in the (UNa + Em) and UNa trace. The Em impalement was briefly lostduring the contracture. Strophanthidin (50 ,umol/l) was present in the [Na]0 1-5 mmol/lsolution as well as before and after the Na withdrawal contracture.
in resting tension (in this experiment the largest change was equivalent to 5% of thetwitch tension).The change in aka brought about by raising [Ca]o from 5-4 mmol/l to 15 mmol/l
in [Na]o 155 mmol/l or by lowering [Na]o to 77-5 mmol/l from 155 mmol/l in thepresence of [Ca]o 5-4 mmol/l is approximately the same, being 7-7 mmol/l + S.E. ofmean 2-3 mmol/l (n = 6) and 7'04 mmol/l + S.E. of mean 1P8 mmol/l (n = 5)respectively. The half-time ofaka induced by the two changes in bathing fluid is 31-8 s+ S.E. of mean 8-6 s for the change in [Na]0 and 44 0 s + S.E. of mean 11-7 s for thechange in [Ca]0, values not significantly different from each other.
In eight other experiments [Na]o was reduced to other values in [Ca]o either5.4 mmol/l or 15 mmol/l. The results ofthese experiments are shown in Fig. 9B wherethe steady-state values of aia have been plotted against aoa for the two different Caconcentrations. The aka would seem to be approximately linearly related to aoa. Anincrease in [Ca]0 reduces the slope of this relationship. This linear relationship issimilar to that obtained by Ellis (1977) in Purkinje fibres and Sheu & Fozzard (1982)in mammalian ventricular muscle.
Na efflux during the Na withdrawal contractureIf the change in aka brought about by the manipulation of [Na]o and [Ca]0 in the
bathing solution is to be interpreted as a movement of Na ions through the cell
263
) by guest on July 14, 2011jp.physoc.orgDownloaded from J Physiol (

R. A. CHAPMAN, A. CORA Y AND J. A. S. McGUIGAN
A
015, -
E 5 - pHo 7-4-M 1
B
0 15 -
E lOF-E 5 - pHo 9-5E 1 7
C
015 4E 10EE L pH0 7*4
7 minFig. 8. Effect of pHo on the change in a'a when [Na]o is reduced from 155 mmol/l to1-5 mmol/l. Ferret trabecula, diameter 290 ,um. A, pHo 7-4. Reduction of [Na]o to1-5 mmol/l brings about a decrease of ala from 9-2 mmol/l to 0 4 mmol/l. B, between thefirst two arrows the solution was changed to HEPES Tyrode solution pH 9-5. Betweenthe second and third arrow the Na was reduced to 1-5 mmol/l while maintaining a pHof 9 5. a'a decreased from 10-2 mmol/l to around 0 1 mmol/l. Between the third andfourth arrow the perfusion fluid was altered back to HEPES Tyrode solution pH 9*5 beforefinally switching to normal Tyrode solution pH 7-4 (fourth arrow). In order to achieve apH of 9-5 the HEPES concentration was reduced by half. C, repeat of the experimentin A. During [Na]o 1-5 mmol/l a'a decreased from 10-7 mmol/l to 0-5 mmol/l.
membrane, then the net Na flux can be calculated from eqn. (1)
net Na flux = At A]i ' (1)
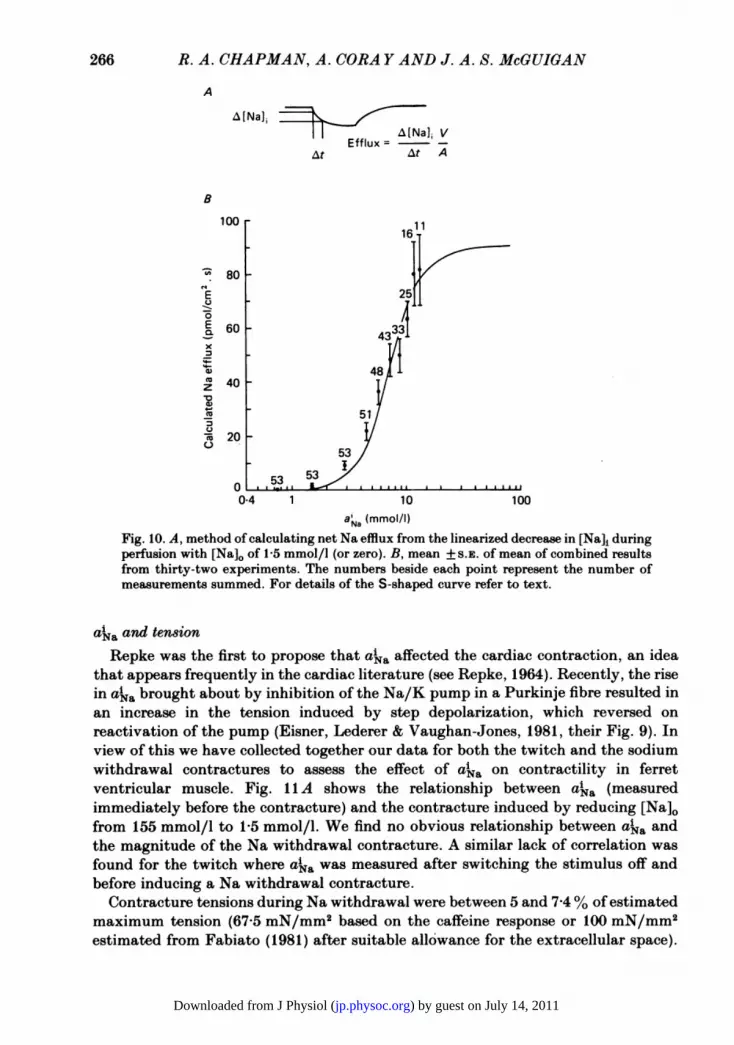
where V/A is the volume/surface area ratio. This was taken from the measurementsof Page (1978). A plot of the calculated Na efflux against aka is shown in Fig. 10 inwhich Na efflux has been calculated for a change in [Na]o from 155 mmol/l to1-5 mmol/l. The data were based on analyses of fifty-three measurements inthirty-two different experiments.
Calculation of the net Na efflux. Part A of Fig. 10 shows the method of obtaining the efflux fromthe linearized change in [Na]i. Steps of 10 or 30 s were taken and the efflux in the period wasconsidered to be appropriate to the mean akaof the step. For each measurement a smooth curvewas drawn through the points so that the efflux could be read off at a particular a'Na. The valuesobtained from all the curves at each particular ai a were averaged and are presented as mean + S.E.of mean in Fig. lOB.Two assumptions are implicit in the above calculations. Firstly, the YNa is assumed to be equal
inside the cell and in the calibrating solutions. Secondly, Na ions are distributed evenly throughoutall of the cell volume (i.e. organelles are neglected). If there were differences in YNa or the Na ionswere confined to a smaller volume of the cell, then the magnitude of the effluxes would be different.
264
) by guest on July 14, 2011jp.physoc.orgDownloaded from J Physiol (
Na/Ca EXCHANGE IN MAMMALIAN VENTRICLE
A16
S12
E 84.z- 4_
0
W -_
0 2 4 6 8 10 12Time (min)
[Na]0 155 155 100 155 mmol/I
[Ca]l 5-4 15 15 5-4 mmol/I
B
10 - /
E 6 3_ +~LZ 4 _ 3_ 5
2 8
00 20 40 60 80 100 120
aNa (mllFig. 9. A, effects of changing either [Na]0 or [Ca]o on a'a. Ferret trabecula, diameter250 ,um. aka in this Figure has been plotted on a linear scale at intervals of 30 s. A smoothcurve has been drawn by eye through the points. The changes in tension have also beenmeasured at 30 s intervals. Changes in perfusing solution are given in the lower part ofA. B, combined results to show the effect of changes in a° a on aia at two different [Ca].;*, [Ca]0 5-4 mmol/l and A, [Ca]o 15 mmol/l. Each point represents the mean of themeasurements and where n > 8 mean +S.E. of mean are given. Linear regression lineshave been drawn at each [Ca]0. In [Ca]o 5-4 mmol/l r was 0-98 and the slope (s) 0-0765.In 15 mmol/l r was 0-52 and 8 0-0402. The point aoa 115 mmol/l (LI) taken after 52 minsis for [Ca]o 5-4 mmol/l and was not included in the linear regression line.
Some curves from individual experiments were clearly S-shaped. In the combined results thisis less obvious because of the large S.E. ofmean at the higher aika. However, in view of the individualexperiments, the points have been fitted by a curve of the form given in eqn. (2) (see Appendix 1,Chapman et al. 1983)
flux Nmax(aia) (2)
with Jma. set at go pMol/Cm2s, Km equal to 7-1 mmol/l and with n equal to 3. Other curves withn equal to 2 or 4 fitted the data less well.
265
) by guest on July 14, 2011jp.physoc.orgDownloaded from J Physiol (
266 R. A. CHAPMAN, A. CORA Y AND J. A. S. McGUIGAN
A
A[Na]A[Na]j V
Efflux = [ VAt At A
B
100 11
" 80
E 25i
.60 4333x
48z 40
Xu 51
Q 20 _i2053
0 5
0-4 1 10 100aNa (mmol/I)
Fig. 10. A, method of calculating net Na efflux from the linearized decrease in [Na]i duringperfusion with [Na]o of 1-5 mmol/l (or zero). B, mean + S.E. of mean of combined resultsfrom thirty-two experiments. The numbers beside each point represent the number ofmeasurements summed. For details of the S-shaped curve refer to text.
aka and tensionRepke was the first to propose that aia affected the cardiac contraction, an idea
that appears frequently in the cardiac literature (see Repke, 1964). Recently, the risein aia brought about by inhibition of the Na/K pump in a Purkinje fibre resulted inan increase in the tension induced by step depolarization, which reversed onreactivation of the pump (Eisner, Lederer & Vaughan-Jones, 1981, their Fig. 9). Inview of this we have collected together our data for both the twitch and the sodiumwithdrawal contractures to assess the effect of aia on contractility in ferretventricular muscle. Fig. 11 A shows the relationship between aNa (measuredimmediately before the contracture) and the contracture induced by reducing [Na]ofrom 155 mmol/l to 1-5 mmol/l. We find no obvious relationship between aia andthe magnitude of the Na withdrawal contracture. A similar lack of correlation wasfound for the twitch where aia was measured after switching the stimulus off andbefore inducing a Na withdrawal contracture.
Contracture tensions during Na withdrawal were between 5 and 7-4% of estimatedmaximum tension (67-5 mN/mm2 based on the caffeine response or 100 mN/mm2estimated from Fabiato (1981) after suitable allowance for the extracellular space).
) by guest on July 14, 2011jp.physoc.orgDownloaded from J Physiol (

Na/Ca EXCHANGE IN MAMMALIAN VENTRICLE 267
A3
zE
03 0 *
0 4 8 12 16 20aNai (mmol/l)
B
3 -
E 2zE
X1 _
01~~Of .8.| *I
0 4 8 12 16,&ai (mmol/l)
Fig. 11. A, plot of contracture amplitude (mN/mm2) against a'a measured immediatelybefore the contracture. Result of twenty-eight experiments, fifty-nine different measure-ments on ferret trabeculae. B, plot of contracture amplitude (mN/mm2) against AaNasmeasured as difference between the initial aia and the aia after 90 s. Results oftwenty-fiveexperiments, thirty-two different measurements in ferret trabeculae.
Moreover, aia falls during exposure to the Na-poor Tyrode so that the mean aia atthe peak tension is lower than the aia immediately before the contracture. This isindicated in Fig. 6B.
Since it is the amount of calcium that moves into the cell that is likely to be ofimportance in determining the strength of the contracture, we have also plotted theA[Na]i over the first 90 s against contracture amplitude. This is shown in Fig. 11 B,but the correlation is only slightly more suggestive.
Effects of strophanthidin on aia and contractilityOn five separate occasions in ferret trabeculae when the electrodes remained in the
preparations for 10 min or longer it was possible to measure the increase in aia duringexposure to 50 ,umol/l strophanthidin. In two preparations a brief initial decline inaka occurred, but generally aka rose to a plateau in a similar way as described forPurkinje fibres (Deitmer & Ellis, 1978). Using the same technique and assumptions
) by guest on July 14, 2011jp.physoc.orgDownloaded from J Physiol (

R. A. CHAPMAN, A. CORA Y AND J. A. S. McGUIGAN
TyrodeA
10080 F Contracture
60 F
40hIA 20-4' 0E 0 4 8 12 16 20IA (mN/mm2')E
o Strophar0 C
I 10080 - Contracture
6040
20 L> .0 4 8 12 16 20
(mN/mm2)
B
t t
2 min
nthidinD
it /1
2 min
Fig. 12. A, C, histograms showing the amplitude of the Na withdrawal contractures innormal Tyrode solution (A) and after strophanthidin doses ranging from 10 'Umol/l to50 ,umol/l (C) in ferret trabeculae. The results in normal Tyrode solution are from 48experiments, 123 measurements, those in strophanthidin are from 18 experiments, 38measurements. Due to the large difference in experimental measurements the results are
given as percentage of the total number of measurements. B, D, comparison of thecontracture in normal Tyrode solution (B) with that after strophanthidin (50 /Zmol/l) ID).Same experiment as in Fig. 7.
8
6EEzE
03
(.3
0
4
AL
A
A
A
2 k
0 _ ,A ** a An
A
.6I
A
4 8 12 16 20 24 28 32
aN. (mmol/1)
Fig. 13. Comparison ofcontracture amplitude (mN/mm2) with the aka immediately before
the contracture ([Na]0 1-5 mmol/l) in normal Tyrode solution and after strophanthidin(10 #smol/l to 50 ,smol/l) in six experiments on ferret trabeculae, A, twelve measurementswith strophanthidin, 0, fourteen measurements in normal Tyrode solution.
268
E CEoZ cE(u
_ E cE .2
_ E
w I I I
) by guest on July 14, 2011jp.physoc.orgDownloaded from J Physiol (

Na/Ca EXCHANGE IN MAMMALIAN VENTRICLE
as for Fig. lOB it was possible to estimate the maximal net influx with the Na/Kpump inhibited. The mean value was 66+ S.E. ofmean 2-7 pmol/cm2 . s, which agreeswell with that calculated for Purkinje fibres by Eisner et al. (1981).
Associated with this rise in a'a there is a rise in resting tension and a potentiationof the Na withdrawal contractures. A comparison of our collected data for normalcontractures and contractures after strophanthidin (from 10 to 50 pmol/l) is givenin Fig. 12. The contracture after strophanthidin is now between 12 and 18% of themaximum tension (as defined above). These potentiated contractures showed a rapidrise and a rapid relaxation.From these experiments it was possible in six experiments to compare aNa
immediately before the contracture with the contracture amplitude in both normalTyrode solution and after strophanthidin. These results are shown in Fig. 13.Although in individual experiments a rise of aka is accompanied by a rise incontracture tension, the Figure shows that if a comparison is made between differentpreparations, the contracture tension in strophanthidin can be greater than thecontrol values at the same aika.
DISCUSSION
Mechanical and electrical propertiesExperiments of the type described in this paper are only possible in preparations
that maintain their mechanical and electrical properties for many hours. To achievethis we have found that very careful dissection and mounting of the trabeculae,together with elevated [Ca]. (5-4 mmol/l) and good and continuous oxygenation areessential. Repeated exposure to Na-poor fluids without irreversible changes occurredwhen tetramethylammonium chloride was used as a Na substitute.
In these experiments the mean Em was -78 mV and twitch tension in thetrabeculae averaged 6-8 mN/mm2 in ferrets and 2-9 mN/mm2 in guinea-pigs. Thesevalues compare favourably with the twitch tensions reported in other studies (ferret:Chapman & Leoty, 1976; Marban & Tsien, 1982; Allen, Eisner, Lab & Orchard, 1983;guinea-pig: see for instance the careful study of Reiter & Stickel, 1968, or two otherpapers randomly selected e.g. McDonald & MacLeod, 1973; Becker, Ingebretsen &Mayer, 1977).The maximal tension (defined as the tension obtained in Na-free solution with
10 mmol/l caffeine) in guinea-pigs was 14-6 mN/mm2 and in ferrets 67-5 mN/mm2.This represents only 15% and 67-5% ofthe maximum tension as recorded by Fabiato(1981) in skinned cardiac cells when allowance has been made for the extracellularspace. However, J. Kentish (Leeds, personal communication) finds in detergent-skinned guinea-pig trabeculae a maximum tension of 20-13 mN/mm2 + S.E. of mean2-23 mN/mm2 (n = 38), which he attributes to the large amount of connective tissuepresent in the trabeculae but not in skinned cardiac cells. A similar explanation wouldseem to be appropriate to our results.
Comparison between amphibian and mammalian muscleIn these small, healthy, well perfused preparations where clearance from the
extracellular space is much enhanced the Na withdrawal contractures are small,
269
) by guest on July 14, 2011jp.physoc.orgDownloaded from J Physiol (

R. A. CHAPMAN, A. CORA Y AND J. A. S. McGUIGAN
especially in the English ferrets. These responses contrast markedly with the nearmaximal contractures (tensions up to 100 mN/mm2) observed in amphibiantrabeculae. Despite the differences in contracture tension the contractures from thetwo species have much in common, the Na withdrawal contractures being enhancedby depolarization (induced by elevated [K]0), increased [Ca]. and exposure to eithermonensin or strophanthidin. They are unaffected by tetracaine and inhibited by Mn(amphibian: Chapman, 1974; Chapman & Ellis, 1977; Chapman & Tunstall, 1980;mammalian: see Chapman et al. 1983).The small amplitude of Na withdrawal contractures in ferret and guinea-pig
preparations would seem to be related to the small rise in aba as measured byCa-sensitive micro-electrodes (ferret: Marban et al. 1980; guinea-pig: Coray &McGuigan, 1981). These measured changes, taken in conjunction with the tension/pCadata of Fabiato (1981) would yield contractures equivalent to about 10% of themaximum tension in the guinea-pig and barely measurable tension changes in theferret.The development of rigor bridges during Na withdrawal contractures, as proposed
by Ventura-Clapier & Vassort (1981), would not seem to be important in ourexperiments because the application of caffeine produces further contraction, strongelectrical stimulation in Na-poor solution gives twitches and, as noted by Allen et al.(1983), the Na withdrawal contracture relaxes as aCa (detected by aequorin) falls.One difference between our experiments and those of Ventura-Clapier & Vassort
(1981) is that our preparations are smaller and well oxygenated. If the preparationsused by Ventura-Clapier & Vassort were hypoxic in the centre of the papillary muscle,the development of rigor bridges and reduced ATP levels in their preparations, butpresumably not in ours, could be explained.
Resting aNaWe have chosen to express our results in terms of activity. This is because at any
given Na concentration the activity depends not only on the ionic strength of thesolution but also on the temperature. The measured resting aia in the presentexperiments of 10-9 mmol/l + S.D. 4-2 mmol/l is higher than values reported byprevious authors (see Lee, 1981; Sheu & Fozzard, 1982). Our results were measuredat room temperature ( 22 °C) and an effect of temperature on the resting aia couldexplain our results. Indeed, personal communications from S. Sheu & H. Fozzard(two experiments on Purkinje fibres) and A. Kleber (guinea-pig ventricle) indicatesuch a relationship.
In the estimation of aka errors can arise if the Na electrode is not well sealed intothe cell (effect of shunt resistance and leakage of ions into the cell; see also Cohen,Fozzard & Sheu, 1982). That the response recorded by the Na electrode and the KClelectrode to K depolarization was the same would seem to indicate that aka were notspuriously high due to bad penetration.
Decrease in aia on changing [Na]0,On reducing [Na]0 to 1-5 mmol/l there is a rapid decrease in aNa (see Fig. 6). We
have already discussed possible sources of error in estimating aia so that poorpenetrations would not seem to be the cause. Furthermore, decreases ofaia are found
270
) by guest on July 14, 2011jp.physoc.orgDownloaded from J Physiol (

Na/Ca EXCHANGE IN MAMMALIAN VENTRICLE
on increasing [Ca]. (see Fig. 9) so the fall in aia is likely to be real. Similar large butslower changes in aia have been described by Vaughan-Jones (1977) in crab musclefibres, Ellis (1977) in Purkinje fibres and recently by Sheu & Fozzard (1982) in bothPurkinje fibres and ventricular muscle. Falls in total Na were measured by Jundt& Reuter (1977) in guinea-pig atria. The slower rate of fall in crustacean muscle andPurkinje fibres could be related to the surface/volume ratio of these larger cells. Inventricular muscle, the rapid decrease may be a consequence of the perfusion system.Our results suggest that the fall in aia is neither due to a passive Na efflux, nor
to a Na/H exchange, nor to the activity of the Na pump, while the effects of changingeither [Na]0 and/or [Ca]. on aia reported here and by Sheu & Fozzard (1982)implicate a sarcolemmal Na/Ca exchange.
If the decrease in aia on Na removal was wholly due to the Na/K pump, even a partial blockof the Na/K pump by either 50 1umol/l strophanthidin or K-free solution would reduce the rateof decrease of ai a. No such difference was found. The aia in K-free solution was often identicalto that in 5 mmol/l [K]0. Also no change in fall of aia was found after strophanthidin (cf. Fig. 7and 8). Finally, Ellis (1977) with 50,uimol/l ouabain in sheep Purkinje fibres found no change inthe decrease in aia on reducing [Na]0 to 1/10.
Net Na effluxAssuming that the fall in aka is due to Na leaving the cell the net Na effluxes as
shown in Fig. 10 have been calculated. The Na efflux promoted by reducing [Na]oto 1-5 mmol/l with our mean aia of 10-9 mmol/l would correspond to a net efflux of70 5 pmol/cm2 . s. While this is a relatively large flux, Na fluxes in excess of this figurehave been reported in cardiac tissue, e.g. for frog ventricle (Keenan & Niedergerke,1967). In growth-orientated embryonic chick Wheeler, Horres & Lieberman (1982)find a Na efflux of 98 pmol/cm2 . s but only around 16 pmol/cm2 . s appeared to beassociated with the Na/K pump.Such a movement of Na ions across the cell membrane, if not completely
compensated by a counter movement of charge (e.g. more than 2 Na for 1 Ca), wouldresult in a hyperpolarization of the membrane. We measured a hyperpolariation of4.3 mV. In ferret ventricular muscle the membrane resistance is around 2800 Q cm2when the surface/volume measurements of Page (1978) are taken into account(H. Hofmann, personal communication). A Na efflux of 705 pmol/cm2. s wouldgenerate a hyperpolarization of 3-8 mV, assuming a 3 Na for 1 Ca exchange.
Ca influxIf the Na efflux is coupled to a Ca influx, the associated net gain of Ca will depend
on the stoichiometry, being 3-4 mmol/l for 4:1, 4-5 mmol/l for 3:1 and 5-4 mmol/lfor 5:2, respectively.
This calculation is based on the assumption that all the Na efflux is coupled withCa influx. If a small part of the Na efflux was due to the Na/K pump, then the Cainflux would be correspondingly over-estimated. Moreover, the assumptions involvedin the Na efflux calculation (page 264) also apply to the magnitude of the Ca influx.
In mammalian heart the measured net gains range from 0-8 mmol/l to 2 mmol/lfibre water (Langer, 1964; Wollert, 1966; Reuter & Seitz, 1968; Wendt & Langer,1977). Despite these measured gains in total Ca the increase in a'. as measured by
271
) by guest on July 14, 2011jp.physoc.orgDownloaded from J Physiol (

R. A. CHAPMAN, A. CORA Y AND J. A. S. McGUIGAN
Ca-sensitive micro-electrodes during perfusion with Na-depleted fluids, ranges from1-4 times in ferret ventricle to 4 times in guinea-pig, with intermediate values for sheepand rabbit ventricle (Marban et al. 1980; Lee, Ulm & Dresdner, 1980; Coray &McGuigan, 1981; Sheu & Fozzard, 1982). This discrepancy between net Ca changesand aba implies that Ca ions are removed from the cytoplasm. The effect of metabolicinhibitors and caffeine on the Na-free contracture and on the subsequent Na-activatedCa efflux (Jundt, Porzig, Reuter & Stucki, 1975) would seem to indicate an activeintracellular uptake of calcium in the cell. Since the total cell Ca increases, the roleof a Ca membrane pump would appear to be minimal.
25
- 20 - 5
E- 15 -
0E Ea. 3 EX 10 _ y
C Q
c5Caiflux 1
0 1 2 3 4 5 6 7Time (min)
Fig. 14. Calculated Ca uptake (mmol/l) and Ca influx (pmol/cm2 s) from the decrease ina a assuming an exchange of 3 Na/1 Ca. Calculated using eqn. (2) (Jmax 90 pmol/cm2 . sKm 7-1 mmol/l) and assuming ai a (initial) of 11-3 mmol/l (i.e. the same as Fig. 6B). Forthe calculation of influx the same assumptions as for Na efflux (Fig. 10) have been taken.
The most likely intracellular structures for the uptake of calcium are the sarco-plasmic reticulum and the mitochondria. The highest estimated capacity of thesarcoplasmic reticulum in mammalian cardiac tissue is around 0-4 mmol/l cell, avalue similar to that found for hyperpermeable myocytes (see Table 6-2 in Chapmanet al. 1983; heart cells: Dani, Cittadini & Inesi, 1979). This is in an order of magnitudebelow the estimated gain of Ca, and on these grounds we would suggest that theintracellular Ca sink are the mitochondria.The mitochondria have a massive capacity to take up Ca and the release ofCa from
mitochondria in heart muscle is via a Na/Ca exchange system. At an aka of10-9 mmol/l the Na/Ca efflux mechanism will be fully activated (see reviews byCarafoli, 1982, and Akerman & Nicholls, 1983). Recently, Becker (1981) has shownthat in chemically skinned cardiac myocytes the mitochondria can on addition ofcalcium reduce the free Ca back to 1 #zmol/l in the presence of 1 mmol/l free Mg and8 mmol/l Na. In our experiments [Na]i is falling so that the Na-dependent Ca effluxsystem will be progressively inhibited, while the input of Ca to the cytoplasm willactivate the Ca uptake mechanism. The net result will be to uncover a largemitochondrial Ca sink.The fall in aia also affects the Ca influx across the membrane. In Fig. 14 we have
calculated the influx of Ca and the rise in total cell Ca from the Na efflux deduced
272
) by guest on July 14, 2011jp.physoc.orgDownloaded from J Physiol (

Na/Ca EXCHANGE IN MAMMALIAN VENTRICLE
from the fall in at a (see Fig. 6 and Fig. 10). As aka inside declines, the total cell Carises to a plateau because the Ca influx falls from a maximum ofabout 24 pmol/cm2 . sto less than 0-2 pmol/cm2 . s after 4 min. This limit to the gain in cell Ca coupled withthe unveiling of a mitochondrial Ca sink would explain the failure to develop largeNa withdrawal contractures in mammalian ventricular muscle.
StoichiometryThe most convincing evidence of the attempts to determine the stoichiometry of
the Na/Ca exchange comes from work on sarcolemmal vesicles. This work supportsan electrogenic 3 Na for 1 Ca exchange (Pitts, 1979; Caroni, Reinlib & Carafoli, 1980;Philipson & Nishimoto, 1981; Reeves, Trumble, Sutko, Kadoma & Froehlich, 1981).The quotient of the measured Na and Ca gradients across the cell will reveal the truecoupling ratio only if the exchange comes to equilibrium, as opposed to being in asteady state with regard to other sarcolemmal movements of Ca and/or Na (eitheractive or passive). Bers & Ellis (1982) and Sheu & Fozzard (1982) obtain a couplingratio lying between 2-5 and 3. From our results a similar result can be obtained fromthe slopes of the lines in Fig. 9B for the slope 8 of the line is given by "A/[Ca]i/[Ca].e( -2)EmF/RT) (see Blaustein & Hodgkin, 1969). This gives a coupling ratio of 2-9in 5-4 mmol/l Ca and 2-7 in 15 mmol/l respectively. This has been calculated assuminga [Ca]i of 250 nmol/l and taking the mean resting potential to be -78 mV. Tentativesupport for a coupling ratio of 3, as opposed to either 2 or 4, comes from fitting curvesto the Na efflux data in Fig. 10 and to the decrease in Na in Fig. 6B.
aia and contractile amplitudeIf a falling aka does expose a large Ca mitochondrial sink, a relationship between
the initial a a and tension would not be expected unless the gain of Ca exceeded theCa-buffering capacity of the cell. It is therefore not surprising that our collectedresults (Fig. 11) do not show a relationship between these two parameters. On theother hand, if a a is increasing, the reduction of the buffering capacity could causean increase in tonic and twitch tension.
In our experiments exposure to strophanthidin increased both intracellular Na andthe amplitude of the Na withdrawal contracture in individual experiments. However,comparison between different experiments (Fig. 13) suggests that contracture tensiongenerated in the presence of strophanthidin could be greater than that obtained inthe absence of the drug at the same aka. (Eisner et al. (1981) find a good correlationbetween aka and both twitch and tonic tension in Purkinje fibres especially when akais increasing. The marked hysteresis they find on activation of the Na pump, whenaia is decreasing, makes a similar correlation less clear. In our experimentsNa-withdrawal tension invariably reaches a peak as a a is declining and a similarhysteresis might affect our results. There is the possibility that strophanthidin haseffects other than raising aNa. Resink & Gevers (1981) find an effect on thephosphorylation of the myosin P chains while Fujino & Fujino (1982) find an effectof ouabain on the sarcoplasmic reticular.
If the results and conclusions of this study can be applied to other mammaliancardiac tissue, the large changes in aka consequent to changes in [Na]0 coupled withmuch smaller changes in a a could make the interpretation of Na-activated Ca fluxes
273
) by guest on July 14, 2011jp.physoc.orgDownloaded from J Physiol (

R. A. CHAPMAN, A. CORA Y AND J. A. S. McGUIGAN
difficult. Finally, since the Na/Ca exchange is in all probability electrogenic, someof the conclusions reached by Bassingthwaighte, Fry & McGuigan (1976) on aCa-mediated PK might need to be re-assessed.
We wish to thank Miss M. Herrenschwand and Miss I. Schonberg for excellent technical help.Mr Cigada and Mr Meyer built parts of our equipment. Antazoline and 2-(O-diphenyloxymethyl)-imidazole were gifts from Ciba-Geigy, Basel. Dr Ammann, Swiss Federal Institute of Technology,Zurich, provided us with the neutral sodium carrier. The analysis of ferret blood was carried outat the University Veterinary Hospital, Berne. We also wish to thank Professor Weidmann andDrs Kleber and Pressler for helpful comments on the manuscript.The work was supported by the Swiss National Science Foundation grant no. 3.565-0.79. Dr
Chapman's stay in Berne was in part financed by a Visiting Investigator's Award from Hoffmann-LaRoche, Basel, and the Science and Engineering Research Council (U.K.).
REFERENCES
AKERMAN, K. E. 0. & NICHOLLS, D. G. (1983). Physiological and bioenergetic aspects of mito-chondrial calcium transport. Rev. Phy8iol. Biochem. Pharmacol. 95, 149-206.
ALLEN, D. G., EISNER, D. A., LAB, M. J. & ORCHARD, C. H. (1983). Regulation of intracellularcalcium in the mammalian myocardium in Na-free solution. J. Physiol., 332, 49-50P.
BASSINGTHWAIGHTE, J. B., FRY, C. H. & McGUIGAN, J. A. S. (1976). Relationship between internalcalcium and outward current in mammalian ventricular muscle; a mechanism for the control ofthe action potential duration? J. Phy8iol. 262, 15-37.
BECKER, E., INGEBRETSEN, W. R. & MAYER, S. E. (1977). Electro-physiological responses of cardiacmuscle to isoproterenol covalently linked to glass beads. Circulation Re. 41, 653-660.
BECKER, G. L. (1981). Regulation of free Ca2+ by cardiac mitochondria and skinned myocytes.In Calcium and Phosphate Tran.port across Biomembranes ed. BRONNER, F. & PETERLIK, M.pp. 79-82. New York: Academic Press.
BERs, D. M. & ELLIS, D. (1982). Intracellular calcium and sodium activity in sheep heart Purkinjefibres. Effect of changes of external sodium and intracellular pH. Pfluigers Arch. 393, 171-178.
BLAUSTEIN, M. P. & HODGKIN, A. L. (1969). The effect of cyanide on the efflux of calcium fromsquid axons. J. Physiol. 200, 497-527.
BUssELEN, P. (1982). Effect of potassium depolarization on sodium-dependent calcium efflux fromgoldfish heart ventricles and guinea-pig atria. J. Physiol. 327, 309-324.
CARAFOLI, E. (1982). The transport of calcium across the inner membrane of mitochondria. InMembrane Transport of Calcium, ed. CARAFOLI, E., pp. 109-139. London: Academic Press.
CARONI, P., REINLIB, L. & CARAFOLI, E. (1980). Charge movements during Na+-Ca2+ exchange inheart sarcolemmal vesicles. Proc. natn. Acad. Sci., U.S.A. 77, 6354-6358.
CHAPMAN, R. A. (1974). A study of the contractures induced in frog atrial trabeculae by a reductionof the bathing sodium concentration. J. Physiol. 237, 295-313.
CHAPMAN, R. A., CIGADA, C., CORAY, A. & MCGUIGAN, J. A. S. (1981). Sodium withdrawalcontractures in mammalian ventricular muscle. J. Physiol. 318, 4P.
CHAPMAN, R. A., CORAY, A. & MCGUIGAN, J. A. S. (1981). Sodium/calcium exchange in mammalianventricular muscle. J. Physiol. 318, 13-14P.
CHAPMAN, R. A., CORAY, A. & MCGUIGAN, J. A. S. (1982). [Na]1 measurements at rest and duringNa withdrawal contractures in mammalian ventricular muscle. J. Physiol. 328, 19-20P.
CHAPMAN, R. A., CORAY, A. & MCGUIGAN, J. A. S. (1983). Sodium-calcium exchange in mammalianheart: the maintenance of low intracellular calcium concentration. In Cardiac Metabolism, ed.DRAKE-HOLLAND. A. J. & NOBLE, M. I. M., pp. 117-149. Chichester: Wiley.
CHAPMAN, R. A. & ELLIS, D. (1977). The effects of manganese ions on the contraction of the frog'sheart. J. Physiol. 272, 331-354.
CHAPMAN, R. A. & LBOTY, C. (1976). The time-dependent and dose-dependent effects of caffeineon the contraction of the ferret heart. J. Physiol. 256, 287-314.
CHAPMAN, R. A. & TUNSTALL, J. (1971). The dependence of the contractile force generated by frogauricular trabeculae upon the external calcium concentration. J. Physiol. 215, 139-162.
274
) by guest on July 14, 2011jp.physoc.orgDownloaded from J Physiol (

Na/Ca EXCHANGE IN MAMMALIAN VENTRICLE
CHAPMAN, R. A. & TUNSTALL, J. (1980). The interaction of sodium and calcium ions at the cellmembrane and the control of contractile strength in frog atrial muscle. J. Phy8iol. 305, 109-123.
CIGADA, C., CORAY, A. & McGUIGAN, J. A. S. (1983). A multichannel tap with no grease. J. Phy8iol.336, 1P.
COHEN, C. J., FOZZARD, H. A. & SHEU, S. S. (1982). Increase in intracellular sodium ion activityduring stimulation in mammalian cardiac muscle. Circulation Res. 50, 651-662.
CORAY, A. & McGUIGAN, J. A. S. (1981). Measurement of intracellular ionic calcium concentrationin guinea pig papillary muscle. In Ion-Selective Microelectrode8 and Their U8e in Excitable Tissues,ed. SYKOVA', E., HNfK, P. & VYKLICKV, L., pp. 299-301. New York: Plenum PublishingCorporation.
CORAY, A. & McGuIGAN, J. A. S. (1983). pH, at rest and during Na withdrawal contractures in ferretventricle. J. Physiol. 336, 66-67P.
DANI, A. M., CITTADINI, A. & INEsi, G. (1979). Calcium transport and contractile activity indissociated mammalian heart cells. Am. J. Phy8iol. 237, C147-155.
DAVIES, C. W. (1938). The extent of dissociation of salts in water. Part VIII. An equation for themean ionic activity coefficient of an electrolyte in water, and a revision of the dissociationconstants of some sulphates. J. chem. Soc. 2093-2098.
DEITMER, J. W. & ELLIS, D. (1978). Changes in the intracellular sodium activity of sheep heartPurkinje fibres produced by calcium and other divalent cations. J. Physiol. 277, 437-453.
EISNER, D. A., LEDERER, W. J. & VAUGHAN-JONES, R. D. (1980). Effects of membrane potentialon intracellular sodium activity in sheep cardiac Purkinje fibres. J. Phy8iol. 307, 61-62P.
EISNER, D. A., LEDERER, W. J. & VAUGHAN-JONES, R. D. (1981). The dependence of sodiumpumping and tension on intracellular sodium activity in voltage-clamped sheep Purkinje fibres.J. Physiol. 317, 163-187.
ELLIS, D. (1977). The effects of external cations and ouabain on the intracellular sodium activityof sheep heart Purkinje fibres. J. Physiol. 273, 211-240.
FABIATO, A. (1981). Myoplasmic free calcium concentration reached during the twitch of an intactisolated cardiac cell and during calcium-induced release of calcium from the sarcoplasmicreticulum ofa skinned cardiac cell from the adult rat or rabbit ventricle. J. gen. Physiol. 78,457-497.
FuJINo, S. & FUJINO, M. (1982). Ouabain potentiation and Ca release from sarcoplasmic reticulumin cardiac and skeletal muscle cells. Can. J. Physiol. Pharmac. 60, 542-555.
HOLROYDE, M. J., ROBERTSON, S. P., JOHNSON, J. D., SOLARO, R. J. & POTTER, J. D. (1980). Thecalcium and magnesium binding sites on cardiac troponin and their role in the regulation ofmyofibrillar adenosine triphosphatase. J. biol. Chem. 255, 11688-11693.
JUNDT, H., PORzIG, H., REUTER, H. & STUCKI, J. W. (1975). The effect of substances releasingintracellular calcium ions on sodium-dependent calcium efflux from guinea-pig auricles. J.Physiol. 246, 229-253.
JUNDT, H. & REUTER, H. (1977). Is sodium-activated calcium efflux from mammalian cardiacmuscle dependent on metabolic energy? J. Physiol. 266, 78-79P.
KEENAN, M. J. & NIEDERGERKE, R. (1967). Intracellular sodium concentration and resting sodiumfluxes of the frog heart ventricle. J. Physiol. 188, 235-260.
LANGER, G. A. (1964). Kinetic studies of calcium distribution in ventricular muscle of the dog.Circulation Res. 15, 393-405.
LANGER, G. A. (1982). Sodium-calcium exchange in the heart. A. Rev. Physiol. 44, 435-449.LEE, C. 0. (1981). Ionic activities in cardiac muscle cells and application of ion-selective micro-
electrodes. Am. J. Physiol. 241, H459-478.LEE, C. O., UHM, D. Y. & DRESDNER, K. (1980). Sodium-calcium exchange in rabbit heart muscle
cells: direct measurement of sarcoplasmic Ca2+ activity. Science, N. Y. 209, 699-701.McDoNALD, T. F. & MAcLEOD, D. P. (1973). Metabolism and the electrical activity of anoxic
ventricular muscle. J. Physiol. 229, 559-582.MARBAN, E., RINK, T. J., TSIEN, R. W. & TSIEN, R. Y. (1980). Free calcium in heart muscle at
rest and during contraction measured with Ca2+-sensitive microelectrodes. Nature, Lond. 286,845-850.
MARBAN, E. & TSIEN, R. W. (1982). Enhancement of calcium current during digitalis inotropyin mammalian heart: positive feed-back regulation by intracellular calcium? J. Physiol. 329,589-614.
275
) by guest on July 14, 2011jp.physoc.orgDownloaded from J Physiol (

R. A. CHAPMAN, A. CORA Y AND J. A. S. McGUIGAN
MEIER, P. C., LANTER, F., AMMANN, D., STEINER, R. A. & SIMON, W. (1982). Applicability ofavailable ion-selective liquid-membrane microelectrodes to intracellular ion-activity measure-ments. Pflugers Arch. 393, 23-30.
NIEDERGERKE, R. (1963). Movements ofCa in frog heart ventricles at rest and during contractures.J. Physiol. 167, 515-550.
PAGE, E. (1978). Quantitative ultrastructural analysis in cardiac membrane physiology. Am. J.Physiol. 235, C147-158.
PERSOFF, D. A. (1960). A comparison of methods for measuring efflux of labelled potassium fromcontracting rabbit atria. J. Physiol. 152, 354-366.
PITTS, B. J. R. (1979). Stiochiometry of sodium-calcium exchange in cardiac sarcolemmal vesicles.Coupling to the sodium pump. J. biol. Chem. 254, 6232-6235.
PHILIPSON, K. D. & NISHIMOTO, A. Y. (1981). Efflux of Ca2+ from cardiac sarcolemmal vesicles.J. biol. Chem. 256, 3698-3702.
REEVES, J., TRUMBLE, W., SUTKO, J., KADOMA, M. & FROEHLICH, J. (1981). Calcium transportmechanisms in cardiac sarcolemmal vesicles. In Calcium and Phosphate Transport across Bio-membranes, ed. BRONNER, F. & PETERLIK, M. pp. 15-18. New York: Academic Press.
REITER, M. & STICKEL, F. J. (1968). Der Einfluss der Kontraktions-frequenz auf das Aktions-potential des Meerschweinchen-Papillarmuskels Arch. exp. Path. Pharmak. 260, 342-365.
REPKE, K. (1964). Ueber den biochemischen Wirkungsmodus von Digitalis. Klin. Wschr. 42,157-165.
RESINK, T. J. & GEVERS, W. (1981). Altered adenosine triphosphatase activities of naturalactomyosin from rat hearts perfused with isoprenaline and ouabain. Cell Calcium 2, 105-123.
REUTER, H. & SEITZ, N. (1968). The dependence of calcium efflux from cardiac muscle ontemperature and external ion composition. J. Physiol. 195, 451-470.
Roos, A. & BORON, W. F. (1981). Intracellular pH. Physiol. Rev. 61, 296-434.SCHOLZ, H. (1969). Ueber Unterschiede im Kontrakturverhalten bei Ventrikel- und Vorhofspra-paraten aus Warmbliiterherzen. Pfluigers Arch. 312, 63-81.
SHEU, S. S. & FOZZARD, H. A. (1982). Transmembrane Na+ and Ca2+ electrochemical gradients incardiac muscle and their relationship to force development. J. gen. Physiol. 80, 325-351.
SPRING, K. R. & GIEBISCH, G. (1977). Kinetics of Na+ transport in Necturus proximal tubule. J.gen. Physiol. 70, 307-328.
STEINER, R. A., OEHME, M., AMMANN, D. & SIMON, W. (1979). Neutral carrier sodium ion-selectivemicroelectrode for intracellular studies. Analyt. Chem. 51, 351-353.
TsIEN, R. Y. & RINK, T. J. (1980). Neutral carrier ion-selective microelectrodes for measurementof intracellular free calcium Biochim. biophys. Acta 599, 623-638.
VAUGHAN-JONES, R. D. (1977). The effect of lowering external sodium on the intracellular sodiumactivity of crab muscle fibres. J. Physiol. 264, 239-265.
VENTURA-CLAPIER, R. & VASSORT, G. (1981). Rigor tension during metabolic and ionic rises inresting tension in rat heart. J. mol. cell. Cardiol. 13, 551-561.
WENDT, I. R. & LANGER, G. A. (1977). The sodium-calcium relationship in mammalian myocardium:effect of sodium deficient perfusion on calcium fluxes. J. mol. cell. Cardiol. 9, 551-564.
WHEELER, D. M., HORRES, C. R. & LIEBERMAN, M. (1982). Sodium tracer kinetics and trans-membrane flux in tissue-cultured-chick heart cells. Am. J. Physiol. 243, C169-176.
WOLLERT, U. (1966). Ueber das Verhalten des cellularen Calciums von Meerschweinchenvorh6fenunter dem Einfluss einer erh6hten extracellulairen Kaliumkonzentration. PflJugers Arch. ges.Physiol. 289, 191-199.
276
) by guest on July 14, 2011jp.physoc.orgDownloaded from J Physiol (


