Embed Size (px)
Citation preview
Environmental Pollution 139 (2006) 40e52
www.elsevier.com/locate/envpol
Soil amendments reduce trace element solubility in a contaminatedsoil and allow regrowth of natural vegetation
Engracia Madejon*, Alfredo Perez de Mora, Efraın Felipe, Pilar Burgos,Francisco Cabrera
Instituto de Recursos Naturales y Agrobiologıa de Sevilla. IRNAS-CSIC, Avenida Reina Mercedes 10, P.O. Box 1052, 41080 Seville, Spain
Received 15 December 2004; accepted 23 April 2005
Soil amendments affect soil chemistry and allow revegetation of soils contaminated by trace elements.
Abstract
We tested the effects of three amendments (a biosolid compost, a sugar beet lime, and a combination of leonardite plus sugar
beet lime) on trace element stabilisation and spontaneous revegetation of a trace element contaminated soil. Soil properties wereanalysed before and after amendment application. Spontaneous vegetation growing on the experimental plot was studied by threesurveys in terms of number of taxa colonising, percentage vegetation cover and plant biomass. Macronutrients and trace elementconcentrations of the five most frequent species were analysed. The results showed a positive effect of the amendments both on soil
chemical properties and vegetation. All amendments increased soil pH and TOC content and reduced CaCl2-soluble-trace elementconcentrations. Colonisation by wild plants was enhanced in all amended treatments. The nutritional status of the five speciesstudied was improved in some cases, while a general reduction in trace element concentrations of the aboveground parts was
observed in all treated plots. The results obtained show that natural assisted remediation has potential for success on a field scalereducing trace element entry in the food chain.� 2005 Elsevier Ltd. All rights reserved.
Keywords: Amendments; Assisted natural remediation; Plant development; Soil quality; Trace elements
1. Introduction
Remediation of soils contaminated with trace ele-ments is mainly based either on the extraction or thestabilisation of the contaminants. While physico-chemicalextraction techniques generally imply degradation ofsoil structure and high costs, stabilisation techniques canimprove soil physico-chemical and biological properties,do not generate by-products, are less expensive andtherefore are more suitable for remediation of extensive
* Corresponding author. Tel.: C34 95 462 4711; fax: C34 95 462
4002.
E-mail address: [email protected] (E. Madejon).
0269-7491/$ - see front matter � 2005 Elsevier Ltd. All rights reserved.
doi:10.1016/j.envpol.2005.04.034
areas of low-value land (Mench et al., 2003). Thepotential of assisted natural remediation for remediationof trace element polluted soils has been recognised(Adriano et al., 2004). The technique is based on the useof amendments to accelerate those processes (sorption,precipitation and complexation reactions) that takeplace naturally in soils to reduce mobility and bio-availability of trace elements (Bolan and Duraisamy,2003; Hartley et al., 2004). Due to their restrictednature, natural attenuation processes alone may not besufficient in mitigating risks from trace elements(Adriano et al., 2004). Moreover, assisted naturalremediation may enhance microbial activity, plantcolonisation and development and thus augment a re-start nutrient cycling in affected soils.
41E. Madejon et al. / Environmental Pollution 139 (2006) 40e52
Vegetation plays a crucial role in the restoration ofsuch degraded areas, because it prevents wind-blow ofcontaminated particles and reduces water pollution(Tordoff et al., 2000). Nevertheless, trace element uptakeby plants implies several hazards such as introduc-tion into the food chain (McLaughin, 2001). Thus,a study of soil properties and vegetation development isnecessary to evaluate the effectiveness of remediationmeasures on ecosystem ecology and risk posed by thetrace element content of a soil.
The failure of the tailings pond dam at theAznalcollar pyrite mine, 45 km west of Seville, Spain,in April 1998 released about 6 million cubic meters ofslurry composed of acidic water containing heavy metalsand other toxic elements that affected ca. 4500 ha ofland along the Agrio and Guadiamar river valleys.A long strip, approximately 300 m wide and 40 kmlong, was covered by a layer (2e30 cm thick) of blacksludge (Cabrera et al., 1999; Grimalt et al., 1999). SevereAs, Bi, Cd, Cu, Pb, Sb, Tl and Zn pollution wasobserved in most of the sludge-affected soils (Cabreraet al., 1999).
Remediation works started soon after the accident.Toxic sludge and a variable layer of topsoil (10e30 cm)were mechanically removed; a second phase of theremediation consisted of addition of liming materialswhilst a third phase encompassed the addition of organicmatter and iron-rich clayey materials (Aguilar et al.,2004). Despite these clean-up and amending operations,soils in the affected zone still exhibit consistent traceelement contamination. In many cases, total soil traceelement concentrations increased after the remediation.This increase can be related to remains of sludge left onthe surface of the soil and buried during sludge removal,liming, manuring and harrowing (Cabrera, 2000; Ayoraet al., 2001).
After these short-termmeasures, the Regional Govern-ment, ‘Junta de Andalucıa’ carried out a programme inthe affected area to assess trace element stabilisation,reduce phytotoxicity and establish a vegetation cover.This programme has been called ‘Green corridor of theGuadiamar River’. The corridor should connect thelowland protected areas (Donana National Park) withthe forested mountains (Sierra Norte Natural Park)(CMA, 2003). In order to re-establish vegetation coverand make a ‘green corridor’, typical both Mediterraneanforest and riparian forest species have been established inthe area. Nevertheless, most soils have been spontane-ously colonised by wild plants (mainly annual plants)well adapted to the local climatic conditions and littleaffected by contamination. The effect of the amendmentsemployed on the colonisation, nutritional status andtrace element concentrations of these plants has not beenpreviously investigated although these plants play anessential role in soil stabilisation, nutrient cycling andorganic matter turnover.
In this study we investigated the effects of threedifferent amendments (sugar beet lime, biosolid compostand leonarditeCsugar beet lime) on soil chemicalproperties, trace element availability and wild plantsgrowing in an experimental plot established on a soilcontaminated by the Aznalcollar mine accident.
Plant species were identified, biomass productionmeasured and vegetation cover estimated. Nutrient andtrace element concentrations of the five most abundantplant species were also compared with phytotoxicand zootoxic concentrations given in the literature toevaluate potential risk of these elements in the foodchain.
2. Materials and methods
2.1. Site description and experimental procedure
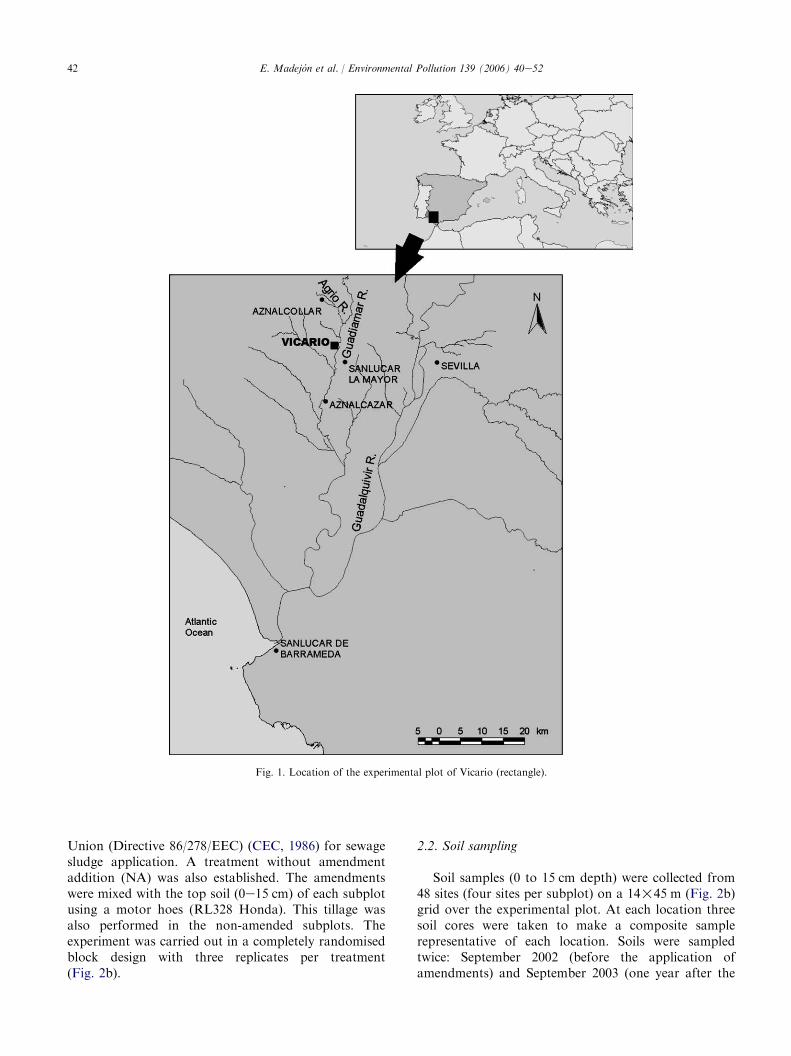
The study site is an experimental field named ‘ElVicario’, affected by the toxic Aznalcollar mine spill(Fig. 1), located on the right margin of the Guadiamarriver (latitude 37 �26#21$ N, longitude 06 �12#59$ W),10 km downstream from the Aznalcollar mine. The onlyremediation work carried out in this field was theremoval of the sludge from the surface of the soiltogether with a layer of soil of around 10e15 cm. Thesoil was a clay loam (21.1% clay, 29.1% silt and 49.8%sand) classified as Typic Xerofluvent (Soil Survey Staff,1996). Before the spill, the area was mainly occupiedby cropland (sunflower, wheat, sorghum) and orchards.Cultivation of food crops in the spill-affected area wasprohibited by law after the accident.
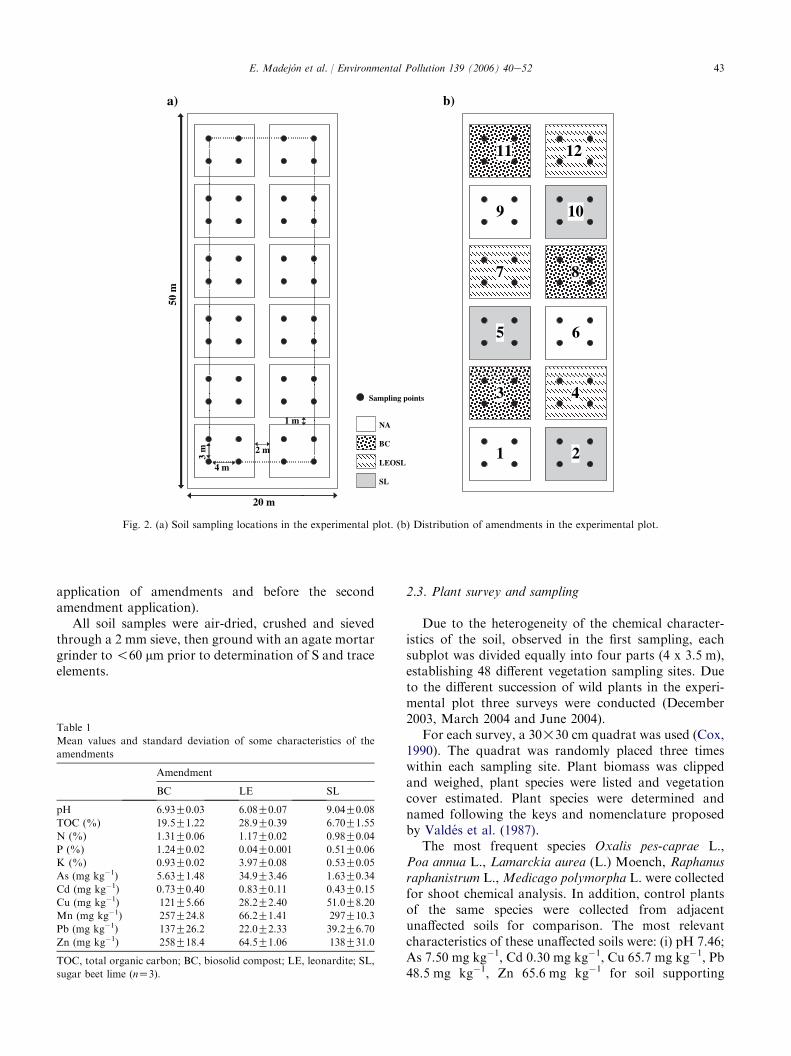
Within the field an experimental plot (20!50 m) wasdivided into 12 subplots of 7!8 m each, with a marginof 1 m (long) and 2 m (wide) between plots (Fig. 2a).
Three amendments d two organic and one inorganicd from different sources were used. The two organicamendments were a biosolid compost (BC) from thewastewater treatment plant of SUFISA (Jerez de laFrontera, southern Spain) and a leonardite (LE), a lowrank coal rich in humic acids (DAYMSA, Zaragoza,northern Spain). The inorganic amendment was sugarbeet lime (SL), a residual material from the sugar beetmanufacturing process with 70e80% (dry basis) ofCaCO3 (EBRO-AGRICOLAS, San Jose de la Rinconada,southern Spain). The most relevant characteristics of theamendments are listed in Table 1.
The following rates (fresh basis) were applied twice(October 2002 and October 2003): (i) 30 Mg ha�1 of BC(treatment BC), (ii) 25 Mg ha�1 of LE mixed with 10 mgha�1 of SL (treatment LESL), and (iii) 30 Mg ha�1 ofSL (treatment SL). The doses were within the commonrage of amendment application in land treating. Thesedoses were below the maximum permitted limits fortrace element annual load established by the European
42 E. Madejon et al. / Environmental Pollution 139 (2006) 40e52
Fig. 1. Location of the experimental plot of Vicario (rectangle).
Union (Directive 86/278/EEC) (CEC, 1986) for sewagesludge application. A treatment without amendmentaddition (NA) was also established. The amendmentswere mixed with the top soil (0e15 cm) of each subplotusing a motor hoes (RL328 Honda). This tillage wasalso performed in the non-amended subplots. Theexperiment was carried out in a completely randomisedblock design with three replicates per treatment(Fig. 2b).
2.2. Soil sampling
Soil samples (0 to 15 cm depth) were collected from48 sites (four sites per subplot) on a 14!45 m (Fig. 2b)grid over the experimental plot. At each location threesoil cores were taken to make a composite samplerepresentative of each location. Soils were sampledtwice: September 2002 (before the application ofamendments) and September 2003 (one year after the
43E. Madejon et al. / Environmental Pollution 139 (2006) 40e52
b)
20 m
50 m
4 m
3 m
1 m
2 m
a)
12
109
87
65
43
21BC
Sampling points
NA
LEOSL
SL
11
Fig. 2. (a) Soil sampling locations in the experimental plot. (b) Distribution of amendments in the experimental plot.
application of amendments and before the secondamendment application).
All soil samples were air-dried, crushed and sievedthrough a 2 mm sieve, then ground with an agate mortargrinder to!60 mm prior to determination of S and traceelements.
Table 1
Mean values and standard deviation of some characteristics of the
amendments
Amendment
BC LE SL
pH 6.93G0.03 6.08G0.07 9.04G0.08
TOC (%) 19.5G1.22 28.9G0.39 6.70G1.55
N (%) 1.31G0.06 1.17G0.02 0.98G0.04
P (%) 1.24G0.02 0.04G0.001 0.51G0.06
K (%) 0.93G0.02 3.97G0.08 0.53G0.05
As (mg kg�1) 5.63G1.48 34.9G3.46 1.63G0.34
Cd (mg kg�1) 0.73G0.40 0.83G0.11 0.43G0.15
Cu (mg kg�1) 121G5.66 28.2G2.40 51.0G8.20
Mn (mg kg�1) 257G24.8 66.2G1.41 297G10.3
Pb (mg kg�1) 137G26.2 22.0G2.33 39.2G6.70
Zn (mg kg�1) 258G18.4 64.5G1.06 138G31.0
TOC, total organic carbon; BC, biosolid compost; LE, leonardite; SL,
sugar beet lime (nZ3).
2.3. Plant survey and sampling
Due to the heterogeneity of the chemical character-istics of the soil, observed in the first sampling, eachsubplot was divided equally into four parts (4 x 3.5 m),establishing 48 different vegetation sampling sites. Dueto the different succession of wild plants in the experi-mental plot three surveys were conducted (December2003, March 2004 and June 2004).
For each survey, a 30!30 cm quadrat was used (Cox,1990). The quadrat was randomly placed three timeswithin each sampling site. Plant biomass was clippedand weighed, plant species were listed and vegetationcover estimated. Plant species were determined andnamed following the keys and nomenclature proposedby Valdes et al. (1987).
The most frequent species Oxalis pes-caprae L.,Poa annua L., Lamarckia aurea (L.) Moench, Raphanusraphanistrum L., Medicago polymorpha L. were collectedfor shoot chemical analysis. In addition, control plantsof the same species were collected from adjacentunaffected soils for comparison. The most relevantcharacteristics of these unaffected soils were: (i) pH 7.46;As 7.50 mg kg�1, Cd 0.30 mg kg�1, Cu 65.7 mg kg�1, Pb48.5 mg kg�1, Zn 65.6 mg kg�1 for soil supporting
44 E. Madejon et al. / Environmental Pollution 139 (2006) 40e52
Oxalis pes-caprae L., Poa annua L. and Medicagopolymorpha L. controls; (ii) pH 7.66; As 5.19 mg kg�1,Cd 0.16 mg kg�1, Cu 19.2 mg kg�1, Pb 32.4 mg kg�1, Zn43.7 mg kg�1 for soil supporting Raphanus raphanistrumL. control; (iii) pH 4.77; As 11.6 mg kg�1, Cd 0.63 mgkg�1, Cu 18.3 mg kg�1, Pb 33.4 mg kg�1, Zn 61.5 mgkg�1 for soil supporting Lamarckia aurea (L.) Moench.
Plant samples were washed for at least 15 s witha 0.1 N HCl solution and for 10 s with distilled water.Plant material was then dried at 70 �C, ground andpassed through a 500-mm stainless-steel sieve.
2.4. Chemical analysis
Soil pH was measured in a 1/2.5 sample/1 M KClextract after shaking for 1 h. Total organic carbon(TOC) was analysed by dichromate oxidation andtitration with ferrous ammonium sulphate (Walkleyand Black, 1934). Pseudo-total trace element contentsand S concentration in soil samples (!60 mm) weredetermined after aqua regia digestion in a microwaveoven (Microwave Laboratory Satation MilestonETHOS 900, Milestone s.r.l., Sorisole, Italy). The term‘pseudo-total’ accounts for the aqua regia digestion,because it does not completely destroy silicates. Availabletrace elements were determined by extracting sampleswith 0.05 M EDTA solution pH 7 (Quevauviller et al.,1998). Soil CaCl2-soluble trace element concentrationswere determined in 1/10 soil sample (2 mm)/0.01 MCaCl2 extracts (Ure et al., 1993).
Plant material was analysed for N by Kjeldahldigestion. Mineral nutrients (P, K, Ca, Mg and S) andtrace elements (As, Cd, Cu, Pb and Zn) were extracted bywet oxidation with concentrated HNO3 (suprapur; density1.39 g cm�3) under pressure in a microwave digester.Analysis of mineral nutrients and trace elements in theextracts of soil and plants were determined by ICP-OESin an IRIS ADVANTAGE, Thermo Jarrel Ash Corpo-ration spectrometer and expressed on a dry basis.
The accuracy of the analytical methods was assessedthrough BCR analysis (Community Bureau of Refer-ence) of a plant sample (CRM 279, Sea lettuce) and soilsample (CRM 277, estuarine sediment) (Table 2). The
Table 2
Analysis of BCR references samples. CRM 277 (estuarine sediment)
and CRM 279 (Sea lettuce)
CRM 277 (Estuarine sediment) CRM 279 (Sea lettuce)
Certified Experimental Certified Experimental
As 43.7 42.8G0.83 3.09 2.03G0.11
Cd 11.9 12.4G0.20 0.28 0.43G0.10
Cu 102 119G1.52 13.1 13.5G0.50
Pb 146 147G0.01 13.5 11.4G0.79
Zn 547 507G16.0 51.3 48.2G1.70
Experimental values calculated from (nZ6).
detection limits of the method used were: As!0.01 mgL�1, Cd!0.001 mg L�1, Cu!0.005 mg L�1, Pb!0.01 mgL�1, Zn!0.001 mg L�1.
2.5. Statistical analysis
Mean and standard deviation (SD), were determinedfor all data. Data was tested for normality with theKolmogoroveSmirnov (K-S) test. Correlation analysiswas performed to determine the relationship betweenthe values of the different parameters analysed in soiland plants. The significance level reported ( p!0.01 andp!0.05) is based on Pearson’s coefficients. To studydifferences between treatments, the data were analysedby ANOVA, considering the treatments as the independentvariable. The means were separated by the Tukey’s test,using a significance level of p!0.05. All statisticalanalyses were carried out using SPSS 11.5 for Windows.
3. Results and discussion
3.1. Soil pollution
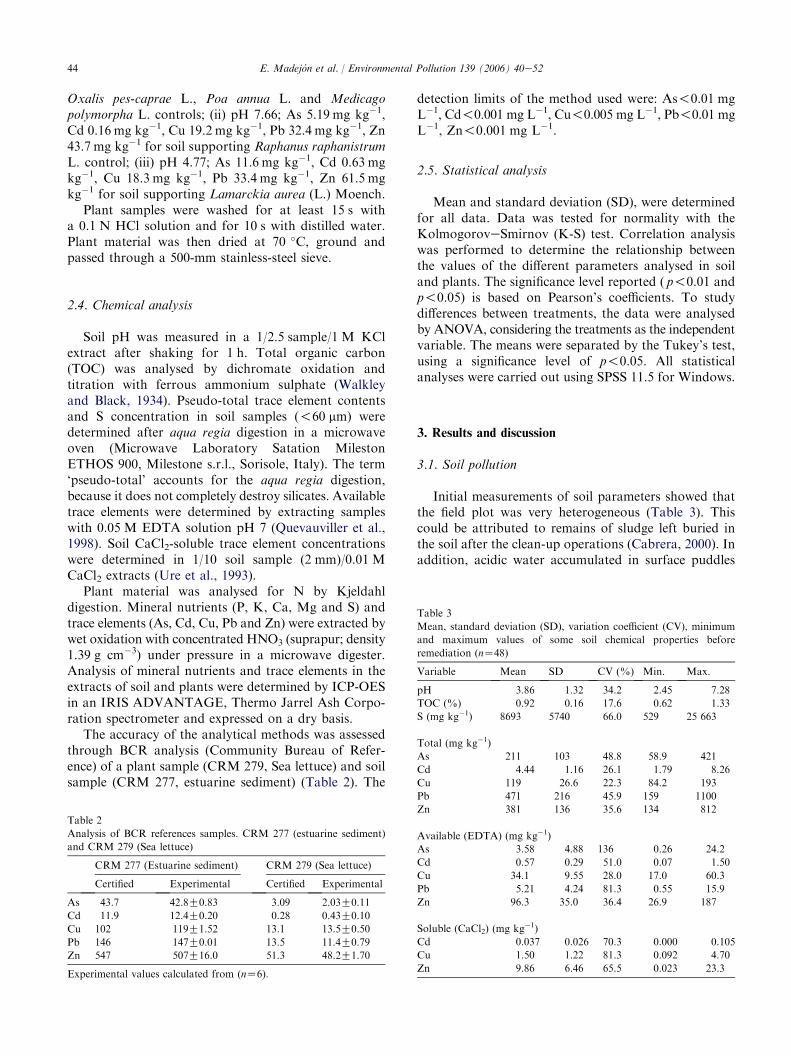
Initial measurements of soil parameters showed thatthe field plot was very heterogeneous (Table 3). Thiscould be attributed to remains of sludge left buried inthe soil after the clean-up operations (Cabrera, 2000). Inaddition, acidic water accumulated in surface puddles
Table 3
Mean, standard deviation (SD), variation coefficient (CV), minimum
and maximum values of some soil chemical properties before
remediation (nZ48)
Variable Mean SD CV (%) Min. Max.
pH 3.86 1.32 34.2 2.45 7.28
TOC (%) 0.92 0.16 17.6 0.62 1.33
S (mg kg�1) 8693 5740 66.0 529 25 663
Total (mg kg�1)
As 211 103 48.8 58.9 421
Cd 4.44 1.16 26.1 1.79 8.26
Cu 119 26.6 22.3 84.2 193
Pb 471 216 45.9 159 1100
Zn 381 136 35.6 134 812
Available (EDTA) (mg kg�1)
As 3.58 4.88 136 0.26 24.2
Cd 0.57 0.29 51.0 0.07 1.50
Cu 34.1 9.55 28.0 17.0 60.3
Pb 5.21 4.24 81.3 0.55 15.9
Zn 96.3 35.0 36.4 26.9 187
Soluble (CaCl2) (mg kg�1)
Cd 0.037 0.026 70.3 0.000 0.105
Cu 1.50 1.22 81.3 0.092 4.70
Zn 9.86 6.46 65.5 0.023 23.3
45E. Madejon et al. / Environmental Pollution 139 (2006) 40e52
could have contributed to the heterogeneity of pH, totalS and trace element distribution (Clemente et al., 2003).
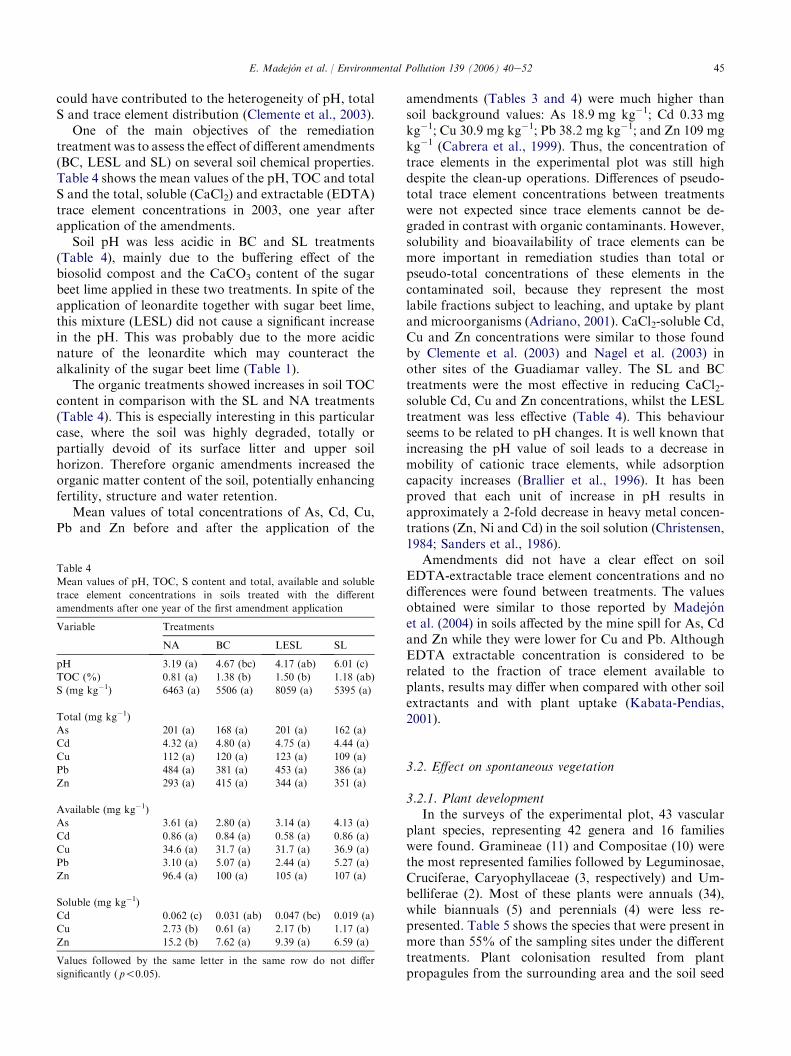
One of the main objectives of the remediationtreatment was to assess the effect of different amendments(BC, LESL and SL) on several soil chemical properties.Table 4 shows the mean values of the pH, TOC and totalS and the total, soluble (CaCl2) and extractable (EDTA)trace element concentrations in 2003, one year afterapplication of the amendments.
Soil pH was less acidic in BC and SL treatments(Table 4), mainly due to the buffering effect of thebiosolid compost and the CaCO3 content of the sugarbeet lime applied in these two treatments. In spite of theapplication of leonardite together with sugar beet lime,this mixture (LESL) did not cause a significant increasein the pH. This was probably due to the more acidicnature of the leonardite which may counteract thealkalinity of the sugar beet lime (Table 1).
The organic treatments showed increases in soil TOCcontent in comparison with the SL and NA treatments(Table 4). This is especially interesting in this particularcase, where the soil was highly degraded, totally orpartially devoid of its surface litter and upper soilhorizon. Therefore organic amendments increased theorganic matter content of the soil, potentially enhancingfertility, structure and water retention.
Mean values of total concentrations of As, Cd, Cu,Pb and Zn before and after the application of the
Table 4
Mean values of pH, TOC, S content and total, available and soluble
trace element concentrations in soils treated with the different
amendments after one year of the first amendment application
Variable Treatments
NA BC LESL SL
pH 3.19 (a) 4.67 (bc) 4.17 (ab) 6.01 (c)
TOC (%) 0.81 (a) 1.38 (b) 1.50 (b) 1.18 (ab)
S (mg kg�1) 6463 (a) 5506 (a) 8059 (a) 5395 (a)
Total (mg kg�1)
As 201 (a) 168 (a) 201 (a) 162 (a)
Cd 4.32 (a) 4.80 (a) 4.75 (a) 4.44 (a)
Cu 112 (a) 120 (a) 123 (a) 109 (a)
Pb 484 (a) 381 (a) 453 (a) 386 (a)
Zn 293 (a) 415 (a) 344 (a) 351 (a)
Available (mg kg�1)
As 3.61 (a) 2.80 (a) 3.14 (a) 4.13 (a)
Cd 0.86 (a) 0.84 (a) 0.58 (a) 0.86 (a)
Cu 34.6 (a) 31.7 (a) 31.7 (a) 36.9 (a)
Pb 3.10 (a) 5.07 (a) 2.44 (a) 5.27 (a)
Zn 96.4 (a) 100 (a) 105 (a) 107 (a)
Soluble (mg kg�1)
Cd 0.062 (c) 0.031 (ab) 0.047 (bc) 0.019 (a)
Cu 2.73 (b) 0.61 (a) 2.17 (b) 1.17 (a)
Zn 15.2 (b) 7.62 (a) 9.39 (a) 6.59 (a)
Values followed by the same letter in the same row do not differ
significantly ( p!0.05).
amendments (Tables 3 and 4) were much higher thansoil background values: As 18.9 mg kg�1; Cd 0.33 mgkg�1; Cu 30.9 mg kg�1; Pb 38.2 mg kg�1; and Zn 109 mgkg�1 (Cabrera et al., 1999). Thus, the concentration oftrace elements in the experimental plot was still highdespite the clean-up operations. Differences of pseudo-total trace element concentrations between treatmentswere not expected since trace elements cannot be de-graded in contrast with organic contaminants. However,solubility and bioavailability of trace elements can bemore important in remediation studies than total orpseudo-total concentrations of these elements in thecontaminated soil, because they represent the mostlabile fractions subject to leaching, and uptake by plantand microorganisms (Adriano, 2001). CaCl2-soluble Cd,Cu and Zn concentrations were similar to those foundby Clemente et al. (2003) and Nagel et al. (2003) inother sites of the Guadiamar valley. The SL and BCtreatments were the most effective in reducing CaCl2-soluble Cd, Cu and Zn concentrations, whilst the LESLtreatment was less effective (Table 4). This behaviourseems to be related to pH changes. It is well known thatincreasing the pH value of soil leads to a decrease inmobility of cationic trace elements, while adsorptioncapacity increases (Brallier et al., 1996). It has beenproved that each unit of increase in pH results inapproximately a 2-fold decrease in heavy metal concen-trations (Zn, Ni and Cd) in the soil solution (Christensen,1984; Sanders et al., 1986).
Amendments did not have a clear effect on soilEDTA-extractable trace element concentrations and nodifferences were found between treatments. The valuesobtained were similar to those reported by Madejonet al. (2004) in soils affected by the mine spill for As, Cdand Zn while they were lower for Cu and Pb. AlthoughEDTA extractable concentration is considered to berelated to the fraction of trace element available toplants, results may differ when compared with other soilextractants and with plant uptake (Kabata-Pendias,2001).
3.2. Effect on spontaneous vegetation
3.2.1. Plant developmentIn the surveys of the experimental plot, 43 vascular
plant species, representing 42 genera and 16 familieswere found. Gramineae (11) and Compositae (10) werethe most represented families followed by Leguminosae,Cruciferae, Caryophyllaceae (3, respectively) and Um-belliferae (2). Most of these plants were annuals (34),while biannuals (5) and perennials (4) were less re-presented. Table 5 shows the species that were present inmore than 55% of the sampling sites under the differenttreatments. Plant colonisation resulted from plantpropagules from the surrounding area and the soil seed
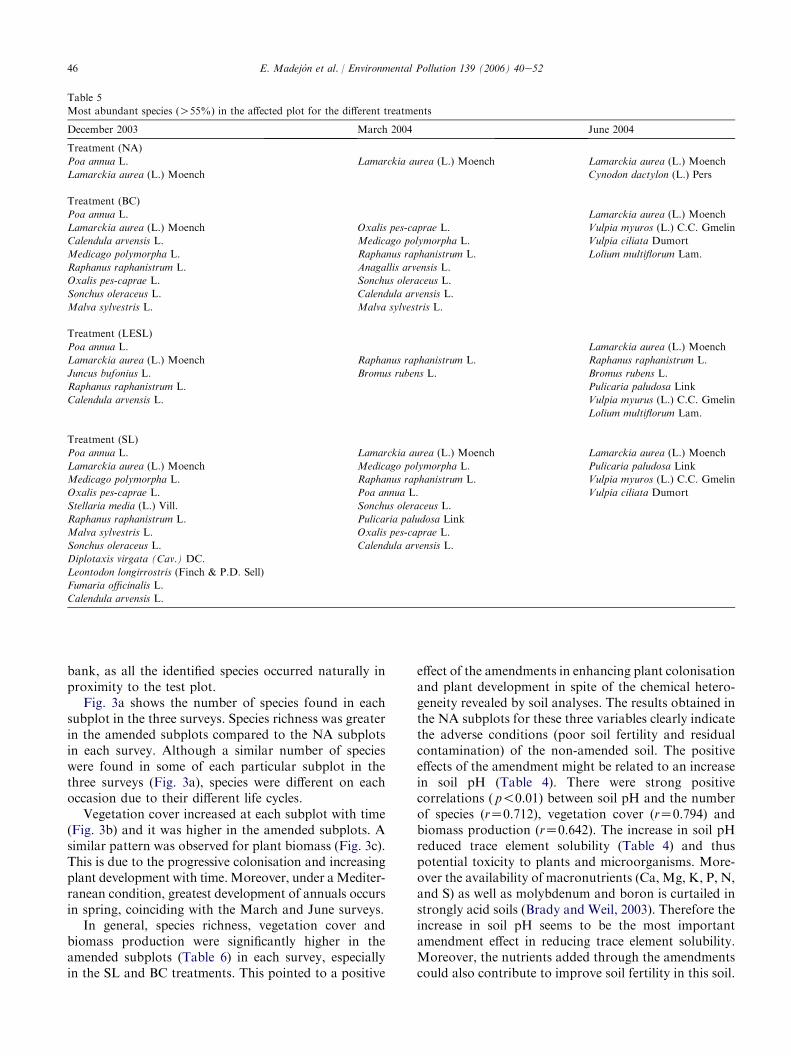
46 E. Madejon et al. / Environmental Pollution 139 (2006) 40e52
Table 5
Most abundant species (O55%) in the affected plot for the different treatments
December 2003 March 2004 June 2004
Treatment (NA)
Poa annua L. Lamarckia aurea (L.) Moench Lamarckia aurea (L.) Moench
Lamarckia aurea (L.) Moench Cynodon dactylon (L.) Pers
Treatment (BC)
Poa annua L. Lamarckia aurea (L.) Moench
Lamarckia aurea (L.) Moench Oxalis pes-caprae L. Vulpia myuros (L.) C.C. Gmelin
Calendula arvensis L. Medicago polymorpha L. Vulpia ciliata Dumort
Medicago polymorpha L. Raphanus raphanistrum L. Lolium multiflorum Lam.
Raphanus raphanistrum L. Anagallis arvensis L.
Oxalis pes-caprae L. Sonchus oleraceus L.
Sonchus oleraceus L. Calendula arvensis L.
Malva sylvestris L. Malva sylvestris L.
Treatment (LESL)
Poa annua L. Lamarckia aurea (L.) Moench
Lamarckia aurea (L.) Moench Raphanus raphanistrum L. Raphanus raphanistrum L.
Juncus bufonius L. Bromus rubens L. Bromus rubens L.
Raphanus raphanistrum L. Pulicaria paludosa Link
Calendula arvensis L. Vulpia myurus (L.) C.C. Gmelin
Lolium multiflorum Lam.
Treatment (SL)
Poa annua L. Lamarckia aurea (L.) Moench Lamarckia aurea (L.) Moench
Lamarckia aurea (L.) Moench Medicago polymorpha L. Pulicaria paludosa Link
Medicago polymorpha L. Raphanus raphanistrum L. Vulpia myuros (L.) C.C. Gmelin
Oxalis pes-caprae L. Poa annua L. Vulpia ciliata Dumort
Stellaria media (L.) Vill. Sonchus oleraceus L.
Raphanus raphanistrum L. Pulicaria paludosa Link
Malva sylvestris L. Oxalis pes-caprae L.
Sonchus oleraceus L. Calendula arvensis L.
Diplotaxis virgata (Cav.) DC.
Leontodon longirrostris (Finch & P.D. Sell)
Fumaria officinalis L.
Calendula arvensis L.
bank, as all the identified species occurred naturally inproximity to the test plot.
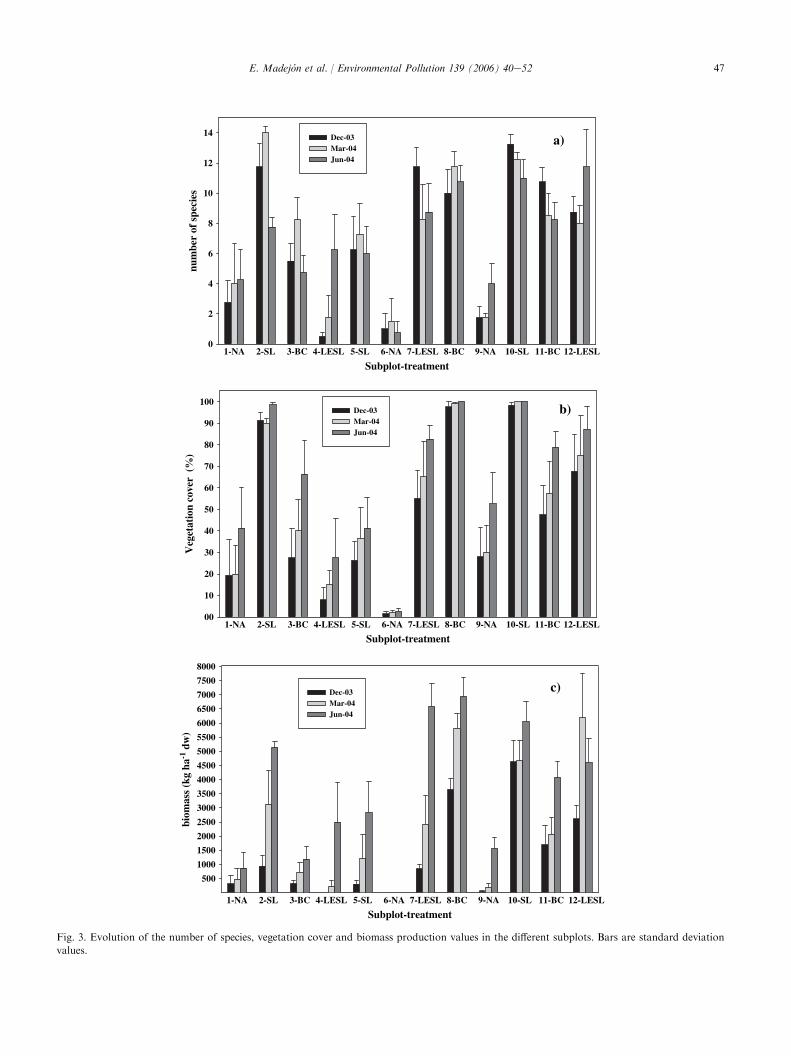
Fig. 3a shows the number of species found in eachsubplot in the three surveys. Species richness was greaterin the amended subplots compared to the NA subplotsin each survey. Although a similar number of specieswere found in some of each particular subplot in thethree surveys (Fig. 3a), species were different on eachoccasion due to their different life cycles.
Vegetation cover increased at each subplot with time(Fig. 3b) and it was higher in the amended subplots. Asimilar pattern was observed for plant biomass (Fig. 3c).This is due to the progressive colonisation and increasingplant development with time.Moreover, under aMediter-ranean condition, greatest development of annuals occursin spring, coinciding with the March and June surveys.
In general, species richness, vegetation cover andbiomass production were significantly higher in theamended subplots (Table 6) in each survey, especiallyin the SL and BC treatments. This pointed to a positive
effect of the amendments in enhancing plant colonisationand plant development in spite of the chemical hetero-geneity revealed by soil analyses. The results obtained inthe NA subplots for these three variables clearly indicatethe adverse conditions (poor soil fertility and residualcontamination) of the non-amended soil. The positiveeffects of the amendment might be related to an increasein soil pH (Table 4). There were strong positivecorrelations ( p!0.01) between soil pH and the numberof species (rZ0.712), vegetation cover (rZ0.794) andbiomass production (rZ0.642). The increase in soil pHreduced trace element solubility (Table 4) and thuspotential toxicity to plants and microorganisms. More-over the availability of macronutrients (Ca, Mg, K, P, N,and S) as well as molybdenum and boron is curtailed instrongly acid soils (Brady and Weil, 2003). Therefore theincrease in soil pH seems to be the most importantamendment effect in reducing trace element solubility.Moreover, the nutrients added through the amendmentscould also contribute to improve soil fertility in this soil.
47E. Madejon et al. / Environmental Pollution 139 (2006) 40e52
Subplot-treatment
Subplot-treatment
num
ber
of s
peci
es
0
2
4
6
8
10
12
14 Dec-03Mar-04Jun-04
1-NA 2-SL 3-BC 4-LESL 5-SL 6-NA 7-LESL 8-BC 9-NA 10-SL 11-BC 12-LESL
1-NA 2-SL 3-BC 4-LESL 5-SL 6-NA 7-LESL 8-BC 9-NA 10-SL 11-BC 12-LESL
Subplot-treatment1-NA 2-SL 3-BC 4-LESL 5-SL 6-NA 7-LESL 8-BC 9-NA 10-SL 11-BC 12-LESL
a)
00
10
20
30
40
50
60
70
80
90
100b)
biom
ass
(kg
ha-1
dw
)
500
1000
1500
2000
2500
3000
3500
4000
4500
5000
5500
6000
6500
7000
7500
8000
c)
Dec-03Mar-04Jun-04
Dec-03Mar-04Jun-04
Veg
etat
ion
cove
r (
)
Fig. 3. Evolution of the number of species, vegetation cover and biomass production values in the different subplots. Bars are standard deviation
values.
48 E. Madejon et al. / Environmental Pollution 139 (2006) 40e52
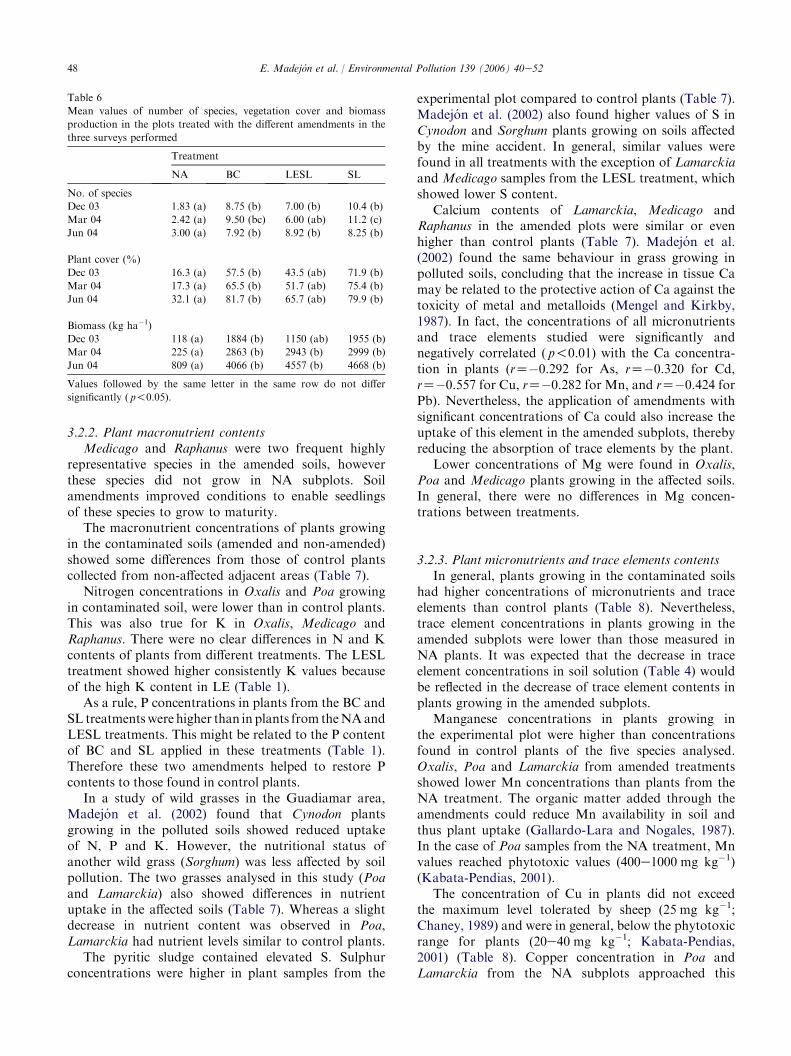
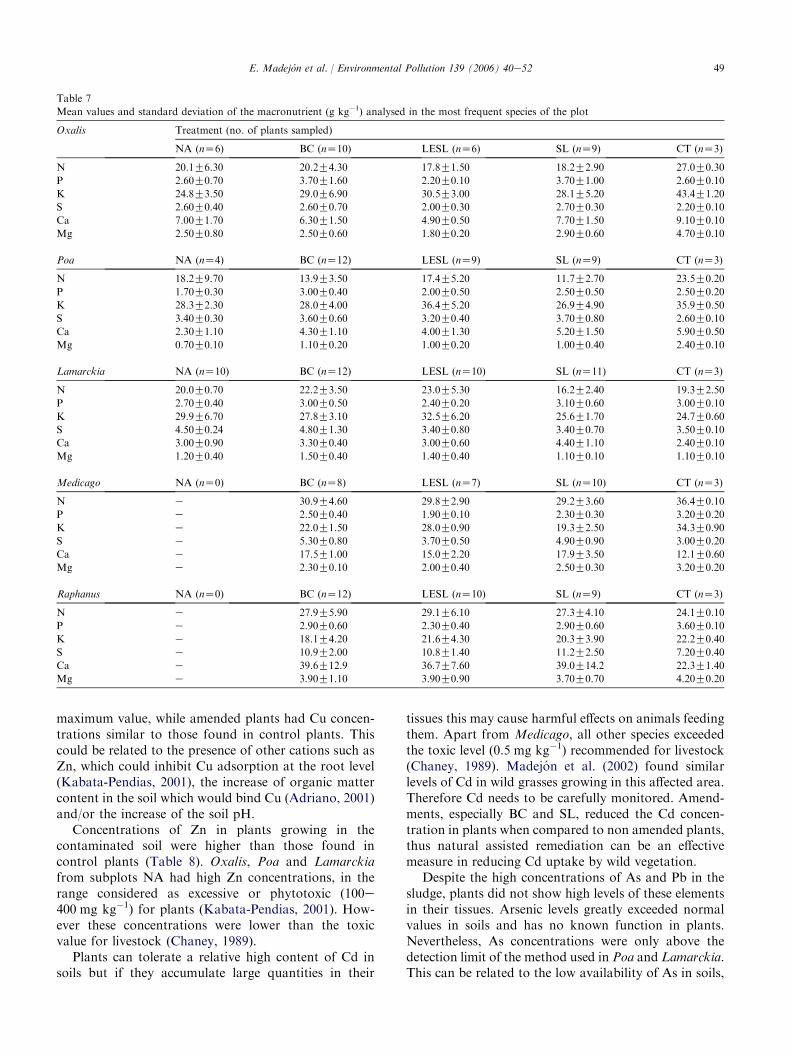
3.2.2. Plant macronutrient contentsMedicago and Raphanus were two frequent highly
representative species in the amended soils, howeverthese species did not grow in NA subplots. Soilamendments improved conditions to enable seedlingsof these species to grow to maturity.
The macronutrient concentrations of plants growingin the contaminated soils (amended and non-amended)showed some differences from those of control plantscollected from non-affected adjacent areas (Table 7).
Nitrogen concentrations in Oxalis and Poa growingin contaminated soil, were lower than in control plants.This was also true for K in Oxalis, Medicago andRaphanus. There were no clear differences in N and Kcontents of plants from different treatments. The LESLtreatment showed higher consistently K values becauseof the high K content in LE (Table 1).
As a rule, P concentrations in plants from the BC andSL treatmentswere higher than in plants from theNAandLESL treatments. This might be related to the P contentof BC and SL applied in these treatments (Table 1).Therefore these two amendments helped to restore Pcontents to those found in control plants.
In a study of wild grasses in the Guadiamar area,Madejon et al. (2002) found that Cynodon plantsgrowing in the polluted soils showed reduced uptakeof N, P and K. However, the nutritional status ofanother wild grass (Sorghum) was less affected by soilpollution. The two grasses analysed in this study (Poaand Lamarckia) also showed differences in nutrientuptake in the affected soils (Table 7). Whereas a slightdecrease in nutrient content was observed in Poa,Lamarckia had nutrient levels similar to control plants.
The pyritic sludge contained elevated S. Sulphurconcentrations were higher in plant samples from the
Table 6
Mean values of number of species, vegetation cover and biomass
production in the plots treated with the different amendments in the
three surveys performed
Treatment
NA BC LESL SL
No. of species
Dec 03 1.83 (a) 8.75 (b) 7.00 (b) 10.4 (b)
Mar 04 2.42 (a) 9.50 (bc) 6.00 (ab) 11.2 (c)
Jun 04 3.00 (a) 7.92 (b) 8.92 (b) 8.25 (b)
Plant cover (%)
Dec 03 16.3 (a) 57.5 (b) 43.5 (ab) 71.9 (b)
Mar 04 17.3 (a) 65.5 (b) 51.7 (ab) 75.4 (b)
Jun 04 32.1 (a) 81.7 (b) 65.7 (ab) 79.9 (b)
Biomass (kg ha�1)
Dec 03 118 (a) 1884 (b) 1150 (ab) 1955 (b)
Mar 04 225 (a) 2863 (b) 2943 (b) 2999 (b)
Jun 04 809 (a) 4066 (b) 4557 (b) 4668 (b)
Values followed by the same letter in the same row do not differ
significantly ( p!0.05).
experimental plot compared to control plants (Table 7).Madejon et al. (2002) also found higher values of S inCynodon and Sorghum plants growing on soils affectedby the mine accident. In general, similar values werefound in all treatments with the exception of Lamarckiaand Medicago samples from the LESL treatment, whichshowed lower S content.
Calcium contents of Lamarckia, Medicago andRaphanus in the amended plots were similar or evenhigher than control plants (Table 7). Madejon et al.(2002) found the same behaviour in grass growing inpolluted soils, concluding that the increase in tissue Camay be related to the protective action of Ca against thetoxicity of metal and metalloids (Mengel and Kirkby,1987). In fact, the concentrations of all micronutrientsand trace elements studied were significantly andnegatively correlated ( p!0.01) with the Ca concentra-tion in plants (rZ�0.292 for As, rZ�0.320 for Cd,rZ�0.557 for Cu, rZ�0.282 for Mn, and rZ�0.424 forPb). Nevertheless, the application of amendments withsignificant concentrations of Ca could also increase theuptake of this element in the amended subplots, therebyreducing the absorption of trace elements by the plant.
Lower concentrations of Mg were found in Oxalis,Poa and Medicago plants growing in the affected soils.In general, there were no differences in Mg concen-trations between treatments.
3.2.3. Plant micronutrients and trace elements contentsIn general, plants growing in the contaminated soils
had higher concentrations of micronutrients and traceelements than control plants (Table 8). Nevertheless,trace element concentrations in plants growing in theamended subplots were lower than those measured inNA plants. It was expected that the decrease in traceelement concentrations in soil solution (Table 4) wouldbe reflected in the decrease of trace element contents inplants growing in the amended subplots.
Manganese concentrations in plants growing inthe experimental plot were higher than concentrationsfound in control plants of the five species analysed.Oxalis, Poa and Lamarckia from amended treatmentsshowed lower Mn concentrations than plants from theNA treatment. The organic matter added through theamendments could reduce Mn availability in soil andthus plant uptake (Gallardo-Lara and Nogales, 1987).In the case of Poa samples from the NA treatment, Mnvalues reached phytotoxic values (400e1000 mg kg�1)(Kabata-Pendias, 2001).
The concentration of Cu in plants did not exceedthe maximum level tolerated by sheep (25 mg kg�1;Chaney, 1989) and were in general, below the phytotoxicrange for plants (20e40 mg kg�1; Kabata-Pendias,2001) (Table 8). Copper concentration in Poa andLamarckia from the NA subplots approached this
49E. Madejon et al. / Environmental Pollution 139 (2006) 40e52
Table 7
Mean values and standard deviation of the macronutrient (g kg�1) analysed in the most frequent species of the plot
Oxalis Treatment (no. of plants sampled)
NA (nZ6) BC (nZ10) LESL (nZ6) SL (nZ9) CT (nZ3)
N 20.1G6.30 20.2G4.30 17.8G1.50 18.2G2.90 27.0G0.30
P 2.60G0.70 3.70G1.60 2.20G0.10 3.70G1.00 2.60G0.10
K 24.8G3.50 29.0G6.90 30.5G3.00 28.1G5.20 43.4G1.20
S 2.60G0.40 2.60G0.70 2.00G0.30 2.70G0.30 2.20G0.10
Ca 7.00G1.70 6.30G1.50 4.90G0.50 7.70G1.50 9.10G0.10
Mg 2.50G0.80 2.50G0.60 1.80G0.20 2.90G0.60 4.70G0.10
Poa NA (nZ4) BC (nZ12) LESL (nZ9) SL (nZ9) CT (nZ3)
N 18.2G9.70 13.9G3.50 17.4G5.20 11.7G2.70 23.5G0.20
P 1.70G0.30 3.00G0.40 2.00G0.50 2.50G0.50 2.50G0.20
K 28.3G2.30 28.0G4.00 36.4G5.20 26.9G4.90 35.9G0.50
S 3.40G0.30 3.60G0.60 3.20G0.40 3.70G0.80 2.60G0.10
Ca 2.30G1.10 4.30G1.10 4.00G1.30 5.20G1.50 5.90G0.50
Mg 0.70G0.10 1.10G0.20 1.00G0.20 1.00G0.40 2.40G0.10
Lamarckia NA (nZ10) BC (nZ12) LESL (nZ10) SL (nZ11) CT (nZ3)
N 20.0G0.70 22.2G3.50 23.0G5.30 16.2G2.40 19.3G2.50
P 2.70G0.40 3.00G0.50 2.40G0.20 3.10G0.60 3.00G0.10
K 29.9G6.70 27.8G3.10 32.5G6.20 25.6G1.70 24.7G0.60
S 4.50G0.24 4.80G1.30 3.40G0.80 3.40G0.70 3.50G0.10
Ca 3.00G0.90 3.30G0.40 3.00G0.60 4.40G1.10 2.40G0.10
Mg 1.20G0.40 1.50G0.40 1.40G0.40 1.10G0.10 1.10G0.10
Medicago NA (nZ0) BC (nZ8) LESL (nZ7) SL (nZ10) CT (nZ3)
N e 30.9G4.60 29.8G2.90 29.2G3.60 36.4G0.10
P e 2.50G0.40 1.90G0.10 2.30G0.30 3.20G0.20
K e 22.0G1.50 28.0G0.90 19.3G2.50 34.3G0.90
S e 5.30G0.80 3.70G0.50 4.90G0.90 3.00G0.20
Ca e 17.5G1.00 15.0G2.20 17.9G3.50 12.1G0.60
Mg e 2.30G0.10 2.00G0.40 2.50G0.30 3.20G0.20
Raphanus NA (nZ0) BC (nZ12) LESL (nZ10) SL (nZ9) CT (nZ3)
N e 27.9G5.90 29.1G6.10 27.3G4.10 24.1G0.10
P e 2.90G0.60 2.30G0.40 2.90G0.60 3.60G0.10
K e 18.1G4.20 21.6G4.30 20.3G3.90 22.2G0.40
S e 10.9G2.00 10.8G1.40 11.2G2.50 7.20G0.40
Ca e 39.6G12.9 36.7G7.60 39.0G14.2 22.3G1.40
Mg e 3.90G1.10 3.90G0.90 3.70G0.70 4.20G0.20
maximum value, while amended plants had Cu concen-trations similar to those found in control plants. Thiscould be related to the presence of other cations such asZn, which could inhibit Cu adsorption at the root level(Kabata-Pendias, 2001), the increase of organic mattercontent in the soil which would bind Cu (Adriano, 2001)and/or the increase of the soil pH.
Concentrations of Zn in plants growing in thecontaminated soil were higher than those found incontrol plants (Table 8). Oxalis, Poa and Lamarckiafrom subplots NA had high Zn concentrations, in therange considered as excessive or phytotoxic (100e400 mg kg�1) for plants (Kabata-Pendias, 2001). How-ever these concentrations were lower than the toxicvalue for livestock (Chaney, 1989).
Plants can tolerate a relative high content of Cd insoils but if they accumulate large quantities in their
tissues this may cause harmful effects on animals feedingthem. Apart from Medicago, all other species exceededthe toxic level (0.5 mg kg�1) recommended for livestock(Chaney, 1989). Madejon et al. (2002) found similarlevels of Cd in wild grasses growing in this affected area.Therefore Cd needs to be carefully monitored. Amend-ments, especially BC and SL, reduced the Cd concen-tration in plants when compared to non amended plants,thus natural assisted remediation can be an effectivemeasure in reducing Cd uptake by wild vegetation.
Despite the high concentrations of As and Pb in thesludge, plants did not show high levels of these elementsin their tissues. Arsenic levels greatly exceeded normalvalues in soils and has no known function in plants.Nevertheless, As concentrations were only above thedetection limit of the method used in Poa and Lamarckia.This can be related to the low availability of As in soils,
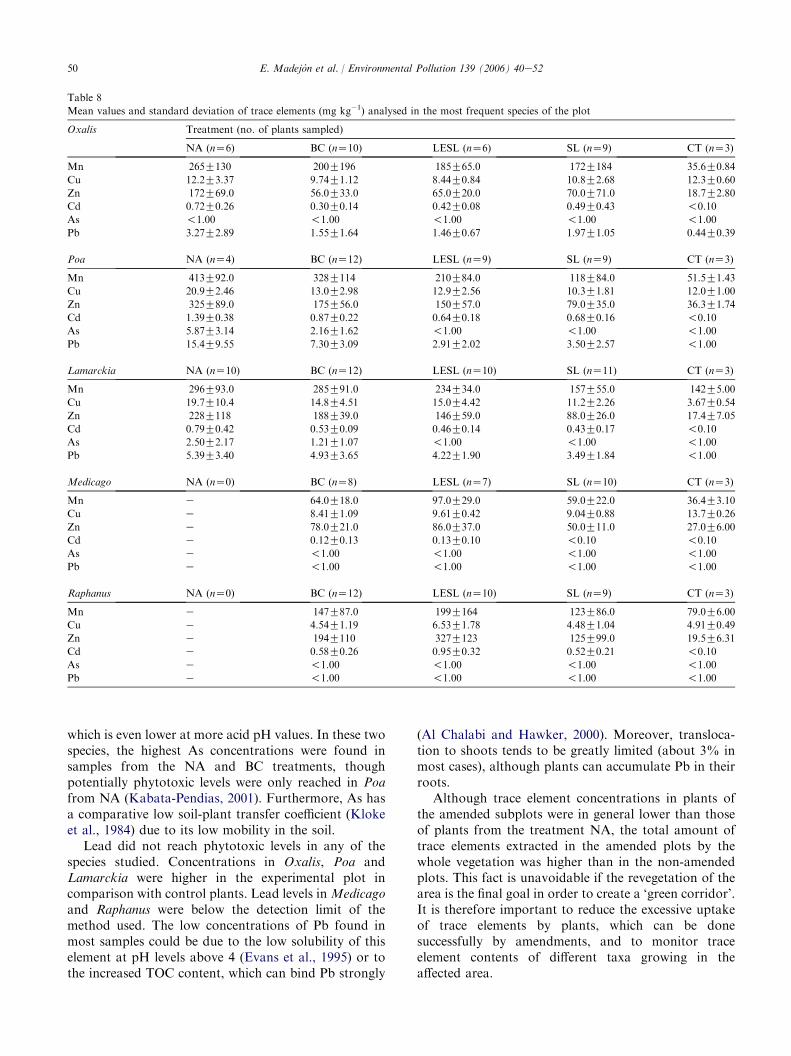
50 E. Madejon et al. / Environmental Pollution 139 (2006) 40e52
Table 8
Mean values and standard deviation of trace elements (mg kg�1) analysed in the most frequent species of the plot
Oxalis Treatment (no. of plants sampled)
NA (nZ6) BC (nZ10) LESL (nZ6) SL (nZ9) CT (nZ3)
Mn 265G130 200G196 185G65.0 172G184 35.6G0.84
Cu 12.2G3.37 9.74G1.12 8.44G0.84 10.8G2.68 12.3G0.60
Zn 172G69.0 56.0G33.0 65.0G20.0 70.0G71.0 18.7G2.80
Cd 0.72G0.26 0.30G0.14 0.42G0.08 0.49G0.43 !0.10
As !1.00 !1.00 !1.00 !1.00 !1.00
Pb 3.27G2.89 1.55G1.64 1.46G0.67 1.97G1.05 0.44G0.39
Poa NA (nZ4) BC (nZ12) LESL (nZ9) SL (nZ9) CT (nZ3)
Mn 413G92.0 328G114 210G84.0 118G84.0 51.5G1.43
Cu 20.9G2.46 13.0G2.98 12.9G2.56 10.3G1.81 12.0G1.00
Zn 325G89.0 175G56.0 150G57.0 79.0G35.0 36.3G1.74
Cd 1.39G0.38 0.87G0.22 0.64G0.18 0.68G0.16 !0.10
As 5.87G3.14 2.16G1.62 !1.00 !1.00 !1.00
Pb 15.4G9.55 7.30G3.09 2.91G2.02 3.50G2.57 !1.00
Lamarckia NA (nZ10) BC (nZ12) LESL (nZ10) SL (nZ11) CT (nZ3)
Mn 296G93.0 285G91.0 234G34.0 157G55.0 142G5.00
Cu 19.7G10.4 14.8G4.51 15.0G4.42 11.2G2.26 3.67G0.54
Zn 228G118 188G39.0 146G59.0 88.0G26.0 17.4G7.05
Cd 0.79G0.42 0.53G0.09 0.46G0.14 0.43G0.17 !0.10
As 2.50G2.17 1.21G1.07 !1.00 !1.00 !1.00
Pb 5.39G3.40 4.93G3.65 4.22G1.90 3.49G1.84 !1.00
Medicago NA (nZ0) BC (nZ8) LESL (nZ7) SL (nZ10) CT (nZ3)
Mn e 64.0G18.0 97.0G29.0 59.0G22.0 36.4G3.10
Cu e 8.41G1.09 9.61G0.42 9.04G0.88 13.7G0.26
Zn e 78.0G21.0 86.0G37.0 50.0G11.0 27.0G6.00
Cd e 0.12G0.13 0.13G0.10 !0.10 !0.10
As e !1.00 !1.00 !1.00 !1.00
Pb e !1.00 !1.00 !1.00 !1.00
Raphanus NA (nZ0) BC (nZ12) LESL (nZ10) SL (nZ9) CT (nZ3)
Mn e 147G87.0 199G164 123G86.0 79.0G6.00
Cu e 4.54G1.19 6.53G1.78 4.48G1.04 4.91G0.49
Zn e 194G110 327G123 125G99.0 19.5G6.31
Cd e 0.58G0.26 0.95G0.32 0.52G0.21 !0.10
As e !1.00 !1.00 !1.00 !1.00
Pb e !1.00 !1.00 !1.00 !1.00
which is even lower at more acid pH values. In these twospecies, the highest As concentrations were found insamples from the NA and BC treatments, thoughpotentially phytotoxic levels were only reached in Poafrom NA (Kabata-Pendias, 2001). Furthermore, As hasa comparative low soil-plant transfer coefficient (Klokeet al., 1984) due to its low mobility in the soil.
Lead did not reach phytotoxic levels in any of thespecies studied. Concentrations in Oxalis, Poa andLamarckia were higher in the experimental plot incomparison with control plants. Lead levels inMedicagoand Raphanus were below the detection limit of themethod used. The low concentrations of Pb found inmost samples could be due to the low solubility of thiselement at pH levels above 4 (Evans et al., 1995) or tothe increased TOC content, which can bind Pb strongly
(Al Chalabi and Hawker, 2000). Moreover, transloca-tion to shoots tends to be greatly limited (about 3% inmost cases), although plants can accumulate Pb in theirroots.
Although trace element concentrations in plants ofthe amended subplots were in general lower than thoseof plants from the treatment NA, the total amount oftrace elements extracted in the amended plots by thewhole vegetation was higher than in the non-amendedplots. This fact is unavoidable if the revegetation of thearea is the final goal in order to create a ‘green corridor’.It is therefore important to reduce the excessive uptakeof trace elements by plants, which can be donesuccessfully by amendments, and to monitor traceelement contents of different taxa growing in theaffected area.
51E. Madejon et al. / Environmental Pollution 139 (2006) 40e52
Table 9
Pearson’s coefficients between extractable EDTA and soluble CaCl2 trace element concentration in soil and plant trace element concentration
As-plant Cd-plant Cu-plant Mn-plant Pb-plant Zn-plant
Soil element
extractable EDTA
e �0.262** e e �0.172* 0.179*
Soil element
soluble CaCl2
e 0.319** 0.296** 0.345** e 0.403**
* p!0.05.** p!0.01.
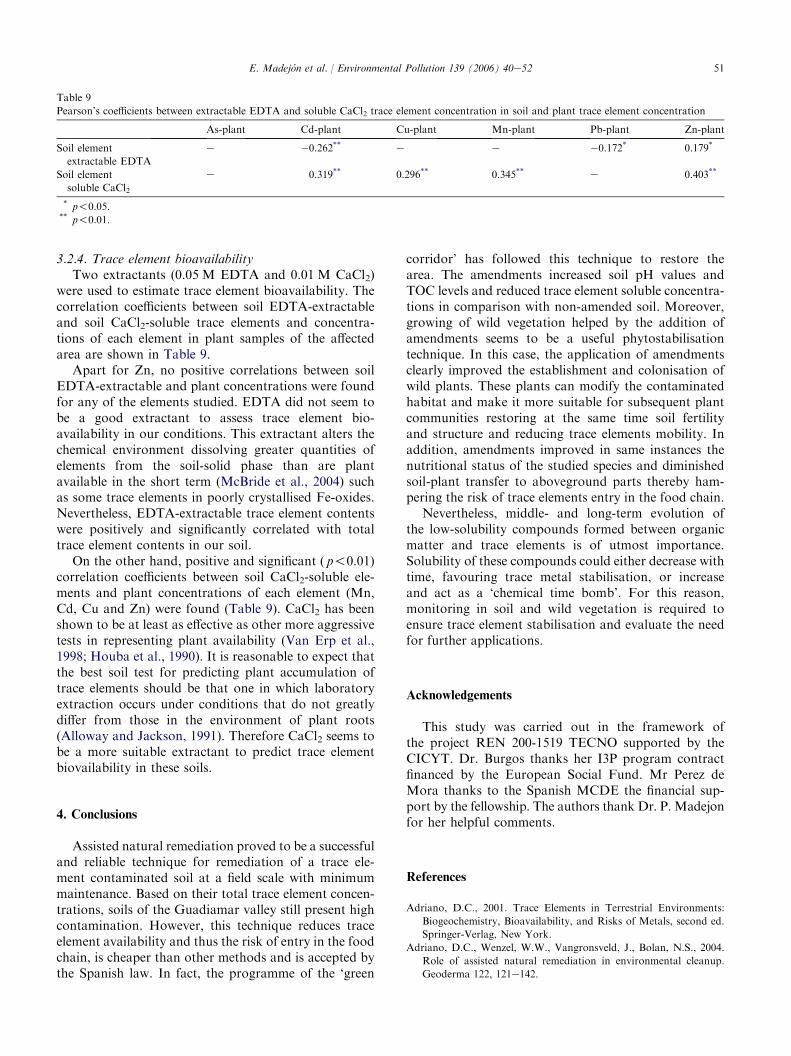
3.2.4. Trace element bioavailabilityTwo extractants (0.05 M EDTA and 0.01 M CaCl2)
were used to estimate trace element bioavailability. Thecorrelation coefficients between soil EDTA-extractableand soil CaCl2-soluble trace elements and concentra-tions of each element in plant samples of the affectedarea are shown in Table 9.
Apart for Zn, no positive correlations between soilEDTA-extractable and plant concentrations were foundfor any of the elements studied. EDTA did not seem tobe a good extractant to assess trace element bio-availability in our conditions. This extractant alters thechemical environment dissolving greater quantities ofelements from the soil-solid phase than are plantavailable in the short term (McBride et al., 2004) suchas some trace elements in poorly crystallised Fe-oxides.Nevertheless, EDTA-extractable trace element contentswere positively and significantly correlated with totaltrace element contents in our soil.
On the other hand, positive and significant ( p!0.01)correlation coefficients between soil CaCl2-soluble ele-ments and plant concentrations of each element (Mn,Cd, Cu and Zn) were found (Table 9). CaCl2 has beenshown to be at least as effective as other more aggressivetests in representing plant availability (Van Erp et al.,1998; Houba et al., 1990). It is reasonable to expect thatthe best soil test for predicting plant accumulation oftrace elements should be that one in which laboratoryextraction occurs under conditions that do not greatlydiffer from those in the environment of plant roots(Alloway and Jackson, 1991). Therefore CaCl2 seems tobe a more suitable extractant to predict trace elementbiovailability in these soils.
4. Conclusions
Assisted natural remediation proved to be a successfuland reliable technique for remediation of a trace ele-ment contaminated soil at a field scale with minimummaintenance. Based on their total trace element concen-trations, soils of the Guadiamar valley still present highcontamination. However, this technique reduces traceelement availability and thus the risk of entry in the foodchain, is cheaper than other methods and is accepted bythe Spanish law. In fact, the programme of the ‘green
corridor’ has followed this technique to restore thearea. The amendments increased soil pH values andTOC levels and reduced trace element soluble concentra-tions in comparison with non-amended soil. Moreover,growing of wild vegetation helped by the addition ofamendments seems to be a useful phytostabilisationtechnique. In this case, the application of amendmentsclearly improved the establishment and colonisation ofwild plants. These plants can modify the contaminatedhabitat and make it more suitable for subsequent plantcommunities restoring at the same time soil fertilityand structure and reducing trace elements mobility. Inaddition, amendments improved in same instances thenutritional status of the studied species and diminishedsoil-plant transfer to aboveground parts thereby ham-pering the risk of trace elements entry in the food chain.
Nevertheless, middle- and long-term evolution ofthe low-solubility compounds formed between organicmatter and trace elements is of utmost importance.Solubility of these compounds could either decrease withtime, favouring trace metal stabilisation, or increaseand act as a ‘chemical time bomb’. For this reason,monitoring in soil and wild vegetation is required toensure trace element stabilisation and evaluate the needfor further applications.
Acknowledgements
This study was carried out in the framework ofthe project REN 200-1519 TECNO supported by theCICYT. Dr. Burgos thanks her I3P program contractfinanced by the European Social Fund. Mr Perez deMora thanks to the Spanish MCDE the financial sup-port by the fellowship. The authors thank Dr. P. Madejonfor her helpful comments.
References
Adriano, D.C., 2001. Trace Elements in Terrestrial Environments:
Biogeochemistry, Bioavailability, and Risks of Metals, second ed.
Springer-Verlag, New York.
Adriano, D.C., Wenzel, W.W., Vangronsveld, J., Bolan, N.S., 2004.
Role of assisted natural remediation in environmental cleanup.
Geoderma 122, 121e142.
52 E. Madejon et al. / Environmental Pollution 139 (2006) 40e52
Aguilar, J., Dorrondoso, C., Fernandez, E., Fernandez, J., Garcıa, I.,
Martın, F., Simon, M., 2004. Soil pollution by a pyrite mine spill in
Spain: evolution in time. Environmental Pollution 132, 395e401.
Al Chalabi, A.B., Hawker, D., 2000. Distribution of vehicular lead in
road side soils of major Roads of Brisbane, Australia. Water, Air,
and Soil Pollution 118, 299e310.
Alloway, B.J., Jackson, S.P., 1991. Behaviour of trace metals in
sludge-amended soils. The Science of the Total Environment 100,
151e176.
Ayora, C., Barettino, D., Carrera, J., Manzano, M., Mediavilla, C.,
2001. Las aguas y los suelos tras el accidente de Aznalcollar.
Boletın Geologico y Minero 112, 1e294.Bolan, N.S., Duraisamy, V.P., 2003. Role of inorganic and organic soil
amendments on immobilisation and phytoavailability of heavy
metals: a review involving specific case studies. Australian Journal
of Soil Research 41, 533e555.
Brady, N.C., Weil, R.R., 2003. The Nature and Properties of Soils,
thirteenth ed. Prentice Hall, Upper Saddle River, NJ.
Brallier, S., Harrison, R.B., Henry, C.L., Dongsen, X., 1996. Liming
effects on availability of Cd, Cu, Ni and Zn in soil amended with
sewage sludge 16 years previously. Water, Air, and Soil Pollution
86, 195e206.
Cabrera, F., 2000. La contaminacion por metales pesados en el valle
del Guadiamar tras el vertido de Aznalcollar. Retema enero-
febrero, 37e48.
Cabrera, F., Clemente, L., Dıaz Barrientos, E., Lopez, R.,
Murillo, J.M., 1999. Heavy metal pollution of soils affected by
the Guadiamar toxic flood. The Science of the Total Environment
242, 117e129.
CEC (Commission of the European Communities), 1986. Council
Directive 86/278/EEC of 12 June 1986 on the protection of the
environment, and in particular of the soil, when sewage sludge is
used in agriculture. Official Journal L181, 04/07/1986, pp. 6e12.
Clemente, R., Walker, D.J., Roig, A., Bernal, M.P., 2003. Heavy metal
bioavailability in a soil affected by mineral sulphides contamination
following the mine spillage at Aznalcollar (Spain). Biodegradation
14, 199e205.
CMA. (Consejerıa de Medio Ambiente), 2003. Ciencia y Restauracion
del Rıo Guadiamar. PICOVER 1998e2002. Consejerıa de Medio
Ambiente. Junta de Andalucıa.
Chaney, R.L., 1989. Toxic element accumulation in soils and crops:
protecting soil fertility and agricultural food chain. In: Baryosef, B.,
Barrow, N.J., Goldshmid, J. (Eds.), Inorganic Contaminants in the
Valdose Zone. Springer-Verlag, Berlin, pp. 140e158.
Christensen, T.H., 1984. Cadmium soil sorption at low concentrations:
I. Effect of time, cadmium load, pH and calcium. Water, Air, and
Soil Pollution 21, 105e114.
Cox, G., 1990. Laboratory Manual of General Ecology, sixth ed.
W.C. Brown, Dubuque, IA.
Evans, L.J., Spiers, G.A., Zhao, G., 1995. Chemical aspects of heavy
metal solubility with reference to sewage sludge amended soils.
International Journal of Environmental Analytical Chemistry 59,
291e302.Gallardo-Lara, F., Nogales, R., 1987. Effect of application of town
refuse compost on the soil-plant system: a review. Biological Waste
19, 35e62.Grimalt, J.O., Ferrer, M., MacPherson, E., 1999. The mine tailing
accident in Aznalcollar. The Science of the Total Environment 242,
2e11.
Hartley, W., Eduards, R., Lepp, W.N., 2004. Arsenic and heavy metal
mobility in iron oxide-amended contaminated soils as evaluated by
short and long term leaching tests. Environmental Pollution 131,
495e504.
Houba, V.J.G., Novozamsky, I., Lemond, Th.M., van der Lee, J.J.,
1990. Applicability of CaCl2 as a single extraction solution for the
assessment of the nutrient status of soils and other diagnostic
purposses. Communications in Soil and Plant Analysis 21,
2281e2290.
Kabata-Pendias, A., 2001. Trace Elements in Soil and Plants. CRC
Press, Boca Raton, FL.
Kloke, A., Sauerbeck, D.R., Vetter, H., 1984. The contamination of
plants and soil with heavy metals and the transport of metals in
terrestrial food chains. In: Nriagu, J.O. (Ed.), Changing Metal
Cycles and Human Health. Springer-Verlag, Berlin, pp. 113e141.Madejon, P., Murillo, J.M., Maranon, T., Cabrera, F., Lopez, R.,
2002. Bioaccumulation of As, Cd, Cu, Fe and Pb in wild grasses
affected by the Aznalcollar mine spill (SW Spain). The Science of
the Total Enviroment 290, 105e120.
Madejon, P., Maranon, T., Murillo, J.M., Robinson, B., 2004. White
poplar (Populus alba) as a biomonitor of trace elements in
contaminated riparian forests. Environmental Pollution 132,
145e155.
Mench, M., Bussiere, S., Boisson, J., Castaing, E., Vangronsveld, J.,
Ruttens, A., De Koe, T., Bleeker, P., Assuncao, A., Manceau, A.,
2003. Progress in remediation and revegetation of the barren Jales
gold mine spoil after in situ treatments. Plant and Soil 249 (1),
187e202.
Mengel, K., Kirkby, E.A., 1987. Principles of Plant Nutrition,
fourth ed. International Potash Institute, Bern.
McBride, M.B., Richards, B.K., Steenhuis, T., 2004. Bioavailability
and crop uptake of trace elements in soil columns amended with
sewage sludge products. Plant and Soil 262, 71e84.
McLaughin, M.J., 2001. Bioavailability of metals to terrestrial plants.
In: Allen, H.E. (Ed.), Bioavailability of Metals in Terrestrial
Ecosystems. Importance of Partioning for Bioavailability to
Invertebrates, Microbes and Plants. SETAC Press, Pensacola, FL,
pp. 39e68.
Nagel, I., Lang, F., Kaupenjohann, M., Pfeffer, K.-H., Cabrera, F.,
Clemente, L., 2003. Guadiamar toxic flood: factors that govern
heavy metal distribution in soils. Water, Air, and Soil Pollution
143, 211e224.
Quevauviller, Ph., Lachica, M., Barahona, E., Gomez, A., Rauret, G.,
Ure, A., Muntau, H., 1998. Certified reference material for the
quality control of EDTA- and DTPA-extractable trace metal
contents in calcareous soil (CRM 600). Fresenius Journal of
Analytical Chemistry 360, 505e511.
Sanders, J.R., McGrath, S.P., Adams, T.M., 1986. Zinc, copper
and nickel concentrations in ryegrass grown on sewage sludge-
contaminated soils of different pH. Journal of Science Food
Agriculture 37, 961e968.
Soil Survey Staff, 1996. Keys to Soil Taxonomy. US Department of
Agriculture. Soil Conservation Service, Washington, DC.
Ure, A.M., Quevauviller, P.H., Muntau, H., Griepink, B., 1993.
Speciation of heavy metals in soils and sediments. An account of
the improvement and harmonisation of extraction techniques
undertaken under the auspices of the BCR of the Commission of
theEuropeanCommunities. International Journal ofEnvironmental
Analytical Chemistry 51, 135e151.
Tordoff, G.M., Baker, A.J.M., Willis, A.J., 2000. Current approaches
to the revegetation and reclamation of metalliferous wastes.
Chemosphere 41, 219e228.
Valdes, B., Talavera, S., Fernandez-Galiano, E., 1987. Flora Vascular
de Andalucıa occidental, Cutres, Barcelona.
Van Erp, P.J., Houba, V.G.J., van Beusichem, M.L., 1998. One
hundredth molar calcium chloride extraction procedure. Part 1:
a review of soil chemical, analytical and plant nutritional aspects.
Communications in Soil Science and Plant Analysis 29,
1603e1623.
Walkley, A., Black, I.A., 1934. An examination of the Degtjareff
method for determining soil organic matter and a proposed
determination of the chromic acid tritation method. Soil Science
37, 29e38.


