Embed Size (px)
Citation preview

Sp
TF
a
ARRA
KFRPCNW
1
f(at
(
p
0d
Forest Ecology and Management 260 (2010) 723–733
Contents lists available at ScienceDirect
Forest Ecology and Management
journa l homepage: www.e lsev ier .com/ locate / foreco
oil calcium, nitrogen, and water are correlated with aboveground net primaryroduction in northern hardwood forests
homas W. Baribault ∗, Richard K. Kobe1, David E. Rothstein2
orestry Department, Michigan State University, 126 Natural Resources Building, East Lansing, MI 48824, USA
r t i c l e i n f o
rticle history:eceived 24 March 2010eceived in revised form 12 May 2010ccepted 18 May 2010
eywords:orest productivityesource correlationroductivity partitioningalciumitrogenater
a b s t r a c t
Multiple soil resources could limit aboveground net primary production (ANPP) in temperate forests, butmost studies have focused on nitrogen (N) availability. We tested a suite of resources including water,multiple measures of N, phosphate (PO4), and extractable ions (calcium (Ca), potassium (K), magnesium(Mg)) as correlates of ANPP across a glacial landform gradient in northwestern Lower Michigan. Ourgoals were to identify resource correlates of ANPP that could potentially limit productivity, to character-ize productivity partitioning to leaves (ANPPL) and wood (ANPPW) across the gradient, and to test soilresource correlates of partitioning. We measured soil resource availability and annual ANPP at 13 sites,and fit models of ANPPW and ANPPL as functions of each resource. We used Akaike’s Information Crite-rion to assess empirical support for models with different functional forms. ANPPW was best correlatedwith Ca, with a relationship that was asymptotic beyond the four lowest-productivity sites. Both Mg andK covaried with Ca; Mg was also supported as an ANPPW correlate. Soil water and sum of ammonium(NH4) and nitrate (NO3) (�N) explained substantial ANPPW variance, but with weaker support than forCa. ANPPL was best correlated with �N; NO3 received support, while Ca received less support but stillexplained substantial ANPPL variance. These results suggest a potential role for Ca in regulating ANPP, atleast in low-productivity sites, while reaffirming the importance of both N and water availability. Parti-tioning of annual production to ANPPW as a fraction of total ANPP was related to Ca and soil water, butonly weakly to �N. Production was partitioned equally between ANPPL and ANPPW at low fertility, butANPPW exceeded ANPPL by 24% at maximum productivity. Given this shift in partitioning, measuring
only ANPPW but assuming that ANPPL scales proportionately would overestimate ANPP at higher fertilitysites. Although correlative, our results suggest that ANPP is constrained by some combination of N, Ca, andwater, and provide motivation for experimental manipulations of these resources to better understandforest responses to human influences. If northern temperate forests are strictly N-limited, as suggestedby much of the literature, then anthropogenic N deposition should enhance ANPP. In contrast, if ANPPis limited, or co-limited, by Ca or by soil water, then anthropogenic change (altered precipitation, baseunte
cation leaching), could co. Introduction3
Aboveground net primary productivity (ANPP) in temperate
orests is often positively correlated to soil nitrogen (N) availabilityPastor et al., 1984; Zak et al., 1989; Goodale and Aber, 2001; Idol etl., 2003; Joshi et al., 2003; Hogberg et al., 2006), and supplemen-al N can increase ANPP (Will et al., 2001; Finzi, 2009). Additional∗ Corresponding author. Tel.: +1 517 355 7599/432 1143.E-mail addresses: [email protected] (T.W. Baribault), [email protected]
R.K. Kobe), [email protected] (D.E. Rothstein).1 Tel.: +1 517 355 8433.2 Tel.: +1 517 432 3353.3 Non-standard abbreviations: ANPPW: wood mass production; ANPPL: leaf mass
roduction; units are (Mg ha−1 year−1).
378-1127/$ – see front matter © 2010 Elsevier B.V. All rights reserved.oi:10.1016/j.foreco.2010.05.029
ract production gains from N deposition.© 2010 Elsevier B.V. All rights reserved.
N from atmospheric deposition, in combination with increasedglobal atmospheric CO2 concentrations and temperatures, is pro-jected to enhance ANPP (Mohan et al., 2007). Nitrogen depositionmay alter nutrient regimes in many ecosystems by alleviating Nlimitation (Gradowski and Thomas, 2008); however, N depositioncould also promote leaching of calcium (Ca) and other base cations(Izuta et al., 2004; Perakis et al., 2006), and paradoxically of N itself(Brookshire et al., 2007). Since N limitation in temperate forests isbroadly assumed (Finzi and Canham, 2000), tests of resource limi-tation often include only correlations of production to N, even when
other resource measures (e.g. soil texture) are available (Pastor etal., 1984; Zak et al., 1989). In theory, productivity could be reducedby deficiency of any resource, so it remains unknown whether Nlimits ANPP more than other resources because other resourceshave rarely been evaluated.
7 y and
2NptAtagcr(2irs2usvC
p(eq(it2ACn22e1p(ai1a2se
c2tpinadCa1rMrpmwac
24 T.W. Baribault et al. / Forest Ecolog
Nitrogen cycling and productivity often co-vary (Hall et al.,006; Johnson, 2006; Mayer, 2008), but production may influencecycling as much as N cycling influences production. For exam-
le, across an elevation—atmospheric N deposition gradient inhe northeastern U.S., N mineralization is strongly correlated withNPP but ANPP is unrelated to mineral N availability, which is con-
rolled by both mineralization and atmospheric deposition (Joshi etl., 2003). In Patagonian steppe systems that span a precipitationradient, ANPP is related to soil moisture and N, but N availability isontrolled by soil moisture (Austin and Sala, 2002). Furthermore, Nesorption from fine roots (Kunkle et al., 2009) and senescent leavesKobe et al., 2005), and direct N absorption by leaves (Sparks et al.,008), could partially decouple N metabolism from soil N availabil-
ty (Migita et al., 2007). In general, leaf production (ANPPL) mayegulate soil N if litter quality exerts strong control over decompo-ition, N mineralization, and nitrification rates (Page and Mitchell,008; Vesterdal et al., 2008). Recognizing that N availability is reg-lated by a cycle of N-vegetation feedback, landscape gradients inoil N could be a function of – in addition to being a reason for –ariation in vegetation cover and ANPP (Hobbie, 1996; Aerts andhapin, 2000).
Emerging evidence highlights the influence of Ca availability onroductivity of deciduous forests in northeastern North AmericaBigelow and Canham, 2007; Gradowski and Thomas, 2008; Parkt al., 2008). Soil Ca availability is less likely than N to be a conse-uence of production because Ca is weathered from parent materialGiesler et al., 1998; Blum et al., 2002; Berger et al., 2006), but its influenced, at least in late succession ecosystems, by mineraliza-ion and decomposition rates (Holzmueller et al., 2007; Watmough,008). Diminished soil Ca reduces growth and disease resistance incer saccharum on acidic soils (St Clair et al., 2008). Furthermore,a availability is strongly related to individual tree growth acrossatural (Bailey et al., 2004; Schaberg et al., 2006; Sverdrup et al.,006) and experimentally manipulated Ca gradients (Kobe et al.,002; Bigelow and Canham, 2007; Dauer et al., 2007; Kulmatiskit al., 2007), and correlates with fine root production (Reich et al.,997; Park et al., 2008). Fertilization with Ca in the field can elicitositive growth responses in seedlings (Kobe et al., 2002), saplingsLong et al., 1997; St Clair and Lynch, 2005; Juice et al., 2006),nd canopy adults (Gradowski and Thomas, 2008). Conversely, lim-ted Ca availability contributes to low ANPP (Hallett and Hornbeck,997; McLaughlin and Wimmer, 1999), while reduced productivityccompanies leaching of soil Ca by acidic rain (Singh and Agrawal,008). Moreover, Ca is immobile in the phloem (Brown et al., 1999),o Ca uptake requirements likely exceed those of phloem-mobilelements like K, Mg, P, or N.
Production also could be related to availability of other baseations (Wilmot et al., 1996; Rosberg et al., 2006; Sverdrup et al.,006; Park et al., 2008). Greater availability of Mg increases pho-osynthesis (Vizcayno-Soto and Cote, 2004), which is the primaryhysiological basis for elevating ANPP. Increased K availability
mproves water use efficiency (Bradbury and Malcolm, 1977),utrient uptake (Stevens et al., 1993), leaf retention (Nowak etl., 1991), and leaf longevity (Hodson and Sangster, 1998), whileecreasing leaf mortality and senescence (Ericsson and Kahr, 1993;ovelo and Gallardo, 2002). Higher K availability also is associ-ted with increased resistance to beetle infestation (Ylimartimo,990), reduced tissue necrosis (Fluckiger and Braun, 1998), andeduced lateral root mass (Triboulot et al., 1997). Potassium andg are readily re-translocated via phloem (Brown et al., 1999), and
esorption rates for both elements are high, further highlighting
hysiological importance. Soil texture can provide an integratedeasure of base cation availability (Knox et al., 1995), and predictood production (ANPPW) approximately as well as N (Pastor etl., 1984; Zak et al., 1989; Reich et al., 1997); soil moisture oftenonstrains production (Knox et al., 1995), so we included both vol-
Management 260 (2010) 723–733
umetric soil water and soil texture in our set of measured soilresources.
Species composition could further affect productivity, sincesome species (e.g. A. saccharum, Quercus rubra) grow faster thanothers (e.g. Quercus alba, Fagus grandifolia) under equivalentresource conditions (Comas and Eissenstat, 2004). As well asmediating the growth response to resource availability, speciescomposition could actively deplete or augment various resources,whether through differences in resource uptake (Fujinuma et al.,2005) or litter cycling rates (Dijkstra, 2003).
In addition to total production, partitioning to leaf, stem, androot production would be expected to vary across resource gradi-ents (Vanninen and Makela, 2000; Sternberg and Shoshany, 2001;Vogel et al., 2008; Kobe et al., 2010). In many studies, productivitypartitioning to stem growth in seedlings responds idiosyncraticallyto increased soil N or base cation availability (Berger and Glatzel,2001; Kobe et al., 2010), but partitioning to stem mass is consis-tently a function of size for both seedlings and adults (Peichl andArain, 2007). It is unclear whether partitioning of annual above-ground growth (as opposed to aboveground total mass) at the adultstage is controlled primarily by tree size, nutrient availability, oran interaction of these factors. We assume that growth and massbehave similarly, on the grounds that mass represents accumulatedgrowth, such that partitioning to annual stem growth increaseswith tree size.
1.1. Objectives
Our overall objective was to determine the strongest relation-ships of production to soil resources in order to identify potentiallimiting resource candidates. We measured tree growth over aneight-year interval at 13 sites that spanned a soil fertility and pro-ductivity gradient. A comprehensive set of soil variables includingN, base cations, texture, and moisture was tested for correlationto ANPP. We expected a relationship of production – particu-larly ANPPL – to N, but also suspected that production might beassociated with base cation or water availability. Our second objec-tive was to test whether partitioning of production across thegradient was related to soil resource availability. Based on allo-metric relationships, we expected wood production to constitutea progressively larger fraction of total production as productiv-ity increased; we also expected that partitioning of productionshould be related to the soil resources identified from the firstobjective.
2. Methods
2.1. Study sites
This study was conducted in mixed hardwood stands of theManistee National Forest in the lower peninsula of Michigan,USA (∼44◦12′N, ∼85◦45′W), a region with well-defined associa-tions among glacial landforms, soil fertility and forest communitycomposition (Zak et al., 1989; Host and Pregitzer, 1992). Net N-mineralization, nitrification rates, nitrate, and ammonium poolsincrease from outwash through ice-contact and moraine landforms(Zak et al., 1989) (Supplementary data, Appendix A). Base cationconcentrations also increase across the landform fertility gradient,although phosphate follows no discernible pattern (Supplementarydata, Appendix B). From outwash through moraine, total ANPP,
ANPPW, and ANPPL increase approximately two-fold (Table 1).Soil properties (Supplementary data, Appendix C) that charac-terize landform are closely associated with characteristic speciescompositions (Host et al., 1988; Host and Pregitzer, 1992). Standswere 80–100 years old second-growth, and have been undisturbed
T.W. Baribault et al. / Forest Ecology and Management 260 (2010) 723–733 725
Table 1Annual productivity increments were calculated between 1999 and 2007 for ANPPW, ANPPL, and total ANPP. Species composition shifts predictably across landform, butoutlying individuals can be found at some sites. Stand age should be interpreted as elapsed time since significant, stand-replacing disturbance, with a mean of 87 years ofminimal local anthropogenic disturbance.
IDa ANPPW
(Mg ha−1)ANPPL
(Mg ha−1)ANPP(Mg ha−1)
Basal area(m2 ha−1)
Density(stems ha−1)
Dominant species b 95% dbh (cm) Age (years) Location
1, O 2.62 2.80 5.42 22.69 582 Qa, Qv, Pb 45.8 88 44◦14′N, 85◦56′W2, O 2.73 2.78 5.51 23.07 510 Qa, Qv, Qr 49.7 80 44◦14′N, 85◦57′W3, I 3.93 3.09 7.02 31.29 555 Qv, Qr, Ar 51.1 97 44◦16′N, 85◦53′W4, I 3.19 3.34 6.53 30.23 486 Qr, Ar, Pg 51.8 111 44◦17′N, 85◦53′W5, mI 5.09 3.52 8.61 38.10 725 Qr, Qv, Ar 44.3 83 44◦19′N, 85◦52′W6, mI 4.34 3.16 7.50 36.46 623 Qr, Pg, Ar 58.4 90 44◦12′N, 85◦48′W7, pM 4.40 3.73 8.13 33.10 568 As, Qr, Ar 48.3 79.0 44◦11′N, 85◦45′W8, pM 4.88 2.99 7.87 NAc 636 As, Fg, Ar 37.9 77 44◦20′N, 85◦29′W9, iM 5.32 3.80 9.12 39.80 712 As, Fg, Qr 56.8 80 44◦22′N, 85◦49′W10, M 4.62 3.77 8.39 39.97 642 As, Fg, Ta 59.6 84 44◦15′N, 85◦45′W11, M 4.71 3.75 8.45 36.24 544 As, Fg, Ta 52.6 76 44◦13′N, 85◦40′W12, M 4.31 3.19 7.49 36.10 612 As, Ta, Qr 55.9 92 44◦13′N, 85◦45′W13, M 5.16 4.05 9.22 33.59 506 As, Ta, Qr 66.9 92 44◦13′N, 85◦45′W
a Landform codes: O: outwash; I: ice contact; mI: mesic ice contact; pM: poor moraine; iM; intermediate moraine; M: Moraine.b Species codes: Ar: Acer rubrum; As: Acer saccharum; Fg: Fagus grandifolia; Fa: Fraxinus americana; Pb: Pinus banksiana; Ps: Pinus strobus; Pg: Populus grandidentata; Qa:
Q mostp
e and
sQoAbectcssrSoaeas
2
icidfim2≤cAdiomuTwtcn
uercus alba; Qr: Quercus rubra; Qv: Quercus velutina; Ta: Tilia americana. The threeroportion.c Site area used for production calculations under-represented species prevalenc
ince the 1920s. Species composition shifts from dominance of. alba and Quercus velutina on outwash plains through Q. rubran intermediate sites, to A. saccharum on moraines (Table 1).ll sites were within an area of 960 km2 (maximum distanceetween sites of 38.1 km, average distance 15.76 km, maximumlevation change 230 m) and are expected to have very similarlimate. Mapped stands were established, wherever possible, inransects of dimensions 240 m × 41 m. Most sites conformed to thisonfiguration, but topographic variation, roads, or edaphic tran-itions at four sites required non-standard plot dimensions. Twoites (12, 13) were adjacent halves of one standard plot, sepa-ated due to different resource availability and species assemblage.ite (4) differed in shape (two 120 m × 41 m rectangles with endsverlapping at a 63◦ angle) and encompassed a slightly largerrea. Site (8) had a reduced area (40 m × 21 m) for tree diam-ter measurements. Leaf traps (n = 10, 1 m × 1 m) were placedt 20 m intervals along a central transect within every mappedtand.
.2. Productivity measurements
Stems of all mapped trees were measured using diameter tapesn 1999, 2005, and 2007. Growth increment was calculated as thehange in diameter measured at 1.37 m height over the eight-yearnterval from September 1999 to August 2007 for trees ≥10 cmiameter. Stem increment for in-growth was calculated as the dif-erence between measured diameter and the 10-cm threshold. Anntermediate census in 2005 enabled calculation of growth incre-
ent over the 1999–2005 interval for trees that died between005 and 2007. Of 6990 individuals, 57 (0.8%) had diameter growth−1 mm during the eight-year interval, and were included in thealculation of site-level productivity to minimize upward bias ofNPP due to measurement error. Trees that grew after 1999 butied before 2005 or 2007 were included. Trees that died during the
nterval but did not grow, or that lost diameter (due to bark lossr localized wood decomposition), were excluded. Annual woodass increment (ANPPW, Mg ha−1 year−1) (Table 1) was estimated
sing species-specific allometric biomass equations available in
erMikaelian and Korzukhin (1997). Several allometric equationsere available for each species, so where possible we used equa-ions developed for Lake States trees. For F. grandifolia and Tsugaanadensis, which are relatively uncommon at these sites, it wasecessary to use equations developed for New Jersey trees. Equa-
prevalent species are listed in order of abundance; other species occurred in small
was excluded from basal area analysis.
tions developed for West Virginia were applied to Q. alba, and fornorthern Kentucky to Q. velutina.
Leaf litter was collected from the 2006 growing season. All leaveshad fallen at sites dominated by A. saccharum or Q. rubra (sites 3–13)by early November 2006, and were completely collected by 12November 2006. Approximately 10% of leaves remained attachedthrough winter at sites dominated by Q. alba (sites 1 and 2), so leaflitter was collected on 12 November 2006 and again on 2 March2007 for these sites. Collected litter was oven-dried at 70 ◦C for ≥3days before weighing (following Pastor et al., 1984). Litter produc-tion for each site (ANPPL) was calculated as mean leaf mass fromthe 10 litter traps scaled to Mg ha−1 year−1 (Table 1).
2.3. Resource measurements
2.3.1. Soil moistureSoil volumetric water was measured to 30 cm depth by time
domain reflectometry (Environmental Sensors Inc., Sidney, BC).Measurements were made in August 1998, April, May, and Septem-ber 1999, and August and October 2000 at 10 m intervals along a200 m central transect at each site. Given the relatively small num-ber of sampling dates, we used median soil moisture for analysis ateach site in order to avoid potential effects of extreme values thatmight disproportionately influence mean soil moisture. Data for allsites were collected during rainless periods over an interval of notmore than two days per each sampling date.
2.3.2. Soil textureSoil samples were collected in October 2005 at three points
per site (40, 100, and 160m along each central transect), and forthree composite strata (0–50 cm, 50–100 cm, and 100–150 cm).Samples were dried for 24 h at 105 ◦C, sieved (2 mm mesh), and100 g (±0.01 g) subsamples were suspended in 5% sodium hexam-etaphosphate to a final volume of 1 L. Following Gee and Bauder(1986), sedimentation of sand was measured by hydrometer after40 s and of silt after 2 h; clay remained in suspension. Percentagesof sand, silt, and clay were calculated for each sample. We also useda composite sample of the three 100–150 cm samples for each site
to measure the particle size profile. Analysis was conducted witha Mastersizer 2000E laser particle size analyzer (Malvern Instru-ments Ltd., Worcestershire, UK) on chemically dispersed samples.To correct for the consistent underestimation of the clay sized(<2 �m) fraction by these instruments, the clay/silt division sepa-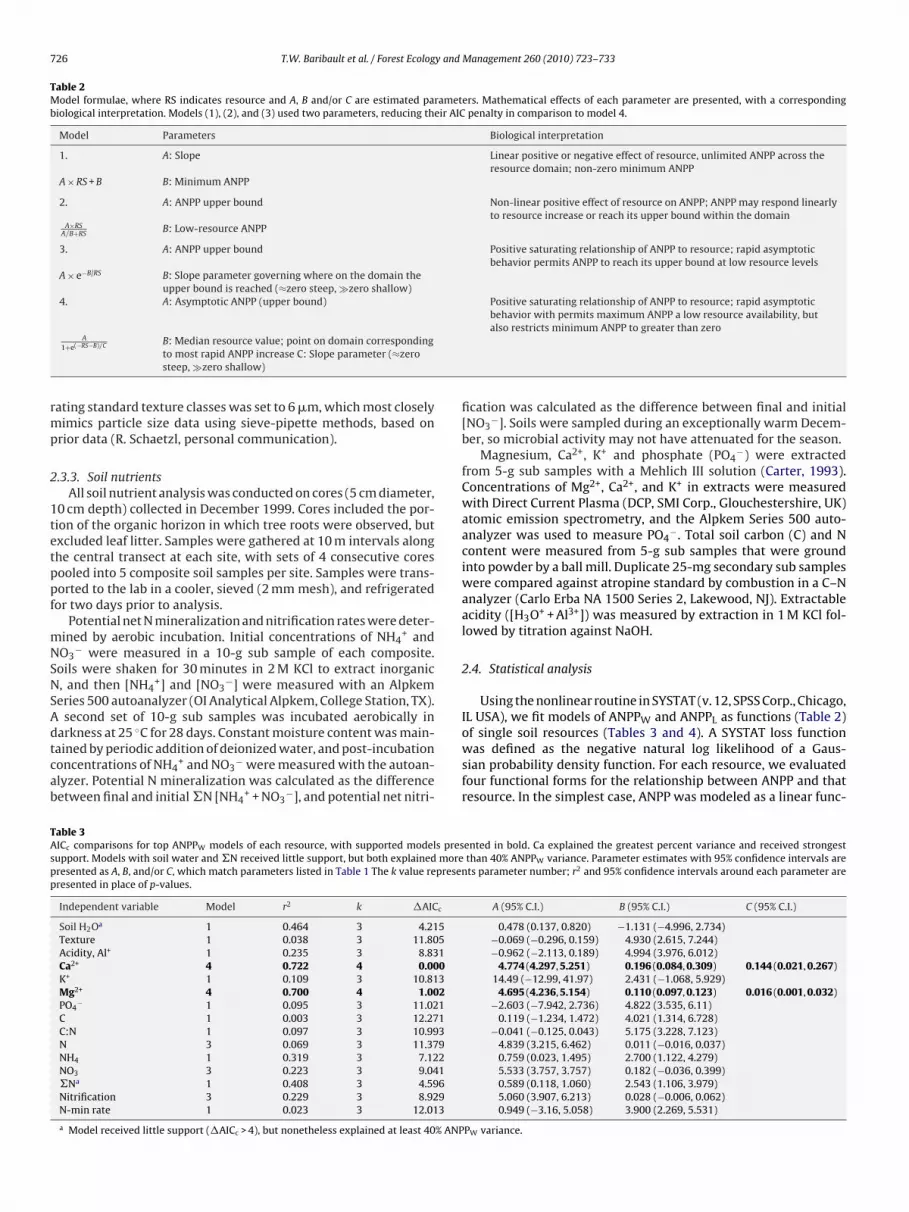
726 T.W. Baribault et al. / Forest Ecology and Management 260 (2010) 723–733
Table 2Model formulae, where RS indicates resource and A, B and/or C are estimated parameters. Mathematical effects of each parameter are presented, with a correspondingbiological interpretation. Models (1), (2), and (3) used two parameters, reducing their AIC penalty in comparison to model 4.
Model Parameters Biological interpretation
1. A: Slope Linear positive or negative effect of resource, unlimited ANPP across theresource domain; non-zero minimum ANPP
A × RS + B B: Minimum ANPP
2. A: ANPP upper bound Non-linear positive effect of resource on ANPP; ANPP may respond linearlyto resource increase or reach its upper bound within the domain
A×RSA/B+RS
B: Low-resource ANPP
3. A: ANPP upper bound Positive saturating relationship of ANPP to resource; rapid asymptoticbehavior permits ANPP to reach its upper bound at low resource levels
A × e−B/RS B: Slope parameter governing where on the domain theupper bound is reached (≈zero steep, zero shallow)
4. A: Asymptotic ANPP (upper bound) Positive saturating relationship of ANPP to resource; rapid asymptoticbehavior with permits maximum ANPP a low resource availability, but
rmp
2
1tetppf
mNSNSAdtcab
TAspp
A
1+e(−RS−B)/C B: Median resource value; point on domain correspondingto most rapid ANPP increase C: Slope parameter (≈zerosteep, zero shallow)
ating standard texture classes was set to 6 �m, which most closelyimics particle size data using sieve-pipette methods, based on
rior data (R. Schaetzl, personal communication).
.3.3. Soil nutrientsAll soil nutrient analysis was conducted on cores (5 cm diameter,
0 cm depth) collected in December 1999. Cores included the por-ion of the organic horizon in which tree roots were observed, butxcluded leaf litter. Samples were gathered at 10 m intervals alonghe central transect at each site, with sets of 4 consecutive coresooled into 5 composite soil samples per site. Samples were trans-orted to the lab in a cooler, sieved (2 mm mesh), and refrigeratedor two days prior to analysis.
Potential net N mineralization and nitrification rates were deter-ined by aerobic incubation. Initial concentrations of NH4
+ andO3
− were measured in a 10-g sub sample of each composite.oils were shaken for 30 minutes in 2 M KCl to extract inorganic, and then [NH4
+] and [NO3−] were measured with an Alpkem
eries 500 autoanalyzer (OI Analytical Alpkem, College Station, TX).second set of 10-g sub samples was incubated aerobically in
arkness at 25 ◦C for 28 days. Constant moisture content was main-ained by periodic addition of deionized water, and post-incubationoncentrations of NH4
+ and NO3− were measured with the autoan-
lyzer. Potential N mineralization was calculated as the differenceetween final and initial �N [NH4
+ + NO3−], and potential net nitri-
able 3ICc comparisons for top ANPPW models of each resource, with supported models presupport. Models with soil water and �N received little support, but both explained moreresented as A, B, and/or C, which match parameters listed in Table 1 The k value represenresented in place of p-values.
Independent variable Model r2 k �AICc
Soil H2Oa 1 0.464 3 4.215Texture 1 0.038 3 11.805Acidity, Al+ 1 0.235 3 8.831Ca2+ 4 0.722 4 0.000K+ 1 0.109 3 10.813Mg2+ 4 0.700 4 1.002PO4
− 1 0.095 3 11.021C 1 0.003 3 12.271C:N 1 0.097 3 10.993N 3 0.069 3 11.379NH4 1 0.319 3 7.122NO3 3 0.223 3 9.041�Na 1 0.408 3 4.596Nitrification 3 0.229 3 8.929N-min rate 1 0.023 3 12.013
a Model received little support (�AICc > 4), but nonetheless explained at least 40% ANP
also restricts minimum ANPP to greater than zero
fication was calculated as the difference between final and initial[NO3
−]. Soils were sampled during an exceptionally warm Decem-ber, so microbial activity may not have attenuated for the season.
Magnesium, Ca2+, K+ and phosphate (PO4−) were extracted
from 5-g sub samples with a Mehlich III solution (Carter, 1993).Concentrations of Mg2+, Ca2+, and K+ in extracts were measuredwith Direct Current Plasma (DCP, SMI Corp., Glouchestershire, UK)atomic emission spectrometry, and the Alpkem Series 500 auto-analyzer was used to measure PO4
−. Total soil carbon (C) and Ncontent were measured from 5-g sub samples that were groundinto powder by a ball mill. Duplicate 25-mg secondary sub sampleswere compared against atropine standard by combustion in a C–Nanalyzer (Carlo Erba NA 1500 Series 2, Lakewood, NJ). Extractableacidity ([H3O+ + Al3+]) was measured by extraction in 1 M KCl fol-lowed by titration against NaOH.
2.4. Statistical analysis
Using the nonlinear routine in SYSTAT (v. 12, SPSS Corp., Chicago,IL USA), we fit models of ANPPW and ANPPL as functions (Table 2)
of single soil resources (Tables 3 and 4). A SYSTAT loss functionwas defined as the negative natural log likelihood of a Gaus-sian probability density function. For each resource, we evaluatedfour functional forms for the relationship between ANPP and thatresource. In the simplest case, ANPP was modeled as a linear func-ented in bold. Ca explained the greatest percent variance and received strongestthan 40% ANPPW variance. Parameter estimates with 95% confidence intervals arets parameter number; r2 and 95% confidence intervals around each parameter are
A (95% C.I.) B (95% C.I.) C (95% C.I.)
0.478 (0.137, 0.820) −1.131 (−4.996, 2.734)−0.069 (−0.296, 0.159) 4.930 (2.615, 7.244)−0.962 (−2.113, 0.189) 4.994 (3.976, 6.012)
4.774 (4.297, 5.251) 0.196 (0.084, 0.309) 0.144 (0.021, 0.267)14.49 (−12.99, 41.97) 2.431 (−1.068, 5.929)
4.695 (4.236, 5.154) 0.110 (0.097, 0.123) 0.016 (0.001, 0.032)−2.603 (−7.942, 2.736) 4.822 (3.535, 6.11)
0.119 (−1.234, 1.472) 4.021 (1.314, 6.728)−0.041 (−0.125, 0.043) 5.175 (3.228, 7.123)
4.839 (3.215, 6.462) 0.011 (−0.016, 0.037)0.759 (0.023, 1.495) 2.700 (1.122, 4.279)5.533 (3.757, 3.757) 0.182 (−0.036, 0.399)0.589 (0.118, 1.060) 2.543 (1.106, 3.979)5.060 (3.907, 6.213) 0.028 (−0.006, 0.062)0.949 (−3.16, 5.058) 3.900 (2.269, 5.531)
PW variance.

T.W. Baribault et al. / Forest Ecology and Management 260 (2010) 723–733 727
Table 4AICc comparisons for top ANPPL models of each resource, with supported models presented in bold. �N was the best predictor of ANPPL, although NO3 was also supported.Ca and nitrification rate received less support, but still explained substantial ANPPL variance. Parameter estimates with 95% confidence intervals are presented as A and/orB, which match parameters listed in Table 1 The k value represents parameter number; r2 and 95% confidence intervals around each parameter are presented in place ofp-values.
Independent Variable Model r2 k �AICc A (95% C.I.) B (95% C.I.)
Soil H2O 1 0.198 3 6.298 0.145 (−0.049, 0.339) 1.746 (−0.449, 3.941)Texture 3 0.044 3 8.772 3.630 (2.769, 4.491) 0.644 (−1.426, 2.714)Acidity, Al+ 1 0.268 3 5.294 −0.477 (−1.001, 0.046) 3.750 (3.287, 4.212)Ca2+a 3 0.422 3 2.222 3.687 (3.366, 4.007) 0.055 (0.010, 0.099)K+ 3 0.234 3 5.894 4.902 (2.709, 7.096) 0.046 (−0.009, 0.101)Mg2+ 3 0.294 3 4.834 3.781 (3.300, 4.262) 0.023 (−0.001, 0.047)PO4
− 3 0.022 3 9.066 3.461 (3.009, 3.914) 0.004 (−0.013, 0.021)C 1 0.024 3 9.036 0.148 (−0.474, 0.770) 3.092 (1.848, 4.337)C:N 1 0.078 3 8.298 −0.017 (−0.057, 0.022) 3.767 (2.853, 4.681)N 1 0.058 3 8.586 2.249 (−3.788, 8.285) 3.160 (2.512, 3.809)NH4 1 0.317 3 4.378 0.352 (0.009, 0.694) 2.663 (1.929, 3.397)NO3 3 0.513 3 1.217 4.278 (3.634, 4.923) 0.162 (0.061, 0.264)�N 1 0.605 3 0.000 0.333 (0.154, 0.512) 2.414 (1.869, 2.960)
NPPL
tidfsaPrfsdmssA(uisdfiradtwotbetvtotr
3
3
ttl
Nitrificationa 3 0.355 3N-min rate 1 0.031 3
a Model received some support (2 < �AICc < 4); may be a significant correlate of A
ion of resource availability (Table 2), assuming that ANPP wouldncrease proportionately with resources across the measuredomain. More complex models, including a Michaelis–Mentenunction, a two-parameter sigmoid function, and a three-parameterigmoid function, represented scenarios in which ANPP could reachn upper bound within the measured resource domain (Table 2).roduction was negatively related to soil acidity and PO4, but theseelationships were so weak that it was unnecessary to test anyurther functional forms (e.g. exponential decay). We also testedeveral paired resources using multiple linear regressions and aouble Michaelis–Menten function (Kobe, 2006). None of theseodels achieved significant parameter estimates, and many pos-
ible resource pairs were not justifiable due to multi-collinearity,o we report no further on these. Models were compared usingkaike’s Information Criteria (AIC) corrected for small sample size
AICc) (Burnham and Anderson, 2002). Models within two AICc
nits of the minimum AICc are considered to have strong empir-cal support. We calculated coefficients of determination (r2) as thequare of the correlation coefficient between observed and pre-icted productivity. To further explain variance in productivity, wet monotonic (linear or Michaelis–Menten) models of every soilesource to the residuals of each best-supported model for ANPPWnd ANPPL. To investigate potential stand history effects on pro-uctivity, we fit linear models of stand age and mortality rate tohe residuals of the three best models. Species composition effectsere explored using linear models comparing production fractions
r basal area by species to ANPP and resource availability. We quan-ified species composition by calculating the basal area contributedy each species, and compared relationships of model residuals toach species’ proportional basal area. Production partitioning pat-erns were characterized in two ways. First, we compared the slopealues of linear models of each partition as a function of total ANPPo measure any change in partitioning with increasing ANPP. Sec-nd, using either log-normal or linear models, we tested whetherhe fraction of total ANPP represented by ANPPW was related to soilesources, species composition, and stand density.
. Results
.1. Summary of productivity and resource availability
ANPP increased nearly twofold from 5.4 Mg ha−1 year−1 athe least productive outwash site to 9.2 Mg ha−1 year−1 athe most productive moraine site (Table 1). Production wasowest at outwash sites and increased through ice-contact
3.662 3.850 (3.367, 4.333) 0.021 (0.002, 0.039)8.944 0.515 (−1.387, 2.416) 3.190 (2.436, 3.945)
.
sites (5.4–7.0 Mg ha−1 year−1), while mesic ice-contact throughmoraines, which constituted a majority of sites, had similarproduction (7.6–9.2 Mg ha−1 year−1) (Table 1). Production of dif-ferent tissues followed similar rankings, with maximum ANPPW(5.3 Mg ha−1 year−1) and ANPPL (4.1 Mg ha−1 year−1) measured onmoraines, whereas minimum ANPPW (2.6 Mg ha−1 year−1) andANPPL (2.8 Mg ha−1 year−1) occurred at the outwash sites (Table 1).Productivity reached its maximum at high fertility, but stem densitypeaked at intermediate fertility (Table 1). Soil resource availabilityincreased along the gradient from outwash through ice-contact,intermediate moraine, and moraine sites, with some covarianceamong a subset of resources (Supplementary data, Appendix D).Notably, base cations were correlated with NO3, NH4, and nitrifica-tion rate, and covariance among the base cations themselves wasextensive (Supplementary data, Appendix D).
3.2. ANPPW increased with availability of base cations, nitrogen,and water in soil
Among all measured resources, extractable Ca was the bestcorrelate of ANPPW (�AICc = 0), and explained much of theobserved ANPPW variance (r2 = 0.72) (Table 3 and Fig. 1a andb). There was a sharp productivity increase associated withCa to 0.45 cmolcharge kg−1, while above that threshold ANPPWapproached an asymptote of 4.8 Mg ha−1 year−1 with some minorscattering around that value (Fig. 1a). ANPPW was also related toMg2+ (�AICc = 1.0, r2 = 0.70), but there was strong covariance of Mgand Ca (Table 3, Supplementary data, Appendix D). Soil moistureand �N were weakly supported as ANPPW correlates (Table 3), butthe positive relationships of ANPPW to soil moisture (Fig. 1c) and N(Fig. 1d) nevertheless suggest a potential role for these resources.Loss of standing mass due to tree mortality increased with ANPPW(r2 = 0.40) if site 4, with atypically high density and mortality ofmature Populus grandidentata (an early succession species), wasexcluded from analysis. No residual variance from any model wasrelated to stand age or measured soil resources.
3.3. ANPPL increased with availability of N in soil
For ANPPL, �N (�AICc = 0, r2 = 0.61) was the best correlate, while
NO3 (�AICc = 1.2, r2 = 0.51) was also a supported correlate (Table 4and Fig. 2a and b). Somewhat weaker support was found for Ca(�AICc = 2.2, r2 = 0.42) and nitrification rate (�AICc = 3.7, r2 = 0.36)(Table 4), but there was considerable scatter in these relationships(Fig. 2c and d). No soil resource was correlated with residuals from
728 T.W. Baribault et al. / Forest Ecology and Management 260 (2010) 723–733
F ted wib PPW mb odel
tr
3
aopscRbnrrsdl
bfpA
ig. 1. ANPPW expressed as functions of soil resources. (a) ANPPW was best correlay dashed lines. (b) Observed ANPPW compared to predicted values from the Ca-ANut these relationships received relatively weak support compared to base-cation m
he �N, NO3, or Ca models, nor was leaf production significantlyelated to stand density, age, or mass lost through mortality.
.4. Species composition and stand density affect productivity
Soil resources (Ca, �N, water) explain up to 72% of ANPPW vari-nce and 61% of ANPPL variance, leaving between 28% and 39%f productivity variance unexplained. Aside from soil resources,erhaps the most striking difference among sites is species compo-ition, so we tested whether species proportional basal areas wereorrelated with residuals from production–resource relationships.esiduals of the ANPPW-Ca model were unrelated to any species’asal area. In contrast, the residuals of the ANPPL-�N model wereegatively related to the basal area of Q. rubra (r2 = 0.54) and Acerubrum (r2 = 0.46). Stem density was positively correlated withesiduals from the ANPPW-Ca model (r2 = 0.29). Post hoc, we mea-ured soil particle size distributions (% fine sand, Supplementaryata, Appendix C), but this measure of soil texture was not corre-
ated with productivity or stand density.
With the goal of maximizing explained variance, we tested com-inations of resource–production models and their residuals asunctions of stand density and species basal areas, where inde-endent variables were not strong co-variates. Residuals of theNPPW-Ca model were related to stand density (r2 = 0.29), and Ca
th Ca, with the best-fit model shown by the solid line and 95% confidence intervalsodel. Considerable ANPPW variance was explained by soil water (c) and by �N (d),
s.
and density together explained 80.3% ANPPW variance. For ANPPL,maximum variance (81.7%) was explained via a combination of the�N model and its residuals as a function of Q. rubra basal area.Species composition itself, but not stand density, was related toavailability of some resources. Relative basal area of A. saccharum(r2 = 0.73) and Tilia americana (r2 = 0.89) were strongly related to Caavailability. Nitrate was related to A. saccharum basal area (r2 = 0.78)but not to any other species; NH4
+ was unrelated to basal area ofany species.
3.5. ANPPW increased disproportionately with total ANPP and soilresources
Wood and leaf production were roughly equal at both outwashsites and at one ice contact site, whereas at maximum total ANPP,ANPPW exceeded ANPPL by 22% (Fig. 3a and Table 1). Both pro-ductivity fractions increased as a function of total ANPP, but theproportion of ANPPW increased faster (r2 = 0.95, slope = 0.71, 95%CI: (0.60, 0.82)) than the proportion of ANPPL (r2 = 0.75, slope = 0.29,
95% CI: (0.18, 0.40)). As a fraction of total ANPP, ANPPW was moststrongly related to Ca (�AICc = 0, r2 = 0.59), was related with somesupport to soil water (�AICc = 2.3, r2 = 0.51), and was weakly relatedto �N (�AICc = 9.4, r2 = 0.02) (Supplementary data, Appendix E).The relationship of ANPPW partition to both Ca and soil water
T.W. Baribault et al. / Forest Ecology and Management 260 (2010) 723–733 729
F d withb ANPPc port.
wv(fittsttrRwtdr
4
mcfb
ig. 2. ANPPL expressed as functions of soil resources. (a) ANPPL was best correlatey dashed lines. (b) Observed ANPPL compared to predicted values from the �N-ompared to the �N-ANPPL model these relationships received relatively little sup
as best described by a log-normal function because the fractionalalue reached a maximum within the observed domain of ANPPFig. 3b and c). In contrast, only a monotonic function could justi-ably characterize the relationship of ANPPW partition to �N, andhe linear model was most parsimonious (Fig. 3d). Productivity par-itioning was negatively related to aggregate relative basal area ofpecies other than Q. rubra (�AICc = 3.3, r2 = 0.39), positively relatedo stand density (�AICc = 3.6, r2 = 0.37), and not significantly relatedo mean tree size, but none of these variables provided a better cor-elation than Ca or soil water (Supplementary data, Appendix E).esources, tree size, and species composition were confounded, soe could not use our data to rigorously evaluate whether produc-
ivity partitioning to leaves versus wood resulted simply from siteifferences in tree size and species composition, or instead fromesource effects.
. Discussion
Extractable Ca correlated with ANPPW better than any othereasured soil resource, supporting our expectation that base
ations should be productivity correlates. Production at low-ertility sites was chiefly responsible for driving the relationshipetween ANPPW and Ca, however, while production at higher-
�N, with the best-fit model shown by the solid line and 95% confidence intervalsL model. Substantial ANPPL variance was explained by Ca (c) and by NO3 (d), but
fertility sites was relatively invariant and unrelated to anymeasured resource. In addition, ANPPW was positively related tosoil moisture and to �N, each accounting for a substantial amountof variance despite receiving weak support. This result was alsoexpected based on evidence in the literature supporting waterand N as production correlates. For ANPPL, �N was a better cor-relate than any other resource, supporting the expectation thatN should be particularly important for leaf production due to itscentral role in photosynthesis. Had we tested only N and not abroad suite of soil resources, we would have found significant rela-tionships between N availability and both components of ANPP,but disregarded a stronger relationship of ANPPW to Ca and areasonably strong relationship of ANPPL to Ca. We achieved ourprimary objective by identifying three soil resources that are themost likely candidates for limiting productivity. Our second objec-tive was partially achieved since we found the expected patternthat ANPPW increased more rapidly than ANPPL as a function ofANPP. This result has important implications for the use of wood
production, or standing biomass, as an approximation for total pro-duction.Overall, our results suggest that it will be important to exper-imentally test whether Ca, N, soil water, or some combination ofresources is responsible for limiting production in these forests.

730 T.W. Baribault et al. / Forest Ecology and Management 260 (2010) 723–733
F P andw reprea
Tssasd0A(iNshoiNg2
4a
nr(
ig. 3. Productivity partitioning to wood and leaves expressed as functions of ANPhile the dash line is the best-fit ANPPL line (triangles). The fraction of total ANPP
nd weakly to �N (d) by a linear relationship.
he lack of resource manipulations in our study, a characteristichared by many studies examining ANPP–soil resource relation-hips (Zak et al., 1989; Reich et al., 1997), precluded distinguishingmong Ca limitation, N, or water limitation, or the possibility ofequential limitation, where Ca limits ANPPW at the four least pro-uctive sites but N or water limit production once a threshold of.5 cmolcharge Ca kg−1 soil has been exceeded. The ANPPW-�N andNPPW-H2O models over-predicted ANPPW at the outwash sites
1 and 2) and one ice-contact site (3) (plots not shown), suggest-ng either that the relationship between production and water or
is strongly non-linear at low resource levels or that other factors,uch as Ca availability, may constrain production. Across sites withigher productivity, ANPPW was roughly constant across an orderf magnitude change in Ca availability (Figs. 1a and 3a), suggest-ng that production at these sites may be controlled by water and, both of which have been identified as correlates of ANPP or treerowth at the same sites by previous studies (Zak et al., 1989; Kobe,006).
.1. ANPPW increased with availability of base cations, nitrogen,nd water in soil
Wood production was best correlated with Ca, with Mg theext-best correlate, while soil water and �N were weak cor-elates (Table 3). Availability of Ca at our lowest-fertility sitesSupplementary data, Appendix B) was comparable to levels at
several soil resources. (a) The solid line is the best-fit ANPPW line (open circles),sented by ANPPW was related to Ca (b) and soil water (c) by log-normal functions,
Hubbard Brook, New Hampshire (0.1 cmolcharge kg−1) (Nezat etal., 2008), where Ca limitation is a concern. However, a directcomparison of production at Hubbard Brook to production atour low-fertility sites was complicated because species assem-blages were entirely different. Calcium could stoichiometricallylimit ANPPW if there were insufficient Ca to incorporate into woodtissues. Direct limitation could also occur if insufficient Ca avail-ability reduced efficiency of photosynthesis, stomatal regulation,phloem transfer of nutrients, or some other physiological processintegral to growth. Although correlative, the strong relationshipbetween ANPPW and Ca would be consistent with direct limita-tion of ANPPW by Ca across the four sites with lowest production.For sites where ANPPW exceeded 4 Mg ha−1 year−1 or where Caexceeded ∼0.5 cmolcharge kg−1, production was essentially unre-lated to Ca. At the higher-productivity sites, it is conceivable thatCa could indirectly influence ANPP through stimulating nitrifica-tion (Hobbie et al., 2007; Page and Mitchell, 2008), but we found noevidence that wood growth at those sites was related to increasedNO3 or �N. In fact, there is minimal variance in site level growth forthese sites, and none of the soil resources we tested were significantcorrelates of production for this subset.
ANPPW was also related to Mg, following a very similar rela-tionship as Ca (i.e., rapid approach to an asymptote). There is littlephysiological justification for stoichiometric limitation of ANPPWby Mg, since wood tissue contains substantially less Mg than Ca(Fujinuma et al., 2005). If Mg availability limits ANPPW, the effect

y and
cti
(caAaadt1
4
rNritpNaa∼rNphrcasb
4
gmfftittW(mptTmp((iit(cti
T.W. Baribault et al. / Forest Ecolog
ould be mediated by photosynthesis, and would be restricted tohe four lowest-productivity sites across which ANPP changes withncreasing Mg.
Higher soil water availability could increase Ca weatheringMcLaughlin, 2009) and promote ANPPW, resulting in a spuriousorrelation between ANPPW and Ca. Sites with relatively low watervailability (3rd and 4th lowest), however, had relatively highNPPW (7th and 3rd highest) (Fig. 1c). We offer the caveat thatt all sites, TDR measurements of soil moisture to 30 cm depth andnalysis of texture to 1.5 m depth (Tables 3 and 4; Supplementaryata, Appendix C) did not account for the possibility of deeper fineextured bands that retain water or nutrients (McFadden et al.,994).
.2. ANPPL increased with availability of nitrogen in soil
Leaf production was best correlated with �N, in agreement withesults from many forest systems (Will et al., 2001; Iversen andorby, 2008; Xia and Wan, 2008). In contrast to the asymptotic
elationship of ANPPW to Ca, the relationship of ANPPL to increas-ng �N was dynamic across the entire environmental gradienthat we sampled (Fig. 2a). If measured during the growing season,ools of available N represent the difference between microbial-mineralization activity and plant N uptake, not total mineral Nvailability. We measured N from soils in December 1999 during antypically warm autumn (air temperature on the sampling day was16 ◦C). Soil microbes were likely still active, so �N probably rep-
esents the full capacity of soil to convert organic matter to mineral. While the data could support direct N limitation of ANPPL, theossibility remains that soil N was a consequence of ANPPL, withigher N availability at sites dominated by species that produceapidly decomposing litter. To determine whether ANPPL was theause or effect of soil N availability would require N fertilizationnd measurement of microbial activity in the field. Species compo-ition and stand development could also influence the relationshipetween ANPPL and soil N.
.3. ANPPW increased disproportionately with total ANPP
The proportion of ANPP represented by ANPPW becomes pro-ressively larger across the gradient (Fig. 3a), with ANPPW varyingore than two-fold across sites whereas ANPPL varied only 1.5-
old. Some studies (e.g. Zak et al., 1989) use ANPPW as a proxyor ANPP, but this substitution would be problematic for sys-ems – like those studied here – in which ANPPL does notncrease in proportion to ANPPW. Greater growth partitioningo wood with increasing ANPP could be influenced by at leasthree factors: resource availability (Wikstrom and Ericsson, 1995;
u et al., 2008), species differences in productivity partitioningTerMikaelian and Korzukhin, 1997; Jenkins et al., 2004), and “allo-
etric effects” (Weiner, 2004) where larger trees partition moreroduction to wood. Partitioning to wood production was relatedo Ca and soil water (Fig. 3b and c), but only weakly to �N (Fig. 3d).he relationships of partitioning to Ca and soil water were notonotonic, but were better supported than correlations between
artitioning and species composition, stand density, or tree sizeSupplementary data, Appendix E). Based on allometric equationsTerMikaelian and Korzukhin, 1997; Jenkins et al., 2004), ANPPWncreases more rapidly with diameter than ANPPL for all speciesn this study; thus, partitioning to wood generally increases with
ree size. Several factors, however, were confounded in our dataand in similar datasets): as nutrient availability increased, speciesomposition changed (Host and Pregitzer, 1992; Kobe, 2006) andrees tended to be larger (Table 1), so we cannot test the relativenfluence of these variables.Management 260 (2010) 723–733 731
4.4. Species composition and stand density were correlated withproductivity
Both species composition and stand density were significantlycorrelated with residuals of production–resource models. Althoughwe identified an effect of Q. rubra relative basal area on ANPPL,this was probably an allometric effect rather than a consequenceof species differences in anatomy or physiology (Meerts, 2002;Freer-Smith and Kennedy, 2003). Sites with greater proportional Q.rubra basal area contained smaller trees (r2 = 0.75 for Q. rubra basalarea versus mean diameter of other species), which produce fewerleaves and total mass than larger trees. Smaller diameters of indi-viduals of other species in the presence of Q. rubra could indicatecompetitive or plant–soil feedback effects (McCarthy-Neumannand Kobe, 2010).
Stand density may also partly explain why all models consis-tently under-predicted productivity at two atypical sites (5 and9) (Figs. 1b and 2b). The high productivity of these sites arosefrom both higher stand densities (20% greater, Table 1) and higherindividual-tree growth rates. The other attribute most obviouslyshared by these two sites was their location at the northwesternedge of our study area, which could be associated with unmeasureddifferences in underlying parent material, establishment history,initial stocking density, or land use prior to secondary forest re-growth.
4.5. Comparison with previous Great Lakes studies
The weak relationships between ANPPW and metrics of N avail-ability differed from previous research conducted at our sites (Zaket al., 1989) and at similar sites in the Great Lakes region (Pastoret al., 1984; Reich et al., 1997). We estimated ANPPW based uponchanges in tree size over a relatively short interval, whereas Zak etal. (1989) estimated ANPPW as the quotient of standing wood massand stand age. With the latter approach, productivity is increasinglyunderestimated with greater stand age because the growth of treesthat die prior to census is discounted (Clark et al., 2001). This under-estimate is more severe at high-productivity sites because masslost to mortality is positively related to ANPP (data not shown). Were-calculated wood production for our dataset as standing woodmass/stand age (ANPPW,A), which substantially underestimatedANPPW (slope = 0.60, r2 = 0.68) across all sites.
Setting aside effects of how ANPP is measured, ANPPW,A wasweakly related to N mineralization rate (r2 = 0.18), which contrastswith the much stronger relationship (r2 = 0.85) in Zak et al. (1989).This incongruous result is not likely related to lab methodologybecause potential N mineralization was estimated in both studiesfrom a single ex situ incubation and resulting site ranks by N min-eralization were identical. In contrast, Zak et al. (1989) regressedmean values of N mineralization and ANPPW,A of nine forest ecosys-tem types, with each mean value calculated from up to nine stands.Using means in the regression reduces site variation within ecosys-tem type (e.g. Zak et al. (1989) reported standard errors up to ±18%for N-min and ±30% for ANPPW within ecosystem type) and couldexplain the discrepancy between studies in the strength of the rela-tionship between N availability and productivity.
5. Conclusions
In this study, Ca, N, and soil moisture were all important cor-
relates of ANPP. Overall, Ca was the best correlate of ANPPW, butthis relationship reached an asymptote at relatively low soil Cacontent. In contrast, ANPPW was related to �N and soil moistureacross the entire domain of both resources, but these resourcesover-predicted ANPPW for low-productivity sites. Most temperate
7 y and
f2ctwccAciea(fCrf2cf1tcsrm
A
wMfaRaptUt
A
t
R
A
A
B
B
B
B
B
B
32 T.W. Baribault et al. / Forest Ecolog
orest ecosystems are thought to be N-limited (Finzi and Canham,000), but we hypothesize that Ca, N, and soil water could jointlyontrol production, with variable importance depending on soilype and species composition. We are more confident that ANPPLas related to N availability, but cannot discern whether this was a
ausative or cyclical relationship. With several resources possiblyontrolling ANPP, and with different potential limiting resources forNPPW versus ANPPL, edaphic conditions and biological responsesould interact counter intuitively. For instance, greater N availabil-ty from atmospheric deposition or fertilizer application shouldlevate production overall by enhancing photosynthesis (Iversennd Norby, 2008). If, however, N deposition causes Ca leachingIzuta et al., 2004), then the greater photosynthetic output expectedrom elevated N availability could fail to increase ANPPW due toa limitation. Alternately, if ANPPW is regulated by soil moistureather than Ca availability, N deposition is unlikely to increaseuture production because most climate models (McMahon et al.,009; Rowell, 2009) predict decreasing soil moisture levels forentral North America. In such situations, ecosystem models thatorecast productivity based on soil N dynamics (e.g. Schimel et al.,996, 1997) would mistakenly predict positive rather than nega-ive ANPP. Overall, our results show that multiple soil resources areorrelated with ANPP, emphasizing that a broad range of resourceshould be tested for their influences on ANPP, and that long-termesource manipulation experiments are still necessary to deter-ine resource limitation in these forest systems.
cknowledgements
We thank the following persons for assistance with field and labork: M. Erickson, J. Bramer, D. Minor, A. Edmonson, B. Bell, and. Petrova. This manuscript was improved by helpful suggestions
rom M. Walters, A. S. Grandy, S. McCarthy-Neumann, E. Holste,nd two anonymous reviewers. We appreciate the expertise of Dr.. Schaetzl (Michigan State University Department of Geography)nd his help with soil texture measurement. The research was sup-orted by the Michigan Agricultural Experiment Station (NRSP-3,he National Atmospheric Deposition Program), the Michigan Stateniversity Rackham Foundation, and the National Science Founda-
ion (DEB 0448058).
ppendix A. Supplementary data
Supplementary data associated with this article can be found, inhe online version, at doi:10.1016/j.foreco.2010.05.029.
eferences
erts, R., Chapin, F.S., 2000. The mineral nutrition of wild plants revisited: a re-evaluation of processes and patterns. Advances in Ecological Research, vol. 30.Academic Press Inc., San Diego, pp. 1–67.
ustin, A.T., Sala, O.E., 2002. Carbon and nitrogen dynamics across a natural precip-itation gradient in Patagonia, Argentina. J. Veg. Sci. 13, 351–360.
ailey, S.W., Horsley, S.B., Long, R.P., Hallett, R.A., 2004. Influence of edaphic factorson sugar maple nutrition and health on the Allegheny Plateau. Soil Sci. Soc. Am.J. 68, 243–252.
erger, T.W., Glatzel, G., 2001. Response of Quercus petraea seedlings to nitrogenfertilization. For. Ecol. Manage. 149, 1–14.
erger, T.W., Swoboda, S., Prohaska, T., Glatzel, G., 2006. The role of calcium uptakefrom deep soils for spruce (Picea abies) and beech (Fagus sylvatica). For. Ecol.Manage. 229, 234–246.
igelow, S.W., Canham, C.D., 2007. Nutrient limitation of juvenile trees in a northernhardwood forest: calcium and nitrate are preeminent. For. Ecol. Manage. 243,310–319.
lum, J.D., Klaue, A., Nezat, C.A., Driscoll, C.T., Johnson, C.E., Siccama, T.G., Eagar, C.,Fahey, T.J., Likens, G.E., 2002. Mycorrhizal weathering of apatite as an importantcalcium source in base-poor forest ecosystems. Nature 417, 729–731.
radbury, I.K., Malcolm, D.C., 1977. Effect of phosphorus and potassium on tran-spiration, leaf diffusive resistance and water-use efficiency in Sitka spruce(Picea-Sitchensis) seedlings. J. Appl. Ecol. 14, 631–641.
Management 260 (2010) 723–733
Brookshire, E.N.J., Valett, H.M., Thomas, S.A., Webster, J.R., 2007. Atmospheric Ndeposition increases organic N loss from temperate forests. Ecosystems 10,252–262.
Brown, P.H., Bellaloui, N., Hu, H.N., Dandekar, A., 1999. Transgenically enhancedsorbitol synthesis facilitates phloem boron transport and increases tolerance oftobacco to boron deficiency. Plant Physiol. 119, 17–20.
Burnham, K.P., Anderson, D.R., 2002. Model Selection and Multimodel Inference: APractical Information—Theoretic Approach. Springer–Verlag, New York.
Carter, M.R., 1993. Soil Sampling and Methods of Analysis. CRC Press, Boca Raton,FL.
Clark, D.A., Brown, S., Kicklighter, D.W., Chambers, J.Q., Thomlinson, J.R., Ni, J., Hol-land, E.A., 2001. Net primary production in tropical forests: an evaluation andsynthesis of existing field data. Ecol. Appl. 11, 371–384.
Comas, L.H., Eissenstat, D.M., 2004. Linking fine root traits to maximum potentialgrowth rate among 11 mature temperate tree species. Funct. Ecol. 18, 388–397.
Covelo, F., Gallardo, A., 2002. Effect of pine harvesting on leaf nutrient dynamics inyoung oak trees at NW Spain. For. Ecol. Manage. 167, 161–172.
Dauer, J.M., Chorover, J., Chadwick, O.A., Oleksyn, J., Tjoelker, M.G., Hobbie, S.E., Reich,P.B., Eissenstat, D.M., 2007. Controls over leaf and litter calcium concentrationsamong temperate trees. Biogeochemistry 86, 175–187.
Dijkstra, F.A., 2003. Calcium mineralization in the forest floor and surface soilbeneath different tree species in the northeastern US. For. Ecol. Manage. 175,185–194.
Ericsson, T., Kahr, M., 1993. Growth and nutrition of birch seedlings in relation topotassium supply rate. Trees-Struct. Funct. 7, 78–85.
Finzi, A.C., 2009. Decades of atmospheric deposition have not resulted in widespreadphosphorus limitation or saturation of tree demand for nitrogen in southernNew England. Biogeochemistry 92, 217–229.
Finzi, A.C., Canham, C.D., 2000. Sapling growth in response to light and nitrogenavailability in a southern New England forest. For. Ecol. Manage. 131, 153–165.
Fluckiger, W., Braun, S., 1998. Nitrogen deposition in Swiss forests and its possiblerelevance for leaf nutrient status, parasite attacks and soil acidification. Environ.Pollut. 102, 69–76.
Freer-Smith, P.H., Kennedy, F., 2003. Base cation removal in harvesting and biologicallimit terms for use in the simple mass balance equation to calculate critical loadsfor forest soils. Water Air Soil Pollut. 145, 409–427.
Fujinuma, R., Bockheim, J., Balster, N., 2005. Base-cation cycling by individual treespecies in old-growth forests of Upper Michigan, USA. Biogeochemistry 74,357–376.
Gee, G.W., Bauder, J.W., 1986. Particle-size analysis. In: Klute, A. (Ed.), Methods ofSoil Analysis. Agronomy Monographs. American Society of Agronomy and SoilScience Society of America, Madison, WI, pp. 383–411.
Giesler, R., Hogberg, M., Hogberg, P., 1998. Soil chemistry and plants in Fennoscan-dian boreal forest as exemplified by a local gradient. Ecology 79, 119–137.
Goodale, C.L., Aber, J.D., 2001. The long-term effects of land-use history on nitrogencycling in northern hardwood forests. Ecol. Appl. 11, 253–267.
Gradowski, T., Thomas, S.C., 2008. Responses of Acer saccharum canopy trees andsaplings to P, K and lime additions under high N deposition. Tree Physiol. 28,173–185.
Hall, S.A., Burke, I.C., Hobbs, N.T., 2006. Litter and dead wood dynamics in ponderosapine forests along a 160-year chronosequence. Ecol. Appl. 16, 2344–2355.
Hallett, R.A., Hornbeck, J.W., 1997. Foliar and soil nutrient relationships in red oakand white pine forests. Can. J. For. Res. Rev. Can. Rech. For. 27, 1233–1244.
Hobbie, S.E., 1996. Temperature and plant species control over litter decompositionin Alaskan tundra. Ecol. Monogr. 66, 503–522.
Hobbie, S.E., Ogdahl, M., Chorover, J., Chadwick, O.A., Oleksyn, J., Zytkowiak, R., Reich,P.B., 2007. Tree species effects on soil organic matter dynamics: the role of soilcation composition. Ecosystems 10, 999–1018.
Hodson, M.J., Sangster, A.G., 1998. Mineral deposition in the needles of white spruce[Picea glauca (Moench.) Voss]. Ann. Bot. 82, 375–385.
Hogberg, P., Fan, H.B., Quist, M., Binkley, D., Tamm, C.O., 2006. Tree growth and soilacidification in response to 30 years of experimental nitrogen loading on borealforest. Glob. Change Biol. 12, 489–499.
Holzmueller, E.J., Jose, S., Jenkins, M.A., 2007. Relationship between Cornus florida L.and calcium mineralization in two southern Appalachian forest types. For. Ecol.Manage. 245, 110–117.
Host, G.E., Pregitzer, K.S., 1992. Geomorphic influences on ground-flora and over-story composition in upland forests of northwestern lower Michigan. Can. J. For.Res. Rev. Can. Rech. For. 22, 1547–1555.
Host, G.E., Pregitzer, K.S., Ramm, C.W., Lusch, D.P., Cleland, D.T., 1988. Variation inoverstory biomass among glacial landforms and ecological land units in north-western lower Michigan. Can. J. For. Res. Rev. Can. Rech. For. 18, 659–668.
Idol, T.W., Pope, P.E., Ponder, F., 2003. N mineralization, nitrification, and N uptakeacross a 100-year chronosequence of upland hardwood forests. For. Ecol. Man-age. 176, 509–518.
Iversen, C.M., Norby, R.J., 2008. Nitrogen limitation in a sweetgum plantation: impli-cations for carbon allocation and storage. Can. J. For. Res. Rev. Can. Rech. For. 38,1021–1032.
Izuta, T., Yamaoka, T., Nakaji, T., Yonekura, T., Yokoyama, M., Funada, R., Koike, T.,Totsuka, T., 2004. Growth, net photosynthesis and leaf nutrient status of Fagus
crenata seedlings grown in brown forest soil acidified with H2SO4 or HNO3solution. Trees Struct. Funct. 18, 677–685.Jenkins, J.C., Chojnacky, D.C., Heath, L.S., Birdsey, R.A., 2004. Comprehensive
Database of Diameter-based Biomass Regressions for North American TreeSpecies. United States Department of Agriculture, Forest Service, NortheasternResearch Station, pp. 1–48.

y and
J
J
J
K
K
K
K
K
K
K
L
M
M
M
M
M
M
M
M
M
N
N
P
P
P
P
P
R
R
T.W. Baribault et al. / Forest Ecolog
ohnson, D.W., 2006. Progressive N limitation in forests: review and implications forlong-term responses to elevated CO2. Ecology 87, 64–75.
oshi, A.B., Vann, D.R., Johnson, A.H., Miller, E.K., 2003. Nitrogen availability and forestproductivity along a climosequence on Whiteface Mountain, New York. Can. J.For. Res. Rev. Can. Rech. For. 33, 1880–1891.
uice, S.M., Fahey, T.J., Siccama, T.G., Driscoll, C.T., Denny, E.G., Eagar, C., Cleavitt,N.L., Minocha, R., Richardson, A.D., 2006. Response of sugar maple to calciumaddition to northern hardwood forest. Ecology 87, 1267–1280.
nox, R.G., Harcombe, P.A., Elsik, I.S., 1995. Contrasting patterns of resource limita-tion in tree seedlings across a gradient in soil texture. Can. J. For. Res. Rev. Can.Rech. For. 25, 1583–1594.
obe, R.K., 2006. Sapling growth as a function of light and landscape-level variationin soil water and foliar nitrogen in northern Michigan. Oecologia 147, 119–133.
obe, R.K., Likens, G.E., Eagar, C., 2002. Tree seedling growth and mortality responsesto manipulations of calcium and aluminum in a northern hardwood forest. Can.J. For. Res. Rev. Can. Rech. For. 32, 954–966.
obe, R.K., Lepczyk, C.A., Iyer, M., 2005. Resorption efficiency decreases with increas-ing green leaf nutrients in a global data set. Ecology 86, 2780–2792.
obe, R.K., Iyer, M., Walters, M.B., 2010. Optimal partitioning theory revisited: non-structural carbohydrates dominate root mass responses to nitrogen. Ecology 91,166–179.
ulmatiski, A., Vogt, K.A., Vogt, D.J., Wargo, P.M., Tilley, J.P., Siccama, T.G., Sigurdard-ottir, R., Ludwig, D., 2007. Nitrogen and calcium additions increase forest growthin northeastern USA spruce-fir forests. Can. J. For. Res. Rev. Can. Rech. For. 37,1574–1585.
unkle, J.M., Walters, M.B., Kobe, R.K., 2009. Senescence-related changes in nitrogenin fine roots: mass loss affects estimation. Tree Physiol. 29, 715–723.
ong, R.P., Horsley, S.B., Lilja, P.R., 1997. Impact of forest liming on growth and crownvigor of sugar maple and associated hardwoods. Can. J. For. Res. Rev. Can. Rech.For. 27, 1560–1573.
ayer, P.M., 2008. Ecosystem and decomposer effects on litter dynamics along an oldfield to old-growth forest successnional gradient. Acta Oecologica-InternationalJournal of Ecology 33, 222–230.
cCarthy-Neumann, S., Kobe, R.K., 2010. Conspecific and heterospecific plant–soilfeedbacks influence survivorship and growth of temperate tree seedlings. J. Ecol.98, 408–418.
cFadden, J.P., Macdonald, N.W., Witter, J.A., Zak, D.R., 1994. Fine-textured soilbands and oak forest productivity in northwestern lower Michigan, USA. Can. J.For. Res. Rev. Can. Rech. For. 24, 928–933.
cLaughlin, J., 2009. Boreal mixed-wood watershed riparian zone cation cyclingduring two contrasting climatic years. Soil Sci. Soc. Am. J. 73, 1408–1418.
cLaughlin, S.B., Wimmer, R., 1999. Tansley Review No. 104—calcium physiologyand terrestrial ecosystem processes. New Phytol. 142, 373–417.
cMahon, S.M., Dietze, M.C., Hersh, M.H., Moran, E.V., Clark, J.S., 2009. A predictiveframework to understand forest responses to global change. In: Year in Ecologyand Conservation Biology 2009. Blackwell Publishing, Oxford, pp. 221–236.
eerts, P., 2002. Mineral nutrient concentrations in sapwood and heartwood: aliterature review. Ann. For. Sci. 59, 713–722.
igita, C., Chiba, Y., Tange, T., 2007. Seasonal and spatial variations in leaf nitrogencontent and resorption in a Quercus serrata canopy. Tree Physiol. 27, 63–70.
ohan, J.E., Clark, J.S., Schlesinger, W.H., 2007. Long-term CO2 enrichment of a forestecosystem: implications for forest regeneration and succession. Ecol. Appl. 17,1198–1212.
ezat, C.A., Blum, J.D., Yanai, R.D., Park, B.B., 2008. Mineral sources of calcium andphosphorus in soils of the Northeastern United States. Soil Sci. Soc. Am. J. 72,1786–1794.
owak, C.A., Downard, R.B., White, E.H., 1991. Potassium trends in red pine planta-tions at Pack-Forest, New-York. Soil Sci. Soc. Am. J. 55, 847–850.
age, B.D., Mitchell, M.J., 2008. Influences of a calcium gradient on soil inorganicnitrogen in the Adirondack Mountains, New York. Ecol. Appl. 18, 1604–1614.
ark, B.B., Yanai, R.D., Fahey, T.J., Bailey, S.W., Siccama, T.G., Shanley, J.B., Cleavitt,N.L., 2008. Fine root dynamics and forest production across a calcium gradientin northern hardwood and conifer ecosystems. Ecosystems 11, 325–341.
astor, J., Aber, J.D., McClaugherty, C.A., Melillo, J.M., 1984. Above-ground productionand N and P cycling along a nitrogen mineralization gradient on BlackhawkIsland, Wisconsin. Ecology 65, 256–268.
eichl, M., Arain, M.A., 2007. Allometry and partitioning of above- and belowgroundtree biomass in an age-sequence of white pine forests. For. Ecol. Manage. 253,68–80.
erakis, S., Maguire, D., Bullen, T., Cromack, K., Waring, R., Boyle, J., 2006. Couplednitrogen and calcium cycles in forests of the Oregon Coast Range. Ecosystems 9,63–74.
eich, P.B., Grigal, D.F., Aber, J.D., Gower, S.T., 1997. Nitrogen mineralization andproductivity in 50 hardwood and conifer stands on diverse soils. Ecology 78,335–347.
osberg, I., Frank, J., Stuanes, A.O., 2006. Effects of liming and fertilization on treegrowth and nutrient cycling in a Scots pine ecosystem in Norway. For. Ecol.Manage. 237, 191–207.
Management 260 (2010) 723–733 733
Rowell, D.P., 2009. Projected midlatitude continental summer drying: North Amer-ica versus Europe. J. Clim. 22, 2813–2833.
Schaberg, P.G., Tilley, J.W., Hawley, G.J., DeHayes, D.H., Bailey, S.W., 2006. Associa-tions of calcium and aluminum with the growth and health of sugar maple treesin Vermont. For. Ecol. Manage. 223, 159–169.
Schimel, D.S., Braswell, B.H., McKeown, R., Ojima, D.S., Parton, W.J., Pulliam, W., 1996.Climate and nitrogen controls on the geography and timescales of terrestrialbiogeochemical cycling. Glob. Biogeochem. Cycle 10, 677–692.
Schimel, D.S., Emanuel, W., Rizzo, B., Smith, T., Woodward, F.I., Fisher, H., Kittel,T.G.F., McKeown, R., Painter, T., Rosenbloom, N., Ojima, D.S., Parton, W.J., Kick-lighter, D.W., McGuire, A.D., Melillo, J.M., Pan, Y., Haxeltine, A., Prentice, C.,Sitch, S., Hibbard, K., Nemani, R., Pierce, L., Running, S., Borchers, J., Chaney,J., Neilson, R., Braswell, B.H., 1997. Continental scale variability in ecosys-tem processes: models, data, and the role of disturbance. Ecol. Monogr. 67,251–271.
Singh, A., Agrawal, M., 2008. Acid rain and its ecological consequences. J. Env. Biol.29, 15–24.
Sparks, J.P., Walker, J., Turnipseed, A., Guenther, A., 2008. Dry nitrogen depositionestimates over a forest experiencing free air CO2 enrichment. Glob. Change Biol.14, 768–781.
St Clair, S.B., Lynch, J.P., 2005. Base cation stimulation of mycorrhization and photo-synthesis of sugar maple on acid soils are coupled by foliar nutrient dynamics.New Phytol. 165, 581–590.
St Clair, S.B., Sharpe, W.E., Lynch, J.P., 2008. Key interactions between nutrient lim-itation and climatic factors in temperate forests: a synthesis of the sugar mapleliterature. Can. J. For. Res. Rev. Can. Rech. For. 38, 401–414.
Sternberg, M., Shoshany, M., 2001. Aboveground biomass allocation and water con-tent relationships in Mediterranean trees and shrubs in two climatologicalregions in Israel. Plant Ecol. 157, 171–179.
Stevens, P.A., Harrison, A.F., Jones, H.E., Williams, T.G., Hughes, S., 1993. Nitrate leach-ing from a Sitka spruce plantation and the effect of fertilization with phosphorusand potassium. For. Ecol. Manage. 58, 233–247.
Sverdrup, H., Thelin, G., Robles, M., Stjernquist, I., Sorensen, J., 2006. Assesingnutrient sustainability of forest production for different tree species consid-ering Ca, Mg, K, N and P at Bjornstorp Estate, Sweden. Biogeochemistry 81,219–238.
TerMikaelian, M.T., Korzukhin, M.D., 1997. Biomass equations for sixty-five NorthAmerican tree species. For. Ecol. Manage. 97, 1–24.
Triboulot, M.B., Pritchard, J., Levy, G., 1997. Effects of potassium deficiency oncell water relations and elongation of tap and lateral roots of maritime pineseedlings. New Phytol. 135, 183–190.
Vanninen, P., Makela, A., 2000. Needle and stem wood production in Scots pine(Pinus sylvestris) trees of different age, size and competitive status. Tree Physiol.20, 527–533.
Vesterdal, L., Schmidt, I.K., Callesen, I., Nilsson, L.O., Gundersen, P., 2008. Carbonand nitrogen in forest floor and mineral soil under six common European treespecies. For. Ecol. Manage. 255, 35–48.
Vizcayno-Soto, G., Cote, B., 2004. Boundary-line approach to determine standardsof nutrition for mature trees from spatial variation of growth and foliar nutri-ent concentrations in natural environments. Commun. Soil Sci. Plant Anal. 35,2965–2985.
Vogel, J.G., Bond-Lamberty, B.P., Schuur, E.A.G., Gower, S.T., Mack, M.C., O’Connell,K.E.B., Valentine, D.W., Ruess, R.W., 2008. Carbon allocation in boreal blackspruce forests across regions varying in soil temperature and precipitation. Glob.Change Biol. 14, 1503–1516.
Watmough, S.A., 2008. Element mobility and partitioning along a soil acidity gradi-ent in central Ontario forests, Canada. Environ. Geochem. Health 30, 431–444.
Weiner, J., 2004. Allocation, plasticity and allometry in plants. Perspect. Plant Ecol.Evol. Syst. 6, 207–215.
Wikstrom, F., Ericsson, T., 1995. Allocation of mass in trees subject to nitrogen andmagnesium limitation. Tree Physiol. 15, 339–344.
Will, R.E., Barron, G.A., Burkes, E.C., Shiver, B., Teskey, R.O., 2001. Relationshipbetween intercepted radiation, net photosynthesis, respiration, and rate of stemvolume growth of Pinus taeda and Pinus elliottii stands of different densities. For.Ecol. Manage. 154, 155–163.
Wilmot, T.R., Ellsworth, D.S., Tyree, M.T., 1996. Base cation fertilization and lim-ing effects on nutrition and growth of Vermont sugar maple stands. For. Ecol.Manage. 84, 123–134.
Wu, F.Z., Bao, W.K., Li, F.L., Wu, N., 2008. Effects of drought stress and N supply onthe growth, biomass partitioning and water-use efficiency of Sophora davidiiseedlings. Environ. Exp. Bot. 63, 248–255.
Xia, J.Y., Wan, S.Q., 2008. Global response patterns of terrestrial plant species to
nitrogen addition. New Phytol. 179, 428–439.Ylimartimo, A., 1990. The effect of nitrogen and potassium availability on scleroder-ris canker of Scots pine-seedlings. Water Air Soil Pollut. 54, 307–313.
Zak, D.R., Host, G.E., Pregitzer, K.S., 1989. Regional variability in nitrogen mineral-ization, nitrification, and overstory biomass in northern lower Michigan. Can. J.For. Res. Rev. Can. Rech. For. 19, 1521–1526.