Embed Size (px)
Citation preview
/.s,sN 0852-257X
Jurnal
TANAH TROPIKA(Journal of Tropicol Soils)
Volume 18, No. 2 May 2013
JURNALTANAH TROPIKA
,\
Accredited by Indonesian DGHE No. 51/DIKTI/KEP/2010
JurnslTANAHTROPIKA(lournal of Tropical Soils)
ISSN 0g52-257X, established in 1995, accredited by Indonesian Directorate General of Higher Education (DGHE) since
lggS,lasraccrediredNo.5l/DIKTI/KEP/2010, 5 July20l0, validuntil5 July20l3.
GrantedforlnternationalizationProgramofScientificJournalbyDGHE No.0l7/SP.SIP/DP2M/2010'
Jurnal TANAH TROPIKA (Journal of Tropicalsoils) published three times a year (January' May and September),
covers wide range of research article in which using tropical soils. Review article does not allow except it was invited
by editor.
All contributors should be subscribed this joumal at least one year. The cost for subscriber journal per year (3 issues)
i, n p r iO.Ooo for individual (Indonesian) "na
zo USO for Overseas, and Rp200-000 for Indonesian institution or library
and 25 USD forOverseas. The cost ofshipping and handling for each issue is Rp25.000 for Indonesian and 5 USD for
overseas. All cost can transfer to Bank Account of Sri iusnaini, Rekening BNI Cabang Pembantu Universitas
Lampung number 021 I 120716.
Chief Editor: DenniYati Managing Editor: Ainin Niswati
Editorial Boards
AbdulKadirSalam(SoilChemistry-TheUniversityofLampung)
Dedi Nursyamsi(Soil Chemistry - Indonesian SwamplandAgricultural Researsch Institute, Banjarbaru)
SriDjuniwati(SoilFertility-BogorAgriculturalUniversity.Bogor)
Soni lsnaini (Soil Fertility - DARMAWACANA Metro)
Erry Purnomo (Soil Fertility - Lambung Mangkurat University' BanjarbarLt)
Eko Hanuddin (Soil chemistry and Mineralogy - Gadjah Mada University' Yogiakarta)
Iin Purwati Handayani (Soil Biology and Microbiology - Murray State University' USA)
Nobihiro Kaneko (Soil Ecology - Yokohama National University. Japan)
Irwan Sukri Banuwa (Soil Conservation and Environmental Sciences - The University olLampung)
Afandi (Soil Physics - The University of Lampung)
Priyono Prawito (Soil Genesis and Classification - The Universiry of Bengkulu' Bengkulu)
Tamaludin Syam (Land Evaluation and Development - l'he University of Lampting)
Treasure: Sri Yusnaini Technical Editors: Astrid Novia DiningrumSuPono
Publisher
Department of Soil Science Faculty ofAgriculture, the Univcrsity of Lamptrng and lndrrnc*l'rn Sircret!
for Soil Science (ISSS) Region Cotntrtissariat Lampung
Website: http ://joumal.unila.ac-idi indcx-php/tropicalsoi I
141J Trop Soils, Vol. 18, No. 2, 2013: 141-148
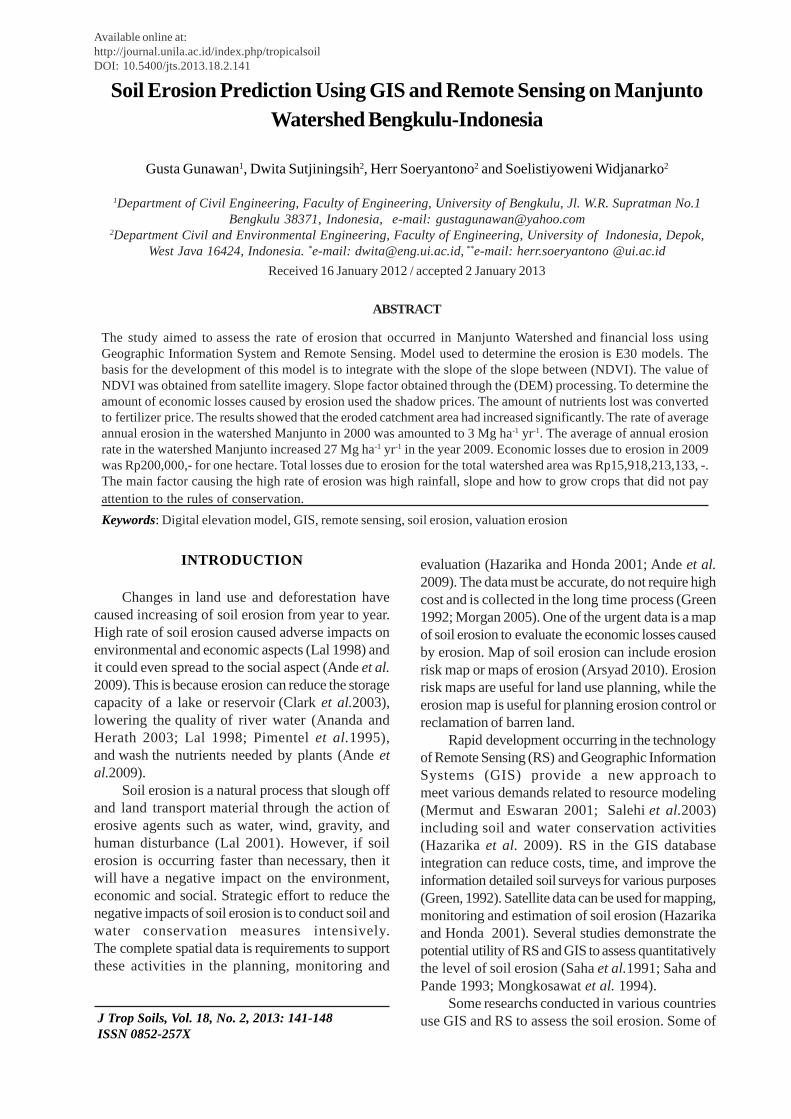
Soil Erosion Prediction Using GIS and Remote Sensing on ManjuntoWatershed Bengkulu-Indonesia
Gusta Gunawan1, Dwita Sutjiningsih2, Herr Soeryantono2 and Soelistiyoweni Widjanarko2
1Department of Civil Engineering, Faculty of Engineering, University of Bengkulu, Jl. W.R. Supratman No.1Bengkulu 38371, Indonesia, e-mail: [email protected]
2Department Civil and Environmental Engineering, Faculty of Engineering, University of Indonesia, Depok,West Java 16424, Indonesia. *e-mail: [email protected], ** e-mail: herr.soeryantono @ui.ac.id
Received 16 January 2012 / accepted 2 January 2013
ABSTRACT
The study aimed to assess the rate of erosion that occurred in Manjunto Watershed and financial loss usingGeographic Information System and Remote Sensing. Model used to determine the erosion is E30 models. Thebasis for the development of this model is to integrate with the slope of the slope between (NDVI). The value ofNDVI was obtained from satellite imagery. Slope factor obtained through the (DEM) processing. To determine theamount of economic losses caused by erosion used the shadow prices. The amount of nutrients lost was convertedto fertilizer price. The results showed that the eroded catchment area had increased significantly. The rate of averageannual erosion in the watershed Manjunto in 2000 was amounted to 3 Mg ha-1 yr-1. The average of annual erosionrate in the watershed Manjunto increased 27 Mg ha-1 yr-1 in the year 2009. Economic losses due to erosion in 2009was Rp200,000,- for one hectare. Total losses due to erosion for the total watershed area was Rp15,918,213,133, -.The main factor causing the high rate of erosion was high rainfall, slope and how to grow crops that did not payattention to the rules of conservation.
J Trop Soils, Vol. 18, No. 2, 2013: 141-148 ISSN 0852-257X
INTRODUCTION
Available online at:http://journal.unila.ac.id/index.php/tropicalsoilDOI: 10.5400/jts.2013.18.2.141
Keywords: Digital elevation model, GIS, remote sensing, soil erosion, valuation erosion
Changes in land use and deforestation havecaused increasing of soil erosion from year to year.High rate of soil erosion caused adverse impacts onenvironmental and economic aspects (Lal 1998) andit could even spread to the social aspect (Ande et al.2009). This is because erosion can reduce the storagecapacity of a lake or reservoir (Clark et al.2003),lowering the quality of river water (Ananda andHerath 2003; Lal 1998; Pimentel et al.1995),and wash the nutrients needed by plants (Ande etal.2009).
Soil erosion is a natural process that slough offand land transport material through the action oferosive agents such as water, wind, gravity, andhuman disturbance (Lal 2001). However, if soilerosion is occurring faster than necessary, then itwill have a negative impact on the environment,economic and social. Strategic effort to reduce thenegative impacts of soil erosion is to conduct soil andwater conservation measures intensively.The complete spatial data is requirements to supportthese activities in the planning, monitoring and
evaluation (Hazarika and Honda 2001; Ande et al.2009). The data must be accurate, do not require highcost and is collected in the long time process (Green1992; Morgan 2005). One of the urgent data is a mapof soil erosion to evaluate the economic losses causedby erosion. Map of soil erosion can include erosionrisk map or maps of erosion (Arsyad 2010). Erosionrisk maps are useful for land use planning, while theerosion map is useful for planning erosion control orreclamation of barren land.
Rapid development occurring in the technologyof Remote Sensing (RS) and Geographic InformationSystems (GIS) provide a new approach tomeet various demands related to resource modeling(Mermut and Eswaran 2001; Salehi et al.2003)including soil and water conservation activities(Hazarika et al. 2009). RS in the GIS databaseintegration can reduce costs, time, and improve theinformation detailed soil surveys for various purposes(Green, 1992). Satellite data can be used for mapping,monitoring and estimation of soil erosion (Hazarikaand Honda 2001). Several studies demonstrate thepotential utility of RS and GIS to assess quantitativelythe level of soil erosion (Saha et al.1991; Saha andPande 1993; Mongkosawat et al. 1994).
Some researchs conducted in various countriesuse GIS and RS to assess the soil erosion. Some of
142 G Gunawan et al.: Soil Erosion Prediction Using GIS
the researchers who conducted the studyon erosion in other countries is Hazarika and Honda(2001), mapping the threat of soil erosion in thecatchment area of Northern Thailand Ao Mae. Andeet al.(2009) using the approach to estimating erosionMorgan and Finney model (MMF) in SouthwesternNigeria. Kefi and Yoshino (2010) assessed the riskof erosion on agricultural productivity using RUSLE,remote sensing and GIS in a catchment area inTunisia.
However, erosion mapping using GIS and RSin Indonesia have not been conducted intensively(Arsyad 2010), especially in areas outside Java.Arsyad stated (2010) , that the only result of soilerosion map, published was the mapping performedby Dames (1955) using traditional methods in theriver flow strip (DAS) of Central Java. In Indonesia,application of GIS to evaluate land degradation firstwas performed by Lanya (1996). Rateof erosion has done by identifying morphologicalchanges in the soil in situ.
The purpose of this research was to evaluatethe risk of erosion occurring in the watershed areaManjunto-Bengkulu and its economic losses by usingGIS and Remote Sensing. The basis of this modelselection is an area of research that is still dominatedby forests and to evaluate the erosiontraditionally will take a long time and high costs(Hazarika and Honda 2001; Kefi and Yoshino 2010).
MATERIALS AND METHODS
Study Site
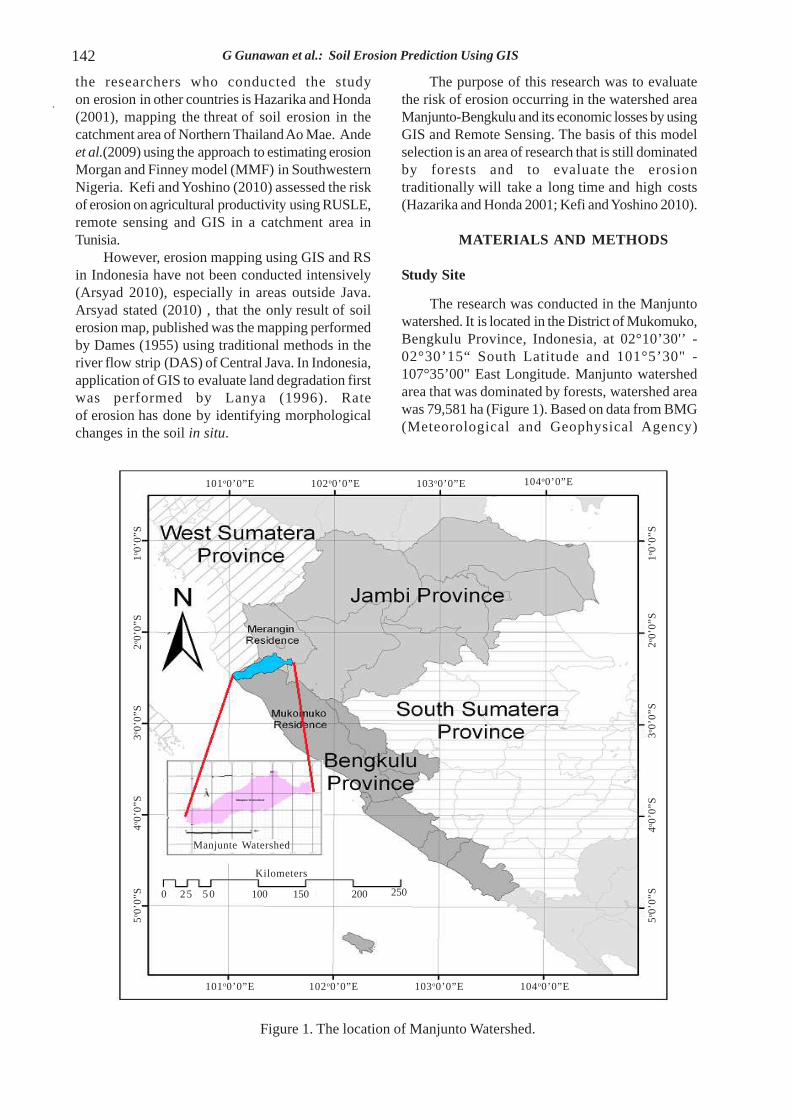
The research was conducted in the Manjuntowatershed. It is located in the District of Mukomuko,Bengkulu Province, Indonesia, at 02°10’30'’ -02°30’15“ South Latitude and 101°5’30" -107°35’00" East Longitude. Manjunto watershedarea that was dominated by forests, watershed areawas 79,581 ha (Figure 1). Based on data from BMG(Meteorological and Geophysical Agency)
Figure 1. The location of Manjunto Watershed.
123456781234567812345678101o0’0”E
123456789123456789123456789
123456781234567812345678102o0’0”E
123456789123456789123456789103o0’0”E 104o0’0”E
1231231231231231231231o 0
’0”S
123123123123123123
123123123123123
123123123123123123123
123123123123123123123
2o 0’0
”S3o 0
’0”S
4o 0’0
”S5o 0
’0”S
12341234123412341234123412341o 0
’0”S
123412341234123412341234123412341234
12341234123412341234123412341234
12341234123412341234123412341234
123412341234123412341234123412341234
2o 0’0
”S3o 0
’0”S
4o 0’0
”S5o 0
’0”S
123456789123456789123456789123456789
1234567890123456789012345678901234567890
123456789123456789123456789123456789
123456789123456789123456789123456789101o0’0”E 102o0’0”E 103o0’0”E 104o0’0”E
123123123123
12345123451234512345
123451234512345123450 25
123456123456123456123456
123456123456123456123456
1234567123456712345671234567
123456712345671234567123456750 100 150 200 250
123456789012312345678901231234567890123Kilometers
12345678901234567890123456789012345678901234567890123456789012345678901234567890Manjunte Watershed
143J Trop Soils, Vol. 18, No. 2, 2013: 141-148
Mukomuko district of Bengkulu province, theaverage rainfall of the study region was 3,329.70mm yr-1 and average annual temperature was23.0 oC. Based on Soil Survey Staff (1998) the mostdominant soil type in research site are Endoaquepts,Udifluvents, and Eutrudepts.
Preparation of Soil Map
Preparation of Soil Map was based on map ofland units and land sheet of Sungai Penuh (0813)Sumatra 1:250.000 Scale. Classification of Each soilmapping unit was classified according to the spreadof the predominant soil types in quantitative and wasgrouped into different classes or soil mapping unit.
Slope Principles maps were made bycalculating the slope based on the transformation ofthe difference between the elevation from west toeast through the process of reduction(derivation) partially with respect to the x axis (mapdx) and the difference between the elevation fromnorth to the south which is a partial decrease in they-axis (the map dy). Data contour linesand elevation points were taken from the DEM(digital elevation model). DEM used as the inputDEM Bengkulu area with 30 m resolution ASTERGDEM was downloaded from version 2. After theinterpolation process and change the vector data toraster processed with the help of Arc Gis 9.3, then
Watershed Boundary
Reference image
Rectification
Corrected image
DEM The image will process
Field survey
Land Cover Map Land Identification
Overlay + Croping
Research Site
Land cover classification
the slope class was into performed different classesas follows: 0-8% (flat), 8-15% (wavy), 15-25%(hilly), 25-45% (mountainous) and > 45% (steep).
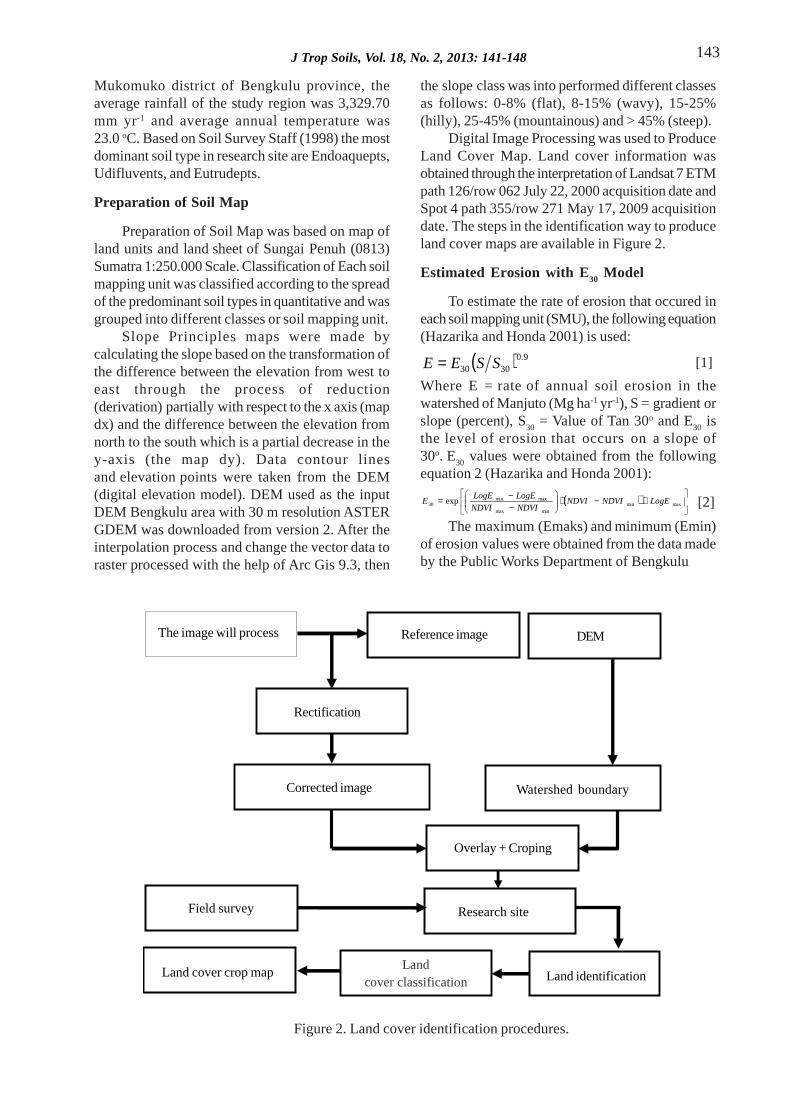
Digital Image Processing was used to ProduceLand Cover Map. Land cover information wasobtained through the interpretation of Landsat 7 ETMpath 126/row 062 July 22, 2000 acquisition date andSpot 4 path 355/row 271 May 17, 2009 acquisitiondate. The steps in the identification way to produceland cover maps are available in Figure 2.
Estimated Erosion with E30 Model
To estimate the rate of erosion that occured ineach soil mapping unit (SMU), the following equation(Hazarika and Honda 2001) is used:
( ) 9.03030 SSEE = [1]
Where E = rate of annual soil erosion in thewatershed of Manjuto (Mg ha-1 yr-1), S = gradient orslope (percent), S
30 = Value of Tan 30o and E
30 is
the level of erosion that occurs on a slope of30o. E
30 values were obtained from the following
equation 2 (Hazarika and Honda 2001):
( )
+−⋅
−−= maxmin
minmax
maxmin30 exp LogENDVINDVI
NDVINDVI
LogELogEE [2]
The maximum (Emaks) and minimum (Emin)of erosion values were obtained from the data madeby the Public Works Department of Bengkulu
Figure 2. Land cover identification procedures.
123456789012345678901234567890112345678901234567890123456789011234567890123456789012345678901123456789012345678901234567890112345678901234567890123456789011234567890123456789012345678901The image will process
1234567890123456789012345678901212345678901234567890123456789012123456789012345678901234567890121234567890123456789012345678901212345678901234567890123456789012Reference image
123456789012345678901123456789012345678901123456789012345678901123456789012345678901123456789012345678901123456789012345678901DEM
1234567890123456789012345678901212345678901234567890123456789012123456789012345678901234567890121234567890123456789012345678901212345678901234567890123456789012Rectification
123456789012345678901234567891234567890123456789012345678912345678901234567890123456789123456789012345678901234567891234567890123456789012345678912345678901234567890123456789Watershed boundary
12345678901234567890123123456789012345678901231234567890123456789012312345678901234567890123123456789012345678901231234567890123456789012312345678901234567890123Corrected image
123456789012345678901234512345678901234567890123451234567890123456789012345123456789012345678901234512345678901234567890123451234567890123456789012345Overlay + Croping
1234567890123456789012345123456789012345678901234512345678901234567890123451234567890123456789012345123456789012345678901234512345678901234567890123451234567890123456789012345Research site
1234567890123456789012345123456789012345678901234512345678901234567890123451234567890123456789012345123456789012345678901234512345678901234567890123451234567890123456789012345Land identification
1234567890123456789012345123456789012345678901234512345678901234567890123451234567890123456789012345123456789012345678901234512345678901234567890123451234567890123456789012345Land cover crop map
123456789012345678901234512345678901234567890123451234567890123456789012345123456789012345678901234512345678901234567890123451234567890123456789012345Field survey
144 G Gunawan et al.: Soil Erosion Prediction Using GIS
province. The maximum erosion value was 242 Mgha-1 yr-1 and the minimum erosion value was 0.1Mg ha-1 yr-1. NDVI (normalized differencevegetation index) was calculated using equation 3.To avoid negative values and facilitate theprocessing of digital data, NDVI values wereobtained from recording image made re-scale (re-scale), so the NDVI equation is as follows (Panujuet al. 2009).
100134
34 xBB
BBNDVI
+
+−= [3]
Where NDVI is a vegetation× index that reflectsthe level of greenness of vegetation× condition(Malingreau 1986). Band 4 (B4) and Band 3 (B3)are a channel on satellite images that record theinfrared spectral (IR/IR) and near infrared (NearInfra Red/ NIR).
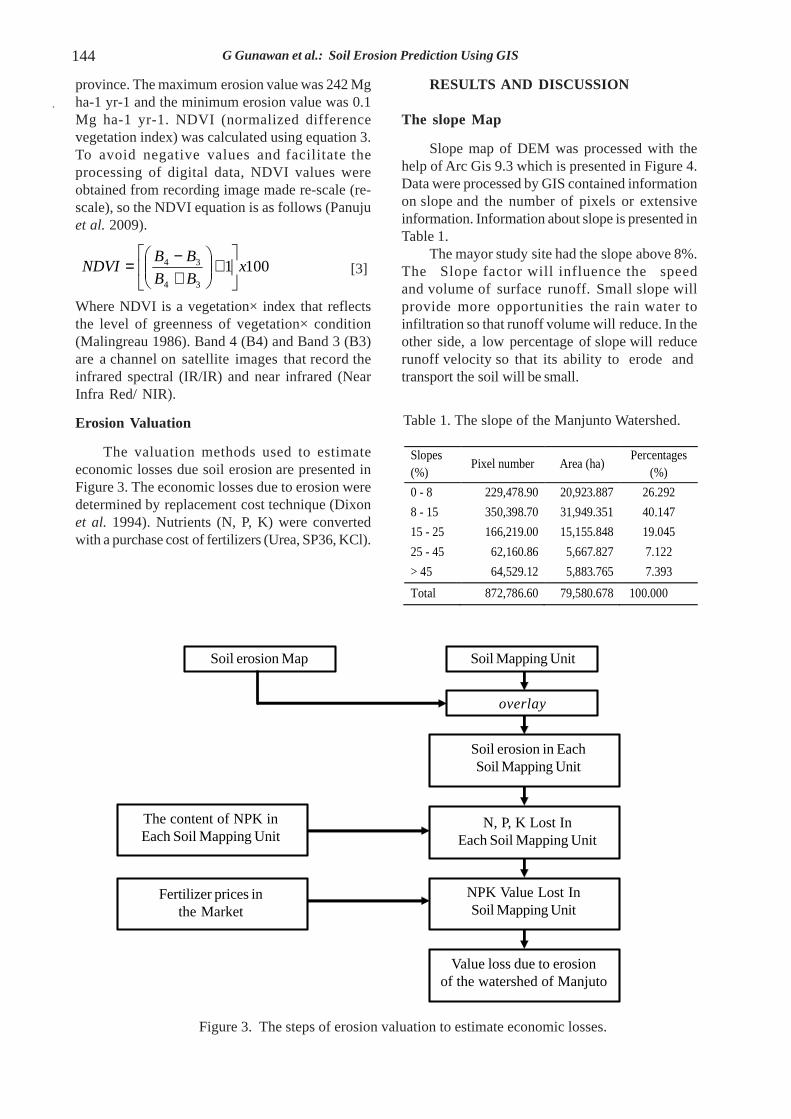
Erosion Valuation
The valuation methods used to estimateeconomic losses due soil erosion are presented inFigure 3. The economic losses due to erosion weredetermined by replacement cost technique (Dixonet al. 1994). Nutrients (N, P, K) were convertedwith a purchase cost of fertilizers (Urea, SP36, KCl).
RESULTS AND DISCUSSION
The slope Map
Slope map of DEM was processed with thehelp of Arc Gis 9.3 which is presented in Figure 4.Data were processed by GIS contained informationon slope and the number of pixels or extensiveinformation. Information about slope is presented inTable 1.
The mayor study site had the slope above 8%.The Slope factor will influence the speedand volume of surface runoff. Small slope willprovide more opportunities the rain water toinfiltration so that runoff volume will reduce. In theother side, a low percentage of slope will reducerunoff velocity so that its ability to erode and transport the soil will be small.
Table 1. The slope of the Manjunto Watershed.
Slopes (%)
Pixel number Area (ha) Percentages
(%)
0 - 8 229,478.90 20,923.887 26.292
8 - 15 350,398.70 31,949.351 40.147
15 - 25 166,219.00 15,155.848 19.045
25 - 45 62,160.86 5,667.827 7.122
> 45 64,529.12 5,883.765 7.393
Total 872,786.60 79,580.678 100.000
The content of NPK in Each Soil Mapping Unit
Fertilizer prices in the Market
Soil erosion Map Soil Mapping Unit
Soil erosion in Each Soil Mapping Unit
overlay
N,P,K Lost In Each Soil Mapping Unit
NPK Value Lost In Soil Mapping Unit
Value loss due to erosion of the watershed of Manjuto
Figure 3. The steps of erosion valuation to estimate economic losses.
123456789012345678901234123456789012345678901234123456789012345678901234123456789012345678901234123456789012345678901234Soil erosion Map
123456789012345678901234123456789012345678901234123456789012345678901234123456789012345678901234123456789012345678901234Soil Mapping Unit
1234567890123123456789012312345678901231234567890123overlay
1234567890123456789012345678123456789012345678901234567812345678901234567890123456781234567890123456789012345678123456789012345678901234567812345678901234567890123456781234567890123456789012345678123456789012345678901234567812345678901234567890123456781234567890123456789012345678
Soil erosion in EachSoil Mapping Unit
123456789012345678901234567890121212345678901234567890123456789012121234567890123456789012345678901212123456789012345678901234567890121212345678901234567890123456789012121234567890123456789012345678901212123456789012345678901234567890121212345678901234567890123456789012121234567890123456789012345678901212
N, P, K Lost InEach Soil Mapping Unit
123456789012345678901234567890121123456789012345678901234567890121123456789012345678901234567890121123456789012345678901234567890121123456789012345678901234567890121123456789012345678901234567890121123456789012345678901234567890121123456789012345678901234567890121123456789012345678901234567890121123456789012345678901234567890121
The content of NPK inEach Soil Mapping Unit
1234567890123456789012345123456789012345678901234512345678901234567890123451234567890123456789012345123456789012345678901234512345678901234567890123451234567890123456789012345123456789012345678901234512345678901234567890123451234567890123456789012345
Fertilizer prices inthe Market
12345678901234567890123456123456789012345678901234561234567890123456789012345612345678901234567890123456123456789012345678901234561234567890123456789012345612345678901234567890123456123456789012345678901234561234567890123456789012345612345678901234567890123456
NPK Value Lost InSoil Mapping Unit
12345678901234567890123456789012123456123456789012345678901234567890121234561234567890123456789012345678901212345612345678901234567890123456789012123456123456789012345678901234567890121234561234567890123456789012345678901212345612345678901234567890123456789012123456123456789012345678901234567890121234561234567890123456789012345678901212345612345678901234567890123456789012123456
Value loss due to erosionof the watershed of Manjuto
145J Trop Soils, Vol. 18, No. 2, 2013: 141-148
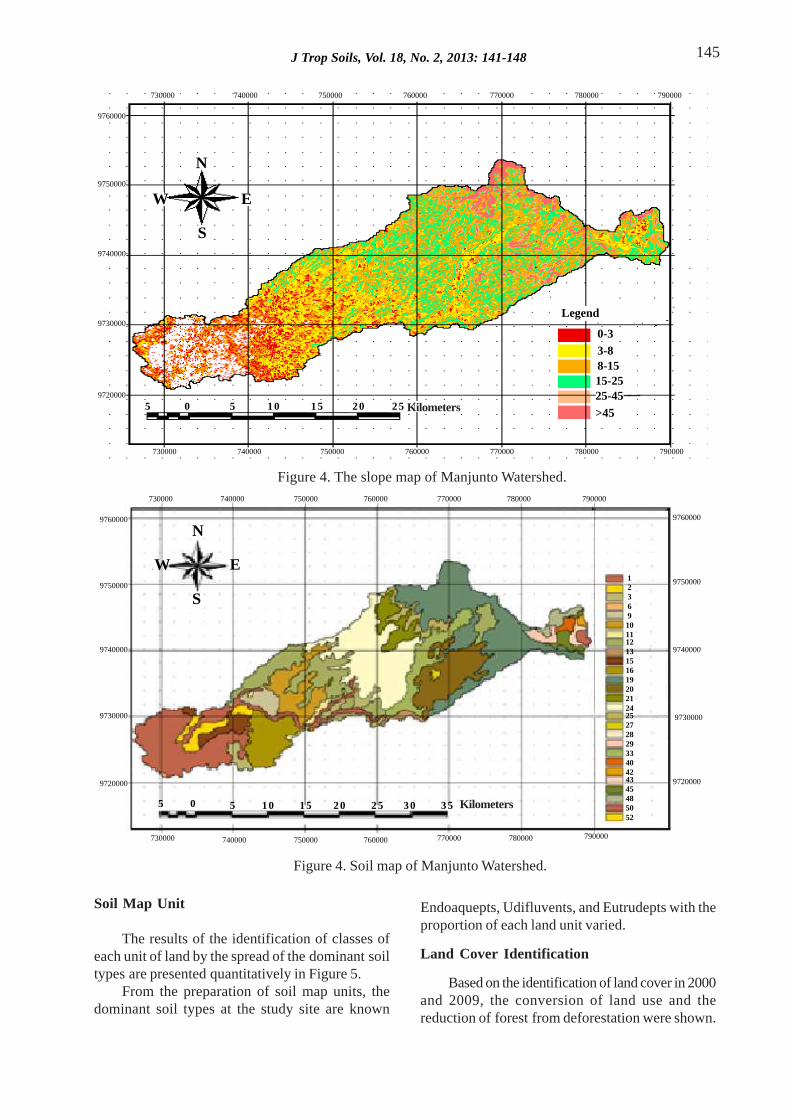
Figure 4. The slope map of Manjunto Watershed.
Soil Map Unit
The results of the identification of classes ofeach unit of land by the spread of the dominant soiltypes are presented quantitatively in Figure 5.
From the preparation of soil map units, thedominant soil types at the study site are known
Figure 4. Soil map of Manjunto Watershed.
Endoaquepts, Udifluvents, and Eutrudepts with theproportion of each land unit varied.
Land Cover Identification
Based on the identification of land cover in 2000and 2009, the conversion of land use and thereduction of forest from deforestation were shown.
9720000
9730000
9740000
9750000
9760000
1234567123456712345671234567
730000 740000 750000 760000 770000 780000 790000
9760000
9750000
9740000
9730000
9720000
790000780000770000760000750000740000730000
9720000
9730000
9740000
9750000
9760000
1236910111213151619202124252728293340424345485052
5 0 5 1 0 1 5 2 0 2 5 3 0 3 5
W
N
E
S
Kilometers
12345678123456781234567812345678
1234567123456712345671234567
123456789123456789123456789123456789
123456789123456789123456789123456789
12345678123456781234567812345678
730000 740000 7500001234567123456712345671234567
12345678123456781234567812345678
123456789123456789123456789123456789
760000 770000 780000 790000
1234567812345678
123456781234567812345678
12345678123456781234567812345678
12345678123456781234567812345678
9760000
9750000
9740000
9730000
9720000
123456712345671234567730000
123456712345671234567
123456712345671234567
123456712345671234567
123456712345671234567
123456712345671234567
123456712345671234567740000 750000 760000 770000 780000 790000
123456789123456789123456789123456789
123456789123456789123456789123456789
123456789123456789123456789
123456789123456789123456789123456789
123456789123456789
12345678901231234567890123123456789012312345678901231234567890123
Legend12345678123456781234567812345678123456780-3123456781234567812345678123456781234567891234567891234567891234567891234567890112345678901123456789011234567890112345678901
12345678123456781234567812345678
1234567890112345678901123456789011234567890112345678901
3-88-1515-2525-45>45
123123123
123451234512345
123412341234
123123123
123456123456123456
123451234512345
123451234512345
1234567890123451234567890123451234567890123455 0 5 1 0 1 5 2 0 2 5 Kilometers
1234512345123451234512345
123451234512345
123412341234
12345123451234512345
123456123456123456123456123456
W
S
E
N
146 G Gunawan et al.: Soil Erosion Prediction Using GIS
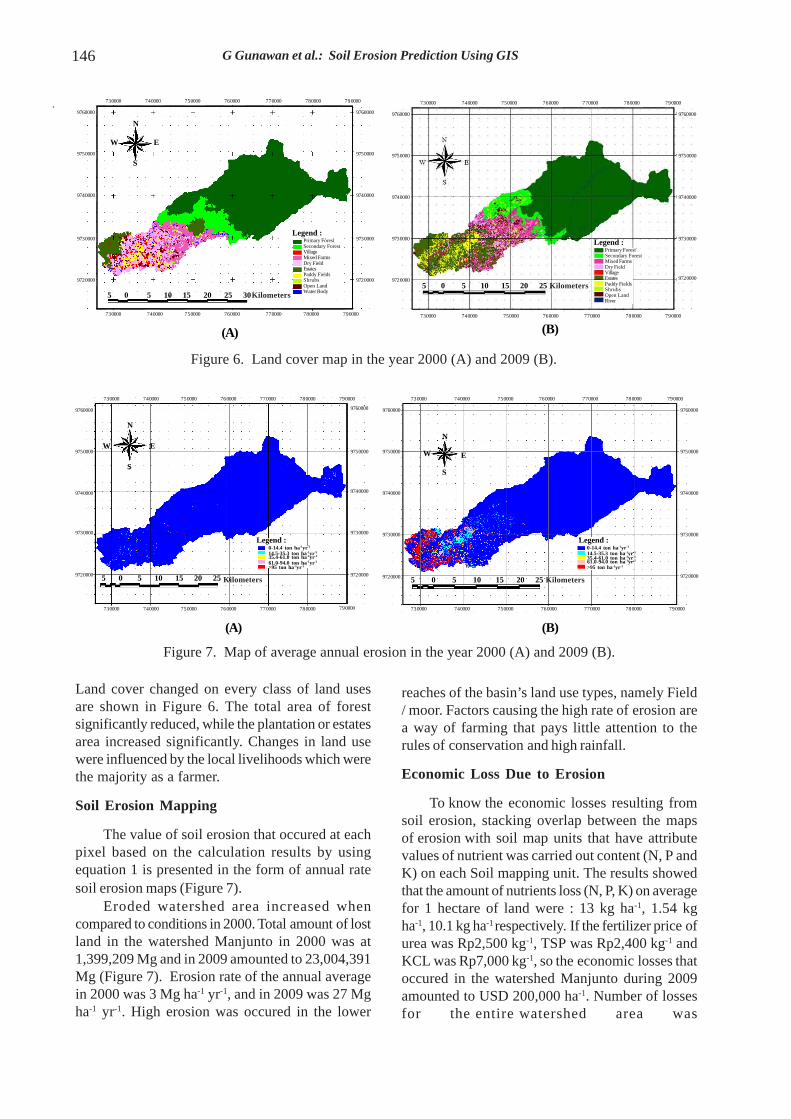
Land cover changed on every class of land usesare shown in Figure 6. The total area of forestsignificantly reduced, while the plantation or estatesarea increased significantly. Changes in land usewere influenced by the local livelihoods which werethe majority as a farmer.
Soil Erosion Mapping
The value of soil erosion that occured at eachpixel based on the calculation results by usingequation 1 is presented in the form of annual ratesoil erosion maps (Figure 7).
Eroded watershed area increased whencompared to conditions in 2000. Total amount of lostland in the watershed Manjunto in 2000 was at1,399,209 Mg and in 2009 amounted to 23,004,391Mg (Figure 7). Erosion rate of the annual averagein 2000 was 3 Mg ha-1 yr-1, and in 2009 was 27 Mgha-1 yr-1. High erosion was occured in the lower
Figure 6. Land cover map in the year 2000 (A) and 2009 (B).
(A) (B)
(A) (B)
Figure 7. Map of average annual erosion in the year 2000 (A) and 2009 (B).
reaches of the basin’s land use types, namely Field/ moor. Factors causing the high rate of erosion area way of farming that pays little attention to therules of conservation and high rainfall.
Economic Loss Due to Erosion
To know the economic losses resulting fromsoil erosion, stacking overlap between the mapsof erosion with soil map units that have attributevalues of nutrient was carried out content (N, P andK) on each Soil mapping unit. The results showedthat the amount of nutrients loss (N, P, K) on averagefor 1 hectare of land were : 13 kg ha-1, 1.54 kgha-1, 10.1 kg ha-1 respectively. If the fertilizer price ofurea was Rp2,500 kg-1, TSP was Rp2,400 kg-1 andKCL was Rp7,000 kg-1, so the economic losses thatoccured in the watershed Manjunto during 2009amounted to USD 200,000 ha-1. Number of lossesfor the entire watershed area was
123456123456123456123456
12345123451234512345
12345123451234512345
123451234512345
1234123412341234
9760000
9750000
9740000
9730000
9720000
123451234512345
12345123451234512345
12345123451234512345
123451234512345
12345123451234512345
9720000
9730000
9740000
9750000
9760000
123456123456123456
123456123456123456
123456123456123456
123451234512345
123456123456123456
123456123456123456
123456712345671234567730000 740000 750000 760000 770000 780000 790000
12341234
1234512345
1234512345
12341234
1234512345
1234512345
1234512345730000 740000 750000 760000 770000 780000 790000
12123 123 12 123 123 123 123123456712345675 0 105 15 20 25 30
12341234
123123
123412341234
12341234
N
W
S
E
12345671234567Legend :
1234567890123456789012345678901234567890123456789012345678901234567890123456789012345678901234567890123456789012345678901234567890
Primary ForestSecondary ForestVillageMixed FarmsDry FieldEstatesPaddy FieldsShrubsOpen LandWater Body
123456123456123456123456
123456123456123456123456
123456123456
123456123456
123456123456
1234512345
1234512345
123456123456
1234512345
1234512345
1234512345
12341234
730000 740000 750000 760000 770000 780000 790000
9760000
9750000
9740000
9730000
9720000
1234512345
1234512345
123456123456
1234512345
1234512345
123456123456
12341234123451234512345
1234512345
12345123451234512345
1234512345
1234512345
730000 740000 750000 760000 770000 780000 790000
9760000
9750000
9740000
9730000
9720000
12345678123456781234567812345678
123456781234567812345678123456781234567812345678123456781234567812345678123456781234567812345678
123456712345671234567
Primary ForestSecondary ForestMixed FarmsDry FieldVillageEstatesPaddy FieldsShrubsOpen LandRiver
Legend :
123123123
123123123
123123123
123123123
123123123
123123123
123123123
123456123456123456
5 0 5 10 15 20 25Kilometers
Kilometers
1234512345
123451234512345
123451234512345
123412341234
1234512345123459720000
9730000
9740000
9750000
9760000
123412341234
123451234512345
123451234512345
123456123456123456
123451234512345
123451234512345
123451234512345
730000 740000 750000 760000 770000 780000 7900001234512345
123451234512345
123451234512345
123451234512345
123451234512345
123412341234
123451234512345
123456123456123456
123451234512345
123451234512345
123451234512345
123451234512345
730000 740000 750000 760000 770000 780000 790000
9720000
9730000
9740000
9750000
9760000
1234512345
123412341234
123451234512345
123123123
W
N
S
E
123412341234
123123123
123412341234
123412341234
123412341234
123451234512345
123451234512345
1234567123456712345675 0 5 10 15 20 25 Kilometers
123456781234567812345678
123456789012123456789012123456789012123456789012123456789012123456789012
Legend :0-14.4 ton ha-1yr-1
14.5-35.3 ton ha-1yr-1
35.4-61.0 ton ha-1yr-1
61.0-94.0 ton ha-1yr-1
>95 ton ha-1yr-1 123451234512345
123451234512345
123451234512345
1234512345
123451234512345
123451234512345
123456123456123456
123451234512345
123451234512345
123451234512345
123451234512345
1234561234561234561234512345
123451234512345
123451234512345
123451234512345
123451234512345
123412341234
123451234512345
123451234512345
123451234512345
123451234512345
123456123456123456
123451234512345730000 740000 750000 760000 770000 780000 790000
9720000
9730000
9740000
9750000
9760000
730000 740000 750000 760000 770000 780000 790000
9760000
9750000
9740000
9730000
9720000
123123
123123123
123123123
123123
N
W
S
E
123412341234
123123123
123123123
121212
123412341234
123123123
123123123
123456789123456789123456789
5 0 5 10 15 20 25 Kilometers
123456789123456789123456789
123456789012123456789012123456789012123456789012123456789012123456789012123456789012
Legend :0-14.4 ton ha-1yr-1
14.5-35.3 ton ha-1yr-1
35.4-61.0 ton ha-1yr-1
61.0-94.0 ton ha-1yr-1
>95 ton ha-1yr-1
147J Trop Soils, Vol. 18, No. 2, 2013: 141-148
Rp15,918,213,133,-. Losses due to erosion at thestudy site were high when compared with othercountries.
CONCLUSIONS
Based on the analysis of erosion evaluationswhich were conducted in year 2000 and 2009, someconclusions were obtained. The total area of theeroded basin had increased significantly from yearto year. Total amount of soil lost by erosion in thewatershed of Manjunto in 2000 amounted to1,399,209 Mg and in 2009 increased to 23,004,391Mg. The average erosion rate in 2000 was 3 Mgha-1 yr-1 and in 2009 increased to 27 Mg ha-1
yr-1. Economic losses that occured in the watershedof Manjunto during 2009 amounted to USD 200,000ha-1 and the total losses amounted toRp15,918,213,133, -.
ACKNOWLEDGEMENTS
We wish to thank the Institute of Space andAeronautics Chairman for his help in providing datafor this study. We also wish to thank the Head of theFaculty of Engineering, University of Indonesia. Thispaper is part of the Doctoral DissertationResearch in Faculty of Engineering, Universityof Indonesia.
REFERENCES
Aksoy E, G Ozsoy and MS Dirim. 2009. Soil mappingapproach in GIS using Landsat satellite imagery andDEM data. Afr J Agric Res 4: 1295-1302.
Ananda J and G Herath. 2003. Soil erosion in developingcountries: a socio-economic appraisal. J EnvironManage 68: 343-353.
Ananda J, G Herath and A Chisholm. 2001. Determinationof yield and Erosion Damage Functions UsingSubjectivly Elicited Data: application to SmallholderTea in Sri Lanka. Aust J Agric Resour Ec 45: 275-289.
Ande OT, Y Alaga and GA Oluwatosin. 2009. Soil erosionprediction using MMF model on highly dissectedhilly terrain of Ekiti environs in southwesternNigeria. Int J Phys Sci 4: 053-057.
Arnold JG, BA Engel and R Srinivasan. 1998. A continuoustime grid cell watershed model. Proc. of applicationof Advanced Technology for management of NaturalResources.
Arsyad S. 2010. Konservasi Tanah dan Air. IPB Press.Bogor-Indonesia (in Indonesian).
Asdak C.1995. Hydrology and Watershed Management.Gadjah Mada University Press, Yogyakarta.
Barlin RD and ID Moore. 1994. Role of buffer strips inmanagement of waterway pollution: a review.Environ Manage 18: 543-58.
Brough PA.1986. Principle of Geographical InformationSystems For Land Resources Assessment. OxfordUniversity Press, 194p.
Clark B and J Wallace. 2003. Global connections:Canadian and world issues. Toronto, Canada:Pearson Education Canada, Inc.
Cochrane T A and DC Flanagan. 1999. Assessing watererosion in small watershed using WEPP with GISand digital elevation models. J Soil Water Conserv54: 678 685.
Dames TWg. 1955. The Soils of East Central Java; witha Soil Map 1:250,000. Balai Besar Penjelidikan
Pertanian, Bogor, Indonesia.Dixon JA, LF Scura, RA Carpenter and PB Sherman. 2004.
Economic Analysis of Environmental Impacts 2nd ed.Eartscans Publication Ltd., London.
Fistikoglu O and NB Harmancioglu. 2002. Integration ofGIS with USLE in Assessment of Soil Erosion. WaterResour Manage 16: 447-467.
Green K. 1992. Spatial imagery and GIS: integrated datafor natural resource management. J Forest 90: 32-36.
Hazarika MK and H Honda. 2001. Estimation of SoilErosion Using Remote Sensing and GIS, ItsValuation & Economic Implications onAgricultural Productions. The 10
th International Soil
Conservation Organization Meeting at PurdueUniversity and the USDA-ARS Soil ErosionResearch Laboratory.
Hazarika S, R Parkinson, R Bol, L Dixon, P Russell, SDonovan and D Allen. 2009. Effect of tillage systemand straw management on organic matter dynamics.Agron Sustain Develop 29: 525-533. doi: 10.1051/
agro/2009024.Honda KL, A Samarakoon, Y Ishibashi, Mabuchi and S
Miyajima.1996. Remote Sensing and GIStechnologies for denudation estimation in Siwalikwatershed of Nepal,p. B21-B26. Proc. 17th AsianConference on Remote Sensing, Colombo, Sri lanka.
Kefi M and K Yoshino. 2010. Evaluation of The EconomicEffects of Soil Erosion Risk on AgriculturalProductivity Using Remote Sensing: Case ofWatershed in Tunisia. International Archives of thePhotogrammetry, Remote Sensing and SpatialInformation Science, Volume XXXVIII, Part 8, KyotoJapan.
Kefi M, K Yoshino, K Zayani and H Isoda. 2009.Estimation of soil loss by using combination ofErosion Model and GIS: case of study watershedsin Tunisia. J Arid Land Stud 19: 287-290.
Lal R. 1998. Soil erosion impact on agronomic productivityand environment quality: Critical Review. Plant Sci17: 319-464.
Lal. 2001. Soil Degradation by Erosion. Land DegradDevelop12: 519-539.
Lanya I. 1996. Evaluasi Kualitas lahan dan ProduktivitasLahan Kering Terdegradasi di Daerah TransmigrasiWPP VII Rengat Kabupaten Indragiri Hulu, Riau.[Disertasi Doktor]. Program Pasca Sarjana IPB,Bogor (in Indonesian).
148 G Gunawan et al.: Soil Erosion Prediction Using GIS
Mermut AR and H Eswaran. 2001. Some majordevelopments in soil science since the mid 1960s.Geoderma 100: 403-426.
Mongkolsawat C, P Thurangoon and Sriwongsa.1994.Soil erosion mapping with USLE and GIS. Proc.Asian Conf. Rem. Sens., C-1-1 to C-1-6.
Morgan RPC, Morgan DDV and Finney HJ. 1984. Apredictive model for the assessment of erosion risk.J Agric Eng Res 30: 245-253.
Morgan RPC. 2005. Soil Erosion and Conservation. 3rded. Malden, MA: Blackwell Publishing Co.
Panuju DR, F Heidina, BH Trisasongko, B Tjahjono, AKasno, AHA Syafril. 2009. Variasi nilai indeksvegetasi MODIS pada siklus pertumbuhan padi.J.Ilmiah Geomat. 15, 9-16 (in Indonesian).
Pimentel D, C Harvey, P Resosudarmo, K. Sinclair, D Kurz,M Mc Nair, S Christ, L Shpritz, L Fitton, R Saffouriand R Balir. 1995. Environmental and Economic
Costs of Soil Erosion and Conservation Benefits.Science 267: 1117-1123.
Saha SK and LM Pande. 1993. Integrated approachtowards soil erosion inventory for environmentalconservation using satellite and agrometeorologicaldata. Asia Pac Rem Sens J 5: 21-28.
Saha SK, Kudrat M and Bhan SK.1991. Erosional soilloss prediction using digital satellitee data andUSLE. In: S Murai (ed). Applications of RemoteSensing in Asia and Oceania – EnvironmentalChange Monitoring. Asian Association of RemoteSensing, pp. 369-372.
Salehi MH, Eghbal MK and Khademi H. 2003. Comparisonof soil variability in a detailed and a reconnaissancesoil map in central Iran. Geoderma 111: 45-56.
Soil Survey Staff. 1998. Keys to Soil Taxonomy. EighthEdition. United States Department of AgricultureNatural Resources Conservation Service.Washington, D.C.


