Embed Size (px)
Citation preview
Applied Soil Ecology
E L S E V I E R Applied Soil Ecology 5 (1996) 81-96 ,
Soil oribatid mite communities ( Acari: Oribatidaj from high Shaba (Zgire) in relation to vegetation
Mundon-Izay Noti a,1, Henri M. Andre a b, * , Marc DufrSne a
a Universit~ Catholique de Louvain. Unit~ d'Ecologie et de Biog~ographie, Place Croix du Sud 5, B-1348 Louvain-la-Neuve, Belgium b Mus~e Royal de rAfrique Centrale, U.R. Faune du Sol, B-3080 Tervuren, Belgium
Accepted 20 May 1996
Abstract
Soil oribatid mite communities from three vegetation types (forest, woodland and savanna) are described in Luiswishi (high Shaba, Za'ire) and 151 species were recorded, Oribatid communities are organized along a successional gradient which parallels the regressive sere defined by phytosociologists and going from the dense forest ("muhulu"), the local climax, to the savanna, passing through the woodland (" miombo"). Within this gradient, oribatid communities may vary depending on the habitat (presence of grass, high termitaria). The impact of seasons (dry vs. rainy season) is weak in the forest but drastic in savanna. The various soil oribatid communities are related to man's activities since the regressive sere results from repeated bumings and associated agricultural practices.
Keywords: Classification; Forest; Woodland; Savanna; Regressive sere; Indicator species; Season; Termitaria
I . Introduct ion
Our ignorance of tropical organisms and ecosys- tems is vast and the African soil fauna is by no means an exception. A recent review of soil fauna studies in Africa edited by Ghabbour and Davis (1988) showed that much has to be done. Most publications deal with taxonomic descriptions, some give an overview of the major groups found in different African soils, a few offer an ecological approach based on precise species identification. Ac- cording to Usher (1988), soil biologists have been
" Corresponding author: Tel. 32 2 769 52 58; Fax. 32 2 769 5638; Email. [email protected].
Present address: lnstitut royal des Sciences naturelles, Dept of Entomology, 29 me Vautier, B-1000 Bruxelles.
less inclined to recognize species and frequently have not been concerned with the taxonomic basis of their science and it has become fashionable to regard the diversity of soil communities as so great that it would be impossible to identify all of the species that exist in them. As a result, little information is available on the arthropod fauna of tropical forests in Africa, especially that of moist forests, and this could lead to a serious underestimate of the total number of species existing on earth (Andr~ et al., 1992).
This is virtually the first publication presenting a detailed analysis of soil microarthropods observed in Africa. Preliminary results were published by Noti and Lebrun (1987). Although it is restricted to orib- atid mites, this study is based on precise species identification and gives a first estimate of species
0929-1393/96/$15.00 Copyright © 1996 Elsevier Science B.V. All fights reserved. PII S0929- 1393(96)00122-9
82 M.-L Noti et a l . / Applied Soil Ecology 5 (1996) 81-96
richness in African soils. The experimental design was related to a regressive sere from the dense forest to the savanna during the two major seasons, dry vs. rainy. This way, it has been possible to describe various soil microarthropod communities in relation to vegetation, to identify indicator species, to deter- mine how these communities undergo the seasons and the presence of high termitaria, and to evaluate the impact of deforestation on them. The description of the communities is essential and urgent when one considers the deforestation rate currently observed in Africa, i.e. 1.7% per year (FAO, 1990, UNEP, 1991; see also Barnes, 1990). Subsequent papers will be devoted to the analysis of species richness (Noti et al., in preparation) and the study of mesologic vari- ables that determine the population distribution (Noti and DufrSne, in preparation).
2. Materials and methods
2.1. The study area
This study was conducted in Luiswishi, about 28 km northeast of Lubumbashi, Zff/re (11°29"05"S - 27°36'10"E; elevation: 1208 m). Three major vegeta- tion types were studied; the climax represented by dense dry forest (called "forest" hereafter), wood- land and savanna. Altogether, they form a regressive sere. More recent publications on these vegetation types include Colonval-Elenkov and Malaisse (1975), Freson (1973), Freson et al. (1974), Malaisse (1973), Malaisse (1978a), Malaisse (1978b), Malaisse (1982), Malaisse (1984), Malaisse-Mousset (1974), Malaisse and Anastassiou-Socquet (1977), Malaisse and Anas- tassiou-Socquet (1983), Malaisse and Colonval- Elenkov (1981), Schmitz (1971), Schmitz (1974), Schmitz (1977), Schmitz (1988).
The soil belongs to the Kaponda series (A2-type, red-yellowish ferralitic soil) (Sys and Schmitz, 1959). The percentage of thin elements (0-2 Ixm) in soil reached 60% in forest against 35 to 50% in other formations (Goffinet, 1973). The surface organic layer varied in depth from about 5 to 10 cm in forest, 2-3 cm in woodland and less than 1 cm in savanna.
The climax forest, locally called "muhulu", is a dense dry forest, with a tree stratum and a well developed woody vegetation. Due to extensive burn-
ings and cuttings, only relicts subsist from the vast original forest (Schmitz, 1971, Malaisse, 1978a,b). Samples were taken in the Entandrophragmeto-Di- ospyretum hoyleanae Schmitz, 1950 association.
The woodland, locally called "miombo", is a semi-deciduous formation that covers ca. 80% of the surface area in the high Shaba (Schmitz, 1971). In contrast with the forest, there is an herbaceous stra- tum (coverage: 5%). Woodland succeeds the forest after burning. Samples were taken in the Brachyste- gio-Marquesietum Schmitz, 1950 association. This association develops immediately after burning and plays a transition role between the climax and substi- tution woodlands. In very degraded situations, it may even become a paraclimax (Schmitz, 1971).
Savanna in the study area belongs to the Ctenio- Loudetietia simplicis Duvigneaud, 1949 class. Sam- ples were taken from Loudetia simplex mosaics in zones that were quite devoid of trees. Grass coverage varied from 12% on termitaria to 14% in between (Noti, 1991). Savanna, as well as woodland, subsists only after repeated bumings during the dry season and may be considered to be a pyroclimax.
There are two rather contrasting seasons, i.e. rainy vs. dry. Climatic data are available in Freson et al. (1974).
2.2. Field sampling
Each formation represents a mosaic of macrohabi- tats related to patches of vegetation, termitaria, etc. Three macrohabitats were sampled in each type of vegetation, as detailed in Table 1. For each habitat, two sampling sites were selected. Sampling was repeated four times: February 1984 and 1985 (rainy season) and June 1984 and 1985 (dry season). A total of 72 relev~s were thus collected.
A relev6 consisted of 10 soil cores taken with a core device of 50 mm diameter. Sampling depth varied from 7 to 10 cm in the forest and from 3 to 5 cm in other formations. In this way, cores included both organic layers and Al-horizon. Soil cores were extracted in Berlese funnels for two weeks (25-W bulbs were lighted only on the third day). For practi- cal reasons (lack of glassware and alcohol), all sam- piing units (cores) collected at the same time from the same sampling site were pooled to form what we call a relev&
M.-I. Noti et al . / Applied Soil Ecology 5 (1996) 81-96 83
Table 1 The three types of vegetation and nine macrohabitats sampled
Types of vegetation Habitats (according to Schmitz, 1988)
- Forest Entandrophragmeto- Diospyretum hoyleanae Schmitz, 1950
- Woodland Brachystegio- Marquesietum Schmitz, 1950
- Savanna Ctenio- Loudetietea simplicis Duvigneaud, 1949
- Typical - Natural clearing
- High termitaria (a)
- Grass tuft (b) - Barren soil - High l~rmitaria (a)
- Grass tuft (0 - Barren soil - High termitaria (a) (o)
(a) High termitaria (ca. 8 m high) were constructed by Macroter- mesfalciger and were covered by small trees, Samples were taken at least 1 m above the soil level. (b) Tristachya bequaertii and T. inamoena, Loudetia simplex, Setaria thermitaria, Eragrostisboehmii, Brachyaria spp., etc. (¢) Mosaic of Loudetia simplex. (d) Also colonized by tufts of Setaria thermitaria where samples were taken.
All adult oribatid mites and most immatures were identified to the species level, after mounting for examination under a compound microscope. Keys to genera include Willmann (1931), Balogh (1972), Balogh and Balogh (1988), Balogh and Balogh (1990), Balogh and Mahunka (1983). At the species level, there is virtually no major key available for African species and the literature is scattered into many publications. A list of approximately 120 refer- ences for species identification is available from the authors on request. Species identification may be difficult, especially when successive revisions have contributed to the multiplication of taxa within a vast and complex family such as Oppiidae (Balogh, 1983, Woas, 1986, Subias and Balogh, I989).
2.3. Statistical analysis
Only adult oribatid mites (22 355 individuals) were included in the data matrices. Data consisted of two basic matrices, a 149 species X 72 relev~ matrix and another including only the 50 most abundant species.
Abundances were expressed as relative values, i.e. sample totals were relativized to 100. Indirect ordina- tion and classification techniques were used to orga- nize community data. The program OSUCL4 (Andr& 1988), a classification around a variable centered algorithm, was applied to the 50 species × 72 relev6 matrix. Percentage difference was selected as the distance measure because of its linear weighting of species abundances and the fact that it gives ecologi- cally more easily interpretable results (Gauch, 1982, Gower and Legendre, 1986, Andr6, 1988). To sup- plement this approach, detrended correspondence analysis (DCA) was applied to the 149 species × 72 relev6s matrix or various sub-matrices (DECORANA by Hill and Gauch, 1980). Due to pronounced arch effects, DCA was preferred to ordinary CA.
A second approach involved obtaining a classifi- cation of samples using the k-means method, an iterative procedure of object relocation (MacQueen, 1967, Spi~th, 1980). The computation was repeated 500 times, after a random allocation of samples to groups used as the starting configuration of each run; this helps avoid the risk of local minima of the overall sum of squares, which is the sum of the within-group sums of squares. The method was ap- plied to the sample coordinates on the first 20 Princi- pal Coordination Analysis axes of a Steinhaus simi- larity matrix computed on log-transformed abun- dances.
To identify indicator species, we used a new index, IV, which combines species relative abun- dance to their relative frequency of occurrence in the various clusters (DufrSne and Legendre, in press). IV is maximum when all specimens of a species are found in a single cluster and when the species occurs in all samples of that cluster. The statistical signifi- cance of IV is evaluated using a random permutation procedure. In contrast with TWINSPAN, IV for a given species is independent from the relative abundances of other species and there is no need to use pseu- dospecies. IV can be computed at all levels of a hierarchical classification. This allows more eury- topic species to be recognized at their characteristic distribution scale.
Between-group distances given in Tables 4 and 5 were estimated using Euclidian metrics between group centroids defined in the first four dimensions of the DCA space.
84 M.-L Noti et a l . /Appl ied Soil Ecology 5 (1996) 81-96
3. Results
3.1. Major groups of arthropods
Density of arthropods and oribatid mites in the three types of vegetation and in the two seasons are given in Table 2. Densities are notably lower in woodland and savanna than in the dense forest. Although total arthropods are more abundant in dry than in rainy season, oribatid mites show the reverse trend in woodland and savanna.
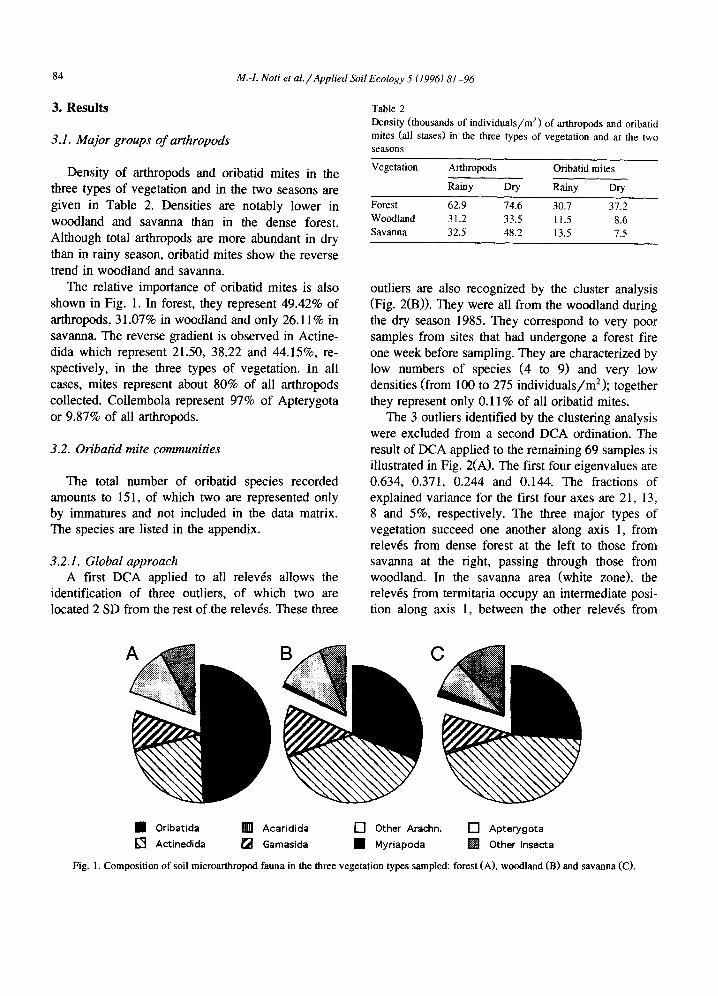
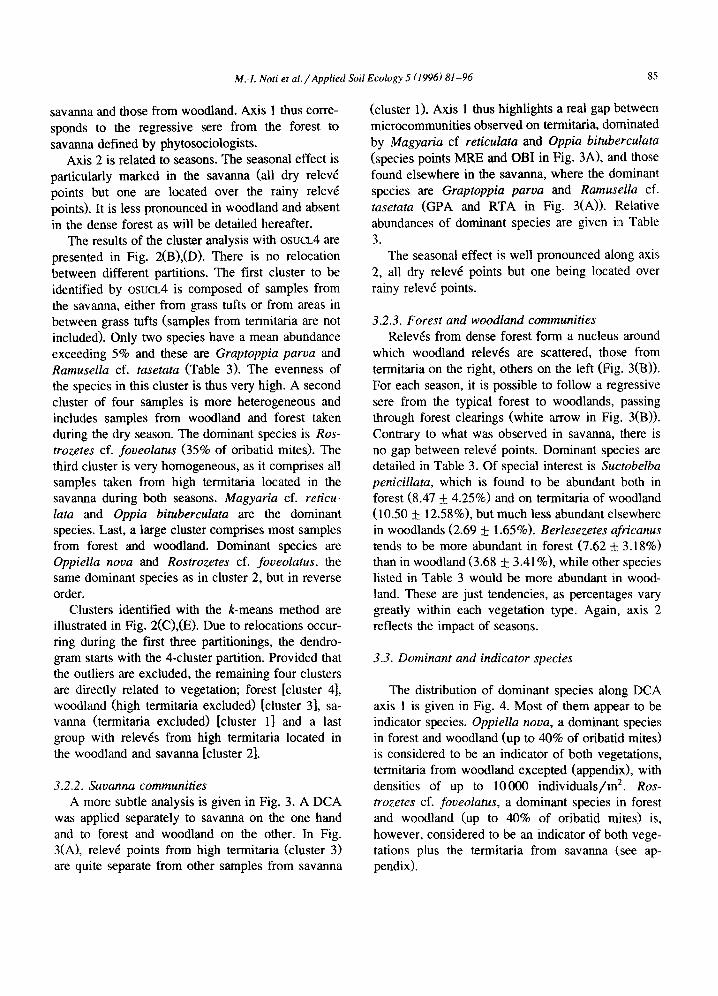
The relative importance of oribatid mites is also shown in Fig. 1. In forest, they represent 49.42% of arthropods, 31.07% in woodland and only 26.11% in savanna. The reverse gradient is observed in Actine- dida which represent 21.50, 38.22 and 44.15%, re- spectively, in the three types of vegetation. In all cases, mites represent about 80% of all arthropods collected. Collembola represent 97% of Apterygota or 9.87% of all arthropods.
3.2. Oribatid mite communities
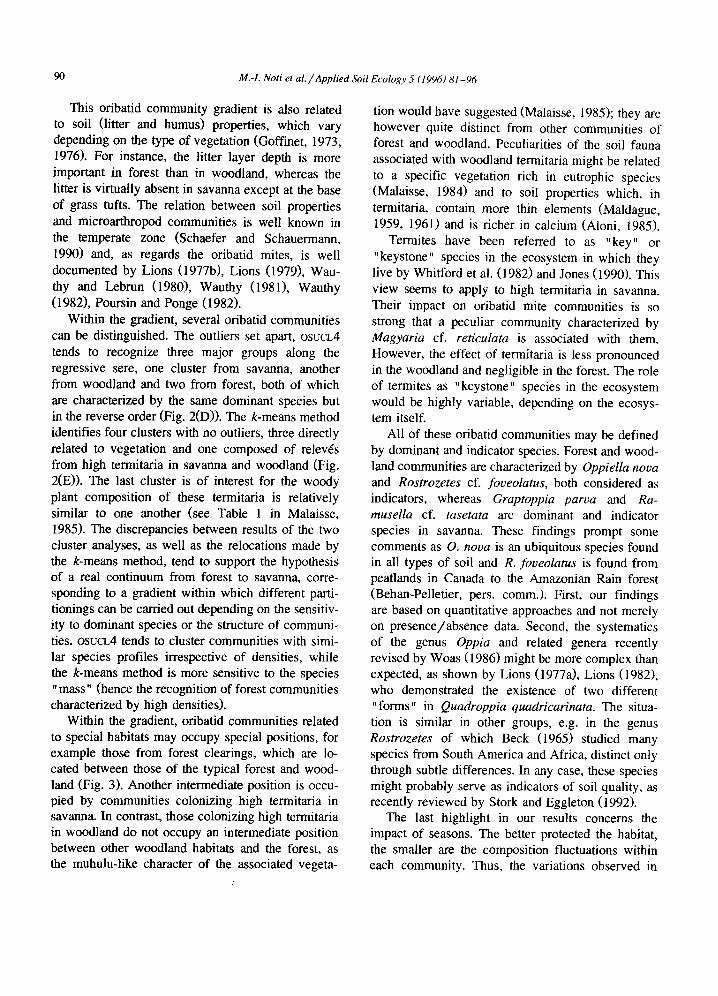
The total number of oribatid species recorded amounts to 151, of which two are represented only by immatures and not included in the data matrix. The species are listed in the appendix.
3.2.1. Global approach A first DCA applied to all relev~s allows the
identification of three outliers, of which two are located 2 SD from the rest of the relev~s. These three
Table 2 Density (thousands of individuals/m 2) of arthropods and oribatid mites (all stases) in the three types of vegetation and at the two seasons
Vegetation Arthropods Oribatid mites
Rainy Dry Rainy Dry
Forest 62.9 74.6 30.7 37,2 Woodland 31.2 33.5 11.5 8.6 Savanna 32.5 48.2 13.5 7.5
outliers are also recognized by the cluster analysis (Fig. 2(B)). They were all from the woodland during the dry season 1985. They correspond to very poor samples from sites that had undergone a forest fire one week before sampling. They are characterized by low numbers of species (4 to 9) and very low densities (from 100 to 275 individuals/m2); together they represent only 0.11% of all oribatid mites.
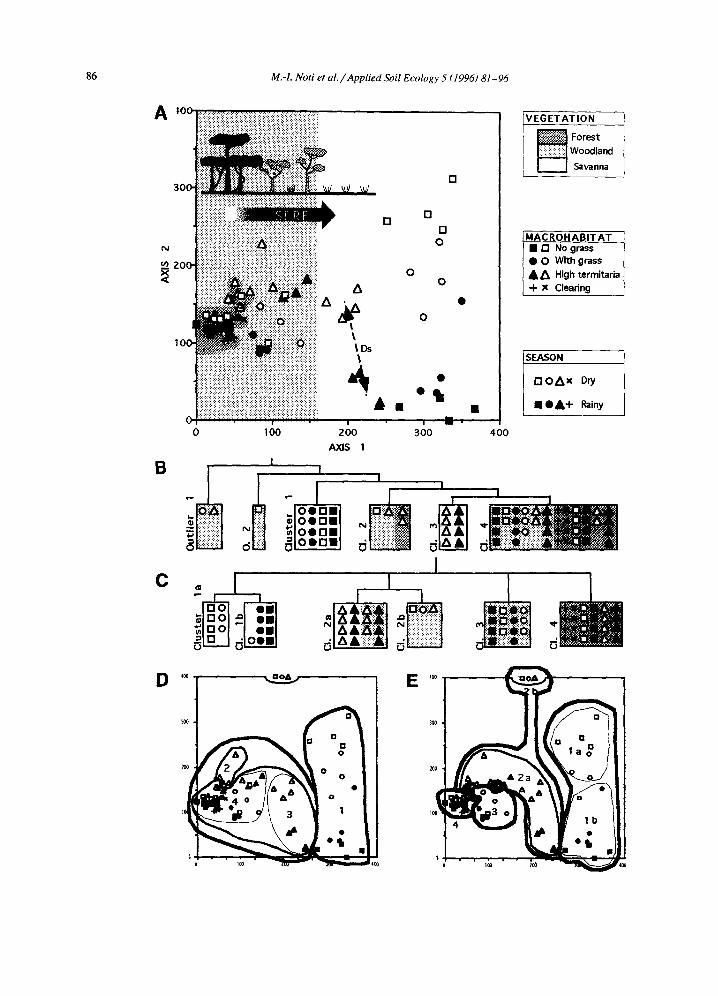
The 3 outliers identified by the clustering analysis were excluded from a second DCA ordination. The result of DCA applied to the remaining 69 samples is illustrated in Fig. 2(A). The first four eigenvalues are 0.634, 0.371, 0.244 and 0.144. The fractions of explained variance for the first four axes are 21, 13, 8 and 5%, respectively. The three major types of vegetation succeed one another along axis 1, from relev6s from dense forest at the left to those from savanna at the right, passing through those from woodland. In the savanna area (white zone), the relev6s from termitaria occupy an intermediate posi- tion along axis 1, between the other relev6s from
(
• Oribatida W Acaridida [ ] Other Arachn. [ ] Apterygota [ ] Actinedida [ ] Gamasida • Myriapoda [ ] Other Insecta
Fig. I. Composition of soil microarthropod fauna in the three vegetation types sampled: forest (A), woodland (B) and savanna (C).
M.-I. Noti et a l . / Applied Soil Ecology 5 (1996) 81-96 85
savanna and those from woodland. Axis 1 thus corre- sponds to the regressive sere from the forest to savanna defined by phytosociologists.
Axis 2 is related to seasons. The seasonal effect is particularly marked in the savanna (all dry relev6 points but one are located over the rainy relev~ points). It is less pronounced in woodland and absent in the dense forest as will be detailed hereafter.
The results of the cluster analysis with OSUCL4 are presented in Fig. 2(B),(D). There is no relocation between different partitions. The first cluster to be identified by osucIA is composed of samples from the savanna, either from grass tufts or from areas in between grass tufts (samples from termitaria are not included). Only two species have a mean abundance exceeding 5% and these are Graptoppia parva and Ramusella cf. tasetata (Table 3). The evenness of the species in this cluster is thus very high. A second cluster of four samples is more heterogeneous and includes samples from woodland and forest taken during the dry season. The dominant species is Ros- trozetes cf. foveolatus (35% of oribatid mites). The third cluster is very homogeneous, as it comprises all samples taken from high termitaria located in the savanna during both seasons. Magyaria cf. reticu- lata and Oppia bituberculata are the dominant species. Last, a large cluster comprises most samples from forest and woodland. Dominant species are Oppiella nova and Rostrozetes cf. foveolatus, the same dominant species as in cluster 2, but in reverse order.
Clusters identified with the k-means method are illustrated in Fig. 2(C),(E). Due to relocations occur- ring during the first three partitionings, the dendro- gram starts with the 4-cluster partition. Provided that the outliers are excluded, the remaining four clusters are directly related to vegetation; forest [cluster 4], woodland (high termitaria excluded) [cluster 3], sa- vanna (termitaria excluded) [cluster 1] and a last group with relev6s from high termitaria located in the woodland and savanna [cluster 2].
3.2.2. Savanna communities A more subtle analysis is given in Fig. 3. A DCA
was applied separately to savanna on the one hand and to forest and woodland on the other. In Fig. 3(A), relev~ points from high termitaria (cluster 3) are quite separate from other samples from savanna
(cluster 1). Axis 1 thus highlights a real gap between microcommunities observed on termitaria, dominated by Magyaria cf reticulata and Oppia bituberculata (species points MRE and OBI in Fig. 3A), and those found elsewhere in the savanna, where the dominant species are Graptoppia parva and Ramusella cf. tasetata (GPA and RTA in Fig. 3(A)). Relative abundances of dominant species are given in Table 3.
The seasonal effect is well pronounced along axis 2, all dry relev6 points but one being located over rainy relev6 points.
3.2.3. Forest and woodland communities Relev~s from dense forest form a nucleus around
which woodland relev6s are scattered, those from termitaria on the right, others on the left (Fig. 3(B)). For each season, it is possible to follow a regressive sere from the typical forest to woodlands, passing through forest clearings (white arrow in Fig. 3(B)). Contrary to what was observed in savanna, there is no gap between relev6 points. Dominant species are detailed in Table 3. Of special interest is Suctobelba penicillata, which is found to be abundant both in forest (8.47 + 4.25%) and on termitaria of woodland (10.50 + 12.58%), but much less abundant elsewhere in woodlands (2.69 + 1.65%). Berlesezetes africanus tends to be more abundant in forest (7.62 _+_ 3.18%) than in woodland (3.68 ___ 3.41%), while other species listed in Table 3 would be more abundant in wood- land. These are just tendencies, as percentages vary greatly within each vegetation type. Again, axis 2 reflects the impact of seasons.
3.3. Dominant and indicator species
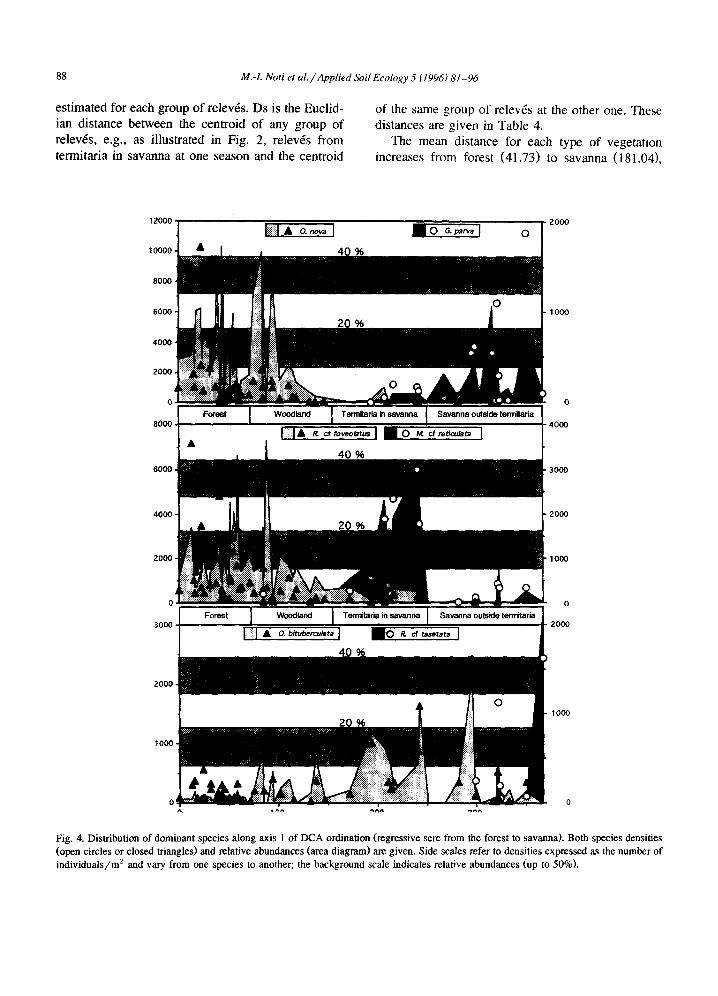
The distribution of dominant species along DCA axis 1 is given in Fig. 4. Most of them appear to be indicator species. Oppiella nova, a dominant species in forest and woodland (up to 40% of oribatid mites) is considered to be an indicator of both vegetations, termitaria from woodland excepted (appendix), with densities of up to 10000 individuals/m 2. Ros- trozetes cf. foveolatus, a dominant species in forest and woodland (up to 40% of oribatid mites) is, however, considered to be an indicator of both vege- tations plus the termitaria from savanna (see ap- pendix).
86 M.-I. Noti et al. / Applied Soil Ecology 5 (1996) 81-96
A
In
VEGETATION
~ Forest Woodland Savanna
MACROHABITAT • [ ] No grass • 0 With grass A ~ High termitaria -I- x Clearing
SEASON
D O A x Dry
• O A + Rainy
0 I O0 200 300 4"00 AXl5 1
B t
d o ' ~ - ~ - , d d d ~ii~:i~:i~iiiiiiiiiii
C I
-=
D°o I =~ , , 1 ~ 300
!
M.-L Noti et al./Applied Soil Ecology 5 (1996) 81-96 87
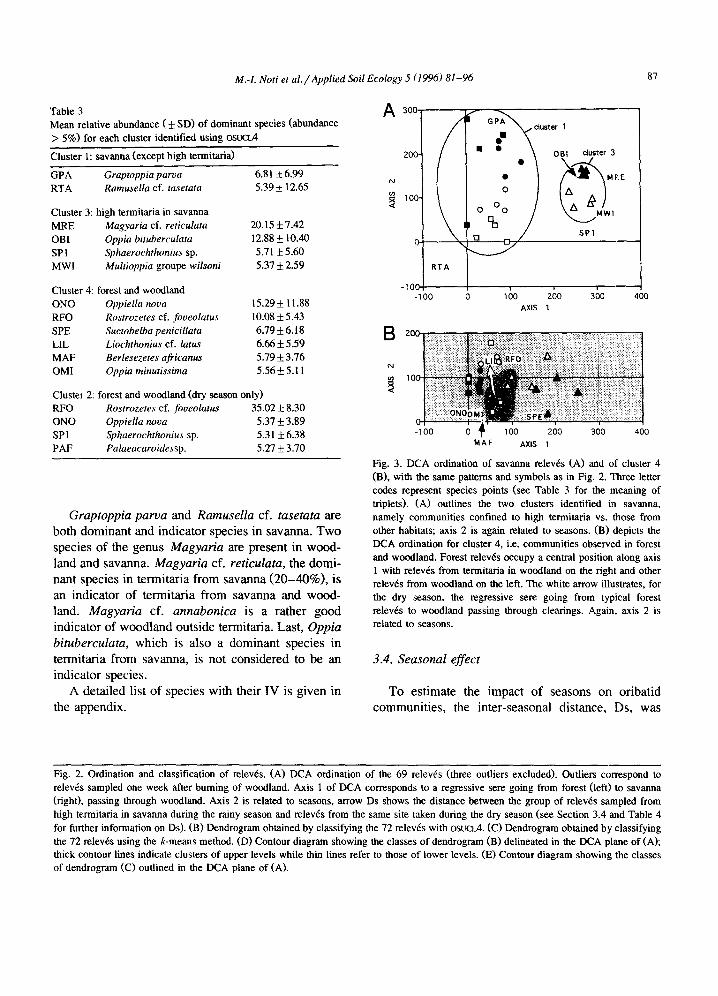
Table 3 Mean relative abundance ( + SD) of dominant species (abundance > 5%) for each cluster identified using osuoA
Cluster 1: savanna (except high termitaria)
GPA Graptoppia parva 6.81 ± 6.99 RTA Ramusella cf. tasetata 5.39 ± 12.65
Cluster 3: high termitaria in savanna MRE Magyaria cf. reticulata 20. l 5 + 7.42 OBI Oppia bituberculata 12.88 ± 10.40 SPI Sphaerochthonius sp. 5.71 ± 5.60 MWI Multioppia groupe wilsoni 5.37 + 2.59
Cluster 4: forest and woodland ONO Oppiella nova 15.29 _+ 11.88 RFO Rostrozetes cf. foveolatus 10.08 ___ 5.43 SPE Suctobelba penicillata 6.79 ± 6.18 LIL Liochthonius cf. latus 6.66 + 5.59 MAF Berlesezetes africanus 5.79 ± 3.76 OMI Oppia minutissima 5.56 ± 5.11
Cluster 2: forest and woodland (dry season only) RFO Rostrozetes cf. foveolatus 35.02 + 8.30 ONO Oppiella nooa 5.37 ± 3.89 SPI Sphaerochthonius sp. 5.31 + 6.38 PAF Palaeacaroidessp. 5.27 + 3.70
Graptoppia parva and Ramusella cf. tasetata are
b o t h d o m i n a n t and i nd i ca to r spec ies in s avanna . T w o
spec ies o f the g e n u s Magyaria are presen t in w o o d -
l and and savanna . Magyaria cf. reticulata, the d o m i -
n a n t spec ies in t e rmi t a r i a f r o m s a v a n n a ( 2 0 - 4 0 % ) , is
an ind ica to r o f t e rmi t a r i a f r o m s a v a n n a and w o o d -
land. Magyaria cf. annabonica is a r a the r g o o d
ind ica to r of w o o d l a n d ou t s ide termi tar ia . Las t , Oppia
bituberculata, w h i c h is a lso a d o m i n a n t spec ies in
t e rmi t a r i a f r o m savanna , is no t c o n s i d e r e d to be an
ind ica to r species .
A de ta i l ed list o f spec ies wi th the i r IV is g i v e n in
the append ix .
OBI duster 3
PJ (D i MRE
SP1 o
RTA
-100 -100 0 1;0 2;0 3;0 400
B
N
AXIS 1
)
M A F AXIS 1
Fig. 3. DCA ordination of savanna relev~s (A) and of cluster 4 (B), with the same patterns and symbols as in Fig. 2. Three letter codes represent species points (see Table 3 for the meaning of triplets). (A) outlines the two clusters identified in savanna, namely communities confined to high termitaria vs. those from other habitats; axis 2 is again related to seasons. (B) depicts the DCA ordination for cluster 4, i.e. communities observed in forest and woodland. Forest relev6s occupy a central position along axis 1 with relev6s from termitaria in woodland on the right and other relev6s from woodland on the left. The white arrow illustrates, for the dry season, the regressive sere going from typical forest relev6s to woodland passing through clearings. Again, axis 2 is related to seasons.
3.4. Seasonal effect
T o es t ima te the i m p a c t o f s ea sons o n o r iba t id
c o m m u n i t i e s , the in t e r - seasona l d i s t ance , Ds, was
Fig. 2. Ordination and classification of relev6s. (A) DCA ordination of the 69 relev6s (three oudiers excluded). Outliers correspond to relevds sampled one week after burning of woodland. Axis 1 of DCA corresponds to a regressive sere going from forest (left) to savanna (right), passing through woodland. Axis 2 is related to seasons, arrow Ds shows the distance between the group of relevEs sampled from high termitaria in savanna during the rainy season and relevEs from the same site taken during the dry season (see Section 3.4 and Table 4 for further information on Ds). (B) Dendrogram obtained by classifying the 72 relev6s with OSUCL4. (C) Dendrogram obtained by classifying the 72 relev6s using the k-means method. (D) Contour diagram showing the classes of dendrogram (B) delineated in the DCA plane of (A); thick contour lines indicate clusters of upper levels while thin lines refer to those of lower levels. (E) Contour diagram showing the classes of dendrogram (C) outlined in the DCA plane of (A).
88 M.-L Noti et al . / Applied Soil Ecology 5 11996) 81-96
estimated for each group of relev~s. Ds is the Euclid- ian distance between the centroid of any group of relevds, e.g., as illustrated in Fig. 2, relev6s from termitaria in savanna at one season and the centroid
of the same group of relev6s at the other one. These distances are given in Table 4.
The mean distance for each type of vegetation increases from forest (41.73) to savanna (181.04),
12000
10000
8000
6000
4000
2000
0
8000
2000
1000
0
4000
4000 2000
0 0
3000, 2000
2000,
1000
o' ¢1.
100o
Fig. 4. Distribution of dominant species along axis 1 of DCA ordination (regressive sere from the forest to savanna). Both species densities (open circles or closed triangles) and relative abundances (area diagram) are given. Side scales refer to densities expressed as the number of individuals/m 2 and vary from one species to another; the background scale indicates relative abundances (up to 50%).
M.-1. Noti et al . / Applied Soil Ecology 5 (1996) 81-96 89
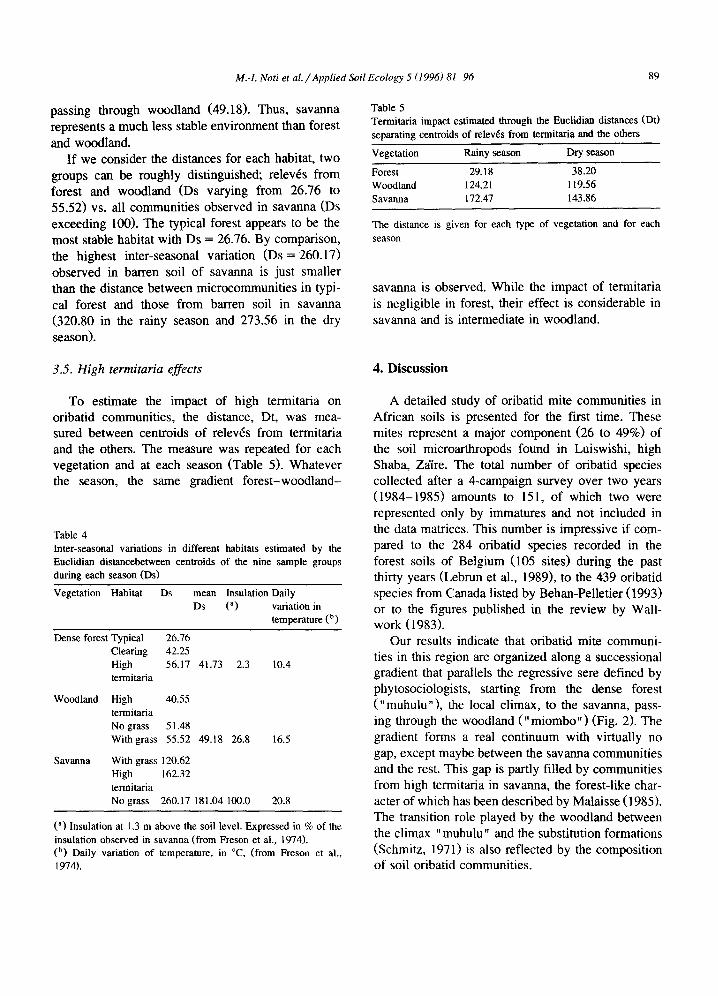
passing through woodland (49.18). Thus, savanna represents a much less stable environment than forest and woodland.
If we consider the distances for each habitat, two groups can be roughly distinguished; relev6s from forest and woodland (Ds varying from 26.76 to 55.52) vs. all communities observed in savanna (Ds exceeding 100). The typical forest appears to be the most stable habitat with Ds = 26.76. By comparison, the highest inter-seasonal variation (Ds = 260.17) observed in barren soil of savanna is just smaller than the distance between microcommunities in typi- cal forest and those from barren soil in savanna (320.80 in the rainy season and 273.56 in the dry season).
Table 5 Termitaria impact estimated through the Euclidian distances (Dt) separating centroids of relev6s from termitaria and the others
Vegetation Rainy season Dry season
Forest 29.18 38.20 Woodland 124. 21 119.56 Savanna 172.47 143.86
The distance is given for each type of vegetation and for each season
savanna is observed. While the impact of termitaria is negligible in forest, their effect is considerable in savanna and is intermediate in woodland.
3.5. High termitaria effects 4. Discussion
To estimate the impact of high termitaria on oribatid communities, the distance, Dt, was mea- sured between centroids of relev6s from termitaria and the others. The measure was repeated for each vegetation and at each season (Table 5). Whatever the season, the same gradient forest-woodland-
Table 4 Inter-seasonal variations in different habitats estimated by the Euclidian distancebetween centroids of the nine sample groups during each season (Ds)
Vegetation Habitat Ds mean Insulation Daily Ds (a) variation in
temperature (t')
Dense forest Typical 26.76 Clearing 42.25 High 56.17 41.73 termitaria
Woodland
Savanna
2.3 10.4
High 40.55 termitaria No grass 51.48 Withgrass 55.52 49.18 26.8 16.5
With grass 120.62 High 162.32 terrnitaria No grass 260.17 181.04 100.0 20.8
(a) Insulation at 1.3 m above the soil level. Expressed in % of the insulation observed in savanna (from Freson et al., 1974). (b) Daily variation of temperature, in °C, (from Freson et al., 1974).
A detailed study of oribatid mite communities in African soils is presented for the first time. These mites represent a major component (26 to 49%) of the soil microarthropods found in Luiswishi, high Shaba, Za;fre. The total number of oribatid species collected after a 4-campaign survey over two years (1984-1985) amounts to 151, of which two were represented only by immatures and not included in the data matrices. This number is impressive if com- pared to the 284 oribatid species recorded in the forest soils of Belgium (105 sites) during the past thirty years (Lebmn et al., 1989), to the 439 oribatid species from Canada listed by Behan-Pelletier (1993) or to the figures published in the review by Wall- work (1983).
Our results indicate that oribatid mite communi- ties in this region are organized along a successional gradient that parallels the regressive sere defined by phytosociologists, starting from the dense forest ("muhulu"), the local climax, to the savanna, pass- ing through the woodland (" miombo") (Fig. 2). The gradient forms a real continuum with virtually no gap, except maybe between the savanna communities and the rest. This gap is partly filled by communities from high termitaria in savanna, the forest-like char- acter of which has been described by Malaisse (1985). The transition role played by the woodland between the climax "muhulu" and the substitution formations (Schmitz, 1971) is also reflected by the composition of soil oribatid communities,
90 M.-I. Noti et al.// Applied Soil Ecology 5 (1996) 81-96
This oribatid community gradient is also related to soil (litter and humus) properties, which vary depending on the type of vegetation (Goffinet, 1973, 1976). For instance, the litter layer depth is more important in forest than in woodland, whereas the litter is virtually absent in savanna except at the base of grass tufts. The relation between soil properties and microarthropod communities is well known in the temperate zone (Schaefer and Schauermann, 1990) and, as regards the oribatid mites, is well documented by Lions (1977b), Lions (1979), Wan- thy and Lebrun (1980), Wauthy (1981), Wauthy (1982), Poursin and Ponge (1982).
Within the gradient, several oribatid communities can be distinguished. The outliers set apart, OSUCL4 tends to recognize three major groups along the regressive sere, one cluster from savanna, another from woodland and two from forest, both of which are characterized by the same dominant species but in the reverse order (Fig. 2(D)). The k-means method identifies four clusters with no outliers, three directly related to vegetation and one composed of relevds from high termitaria in savanna and woodland (Fig. 2(E)). The last cluster is of interest for the woody plant composition of these termitaria is relatively similar to one another (see Table 1 in Malaisse, 1985). The discrepancies between results of the two cluster analyses, as well as the relocations made by the k-means method, tend to support the hypothesis of a real continuum from forest to savanna, corre- sponding to a gradient within which different parti- tionings can be carried out depending on the sensitiv- ity to dominant species or the structure of communi- ties. OSUCL4 tends to cluster communities with simi- lar species profiles irrespective of densities, while the k-means method is more sensitive to the species "mass" (hence the recognition of forest communities characterized by high densities).
Within the gradient, oribatid communities related to special habitats may occupy special positions, for example those from forest clearings, which are lo- cated between those of the typical forest and wood- land (Fig. 3). Another intermediate position is occu- pied by communities colonizing high termitaria in savanna. In contrast, those colonizing high termitaria in woodland do not occupy an intermediate position between other woodland habitats and the forest, as the muhulu-like character of the associated vegeta-
/
tion would have suggested (Malaisse, 1985); they are however quite distinct from other communities of forest and woodland. Peculiarities of the soil fauna associated with woodland termitaria might be related to a specific vegetation rich in eutrophic species (Malaisse, 1984) and to soil properties which, in termitaria, contain more thin elements (Maldague, 1959, 1961) and is richer in calcium (Aloni, 1985).
Termites have been referred to as "key" or "keystone" species in the ecosystem in which they live by Whitford et al. (1982) and Jones (1990). This view seems to apply to high termitaria in savanna. Their impact on oribatid mite communities is so strong that a peculiar community characterized by Magyaria cf. reticulata is associated with them. However, the effect of termitaria is less pronounced in the woodland and negligible in the forest. The role of termites as "keystone" species in the ecosystem would be highly variable, depending on the ecosys- tem itself.
All of these oribatid communities may be defined by dominant and indicator species. Forest and wood- land communities are characterized by Oppiella nova and Rostrozetes cf. foveolatus, both considered as indicators, whereas Graptoppia parva and Ra- musella cf. tasetata are dominant and indicator species in savanna. These findings prompt some comments as O. nova is an ubiquitous species found in all types of soil and R. foveolatus is found from peaflands in Canada to the Amazonian Rain forest (Behan-Pelletier, pers. comm.). First, our findings are based on quantitative approaches and not merely on presence/absence data. Second, the systematics of the genus Oppia and related genera recently revised by Woas (1986) might be more complex than expected, as shown by Lions (1977a), Lions (1982), who demonstrated the existence of two different "forms" in Quadroppia quadricarinata. The situa- tion is similar in other groups, e.g. in the genus Rostrozetes of which Beck (1965) studied many species from South America and Africa, distinct only through subtle differences. In any case, these species might probably serve as indicators of soil quality, as recently reviewed by Stork and Eggleton (1992).
The last highlight in our results concerns the impact of seasons. The better protected the habitat, the smaller are the composition fluctuations within each community. Thus, the variations observed in
M.-L Noti et a l . / Applied Soil Ecology 5 (1996) 81-96 91
the soil fauna sheltered by the forest and woodland are weak and the minimum value is observed in the typical forest. In contrast, savanna communities un- dergo drastic changes that are nearly as large as the distance between the extremes of the successional gradient. However, as the data matrix we used in- cluded only the adult stase, the results must be interpreted carefully. Indeed, the drastic variations observed in savanna may be explained either by a real species turnover related to seasons, or by well marked life cycles related to specific life strategies, or by a combination of both. In any case, our results agree with experiments carried out by Koehler and Born (1989) who provided evidence that the vegeta- tion structure had a deep influence on the soil fauna through specific microclimate.
dient we observed is thus a direct consequence of man's activities, The impact of these activities on tropical forests is not limited to a decrease in soil animal densities and biological activity (e.g. Maldague (1961), Critchley et al. (1979), Badejo and Lasebikan (1988), Badejo (1990), Okwakol (1994) for Africa, Adis and de Albuquerque Ribeiro (1989) for South America) but results in a real alteration of the whole ecosystem, from the vegetation structure to the functioning and composition of the soil fauna. In such a context, soil conservation seems to be of major importance as it probably constitutes a huge reservoir of biodiversity (Andr6 et al., 1994, Lee, 1994).
Acknowledgements
5. Conclusion
Our study indicates that the human impact on soil communities is huge. In the short term, burning has a drastic impact on the soil oribatid fauna. Few indi- viduals and few species survive, so that the composi- tion is so affected that such "communities" are true outliers. In the long term, repeated burning induces the transformation of the forest into woodland and, associated with some agricultural practices, may even lead to complete deforestation. The successional gra-
This is part of a D. Sc. thesis submitted by the first author who wishes to thank Profl Ph. Lebrun for his invaluable assistance and the late Prof. Bourgeois for her support, much advice and interest to environ- mental problems in the Lubumbashi region. The authors would like to thank Prof. F. Malaisse for assistance in the field and for being helpful with the selection of sites. They also thank Dr. V. Behan-Pel- letier and Prof. Ph. Lebrun, R. Norton and J. Ruelle for commenting upon an earlier draft of the manuscript.
92 M.-L Noti et aL /Applied Soil Ecology 5 (1996) 81-96
Appendix A
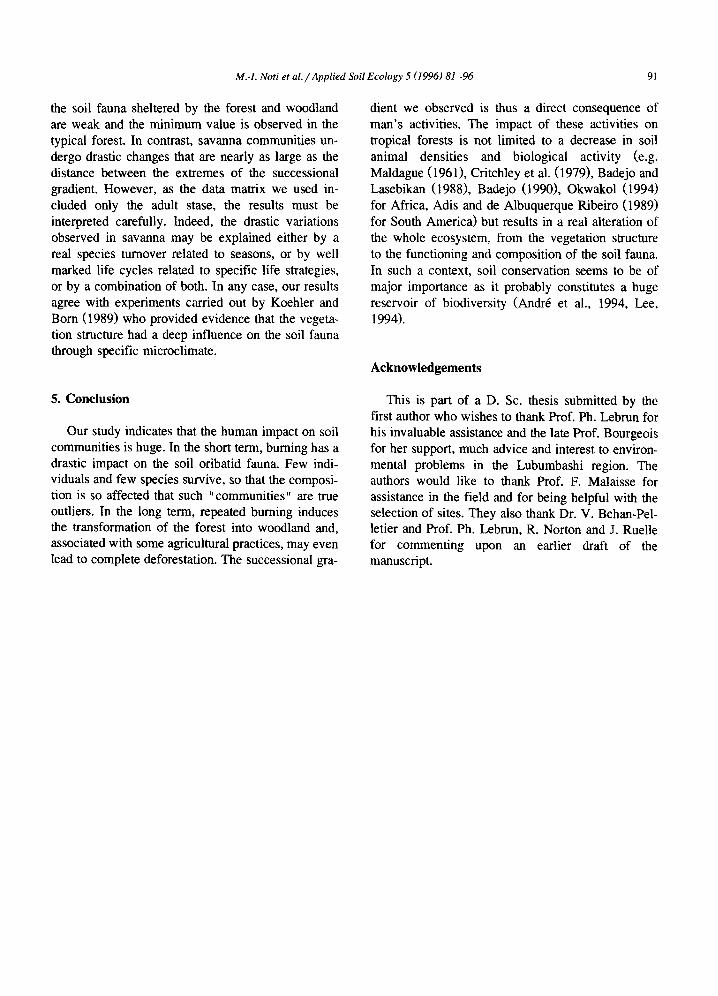
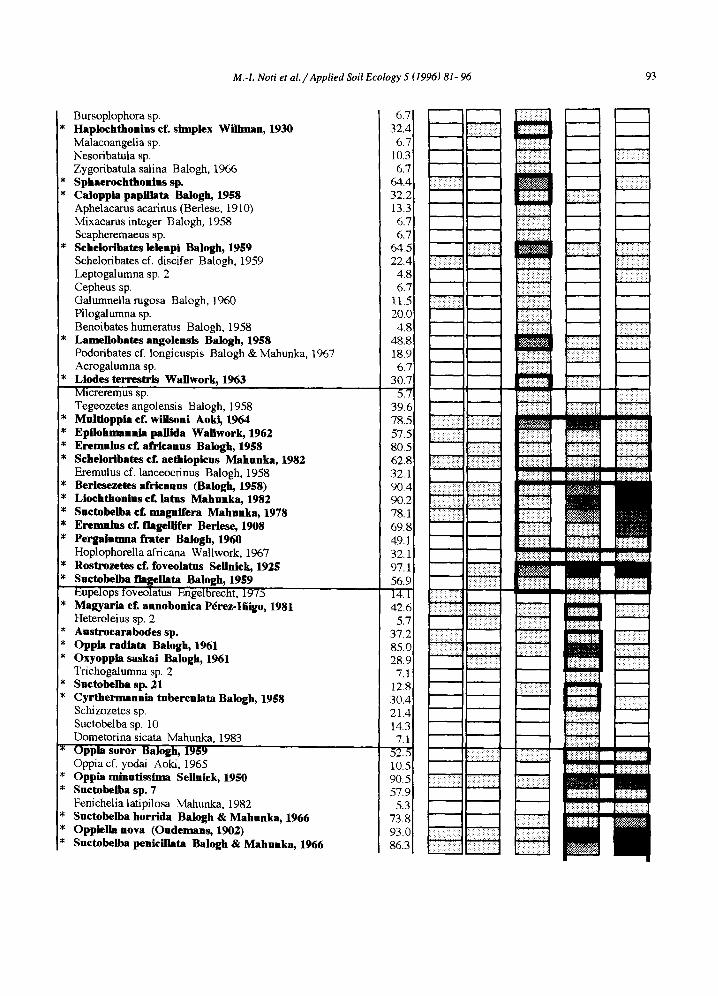
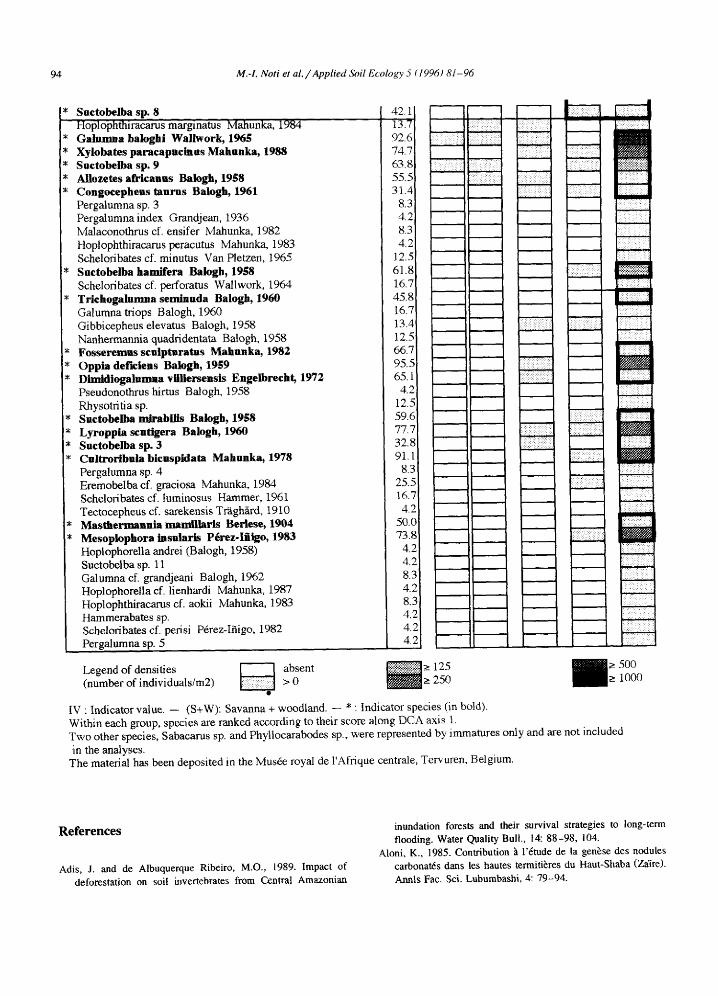
Appendix. Li st and dis tri bution of ori baild mites (adults only).
Species
Striatoppia papillata Balogh & NIahfinka, i966 Hetemleius longissimus Balogh & Mahunka, 1966 Zygoribatula el. schanenhergi Mahnnka, 1978 Haplozetes sp. 2 Hypozetes translamellatns Wailwork, 1965 Phyliozetes alatns Mahunka, 1982
* Ceratozetes cf. rostroserratus Wallwork, 1965 !* Africortbatesevansi Balogh, 1958
lncabates sp. 1 Malaconothms cf. punctulatus Balogh, 1958
I, Zetomotrichus sp. Oppia Sp. 14
* Symphauloppia cf. lnterrnpta Jeleva, 1962 * Passalozetes pecttnatns Wallwork, 1964 * Oxyoppia cf. complicata Mahunka, 1968 * Tectocephens spinosus Mahnnka, 1984 * T~heremaeus areolatns Balogh & Mahnnha, 1967 * Tectocepheus vlcartus Balogh, 1958 * Haplozetes of. inslgnis Balogh & Mahenka, 1966
Pafalamellobates schoutedeni (Ba]ogh, 1958) Pilobatella punctulata Balogh & Mahunka, 1967 Scutove~ex subspinipes Balogh, 1959 Scheloribates cf. flmbriatus Thor Scheloribates cf. praencisus Berlese, 1910 Nesotocepheus cf. setiger Hammer, 1972 Tutomzetes sp. Ramusella cf. tasetata Sub/as, 1980 Eohypochthonius cf vilhemamm (Balogh, 1958) Oppia pluripectinata Batogh, 1961
* Graptoppla parva (Kok, 1967) * Papillonotus of. hauseri Mahnnka, 1988 * Papiilonotus cf. granulosus Wallwork, 1961 * Oppia deboissezoni Balogh & Mahnnka, 1966
Xylobates sp. 2 Oppia sp. 13
I Oppia piloselIa Balo'gh; 1959 ..... Microtegeaeus cf, quadrisetosa Balogh & Mahunka, 1977
~Oppia lanceoseta Balogh, 1959 Oppia bitubercutata Balogh, 1958 Palaeacaroides sp.
~Trichogalumna montana Balogh, 1962 vr 7 Suctobelbila fonticula Hammer, 19 5
Brachychochthonius cf. heterotrichus (Balogh, 1963) .... Annecta~arus africanus Balogh,196f
Allogalumna pdlucida Wallwork, i965 * Arcoppia sp.
Unguizetes reticulatus Waltwork, 1965 * Magyaria cf. retieulata (Balogh, 1958)
Leptogalumna ciliata Balogh, 1960 Oppia sp. 20 Hemileius tropicus Balogh, 1958 Trimalaconothrus cf. africanus Balogh, 1958
IV
14,3 14.3 57. i] 20.61 67.3 96.1 68.3, 34.2 21.6 11.9 28.6 55.6 25.0 50.0 42.8 74.8 69.4 50,5 24.0 10.4 40.5 12.5 48.3 70.3 15.8 11.1 50.2 27.6 12.3 84.8 93.7 33.3 66,8 31.0 14.2 42.i~ 33,3 59,4 78.3 60. c 66.T 36.7 94.~
Savanna Termi tada Forest Dry Rainy (S+W) Woodland
. . . . . . . . . . . .
; .: : ,2 ; :"z :,;. ' . . : . | | = : =
: 5 . : . . : : : : : : ' . : : ;
:::::::::::::::::::::: : : : ::.::;::::.::::::::
iiiiiii?i::i: ?i:ii::?iil
~ ? i i : !i!!i:i:i?i? ~:_L
' : : i ! . i : . ! : ; ;
====================== ,i;i.:::: ::::
I! !I ~ ] - ~ i < , .:~r : : : : - : : : : : : : . . . : . , : : = . . . . ! , : . : : ; : ; : : : ; 5 ~.
' ' ~ ~ " : ~ . : , . . . . , . . . . . ; ! . - - , - - ~
_
!:: ;ii:::]!i~! [!!i':?.i?::/:!:? ]:i.i|
! . : . : - i!, ,i::r!i:::i~ i ~ i i q ! ! : i - . ~ - . . \ . _ . . , , - . . , . : . . . .
i , 1 : 7 : ; 4 . ; , : . : : 1 , , . - , , . . -, , . . . .
~ :i::: ?ii : : : i:il :::7.: ~ :. ~ ~ ! : ~ i]:i]~ [ :[~[ i: ~. ][] [! ]~i]][ [iii: ]i] ]]]] i:: i i ]]i:]~]!::::] ]$]i]
. . . . , . . . . . . . . . . _ .
; : L . : , : . ' , : : , ,
: 7 : : : ! f : ~ . ~ : . : : : ~ : : : : : : : : : : : : : : : : : : : : : : : - - "
M.-I. Noti et a l . / Applied Soil Ecology 5 (1996) 81-96 93
Bursoplophora sp. Haplochthonins cf. simplex Wiilman, 1930 Malacoangelia sp. Nesoribatula sp. Zygoribatula salina Balogh, 1966 Sphaerochthonlns sp. Caloppia papillata Balogh, 19~8 Aphelacarus acarinus (Berlese, 1910) Mixacarus integer Balogh, 1958 Scapheremaeus sp. Schelodbates lelenpi Balogh, 1959 Scheloribates cf. discifer Balogh, 1959 Leptogalumna sp. 2 Cepheus sp. Galumnella rugosa Balogh, 1960 Pilogalumna sp. Benoibates humeratus Balogh, 1958 Lamellobates angolensis Balogh, 1958 Podoribates cf. longicuspis Balogh & Mahunka, 1967 Acrogalumna sp. Llodes terrestris Wallwork, 1963 Micreremus sp. Tegeozetes angolensis Balogh, 1958
* Mnltioppla ofº wilJsonl Aoki, 1964 * Epflohmannla pamda Wallwork, 1962 * Eremnlns of. africanns Balogh, 19~8 [* Schelorlbates cf. aethiopicns Mahunka, 1982 l, Eremulus cf. lanceocrinus Balogh, 1958
Berlesezetes africanus (Balogh, 1958) j* Llochthontns cf. latus Mahnnka, 1982 * Snctobelba of. magnifera Mahnnka, 1978
i , Eremulus cf. flagellifer Berlese, 1908 i, Pergainnmafrater Balogh, 1960 i, HoplophoreUa africana Wallwork, 1967
Rostrozetes eL foveolatus Sellnick, 192~ * Snctobelba flagellata Balogh, 1959
Eupelops foveolatus Engelbrecht, 1975 * Magyarla el. annobonica P~rez-Ifiigo, 1981
Heteroleius sp. 2 * Austrocarabodes sp. * Oppia radlata Balogh, 1961 * Oxyoppia saskai Balogh, 1961
Trichogalumna sp. 2 * Snctobeiba sp. 21 * Cyrthermannia tuberculata Balogh, 1958
Schizozetes sp. Suctobelba sp. 10 Dometorina sicata Mahunka, 1983 Oppia soror Balogh, 1959 Oppia cf. yodai Aoki, 1965
* Oppia mlnntissima Seilnick, 1950 * Snctobelba sp. 7
Fenichelia latipilosa Mahunka, 1982 Suctobelba horrida Balogh & Mahunka, 1966
* Oppiella nova (Ondemans, 1902) * Suctobelba penicillata Balogh & Mahnnka, 1966
, . . . . . . . . . . .
. . . , H
i .... i' ................. ~ . ~ ~
; : ; ; : : : : : : : ;
! : : ; . : : : : : ' : : : . : , . !
I:!:i:i:i:i:!:i:!:ix!:!:l I
::::::::::::::::::::::: . . . . . . . . . . :::::::::::::::::::::::: :.:.: :.: : . . . . _ ,
| : : :.:.: : : :,: :.:: : I I ::::;: • .i ::::::::::::::::::::::: ! . :.: :
1::5;::;: : : : : : : : : : : : :# ' n :,: : :,: :.:.: :.: : ! u
i?! :! : i i ! i i l l ............
::::::::::::::::::::::::::: !
::::::::::::::::::::::::::: I --" •
::::::::::::::::::::: ::1 ::::::::::::::::::::: : : : ; : ; : : : F:~:~:~:i::i:~:~:~:: -"::~ ~:?~ ~::
: ::::::::::: ..i:i:!tl!U :ti~i~i, " i i! !I i:.iiiii!!!~!ill] F : i : i l ::::::::::::::::::::::::::: I: :i I::: :I:I: i: :!1 ::::::::::::::::::::::::: n :':::::
::::::: ::::: ' . . . . . . . . ' : :i:i: : :;::::::::: : : : ; : : ;::
ii::~ ~:!i!1::~!¢~:#i::~:::!::, , ::::]ii::i::]:]::iiiiiii]i] fii)iiiiii::'.ij:ii!i}]ii t i :# i
: : : : : : : : : : : : : : : : : : : : : : : : : : : : : : : : : : : : : : : : : :
....... ~: ~ : ~ I . . : .
: .~:+:: + :+ :+ :+ : :!
!iYi: I ......................
iiiilili~ii~iii!i!!!i!i! ~ | I I:I:I i : i? i¢ i : i : i : ]
;!~:!:i?;?i:i:!:i~ !~:?~&:?::?i:i I:L ., . , : . . . : : : : : :
lili!ii!ii!i!i!iiiiiii!i!" ~iiiiii!iiiiiiiiiii liiiiii~iiii!iii!~ iiiiilili!iti -~,..,,,
+: ;;:::5;:::;
:Z;::;:: ::::::::
:IT# ':( #SJ :i:i:~8 :~:!:i:i ::::
i . ; : : ; : : .:.:
Iiiiiii! iii:. :.ii !i!i :
: : : : : : : : : : : : : : : : : : : : : : I
: i : : : : t : : l I!~i!::i:::i!::i!i!::i::t [i:¢illii
Ii:i i : : ! : ! i : i&::: l
i!'ii!~!i:L~ii:iiiiiiliiiill!iii:Li!~:'~ii!~,~ili;ili~il r::,:::::,:::iiiili!i:~
m R N M
°
94 M.-L Noti et al , /Appl ied Soil Ecology 5 (19961 81-96
* Suctobelba sp. 8 42.1 Hoplophthiracarus margmatus Mahunka, 1984 13.7
* Galunma baloghi Wallwork, 196~; 92.6 * Xylobates paracapncines Mahunka, 1988 74.7 * Suctobelba sp. 9 63.8 * Al lozetesafr icanns Balogh, 19~;8 55.5 * Congocephenstaurus Balogh, 1961 31.4
Pergalumna sp. 3 Pergalumnaindex Grandjean, 1936 81321 Malaconothrus cf. ensifer Mahunka, 1982 8.31 Hoplophthiracarus peracutus Mahunka, 1983 4.21 Scheloribates cf. minutus Van Pletzen, 1965 12.51
* Sactobeiba hamifera Balogh, 1958 61.81 Scheloribates cf. pefforatus Wallwork, 1964 16.71
* Triehogalumna seminuda Balogh, 1960 45.81 Galumna triops Balogh, 1960 16.71 Gibbicepheus elevatus Balogh, 1958 13.4 ~ Nanhermannia quadridentata Balogh, 1958 12.5
* Fosseremus sculptnratns Mahunka, 1982 66.7 * Oppiadeficlens Balogh, 19~9 95.5 * Dimidtogalunma vgllersensis Engelbrecht, 1972 65.1
Pseudonothrus hirtus Balogh, 1958 4.2 Rhysotritia sp. 12.5
* Suctobelba mlrabilts Baiogh, 1958 59.6 * LyropptascutJgera Balogh, 1960 77,7 * Suctobelba sp. 3 32.8 * Cultroribula bicgspidata Mahunka, 1978 91.1
Pergalumna sp. 4 8.3 Eremobelba cf. graciosa Mahunka, 1984 25.5 Schelodbates cf. tuminosus Hammer, 1961 16.7 Tectocepheus cf. sarekensis Tr~gh~ird, 1910 4.2
* Masthermannla ~ r i s Berlese, 1904 50.0 * Mesoplophora insularis P~rez-liigo, 1983 73.8
Hoplophorella andrei (Balogh, 1958) 4.2 Suctobelba sp. i1 4.2 Galumna ef. grandjeani Balogh, 1962 8.3 Hoplophorella cf. lienhardi Mahunka, 1987 4.~ Hoplophthiracarus cf. aokii Mahunka, 1983 85 Hammerabates sp. 45 Scheloribates cf. perisi P6rez-Ifiigo, 1982 4.: Pergalumna sp. 5 45
Legend of densities ~ absent ~ ~ 1 2 5 (number of individuals/m2) > 0 250
IV • Indicator value. -- (S+W): Savanna + woodland. -- * ' Indicator species (in bold).
)i:i: : : : i i : i i :: il : : : : : i . . 7 1 1 . : : :.: x : :-. : : : . l l ~ . . ~ . = :
. . . . . ~ . .
.:ii~.~:::::i i:~° ;!:..;i::::!2 -i:~ : : i> , . . . . . . ~ , . . . . . . . . .
• : . . . : : . : . : : i - : : : 5 . : : : : . - l : < : - ' : : : - : : : i : : . : : . . . : : . : ;
, . . . . . : . , 'i;!8:i ,:i: :" . - . . . . . . .
::i:~ : : 5 .: : : :
::ii:ii:: ii@i~l ,i::: ! . : ; ? ,
. ~ .
:.:.:.:. ::.: .; :.: :::::::::::::::::::::: ::
- _ : : . . . : : : : . . : - _ . . . . . . . .
, i i i ! # . . . . . . :?i , . i : i i : ! . . . " i . ? . . ' " "
, : : . . : . i
. : : : : : : : ~
i
' " " " ' ' '::: :i ' ::::::::::::::::::::: - ~ - .
=========================== ~
: : : . : : : > : :: ! : : : .: : : : : : . : .
. .: . . . . .
. . : . : : ' . i . i i . . . . . . . . . • .
_ . . . . . . . . . . . . ,
- . : : : : .
- : : : : : : : : : : : : : :
. . . . . . . . . . . . . . . . - : : : 5 : . : : : : : :
. . . . . . .
, : : . 7 : : . : : . ~i!il!iiiii:i. ii!i
| . . . . : i ' • . . . . . . ; . . . . : ' : : . . . . . . . . . . . . . .
i i:iiii,! > 500 > 1000
Within each group, species are ranked according to their score along DCA axis 1. Two other species, Sabacarus sp. and Phyllocarabodes sp., were represented by immatures only and are not included
in the analyses. The material has been deposited in the Mus6e royal de l'Afrique centrale, Tervuren, Belgium.
References
Adis, J. and de Albuquerque Ribeiro, M.O., 1989. Impact of deforestation on soil invertebrates from Central Amazonian
inundation forests and their survival strategies to long-term flooding. Water Quality Bull., 14" 88-98, 104.
Aloni, K., 1985. Contribution ~ l'6tude de la gen~se des nodules carbonat6s darts les hautes termiti~res du Haut-Shaba (Z~/ire). Annls Fac. Sci. Lubumbashi, 4: 79-94.
M.-I. Noti et a l . / Applied Soil Ecology 5 (1996) 81-96 95
Andr6, H.M., 1988. Variable centered methods and community classification. Coenoses, 3: 69-78.
Andr6, H.M., Lebrun, Ph. and Noti, M.-I., 1992. Biodiversity in Africa: a plea for more data. J. Aft'. Zool., 106: 3-15,
Andr6, H.M., Noti, M.-I. and Lebrun, Ph., 1994. The soil fauna: the other last biotic frontier. Biodiversity and Conservation, 3: 45-56.
Badejo, M.A., 1990. Seasonal abundance of soil mites (Acarina) in two contrasting environments. Biotropica, 22: 382-390.
Badejo, M.A. and Lasebikan, B.A., 1988. Comparative studies of the acarine populations of a secondary regrowth forest and a cassava plantation in lle-lfe, Nigeria. Pedobiologia, 32: 111- 116.
Balogh, J., 1972. The Oribatid Genera of the World. Akademiai Kiado Budapest, 182 pp.
Balogh, J., 1983. A partial revision of the Oppiidae Grandjean, 1954 (Acari: Oribatei). Acta Zool. Hung., 29: 1-79.
Balogh, J. and Balogh, P., 1988. Oribatid Mites of the Neotropical R6gion I. Elsevier, Amsterdam, 355 pp.
Balogh, J. and Balogh, P., 1990. Oribatid Mites of the Neotropical Region II. Elsevier, Amsterdam, 333 pp.
Balogh, J. and Mahunka, S., 1983. Primitive Oribatids of the Palaearctic Region. Elsevier, Amsterdam, 372 pp.
Barnes, R.F.W., 1990. Deforestation trends in tropical Africa. Afr. J. Ecol., 28: 161-173.
Beck, L., 1965. Uber Variabilit~tt und Wertigkeit morphologischer Merkmale bei adulten Oribatiden (Arachnida, Acari) am Beispiel der Gattung Rostrozetes Sellnick 1925. Abh. Senck- enb. Naturf. Ges., 508: 1-64.
Behan-Pelletier, V.M., 1993. Diversity of soil arthropods in Canada: Systematic and ecological problems. Mem. Ent. Soc. Can., 165: 11-50.
Colonval-Elenkov, E. and Malaisse, F., 1975. Contribution h l'6tude de l'6cosyst~me forSt claire (Miombo). Note 20. Re- marques sur 1'6comorphologie de la flore termitophile du Haut-Shaba (Zffire). Bull. Soc. R. Bot. Belg., 108: 167-181.
Critchley, B.R., Cook, A.G., Critchley, U., Perfect, T.J., Russel- Smith, A. and Yeadon, R., 1979. Effects of bush clearing and soil cultivation on the invertebrate fauna of a forest soil in the humid tropics. Pedobiologia, 19: 425-438.
Dufr~ne, M. and Legendre, P., in press. Species assemblages and indicator species: The need for flexible asymmetrical ap- proach. Ecology.
FAt , 1990. Interim Report on the State of Forest Resources Assessment. Tenth Session of the F A t Committee on Forestry, Rome, 24-28 September 1990. Food and Agriculture Organi- zation, Roma.
Freson, R., 1973. Contribution ~t 1'6tude de l'6cosyst~me for& claire (Miombo). Note 13. Aper~u de la biomasse et de la productivit6 de la strate herbac6e au miombo de la Luiswishi. Annls Univ. Abidjan, 6: 265-277.
Freson, R., Goffinet, J. and Malaisse, F., 1974. Ecological effects of the regressive succession Muhulu-Miambo-Savannah in Upper Shaba (Zffire). Proc. 1st Int. Congress Ecology, the Hague (Wageningen), pp. 365-371.
Gauch, H.G., 1982. Multivariate Analysis in Community Ecology. Cambridge University Press, Cambridge.
Ghabbour, S.I. and Davis, R.C. (Editors), 1988. Proceedings of the Seminar on Resources of Soil Fauna in Egypt and Africa. In: Revue Zool. Afr., 102(3): 261-389.
Goffmet, G., 1973. Contribution ~ l'6tude de l'6cosyst~me for~t claire (Miambo). Note 11: Etude comparative des effectifs de quelques groupes arthropodiens du sol intercalique de quatre biotopes katangais (Z~re). Annls. Univ. Abidjan, ser. E (Ecol- ogy), 6:251-263.
Goffmet, G., I976. Ecologie 6daphique des 6cosyst~mes naturels du Haut-Shaba (Zffire). II. Ph6nologie et fluctuations d6mographiques au niveau des groupes zoologiques dominants et de quelques populations d'arthropodes. Bull. Ecol., 7: 335- 352.
Gower, J.C. and Legendre, P., 1986. Metric and Euclidian proper- ties of dissimilarity coefficients. J. Classification, 3: 5-48.
Hill, M.O. and Gauch, Jr, H.G., 1980. Detrended correspondence analysis: an improved ordination technique. Vegetatio, 42: 47-58.
Jones, J., 1990. Termites, soil fertility and carbon cycling in dry tropical Africa: a hypothesis. J. trop. Ecol., 6: 291--305.
Koehler, H. and Born, H., 1989. The influence of vegetation structure on the development of soil mesofauna. Agriculture, Ecosystems and Environment, 27: 253-269.
Lebrun, Ph., Wauthy, G. and Dufr~ne, M. 1989. Soil mites in Belgium: A review. Proceedings of the Symposium "lnvert6br6s de Belgique", M~m. inst. r. Sci. nat. Belg. 165: 203-210.
Lee, K.E., 1994. The biodiversity of soil organisms. Applied Soil Ecology, 1: 251-254.
Lions, J.-CI., 1977a. Au sujet de la chaetotaxie des pattes et de la pr6sence des polls proranx chez des Oribates proehes du Quadroppia quadricarinata (Michael, 1885). Acarologia, 19: 541-555.
Lions, J.-CI., 1977b. Application du concept de la diversit6 sp~cifique ~ la dynamique de trois populations d'Oribates (Acariens) de la for~t de la Sainte-Baume (Var). l~re partie: R6sultats g6n6raux et variabilit~ temporelle globale. Ecologia Mediterranea, 1: 165-192.
Lions, J.-CI., 1979. Application de l'analyse factorielle des corre- spondances ~ 1'6tude des affinit~s 6cologiques d~termin6es par les populations d'Oribates (Acariens) dans trois stations de la for~t domaniale de la Sainte-Baume (Var). Ecologia Mediter- ranea, 41: 3-32.
Lions, J.-CI., 1982. Statistique sexuelle chez deux formes d'Oribates proches du Quadroppia quadricarinata (Michael, 1885). Acarologia, 23: 373-389.
MacQueen, J.B., 1967. Some methods for classification analysis of multivariate observations. In: L.M. Le Cam and J. Neyman (Editors), Proc. 5th Berkeley Symposium Math. Stat. Probab. Vol. 1. University of California Press, Berkeley, pp. 281-297.
Malaisse, F., 1973. Contribution ~t l'6tude de l'6cosystbme forSt claire (Miombo). Note 8: le projet Miombo. Annls Univ. Abidjan (S6r. E, Ecologie), 6: 227-250.
Malaisse, F., 1978a. Contribution h l'6tude de l'6cosyst~me for~t claire (miombo). Note 35: The Miombo system. In: Tropical Forest Ecosystems, a State of Knowledge Report. UNESCO/UNEP/FAO, UNESCO, Paris, pp. 589-606.
96 M.-L Noti et al . / Applied Soil Ecology 5 (1996) 81-96
Malaisse, F., 1978b. High termitaria. In: Werger, M.J.A. and van Bruggen, A.C. (Editors), Biogeography and Ecology of South- em Africa. Junk Publ., The Hague, pp. 1281-1300.
Malaisse, F., 1982. Comparison of the woody structure in a regressive Zambesian succession: dry evergreen forest-open forest-wooded savanna (Luiswishi, Shaba, Za'ire). Geo-Eco- Trop., 6: 309-350.
Malaisse, F., 1984. Structure d'une for~t dense s~che zamb6sienne des environs de Lubumbashi (Za'ire). Bull. Soc. R. Bot. Belg., 117: 428-458.
Malaisse, F., 1985. Comparison of the woody structure in a regressive zambezian succession, with emphasis on high termi- taria vegetation (Luiswishi, Shaba, Za'ire). Bull. Soc. R. Bot. Belg., 118: 244-265.
Malaisse, F. and Anastassiou-Socquet, F., 1977. Contribution l'6tude de l'6cosystbmes forSt claire (Miombo). Note 24: Phytog6ographie des hantes termiti~res du Shaba m6ridional (Z~ire). Bull. Soc. R. Bot. Belg., 110: 85-95.
Malaisse, F. and Anastassiou-Socquet, F., 1983. Spectres bi- ologiques, surfaces foliaires, types de fruits et mode de diss6mination des plants de ahutes termiti~res &ablies en for~t claires du Shaba m6ridional. Annls Fac. Sci. Lubumbashi, 3: 13-39.
Malaisse, F. and Colonval-Elenkov, E., 1981. Ecomorphologie et anatomie des feuilles des for&s denses s~hes zamb6ziennes. Bull. Soc. R. Bot. Belg., 114: 209-228.
Malaisse-Mousset, M., 1974. Premier aper~ju sur la microflore de quelques sols du Hant-Shaba (Za'ire). P6dologie, 24: 64-70.
Maldague, M., 1959. Analyses des sols et mat6riaux des termiti~,res du Congo beige. Insectes Soc., 6: 343-359.
Maldague, M., 1961. Relation entre le couvert v6g&al et la microfaune, leur importance dans la conservation biologiques des sols tropicaux. Publ. Inst. Natn. Etude agron. Congo (I.N.E.A.C.), S~r. scientifique, 90: 1-122.
Noti, M.-I., 1991. Etude bioc6notique des peuplements des Acariens du sol du Haut-Shaba de la r6gion de Lubumbashi, Za'ire. D.Sc. Thesis, Universit6 Catholique de Louvain, Bel- gium, 391 pp.
Noti, M.-I. and Lebrun, Ph., 1987. Acariens 6daphiques (Acari, Oribatida) dans trois syst~mes contigus du Haut-Shaba, Za'ire: prem!er inventaire et relations avec les types de v6g6tations. Revue Zool. Afr., 101: 233-242.
Okwakol, M.J.N., 1994. The effect of change in land use on soil macrofauna communities in Mbira Forest, Uganda. Afr. J. Ecol., 32: 273-282.
Poursin, J.M. and Ponge, J.F., 1982. Comparaison de trois types de peuplements forestiers (feuillu, mixte, r6sineux) ~t l'aide de la m6sofaune du sol (Collemboles et Oribates). C. R. Acad. Sci. Paris, 294D: 1021-1024.
Schaefer, M. and Schauermann, J., 1990. The soil fauna of beech forests: comparison between a mull and a moder soil. Pedobi- ologia, 34: 299-314.
Schmitz, A., 1971. La v6g&ation de la Plaine de Lubumbashi (Haut-Katanga). Publ. Inst. Natn. Etude agron. Congo (I.N.E.A.C.), S6r. scientifique, 113: 1-388, 16 pl.
Schmitz, A., 1974. L'homme et la v6g&ation du Haut-Sbaba (R6publique d6mocratique du Za'ire). Natur. Belg., 55: 374- 414.
Schmitz, A., 1977. Atlas des Formations V6g~tales du Shaba (Za'ire). Fondation Universitaire Luxembourgeoise, Arlon, 95
PP. Schmitz, A., 1988. R6vision des groupements v6g6taux d6crits du
Za'ire, du Rwanda et du Burundi. Annles Mus. R. Afr. Cen- trale (Sci I~conomiques), 17: 1-277.
Sp~ith, H., 1980. Cluster Analysis Algorithms. Ellis Horwood, Chichester.
Stork, N.E. and Eggleton, P., 1992. Invertebrates as determinants and indicators of soil quality. Amer. J. Alternative Agriculture, 7: 23-32.
Subias, L.S. and Balogh, P., 1989. Identification keys to the genera of Oppiidae Grandjean, 1951 (Acari: Oribatei). Acta Zool, Hung., 35: 355-412.
Sys, C. and Schmitz, A., 1959. Carte des sols et de la v6g&ation du Congo beige et du Ruanda-Urundi. Livraison 9: R6gion d'Elisabethville (Haut-Katanga), Publ. Inst. Natn. Etude agron. Congo (I.N.E.A.C.).
UNEP. 1991. United Nations Environment Programme. Environ- mental Data Report (3rd ed.). Basil Blackwell, Oxford.
Usher, M.B. 1988. Soil invertebrates: Species, populations, com- munities, modelling and conservation with special reference to the African continent. Revue Zool. Afr., 102: 285-300.
Wauthy, G., 1981. Synecology of forest soil oribatid mites of Belgium (Acari, Oribatida). I1. Zoosociological uniformity. Acta Oecologica, Oecol. Gener., 2: 31-47.
Wallwork, J.A., 1983. Oribatids in forest ecosystems. Ann. Rev. Entomol., 28: 109-130.
Wanthy, G., 1982. Synecology of forest soil oribatid mites of Belgium (Acari, Oribatida). III. Ecological groups. Acta Oeco- logica,-Oecol. Gener., 3: 469-494.
Wauthy, G. and Lebrun, Ph., 1980. Synecology of forest soil oribatid mites of Belgium (Acari, Oribatida). I. The zoosocio- logical classes. In: D.L. Dindal (Editor), Soil Biology as Related to Land Use Practices. EPA, Washington, pp. 795- 805.
Whifford, W.G., Steinberger, Y. and Ettershanks, G., 1982. Con- tributions of subterranean termites to the "economy" of Chi- huahuan desert ecosystems. Oecologia (Bed.), 55: 298-302.
Willmann, C., 1931. Moosmilben oder Oribatiden (Oribatei). In: F. Dahl, (Editor). Die Tierwelt Deutschlands, 22: 79-200.
Woas, S., 1986. Beitrag zur revision der Oppioidea sensu Balogh, 1972 (Acari, Oribatei). Andria, 5: 21-224.


![[Oribatid acari (Acari: Oribatei) from Coiba Island National Park, Panamá]](https://img.pdfslide.net/doc/110x75/635570fd8ae64d6d7f0b2802/oribatid-acari-acari-oribatei-from-coiba-island-national-park-panama.jpg)


