Embed Size (px)
Citation preview
Journal
Journal of Hydrology 166 (1995) 15-35
[31
Soilwater chemistry in a holm oak (Quercus ilex) forest: inferences on biogeochemical processes for a
montane-Mediterranean area
Anna Avila”>*, David Bonilla”, Ferran Rodi”, Josep Piiiola, Colin Nealb “Centre de Recerca Ecolbgica i Aplicacions Forestals, Universitat Autboma de Barcelona,
08193 Bellaterra, Spain bInstitute of Hydrology, MacLean Building, Crowmarsh Gzflord, Wallingford OX10 8BB, UK
Received 12 January 1994; revision accepted 26 August 1994
Abstract
Soil solution and free-flowing soilwater were sampled at various depths for 3 years in a plot of holm oak (Quercus ilex L.) in the Montseny mountains (NE Spain). The soil solution retained at -65M kPa in the mineral soil at depths of 20 and 40 cm had a different chemistry from that of throughflow under the humic layer (H-layer throughflow) and, to a lesser extent, from deep subsurface flow. The dominant mobile anion in the soil solution and the deep flow was SO:-, whereas in the H-layer, SOi- was overridden by alkalinity.
H-Layer throughflow chemistry was extremely variable, in consequence of the large number of biogeochemical processes affecting it (e.g. rainfall chemistry, dry deposition, leaching from canopy and litter, decomposition), and of the quantity of water available for transport of solutes. The chemistry of the soil solution was more predictable, as it was governed mainly by nutrient uptake, cation exchange reactions and the seasonal wetting and drying cycles. The chemistry of the deep subsurface flow was often intermediate between that of the soil solution and that of the H-layer throughflow; this suggested a mixture of displaced pre-event soil solution and of H-layer throughflow circulating through preferential flow paths. With humid antecedent conditions, the chemistry of the deep subsurface flow approached that of the soil solution.
The cation concentration relationships in the soil solution were strongly linear. In a homogeneous soil, cation exchange theory predicts this to be expected only for cations of the same charge, whereas cations of different charges should follow power relationships. Our results, however, are consistent with a theoretical approach involving cation exchange reactions in a highly heterogeneous environment. Indeed, our study illustrates the heterogeneous nature of the soils, as the power relationship has been obscured completely.
Soilwater chemistries were markedly different from those of streamwater, particularly under
* Corresponding author.
0022-1694/95/$09.50 0 1995 - Elsevier Science B.V. All rights reserved SSDI 0022-1694(94)02608-4
16 A. Avila et al. / Journal of Hydrology 166 (1995) 15-35
dry conditions. During baseflow, the stream is fed by groundwater, and the soils are probably disconnected from the stream. During humid periods, the chemistry of the streamwater tends toward that of the deep subsurface flow. Chemical hydrograph separation indicates that, on average, stormflow water comprises an approximately one to one mixture of groundwater and deep subsurface flow.
1. Introduction
Soilwater chemistry is the result of many interacting processes, including atmospheric deposition, evapotranspiration, biological uptake of nutrients, organic matter decay, cation exchange, sorption-desorption, mineral weathering, and secondary mineral formation (Adams, 1974; Nye and Tinker, 1977). Ion concentra- tions in soilwater are thus useful state variables for monitoring ecosystem changes (Shugart et al., 1976; McCall, 1978; Sollins and McCorison, 1981; Binkley et al., 1982; Johnson and Lindberg, 1992). For example, considerable research to improve under- standing and prediction of soilwater chemistry has been undertaken in the context of soil and freshwater acidification (Reuss and Johnson, 1986; Adrian0 and Havas, 1989; Mason, 1990).
Most Mediterranean soils are well buffered against acidification either because they are carbonate rich or because, despite lying on silicate bedrock, they often show relatively high base saturation and weathering rates. Also, atmospheric deposition in Mediterranean ecosystems is usually alkaline because strong acid anions in precipitation are accompanied by calcium (Camarero and Catalan, 1993; Roda et al., 1993). Differences in climate, pollution climate, soils, and vegetation between Mediterranean ecosystems and the better-studied cool temperate systems are likely to be reflected in the chemistry of soilwaters.
Since 1978, the hydrology and biogeochemistry of holm oak (Quevcus ilex L.) forest in the Montseny area of NE Spain have been studied at the plot and catchment scales. Published work has described the chemical variations in streamwaters (Avila et al., 1992; Piiiol et al., 1992) and estimated chemical fluxes entering (Avila and Rodi, 1991; Roda et al., 1993) and leaving the catchment (Avila and Rod& 1988). Solution chemistry profiles along the path of water through the holm oak ecosystem have been reported by Roda et al. (1990), including a concise description of tension-lysimeter soil solution chemistry. These earlier studies are extended here to (1) include the chemistry of free- flowing soilwater and compare it with the chemistry of capillary soil solution sampled with tension lysimeters, (2) test present theory of the cation exchange equilibrium in the micropore soilwater environmenf and (3) evaluate the volumetric and chemical influence of soilwaters on the stream during periods of high flow.
2. Study area
The study was conducted at La Castanya Biological Station in the Montseny
Tabl
e 1
Soil
char
acte
ristic
s of
the
st
udie
d ho
lm
oak
fore
st
at L
a C
asta
nya
Dep
th
(cm
) PH
O
.M.C
(KC
U
W)
C/N
Ex
chan
geab
le
catio
ns
(cm
ol,
kg-‘)
”
Na+
K
+ C
azf
Mg2
’
B.S
.b
W)
CEC
o-4
5.31
4.
89
16.6
9.
6 0.
49
20.1
1.
25
0.62
9.
5 5.
8 16
.4
108
4-23
4.
59
4.04
4.
5 2.
6 0.
24
11.1
0.
70
0.17
1.
7 1.
7 10
.0
44
23-6
1 4.
64
4.11
3.
3 1.
9 0.
20
9.5
0.57
0.
09
1.3
0.9
10.8
31
a Ex
chan
geab
le
catio
ns
wer
e ex
tract
ed
with
am
mon
ium
ac
etat
e at
pH
7.
b
Bas
e sa
tura
tion.
’ O
.M.,
orga
nic
mat
eria
l. V
alue
s ar
e ar
ithm
etic
m
eans
of
ten
rep
licat
es
obta
ined
in
a p
lot
at 7
50 m
abo
ve
sea-
leve
l on
a n
orth
-faci
ng
slop
e ad
jace
nt
to t
he T
M9
catc
hmen
t. St
anda
rd
erro
rs
wer
e be
low
20
%
of t
he m
ean
for
ail
anal
ytes
.
18 A. Avila et al. / Journal of Hydrology 166 (1995) 15-35
mountains (41”46’N, 2”21’E), 40 km NNE from Barcelona; the climate is montane Mediterranean. Mean annual precipitation is 870 mm, but precipitation varies greatly in annual total and in monthly distribution. On average, rainfall is highest in spring and autumn, and lowest in summer. Snowfall accounts for only 3% of the mean annual precipitation. Mean annual air temperature in the study plot is 9-10 “C.
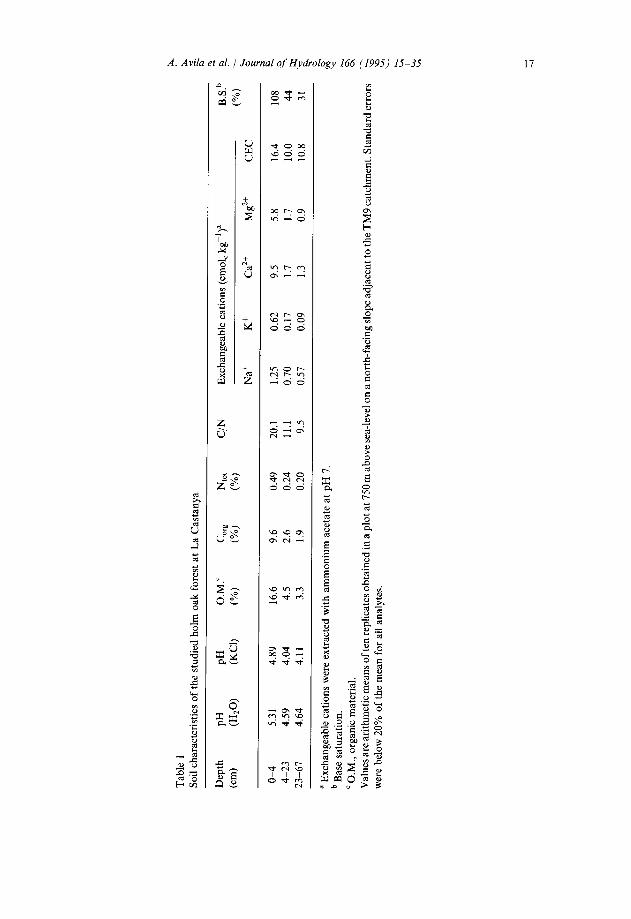
Soilwaters were sampled in and around a 0.23 ha plot near the Torrent de la Mina stream, at an altitude of 665 m. This plot has been the site of intensive biogeochemical studies (Ferres et al., 1984; Roda et al., 1990). The plot faces west and NW, and lies at the foot of a steep slope. The bedrock is a low-grade metamorphic schist, with quartz, sericite, albite and chlorite as major minerals. The soil is a very stony, sandy loam dystric xerochrept, ranging from 0.4 to 1.6 m in depth. Abundant litter accumulates on the forest floor. The main characteristics of the mineral soil are listed in Table 1. The vegetation is a closed-canopy holm oak forest which has been largely undisturbed for the last 30-40 years.
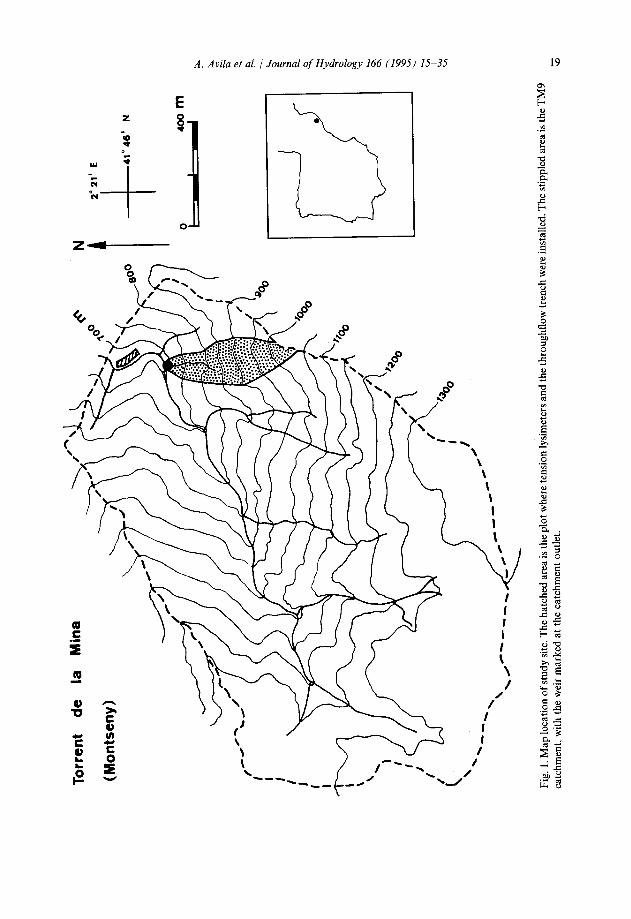
Bulk precipitation, throughfall, and streamwater chemistry data used in this paper were obtained by Rodd et al. (1990) and Avila et al. (1992). Bulk precipitation was collected in a clearing near the instrumented plot; throughfall within the plot; and streamwater was sampled in a nearby first-order catchment named TM9 (Fig. 1) whose stream drains a slope of similar characteristics to those of the instrumented plot.
3. Methods
3.1. Field sampling
Two types of soilwater were studied: soil solution and free-flowing soilwater. Soil solution was sampled with soil moisture ceramic-cup tension lysimeters evacuated at -65 kPa. Eight lysimeters were installed in autumn 1981. Four of these (two at 20 cm and two at 40 cm depth) were placed in the low-slope area (7-l 1”) of the plot, some 10 m from the stream, and were sampled from 11 November 1983 to 27 June 1986. The other four lysimeters, two at each depth, were placed in the steep slope (30”) just above the plot, and were sampled from 11 December 1984 to 27 June 1986.
Free-flowing soilwater was sampled in a trench of 3 m length excavated down to the bedrock at the foot of the slope as described by Atkinson (1978). The trench contained a gutter to collect water flowing through or just below the humic layer (H-layer throughflow), and two perforated PVC tubes inserted into the soil at depths of 50 and 160 cm to collect subsurface flow. A thick polyethylene sheet within the backfilled trench separated these two depths of subsurface flow. The collector at 160 cm depth sampled water flowing at the contact with the bedrock (deep subsurface flow). The three collectors drained to high-volume tanks. The trench was sampled from May 1985 to May 1988. Lysimeters and trench were less than 100 m apart.
Soilwaters (if any) were collected at least weekly. Lysimeters at the low-slope area were collected individually, but lysimeters at the steep slope were cornposited for each depth in the field. After sampling, a pressure of -65 kPa was applied to each lysimeter
A. Avila et al. / Journal of Hydrology I66 (1995) 15-35
.
:-
20 A. Avila et al. / Journal of Hydrology 166 (1995) 15-35
with a hand pump. Water from the trench was collected after thoroughly homogeniz- ing each collecting tank. If there were no samples, the tanks were cleaned with distilled water. Sampling methods for bulk precipitation, throughfall, and streamwater have been described in Roda et al. (1990) and Avila et al. (1992).
3.2. Laboratory methods
On arrival at the laboratory, unfiltered samples were equilibrated at room temperature and analysed for conductivity, pH and alkalinity. The pH was measured potentiometrically with a combination electrode. Alkalinity was measured by conductimetric titration (Golterman et al., 1978; Pifiol and Avila, 1992). Samples were then filtered through 0.45 pm membrane filters. Frozen aliquots were stored for future analysis.
Metallic cations were analysed on a single aliquot. Samples, standards and blanks were supplemented with 400 ppm La (as LaC13) and analytical grade concentrated HCl (1% v/v) to prevent analytical interferences. Sodium and K were analysed by flame emission, and Ca and Mg by atomic absorption spectrometry at the Serveis Tecnics of the Universitat de Barcelona. Nitrate, SOi- and Cll were analysed by ion chromatography. Ammonium was analysed by gas diffusion through a membrane followed by calorimetry with a Tecator (Hogan&, Sweden) FIA (Anonymous, 1984). Ammonium concentrations are reported only for H-layer throughflow, as all the other soilwater types had very low mean NH: concentrations (less than 2 pequiv 1-l).
The mean chemistry for the soil solution at depths of 20 and 40 cm was calculated as the average of the mean chemistry of the four lysimeters at each depth for the common period of sampling (11 December 1984-27 June 1986). The mean chemistry for each lysimeter was averaged arithmetically. Tension lysimeter data were not volume-weighted because the collected volume of water is not a good measure of soilwater flow (Grossmann and Udluft, 1991). This is an intrinsic limitation of the use of tension lysimeters (Haines and Waide, 1979; Binkley et al., 1982), and has to be borne in mind when comparing the solution chemistry profile. However, the
Table 2 Volume-weighted mean chemical composition (concentrations in pequiv 1-l) of bulk precipitation, throughfall and streamwater in the holm oak forest at La Castaya; streamwater is from a first-order stream named TM9
Naf K+ Ca2+ Mg*+ NH: NOj SO:- cl- Alkalinity
Bulk precipitatior? 23.3 4.2 64.8 10.8 24.4 21.0 49.8 29.5 16.9 Throughfallb 39 86 129 45 n.a. 34 n.a. 62 na. StreamwaterC 276 11.0 248 153 0 1.2 206 112 343
na., Not analysed. a Data for August 1983-July 1991. b Data for December 1978-December 1980, after Roda et al. (1990). ‘Data for August 1984-July 1988.
Table 3
A. Avila et al. / Journal of Hydrology 166 (1995) 15-35 21
Mean chemistry of tension-lysimeter soil solution in a holm oak plot at La Castanya
Soil depth n Conductivity pH Alkalinity Na+ K+ Ca2+ Mg2+ NO, SOi- Cl-
20 cm Lys 2 52
Lys 3 34
Lys 5 + 8 47
Mean
40 cm Lys 1 60
Lys 4 35
Lys 6+7 56
Mean
75.1 5.57 70.2 (26.4) (0.09) (11.5) 71.0 5.54 62.5
(12.9) (0.11) (8.6) 77.0 5.76 64.2
(25.4) (0.16) (18.7) 75.0 5.66 65.3
84.6 (18.7) 160
(76) 65.8
(20.7) 94.1
5.74 (0.13) 5.41
(0.11) 5.66
(0.16) 5.62
59.9 (11.7) 66.0
(11.2) 57.1
(8.9) 60.0
125
(39) 120
(18) 162
(38) 142
145
(32) 308
(90) 125
(29) 176
70.0 443 215 (12.9) (164) (90) 45.5 400 198
(9.2) (64) (34) 11.6 412 204 (4.9) (101) (54) 34.7 417 205
7.6 491 231 (11.3) (125) (59)
10.0 817 423 (4.9) (421) (207) 61.9 328 169
(43.8) (113) (55) 35.4 491 248
1.4 398 (3.7) (136) 2.2 399
(4.3) (93) 1.6 390
(5.2) (69) 1.7 394
3.7 429 (16.2) (121)
1.4 987 (6.6) (624) 9.5 369
(25.9) (111) 6.0 539
152
(155) 151
(51) 198
(144) 175
242
(91) 308
(309) 134
(74) 205
Arithmetic mean and standard deviation (in parenthesis) of n weekly samples are given for the common period of sampling (from 11 December 1984 to 27 June 1986). Lys 5 + 8 and Lys 6 + 7 each are the combination of two individual lysimeters which were composited in the field; their values have been given double weight for calculating the mean at each depth. (Conductivity in PScm-’ at 20°C. Ion concentrations and alkalinity in PEquiv 1-l.)
Table 4 Chemical composition of various types of water along the soil profile in the holm oak forest at La Castanya
Conductivity pH Alkalinity Na+ Kf Ca2+ Mg2+ NO; SO:- Cl- Anion deficit”
H-layer throughflow 146 6.28 481 136 295 908 301 249 319 256 335 20~x11 soil solution 15 5.66 65 142 35 417 205 1.7 394 175 163 40 cm soil solution 94 5.62 60 176 35 491 248 6.0 539 205 140 Deep subsurface flow 61 5.53 47 159 13 258 150 40 288 151 54 stormflowb 65 7.35 282 266 12 248 150 1.7 229 121 42 BaseflowC 86 7.70 665 345 11 345 226 1.2 163 X7 11
a Anion deficit computed as (Ca + Mg + Na + K) - (alkalinity + NO3 + SO4 + Cl). The contribution of NH: and H+ to the ion balance of these waters is negligible. b All samples with discharge of more than 0.7 1 s-’ ’ All weekly grab samples with discharge of 0.2 1 s-’ or less. Values for the soil solution at 20 and 40 cm are arithmetic means. All the other water types are represented by volume-weighted means. Stormflow and baseflow are from a first-order stream named TM9. Periods of study are: May 19855May 1988 for the H-layer throughflow and deep subsurface flow; December 19844 June 1986 for soil solution at 20 and 40cm depths; August 19844July 1988 for stormflow and baseflow. (Conductivity in PS cm-’ at 20°C. Ion concentrations and alkalinity in PEquiv 1-l.)
22 A. Avila et al, / Journal of Hydrology 166 (1995) 15-35
- 200
j 160
VI a 120
x
.$ 80 E
s 7 40
0
PfPSP9P9P9$ 1984 1985 1986
20 cm depth 1500
.
_ 1200-
7J 900-
1984 1985 1986
20 cm depth
--- I I
_ 240
Ll 160
E t 120
ST 60
1984 1985 1986
20 cm depth 150
120- .
7 . J
go- ??
PfP3PSP$PSP 1984 1985 1986
20 cm depth 1000, . 1
. . 600
400
200
01
Pi!PSP9#9PfP 1984 1985 1986
20 cm depth 600 / +
.+ :* ic
PSPSPSPPP2P 1984 1985 1986
20 cm depth
;,i$T-
01
1984 1985 1986
20 cm depth 4om
35- .
30- +
25- 0
zo-
3 c -e
1984 1985 1986
A. Avila et al. 1 Journal of Hydrology 166 (1995) 15-35 23
volume-weighted mean ion concentrations in the tension-lysimeter solution were not strikingly different from arithmetic means.
Concentrations of NH: and NO, were often below the detection limit (usually 1 pequiv 1-l). For averaging, such samples were assigned concentrations of the involved ions equal to half the detection limit.
4. Background on biogeochemical information
The chemical composition of bulk precipitation, throughfall, and streamwater of the study area is summarized in Table 2. Bulk precipitation chemistry at Montseny is dominated by Ca2+ and SO:-. Although, on average, 23% of the precipitation samples are very acidic (pH less than 4.5), the mean annual volume-weighted alkalinity is positive (Table 2) and, if HCOT is the dominant weak anion, it corresponds to an air-equilibrated pH of 6.5. Throughfall is typically 1.5-4 times more concentrated than bulk precipitation for most ions. The exceptions are Kf, which shows a 22-fold increase, and Hf, which decreases (Rodd et al., 1990). Stream- water, sampled at TM9, is highly buffered, with high pH and bicarbonate alkalinity. The major anion is HCOT, and Ca2+ and Na+ provide the major cationic counter- parts. Streamwater is more concentrated than throughfall for all the ions, except for Hf, Kf, and NO, (Roda et al., 1990). At high flows, streamwater has a lower pH, alkalinity, and Ca2+, Na+, Mg2+ concentrations compared with baseflow, but higher Cl- and SO:- concentrations (Avila et al., 1992).
5. Results
5.1. The mean chemistry of soilwaters
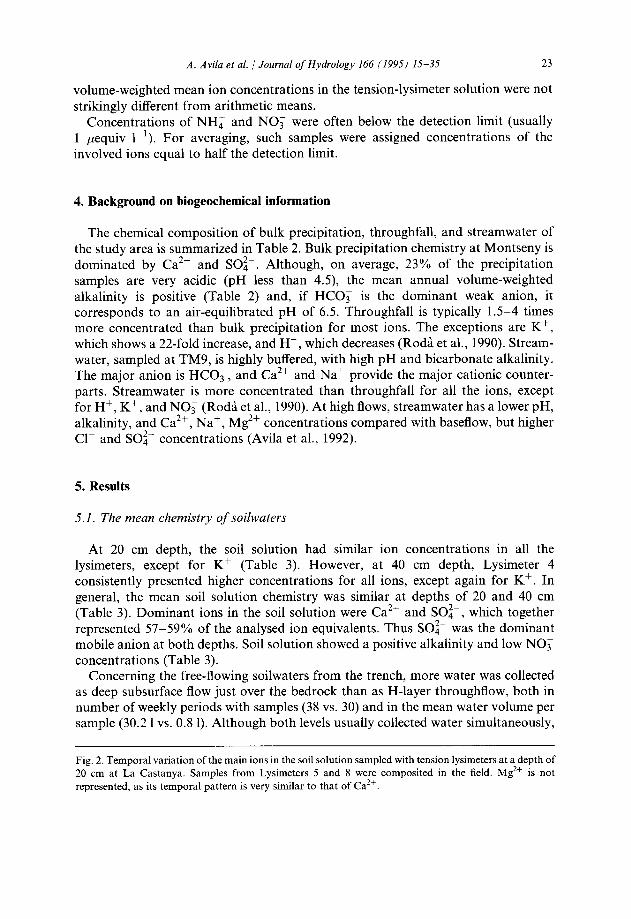
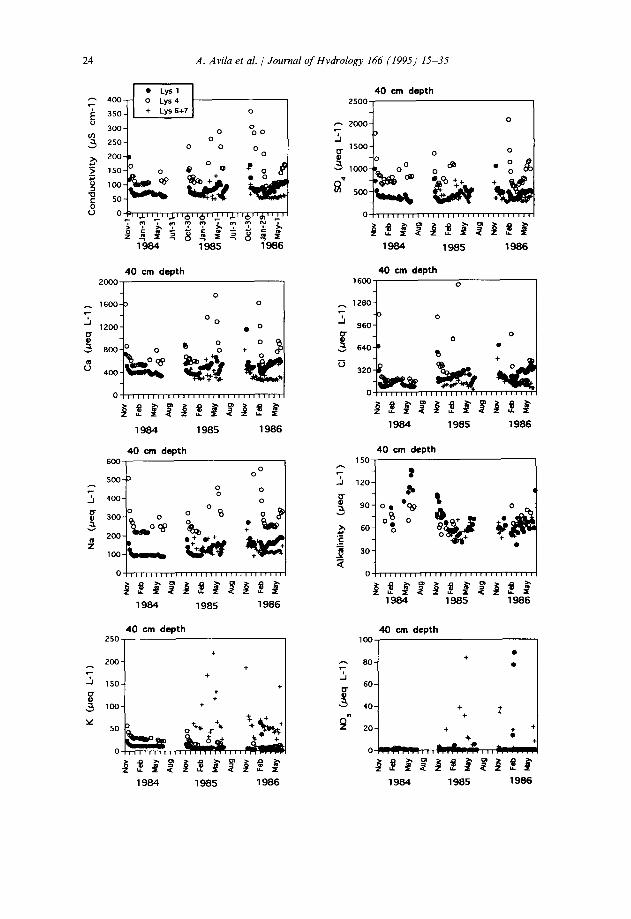
At 20 cm depth, the soil solution had similar ion concentrations in all the lysimeters, except for K+ (Table 3). However, at 40 cm depth, Lysimeter 4 consistently presented higher concentrations for all ions, except again for K+. In general, the mean soil solution chemistry was similar at depths of 20 and 40 cm (Table 3). Dominant ions in the soil solution were Ca2+ and SO:-, which together represented 57-59% of the analysed ion equivalents. Thus SOi- was the dominant mobile anion at both depths. Soil solution showed a positive alkalinity and low NO; concentrations (Table 3).
Concerning the free-flowing soilwaters from the trench, more water was collected as deep subsurface flow just over the bedrock than as H-layer throughflow, both in number of weekly periods with samples (38 vs. 30) and in the mean water volume per sample (30.2 1 vs. 0.8 1). Although both levels usually collected water simultaneously,
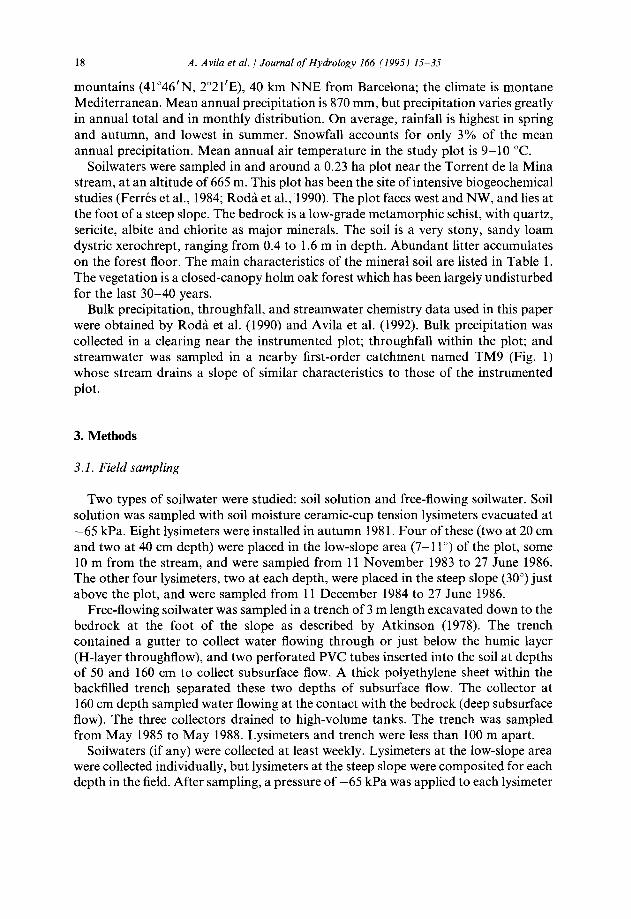
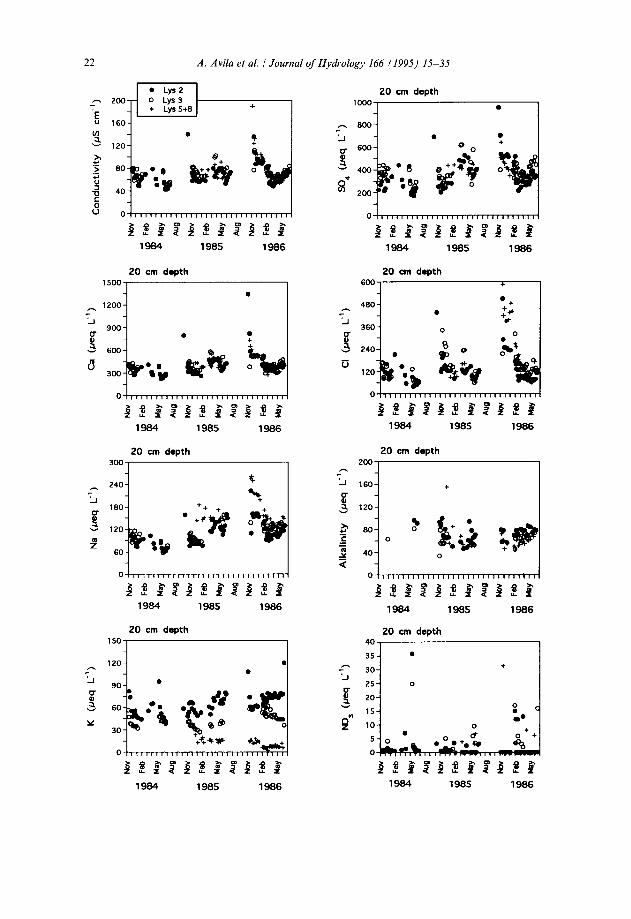
Fig. 2. Temporal variation of the main ions in the soil solution sampled with tension lysimeters at a depth of 20 cm at La Castanya. Samples from Lysimeters 5 and 8 were composited in the field. Mg*+ is not represented, as its temporal pattern is very similar to that of Ca*+.
K
(wq
L-l
)
NW
; Fe
b
$ Ma
y
Aw
t+w
; Fe
b
8 Ma
y
Aug
+ ++
+
Na
(Deq
L-
1)
00
Alka
linity
(v
eq
L-l
)
Ca (
wq
L-l
)
Cl (
jEq
L-l
)
Cond
uctiv
ity
(US
cm-l
)
So,
be
q L-
1 1
A. Avila et al. / Journal of Hydrology 166 (1995) 15-35 25
in some events one collected water whereas the other did not. The collector at 50 cm never provided samples, probably because water in this highly permeable soil flowed down vertically until the bedrock and then laterally downslope.
H-Layer throughflow had on average much higher ion concentrations than deep subsurface flow (Table 4), particularly for K +, NO;, and alkalinity. The other ions also showed higher concentrations in the H-layer throughflow, except for Na+ and SO:-, which had similar concentrations at both depths. Mean volume-weighted NH: concentration was 7 pequiv ll’, H-layer throughflow being the only soilwater type sampled that consistently showed detectable NH:. The H-layer throughflow cation composition was dominated by Ca2+ (55% of cation charge), and weak anions included in the alkalinity measurement dominated the anion composition. The high alkalinity of the H-layer throughflow (Table 4) was probably due mostly to organic anions, because, at the measured mean pH (6.28), HCO: could account for only a minor fraction of the measured alkalinity, even allowing for some supersaturation in throughflow water with respect to atmospheric COZ. Organic anions appeared to be important components of the water chemistry in the H-layer throughflow. Indeed, this water was often highly coloured. There was a substantial anion deficit in the measured H-layer throughflow composition (Table 4). This deficit arose probably (1) from organic anions that were strong enough to remain unprotonated in our conductimetric titration and that were not included in the alkalinity measurement, and (2) from part of the cations, particularly Ca2+, that were complexed with dissolved organic matter in the original solution but that were included in the atomic absorption determinations. The same comments apply to the tension-lysimeter soil solution, but the anion deficit was much lower there (Table 4) probably because the longer retention time of this water in the soil allowed for sorption and biological utilization of dissolved organic compounds.
The chemistry of deep subsurface flow was dominated by SOi- and Ca2+ (55% and 44% of the total analysed anion and cation equivalents, respectively; Table 4). Organic anions at this level contributed much less to the total anionic charge than in the H-layer throughflow, as alkalinity, which included HCO,, amounted only to 9% of the analysed anion equivalents, and the mean anion deficit was very low (Table 4).
5.2. Temporal variability
Much of the variability of some of the ions in the soilwater reflects a seasonal pattern (Figs. 2 and 3). Tension lysimeters, which were dry during each summer period, started to collect water with the onset of the wet autumn period. These early autumnal samples usually presented very high concentrations of Na+, Ca2+, Mg2+, SOi- and Cl-, but concentrations tended to decrease regularly with time each year. Other ions, such as K+ and NO;, did not present such a regular pattern, and
Fig. 3. Temporal variation of the main ions in the soil solution sampled with tension lysimeters at a depth of 40 cm at La Castanya. Samples from Lysimeters 6 and 7 were composited in the field. Mg2’ is not represented, as its temporal pattern is very similar to that of Ca*+.
26 A. Avila et al. / Journal of Hydrology 166 (1995) 15-35
1985 1986
Trench
1967 1986
1965 1986
Trench
1967 1966
1965 1966
Trench
1987 1966
Trench
1965 1966 1967 1966
Trench
‘0°01
Trench 16OOm
. 1400- 0
-- 1200- 'A 0
IOOO- . z 0
=L 600- o c
600- * .o$ ?? ????
0 o
4 400- 0
200~, ??0 . 0 o . 00
0 .9*
0 -2
1985 1986 1987 1966 1985 1986 1987 1988
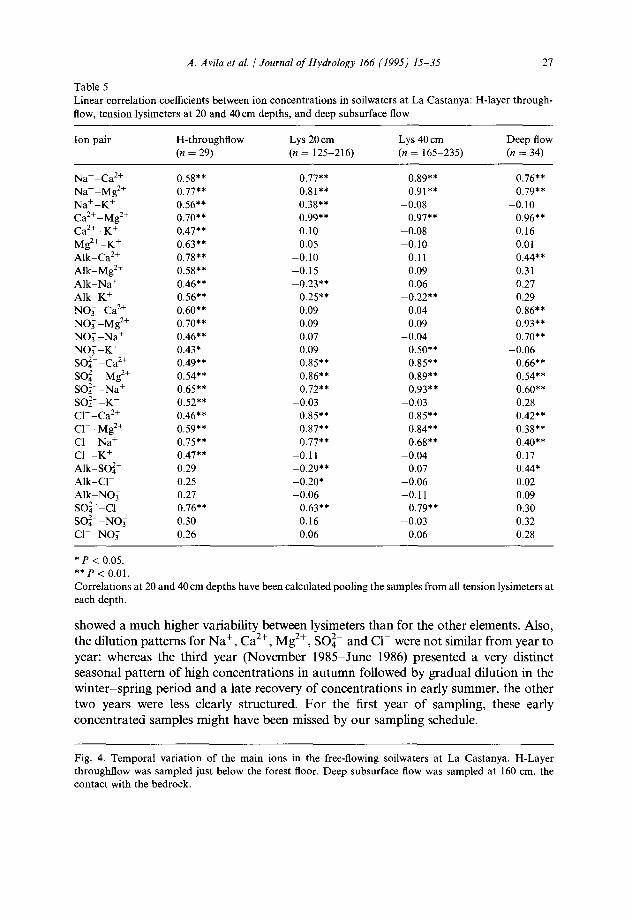
Table 5
A. Avila et al. / Journal of Hydrology 166 (1995) 15-35 21
Linear correlation coefficients between ion concentrations in soilwaters at La Castanya: H-layer through- flow, tension lysimeters at 20 and 40 cm depths, and deep subsurface flow
Ion pair H-throughflow (n = 29)
Lys 20 cm (n = 125-216)
Lys 40 cm (n = 1655235)
Deep flow (n = 34)
Naf-Ca*+ 0.58** 0.77** 0.89** 0.76** Na+-Mg*+ 0.77** 0.81** 0.91** 0.79** Na+-K+ 0.56** 0.38** -0.08 -0.10 Ca*+-Mg*+ 0.70** 0.99** 0.97** 0.96** Ca*+-K+ 0.47** 0.10 -0.08 0.16 Mg*+-K+ 0.63** 0.05 -0.10 0.01 Alk-Ca*+ 0.78** -0.10 0.11 0.44** Alk-Mg*+ 0.58** -0.15 0.09 0.31 Alk-Na+ 0.46** -0.23** 0.06 0.27 AlkpK+ 0.56** 0.25** -0.22** 0.29 NOT -Ca*+ 0.60** 0.09 0.04 0.86** NOT -M2+ 0.70** 0.09 0.09 0.93** NO; -Na+ 0.46** 0.07 -0.04 0.70** NO; -K+ 0.43* 0.09 0.50** -0.06 SOi--Ca’+ 0.49** 0.85** 0.85** 0.66** SO:~~Mg*+ 0.54** 0.86** 0.89** 0.54** SO:--Na+ 0.65** 0.72** 0.93** 0.60** SO:- -K+ 0.52** -0.03 -0.03 0.28 Cl--Ca*+ 0.46** 0.85** 0.85** 0.42** Cl--Mg*+ 0.59** 0.87** 0.84** 0.38** Cl--Na+ 0.75** 0.77** 0.68** 0.40** Cl--K+ 0.47** -0.11 -0.04 0.17 Alk-SO:- 0.29 -0.29** 0.07 0.44* Alk-Cl- 0.25 -0.20* -0.06 0.02 AlkkNO: 0.27 -0.06 -0.11 0.09 so:- -cl- 0.76** 0.63** 0.79** 0.30 SO:- -NO; 0.30 0.16 -0.03 0.32 Cl--NO; 0.26 0.06 -0.06 0.28
*P < 0.05. **p < 0.01. Correlations at 20 and 40 cm depths have been calculated pooling the samples from all tension lysimeters at each depth.
showed a much higher variability between lysimeters than for the other elements. Also, the dilution patterns for Na+, Ca*+, Mg*+, SOi- and Cl- were not similar from year to year: whereas the third year (November 1985-June 1986) presented a very distinct seasonal pattern of high concentrations in autumn followed by gradual dilution in the winter-spring period and a late recovery of concentrations in early summer, the other two years were less clearly structured. For the first year of sampling, these early concentrated samples might have been missed by our sampling schedule.
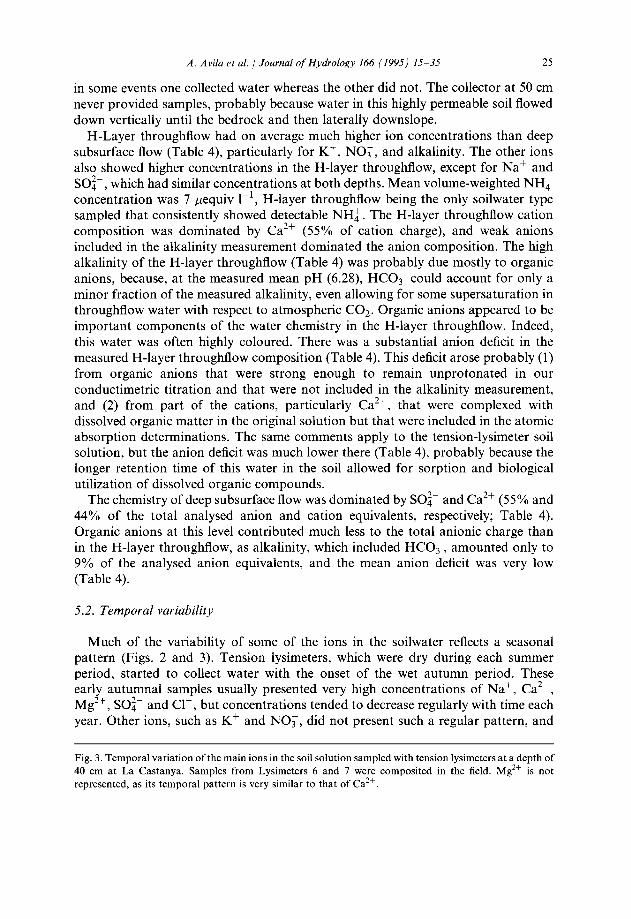
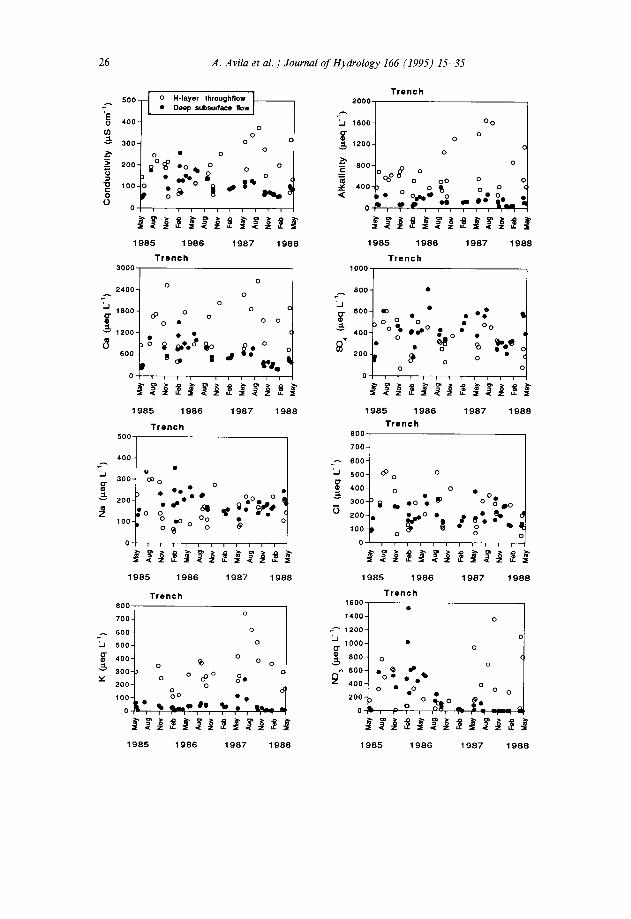
Fig. 4. Temporal variation of the main ions in the free-flowing soilwaters at La Castanya. H-Layer throughflow was sampled just below the forest floor. Deep subsurface flow was sampled at 160 cm, the contact with the bedrock.
28 A. Avila et al. / Journal of Hvdrology 166 (1995) 15-35
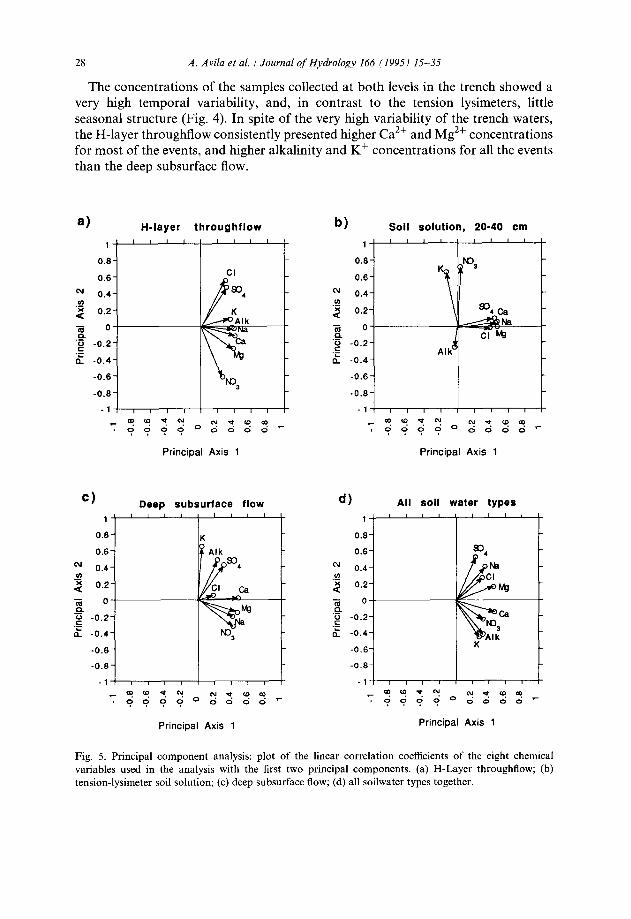
The concentrations of the samples collected at both levels in the trench showed a very high temporal variability, and, in contrast to the tension lysimeters, little seasonal structure (Fig. 4). In spite of the very high variability of the trench waters, the H-layer throughflow consistently presented higher Ca2+ and Mg2+ concentrations for most of the events, and higher alkalinity and Kf concentrations for all the events than the deep subsurface flow.
a) H-layer throughflow b) Soil solution, 20-40 cm
1
0.6
0.6 I-----
-0.6
-0.6
-1 I--
t I I I I
0.6
0.6 Cu 0.4 .v, 2 0.2
3 0 m 'G .c
-0.2
C -0.4
-0.6
-0.6
_-a*cu cu*tD* * d d 6 d 0 d ddd’
I I I I
Principal Axis 1
m lo d N cl* tD OD .ddddo dddd’
I I I I
Principal Axis 1
cl Deep subsurface flow
‘I 0.8
0.6 cu 0.4 .C 2 0.2
3 0 .a 0 .E
-0.2
t -0.4
-0.6
d) All so11 water types 1 "'I I I I ,
0.8-
0.6- cd 0.4-
Principal Axis 1 Principal Axis 1
Fig. 5. Principal component analysis: plot of the linear correlation coefficients of the eight chemical variables used in the analysis with the first two principal components. (a) H-Layer throughflow; (b) tension-lysimeter soil solution; (c) deep subsurface flow; (d) all soilwater types together.
A. Avila et al. / Journal of Hydrology 166 (1995) 15-35
5.3, Ion relationships
29
Nearly all the ion pairs showed significant linear correlations (P < 0.01) in the H- layer throughflow (Table 5). For ion pairs that were well correlated in the soil solution at both 20 and 40 cm depth, correlation coefficients in the H-layer throughflow were usually lower, owing to higher data scatter. For the ion pairs involving NO, and the major cations, there was a significant positive correlation only in the H-layer through- flow and in the deep subsurface flow, but not in the soil solution (Table 5). There were strong positive correlations between the major cations (Ca2+, Mg2+ and Naf) in all soilwaters, particularly in the soil solution at both depths and in the deep subsurface flow. The highest correlations were those between Ca2+ and Mg2+ in these three soilwater types. Sulphate and Cl- were also strongly correlated with Ca2+ and Mg2+ in the soil solution.
Ion relationships were also explored using a principal component analysis (PCA) calculated on the linear correlation matrix. Results showed a fairly complex pattern for the relationships between the ions (Fig. 5). PCA applied to soil solution samples showed three groups for the ions (Fig. 5(b)): (1) the main anions and cations; (2) Kf and NO,; (3) alkalinity. PCA of the trench water samples (Figs. 5(a)-5(c)) failed to identify clear groups of inter-correlated chemical variables. A PCA analysis applied
6-
4 -
cu
E F
2 -
x E 8 0 -
z a .- Ls -2
‘C a
-4 -
A Deep subsurface flow ?? H-layer throughflow
. 8. 0 -6 ’
-4 -2 0 2 4 6 8 10
Principal component 1
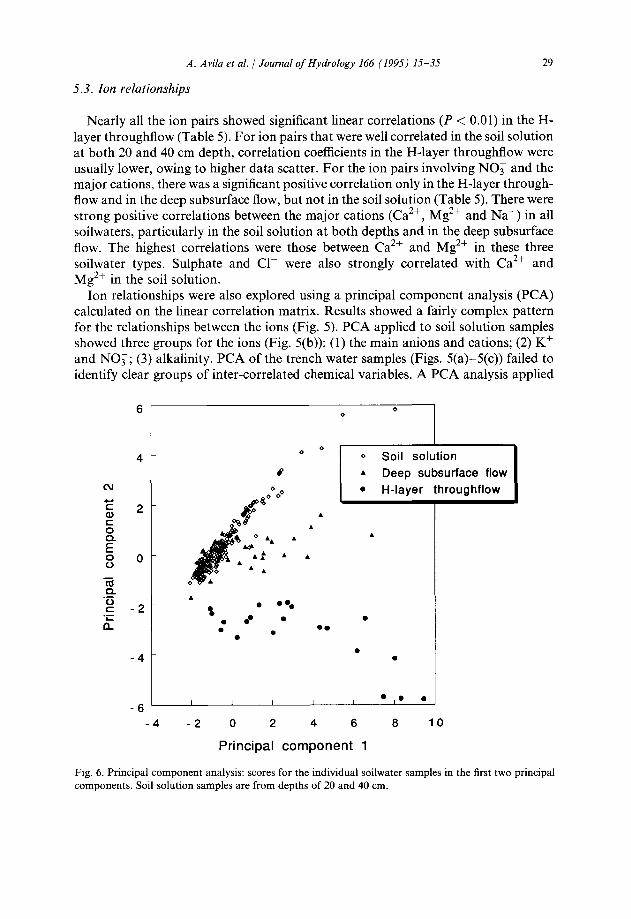
Fig. 6. Principal component analysis: scores for the individual soilwater samples in the first two principal components. Soil solution samples are from depths of 20 and 40 cm.
30 A. Avila et al. / Journal of Hydrology 166 (1995) 15-35
to all the soilwater samples (20 and 40 cm soil solution, H-layer throughflow and deep subsurface flow) also failed to show patterns of inter-correlated variables (Fig. 5(d)), but produced good results as a sample ordination technique (Fig. 6): the first two principal components accounted for 79% of the total variance and clearly separated the soil solution from the H-layer throughflow; the deep subsurface flow was in an intermediate position. This diagram shows clearly that the chemical composition of the water that flows at depth can be understood as a mixture of the preferential flow of recently infiltrated water and of pre-event displaced soil solution. The intermediate position of deep subsurface flow with respect to H-layer throughflow and soil solution is masked in Table 4 because volume-weighted mean concentrations in the deep subsurface flow are dominated by two high-volume events.
6. Discussion
6.1. Within-soil processes
To understand the chemical composition of the various kinds of soilwater sampled in the present study, one has to consider the different biogeochemical processes that take place at the plot level. These main processes are discussed below.
Rainwater enters the soil after passing through the canopy and through the forest floor. The water sampled as H-layer throughflow might have travelled for a few centimetres along the surface of the soil, probably becoming more enriched in solutes than the water that infiltrates immediately into the soil. Thus, the H-layer through- flow provides an upper limit for the concentration of the water that actually infiltrates into the soil. The chemical characteristics of this water reflect the biogeochemical processes that occur at the canopy and the forest floor. Its huge temporal variability in chemical composition and the lower ionic correlations than in the soil solution is a consequence of variation in the following factors: (1) throughfall quantity and chemistry; (2) the amount of solutes released during decomposition of organic matter in the forest floor; (3) the short residence time and rapid circulation through the organic layer. The variability of the biogeochemical processes involved in the chemical composition of this water makes it very difficult to determine what the controlling mechanisms are on an event-to-event basis. The high number of significant correlations between ions is explained by a covariance of ion concen- trations with volume, as all ions have a negative relationship with the water amount collected.
After passing through the forest floor, rainwater infiltrates into the soil to become soil solution. Part of it is retained in the soil matrix and part of it by-passes the soil matrix through preferential flow pathways (Beven and Germann, 1982). The water in the soil solution has a relatively long residence time in the soil. Here, it becomes involved in four main soil biogeochemical processes. These are: (1) preferential nutrient uptake of some ions by plants and microorganisms; (2) concentration- dilution changes owing to the evaporation and rainfall recharge of soil solution; (3) cation exchange reactions between the soil solution and the cation exchange complex;
A. Avila et al. / Journal of Hydrology 166 (1995) 15-35 31
1000
800
Ii p 600 s
r” 400
200
0
Soil solution (20 & 40 cm depth) I I I I I
0 0°0 T
L
I I I I I + 100 200 300 400 500 600
Na (wW
Soil solution (20 & 40 cm depth)
25001
00 0 loo 200 300 400 500 600
Na (wq/L)
Soil solution (20 & 40 cm depth)
2500 I , I I
2000
zi $1500 j_
s 1000
500
0 I 0 200 400 600 800 1000
MO h.WL)
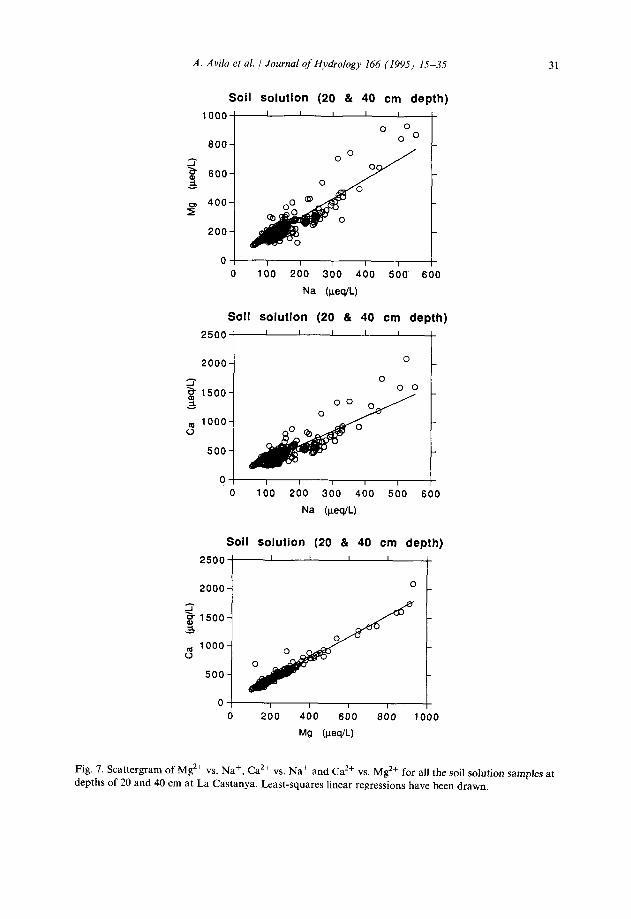
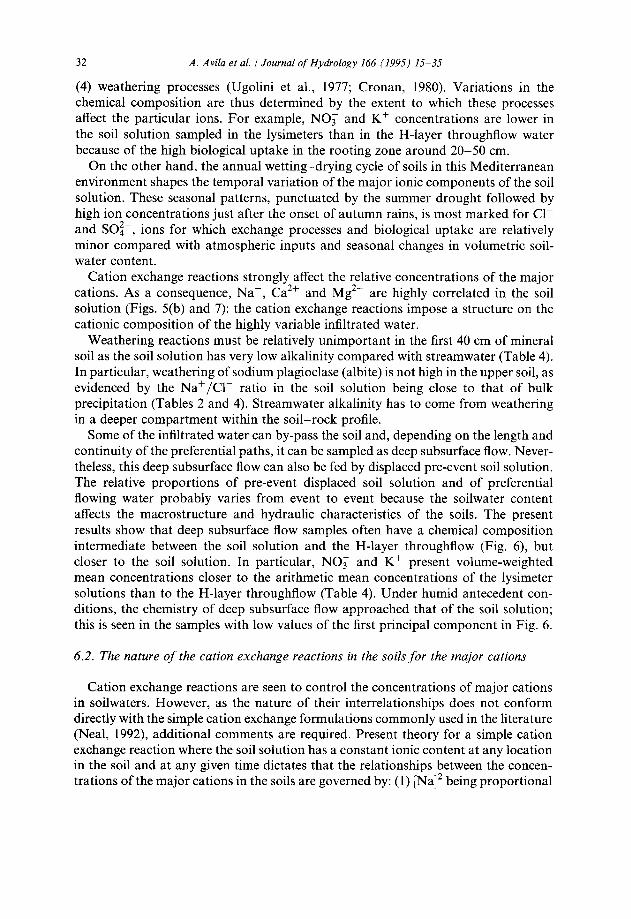
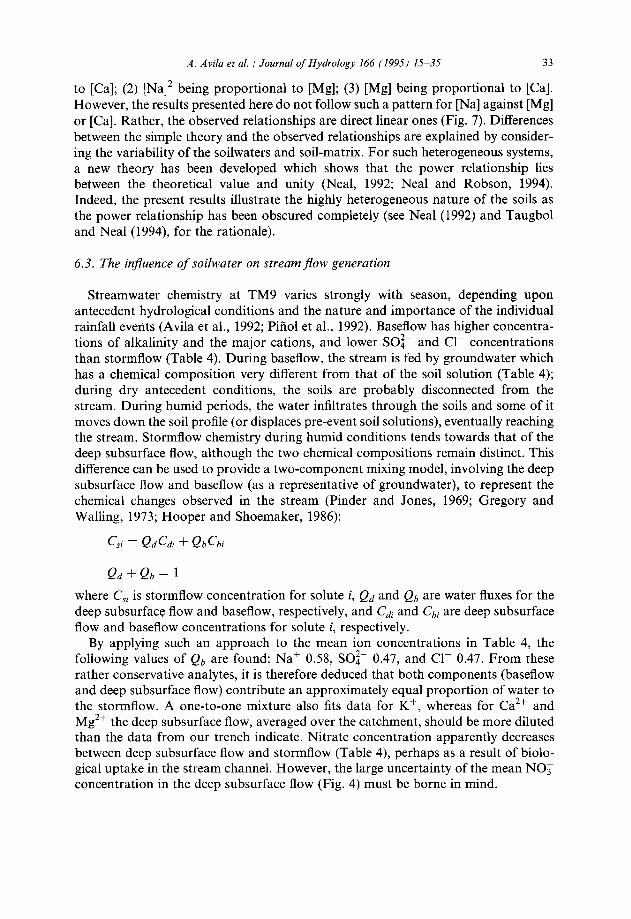
Fig. 7. Scattergram of M2+ vs. Na’, Ca*+ vs. Na+ and Ca*+ vs. Mg*+ for all the soil solution samples at depths of 20 and 40 cm at La Castanya. Least-squares linear regressions have been drawn.
32 A. Avila et al. 1 Journal of Hydrology I66 (1995) 15-35
(4) weathering processes (Ugolini et al., 1977; Cronan, 1980). Variations in the chemical composition are thus determined by the extent to which these processes affect the particular ions. For example, NO, and K+ concentrations are lower in the soil solution sampled in the lysimeters than in the H-layer throughflow water because of the high biological uptake in the rooting zone around 20-50 cm.
On the other hand, the annual wetting-drying cycle of soils in this Mediterranean environment shapes the temporal variation of the major ionic components of the soil solution. These seasonal patterns, punctuated by the summer drought followed by high ion concentrations just after the onset of autumn rains, is most marked for Cl- and SO:-, ions for which exchange processes and biological uptake are relatively minor compared with atmospheric inputs and seasonal changes in volumetric soil- water content.
Cation exchange reactions strongly affect the relative concentrations of the major cations. As a consequence, Na+, Ca2+ and Mg2+ are highly correlated in the soil solution (Figs. 5(b) and 7): the cation exchange reactions impose a structure on the cationic composition of the highly variable infiltrated water.
Weathering reactions must be relatively unimportant in the first 40 cm of mineral soil as the soil solution has very low alkalinity compared with streamwater (Table 4). In particular, weathering of sodium plagioclase (albite) is not high in the upper soil, as evidenced by the Na+/Cl- ratio in the soil solution being close to that of bulk precipitation (Tables 2 and 4). Streamwater alkalinity has to come from weathering in a deeper compartment within the soil-rock profile.
Some of the infiltrated water can by-pass the soil and, depending on the length and continuity of the preferential paths, it can be sampled as deep subsurface flow. Never- theless, this deep subsurface flow can also be fed by displaced pre-event soil solution. The relative proportions of pre-event displaced soil solution and of preferential flowing water probably varies from event to event because the soilwater content affects the macrostructure and hydraulic characteristics of the soils. The present results show that deep subsurface flow samples often have a chemical composition intermediate between the soil solution and the H-layer throughflow (Fig. 6) but closer to the soil solution. In particular, NO, and K+ present volume-weighted mean concentrations closer to the arithmetic mean concentrations of the lysimeter solutions than to the H-layer throughflow (Table 4). Under humid antecedent con- ditions, the chemistry of deep subsurface flow approached that of the soil solution; this is seen in the samples with low values of the first principal component in Fig. 6.
6.2. The nature of the cation exchange reactions in the soils for the major cations
Cation exchange reactions are seen to control the concentrations of major cations in soilwaters. However, as the nature of their interrelationships does not conform directly with the simple cation exchange formulations commonly used in the literature (Neal, 1992), additional comments are required. Present theory for a simple cation exchange reaction where the soil solution has a constant ionic content at any location in the soil and at any given time dictates that the relationships between the concen- trations of the major cations in the soils are governed by: (1) [Na]’ being proportional
A. Avila et al. / Journal of Hydrology 166 (1995) 15-35 33
to [Cal; (2) [Na12 being proportional to [Mg]; (3) [Mg] being proportional to [Cal. However, the results presented here do not follow such a pattern for [Na] against [Mg] or [Cal. Rather, the observed relationships are direct linear ones (Fig. 7). Differences between the simple theory and the observed relationships are explained by consider- ing the variability of the soilwaters and soil-matrix. For such heterogeneous systems, a new theory has been developed which shows that the power relationship lies between the theoretical value and unity (Neal, 1992; Neal and Robson, 1994). Indeed, the present results illustrate the highly heterogeneous nature of the soils as the power relationship has been obscured completely (see Neal (1992) and Taugbol and Neal (1994) for the rationale).
6.3. The influence of soilwater on stream flow generation
Streamwater chemistry at TM9 varies strongly with season, depending upon antecedent hydrological conditions and the nature and importance of the individual rainfall events (Avila et al., 1992; Pin01 et al., 1992). Baseflow has higher concentra- tions of alkalinity and the major cations, and lower SO:- and Cl- concentrations than stormflow (Table 4). During baseflow, the stream is fed by groundwater which has a chemical composition very different from that of the soil solution (Table 4); during dry antecedent conditions, the soils are probably disconnected from the stream. During humid periods, the water infiltrates through the soils and some of it moves down the soil profile (or displaces pre-event soil solutions), eventually reaching the stream. Stormflow chemistry during humid conditions tends towards that of the deep subsurface flow, although the two chemical compositions remain distinct. This difference can be used to provide a two-component mixing model, involving the deep subsurface flow and baseflow (as a representative of groundwater), to represent the chemical changes observed in the stream (Pinder and Jones, 1969; Gregory and Walling, 1973; Hooper and Shoemaker, 1986):
Qd + Qb = 1 where Csi is stormflow concentration for solute i, Qd and Qb are water fluxes for the deep subsurface flow and baseflow, respectively, and C, and Cbi are deep subsurface flow and baseflow concentrations for solute i, respectively.
By applying such an approach to the mean ion concentrations in Table 4, the following values of Qb are found: Nat 0.58, SOi- 0.47, and Cl- 0.47. From these rather conservative analytes, it is therefore deduced that both components (baseflow and deep subsurface flow) contribute an approximately equal proportion of water to the stormflow. A one-to-one mixture also fits data for K+, whereas for Ca2+ and Mg2+ the deep subsurface flow, averaged over the catchment, should be more diluted than the data from our trench indicate. Nitrate concentration apparently decreases between deep subsurface flow and stormflow (Table 4) perhaps as a result of biolo- gical uptake in the stream channel. However, the large uncertainty of the mean NO; concentration in the deep subsurface flow (Fig. 4) must be borne in mind.
34 A. Avila et al. / Journal of Hydrology 166 (1995) 15-35
Because deep subsurface flow contains a high proportion of displaced pre-event soilwater, during stormflow conditions there is little direct rainfall contribution to the streamwater. This extends our previous work with stable isotopes, where more than one pre-event water store was needed to explain the isotopic patterns observed in the stream during storm events (Neal et al., 1992). Attempts to explain the streamwater chemistry of TM9 during particular storm events by end-member mixing analysis (EMMA; Christophersen et al., 1990; Hooper et al., 1990) using deep subsurface flow, soil solution, and pre-event baseflow chemistries have been unsuccessful so far. Probably, this is a consequence of the huge spatial variation in soilwater chemistry at the catchment scale, a question difficult to deal with using the standard sampling schedules.
Acknowledgements
This work was funded by CAICYT (Project 2129/83), CICYT (Project AMB92- 0349) and ICONA (Project LUCDEME). The co-operation of the Departament d’Agricultura, Ramaderia i Pesca de la Generalitat de Catalunya is fully acknowledged. We thank K. Beven, J. McCulloch, Ll. Comellas, and three anonymous reviewers for their useful comments and criticisms on the manuscript.
References
Adams, F., 1974. Soil solution. In: E.W. Carson (Editor), The Plant Root and its Environment. University Press of Virginia, Charlottesville, VA, pp. 441-481.
Adriano, D.C. and Havas, M. (Editors), 1989. Acidic Precipitation. Vol. 1: Case Studies. Springer, Berlin. Anonymous, 1984. Determination of ammonia nitrogen in water by flow injection analysis and gas
diffusion. Application Subnote SO-Olj84. Tecator AB, Hogan%, Sweden. Atkinson, T.C., 1978. Techniques for measuring subsurface flow on hillslopes. In: M.R. Kirkby (Editor),
Hillslope Hydrology. Wiley, New York. Avila, A. and Roda, F., 1988. Export of dissolved elements in an evergreen-oak forested watershed in the
Montseny mountains. Catena Suppl., 12: l-l 1. Avila, A. and Roda, F., 1991. Red rains as major contributors of nutrients and alkalinity to terrestrial
ecosystems at Montseny (NE Spain). Orsis, 6: 215-229. Avila, A., Pitiol, J., Roda, F. and Neal, C., 1992. Storm solute behaviour in a montane Mediterranean
forested catchment. J. Hydrol., 140: 143-161. Beven, K. and Germann, P., 1982. Macropores and water flow in soils. Water. Resour. Res., 18: 1311-1325. Binkley, D., Kimmins, J.P. and Feller, M.C., 1982. Water profiles in an early and a mid-successional forest
in coastal British Columbia. Can. J. For. Res., 12: 240-248. Camarero, L. and Catalan, J., 1993. Chemistry of bulk precipitation in the Central and Eastern Pyrenees
(northeast Spain). Atmos. Environ., 27A: 83-94. Christophersen, N., Neal, C., Hooper, R.P., Vogt, R.D. and Andersen, S., 1990. Modelling streamwater
chemistry as a mixture of soilwater end-members. A step towards second-generation acidification models. J. Hydrol., 116: 3077320.
Cronan, C.S., 1980. Solution chemistry of a New Hampshire subalpine ecosystem: a biogeochemical analysis. Oikos, 34: 272-28 1.
Ferres, L., Roda, F., Verdu, A.M.C. and Terradas, J., 1984. Circulation de nutrientes en algunos eco- sistemas forestales de1 Montseny (Barcelona) . Mediterranea, Serie de Estudios Biologicos, 7: 139-166.
A. Avila et al. / Journal of Hydrology 166 (1995) 15-35 35
Golterman, H.L., Clymo, R.S. and Ohnstad, M.A.M., 1978. Methods for Physical and Chemical Analysis of Fresh Waters. Blackwell Scientific, Oxford.
Gregory, K.J. and Walling, D.E., 1973. Drainage Basin Form and Processes. Edward Arnold, London. Grossmann, J. and Udluft, P., 1991. The extraction of soil water by the suction-cup method: a review. J.
Soil Sci., 42: 83-93. Haines, B.L. and Waide, J.B., 1979. Changes in soil solution chemistry resulting from clearcutting of a
southern Appalachian hardwood forest. In: Impact of Intensive Harvesting on Forest Nutrient Cycling. State University of New York, Syracuse.
Hooper, R.P. and Shoemaker, CA., 1986. A comparison of chemical and isotopic hydrograph separation. Water Resour. Res., 22: 1444-1454.
Hooper, R.P., Christophersen, N. and Peters, N.E., 1990. Modelling streamwater chemistry as a mixture of soilwater end-members. An application to the Panola Mountain catchment, Georgia, USA. J. Hydrol., 116: 321-343.
Johnson, D.W. and Lindberg, S.E. (Editors), 1992. Atmospheric Deposition and Forest Nutrient Cycling. Springer, New York.
Mason, J. (Editor), 1990. The Surface Waters Acidification Program. Cambridge University Press, Cambridge.
McCall, J.G., 1978. Ionic composition of forest soil solutions and effects of clearcutting. Soil Sci. Sot. Am. J., 42: 358363.
Neal, C., 1992. Describing anthropogenic impacts on stream water quality: the problem of integrating soilwater chemistry variability. Sci. Total Environ., 115: 207-218.
Neal, C. and Robson, A., 1994. Integrating soil water chemistry variations at the catchment level within a cation exchange model. Sci. Total Environ., 144: 93-102.
Neal, C., Neal, M., Warrington, A., Avila, A., Pifiol, J. and Roda, F., 1992. Stable hydrogen and oxygen isotope studies of rainfall and streamwaters for two contrasting holm oak areas of Catalonia, north- eastern Spain. J. Hydrol., 140: 1633178.
Nye, P.H. and Tinker, P.B., 1977. Soiute Movement in the Soil-Root System. Blackwell, Oxford. Pinder, G.F. and Jones, J.F., 1969. Determination of the groundwater component of peak discharge from
the chemistry of total runoff. Water Resour. Res., 5: 4388445. Piiiol, J. and Avila, A., 1992. Streamwater pH, alkalinity, pCO:, and discharge relationships in some
forested Mediterranean catchments. J. Hydrol., 131: 205-225. Piiiol, J., Avila, A. and Roda, F., 1992. The seasonal variation of streamwater chemistry in three forested
Mediterranean catchments. J. Hydrol., 140: 1199141. Reuss, J.O. and Johnson, D.W., 1986. Acid Deposition and the Acidification of Soils and Waters. Springer,
Berlin. Roda, F., Avila, A. and Bonilla, D., 1990. Precipitation, throughfall, soil solution and streamwater
chemistry in a holm oak (Quercus ilex) forest. J. Hydrol., 116: 167-183. Rod& F., Bellot, J., Escarre, A., Avila, A., Pifiol, J. and Terradas, J., 1993. Saharan dust and the
atmospheric inputs of elements to Mediterranean ecosystems. Water Air Soil Pollut., 66: 277-288. Shugart, H.H., Reichle, D.E., Edwards, N.T. and Kercher, J.R., 1976. A model of calcium-cycling in an
east Tennessee Liriodendron fcrest: model structure, parameters and frequency response analysis. Ecology, 57: 999109.
Sollins, P. and McCorison, F.M., 1981. Nitrogen and carbon solution chemistry of an old growth con- iferous forest watershed before and after cutting. Water Resour. Res., 17: 140991418.
Taugbol, G. and Neal, C., 1994. Soil and stream water chemistry variations on acidic soils. Application of a cation exchange model at the catchment level. Sci. Total Environ., 149: 83-95.
Ugolini, F.C., Minden, R., Dawson, H. and Zachara, J., 1977. An example of soil processes in the Abies amabilis zone of Central Cascades, Washington. Soil Sci., 124: 291-302.


