Embed Size (px)
Citation preview
University of South FloridaScholar Commons
Graduate Theses and Dissertations Graduate School
2007
Sol-gel immobilized cyano-polydimethylsiloxaneand short chain polyethylene glycol coatings forcapillary microextraction coupled to gaschromatographySameer M. KulkarniUniversity of South Florida
Follow this and additional works at: http://scholarcommons.usf.edu/etd
Part of the American Studies Commons
This Dissertation is brought to you for free and open access by the Graduate School at Scholar Commons. It has been accepted for inclusion inGraduate Theses and Dissertations by an authorized administrator of Scholar Commons. For more information, please [email protected].
Scholar Commons CitationKulkarni, Sameer M., "Sol-gel immobilized cyano-polydimethylsiloxane and short chain polyethylene glycol coatings for capillarymicroextraction coupled to gas chromatography" (2007). Graduate Theses and Dissertations.http://scholarcommons.usf.edu/etd/2249
Sol-Gel Immobilized Cyano-Polydimethylsiloxane and Short Chain Polyethylene Glycol
Coatings for Capillary Microextraction Coupled to Gas Chromatography
by
Sameer M. Kulkarni
A dissertation submitted in partial fulfillment of the requirements for the degree of
Doctor of Philosophy Department of Chemistry
College of Arts and Sciences University of South Florida
Major Professor: Abdul Malik, Ph.D. Milton D. Johnston, Jr., Ph.D.
Robert Potter, Ph.D. Jennifer Lewis, Ph.D.
Date of Approval: July 16, 2007
Keywords: SPME, In-tube SPME, polar, PAHs, ketones, aldehydes, amines, phenols, fatty acids
© Copyright 2007, Sameer M. Kulkarni

DEDICATION
To
my parents Mohan and Meenal Kulkarni,
my wife Pooja Kulkarni,
my brother Robin Kulkarni,
who made this possible, for their overwhelming love, encouragement, and support.

ACKNOWLEDGMENTS
I would like to acknowledge many people for their support, guidance, and
encouragement during my doctoral work. I would like to thank my major professor, Dr.
Abdul Malik, for his guidance, encouragement, and patience. I am also very grateful to
my dissertation committee members: Dr. Jennifer Lewis; Dr. Milton D. Johnston, Jr.; and
Dr. Robert Potter for their valuable advice, and encouragement.
I would like to thank all my former and current colleagues, Dr. Khalid Alhooshani,
Dr. Tae-Young Kim, Dr. Wen Li, Li Fang, Anne Marie Shearrow, Erica Turner, and
Scott Segro for their continuous assistance, encouragement, and friendship. I
acknowledge the Department of Chemistry for their financial support throughout my
graduate study.
Finally, I would like to express my great appreciation and gratitude to my parents,
my wife, and my brother for their immense love and support.
i
TABLE OF CONTENTS
LIST OF TABLES viii
LIST OF FIGURES xiv
LIST OF SCHEMES xviii
LIST OF SYMBOLS AND ABBREVIATIONS xix
ABSTRACT xxiii
CHAPTER 1: AN INTRODUCTION TO SOLID-PHASE
MICROEXTRACTION 1
1.1 An Overview on Sample Preparation 1
1.2 History of SPME 3
1.3 Extraction Modes in SPME 8
1.3.1 Modes of Extraction with Coated SPME Fiber 8
1.3.2 Modes of Extraction with in-tube SPME 14
1.4 Coatings used in SPME and in-tube SPME 15
1.4.1 Coatings used in Fiber SPME 15
1.4.1.1 Commercially Available Coatings for Fiber
SPME 16
1.4.1.2 Tailor-made Coatings for Fiber SPME 19
1.4.1.2.1 Carbonaceous Sorbents 19
1.4.1.2.2 Bonded-phase Silica Sorbents 20
1.4.1.2.3 Coated Metallic SPME Fibers 21
1.4.1.2.4 Miscellaneous Sorbents 23
1.4.2 Coatings used in in-tube SPME 26
1.4.2.1 Commercial GC Sorbents as in-tube SPME
Coatings 27
ii
1.4.2.2 Tailor-made Coatings for in-tube SPME 31
1.4.2.2.1 Restricted Access Materials 31
1.4.2.2.2 Molecularly Imprinted Polymers 32
1.4.2.2.3 Monolithic Sorbents 34
1.4.2.2.4 Miscellaneous Sorbents 37
1.5 Parameters Affecting Extraction Efficiency 38
1.5.1 Adjustment of Sample Matrix pH 39
1.5.2 Agitation of Sample Matrix 39
1.5.3 Heating of Sample Matrix 40
1.5.4 Addition of Salt to Sample Matrix 42
1.6 Derivatization 42
1.7 References to Chapter 1 45
CHAPTER 2: SOL-GEL TECHNOLOGY IN SOLID PHASE
MICROEXTRACTION AND CAPILLARY MIRCOEXTRACTION 54
2.1 Sol-gel Technology: A brief history 54
2.2 Reactions involved in sol-gel process 56
2.3 Steps involved in Preparation of Sol-gel Soated SPME Fiber
and CME Capillary 63
2.3.1 Design and Preparation of Sol Solution 63
2.3.2 Pretreatment, Coating, and Post-coating Treatment
of Fused Silica SPME Fiber/Capillary 64
2.4 Characterization and Morphology of Sol-gel Sorbents 69
2.5 Sol-gel Sorbents in SPME and CME: A Brief Overview 71
2.5.1 Sol-gel PDMS and PDMDPS Sorbents 77
2.5.2 Sol-gel PDMS-PVA Sorbents 78
2.5.3 Sol-gel PDMS-PMPVS Sorbents 79
2.5.4 Sol-gel PDMS-DVB Sorbents 80
2.5.5 Sol-gel PDMS-Fullerene Sorbent 81
2.5.6 Sol-gel PDMS-Calix4arene Sorbents 82
iii
2.5.7 Sol-gel PDMS-Crown ether Sorbents 85
2.5.8 Sol-gel Cyclodextrin Sorbents 90
2.5.9 Sol-gel Dendrimer Sorbent 91
2.5.10 Sol-gel Poly-THF Sorbent 92
2.5.11 Miscellaneous Sol-gel Sorbents 93
2.6 References to Chapter 2 96
CHAPTER 3: SOL-GEL IMMOBILIZED CYANO-
POLYDIMETHYLSILOXANE COATING FOR
CAPILLARY MICROEXTRACTION 104
3.1 Introduction 104
3.2 Experimental Section 107
3.2.1 Equipment 107
3.2.2 Materials and Chemicals 108
3.2.3 Preparation of Sol-gel CN-PDMS Coated
Microextraction Capillaries 110
3.2.3.1 Preparation of Sol Solution 110
3.2.3.2 Pretreatment of Fused Silica Capillary 112
3.2.3.3 Coating of Fused Silica Capillary with Sol
Solution 113
3.2.3.4 Post-coating Treatment 114
3.2.4 Preparation of Standard Solution Samples for CME 115
3.2.5 Capillary Microextraction of Analytes on Sol-gel
CN-PDMS Coated Capillaries 115
3.2.6 GC Analysis of the Extracted Analytes 115
3.2.7 Calculation of limit of Detection (LOD) for the
Extracted Analytes 116
3.2.8 Analyte Enhancement Factor for Sol-gel CN-PDMS
Coated Microextraction Capillaries 118
iv
3.3 Resuts and Discussion 121
3.3.1 Reactions Leading to the Formation of Chemically
Immobilized Sol-gel CN-PDMS Network 121
3.3.2 Characterization of surface morphology and
Determination of Coating Thickness using Scanning
Electron Microscopy 128
3.3.3 Thermal- and Solvent Stabilities of Sol-gel CN-PDMS
Coated Micorextraction Capillaries 128
3.3.4 Extraction Profile of Moderately Polar and Highly
Polar Organic Compounds on Sol-gel CN-PDMS
Microextraction Capillary 135
3.3.5 CME-GC Analysis of Non-polar, Moderately Polar,
and Highly Polar Organic Compounds using Sol-gel
CN-PDMS Coated Microextraction Capillaries 135
3.3.5.1 CME-GC-FID of Polycyclic Aromatic
Hydrocarbons using Sol-gel CN-PDMS
Coated Microextraction Capillaries 137
3.3.5.2 CME-GC-FID of Aldehydes and Ketones
using Sol-gel CN-PDMS Coated
Microextraction Capillaries 144
3.3.5.3 CME-GC-FID of Aromatic Amines using
Sol-gel CN-PDMS Coated Microextraction
Capillaries 156
3.3.5.4 CME-GC-FID of Chlorophenols using Sol-gel
CN-PDMS Coated Microextraction Capillaries 162
3.3.5.5 CME-GC-FID of Alcohols using Sol-gel CN-
PDMS Coated Microextraction Capillaries 168
3.3.5.6 CME-GC-FID of Free Fatty Acids using
Sol-gel CN-PDMS Coated Microextraction
Capillaries 174
v
3.3.5.7 CME-GC-FID of Mixture of Nonpolar,
Moderately Polar, and Highly Polar Organic
Compounds using Sol-gel CN-PDMS Coated
Microextraction Capillary 180
3.3.5.8 Performance of Sol-gel CN-PDMS Capillary
in CME 180
3.4 Conclusion 184
3.5 References to Chapter 3 185
CHAPTER 4: SOL-GEL IMMOBILIZED SHORT CHAIN
POLYETHYLENE GLYCOL COATING FOR CAPILLARY
MICROEXTRACTION 189
4.1 Introduction 189
4.2 Experimental Section 191
4.2.1 Equipment 191
4.2.2 Materials and Chemicals 191
4.2.3 Preparation of Sol-gel PEG Coated Microextraction
Capillaries 192
4.2.3.1 Preparation of Sol Solution 193
4.2.3.2 Pretreatment of Fused Silica Capillary 193
4.2.3.3 Coating of Fused Silica Capillary with
Sol Solution 195
4.2.3.4 Post-coating Treatment 196
4.2.4 Preparation of Standard Solution Samples for CME 197
4.2.5 Capillary Microextraction of Analytes on Sol-gel
PEG Coated Capillaries 197
4.2.6 GC Analysis of the Extracted Analytes 198
4.2.7 Calculation of the Limit of Detection (LOD) for
Extracted Analytes 199
vi
4.2.8 Analyte Enhancement Factor for Short Chain
Sol-gel PEG Coated Microextraction Capillaries 199
4.3 Results and Discussion 199
4.3.1 Reactions Leading to the Formation of a
Chemically Immobilized Sol-gel PEG Network 200
4.3.2 Determination of the Coating Thickness of the Sol-
gel Coating using Scanning Electron Microscopy 201
4.3.3 Thermal- and Solvent Stabilities of Sol-gel PEG
Coating 206
4.3.4 Extraction Profile of Organic Compounds on
Sol-gel PEG Coated Microextraction Capillary 209
4.3.5 CME-GC Analysis of Moderately Polar and
Highly Polar Organic Compounds using Sol-gel
PEG Microextraction Capillaries 209
4.3.5.1 CME-GC-FID of Aldehydes and Ketones
using Sol-gel PEG Coated Microextraction
Capillaries 211
4.3.5.2 CME-GC-FID of Aromatic Amines using
Sol-gel PEG Coated Microextraction
Capillaries 223
4.3.5.3 CME-GC-FID of Phenol Derivatives using
Sol-gel PEG Coated Microextraction
Capillaries 231
4.3.5.4 CME-GC-FID of Alcohols using Sol-gel PEG
Coated Microextraction Capillaries 238
4.3.5.5 CME-GC-FID of Free Fatty Acids using
Sol-gel PEG Coated Microextraction
Capillaries 244
vii
4.3.5.6 CME-GC-FID of Mixture of Moderately
Polar and Highly Polar Organic Compounds
using Sol-gel PEG Coated Microextraction
Capillaries 251
4.3.5.7 CME Performance of Sol-gel Capillaries
Prepared with and without TESP 251
4.4 Conclusion 255
4.5 References to Chapter 4 256
APPENDICES 260
Appendix A: Sol-gel Immobilized Cyano-polydimethylsiloxane
Coating for Capillary Microextraction of Aqueous
Trace Analytes Ranging from Polycyclic Aromatic
Hydrocarbons to Free Fatty Acids 261
Appendix B: Quantitative Analysis in CME 273
Appendix C: Optimization of Sol-gel Coatings Solution Composition 278
Appendix D: LOD data for various organic analytes extracted using
sol-gel CN-PDMS, short chain sol-gel PEG and other
SPME/CME coatings reported in literature 280
ABOUT THE AUTHOR End Page
viii
LIST OF TABLES
Table 1.1 Commercially available fiber coatings for SPME and its applications
17
Table 1.2 Chemical structure and composition of GC stationary phases used in in-tube SPME
28
Table 2.1 Characteristic Infrared bands in spectra of sol-gel materials
70
Table 2.2 Summary of sol-gel sorbent used in SPME and CME
72
Table 3.1 Names, functions, and chemical structures of sol-gel CN-PDMS coating solution ingredients 111
Table 3.2 GC Peak area repeatability data (n=3) for free fatty acids obtained in CME-GC experiments before and after rinsing the sol-gel CN-PDMS coated microextraction capillary with a mixture (50 mL) of dichloromethane/methanol (1:1, v/v) for 24 hours
134
Table 3.3 Chemical structures and pertinent physical properties of polycyclic aromatic hydrocarbons (PAHs) extracted using sol-gel CN-PDMS coating
139
Table 3.4 Experimental data on CME-GC replicate measurements illustrating run-to-run peak area reproducibility for mixtures of PAHs extracted on a sol-gel CN-PDMS microextraction capillary
141
Table 3.5 Experimental data on CME-GC replicate measurements illustrating capillary-to-capillary peak area reproducibility for a mixtures of PAHs extracted on a sol-gel CN-PDMS microextraction capillary
142
Table 3.6 Limits of detection (LOD) data for PAHs in CME-GC-FID using sol-gel CN-PDMS microextraction capillaries
143
Table 3.7 Chemical structures and pertinent physical properties of aldehydes extracted using sol-gel CN-PDMS coating
146
ix
Table 3.8 Experimental data on CME-GC replicate measurements illustrating run-to-run peak area reproducibility for mixtures of aldehydes extracted on a sol-gel CN-PDMS microextraction capillary
148
Table 3.9 Experimental data on CME-GC replicate measurements illustrating capillary-to-capillary peak area reproducibility for mixtures of aldehydes extracted on a sol-gel CN-PDMS microextraction capillary
149
Table 3.10 Limits of detection (LOD) data for aldehydes in CME-GC-FID using sol-gel CN-PDMS microextraction capillaries
150
Table 3.11 Chemical structures and pertinent physical properties of ketones extracted using sol-gel CN-PDMS coating
151
Table 3.12 Experimental data on CME-GC replicate measurements illustrating run-to-run peak area reproducibility for mixtures of ketones extracted on a sol-gel CN-PDMS microextraction capillary
153
Table 3.13 Experimental data on CME-GC replicate measurements illustrating capillary-to-capillary peak area reproducibility for mixtures of ketones extracted on a sol-gel CN-PDMS microextraction capillary
154
Table 3.14 Limits of detection (LOD) data for ketones in CME-GC-FID using sol-gel CN-PDMS microextraction capillaries
155
Table 3.15 Chemical structures and pertinent physical properties of aromatic amines extracted using sol-gel CN-PDMS coating
157
Table 3.16 Experimental data on CME-GC replicate measurements illustrating run-to-run peak area reproducibility for mixtures of aromatic amines extracted on a sol-gel CN-PDMS microextraction capillary
159
Table 3.17 Experimental data on CME-GC replicate measurements illustrating capillary-to-capillary peak area reproducibility for mixtures of aromatic amines extracted on a sol-gel CN-PDMS microextraction capillary
160
Table 3.18 Limits of detection (LOD) data for aromatic amines in CME-GC-FID using sol-gel CN-PDMS microextraction capillaries
161
x
Table 3.19 Chemical structures and pertinent physical properties of chlorophenols extracted using sol-gel CN-PDMS coating
163
Table 3.20 Experimental data on CME-GC replicate measurements illustrating run-to-run peak area reproducibility for mixtures of chlorophenols extracted on a sol-gel CN-PDMS microextraction capillary
165
Table 3.21 Experimental data on CME-GC replicate measurements illustrating capillary-to-capillary peak area reproducibility for mixtures of chlorophenols extracted on a sol-gel CN-PDMS microextraction capillary
166
Table 3.22 Limits of detection (LOD) data for chlorophenols in CME-GC-FID using sol-gel CN-PDMS microextraction capillaries
167
Table 3.23 Chemical structures and pertinent physical properties of alcohols extracted using sol-gel CN-PDMS coating
169
Table 3.24 Experimental data on CME-GC replicate measurements illustrating run-to-run peak area reproducibility for mixtures of alcohols extracted on a sol-gel CN-PDMS microextraction capillary
171
Table 3.25 Experimental data on CME-GC replicate measurements illustrating capillary-to-capillary peak area reproducibility for mixtures of alcohols extracted on a sol-gel CN-PDMS microextraction capillary
172
Table 3.26 Limits of detection (LOD) data for alcohols in CME-GC-FID using sol-gel CN-PDMS microextraction capillaries
173
Table 3.27 Chemical structures and pertinent physical properties of free fatty acids extracted using sol-gel CN-PDMS coating
175
Table 3.28 Experimental data on CME-GC replicate measurements illustrating run-to-run peak area reproducibility for mixtures of free fatty acids extracted on a sol-gel CN-PDMS microextraction capillary
177
Table 3.29 Experimental data on CME-GC replicate measurements illustrating capillary-to-capillary peak area reproducibility for mixtures of free fatty acids extracted on a sol-gel CN-PDMS microextraction capillary
178
xi
Table 3.30 Limits of detection (LOD) data for free fatty acids in CME-GC-FID using sol-gel CN-PDMS microextraction capillaries
179
Table 4.1 Names, functions, and chemical structures of sol-gel PEG coating solution ingredients
194
Table 4.2 GC peak area repeatability data (n=3) for alcohols obtained in CME-GC experiments conducted before and after rinsing the sol-gel PEG coated microextraction capillary with a mixture (50 mL) of dichloromethane/methanol (1:1, v/v) for 24 hours
208
Table 4.3 Chemical structures and pertinent physical properties of aldehydes extracted using sol-gel PEG coating
212
Table 4.4 Experimental data on CME-GC replicate measurements illustrating run-to-run GC peak area reproducibility for mixtures of aldehydes extracted on a sol-gel PEG microextraction capillary
214
Table 4.5 Experimental data on CME-GC replicate measurements illustrating capillary-to-capillary GC peak area reproducibility for mixtures of aldehydes extracted on a sol-gel PEG microextraction capillary
215
Table 4.6 Limits of detection (LOD) data for aldehydes in CME-GC-FID using sol-gel PEG microextraction capillaries
216
Table 4.7 Chemical structures and pertinent physical properties of ketones extracted using sol-gel PEG coating
218
Table 4.8 Experimental data on CME-GC replicate measurements illustrating run-to-run GC peak area reproducibility for mixtures of ketones extracted on a sol-gel PEG microextraction capillary
220
Table 4.9 Experimental data on CME-GC replicate measurements illustrating capillary-to-capillary GC peak area reproducibility for mixtures of ketones extracted on a sol-gel PEG microextraction capillary
221
Table 4.10 Limits of detection (LOD) data for ketones in CME-GC-FID using sol-gel PEG microextraction capillaries
222
Table 4.11 Chemical structures and pertinent physical properties of aromatic amines extracted using sol-gel PEG coating
225
xii
Table 4.12 Experimental data on CME-GC replicate measurements illustrating run-to-run GC peak area reproducibility for mixtures of aromatic amines extracted on a sol-gel PEG microextraction capillary
228
Table 4.13 Experimental data on CME-GC replicate measurements illustrating capillary-to-capillary GC peak area reproducibility for mixtures of aromatic amines extracted on a sol-gel PEG microextraction capillary
229
Table 4.14 Limits of detection (LOD) data for aromatic amines in CME-GC-FID using sol-gel PEG microextraction capillaries
230
Table 4.15 Chemical structures and pertinent physical properties of phenol derivatives extracted using sol-gel PEG coating
233
Table 4.16 Experimental data on CME-GC replicate measurements illustrating run-to-run GC peak area reproducibility for mixtures of phenol derivatives extracted on a sol-gel PEG microextraction capillary
235
Table 4.17 Experimental data on CME-GC replicate measurements illustrating capillary-to-capillary GC peak area reproducibility for mixtures of phenol derivatives extracted on a sol-gel PEG microextraction capillary
236
Table 4.18 Limits of detection (LOD) data for phenol derivatives in CME-GC-FID using sol-gel PEG microextraction capillaries
237
Table 4.19 Chemical structures and pertinent physical properties of alcohols extracted using sol-gel PEG coating
239
Table 4.20 Experimental data on CME-GC replicate measurements illustrating run-to-run GC peak area reproducibility for mixtures of alcohols extracted on a sol-gel PEG microextraction capillary
241
Table 4.21 Experimental data on CME-GC replicate measurements illustrating capillary-to-capillary GC peak area reproducibility for mixtures of alcohols extracted on a sol-gel PEG microextraction capillary
242
Table 4.22 Limits of detection (LOD) data for alcohols in CME-GC-FID using sol-gel PEG microextraction capillaries
243
xiii
Table 4.23 Chemical structures and pertinent physical properties of free fatty acids extracted using sol-gel PEG coating
246
Table 4.24 Experimental data on CME-GC replicate measurements illustrating run-to-run GC peak area reproducibility for mixtures of free fatty acids extracted on a sol-gel PEG microextraction capillary
248
Table 4.25 Experimental data on CME-GC replicate measurements illustrating capillary-to-capillary GC peak area reproducibility for mixtures of free fatty acids extracted on a sol-gel PEG microextraction capillary
249
Table 4.26 Limits of detection (LOD) data for free fatty acids in CME-GC-FID using sol-gel PEG microextraction capillaries
250
xiv
LIST OF FIGURES Figure 1.1 Custom-made SPME device based on Hamilton™ 7000 series
microsyringe
5
Figure 1.2 Design of the first commercial SPME device produced by Supelco
6
Figure 1.3 Modes of extraction with coated fiber (a) direct extraction; (b) headspace configuration; (c) membrane protection approach
10
Figure 1.4 Schematic representation of molecular imprinting process
33
Figure 1.5 Scanning electron microscopic images of poly(AA-VP-Bis) monolithic capillary; (a) Wide-view and (b) close-up-view
36
Figure 1.6 Design of internally cooled SPME device
41
Figure 1.7 SPME derivatization techniques
43
Figure 2.1 Overview of the sol-gel process 58
Figure 2.2 Schematics illustrating the cross sectional view of sorbent-coated SPME fiber (A), and sorbent-coated CME capillary (B)
65
Figure 2.3 Schematic of a homemade capillary filling/purge device
67
Figure 3.1 Gravity-fed sample delivery system for capillary microextraction
109
Figure 3.2 Schematic representation of the connection of the microextraction capillary with the analysis column inside the GC oven using a press-fit quartz connector
117
Figure 3.3 Standard curve for 1-undecanol obtained by direct injection into the GC under splitless mode
120
xv
Figure 3.4 Scanning electron microscopic image of a sol-gel CN-PDMS coating on the inner surface of a fused silica capillary (250 µm i.d.) used in CME illustrating uniform coating thickness on the inner surface of the fused silica capillary, magnification: 10,000x
129
Figure 3.5 Scanning electron microscopic image of a sol-gel CN-PDMS coating on the inner surface of a fused silica capillary (250 µm i.d.) used in CME illustrating porous fine structure of sol-gel CN-PDMS coating, magnification: 20,000x
130
Figure 3.6 Effect of conditioning temperature on the performance of sol-gel CN-PDMS microextraction capillary in CME of alcohols used as test solutes
132
Figure 3.7 Effect of conditioning temperature on the performance of sol-gel CN-PDMS microextraction capillary in CME of PAHs used as test solutes
133
Figure 3.8 Illustration of the extraction profiles of moderately polar and polar analytes
136
Figure 3.9 CME-GC analysis of aqueous samples of PAHs on a sol-gel CN-PDMS capillary
140
Figure 3.10 CME-GC analysis of aldehydes on a sol-gel CN-PDMS capillary
147
Figure 3.11 CME-GC analysis of ketones on a sol-gel CN-PDMS capillary
152
Figure 3.12 CME-GC analysis of aromatic amines on a sol-gel CN-PDMS capillary
158
Figure 3.13 CME-GC analysis of chlorophenols on a sol-gel CN-PDMS capillary
164
Figure 3.14 CME-GC analysis of alcohols on a sol-gel CN-PDMS capillary
170
Figure 3.15 CME-GC analysis of free fatty acids on a sol-gel CN-PDMS capillary
176
Figure 3.16 CME-GC analysis of a mixture of nonpolar, moderately polar and highly polar organic compounds on a sol-gel CN-PDMS capillary
181
xvi
Figure 3.17 CME-GC analysis of mixture of two alcohols and two free fatty acids on a sol-gel CN-PDMS capillary
182
Figure 3.18 CME-GC analysis of mixture of two alcohols and two free fatty acids on a sol-gel PDMS capillary
183
Figure 4.1 Scanning electron microscopic image of a sol-gel PEG coating on the inner surface of a fused silica capillary (250 µm i.d.) used in CME illustrating uniform coating thickness on the inner surface of the fused silica capillary, magnification: 10,000x
205
Figure 4.2 Effect of conditioning temperature on the performance of sol-gel PEG microextraction capillary
207
Figure 4.3 Illustration of the extraction profiles of moderately polar and polar analytes
210
Figure 4.4 CME-GC analysis of aldehydes on a sol-gel PEG capillary
213
Figure 4.5 CME-GC analysis of ketones on a sol-gel PEG capillary 219
Figure 4.6-A CME-GC analysis of aromatic amines on a sol-gel PEG capillary
226
Figure 4.6-B CME-GC analysis of aromatic amines on a sol-gel PEG capillary
227
Figure 4.7 CME-GC analysis of phenols on a sol-gel PEG capillary 234
Figure 4.8 CME-GC analysis of alcohols on a sol-gel PEG capillary 240
Figure 4.9 CME-GC analysis of free fatty acids on a sol-gel PEG capillary
247
Figure 4.10 CME-GC analysis of a mixture of moderately polar and highly polar organic compounds on a sol-gel PEG capillary
252
Figure 4.11 CME-GC analysis of mixture of two alcohols and two free fatty acids on a sol-gel microextraction capillary prepared using TESP
253
xvii
Figure 4.12 CME–GC analysis of mixture of two alcohols and two free fatty acids on a sol-gel microextraction capillary prepared without TESP
254
xviii
LIST OF SCHEMES
Scheme 2.1 Key reactions in sol-gel prosess
57
Scheme 2.2-A Mechanism of acid catalyzed sol-gel reactions 61
Scheme 2.2-B Mechanism of base catalyzed sol-gel reactions 62
Scheme 3.1 Hydrolysis of 3-cyanopropyltriethoxysilane (precursor) and tetraethoxysilane (co-precursor)
123
Scheme 3.2-A Growth of sol-gel CN-PDMS polymer chains within a fused silica capillary via polycondensation of a hydrolyzed precursor (A) and a hydrolyzed co-precursor (B)
124
Scheme 3.2-B Growth of sol-gel CN-PDMS polymer chains within a fused silica capillary via polycondensation of precursors (C) and a sol-gel active polymer (D)
125
Scheme 3.3 Sol-gel CN-PDMS coating chemically anchored to the inner walls of fused silica capillary
126
Scheme 3.4 Deactivation of sol-gel CN-PDMS coating chemically anchored to the inner walls of fused silica capillary
127
Scheme 4.1 Hydrolysis of methyltrimethoxysilane (precursor) and N-(triethoxysilylpropyl)-O-polyethylene oxide urethane (sol-gel co-precursor with bonded PEG moiety)
202
Scheme 4.2 Growth of sol-gel PEG polymer chains within a fused silica capillary via polycondensation of a hydrolyzed sol-gel precursor (A) and a hydrolyzed sol-gel co-precursor (B)
203
Scheme 4.3 Sol-gel PEG coating chemically anchored to the inner walls of fused silica capillary
204
xix
LIST OF SYMBOLS AND ABBREVIATIONS a Activity of analytes AA-VP-Bis Acrylamide-VinylPyridine-N, N’-methylene bisacrylamide AN Nucleophilic Addition ACF Active Carbon Fiber ACN Acetonitrile ADS Alkyl-Diol-Silica AFM Atomic Force Microscopy Amide bridged calix[4]arene
25,27-dihydroxy-26,28-oxy (2΄,7΄-dioxo-3΄,6΄-diazaoctyl)oxy-p-tert-butylcalix[4]arene
AMTEOS Anilinemethyltriethoxysilane APs Alkyl Phenols ASE Accelerated Solvent Extraction B15C5 3΄-allylbenzo-15-crow-5 ether bp Boiling Point BMA Butyl Methacrylate BPA Bisphenol-A BTEX Benzene, Toluene, Ethylbenzene, and Xylene C8 Octyl C18-TMS N-octadecyldimethyl[3-(trimethoxysilyl)propyl] ammonium
chloride CAR Carboxen CE Capillary Electrophoresis CEC Capillary Electrochromatography CEES 2-chloroethyl ethyl sulfide CME Capillary Microextraction CN-PDMS Cyanopropyl-Poly(dimethylsiloxane) CP Chlorophenol CW Carbowax d Density DATEG α,ω-Diallyltriethylene Glycol DB18C6 4-allyldibenzo-18-crown-6 ether DBUD14C4 Dibutyl-unsymmetric-dibenzo-14-crown-4-dihydroxy crown ether DCCA Drying Control Chemical Additive DEHP Di-(2-ethylhexyl)phosphoric acid DI Deionized
xx
Diglycidyloxy-C[4]arene
(5,11,17,23-tetra-tert-butyl)-25,27-dihydroxy-26,28-diglycidyloxycalix[4]arene
DHSU14C4 Dihydroxy-substituted saturated urushiol crown ether DOH-B15C5 Dihydroxy-terminated benzo-15-crown-5 DM-β-CD Heptakis (2,6-di-O-nethyl)-β-cyclodextrin DVB (or DB) Divinylbenzene ECD Electron Capture Detection EGDMA Ethylene Glycol Dimethacrylate EOF Electroosmotic Flow EP Ephedrine EPA Environmental Protection Agency EXAFS X-Ray Absorption Fine Structure Spectroscopy FID Flame Ionization Detector FTIR Fourier Transform Infrared Spectroscopy GAA Glacial Acetic Acid GC Gas Chromatography GBC Graphitized Carbon Black HMDS 1,1,1,3,3,3-Hexamethyldisilazane HPLC High-Performance Liquid Chromatography HS-SPME Headspace Solid-Phase Microextraction i.d. Inner Diameter INCAT Inside Needle Capillary Absorption Trap LC-MS Liquid Chromatography-Mass Spectrometry K Distribution constant KH-560 3-(2- cyclooxypropoxyl)propyltrimethoxysilane LLE Liquid-Liquid Extraction LOD Limit of Detection MA Methyl Acrylate MAA Methacrylic Acid MAE Microwave-Assisted Extraction MAHs Monocyclic Aromatic Hydrocarbons MeOH Methanol MIP Molecularly Imprinted Polymer MMA Methyl Methacrylate MP Methamphetamine MS mass spectrometry MTMOS Methyltrimethoxysilane MW Molecular Weight nD Refractive Index NMR Nuclear Magnetic Resonance
xxi
OCPs Organochlorine Pesticides ODS Octadecylsilane OH-DB14C4 Hydroxy-Terminated Dibenzo-14-Crown-4 OH-TSO Hydroxy-terminated Silicon Oil OPPs Oganophosporuos Pesticides OTCs Open-Tubular Capillary Columns OTEC Open-Tubular Electrochromatography OTLC Open-Tubular Liquid Chromatography PA Polyacrylate PAEs Phthalic acid esters PANI Polyaniline PAHs Polycyclic Aromatic Hydrocarbons PCBs Polychlorinated Biphenyls PDMDPS Poly(dimethyldiphenylsiloxane) PDMS Poly(dimethylsiloxane) PEEK Polyetheretherketone PEG Polyethylene Glycol PF Polysilicone Fullerene PheDMS Phenyldimethylsilane PLAC Porous Layer Activated Charcoal PLE Pressurized Liquid Extraction PMHS poly(methylhydrosiloxane) PMPVS Polymethylphenylvinylsiloxane PPY Polypyrrole PPPY Poly-N-Phenylpyrrole PTMO Polytetramethylene oxide PVA Poly(vinyl alcohol) RAM Restricted Access Material RPLC Reversed-Phase Liquid Chromatography RPM Revolution per Minute RSD Relative Standard Deviation S/N Signal to Noise SN Nucleophilic Substitution SAM Self-Assembled Monolayer SEM Scanning Electron Microscopy SFC Supercritical Fluid Chromatography SFE Supercritical Fluid Extraction SPE Solid-Phase Extraction SPME Solid-Phase Microextraction Tg Glass transition termperature
xxii
TEOS Tetraethylorthosilicate (or Tetraethoxysilane) TESP N-(Triethoxysilylpropyl)-O-Polyethylene Oxide Urethane TFA Trifluoroacetic Acid THF Tetrahydrofuran TEOS Tetraethylorthosilicate (or Tetraethoxysilane) TMSPMA 3-(trimethoxysilyl)propyl methacrylate TR Templated Resin UV Ultraviolet VOC Volatile Organic Compound VTEOS Vinyltriethoxysilane XANES X-Ray Absorption Near Edge Spectroscopy XPS X-Ray Photoelectron Spectroscopy
xxiii
Sol-Gel Immobilized Cyano-Polydimethylsiloxane and Short Chain Polyethylene Glycol
Coatings for Capillary Microextraction Coupled to Gas Chromatography
Sameer M. Kulkarni
ABSTRACT
Two highly polar sol-gel coatings were developed for capillary microextraction
(CME). One of the coatings contained cyanopropyl-polydimethylsiloxane (CN-PDMS)
and the other low molecular weight polyethylene glycol. These highly polar coatings
were immobilized via sol-gel chemistry allowing for direct chemical bonding to the inner
surface of fused silica capillaries. These sol-gel coated microextraction capillaries were
employed in CME for solvent-free microextraction and preconcentration of trace analytes
(polar, moderately polar, and nonpolar) from aqueous matrices. CN-PDMS and short
chain PEG extraction phases exhibit both polar and polarizable characteristics. Therefore,
both sol-gel CN-PDMS and short chain sol-gel PEG coatings were able to extract
analytes of different polarity from aqueous media. Both sol-gel CN-PDMS and sol-gel
PEG coatings provided effective extraction of polar analytes such as free fatty acids,
alcohols, and phenols without requiring derivatization, pH adjustment or salting out
procedures commonly used in SPME experiments with conventional coatings. For each
of these coatings, detection limits on the order of nanogram/liter (ng/L) were achieved for
both polar and nonpolar analytes extracted simultaneously from aqueous media followed
xxiv
by GC-FID analysis. Both sol-gel CN-PDMS and short chain sol-gel PEG coated
microextraction capillaries showed excellent run-to-run and capillary-to-capillary
extraction reproducibility (GC peak area RSD < 6% & 5%, respectively) for nonpolar as
well as polar analytes. For the sol-gel CN-PDMS coatings, the upper allowable
conditioning temperatures were 330 °C and 350 °C, for the extraction of polar and
nonpolar organic analytes, respectively. Similarly, the sol-gel PEG coatings used for the
extraction of polar organic analytes survived a conditioning temperature of 340 °C. Both
sol-gel CN-PDMS and sol-gel PEG coated microextraction capillaries showed no
significant changes in the peak areas of the extracted analytes even after being washed
with organic solvents (dichloromethane and methanol (1:1), v/v) for 24 hours. The
excellent thermal and solvent stabilities can be attributed to the presence of chemical
bonds between the sol-gel coatings and the fused silica surface.
1
CHAPTER 1
AN INTRODUCTION TO SOLID-PHASE MICROEXTRACTION
1.1 An overview on sample preparation
During the past several decades, public awareness of health risk associated with
environmental contaminants has stimulated interest in environmental research and
monitoring which, in turn, has resulted in a requirement for the determination of toxic
contaminants in air, water, and solids, including soil and sediment samples. The
conventional approaches to sample preparation and analysis are not usually in keeping
with the determination of complex environmental samples.
In general, an analytical method involves several processes such as sampling
(collection of a representative sample), sample preparation (isolation from the matrix,
preconcentration, fractionation and, if necessary, derivatization), separation, detection,
and interpretation of the analytical data. These analytical steps are followed consecutively,
and therefore, overall speed of any analysis is determined by the speed of the slowest step.
Since the success of an analytical procedure depends on the performance of each
individual step, it is imperative to monitor each step. Typically, conventional sampling
and sample preparation methods are time-consuming and labor-intensive processes
involving multi-step procedures that often employ significant amounts of harmful organic
solvents and are often prone to analyte losses. Surveys show that more than 80% of
2
analysis time is spent on sample collection and sample preparation [1]. This is necessary
because in most cases analytical instruments cannot handle the sample matrices directly.
The whole analytical process can be wasted if an unsuitable sample preparation method is
employed before the sample reaches the analytical instrument [2,3].
Classical sample preparation methods include various extraction techniques, such
as Soxhlet extraction [4], liquid-liquid extraction (LLE) [5], accelerated solvent
extraction (ASE) [6], microwave-assisted solvent extraction (MAE) [7], solid-phase
extraction (SPE) [8], supercritical fluid extraction (SFE) [9], and purge-and-trap [10].
Sample preparation procedures using solvents consume large amounts of solvents, thus
creating environmental and occupational hazards. Moreover, they are time-consuming,
labor-intensive and involve multi-stage operations. Each step can introduce errors and
analyte losses, especially when preparing samples containing volatile analytes. The use of
SPE cartridges [11,12] has reduced many limitations of classical extraction methods. SPE
needs less solvent but it is a time-consuming multi-step process and often requires an
analyte preconcentration step via solvent evaporation, which may result in the loss of
volatile components. Adsorption of analytes on the walls of extraction devices may occur,
and trace impurities in the extraction solvent may simultaneously become concentrated.
Even though the volume of organic solvents needed for SPE is much less than that for
LLE or Soxhlet extraction techniques, it is still significant.
In order to eliminate limitations inherent in classical sampling and sample
preparation methods, Belardi and Pawliszyn [13] introduced solid-phase microextraction
(SPME) in 1989. SPME integrates sampling, extraction, preconcentration and sample
3
introduction into a solvent-free single-step procedure. SPME saves sample preparation
time and solvent disposal costs and provides improved detection limits for target analytes
both in the laboratory and in the field.
1.2 History of SPME
In late 1980s, when Pawliszyn and co-workers [14] were involved in laser
desorption/fast gas chromatography experiments, the sample preparation step took hours.
In such an experiment, one end of an optical fiber was dipped in the solvent extract of
target analytes and the volatile solvent was removed through evaporation, thus coating
the fiber with the sample. The coated end of the fiber was then inserted into the GC
injection port and analytes were desorbed onto the GC column using a laser pulse.
Although, use of laser pulse and high speed GC instrument was time efficient, the much
slower sample preparation technique prolonged the overall analysis time. To address this
problem, optical fibers with polymeric coatings were used. The original purpose of these
coatings was to protect the optical fibers from breakage. Since the coatings were thin (10-
100 µm), the expected extraction times for these systems were short.
The preliminary work on SPME involved uncoated and coated (with liquid and
solid polymeric phases) fused silica optical fibers. The extraction was performed using
sections of these fibers dipped into the aqueous sample containing tests analytes. These
analytes were then desorbed by placing the fibers in GC injection port. The early
experimental data indicated the effectiveness of this novel but simple approach to the
4
extraction of both nonpolar and polar analytes from aqueous samples in a reproducible
manner.
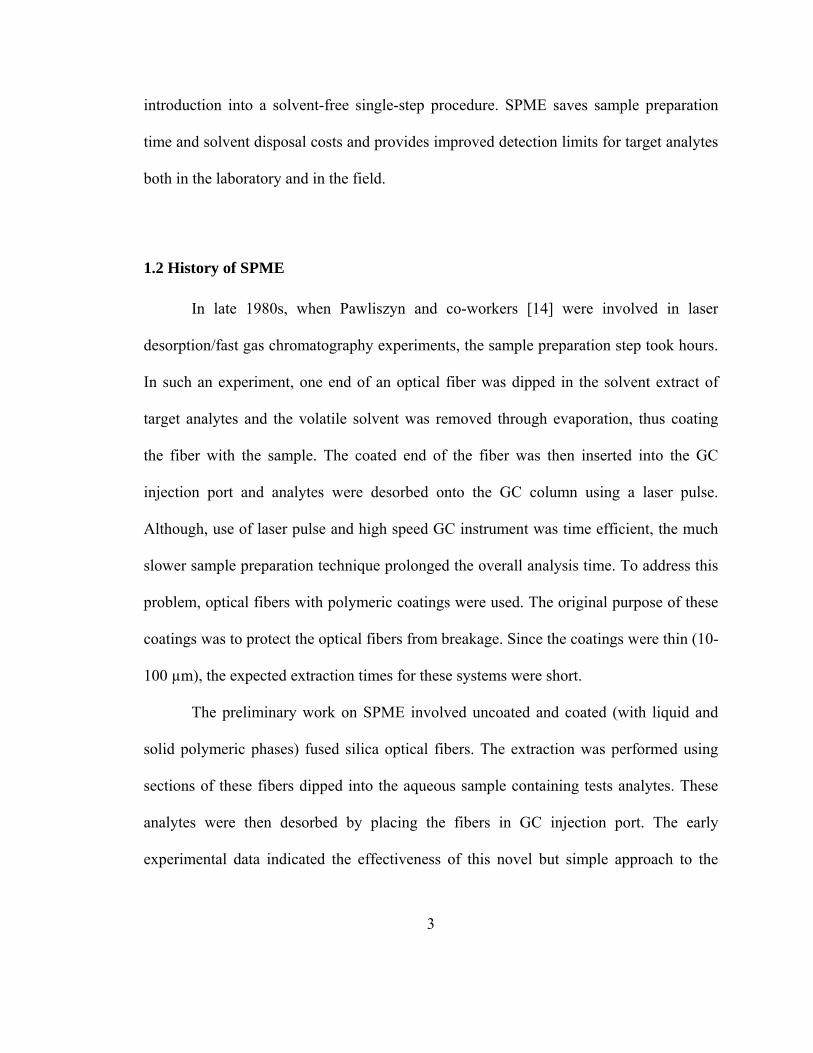
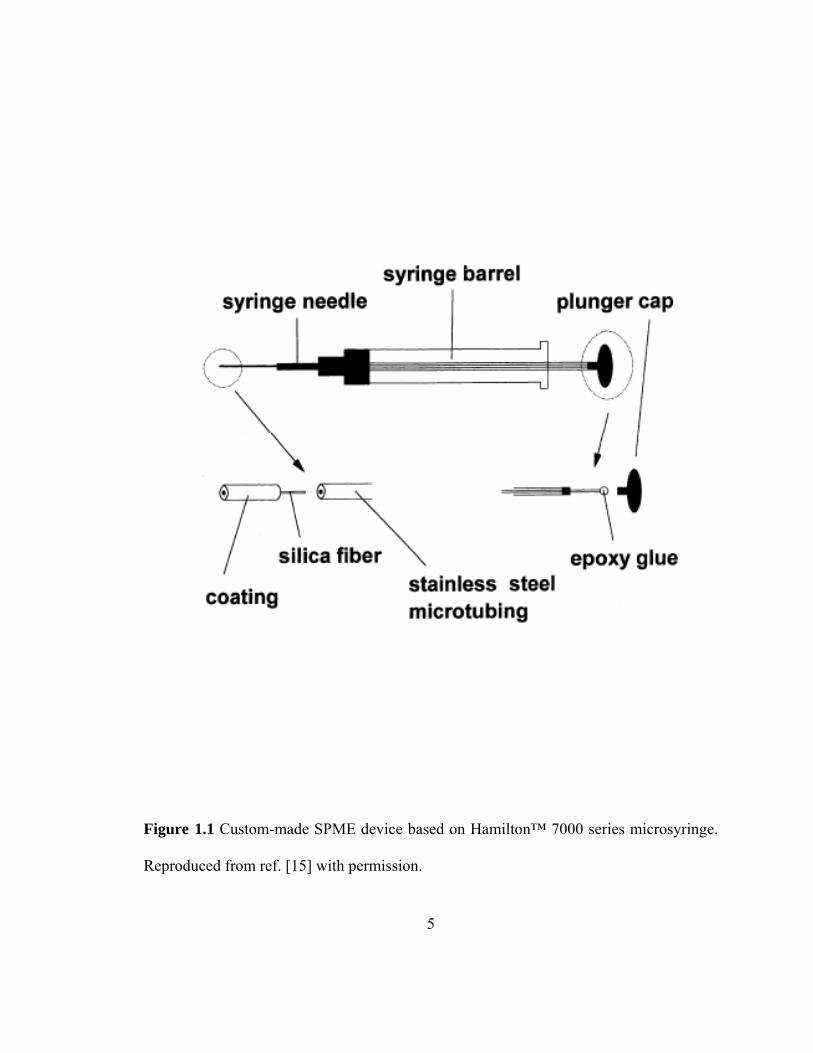
Promising results from these preliminary experiments accelerated the
development of first SPME device which incorporated a coated fused silica fiber into a
Hamilton™ 7000 series microsyringe [15]. As shown in figure 1.1, the plunger of the
microsyringe was replaced with stainless steel microtubing. The outer protective coating
(5 mm) was removed before inserting 1.5 cm long fused silica fiber into the microtubing.
Using epoxy glue the fiber was mounted on the plunger cap. Movement of the plunger
allowed exposure of the fiber (coated or uncoated with polymeric phase) during
extraction and desorption of target analytes. The syringe needle protected the fiber during
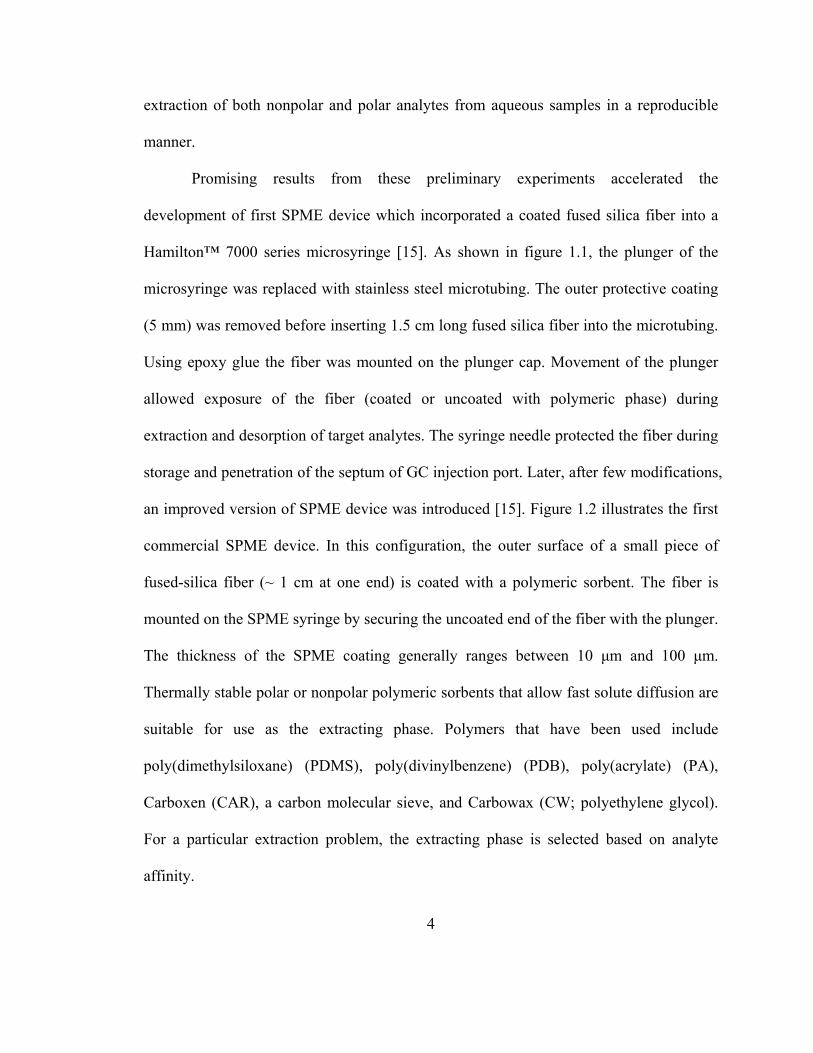
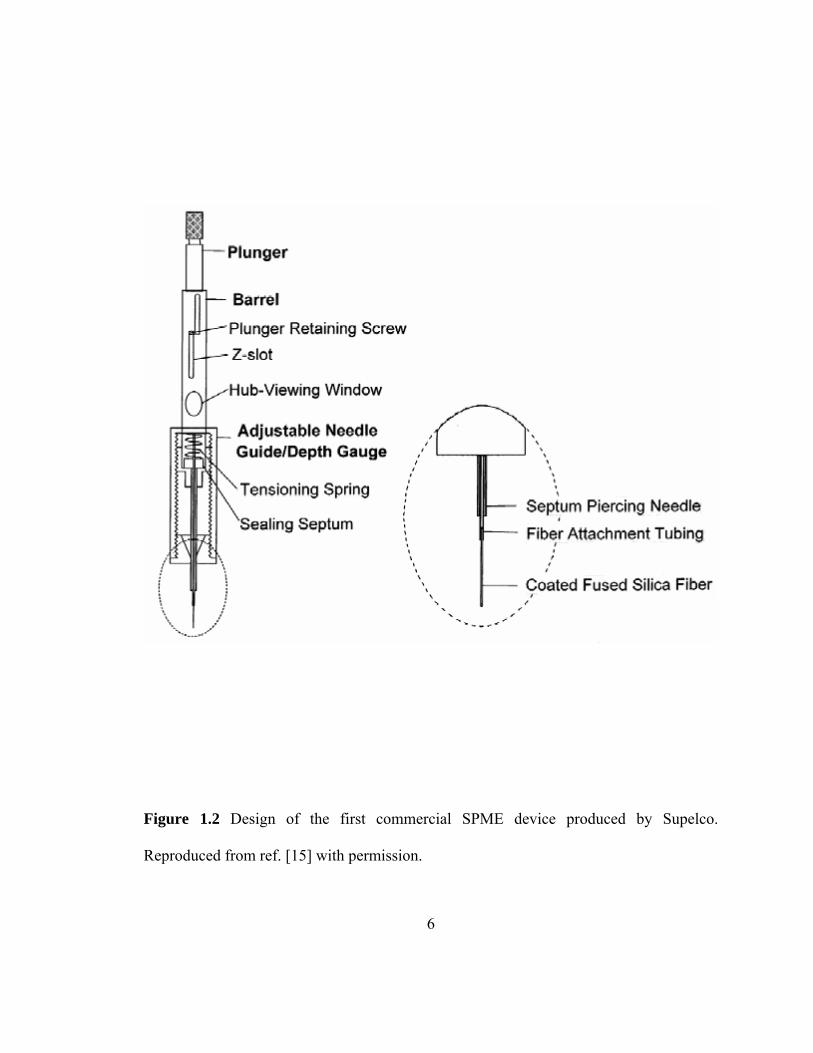
storage and penetration of the septum of GC injection port. Later, after few modifications,
an improved version of SPME device was introduced [15]. Figure 1.2 illustrates the first
commercial SPME device. In this configuration, the outer surface of a small piece of
fused-silica fiber (~ 1 cm at one end) is coated with a polymeric sorbent. The fiber is
mounted on the SPME syringe by securing the uncoated end of the fiber with the plunger.
The thickness of the SPME coating generally ranges between 10 µm and 100 µm.
Thermally stable polar or nonpolar polymeric sorbents that allow fast solute diffusion are
suitable for use as the extracting phase. Polymers that have been used include
poly(dimethylsiloxane) (PDMS), poly(divinylbenzene) (PDB), poly(acrylate) (PA),
Carboxen (CAR), a carbon molecular sieve, and Carbowax (CW; polyethylene glycol).
For a particular extraction problem, the extracting phase is selected based on analyte
affinity.
5
Figure 1.1 Custom-made SPME device based on Hamilton™ 7000 series microsyringe.
Reproduced from ref. [15] with permission.
6
Figure 1.2 Design of the first commercial SPME device produced by Supelco.
Reproduced from ref. [15] with permission.
7
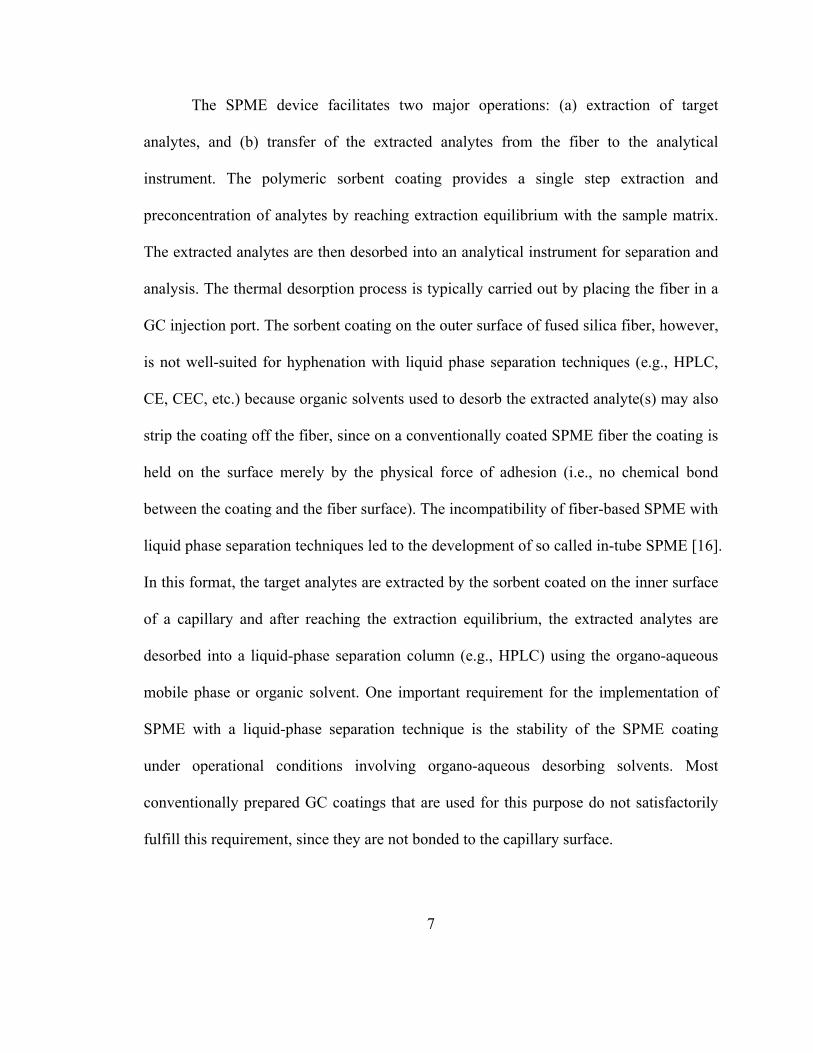
The SPME device facilitates two major operations: (a) extraction of target
analytes, and (b) transfer of the extracted analytes from the fiber to the analytical
instrument. The polymeric sorbent coating provides a single step extraction and
preconcentration of analytes by reaching extraction equilibrium with the sample matrix.
The extracted analytes are then desorbed into an analytical instrument for separation and
analysis. The thermal desorption process is typically carried out by placing the fiber in a
GC injection port. The sorbent coating on the outer surface of fused silica fiber, however,
is not well-suited for hyphenation with liquid phase separation techniques (e.g., HPLC,
CE, CEC, etc.) because organic solvents used to desorb the extracted analyte(s) may also
strip the coating off the fiber, since on a conventionally coated SPME fiber the coating is
held on the surface merely by the physical force of adhesion (i.e., no chemical bond
between the coating and the fiber surface). The incompatibility of fiber-based SPME with
liquid phase separation techniques led to the development of so called in-tube SPME [16].
In this format, the target analytes are extracted by the sorbent coated on the inner surface
of a capillary and after reaching the extraction equilibrium, the extracted analytes are
desorbed into a liquid-phase separation column (e.g., HPLC) using the organo-aqueous
mobile phase or organic solvent. One important requirement for the implementation of
SPME with a liquid-phase separation technique is the stability of the SPME coating
under operational conditions involving organo-aqueous desorbing solvents. Most
conventionally prepared GC coatings that are used for this purpose do not satisfactorily
fulfill this requirement, since they are not bonded to the capillary surface.
8
1.3 Extraction modes in SPME
As mentioned earlier, in SPME, the extracting phase can be either on the outer
surface of a fiber (fiber-SPME) or on the inner surface of a capillary (in-tube SPME, also
known as capillary microextraction (CME)) [17]. SPME can be used for solid, liquid, and
gaseous samples.
1.3.1 Modes of extraction with coated SPME fiber
There are three different extraction (SPME) modes that can be performed using coated
fibers: (I) direct extraction, (II) headspace extraction, and (III) a membrane-protected
extraction.
In direct extraction mode (Figure 1.3 (a)), the coated fiber is immersed into the sample
and the analyte(s) are transported directly from the sample matrix to the extracting phase.
Usually agitation is employed to facilitate the transport of analyte(s) from the bulk of the
solution to the vicinity of extracting phase. For gaseous samples, natural convection of air
is sufficient to facilitate equilibrium extraction. In case of aqueous samples, a variety of
agitation methods, such as fast sample flow, rapid vial or fiber shaking, stirring or
sonication of the aqueous sample may be employed. In direct SPME, extracting phase is
kept in contact with sample matrix containing target analyte(s) for predetermined amount
of time. When concentration equilibrium is reached between the sample matrix and the
extracting phase, exposing the extracting phase to the sample for longer time will not lead
to any further accumulation of the analyte(s). The equilibrium conditions can be
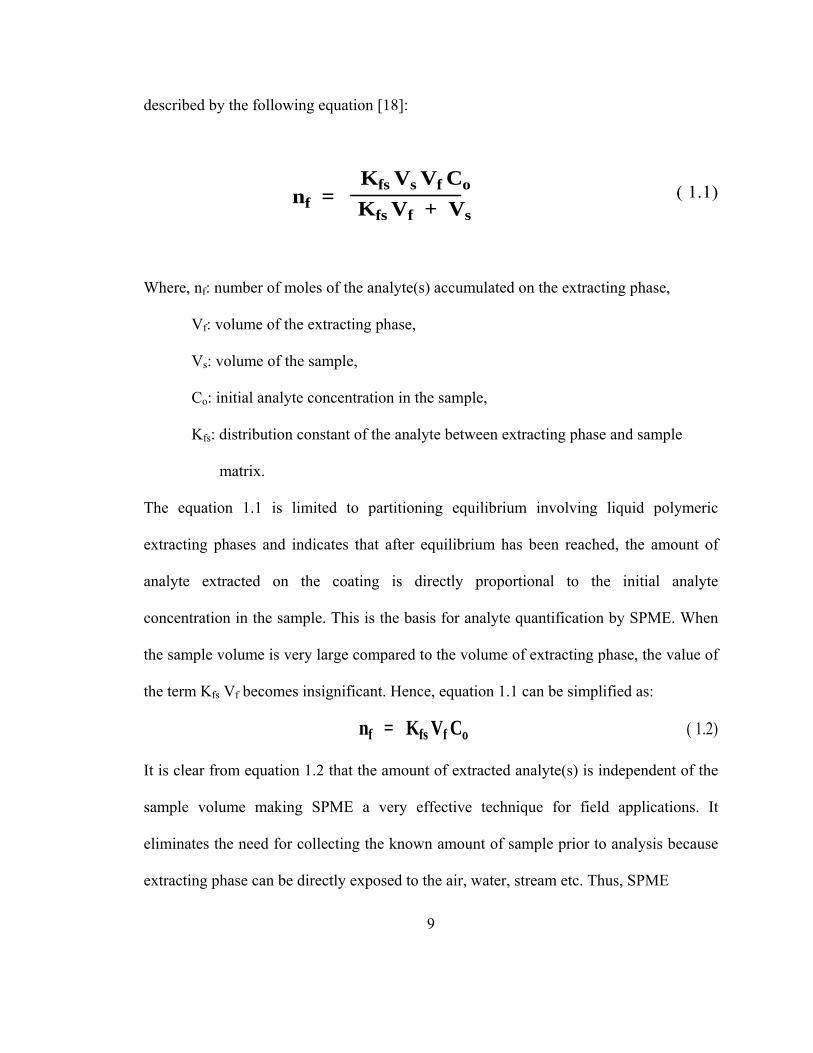
9
described by the following equation [18]:
nf =Kfs Vs Vf Co
Kfs Vf + Vs( 1.1)
Where, nf: number of moles of the analyte(s) accumulated on the extracting phase,
Vf: volume of the extracting phase,
Vs: volume of the sample,
Co: initial analyte concentration in the sample,
Kfs: distribution constant of the analyte between extracting phase and sample
matrix.
The equation 1.1 is limited to partitioning equilibrium involving liquid polymeric
extracting phases and indicates that after equilibrium has been reached, the amount of
analyte extracted on the coating is directly proportional to the initial analyte
concentration in the sample. This is the basis for analyte quantification by SPME. When
the sample volume is very large compared to the volume of extracting phase, the value of
the term Kfs Vf becomes insignificant. Hence, equation 1.1 can be simplified as:
nf = Kfs Vf Co ( 1.2)
It is clear from equation 1.2 that the amount of extracted analyte(s) is independent of the
sample volume making SPME a very effective technique for field applications. It
eliminates the need for collecting the known amount of sample prior to analysis because
extracting phase can be directly exposed to the air, water, stream etc. Thus, SPME
10
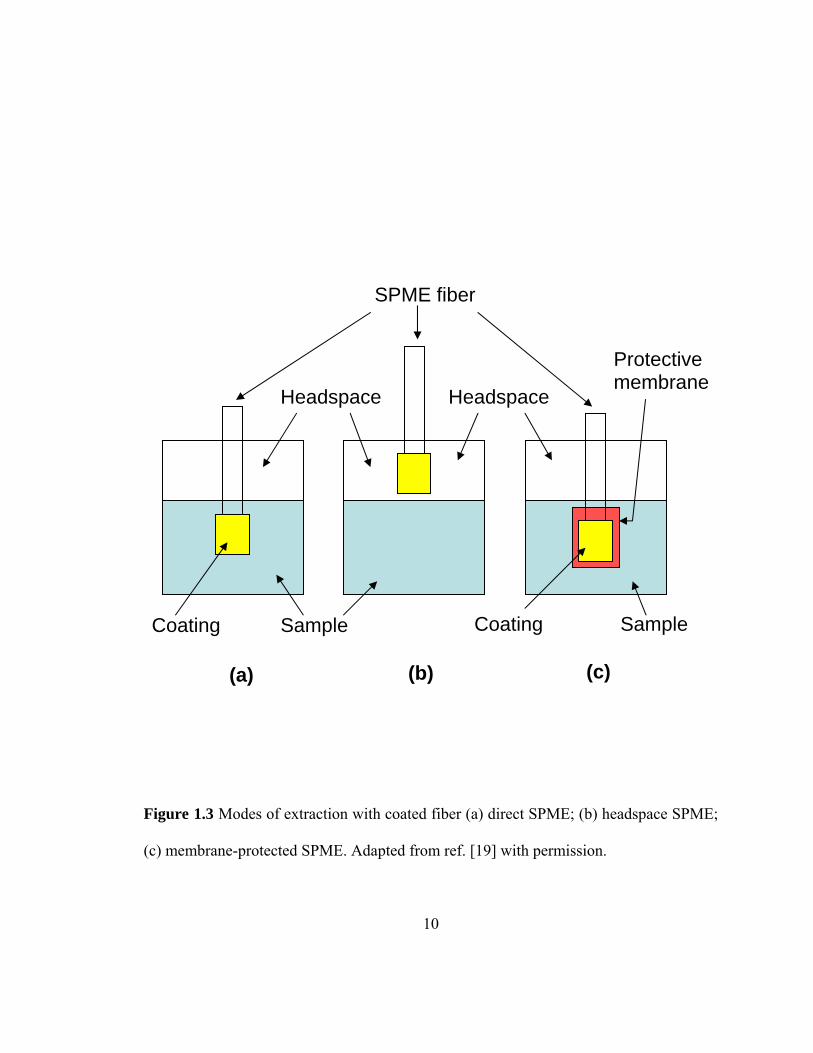
Figure 1.3 Modes of extraction with coated fiber (a) direct SPME; (b) headspace SPME;
(c) membrane-protected SPME. Adapted from ref. [19] with permission.
Coating SampleSample Coating
SPME fiber
Protectivemembrane
Headspace Headspace
(a) (b) (c)
11
combines sampling and sample preparation in a single step eradicating the errors
associated with analyte(s) losses through decomposition or adsorption on the walls of
sampling container.
In headspace SPME (HS-SPME) (Figure 1.3 (b)), the aqueous sample containing
target analyte(s) is placed in a sealed container and with the help of the SPME syringe,
the fiber is introduced into the headspace (gaseous space above the liquid sample) of the
container without immersing the coated fiber into the sample matrix. The main purpose
of this modification is to avoid the damage to the fiber coating from undesirable sample
matrix interferences (e.g., high molecular mass compounds, humic materials, proteins,
etc.). In addition, such an extraction mode allows alterations to the sample matrix (e.g.,
change in pH, addition of salts, etc.) that are frequently used to ameliorate the extraction
efficiency. The equilibrium analyte distributions taking place in HS-SPME are: (1)
between the aqueous phase (sample matrix) and gaseous phase (in the headspace) of the
closed container (Eq. 1.3), and (2) between the gaseous phase and extracting phase (fiber
coating) (Eq. 1.4).
Khs =Ch
Cs(1.3)
and,
Kfh =Cf
Ch(1.4)
Where, Khs: the distribution constant between the headspace and the aqueous phase;
Ch∞: the concentration of the analyte(s) in the gaseous phase (or headspace) at
12
equilibrium;
Cs∞: the concentration of the analyte in the aqueous phase at equilibrium;
Kfh: the analyte distribution constant between the extracting phase and the
headspace;
Cf∞: analyte concentration in the extracting phase at equilibrium.
The mass of an analyte extracted by coating on the fiber is related to overall equilibrium
of the analyte in the three-phase system. Since the total mass of an analyte should remain
constant during the extraction:
Cf Vf +C0Vs = Ch Vh + Cs Vs
(1.5)
where, C0: the initial concentration of the analyte in the sample matrix;
Vf: the volume of the extracting phase on the SPME fiber;
Vh: the volume of the gaseous phase (or headspace);
Vs: the volume of the sample matrix.
The number of moles of the analyte extracted by the extracting phase, nf = Cf∞Vf
∞, can be
expressed as [18]:
nf =Kfh Khs Vf C0 Vs
Kfh Khs Vf + Khs Vh + Vs(1.6)
Also, Kfs = KfhKhs = KfgKgs, since the extracting phase/headspace distribution constant,
13
Kfh, can be approximated by the stationary phase/gas distribution constant, Kfg, and the
headspace/sample distribution constant, Khs, can be approximated by the gas/sample
distribution constant, Kgs. If the moisture effect in the gaseous headspace is neglected,
equation 1.6 can be rewritten as:
nf =Kfs Vf C0 Vs
Kfs Vf + Khs Vh + Vs(1.7)
Equation 1.7 shows that the amount of extracted analyte is independent of the location of
the fiber in the system. It may be placed in the gaseous phase or directly in the aqueous
phase as long as all other parameters, such as the volume of the stationary phase,
headspace, and the sample matrix, remain constant.
In case of protected-membrane extraction (Figure 1.3 (c)), the preliminary goal is
to protect the fiber coating against the damage from unwanted interferences that maybe
present in the sample matrix. This approach is mainly advantageous for selective
extraction of target analyte(s) by choosing the membrane of desired properties. The
slower kinetics of membrane extraction is the major disadvantage since the analyte(s)
must diffuse through the membrane before they can reach the coating. The use of thin
membranes and elevated extraction temperatures may accelerate the extraction process
[20].
14
1.3.2 Modes of extraction with in-tube SPME
There are two different modes of extraction with in-tube SPME: active or
dynamic where sample matrix containing the target analyte(s) is passed through the tube
coated with extracting phase (coating), and passive or static where the sample matrix
containing target analyte(s) is kept in the tube coated with extracting phase (coating)
allowing the analyte(s) to diffuse into the coating.
In dynamic in-tube SPME, a piece of fused silica capillary typically coated with
thin film of the extracting phase or a capillary packed with extracting phase dispersed on
an inert support material (a piece of micro-LC capillary column) is used for extraction of
target analyte(s). The analyte front migrates through the capillary with a speed
proportional to the linear velocity of the sample matrix, and inversely related to the
partition ratio. For the in-tube SPME using short capillaries, the minimum extraction time
at equilibrium can be expressed as [19]:
KesVeVv
(1.8)
1 +te = u
L
where, te: extraction time required to reach concentration equilibrium between analyte(s)
and extracting phase;
L: length of the extraction capillary;
Kes: analyte distribution constant between extracting phase and sample
matrix;
15
Ve: volume of the extracting phase;
Vv: void volume of the tubing containing the extracting phase;
u: chromatographic linear velocity.
In static in-tube SPME, similar to dynamic in-tube SPME, a piece of fused silica
capillary coated with a thin film of the extracting phase or packed with extracting phase
dispersed on an inert support material is used for extraction of target analyte(s). However,
the sample matrix containing target analyte(s) is kept (static) inside the coated or packed
capillary. In this case, the only mechanism of analyte transport (and preconcentration) is
diffusion through sample matrix contained in the capillary. The static in-tube SPME is
particularly suitable for field sampling.
1.4 Coatings used in fiber SPME and in-tube SPME
1.4.1 Coatings used in fiber SPME
Several different methods can be employed to prepare SPME fibers coated with
an extraction phase (coating). In the dipping technique, fiber is placed in a concentrated
organic solvent solution of the (polymeric) extracting phase for a brief period of time.
Subsequently, the fiber is removed from the solution and the solvent is evaporated
creating a coating on the fiber [13]. The same method can be expanded to
electrodeposition of selective coatings on the surface of metallic rods [21]. The
16
preparation of commercial extracting coating is carried out simultaneously during the
drawing of the fused silica rod to maintain the reproducibility of the coating thickness.
Coatings used in fiber SPME can be compiled into two major groups: (a) commercially
available coatings and (b) tailor-made coatings.
1.4.1.1 Commercially available coatings for fiber SPME
Currently a number of coatings with different thicknesses are commercially
available: poly(dimethylsiloxane) (PDMS), polyacrylate (PA), also the composite (mixed
phase) coatings such as Polydimethylsiloxane/Polydivinylbenzene (PDMS/PDVB),
Carboxen/Polydimethylsiloxane (CAR/PDMS), Carbowax/Polydivinylbenzene
(CW/PDVB), Carbowax/Templated Resin (CW/TR), Polydivinylbenzene-Carboxen-
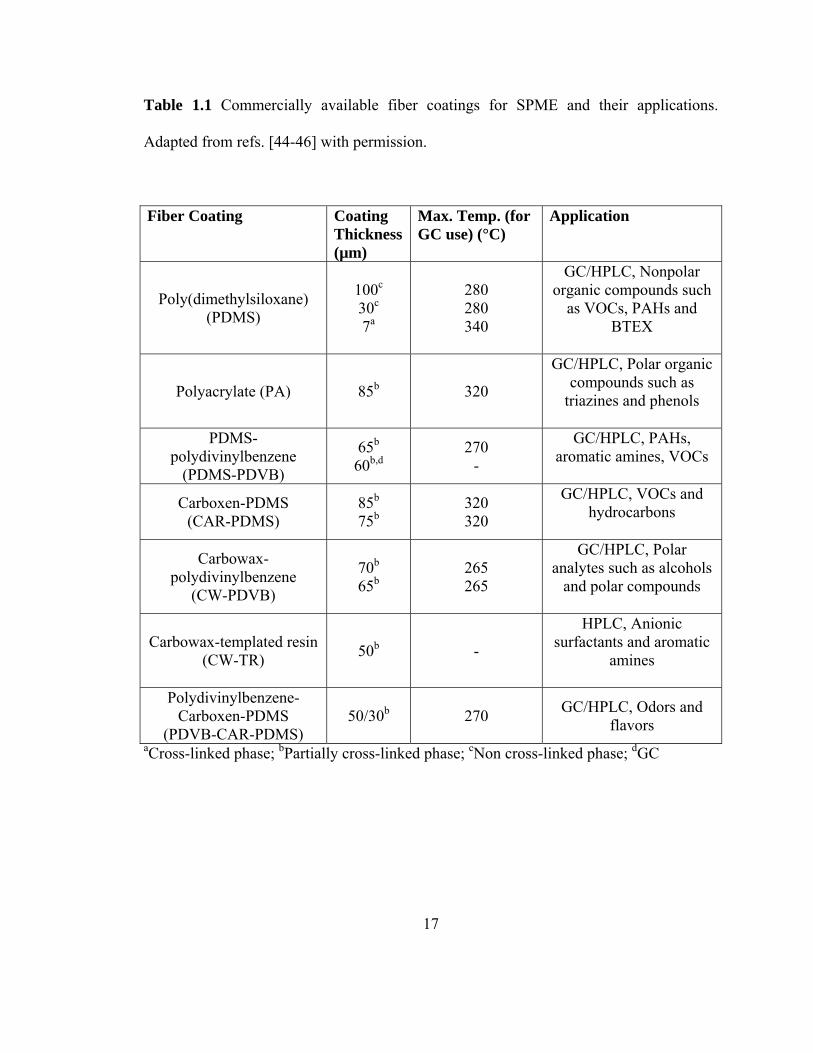
Polydimethylsiloxane (PDVB/CAR/PDMS). Table 1.1 shows the summary of
commercially available polymers used as fiber SPME coatings.
Poly(dimethylsiloxane) (PDMS) and polyacrylate (PA) are the homogeneous
polymeric sorbents used in SPME. PDMS [22] has been the most frequently used sorbent
in SPME because of its inherent versatility, high thermal stability, and extraction
efficiencies for wide range of analytes. Commercially available PDMS coated fibers have
PDMS sorbent immobilized on the fiber using a cross-linkable functionality present in
the polymeric structure. This cross-linking provides PDMS coatings with higher thermal
stability (~ 340 ºC) as well as solvent stability [23]. However, due to the difficulty of
stabilizing thick coatings through cross-linking reaction, the only commercially available
17
Table 1.1 Commercially available fiber coatings for SPME and their applications.
Adapted from refs. [44-46] with permission.
Fiber Coating Coating Thickness (µm)
Max. Temp. (for GC use) (°C)
Application
Poly(dimethylsiloxane) (PDMS)
100c 30c 7a
280 280 340
GC/HPLC, Nonpolar organic compounds such
as VOCs, PAHs and BTEX
Polyacrylate (PA) 85b 320
GC/HPLC, Polar organic compounds such as
triazines and phenols
PDMS-polydivinylbenzene
(PDMS-PDVB)
65b 60b,d
270 -
GC/HPLC, PAHs, aromatic amines, VOCs
Carboxen-PDMS (CAR-PDMS)
85b 75b
320 320
GC/HPLC, VOCs and hydrocarbons
Carbowax-polydivinylbenzene
(CW-PDVB)
70b 65b
265 265
GC/HPLC, Polar analytes such as alcohols
and polar compounds
Carbowax-templated resin (CW-TR) 50b -
HPLC, Anionic surfactants and aromatic
amines
Polydivinylbenzene-Carboxen-PDMS
(PDVB-CAR-PDMS) 50/30b 270 GC/HPLC, Odors and
flavors aCross-linked phase; bPartially cross-linked phase; cNon cross-linked phase; dGC
18
PDMS coated fiber that can withstand solvent rinsing is the one with 7 µm coating
thickness. PDMS is a nonpolar polymer which usually extracts nonpolar analytes such as
volatile organic compounds (VOCs) [24,25], PAHs [26,27], alkanes [28,29] , BTEX
compounds (benzene, toluene, ethylbenzene, and xylene) [22,30], and some pesticides
[31,32] .
Polyacrylate (PA) [33] is a highly polar sorbent immobilized by partial cross-
linking. It is commercially available in 85 µm thickness. Due to its high polarity, PA
coating is frequently used for extraction of polar analytes such as alcohols [34,35],
organic acids [36,37], aromatic amines [38,39], phenols and their derivatives [33,40,41]
and polar pesticides [40,42] from various matrices. Polyacrylate is a rigid, low density
solid polymer at room temperature. Consequently, the extraction times tend to be longer
because of slower analyte diffusion. [41,43].
The composite (mixed phase) coatings were introduced to enhance the selectivity
toward target analytes. They are prepared by embedding porous particles (one or more
types) in the partially cross-linked polymeric phase. However, compared to homogeneous
polymeric coatings (PDMS and PA) composite coatings have lower mechanical stability.
Introduced in 1996, Polydimethylsiloxane/Polydivinylbenzene (PDMS/PDVB) [47], is
suitable for extraction of polar compounds like alcohols, amines, etc. [48].
Carboxen/Polydimethylsiloxane (CAR/PDMS) [49] and Carbowax/Polydivinylbenzene
(CW/PDVB) [50] coated fibers were introduced in 1997. CAR/PDMS coating has a
highly porous polymeric material named Carboxen and used in SPME for the extraction
of VOCs [51] and hydrocarbons [52]. CW/PDVB is a blend of porous PDVB and polar
19
Carbowax polymeric phase. Similar to PDMS/PDVB, CW/PDVB coating is also used for
extraction of polar compounds (e.g., alcohols) [53]. But the swelling tendencies of
Carbowax in water and its oxygen sensitivity at temperatures above 220 °C are the major
drawbacks of CW/PDVB. Like other composite coatings, Carbowax/Templated Resin
(CW/TR), is made by blending porous templated resin with polar Carbowax polymer.
Due to the presence of both hydrophilic (Carbowax) and hydrophobic (Templated Resin)
moieties in this polymeric blend, it provides remarkable selectivity for the extraction of
surfactants from aqueous media [54]. Polydivinylbenzene-Carboxen-
Polydimethylsiloxane (PDVB/CAR/PDMS), a blend of highly porous PDVB and CAR
polymeric material with liquid PDMS, was introduced by SUPELCO in 1999 [55] . This
composite phase is used to extract analytes (C3-C20) from wide range of polarity [56,57].
1.4.1.2 Tailor-made coatings for fiber SPME
In general, tailor-made sorbents coated on SPME fiber can be grouped into
different classes: carbonaceous sorbents, bonded-phase silica sorbents, coated metallic
SPME fibers, and miscellaneous sorbents.
1.4.1.2.1 Carbonaceous sorbents
Carbonaceous sorbents are homogeneous, highly porous, and thermally stable.
Due to these characteristics, they are favorable for SPME. Mangani and co-worker [58]
reported a fused silica fiber coated with graphitized carbon black (GCB) for extraction of
20
VOCs from various matrices. A porous layer of activated charcoal (PLAC) coated SPME
fibers used for the extraction of BTEX and PAHs showed significantly high thermal
stabilities (> 320 °C) [59,60]. SPME coating developed by Farajzadeh and co-worker [61]
by mixing activated charcoal with PVC powder (ratio of 90:10) was very efficient in
extracting low molecular weight alkanes. Later experiments involving a coating made
with activated charcoal and PVC (ratio 70:30) demonstrated successful extraction of
organophosphorous pesticides from an aqueous matrix [62]. Jia and co-workers [63]
reported the use of active carbon fiber (ACF) as SPME sorbent. It showed efficient
removal of sulfur dioxide and nitric oxide in flue gas from coal combustion. Olesik and
Co-workers have used glassy carbon as a SPME sorbent for extraction of taste and odor
contaminants (geosmin, 2-methylisoborneol, and 2,4,6-trichloroanisole commonly found
in water supplies) [64], volatile organic compounds (2-methylheptane, styrene,
propylbenzene, decane, undecane) [65], and halogenated compounds (fluorobenzene,
chlorobenzene, bromobenzene, and iodobenzene) [66] from aqueous samples.
1.4.1.2.2 Bonded-phase silica sorbents
In SPME, it is desirable to employ thick coatings to achieve higher extraction
sensitivity. However, the use of thicker coatings leads to longer extraction times due to
slow diffusion on analytes into the extracting phase. Lee and co-workers [67] used
bonded phase silica particles to achieve shorter extraction tome and high extraction
efficiency in SPME based on thinner coatings. Comparison of a 30 µm coating of bonded
21
phase silica particles (C8-, C18-) and a conventional SPME coating (100 µm PDMS)
showed that the surface area of a coating made with the bonded phase silica particles was
500 times greater than that of conventional SPME coating. Therefore, extraction
sensitivity of bonded phase silica coating was significantly higher compared to a
conventional PDMS coating. For example, C8-bonded phase silica coated fiber extracted
~ 40 ng of toluene from a 0.1 mg/L aqueous sample of toluene whereas PDMS coated
fiber extracted only ~ 5 ng of toluene under same conditions. Among all the bonded
phases investigated (C8-, C18-, phenyl), C18-bonded phase silica coatings showed
highest sensitivity toward PAHs [68]. A mesoporous silica material (C16-MCM-41)
characterized by its large surface area (1028 m2 g -1) was used as an SPME sorbent by
Hou and co-workers [69]. The mesoporous silica coating (100 µm) was immobilized onto
a stainless steel wire by epoxy glue and showed very high extraction efficiency for the
extraction of PAHs.
1.4.1.2.3 Coated metallic SPME fibers
Currently, almost all the conventional SPME fibers are made of fused silica. With
no protective polyimide coating on the coated segment, the fused silica SPME fiber is
very fragile and requires great care during handling of the SPME device. Therefore, some
researchers have explored the use of miniaturized metallic rods as an alternative to fragile
silica-based SPME fibers [70-74]. These metal rod themselves or an oxide layer formed
on the metal surface have served as the SPME sorbent. Guo and co-workers used carbon
22
steel electrode (140 µm) coated with electrochemically deposited 10 µm thick gold
coating for extraction of inorganic mercury ions in aqueous matrix [72]. Djozan and co-
workers [70] evaluated different types of aluminum-based wires: (a) polished aluminum
wire, (b) aluminum wire coated with oxidation product (Al2O3), and (c) anodized
aluminum wire as the extraction sorbents for SPME. In their experiments, anodized
aluminum wire was found to be 30 times more sensitive than oxidized aluminum wire.
The increased sensitivity of the anodized coating was explained by adsorptive nature of
the thick Al2O3 bed formed on the aluminum wire surface during anodizing process and
the inherent porous structure of the coated aluminum oxide bed. Anodized aluminum
wire was used to extract aliphatic alcohols, BTEX, and petroleum products from gaseous
samples. High thermal stability (~300 °C), mechanical strength, low cost, and long life
span are among the important advantages of anodized aluminum wires. Later, the same
researchers developed copper wires coated with a thin layer of microcrystalline copper
chloride (CuCl) [74] and copper sulfide coating [73] as new SPME fibers (with high
selectivity, sensitivity, and durability) for the extraction of low molecular weight
aliphatic amines. Low molecular weight aliphatic amines are important air pollutants and
most of them are toxic, sensitizers and irritants to the skin, mucous membrane, and
respiratory tract [74]. Due to their high polarity, extraction and preconcentration of
aliphatic amines from aqueous media is very difficult and derivatization techniques are
often needed to extract these aliphatic amines. Copper wire coated with microcrystalline
copper chloride (CuCl) developed by Djozan and co-workers showed high selectivity
toward aliphatic amines [74]. The selectivity of CuCl was explained by its reactive nature
23
and ability to form coordinate bond with ligand such as amine group to form amino
complex (Cu(amine)xCl). At high temperatures (during desorption in the GC injection
port), the copper amino complex breaks apart to release free amine. Similarly, copper
sulfide coated copper wire was found to be very efficient and selective in extracting
aliphatic amines and alcohols [73] directly from aqueous samples without any
derivatization process.
1.4.1.2.4 Miscellaneous sorbents
In addition to the aforementioned sorbents, miscellaneous sorbents have been
explored for SPME of various analytes.
Li and co-workers [75] used plasticized poly(vinylchloride) as an SPME sorbent
coated on a primed steel rod. The device was used to extract barbiturates from urine and
bovine serum samples for further analysis by CE. They reported extraction in the 0.1-0.3
mg/L and ~ 1 mg/L concentration range for urine and serum samples, respectively.
For the extraction of polar compounds (alcohols) from liquid matrices, Gorecki
and co-workers [76] used Nafion® perfluorinated resin as a sorbent for fiber SPME.
Amongst the polar compounds tested, Nafion® showed very high affinity toward
methanol – an analytical task that is difficult to accomplish using conventional SPME
coatings.
Xiao and co-workers [77] developed a polysilicone fullerene (PF) coating (33 µm)
as SPME sorbent for extraction of BTEX and PAHs. Due to its high thermal stability (~
24
360 °C), and good selectivity towards aromatic compounds, fullerene has long been
known as a chromatographic material [78-82]. They compared the efficiency of two
coatings, one made of pure PF and the other made of a mixture of PDMS and PF (4:1
ratio). Coating obtained from pure PF showed better sensitivity toward the test analytes
than the mixed one.
Harvey and co-workers [83] developed a novel SPME coating consisting of
hydrogen bond acidic hexafluorobisphenol groups alternating with oligo
(dimethylsiloxane) segments to detect trace levels of chemical warfare agents. The new
coating demonstrated remarkable affinity (22-fold higher affinity than commercial PDMS
coated fiber) towards sarin, a nurve gas.
Another important contribution was the introduction of polypyrrole (PPY) and its
derivative poly-N-phenylpyrrole (PPPY) SPME-coatings by Pawliszyn and co-workers
[84]. These sorbents have drawn much attention due to their ability to form stable
polymeric films by electrochemical and chemical means on metal and fused silica
substrate, respectively. Wu and co-workers [85] have given a detail account on the
preparation of PPY and PPPY coatings on metal fibers (e.g., Pt, Au, stainless steel) as
well as on the fused silica surface. They also demonstrated a wide range of applications
of the PPY coating which included PAHs, aromatic amines, organoarsenic compounds.
Due to the inherent multifunctional properties of PPY coatings, they can be used for
extracting a wide array of analytes including β-blockers in urine and serum samples [86],
catechin and caffeine in tea [87], aromatic compounds in aqueous samples [88],
stimulants in human urine and hair samples [89], polar pesticides in water and wine
25
samples [90], verapamil drug and its metabolites [91], and N- nitrosamines in cell
cultures [92]. Also, Lord and co-workers [93] have used polypyrrole coated SPME probe
for in vivo pharmacokinetic studies in living animals.
Polyanilines (PANI) are a class of conductive polymers that generally possess
extended conjugated π-electron system along a polymer backbone [94,95]. These are
versatile materials in which analyte recognition can be achieved in different ways [96],
including: (1) incorporation of counter ions that introduce selective interactions; (2) via
inherent multifunctionality (hydrophobic, acid–base and π–π interactions, polar
functional groups, ion-exchange, hydrogen bonding, etc.) of the polymers; (3)
introduction of functional groups to the monomers. Djoznan and co-worker [97] used
PANI coated gold wire for SPME of phenol and 4-chlorophenol from petrochemical
sewage sample. Later, the same researchers also reported extraction of aliphatic alcohols
from aqueous samples [98]. Some researchers have presented PANI film electrodeposited
on the Pt wire for SPME of phenol derivatives [99,100] and PAHs [101] from aqueous
media. There are also reports of PANI film electrodeposited on the stainless steel wire for
SPME of chloro- and nitro benzenes [102], phthalates [103], aromatic amines [104], and
phenols [105]
Although SPME has been introduced primarily for the extraction and
preconcentration of organic compounds, it can be easily applied to the broad field of
metal analysis by simply modifying the sorbent. Otu and Pawliszyn [106] reported use of
PDMS coating modified with di-(2-ethylhexyl)phosphoric acid (DEHP) (a liquid ion-
exchanger) for microextraction of bismuth (III) ion from an aqueous sample. Jia and co-
26
workers [107] used dibenzo-18-crown-6 (DBC) doped membrane as SPME coating for
extracting mercury (II) ions. A detection limit of 500 ng/L was reported in SPME-HPCL-
UV experiments.
1.4.2 Coatings used in in-tube SPME
In the classical fiber format of SPME, the fiber with sorbent coating on its end
segment is installed in a specially designed SPME syringe. This design of the syringe
offers good protection to the fiber as well as the sorbent coating on its external surface.
However, fiber breakage, mechanical damage of the coating due to scraping and needle
bending are the drawbacks frequently encountered by analytical chemists. Since, in fiber
SPME, the length of the coated segment of the fiber is short (~ 1-2 cm), it provides low
sorbent loading available for extraction. As a consequence, low sample capacity of the
fiber imposes limitation on the extraction sensitivity of SPME. Thicker coatings may
increase the sample capacity to some extent but long extraction time may become a major
drawback in the whole extraction process. Another major shortcoming of the fiber SPME
is the difficulty to interface it with liquid-phase separation techniques (e.g., HPLC, CEC,
etc). To overcome these format related shortcomings, in-tube SPME (or CME) was
introduced [108]. In hyphenation with liquid-phase separation technique, in-tube SPME
can be easily automated which not only cuts down the total analysis time but also
provides better accuracy and precision compared to manual operation. Coatings used in
in-tube SPME can be compiled into two major groups: (a) commercial GC stationary
27
phases used as in-tube SPME coatings and (b) tailor-made coatings for in-tube SPME.
1.4.2.1 Commercial GC stationary phases as in-tube SPME coatings
Gas chromatographic stationary phases are suitable for use as in-tube SPME
sorbents. Short pieces of coated GC capillary columns (in most cases, a 60-cm segment)
are commonly used for in-tube SPME [109]. The stationary phase coating on the inner
surface of the capillary serves as the extracting phase. Table 1.2 lists frequently used
extracting phases in in-tube SPME. Most of the sorbents used in in-tube SPME are
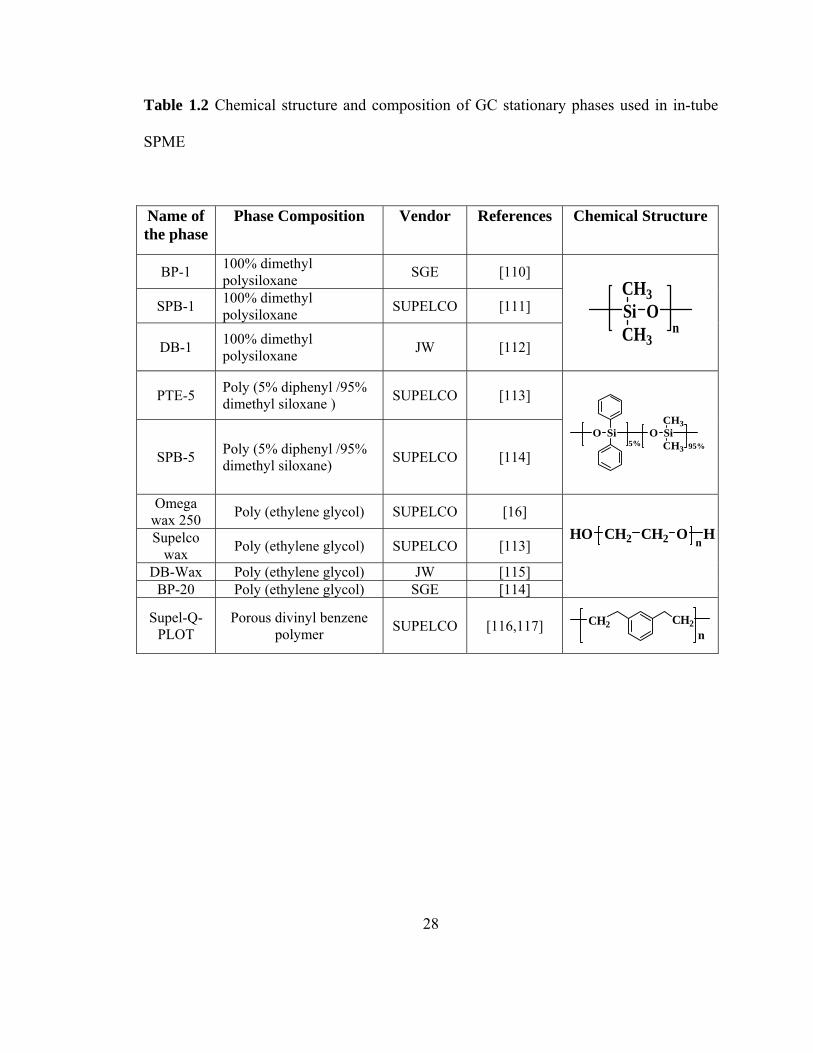
commercially available GC stationary phases (e.g., DB-1, BP-1, SPB-1, SPB-5, PTE-5,
Supelcowax, DB-5, Omegawax 250, DB-Wax, BP-20 Wax, Supel-Q-PLOT etc.).
Pawliszyn and co-workers first reported the use of in-tube SPME mode of
microextraction in 1997 [16]. In their experiments, 60-cm individual pieces of GC
capillary columns with various stationary phases (Omegawax 250, SPB-1, SPB-5), and
an uncoated fused silica capillary were used for extraction and each one of them was
coupled to a commercial HPLC autosampler. Six phenylurea analytes were extracted
using each of the above mentioned capillaries. The Omegawax 250, being the most polar
phase, extracted the most and the uncoated fused silica capillary extracted the least of
these polar analytes. SPB-1 and SPB-5 coatings (nonpolar) also demonstrated poor
extraction yield as was expected. Omegawax 250 GC capillary columns use
poly(ethylene glycol) as the stationary phase. It is the most frequently used sorbent in in-
tube SPME for extracting polar analytes. Thus far, Omegawax 250 has been used for
28
Table 1.2 Chemical structure and composition of GC stationary phases used in in-tube
SPME
Name of the phase
Phase Composition Vendor References Chemical Structure
BP-1 100% dimethyl polysiloxane SGE [110]
SPB-1 100% dimethyl polysiloxane SUPELCO [111]
DB-1 100% dimethyl polysiloxane JW [112]
SiCH3
CH3
On
PTE-5 Poly (5% diphenyl /95% dimethyl siloxane ) SUPELCO [113]
SPB-5 Poly (5% diphenyl /95% dimethyl siloxane) SUPELCO [114]
O Si O SiCH3
CH35% 95%
Omega wax 250 Poly (ethylene glycol) SUPELCO [16]
Supelco wax Poly (ethylene glycol) SUPELCO [113]
DB-Wax Poly (ethylene glycol) JW [115] BP-20 Poly (ethylene glycol) SGE [114]
HO CH2 CH2 O Hn
Supel-Q-PLOT
Porous divinyl benzene polymer SUPELCO [116,117] CH2 CH2
n
29
extracting phenylureas [16], β- blockers and its metabolites in urine and serum samples
[118], carbamate pesticides [113,114,119], mutagenic heterocyclic amines [111],
ranitidine [108], and in drug analysis [120]. Although in both Supelcowax and
Omegawax 250 coated capillaries, poly(ethylene glycol) was the common stationary
phase, Omegawax 250 demonstrated higher yield in extracting carbamate from aqueous
solution compared to the other [114]. In almost all of the above mentioned in-tube SPME
publications SPB-1 (100% dimethyl polysiloxane), SPB-5 (poly 5% diphenyl/95%
dimethyl polysiloxane), and uncoated fused silica capillary were used to study the
importance of sorbent polarity in the extraction of polar analytes. Takino and co-workers
used DB-Wax (J&W Scientific, Folsom, CA, USA) for the determination of chlorinated
phenoxy acid herbicides in environmental water [115] and successfully coupled SPME-
LC with EI/MS providing enhanced selectivity and identification capability of the
method.
Tan and co-workers [110] have successfully coupled in-tube SPME to GC-FID.
One-meter segments of BP-1 (100% methylsiloxane) and BP-20 (polyethylene glycol)
GC columns were used for the extraction of BTEX and phenols, respectively from
aqueous media. Extraction was carried out by pushing the aqueous medium containing
the analytes through the capillary using nitrogen pressure. Desorption of the extracted
analytes was done by using a small plug of organic solvent which carried the analytes
from the capillary to the GC injection port. Nardi [121,122] used capillaries (0.474 mm
i.d., ~ 0.9 mm o.d.) statically coated with cross-linked PDMS gum PS255 (a Petrarch
Systems polydimethylsiloxane with ~ 1% vinyl groups) for in-tube SPME of BETX from
30
aqueous samples. The extracted analytes were desorbed by connecting the extraction
capillary (“capillary extractor”) as a precolumn through the polytetrafluoroethylene
(PTFE) unions. To avoid carryover, analytes were desorbed from extractor into GC for 3
min, under helium flow at room temperature. During this time analytes were focused
quantitatively at the entrance of a laboratory-made-cryofocusing device [123,124] that
utilized a 0.32 mm i.d. transfer-line dipped into liquid nitrogen. Fast heating of the
focusing transfer-line up to 200 °C realized the BTEX injection.
Although SPME has been developed to eliminate the use of toxic organic solvents
in sample preconcentration step, a small amount of solvent was still used in the
desorption process, particularly when coupled to LC. To reduce the amount of toxic
organic solvent used in analyte(s) desorption step after the extraction, Saito and co-
workers [112] proposed a wire-in-tube configuration of SPME in which a 20-cm piece of
DB-1 (100% polydimethylsiloxane) coated capillary was used as the extractor. A
stainless steel wire (diameter = 200 µm) was inserted into the capillary (diameter B= 250
µm) that significantly reduced the available internal volume of the capillary (9.82 µL vs.
3.53 µL) and thereby reduced the volume of solvent required for desorption. The wire-in-
tube SPME was successfully used to analyze antidepressant drugs in a urine sample.
Another GC capillary column frequently used in in-tube SPME is Supel-Q-Plot. A
porous divinylbenzene polymer is used as the stationary phase in this column. Mester and
co-workers [116] successfully coupled SPME to electrospray ionization mass
spectrometry. A 60-cm piece of Supel-Q-PLOT column was used to preconcentrate and
analyze trimethyl- and triethyllead species from aqueous media. This system seems to be
31
very promising in lead speciation. The same phase has also been used for the analysis of
endocrine disruptors in liquid medicines and intravenous solutions [125], daidzein and
genistein in soybean foods [117], bisphenol A, alkylphenols, and phthalate esters in foods
contacted with plastics [126].
1.4.2.2 Tailor-made coatings for in-tube SPME
Several tailor-made sorbents have found successful use in both fiber- and in-tube
SPME. Some of sorbents used for in-tube SPME include restricted access materials
(RAMs), molecularly imprinted polymers (MIPs), monolithic sorbents, and
miscellaneous sorbents.
1.4.2.2.1 Restricted access materials
Restricted access materials (RAMs) are special class of materials that prevent
access of interferences (macromolecules) to the specific sorbent region where extraction
and enrichment of low molecular weight analyte(s) take place [127]. Initially, these
sorbents were developed for the isolation of low-molecular-mass drugs from biological
fluids with minimum sample pretreatment and now they also find use in the isolation of
herbicides from surface waters containing high levels of humic substances [128].
Mullett and co-worker [129] reported use of a capillary packed with alkyl-diol-
silica (ADS) restricted access material for the automated in-tube SPME of several
benzodiazepines from human serum. The sorbent alkyl-diol-silica (ADS) possesses two
32
different chemical layers (diol groups on the outer layer, and alkyl groups on the inner
layer) and a pore size that prevents larger molecules (e.g., proteins) from entering into the
inner layer. Hydrophilic diol groups on the outer layer of the spherical ADS particles act
like a filter to trap (and restrict) bulky molecules (e.g., proteins), whereas hydrophobic
alkyl groups on the inner layer extract relatively smaller target analytes that easily
penetrates the outer layer. In-tube SPME-HPLC-UV experiments using ADS particles
yielded detection limits of 22-29 ng/mL for various benzodiazepines. The same
researchers have also reported use of alkyl-diol- silica (ADS) restricted access material as
the fiber SPME Coating for determination of benzodiazepines from human urine samples
[130] and monitoring of drugs and metabolites in whole blood [131].
1.4.2.2.2 Molecularly imprinted polymers
Molecularly imprinted polymers (MIPs) are cross-linked macromolecules with
cavity-based specific binding sites for a target analyte [132]. In order to obtain a highly
selective recognition of a target molecule, a template molecule (same or similar to target
molecule) is incorporated in the mixture of reacting monomers during synthesis of MIP
material. After completion of MIP synthesis, the template molecule is extracted out
leaving a three dimensional imprint of itself in the form of a cavity in the polymer. Figure
1.4 illustrates different steps involved in molecular imprinting process [132].
Mullett and co-workers [133] reported the application of a molecularly imprinted
polymer in in-tube SPME for selective extraction of propranolol from biological fluids.
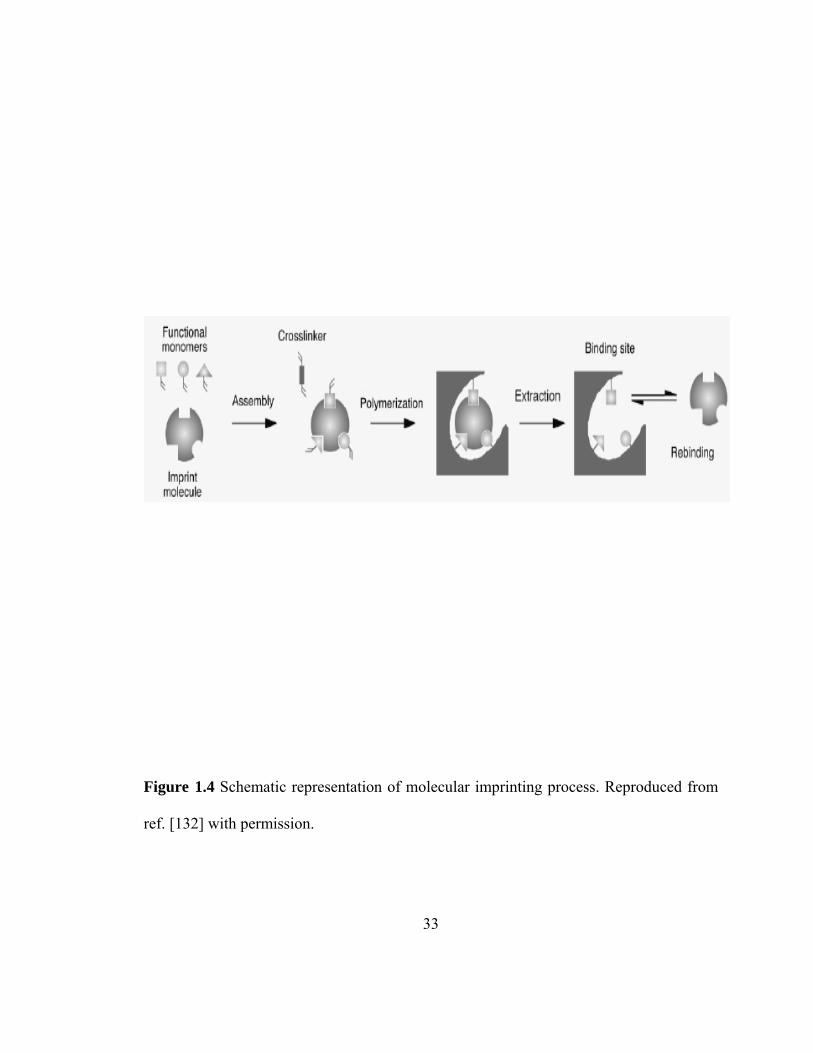
33
Figure 1.4 Schematic representation of molecular imprinting process. Reproduced from
ref. [132] with permission.
34
The propranolol-imprinted polymer particles were packed in a PEEK tubing (80-mm in
length and 0.76-mm i.d.) and both the ends were capped with a zero volume union fitted
with 2-µm frit. A detection limit of 0.32 µg/mL was achieved for the extraction of
propranolol from serum sample in in-tube SPME-HPLC-UV experiments using MIP-
based sorbent. Later, same researchers [134,135] also reported online preparation of
sample containing verapamil and its metabolites by an MIP material coupled on-line to a
RAM precolumn. A detection limit of 5 ng/mL was obtained in LC-MS analysis. Koster
and co-workers [136] have presented silica-based SPME fibers coated with MIPs. In their
work, clenbuterol-imprinted fibers were prepared and used in the selective extraction of
brombuterol from human urine. The preparation of imprinted fibers was performed by
silanization of silica fibers which were subsequently immersed in the polymerization
solution composed of clenbuterol, methacrylic acid, ethylene glycol dimethacrylate, and
azo(bis)isobutyronitrile dissolved in acetonitrile. Then, polymerization was performed for
12 h at 4 °C under irradiation with UV light at 350 nm. According to the authors, fibers
with a polymeric film thickness of ~ 75 µm were obtained in a reproducible manner.
Recently, some researchers have also reported new molecularly imprinted SPME fibers
for determination of triazines from environmental and food samples [137,138].
1.4.2.2.3 Monolithic sorbents
Commonly used open tubular extraction capillary cannot provide sufficient
extraction efficiency since the ratio of its extraction coating volume to that of the
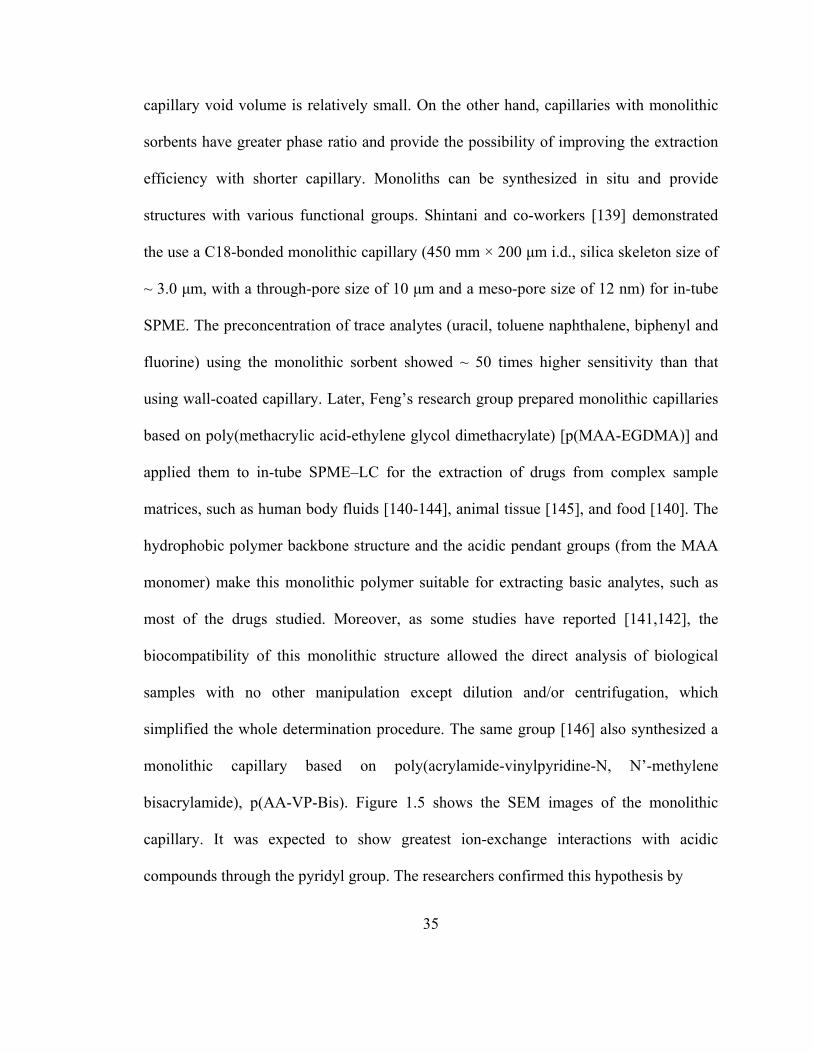
35
capillary void volume is relatively small. On the other hand, capillaries with monolithic
sorbents have greater phase ratio and provide the possibility of improving the extraction
efficiency with shorter capillary. Monoliths can be synthesized in situ and provide
structures with various functional groups. Shintani and co-workers [139] demonstrated
the use a C18-bonded monolithic capillary (450 mm × 200 µm i.d., silica skeleton size of
~ 3.0 µm, with a through-pore size of 10 µm and a meso-pore size of 12 nm) for in-tube
SPME. The preconcentration of trace analytes (uracil, toluene naphthalene, biphenyl and
fluorine) using the monolithic sorbent showed ~ 50 times higher sensitivity than that
using wall-coated capillary. Later, Feng’s research group prepared monolithic capillaries
based on poly(methacrylic acid-ethylene glycol dimethacrylate) [p(MAA-EGDMA)] and
applied them to in-tube SPME–LC for the extraction of drugs from complex sample
matrices, such as human body fluids [140-144], animal tissue [145], and food [140]. The
hydrophobic polymer backbone structure and the acidic pendant groups (from the MAA
monomer) make this monolithic polymer suitable for extracting basic analytes, such as
most of the drugs studied. Moreover, as some studies have reported [141,142], the
biocompatibility of this monolithic structure allowed the direct analysis of biological
samples with no other manipulation except dilution and/or centrifugation, which
simplified the whole determination procedure. The same group [146] also synthesized a
monolithic capillary based on poly(acrylamide-vinylpyridine-N, N’-methylene
bisacrylamide), p(AA-VP-Bis). Figure 1.5 shows the SEM images of the monolithic
capillary. It was expected to show greatest ion-exchange interactions with acidic
compounds through the pyridyl group. The researchers confirmed this hypothesis by
36
Figure 1.5 Scanning electron microscopic images of poly(AA-VP-Bis) monolithic
capillary; (a) Wide-view and (b) close-up-view. Reproduced from ref. [146] with
permission.
37
using in-tube SPME–LC–UV to extract a group of analytes, including acidic drugs, and
phenols. The extraction yield for 2,4-dinitrophenol (the most acidic phenolic compound
analyzed) was 87%, while for phenol (the least acidic and least hydrophobic compound)
it was 6%.
1.4.2.2.4 Miscellaneous sorbents
In addition to the above mentioned sorbents, miscellaneous sorbents have been
explored for in-tube SPME for extraction of various analytes.
McComb and co-workers [147] introduced a novel method for the SPME of
VOCs (e.g. BTEX) followed by GC analysis. Inside needle capillary absorption trap
(INCAT) is a technique that uses a hollow needle with either a short length of GC
capillary column placed inside it, or an internal coating of carbon, as the sample
preconcentration phase. Sampling may be performed on ambient air, on solution, or on
the sample solution headspace, by passing the gas or liquid through the device actively
with a syringe, or passively via diffusion. In their work, one of the INCAT device had a
2.5 cm long GC capillary column (DB-5 TM) inserted in a 7.5 cm steel needle and other
device was made by depositing carbon on inner surface of steel needle which served as
extraction phase for the preconcentration of VOCs. Their results suggested INCAT
device may be used as a rapid and sensitive method for the analysis of VOCs in both air
and water samples.
Saito and co-workers [148] developed a novel “fiber-in-tube” SPME method. To
38
prepare the extraction tube, a heterocyclic polymer, Zylon® fiber was cut to 10 cm length
and packed longitudinally into the same length of PEEK tube (0.25 mm i.d.). The
diameter of each filaments of the fiber was about 11.5 µm and the total number of the
filaments packed in the PEEK tubing was about 280. The analysis of n-butyl phthalate of
an actual wastewater was carried out with the newly developed fiber-in-tube SPME-LC
system. The analytical determination of trace level phthalates in aqueous sample matrix
has been regarded as one of the most important problems [149-152]. With fiber-in-tube
SPME preconcentration method the original concentration of phthalate in the wastewater
was determined to be 0.40 ng/mL. The preconcentration factor of n-butyl phthalate was
calculated as the ratio of the peak area obtained with fiber-in-tube SPME
preconcentration and that without preconcentration. The estimated preconcentration
factor for n-butyl phthalate was about 160 with RSD less than 1% for repeated runs. Later
same researchers developed an on-line fiber-in-tube SPME-CE system using Zylon®
fiber for the separation of four trycylic antidepressants (amitriptyline, imipramine,
nortriptyline and desipramine) [153].
1.5 Parameters affecting extraction efficiency
Although, in SPME, the physical and chemical properties of the extracting phase
(coating) mainly govern the extraction efficiency, several other experimental parameters
can also be manipulated to enhance the extraction efficiency. These experimental
parameters include pH, stirring, heating, and addition of the salt to the sample matrix.
39
1.5.1 Adjustment of sample matrix pH
Most of the coatings used in SPME are electrically neutral. Hence, these coatings
are appropriate for (direct or headspace) extraction of analytes which remain neutral in
the aqueous matrices. However, compounds such as organic acids and bases partially
dissociate into ionic species in aqueous samples. In order to extract such compounds from
aqueous media using SPME coatings, pH adjustment of sample matrix is necessary to
convert the ionic species into neutral molecules. Optimum pH of the matrix depends on
the pKa or pKb values of organic acids and bases, respectively. In order to make sure that
99% of an organic acid is in neutral form, the pH of the matrix should be at least two
units lower than pKa value of the acid [18]. Similarly, in case of a basic analyte, pH of the
matrix should be at least two units larger than pKb value of the base [18].
1.5.2 Agitation of the sample matrix
Usually, agitation of the sample matrix is employed to reduce the extraction
equilibrium time. In the direct extraction mode, the coated fiber is immersed into the
sample matrix and the analytes are transported directly from the sample matrix to the
extracting phase. Agitation of the sample matrix helps to accelerate analyte transport
from the bulk of the liquid sample to the vicinity of the SPME fiber coating. Fast sample
flow through the capillary (in-tube SPME), rapid fiber or vial movement, stirring or
sonication are also common methods used to decrease the extraction equilibrium time.
Agitation minimizes the effect caused by so called “depletion zone” [18] formed close to
40
the fiber as a result of fluid shielding and slow diffusion coefficients of analytes in liquid
matrices. In the headspace extraction mode, agitation of the aqueous sample generates a
continuously fresh surface and accelerates the mass transfer of less volatile analytes from
the water to headspace. Once in the gaseous phase, analytes moves rapidly from the
headspace to the extracting phase due to their large diffusion coefficients in the gas phase.
1.5.3 Heating of sample matrix
In SPME, temperature has a significant impact on overall extraction efficiency.
Although, the diffusion of the analyte increases with the increase in temperature leading
to faster mass transfer from the liquid phase to the headspace and from the headspace to
the coating, the coating/sample distribution constant decreases with increase in
temperature. Hence, the amount of analyte extracted at equilibrium would be lower at
higher temperature. Simultaneous cooling of the coating can prevent the loss of
extraction sensitivity. This idea was implemented by Zhang and co-workers [32] in the
design of an internally cooled SMPE device which allows simultaneous cooling of the
sorbent while the sample matrix is heated [Figure 1.6]. In this device, two concentric
fused silica capillaries are used and the sorbent is coated on the outer surface of the larger
diameter capillary. Liquid carbon dioxide is delivered via the inner capillary to the coated
end of the outer capillary, resulting in a coating temperature significantly lower than that
of the sample matrix. This “cold finger” effect results in accumulation of the volatilized
analytes at the tip of the fiber.
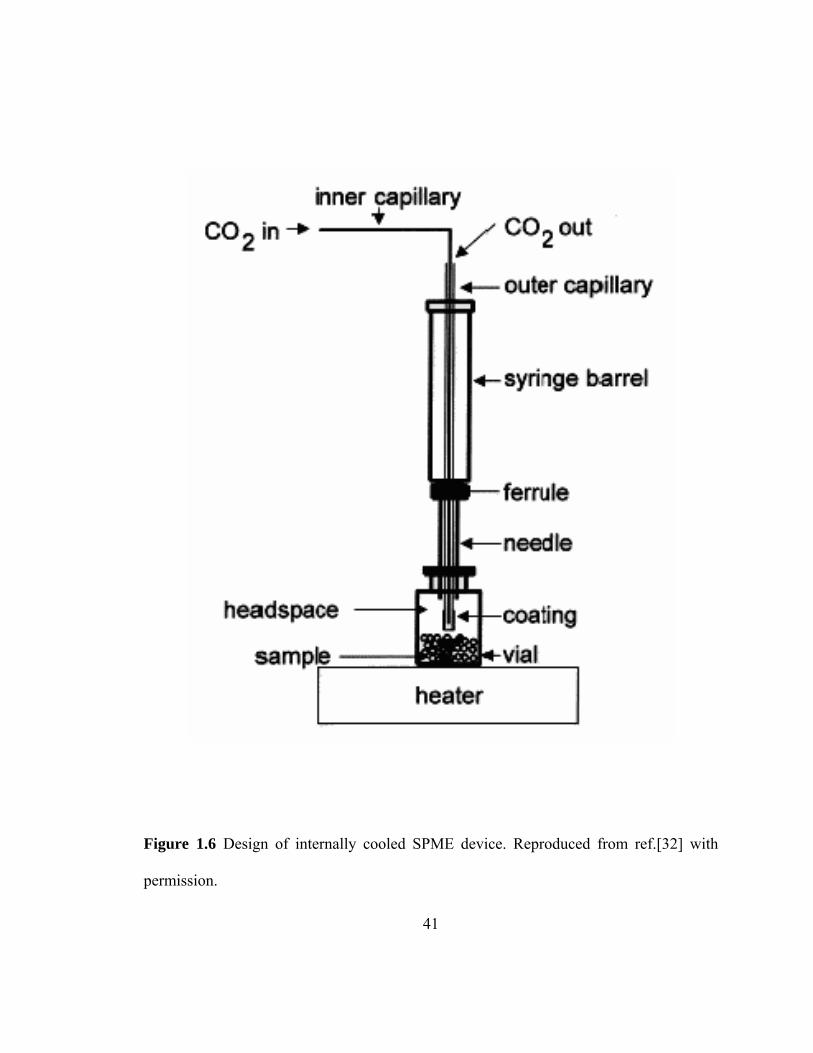
41
Figure 1.6 Design of internally cooled SPME device. Reproduced from ref.[32] with
permission.
42
1.5.4 Addition of the salt to the sample matrix
Addition of salt into the aqueous sample matrix containing organic analytes (also
called salting out) can significantly affect the extraction efficiency. Salting out is a well
known phenomenon used to enhance extraction of organics from aqueous samples.
Although, in SPME, sodium chloride (NaCl) salt is predominantly used, other salts (e.g.,
CaCl2, NH4Cl, (NH4)2SO4, MgSO4, Na2CO3, K2CO3) may also be utilized [154].
1.6 Derivatization
In organic analysis, the main challenge involves the extractions of polar
compounds. The hydrophilic nature of polar compounds makes their extraction from
environmental and biological matrices extremely difficult. In such cases, various
derivatization techniques are frequently used. Different derivatization approaches that can
be implemented in combination with SPME are summarized in Figure 1.7 [155]. In direct
derivatization, the derivatizing agent is first added to the sample vial to convert the
analyte(s) into a derivative followed by the extraction on the SPME fiber.
In case of polar coatings, where the sorbent affinity toward target analytes is
sufficient for extracting underivatized polar analyte from aqueous phase, derivatization of
the analytes may still be necessary to aid the separation and better chromatographic
response. This can be achieved by employing in-coating derivatization following
extraction. The most interesting and potentially very useful approach is simultaneous
derivatization and extraction, performed directly on the coating [36]. This approach
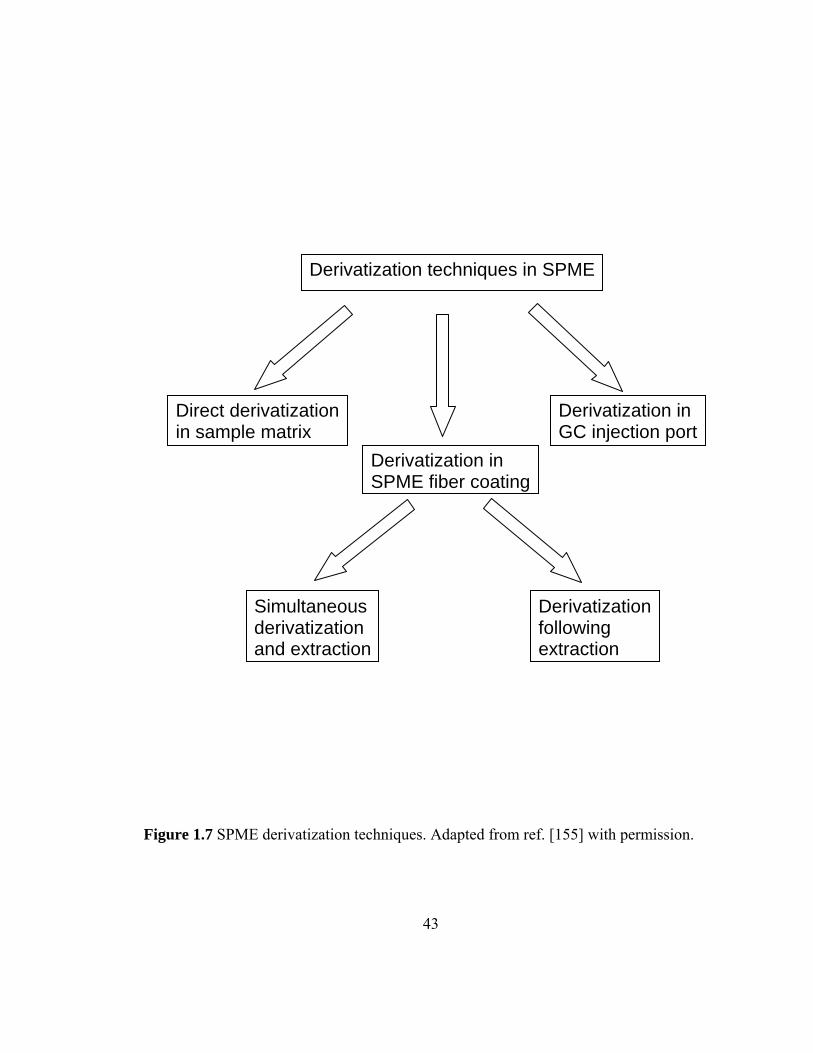
43
Figure 1.7 SPME derivatization techniques. Adapted from ref. [155] with permission.
Derivatization techniques in SPME
Direct derivatization in sample matrix
Derivatization in GC injection port
Derivatization in SPME fiber coating
Simultaneous derivatization and extraction
Derivatization following extraction

44
allows high efficiency and can be effectively used in remote field applications. In this
case, the fiber is doped with a derivatizing reagent and subsequently is exposed to the
sample. The analytes are extracted and simultaneously converted to compounds having
high affinity for the coating.
45
1.7 References to Chapter 1
[1] G. Vas, K. Vekey, J. Mass Spectrom. 39 (2004) 233.
[2] R.M. Smith, J. Chromatogr. A 1000 (2003) 3.
[3] J. Pawliszyn, Anal. Chem. 75 (2003) 2543.
[4] F. Soxhlet, Dinger’s Polyt. J. 232 (1879) 461.
[5] R.E. Majors, LC-GC Int. 10 (1997) 93.
[6] B.E. Richter, B.A. Jones, J.L. Ezzel, N.L. Porter, N. Abdalovic, C. Pohl, Anal. Chem. 68 (1996) 1033.
[7] A. Zlotorzynski, Crit. Rev. Anal. Chem. 25 (1995) 43.
[8] K. Coulibaly, I.J. Jeon, Food Rev. Int. 12 (1996) 131.
[9] S.B. Howthorne, Anal. Chem. 62 (1990) 633A.
[10] M.M. Minnich, J.H. Zimmerman, B.A. Schumacher, J. AOAC Int. 79 (1996) 1198.
[11] J.S. Fritz, Analytical Solid-Phase Extraction, Wiley–VCH, New York, 1999.
[12] C.F. Poole, A.D. Gunatillekam, R. Sethuraman, J. Chromatogr. A 885 (2000) 17.
[13] R.P. Belardi, J. Pawliszyn, Water Pollut. Res. J. Can. 24 (1989) 179.
[14] J. Pawliszyn, S. Liu, Anal. Chem. 59 (1987) 1475.
[15] C.L. Arthur, J. Pawliszyn, Anal. Chem. 62 (1990) 2145.
[16] R. Eisert, J. Pawliszyn, Anal. Chem. 69 (1997) 3140.
[17] S. Bigham, J. Medlar, A. Kabir, C. Shende, A. Alli, A. Malik, Anal. Chem. 74 (2002) 752.
[18] J. Pawliszyn, Solid Phase Microextraction: Theory and Practice, Wiley-VCH,
New York, 1997.
46
[19] J. Pawliszyn, Sampling and Sample Preparation for Field and Laboratory, Elsevier, New York, 2002.
[20] Z. Zhang, J. Poerschmann, J. Pawliszyn, Anal. Commun. 33 (1996) 219.
[21] Z. Zhang, M.J. Yang, J. Pawliszyn, Anal. Chem. 66 (1994) 844A.
[22] C.L. Arthur, L.M. Killam, K.D. Buchholz, J. Pawliszyn, J.R. Berg, Anal. Chem. 64 (1992) 1960.
[23] G. Vas, K. Vekey, J. Mass Spectrom. 39 (2004) 233.
[24] F.J. Santos, M.T. Galceran, D. Fraisse, J. Chromatogr. A 742 (1996) 181.
[25] M. Chai, J. Pawliszyn, Environ. Sci. Technol. 29 (1995) 693.
[26] R.-a. Doong, S.-m. Chang, Y.-c. Sun, J. Chromatogr. A 879 (2000) 177.
[27] B. Shurmer, J. Pawliszyn, Anal. Chem. 72 (2000) 3660.
[28] A. Saraullo, P.A. Martos, J. Pawliszyn, Anal. Chem. 69 (1997) 1992.
[29] B. Schafer, P. Hennig, W. Engewald, J. High Resolut. Chromatogr. 20 (1997) 217.
[30] I. Valor, C. Cortada, J.C. Molto, J. High Resolut. Chromatogr. 472 (1996) 472.
[31] J. Dugay, C. Miege, M.C. Hennion, J. Chromatogr. A 795 (1998) 27.
[32] Z. Zhang, J. Pawliszyn, Anal. Chem. 67 (1995) 34.
[33] K.D. Buchholz, J. Pawliszyn, Environ. Sci. Technol. 27 (1993) 2844.
[34] E. Matisova, J. Sedlakova, M. Slezackova, T. Welsch, J. High Resolut. Chromatogr. 22 (1999) 109.
[35] H.H. Jelen, K. Wlazly, E. Wasowicz, E. Kaminski, J. Agric. Food Chem. 46
(1998) 1469. [36] L. Pan, M. Adams, J. Pawliszyn, Anal. Chem. 67 (1995) 4396.
[37] C. Wijesundera, L. Drury, T. Walsh, Aust. J. Dairy Technol. 53 (1998) 140.
[38] H. Van Doom, C.B. Grabanski, D.J. Miller, S.B. Hawthorne, J. Chromatogr. A 829 (1998) 223.
47
[39] Y.-C. Wu, S.-D. Huang, Anal. Chem. 71 (1999) 310.
[40] M.R. Lee, Y.C. Yeh, W.S. Hsiang, B.H. Hwang, J. Chromatogr. A 806 (1998) 317.
[41] P. Bartak, L. Cap, J. Chromatogr. A 767 (1997) 171.
[42] K. Jinno, T. Muramatsu, Y. Saito, Y. Kiso, S. Magdic, J. Pawliszyn, J. Chromatogr. A 754 (1996) 137.
[43] C.G. Zambonim, F. Palmisano, Analyst 123 (1998) 2825.
[44] A. Penalver, E. Pocurull, F. Borrull, R.M. Marce, TrAC, Trends Anal. Chem. 18 (1999) 557.
[45] M.D.F. Alpendurada, J. Chromatogr. A 889 (2000) 3.
[46] S. Mitra, Sample Preparation Techniques in Analytical Chemistry, Wiley-Interscience, Hoboken, NJ, 2003.
[47] V. Mani, Applications of Solid Phase Microextraction, Royal Society of
Chemistry, Cambridge, UK, 1999. [48] S.A.S. Wercinski, Solid Phase Microextraction, Mercel Dekker Inc., New York,
1999. [49] R.E. Shirey, V. Mani, in Pittcon 1997, Atlanta, GA, 1997.
[50] B.J. Hall, J.S. Brodbelt, J. Chromatogr. A 777 (1997) 275.
[51] S. Tumbiolo, J.-F. Gal, P.-C. Maria, O. Zerbinati, Anal. Bioanal. Chem. 380 (2004) 824.
[52] J.A. Lloyd, P.L. Edmiston, J. Forensic Sci. 48 (2003) 130.
[53] D. Zuba, A. Parczewski, M. Reichenbacher, J. Chromatogr. B 773 (2002) 75.
[54] R. Aranda, P. Kruss, R.C. Burk, J. Chromatogr. A 888 (2000) 35.
[55] D. Poli, E. Bergamaschi, P. Manini, R. Andreoli, A. Mutti, J. Chromatogr. B 732 (1999) 115.
48
[56] B. Rega, N. Fournier, E. Guichard, J. Agric. Food. Chem. 51 (2003) 7092.
[57] O. Ezquerro, M.T. Tena, J. Chromatogr. A 1068 (2005) 201.
[58] F. Mangani, R. Cenciarini, Chromatographia 41 (1995) 678.
[59] D. Djozan, Y. Assadi, Chromatographia 45 (1997) 183.
[60] D. Djozan, Y. Assadi, Microchem. J. 63 (1999) 276.
[61] M.A. Farajzadeh, A.A. Matin, Anal. Sci. 18 (2002) 77.
[62] M.A. Farajzadeh, M. Hatami, Chromatographia 59 (2004) 259.
[63] J. Jia, X. Feng, N. Fang, Y. Wang, H. Chen, W. Dan, J. Environ. Sci. Health 37 (2002) 489.
[64] M. Giardina, S.V. Olesik, Anal. Chem. 73 (2001) 5841.
[65] M. Giardina, S.V. Olesik, Anal. Chem. 75 (2003) 1604.
[66] M. Giardina, L. Ding, S.V. Olesik, J. Chromatogr. A 1060 (2004) 215.
[67] Y. Liu, M.L. Lee, J.K. Hageman, Y. Yang, S.B. Hawthorne, Anal. Chem. 69 (1997) 5001.
[68] Y. Liu, Y. Shen, M.L. Lee, Anal. Chem. 69 (1997) 190.
[69] J. Hou, Q. Ma, X. Du, H. Deng, J. Gao, Talanta 62 (2004) 241.
[70] D. Djozan, Y. Assadi, S.H. Haddadi, Anal. Chem. 73 (2001) 4054.
[71] M.A. Farajzadeh, M. Hatami, J. Sep. Sci. 26 (2003) 802.
[72] F. Guo, T. Gorecki, D. Irish, J. Pawliszyn, Anal. Commun. 33 (1996) 361.
[73] D. Djozan, M. Amir-Zehni, Chromatographia 58 (2003) 221.
[74] D. Djozan, Y. Assadi, G. Karim-Nezhad, Chromatographia 56 (2002) 611.
[75] S. Li, S.G. Weber, Anal. Chem. 69 (1997) 1217.
[76] T. Gorecki, P. Martos, J. Pawliszyn, Anal. Chem. 70 (1998) 19.
49
[77] C. Xiao, S. Han, Z. Wang, J. Xing, C. Wu, J. Chromatogr. A 927 (2001) 121.
[78] K. Jinno, K. Yamamoto, J.C. Fetzer, W.R. Biggs, J. Microcol. Sep. 4 (1992) 187.
[79] D.L. Stalling, C.Y. Guo, S. Saim, J. Chromatogr. Sci. 31 (1993) 265.
[80] R.V. Golovnya, M.B. Terenina, E.L. Ruchkina, V.L. Karnatsevich, Mendeleev. Commun. 6 (1993) 231.
[81] A. Glausch, A. Hirsch, I. Lamparth, V. Schurig, J. Chromatogr. A 809 (1998) 252.
[82] P.F. Fang, Z.R. Zeng, J.H. Fan, Y.Y. Chen, J. Chromatogr. A 867 (2000) 177.
[83] S.D. Harvey, D.A. Nelson, B.W. Wright, J.W. Grate, J. Chromatogr. A 954 (2002) 217.
[84] J. Wu, Z. Deng, J. Pawliszyn, in Extech.’99, Waterloo, Canada, 1999.
[85] J. Wu, J. Pawliszyn, J. Chromatogr. A 909 (2001) 37.
[86] J. Wu, H.L. Lord, J. Pawliszyn, H. Kataoka, J. Microcol. Sep. 12 (2000) 255.
[87] J. Wu, W. Xie, J. Pawliszyn, Analyst 125 (2000) 2216.
[88] J. Wu, J. Pawliszyn, Anal. Chem. 73 (2001) 55.
[89] J. Wu, H. Lord, J. Pawliszyn, Talanta 54 (2001) 655.
[90] J. Wu, C. Tragas, H. Lord, J. Pawliszyn, J. Chromatogr. A 976 (2002) 357.
[91] M. Walles, W.M. Mullett, K. Levsen, J. Borlak, G. Wunsch, J. Pawliszyn, J. Pharm. Biomed. Anal. 30 (2002) 307.
[92] W.M. Mullett, K. Levsen, J. Borlak, J. Wu, J. Pawliszyn, Anal. Chem. 74 (2002)
1695. [93] H.L. Lord, R.P. Grant, M. Walles, B. Incledon, B. Fahie, J. Pawliszyn, Anal.
Chem. 75 (2003) 5103. [94] A. Kraft, Conducting polymers; Organic Molecular Solids: Properties and
Applications, CRC Press, Boca Raton, FL, 1997. [95] R.A. Pethrick, Conducting polymers; Desk Reference of Functional Polymers:
Synthesis and Applications, ACS, Washington, DC, 1997.
50
[96] H. Bagheri, M. Saraji, J. Chromatogr. A 986 (2003) 111.
[97] D. Djozan, S. Bahar, Chromatographia 58 (2003) 637.
[98] D. Djozan, S. Bahar, Chromatographia 59 (2004) 95.
[99] H. Bagheri, A. Mir, E. Babanezhad, Anal. Chim. Acta. 532 (2005) 89.
[100] M. Mousavi, E. Noroozian, M. Jalali-Heravi, A. Mollahosseini, Anal. Chim. Acta. 581 (2007) 71.
[101] H. Bagheri, E. Babanezhad, A. Es-haghi, J. Chromatogr. A 1152 (2007) 168.
[102] X. Li, J. Chen, L. Du, J. Chromatogr. A 1140 (2007) 21.
[103] X. Li, M. Zhong, S. Xu, C. Sun, J. Chromatogr. A 1135 (2006) 101.
[104] M. Huang, T. Chao, Q. Zhou, G. Jiang, J. Chromatogr. A 1048 (2004) 257.
[105] M. Huang, G. Jiang, Y. Cai, J. Sep. Sci. 28 (2005) 2218.
[106] E.O. Otu, J. Pawliszyn, Microchim. Acta 112 (1993) 41.
[107] C. Jia, Y. Luo, J. Pawliszyn, J. Microcol. Sep. 10 (1998) 167.
[108] H. Kataoka, H.L. Lord, J. Pawliszyn, J. Chromatogr. B 731 (1999) 353.
[109] H.L. Lord, J. Pawliszyn, LC-GC (1998) 41.
[110] B.C.D. Tan, P.J. Marriott, P.D. Morrison, H.K. Lee, Analyst 124 (1999) 651.
[111] K. Kataoka, J. Pawliszyn, Chromatographia 50 (1999) 532.
[112] Y. Saito, Y. Nakao, M. Imaizumi, Y. Morishima, Y. Kiso, K. Jinno, Anal. Bioanal. Chem. 373 (2002) 81.
[113] Y. Gou, J. Pawliszyn, Anal. Chem. 72 (2000) 2774.
[114] Y. Gou, R. Eisert, J. Pawliszyn, J. Chromatogr. A 873 (2000) 137.
[115] M. Takino, S. Daishima, T. Nakahara, Analyst 126 (2001) 602.
51
[116] Z. Mester, J. Pawliszyn, Rapid Commun. Mass Spectrom. 13 (1999) 1999.
[117] K. Mitani, S. Narimatsu, H. Kataoka, J. Chromatogr. A 986 (2003) 169.
[118] H. Kataoka, S. Narimatsu, H.L. Lord, J. Pawliszyn, Anal. Chem. 71 (1999) 4237.
[119] Y. Gou, C. Tragas, H. Lord, J. Pawliszyn, J. Microcol. Sep. 12 (2000) 125.
[120] H. Kataoka, H.L. Lord, S. Yamamoto, S. Narimatsu, J. Pawliszyn, J. Microcol. Sep. 12 (2000) 493.
[121] L. Nardi, J. Chromatogr. A 985 (2003) 39.
[122] L. Nardi, J. Chromatogr. A 985 (2003) 85.
[123] L. Nardi, in P. Sandra (Editor), 25th International Symposium on Capillary Chromatography, Riva del Garda, Italy, May 13-17 (2002), p. on CD.
[124] L. Nardi, J. Chromatogr. A 985 (2003) 67.
[125] K. Mitani, S. Narimatsu, F. Izushi, H. Kataoka, J. Pharm. Biomed. Anal. 32 (2003) 469.
[126] H. Kataoka, M. Ise, S. Narimatsu, J. Sep. Sci. 25 (2002) 77.
[127] W.M. Mullett, J. Pawliszyn, J. Sep. Sci. 26 (2003) 251.
[128] C.F. Poole, TrAC, Trends Anal. Chem. 22 (2003) 362.
[129] W.M. Mullett, K. Levsen, D. Lubda, J. Pawliszyn, J. Chromatogr. A 963 (2002) 325.
[130] W.M. Mullett, J. Pawliszyn, Anal. Chem. 74 (2002) 1081.
[131] M. Walles, W.M. Mullett, J. Pawliszyn, J. Chromatogr. A 1025 (2004) 85.
[132] K. Haupt, Analyst 126 (2001) 747.
[133] W.M. Mullett, P. Martin, J. Pawliszyn, Anal. Chem. 73 (2001) 2383.
[134] W.M. Mullett, M. Walles, K. Levsen, J. Borlak, J. Pawliszyn, J. Chromatogr. B 801 (2004) 297.
52
[135] M. Walles, W.M. Mullett, K. Levsen, J. Borlak, G. Wunsh, J. Pawliszyn, J. Pharm. Biomed. Anal. 30 (2002) 307.
[136] E.H.M. Koster, C. Crescenzi, W. den Hoedt, K. Ensing, G.J. de Jong, Anal. Chem.
73 (2001) 3140. [137] E. Turiel, J.L. Tadeo, A. Martin-Esteban, Anal. Chem. 79 (2007) 3099.
[138] X. Hu, Y. Hu, G. Li, J. Chromatogr. A 1147 (2007) 1.
[139] Y. Shintani, X. Zhou, M. Furuno, H. Minakuchi, K. Nakanishi, J. Chromatogr. A 985 (2003) 351–357.
[140] J.-F. Huang, B. Lin, Q.-W. Yu, Y.-Q. Feng, Anal. Bioanal. Chem. 384 (2006)
1228. [141] Y. Fan, Y.-Q. Feng, S.-L. Da, Z.-G. Shi, Anal. Chim. Acta. 523 (2004) 251.
[142] Y. Fan, Y.-Q. Feng, S.-L. Da, X.-P. Gao, Analyst 129 (2004) 1065.
[143] Y. Wen, Y. Fan, M. Zhang, Y.-Q. Feng, Anal. Bioanal. Chem. 382 (2005) 204.
[144] Y. Fan, Y.-Q. Feng, J.-T. Zhang, S.-L. Da, M. Zhang, J. Chromatogr. A 1074 (2005) 9.
[145] J. Nie, Q. Zhao, J. Huang, B. Xiang, Y.-Q. Feng, J. Sep. Sci. 29 (2006) 650.
[146] Y. Fan, M. Zhang, Y.-Q. Feng, J. Chromatogr. A 1099 (2005) 84.
[147] M.E. McComb, R.D. Oleschuk, E. Giller, H.D. Gesser, Talanta 44 (1997) 2137.
[148] Y. Saito, Y. Nakao, M. Imaizumi, T. Takeichi, Y. Kiso, K. Jinno, Fresen. J. Anal. Chem. 368 (2000) 641–643.
[149] K. Furtmann, Fresen. J. Anal. Chem. 348 (1994) 291–296.
[150] K. Furtmann, Anal. Methods. Inst. 5 (1995) 254–265.
[151] X.-P. Lee, T. Kumazawa, K. Sato, O. Suzuki, J. Chromatogr. Sci. 35 (1997) 302–308.
[152] S. Ulrich, J. Martens, J. Chromatogr. B 696 (1997) 217–234.

53
[153] K. Jinno, M. Kawazoe, Y. Saito, T. Takeichi, M. Hayashida, Electrophoresis 22 (2001) 3785–3790.
[154] T. Kumazawa, X.-P. Lee, K. Sato, O. Suzuki, Anal. Chim. Acta 492 (2003) 49.
[155] L. Pan, J. Pawliszyn, Anal. Chem. 69 (1997) 196.
54
CHAPTER 2
SOL-GEL TECHNOLOGY IN SOLID-PHASE MICROEXTRACTION AND
CAPILLARY MICROEXTRACION
2.1 Sol-gel Technology: A brief history
The term sol-gel process [1] has been used for any solution involving hydrolysis
of a precursor and formation of a gel via polycondensation reactions. Sol-gel technology
offers a simple but versatile approach to the synthesis of inorganic polymers and hybrid
inorganic-organic materials. Due to unique combinations of properties and numerous
inherent advantages such as better homogeneity and purity, easier controllability,
enhanced manageability, sol-gel technology has found growing interest in diverse
research areas.
The history of sol-gel technology dates back to mid-1800s. In 1845, Ebelman [2]
prepared tetraethoxysilane (TEOS) from silicon tetrachloride (SiCl4) and ethanol. His
subsequent publications [3,4] document the hydrolysis of TEOS to yield silicate solutions
from which fibers could be drawn and the casting of amorphous gels. In late 1850s,
Mendeleyev [5] conceived of the novel idea that hydrolysis of SiCl4 yields a product
tetrahydroxysilane (Si(OH)4) that undergoes polycondensation reactions to form high
molecular weight polysiloxanes. After almost a century later, Hurd [6] showed a
polymeric structure of silicic acid, which was widely accepted for the demonstration of
55
the network structure of silica gels. Geffcken [7] used alkoxides to prepare oxide films.
During 1950s and 1960s Roy and coworkers [8,9] succeeded in using sol-gel methods to
synthesize a large number of novel ceramic oxide compositions involving Al, Si, Ti, Zr,
etc., that were impossible to obtain using ceramic powder methods. Stober and co-
workers [10] reported in 1968 that both the morphology and size of the powders could be
controlled using ammonia as a catalyst for the TEOS hydrolysis reaction. In early 1970s,
Dislich [11], and Levene and Thomas [12] independently developed multicomponent
glasses using alkoxide precursors and controlling the sol-gel hydrolysis and
polycondensation reactions.
J.D. Mackenzie [13] has divided the achievements in sol-gel chemistry during last
two and a half decades into two broader generations: (1) first generation and (2) second
generation sol-gel process. The first generation sol-gel process involved in better
understanding of the structure and physical chemistry of the “original-type” of liquid
solution ( mixture of alcohol, alkoxide, water, catalyst) which resulted in oxide gels. The
pioneering work of Schmidt at the Fraunhoffer Institute [14,15] who successfully
incorporated organic material into inorganic network by sol-gel process is regarded as the
beginning of second generation by J.D. Mackenzie. Schmidt’s invention opened up a new
possibility of creating hybrid organic-inorganic materials using a very simple sol-gel
approach.
Schmidt’s work opened a new chapter in sol-gel chemistry. Cortes and co-
workers [16] created porous monolithic ceramic beds within small-diameter capillaries
using sol-gel technology by polymerizing solutions containing potassium silicate for its
56
application in liquid chromatography (LC) as a separation column. Later, Crego and co-
workers [17] reported the preparation of sol-gel open tubular capillary columns (OTCs)
for reversed-phase liquid chromatography (RPLC). Guo and Colon [18] developed a sol-
gel stationary phase for open tubular electrochromatography (OTEC). Few years later,
Malik and coworkers introduced sol-gel coated capillary columns for gas
chromatography (GC) [19], and sol-gel coated fibers for solid-phase microextraction
(SPME) [20]. Among many scientists working in the field of chromatography, Tanaka
and co-workers made a significant contribution by developing sol-gel monolithic beds
and using them in high-performance liquid chromatography (HPLC) columns [21-23].
They showed high permeability and high column efficiency of monolithic beds compared
to a particle-packed column (most commonly used in HPLC).
2.2 Reactions involved in the sol-gel process
In order to control the entire sol-gel process and fine-tune the properties of the target
product, it is important to understand the chemical reactions involved (scheme 2.1). In
general, a sol-gel process involves hydrolysis of metal alkoxides precursors (and/or
polymers) and polycondensation reactions converting them into a colloid that ultimately
turns into a three dimensional network. Figure 2.1 illustrates various aspects of the sol-
gel process. As can be seen in figure 2.1, any experimental parameter that affects sol-gel
reactions is likely to influence the properties of the final product. Hence, accurate control
of experimental conditions is very important in sol-gel synthesis. The relative rates of
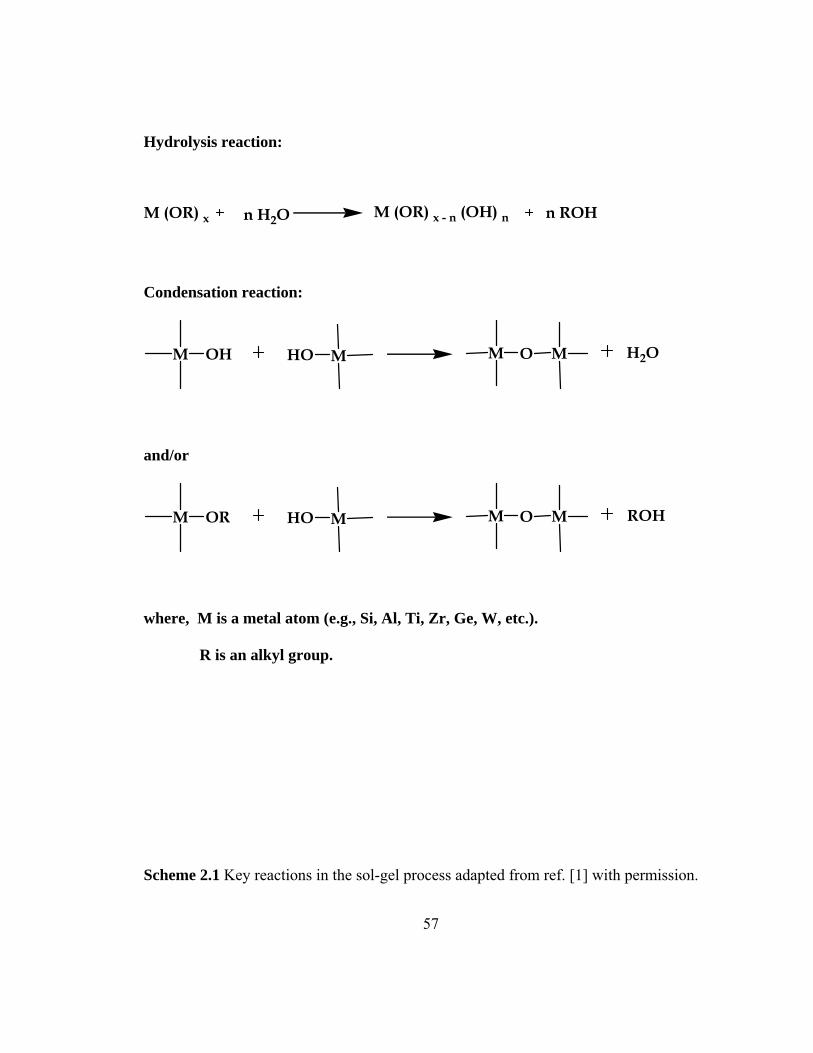
57
Hydrolysis reaction:
n H2OM (OR) x M (OR) x - n (OH) n n ROH
Condensation reaction:
M HO M H2OM MOOH
and/or
M HO M ROHM MOOR
where, M is a metal atom (e.g., Si, Al, Ti, Zr, Ge, W, etc.).
R is an alkyl group.
Scheme 2.1 Key reactions in the sol-gel process adapted from ref. [1] with permission.
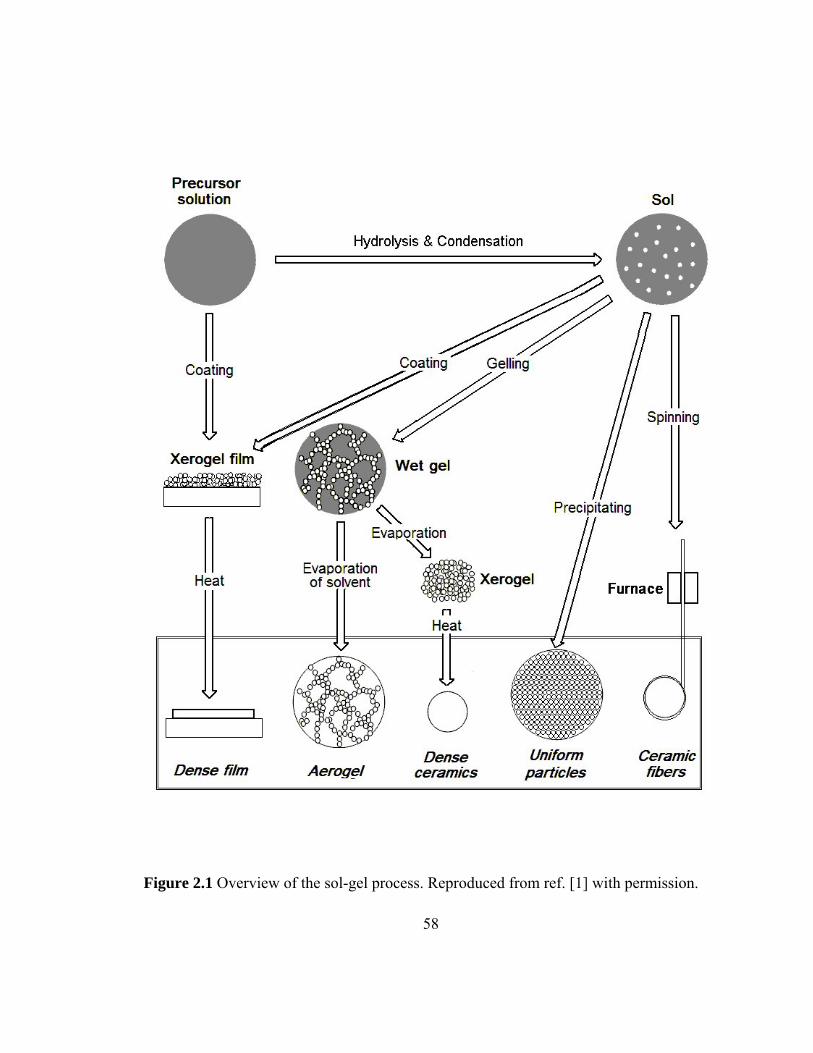
58
Figure 2.1 Overview of the sol-gel process. Reproduced from ref. [1] with permission.
59
hydrolysis and condensation may vary depending on experimental conditions. When the
rate of condensation reaction is higher than that of the hydrolysis reaction, the resulting
sol-gel material is highly branched and the corresponding gel typically acquires a
mesoporous structure [24]. On the other hand, if the hydrolysis reaction rate is
significantly higher than that of the condensation reaction, then the resulting sol-gel
material is weakly branched and the corresponding gel typically acquires a microporous
structure [25]. A typical sol solution generally contains the following chemical
components: (1) one or more sol-gel precursor(s) (usually a metal alkoxide M(OR)x), (2)
solvent system, (3) a catalyst (an acid, base or fluoride), and (4) water.
Since hydrolysis and condensation both involve nucleophilic displacement (SN)
mechanism, the reactivity of metal alkoxides in the sol-gel process, consisting of these
reactions, is dependent on the positive partial charge of the metal atom and its
coordination number. In general, the longer and bulkier the alkoxide group attached to a
particular metal atom, the less reactive that precursor is in hydrolysis and condensation
[26,27]. Many metals, such as titanium, aluminum, vanadium, zirconium, and germanium,
can be used to prepare their alkoxides. However, silica-based alkoxides are the most
widely used precursors due to their well known chemistry, stability of Si-O bond, and
commercially availability of starting materials [28].
Along with the sol-gel precursor(s), catalyst(s), and water, the sol solution also
contains sol-gel active organic ligands including polymer(s). To accommodate all these
chemical ingredients, a solvent system is chosen in such a way that it provides a
homogeneous system, does not hinder the sol-gel process, and avoids any undesired side
60
reactions. Often more than one solvent (e.g., mixture of methanol and dichloromethane)
is used depending on the compatibility of the sol-gel precursor(s) and the sol-gel active
organic ligand. The amount of solvent used also has a significant effect on the gelation
time. Besides, the water-to-precursor ratio in the sol solution may also affect the reaction
rates as well as the physical properties of the created sol-gel materials.
Among all the chemical ingredients used in sol gel process, catalyst(s) play a vital
role. They not only change the reaction speed, the type of the catalyst also affects the
structure of the resulting sol-gel materials. Various acidic (e.g., acetic acid [29],
hydrofluoric acid [30], and trifluoroacetic acid [31] and basic ammonia [32] and amines
[33] catalysts have been used to expedite the alkoxide-based sol-gel processes. A
generally accepted notion is that acid-catalyzed sol-gel processes are more likely to
produce linear polymers because under acidic conditions, the hydrolysis of alkoxide
precursors is faster than the condensation process [34]. Under acidic conditions, the
mechanism of hydrolysis reaction involves protonation of the alkoxide group followed by
a nucleophilic attack by water to form a pentacoordinate intermediate (scheme 2.2 A) [1].
On the other hand, under basic condition, condensation reaction is faster and the rate of
the overall sol-gel process is determined by the relatively slow hydrolysis step. The
hydrolysis reaction under basic condition is believed to start with the nucleophilic attack
on the silicon atom by the hydroxide anion and form a penta-coordinated intermediate.
This step is followed by the substitution of an alkoxide group by a hydroxyl group
(scheme 2.2 B) [1,35,36].
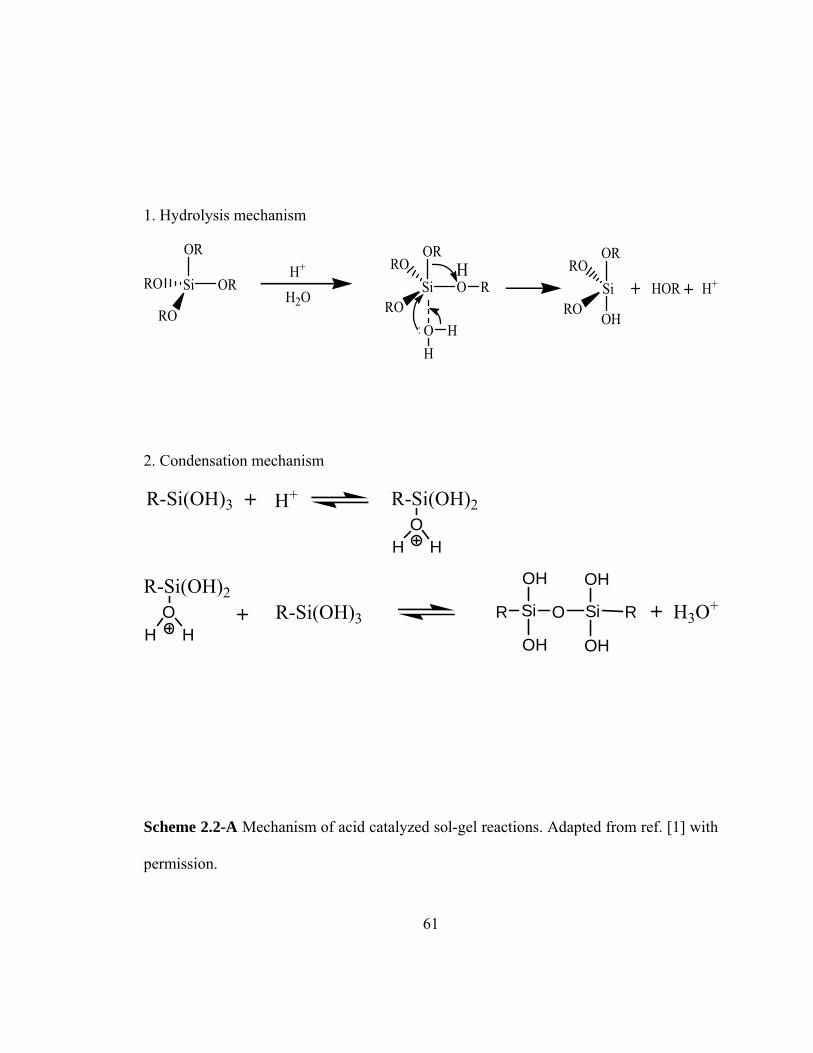
61
1. Hydrolysis mechanism
Si ORRO
RO
ORH+
H2O Si ORO
RO
OR
O HH
HR Si
RO
RO
OR
OH
HOR H+
2. Condensation mechanism
R-Si(OH)3 H+ R-Si(OH)2O
H H
R-Si(OH)2O
H HR-Si(OH)3 Si
OH
OH
R O Si
OH
OH
R H3O+
Scheme 2.2-A Mechanism of acid catalyzed sol-gel reactions. Adapted from ref. [1] with
permission.
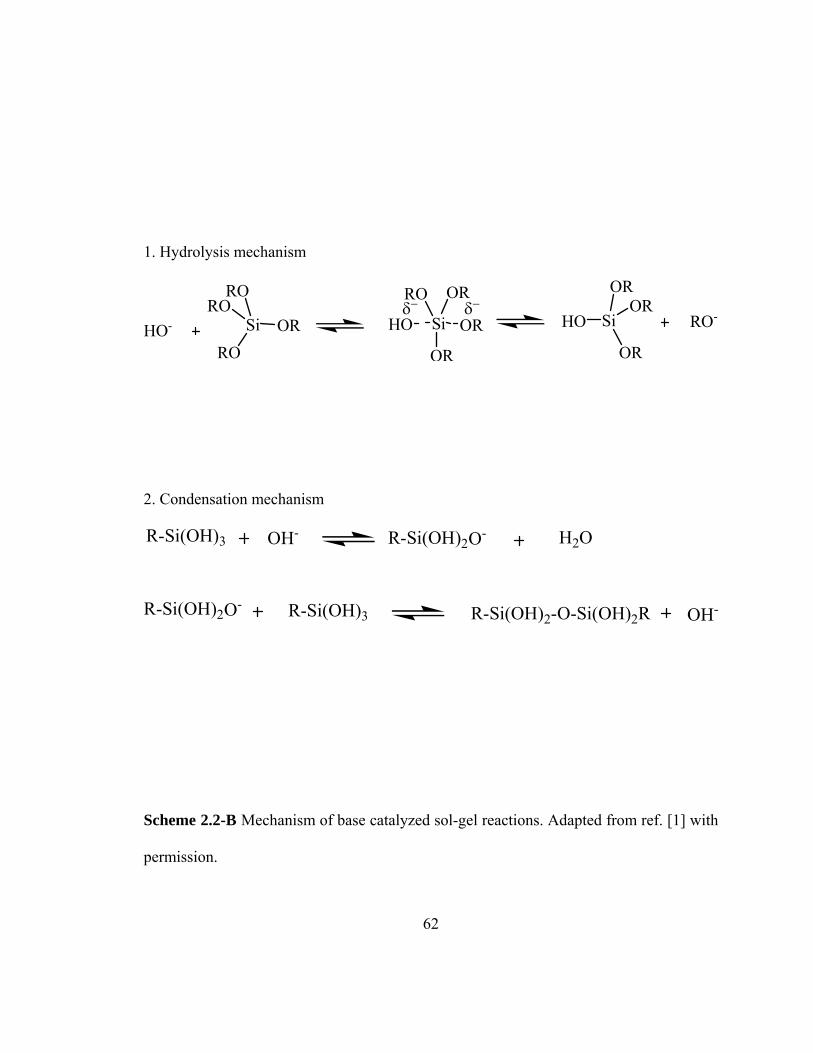
62
1. Hydrolysis mechanism
Si ORRO
RORO
HO- Si
OR
RO OR
HO OR SiOR
OR
HO
OR
RO-δ− δ−
2. Condensation mechanism
R-Si(OH)3 OH- R-Si(OH)2O- H2O
R-Si(OH)2O- R-Si(OH)3 R-Si(OH)2-O-Si(OH)2R OH-
Scheme 2.2-B Mechanism of base catalyzed sol-gel reactions. Adapted from ref. [1] with
permission.
63
2.3 Steps involved in preparation of sol-gel coated SPME fiber and CME capillary
The organic-inorganic hybrid materials synthesized by sol-gel technology have
been used as stationary phases in various separation techniques such as gas
chromatography [19], high-performance liquid chromatography [18,23,37], and capillary
electrochromatography [18,38]. Preparation of the sol-gel sorbent coated fiber/capillary
involves design and preparation of the sol solution, pretreatment and coating of the fused-
silica fiber/capillary.
2.3.1 Design and preparation of sol solution
The most decisive step in the preparation of a sol-gel coating for both fiber SPME
and CME is the design of the sol solution. The successful creation of the desired sol-gel
sorbent depends upon the selection of the sol solution ingredients. The sol solution
ingredients typically include inorganic precursor(s), a solvent system, a catalyst, water, a
sol-gel active organic polymer, and a surface deactivating agent. Among various catalysts,
trifluoroacetic acid (TFA) is the most commonly used catalyst in the preparation of sol-
gel SPME and CME coatings. TFA (a relatively strong organic acid) along with low
concentrations of water (usually 5-10 %) also serves as a controlled source of water for
the sol-gel hydrolysis reaction. A reasonable gelation time (1-2 h) is usually achieved by
adjusting the amount water and acid catalyst. Along with sol-gel precursor(s), sol-gel
active organic ligands (polymer or monomers) with specific functional groups are added
to sol solution to provide desired sorbent selectivity toward target analytes. In sol-gel
64
SPME and CME coatings, a surface deactivating reagent may be used to deactivate
residual silanol groups on the sorbent surface. Malik and coworkers have reported the use
of various deactivation reagents, such as phenyldimethylsilane (PheDMS) [39,40],
poly(methylhydrosiloxane) (PMHS) [19,20,41-44], and 1,1,1,3,3,3-hexamethyldisilazane
(HMDS) [41-45].
2.3.2 Pretreatment, coating, and post-coating treatment of fused silica SPME
fiber/capillary
SPME fibers are solid cylindrical rods with no flow-through holes and have small
diameters (~ 100 µm). However, capillaries used in CME (also known as in-tube SPME)
differ from a fiber by the presence of a flow-through hole (Figure 2.2). Due of its
mechanical strength and chemical inertness, fused silica material is commonly used as
the substrate for both fiber-based and capillary-based SPME device. The commercially
available fused silica capillaries have a protective polyimide coating on the outer surface.
This polyimide coating protects the fused silica substrate from micro scratches during
handling and storage. A sorbent coating is applied to the outer surface of the fiber (fiber-
SPME) or to the inner surface of the capillary (CME or in-tube SPME).
The main purpose of pretreatment of the fiber (outer surface) or capillary (inner
surface) is to enhance the silanol (Si-OH) content of the surface, and thereby facilitate the
effective bonding of the sol-gel sorbent (coating or monoliths) materials to the fused
silica substrate. In the case of fiber-based SPME, first the protective polyimide coating is
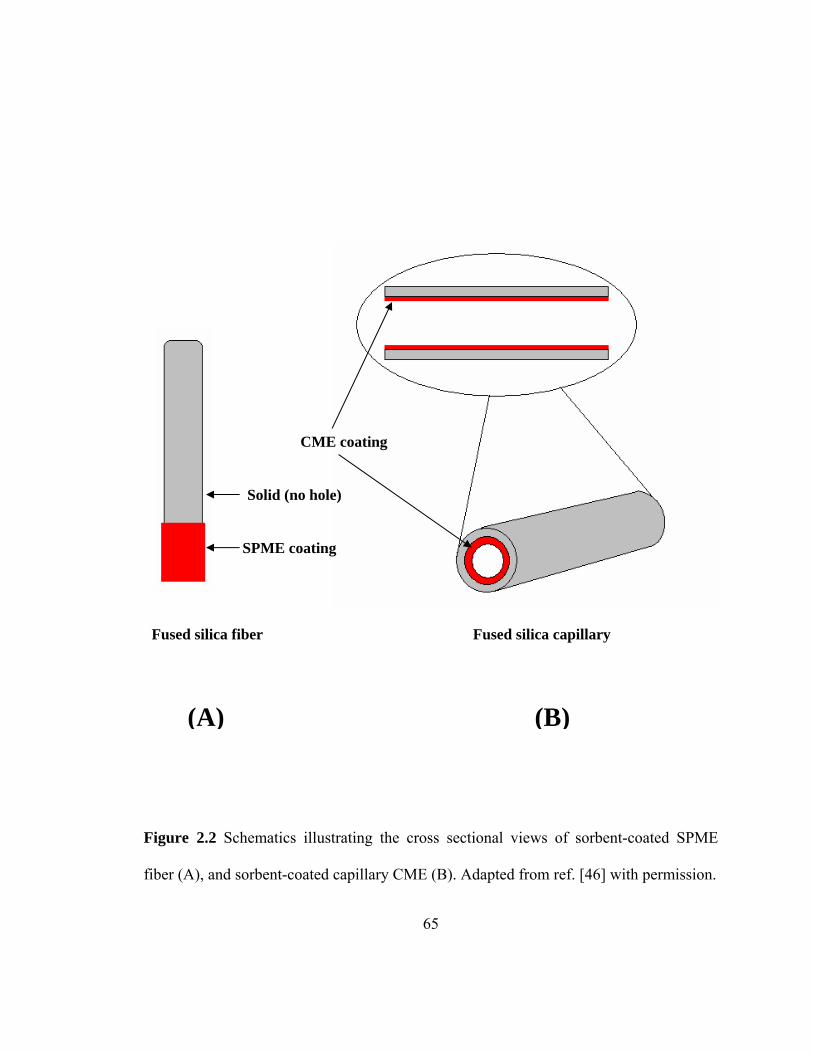
65
Figure 2.2 Schematics illustrating the cross sectional views of sorbent-coated SPME
fiber (A), and sorbent-coated capillary CME (B). Adapted from ref. [46] with permission.
Fused silica capillary Fused silica fiber
Solid (no hole)
SPME coating
CME coating
(A) (B)
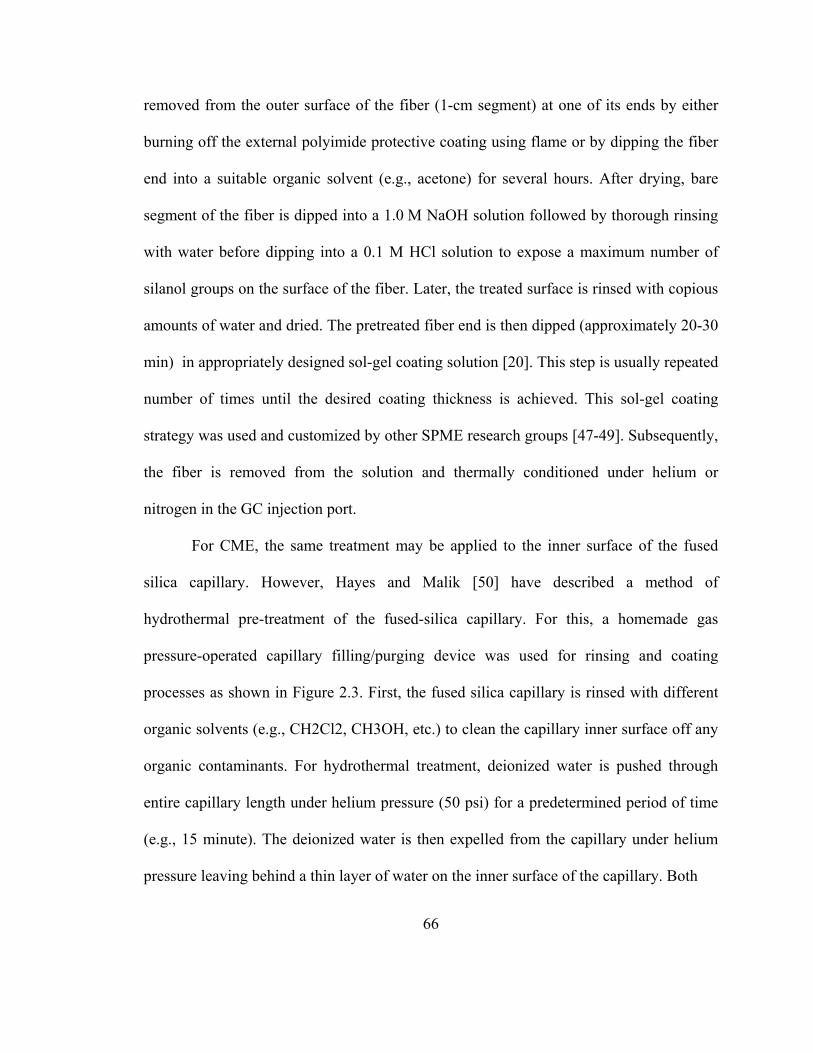
66
removed from the outer surface of the fiber (1-cm segment) at one of its ends by either
burning off the external polyimide protective coating using flame or by dipping the fiber
end into a suitable organic solvent (e.g., acetone) for several hours. After drying, bare
segment of the fiber is dipped into a 1.0 M NaOH solution followed by thorough rinsing
with water before dipping into a 0.1 M HCl solution to expose a maximum number of
silanol groups on the surface of the fiber. Later, the treated surface is rinsed with copious
amounts of water and dried. The pretreated fiber end is then dipped (approximately 20-30
min) in appropriately designed sol-gel coating solution [20]. This step is usually repeated
number of times until the desired coating thickness is achieved. This sol-gel coating
strategy was used and customized by other SPME research groups [47-49]. Subsequently,
the fiber is removed from the solution and thermally conditioned under helium or
nitrogen in the GC injection port.
For CME, the same treatment may be applied to the inner surface of the fused
silica capillary. However, Hayes and Malik [50] have described a method of
hydrothermal pre-treatment of the fused-silica capillary. For this, a homemade gas
pressure-operated capillary filling/purging device was used for rinsing and coating
processes as shown in Figure 2.3. First, the fused silica capillary is rinsed with different
organic solvents (e.g., CH2Cl2, CH3OH, etc.) to clean the capillary inner surface off any
organic contaminants. For hydrothermal treatment, deionized water is pushed through
entire capillary length under helium pressure (50 psi) for a predetermined period of time
(e.g., 15 minute). The deionized water is then expelled from the capillary under helium
pressure leaving behind a thin layer of water on the inner surface of the capillary. Both
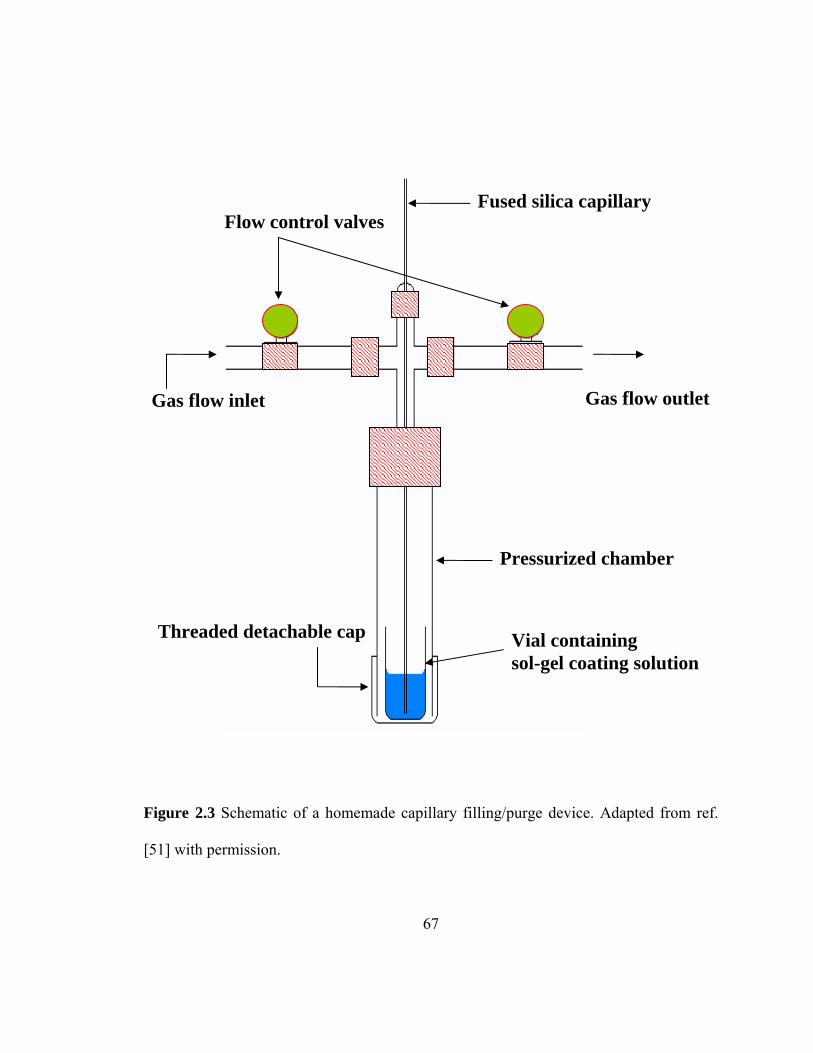
67
Figure 2.3 Schematic of a homemade capillary filling/purge device. Adapted from ref.
[51] with permission.
Gas flow inlet
Flow control valvesFused silica capillary
Gas flow outlet
Pressurized chamber
Vial containing sol-gel coating solution
Threaded detachable cap
68
ends of the capillary are then sealed with a high-temperature flame (e.g., an oxyacetylene
torch), and the sealed capillary is conditioned in a GC oven at 250 ˚C for two hours.
Under these conditions, additional silanol groups are generated on the fused silica
capillary surface as a result of the hydrolysis of siloxane bridges. To moderate the surface
silanol concentration, both ends of the capillary are cut open and the thermal treatment is
continued for an additional two hours, by simultaneously heating the capillary while
purging with helium. The hydrothermal treatment also provides a more uniform
distribution of these silanol groups on the surface facilitating strong chemical anchoring
of the sol-gel surface coating/monolithic bed that will subsequently be created within the
capillary. To prepare sol-gel coated CME capillary, a hydrothermally treated fused silica
capillary is filled with previously designed sol solution [51] using home-made capillary
filling/purging device described earlier (Figure 2.3). The sol solution is kept inside the
capillary for a desired period of time (~ 15-30 min) to facilitate the formation of a sol-gel
coating, and its chemical bonding to the capillary inner walls. After this, the unbonded
portion of the sol solution is expelled from the capillary, under helium pressure (~ 50 psi)
leaving behind a surface-bonded sol-gel coating within the capillary. The sol-gel coating
is then purged with helium for additional period of time (~ 30 min) to evaporate any
remaining volatile organic solvents. Later, thermal conditioning is carried out in a GC
oven by temperature-programmed heating of the coated capillary. Usually, the final
conditioning temperature is determined by thermal stability of organic component
(functional group(s) and side-chain(s)) used to prepare the sorbent coating. After thermal
conditioning, the extraction capillary is further rinsed with organic solvents (e.g., CH2Cl2,
69
CH3OH) to clean the coated surface and conditioned again in the GC oven. The
conditioned capillary is then cut into small pieces (~ 10-12 cm) that are used to perform
capillary microextraction.
2.4 Characterization and morphology of sol-gel sorbents
The performance of sol-gel organic-inorganic hybrid SPME and CME coatings
depend on the characteristics of the sol solution ingredients used to prepare such coatings.
To study the chemical bonds in sol-gel structure, spectroscopic techniques like Fourier
transform infrared spectroscopy (FTIR) [52,53], and nuclear magnetic resonance (NMR)
[54-56], fluorescence spectroscopy [53] are frequently used. Infrared (IR) spectroscopy is
an important and simple tool to follow the evolution of the sol-gel material and
microstructure of sol–gel silica films [57,58]. In sol-gel SPME, FTIR spectroscopy is
most commonly used to identify specific chemical bonds (Table 2.1) on the sorbent
coating [59,60]. Another powerful analytical technique, nuclear magnetic resonance
(NMR), was used by Rodriguez and Colon [61] to investigate the species present in the
sol-gel solution used to modify the inner surface of an open tubular CEC column.
To study the detailed surface morphology of the sol-gel materials, scanning
electron microscopy (SEM) is a powerful tool. With SEM, sample surface is scanned by a
fine electron incident beam which produces an image with great depth of field and an
almost three-dimensional appearance. With this feature, SEM is the most widely used
technique to evaluate the morphology of sol-gel materials [40,50,62,63]. In case of sol-
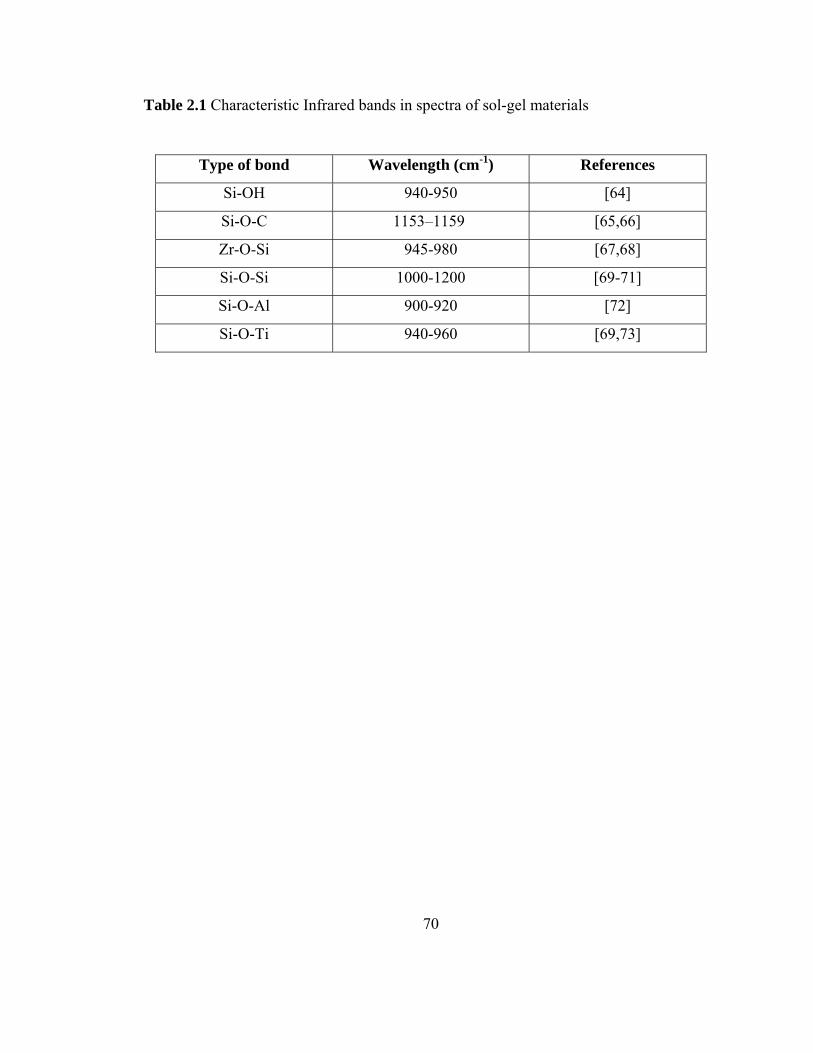
70
Table 2.1 Characteristic Infrared bands in spectra of sol-gel materials
Type of bond Wavelength (cm-1) References
Si-OH 940-950 [64]
Si-O-C 1153–1159 [65,66]
Zr-O-Si 945-980 [67,68]
Si-O-Si 1000-1200 [69-71]
Si-O-Al 900-920 [72]
Si-O-Ti 940-960 [69,73]
71
gel SPME and CME, SEM helps to study surface structural details through cross
sectional and surface views of sol-gel fiber/capillary coating. It can also reveal the
uniformity of coating thickness and structural defects if any [41].
2.5 Sol-gel sorbents used in SPME and CME: A brief overview
Sol-gel technology for fused silica fiber/capillary-based SPME offers many
advantages over SPME with conventional coatings. Sol-gel coating procedure allows
creation of chemical bonds between the fused silica surface and the sorbent coating
through condensation of silanol and other sol-gel active groups. It provides surface-
coatings with both thermal and solvent stability ensuring reproducible performance of the
sorbent coatings. High thermal stability of the sol-gel coating provides an opportunity to
broaden the applicability of SPME and CME toward analytes with high-boiling point.
The solvent stability of sol-gel coatings makes sol-gel microextraction capillary an
effective means for hyphenation of SPME and CME with liquid-phase separation
techniques like HPLC [74,75] and CEC [39,51]. Since sol-gel technology has tunable
selectivity, it offers the flexibility of incorporating sol-gel active organic ligand (polymer
or monomer) with specific functional groups in the sol solution which can provide the
selectivity to the created extracting sorbent toward target analytes. The extraction
sorbents prepared using sol-gel approach are highly porous which gives them
significantly high surface area and provides acceptable sample capacity, and faster mass
transfer even with thinner coatings [20]. Some of the sol-gel sorbents used in SPME
and/or CME (Table 2.2) are described in following sections.
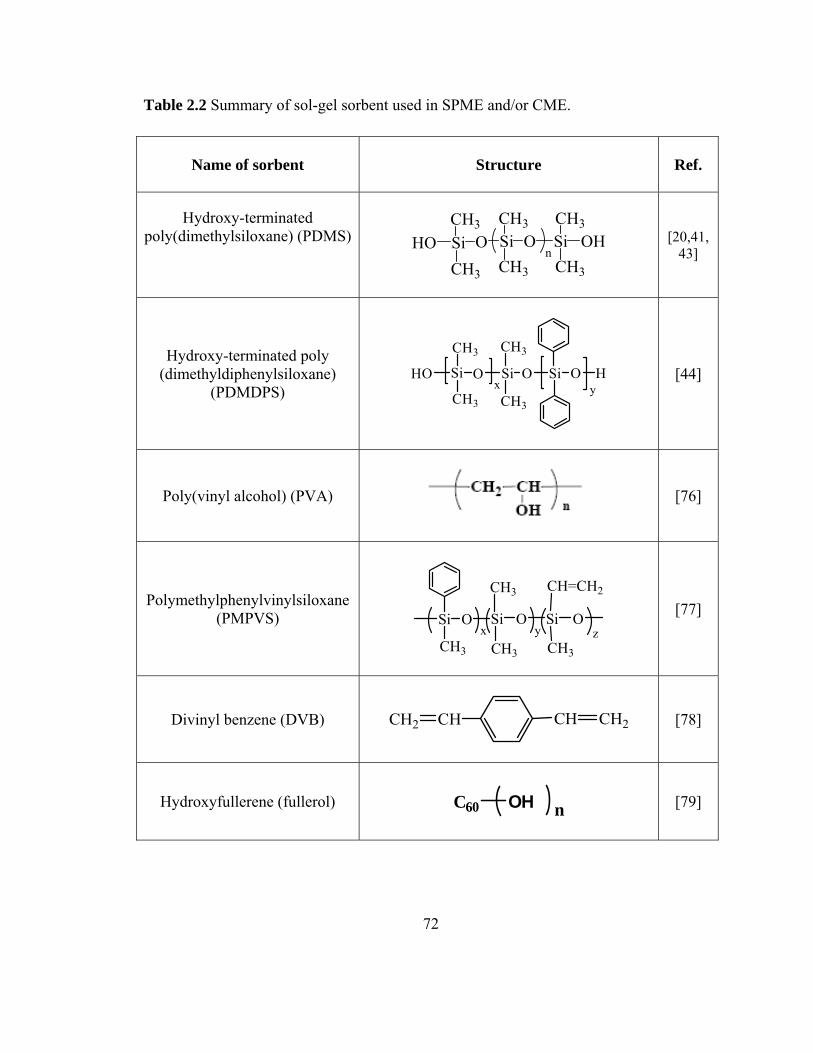
72
Table 2.2 Summary of sol-gel sorbent used in SPME and/or CME.
Name of sorbent
Structure Ref.
Hydroxy-terminated poly(dimethylsiloxane) (PDMS)
HO Si OCH3
Si OCH3
CH3
Si OHCH3
CH3CH3
n
[20,41,43]
Hydroxy-terminated poly (dimethyldiphenylsiloxane)
(PDMDPS)
Si
CH3
CH3
xSi
yOO Si O H
CH3
CH3
HO
[44]
Poly(vinyl alcohol) (PVA)
[76]
Polymethylphenylvinylsiloxane (PMPVS)
Si
CH3
Si O
CH3
O Si O
CH3
CH3
CH=CH2
x y z
[77]
Divinyl benzene (DVB)
CH2 CH CH CH2
[78]
Hydroxyfullerene (fullerol)
C60 OH n
[79]
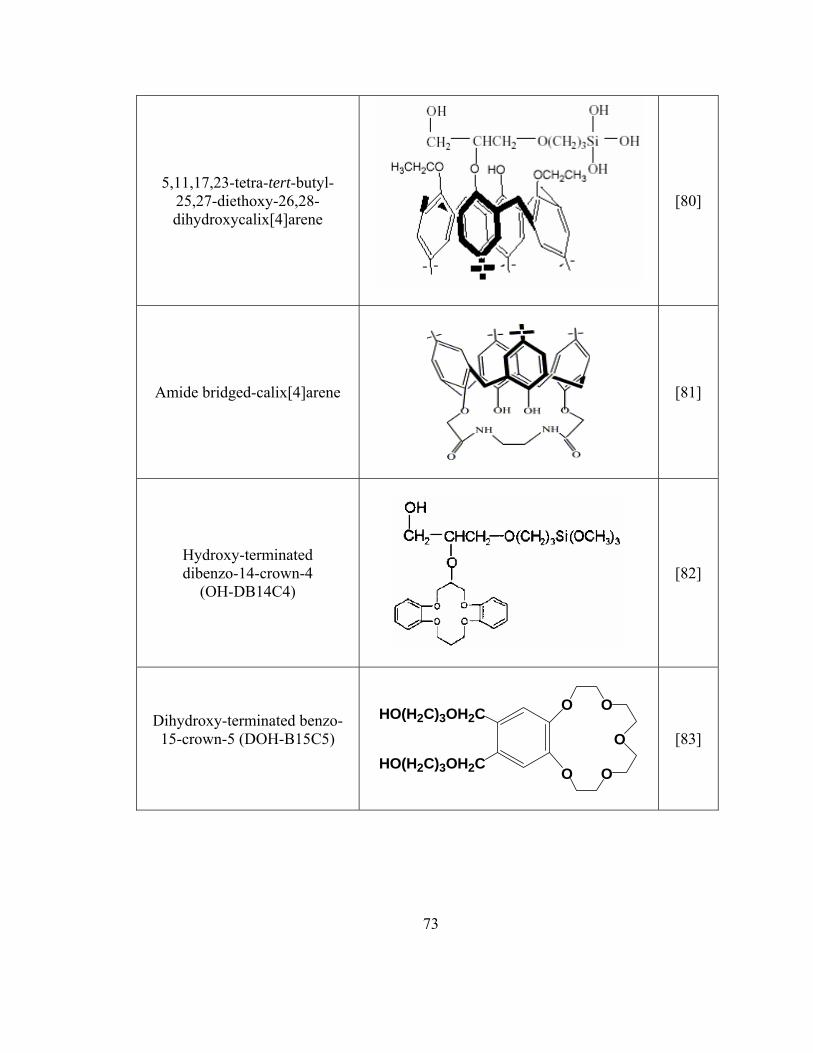
73
5,11,17,23-tetra-tert-butyl-25,27-diethoxy-26,28- dihydroxycalix[4]arene
[80]
Amide bridged-calix[4]arene
[81]
Hydroxy-terminated dibenzo-14-crown-4
(OH-DB14C4)
[82]
Dihydroxy-terminated benzo-15-crown-5 (DOH-B15C5)
O O
O
OOHO(H2C)3OH2C
HO(H2C)3OH2C
[83]
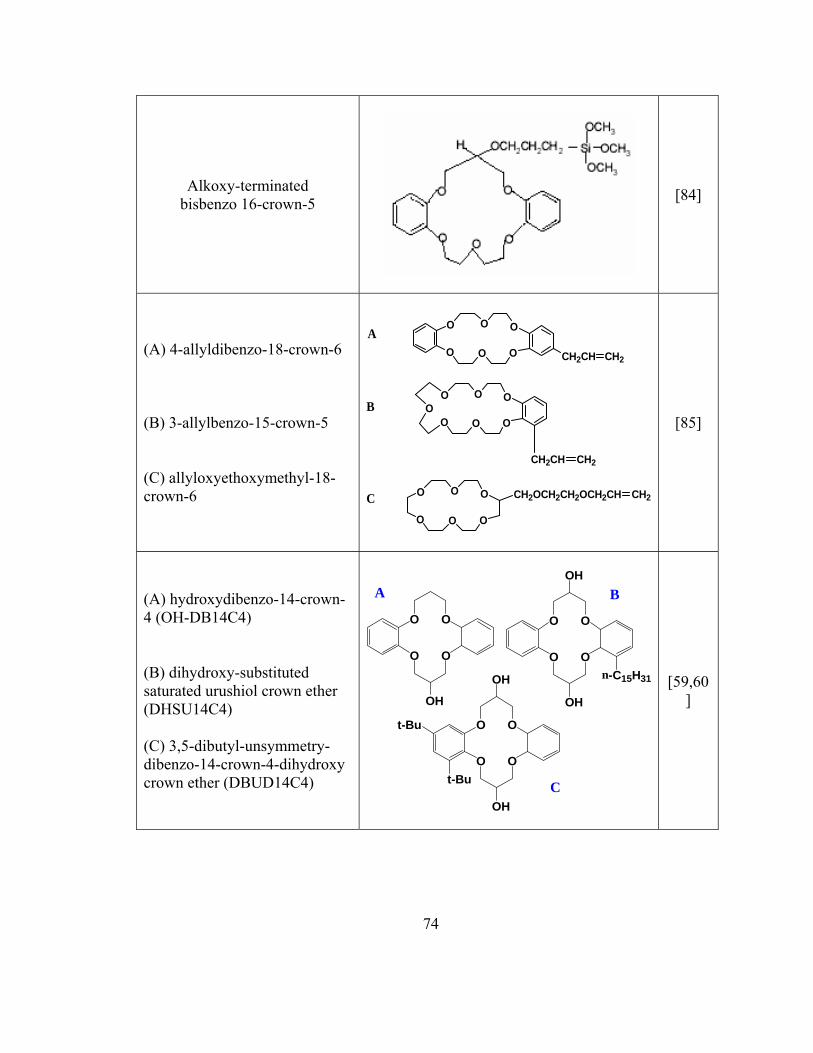
74
Alkoxy-terminated bisbenzo 16-crown-5
[84]
(A) 4-allyldibenzo-18-crown-6
(B) 3-allylbenzo-15-crown-5
(C) allyloxyethoxymethyl-18-crown-6
O
O
O
O
O
O
O
O
O
O
O
O CH2CH CH2
O
CH2CH CH2
O
O
O
O
O
O
CH2OCH2CH2OCH2CH CH2
A
B
C
[85]
(A) hydroxydibenzo-14-crown-4 (OH-DB14C4) (B) dihydroxy-substituted saturated urushiol crown ether (DHSU14C4) (C) 3,5-dibutyl-unsymmetry-dibenzo-14-crown-4-dihydroxy crown ether (DBUD14C4)
O
O
O
O
OH
OH
-C15H31n
O
O
O
O
OH
OH
t-Bu
t-Bu
O
O
O
O
OH
A B
C
[59,60]
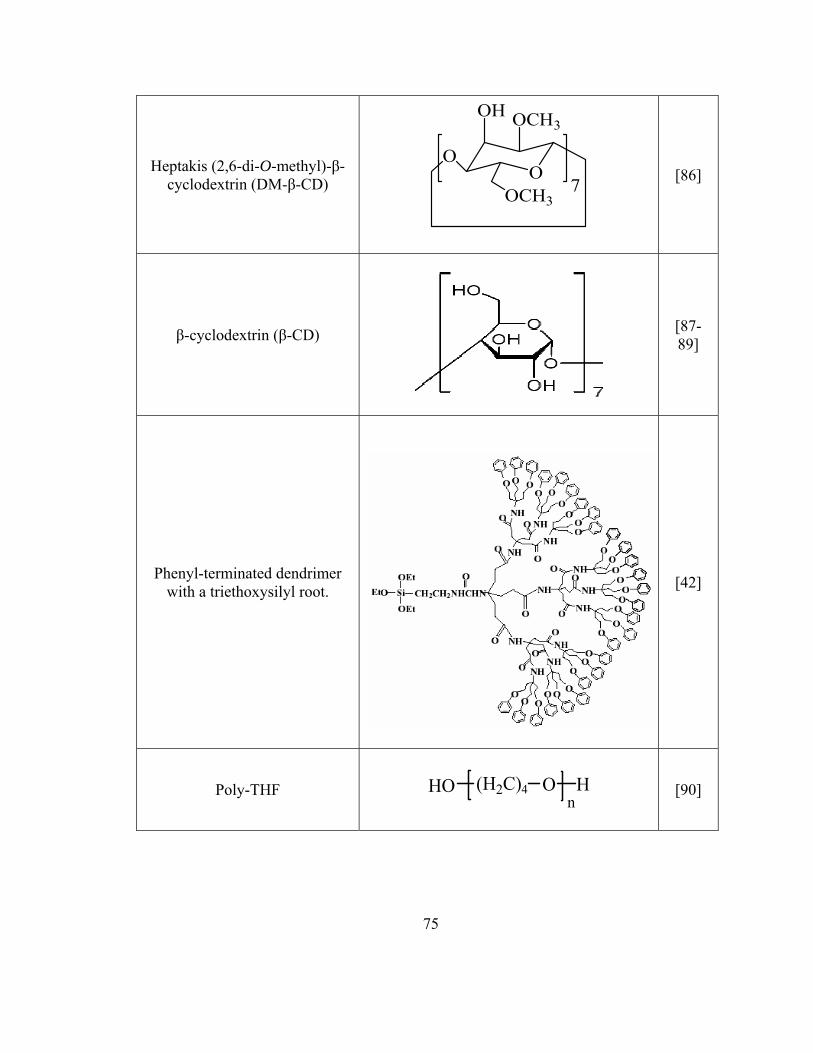
75
Heptakis (2,6-di-O-methyl)-β-cyclodextrin (DM-β-CD)
O
OH OCH3
OCH3
O7
[86]
β-cyclodextrin (β-CD)
[87-89]
Phenyl-terminated dendrimer
with a triethoxysilyl root.
[42]
Poly-THF
(H2C)4 OnHHO
[90]
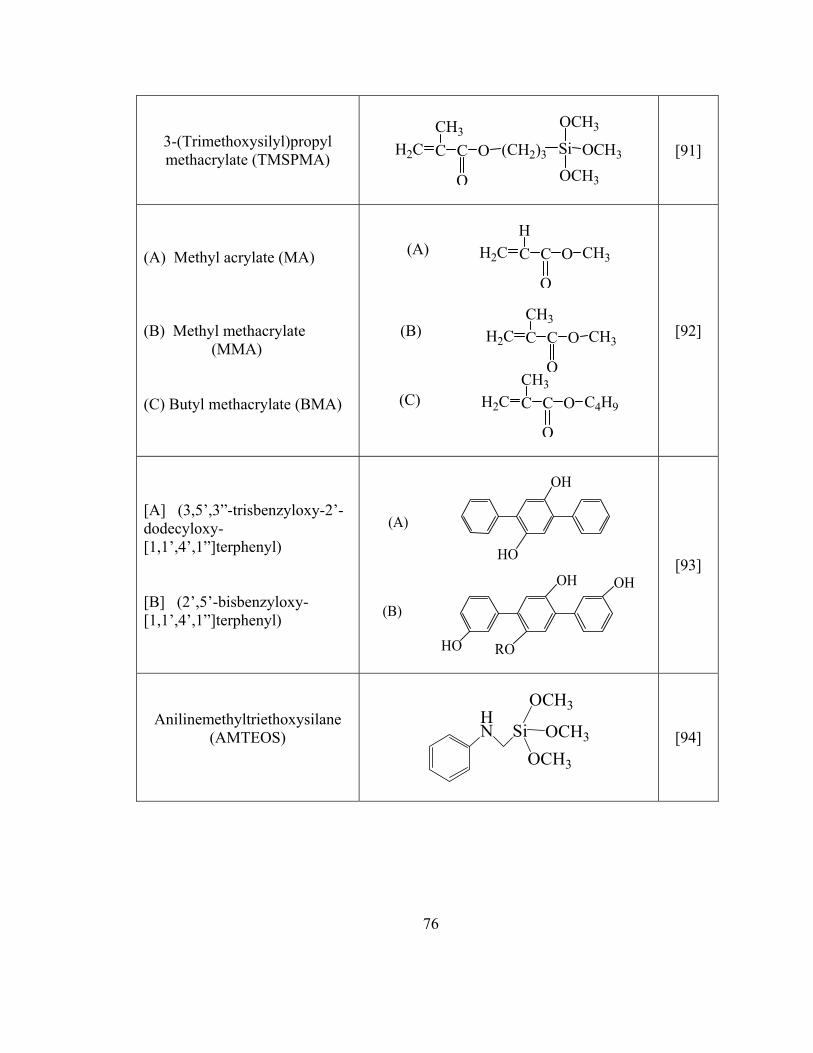
76
3-(Trimethoxysilyl)propyl methacrylate (TMSPMA)
H2C CCH3
C
O
O (CH2)3 Si
OCH3
OCH3
OCH3
[91]
(A) Methyl acrylate (MA) (B) Methyl methacrylate (MMA) (C) Butyl methacrylate (BMA)
H2C CH
C
O
O CH3(A)
H2C CCH3
C
O
O CH3(B)
H2C CCH3
C
O
O C4H9(C)
[92]
[A] (3,5’,3”-trisbenzyloxy-2’-dodecyloxy-[1,1’,4’,1”]terphenyl) [B] (2’,5’-bisbenzyloxy-[1,1’,4’,1”]terphenyl)
(A)
OH
HO
OH
ROHO
OH
(B)
[93]
Anilinemethyltriethoxysilane (AMTEOS)
HN Si
OCH3
OCH3
OCH3
[94]
77
2.5.1 Sol-gel PDMS and PDMDPS sorbents
In these sorbents, sol-gel active hydroxyl terminated PDMS or PDMDPS
polymers with surface methyl or phenyl groups have served as sol-gel extraction media.
Various precursors (alkoxides of Si, Ti, and Zr) have been successfully used for chemical
immobilization of PDMS [20,41,43] and PDMDPS [44] on the surface of fused silica
fiber (fiber-SPME) or inner surface of fused silica capillary (in-tube SPME or CME).
Chong and co-workers [20] were the first to use sol-gel approach to prepare
SPME fibers. Hydroxy-terminated PDMS along with sol-gel precursor
methyltrimethoxysilane (MTMOS) was reacted in presence of a sol-gel catalyst
(trifluoroacetic acid containing 5% water) to produce a hybrid organic-inorganic
polymeric network chemically bonded to the fused silica fiber surface. Due to the strong
chemical bonding to the substrate, the hybrid material provided exceptionally high
thermal and solvent stability. Moreover, the porous structure of the sol-gel coating
facilitated efficient mass transfer of analytes between the sorbent and aqueous media.
This, in turn, facilitated faster extraction equilibrium compared to conventional thick
PDMS coating which may take much longer time to reach the equilibrium. Due to the
porous structure, a sol-gel hybrid organic-inorganic material provides higher surface area.
Consequently, a relatively thin coating is sufficient to achieve an analyte detection limit
equal to or even lower than that achieved using conventionally coated sorbents. As
indicated by the result obtained for BTEX analysis, an order of magnitude lower
detection limit has been accomplished by the sol-gel PDMS coating, even though
78
thickness was two-fifth of the conventional PDMS coating [20].
Bigham and co-workers [41] demonstrated use of PDMS sol-gel coatings in CME
(or in-tube SPME). They also demonstrated superior performance of sol-gel based PDMS
coatings in direct extraction of organic analytes from aqueous media compared to
conventional PDMS coatings. Later, Kim and co-workers [43] developed a high pH
resistant, surface bonded sol-gel titania-PDMS coating and demonstrated its application
in CME coupled with HPLC for on-line extraction of PAHs, BETX and ketones. On the
other hand, Alhooshani and co-workers [44] reported a sol-gel hybrid zirconia-PDMDPS
coating for CME of PAHs, aldehydes, ketones coupled with GC-FID.
2.5.2 Sol-gel PDMS-PVA sorbents
Lopes and co-workers [76] prepared a composite sol-gel sorbent using PDMS and
poly (vinyl alcohol) (PVA) as organic moieties. Polyvinyl alcohol was incorporated in
the growing sol-gel network via polycondensation and acted as a strong cross-linking
agent. The thermal stability of the composite phase was found to be superior compared to
sol-gel PDMS sorbent. The improved thermal stability of sol-gel PDMS-PVA was
attributed to the additional cross-linking provided by the PVA in the reaction mixture.
The enhanced thermal stability of SPME sorbents is extremely desirable because higher
thermal stability of the sorbents can extend applicability of SPME toward higher-boiling
compounds. Moreover, bleeding from the fiber coating during the thermal desorption (in
GC injection port) is less likely to happen. Sol-gel PDMS-PVA showed better affinity
79
towards polychlorinated biphenyl (PCBs) compared with sol-gel PDMS coating [76].
Later experiments have also demonstrated the applicability of sol-gel PDMS-PVA
sorbent for SPME of organochlorine pesticides and organophosphorous pesticides [95].
2.5.3 Sol-gel PDMS-PMPVS sorbents
Yang and co-workers [77] have described preparation of sol-gel PDMS-PMPVS
coated SPME fibers. Briefly, sol solution prepared by mixing 40 mg of PMPVS, 90 mg
of hydroxyl-terminated silicon oil (OH-TSO), 100 µL of TEOS, 50 µL of VTEOS, 10 mg
of PMHS and 8 mg benzophenone, 400 µL of methylene chloride and 120 µL of TFA
(5% water) was used to coat SPME fiber. Instead of using single precursor, TEOS,
another precursor vinyltriethoxysilane (VTEOS) was also used in conjunction with TEOS.
Upon exposure to ultraviolet light, vinyl groups present in VTEOS and PMPVS reacted
to form cross-links in presence of benzophenone (a free-radical initiator). Due to its
inherent multifunctional composition and advantages of sol-gel chemistry [19,20], sol-gel
PDMS-PMPVS coatings showed superior efficiency for extraction of aromatic
compounds (e.g., PAHs, BTEX etc.) compared commercial PDMS and PA coated SPME
fibers. Sol-gel PMPVS coating was characterized by good thermal stability (350 °C),
long life time, and high extraction efficiency. Later same researchers [96,97] used same
coating for analysis of organophosphorus pesticides.
80
2.5.4 Sol-gel PDMS-DVB sorbents
Liu and co-workers [78] developed a sol-gel based sorbent using OH-TSO and
divinylbenzene (DVB) polymers for selective extraction of phosphates and
methylphosphonates from air and water samples. Sol solution was prepared by
thoroughly mixing 180 µL of DVB, 60 mg of OH-TSO, 50 µL of VTEOS, 10 mg of
PMHS, 8 mg benzophenone, 100 µL of methylene chloride and 70 µL trifluoroacetic acid
(with 5% water, v/v). In order to prepare the coating, fused silica fibers were dipped into
the sol solution and kept there for 30 min. When the coating was completed, the fibers
were irradiated under ultraviolet light for 30 min. Finally, the fiber was thermally
conditioned up to 380 °C under nitrogen flow. A comparison was made between sol-gel
PDMS-DVB and commercial SPME coatings (PDMS, PA, and PDMS-DVB). Among all
the phases compared, sol-gel PDMS-DVB coating showed the best extraction efficiency.
Sol-gel PDMS-DVB coating was characterized by very high thermal stability. After
heating up to 380 °C, no noticeable loss in extraction efficiency was observed. As a result
of high thermal stability, it provided higher desorption temperature for analytes with high
boiling points, and also eliminated sample carryover still considered to be a common
problem for commercial coatings.
Same researchers [98] also synthesized hydroxy-terminated silicone oil-Bu
methacrylate-divinylbenzene (OH-TSO-BMA-DVB) copolymer and prepared sol-gel
OH-TSO-BMA-DVB coating for SPME. It showed high extraction efficiency for both
polar alcohols and fatty acids and nonpolar esters compared to commercial PDMS,
PDMS-DVB and PA coated SPME fibers.
81
2.5.5 Sol-gel PDMS-fullerene sorbents
Fullerenes are closed-cage carbon molecules containing pentagonal and
hexagonal rings. Because of their inherent properties like high hydrophobicity, high
thermal stability, resistance to oxidation, and the capability of strong (π-π and donor-
acceptor) interactions with various organic compounds have made it a very promising
SPME sorbent [79].
Yu and co-workers [79] developed a sol-gel SPME coating using
hydroxyfullerene (fullerol) with OH-TSO. Sol-gel hydroxyfullerene coated SPME fibers
were conditioned at as high as 360 °C for 5 hours. The high thermal and solvent stability
was attributed to the strong chemical bonding of the sorbent to the fused silica fiber, as
well as the excellent thermal stability of the participating organic ingredients (fullerol).
Also, the porous structure of the fullerene based sol-gel coatings facilitated faster mass
transfer between the sorbent and aqueous media, which aided establishment of extraction
equilibrium significantly faster than commercial coatings. For example, polychlorinated
biphenyls (PCBs) extracted on sol-gel PDMS-fullerol SPME coating required only 50
min to reach extraction equilibrium compared to a commercial PDMS coating which
required several days to reach equilibrium [99]. Sol-gel PDMS-fullerol coatings were
also used to aromatic amines. The results revealed that sol-gel PDMS-fullerol coatings
are not only suitable for non polar compounds but also very efficient in extracting polar
analytes.
82
2.5.6 Sol-gel PDMS-calix4arene sorbents
Calixarenes are cyclic oligomers prepared from the reaction of phenols and
aldehydes [100]. Since they possess a molecular cavity of cylindrical architecture similar
to that of cyclodextrins, they can form inclusion complexes. The unique characteristics of
calixarenes such as small molecular size, good film forming properties, excellent thermal
stability, and presence of functional groups to interact with analytes have made them
promising candidates for being used in SPME sorbents [80].
Zeng and co-workers [80] developed calixarene based sol-gel sorbents for SPME.
These researchers synthesized 5,11,17,23-tetra-tert-butyl-25,27-diethoxy-26,28-
dihydroxycalix[4]arene and utilized it as a new SPME sorbent. Sol-gel approach was
followed to prepare a coating on a fused silica fiber using synthesized calix[4]arene as an
organic components, OH-TSO as a sol-gel active polymer, 3-(2-
cyclooxypropoxyl)propyltrimethoxysilane (KH-560) and TEOS as sol-gel precursors,
poly(methylhydrosiloxane) (PMHS) as deactivating reagent, and trifluoroacetic acid
(TFA) (with 5% water, v/v) as the sol-gel catalyst. OH-TSO was added along with
calix[4]arene in the sol solution in order to increase the surface area of the coating.
Several SPME fibers with different amount of calix[4]arene were prepared. All the sol-
gel calix[4]arene coatings showed excellent thermal stability (380 °C). Since
calix[4]arene contains phenyl termination as well as a cavity in its structure, it is expected
to exhibit high selectivity toward non polar aromatic compounds due to π-π interaction,
hydrophobic interactions and cavity-shaped cyclic molecular structure. Moreover, such
coatings should efficiently extract polar aromatic amines through hydrogen bonding and
83
dipole-dipole interactions. As was expected, calix[4]arene coatings demonstrated very
high efficiency in extracting both non polar (BTEX, PAHs) and polar (aromatic amines)
analytes.
Later experiments, carried out using the same coating, demonstrated higher
extraction efficiency than commercial PDMS-DVB and PA coated SPME fibers for
extraction of chlorophenols [101]. They also utilized the same sol-gel calix[4]arene
sorbent for the determination of phthalate acid esters plasticizers in polymeric materials
[102]. Phthalic acid esters (PAEs) (the most commonly used additives in plastic) have
been classified as priority pollutants by US Environmental Protection Agency (EPA)
[103]. Therefore, a simple, low cost and rugged method for determining PAEs in water is
necessary. The sol-gel coated calix[4]arene SPME fibers were employed to determine the
contents of phthalate ester-based plasticizers in blood bags, transfusion tubing, food
packaging bag, and mineral water bottle. Relative affinity of PAEs were investigated by
employing sol-gel calix[4]arene and three commercially available fibers (PDMS, PA, and
PDMS/DVB). The results unequivocally demonstrated the superiority of sol-gel
calix[4]arene sorbent among all four phases tested.
Zeng and co-workers [81] also utilized 25,27-dihydroxy-26,28-oxy (2΄,7΄-dioxo-
3΄,6΄-diazaoctyl)oxy-p-tert-butylcalix[4]arene (amide bridged calix[4]arene) to make sol-
gel amide bridged calix[4]arene sorbent for headspace SPME of underivatized aliphatic
amines from aqueous solution. The developed sol-gel amide bridged calix[4]arene SPME
coatings showed all attributes of (e.g., high thermal stability (~ 380 °C), solvent stability,
long life span, as well as highly porous surface morphology) previously reported sol-gel
84
calix[4]arene SPME coatings [80]. Owing to the introduction of the polar amide bridge in
calixarene molecules, the polarity of the coating increased. As a consequence, these
coatings exhibited better sensitivity to most of the investigated aliphatic amines
compared to commercial polar coatings PDMS/DVB and PA.
Recently, same researchers developed a novel SPME fiber coated with sol-gel
(5,11,17,23-tetra-tert-butyl)-25,27-dihydroxy-26,28-diglycidyloxycalix[4]arene/hydroxy-
terminated silicone oil (diglycidyloxy-C[4]/OH-TSO) and used it for determination of
nine chlorobenzenes in soil matrices [104]. Chlorobenzenes are used in large quantities as
industrial solvents, pesticides, dielectric fluids, deodorants and chemical intermediates.
Due to their widespread use over several decades, chlorobenzenes have become very
common in the environment. They are found in water, soil, sediments, and sewage sludge
[105,106]. These compounds have high octanol–water partition coefficients [107],
therefore biological accumulation can be expected in the aquatic ecosystem. Due to their
acute toxicity [108] and the potential danger they pose to the environment [109], it is very
important to monitor these compounds. The sol-gel diglycidyloxy-C[4]/OH-TSO coated
SPME fiber used for the extraction of chlorobenzenes showed a better extraction
capability than the coatings made with only OH-TSO. Also, comparison between sol-gel
diglycidyloxy-C[4]/OH-TSO coated SPME fiber with those of commercial PDMS and
PDMS-DVB coated fibers showed that the sol-gel diglycidyloxy-C[4]/OH-TSO coated
fiber had the highest chlorobenzene extraction efficiency among these fibers. The high
extraction capability of the diglycidyloxy-C[4]/OH-TSO fiber towards these compounds
was attributed to the π–π interactions, the hydrophobic interactions and some other
85
specific interactions such as inclusion complexes in the cavities formed by the
supramolecules. Using sol-gel diglycidyloxy-C[4]/OH-TSO coatings, detection limits
were found at sub-ng/g in HS-SPME-GC-ECD experiments, which were about an order
of magnitude lower than those given by the commercial PDMS coating for most of the
compounds.
2.5.7 Sol-gel PDMS-crown ether sorbents
Crown ethers are cyclic carbon compounds containing hetero atoms such as
oxygen, nitrogen and sulfur. They are characterized by a cavity structure, medium
polarity and strong electronegative effect of hetero atoms on the crown ether ring. Table
3.3 (add figure of ref 31 in the table) lists most common crown ether based polysiloxane
sorbents used in SPME.
Zeng and coworkers [59] proposed a sol-gel based approach to coat SPME fibers
with hydroxyl-terminated dibenzo-14-crown-4 crown ethers (OH-DB14C4) and
successfully utilized them in phenol analysis. Sol solution was prepared by mixing 8 mg
of OH-DB14C4, 90 mg of OH-TSO, 10 mg of PMHS, 100 µL of TEOS, 50 µL of 3-(2-
Cyclooxypropoxyl)propyltrimethoxysilane (KH-560), and 100 µL of methylene chloride
solvent. The so-gel reactions were catalyzed by adding 80 µL of TFA (with 5% water,
v/v). Due to the limited solubility of OH-DB14C4, lower concentrations of OH-DB14C4
were used in sol-gel coating solution. Comparison of distribution constants (K) of various
phenols between aqueous phase and SPME coatings prepared with different amounts of
86
OH-DB14C4 (0 mg, 4 mg, 8 mg) showed distribution constants (K) values increased with
the increase in the amount of added OH-DB14C4. Sol-gel coated OH-TSO/OH-DB14C4
SPME fibers were characterized by high thermal stability. No apparent loss in extraction
efficiency was observed even after being heated at 350 °C and also after 150 times
repeated extractions.
Same researchers also used previously reported [59] sol-gel approach to make
SPME coatings using dihydroxy-substituted saturated urushiol crown ether (DHSU14C4)
and dibutyl-unsymmetric-dibenzo-14-crown-4-dihydroxy crown ether (DBUD14C4) [60]
and investigated their selectivity toward aromatic amines. Five different coatings (OH-
DB14C4/OH-TSO, DHSU14C4/OH-TSO, DBUD14C4/OH-TSO, OH-TSO, and OH-
DB14C4) were employed to compare the selectivity of different crown ethers toward
aromatic amines. The results suggested that OH-DB14C4/OH-TSO had the highest
extraction efficiency. Among the three sol-gel crown ether coatings, extraction efficiency
decreased with increasing number of alkyl groups (no alkyl group> n-C15H31> t-Bu)
attached to the crown ether ring attributed to the decreased polarity of the coatings and
increased steric hindrance. Among all the coatings tested, sol-gel OH-DB14C4 (with no
OH-TSO) had the lowest extraction efficiency indicating the presence of OH-TSO in the
sol-gel structure helped the sorbent coating to spread uniformly onto the fused silica
substrate.
Although sol-gel OH-DB14C4/OH-TSO has been proved to be a superior coating,
compared with commercial coatings it has relatively low polarity coating [110,111]. In
addition, its low solubility in sol solution limits the concentration of OH-DB14C leading
87
to low sample capacity [59]. In order to eliminate the inherent shortcoming of smaller
crown ether, Wang and co-workers [83] synthesized dihydroxy-terminated benzo-15-
crown-5 (DOH-B15C5) possessing bigger ring size and higher polarity compared to that
of smaller OH-DB14C4. Sol-gel SPME coatings were made using various amounts of
DOH-B15C5 (0 mg, 10 mg, and 20 mg) along with 90 mg of OH-TSO, 10 mg of PMHS,
100 µL of TEOS, 200 µL of methylene and 80 µL TFA (with 5% water, v/v). Evaluation
of the thermal stability of these coatings showed that sol-gel coating with no (0 mg)
DOH-B15C5 added in the sol-gel coating solution cracked at 300 °C. On the other hand,
SPME coatings made with 10 mg and 20 mg of DOH-B15C5 in the sol-gel coating
solution intact even after conditioned at 350 °C. Also the selectivity study showed,
compared to commercial SPME coatings (100 µm PDMS and 85 µm PA), sol-gel DOH-
B15C5 (67 µm) SPME coating had highest efficiency for the extraction of phenols. The
excellent extraction efficiency of sol-gel DOH-B15C5 was attributed to enhanced surface
area as well as sample capacity and hydrogen-bonding between the crown ether and
phenolic compounds. Sol-gel DOH-B15C5/OH-TSO coating has also been used for trace
analysis of organochlorine pesticides (OCPs) in water [112].
Oganophosporuos pesticides (OPPs) have long been considered as a health and
environmental hazard due to its toxicity and ubiquity in nature. Consequently, there is
always a great demand for an analytical method that is cheap, simple, fast, and highly
sensitive that would ease the monitoring of trace levels of OPPs in water, food and other
matrices. Yu and co-workers [84] synthesized allyloxy bisbenzo 16-crown-5
trimethoxysilane and used it as a precursor to prepare sol-gel bisbenzo crown ether/OH-
88
TSO coating for SPME. Unlike other silicon oil based mixed sorbent systems where the
loading of a organic moiety is limited by its low solubility and translates into poor to
moderate impact on the selectivity of the composite sorbent, allyloxy bisbenzo 16-crown-
5 trimethoxysilane is highly soluble in sol solution ingredient and can be added to OH-
TSO in a greater ratio. Sol solution contained 75 mg of allyloxy bisbenzo 16-crown-5
trimethoxysilane, 90 µL of OH-TSO, 50 µL TEOS, 10 µL of PMHS, 300 µL of
methylene chloride and 80 µL TFA (5% water). These sorbents demonstrated very high
thermal stability (350 °C). Furthermore, no significant change in extraction sensitivity
was observed from subsequent extractions of OPPs using sol-gel crown ether coating
even after being washed with different solvents (e.g., n-hexane, methylene chloride,
acetone, and distilled water) for 1 hour. The extraordinary thermal and solvent stability of
the sol-gel crown ether coating was attributed to its strong chemical bonding to the fused
silica fiber.
Aliphatic amines are ubiquitous in nature due to their widespread use in industry
as well as biodegradation products of organic compounds like proteins and amino acids
or other nitrogenous compounds. Due to their toxicity and hazardous nature, low-
molecular-mass amines are considered to be important air pollutants. Moreover,
secondary aliphatic amines are assumed to react with nitrile to form carcinogenic
nitrosamines [113]. Therefore, analysis of aliphatic amines at trace levels in biological
fluids, air, and water is of great interest. Cai and co-workers [85] used sol-gel coatings
made from three different crown ethers: 4-allyldibenzo-18-crown-6 (DB18C6), 3΄-
allylbenzo-15-crow-5 (B15C5), and allyloxyethoxymethyl-18-crown-6) (PSO18C6).
89
They compared the performance of these sol-gel crown ether coatings with commercial
PDMS and PA SPME coatings. The coating thicknesses of three sol-gel coatings
DB18C6, B15C5, and PSO18C6 were 80-, 84-, and 82 µm, respectively. The thicknesses
of two commercial coatings, PDMS and PA, were 100 and 85 µm, respectively. The
extraction efficiencies of all five coatings were compared by extracting derivatized
aliphatic amines under identical conditions. The results indicated that sol-gel DB18C6
and B15C5 had higher extraction efficiencies than sol-gel PSO18C6. The presence of
benzyl group in these crown ether was thought to be responsible for higher extraction of
aliphatic amines by π-π interactions with derivatized amines. Particularly, the symmetric
benzyl groups and greater number of oxygen atoms in the crown ether ring in sol-gel
DB18C6 results in stronger π-π interactions between the coating and the derivatized
amines, and therefore, made this coating most efficient among all five coatings employed
in this investigation [85]. Moreover, the extraction efficiencies of two commercial
coatings (PDMS and PA) were lower than the crown ether coatings, PDMS having the
lowest. Enhanced surface area and sample capacity provided by sol-gel coating
technology is one factor that helped achieve this enhanced extraction sensitivity.
Later same researchers used previously reported [85] sol-gel crown ethers for
SPME of OPPs. They found sol-gel B15C5 coating with higher polarity had the best
selectivity for OPPs [114].
90
2.5.8 Sol-gel cyclodextrin sorbents
Cyclodextrins (CDs) and their derivatives have long been used as
chromatographic stationary phases especially in chiral separations [115] due to their
unique properties, in particular, presence of a chiral cavity, the shape and size selectivity
as well as its ability to form inclusion compounds with various analytes. Considering the
positive attributes of cyclodextrins as chromatographic stationary phases, Fan and co-
workers [87] developed a sol-gel method for preparing sol-gel β-CD coating for in-tube
SPME coupled to HPLC for the determination of non-steroidal anti-inflammatory drugs
in urine samples. In order to prepare the sol solution, 0.1 mL TEOS was added to 0.1 mL
0.01 M HCl and stirred at 60 °C until became homogeneous. Another solution was made
using 0.05 g 3-glycidoxypropyltrimethoxysilane (KH-560) derivatized β-CD dissolved in
0.3 mL acetonitrile and 0.5 mL 0.01M HCl. Both solutions were mixed thoroughly and
centrifuged. The resulting sol solution was used to coat the inner surface of capillary.
After desired coating thickness was achieved the capillary was aged for 48 hours. Later, a
60 cm piece of sol-gel cyclodextrin coated capillary was used for in-tube SPME of urine
samples. Hu and co-workers [88,89] showed use of poly(dimethylsiloxane)/β-
cyclodextrin (PDMS/ β-CD) coating membrane for SPME of PAHs, amines and phenols.
Recently, Zhou and co-workers reported [86] fiber coated with β-cyclodextrin
derivatives. The sol solution contained 30 mg of Heptakis (2,6-di-O-methyl)-β-
cyclodextrin (DM-β-CD) 150 µl of methylene chloride, 90 mg of OH-TSO, 100 of TEOS,
50 µl KH-560, 10 mg of PMHS and 100 µl TFA (with 5% water,v/v). The coating
thickness of DM-β-CD/OH-TSO fiber was 65 µm. DM-β-CD/OH-TSO coated fibers
91
were used for HS-SPME of ephedrine (EP) and methamphetamine (MP) in human urine.
Detection limits of 0.33 ng/ml for EP and 0.60 ng/ml for MP were achieved in HS-
SPME-GC experiments.
2.5.9 Sol-gel dendrimer sorbent
Dendrimers [116,117] are highly branched macromolecules created in a step-wise
fashion using simple branched monomeric units, the nature and functionality of which
can be easily controlled and varied. They possess open and vacuous structures
characterized by channels and pockets which are especially true for higher generations
[118]. Because of their tree-like branched architecture, functionalized dendrons are ideal
candidates for sorbents to be used in analytical sample enrichment and separations.
Dendrimers have been used as: (a) pseudo-stationary phases in electrokinetic
chromatography [119,120], (b) bonded stationary phases in capillary
electrochromatography [121], (c) chiral stationary phases in HPLC [122], and (d) GC
stationary phases [123]. Kabir and co-workers [42] introduced sol-gel dendrimers as
sorbent in CME for solvent-free microextraction of both polar and nonpolar analytes
from aqueous samples. The sol solution contained 5 µL of MTMOS, 50 mg of phenyl-
terminated dendrimer with a triethoxysilyl containing root, 10 µL of HMDS, 25 µL of
PMHS, and 50 µL of TFA in 900 µL of dichloromethane solvent. After filling, the sol
solution was kept inside the capillary for 30 min to facilitate the formation of a surface-
bonded sol–gel dendrimer coating. The free unbonded portion of the sol solution was
92
later expelled from the capillary under helium pressure (50 psi) and the coated capillary
was purged with helium for an hour. The coating thickness was estimated at 0.5 µm.
Detection limits on the order of ng/L were achieved for the extraction of both polar and
nonpolar analytes including PAHs, aldehydes, ketones, phenols, and alcohols in CME–
GC–FID experiments using sol–gel dendrimer-coated microextraction capillaries.
2.5.10 Sol-gel poly-THF sorbent
Poly-THF (also called polytetramethylene oxide, PTMO) is a hydroxy-terminated
polar material that has been used as an organic component to synthesize organic–
inorganic hybrid materials [124-126]. Sol–gel poly-THF has been used as bioactive bone
repairing material [127], and as a proton conducting solid polymer electrolyte that might
allow the operation of high temperature fuel cells [128].
Kabir and co-workers [90] first described a sol-gel chemistry-based approach for
in situ creation poly-THF based hybrid organic-inorganic CME coatings on the inner
walls of fused silica capillaries. The sol-gel coating was created on the inner walls of a
fused silica capillary using a sol solution containing poly-THF (250 mg) as an organic
component, MTMOS (20 µL) as a sol-gel precursor, TFA (100 µL) (with 5% water, v/v)
as a sol–gel catalyst, and HMDS (20 µL) as a deactivating reagent. In CME-GC-FID
experiments, pictogram/liter (pg/L) level detection limits were reported for the analytes
of different polarity including PAHs, aldehydes, ketones, chlorophenols, and alcohols
extracted from aqueous samples using sol–gel poly-THF coated microextraction
93
capillaries.
2.5.11 Miscellaneous sol-gel sorbents
In addition to the aforementioned sorbents, miscellaneous sol-gel chemistry-based
sorbents have been reported in the literature.
Liu and co-workers [129] used 3-(Trimethoxysilyl)propyl methacrylate
(TMSPMA) to prepare the sol-gel-derived TMSPMA-hydroxyl-terminated silicone oil
(TMSPMA-OH-TSO) extracting sorbent for HS-SPME of aroma compounds in beer.
TMSPMA, which contains both methacrylate and alkoxysilane groups, served as a
bifuntional reagent. Sol-gel TMSPMA-OH-TSO (a medium polarity coating) was very
effective in carrying out simultaneous extraction of both polar (alcohols, fatty acids) and
nonpolar (esters) analytes in beer. The extraction temperature, extraction time, and ionic
strength of the sample matrix were modified to allow for maximum sorption of the
analytes onto the sol-gel TMSPMA-OH-TSO coated fiber. The extraction efficiency of
sol–gel-derived TMSPMA-OH-TSO fiber was found to be much better than PDMS,
PDMS-DVB and PA coated commercial SPME fibers. They also [92] described three
types of novel acrylate/silicone co-polymer coatings: (1) co-poly(methyl
acrylate/hydroxy-terminated silicone oil) (MA/OH-TSO), (2) co-poly(methyl
methacrylate/OH-TSO) (MMA/OH-TSO), and (3) co-poly(butyl methacrylate/OH-TSO)
(BMA/OH-TSO) prepared using sol-gel technology and subsequently applied to HS-
SPME of 2-chloroethyl ethyl sulfide (CEES), a surrogate of mustard, in soil. Among the
94
three kinds of acrylate/silicone coated SPME fibers, the sol-gel-derived BMA/OH-TSO
coating had the highest affinity for CEES. Sol-gel-derived BMA/OH-TSO coatings were
also used for HS-SPME of medium and long chain fatty acids after derivatization and
applied to the analysis of fatty acids in lung tissues by coupling to GC–MS [130]. The
experimental parameters for derivatization, HS-SPME, and desorption were optimized.
Fatty acids in cancerous lung tissues from five patients with lung cancer were determined
under the optimized conditions. Normal lung tissues from the same five patients were
used as controls. The sol-gel BMA/OH-TSO coatings showed higher extraction
efficiency for fatty acids after derivatization when compared with commercial PDMS and
PDMS/DVB coated fibers. The higher extraction efficiency was attributed to the three-
dimensional network in the sol-gel BMA/OH-TSO coating. Later same researchers [131]
presented a novel alumina-based hybrid organic-inorganic sol-gel coating for SPME.
Compared to the sol-gel silica-based coating, the alumina-based coating demonstrated
excellent pH stability. In addition, developed coatings possessed good thermal stability
and coating preparation reproducibility. Practical applicability of the prepared alumina-
OH-TSO fiber was demonstrated through the analysis of volatile alcohols and fatty acids
in beer.
Basheer and co-workers [93] synthesized hydrophilic (3,5’,3”-trisbenzyloxy-2’-
dodecyloxy-[1,1’,4’,1”]terphenyl) and amphiphilic (2’,5’-bisbenzyloxy-
[1,1’,4’,1”]terphenyl) oligomers and coated them on fused silica fibers using a sol-gel
technique. The extraction efficiency of the sol–gel coatings was evaluated for the
extraction of both non-polar and polar analytes, including organochlorine pesticides,
95
triazine herbicides, estrogens and alkyl phenols (APs) and bisphenol-A (BPA). Compared
with commercially available SPME sorbents such as PDMS-DVB and PA, the new
materials showed comparable selectivity and sensitivity towards both non-polar and polar
analytes. The new coatings gave good linearity and detection limits. For example with
triazines, a detection limit of < 0.005 µg/L, precision from 5.0 to 11.0% (n = 6) and
linearity of the calibration plots (0.5 to 50 µg/L) were obtained.
Hu and co-workers [132] reported sol–gel derived anilinemethyltriethoxysilane-
polydimethylsiloxane (AMTEOS/PDMS) sorbents for SPME. The sol-gel
AMTEOS/PDMS coating was designed to aim at π–π interaction between the aromatic
compounds and the phenyl group in the sol–gel network. The novel SPME fiber showed
high extraction efficiency, good thermal stability and long lifetime compared with
commercial SPME coating (PDMS) for the extraction of monocyclic aromatic
hydrocarbons (MAHs) and PAHs. LODs were between for MAHs 0.6 - 3.8 µg/L and 0.2
- 1.5 µg/L for PAHs.
96
2.6 References to chapter 2
[1] C. Brinker, G. Scherer, Sol–Gel Science. The Physics and Chemistry of Sol–Gel Processing, Academic Press, San Diego, CA, 1990.
[2] M. Ebelmen, Ann. Chim. Phys. 15 (1845) 319.
[3] M. Ebelmen, Ann. Chim. Phys. 16 (1846) 129.
[4] M. Ebelmen, Comptes. Rend. de l'Acd des Sciences 25 (1847) 854.
[5] D.I. Mendeleyev, Khim. Zhur. Sok. i. Eng. 4 (1860) 65.
[6] C.B. Hurd, Chem. Rev. 22 (1938) 403.
[7] W. Geffcken, E. Berger, in, German Patent, 1939.
[8] R. Roy, J. Am. Ceram. Soc. 39 (1956) 145.
[9] R. Roy, J. Am. Ceram. Soc. 52 (1969) 344.
[10] W. Stober, A. Fink, E. Bohn, J. Colloid. Interface. Sci. 26 (1968) 62.
[11] H. Dislich, Angew Chem. 10 (1971) 363.
[12] L. Levene, I.M. Thomas, in, U.S. Patent 3,640,093, 1972.
[13] J.D. Mackenzie, J. Sol-Gel. Sci. Technol. 26 (2003) 23.
[14] H. Schmidt, J. Non-Cryst. Solids 73 (1985) 681.
[15] H. Schmidt, Mater. Res. Soc. Symp. Proc. 32 (1984) 327.
[16] H.J. Cortes, C.D. Pfeiffer, B.E. Richter, T.S. Stevens, J. High Resolut. Chromatogr. Chromatogr. Commun. 10 (1987) 446.
[17] A.L. Crego, J.C. Diez-Masa, M.V. Dabrio, Anal. Chem. 65 (1993) 1615.
[18] Y. Guo, L.A. Colon, Anal. Chem. 67 (1995) 2511.
[19] D. Wang, S.L. Chong, A. Malik, Anal. Chem. 69 (1997) 4566.
97
[20] S.L. Chong, D. Wang, J.D. Hayes, B.W. Wilhite, A. Malik, Anal. Chem. 69 (1997) 3889.
[21] H. Minakuchi, K. Nakanishi, N. Soga, N. Ishizuka, N. Tanaka, J. Chromatogr. A
762 (1997) 135. [22] N. Ishizuka, H. Minakuchi, K. Nakanishi, N. Soga, H. Nagayama, K. Hosoya, N.
Tanaka, Anal. Chem. 72 (2000) 1275. [23] N. Tanaka, H. Kobayashi, K. Nakanishi, H. Minakuchi, N. Ishizuka, Anal. Chem.
73 (2001) 420A. [24] M.I. Sarwa, Z. Ahmad, Eur. Polym. J. 36 (2000) 89.
[25] C. Tilgner, P. Fischer, F.M. Bohnen, H. Rehage, W.F. Maier, Microporous Mater. 5 (1995) 77.
[26] S.S. Kistler, J. Physical Chem. 36 (1932) 52.
[27] H. Schmid, A. Kaiser, M. Rudolph, A. Lentz, Science of Ceramic Chemical Processing, Wiley, NY, 1986, p.87.
[28] T. Ogoshi, Y. Chujo, Compos. Interfaces 11 (2005) 539.
[29] S. Sakka, K. Kamiya, in Proc. Ing. Symp. Factors Densification Sintering Oxide Non-Oxide Ceram, Gakujutsu Bunken Fukyu-kai, Tokyo, Japan, 1979, p. 101.
[30] P.B. Dorain, J.J. Rafalko, J.E. Feeney, C.E. Forbes, R.V. Carney, T.M. Che, in
Materials Research Society Symposium, MA, USA, 1988, p. 523. [31] W. Jost, H.E. Hauck, in F.Z.S.G. Shuomingshu (Editor), CHINA, 1987, p. 17.
[32] M.T. Harris, R.R. Brunson, C.H. Byers, J. Non-Cryst. Solids 121 (1990) 397.
[33] T. Yamamoto, M. Mori, T. Maeda, in J.K.T. Koho (Editor), Nakato Kenkyusho K. K., Japan; Osaka Gas Co., Ltd., 1988, p. 5.
[34] I.C. Tilgner, P. Fischer, F.M. Bohnen, H. Rehage, W.F. Maier, Microporous
Mater. 5 (1995) 77. [35] R.J.P. Corriu, D. Leclercq, Angew. Chem. Int. Ed. Engl. 35 (1996) 1420.
[36] A.M. Buckley, M. Greenblatt, J. Chem. Ed. 71 (1994) 599.
98
[37] H. Minakuchi, K. Nakanishi, N. Soga, N. Ishizuka, N. Tanaka, Anal. Chem. 68 (1996) 3498.
[38] H. Kobayashi, C. Smith, K. Hosoya, T. Ikegami, N. Tanaka, Anal. Sci. 18 (2002)
89. [39] W. Li, D. Fries, A. Ali, A. Malik, Anal. Chem. 76 (2004) 218.
[40] J.D. Hayes, A. Malik, Anal. Chem. 72 (2000) 4090.
[41] S. Bigham, J. Medlar, A. Kabir, C. Shende, A. Ali, A. Malik, Anal. Chem. 74 (2002) 752.
[42] A. Kabir, C. Hamlet, K.S. Yoo, G.R. Newkome, A. Malik, J. Chromatogr. A 1034
(2004) 1. [43] T.Y. Kim, K. Alhooshani, A. Kabir, D.P. Fries, A. Malik, J. Chromatogr. A 1047
(2004) 165. [44] K. Alhooshani, T.-Y. Kim, A. Kabir, A. Malik, J. Chromatogr. A 1062 (2005) 1.
[45] S. Kulkarni, L. Fang, K. Alhooshani, A. Malik, J. Chromatogr. A 1124 (2006) 205–216.
[46] J.V. Hinshaw, LC-GC Europe (2003) 2.
[47] Z. Wang, C. Xiao, C. Wu, H. Han, J. Chromatogr. A 893 (2000) 157.
[48] L. Cai, J. Xing, L. Dong, C. Wu, J. Chromatogr. A 1015 (2003) 11.
[49] L. Yun, Anal. Chim. Acta 486 (2003) 63.
[50] J.D. Hayes, A. Malik, Anal. Chem. 73 (2001) 987.
[51] J.D. Hayes, A. Malik, J. Chromatogr. B 695 (1997) 3.
[52] A. Fidalgo, L.M. Ilharco, J. Non-Cryst. Solids 283 (2001) 144.
[53] J.D. Brennan, J.S. Hartman, E.I. Ilnicki, M. Rakic, Chem. Mater. 11 (1999) 1853.
[54] S.A. Rodrigues, L.A. Colon, Chem. Mater. 11 (1999) 754.
[55] M. Pursch, A. Jaeger, T. Schneller, R. Brindle, K. Albert, E. Lindner, Chem. Mater. 8 (1996) 1245.

99
[56] S.A. Jones, S. Wong, J.M. Burlitch, S. Viswanathan, D.L. Kohlstedt, Chem.
Mater. 9 (1997) 2567. [57] J. Gnado, P. Dhamelincourt, C. Pelegris, M. Traisnel, A.L.M. Mayot, J. Non-
Cryst. Solids 208 (1996) 247. [58] R.M. Almeida, C.G. Pantano, J. Appl. Phys. 68 (1990) 4225.
[59] Z. Zeng, W. Qiu, Z. Huang, Anal. Chem. 73 (2001) 2429.
[60] Z. Zeng, W. Qiu, M. Yang, X. Wei, Z. Huang, F. Li, J. Chromatogr. A 934 (2001) 51.
[61] S.A. Rodriguez, L.A. Colon, Appl. Spectrosc. 55 (2001) 472.
[62] M.T. Dulay, J.P. Quirino, B.D. Bennett, M. Kato, R.N. Zare, Anal. Chem. 73 (2001) 3921.
[63] M. Kato, K. Sakai-Kato, T. Toyo'oka, M.T. Dulay, J.P. Quirino, R.N. Zare, J.
Chromatogr. A 961 (2002) 45. [64] A. Kasgöz, K. Yoshimura, T. Misono, Y. Abe, J. Sol–Gel Sci. Technol. 1 (1994)
185. [65] C.J.T. Landdry, B.K. Cltrain, J.A. Wesson, N. Zumbulyadis, Polymer 33 (1992)
1496. [66] Y. Fu, Q.-Q. Ni, M. Iwamoto, J. Non-Cryst. Solids 351 (2005) 760.
[67] Z. Dang, B.G. Anderson, Y. Amenomiya, B.A. Morrow, J. Phys. Chem. 99 (1995) 14437.
[68] C. Guermeur, J. Lambard, J.F. Gerard, C. Sanchez, J. Mater. Chem. 9 (1999) 769.
[69] D.C.M. Dutoit, M. Shneider, A. Baiker, J. Catal. 153 (1995) 165.
[70] J.M. Fraile, J.I. Garcia, J.A. Mayoral, E. Vispe, J. Catal. 233 (2005) 90.
[71] C.A. Muller, M. Maciejewski, T. Mallat, A. Baiker, J. Catal. 184 (1999) 280.
[72] M.S.M. Saifullah, D.J. Kang, K.R.V. Subramanian, M.E. Welland, K. Yamazaki, K. Kurihara, J. Sol–Gel Sci. Technol. 29 (2004) 5.
100
[73] M.R. Boccuti, K.M. Rao, A. Zecchina, G. Leofanti, G. Petrini, Stud. Surf. Sci. Catal. 48 (1989) 133.
[74] J.J. Kirkland, J.W. Henderson, J.J. DeStefano, M.A.v. Straten, H.A. Claessens, J.
Chromatogr. A 762 (1997) 97. [75] T.P. Gbatu, K.L. Sutton, J.A. Caruso, Anal. Chim. Acta 402 (1999) 67.
[76] A.L. Lopes, F. Augusto, J. Chromatogr. A 1056 (2004) 13.
[77] M. Yang, Z.R. Zeng, W.L. Qiu, Y.L. Wang, Chromatographia 56 (2002) 73.
[78] M.M. Liu, Z.R. Zeng, C.L. Wang, Y.J. Tan, H. Liu, Chromatographia 58 (2003) 597.
[79] J. Yu, L. Dong, C. Wu, L. Wu, J. Xing, J. Chromatogr. A 978 (2002) 37.
[80] X. Li, Z. Zeng, S. Gao, H. Li, J. Chromatogr. A 1023 (2004) 15.
[81] X. Li, Z. Zeng, J. Zhou, S. Gong, W. Wang, Y. Chen, J. Chromatogr. A 1041 (2004) 1.
[82] Z. Zeng, W. Qiu, Z. Huang, Anal. Chem. 73 (2001) 2429.
[83] D. Wang, J. Xing, J. Peng, C. Wu, J. Chromatogr. A 1005 (2003) 1.
[84] J. Yu, C. Wu, J. Xing, J. Chromatogr. A 1036 (2004) 101.
[85] L. Cai, Y. Zhao, S. Gong, L. Dong, C. Wu, Chromatographia 58 (2003) 615.
[86] J. Zhou, Z. Zeng, Anal. Chim. Acta. 556 (2006) 400 – 406.
[87] Y. Fan, Y.Q. Feng, S.L. Da, Z.H. Wang, Talanta 65 (2005) 111.
[88] Y.-l. Fu, Y.-l. Hu, Y.-j. Zheng, G.-K. Li, J. Sep. Sci. 29 (2006) 2684.
[89] Y. Hu, Y. Yang, J. Huang, G. Li, Anal. Chim. Acta. 543 (2005) 17.
[90] A. Kabir, C. Hamlet, A. Malik, J. Chromatogr. A 1047 (2004) 1.
[91] M. Liu, Z. Zeng, B. Xiong, J. Chromatogr. A 1065 (2005) 287–299.
[92] M. Liu, Z. Zeng, H. Fang, J. Chromatogr. A 1076 (2005) 16.
101
[93] C. Basheer, S. Jegadesan, S. Valiyaveettil, H.K. Lee, J. Chromatogr. A 1087 (2005) 252.
[94] Y.-l. Hu, Y.-l. Fu, G.-K. Li, Anal. Chim. Acta 567 (2006) 211–217.
[95] V.G. Zuin, A.L. Lopes, J.H. Yariwake, F. Augusto, J. Chromatogr. A 1056 (2004) 21.
[96] Y. Wang, Z. Zeng, M. Yang, C. Dong, Wuhan Daxue Xuebao, Lixueban 52 (2006)
137. [97] Y. Wang, Z. Zeng, M. Yang, C. Dong, X. Wang, Wuhan Ligong Daxue Xuebao
27 (2005) 37. [98] M. Liu, Z. Zeng, Y. Tian, Anal. Chim. Acta 540 (2005) 341.
[99] M. Llompart, K. Li, M. Fingas, Anal. Chem. 70 (1998) 2510.
[100] C.D. Gutsche, Calixarenes, Royal Society of Chemistry, Cambridge, 1989.
[101] X. Li, Z. Zeng, J. Zhou, Anal. Chim. Acta. 509 (2004) 27.
[102] X. Li, Z. Zeng, Y. Chen, Y. Xu, Talanta 63 (2004) 1013.
[103] A. Penalver, E. Pocurull, F. Borrull, R.M. Marce, J. Chromatogr. A 872 (2000) 191.
[104] X. Li, Z. Zeng, Y. Xu, Anal. Bioanal. Chem. 384 (2006) 1428.
[105] M.N. Sarrion, F.J. Santos, M.T. Galceran, J. Chromatogr. A 819 (1998) 197.
[106] F.J. Santos, M.N. Sarrion, M.T. Galceran, J. Chromatogr. A 771 (1997) 181.
[107] B.G. Oliver, K.D. Bothen, Anal. Chem. 52 (1980) 2066.
[108] A. Belfroid, W. Seinen, K. Vangestel, J. Hermens, Chemosphere 26 (1993) 2265.
[109] Y. Wang, H.K. Lee, J. Chromatogr. A 803 (1998) 291.
[110] C.Y. Wu, L.S. Cai, Y.J. Wang, H.M. Han, Z.R. Zeng, Z.Y. Yu, H. Yuan, Chromatographia 37 (1993) 374.
[111] J.L. Ge, R.N. Fu, Z.F. Huang, Y.T. Wang, J. Microcol. Sep. 3 (1991) 250.
102
[112] D. Wang, J. Peng, C. Xing, Y. Wu, J. Xu, J. Chromatogr. Sci. 58 (2003) 57.
[113] G. Audunsson, Anal. Chem. 60 (1988) 1340.
[114] L. Cai, S. Gong, M. Chen, C. Wu, Anal. Chim. Acta. 559 (2006) 89.
[115] T. Cserhati, E. Forgacs, Cyclodextrins in Chromatography, Royal Society of Chemistry, Cambridge, UK, 2003.
[116] G.R. Newkome, Z. Yao, G.R. Baker, V.K. Gupta, J. Org. Chem. 50 (1985) 2003.
[117] D.A. Tomalia, H. Baker, J. Dewald, M. Hall, G. Kallos, S. Martin, J. Roeck, J. Ryder, P. Smith, Polym. J. 17 (1985) 117.
[118] G.R. Newkome, C.N. Moorefield, F. Vogtle, Dendrimers and Dendron. Concept,
Synthesis, Applications, Wiley-VCH, Weinheim, 2001. [119] S.A. Kuzdzal, C.A. Monnig, G.R. Newkome, C.N. Moorefield, J. Chem. Soc.,
Chem. Commun. 18 (1994) 2139. [120] C.P. Palmer, N. Tanaka, J. Chromatogr. A 792 (1997) 105.
[121] H.C. Chao, J.E. Hanson, J. Sep. Sci. 25 (2002) 345.
[122] B.T. Mathews, A.E. Beezer, M.J. Snowden, M.J. Hardy, J.C. Mitchell, Chromatographia 53 (2001) 147.
[123] G.R. Newkome, K.S. Yoo, A. Kabir, A. Malik, Tetrahedron Lett. 42 (2001) 7537.
[124] H. Goda, C.W. Frank, Chem. Mater. 13 (2001) 2783.
[125] C.S. Betrabet, G.L. Wilkes, Chem. Mater. 7 (1995) 535.
[126] T. Higuchi, K. Kurumada, S. Nagamine, A.W. Lothongkum, M. Tanigaki, J. Mater. Sci. 35 (2000) 3237.
[127] M. Kamitakahara, M. Kawashita, N. Miyata, T. Kokubo, T. Nakamura,
Biomaterials 24 (2003) 1357. [128] I. Honma, O. Nishikawa, T. Sugimoto, S. Nomura, H. Nakajima, Fuel Cells 2
(2002) 52. [129] M. Liu, Z. Zeng, B. Xiong, J. Chromatogr. A 1065 (2005) 287.

103
[130] D. Cha, M. Liu, Z. Zeng, D.e. Cheng, G. Zhan, Anal. Chim. Acta. 572 (2006) 47.
[131] M. Liu, Y. Liu, Z. Zeng, T. Peng, J. Chromatogr. A 1108 (2006) 149.
[132] Y.-l. Hu, Y.-l. Fu, G.-K. Li, Anal. Chim. Acta. 567 (2006) 211.
104
CHAPTER 3
SOL-GEL IMMOBILIZED CYANO-POLYDIMETHYLSILOXANE COATING
FOR CAPILLARY MICROEXTRACTION
3.1 Introduction
Solid-Phase microextraction (SPME) [1] of polar analytes such as carboxylic
acids, alcohols, amines, phenols, etc. from an aqueous medium often poses difficulty due
to their high affinity toward water. For efficient extraction of such analytes from aqueous
samples the SPME coating must have polarity high enough to compete with water for the
analyte molecules. However, polar coatings are difficult to immobilize on a silica
substrates using conventional techniques [2]. The absence of chemical bonds between the
SPME coating and fused silica fiber is considered to be responsible for low thermal and
solvent stability of conventionally prepared SPME coatings [3]. If such coatings are used
for the extraction of polar analytes from aqueous media, desorption step becomes
problematic and often leads to undesired effects such as incomplete desorption and
sample carryover.
Sol-gel coatings [3,4] were developed to provide an effective solution to these
problems that inherently arises from the use of in conventional SPME coatings. The sol-
gel coatings offer several advantages. First, sol-gel coatings are chemically anchored to
105
the fused silica substrate. The presence of chemical bonds ensures thermal stability of the
coatings, and thereby facilitates application of higher temperatures for effective
desorption of high-boiling analytes. Thanks to these chemical bonds, sol-gel coatings also
possess high solvent stability [4]. Second, the sol-gel coatings usually have a porous
structure enhancing the surface area of the extracting phase. This enhanced surface area
allows the use of thinner coatings to achieve faster extraction and desired level of sample
capacity [3]. Third, the selectivity of a sol-gel coating can be easily fine tuned by
changing the composition of the used sol solution.
Both conventional and sol-gel coatings have been used to extract polar
compounds (e.g., free carboxylic acids, alcohols, etc.) from aqueous media. Pan and co-
workers [5] have demonstrated the possibility of achieving improved limits of detection
for short-chain (C2–C10) fatty acids via headspace extraction and in-fiber derivatization
on poly(acrylate) (PA) coated SPME fiber. Mixed phase coatings such as
carbowax/divinylbenzene (CW/DVB) [6-8], polydimethylsiloxane/divinylbenzene
(PDMS/DVB) [8,9], polydimethylsiloxane/Carboxen (PDMS/Carboxen) [8,10],
polydimethylsiloxane/Carboxen/divinylbenzene (PDMS/CAR/DVB) [8] have been used
for the extraction of highly polar compounds. The use of 3-(trimethoxysilyl)propyl
methacrylate-hydroxyl-terminated silicone oil (TMSPMA-OH-TSO) [11] and hydroxy-
terminated silicone oil-butyl methacrylate-divinylbenzene (OH-TSO-BMA-DVB) [12]
copolymer to prepare sol-gel coatings have also been reported for the extraction of
alcohols and fatty acids in conjunction with temperature and sample matrix pH
adjustments. In all these reports manipulation to the operational conditions (e.g., sample
106
derivatization, temperature control, and pH of sample matrix, etc.) was used to improve
the extraction efficiency. This however, increases the number of steps involved in the
extraction process with a concomitant increase in the extraction time as well as the error
associated with it. It is, therefore, highly desirable to develop coatings capable of
providing efficient extraction of polar compounds without requiring such adjustments in
operating conditions.
Chromatographic stationary phases containing cyano functional group [13] are
known to be extremely polar, and may prove to be highly effective in the microextraction
of polar analytes from aqueous samples. Cyanopropylpolysiloxanes exhibit both polar
and polarizable characteristics and are among the most useful stationary phases with
respect to polarity at both low and high temperatures. The cyano group, attached to the
siloxane backbone via a three-methylene (-CH2) spacer, is dipolar and strongly electron
attracting, hence displaying dipole-dipole, dipole-induced dipole, and charge-transfer
interactions. The unshared electron pair on the nitrile nitrogen may form intermolecular
hydrogen-bonds with suitable hydrogen-donor molecules in the sample such as phenols.
These characteristics of cyano stationary phases are responsible for increased affinity of
these phases for alcohols, ketones, esters, and analytes bearing π-electrons. Cyano
stationary phases have been used in GC [14-18], HPLC [19-21], capillary
electrochromatography (CEC) [22] and as an extraction medium in solid-phase extraction
(SPE) [23-25]. Although cyanopropylpolysiloxanes might be useful for extracting highly
polar compounds, conventionally prepared cyano coatings (having no chemical bond to
the substrate) are not stable at elevated temperatures [26,27]. The sol-gel approach solves
107
this problem by chemically anchoring such polar coatings onto the fused silica surface.
A recent publication from our group [28] describes sol-gel cyanopropyl-based
coatings for capillary microextraction (CME, also called in-tube SPME). In this
dissertation, we provide a detail account on in situ creation of sol-gel coatings containing
cyanopropyl and poly(dimethylsiloxane) components (sol-gel CN-PDMS coatings), and
explain how sol-gel chemistry can provide an effective means to immobilize such
coatings on the inner walls of fused silica capillaries for use in CME. We also
demonstrate the effectiveness of sol-gel CN-PDMS coatings in the simultaneous
extraction of highly polar, moderately polar, and nonpolar analytes from aqueous sample
matrices – an analytical task that is difficult to accomplish using conventional SPME
coatings.
3.2 Experimental section
3.2.1 Equipment
All the CME-GC experiments with sol-gel CN-PDMS coated capillaries were
performed on a Shimadzu Model 17A GC (Shimadzu, Kyoto, Japan) equipped with a
flame ionization detector (FID) and a split-splitless injector. A Barnstead Model 04741
Nanopure deionized water system (Barnstead/Thermolyne, Dubuque, IA) was used to
obtain ~16.9 MΩ water. A homebuilt, gas pressure-operated capillary filling/purging
device [29] was used to rinse the fused silica capillary with solvents, fill it with sol
108
solution, expel the sol solution from the capillary at the end of sol-gel coating process,
and purge the capillary with helium (Figure 2.4). A vortex shaker model G-560
(Scientific Industries, Bohemia, NY) was used to mix sol-gel ingredients. A ThermoIEC
model Micromax microcentrifuge (Needham Heights, MA) was used to separate the sol
solution from the precipitate (if any) at 14 000 rpm (~ 15 915 g). A JEOL model JSM-35
scanning electron microscope (SEM) was used to investigate the surface morphology of
sol-gel CN-PDMS coated capillaries. An in-house designed liquid sample dispenser [30]
was used to perform CME via gravity-fed flow of the aqueous samples through the sol-
gel CN-PDMS coated capillary (Figure 3.1).
3.2.2 Materials and chemicals
Fused silica capillary (250 µm i.d.) with a protective polyimide coating on the
external surface was obtained from Polymicro Technologies (Phoenix, AZ). HPLC-grade
solvents (dichloromethane, methanol, and tetrahydrofuran (THF)), Kimwipes,
polypropylene microcentrifuge tubes (2.0 mL), and 7.0 mL borosilicate vials (used to
store standard solutions) were purchased from Fisher Scientific (Pittsburgh, PA).
Polycyclic aromatic hydrocarbons (PAHs) (acenaphthene, fluorene, phenanthrene,
fluoranthene), aldehydes (nonanal, 4-isopropylbenzaldehyde, 4-tert-butylbenzaldehyde,
dodecanal), ketones (butyrophenone, valerophenone, hexanophenone, benzophenone,
anthraquinone), aniline derivatives (N,N-dimethylaniline, N-butylaniline, acridine,
benzanilide), substituted phenols (2,4-dichlorophenol, 2,4,6-trichlorophenol,
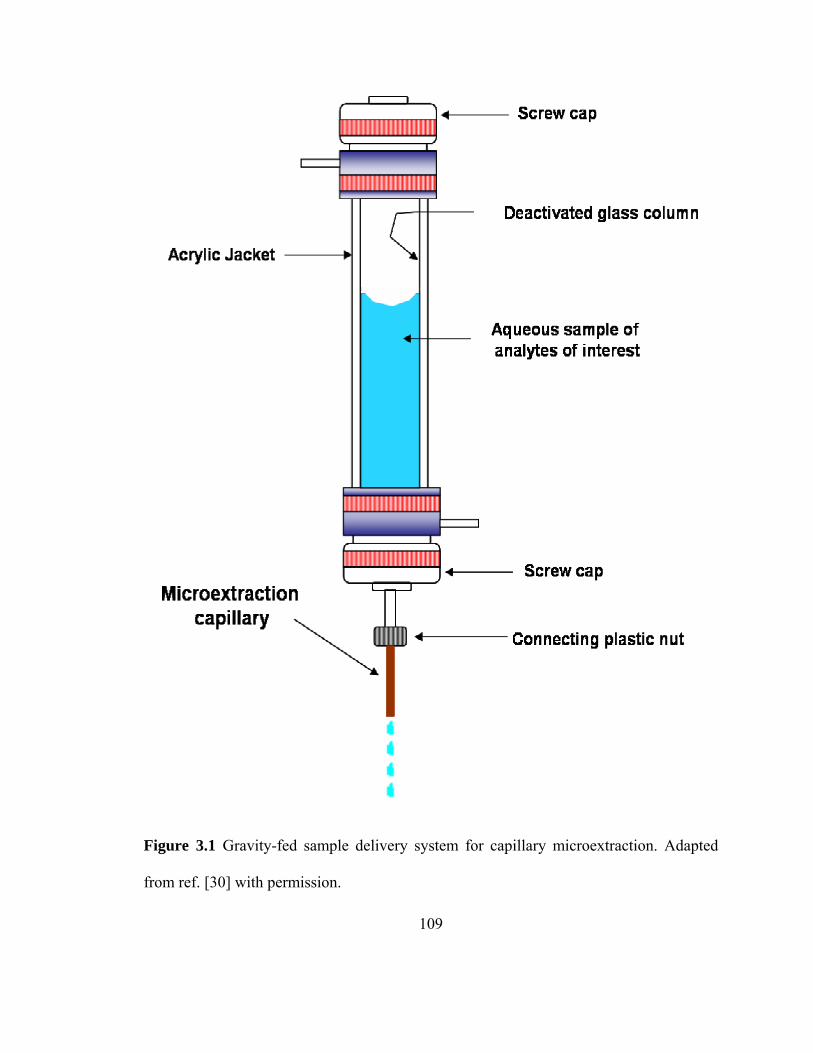
109
Figure 3.1 Gravity-fed sample delivery system for capillary microextraction. Adapted
from ref. [30] with permission.
110
4-chloro-3-methylphenol, pentachlorophenol), fatty acids (hexanoic acid, nonanoic acid,
decanoic acid, undecanoic acid), tetraethoxysilane (TEOS, 99%), 1,1,1,3,3,3-
hexamethyldisilazane (HMDS, 99.9%), and trifluoroacetic acid (TFA, 99%) were
purchased from Aldrich (Milwaukee, WI). Alcohols (1-heptanol, 1-octanol, 1-nonanol,
and 1-decanol) were purchased from Acros (Pittsburgh, PA). Silanol terminated PDMS
was obtained from United Chemical Technologies (Bristol, PA) and 3-
cyanopropyltriethoxysilane was purchased from Gelest (Morrisville, PA).
3.2.3 Preparation of sol-gel CN-PDMS coated microextraction capillaries
Preparation of sol-gel coated microextraction capillaries involves preparation of
the sol solution, Pretreatment of the fused silica capillary, coating the pretreated capillary
with the sol solution, and post coating treatment.
3.2.3.1 Preparation of sol solution
The used sol solution consisted of an alkoxide precursor(s), a sol-gel-active
(either hydroxy or alkoxy silane terminated) organic polymer, surface deactivating
reagent, appropriate organic solvent, and a sol-gel catalyst. Table 3.1 presents the names,
functions, and chemical structures of different chemical ingredients used to prepare the
sol solution for creating the sol-gel CN-PDMS coated microextraction capillaries.
A sol-gel coating solution was prepared as follows: First 50 mg of PDMS (sol-gel
active polymer), and 50 µL of 3-cyanopropyltriethoxysilane (sol-gel precursor) and

111
Table 3.1 Names, functions, and chemical structures of sol–gel CN-PDMS coating
solution ingredients.
Name of chemical Function Structure
3-cyanopropyltriethoxysilane Sol-gel precursor
Si OC2H5
OC2H5
C2H5O
CN
Tetraethoxysilane (TEOS) Sol-gel co-precursor Si OC2H5
OC2H5
C2H5O
OC2H5
Silanol-terminated poly(dimethylsiloxane)
(PDMS)
Sol-gel active polymer Si
CH3
CH3n
O HHO
Trifluoroacetic acid / 5% water (v/v)
Catalyst and source of water
CF3COOH
Solvent Dichloromethane CH2Cl2
1,1,1,3,3,3-hexamethyldisilazane
(HMDS)
Deactivating reagent Si
CH3
H3C
CH3
N Si
CH3
CH3
CH3
H
112
50 µL TEOS (sol-gel co-precursor) were dissolved in 700 µL dichloromethane (solvent)
contained in a polypropylene microcentrifuge vial. Subsequently, 10 µL of HMDS
(surface deactivation reagent) and 50 µL of TFA (sol-gel catalyst) containing 5% water
were added to the microcentrifuge vial and mixed for 2 minutes using a vortex shaker.
The resulting solution was centrifuged at 14 000 rpm (~ 15 915 g) for 5 min and clear
supernatant of the sol solution was transferred to another clean vial. This sol solution was
used to coat fused silica capillaries to be used further for capillary microextraction.
3.2.3.2 Pretreatment of fused silica capillary
First, the fused silica capillary (~ 2 m) was rinsed sequentially with
dichloromethane (1 mL) and methanol (1 mL) using gas pressure-operated capillary
filling/purging device (Figure 2.3) to clean the capillary inner surface off any organic
contaminants. The rinsed capillary was then purged with helium (50 psi) for 30 min
followed by hydrothermal treatment. Hydrothermal treatment is a very important step that
helps generating adequate surface silanol groups required for the formation of strong
chemical bonds between the substrate and the developed sol-gel coating. To perform
hydrothermal treatment, the cleaned fused silica capillary was filled with deionized water
using the filling/purging device and after 15 min of in-capillary residence time the water
was flushed out of the capillary with the aid of helium gas pressure (50 psi). The capillary
was then purged with helium gas for 30 min so that only a thin layer of water remained
on the inner surface of the capillary. At this point, both the ends of the fused silica
113
capillary were sealed with an oxy-acetylene torch and the sealed capillary was heated at
250 °C in a GC oven for 2 hours. Under these conditions, additional silanol groups are
generated on the fused silica capillary surface as a result of the hydrolysis of siloxane
bridges. Following this, both the ends of the capillary were cut open with a ceramic wafer.
One end of the fused silica capillary was then connected to the GC injection port with the
help of a graphite ferrule and the capillary was heated again in the GC oven at 250 °C for
2 hours under continuous helium flow (1 mL/min) through the capillary. After this, the
capillary was ready for coating.
3.2.3.3 Coating of the fused silica capillary with sol solution
A hydrothermally treated [31] fused silica capillary (2 m) was filled with the
freshly prepared sol solution using a helium (50 psi) pressure-operated filling/purging
device (Figure 2.4). The sol solution was allowed to stay inside the capillary for a
controlled period of time (typically 10-15 minutes) to facilitate the formation of a sol-gel
coating and its chemical bonding to the capillary inner walls. The residence time of the
sol solution inside the capillary must be carefully controlled. A systematic study on the
gelation time of sol solution was conducted to optimize the residence time of sol solution
inside the fused silica capillary (Appendix B). After keeping the sol solution inside the
capillary for the optimized period of time, the unbonded portion of the solution was
expelled from the capillary under helium pressure (50 psi), leaving behind a surface-
bonded sol-gel coating within the capillary. The sol-gel CN-PDMS coated capillary was
114
subsequently dried by purging with helium (50 psi) for an hour. The helium gas flow
facilitated the evaporation of liquids associated with the coating.
3.2.3.4 Post-coating treatment
The purpose of post-coating treatment is to physically and chemically stabilize the
sorbent coating on the fused silica capillary surface and remove any residual non-bonded
portion of sol solution from the capillary. For this, the coated capillary was installed in a
GC oven with one end of the capillary connected to the injection port and the other end
left open in the GC oven. The sol-gel coated capillary was then thermally conditioned in
the GC oven using temperature-programmed heating from 35 oC to 150 oC at 1 oC/min
with a hold time of 300 min at 150 oC, simultaneously purging the capillary with helium
(1 mL/min). The capillary was further conditioned from 150 oC to 300 oC at 2 oC/min,
holding it at 300 oC for 60 min under helium flow (1 mL/min).
Before using in extraction, the coated capillary was rinsed with 1 mL
dichloromethane/methanol (1:1 v/v) mixture followed by purging with helium for 30-45
min to remove any residual solvent. Rinsing the capillary with the organic solvent helps
clean the sol-gel coating surface. After rinsing, the capillary was conditioned again from
35 oC to 300 oC at 5 oC/min, holding it at 300 oC for 30 min under helium flow (1
mL/min). The conditioned capillary was then cut into 12 cm long pieces that were further
used in capillary microextraction.
115
3.2.4 Preparation of the standard sample solution s for CME
Stock solutions (10 mg/mL) of the selected analytes were prepared in methanol or
THF and stored in surface-deactivated [30] amber glass vials. For extraction, fresh
aqueous samples were prepared by further diluting these stock solutions to ng/mL level
concentrations.
3.2.5 Capillary microextraction of analytes on sol-gel CN-PDMS coated capillaries
A Chromaflex AQ column (Knotes Glass, Vineland, NJ) was modified as
described in ref. [30] and used for gravity-fed sample delivery to the sol-gel CN-PDMS
capillary for preconcentration by CME (Figure 3.1). A 12-cm long piece of thermally
conditioned sol-gel CN-PDMS coated microextraction capillary (250 µm i.d.) was
vertically connected to the lower end of the gravity-fed sample dispenser. The aqueous
sample (50 mL) was poured into the dispenser from its top end and allowed to flow
through the microextraction capillary under gravity. The extraction was carried out for
30-40 min for the analyte concentration equilibrium to be established between the sol-gel
coating and the sample matrix. The capillary was then detached from the dispenser and
the residual sample droplets were removed by touching one of the ends of
microextraction capillary with a piece of Kimwipes tissue.
3.2.6 GC analysis of the extracted analytes
The extracted analytes were transferred from the microextraction capillary to the
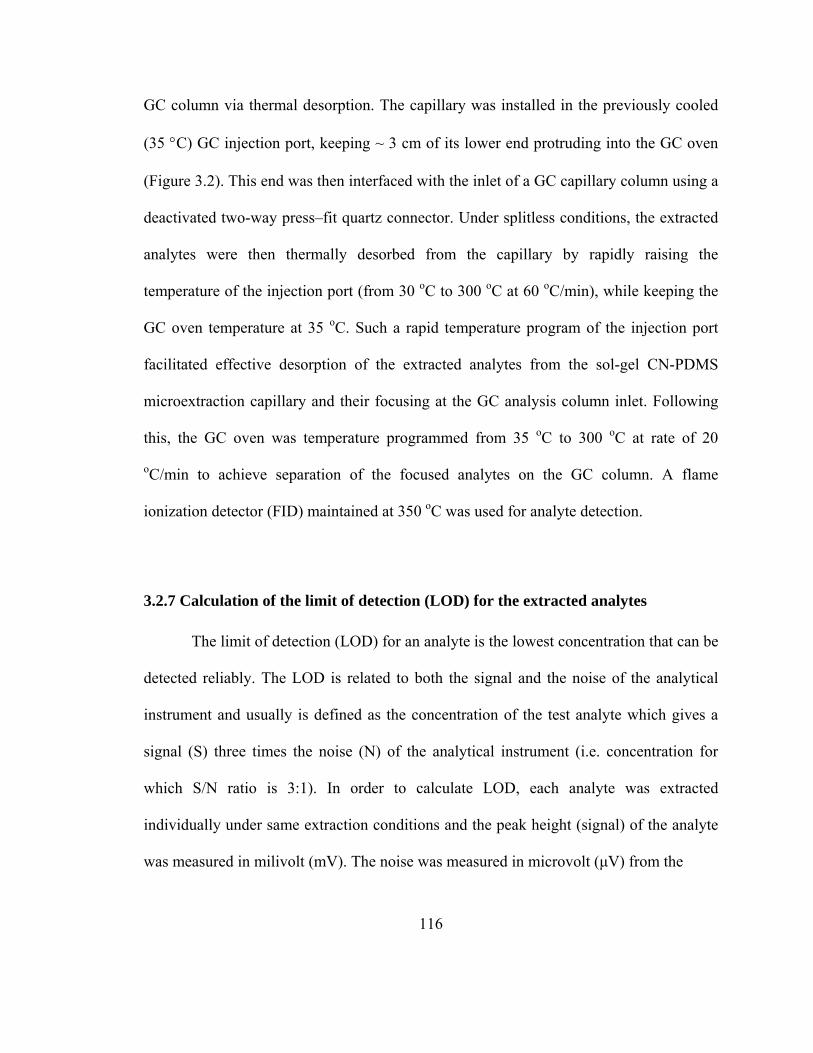
116
GC column via thermal desorption. The capillary was installed in the previously cooled
(35 °C) GC injection port, keeping ~ 3 cm of its lower end protruding into the GC oven
(Figure 3.2). This end was then interfaced with the inlet of a GC capillary column using a
deactivated two-way press–fit quartz connector. Under splitless conditions, the extracted
analytes were then thermally desorbed from the capillary by rapidly raising the
temperature of the injection port (from 30 oC to 300 oC at 60 oC/min), while keeping the
GC oven temperature at 35 oC. Such a rapid temperature program of the injection port
facilitated effective desorption of the extracted analytes from the sol-gel CN-PDMS
microextraction capillary and their focusing at the GC analysis column inlet. Following
this, the GC oven was temperature programmed from 35 oC to 300 oC at rate of 20
oC/min to achieve separation of the focused analytes on the GC column. A flame
ionization detector (FID) maintained at 350 oC was used for analyte detection.
3.2.7 Calculation of the limit of detection (LOD) for the extracted analytes
The limit of detection (LOD) for an analyte is the lowest concentration that can be
detected reliably. The LOD is related to both the signal and the noise of the analytical
instrument and usually is defined as the concentration of the test analyte which gives a
signal (S) three times the noise (N) of the analytical instrument (i.e. concentration for
which S/N ratio is 3:1). In order to calculate LOD, each analyte was extracted
individually under same extraction conditions and the peak height (signal) of the analyte
was measured in milivolt (mV). The noise was measured in microvolt (µV) from the
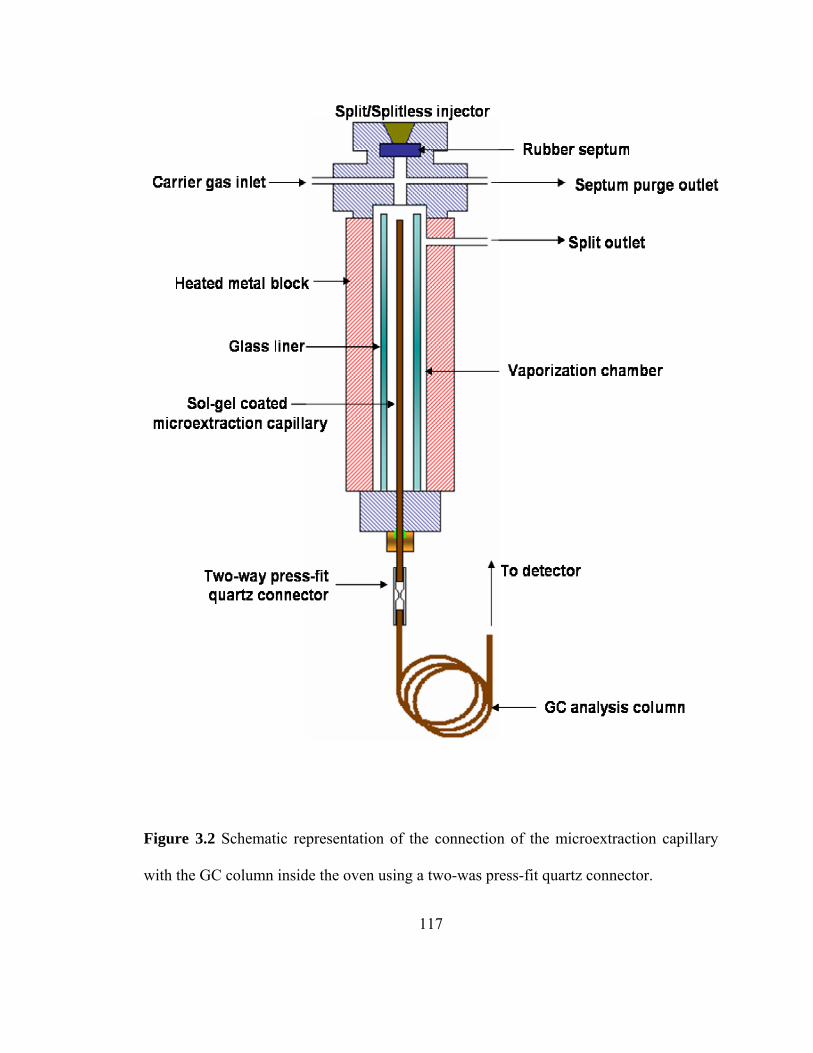
117
Figure 3.2 Schematic representation of the connection of the microextraction capillary
with the GC column inside the oven using a two-was press-fit quartz connector.
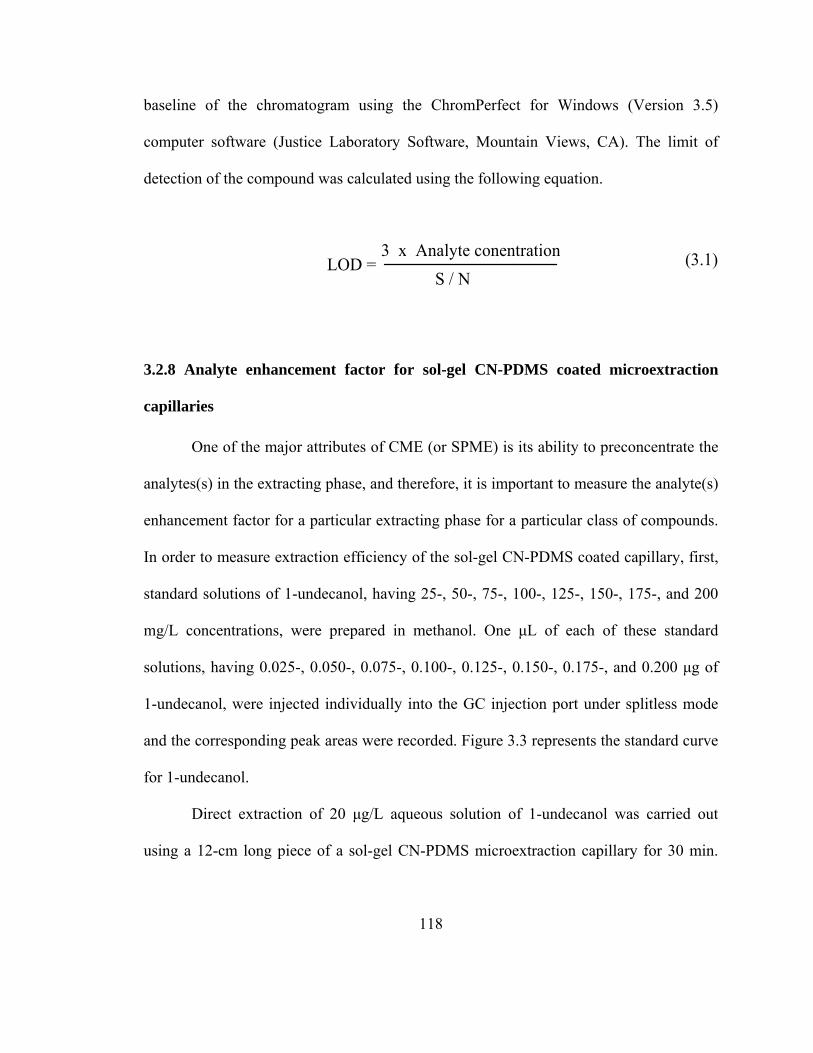
118
baseline of the chromatogram using the ChromPerfect for Windows (Version 3.5)
computer software (Justice Laboratory Software, Mountain Views, CA). The limit of
detection of the compound was calculated using the following equation.
LOD =3 x Analyte conentration
S / N(3.1)
3.2.8 Analyte enhancement factor for sol-gel CN-PDMS coated microextraction
capillaries
One of the major attributes of CME (or SPME) is its ability to preconcentrate the
analytes(s) in the extracting phase, and therefore, it is important to measure the analyte(s)
enhancement factor for a particular extracting phase for a particular class of compounds.
In order to measure extraction efficiency of the sol-gel CN-PDMS coated capillary, first,
standard solutions of 1-undecanol, having 25-, 50-, 75-, 100-, 125-, 150-, 175-, and 200
mg/L concentrations, were prepared in methanol. One µL of each of these standard
solutions, having 0.025-, 0.050-, 0.075-, 0.100-, 0.125-, 0.150-, 0.175-, and 0.200 µg of
1-undecanol, were injected individually into the GC injection port under splitless mode
and the corresponding peak areas were recorded. Figure 3.3 represents the standard curve
for 1-undecanol.
Direct extraction of 20 µg/L aqueous solution of 1-undecanol was carried out
using a 12-cm long piece of a sol-gel CN-PDMS microextraction capillary for 30 min.
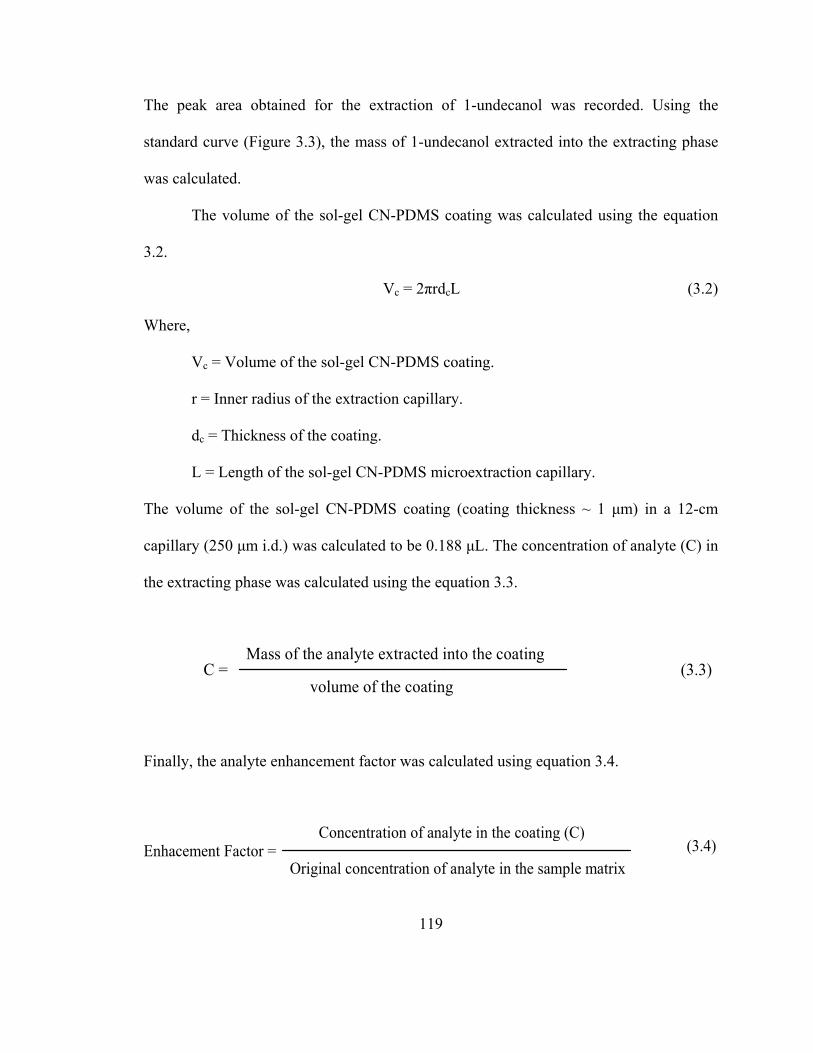
119
The peak area obtained for the extraction of 1-undecanol was recorded. Using the
standard curve (Figure 3.3), the mass of 1-undecanol extracted into the extracting phase
was calculated.
The volume of the sol-gel CN-PDMS coating was calculated using the equation
3.2.
Vc = 2πrdcL (3.2)
Where,
Vc = Volume of the sol-gel CN-PDMS coating.
r = Inner radius of the extraction capillary.
dc = Thickness of the coating.
L = Length of the sol-gel CN-PDMS microextraction capillary.
The volume of the sol-gel CN-PDMS coating (coating thickness ~ 1 µm) in a 12-cm
capillary (250 µm i.d.) was calculated to be 0.188 µL. The concentration of analyte (C) in
the extracting phase was calculated using the equation 3.3.
C =
Mass of the analyte extracted into the coating
volume of the coating(3.3)
Finally, the analyte enhancement factor was calculated using equation 3.4.
Enhacement Factor =Concentration of analyte in the coating (C)
Original concentration of analyte in the sample matrix(3.4)
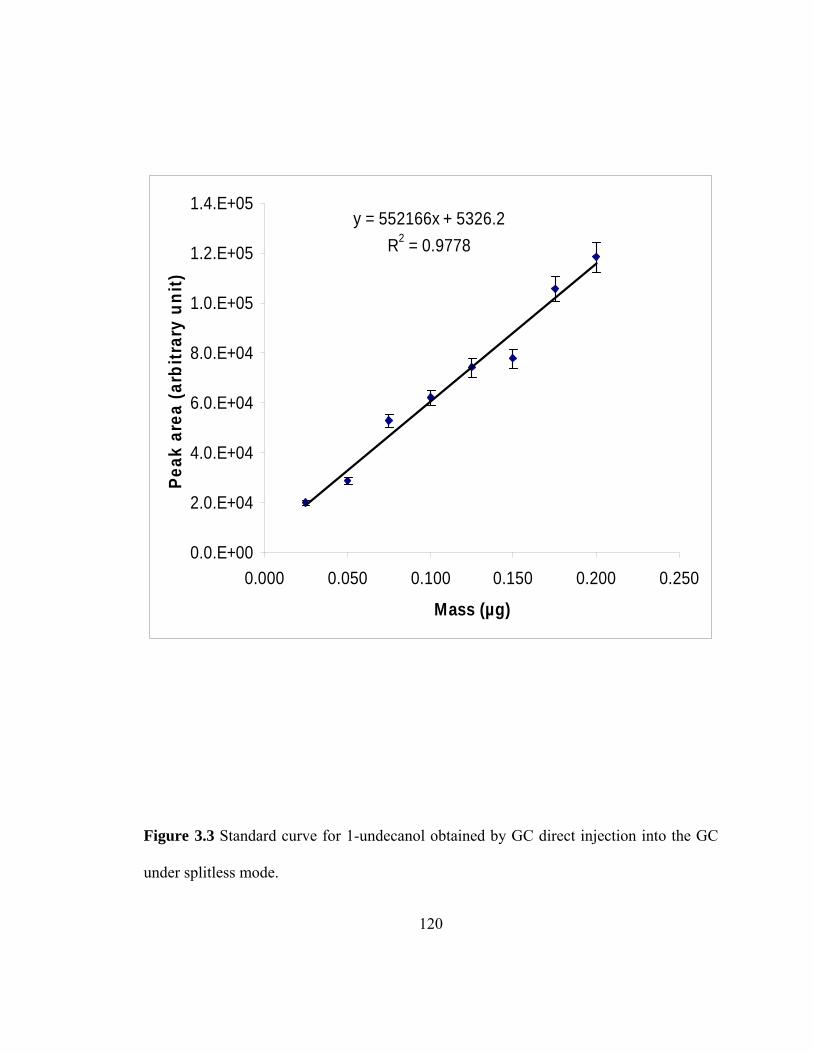
120
y = 552166x + 5326.2R2 = 0.9778
0.0.E+00
2.0.E+04
4.0.E+04
6.0.E+04
8.0.E+04
1.0.E+05
1.2.E+05
1.4.E+05
0.000 0.050 0.100 0.150 0.200 0.250
Mass (µg)
Peak
are
a (a
rbitr
ary
unit)
Figure 3.3 Standard curve for 1-undecanol obtained by GC direct injection into the GC
under splitless mode.
121
The analyte enhancement factor for 1-undecanol was found to be 26,534 which is much
higher than the values 353 and 915 obtained for the same compound on commercial
PDMS (0.66 µL) and PA (0.5 µL) coated SPME fibers, respectively [32].
3.3 Results and discussion
In the sol-gel process, a gel can be formed via hydrolytic polycondensation of a
sol-gel precursor followed by aging and drying [33]. Since the introduction of sol-gel
SPME coatings in 1997 [3], various sol-gel organic-inorganic hybrid materials have been
prepared to coat SPME fibers [34,35] as well as inner walls of the fused capillaries for
use in CME or in-tube SPME [30,36-38].
In this work, sol-gel chemistry was used to chemically bind highly polar
cyanopropyl and nonpolar PDMS moieties to an evolving sol-gel network structure, and
use such a hybrid organic-inorganic material as a surface-bonded coating in a fused silica
capillary to provide efficient extraction of aqueous trace analytes from a wide range of
polarity.
3.3.1 Reactions leading to the formation of a chemically immobilized sol-gel CN-
PDMS network
In recent years, sol-gel technology has received increased attention in analytical
separations and sample preparations due to its outstanding versatility and excellent
control over properties of the created sol-gel materials that proved to be promising for use
as stationary phases and extraction media. The chemical ingredients used the in sol
122
solution to prepare sol-gel CN-PDMS coated microextraction capillaries are presented in
Table 3.1.
As can be seen in Table 3.1, the used sol solution contained 3-
cyanopropyltriethoxysilane (sol-gel precursor) and TEOS (sol-gel co-precursor). It is
well-known from the basic principles of sol-gel chemistry [39] that such alkoxysilane
compounds are capable of undergoing hydrolytic polycondensation reactions in the
presence of a sol-gel catalyst. Under the experimental conditions used, both 3-
cyanopropyltriethoxysilane and TEOS can get hydrolyzed in the presence of the sol-gel
catalyst, trifluoroacetic acid (TFA), as presented in the reaction Scheme 3.1.
Polycondensation of the hydrolyzed precursors and silanol-terminated PDMS would lead
to a three-dimensional sol–gel network incorporating highly polar cyanopropyl and
nonpolar PDMS moieties in the organic-inorganic hybrid structure (Scheme 3.2 (A) and
(B)). Fragments of this sol-gel network, especially the ones growing in the vicinity of the
capillary walls, have the opportunity to get chemically anchored to the capillary inner
surface via condensation with the surface silanol groups, leading to the formation of a
surface-bonded sol–gel coating on the capillary inner walls forming a surface-bonded
extracting phase film (Scheme 3.3). In this work, hexamethyldisilazane (HMDS) was
added to the sol solution for deactivating the residual silanol groups on the sorbent
coating during the post-coating thermal conditioning (Scheme 3.4).
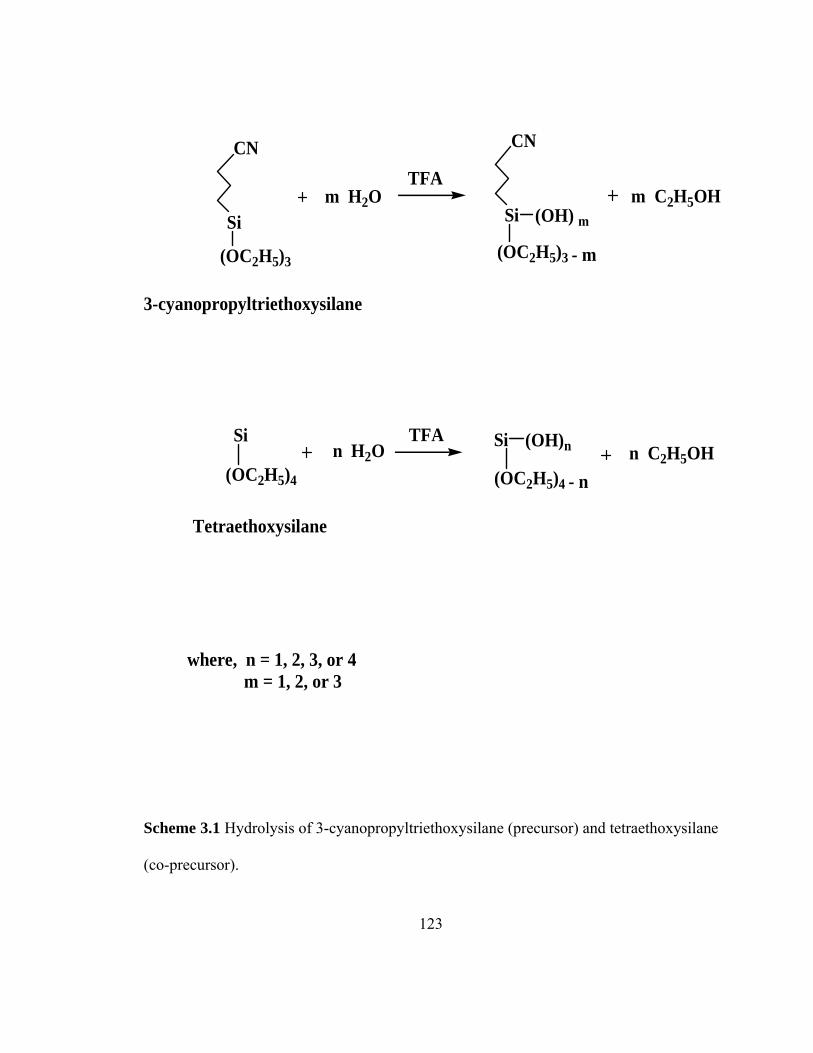
123
Si
(OC2H5)4
Tetraethoxysilane
m H2OSi
(OC2H5)3
CN
3-cyanopropyltriethoxysilane
Si
(OC2H5)3
(OH) m
CN
TFA
TFA
- m
n H2O Si
(OC2H5)4
m C2H5OH
n C2H5OH(OH)n
- n
where, n = 1, 2, 3, or 4 m = 1, 2, or 3
Scheme 3.1 Hydrolysis of 3-cyanopropyltriethoxysilane (precursor) and tetraethoxysilane
(co-precursor).
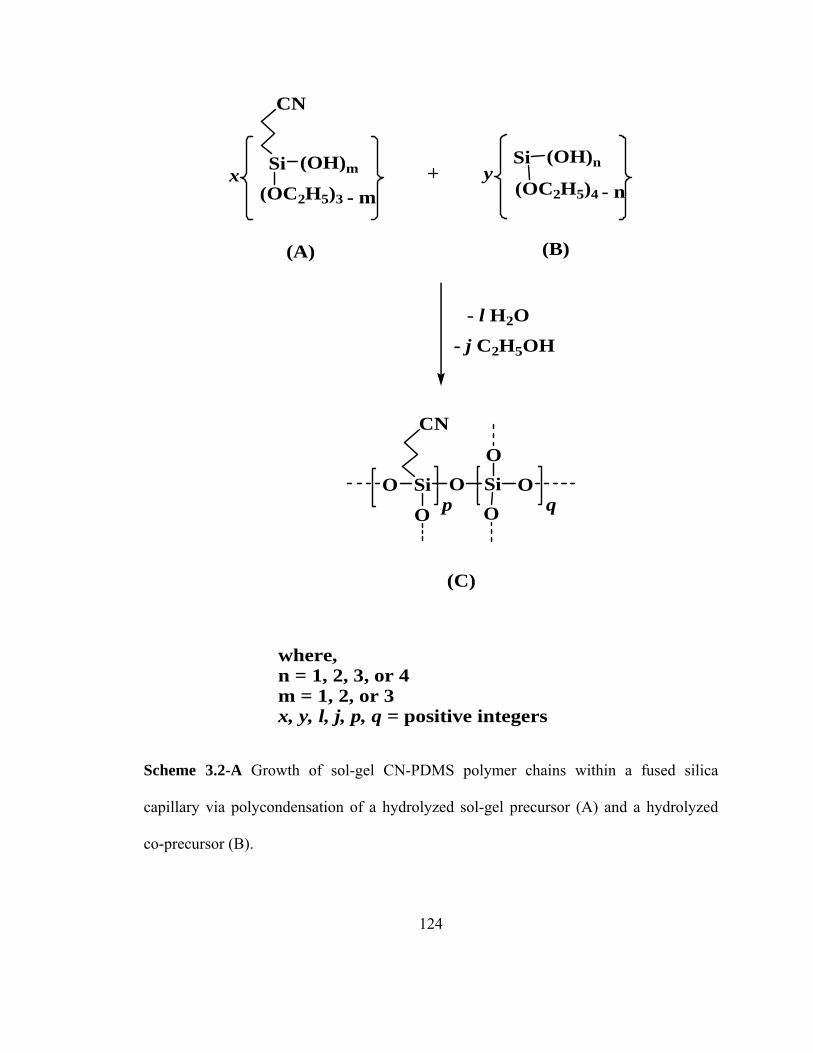
124
- l H2O
Si
(OC2H5)3
(OH)m
CN
- m
Si
(OC2H5)4
(OH)n
- n
where, n = 1, 2, 3, or 4m = 1, 2, or 3x, y, l, j, p, q = positive integers
OSiO SiOq
O
O
CN
O p
- j C2H5OH
x y
(A) (B)
(C)
Scheme 3.2-A Growth of sol-gel CN-PDMS polymer chains within a fused silica
capillary via polycondensation of a hydrolyzed sol-gel precursor (A) and a hydrolyzed
co-precursor (B).
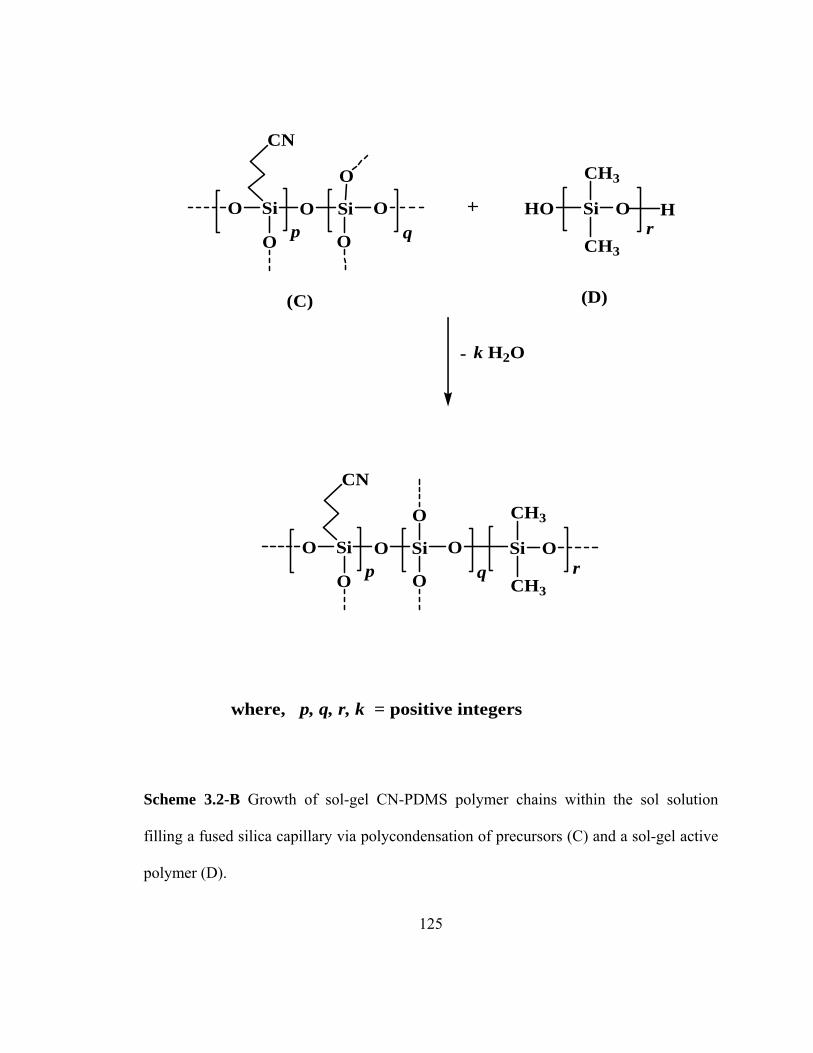
125
OSiO SiOq
O
O
CN
O p
where, p, q, r, k = positive integers
Si
CH3
CH3
rO HHO
k H2O-
OSiO SiOq
O
O
CN
O pSi
CH3
CH3
rO
(C) (D)
Scheme 3.2-B Growth of sol-gel CN-PDMS polymer chains within the sol solution
filling a fused silica capillary via polycondensation of precursors (C) and a sol-gel active
polymer (D).
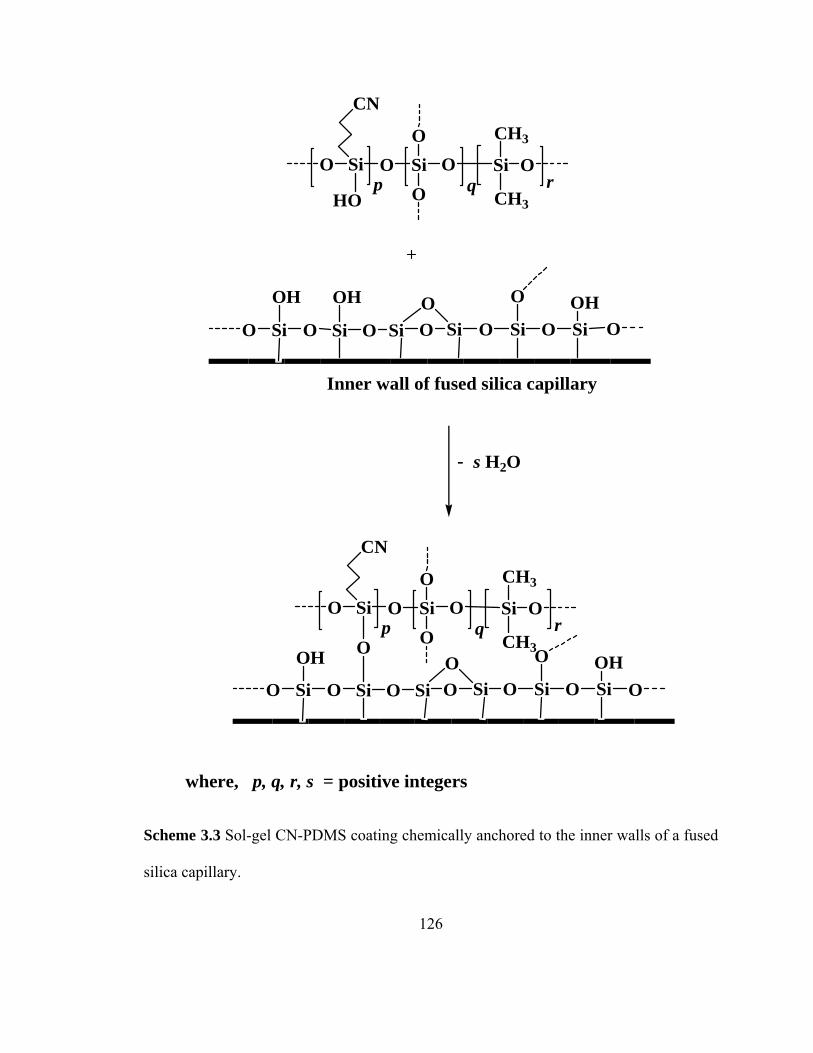
126
OSiO SiOq
O
O
CN
HOp
Si
CH3
CH3r
O
Si O Si O Si O SiO O Si OSiOOHOH O
- s H2O
Inner wall of fused silica capillary
O
Si O Si O Si O SiO O Si OSiOOHOO
OSiO SiOq
O
O
CN
pSi
CH3
CH3r
O
O
OH
OH
where, p, q, r, s = positive integers
Scheme 3.3 Sol-gel CN-PDMS coating chemically anchored to the inner walls of a fused
silica capillary.
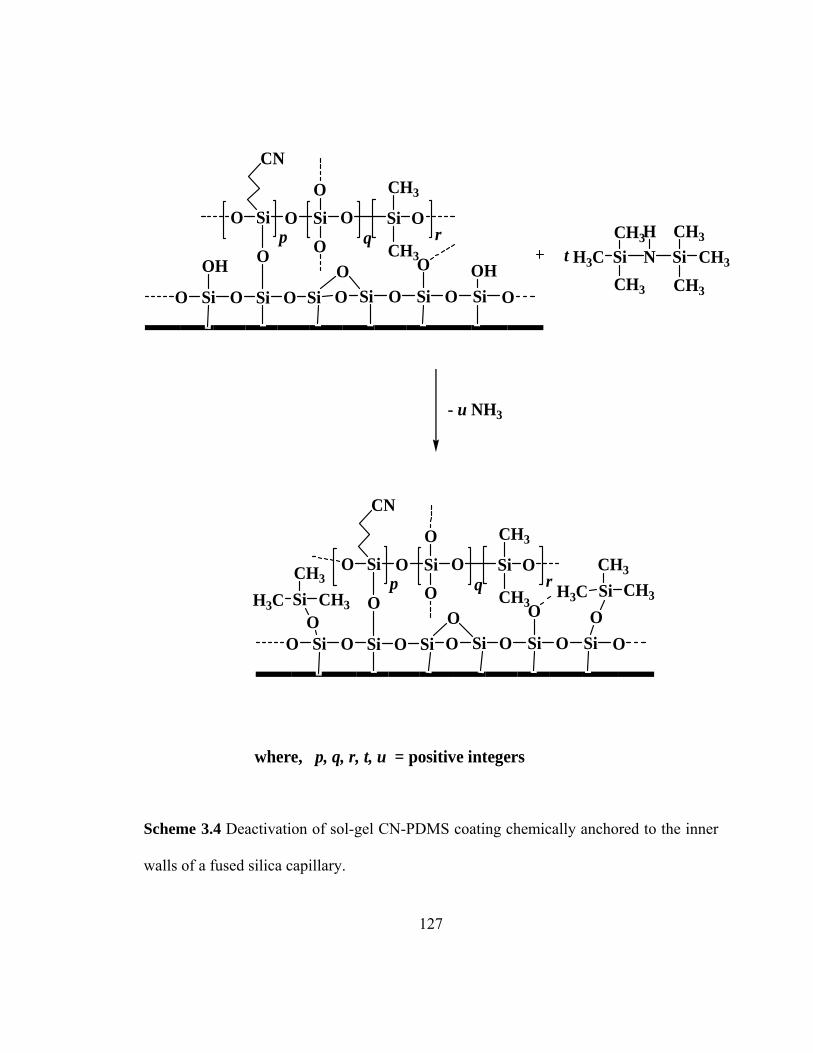
127
Si O Si O Si O SiO O Si OSiOOHOO
OSiO SiOq
O
O
CN
pSi
CH3
CH3r
O
O SiCH3
H3CCH3
N SiCH3
CH3
CH3
H
OH t
where, p, q, r, t, u = positive integers
- u NH3
Si O Si O Si O SiO O Si OSiOOOO
OSiO SiOq
O
O
CN
pSi
CH3
CH3r
O
OO
SiH3C CH3
CH3
SiH3C CH3
CH3
Scheme 3.4 Deactivation of sol-gel CN-PDMS coating chemically anchored to the inner
walls of a fused silica capillary.
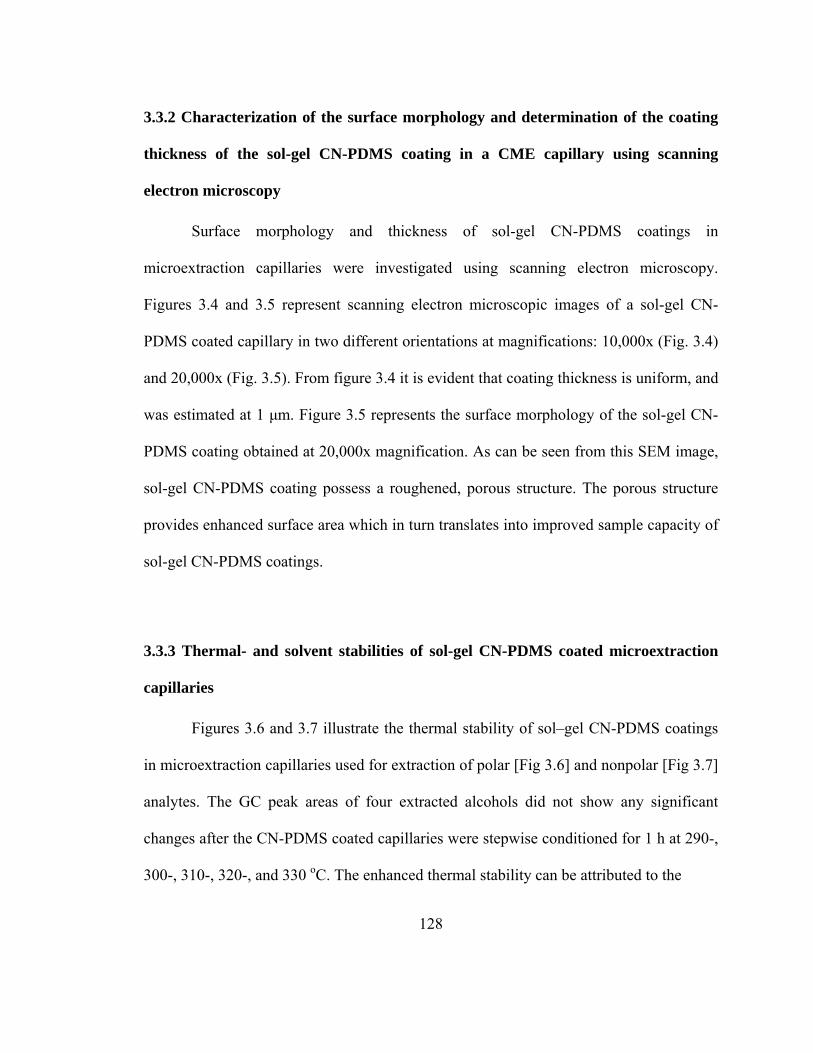
128
3.3.2 Characterization of the surface morphology and determination of the coating
thickness of the sol-gel CN-PDMS coating in a CME capillary using scanning
electron microscopy
Surface morphology and thickness of sol-gel CN-PDMS coatings in
microextraction capillaries were investigated using scanning electron microscopy.
Figures 3.4 and 3.5 represent scanning electron microscopic images of a sol-gel CN-
PDMS coated capillary in two different orientations at magnifications: 10,000x (Fig. 3.4)
and 20,000x (Fig. 3.5). From figure 3.4 it is evident that coating thickness is uniform, and
was estimated at 1 µm. Figure 3.5 represents the surface morphology of the sol-gel CN-
PDMS coating obtained at 20,000x magnification. As can be seen from this SEM image,
sol-gel CN-PDMS coating possess a roughened, porous structure. The porous structure
provides enhanced surface area which in turn translates into improved sample capacity of
sol-gel CN-PDMS coatings.
3.3.3 Thermal- and solvent stabilities of sol-gel CN-PDMS coated microextraction
capillaries
Figures 3.6 and 3.7 illustrate the thermal stability of sol–gel CN-PDMS coatings
in microextraction capillaries used for extraction of polar [Fig 3.6] and nonpolar [Fig 3.7]
analytes. The GC peak areas of four extracted alcohols did not show any significant
changes after the CN-PDMS coated capillaries were stepwise conditioned for 1 h at 290-,
300-, 310-, 320-, and 330 oC. The enhanced thermal stability can be attributed to the
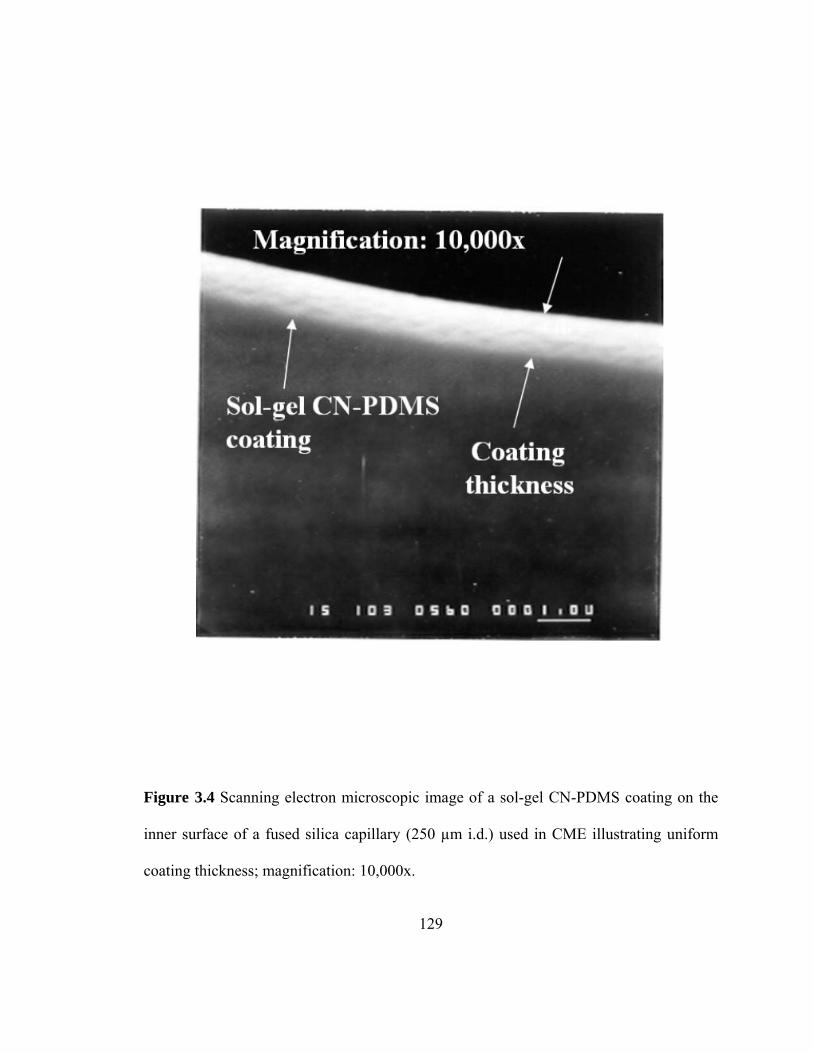
129
Figure 3.4 Scanning electron microscopic image of a sol-gel CN-PDMS coating on the
inner surface of a fused silica capillary (250 µm i.d.) used in CME illustrating uniform
coating thickness; magnification: 10,000x.
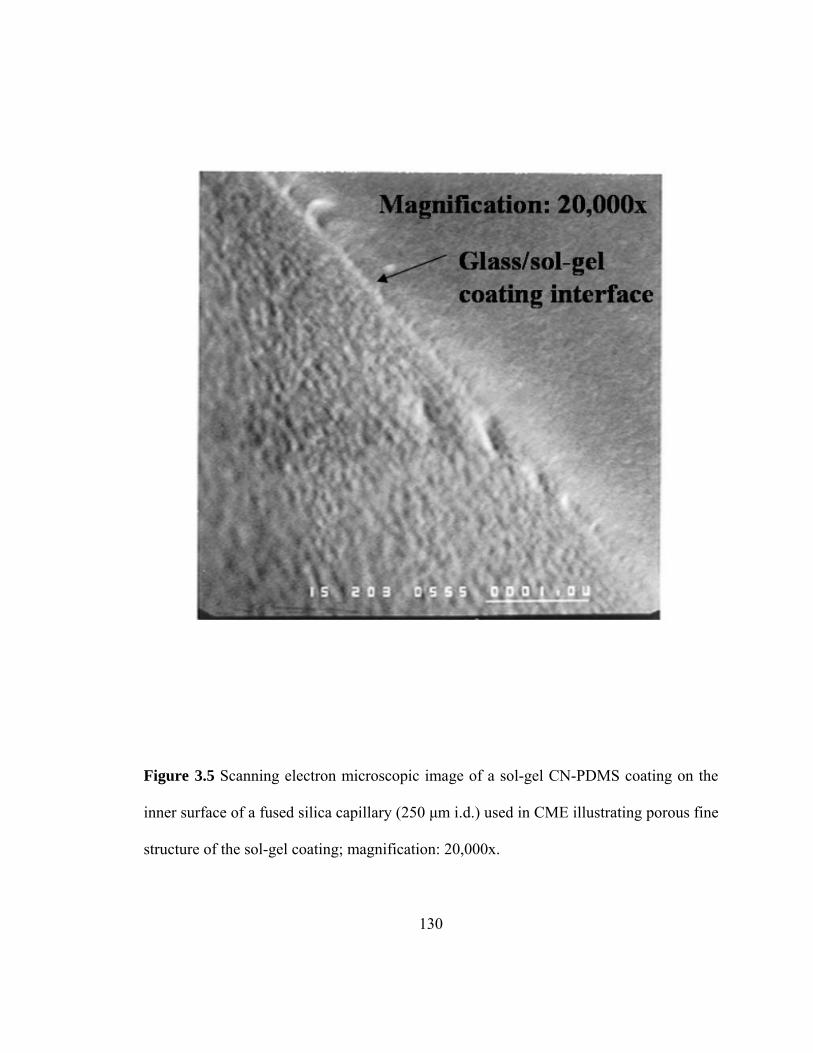
130
Figure 3.5 Scanning electron microscopic image of a sol-gel CN-PDMS coating on the
inner surface of a fused silica capillary (250 µm i.d.) used in CME illustrating porous fine
structure of the sol-gel coating; magnification: 20,000x.
131
strong chemical bonding between sol-gel CN-PDMS coating and the inner walls of the
fused silica capillary. It should be noted that the performance of the sol-gel CN-PDMS
coated capillary with regard to extraction of alcohols was not affected even after
subjecting it to a conditioning temperature of 330 °C. When the microextraction capillary
was heated above 330 °C a reduction in peak area of extracted alcohols was observed.
Since the polar cyanopropyl moieties are mainly responsible for the extraction of these
polar analytes, it can be assumed that such a peak area reduction is associated with
degradation of the cyanopropyl moiety in the sol-gel coating above 330 °C. On the other
hand, no significant change was observed in peak area of nonpolar compounds extracted
with sol-gel CN-PDMS coated capillaries conditioned up to 350 °C. This indicates that
the nonpolar PDMS component of the sol-gel coating (which is responsible for the
extraction nonpolar analytes) was still intact even when the capillary was conditioned at
350 °C. We are not aware of any reports on cyano moiety-containing surface coatings
that can provide stable performance at such a high temperature (330 °C). By comparison,
even the thin conventionally prepared cyanopropylpolysiloxane based GC coatings (~
0.25 µm) that should, in principle, provide better thermal stability (compared to thicker
coating like the ones used in the present work) have upper temperature limit of ~ 275 °C
[40]. Addtionally, sol-gel CN-PDMS coating showed excellent stability toward organic
solvents. As it can be seen in Table 3.2, the performance of the sol-gel CN-PDMS
capillary in CME remained practically unchanged after rinsing it with 50 mL of
dichloromethane/methanol mixture (1:1, v/v) over a 24 h period.
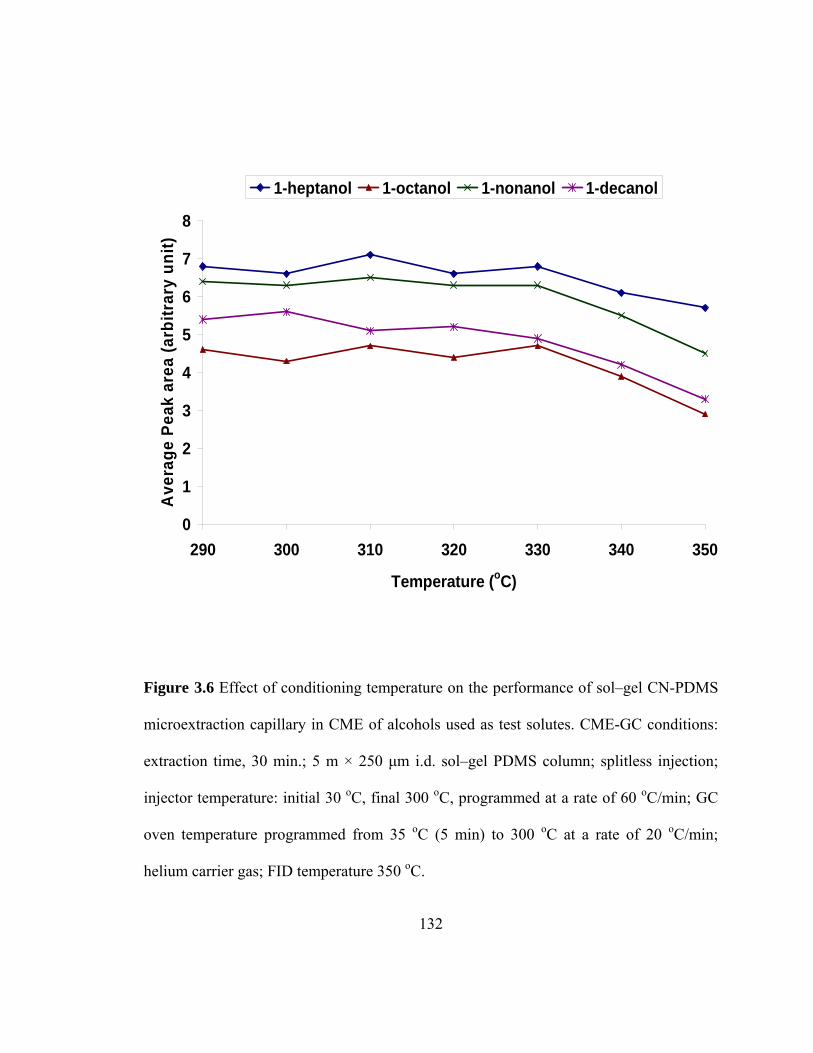
132
0
1
2
3
4
5
6
7
8
290 300 310 320 330 340 350
Temperature (oC)
Ave
rage
Pea
k ar
ea (a
rbitr
ary
unit)
1-heptanol 1-octanol 1-nonanol 1-decanol
Figure 3.6 Effect of conditioning temperature on the performance of sol–gel CN-PDMS
microextraction capillary in CME of alcohols used as test solutes. CME-GC conditions:
extraction time, 30 min.; 5 m × 250 µm i.d. sol–gel PDMS column; splitless injection;
injector temperature: initial 30 oC, final 300 oC, programmed at a rate of 60 oC/min; GC
oven temperature programmed from 35 oC (5 min) to 300 oC at a rate of 20 oC/min;
helium carrier gas; FID temperature 350 oC.
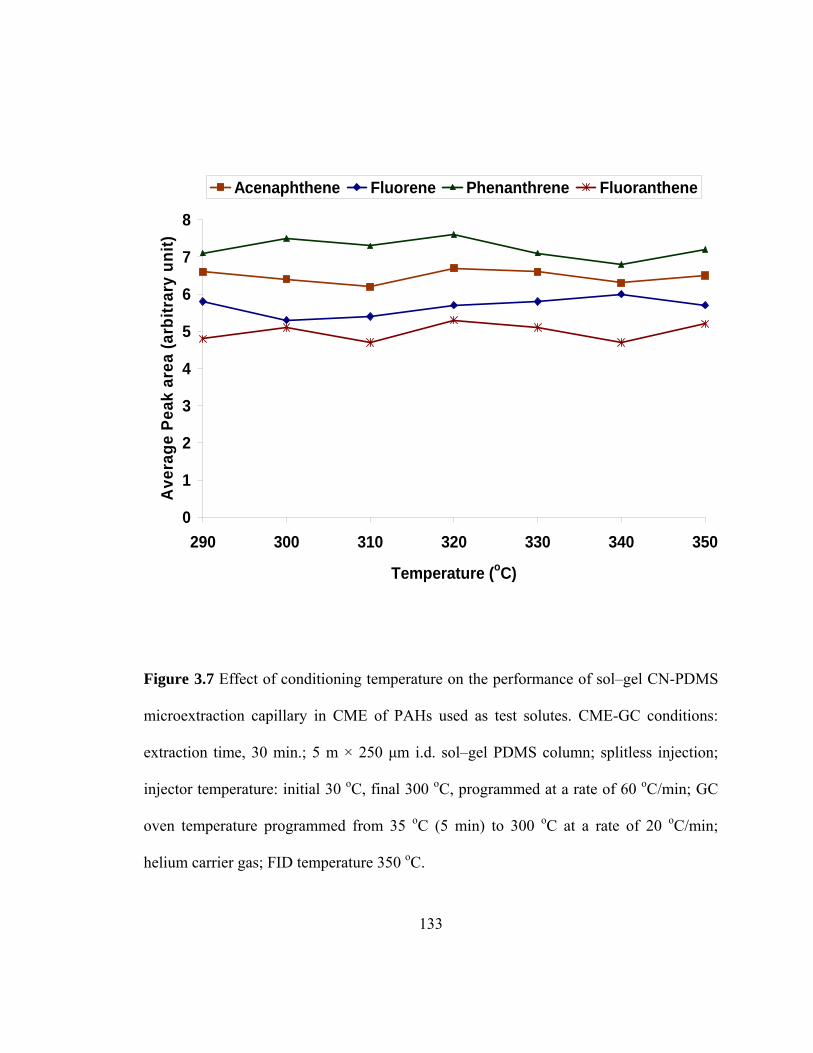
133
0
1
2
3
4
5
6
7
8
290 300 310 320 330 340 350
Temperature (oC)
Ave
rage
Pea
k ar
ea (a
rbitr
ary
unit)
Acenaphthene Fluorene Phenanthrene Fluoranthene
Figure 3.7 Effect of conditioning temperature on the performance of sol–gel CN-PDMS
microextraction capillary in CME of PAHs used as test solutes. CME-GC conditions:
extraction time, 30 min.; 5 m × 250 µm i.d. sol–gel PDMS column; splitless injection;
injector temperature: initial 30 oC, final 300 oC, programmed at a rate of 60 oC/min; GC
oven temperature programmed from 35 oC (5 min) to 300 oC at a rate of 20 oC/min;
helium carrier gas; FID temperature 350 oC.
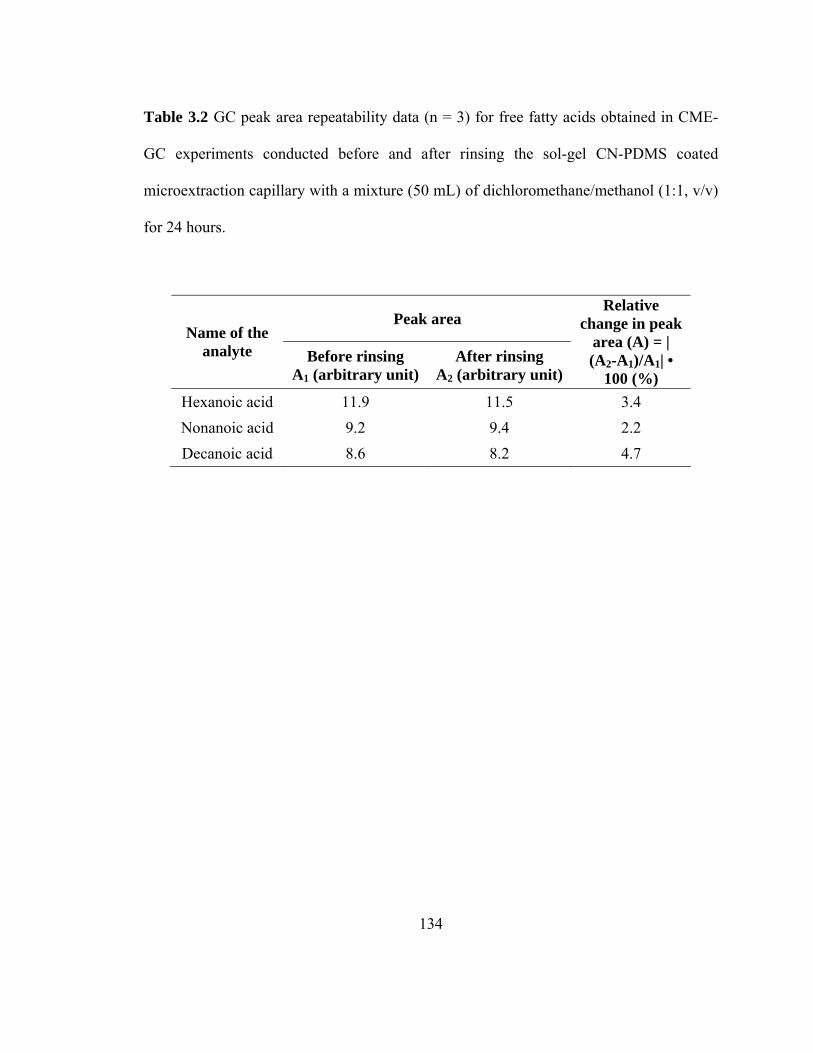
134
Table 3.2 GC peak area repeatability data (n = 3) for free fatty acids obtained in CME-
GC experiments conducted before and after rinsing the sol-gel CN-PDMS coated
microextraction capillary with a mixture (50 mL) of dichloromethane/methanol (1:1, v/v)
for 24 hours.
Peak area Name of the
analyte Before rinsing A1 (arbitrary unit)
After rinsing A2 (arbitrary unit)
Relative change in peak
area (A) = | (A2-A1)/A1| •
100 (%) Hexanoic acid 11.9 11.5 3.4 Nonanoic acid 9.2 9.4 2.2 Decanoic acid 8.6 8.2 4.7
135
3.3.4 Extraction profile of moderately polar and highly polar organic compounds on
sol-gel CN-PDMS coated CME capillary
Figure 3.8 illustrates the extraction kinetics of valerophenone, 2,4,6-
trichlorophenol, 1-nonanol, and nonanoic acid on a sol-gel coated microextraction
capillary. The CME experiments were carried out using aqueous samples of individual
test analytes. The extraction equilibriums for valerophenone and 2,4,6-trichlorophenol
were reached faster (~ 20 minutes) than those for 1-nonanol and nonanoic acid (~ 30
minutes). These results indicate that, compared with 1-nonanol and nonanoic acid,
valerophenone and 2,4,6-trichlorophenol have lower affinity for the aqueous matrix
resulting in their faster extraction. On the other hand, greater hydrophilic nature of 1-
nonanol and nonanoic acid makes the extraction process slower which is evident from
longer equilibration time.
3.3.5 CME-GC analysis of non-polar, moderately polar, and highly polar organic
compounds using sol-gel CN-PDMS coated microextraction capillaries
Sol-gel CN-PDMS coated capillaries were used to extract a variety of analytes
from a wide polarity range (nonpolar to highly polar) and of environmental, biomedical
and ecological importance. Test analytes included polycyclic aromatic hydrocarbons
(PAHs), aldehydes, ketones, aromatic amines, phenols, alcohols and free fatty acids. The
extracted solutes were further analyzed by GC-FID.
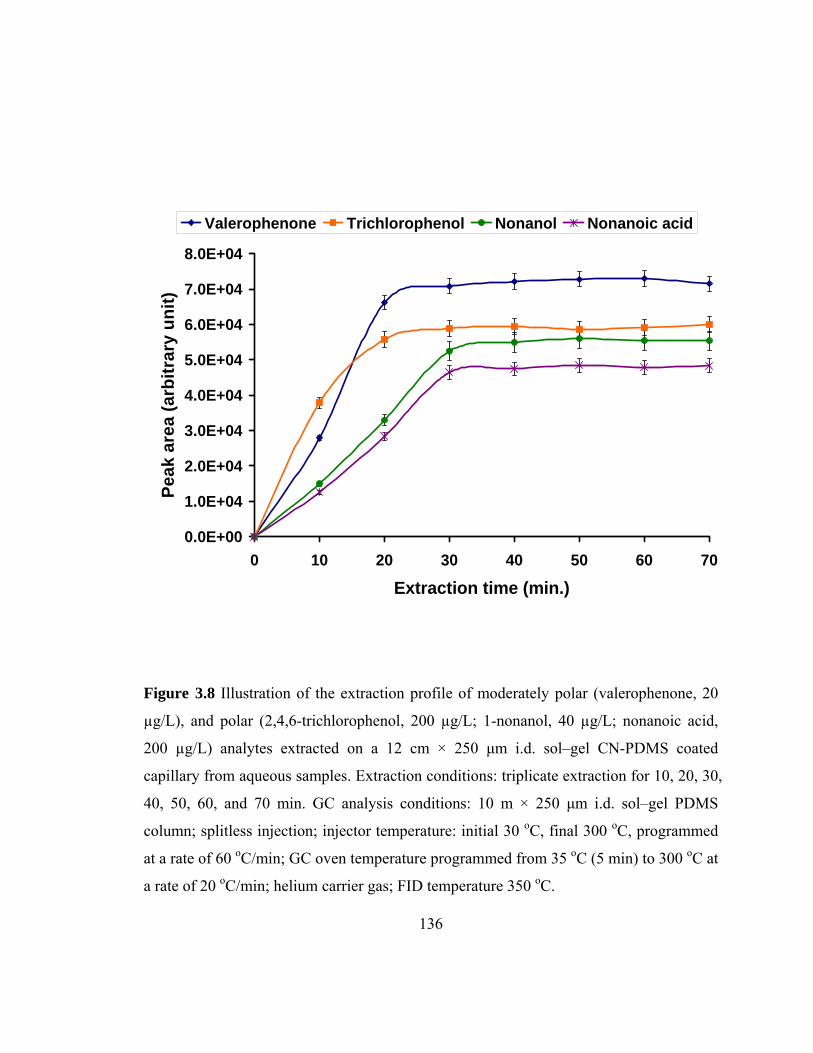
136
0.0E+00
1.0E+04
2.0E+04
3.0E+04
4.0E+04
5.0E+04
6.0E+04
7.0E+04
8.0E+04
0 10 20 30 40 50 60 70
Extraction time (min.)
Peak
are
a (a
rbitr
ary
unit)
Valerophenone Trichlorophenol Nonanol Nonanoic acid
Figure 3.8 Illustration of the extraction profile of moderately polar (valerophenone, 20
µg/L), and polar (2,4,6-trichlorophenol, 200 µg/L; 1-nonanol, 40 µg/L; nonanoic acid,
200 µg/L) analytes extracted on a 12 cm × 250 µm i.d. sol–gel CN-PDMS coated
capillary from aqueous samples. Extraction conditions: triplicate extraction for 10, 20, 30,
40, 50, 60, and 70 min. GC analysis conditions: 10 m × 250 µm i.d. sol–gel PDMS
column; splitless injection; injector temperature: initial 30 oC, final 300 oC, programmed
at a rate of 60 oC/min; GC oven temperature programmed from 35 oC (5 min) to 300 oC at
a rate of 20 oC/min; helium carrier gas; FID temperature 350 oC.
137
3.3.5.1 CME-GC-FID of polycyclic aromatic hydrocarbons using sol-gel CN-PDMS
coated microextraction capillaries
Polycyclic aromatic hydrocarbons are among the most common environmental
pollutants found in air, water, and soil in the USA and other industrialized countries
where petroleum products are heavily used. Due to their potential or proven carcinogenic
activities, US Environmental Protection Agency (EPA) has placed 16 unsubstituted
PAHs in its list of 129 priority pollutants [41]. Among the 16 EPA promulgated
unsubstituted PAH, 4 were extracted and analyzed using sol-gel CN-PDMS coated
microextraction capillaries. Table 3.3 provides a list of 4 selected unsubstituted PAHs,
their chemical structures as well as pertinent physico-chemical properties. Figure 3.9
represents a gas chromatogram of unsubstituted polycyclic aromatic hydrocarbons
extracted using a sol-gel CN-PDMS microextraction capillary from an aqueous sample
(12 µg/L concentration of each). As can be seen from Table 3.4 and Table 3.5 the run-to-
run and capillary-to-capillary peak area relative standard deviation (RSD) values for sol-
gel CN-PDMS capillary were under 5% and 7%, respectively. The detection limits of
ng/L were obtained for PAHs in the CME–GC–FID experiments using sol-gel CN-PDMS
coated microextraction capillaries (Table 3.6). These values are better than the detection
limits reported in the literature. For instance, detection limits obtained for fluorene (3.0
ng/L) and phenanthrene (3.1 ng/L) in our CME-GC-FID experiments were lower than
those reported by Zeng and co-workers [42] for same compounds (i.e. fluorene (5.6 ng/L)
and phenanthrene (8.0 ng/L)) in HS-SPME-GC-FID experiments using sol-gel C4-OH-
138
TSO coating. Also, Doong and co-workers [43] obtained a detection limit of 250 ng/L for
fluoranthene by SPME-GC-FID on a commercial PDMS (100 µm) coated fiber, which is
much higher than the value 4.1 ng/L obtained for the same compound on sol-gel CN-
PDMS coated microextraction capillary in CME-GC-FID experiments. All data for
detection limits were calculated using a signal-to-noise ratio of 3.
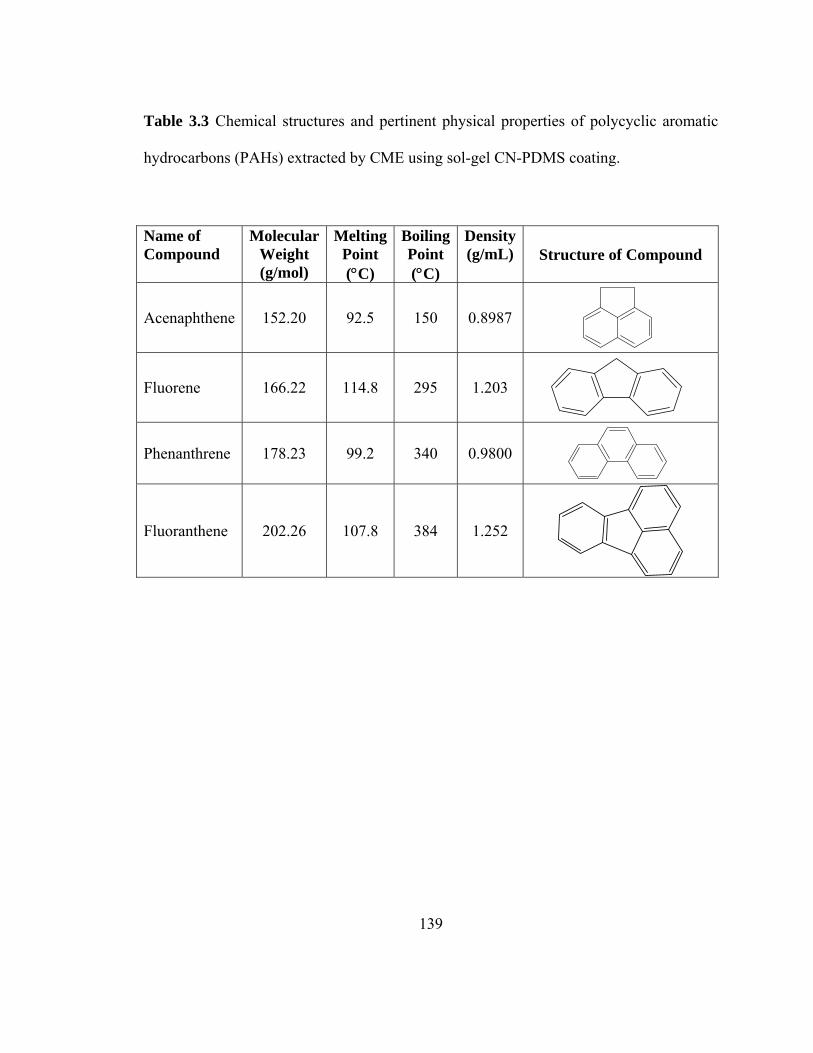
139
Table 3.3 Chemical structures and pertinent physical properties of polycyclic aromatic
hydrocarbons (PAHs) extracted by CME using sol-gel CN-PDMS coating.
Name of Compound
Molecular Weight (g/mol)
Melting Point (°C)
Boiling Point (°C)
Density(g/mL) Structure of Compound
Acenaphthene 152.20 92.5 150 0.8987
Fluorene 166.22 114.8 295 1.203
Phenanthrene 178.23 99.2 340 0.9800
Fluoranthene 202.26 107.8 384 1.252
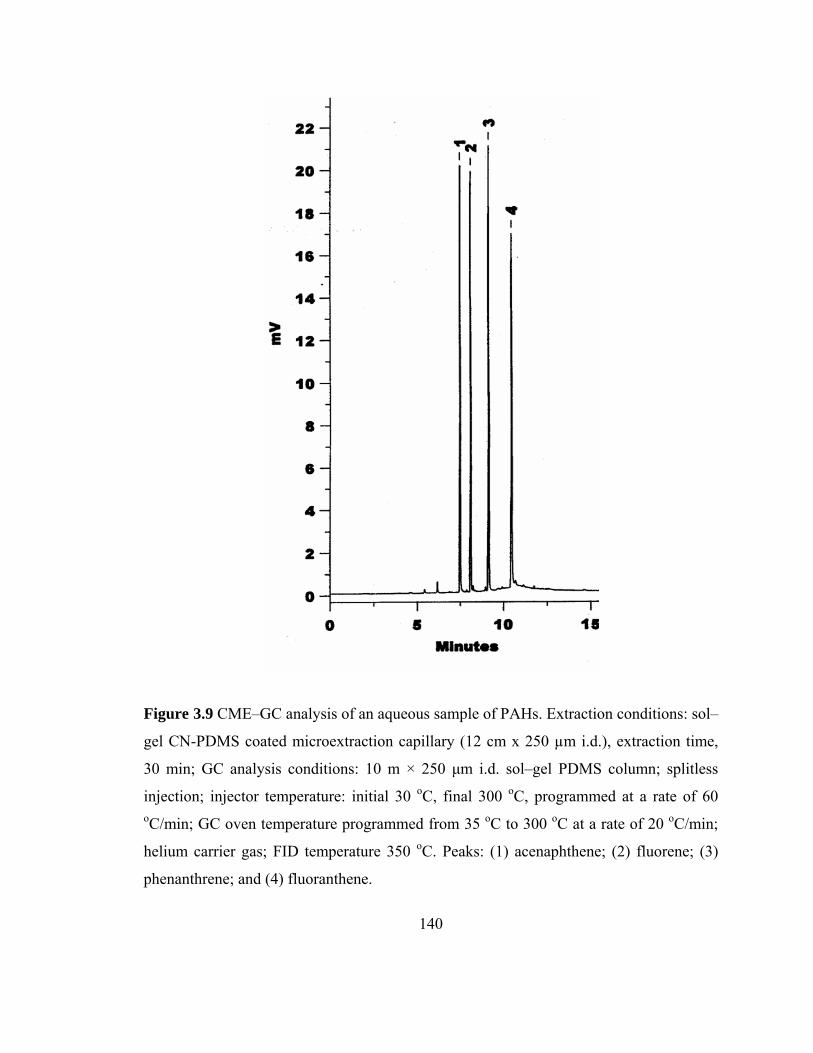
140
Figure 3.9 CME–GC analysis of an aqueous sample of PAHs. Extraction conditions: sol–
gel CN-PDMS coated microextraction capillary (12 cm x 250 µm i.d.), extraction time,
30 min; GC analysis conditions: 10 m × 250 µm i.d. sol–gel PDMS column; splitless
injection; injector temperature: initial 30 oC, final 300 oC, programmed at a rate of 60 oC/min; GC oven temperature programmed from 35 oC to 300 oC at a rate of 20 oC/min;
helium carrier gas; FID temperature 350 oC. Peaks: (1) acenaphthene; (2) fluorene; (3)
phenanthrene; and (4) fluoranthene.
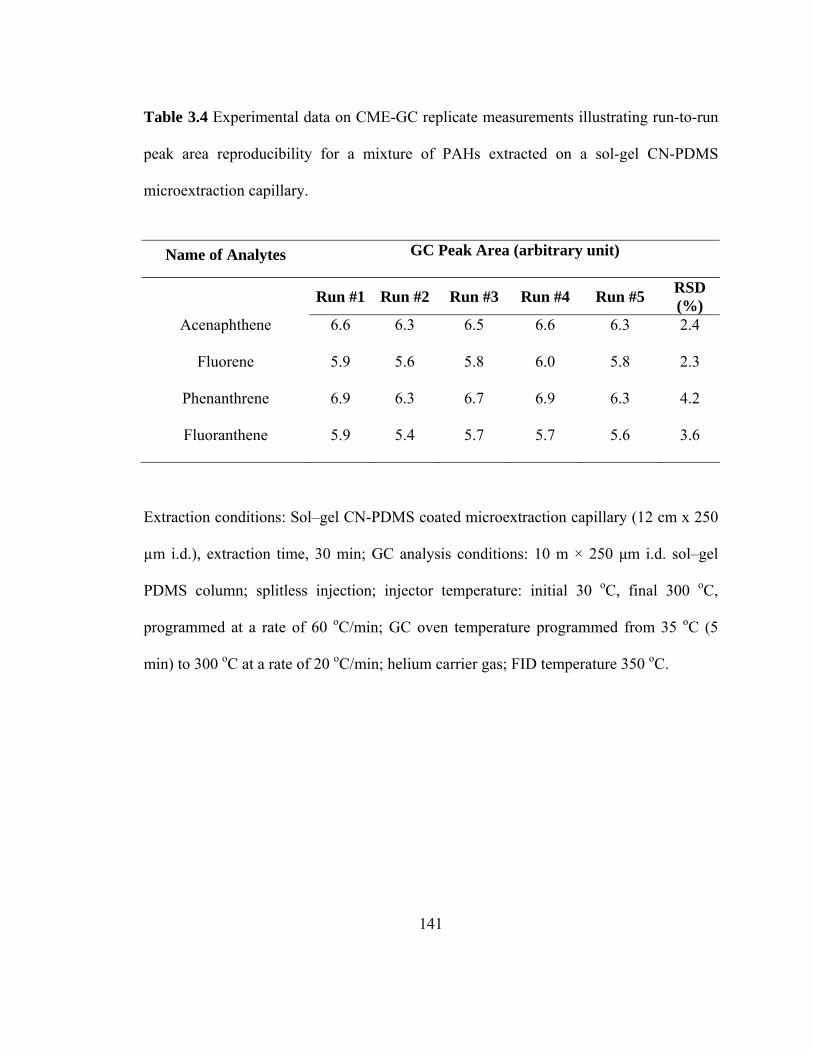
141
Table 3.4 Experimental data on CME-GC replicate measurements illustrating run-to-run
peak area reproducibility for a mixture of PAHs extracted on a sol-gel CN-PDMS
microextraction capillary.
Name of Analytes GC Peak Area (arbitrary unit)
Run #1 Run #2 Run #3 Run #4 Run #5 RSD (%)
Acenaphthene 6.6 6.3 6.5 6.6 6.3 2.4
Fluorene 5.9 5.6 5.8 6.0 5.8 2.3
Phenanthrene 6.9 6.3 6.7 6.9 6.3 4.2
Fluoranthene 5.9 5.4 5.7 5.7 5.6 3.6
Extraction conditions: Sol–gel CN-PDMS coated microextraction capillary (12 cm x 250
µm i.d.), extraction time, 30 min; GC analysis conditions: 10 m × 250 µm i.d. sol–gel
PDMS column; splitless injection; injector temperature: initial 30 oC, final 300 oC,
programmed at a rate of 60 oC/min; GC oven temperature programmed from 35 oC (5
min) to 300 oC at a rate of 20 oC/min; helium carrier gas; FID temperature 350 oC.
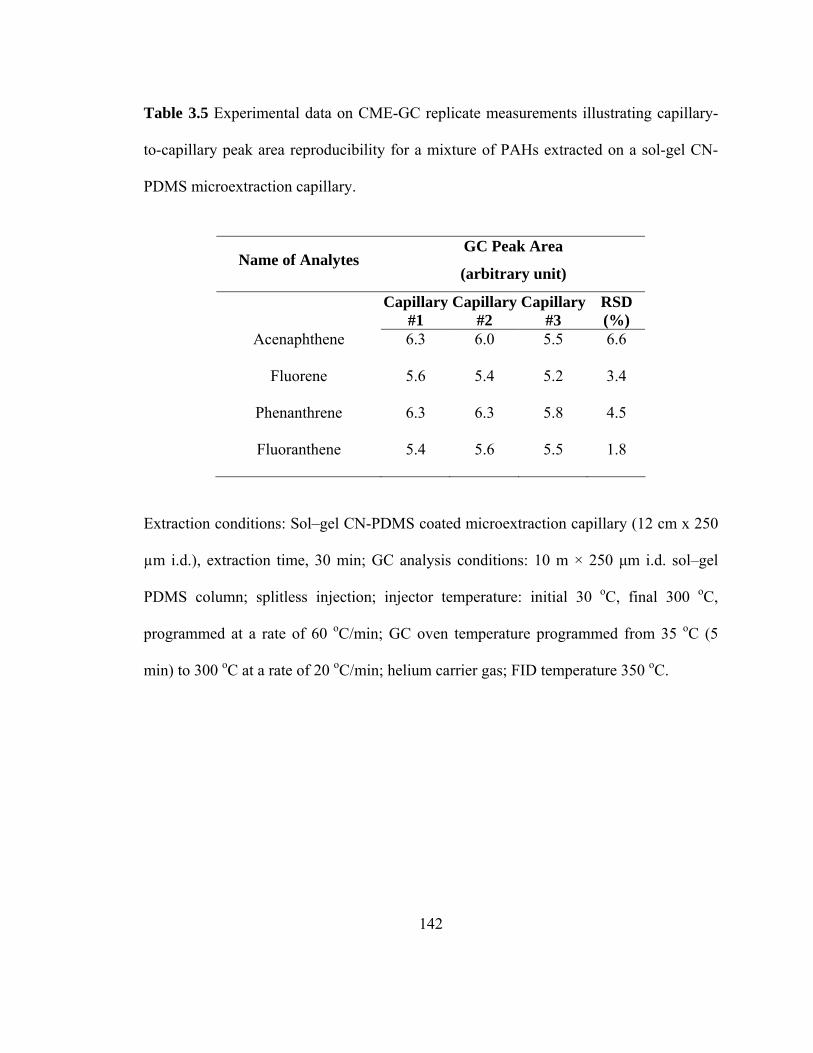
142
Table 3.5 Experimental data on CME-GC replicate measurements illustrating capillary-
to-capillary peak area reproducibility for a mixture of PAHs extracted on a sol-gel CN-
PDMS microextraction capillary.
Name of Analytes GC Peak Area
(arbitrary unit)
Capillary #1
Capillary#2
Capillary #3
RSD (%)
Acenaphthene 6.3 6.0 5.5 6.6
Fluorene 5.6 5.4 5.2 3.4
Phenanthrene 6.3 6.3 5.8 4.5
Fluoranthene 5.4 5.6 5.5 1.8
Extraction conditions: Sol–gel CN-PDMS coated microextraction capillary (12 cm x 250
µm i.d.), extraction time, 30 min; GC analysis conditions: 10 m × 250 µm i.d. sol–gel
PDMS column; splitless injection; injector temperature: initial 30 oC, final 300 oC,
programmed at a rate of 60 oC/min; GC oven temperature programmed from 35 oC (5
min) to 300 oC at a rate of 20 oC/min; helium carrier gas; FID temperature 350 oC.
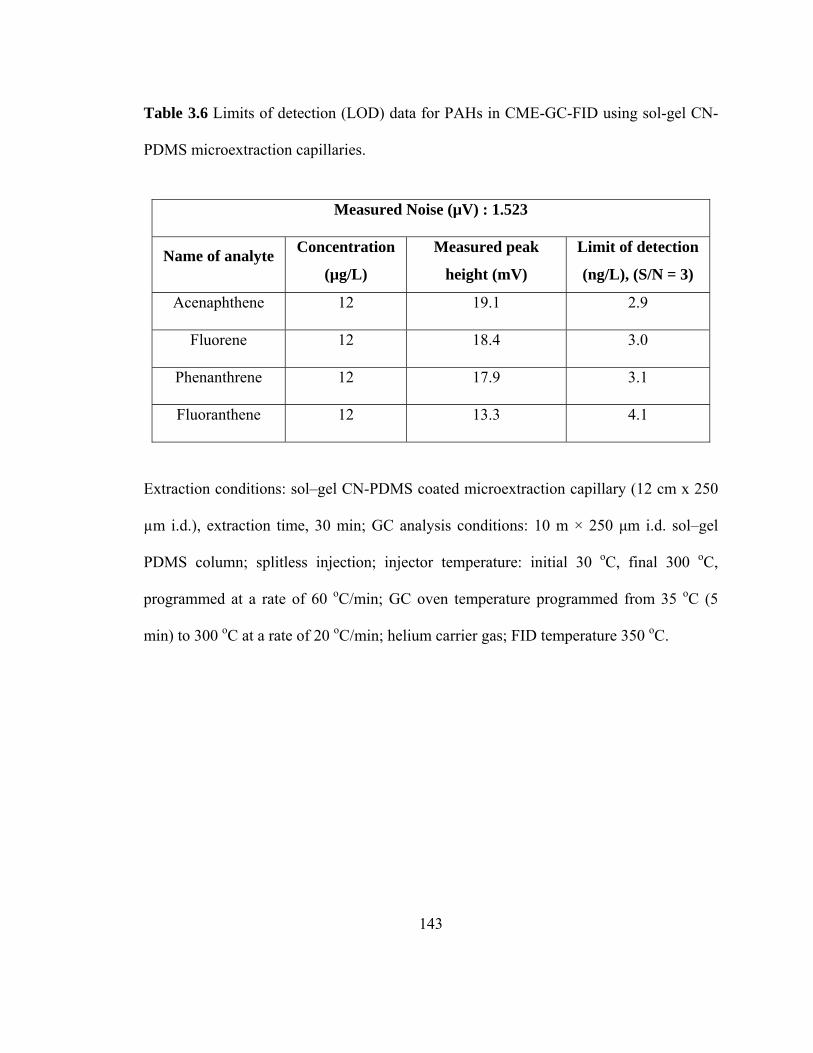
143
Table 3.6 Limits of detection (LOD) data for PAHs in CME-GC-FID using sol-gel CN-
PDMS microextraction capillaries.
Measured Noise (µV) : 1.523
Name of analyte Concentration
(µg/L)
Measured peak
height (mV)
Limit of detection
(ng/L), (S/N = 3)
Acenaphthene 12 19.1 2.9
Fluorene 12 18.4 3.0
Phenanthrene 12 17.9 3.1
Fluoranthene 12 13.3 4.1
Extraction conditions: sol–gel CN-PDMS coated microextraction capillary (12 cm x 250
µm i.d.), extraction time, 30 min; GC analysis conditions: 10 m × 250 µm i.d. sol–gel
PDMS column; splitless injection; injector temperature: initial 30 oC, final 300 oC,
programmed at a rate of 60 oC/min; GC oven temperature programmed from 35 oC (5
min) to 300 oC at a rate of 20 oC/min; helium carrier gas; FID temperature 350 oC.
144
3.3.5.2 CME-GC-FID of aldehydes and ketones using sol-gel CN-PDMS coated
microextraction capillaries
Aldehydes and ketones are known to have toxic and carcinogenic properties, and
therefore, their presence in the environment is of great concern [44]. They are formed as
by-products in the drinking water disinfection processes. Many of these by-products have
been shown to be carcinogens or carcinogen suspects [45,46]. Due to the polar nature of
these compounds, they are often derivatized [47] for GC analysis to avoid undesirable
adsorption that leads to peak tailing and analyte loss. Although analytical derivatizations
are effective, they involve additional steps in the sample preparation scheme. These
reactions may not be quantitative, especially for samples containing ultra trace
concentrations of the analytes. They may also produce side products capable of
interfering with the analysis. For these reasons, it is not always desirable to use
derivatization of the target analyte.
We extracted four underivatized aldehydes using sol-gel CN-PDMS coated
microextraction capillaries. List of these aldehydes is provided in Table 3.7. Figure 3.10
is a gas chromatogram representing CME-GC-FID analysis of a mixture of four
underivatized aldehydes. Experimental data on replicate CME-GC-FID have been
presented in Table 3.8, Table 3.9. It demonstrates remarkable ability of sol-gel CN-
PDMS capillaries to reproducibly extract aldehydes from aqueous medium. We were also
able to achieve detection limits (e.g., 0.002 µg/L for nonanal and 0.005 µg/L for
dodecanal) lower than those reported in the literature for the same compounds (e.g., 0.33
145
µg/L for nonanal and 0.05 µg/L for dodecanal) [38]. Table 3.10 represents the calculated
detection limits for underivatized aldehydes.
Table 3.11 provides a list of 5 ketones that were extracted from aqueous samples
using sol-gel CN-PDMS coated capillaries. As can be seen from Figure 3.11, the sol-gel
CN-PDMS coated capillaries were found to be effective in extracting four underivatized
ketones from an aqueous sample. CME-GC-FID results are presented in Table 3.12,
Table 3.13. Excellent reproducibility for the capillary microextraction of ketones (RSD
values for run-to-run and capillary-to-capillary reproducibility were under 5 %)
demonstrates the versatility of the sol–gel CN-PDMS coatings and the sol-gel procedure
used to prepare the extraction capillaries. Also, the detection limits of ng/L were obtained
for ketone in the CME–GC–FID experiments using sol–gel CN-PDMS coated
microextraction capillaries (Table 3.14). These values are better than the detection limits
reported in the literature. For instance, detection limits obtained for hexanophenone (2.3
ng/L) and anthraquinone (4.7 ng/L) using sol-gel CN-PDMS coated microextraction
capillaries were lower than those reported for same compounds (i.e. hexanophenone (109
ng/L) and anthraquinone (32 ng/L)) using sol-gel PDMS coated microextraction
capillaries [30].
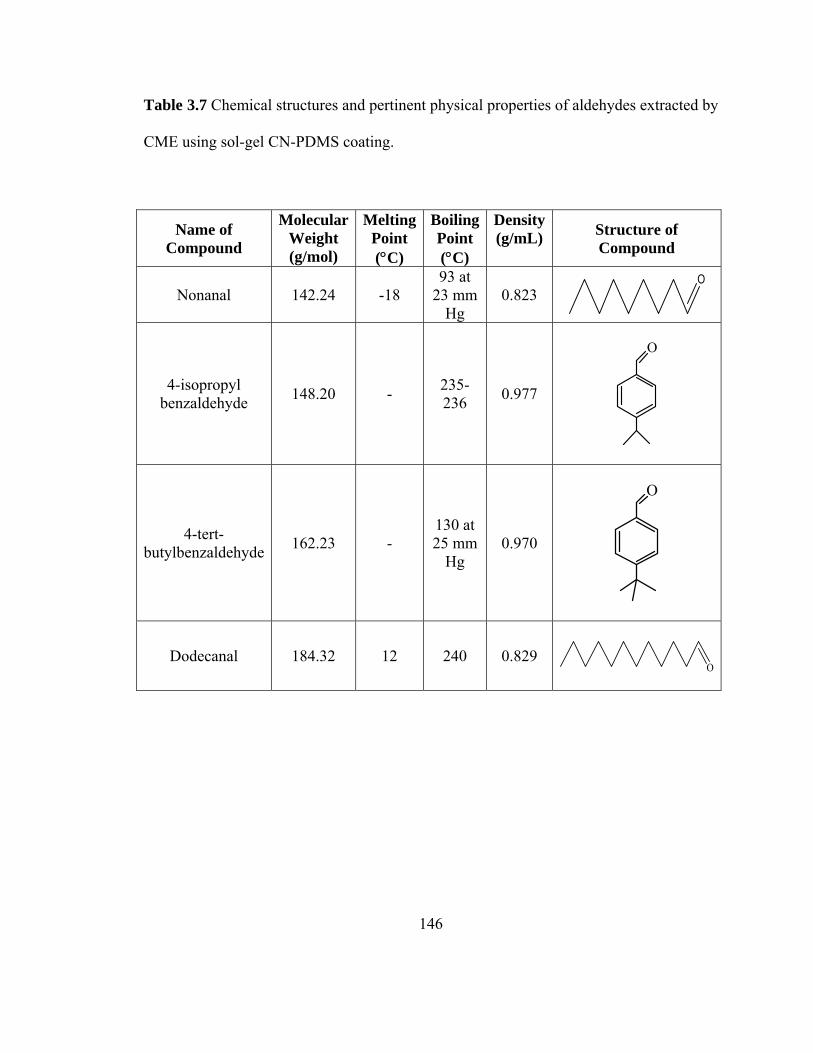
146
Table 3.7 Chemical structures and pertinent physical properties of aldehydes extracted by
CME using sol-gel CN-PDMS coating.
Name of Compound
Molecular Weight (g/mol)
Melting Point (°C)
Boiling Point (°C)
Density(g/mL) Structure of
Compound
Nonanal 142.24 -18 93 at
23 mm Hg
0.823 O
4-isopropyl benzaldehyde 148.20 - 235-
236 0.977
O
4-tert-butylbenzaldehyde 162.23 -
130 at 25 mm
Hg 0.970
O
Dodecanal 184.32 12 240 0.829
O
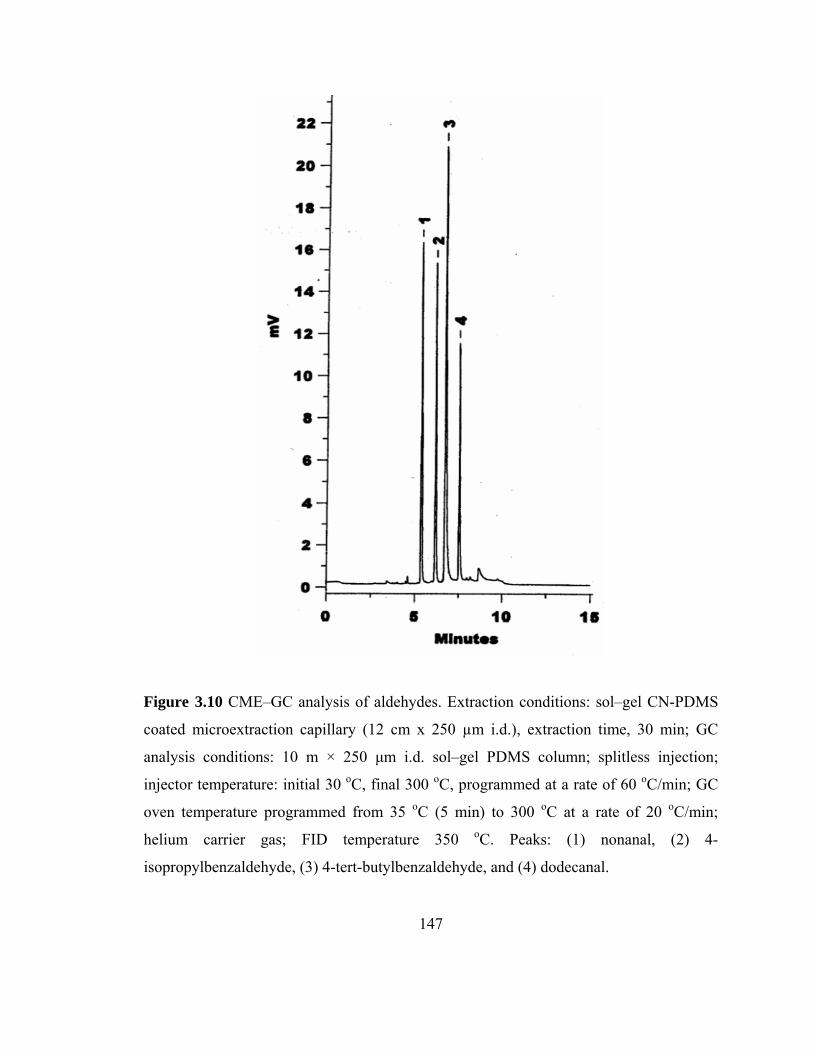
147
Figure 3.10 CME–GC analysis of aldehydes. Extraction conditions: sol–gel CN-PDMS
coated microextraction capillary (12 cm x 250 µm i.d.), extraction time, 30 min; GC
analysis conditions: 10 m × 250 µm i.d. sol–gel PDMS column; splitless injection;
injector temperature: initial 30 oC, final 300 oC, programmed at a rate of 60 oC/min; GC
oven temperature programmed from 35 oC (5 min) to 300 oC at a rate of 20 oC/min;
helium carrier gas; FID temperature 350 oC. Peaks: (1) nonanal, (2) 4-
isopropylbenzaldehyde, (3) 4-tert-butylbenzaldehyde, and (4) dodecanal.
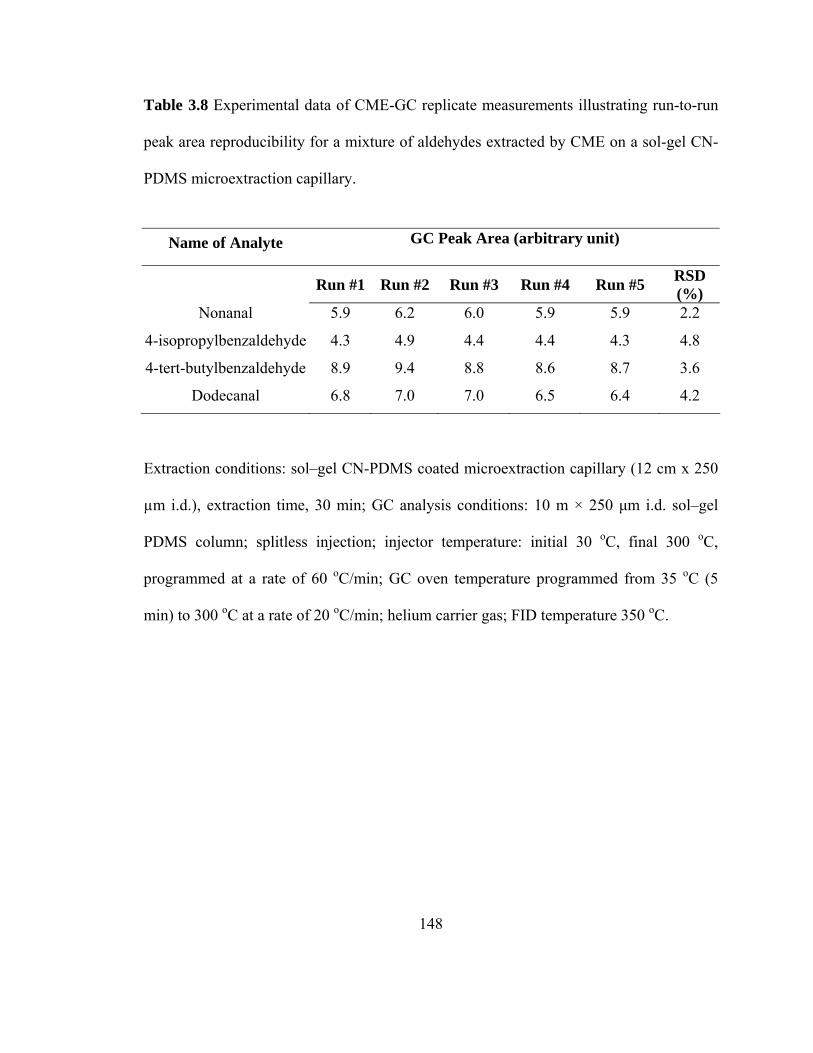
148
Table 3.8 Experimental data of CME-GC replicate measurements illustrating run-to-run
peak area reproducibility for a mixture of aldehydes extracted by CME on a sol-gel CN-
PDMS microextraction capillary.
Name of Analyte GC Peak Area (arbitrary unit)
Run #1 Run #2 Run #3 Run #4 Run #5 RSD (%)
Nonanal 5.9 6.2 6.0 5.9 5.9 2.2
4-isopropylbenzaldehyde 4.3 4.9 4.4 4.4 4.3 4.8
4-tert-butylbenzaldehyde 8.9 9.4 8.8 8.6 8.7 3.6
Dodecanal 6.8 7.0 7.0 6.5 6.4 4.2
Extraction conditions: sol–gel CN-PDMS coated microextraction capillary (12 cm x 250
µm i.d.), extraction time, 30 min; GC analysis conditions: 10 m × 250 µm i.d. sol–gel
PDMS column; splitless injection; injector temperature: initial 30 oC, final 300 oC,
programmed at a rate of 60 oC/min; GC oven temperature programmed from 35 oC (5
min) to 300 oC at a rate of 20 oC/min; helium carrier gas; FID temperature 350 oC.
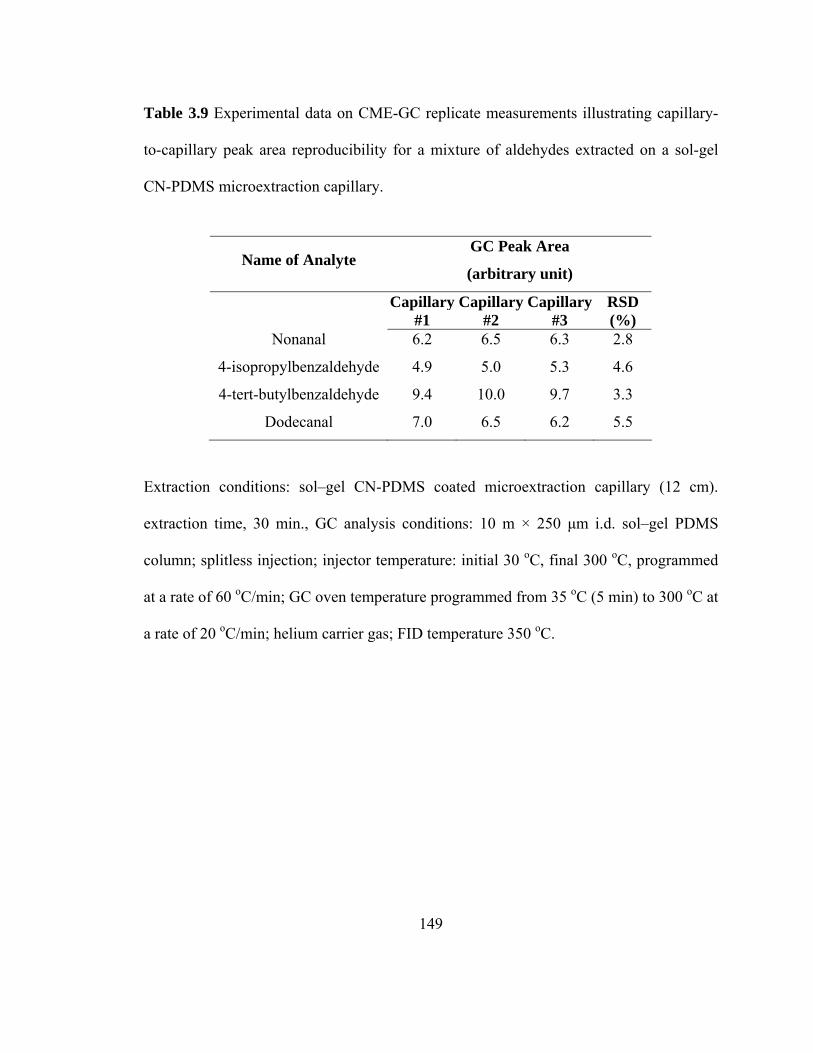
149
Table 3.9 Experimental data on CME-GC replicate measurements illustrating capillary-
to-capillary peak area reproducibility for a mixture of aldehydes extracted on a sol-gel
CN-PDMS microextraction capillary.
Name of Analyte GC Peak Area
(arbitrary unit)
Capillary #1
Capillary#2
Capillary #3
RSD (%)
Nonanal 6.2 6.5 6.3 2.8
4-isopropylbenzaldehyde 4.9 5.0 5.3 4.6
4-tert-butylbenzaldehyde 9.4 10.0 9.7 3.3
Dodecanal 7.0 6.5 6.2 5.5
Extraction conditions: sol–gel CN-PDMS coated microextraction capillary (12 cm).
extraction time, 30 min., GC analysis conditions: 10 m × 250 µm i.d. sol–gel PDMS
column; splitless injection; injector temperature: initial 30 oC, final 300 oC, programmed
at a rate of 60 oC/min; GC oven temperature programmed from 35 oC (5 min) to 300 oC at
a rate of 20 oC/min; helium carrier gas; FID temperature 350 oC.
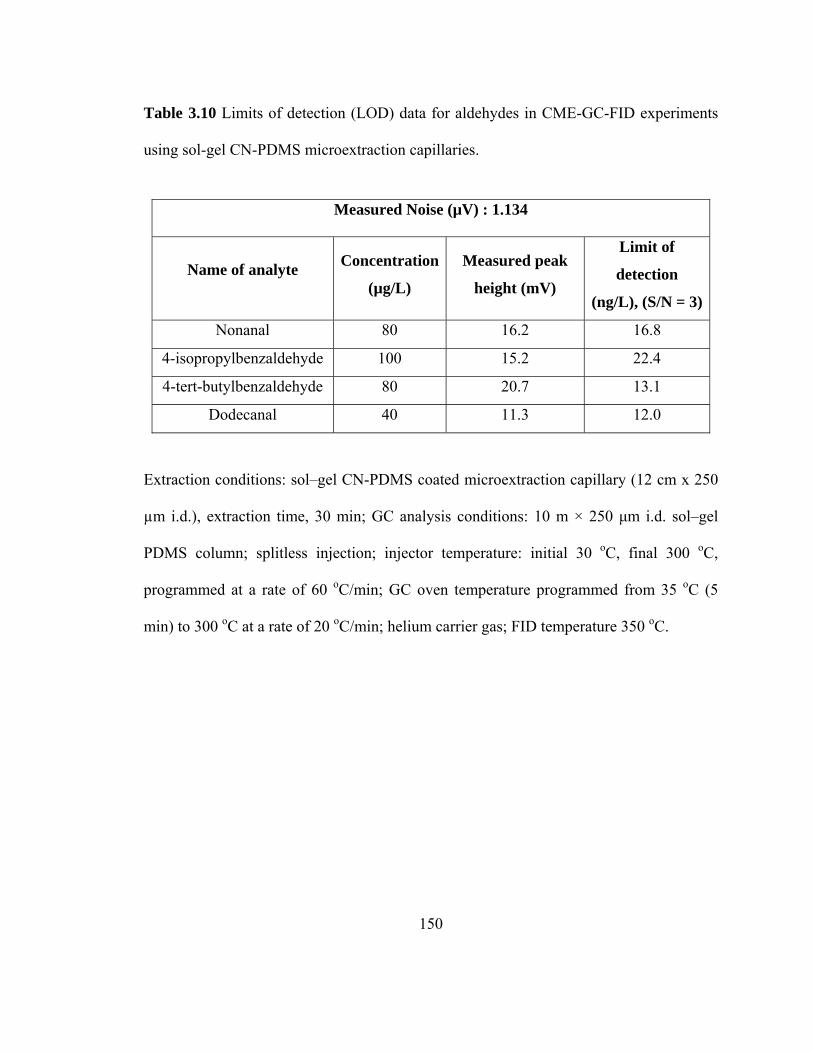
150
Table 3.10 Limits of detection (LOD) data for aldehydes in CME-GC-FID experiments
using sol-gel CN-PDMS microextraction capillaries.
Measured Noise (µV) : 1.134
Name of analyte Concentration
(µg/L)
Measured peak
height (mV)
Limit of
detection
(ng/L), (S/N = 3)
Nonanal 80 16.2 16.8
4-isopropylbenzaldehyde 100 15.2 22.4
4-tert-butylbenzaldehyde 80 20.7 13.1
Dodecanal 40 11.3 12.0
Extraction conditions: sol–gel CN-PDMS coated microextraction capillary (12 cm x 250
µm i.d.), extraction time, 30 min; GC analysis conditions: 10 m × 250 µm i.d. sol–gel
PDMS column; splitless injection; injector temperature: initial 30 oC, final 300 oC,
programmed at a rate of 60 oC/min; GC oven temperature programmed from 35 oC (5
min) to 300 oC at a rate of 20 oC/min; helium carrier gas; FID temperature 350 oC.

151
Table 3.11 Chemical structures and pertinent physical properties of ketones extracted by
CME using sol-gel CN-PDMS coating.
Name of Compound
Molecular Weight (g/mol)
Melting Point (°C)
Boiling Point (°C)
Density(g/mL) Structure of
Compound
Butyrophenone 148.20 11 - 13 220- 222 0.988
O
Valerophenone 162.23 -9
105 - 107 at 5 mm
Hg
0.988
O
Hexanophenone 176.26 25 - 26 265.1 0.958
O
Benzophenone 182.22 48.5 305.4 1.11
O
Anthraquinone 208.22 286 380 1.438
O
O
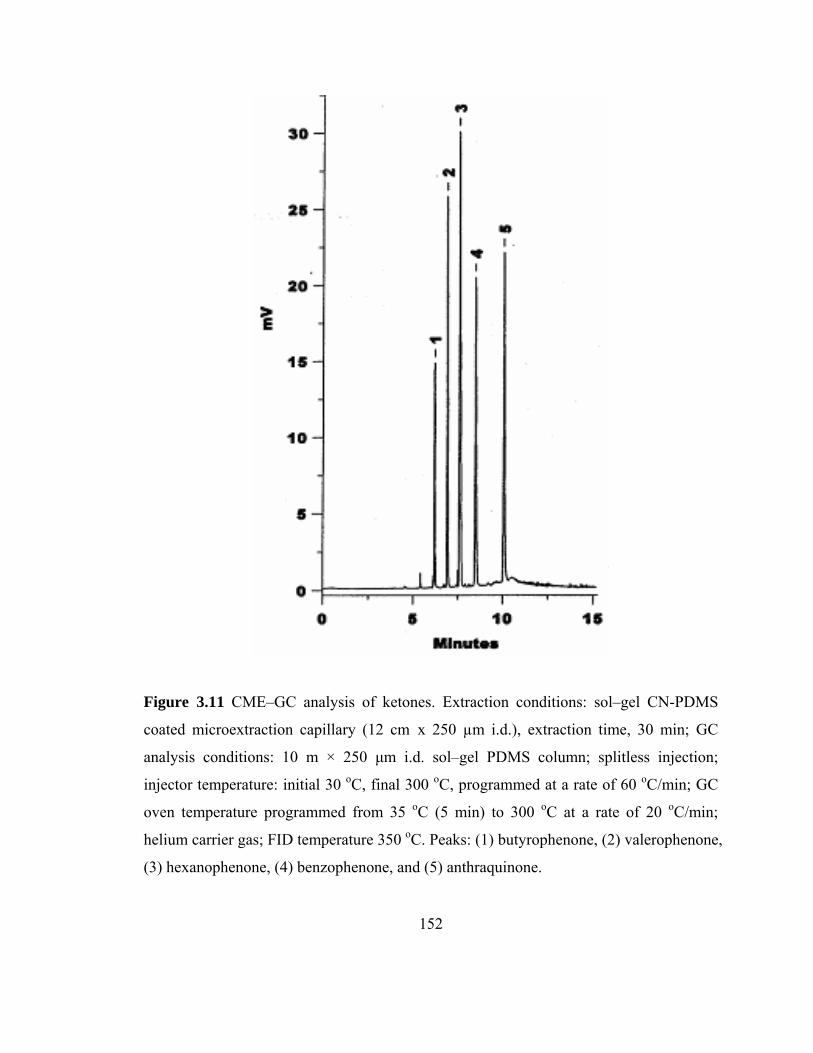
152
Figure 3.11 CME–GC analysis of ketones. Extraction conditions: sol–gel CN-PDMS
coated microextraction capillary (12 cm x 250 µm i.d.), extraction time, 30 min; GC
analysis conditions: 10 m × 250 µm i.d. sol–gel PDMS column; splitless injection;
injector temperature: initial 30 oC, final 300 oC, programmed at a rate of 60 oC/min; GC
oven temperature programmed from 35 oC (5 min) to 300 oC at a rate of 20 oC/min;
helium carrier gas; FID temperature 350 oC. Peaks: (1) butyrophenone, (2) valerophenone,
(3) hexanophenone, (4) benzophenone, and (5) anthraquinone.
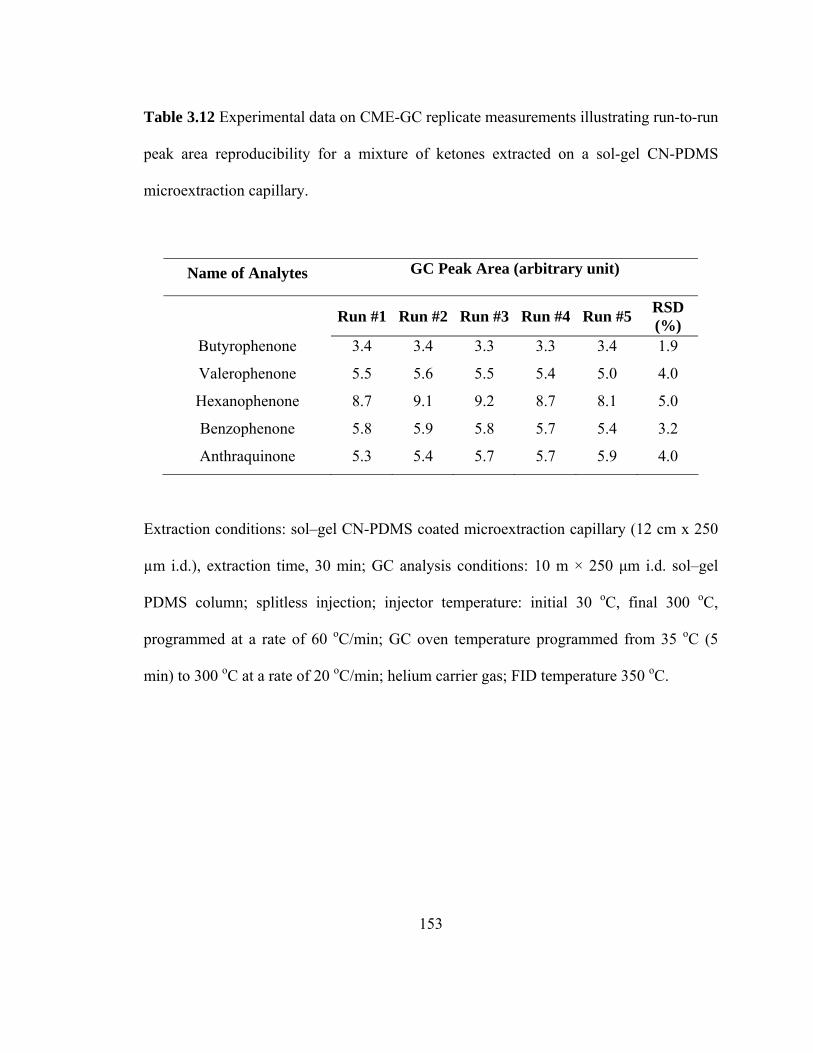
153
Table 3.12 Experimental data on CME-GC replicate measurements illustrating run-to-run
peak area reproducibility for a mixture of ketones extracted on a sol-gel CN-PDMS
microextraction capillary.
Name of Analytes GC Peak Area (arbitrary unit)
Run #1 Run #2 Run #3 Run #4 Run #5 RSD
(%) Butyrophenone 3.4 3.4 3.3 3.3 3.4 1.9
Valerophenone 5.5 5.6 5.5 5.4 5.0 4.0
Hexanophenone 8.7 9.1 9.2 8.7 8.1 5.0
Benzophenone 5.8 5.9 5.8 5.7 5.4 3.2
Anthraquinone 5.3 5.4 5.7 5.7 5.9 4.0
Extraction conditions: sol–gel CN-PDMS coated microextraction capillary (12 cm x 250
µm i.d.), extraction time, 30 min; GC analysis conditions: 10 m × 250 µm i.d. sol–gel
PDMS column; splitless injection; injector temperature: initial 30 oC, final 300 oC,
programmed at a rate of 60 oC/min; GC oven temperature programmed from 35 oC (5
min) to 300 oC at a rate of 20 oC/min; helium carrier gas; FID temperature 350 oC.
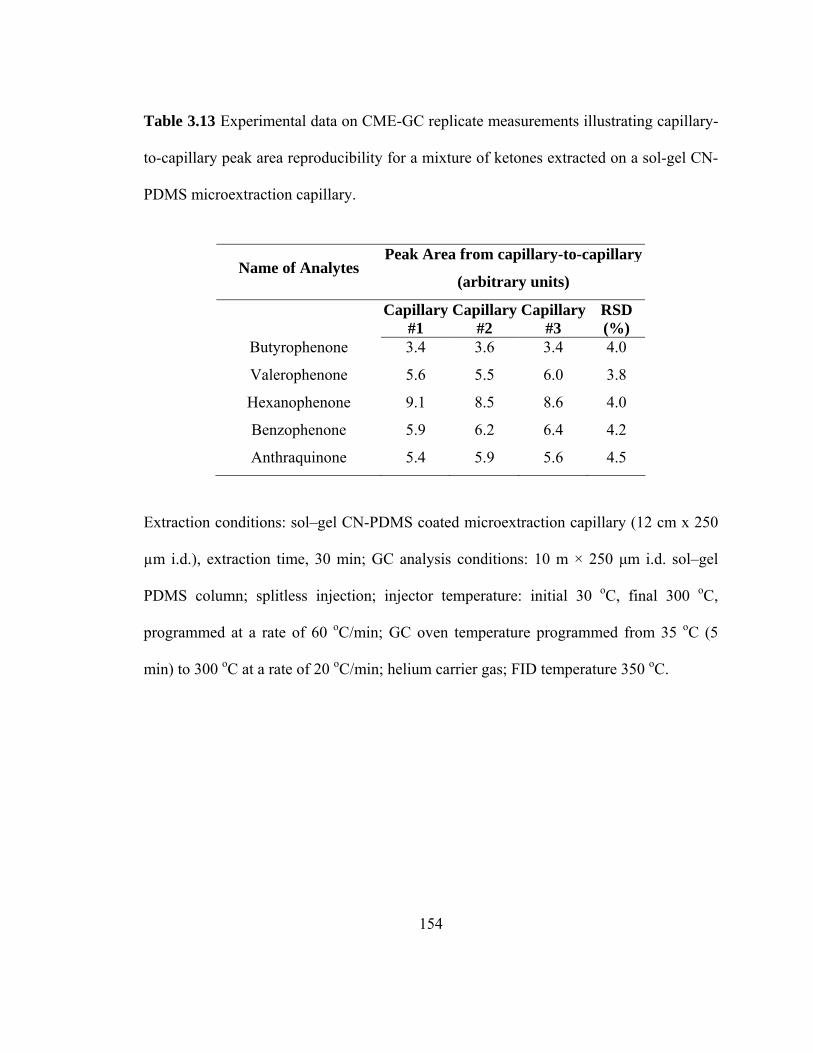
154
Table 3.13 Experimental data on CME-GC replicate measurements illustrating capillary-
to-capillary peak area reproducibility for a mixture of ketones extracted on a sol-gel CN-
PDMS microextraction capillary.
Name of Analytes Peak Area from capillary-to-capillary
(arbitrary units)
Capillary #1
Capillary#2
Capillary #3
RSD (%)
Butyrophenone 3.4 3.6 3.4 4.0
Valerophenone 5.6 5.5 6.0 3.8
Hexanophenone 9.1 8.5 8.6 4.0
Benzophenone 5.9 6.2 6.4 4.2
Anthraquinone 5.4 5.9 5.6 4.5
Extraction conditions: sol–gel CN-PDMS coated microextraction capillary (12 cm x 250
µm i.d.), extraction time, 30 min; GC analysis conditions: 10 m × 250 µm i.d. sol–gel
PDMS column; splitless injection; injector temperature: initial 30 oC, final 300 oC,
programmed at a rate of 60 oC/min; GC oven temperature programmed from 35 oC (5
min) to 300 oC at a rate of 20 oC/min; helium carrier gas; FID temperature 350 oC.
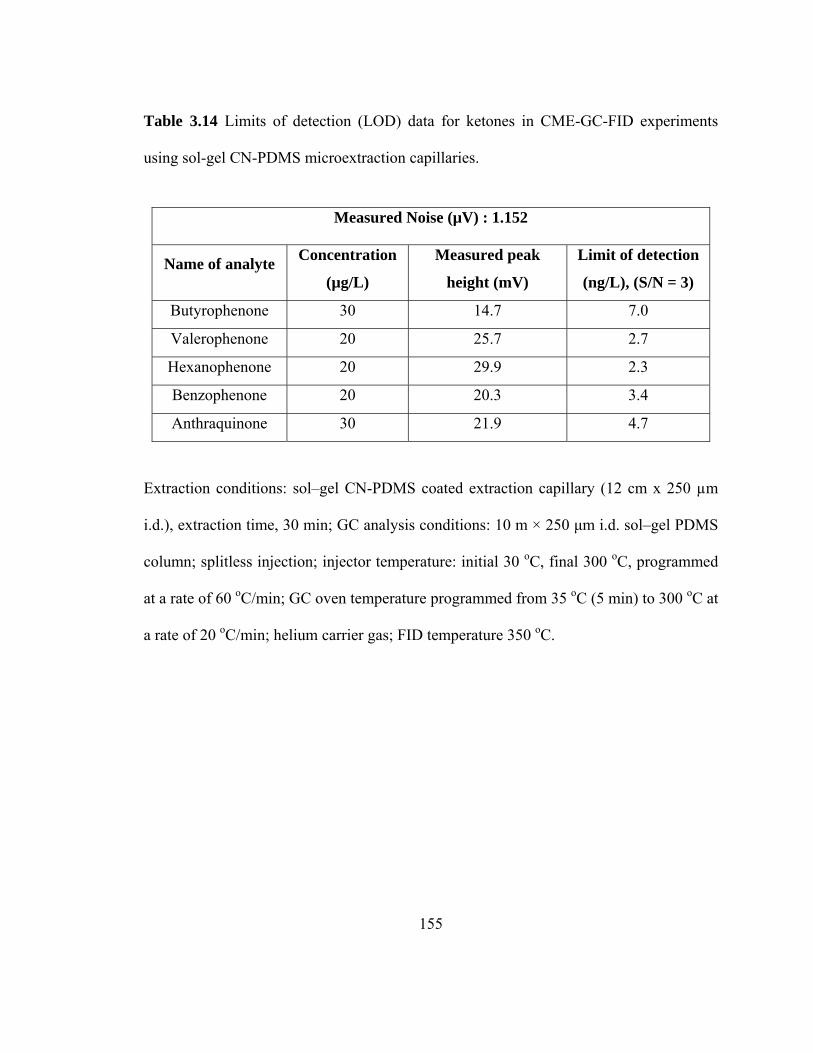
155
Table 3.14 Limits of detection (LOD) data for ketones in CME-GC-FID experiments
using sol-gel CN-PDMS microextraction capillaries.
Measured Noise (µV) : 1.152
Name of analyte Concentration
(µg/L)
Measured peak
height (mV)
Limit of detection
(ng/L), (S/N = 3)
Butyrophenone 30 14.7 7.0
Valerophenone 20 25.7 2.7
Hexanophenone 20 29.9 2.3
Benzophenone 20 20.3 3.4
Anthraquinone 30 21.9 4.7
Extraction conditions: sol–gel CN-PDMS coated extraction capillary (12 cm x 250 µm
i.d.), extraction time, 30 min; GC analysis conditions: 10 m × 250 µm i.d. sol–gel PDMS
column; splitless injection; injector temperature: initial 30 oC, final 300 oC, programmed
at a rate of 60 oC/min; GC oven temperature programmed from 35 oC (5 min) to 300 oC at
a rate of 20 oC/min; helium carrier gas; FID temperature 350 oC.
156
3.3.5.3 CME-GC-FID of Aromatic amines using sol-gel CN-PDMS coated
microextraction capillaries
Aromatic amines are used as intermediates in the pharmaceutical, photographic,
dye, and pesticide industries [48-50]. They have also been employed in rubber industry as
antioxidants and antiozonants [51]. Many of the aromatic amines found in air, water and
soil [52-55], have been classified as mutagenic and carcinogenic [56,57]. This makes
quantitative detection of aromatic amines very important.
In our study, various aromatic amines were directly extracted from aqueous
samples (Table 3.15). Figure 3.12 represents a gas chromatogram of a mixture of four
underivatized aromatic amines extracted from an aqueous sample. CME–GC–FID
experiments using sol–gel CN-PDMS microextraction capillaries provided excellent run-
to-run (Table 3.16) and capillary-to-capillary (Table 3.17) extraction repeatability
characterized by RSD values of less than 5%. We were also able to achieve lower
detection limits (e.g., 0.11µg/L for N,N-dimethylaniline and 0.03 µg/L for benzanilide,
by CME-GC-FID) compared to other literature reports (e.g., 1.2 µg/L for N,N-
dimethylaniline, by HS-SPME-GC-FID [58] and 0.005 µg/L for benzanilide, by CME-
GC-FID [30]). LOD results for the aromatic amines are provided in Table 3.18.
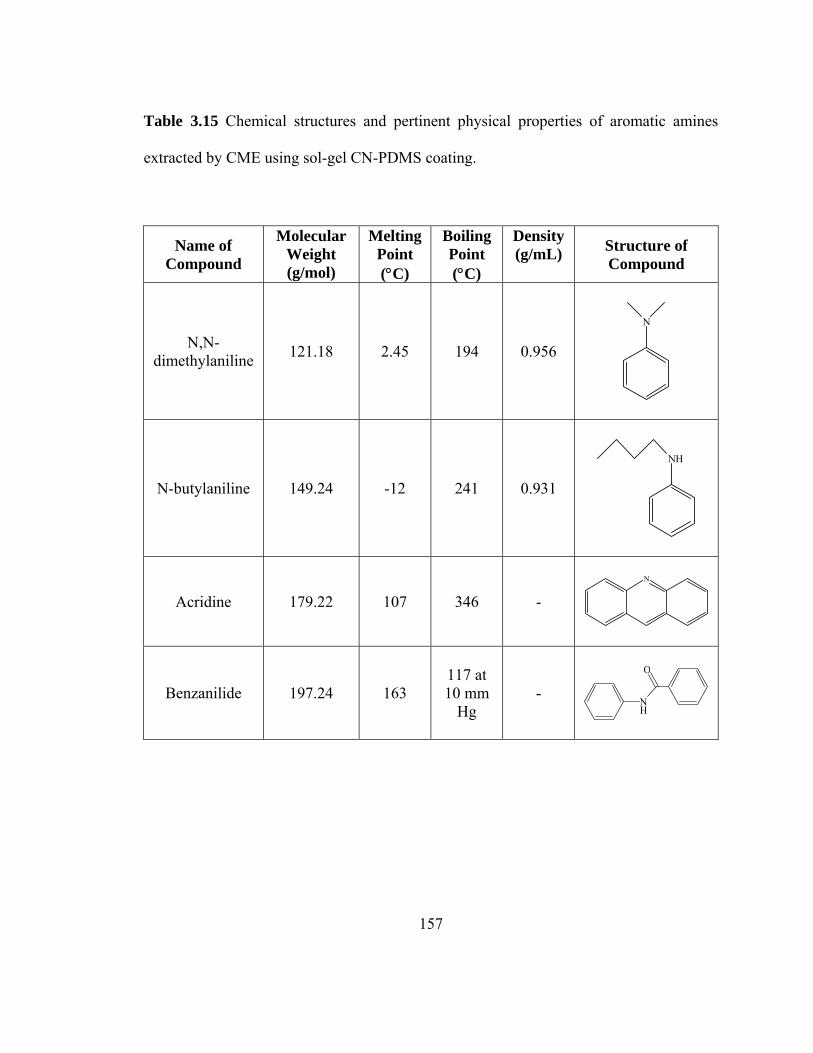
157
Table 3.15 Chemical structures and pertinent physical properties of aromatic amines
extracted by CME using sol-gel CN-PDMS coating.
Name of Compound
Molecular Weight (g/mol)
Melting Point (°C)
Boiling Point (°C)
Density (g/mL) Structure of
Compound
N,N-dimethylaniline 121.18 2.45 194 0.956
N
N-butylaniline 149.24 -12 241 0.931
NH
Acridine 179.22 107 346 -
N
Benzanilide 197.24 163 117 at 10 mm
Hg -
NH
O
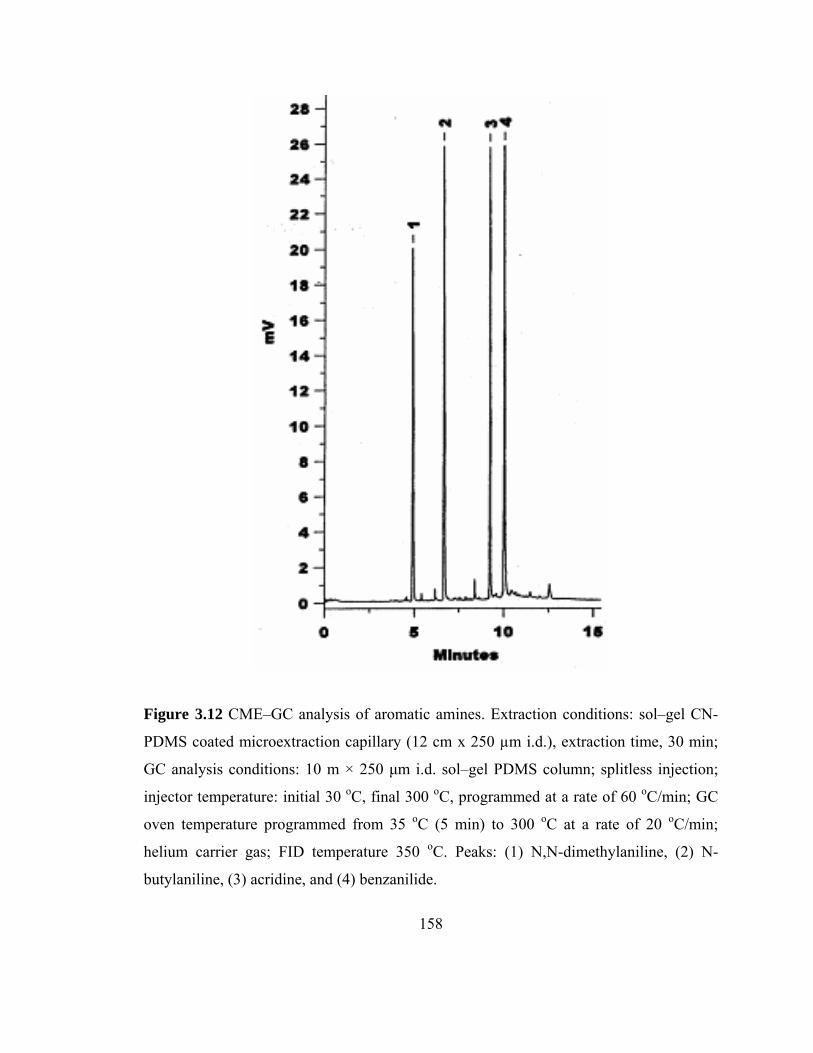
158
Figure 3.12 CME–GC analysis of aromatic amines. Extraction conditions: sol–gel CN-
PDMS coated microextraction capillary (12 cm x 250 µm i.d.), extraction time, 30 min;
GC analysis conditions: 10 m × 250 µm i.d. sol–gel PDMS column; splitless injection;
injector temperature: initial 30 oC, final 300 oC, programmed at a rate of 60 oC/min; GC
oven temperature programmed from 35 oC (5 min) to 300 oC at a rate of 20 oC/min;
helium carrier gas; FID temperature 350 oC. Peaks: (1) N,N-dimethylaniline, (2) N-
butylaniline, (3) acridine, and (4) benzanilide.
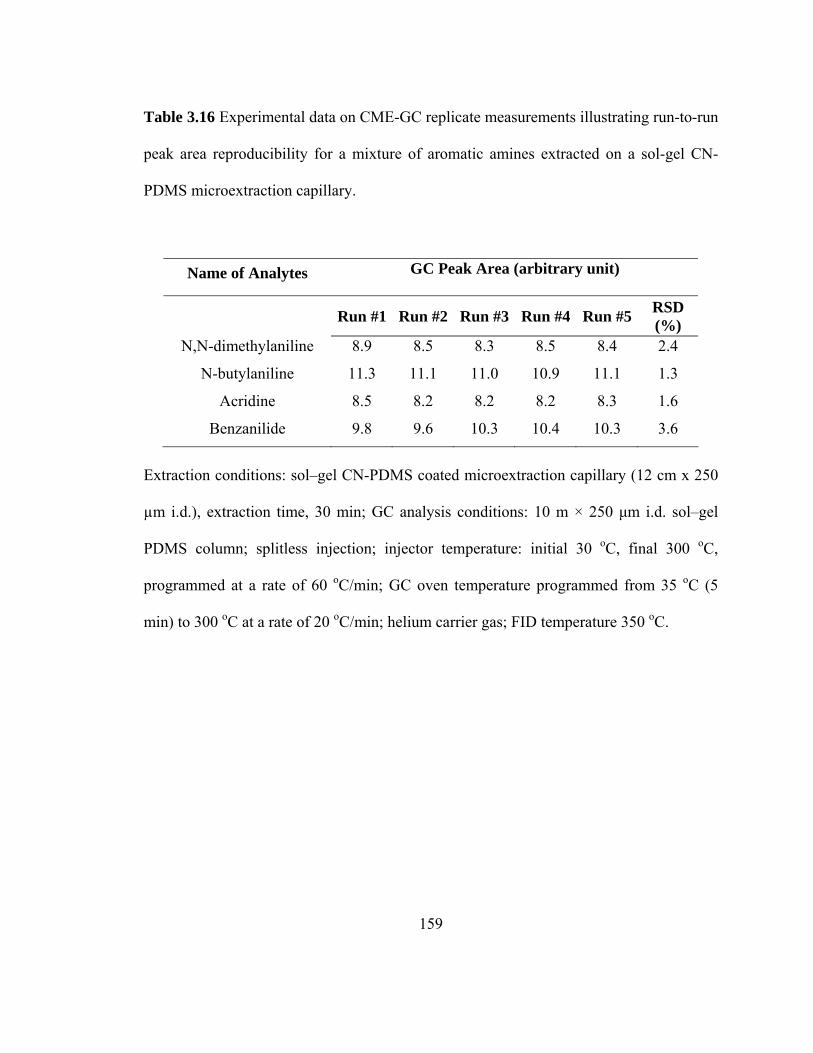
159
Table 3.16 Experimental data on CME-GC replicate measurements illustrating run-to-run
peak area reproducibility for a mixture of aromatic amines extracted on a sol-gel CN-
PDMS microextraction capillary.
Name of Analytes GC Peak Area (arbitrary unit)
Run #1 Run #2 Run #3 Run #4 Run #5 RSD
(%) N,N-dimethylaniline 8.9 8.5 8.3 8.5 8.4 2.4
N-butylaniline 11.3 11.1 11.0 10.9 11.1 1.3
Acridine 8.5 8.2 8.2 8.2 8.3 1.6
Benzanilide 9.8 9.6 10.3 10.4 10.3 3.6
Extraction conditions: sol–gel CN-PDMS coated microextraction capillary (12 cm x 250
µm i.d.), extraction time, 30 min; GC analysis conditions: 10 m × 250 µm i.d. sol–gel
PDMS column; splitless injection; injector temperature: initial 30 oC, final 300 oC,
programmed at a rate of 60 oC/min; GC oven temperature programmed from 35 oC (5
min) to 300 oC at a rate of 20 oC/min; helium carrier gas; FID temperature 350 oC.
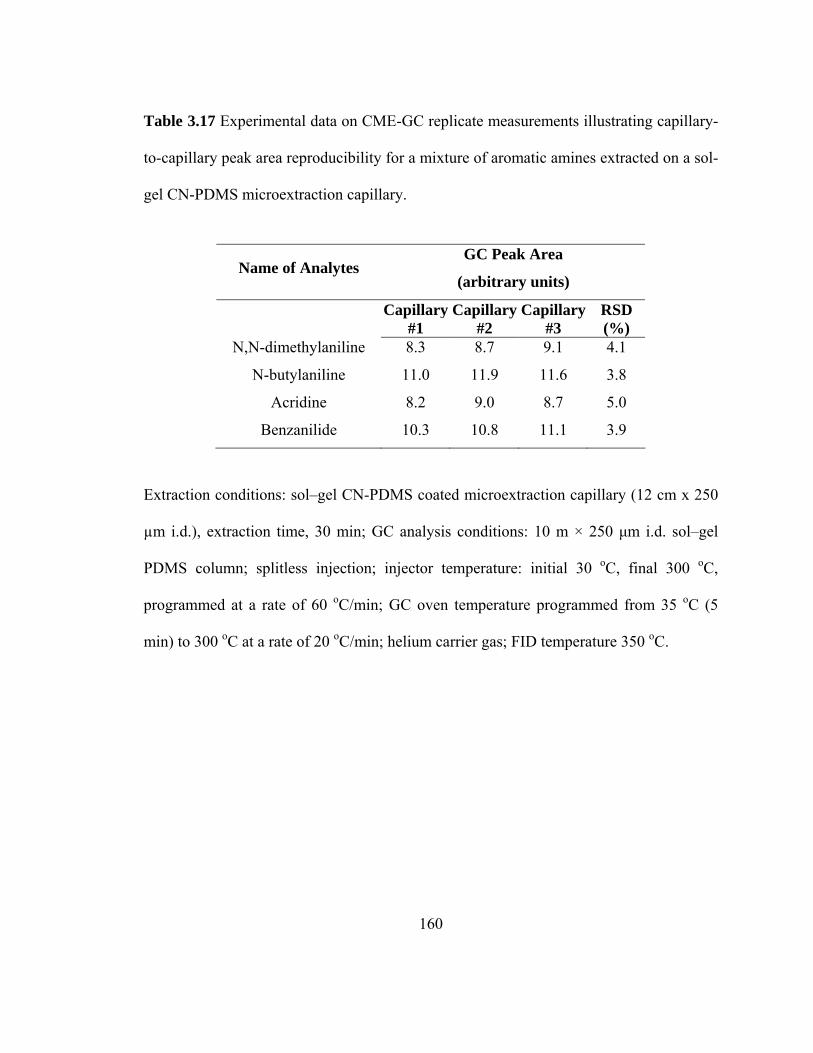
160
Table 3.17 Experimental data on CME-GC replicate measurements illustrating capillary-
to-capillary peak area reproducibility for a mixture of aromatic amines extracted on a sol-
gel CN-PDMS microextraction capillary.
Name of Analytes GC Peak Area
(arbitrary units)
Capillary #1
Capillary#2
Capillary #3
RSD (%)
N,N-dimethylaniline 8.3 8.7 9.1 4.1
N-butylaniline 11.0 11.9 11.6 3.8
Acridine 8.2 9.0 8.7 5.0
Benzanilide 10.3 10.8 11.1 3.9
Extraction conditions: sol–gel CN-PDMS coated microextraction capillary (12 cm x 250
µm i.d.), extraction time, 30 min; GC analysis conditions: 10 m × 250 µm i.d. sol–gel
PDMS column; splitless injection; injector temperature: initial 30 oC, final 300 oC,
programmed at a rate of 60 oC/min; GC oven temperature programmed from 35 oC (5
min) to 300 oC at a rate of 20 oC/min; helium carrier gas; FID temperature 350 oC.

161
Table 3.18 Limits of detection (LOD) data for aromatic amines in CME-GC-FID
experiments using sol-gel CN-PDMS microextraction capillaries.
Measured Noise (µV) : 1.046
Name of analyte Concentration
(µg/L)
Measured peak
height (mV)
Limit of detection
(ng/L), (S/N = 3)
N,N-dimethylaniline 800 21.9 114.9
N-butylaniline 100 27.4 11.4
Acridine 100 30.1 10.4
Benzanilide 300 26.2 35.9
Extraction conditions: sol–gel CN-PDMS coated microextraction capillary (12 cm x 250
µm i.d.), extraction time, 30 min; GC analysis conditions: 10 m × 250 µm i.d. sol–gel
PDMS column; splitless injection; injector temperature: initial 30 oC, final 300 oC,
programmed at a rate of 60 oC/min; GC oven temperature programmed from 35 oC (5
min) to 300 oC at a rate of 20 oC/min; helium carrier gas; FID temperature 350 oC.
162
3.3.5.4 CME-GC-FID of chlorophenols using sol-gel CN-PDMS coated
microextraction capillaries
Chlorophenols (CPs) have been widely used as preservatives, pesticides,
antiseptics, and disinfectants [59]. They are also used in producing dyes, plastics and
pharmaceuticals. In the environment, CPs may also form as a result of hydrolysis,
oxidation, and microbiological degradation of chlorinated pesticides. As a result, CPs are
often found in waters [60], soils, and sediments [61]. CPs constitute an important group
of priority toxic pollutants listed by EPA [41] because of their possible carcinogenic
properties. In our study, four CPs were extracted using sol-gel CN-PDMS coated
capillaries (Table 3.19). CPs are highly polar compounds with significant affinity toward
water. CN-PDMS coated capillaries were effective in extracting four underivatized CPs
from an aqueous sample. A gas chromatogram obtained in these experiments is shown in
Figure 3.13. Run-to-run and capillary-to-capillary microextraction reproducibility results
are provided in Table 3.20 and Table 3.21, respectively. We were able to achieve
detection limits (e.g., 0.1 µg/L for 2,4-dichlorophenol, by CME-GC-FID) comparable to
other literature reports (e.g., 0.1 µg/L for the same compound, by SPME-GC-FID)
[35,62,63]. In one instance, the detection limits were much lower than (e.g., 0.2 µg/L for
2,4,6-trichlorophenol and 0.06 µg/L for 4-chloro-3-methylphenol, by CME-GC-FID) the
reported literature values (e.g., 60 µg/L for 2,4,6-trichlorophenol and 53 µg/L for 4-
chloro-3-methylphenol, by SPME-GC-FID) using commercial PA (85 µm) coated fiber
[64]. LOD results for CPs are provided in Table 3.22.
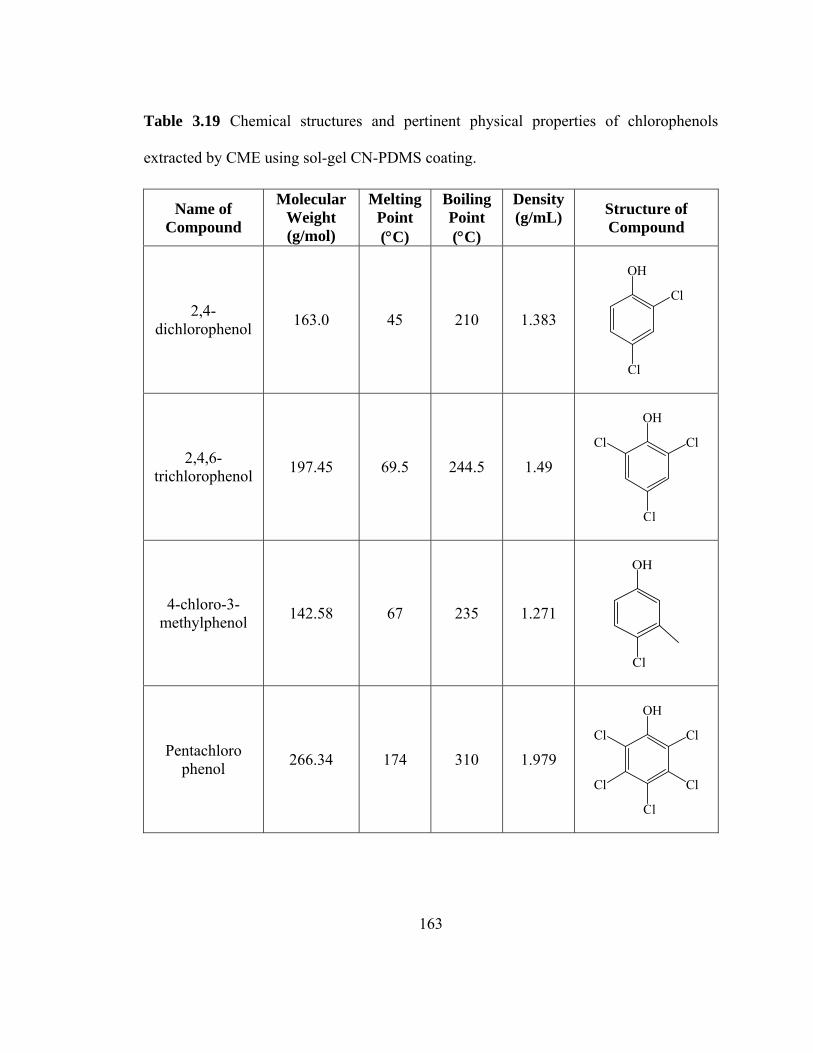
163
Table 3.19 Chemical structures and pertinent physical properties of chlorophenols
extracted by CME using sol-gel CN-PDMS coating.
Name of Compound
Molecular Weight (g/mol)
Melting Point (°C)
Boiling Point (°C)
Density (g/mL) Structure of
Compound
2,4-dichlorophenol 163.0 45 210 1.383
Cl
Cl
OH
2,4,6-trichlorophenol 197.45 69.5 244.5 1.49
Cl
Cl
Cl
OH
4-chloro-3-methylphenol 142.58 67 235 1.271
Cl
OH
Pentachloro phenol 266.34 174 310 1.979
Cl
Cl
Cl
Cl
Cl
OH
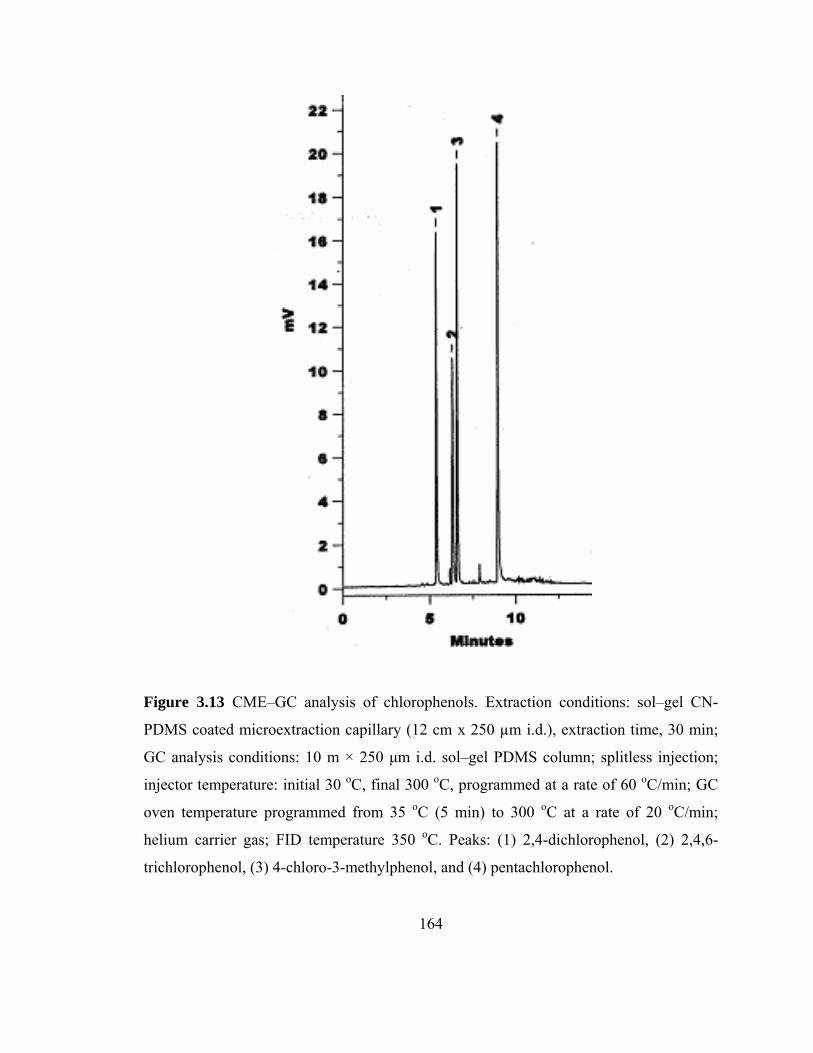
164
Figure 3.13 CME–GC analysis of chlorophenols. Extraction conditions: sol–gel CN-
PDMS coated microextraction capillary (12 cm x 250 µm i.d.), extraction time, 30 min;
GC analysis conditions: 10 m × 250 µm i.d. sol–gel PDMS column; splitless injection;
injector temperature: initial 30 oC, final 300 oC, programmed at a rate of 60 oC/min; GC
oven temperature programmed from 35 oC (5 min) to 300 oC at a rate of 20 oC/min;
helium carrier gas; FID temperature 350 oC. Peaks: (1) 2,4-dichlorophenol, (2) 2,4,6-
trichlorophenol, (3) 4-chloro-3-methylphenol, and (4) pentachlorophenol.
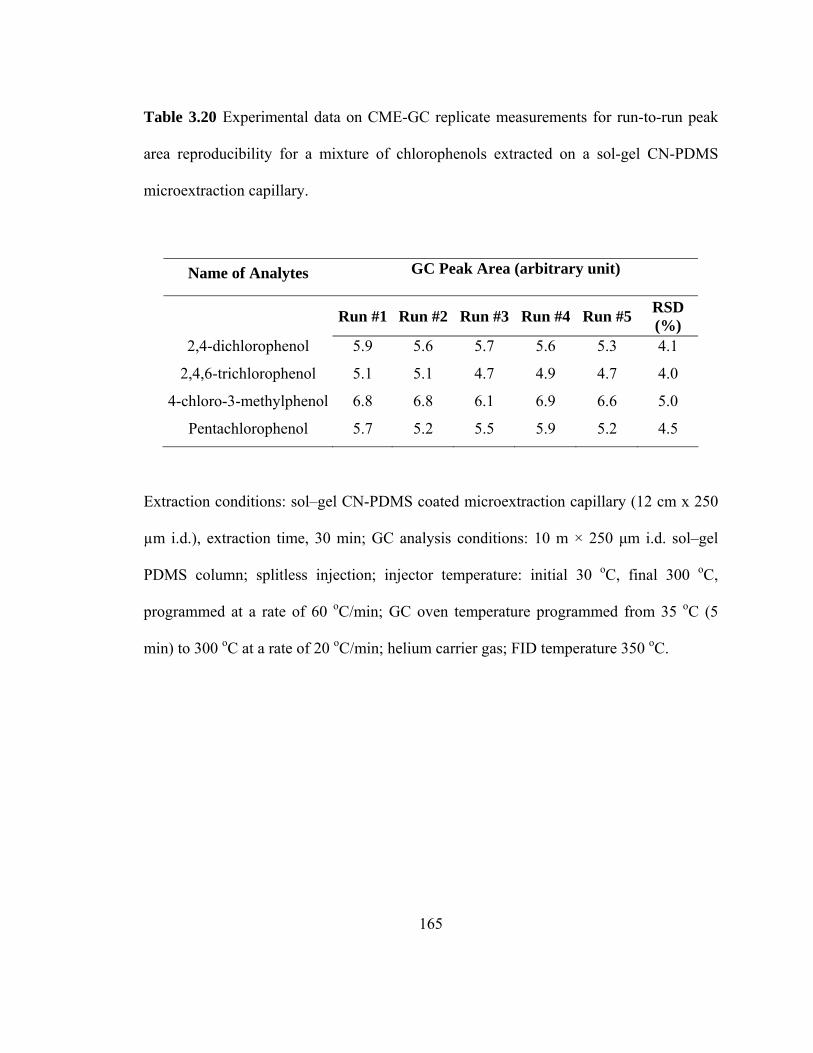
165
Table 3.20 Experimental data on CME-GC replicate measurements for run-to-run peak
area reproducibility for a mixture of chlorophenols extracted on a sol-gel CN-PDMS
microextraction capillary.
Name of Analytes GC Peak Area (arbitrary unit)
Run #1 Run #2 Run #3 Run #4 Run #5 RSD
(%) 2,4-dichlorophenol 5.9 5.6 5.7 5.6 5.3 4.1
2,4,6-trichlorophenol 5.1 5.1 4.7 4.9 4.7 4.0
4-chloro-3-methylphenol 6.8 6.8 6.1 6.9 6.6 5.0
Pentachlorophenol 5.7 5.2 5.5 5.9 5.2 4.5
Extraction conditions: sol–gel CN-PDMS coated microextraction capillary (12 cm x 250
µm i.d.), extraction time, 30 min; GC analysis conditions: 10 m × 250 µm i.d. sol–gel
PDMS column; splitless injection; injector temperature: initial 30 oC, final 300 oC,
programmed at a rate of 60 oC/min; GC oven temperature programmed from 35 oC (5
min) to 300 oC at a rate of 20 oC/min; helium carrier gas; FID temperature 350 oC.
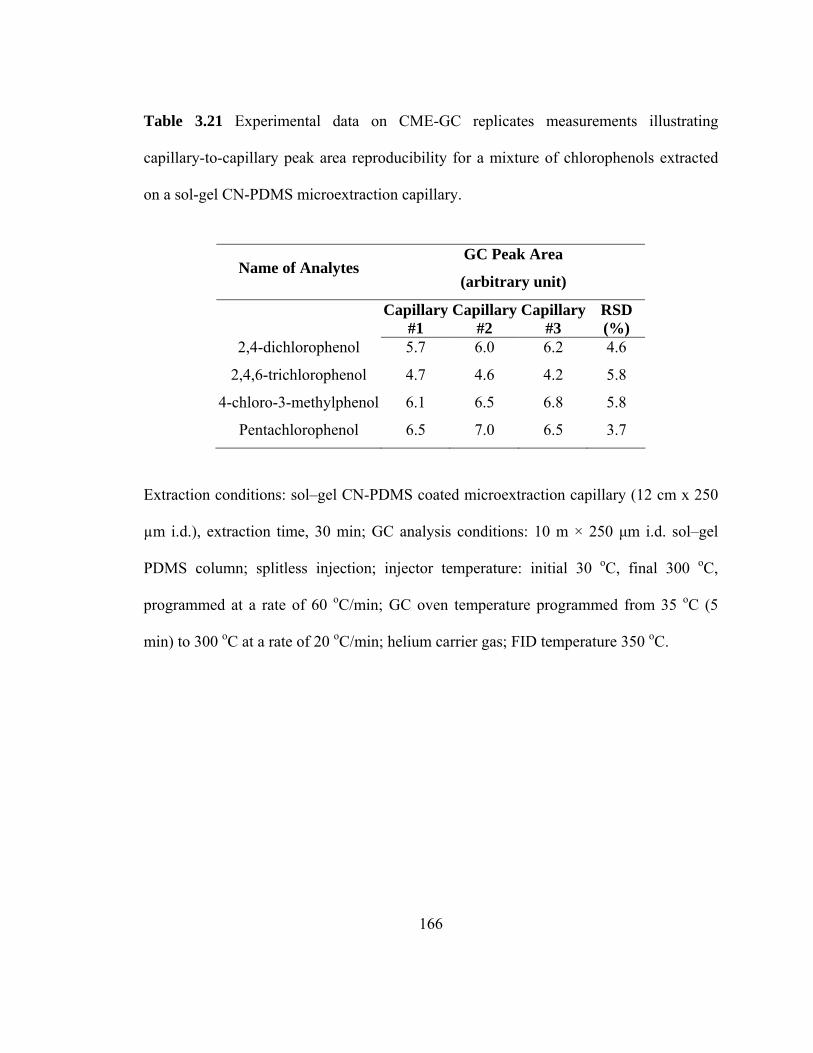
166
Table 3.21 Experimental data on CME-GC replicates measurements illustrating
capillary-to-capillary peak area reproducibility for a mixture of chlorophenols extracted
on a sol-gel CN-PDMS microextraction capillary.
Name of Analytes GC Peak Area
(arbitrary unit)
Capillary #1
Capillary#2
Capillary #3
RSD (%)
2,4-dichlorophenol 5.7 6.0 6.2 4.6
2,4,6-trichlorophenol 4.7 4.6 4.2 5.8
4-chloro-3-methylphenol 6.1 6.5 6.8 5.8
Pentachlorophenol 6.5 7.0 6.5 3.7
Extraction conditions: sol–gel CN-PDMS coated microextraction capillary (12 cm x 250
µm i.d.), extraction time, 30 min; GC analysis conditions: 10 m × 250 µm i.d. sol–gel
PDMS column; splitless injection; injector temperature: initial 30 oC, final 300 oC,
programmed at a rate of 60 oC/min; GC oven temperature programmed from 35 oC (5
min) to 300 oC at a rate of 20 oC/min; helium carrier gas; FID temperature 350 oC.
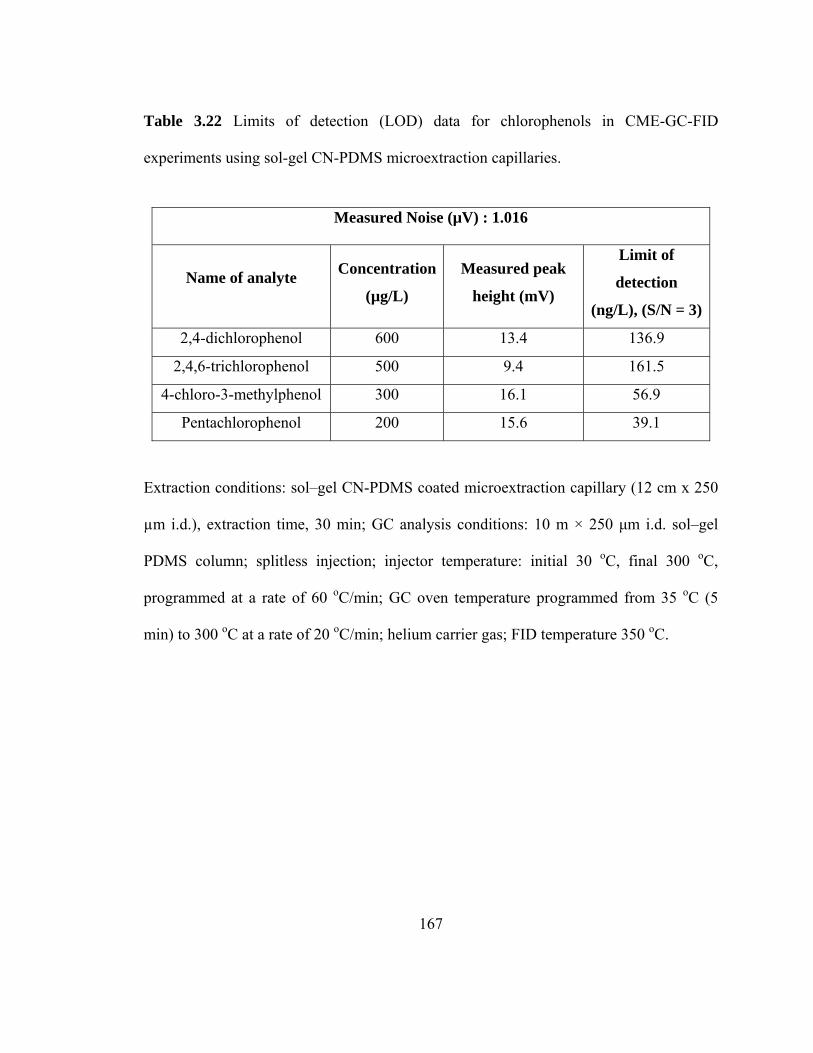
167
Table 3.22 Limits of detection (LOD) data for chlorophenols in CME-GC-FID
experiments using sol-gel CN-PDMS microextraction capillaries.
Measured Noise (µV) : 1.016
Name of analyte Concentration
(µg/L)
Measured peak
height (mV)
Limit of
detection
(ng/L), (S/N = 3)
2,4-dichlorophenol 600 13.4 136.9
2,4,6-trichlorophenol 500 9.4 161.5
4-chloro-3-methylphenol 300 16.1 56.9
Pentachlorophenol 200 15.6 39.1
Extraction conditions: sol–gel CN-PDMS coated microextraction capillary (12 cm x 250
µm i.d.), extraction time, 30 min; GC analysis conditions: 10 m × 250 µm i.d. sol–gel
PDMS column; splitless injection; injector temperature: initial 30 oC, final 300 oC,
programmed at a rate of 60 oC/min; GC oven temperature programmed from 35 oC (5
min) to 300 oC at a rate of 20 oC/min; helium carrier gas; FID temperature 350 oC.
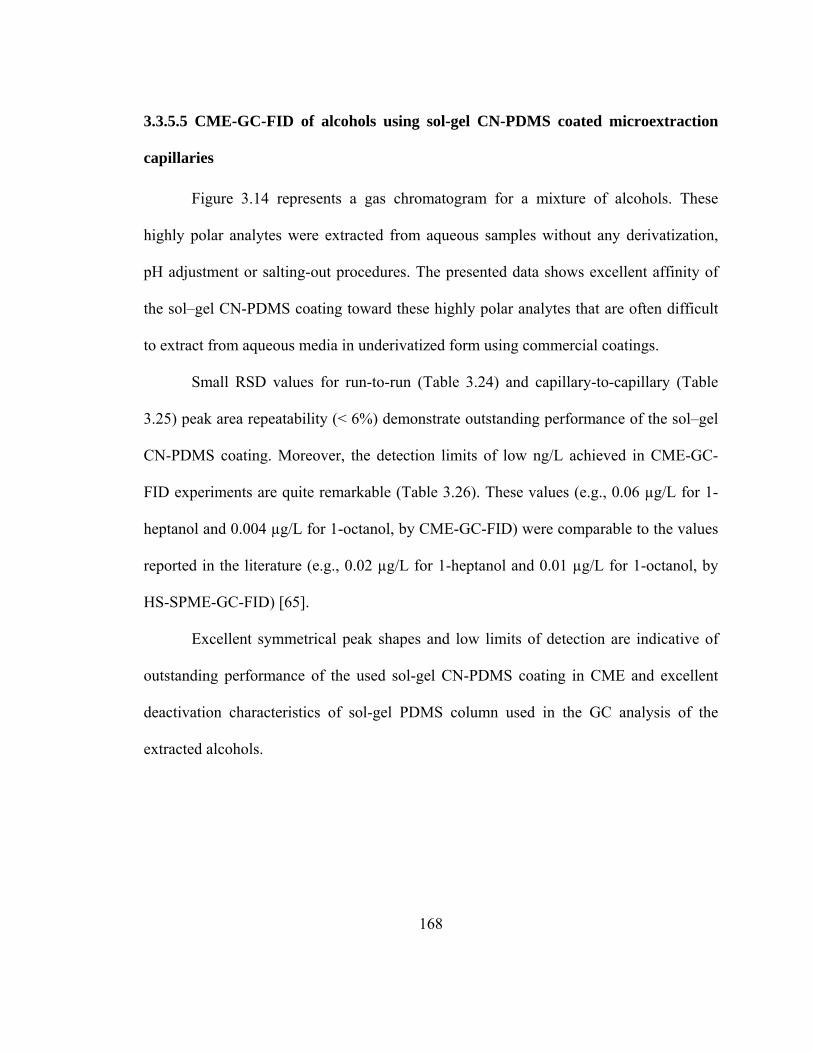
168
3.3.5.5 CME-GC-FID of alcohols using sol-gel CN-PDMS coated microextraction
capillaries
Figure 3.14 represents a gas chromatogram for a mixture of alcohols. These
highly polar analytes were extracted from aqueous samples without any derivatization,
pH adjustment or salting-out procedures. The presented data shows excellent affinity of
the sol–gel CN-PDMS coating toward these highly polar analytes that are often difficult
to extract from aqueous media in underivatized form using commercial coatings.
Small RSD values for run-to-run (Table 3.24) and capillary-to-capillary (Table
3.25) peak area repeatability (< 6%) demonstrate outstanding performance of the sol–gel
CN-PDMS coating. Moreover, the detection limits of low ng/L achieved in CME-GC-
FID experiments are quite remarkable (Table 3.26). These values (e.g., 0.06 µg/L for 1-
heptanol and 0.004 µg/L for 1-octanol, by CME-GC-FID) were comparable to the values
reported in the literature (e.g., 0.02 µg/L for 1-heptanol and 0.01 µg/L for 1-octanol, by
HS-SPME-GC-FID) [65].
Excellent symmetrical peak shapes and low limits of detection are indicative of
outstanding performance of the used sol-gel CN-PDMS coating in CME and excellent
deactivation characteristics of sol-gel PDMS column used in the GC analysis of the
extracted alcohols.
169
Table 3.23 Chemical structures and pertinent physical properties of alcohols extracted by
CME using sol-gel CN-PDMS coating.
Name of Compound
Molecular Weight (g/mol)
Melting Point (°C)
Boiling Point (°C)
Density (g/mL) Structure of
Compound
1-heptanol 116.20 -36 176 0.823
OH
1-octanol 130.23 -15 195 0.826
OH
1-nonanol 144.26 -8 to -6 215 0.828
OH
1-decanol 158.28 6 230 0.829
OH
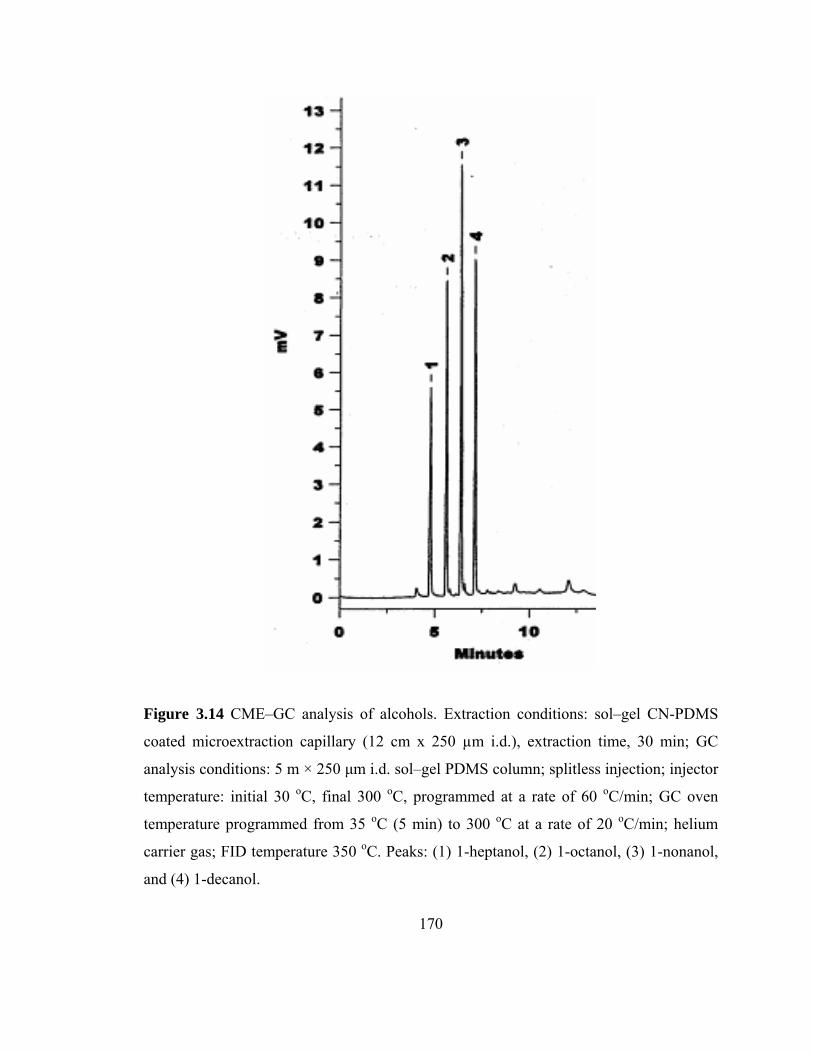
170
Figure 3.14 CME–GC analysis of alcohols. Extraction conditions: sol–gel CN-PDMS
coated microextraction capillary (12 cm x 250 µm i.d.), extraction time, 30 min; GC
analysis conditions: 5 m × 250 µm i.d. sol–gel PDMS column; splitless injection; injector
temperature: initial 30 oC, final 300 oC, programmed at a rate of 60 oC/min; GC oven
temperature programmed from 35 oC (5 min) to 300 oC at a rate of 20 oC/min; helium
carrier gas; FID temperature 350 oC. Peaks: (1) 1-heptanol, (2) 1-octanol, (3) 1-nonanol,
and (4) 1-decanol.
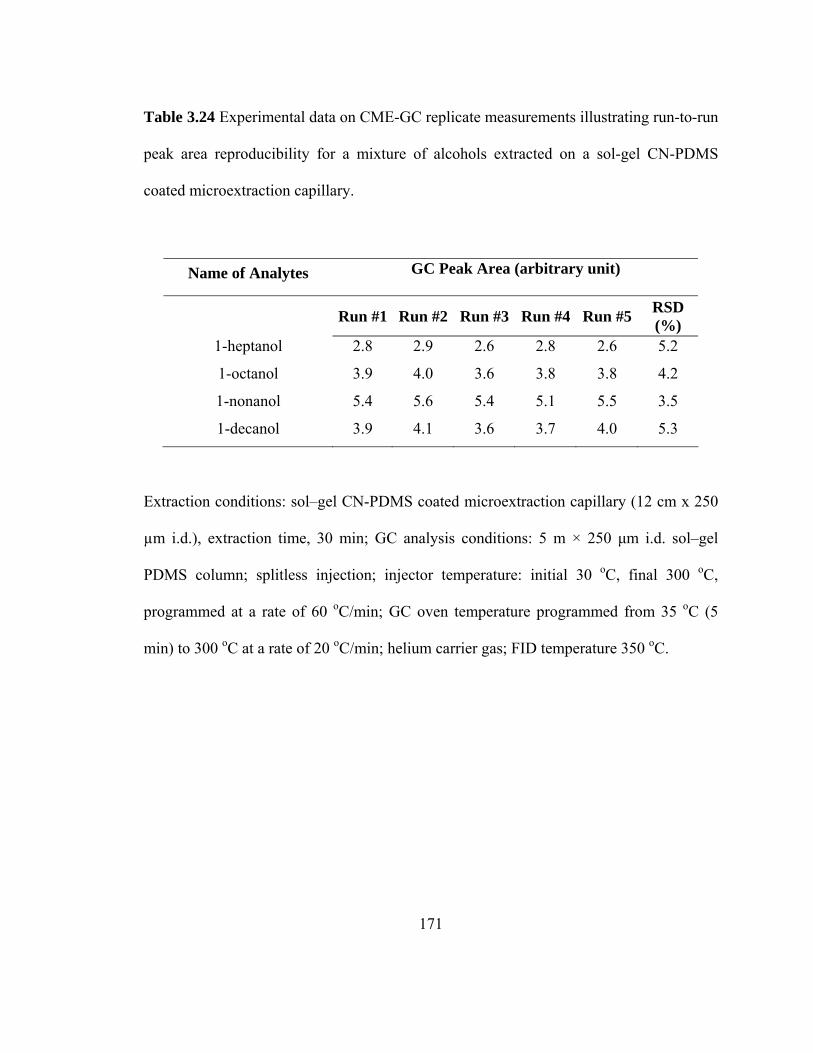
171
Table 3.24 Experimental data on CME-GC replicate measurements illustrating run-to-run
peak area reproducibility for a mixture of alcohols extracted on a sol-gel CN-PDMS
coated microextraction capillary.
Name of Analytes GC Peak Area (arbitrary unit)
Run #1 Run #2 Run #3 Run #4 Run #5 RSD
(%) 1-heptanol 2.8 2.9 2.6 2.8 2.6 5.2
1-octanol 3.9 4.0 3.6 3.8 3.8 4.2
1-nonanol 5.4 5.6 5.4 5.1 5.5 3.5
1-decanol 3.9 4.1 3.6 3.7 4.0 5.3
Extraction conditions: sol–gel CN-PDMS coated microextraction capillary (12 cm x 250
µm i.d.), extraction time, 30 min; GC analysis conditions: 5 m × 250 µm i.d. sol–gel
PDMS column; splitless injection; injector temperature: initial 30 oC, final 300 oC,
programmed at a rate of 60 oC/min; GC oven temperature programmed from 35 oC (5
min) to 300 oC at a rate of 20 oC/min; helium carrier gas; FID temperature 350 oC.
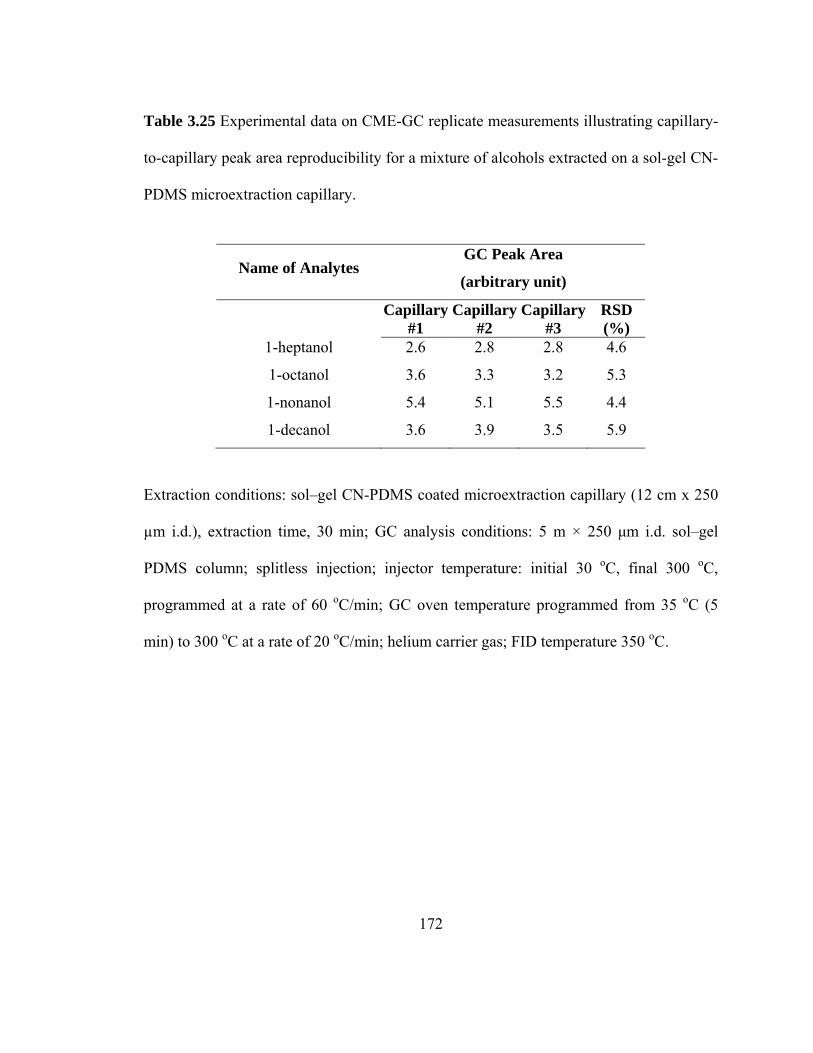
172
Table 3.25 Experimental data on CME-GC replicate measurements illustrating capillary-
to-capillary peak area reproducibility for a mixture of alcohols extracted on a sol-gel CN-
PDMS microextraction capillary.
Name of Analytes GC Peak Area
(arbitrary unit)
Capillary #1
Capillary#2
Capillary #3
RSD (%)
1-heptanol 2.6 2.8 2.8 4.6
1-octanol 3.6 3.3 3.2 5.3
1-nonanol 5.4 5.1 5.5 4.4
1-decanol 3.6 3.9 3.5 5.9
Extraction conditions: sol–gel CN-PDMS coated microextraction capillary (12 cm x 250
µm i.d.), extraction time, 30 min; GC analysis conditions: 5 m × 250 µm i.d. sol–gel
PDMS column; splitless injection; injector temperature: initial 30 oC, final 300 oC,
programmed at a rate of 60 oC/min; GC oven temperature programmed from 35 oC (5
min) to 300 oC at a rate of 20 oC/min; helium carrier gas; FID temperature 350 oC.
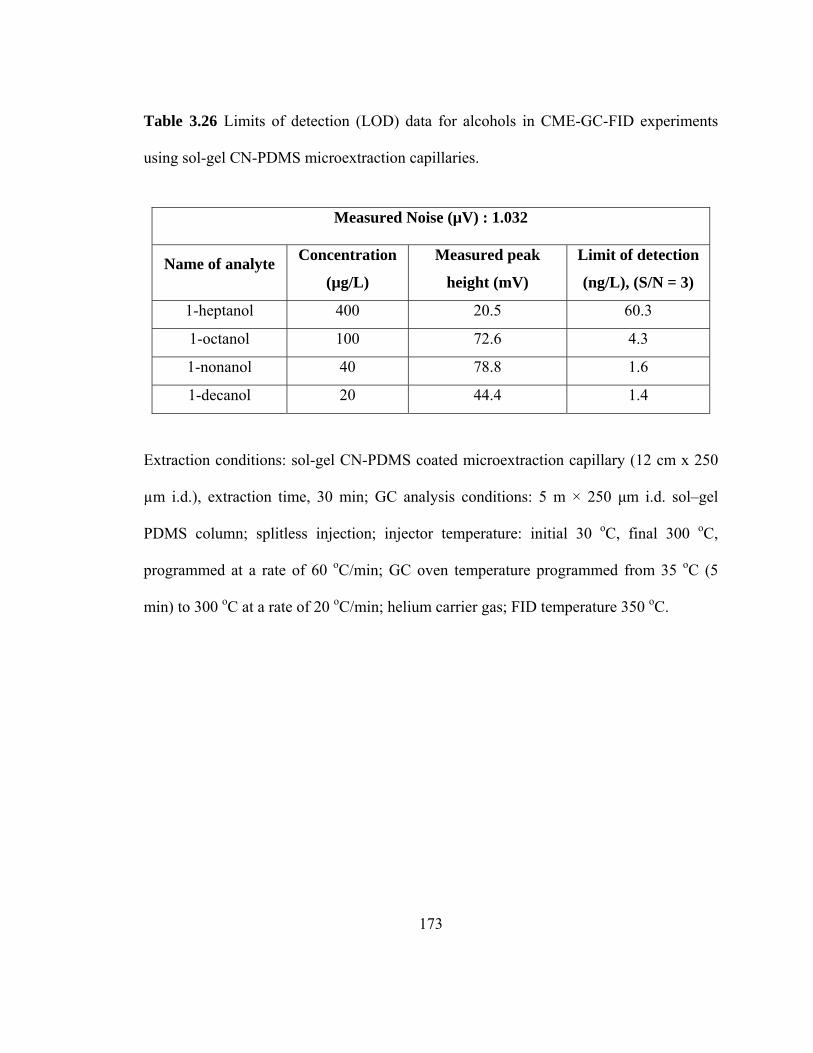
173
Table 3.26 Limits of detection (LOD) data for alcohols in CME-GC-FID experiments
using sol-gel CN-PDMS microextraction capillaries.
Measured Noise (µV) : 1.032
Name of analyte Concentration
(µg/L)
Measured peak
height (mV)
Limit of detection
(ng/L), (S/N = 3)
1-heptanol 400 20.5 60.3
1-octanol 100 72.6 4.3
1-nonanol 40 78.8 1.6
1-decanol 20 44.4 1.4
Extraction conditions: sol-gel CN-PDMS coated microextraction capillary (12 cm x 250
µm i.d.), extraction time, 30 min; GC analysis conditions: 5 m × 250 µm i.d. sol–gel
PDMS column; splitless injection; injector temperature: initial 30 oC, final 300 oC,
programmed at a rate of 60 oC/min; GC oven temperature programmed from 35 oC (5
min) to 300 oC at a rate of 20 oC/min; helium carrier gas; FID temperature 350 oC.
174
3.3.5.6 CME-GC-FID of free fatty acids using sol-gel CN-PDMS coated
microextraction capillaries
The determination of free fatty acids in various matrices such as blood plasma and
urine is of great importance because they are key metabolites and intermediates in
biological processes [66]. They are widely dispersed in nature and are often produced
from humic substances during water treatment [67]. Being very hydrophilic,
underivatized short-chain fatty acids are usually difficult to extract from aqueous atrices.
In the present study, sol-gel CN-PDMS microextraction capillaries provided
efficient extraction of fatty acids from aqueous samples without requiring any
derivatization, pH adjustment or salting-out procedures. A list of these free fatty acids is
given in Table 3.27. A gas chromatogram obtained in these experiments is shown in
Figure 3.15. Experimental data for free fatty acids is presented in Table 3.28, 3.29, and
3.30. It demonstrates remarkable ability of sol-gel CN-PDMS capillaries to reproducibly
extract fatty acids from aqueous medium. Detection limits of 0.2 µg/L and 0.01 µg/L
were obtained in CME-GC-FID experiments for underivatized hexanoic acid and
decanoic acid, respectively. These values are lower than those reported in the literature
using in situ derivatization of fatty acids on polyacrylate coated SPME fiber (e.g., 0.5
µg/L for hexanoic acid and 0.02 µg/L for decanoic acid, by SPME-GC-FID) [5] and
using sol-gel C[4] open chain crown ether/OH-TSO coated SPME fibers (e.g., 0.4 µg/L
for hexanoic acid and 0.03 µg/L for decanoic acid, by SPME-GC-FID) [65].
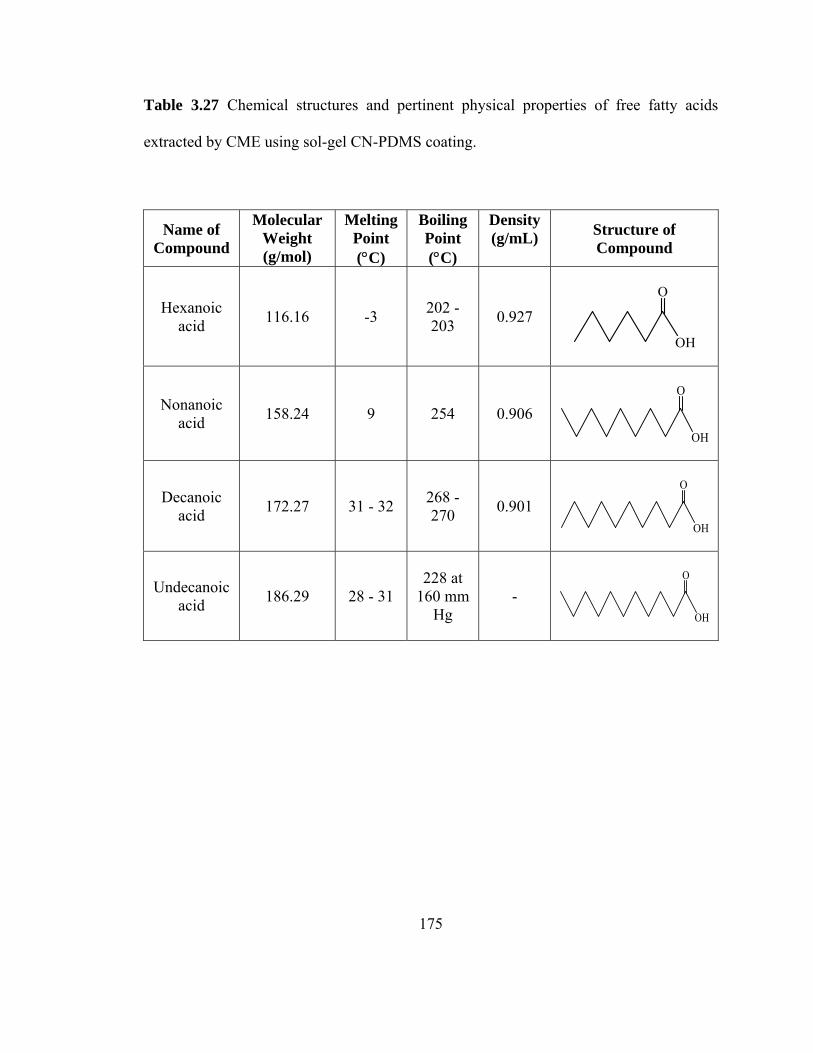
175
Table 3.27 Chemical structures and pertinent physical properties of free fatty acids
extracted by CME using sol-gel CN-PDMS coating.
Name of Compound
Molecular Weight (g/mol)
Melting Point (°C)
Boiling Point (°C)
Density (g/mL) Structure of
Compound
Hexanoic acid 116.16 -3 202 -
203 0.927
O
OH
Nonanoic acid 158.24 9 254 0.906
O
OH
Decanoic acid 172.27 31 - 32 268 -
270 0.901
O
OH
Undecanoic acid 186.29 28 - 31
228 at 160 mm
Hg -
O
OH
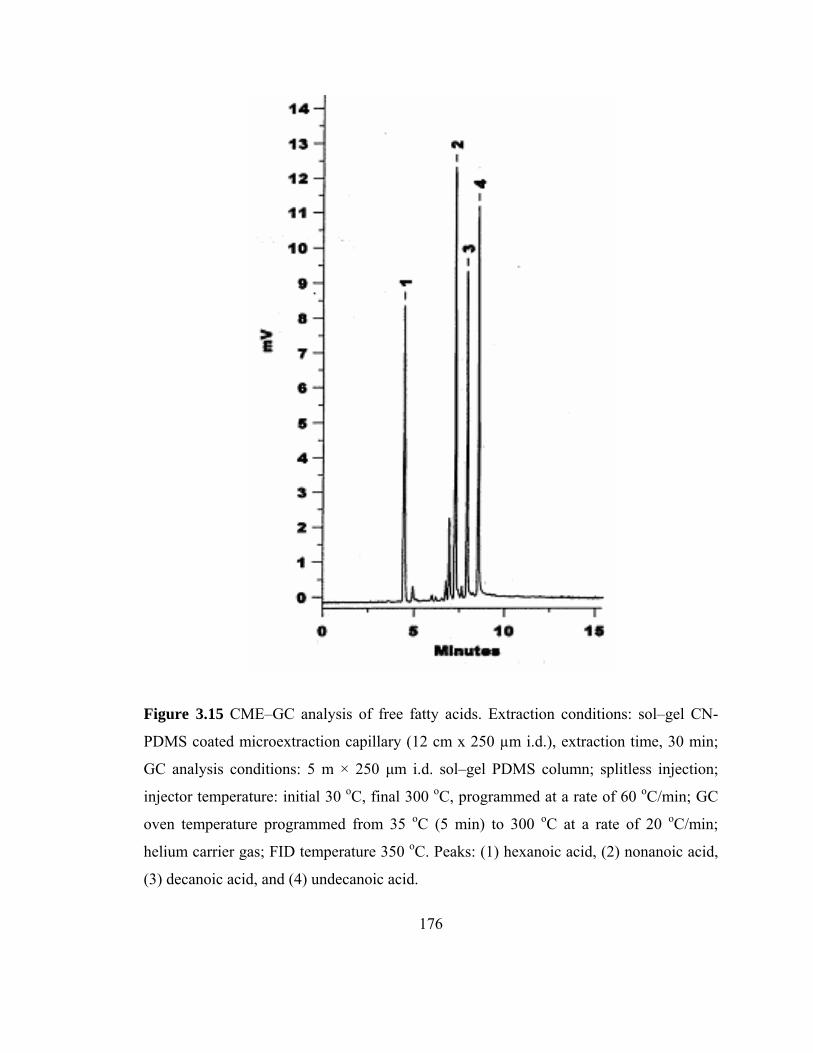
176
Figure 3.15 CME–GC analysis of free fatty acids. Extraction conditions: sol–gel CN-
PDMS coated microextraction capillary (12 cm x 250 µm i.d.), extraction time, 30 min;
GC analysis conditions: 5 m × 250 µm i.d. sol–gel PDMS column; splitless injection;
injector temperature: initial 30 oC, final 300 oC, programmed at a rate of 60 oC/min; GC
oven temperature programmed from 35 oC (5 min) to 300 oC at a rate of 20 oC/min;
helium carrier gas; FID temperature 350 oC. Peaks: (1) hexanoic acid, (2) nonanoic acid,
(3) decanoic acid, and (4) undecanoic acid.
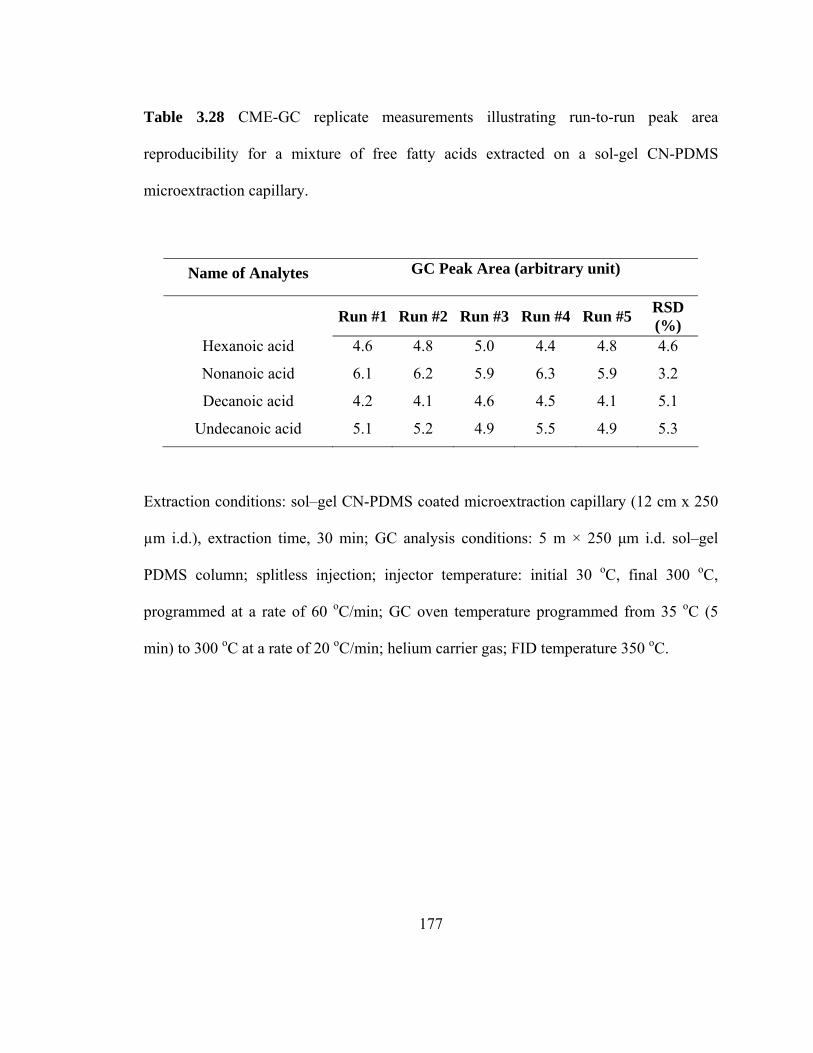
177
Table 3.28 CME-GC replicate measurements illustrating run-to-run peak area
reproducibility for a mixture of free fatty acids extracted on a sol-gel CN-PDMS
microextraction capillary.
Name of Analytes GC Peak Area (arbitrary unit)
Run #1 Run #2 Run #3 Run #4 Run #5 RSD
(%) Hexanoic acid 4.6 4.8 5.0 4.4 4.8 4.6
Nonanoic acid 6.1 6.2 5.9 6.3 5.9 3.2
Decanoic acid 4.2 4.1 4.6 4.5 4.1 5.1
Undecanoic acid 5.1 5.2 4.9 5.5 4.9 5.3
Extraction conditions: sol–gel CN-PDMS coated microextraction capillary (12 cm x 250
µm i.d.), extraction time, 30 min; GC analysis conditions: 5 m × 250 µm i.d. sol–gel
PDMS column; splitless injection; injector temperature: initial 30 oC, final 300 oC,
programmed at a rate of 60 oC/min; GC oven temperature programmed from 35 oC (5
min) to 300 oC at a rate of 20 oC/min; helium carrier gas; FID temperature 350 oC.
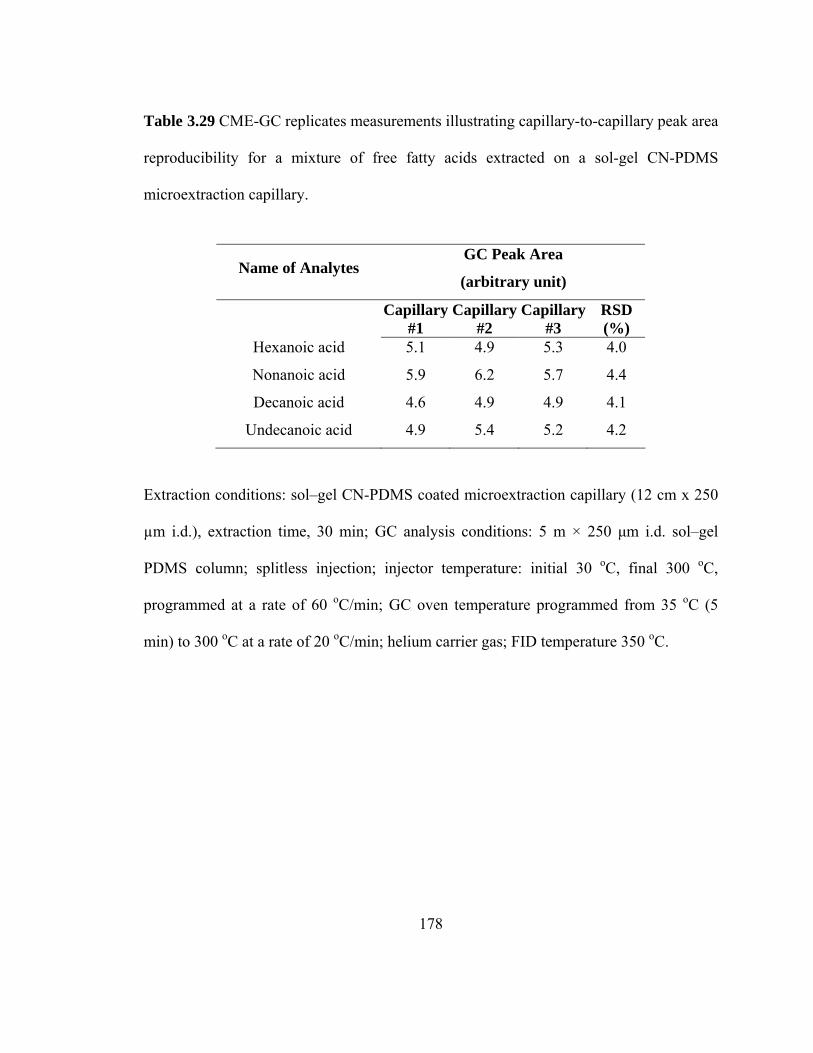
178
Table 3.29 CME-GC replicates measurements illustrating capillary-to-capillary peak area
reproducibility for a mixture of free fatty acids extracted on a sol-gel CN-PDMS
microextraction capillary.
Name of Analytes GC Peak Area
(arbitrary unit)
Capillary #1
Capillary#2
Capillary #3
RSD (%)
Hexanoic acid 5.1 4.9 5.3 4.0
Nonanoic acid 5.9 6.2 5.7 4.4
Decanoic acid 4.6 4.9 4.9 4.1
Undecanoic acid 4.9 5.4 5.2 4.2
Extraction conditions: sol–gel CN-PDMS coated microextraction capillary (12 cm x 250
µm i.d.), extraction time, 30 min; GC analysis conditions: 5 m × 250 µm i.d. sol–gel
PDMS column; splitless injection; injector temperature: initial 30 oC, final 300 oC,
programmed at a rate of 60 oC/min; GC oven temperature programmed from 35 oC (5
min) to 300 oC at a rate of 20 oC/min; helium carrier gas; FID temperature 350 oC.
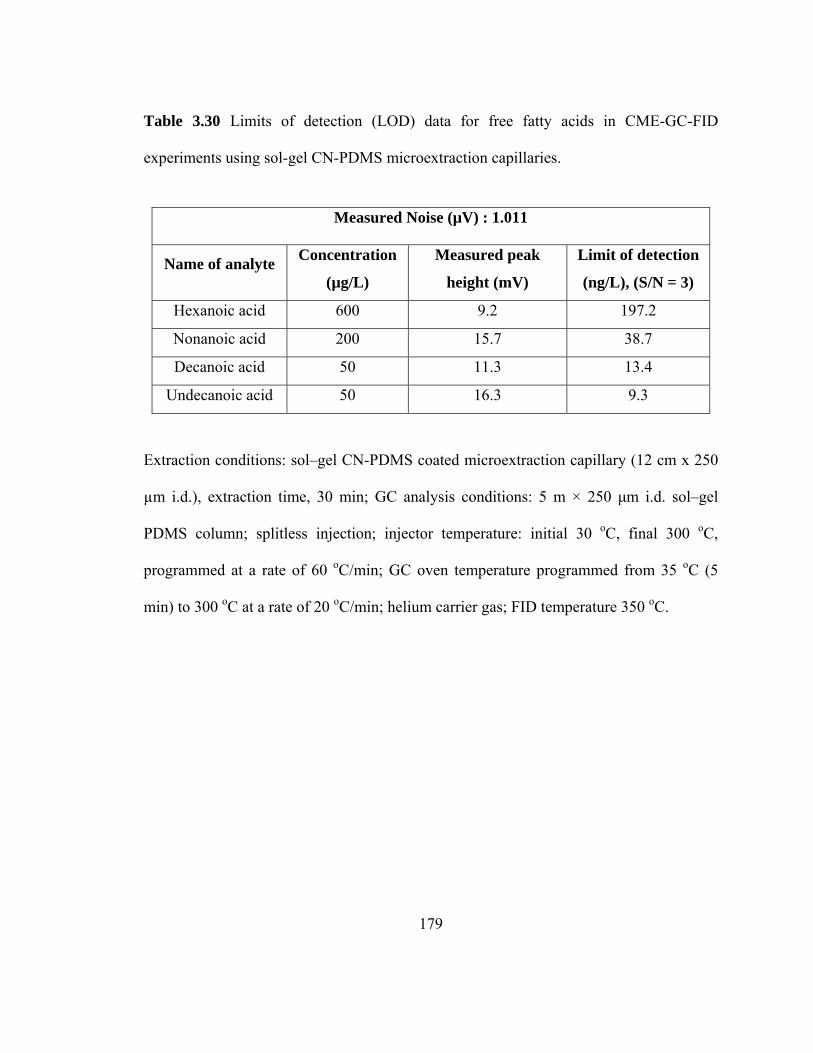
179
Table 3.30 Limits of detection (LOD) data for free fatty acids in CME-GC-FID
experiments using sol-gel CN-PDMS microextraction capillaries.
Measured Noise (µV) : 1.011
Name of analyte Concentration
(µg/L)
Measured peak
height (mV)
Limit of detection
(ng/L), (S/N = 3)
Hexanoic acid 600 9.2 197.2
Nonanoic acid 200 15.7 38.7
Decanoic acid 50 11.3 13.4
Undecanoic acid 50 16.3 9.3
Extraction conditions: sol–gel CN-PDMS coated microextraction capillary (12 cm x 250
µm i.d.), extraction time, 30 min; GC analysis conditions: 5 m × 250 µm i.d. sol–gel
PDMS column; splitless injection; injector temperature: initial 30 oC, final 300 oC,
programmed at a rate of 60 oC/min; GC oven temperature programmed from 35 oC (5
min) to 300 oC at a rate of 20 oC/min; helium carrier gas; FID temperature 350 oC.
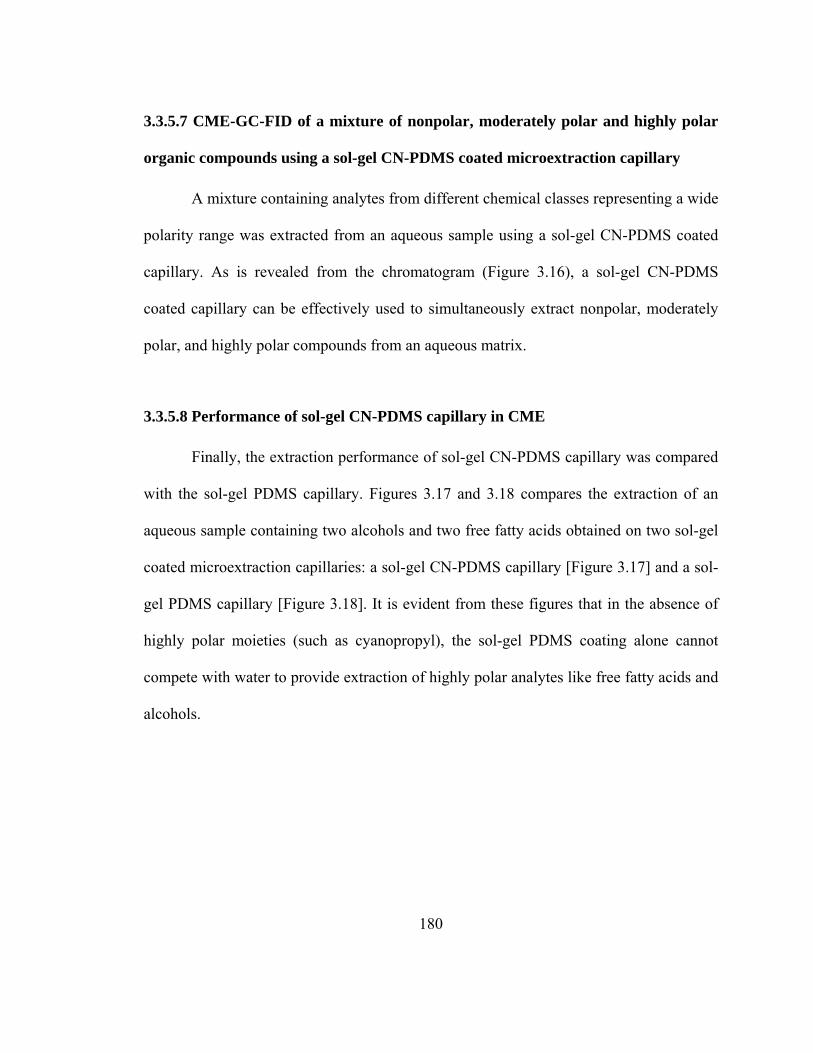
180
3.3.5.7 CME-GC-FID of a mixture of nonpolar, moderately polar and highly polar
organic compounds using a sol-gel CN-PDMS coated microextraction capillary
A mixture containing analytes from different chemical classes representing a wide
polarity range was extracted from an aqueous sample using a sol-gel CN-PDMS coated
capillary. As is revealed from the chromatogram (Figure 3.16), a sol-gel CN-PDMS
coated capillary can be effectively used to simultaneously extract nonpolar, moderately
polar, and highly polar compounds from an aqueous matrix.
3.3.5.8 Performance of sol-gel CN-PDMS capillary in CME
Finally, the extraction performance of sol-gel CN-PDMS capillary was compared
with the sol-gel PDMS capillary. Figures 3.17 and 3.18 compares the extraction of an
aqueous sample containing two alcohols and two free fatty acids obtained on two sol-gel
coated microextraction capillaries: a sol-gel CN-PDMS capillary [Figure 3.17] and a sol-
gel PDMS capillary [Figure 3.18]. It is evident from these figures that in the absence of
highly polar moieties (such as cyanopropyl), the sol-gel PDMS coating alone cannot
compete with water to provide extraction of highly polar analytes like free fatty acids and
alcohols.
181
Figure 3.16 CME–GC analysis of a mixture of nonpolar, moderately polar and highly
polar organic compounds. Extraction conditions: sol–gel CN-PDMS coated
microextraction capillary (12 cm x 250 µm i.d.), extraction time, 30 min; GC analysis
conditions: 5 m × 250 µm i.d. sol–gel PDMS column; splitless injection; injector
temperature: initial 30 oC, final 300 oC, programmed at a rate of 60 oC/min; GC oven
temperature programmed from 35 oC (5 min) to 300 oC at a rate of 15 oC/min; helium
carrier gas; FID temperature 350 oC. Peaks: (1) 1-heptanol, (2) 2,4-dichlorophenol, (3)
decanal, (4) nonanoic acid, (5) fluorene, and (6) acridine.
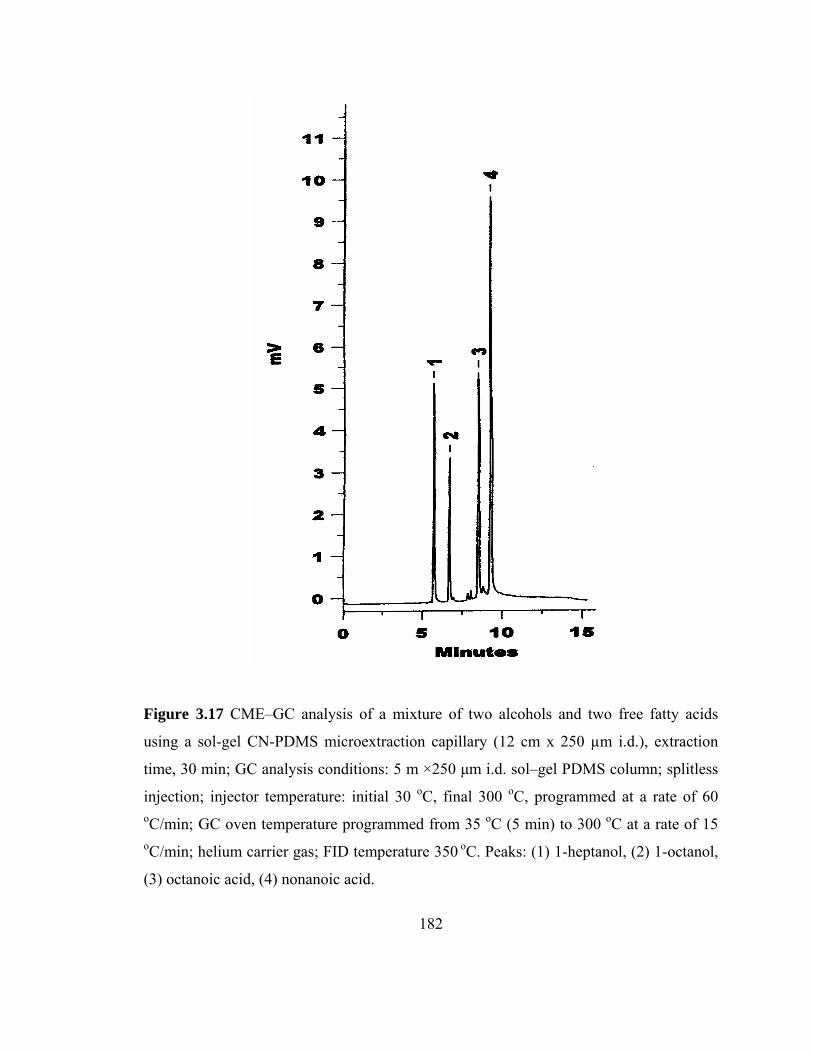
182
Figure 3.17 CME–GC analysis of a mixture of two alcohols and two free fatty acids
using a sol-gel CN-PDMS microextraction capillary (12 cm x 250 µm i.d.), extraction
time, 30 min; GC analysis conditions: 5 m ×250 µm i.d. sol–gel PDMS column; splitless
injection; injector temperature: initial 30 oC, final 300 oC, programmed at a rate of 60 oC/min; GC oven temperature programmed from 35 oC (5 min) to 300 oC at a rate of 15 oC/min; helium carrier gas; FID temperature 350 oC. Peaks: (1) 1-heptanol, (2) 1-octanol,
(3) octanoic acid, (4) nonanoic acid.
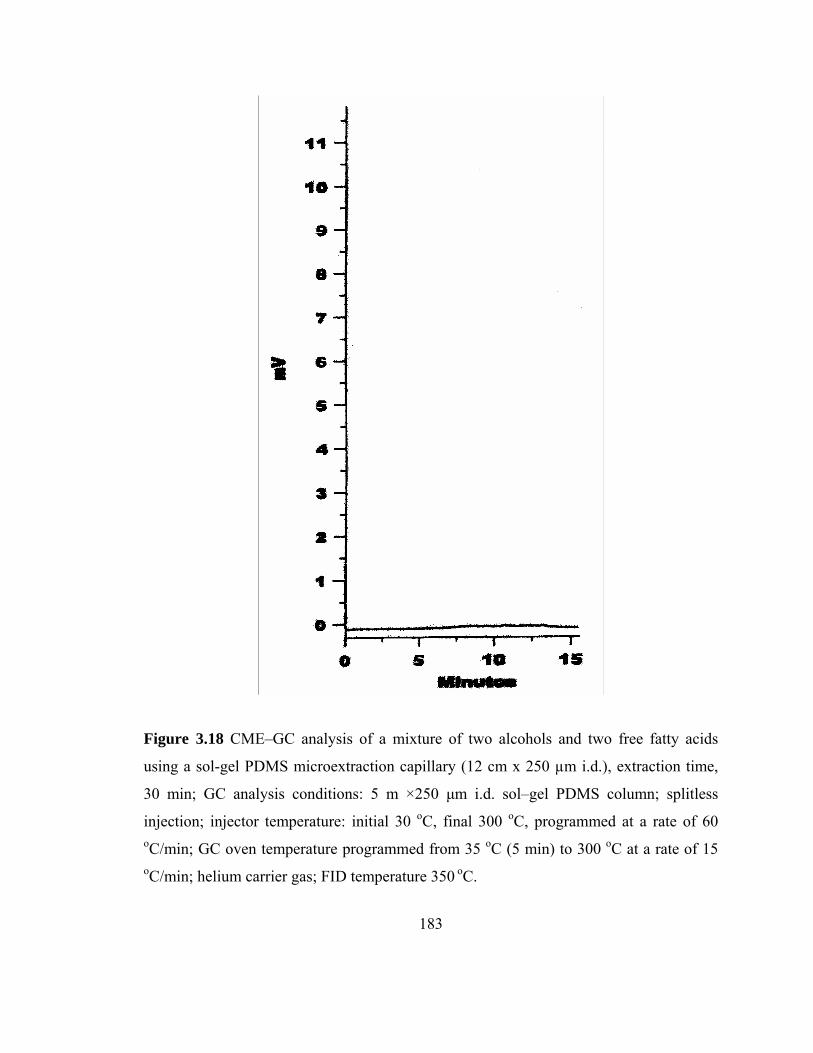
183
Figure 3.18 CME–GC analysis of a mixture of two alcohols and two free fatty acids
using a sol-gel PDMS microextraction capillary (12 cm x 250 µm i.d.), extraction time,
30 min; GC analysis conditions: 5 m ×250 µm i.d. sol–gel PDMS column; splitless
injection; injector temperature: initial 30 oC, final 300 oC, programmed at a rate of 60 oC/min; GC oven temperature programmed from 35 oC (5 min) to 300 oC at a rate of 15 oC/min; helium carrier gas; FID temperature 350 oC.
184
3.4 Conclusion
For the first time, sol–gel CN-PDMS coated microextraction capillaries were
developed for effective preconcentration and trace analysis of polar and non-polar
compounds. In such coatings, the cyanopropyl moieties are primarily responsible for the
extraction of polar analytes and the PDMS moieties are mainly responsible for the
extraction of nonpolar analytes. In conjunction with GC-FID, the sol-gel CN-PDMS
coated microextraction capillaries provided low ng/L level detection limits for polar and
nonpolar analytes directly extracted from aqueous media without requiring derivatization,
pH adjustment, or salting out procedures. The sol-gel CN-PDMS microextraction
coatings possess remarkable performance repeatability. The run-to-run and capillary-to-
capillary peak area RSD values for these coatings were lower than 5% and 6%,
respectively. The sol-gel CN-PDMS coatings showed excellent thermal and solvent
stability. The integrity of the sol-gel CN-PDMS coatings and hence their extraction
abilities for polar analytes was fully preserved even after conditioning at 330 oC.
185
3.5 References to chapter 3
[1] J. Pawliszyn, Solid Phase Microextraction: Theory and Practice, Wiley-VCH, New York, 1997.
[2] L.G. Blomberg, J. Microcol. Sep. 2 (1990) 62.
[3] S.L. Chong, D. Wang, J.D. Hayes, B.W. Wilhite, A. Malik, Anal. Chem. 69 (1997) 3889.
[4] D. Wang, S.L. Chong, A. Malik, Anal. Chem. 69 (1997) 4566.
[5] L. Pan, M. Adams, J. Pawliszyn, Anal. Chem. 67 (1995) 4396.
[6] B.J. Hall, J.S. Brodbelt, J. Chromatogr. A 777 (1997) 275.
[7] S.-P. Yo, Chemosphere 38 (1999) 823.
[8] M. Abalos, J.M. Bayona, J. Pawliszyn, J. Chromatogr. A 873 (2000) 107.
[9] O.E. Mills, A.J. Broome, ACS Symp. Ser. 705 (1998) 85.
[10] V. Mani, Applications of Solid Phase Microextraction, Royal Society of Chemistry, Cambridge, UK, 1999.
[11] M. Liu, Z. Zeng, B. Xiong, J. Chromatogr. A 1065 (2005) 287.
[12] M. Liu, Z. Zeng, Y. Tian, Anal. Chim. Acta 540 (2005) 341.
[13] K. Markides, L. Blomberg, J. Buijten, T. Wannman, J. Chromatogr. 254 (1983) 53.
[14] L. Blomberg, K. Markides, T. Wannman, J. Chromatogr. 203 (1981) 217.
[15] P. Sandra, M. Van Roelenbosch, I. Temmerman, M. Verzele, Chromatographia 16 (1982) 63.
[16] B.A. Jones, J.C. Kuei, J.S. Bradshaw, M.L. Lee, J. Chromatogr. 298 (1984) 389.
[17] B.E. Rossiter, S.L. Reese, S. Morgan, A. Malik, J.S. Bradshaw, M.L. Lee, J. Microcol. Sep. 4 (1993) 521.
[18] A. Malik, I. Ostrovsky, S.R. Sumpter, S.L. Reese, S. Morgan, B.E. Rossiter, J.S.
Bradshaw, M.L. Lee, J. Microcol. Sep. 4 (1993) 529.
186
[19] R.K. Gilpin, W.R. Sisco, Anal. Chem. 50 (1978) 1337.
[20] C. Dewaele, M. Verzele, J. Chromatogr. 197 (1980) 189.
[21] E. Gaetani, C.F. Laureri, A. Mangia, Ann. Chim. 69 (1979) 181.
[22] A. Darin, E.R. Ziad, J. Chromatogr. A 1029 (2004) 239.
[23] G. Musch, D.L. Massart, J. Chromatogr. 432 (1988) 209.
[24] J.W. Kelly, L. He, J.T. Stewart, J. Chromatogr. 622 (1993) 291.
[25] N.B. Smith, S. Mathialagan, K.E. Brooks, J. Anal. Toxicol. 17 (1993) 143.
[26] W. Noll, Chemisty and Technology of Silicones, Academic press, New York, 1968.
[27] B.W. Wright, P.A. Peaden, M.L. Lee, J. High Resolut. Chromatogr. Chromatogr.
Commun. 5 (1982) 413. [28] S. Kulkarni, L. Fang, K. Alhooshani, A. Malik, J. Chromatogr. A 1124 (2006)
205–216. [29] J.D. Hayes, A. Malik, J. Chromatogr. B 695 (1997) 3.
[30] S. Bigham, J. Medlar, A. Kabir, C. Shende, A. Alli, A. Malik, Anal. Chem. 74 (2002) 752.
[31] C. Shende, A. Kabir, E. Townsend, A. Malik, Anal. Chem. 75 (2003) 3518.
[32] A. Kabir, in, University of South Florida, Tampa, 2005, p. 299.
[33] J. Fricke, R. Caps, Ultrastructure Processing of Advanced Ceramics, Wiley, New York, 1988.
[34] A. Malik, S.L. Chong, Applications of Solid Phase microextraction, Royal
Society of Chemistry, Cambridge, UK, 1999. [35] Z. Zeng, W. Qiu, Z. Huang, Anal. Chem. 73 (2001) 2429.
[36] A. Kabir, C. Hamlet, K.S. Yoo, G.R. Newkome, A. Malik, J. Chromatogr. A 1034 (2004) 1.
187
[37] T.Y. Kim, K. Alhooshani, A. Kabir, D.P. Fries, A. Malik, J. Chromatogr. A 1047 (2004) 165.
[38] K. Alhooshani, T.-Y. Kim, A. Kabir, A. Malik, J. Chromatogr. A 1062 (2005) 1.
[39] C. Brinker, G. Scherer, Sol–Gel Science. The Physics and Chemistry of Sol–Gel Processing, Academic Press, San Diego, CA, 1990.
[40] Supelco catalog (2006) 317.
[41] L.H. Keith, W.A. Telliard, Environ. Sci. Technol. 13 (1979) 416.
[42] X. Li, Z. Zeng, S. Gao, H. Li, J. Chromatogr. A 1023 (2004) 15.
[43] R.-a. Doong, S.-m. Chang, Y.-c. Sun, J. Chromatogr. A 879 (2000) 177.
[44] WHO, Air Quality Guidelines for Europe, WHO European, Copenhagen, 1987.
[45] N.R. Council, Formaldehyde and Other Aldehydes: Board on Toxicology and Environmental Health Hazards, National Academy Press, Washington, DC, 1981.
[46] G.D. Leikauf, Environmental Toxicants:Human Exposures and Their Health
Effects, Van Nostrand Reinhold, New York, 1992. [47] J. Nawrocki, I. Kalkowska, A. Dabrowska, J. Chromatogr. A 749 (1996) 157.
[48] M.S. Reisch, Chem. Eng. News 66 (1988) 7.
[49] J. Szadowski, J. Dyes Pigments 14 (1990) 217.
[50] G. Sabbioni, H.-G. Neumann, Carcinogenesis 11 (1990) 111.
[51] Encyclopedia of Occupational Health and Safety, International Labour Office, Geneva, 1983.
[52] P.D. Santo, G. Moneti, M. Salvadori, C. Saltutti, A.D. Rosa, P. Dolara, Cancer
Lett. 60 (1991) 245. [53] E. Ward, A. Carpenter, S. Markowitz, D. Roberts, W. Halperin, J. Natl. Cancer
Inst. 83 (1991) 501. [54] G. Birner, H.G. Neumann, Arch. Toxicol. 62 (1988) 110.
188
[55] P.L. Skipper, X. Peng, C.K. Soohoo, S.R. Tannen-baum, Drug Metab. Rev. 26 (1994) 111.
[56] ACGIH, Threshold Limit Values and Biological Exposure Indices, ACGIH-Press,
Cincinnati, OH, 1999. [57] D.-D. Forschungsgemeinschaft, MAK- and BAT- Values, VCH, Weinheim, 2000.
[58] Y.-l. Fu, Y.-l. Hu, Y.-j. Zheng, G.-K. Li, J. Sep. Sci. 29 (2006) 2684.
[59] V.H. Kitunen, R.J. Valo, M.S. Salkainoja-Salonen, Environ. Sci. Technol. 21 (1987) 96.
[60] D. Puig, D. Barcelo, Trends Anal. Chem. 15 (1996) 362.
[61] M.R. Lee, Y.C. Yeh, W.S. Hsiang, B.H. Hwang, J. Chromatogr. A 806 (1998) 317.
[62] D. Wang, J. Xing, J. Peng, C. Wu, J. Chromatogr. A 1005 (2003) 1.
[63] Z. Wang, C. Xiao, C. Wu, H. Han, J. Chromatogr. A 893 (2000) 157.
[64] M. Portillo, N. Prohibas, V. Salvadó, B.M. Simonet, J. Chromatogr. A 1103 (2006) 29.
[65] M. Liu, Z. Zeng, Y. Lei, H. Li, J. Sep. Sci. 28 (2005) 2306.
[66] E. Fogelqvist, B. Josefsson, C. Roos, J. High Resolut. Chromatogr. Chromatogr. Commun. 3 (1980) 568.
[67] J.H. Brill, B.A. Narayanan, J.P. McCormick, Appl. Spectrosc. 45 (1991) 1617.
189
CHAPTER 4
SOL-GEL IMMOBILIZED SHORT CHAIN POLYETHYLENE GLYCOL
COATING FOR CAPILLARY MICROEXTRACTION
4.1 Introduction
Polyethylene glycols (PEGs) have long been used as polar stationary phases in
gas chromatography (GC) [1-4]. The polar nature of PEG makes it an excellent sorbent
for extraction of the polar analytes that are usually difficult to extract from aqueous
matrices using silicone-based coatings. In solid-phase microextraction (SPME), PEGs
have been used to prepare composite coatings [5,6]; however, low thermal stability [7],
susceptibility to degradation by oxygen [7], and narrow useful temperature range for GC
operation (~ 70 °C – 270 °C) of widely used high molecular weight PEGs (e.g.,
Carbowax 20M) [7,8] are the major shortcomings. Often, free radical cross-linking
reactions are employed to immobilize PEG coatings on the substrate [9,10]. However, in
many instances, only partial immobilization has been achieved [11]. When such coatings
with lower thermal stability are coupled to GC, it may lead to problems like incomplete
desorption and sample carryover.
In recent years, sol-gel technology has proven effective in the immobilization of
PEGs for their use in SPME [12-14], capillary microextraction (CME also called in-tube
190
SPME) [15], and GC stationary phase [16]. The key to the effective immobilization is the
chemical anchoring of PEGs onto the fused silica surface. Thanks to this chemical
bonding, sol-gel coatings possess high thermal and solvent stability [17]. In addition to
this, sol-gel coatings usually give a porous structure which significantly increased the
surface area of the extracting phase allowing the use of thinner coatings to achieve faster
extraction and desired level of sample capacity [18]. Also, sol-gel technology provides
tunable selectivity of a sol-gel coating by changing the relative proportions of organic
and inorganic components of the used sol solution.
Although, sol-gel technology has great promise for the preparation of thermally
stable coatings, to date only high molecular weight PEGs have been successfully
immobilized [12,14-16]. PEGs with higher molecular weights have lower polarity
compared to their low molecular weight counterparts, which limits their ability to extract
highly polar analytes from aqueous matrix at room temperature. Considering this problem,
the goal of this research was to immobilize low molecular weight PEG coatings using
sol-gel chemistry. Here, we describe a sol-gel method for in situ immobilization of low
molecular weight (short chain) PEG to provide a stable coating using N-
(triethoxysilylpropyl)-O-polyethylene oxide urethane (TESP) and demonstrate the
effectiveness of the developed sol-gel PEG coatings for capillary microextraction of polar
analytes from aqueous samples.
191
4.2 Experimental section
4.2.1 Equipment
All the CME-GC experiments with sol-gel PEG coated capillaries were performed
on a Shimadzu Model 17A GC (Shimadzu, Kyoto, Japan) equipped with a flame
ionization detector (FID) and a split-splitless injector. A homebuilt, gas pressure-operated
capillary filling/purging device [19] was used to perform a number of operations: (a)
rinse the fused silica capillary with solvents, (b) fill the extraction capillary with sol
solution, (c) expel the sol solution from the capillary at the end of sol-gel coating process,
and (d) purge the capillary with helium. A Barnstead Model 04741 Nanopure deionized
water system (Barnstead/Thermolyne, Dubuque, IA) was used to obtain ~16.0 MΩ water.
An in-house designed liquid sample dispenser [15] was used to perform CME via
gravity-fed flow of the aqueous samples through the sol-gel PEG coated capillary. A
model G-560 (Scientific Industries, Bohemia, NY) vortex shaker was used to mix the
coating solution ingredients. A ThermoIEC model Micromax microcentrifuge (Needham
Heights, MA) was used to separate the sol solution from the precipitate (if any) at 14 000
rpm (~ 15 915 g). A JEOL model JSM-35 scanning electron microscope (SEM) was used
to investigate the surface morphology of sol-gel PEG coated capillaries.
4.2.2 Materials and chemicals
N-(triethoxysilylpropyl)-O-polyethylene oxide urethane (TESP, 95%) was
192
purchased from Gelest (Morrisville, PA). Fused silica capillary (250 µm i.d.) with a
protective polyimide coating on the external surface was purchased from Polymicro
Technologies (Phoenix, AZ). HPLC-grade solvents (dichloromethane, methanol, and
tetrahydrofuran (THF)), Kimwipes tissue paper, polypropylene microcentrifuge tubes
(2.0 mL), and 7.0 mL borosilicate vials (used to store standard solutions) were purchased
from Fisher Scientific (Pittsburgh, PA). Aldehydes (nonanal, decanal, undecanal, and
dodecanal), ketones (4’-chloroacetophenone, valerophenone, hexanophenone,
benzophenone, 2,3-dichloro-1,4-naphthoquinone), aniline derivatives (2-chloroaniline, 3-
ethylaniline, 3-bromoaniline, N-butylaniline, N-phenylaniline), substituted phenols (2,4-
dimethylphenol, 3,4-dichlorophenol, 2,4,6-trichlorophenol, 2-tert-butyl-4-
methoxyphenol), fatty acids (octanoic acid, nonanoic acid, decanoic acid, undecanoic
acid), methyltrimethoxysilane (MTMOS, 98%), and trifluoroacetic acid (TFA, 99%)
were purchased from Aldrich (Milwaukee, WI). Alcohols (1-heptanol, 1-octanol, 1-
nonanol, 1-decanol) were purchased from Acros (Pittsburgh, PA).
4.2.3 Preparation of sol-gel PEG coated microextraction capillaries
Preparation of sol-gel coated extraction capillaries involved following operations:
(1) preparation of the sol solution, (2) pretreatment of fused silica capillary, (3) coating
the fused silica capillary with the sol solution, and (4) post-coating treatment.
193
4.2.3.1 Preparation of sol solution
A sol solution designed to prepare a hybrid sol-gel organic-inorganic coating
consisted of an alkoxide precursor, a sol-gel co-precursor with a bonded PEG moiety, an
appropriate organic solvent (dichloromethane), and a sol-gel catalyst (trifluoroacetic acid).
Table 4.1 presents the names, functions, and chemical structures of different chemical
ingredients used to prepare the sol solution for creating the sol-gel PEG coated
microextraction capillaries.
A sol-gel coating solution was prepared as follows: First 100 µL MTMOS (sol-gel
precursor) and 50 mg of TESP (sol-gel co-precursor) were dissolved in 500 µL
dichloromethane (solvent) contained in a polypropylene microcentrifuge vial.
Subsequently, 100 µL of TFA (sol-gel catalyst) containing 10 % water was added to the
microcentrifuge vial and mixed for 2 minutes using a vortex shaker. The resulting
solution was centrifuged at 14 000 rpm (~ 15 915 g) for 5 min. The clear supernatant of
the sol solution was transferred to another clean vial, and was further used to coat fused
silica capillaries for use in capillary microextraction.
4.2.3.2 Pretreatment of fused silica capillary
The main purpose of pretreatment of the fused silica capillary is to clean its inner
walls and enhance the content of the surface silanol (Si-OH) groups, and thereby
facilitate effective covalent bonding of the sol-gel sorbent materials to the fused silica
substrate. For this, the fused silica capillary (~ 2 m) was first rinsed sequentially with
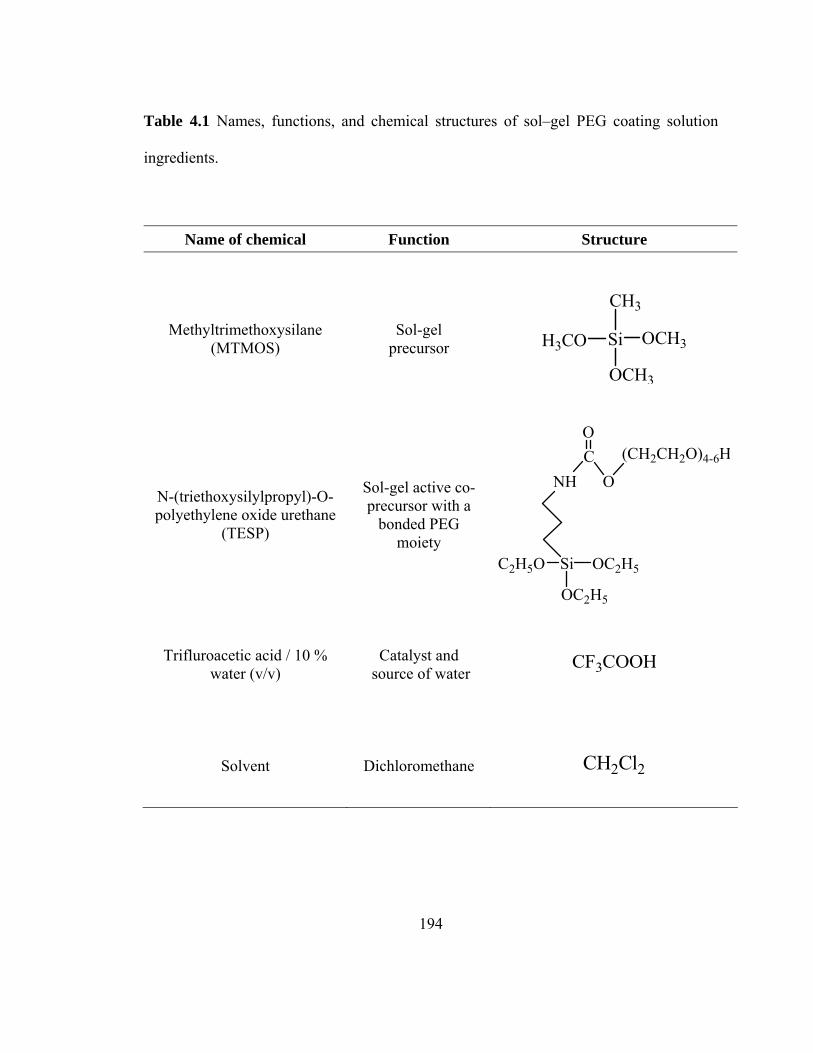
194
Table 4.1 Names, functions, and chemical structures of sol–gel PEG coating solution
ingredients.
Name of chemical Function Structure
Methyltrimethoxysilane (MTMOS)
Sol-gel precursor Si OCH3
OCH3
H3CO
CH3
N-(triethoxysilylpropyl)-O-polyethylene oxide urethane
(TESP)
Sol-gel active co-precursor with a
bonded PEG moiety
NHCO
O
(CH2CH2O)4-6H
Si OC2H5
OC2H5
C2H5O
Trifluroacetic acid / 10 % water (v/v)
Catalyst and source of water
CF3COOH
Solvent Dichloromethane CH2Cl2
195
dichloromethane (1 mL) and methanol (1 mL) using gas pressure-operated capillary
filling/purging device (Figure 2.3) to clean the capillary inner surface off any organic
contaminants. The rinsed capillary was then purged with helium (50 psi) for 30 min
followed by hydrothermal treatment. To perform hydrothermal treatment, the cleaned
fused silica capillary was filled with deionized water using the filling/purging device and
after 15 min of in-capillary residence time the water was flushed out of the capillary with
the aid of helium gas pressure (50 psi). The capillary was then purged with helium gas for
30 min so that only a thin layer of water remained on the inner surface of the capillary. At
this point, both the ends of the fused silica capillary were sealed with an oxy-acetylene
torch and the sealed capillary was heated at 250 °C in a GC oven for 2 hours. Under these
conditions, additional silanol groups are generated on the fused silica capillary surface as
a result of the hydrolysis of siloxane bridges. Following this, both the ends of the
capillary were cut open with a ceramic wafer. One end of the fused silica capillary was
then connected to the GC injection port with the help of a graphite ferrule and the
capillary was heated again in the GC oven at 250 °C for 2 hours under continuous helium
flow (1 mL/min) through the capillary. After this, the capillary was ready for coating.
4.2.3.3 Coating of the fused silica capillary with sol solution
A hydrothermally treated [16] fused silica capillary (2 m) was filled with the
freshly prepared sol solution using a helium (50 psi) pressure-operated filling/purging
device (Figure 2.4). The sol solution was allowed to stay inside the capillary for 15
196
minutes. During this residence period of the sol solution inside the capillary, a sol-gel
hybrid organic-inorganic polymeric network evolved within the sol solution, and part of
it ultimately became bonded to the fused silica capillary inner surface via condensation
reaction with surface silanol groups. The residence time of the sol solution inside the
capillary must be carefully controlled. A systematic study on the gelation time of sol
solution was conducted to optimize the residence time of sol solution inside the fused
silica capillary (Appendix B). After keeping the sol solution inside the capillary for the
optimized period of time (~ 15 min), the unbonded portion of the solution was expelled
from the capillary under helium pressure (50 psi), leaving behind a surface-bonded sol-
gel coating within the capillary. The sol-gel PEG coated capillary was subsequently dried
by purging with helium (50 psi) for an hour. The helium gas flow facilitated the
evaporation of liquids associated with the coating.
4.2.3.4 Post-coating treatment
The purpose of post-coating treatment is to physically and chemically stabilize the
sorbent coating on the fused silica capillary surface and remove any residual non-bonded
portion of sol solution from the capillary. For this, the coated capillary was installed in a
GC oven with one end of the capillary connected to the injection port and the other end
left open in the GC oven. The sol-gel coated capillary was then thermally conditioned in
the GC oven using temperature-programmed heating from 35 oC to 340 oC at 1 oC/min,
holding it at 340 oC for 60 min under helium flow (1 mL/min).
197
Before using in extraction, the coated capillary was rinsed with 1 mL
dichloromethane/methanol (1:1 v/v) mixture followed by purging with helium for 30-45
min to remove any residual solvent. Rinsing the capillary with the organic solvent helps
clean the sol-gel coating surface. After rinsing, the capillary was conditioned again from
35 oC to 340 oC at 5 oC/min, holding it at 340 oC for 30 min under helium flow (1
mL/min). The conditioned capillary was then cut into 12 cm long pieces that were further
used in capillary microextraction.
4.2.4 Preparation of the standard sample solutions for CME
Stock solutions (10 mg/mL) of the selected analytes were prepared in methanol or
THF and stored in surface-deactivated [15] amber glass vials. For extraction, fresh
aqueous samples were prepared by further diluting these stock solutions to ng/mL level
concentrations.
4.2.5 Capillary microextraction of analytes on sol-gel PEG coated capillaries
A Chromaflex AQ column (Knotes Glass, Vineland, NJ) was modified as
described in ref. [15] and used for gravity-fed sample delivery to the sol-gel PEG
capillary for preconcentration by CME (Figure 3.1). A 12-cm long piece of thermally
conditioned sol-gel PEG coated microextraction capillary (250 µm i.d.) was vertically
connected to the lower end of the gravity-fed sample dispenser. The aqueous sample (50
mL) was poured into the dispenser from its top end and allowed to flow through the
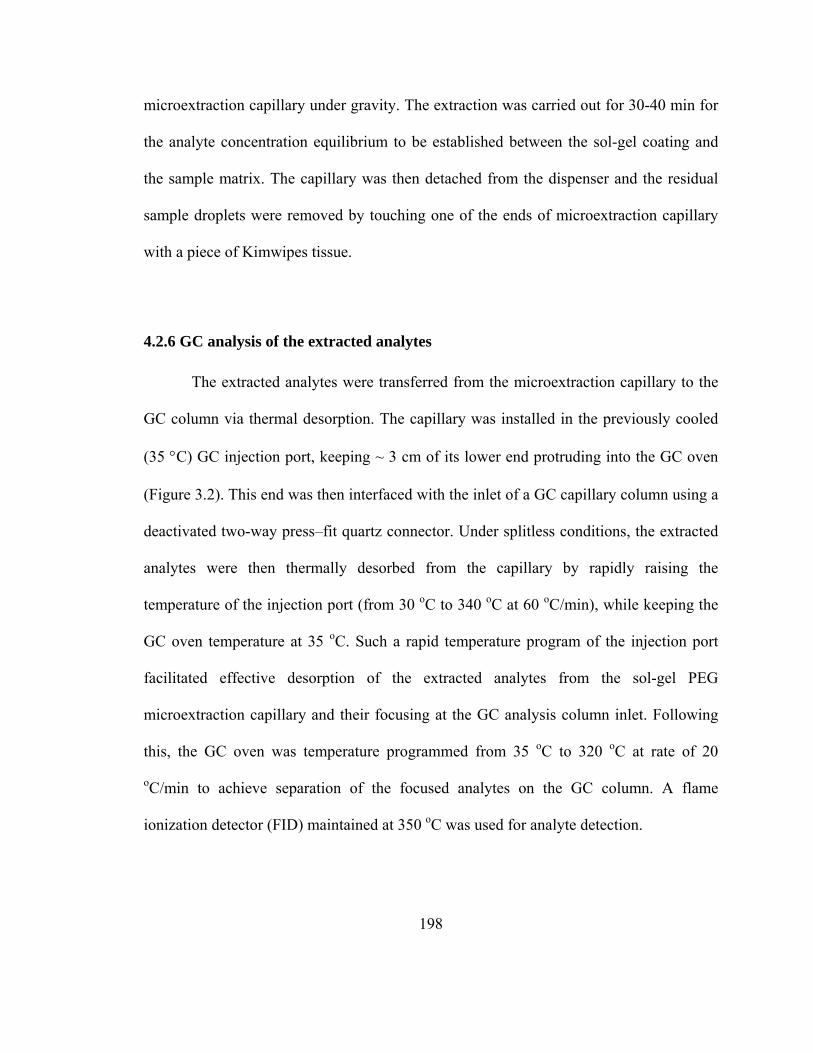
198
microextraction capillary under gravity. The extraction was carried out for 30-40 min for
the analyte concentration equilibrium to be established between the sol-gel coating and
the sample matrix. The capillary was then detached from the dispenser and the residual
sample droplets were removed by touching one of the ends of microextraction capillary
with a piece of Kimwipes tissue.
4.2.6 GC analysis of the extracted analytes
The extracted analytes were transferred from the microextraction capillary to the
GC column via thermal desorption. The capillary was installed in the previously cooled
(35 °C) GC injection port, keeping ~ 3 cm of its lower end protruding into the GC oven
(Figure 3.2). This end was then interfaced with the inlet of a GC capillary column using a
deactivated two-way press–fit quartz connector. Under splitless conditions, the extracted
analytes were then thermally desorbed from the capillary by rapidly raising the
temperature of the injection port (from 30 oC to 340 oC at 60 oC/min), while keeping the
GC oven temperature at 35 oC. Such a rapid temperature program of the injection port
facilitated effective desorption of the extracted analytes from the sol-gel PEG
microextraction capillary and their focusing at the GC analysis column inlet. Following
this, the GC oven was temperature programmed from 35 oC to 320 oC at rate of 20
oC/min to achieve separation of the focused analytes on the GC column. A flame
ionization detector (FID) maintained at 350 oC was used for analyte detection.
199
4.2.7 Calculation of the limit of detection (LOD) for the extracted analytes
The LOD is related to both the signal and the noise of the analytical instrument
and usually is defined as the concentration of the test analyte which gives a signal (S)
three times the noise (N) of the analytical instrument (i.e. concentration for which S/N
ratio is 3:1). In order to calculate LOD, each analyte was extracted individually under
same extraction conditions and the peak height (signal) of the analyte was measured in
mV. The noise was measured in µV from the baseline of the chromatogram using the
ChromPerfect for Windows (Version 3.5) computer software (Justice Laboratory
Software, Mountain Views, CA). The limit of detection of the compound was calculated
using the equation 3.1.
4.2.8 Analyte enhancement factor for short chain sol-gel PEG coated
microextraction capillaries
Analyte enhancement factor [20] of the short chain sol-gel PEG coated capillary
was measured using 1-undecanol as a test analyte. The procedure has been described in
chapter 3 (section 3.2.8). The analyte enhancement factor was found to be 32,500 for a
(12-cm x 250 µm i.d.) sol-gel PEG coated microextraction capillary with a coating
volume of 0.094 µL.
4.3 Results and discussion
Sol–gel chemistry provides an effective synthetic pathway for creating organic–
200
inorganic hybrid materials of desired properties. Due to it’s versatility, in recent years, it
has been effectively utilized to create surface-bonded coatings on the outer surface of
conventional SPME fibers [18,21,22] as well as on the inner walls of fused silica
capillary for use in CME or in-tube SPME [15,23-26].
In the present work, sol-gel chemistry was used to immobilize a low molecular
weight PEG on fused silica capillary inner surface creating sol-gel PEG coating which
provided efficient extraction of moderately polar and highly polar aqueous trace analytes.
4.3.1 Reactions leading to the formation of a chemically immobilized sol-gel PEG
network
It is well-known from the basic principles of sol-gel chemistry [27] that
alkoxysilane compounds are capable of undergoing hydrolytic polycondensation
reactions in the presence of a sol-gel catalyst. As can be seen in Table 4.1, the used sol
solution contained MTMOS (sol-gel precursor) and N-(triethoxysilylpropyl)-O-
polyethylene oxide urethane (TESP) (sol-gel co-precursor with PEG moiety). TESP,
which carries triethoxysilane groups at one end and hydroxyl terminated polyethylene
oxide chain at other end, is the key sol-gel active ingredient.
The creation of sol-gel PEG coating involved following processes: (1) hydrolysis
of the alkoxysilane compounds, MTMOS and TESP (Scheme 4.1); (2) polycondensation
of the hydrolyzed species with themselves and other sol-gel active ingredients in the sol
solution (Scheme 4.2); and (3) chemical anchoring of the evolving sol-gel network to the
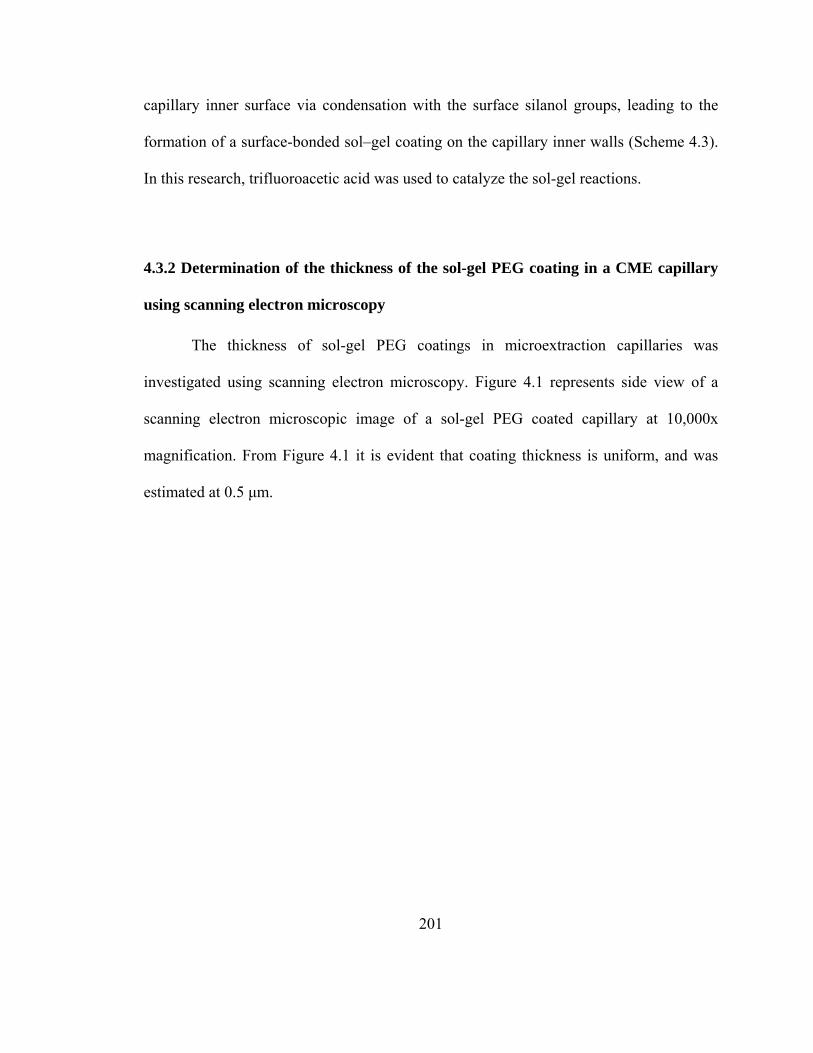
201
capillary inner surface via condensation with the surface silanol groups, leading to the
formation of a surface-bonded sol–gel coating on the capillary inner walls (Scheme 4.3).
In this research, trifluoroacetic acid was used to catalyze the sol-gel reactions.
4.3.2 Determination of the thickness of the sol-gel PEG coating in a CME capillary
using scanning electron microscopy
The thickness of sol-gel PEG coatings in microextraction capillaries was
investigated using scanning electron microscopy. Figure 4.1 represents side view of a
scanning electron microscopic image of a sol-gel PEG coated capillary at 10,000x
magnification. From Figure 4.1 it is evident that coating thickness is uniform, and was
estimated at 0.5 µm.
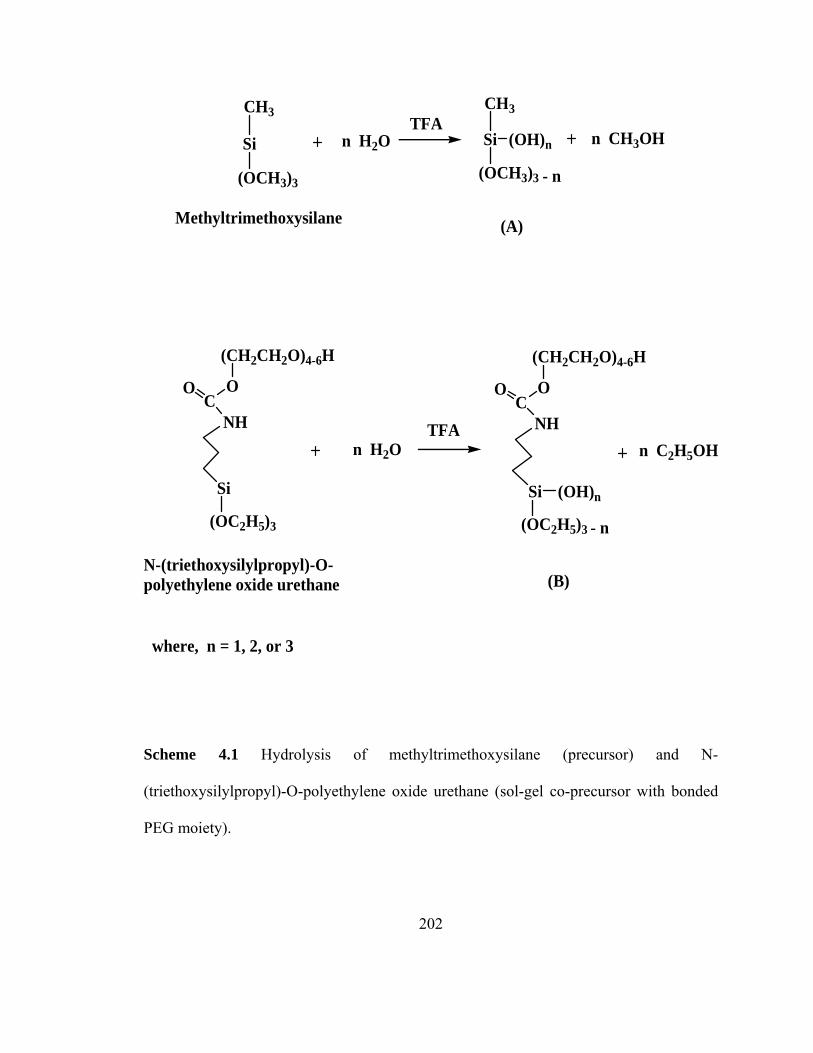
202
Si
(OCH3)3
CH3
n CH3OHSi (OH)n
CH3
n H2O
N-(triethoxysilylpropyl)-O-polyethylene oxide urethane
Methyltrimethoxysilane
Si (OH)n
(OC2H5)3
NHC
O O
(CH2CH2O)4-6H
Si
(OC2H5)3
TFA
TFA
n H2O
- n(OCH3)3
- n
NHC
O O
(CH2CH2O)4-6H
n C2H5OH
where, n = 1, 2, or 3
(A)
(B)
Scheme 4.1 Hydrolysis of methyltrimethoxysilane (precursor) and N-
(triethoxysilylpropyl)-O-polyethylene oxide urethane (sol-gel co-precursor with bonded
PEG moiety).
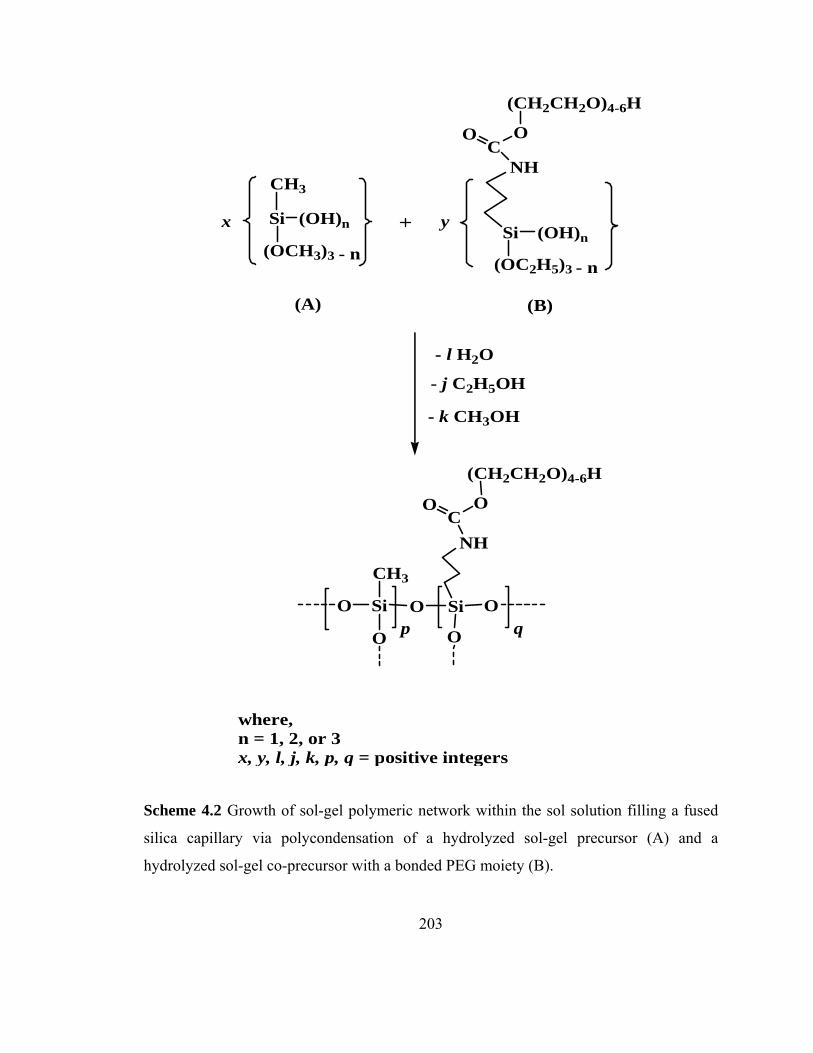
203
Si (OH)n
CH3
- n(OCH3)3
Si (OH)n
(OC2H5)3 - n
NHC
O O
(CH2CH2O)4-6H
- l H2O
- j C2H5OH
- k CH3OH
yx
where, n = 1, 2, or 3x, y, l, j, k, p, q = positive integers
OSiO SiOqOO p
NHC
O O
(CH2CH2O)4-6H
CH3
(B)(A)
Scheme 4.2 Growth of sol-gel polymeric network within the sol solution filling a fused
silica capillary via polycondensation of a hydrolyzed sol-gel precursor (A) and a
hydrolyzed sol-gel co-precursor with a bonded PEG moiety (B).
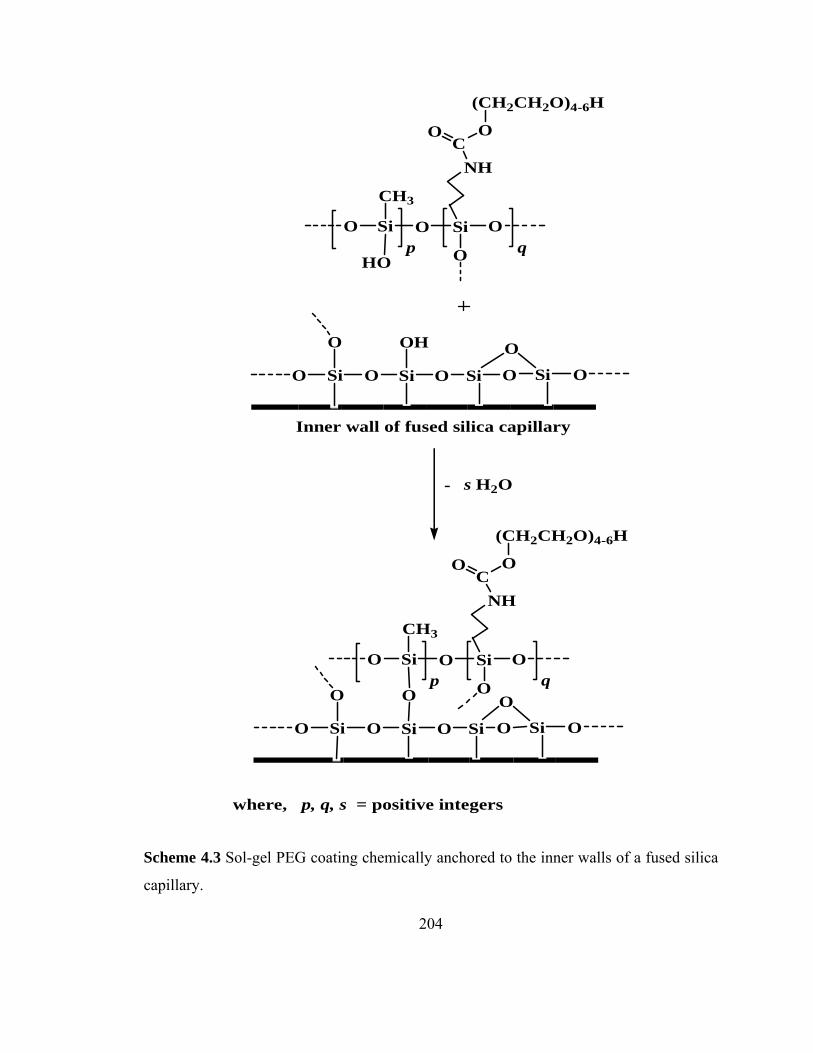
204
OSiO SiOqOHO
p
NHC
O O
(CH2CH2O)4-6H
CH3
Si O Si O Si OOSiO
OH
- s H2O
Inner wall of fused silica capillary
OO
where, p, q, s = positive integers
Si O Si O Si OOSiO
O OO
OSiO SiOqOp
NHC
O O
(CH2CH2O)4-6H
CH3
Scheme 4.3 Sol-gel PEG coating chemically anchored to the inner walls of a fused silica
capillary.
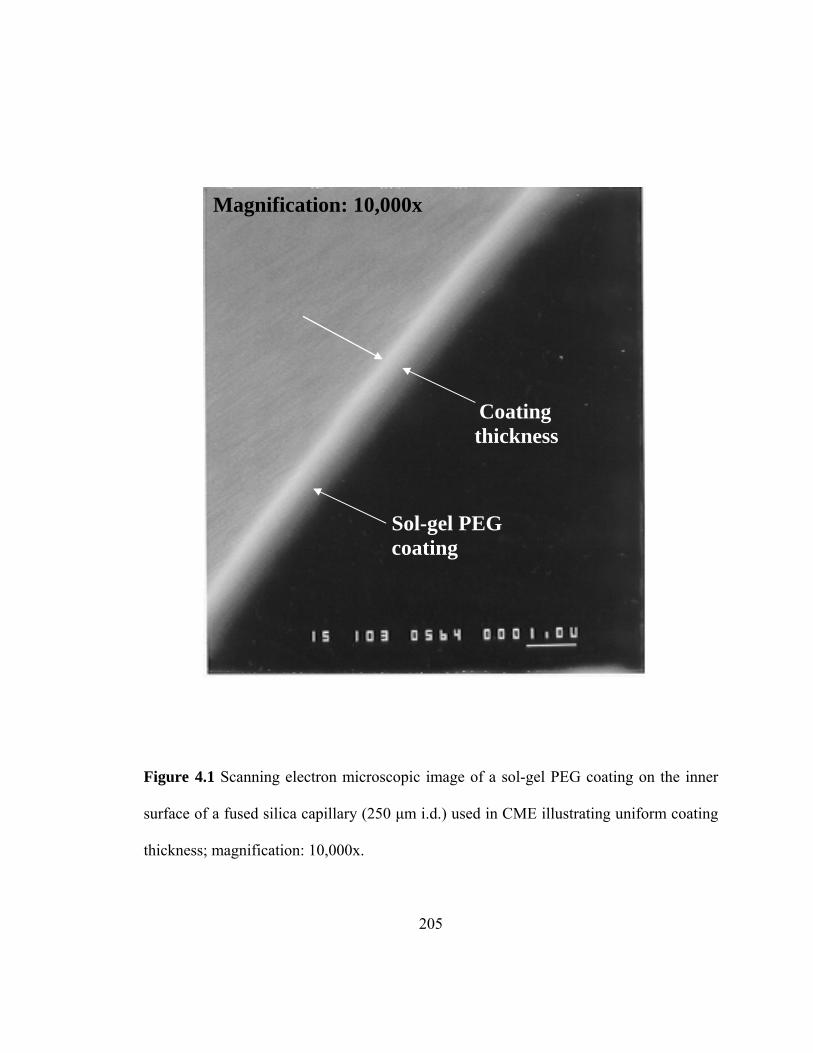
205
Figure 4.1 Scanning electron microscopic image of a sol-gel PEG coating on the inner
surface of a fused silica capillary (250 µm i.d.) used in CME illustrating uniform coating
thickness; magnification: 10,000x.
Coating thickness
Sol-gel PEG coating
Magnification: 10,000x
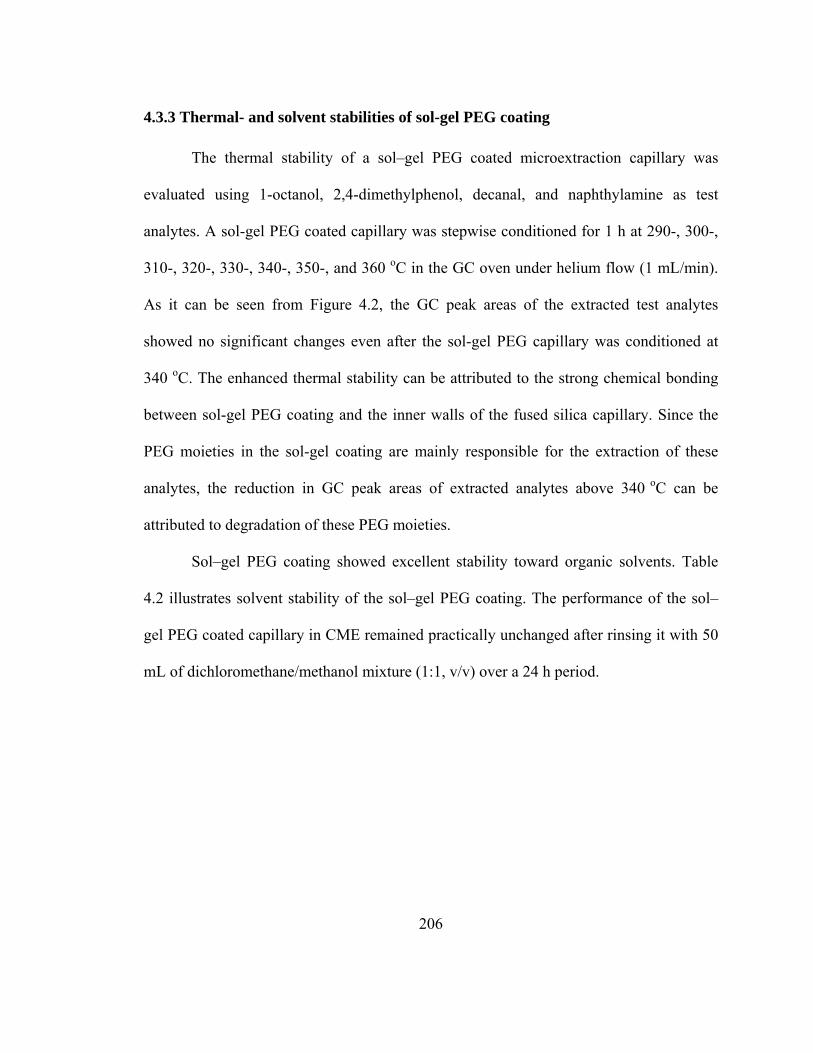
206
4.3.3 Thermal- and solvent stabilities of sol-gel PEG coating
The thermal stability of a sol–gel PEG coated microextraction capillary was
evaluated using 1-octanol, 2,4-dimethylphenol, decanal, and naphthylamine as test
analytes. A sol-gel PEG coated capillary was stepwise conditioned for 1 h at 290-, 300-,
310-, 320-, 330-, 340-, 350-, and 360 oC in the GC oven under helium flow (1 mL/min).
As it can be seen from Figure 4.2, the GC peak areas of the extracted test analytes
showed no significant changes even after the sol-gel PEG capillary was conditioned at
340 oC. The enhanced thermal stability can be attributed to the strong chemical bonding
between sol-gel PEG coating and the inner walls of the fused silica capillary. Since the
PEG moieties in the sol-gel coating are mainly responsible for the extraction of these
analytes, the reduction in GC peak areas of extracted analytes above 340 oC can be
attributed to degradation of these PEG moieties.
Sol–gel PEG coating showed excellent stability toward organic solvents. Table
4.2 illustrates solvent stability of the sol–gel PEG coating. The performance of the sol–
gel PEG coated capillary in CME remained practically unchanged after rinsing it with 50
mL of dichloromethane/methanol mixture (1:1, v/v) over a 24 h period.
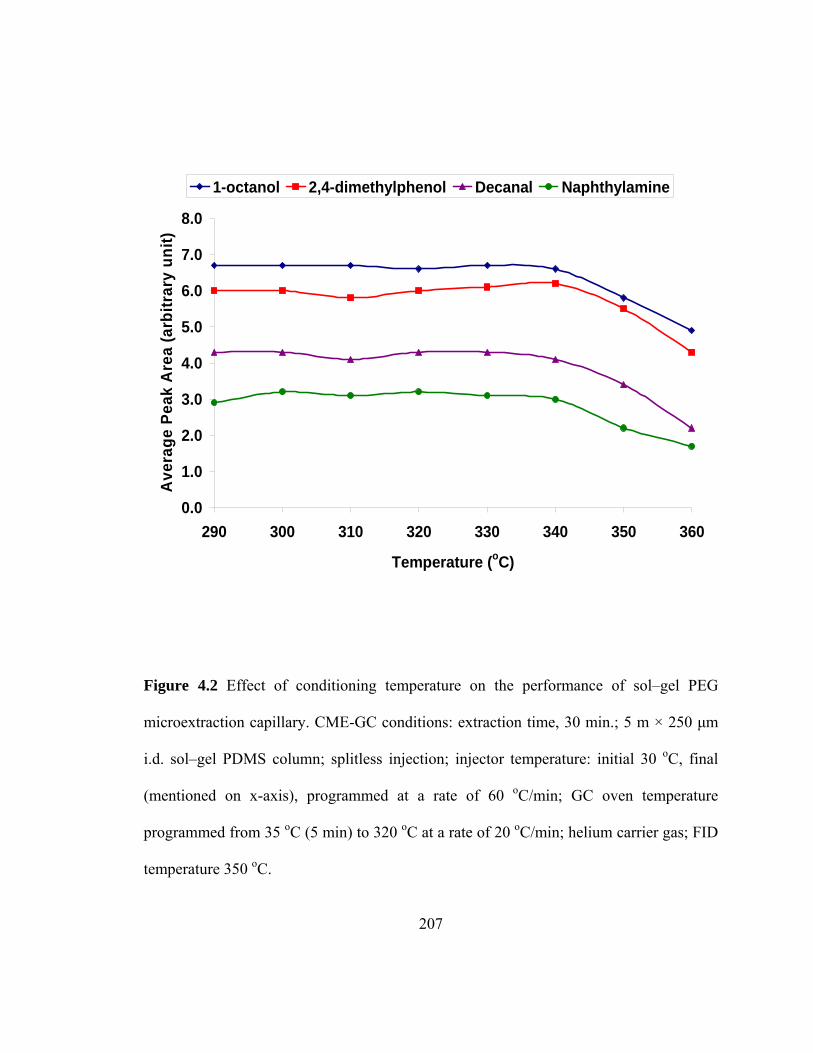
207
0.0
1.0
2.0
3.0
4.0
5.0
6.0
7.0
8.0
290 300 310 320 330 340 350 360
Temperature (oC)
Ave
rage
Pea
k A
rea
(arb
itrar
y un
it)1-octanol 2,4-dimethylphenol Decanal Naphthylamine
Figure 4.2 Effect of conditioning temperature on the performance of sol–gel PEG
microextraction capillary. CME-GC conditions: extraction time, 30 min.; 5 m × 250 µm
i.d. sol–gel PDMS column; splitless injection; injector temperature: initial 30 oC, final
(mentioned on x-axis), programmed at a rate of 60 oC/min; GC oven temperature
programmed from 35 oC (5 min) to 320 oC at a rate of 20 oC/min; helium carrier gas; FID
temperature 350 oC.
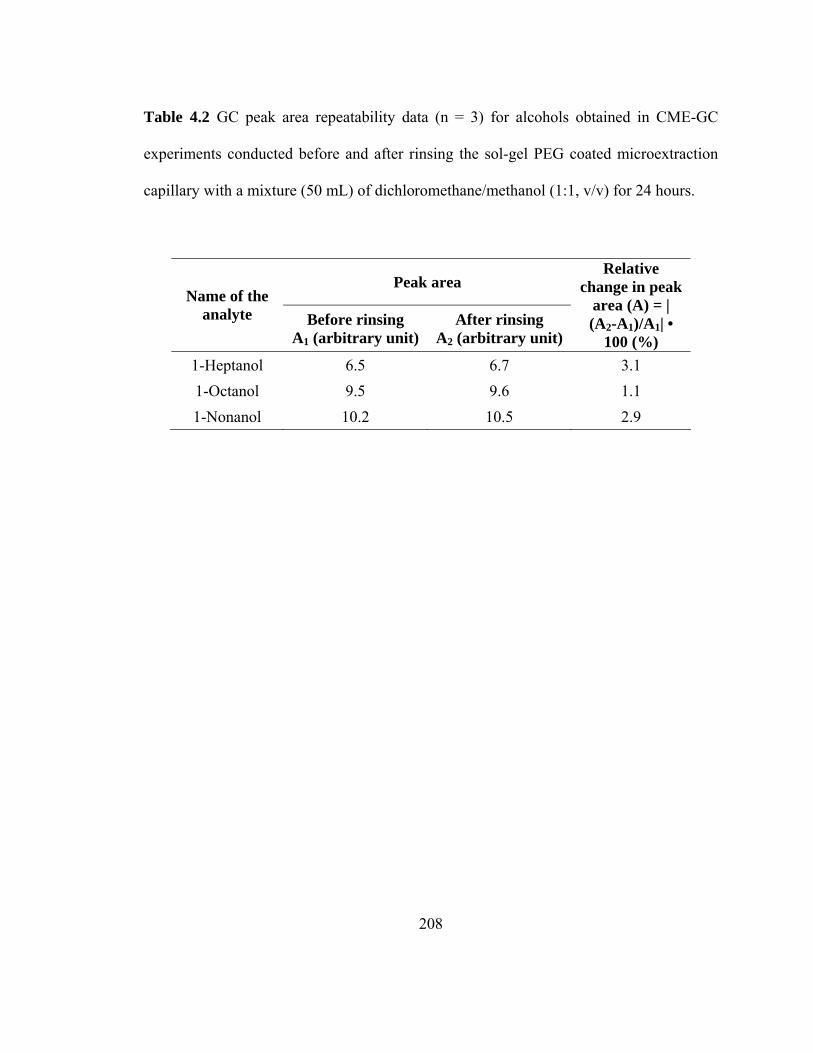
208
Table 4.2 GC peak area repeatability data (n = 3) for alcohols obtained in CME-GC
experiments conducted before and after rinsing the sol-gel PEG coated microextraction
capillary with a mixture (50 mL) of dichloromethane/methanol (1:1, v/v) for 24 hours.
Peak area Name of the
analyte Before rinsing A1 (arbitrary unit)
After rinsing A2 (arbitrary unit)
Relative change in peak
area (A) = | (A2-A1)/A1| •
100 (%) 1-Heptanol 6.5 6.7 3.1 1-Octanol 9.5 9.6 1.1 1-Nonanol 10.2 10.5 2.9
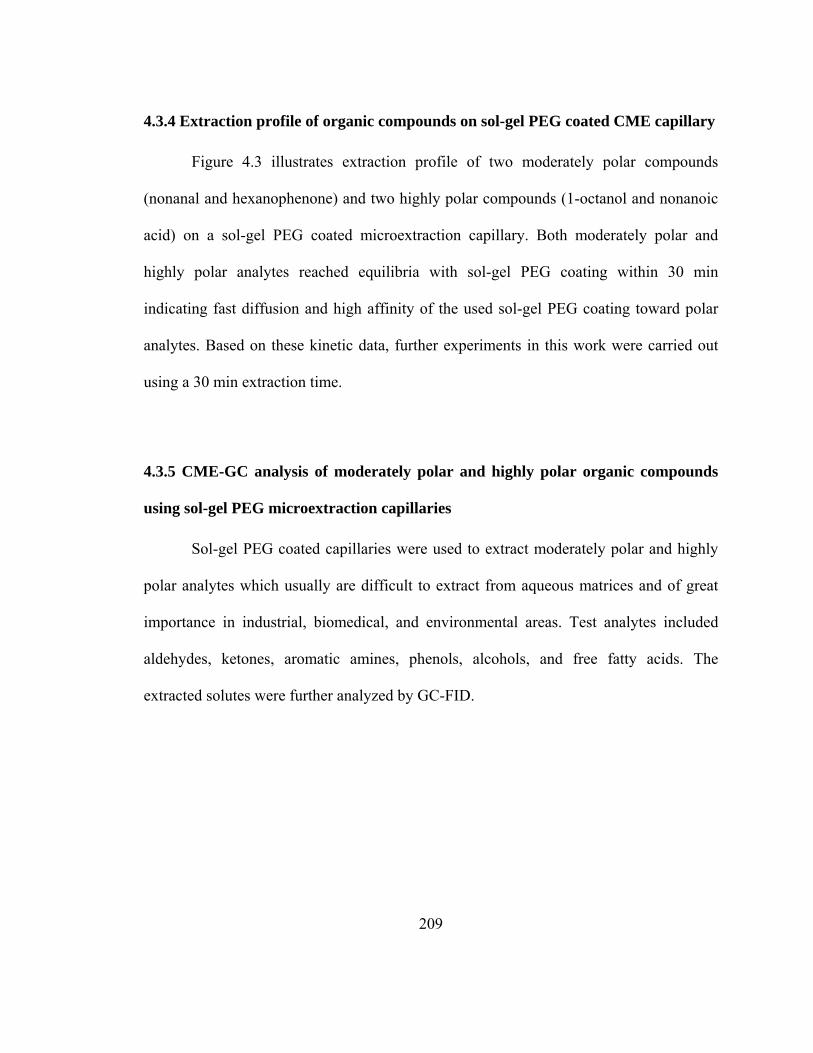
209
4.3.4 Extraction profile of organic compounds on sol-gel PEG coated CME capillary
Figure 4.3 illustrates extraction profile of two moderately polar compounds
(nonanal and hexanophenone) and two highly polar compounds (1-octanol and nonanoic
acid) on a sol-gel PEG coated microextraction capillary. Both moderately polar and
highly polar analytes reached equilibria with sol-gel PEG coating within 30 min
indicating fast diffusion and high affinity of the used sol-gel PEG coating toward polar
analytes. Based on these kinetic data, further experiments in this work were carried out
using a 30 min extraction time.
4.3.5 CME-GC analysis of moderately polar and highly polar organic compounds
using sol-gel PEG microextraction capillaries
Sol-gel PEG coated capillaries were used to extract moderately polar and highly
polar analytes which usually are difficult to extract from aqueous matrices and of great
importance in industrial, biomedical, and environmental areas. Test analytes included
aldehydes, ketones, aromatic amines, phenols, alcohols, and free fatty acids. The
extracted solutes were further analyzed by GC-FID.
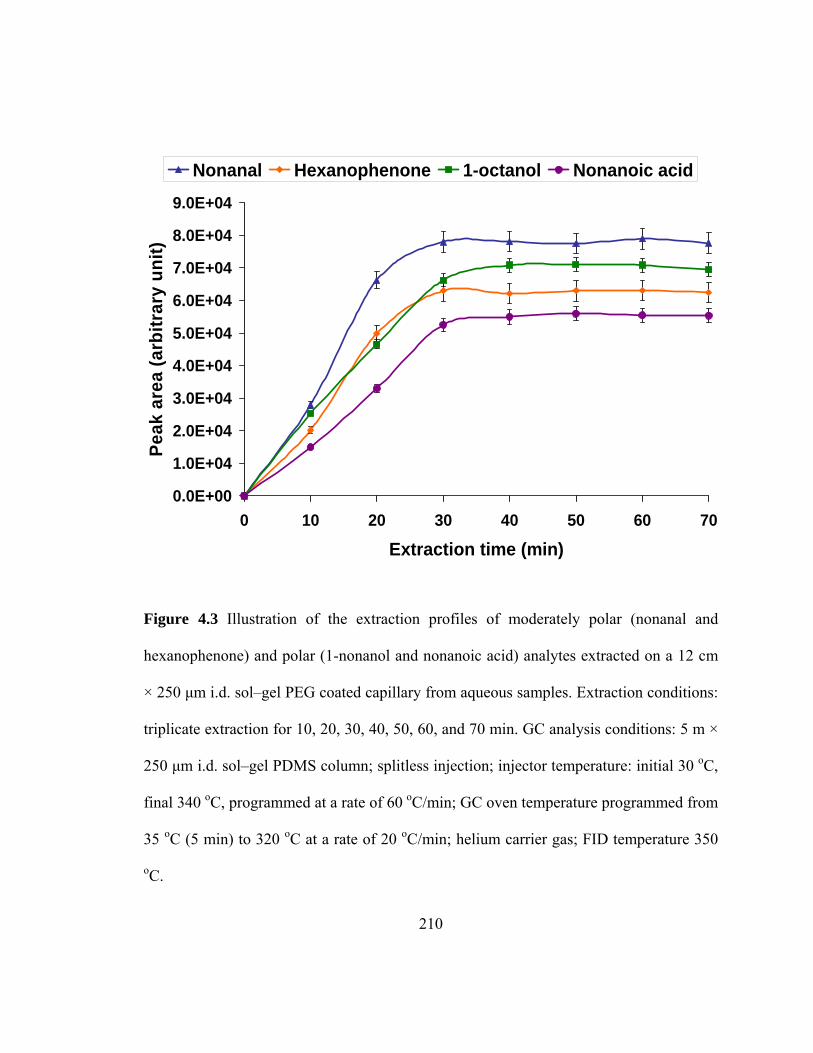
210
0.0E+00
1.0E+04
2.0E+04
3.0E+04
4.0E+04
5.0E+04
6.0E+04
7.0E+04
8.0E+04
9.0E+04
0 10 20 30 40 50 60 70
Extraction time (min)
Peak
are
a (a
rbitr
ary
unit)
Nonanal Hexanophenone 1-octanol Nonanoic acid
Figure 4.3 Illustration of the extraction profiles of moderately polar (nonanal and
hexanophenone) and polar (1-nonanol and nonanoic acid) analytes extracted on a 12 cm
× 250 µm i.d. sol–gel PEG coated capillary from aqueous samples. Extraction conditions:
triplicate extraction for 10, 20, 30, 40, 50, 60, and 70 min. GC analysis conditions: 5 m ×
250 µm i.d. sol–gel PDMS column; splitless injection; injector temperature: initial 30 oC,
final 340 oC, programmed at a rate of 60 oC/min; GC oven temperature programmed from
35 oC (5 min) to 320 oC at a rate of 20 oC/min; helium carrier gas; FID temperature 350
oC.
211
4.3.5.1 CME-GC-FID of aldehydes and ketones using sol-gel PEG coated
microextraction capillaries
Aldehydes and ketones (carbonyl compounds) play an important role in aquatic
oxidation processes. They can form in water by the photodegradation of dissolved natural
organic matter [28]. They are also major disinfection by products formed as a result of
chemical reaction between disinfectant (ozone or chlorine) and natural organic matter in
drinking water [29]. Several of these by-products have been shown to be carcinogens or
carcinogen suspects [30,31]. This makes quantitative detection of carbonyl compounds
very important. Analytical determination of aldehydes is often performed through
derivatization into less polar or easy-to-detect forms [32]. In this work, aldehydes were
extracted and analyzed without derivatization. We extracted four underivatized aldehydes
using sol-gel PEG coated microextraction capillary. List of these underivatized aldehydes
is provided in Table 4.3. Figure 4.4 is a gas chromatogram representing a mixture of 4
underivatized aldehydes. Microextraction results have been presented in Table 4.4, Table
4.5. Table 4.6 represents the calculated detection limits for these underivatized aldehydes.
We obtained detection limits of 20.4 ng/L, 11.8 ng/L, and 16.1 ng/L for nonanal, decanal,
and undecanal, respectively, in CME-GC-FID experiments using sol-gel PEG coated
microextraction capillaries. By comparison, these LOD values are better than those
reported in the literature for the same compounds extracted using sol-gel PDMS coated
microexrtaction capillaries (i.e. 40.4 ng/L, 28.3 ng/L, and 50.4 ng/L for nonal, decanal,
and undecanal, respectively) [15].
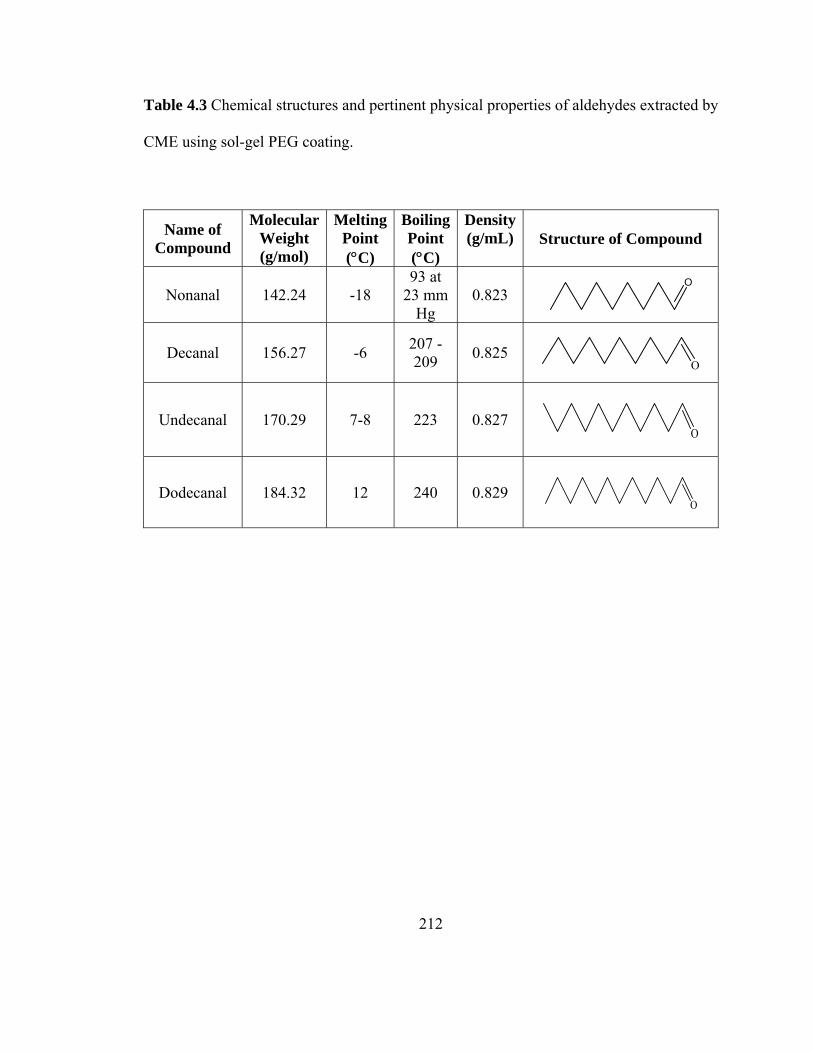
212
Table 4.3 Chemical structures and pertinent physical properties of aldehydes extracted by
CME using sol-gel PEG coating.
Name of Compound
Molecular Weight (g/mol)
Melting Point (°C)
Boiling Point (°C)
Density(g/mL) Structure of Compound
Nonanal 142.24 -18 93 at
23 mm Hg
0.823 O
Decanal 156.27 -6 207 - 209 0.825
O
Undecanal 170.29 7-8 223 0.827
O
Dodecanal 184.32 12 240 0.829
O
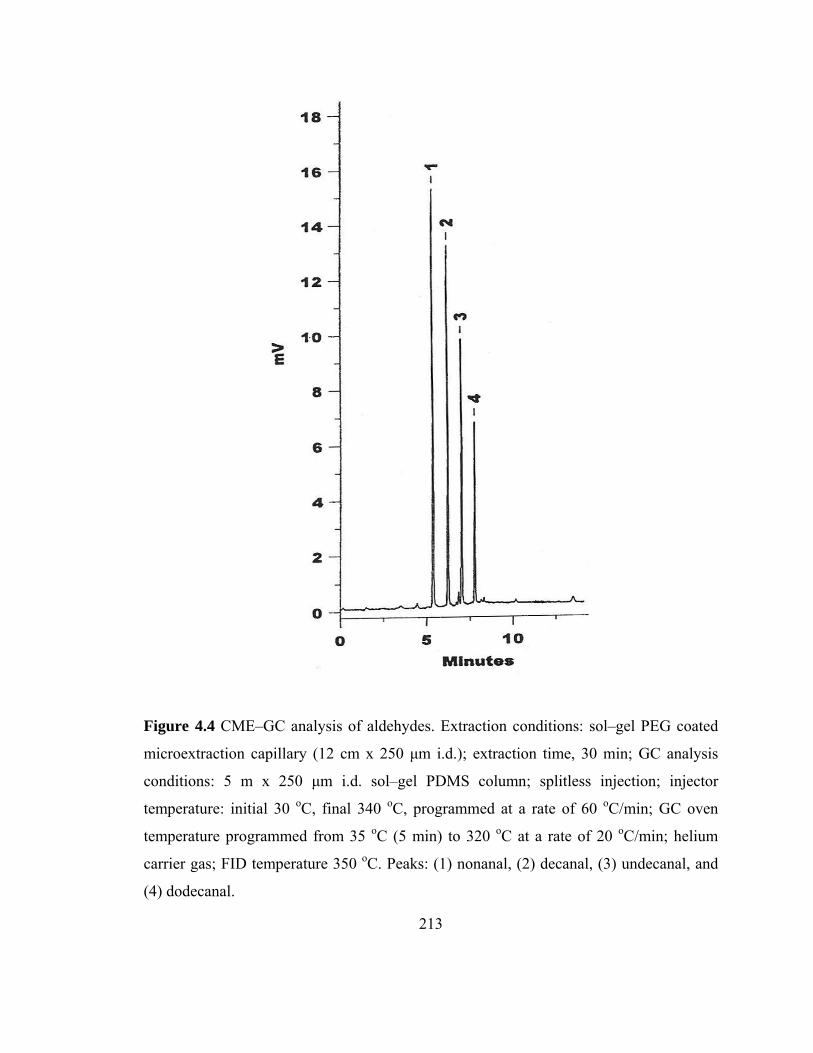
213
Figure 4.4 CME–GC analysis of aldehydes. Extraction conditions: sol–gel PEG coated
microextraction capillary (12 cm x 250 µm i.d.); extraction time, 30 min; GC analysis
conditions: 5 m x 250 µm i.d. sol–gel PDMS column; splitless injection; injector
temperature: initial 30 oC, final 340 oC, programmed at a rate of 60 oC/min; GC oven
temperature programmed from 35 oC (5 min) to 320 oC at a rate of 20 oC/min; helium
carrier gas; FID temperature 350 oC. Peaks: (1) nonanal, (2) decanal, (3) undecanal, and
(4) dodecanal.
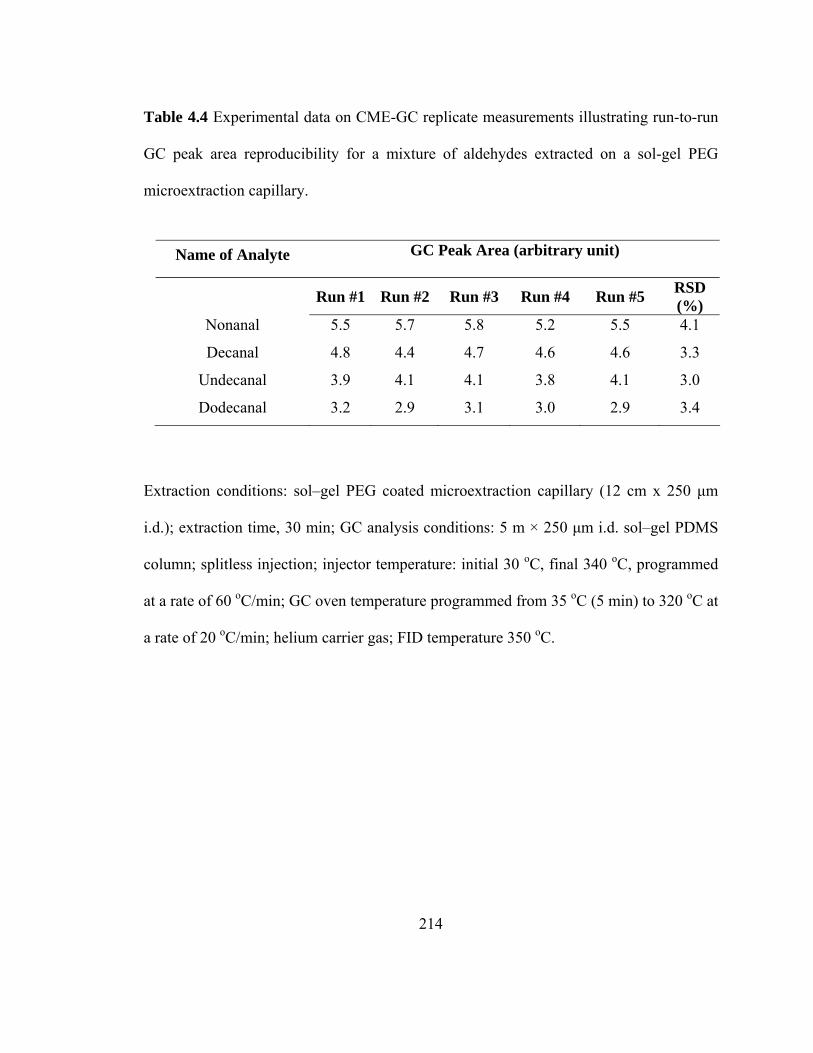
214
Table 4.4 Experimental data on CME-GC replicate measurements illustrating run-to-run
GC peak area reproducibility for a mixture of aldehydes extracted on a sol-gel PEG
microextraction capillary.
Name of Analyte GC Peak Area (arbitrary unit)
Run #1 Run #2 Run #3 Run #4 Run #5 RSD (%)
Nonanal 5.5 5.7 5.8 5.2 5.5 4.1
Decanal 4.8 4.4 4.7 4.6 4.6 3.3
Undecanal 3.9 4.1 4.1 3.8 4.1 3.0
Dodecanal 3.2 2.9 3.1 3.0 2.9 3.4
Extraction conditions: sol–gel PEG coated microextraction capillary (12 cm x 250 µm
i.d.); extraction time, 30 min; GC analysis conditions: 5 m × 250 µm i.d. sol–gel PDMS
column; splitless injection; injector temperature: initial 30 oC, final 340 oC, programmed
at a rate of 60 oC/min; GC oven temperature programmed from 35 oC (5 min) to 320 oC at
a rate of 20 oC/min; helium carrier gas; FID temperature 350 oC.
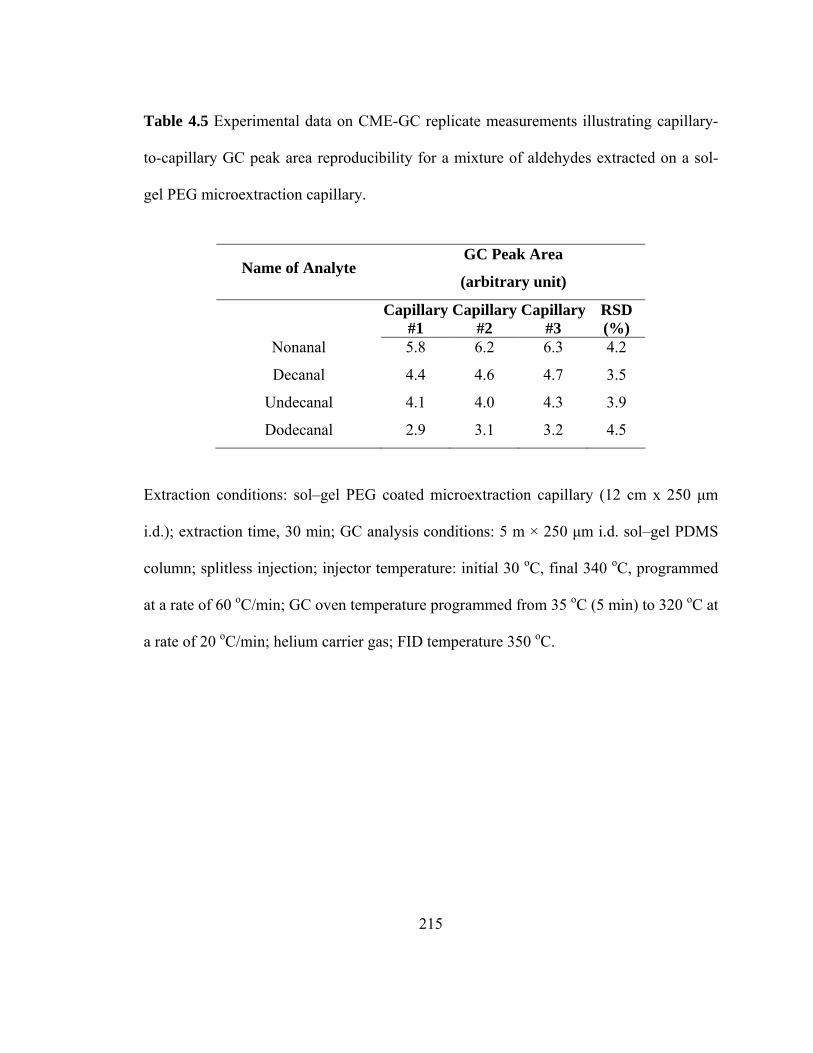
215
Table 4.5 Experimental data on CME-GC replicate measurements illustrating capillary-
to-capillary GC peak area reproducibility for a mixture of aldehydes extracted on a sol-
gel PEG microextraction capillary.
Name of Analyte GC Peak Area
(arbitrary unit)
Capillary #1
Capillary#2
Capillary #3
RSD (%)
Nonanal 5.8 6.2 6.3 4.2
Decanal 4.4 4.6 4.7 3.5
Undecanal 4.1 4.0 4.3 3.9
Dodecanal 2.9 3.1 3.2 4.5
Extraction conditions: sol–gel PEG coated microextraction capillary (12 cm x 250 µm
i.d.); extraction time, 30 min; GC analysis conditions: 5 m × 250 µm i.d. sol–gel PDMS
column; splitless injection; injector temperature: initial 30 oC, final 340 oC, programmed
at a rate of 60 oC/min; GC oven temperature programmed from 35 oC (5 min) to 320 oC at
a rate of 20 oC/min; helium carrier gas; FID temperature 350 oC.
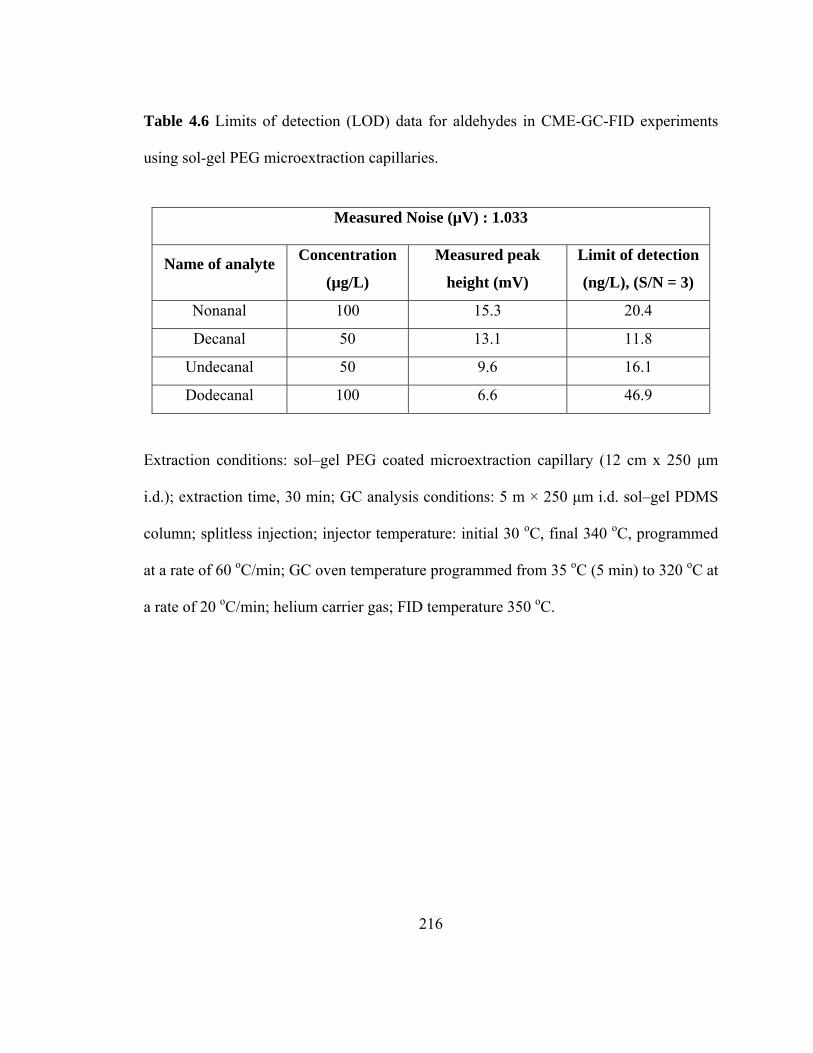
216
Table 4.6 Limits of detection (LOD) data for aldehydes in CME-GC-FID experiments
using sol-gel PEG microextraction capillaries.
Measured Noise (µV) : 1.033
Name of analyte Concentration
(µg/L)
Measured peak
height (mV)
Limit of detection
(ng/L), (S/N = 3)
Nonanal 100 15.3 20.4
Decanal 50 13.1 11.8
Undecanal 50 9.6 16.1
Dodecanal 100 6.6 46.9
Extraction conditions: sol–gel PEG coated microextraction capillary (12 cm x 250 µm
i.d.); extraction time, 30 min; GC analysis conditions: 5 m × 250 µm i.d. sol–gel PDMS
column; splitless injection; injector temperature: initial 30 oC, final 340 oC, programmed
at a rate of 60 oC/min; GC oven temperature programmed from 35 oC (5 min) to 320 oC at
a rate of 20 oC/min; helium carrier gas; FID temperature 350 oC.
217
Table 4.7 provides a list of 5 ketones that were extracted and analyzed using sol-gel PEG
coated capillaries. Figure 4.5 represents a gas chromatogram of the mixture of 5
underivatized ketones extracted from an aqueous solution. CME–GC–FID experiments
using sol–gel PEG microextraction capillaries provided excellent run-to-run (Table 4.8)
and capillary-to-capillary (Table 4.9) extraction repeatability characterized by RSD
values under 5%. We were also able to achieve detection limits (e.g., 8.1 ng/L for
valerophenone and 9.7 ng/L for hexanophenone, by CME-GC-FID) significantly lower
than those reported in the literature for the same compounds (e.g., 0.92 µg/L for
valerophenone and 0.33 µg/L for hexanophenone, by CME-GC-FID) [23].
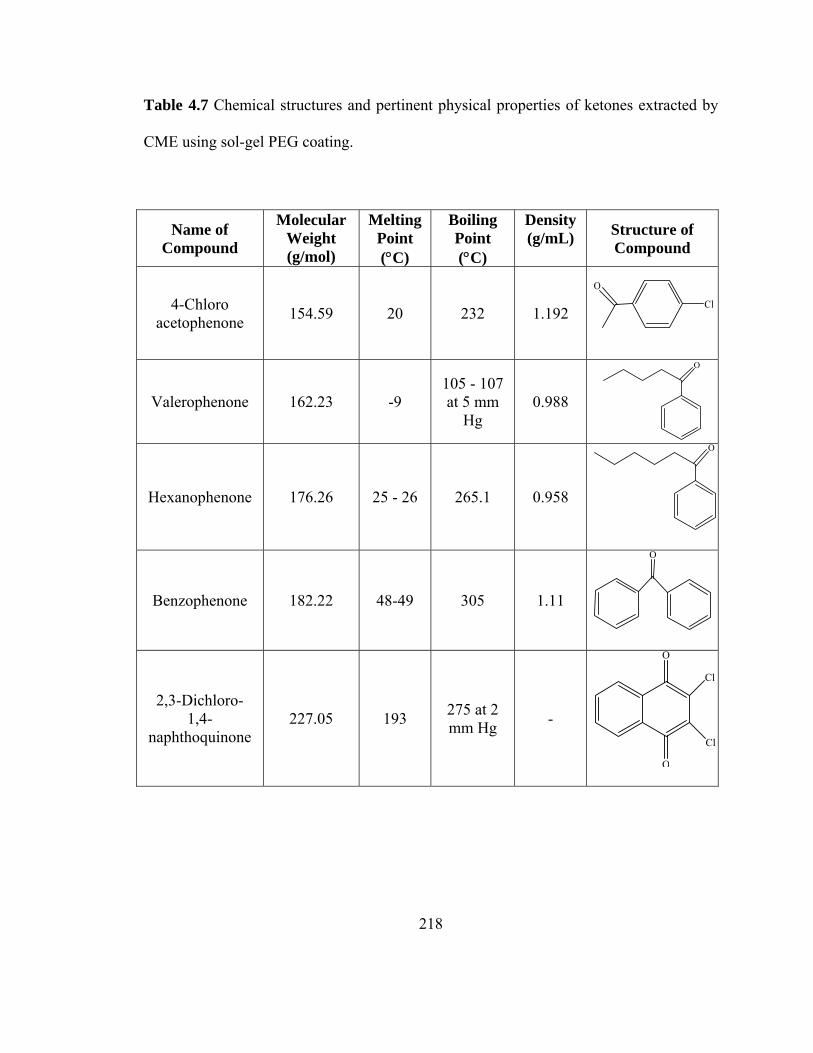
218
Table 4.7 Chemical structures and pertinent physical properties of ketones extracted by
CME using sol-gel PEG coating.
Name of Compound
Molecular Weight (g/mol)
Melting Point (°C)
Boiling Point (°C)
Density (g/mL) Structure of
Compound
4-Chloro acetophenone 154.59 20 232 1.192
O
Cl
Valerophenone 162.23 -9 105 - 107 at 5 mm
Hg 0.988
O
Hexanophenone 176.26 25 - 26 265.1 0.958
O
Benzophenone 182.22 48-49 305 1.11
O
2,3-Dichloro-1,4-
naphthoquinone 227.05 193 275 at 2
mm Hg -
O
O
Cl
Cl
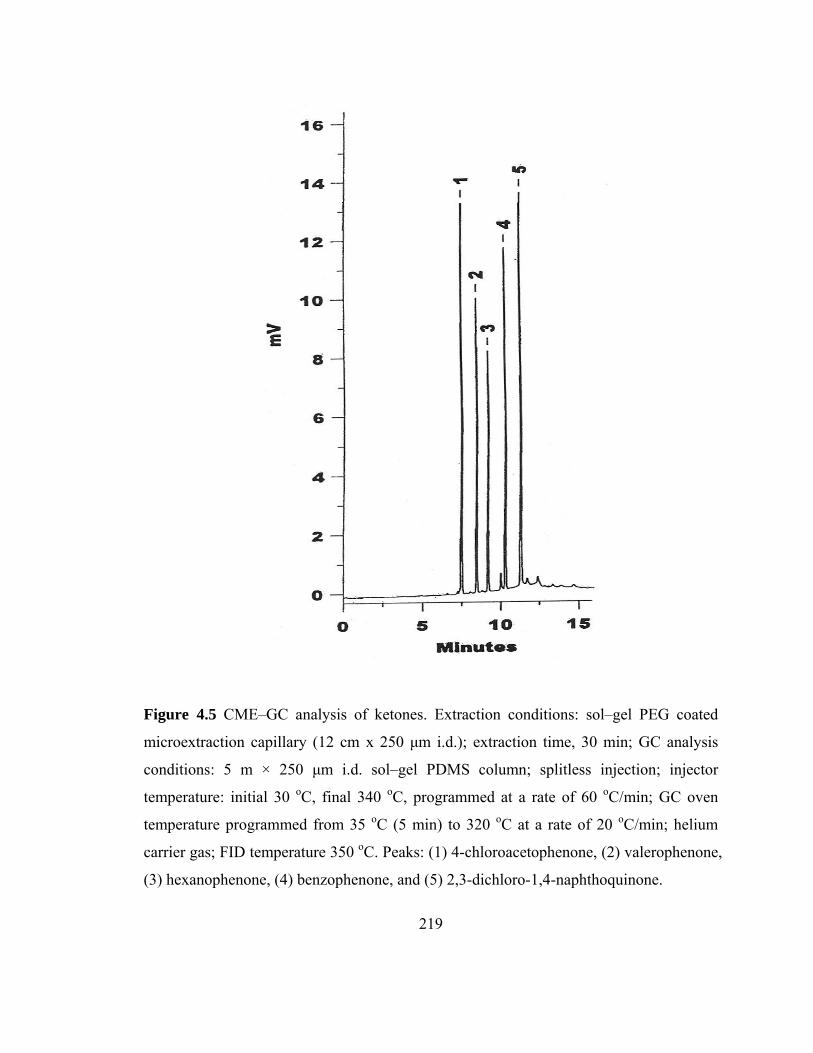
219
Figure 4.5 CME–GC analysis of ketones. Extraction conditions: sol–gel PEG coated
microextraction capillary (12 cm x 250 µm i.d.); extraction time, 30 min; GC analysis
conditions: 5 m × 250 µm i.d. sol–gel PDMS column; splitless injection; injector
temperature: initial 30 oC, final 340 oC, programmed at a rate of 60 oC/min; GC oven
temperature programmed from 35 oC (5 min) to 320 oC at a rate of 20 oC/min; helium
carrier gas; FID temperature 350 oC. Peaks: (1) 4-chloroacetophenone, (2) valerophenone,
(3) hexanophenone, (4) benzophenone, and (5) 2,3-dichloro-1,4-naphthoquinone.
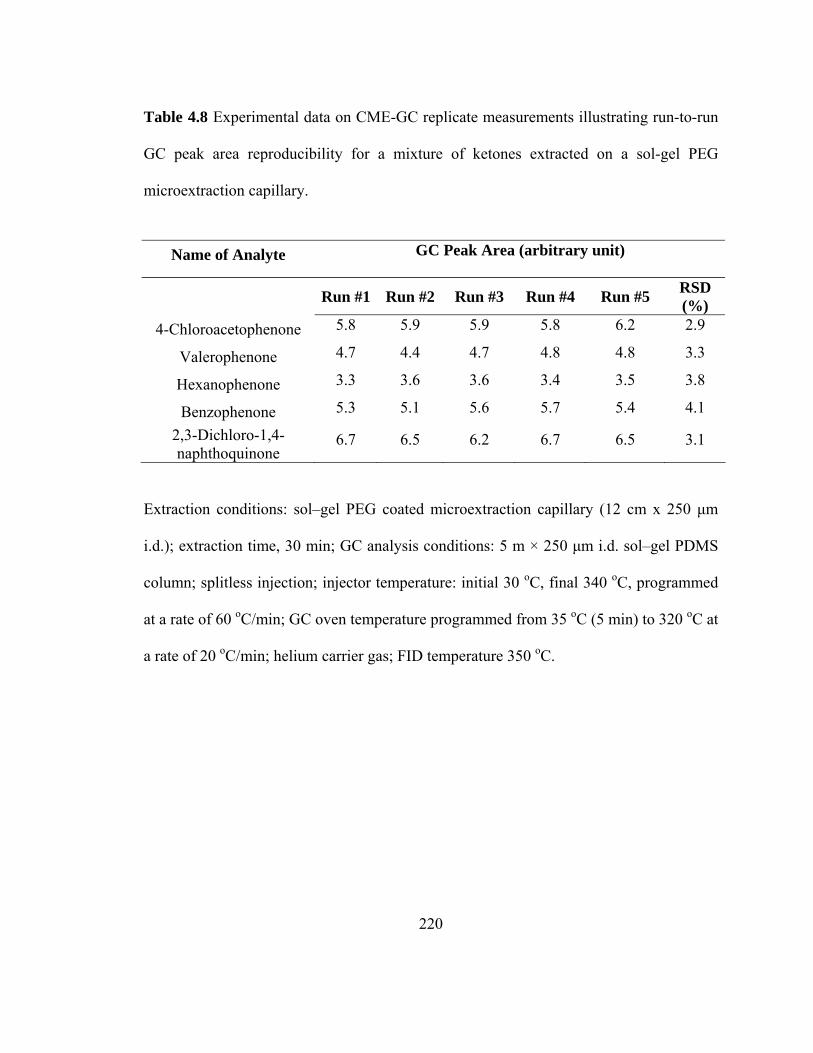
220
Table 4.8 Experimental data on CME-GC replicate measurements illustrating run-to-run
GC peak area reproducibility for a mixture of ketones extracted on a sol-gel PEG
microextraction capillary.
Name of Analyte GC Peak Area (arbitrary unit)
Run #1 Run #2 Run #3 Run #4 Run #5 RSD (%)
4-Chloroacetophenone 5.8 5.9 5.9 5.8 6.2 2.9
Valerophenone 4.7 4.4 4.7 4.8 4.8 3.3
Hexanophenone 3.3 3.6 3.6 3.4 3.5 3.8
Benzophenone 5.3 5.1 5.6 5.7 5.4 4.1
2,3-Dichloro-1,4-naphthoquinone
6.7 6.5 6.2 6.7 6.5 3.1
Extraction conditions: sol–gel PEG coated microextraction capillary (12 cm x 250 µm
i.d.); extraction time, 30 min; GC analysis conditions: 5 m × 250 µm i.d. sol–gel PDMS
column; splitless injection; injector temperature: initial 30 oC, final 340 oC, programmed
at a rate of 60 oC/min; GC oven temperature programmed from 35 oC (5 min) to 320 oC at
a rate of 20 oC/min; helium carrier gas; FID temperature 350 oC.
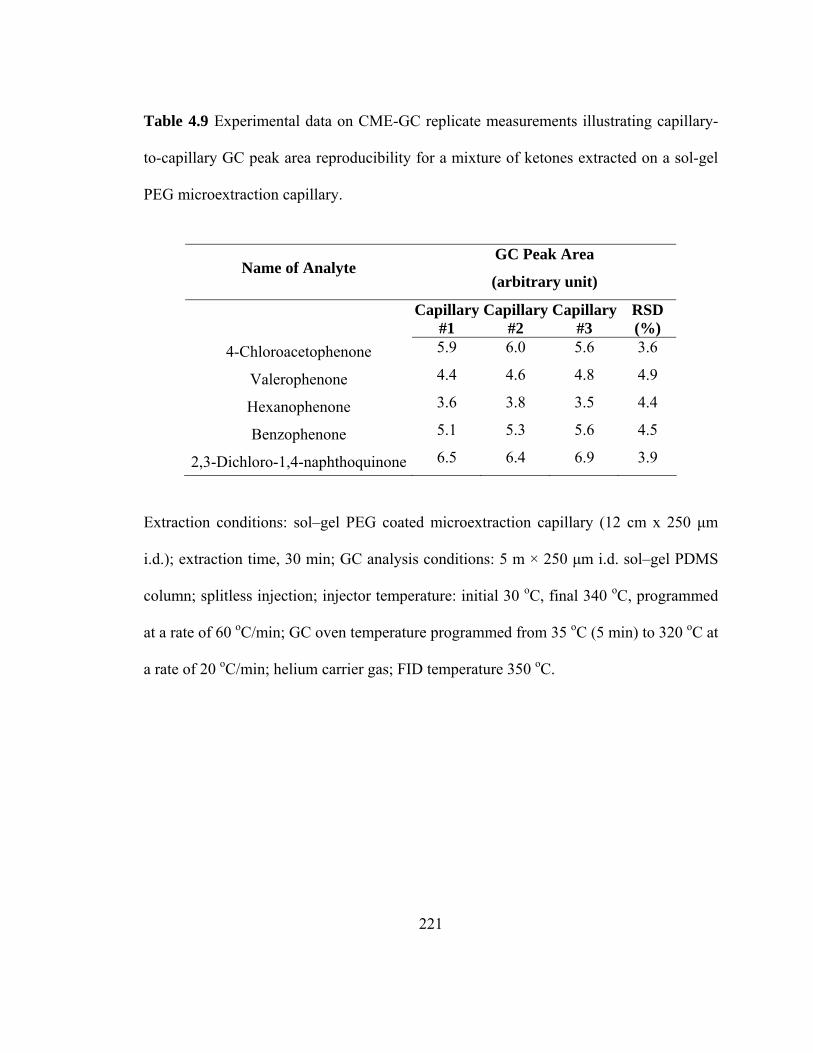
221
Table 4.9 Experimental data on CME-GC replicate measurements illustrating capillary-
to-capillary GC peak area reproducibility for a mixture of ketones extracted on a sol-gel
PEG microextraction capillary.
Name of Analyte GC Peak Area
(arbitrary unit)
Capillary #1
Capillary#2
Capillary #3
RSD (%)
4-Chloroacetophenone 5.9 6.0 5.6 3.6
Valerophenone 4.4 4.6 4.8 4.9
Hexanophenone 3.6 3.8 3.5 4.4
Benzophenone 5.1 5.3 5.6 4.5
2,3-Dichloro-1,4-naphthoquinone 6.5 6.4 6.9 3.9
Extraction conditions: sol–gel PEG coated microextraction capillary (12 cm x 250 µm
i.d.); extraction time, 30 min; GC analysis conditions: 5 m × 250 µm i.d. sol–gel PDMS
column; splitless injection; injector temperature: initial 30 oC, final 340 oC, programmed
at a rate of 60 oC/min; GC oven temperature programmed from 35 oC (5 min) to 320 oC at
a rate of 20 oC/min; helium carrier gas; FID temperature 350 oC.
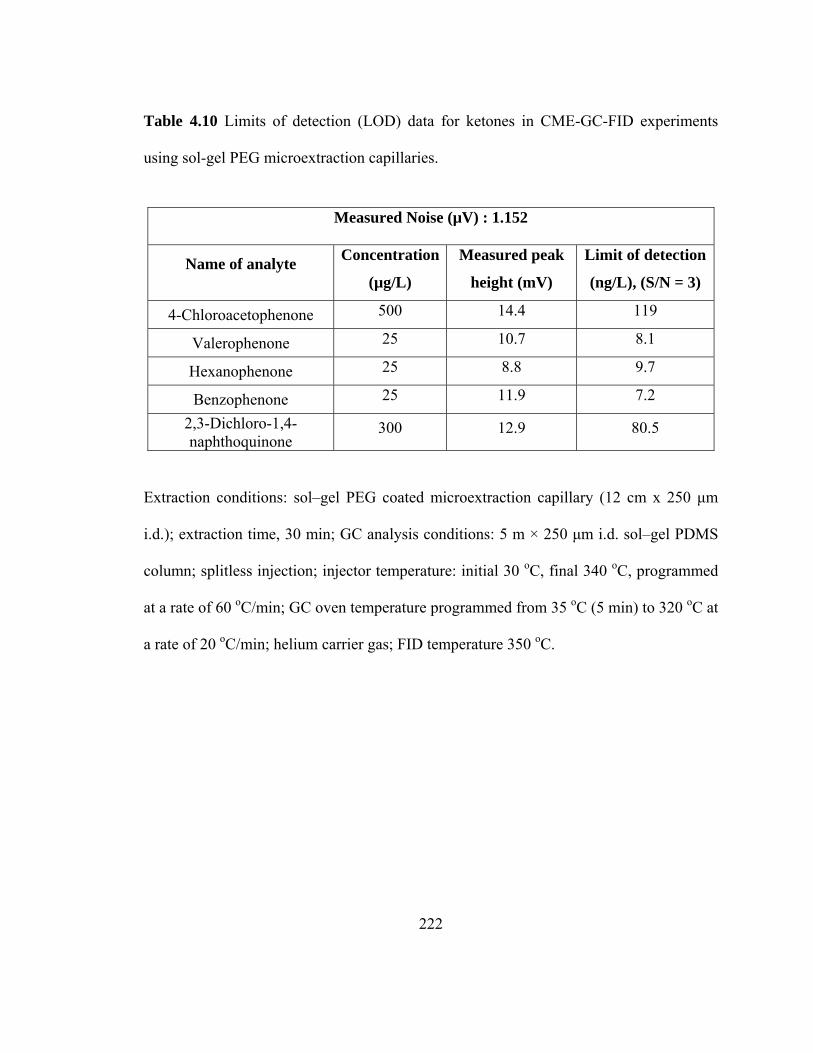
222
Table 4.10 Limits of detection (LOD) data for ketones in CME-GC-FID experiments
using sol-gel PEG microextraction capillaries.
Measured Noise (µV) : 1.152
Name of analyte Concentration
(µg/L)
Measured peak
height (mV)
Limit of detection
(ng/L), (S/N = 3)
4-Chloroacetophenone 500 14.4 119
Valerophenone 25 10.7 8.1
Hexanophenone 25 8.8 9.7
Benzophenone 25 11.9 7.2
2,3-Dichloro-1,4-naphthoquinone
300 12.9 80.5
Extraction conditions: sol–gel PEG coated microextraction capillary (12 cm x 250 µm
i.d.); extraction time, 30 min; GC analysis conditions: 5 m × 250 µm i.d. sol–gel PDMS
column; splitless injection; injector temperature: initial 30 oC, final 340 oC, programmed
at a rate of 60 oC/min; GC oven temperature programmed from 35 oC (5 min) to 320 oC at
a rate of 20 oC/min; helium carrier gas; FID temperature 350 oC.
223
4.3.5.2 CME-GC-FID of Aromatic amines using sol-gel PEG coated microextraction
capillaries
Many aromatic amines are of industrial importance because of their use as
intermediates in the synthesis of azo dyes, antioxidants in rubber products, and other
commercial materials [33,34]. During production, use, and disposal of these goods,
emissions of aromatic amines may occur. Epidemiological observations of the toxicity of
aromatic amines were first reported in aniline dye factories by Rehn [35] in 1895, with
the report that German and Swiss workers suffered urinary bladder tumors [34]. A major
toxicological issue is reaction with DNA and induction of carcinomas, primarily in the
urinary bladder, liver, or other tissues in humans and experimental animals [36]. Many of
these aromatic amines, have been classified as mutagenic and carcinogenic [37,38].
Therefore, accurate analysis of trace-level contents of aromatic amines in the
environment and in drinking water is necessary.
In our study, various aromatic amines were extracted from aqueous samples
(Table 4.11). Figure 4.6 (a) and (b) represent gas chromatograms of a mixture of
underivatized aromatic amines extracted from aqueous samples. As can be seen from
Table 4.12 and Table 4.13 the run-to-run and capillary-to-capillary relative standard
deviation (RSD) values for GC peaks resulting from analytes extracted on sol-gel PEG
coated capillaries were under 5%. We were able to obtain detection limits of 0.10 µg/L
and 0.39 µg/L for N,N-dimethylaniline and 2,4-dimethylaniline, respectively (Table 4.14).
These LODs were significantly lower compared to the reported literature values for the
224
same compounds (1.06 µg/L for N,N-dimethylaniline and 1.02 µg/L for 2,4-
dimethylaniline) obtained in SPME-GC-FID experiments using 50 µm thick polyaniline
coatings with temperature and pH adjustment of aqueous samples [39]. No such
adjustments were needed in our CME-GC-FID experiments. Also, detection limit
obtained for diphenyl amine (0.005 µg/L) in our CME-GC-FID experiments was much
lower than the reported literature values for the same compound (i.e. 5 µg/L using PA
coating and 0.5 µg/L using commercial CW-DVB coating) in SPME-GC-FID
experiments [40].
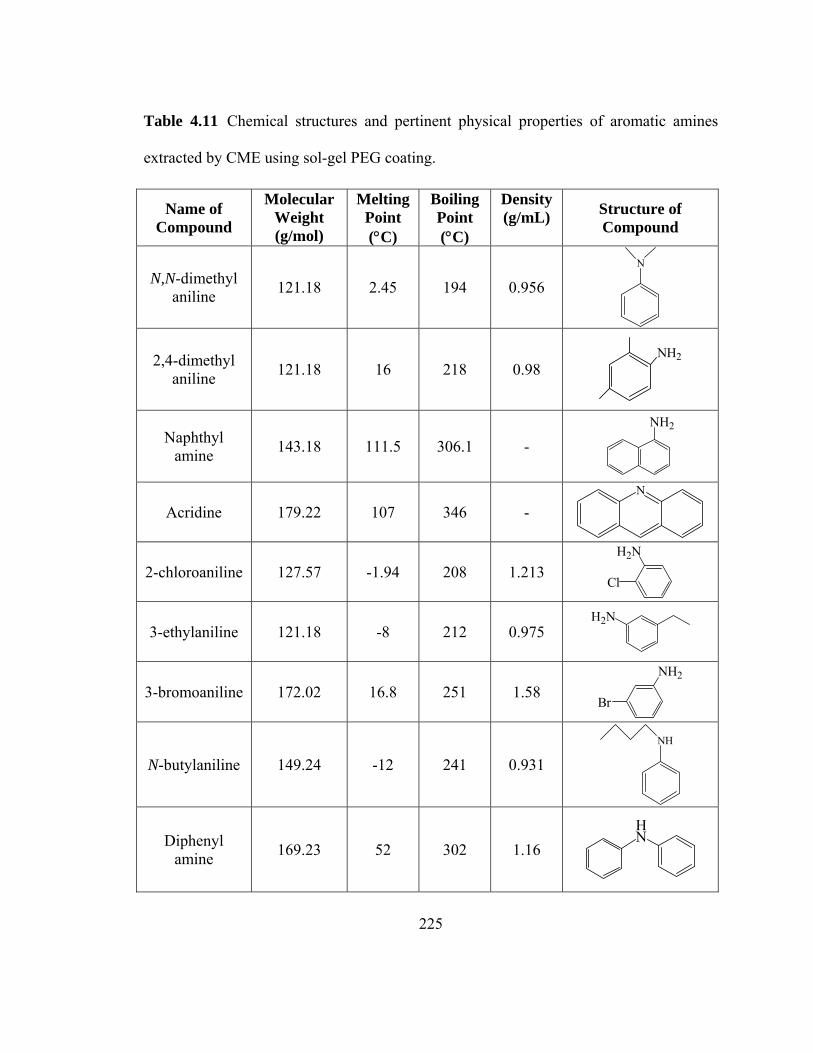
225
Table 4.11 Chemical structures and pertinent physical properties of aromatic amines
extracted by CME using sol-gel PEG coating.
Name of Compound
Molecular Weight (g/mol)
Melting Point (°C)
Boiling Point (°C)
Density (g/mL) Structure of
Compound
N,N-dimethyl aniline 121.18 2.45 194 0.956
N
2,4-dimethyl aniline 121.18 16 218 0.98
NH2
Naphthyl amine 143.18 111.5 306.1 -
NH2
Acridine 179.22 107 346 - N
2-chloroaniline 127.57 -1.94 208 1.213 Cl
H2N
3-ethylaniline 121.18 -8 212 0.975 H2N
3-bromoaniline 172.02 16.8 251 1.58 Br
NH2
N-butylaniline 149.24 -12 241 0.931 NH
Diphenyl amine 169.23 52 302 1.16
HN
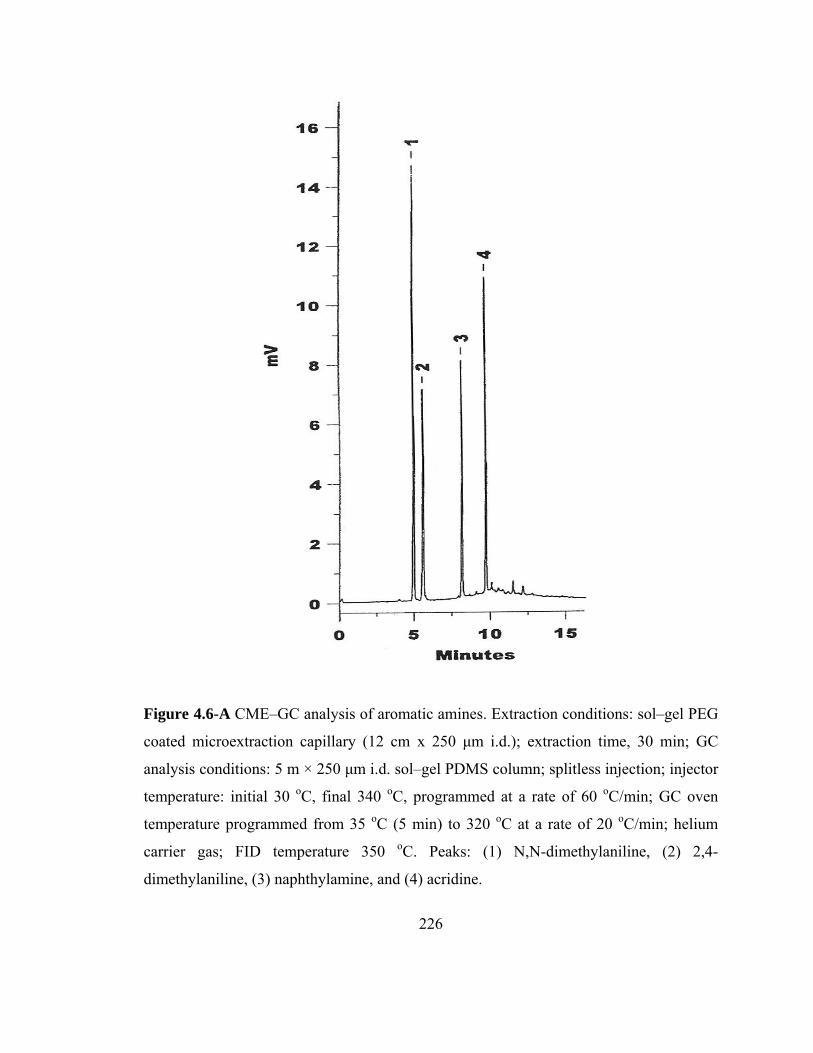
226
Figure 4.6-A CME–GC analysis of aromatic amines. Extraction conditions: sol–gel PEG
coated microextraction capillary (12 cm x 250 µm i.d.); extraction time, 30 min; GC
analysis conditions: 5 m × 250 µm i.d. sol–gel PDMS column; splitless injection; injector
temperature: initial 30 oC, final 340 oC, programmed at a rate of 60 oC/min; GC oven
temperature programmed from 35 oC (5 min) to 320 oC at a rate of 20 oC/min; helium
carrier gas; FID temperature 350 oC. Peaks: (1) N,N-dimethylaniline, (2) 2,4-
dimethylaniline, (3) naphthylamine, and (4) acridine.
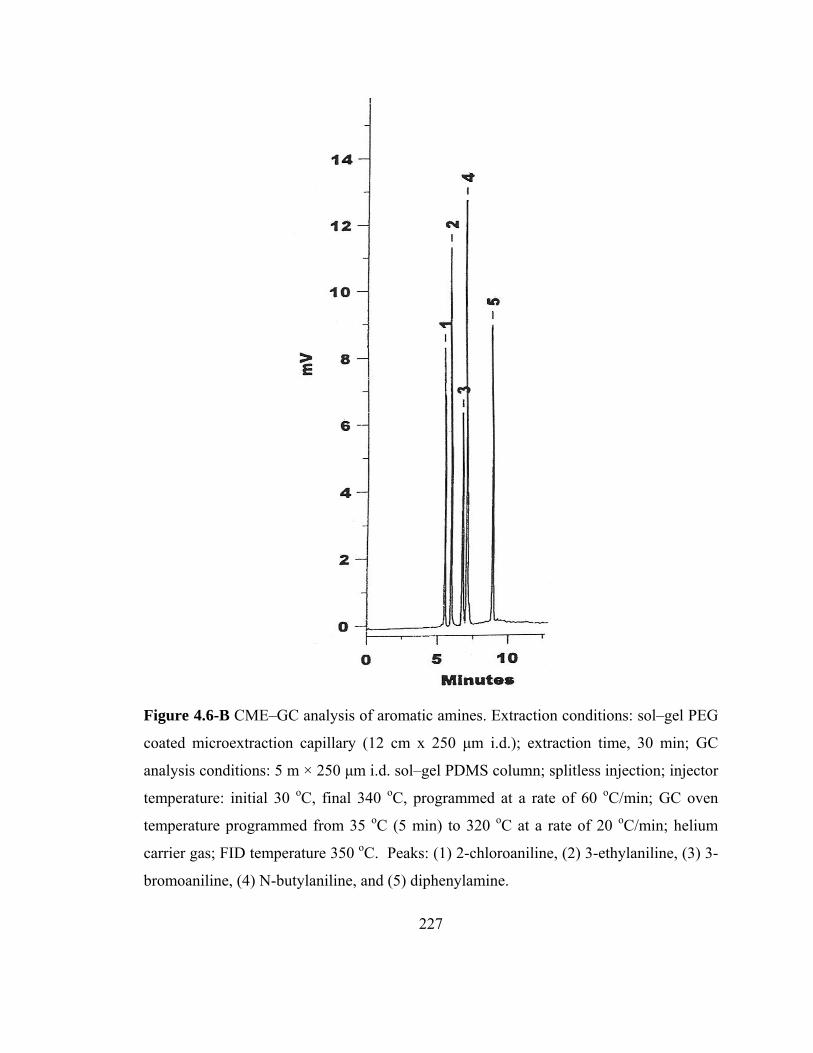
227
Figure 4.6-B CME–GC analysis of aromatic amines. Extraction conditions: sol–gel PEG
coated microextraction capillary (12 cm x 250 µm i.d.); extraction time, 30 min; GC
analysis conditions: 5 m × 250 µm i.d. sol–gel PDMS column; splitless injection; injector
temperature: initial 30 oC, final 340 oC, programmed at a rate of 60 oC/min; GC oven
temperature programmed from 35 oC (5 min) to 320 oC at a rate of 20 oC/min; helium
carrier gas; FID temperature 350 oC. Peaks: (1) 2-chloroaniline, (2) 3-ethylaniline, (3) 3-
bromoaniline, (4) N-butylaniline, and (5) diphenylamine.
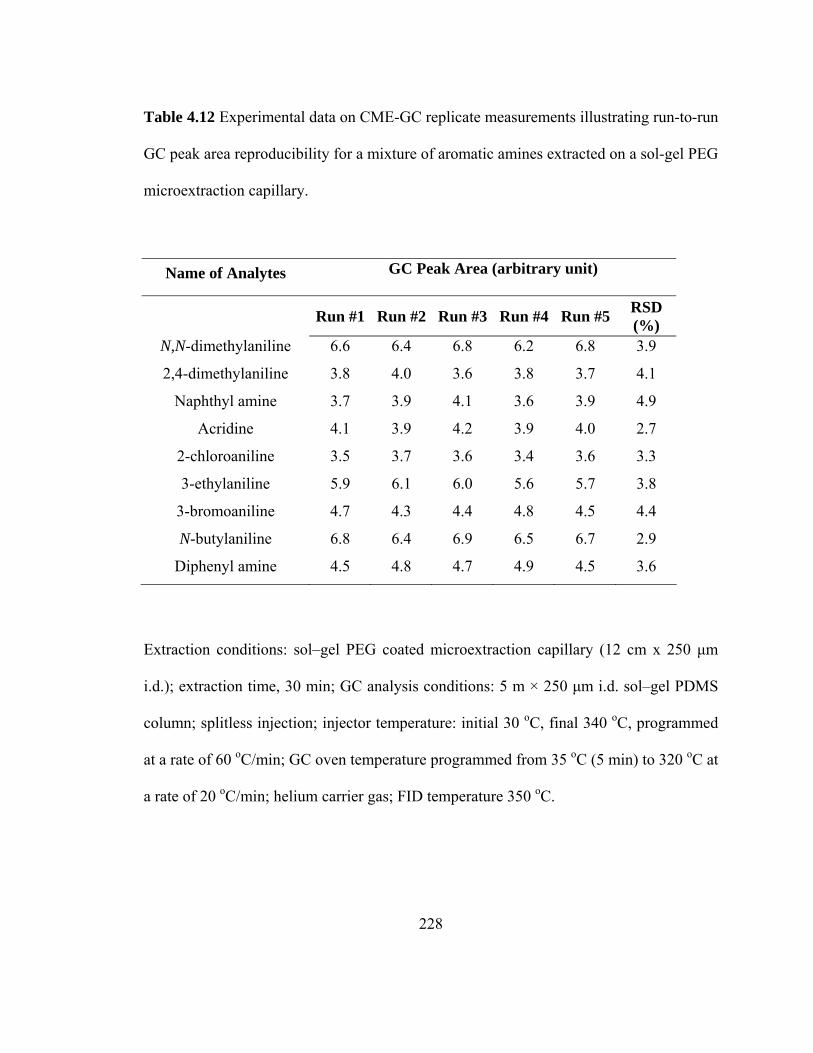
228
Table 4.12 Experimental data on CME-GC replicate measurements illustrating run-to-run
GC peak area reproducibility for a mixture of aromatic amines extracted on a sol-gel PEG
microextraction capillary.
Name of Analytes GC Peak Area (arbitrary unit)
Run #1 Run #2 Run #3 Run #4 Run #5 RSD
(%) N,N-dimethylaniline 6.6 6.4 6.8 6.2 6.8 3.9
2,4-dimethylaniline 3.8 4.0 3.6 3.8 3.7 4.1
Naphthyl amine 3.7 3.9 4.1 3.6 3.9 4.9
Acridine 4.1 3.9 4.2 3.9 4.0 2.7
2-chloroaniline 3.5 3.7 3.6 3.4 3.6 3.3
3-ethylaniline 5.9 6.1 6.0 5.6 5.7 3.8
3-bromoaniline 4.7 4.3 4.4 4.8 4.5 4.4
N-butylaniline 6.8 6.4 6.9 6.5 6.7 2.9
Diphenyl amine 4.5 4.8 4.7 4.9 4.5 3.6
Extraction conditions: sol–gel PEG coated microextraction capillary (12 cm x 250 µm
i.d.); extraction time, 30 min; GC analysis conditions: 5 m × 250 µm i.d. sol–gel PDMS
column; splitless injection; injector temperature: initial 30 oC, final 340 oC, programmed
at a rate of 60 oC/min; GC oven temperature programmed from 35 oC (5 min) to 320 oC at
a rate of 20 oC/min; helium carrier gas; FID temperature 350 oC.
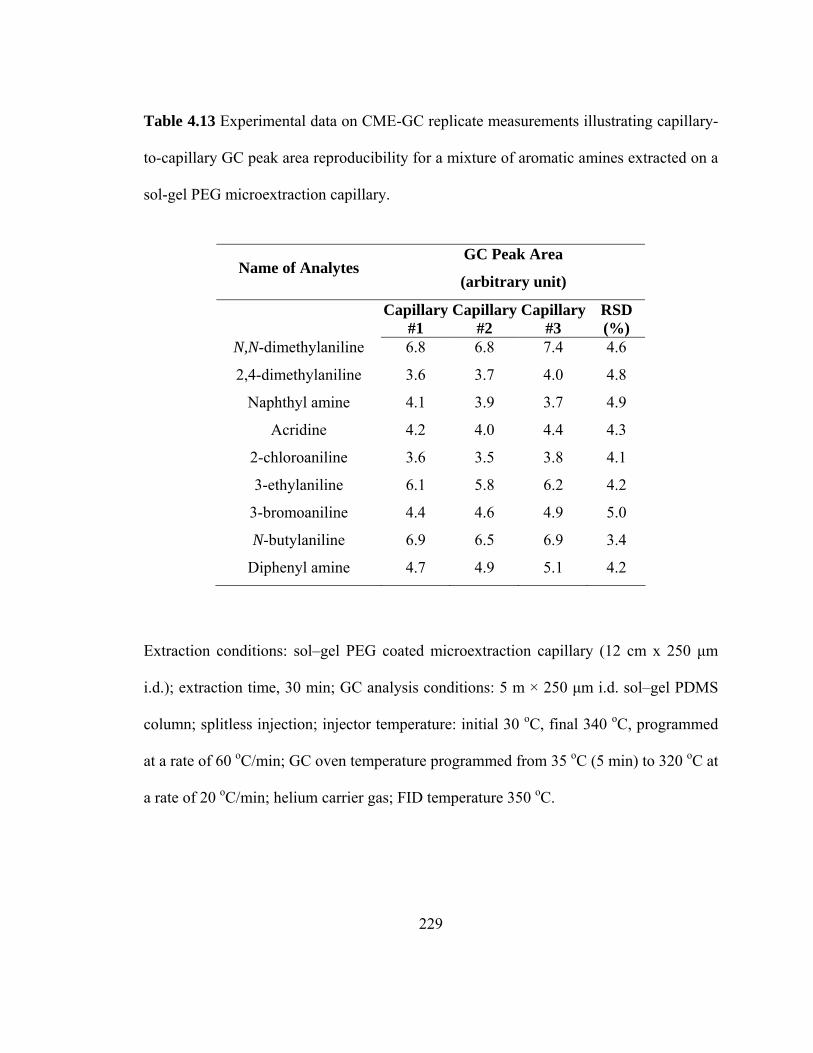
229
Table 4.13 Experimental data on CME-GC replicate measurements illustrating capillary-
to-capillary GC peak area reproducibility for a mixture of aromatic amines extracted on a
sol-gel PEG microextraction capillary.
Name of Analytes GC Peak Area
(arbitrary unit)
Capillary #1
Capillary#2
Capillary #3
RSD (%)
N,N-dimethylaniline 6.8 6.8 7.4 4.6
2,4-dimethylaniline 3.6 3.7 4.0 4.8
Naphthyl amine 4.1 3.9 3.7 4.9
Acridine 4.2 4.0 4.4 4.3
2-chloroaniline 3.6 3.5 3.8 4.1
3-ethylaniline 6.1 5.8 6.2 4.2
3-bromoaniline 4.4 4.6 4.9 5.0
N-butylaniline 6.9 6.5 6.9 3.4
Diphenyl amine 4.7 4.9 5.1 4.2
Extraction conditions: sol–gel PEG coated microextraction capillary (12 cm x 250 µm
i.d.); extraction time, 30 min; GC analysis conditions: 5 m × 250 µm i.d. sol–gel PDMS
column; splitless injection; injector temperature: initial 30 oC, final 340 oC, programmed
at a rate of 60 oC/min; GC oven temperature programmed from 35 oC (5 min) to 320 oC at
a rate of 20 oC/min; helium carrier gas; FID temperature 350 oC.
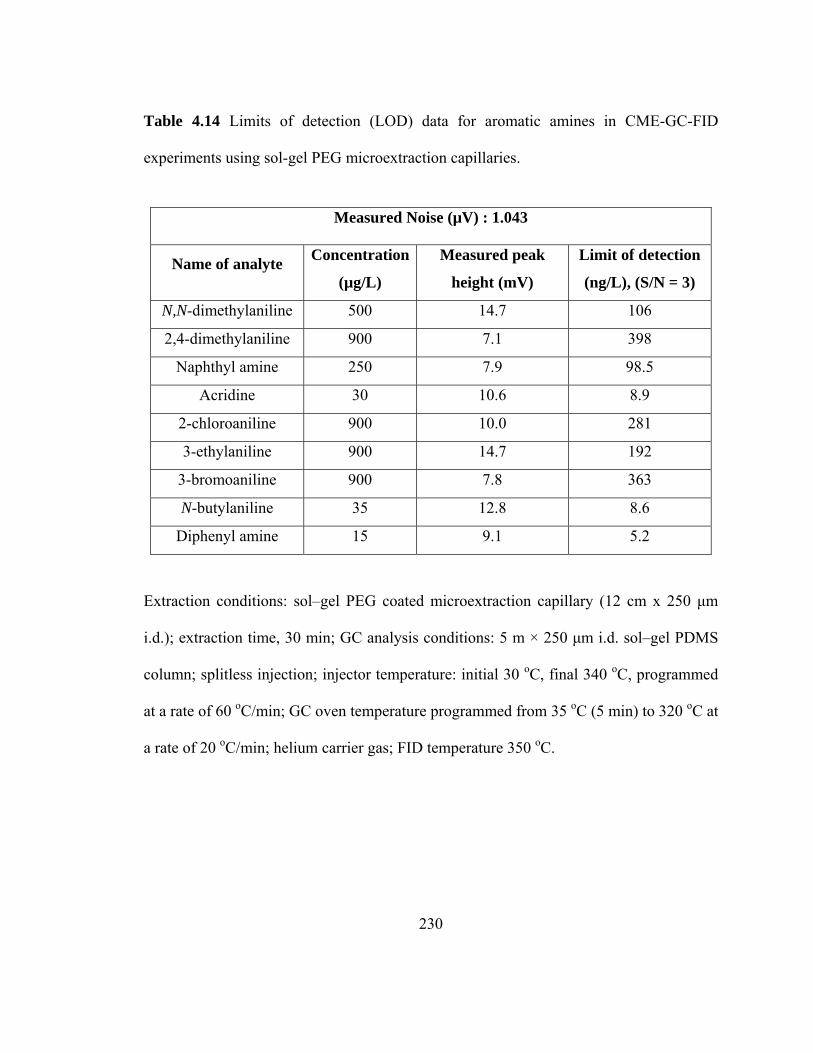
230
Table 4.14 Limits of detection (LOD) data for aromatic amines in CME-GC-FID
experiments using sol-gel PEG microextraction capillaries.
Measured Noise (µV) : 1.043
Name of analyte Concentration
(µg/L)
Measured peak
height (mV)
Limit of detection
(ng/L), (S/N = 3)
N,N-dimethylaniline 500 14.7 106
2,4-dimethylaniline 900 7.1 398
Naphthyl amine 250 7.9 98.5
Acridine 30 10.6 8.9
2-chloroaniline 900 10.0 281
3-ethylaniline 900 14.7 192
3-bromoaniline 900 7.8 363
N-butylaniline 35 12.8 8.6
Diphenyl amine 15 9.1 5.2
Extraction conditions: sol–gel PEG coated microextraction capillary (12 cm x 250 µm
i.d.); extraction time, 30 min; GC analysis conditions: 5 m × 250 µm i.d. sol–gel PDMS
column; splitless injection; injector temperature: initial 30 oC, final 340 oC, programmed
at a rate of 60 oC/min; GC oven temperature programmed from 35 oC (5 min) to 320 oC at
a rate of 20 oC/min; helium carrier gas; FID temperature 350 oC.
231
4.3.5.3 CME-GC-FID of phenol derivatives using sol-gel PEG coated
microextraction capillaries
Phenols derivatives are produced as a result of various processes in pesticides-,
dyes-, plastics-, paper-, and petrochemical industries [41-44]. Many of these phenol
derivatives are often found in waters [45,46], soils [47], and sediments [47]. Because of
their toxicity, US Environmental Protection Agency has classified 11 phenolic
compounds as major pollutants [48].
Among the phenol derivatives extracted, 2-tert-butyl-4-methoxyphenol (BHA)
has been considered a possible carcinogen [49,50]. BHA is a chemical antioxidant used
since 1947 as a preservative in some edible fats and oils, fat-containing or oil-containing
foods such as baked goods and pork sausage, chewing gum, cosmetics, pharaceuticals,
animal feed, food packaging, and in rubber and petroleum products. It prevents spoilage
by reacting with oxygen, thus keeping the oxygen from reacting with fats and oils. It
slows the development of off-flavors, odors and color changes caused by oxidation.
In the present work, four phenol derivatives were extracted using sol-gel PEG
coated capillaries (Table 4.15). As can be seen from Figure 4.7, the sol-gel PEG coated
capillaries were found to be effective in extracting four underivatized phenols from an
aqueous sample. Capillary microextraction results are presented in Table 4.16 and Table
4.17. The detection limits on the order of ng/L were obtained for aromatic amines in the
CME–GC–FID experiments using sol–gel PEG coated microextraction capillaries (Table
4.18). These values are better than the detection limits reported in the literature. For
232
instance, detection limits obtained for 2,4-dimethylphenol (0.07 µg/L) and 2,4,6-
trichlorophenol (0.02 µg/L) in our CME-GC-FID experiments were lower than those
reported in HS-SPME-GC-FID experiments for the same compounds using sol-gel DOH-
B15C5/OH-TSO coating (i.e. 2,4-dimethylphenol (0.25 µg/L) and 2,4,6-trichlorophenol
(0.05 µg/L)) [51] and using sol-gel PEG coating (i.e. 2,4-dimethylphenol (1.0 µg/L) and
2,4,6-trichlorophenol (0.1 µg/L)) [52].
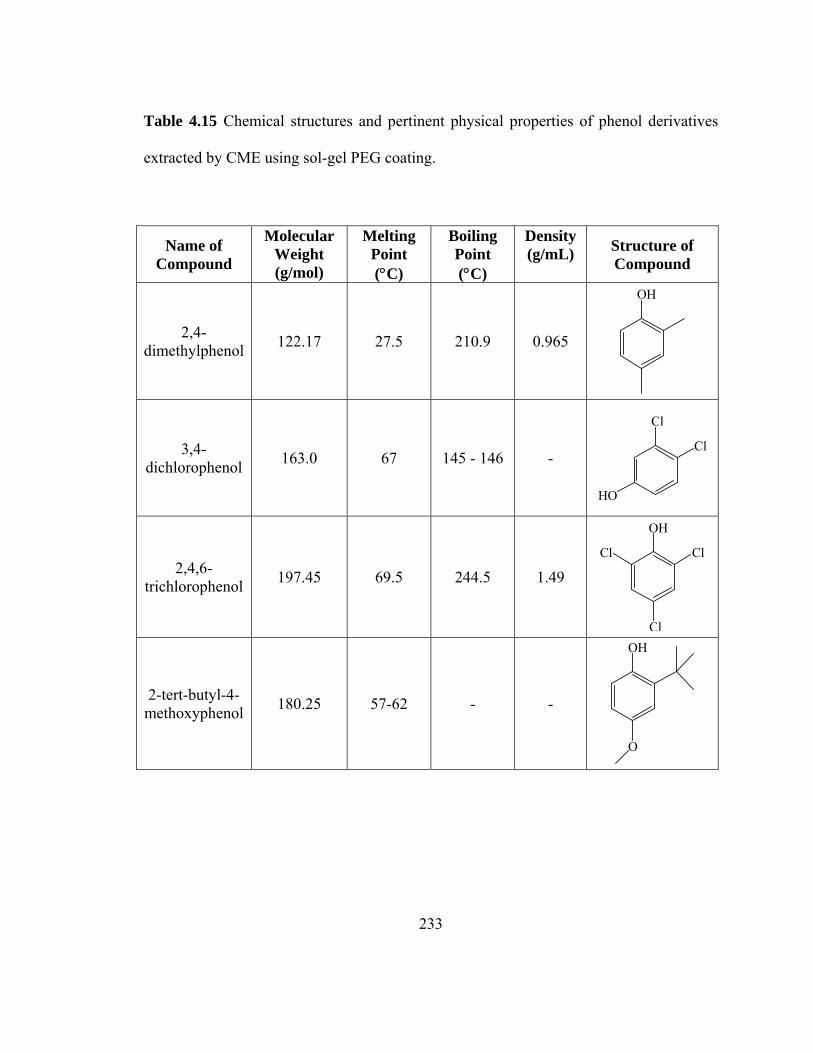
233
Table 4.15 Chemical structures and pertinent physical properties of phenol derivatives
extracted by CME using sol-gel PEG coating.
Name of Compound
Molecular Weight (g/mol)
Melting Point (°C)
Boiling Point (°C)
Density (g/mL) Structure of
Compound
2,4-dimethylphenol 122.17 27.5 210.9 0.965
OH
3,4-dichlorophenol 163.0 67 145 - 146 -
Cl
Cl
HO
2,4,6-trichlorophenol 197.45 69.5 244.5 1.49
Cl
Cl
Cl
OH
2-tert-butyl-4-methoxyphenol 180.25 57-62 - -
OH
O
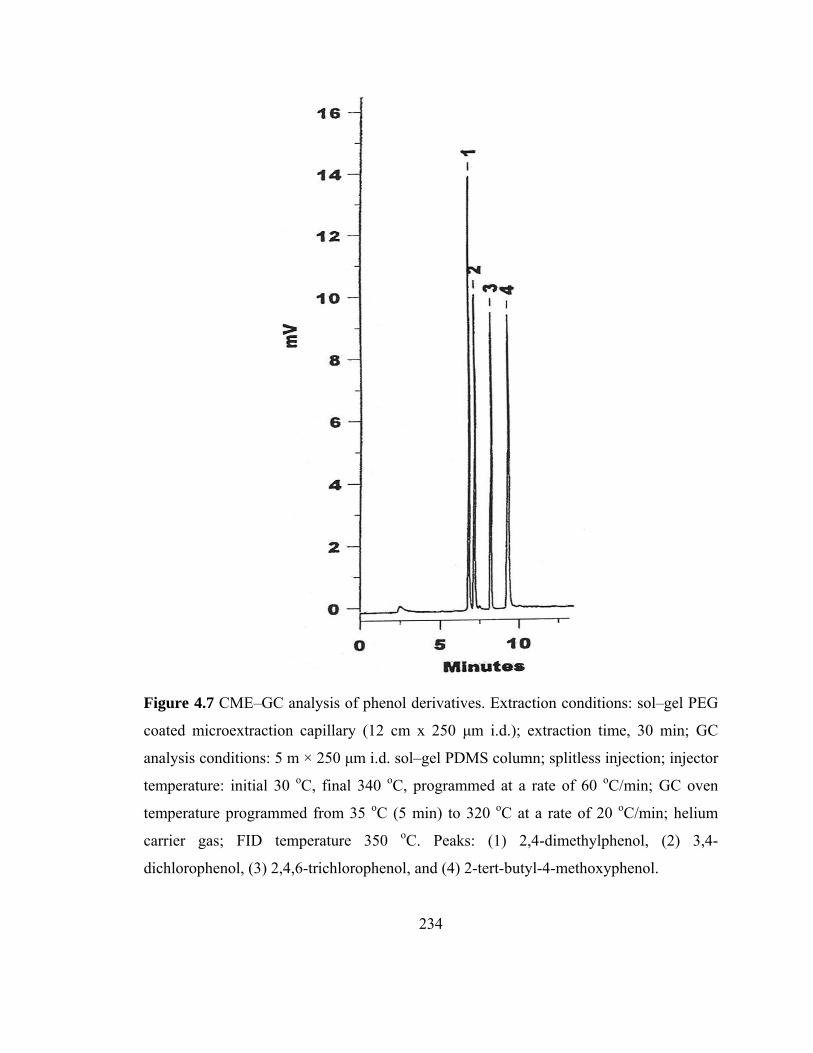
234
Figure 4.7 CME–GC analysis of phenol derivatives. Extraction conditions: sol–gel PEG
coated microextraction capillary (12 cm x 250 µm i.d.); extraction time, 30 min; GC
analysis conditions: 5 m × 250 µm i.d. sol–gel PDMS column; splitless injection; injector
temperature: initial 30 oC, final 340 oC, programmed at a rate of 60 oC/min; GC oven
temperature programmed from 35 oC (5 min) to 320 oC at a rate of 20 oC/min; helium
carrier gas; FID temperature 350 oC. Peaks: (1) 2,4-dimethylphenol, (2) 3,4-
dichlorophenol, (3) 2,4,6-trichlorophenol, and (4) 2-tert-butyl-4-methoxyphenol.
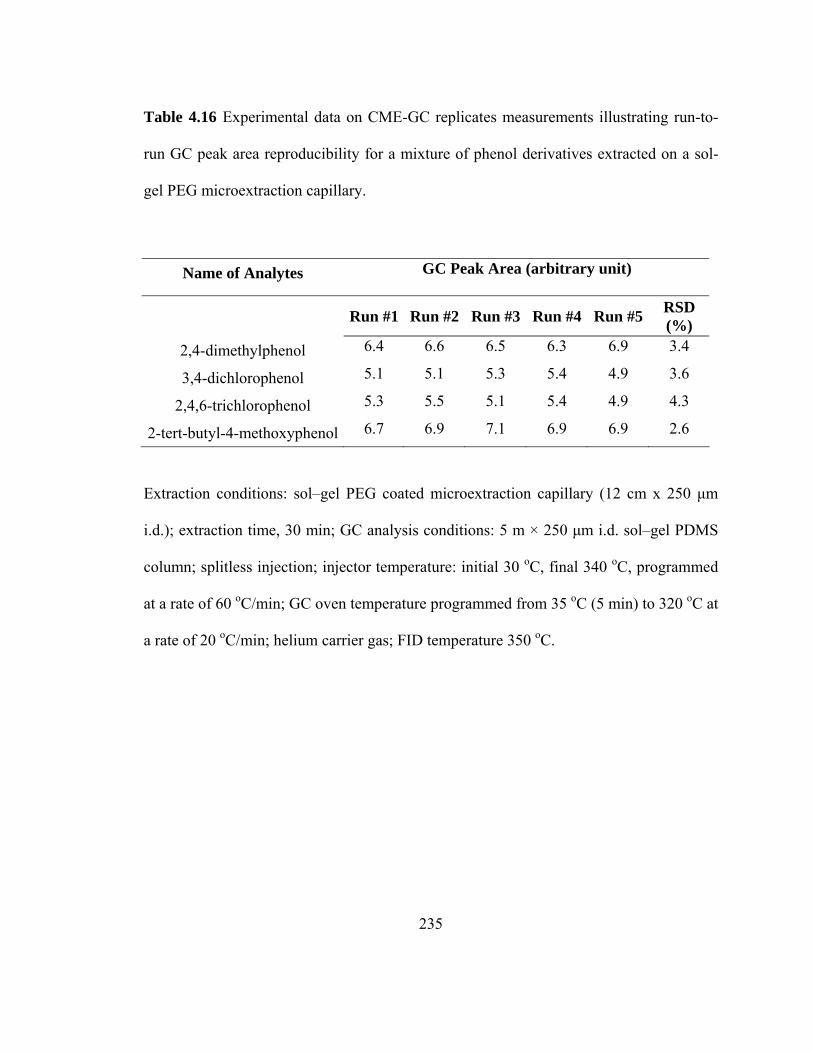
235
Table 4.16 Experimental data on CME-GC replicates measurements illustrating run-to-
run GC peak area reproducibility for a mixture of phenol derivatives extracted on a sol-
gel PEG microextraction capillary.
Name of Analytes GC Peak Area (arbitrary unit)
Run #1 Run #2 Run #3 Run #4 Run #5 RSD
(%) 2,4-dimethylphenol 6.4 6.6 6.5 6.3 6.9 3.4
3,4-dichlorophenol 5.1 5.1 5.3 5.4 4.9 3.6
2,4,6-trichlorophenol 5.3 5.5 5.1 5.4 4.9 4.3
2-tert-butyl-4-methoxyphenol 6.7 6.9 7.1 6.9 6.9 2.6
Extraction conditions: sol–gel PEG coated microextraction capillary (12 cm x 250 µm
i.d.); extraction time, 30 min; GC analysis conditions: 5 m × 250 µm i.d. sol–gel PDMS
column; splitless injection; injector temperature: initial 30 oC, final 340 oC, programmed
at a rate of 60 oC/min; GC oven temperature programmed from 35 oC (5 min) to 320 oC at
a rate of 20 oC/min; helium carrier gas; FID temperature 350 oC.
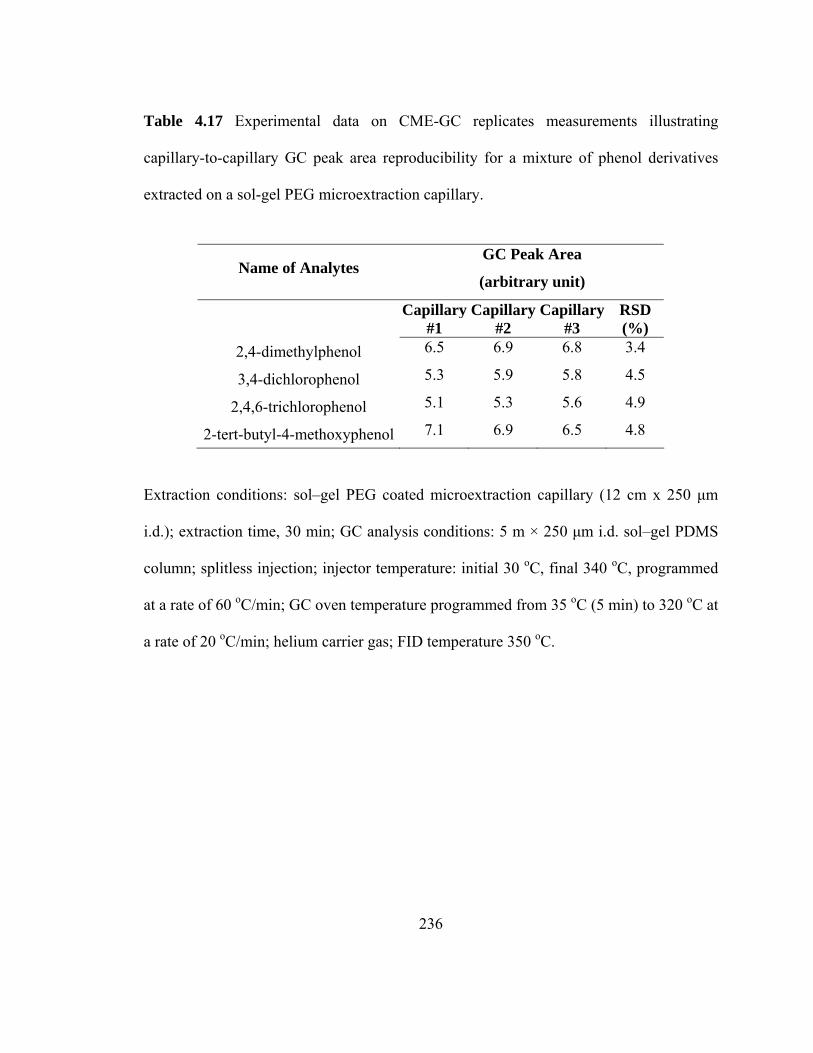
236
Table 4.17 Experimental data on CME-GC replicates measurements illustrating
capillary-to-capillary GC peak area reproducibility for a mixture of phenol derivatives
extracted on a sol-gel PEG microextraction capillary.
Name of Analytes GC Peak Area
(arbitrary unit)
Capillary #1
Capillary#2
Capillary #3
RSD (%)
2,4-dimethylphenol 6.5 6.9 6.8 3.4
3,4-dichlorophenol 5.3 5.9 5.8 4.5
2,4,6-trichlorophenol 5.1 5.3 5.6 4.9
2-tert-butyl-4-methoxyphenol 7.1 6.9 6.5 4.8
Extraction conditions: sol–gel PEG coated microextraction capillary (12 cm x 250 µm
i.d.); extraction time, 30 min; GC analysis conditions: 5 m × 250 µm i.d. sol–gel PDMS
column; splitless injection; injector temperature: initial 30 oC, final 340 oC, programmed
at a rate of 60 oC/min; GC oven temperature programmed from 35 oC (5 min) to 320 oC at
a rate of 20 oC/min; helium carrier gas; FID temperature 350 oC.
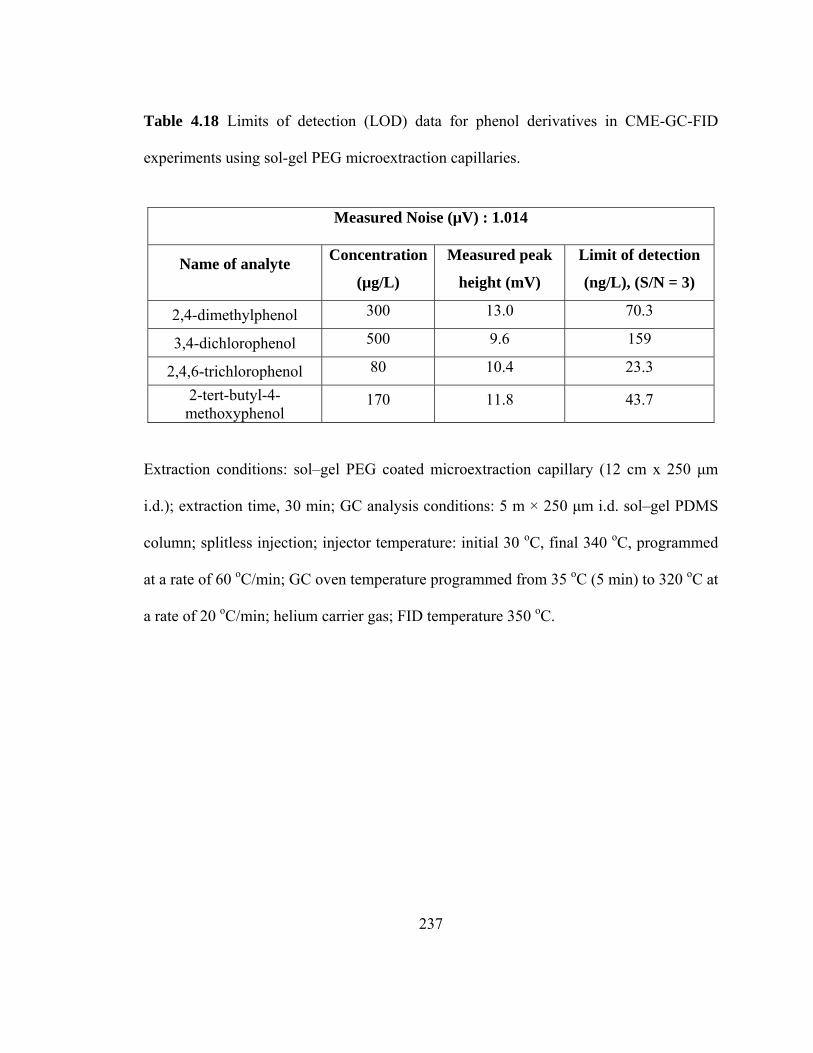
237
Table 4.18 Limits of detection (LOD) data for phenol derivatives in CME-GC-FID
experiments using sol-gel PEG microextraction capillaries.
Measured Noise (µV) : 1.014
Name of analyte Concentration
(µg/L)
Measured peak
height (mV)
Limit of detection
(ng/L), (S/N = 3)
2,4-dimethylphenol 300 13.0 70.3
3,4-dichlorophenol 500 9.6 159
2,4,6-trichlorophenol 80 10.4 23.3
2-tert-butyl-4-methoxyphenol
170 11.8 43.7
Extraction conditions: sol–gel PEG coated microextraction capillary (12 cm x 250 µm
i.d.); extraction time, 30 min; GC analysis conditions: 5 m × 250 µm i.d. sol–gel PDMS
column; splitless injection; injector temperature: initial 30 oC, final 340 oC, programmed
at a rate of 60 oC/min; GC oven temperature programmed from 35 oC (5 min) to 320 oC at
a rate of 20 oC/min; helium carrier gas; FID temperature 350 oC.
238
4.3.5.4 CME-GC-FID of alcohols using sol-gel PEG coated microextraction
capillaries
In the present work, four alcohols were extracted using sol-gel PEG coated
capillaries (Table 4.19). Extraction of alcohols from aqueous matrices often poses
difficulty due to their high polarity and pronounced affinity toward water. As can be seen
from Figure 4.8, the sol-gel PEG capillaries were found to be effective in extracting
underivatized alcohols from an aqueous sample without requiring any derivatization, pH
adjustment or salting-out procedures.
Run-to-run (Table 4.20) and capillary-to-capillary (Table 4.21) peak area relative
standard deviation (RSD) values for GC peak areas resulting from alcohols extracted on a
sol-gel PEG coated capillaries were under 5%. It demonstrates outstanding performance
of the sol–gel PEG coating. We were also able to achieve detection limits of 0.02 µg/L
and 0.008 µg/L for 1-octanol and 1-decanol, respectively (Table 4.22). These LOD
values were comparable to reported literature values of 0.01 µg/L and 0.01 µg/L for the
same compounds obtained on sol-gel open chain crown ether/OH-TSO coatings in HS-
SPME-GC-FID experiments with sample matrix temperature and pH adjustments [53].
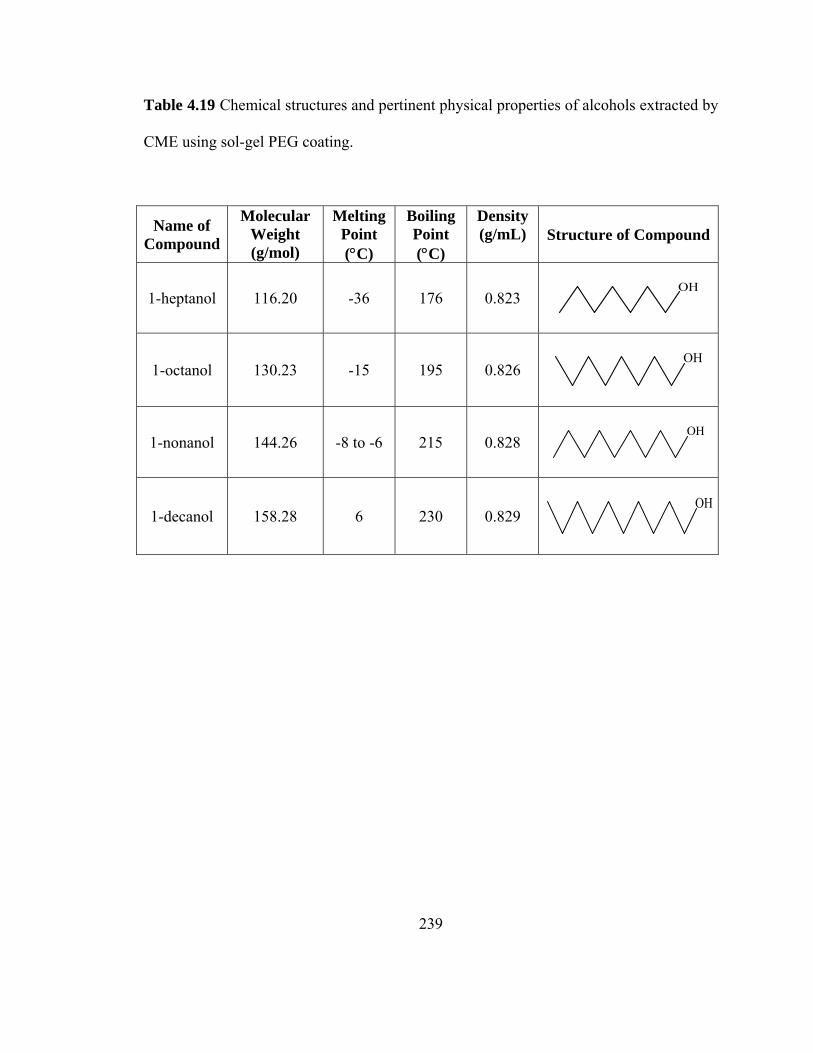
239
Table 4.19 Chemical structures and pertinent physical properties of alcohols extracted by
CME using sol-gel PEG coating.
Name of Compound
Molecular Weight (g/mol)
Melting Point (°C)
Boiling Point (°C)
Density (g/mL) Structure of Compound
1-heptanol 116.20 -36 176 0.823
OH
1-octanol 130.23 -15 195 0.826
OH
1-nonanol 144.26 -8 to -6 215 0.828
OH
1-decanol 158.28 6 230 0.829
OH
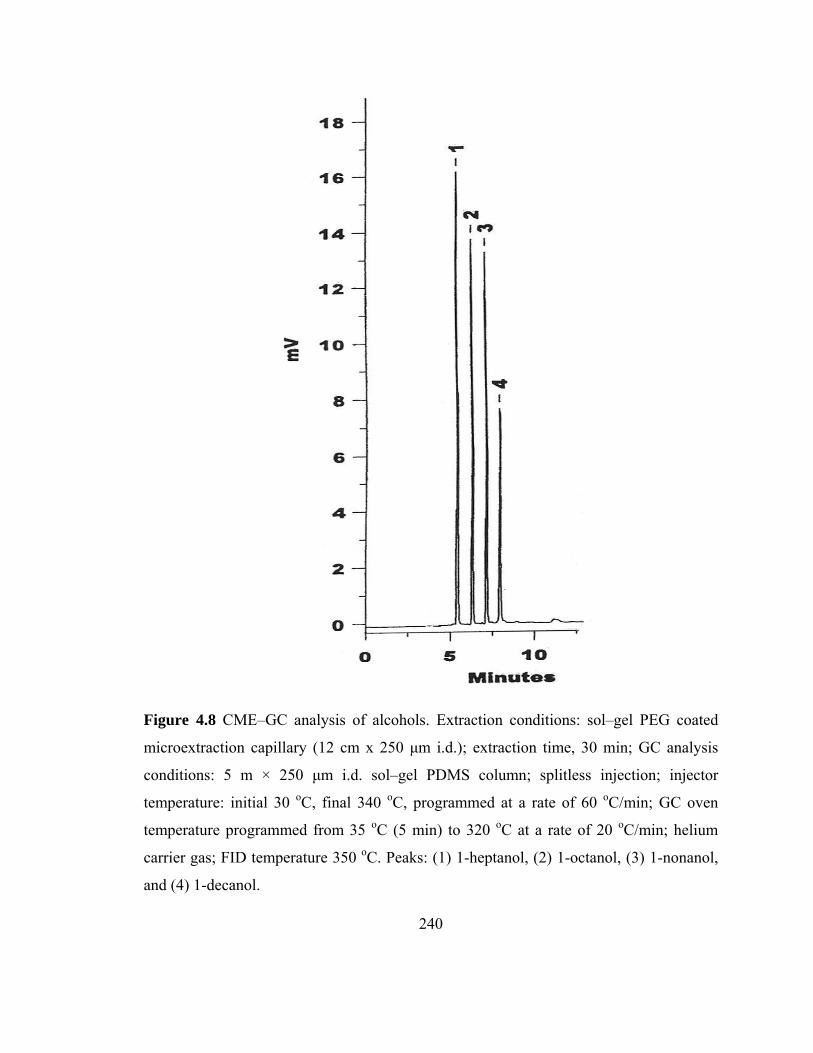
240
Figure 4.8 CME–GC analysis of alcohols. Extraction conditions: sol–gel PEG coated
microextraction capillary (12 cm x 250 µm i.d.); extraction time, 30 min; GC analysis
conditions: 5 m × 250 µm i.d. sol–gel PDMS column; splitless injection; injector
temperature: initial 30 oC, final 340 oC, programmed at a rate of 60 oC/min; GC oven
temperature programmed from 35 oC (5 min) to 320 oC at a rate of 20 oC/min; helium
carrier gas; FID temperature 350 oC. Peaks: (1) 1-heptanol, (2) 1-octanol, (3) 1-nonanol,
and (4) 1-decanol.
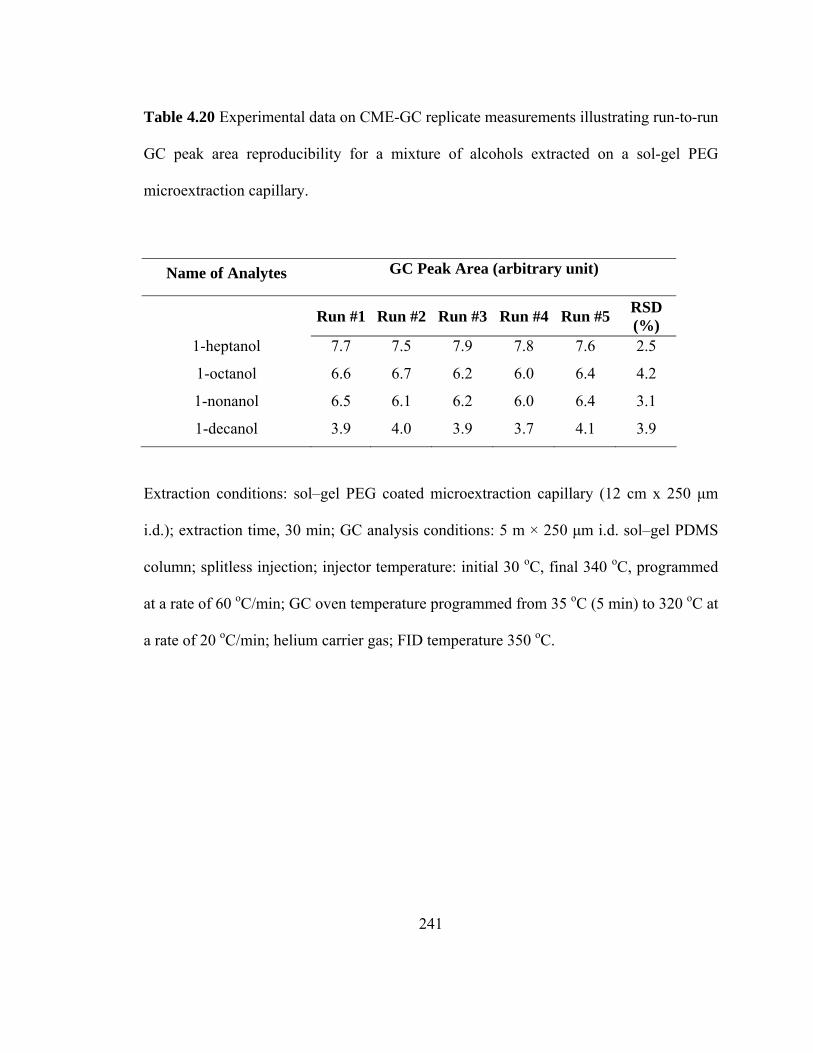
241
Table 4.20 Experimental data on CME-GC replicate measurements illustrating run-to-run
GC peak area reproducibility for a mixture of alcohols extracted on a sol-gel PEG
microextraction capillary.
Name of Analytes GC Peak Area (arbitrary unit)
Run #1 Run #2 Run #3 Run #4 Run #5 RSD
(%) 1-heptanol 7.7 7.5 7.9 7.8 7.6 2.5
1-octanol 6.6 6.7 6.2 6.0 6.4 4.2
1-nonanol 6.5 6.1 6.2 6.0 6.4 3.1
1-decanol 3.9 4.0 3.9 3.7 4.1 3.9
Extraction conditions: sol–gel PEG coated microextraction capillary (12 cm x 250 µm
i.d.); extraction time, 30 min; GC analysis conditions: 5 m × 250 µm i.d. sol–gel PDMS
column; splitless injection; injector temperature: initial 30 oC, final 340 oC, programmed
at a rate of 60 oC/min; GC oven temperature programmed from 35 oC (5 min) to 320 oC at
a rate of 20 oC/min; helium carrier gas; FID temperature 350 oC.

242
Table 4.21 Experimental data on CME-GC replicates measurements illustrating
capillary-to-capillary GC peak area reproducibility for a mixture of alcohols extracted on
a sol-gel PEG microextraction capillary.
Name of Analytes GC Peak Area
(arbitrary unit)
Capillary #1
Capillary#2
Capillary #3
RSD (%)
1-heptanol 7.9 8.2 7.7 3.2
1-octanol 6.2 6.4 6.8 4.7
1-nonanol 6.2 6.3 6.9 3.5
1-decanol 3.9 3.9 3.6 4.9
Extraction conditions: sol–gel PEG coated microextraction capillary (12 cm x 250 µm
i.d.); extraction time, 30 min; GC analysis conditions: 5 m × 250 µm i.d. sol–gel PDMS
column; splitless injection; injector temperature: initial 30 oC, final 340 oC, programmed
at a rate of 60 oC/min; GC oven temperature programmed from 35 oC (5 min) to 320 oC at
a rate of 20 oC/min; helium carrier gas; FID temperature 350 oC.
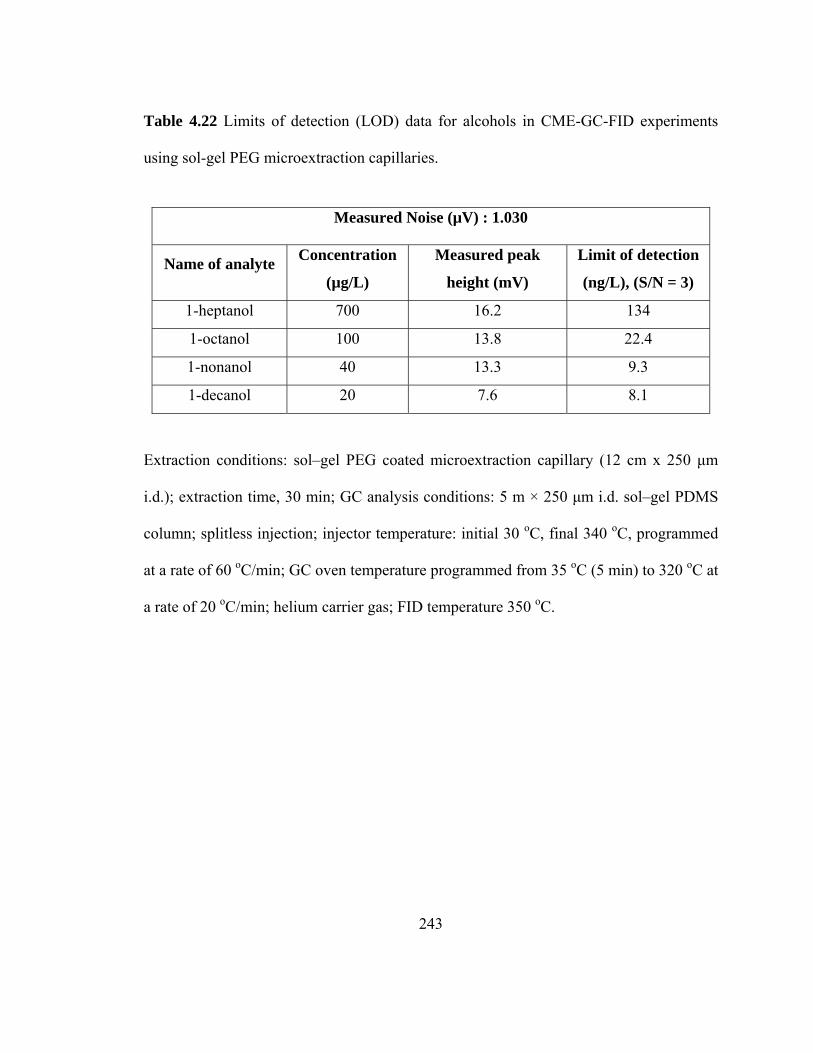
243
Table 4.22 Limits of detection (LOD) data for alcohols in CME-GC-FID experiments
using sol-gel PEG microextraction capillaries.
Measured Noise (µV) : 1.030
Name of analyte Concentration
(µg/L)
Measured peak
height (mV)
Limit of detection
(ng/L), (S/N = 3)
1-heptanol 700 16.2 134
1-octanol 100 13.8 22.4
1-nonanol 40 13.3 9.3
1-decanol 20 7.6 8.1
Extraction conditions: sol–gel PEG coated microextraction capillary (12 cm x 250 µm
i.d.); extraction time, 30 min; GC analysis conditions: 5 m × 250 µm i.d. sol–gel PDMS
column; splitless injection; injector temperature: initial 30 oC, final 340 oC, programmed
at a rate of 60 oC/min; GC oven temperature programmed from 35 oC (5 min) to 320 oC at
a rate of 20 oC/min; helium carrier gas; FID temperature 350 oC.
244
4.3.5.5 CME-GC-FID of free fatty acids using sol-gel PEG coated microextraction
capillaries
Free fatty acids are the key metabolites and intermediates in biological processes
[54]. Fatty acids have also received considerable attention in the scientific as well as
popular press because of its linkage to several chronic diseases, such as insulin resistance
[55,56], coronary artery disease [57] and certain types of cancer [58,59]. Hence, the
determination of these fatty acids in various matrices such as blood plasma and urine is of
great importance. The hydrophilic nature of fatty acids makes their extraction from
aqueous matrices an extremely difficult analytical task.
Table 4.23 lists the free fatty acids that were extracted using sol-gel PEG
microextraction capillaries. Sol-gel PEG coated capillaries were able to efficiently
extract underivatized free fatty acids from aqueous samples without requiring any
derivatization, pH adjustment or salting-out procedures. A typical gas chromatogram
obtained from these experiments is shown in Figure 4.9. It must be noted that this was the
first time a small molecular weight PEG was successfully used to extract free fatty acids
without any modification to the analytes or the sample matrix. CME–GC–FID
experiments using sol–gel PEG microextraction capillaries provided excellent run-to-run
(Table 4.24) and capillary-to-capillary (Table 4.25) extraction repeatability characterized
by RSD values of less than 4% and 5%, respectively. We were also able to achieve
detection limits (e.g., 0.07 µg/L for octanoic acid and 0.02 µg/L for decanoic acid, by
CME-GC-FID) comparable to those reported in the literature using sol-gel open chain

245
crown ether/OH-TSO coated SPME fiber (e.g., 0.03 µg/L for octanoic acid and 0.03 µg/L
for decanoic acid, by SPME-GC-FID) [53] and using in situ derivatization of fatty acids
on polyacrylate coated SPME fiber (e.g., 0.04 µg/L for octanoic acid and 0.02 µg/L for
decanoic acid, by SPME-GC-FID) [60]. LOD results for the fatty acids are provided in
Table 4.26.
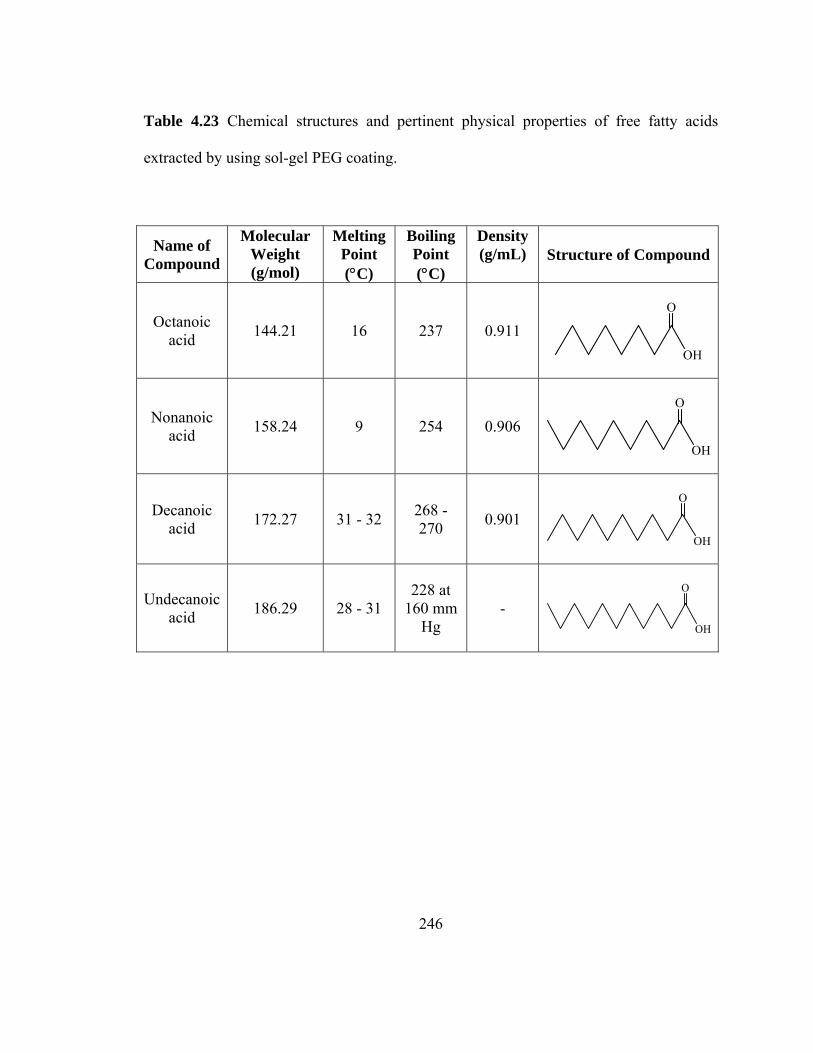
246
Table 4.23 Chemical structures and pertinent physical properties of free fatty acids
extracted by using sol-gel PEG coating.
Name of Compound
Molecular Weight (g/mol)
Melting Point (°C)
Boiling Point (°C)
Density (g/mL) Structure of Compound
Octanoic acid 144.21 16 237 0.911
O
OH
Nonanoic acid 158.24 9 254 0.906
O
OH
Decanoic acid 172.27 31 - 32 268 -
270 0.901
O
OH
Undecanoic acid 186.29 28 - 31
228 at 160 mm
Hg -
O
OH
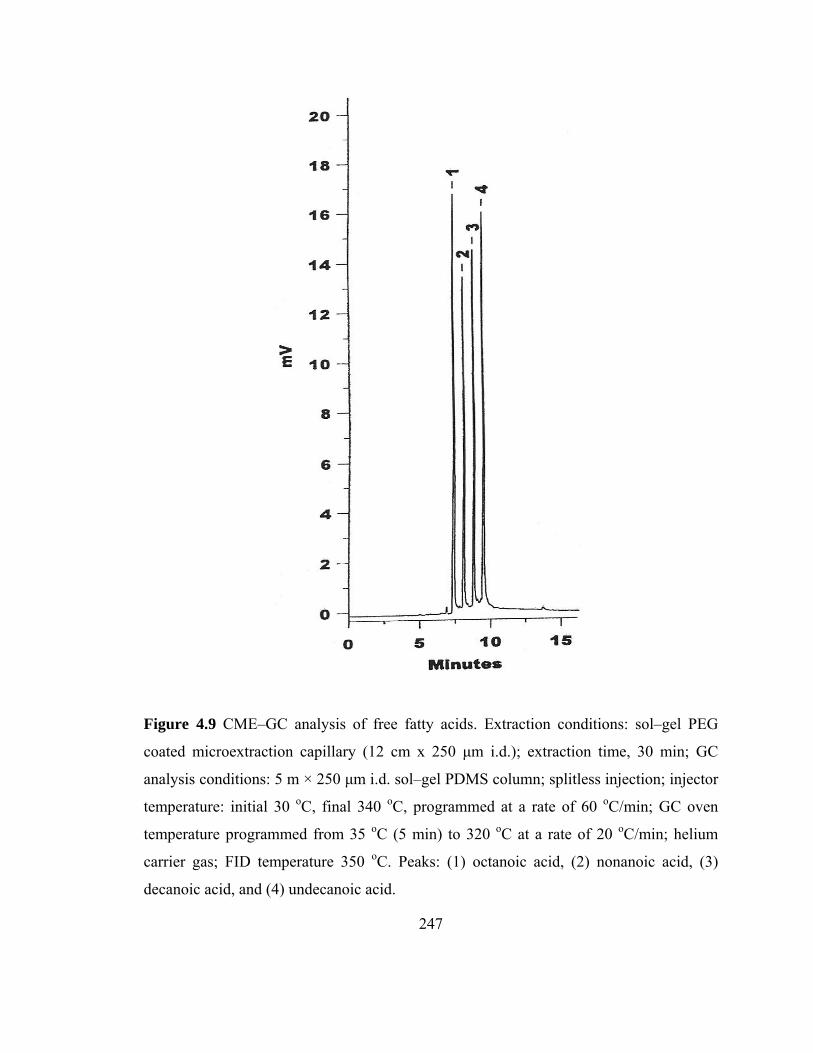
247
Figure 4.9 CME–GC analysis of free fatty acids. Extraction conditions: sol–gel PEG
coated microextraction capillary (12 cm x 250 µm i.d.); extraction time, 30 min; GC
analysis conditions: 5 m × 250 µm i.d. sol–gel PDMS column; splitless injection; injector
temperature: initial 30 oC, final 340 oC, programmed at a rate of 60 oC/min; GC oven
temperature programmed from 35 oC (5 min) to 320 oC at a rate of 20 oC/min; helium
carrier gas; FID temperature 350 oC. Peaks: (1) octanoic acid, (2) nonanoic acid, (3)
decanoic acid, and (4) undecanoic acid.
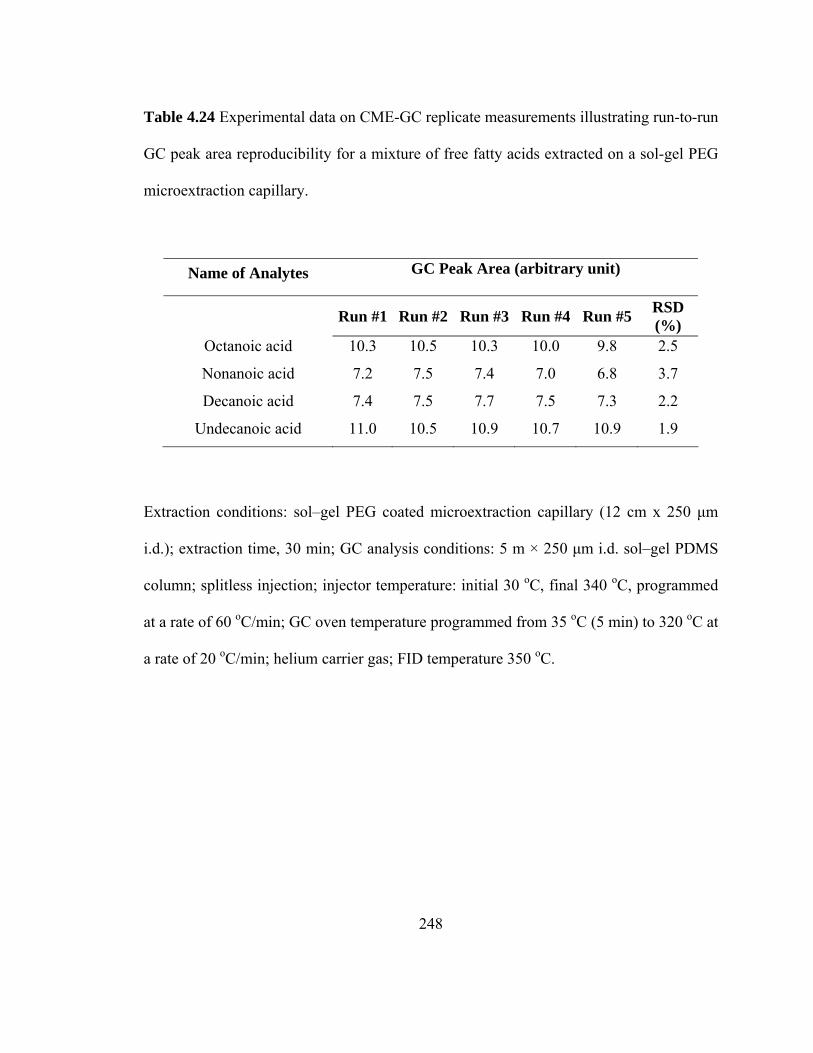
248
Table 4.24 Experimental data on CME-GC replicate measurements illustrating run-to-run
GC peak area reproducibility for a mixture of free fatty acids extracted on a sol-gel PEG
microextraction capillary.
Name of Analytes GC Peak Area (arbitrary unit)
Run #1 Run #2 Run #3 Run #4 Run #5 RSD
(%) Octanoic acid 10.3 10.5 10.3 10.0 9.8 2.5
Nonanoic acid 7.2 7.5 7.4 7.0 6.8 3.7
Decanoic acid 7.4 7.5 7.7 7.5 7.3 2.2
Undecanoic acid 11.0 10.5 10.9 10.7 10.9 1.9
Extraction conditions: sol–gel PEG coated microextraction capillary (12 cm x 250 µm
i.d.); extraction time, 30 min; GC analysis conditions: 5 m × 250 µm i.d. sol–gel PDMS
column; splitless injection; injector temperature: initial 30 oC, final 340 oC, programmed
at a rate of 60 oC/min; GC oven temperature programmed from 35 oC (5 min) to 320 oC at
a rate of 20 oC/min; helium carrier gas; FID temperature 350 oC.
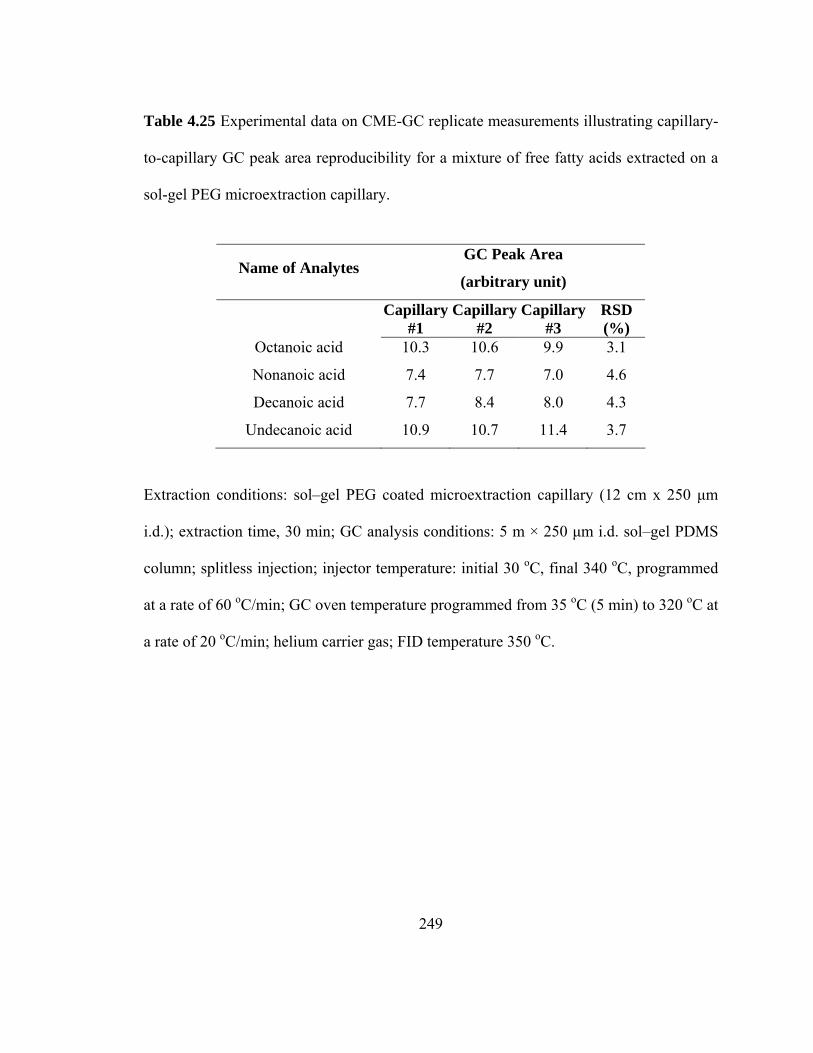
249
Table 4.25 Experimental data on CME-GC replicate measurements illustrating capillary-
to-capillary GC peak area reproducibility for a mixture of free fatty acids extracted on a
sol-gel PEG microextraction capillary.
Name of Analytes GC Peak Area
(arbitrary unit)
Capillary #1
Capillary#2
Capillary #3
RSD (%)
Octanoic acid 10.3 10.6 9.9 3.1
Nonanoic acid 7.4 7.7 7.0 4.6
Decanoic acid 7.7 8.4 8.0 4.3
Undecanoic acid 10.9 10.7 11.4 3.7
Extraction conditions: sol–gel PEG coated microextraction capillary (12 cm x 250 µm
i.d.); extraction time, 30 min; GC analysis conditions: 5 m × 250 µm i.d. sol–gel PDMS
column; splitless injection; injector temperature: initial 30 oC, final 340 oC, programmed
at a rate of 60 oC/min; GC oven temperature programmed from 35 oC (5 min) to 320 oC at
a rate of 20 oC/min; helium carrier gas; FID temperature 350 oC.
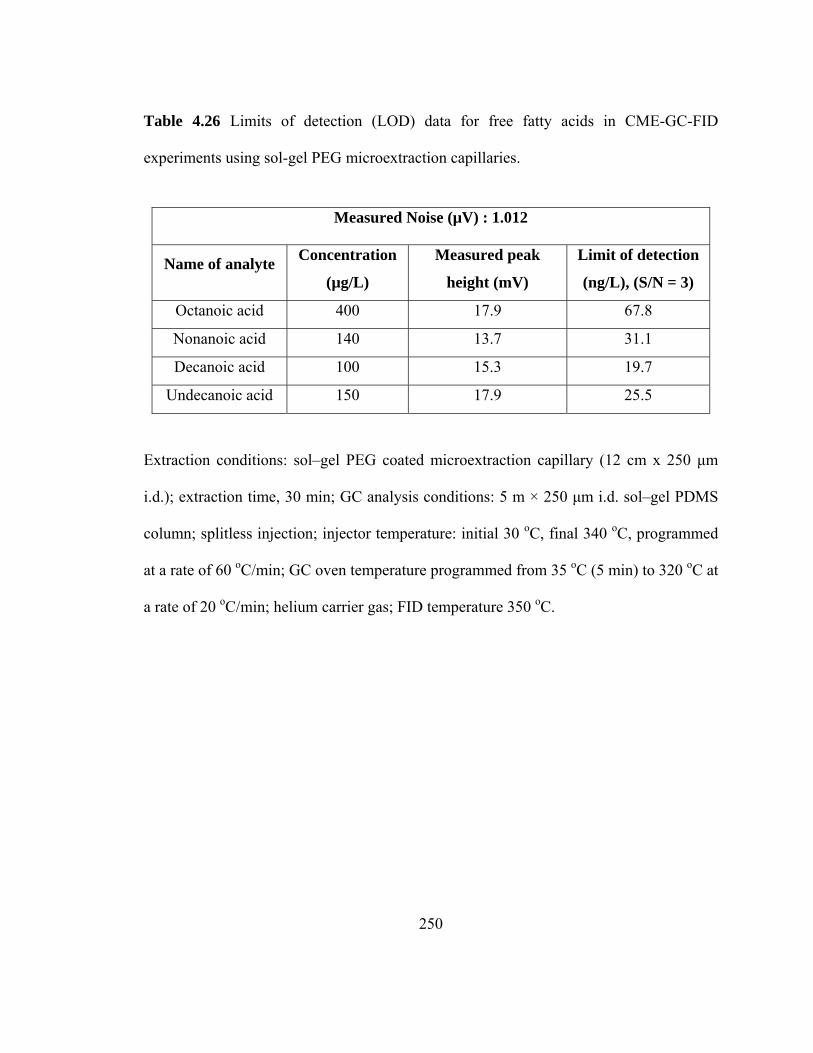
250
Table 4.26 Limits of detection (LOD) data for free fatty acids in CME-GC-FID
experiments using sol-gel PEG microextraction capillaries.
Measured Noise (µV) : 1.012
Name of analyte Concentration
(µg/L)
Measured peak
height (mV)
Limit of detection
(ng/L), (S/N = 3)
Octanoic acid 400 17.9 67.8
Nonanoic acid 140 13.7 31.1
Decanoic acid 100 15.3 19.7
Undecanoic acid 150 17.9 25.5
Extraction conditions: sol–gel PEG coated microextraction capillary (12 cm x 250 µm
i.d.); extraction time, 30 min; GC analysis conditions: 5 m × 250 µm i.d. sol–gel PDMS
column; splitless injection; injector temperature: initial 30 oC, final 340 oC, programmed
at a rate of 60 oC/min; GC oven temperature programmed from 35 oC (5 min) to 320 oC at
a rate of 20 oC/min; helium carrier gas; FID temperature 350 oC.
251
4.3.5.6 CME-GC-FID of mixture of moderately polar and highly polar compounds
using sol-gel PEG coated microextraction capillary
A mixture containing analytes from different chemical classes representing a wide
polarity range was extracted from an aqueous sample using a sol-gel PEG coated
capillary. As is revealed from the chromatogram (Figure 4.10), a sol-gel PEG coated
capillary can be effectively used to simultaneously extract moderately polar, and highly
polar compounds from an aqueous matrix.
4.3.5.7 CME performance of sol-gel capillaries prepared with and without TESP
Finally, the extraction performance of sol-gel PEG capillary was compared to a
capillary coated without TESP (sol-gel co-precursor with a bonded PEG moiety). Figures
4.11 and 4.12 compares the extraction of an aqueous sample containing two alcohols and
two free fatty acids obtained on two sol-gel coated microextraction capillaries: a sol-gel
PEG capillary [Figure 4.11] and a capillary coated without TESP [Figure 4.12]. It is
evident from these figures that in the absence of polar PEG moieties, the methyl groups
(from MTMOS precursor) cannot compete with water to provide extraction of highly
polar analytes like free fatty acids and alcohols.
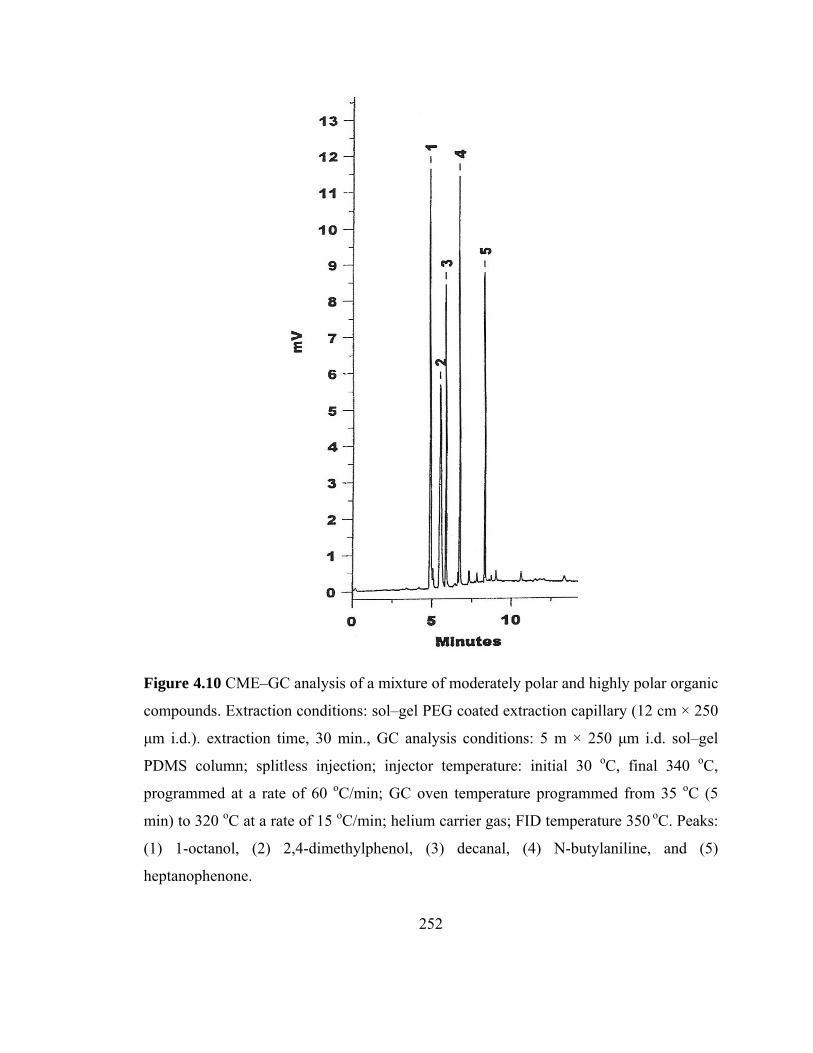
252
Figure 4.10 CME–GC analysis of a mixture of moderately polar and highly polar organic
compounds. Extraction conditions: sol–gel PEG coated extraction capillary (12 cm × 250
µm i.d.). extraction time, 30 min., GC analysis conditions: 5 m × 250 µm i.d. sol–gel
PDMS column; splitless injection; injector temperature: initial 30 oC, final 340 oC,
programmed at a rate of 60 oC/min; GC oven temperature programmed from 35 oC (5
min) to 320 oC at a rate of 15 oC/min; helium carrier gas; FID temperature 350 oC. Peaks:
(1) 1-octanol, (2) 2,4-dimethylphenol, (3) decanal, (4) N-butylaniline, and (5)
heptanophenone.
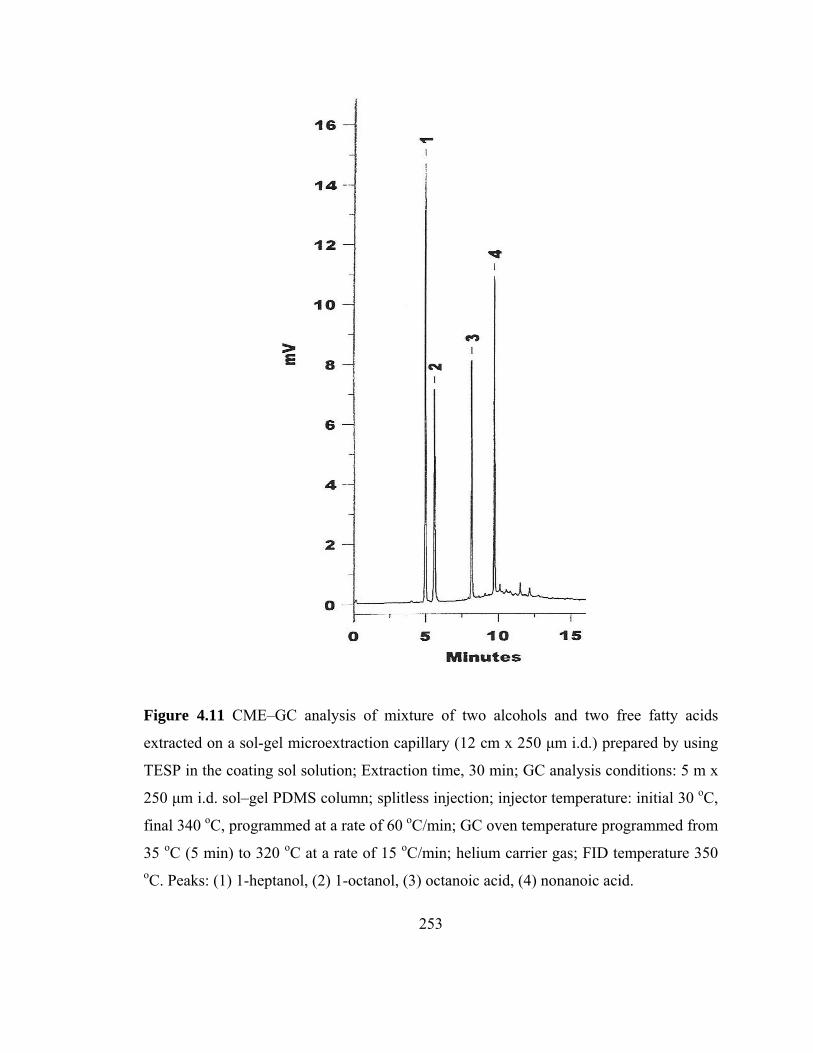
253
Figure 4.11 CME–GC analysis of mixture of two alcohols and two free fatty acids
extracted on a sol-gel microextraction capillary (12 cm x 250 µm i.d.) prepared by using
TESP in the coating sol solution; Extraction time, 30 min; GC analysis conditions: 5 m x
250 µm i.d. sol–gel PDMS column; splitless injection; injector temperature: initial 30 oC,
final 340 oC, programmed at a rate of 60 oC/min; GC oven temperature programmed from
35 oC (5 min) to 320 oC at a rate of 15 oC/min; helium carrier gas; FID temperature 350
oC. Peaks: (1) 1-heptanol, (2) 1-octanol, (3) octanoic acid, (4) nonanoic acid.
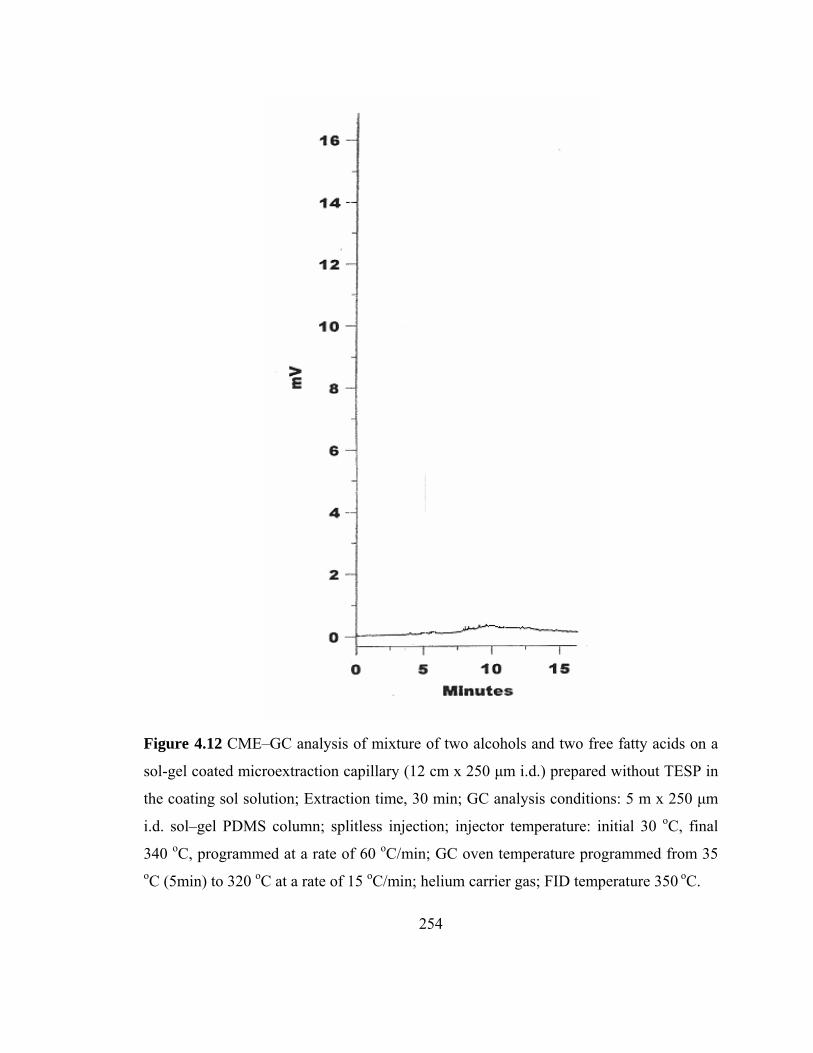
254
Figure 4.12 CME–GC analysis of mixture of two alcohols and two free fatty acids on a
sol-gel coated microextraction capillary (12 cm x 250 µm i.d.) prepared without TESP in
the coating sol solution; Extraction time, 30 min; GC analysis conditions: 5 m x 250 µm
i.d. sol–gel PDMS column; splitless injection; injector temperature: initial 30 oC, final
340 oC, programmed at a rate of 60 oC/min; GC oven temperature programmed from 35 oC (5min) to 320 oC at a rate of 15 oC/min; helium carrier gas; FID temperature 350 oC.
255
4.4 Conclusion
For the first time, low molecular weight PEG was used to prepare sol-gel coatings
for capillary microextraction. The used sol-gel PEG coated microextraction capillaries
were very effective in preconcentration and trace analysis of moderately polar and highly
polar compounds. Using sol-gel PEG coated microextraction capillaries, low ng/L level
detection limits were achieved for both moderately polar and highly polar analytes
directly extracted from aqueous media without requiring derivatization, pH adjustment,
or salting out procedures. The sol-gel PEG microextraction coatings showed remarkable
performance repeatability evident from their run-to-run and capillary-to-capillary peak
area RSD values of lower than 5%. Since low molecular weight sol–gel PEG extraction
phase shows excellent thermal (340 °C) and solvent stability, the sol–gel PEG coatings
are suitable for coupling with both GC and HPLC.
256
4.5 References to chapter 4
[1] J.A. Yancey, J. Chromatogr. 23 (1985) 161.
[2] P. Sandra, F. David, M. Proot, G. Diricks, M. Verstappe, M. Verzele, J. High Resolut. Chromatogr. Chromatogr. Commun. 8 (1985) 782.
[3] W.R. Supina, L.R. Rose, J. Chromatogr. Sci. 8 (1970) 214.
[4] L. Rohrschneider, Advances in Chromatography, Marcel Dekker, New York, 1967.
[5] B.J. Hall, J.S. Brodbelt, J. Chromatogr. A 777 (1997) 275.
[6] V. Mani, Applications of Solid Phase Microextraction, Royal Society of Chemistry, Cambridge, UK, 1999.
[7] M. Ciganek, M. Dressler, J. Teply, J. Chromatogr. 588 (1991) 225.
[8] J. de Zeeuw, J. Luong, TrAc, Trends Anal. Chem. 21 (2002) 594.
[9] M. Horka, V. Kahle, K. Janak, K. Tesarik, J. High. Resolut. Chromatogr. Chromatogr. Commun. 8 (1985) 259.
[10] M. Horka, V. Kahle, K. Janak, K. Tesarik, Chromatographia 21 (1986) 454.
[11] L. Bystricky, J. High. Resolut. Chromatogr. Chromatogr. Commun. 9 (1986) 240.
[12] Z. Wang, C. Xiao, C. Wu, H. Han, J. Chromatogr. A 893 (2000) 157.
[13] R.G.d.C. Silva, F. Augusto, J. Chromatogr. A 1072 (2005) 7–12.
[14] M. Cai, W. Wang, J. Xing, Y. Feng, C. Wu, Fenxi Huaxue 34 (2006) 91.
[15] S. Bigham, J. Medlar, A. Kabir, C. Shende, A. Alli, A. Malik, Anal. Chem. 74 (2002) 752.
[16] C. Shende, A. Kabir, E. Townsend, A. Malik, Anal. Chem. 75 (2003) 3518.
[17] D. Wang, S.L. Chong, A. Malik, Anal. Chem. 69 (1997) 4566.
[18] S.L. Chong, D. Wang, J.D. Hayes, B.W. Wilhite, A. Malik, Anal. Chem. 69 (1997) 3889.
257
[19] J.D. Hayes, A. Malik, J. Chromatogr. B 695 (1997) 3.
[20] A. Kabir, in "Polytetrahydrofuran-and Dendrimer-Based Novel Sol-Gel Coatings for Capillary Microextraction (CME) Providing Parts Per Trillion (ppt) and Parts Per Quadrillion (ppq) Level Detection Limits in Conjunction With Gas Chromatography and Flame Ionization Detection (FID)", University of South Florida, Tampa, 2005, p. 299.
[21] Z. Zeng, W. Qiu, Z. Huang, Anal. Chem. 73 (2001) 2429.
[22] A. Malik, S.L. Chong, Applications of Solid Phase microextraction, Royal Society of Chemistry, Cambridge, UK, 1999.
[23] K. Alhooshani, T.-Y. Kim, A. Kabir, A. Malik, J. Chromatogr. A 1062 (2005) 1.
[24] T.Y. Kim, K. Alhooshani, A. Kabir, D.P. Fries, A. Malik, J. Chromatogr. A 1047 (2004) 165.
[25] A. Kabir, C. Hamlet, K.S. Yoo, G.R. Newkome, A. Malik, J. Chromatogr. A 1034
(2004) 1. [26] S. Kulkarni, L. Fang, K. Alhooshani, A. Malik, J. Chromatogr. A 1124 (2006)
205–216. [27] C. Brinker, G. Scherer, Sol–Gel Science. The Physics and Chemistry of Sol–Gel
Processing, Academic Press, San Diego, CA, 1990. [28] R.J. Kieber, K. Mopper, Environ. Sci. Technol. 24 (1990) 1477.
[29] M.L. Bao, F. Pantani, O. Griffini, D. Burrini, D. Santianni, K. Barbieri, J. Chromatogr. A 809 (1998) 75.
[30] G.D. Leikauf, Environmental Toxicants:Human Exposures and Their Health
Effects, Van Nostrand Reinhold, New York, 1992. [31] N.R. Council, Formaldehyde and Other Aldehydes: Board on Toxicology and
Environmental Health Hazards, National Academy Press, Washington, DC, 1981. [32] J. Nawrocki, J. Chromatogr. A 749 (1996) 157.
[33] J.L. Radomski, Annu. Rev. Pharmacol. 19 (1979) 129–157.
[34] R.C. Garner, C.N. Martin, D.B. Clayson, Chemical Carcinogens, Amer. Chem. Soc., Washington, DC, 1984.
258
[35] L. Rehn, Archiv. Clin. Chirgurie 50 (1895) 588–600.
[36] D. Kim, F.P. Guengerich, Ann. Rev. Pharmacol. Toxicol. 45 (2005) 27.
[37] ACGIH, Threshold Limit Values and Biological Exposure Indices, ACGIH-Press, Cincinnati, OH, 1999.
[38] D.-D. Forschungsgemeinschaft, MAK- and BAT- Values, VCH, Weinheim, 2000.
[39] M. Huang, T. Chao, Q. Zhou, G. Jiang, J. Chromatogr. A 1048 (2004) 257.
[40] H. Van Doom, C.B. Grabanski, D.J. Miller, S.B. Hawthorne, J. Chromatogr. A 829 (1998) 223.
[41] M. Molder, S. Schrader, U. Franck, P. Popp, Fresen., J. Anal. Chem. 357 (1997)
326. [42] E. Gonzalez-Toledo, M.D. Part, M.F. Alpendurada, J. Chromatogr. A 923 (2001)
45. [43] A. Penalver, E. Pocurull, F. Borrull, R.M. Marce, J. Chromatogr. A 953 (2002) 79.
[44] K.J. James, M.A. Stack, Fresen, J. Anal. Chem. 358 (1997) 833.
[45] D. Puig, D. Barcelo, Trends Anal. Chem. 15 (1996) 362.
[46] M. Llompart, M. Lourido, P. Landın, C. Garcıa-Jares, R. Cela, J. Chromatogr. A 963 (2002) 137.
[47] M.R. Lee, Y.C. Yeh, W.S. Hsiang, B.H. Hwang, J. Chromatogr. A 806 (1998)
317. [48] US, Environmental, Protection, Agency, in, EPA method 625 Fed. Reg., part VIII,
40 CFR part 136, 1981, p. 58. [49] N. Ito, S. Fukushima, A. Hagiwara, M. Shibata, T. Ogiso, J. Natl Cancer Inst. 70
(1983) 343–352. [50] IARC, Monographs on the Evaluation of the Carcinogenic Risks of Chemicals to
Humans 40 (1986) 123. [51] D. Wang, J. Xing, J. Peng, C. Wu, J. Chromatogr. A 1005 (2003) 1.
259
[52] Z. Wang, C. Xiao, C. Wu, H. Han, J. Chromatogr. A 893 (2000) 157.
[53] M. Liu, Z. Zeng, Y. Lei, H. Li, J. Sep. Sci. 28 (2005) 2306.
[54] E. Fogelqvist, B. Josefsson, C. Roos, J. High Resolut. Chromatogr. Chromatogr. Commun. 3 (1980) 568.
[55] L.H. Storlien, E.W. Kraegen, D.J. Chisholm, Science 237 (1987) 885.
[56] J. Yang, G.W. Xu, Q.F. Hong, J. Chromatogr. B 813 (2004) 53.
[57] P. Franck, M. Jean, D. Marie, Int. J. Cardiol. 78 (2001) 27.
[58] Y. Xu, Z. Shen, D. Wiper, J. Am. Med. Assoc. 280 (1998) 719.
[59] J.D. Potter, J. Am. Med. Assoc. 268 (1992) 1573.
[60] L. Pan, M. Adams, J. Pawliszyn, Anal. Chem. 67 (1995) 4396.

260
APPENDICES
261
Appendix A
262
Appendix A (Continued)
263
Appendix A (Continued)
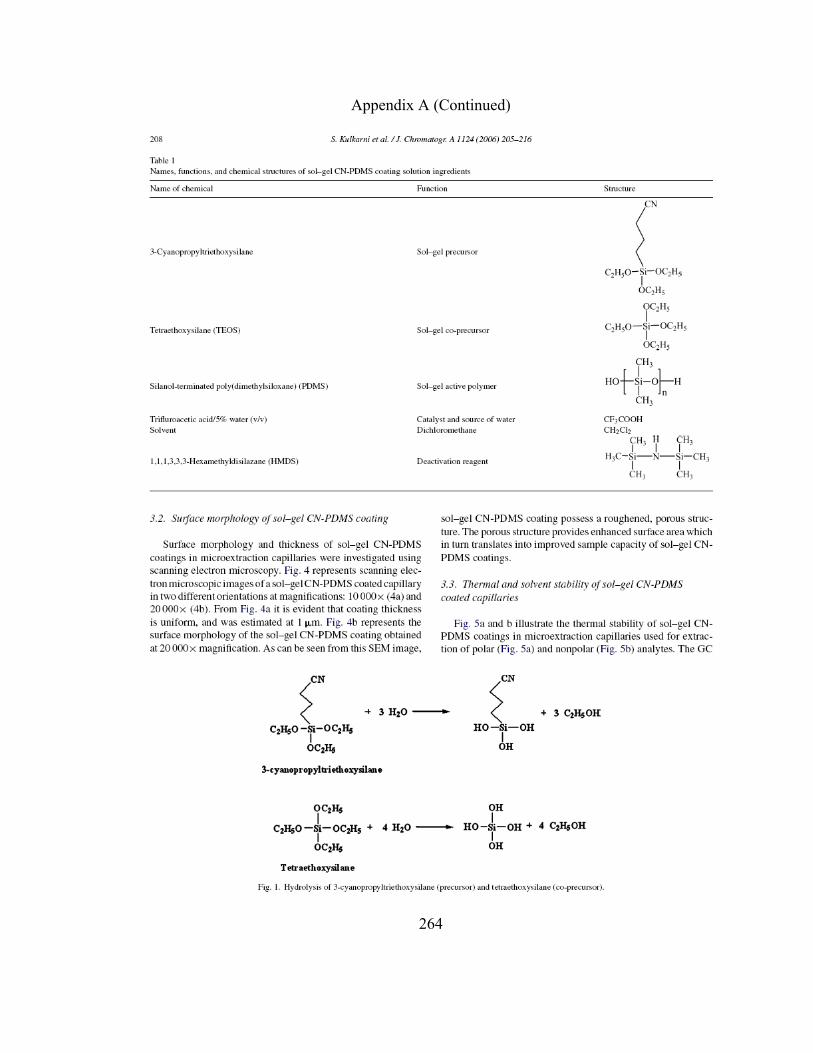
264
Appendix A (Continued)
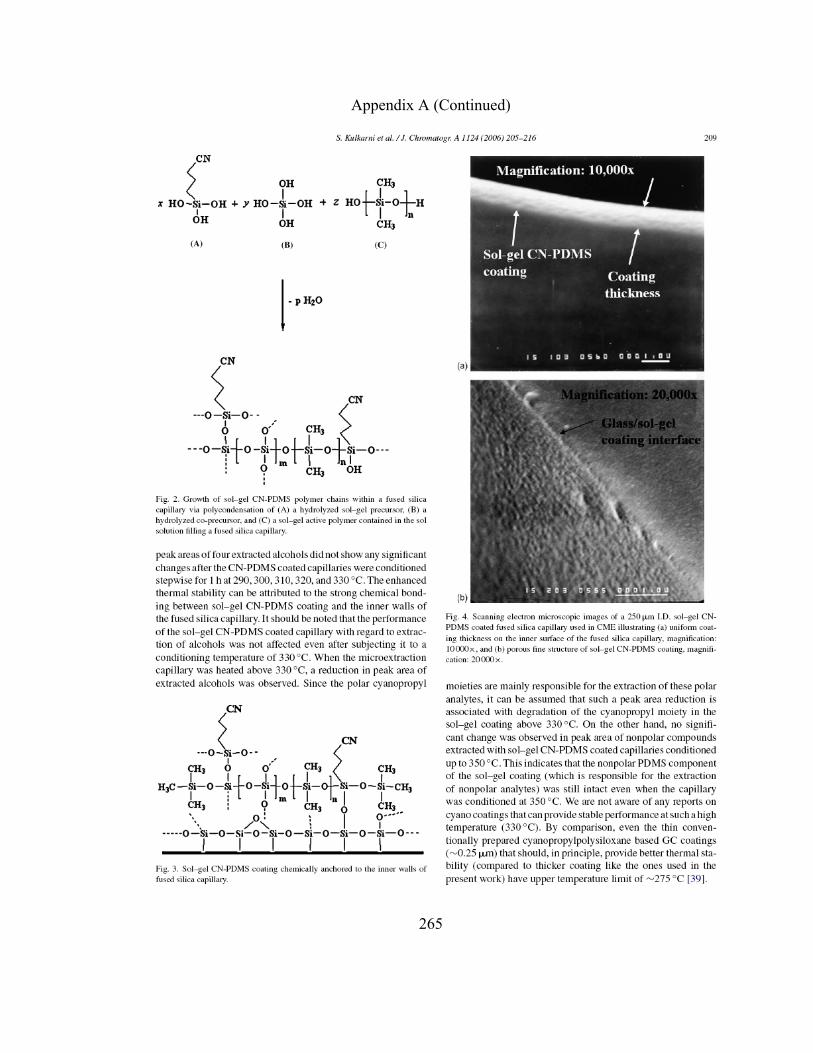
265
Appendix A (Continued)
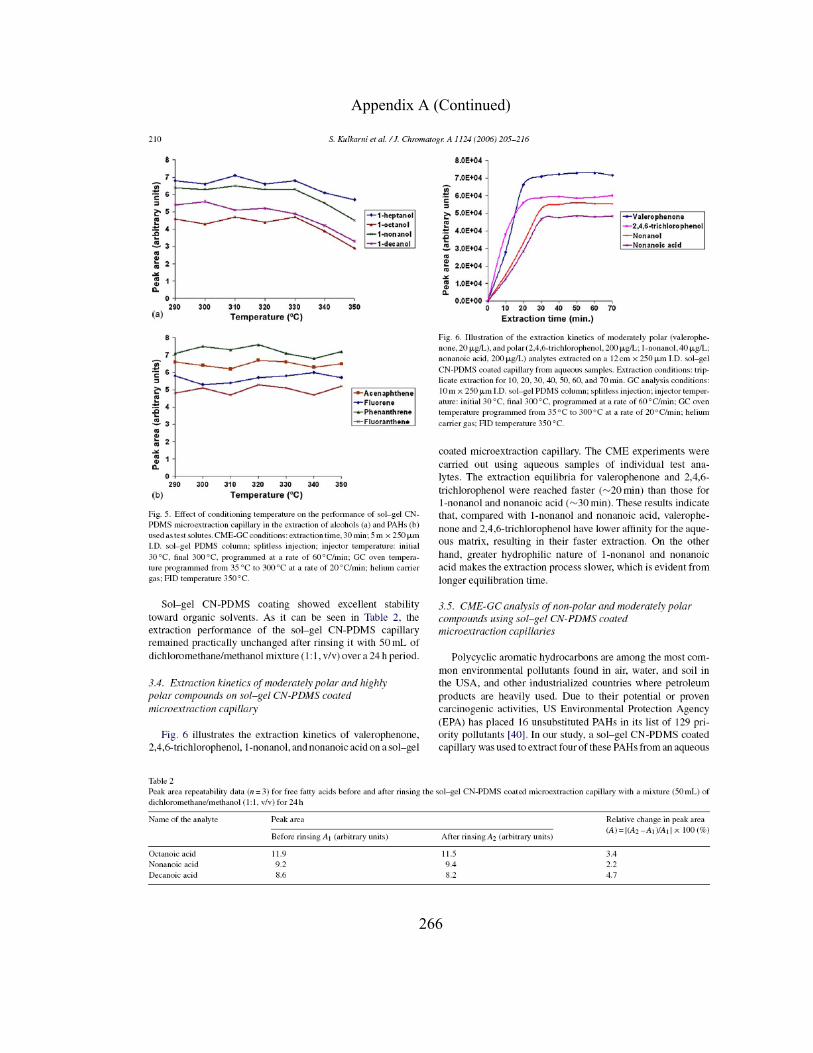
266
Appendix A (Continued)
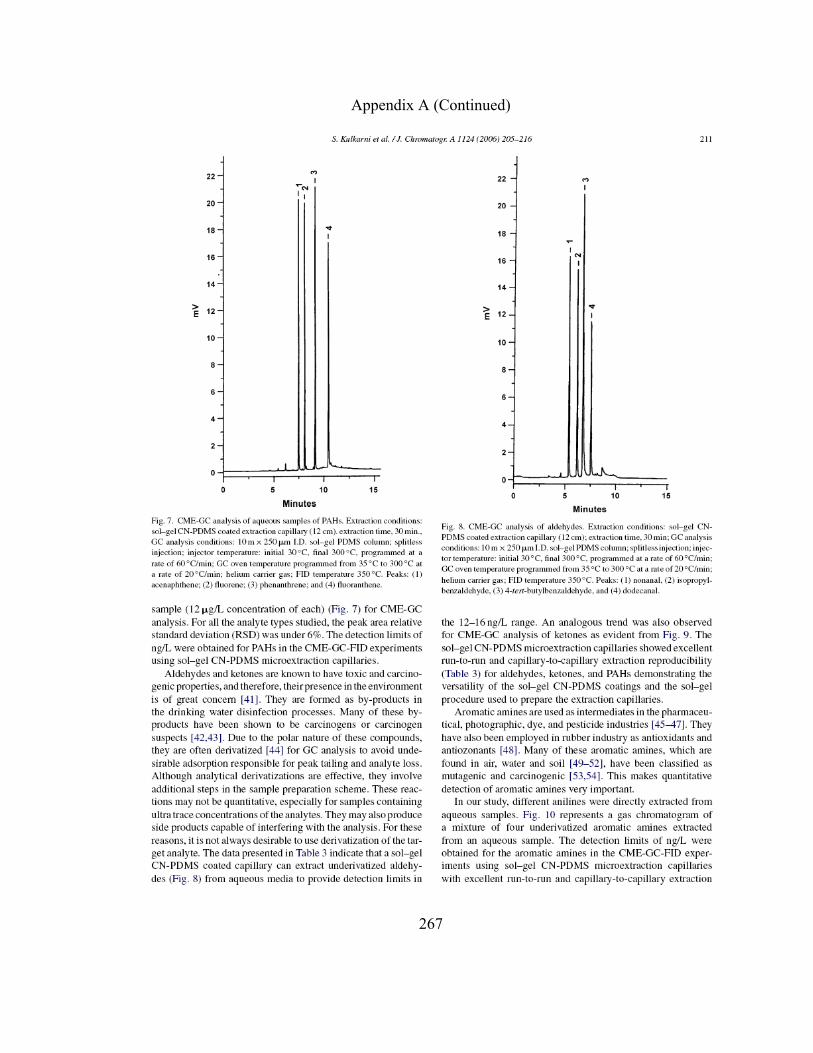
267
Appendix A (Continued)
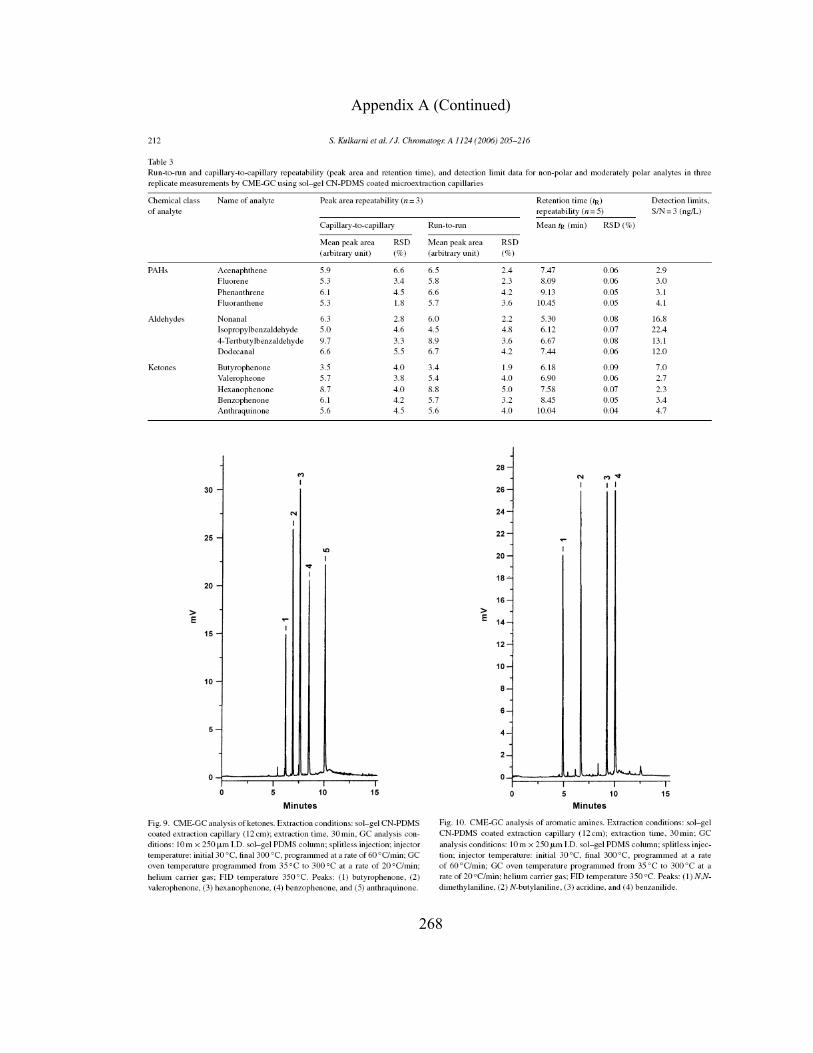
268
Appendix A (Continued)
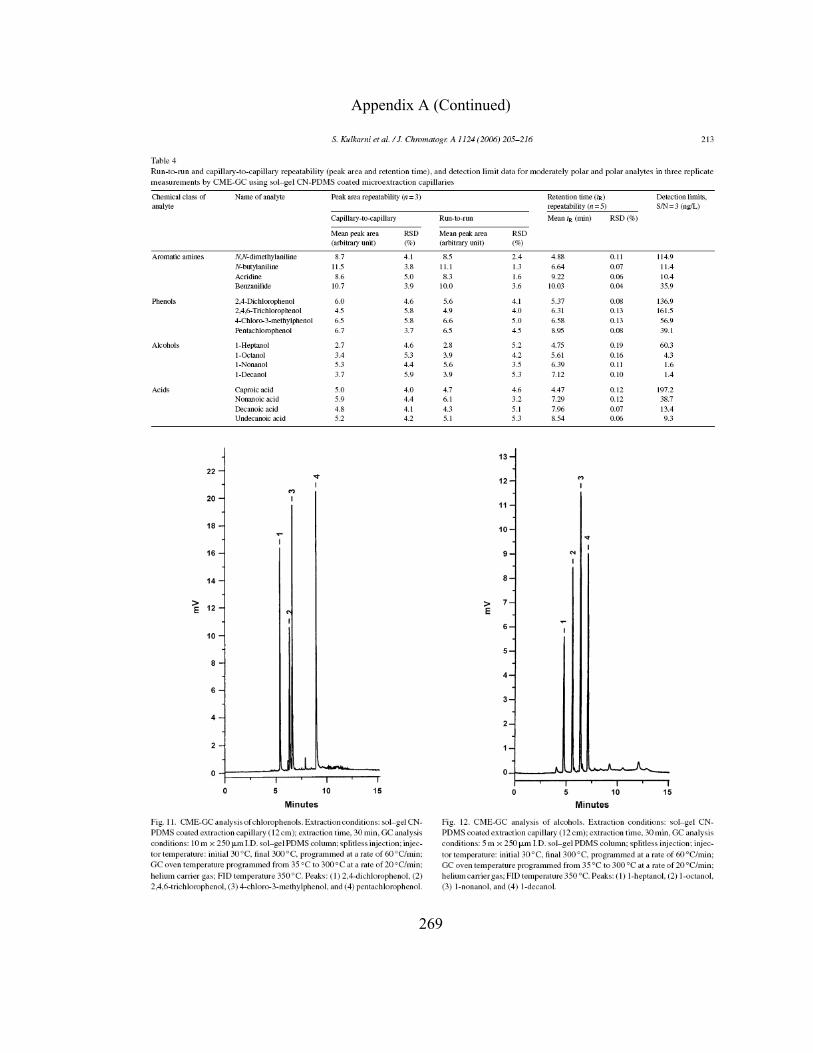
269
Appendix A (Continued)
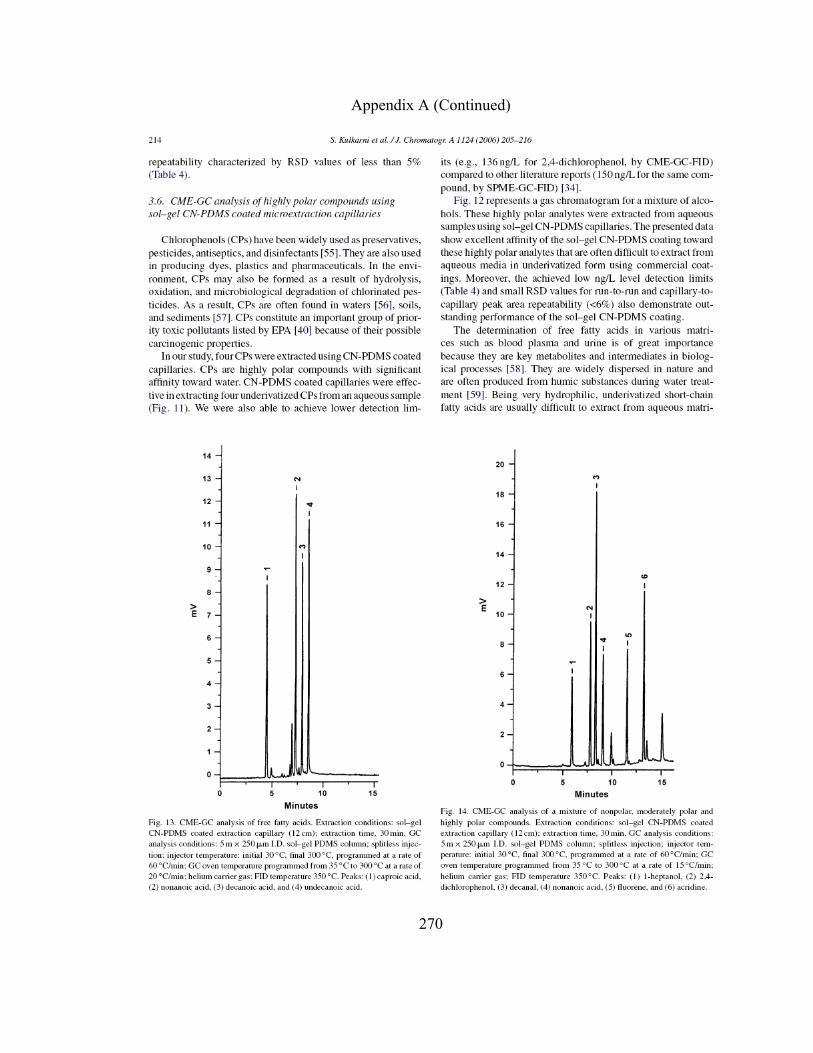
270
Appendix A (Continued)
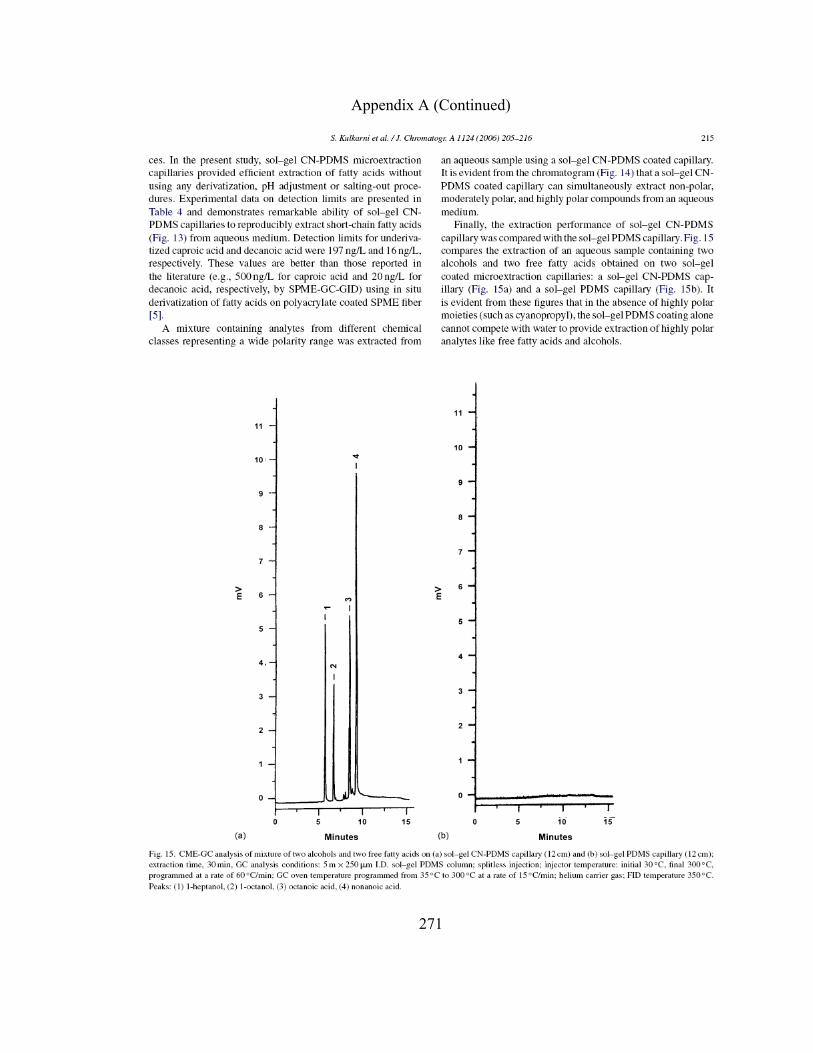
271
Appendix A (Continued)
272
Appendix A (Continued)
273
Appendix B
Quantitative Analysis in CME
In CME, first experiments should be performed to determine extraction time
profile of target analyte(s) (i.e., minimum time required for the extraction of equilibrium
concentration of target analyte(s) from the sample matrix) since the extraction process is
based on distribution of target analyte(s) between extracting phase (coating) and sample
matrix. The initial experiments give an estimate about the effectiveness of a CME coating
in extracting target analyte(s) from sample matrix, and indicate if there is a need for
further optimization of experimental parameter(s) (e.g., sample flow rate, temperature,
pH, salt concentration, etc.). It also gives a good estimate of the detection limits that are
to be expected.
The choice of the quantitation method depends primarily on the nature of sample
matrix. Simple matrices (e.g., drinking water) ususally do not have interferences that
might hinder the equilibrium extraction of target analyte(s). Therefore, a calibration curve
prepared using known concentration of target analyte(s) can be used for quantitative
analyses of analyte(s) of unknown concentration. Based on the principles of SPME (or
CME) [1], the amount of analyte(s) extracted from the sample at equilibrium (and under
set conditions like sample temperature, pH, and salt concentration) will be directly
proportional to the initial concentration of the analyte(s) in the sample. Therefore, it is
obvious that a linear calibration curve can be obtained (Figure B-1). The concentrations
274
Appendix B (Continued)
used to prepare linear calibration curve must cover the concentration range of the target
analyte(s). After extraction, the analytical response for the unknown sample can be
measure and, using the calibration curve (equation of line, y = mx + b), the analyst can
interpolate to find the unknown concentration of analyte(s) in the sample.
In case of complex matrices (e.g., river water, waste water, etc.), some of the
matrix components (e.g., suspended matter) are likely to interfere with the extraction
process or modify the properties of the coating (e.g., surfactants). Therefore, a standard
addition method is recommended for quantitative analyses of target analyte(s) of
unknown concentration. In this method, the sample containing unknown concentration of
target analyte(s) is divided into several portions. A series of samples are then prepared by
adding known amount (concentration) of an analyte (a standard) to the sample containing
unknown concentration of target analyte(s). After equilibrium extraction by CME, each
of these samples can then be analyzed. Since the analytical response will be directly
proportional to the analyte concentration, a standard addition curve can be prepared and
the analyst can extrapolate to find the unknown concentration of analyte(s) in the sample
(Figure B-2). In practice, a small volume of concentrated standard is added to avoid
significant changes in the sample matrix composition.
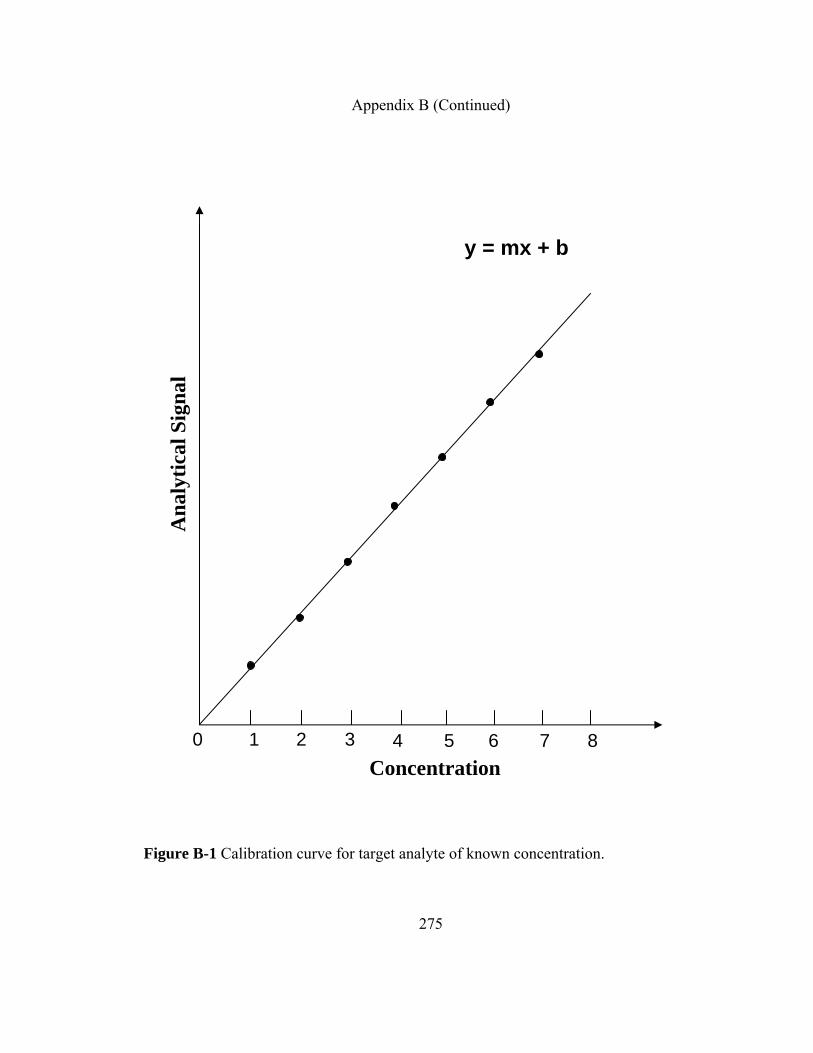
275
Appendix B (Continued)
Figure B-1 Calibration curve for target analyte of known concentration.
Ana
lytic
al S
igna
l
Concentration 0 1 2 3 4 5 6 7 8
y = mx + b
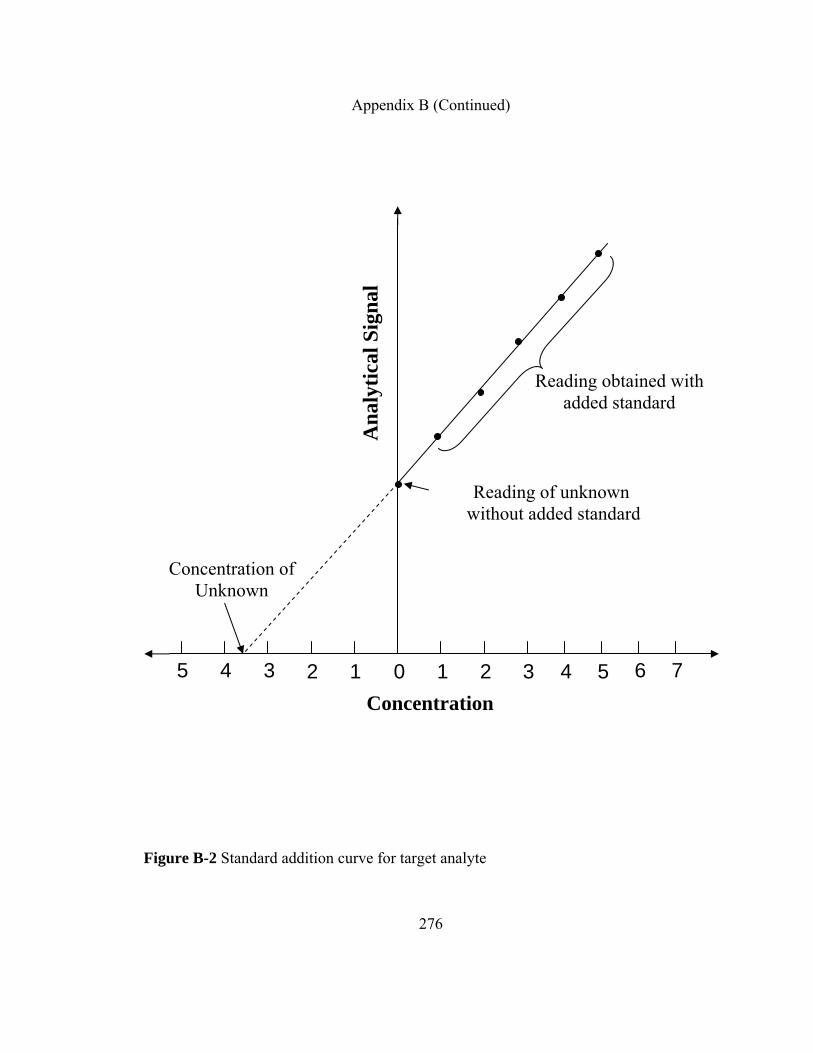
276
Appendix B (Continued)
Figure B-2 Standard addition curve for target analyte
Reading obtained with added standard
Reading of unknown without added standard
Concentration
Concentration of Unknown
0 1 2 3 4 5 6 7123 4 5
Ana
lytic
al S
igna
l
277
Appendix B (Continued)
Reference:
[1] J. Pawliszyn, Solid Phase Microextraction: Theory and Practice, Wiley-VCH, New York, 1997, p. 15.
278
Appendix C
Optimization of Sol-gel Coating Solution Composition
An important step in the preparation of a sol-gel coating for both fiber SPME and
CME is the optimization of the sol solution composition. The successful creation of the
desired sol-gel sorbent depends upon proper selection and optimization of relative
proportions of the sol solution ingredients. The sol solution ingredients typically include
sol-gel precursor(s), a solvent system, a catalyst, water, and a sol-gel active organic
ligand/polymer.
In our work, concentration of sol-gel precursor(s) and sol-gel active organic
ligand/polymer was chosen in a way that gives polarity to the CME coating necessary for
effective extraction of polar as well as nonpolar analytes from aqueous matrix. Since the
total amount of sol solution used to prepare CME coatings was less than 1 mL the amount
of sol-gel active components (i.e. sol-gel precursor(s) and sol-gel active organic
ligand/polymer), containing organic groups or side chains (responsible for the extraction
of organic analyte(s) from aqueous matrix), used were limited to 50 mg or less. Increase
in the amount of any one of the components (i.e. sol-gel precursor(s) or sol-gel active
organic polymer) led to increase in the amount of catalyst and solvent required to achieve
a reasonable gelation time (~ 1 – 2 h). During the optimization of sol-gel process, catalyst
(trifluoroacetic acid (TFA)) with low concentrations of water (usually 5-10 %) served as
a controlled source of water for the sol-gel hydrolysis reaction. Keeping the amount of
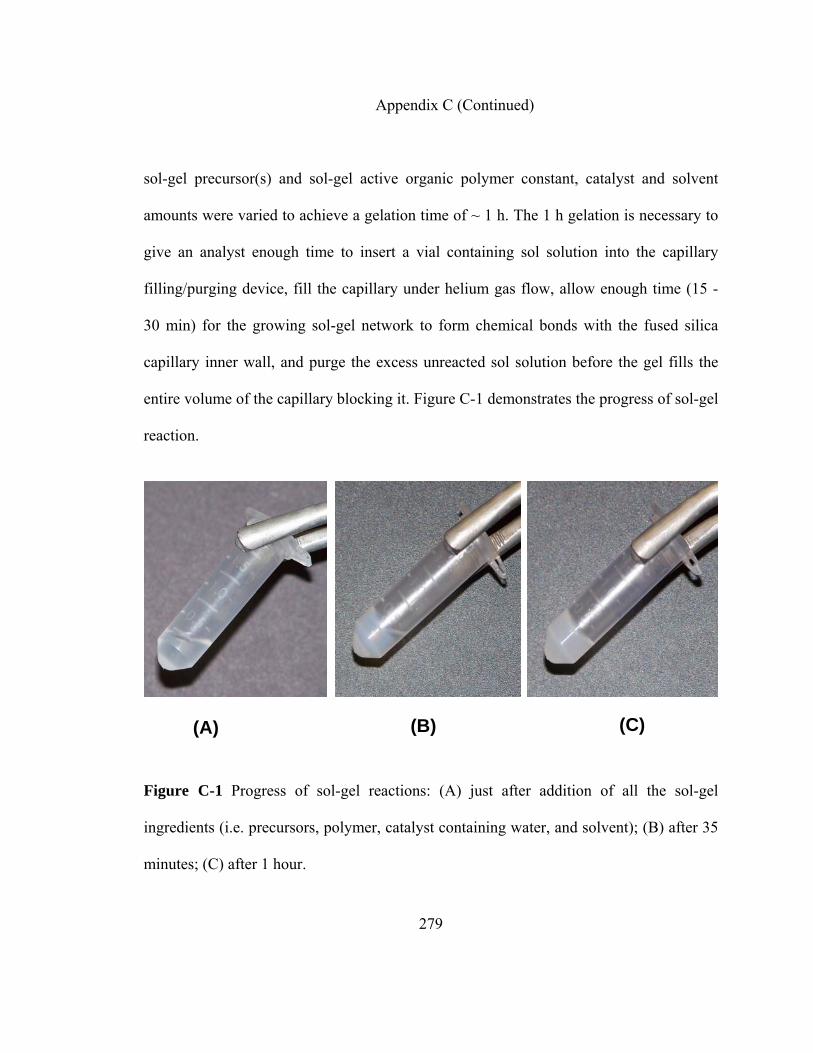
279
Appendix C (Continued)
sol-gel precursor(s) and sol-gel active organic polymer constant, catalyst and solvent
amounts were varied to achieve a gelation time of ~ 1 h. The 1 h gelation is necessary to
give an analyst enough time to insert a vial containing sol solution into the capillary
filling/purging device, fill the capillary under helium gas flow, allow enough time (15 -
30 min) for the growing sol-gel network to form chemical bonds with the fused silica
capillary inner wall, and purge the excess unreacted sol solution before the gel fills the
entire volume of the capillary blocking it. Figure C-1 demonstrates the progress of sol-gel
reaction.
Figure C-1 Progress of sol-gel reactions: (A) just after addition of all the sol-gel
ingredients (i.e. precursors, polymer, catalyst containing water, and solvent); (B) after 35
minutes; (C) after 1 hour.
(A) (B) (C)
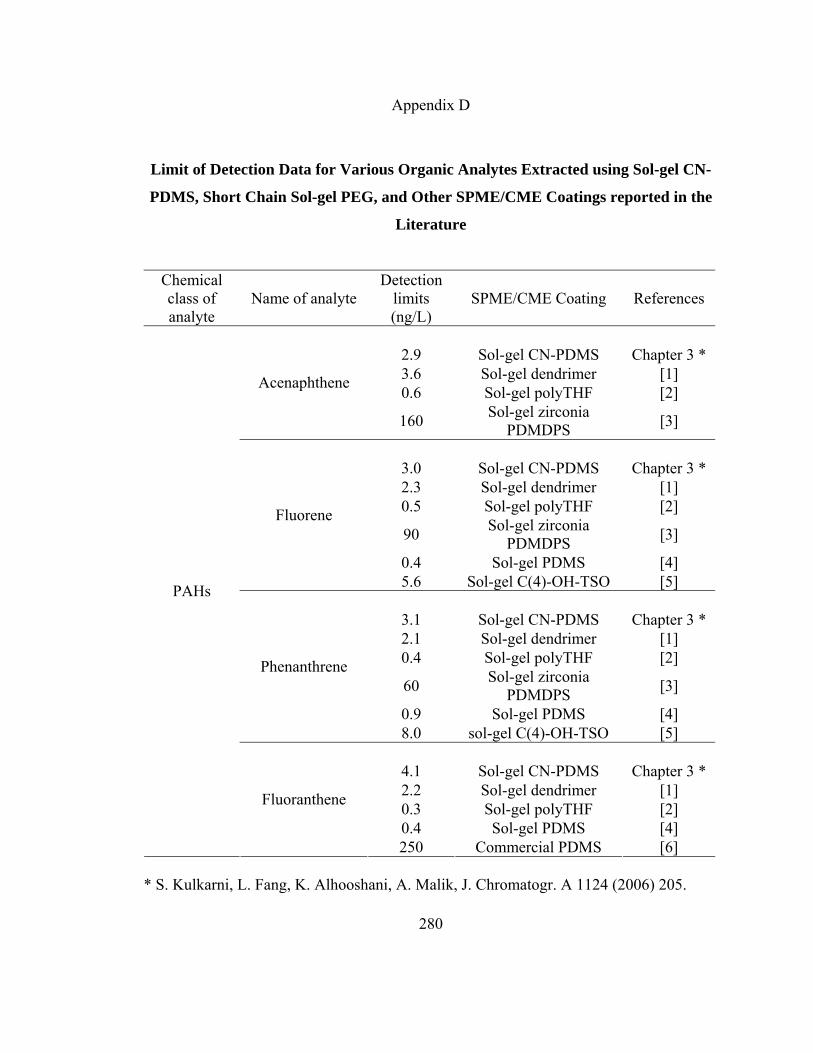
280
Appendix D
Limit of Detection Data for Various Organic Analytes Extracted using Sol-gel CN-
PDMS, Short Chain Sol-gel PEG, and Other SPME/CME Coatings reported in the
Literature
Chemical class of analyte
Name of analyte Detection
limits (ng/L)
SPME/CME Coating References
2.9 Sol-gel CN-PDMS Chapter 3 * 3.6 Sol-gel dendrimer [1] 0.6 Sol-gel polyTHF [2] Acenaphthene
160 Sol-gel zirconia PDMDPS [3]
3.0 Sol-gel CN-PDMS Chapter 3 * 2.3 Sol-gel dendrimer [1] 0.5 Sol-gel polyTHF [2]
90 Sol-gel zirconia PDMDPS [3]
0.4 Sol-gel PDMS [4]
Fluorene
5.6 Sol-gel C(4)-OH-TSO [5]
3.1 Sol-gel CN-PDMS Chapter 3 * 2.1 Sol-gel dendrimer [1] 0.4 Sol-gel polyTHF [2]
60 Sol-gel zirconia PDMDPS [3]
0.9 Sol-gel PDMS [4]
Phenanthrene
8.0 sol-gel C(4)-OH-TSO [5]
4.1 Sol-gel CN-PDMS Chapter 3 * 2.2 Sol-gel dendrimer [1] 0.3 Sol-gel polyTHF [2] 0.4 Sol-gel PDMS [4]
PAHs
Fluoranthene
250 Commercial PDMS [6] * S. Kulkarni, L. Fang, K. Alhooshani, A. Malik, J. Chromatogr. A 1124 (2006) 205.
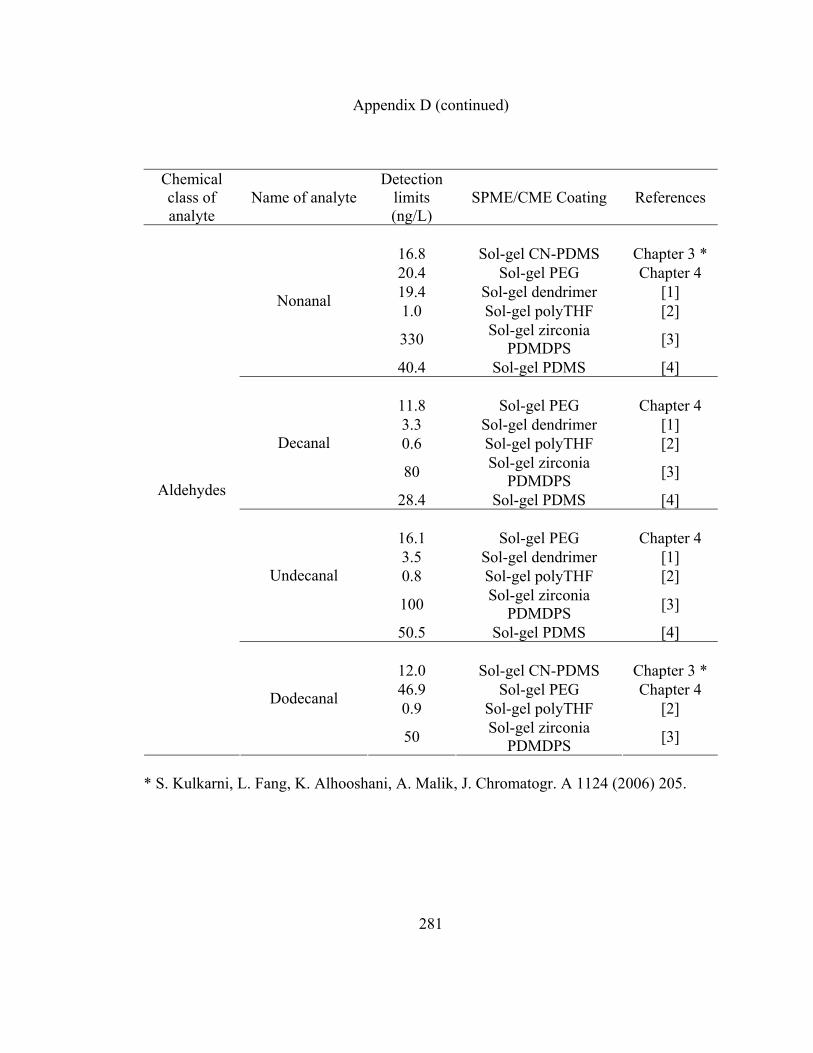
281
Appendix D (continued)
Chemical class of analyte
Name of analyte Detection
limits (ng/L)
SPME/CME Coating References
16.8 Sol-gel CN-PDMS Chapter 3 * 20.4 Sol-gel PEG Chapter 4 19.4 Sol-gel dendrimer [1] 1.0 Sol-gel polyTHF [2]
330 Sol-gel zirconia PDMDPS [3]
Nonanal
40.4 Sol-gel PDMS [4]
11.8 Sol-gel PEG Chapter 4 3.3 Sol-gel dendrimer [1] 0.6 Sol-gel polyTHF [2]
80 Sol-gel zirconia PDMDPS [3]
Decanal
28.4 Sol-gel PDMS [4]
16.1 Sol-gel PEG Chapter 4 3.5 Sol-gel dendrimer [1] 0.8 Sol-gel polyTHF [2]
100 Sol-gel zirconia PDMDPS [3]
Undecanal
50.5 Sol-gel PDMS [4]
12.0 Sol-gel CN-PDMS Chapter 3 * 46.9 Sol-gel PEG Chapter 4 0.9 Sol-gel polyTHF [2]
Aldehydes
Dodecanal
50 Sol-gel zirconia PDMDPS [3]
* S. Kulkarni, L. Fang, K. Alhooshani, A. Malik, J. Chromatogr. A 1124 (2006) 205.

282
Appendix D (continued)
Chemical class of analyte
Name of analyte Detection
limits (ng/L)
SPME/CME Coating References
7.0 Sol-gel CN-PDMS Chapter 3 * 44.3 Sol-gel dendrimer [1] Butyrophenone
1.0 Sol-gel polyTHF [2]
2.7 Sol-gel CN-PDMS Chapter 3 * 8.1 Sol-gel PEG Chapter 4 11.7 Sol-gel dendrimer [1] 0.5 Sol-gel polyTHF [2]
920 Sol-gel zirconia PDMDPS [3]
Valerophenone
215 Sol-gel PDMS [4]
2.3 Sol-gel CN-PDMS Chapter 3 * 9.7 Sol-gel PEG Chapter 4 3.7 Sol-gel dendrimer [1] 0.6 Sol-gel polyTHF [2]
330 Sol-gel zirconia PDMDPS [3]
Hexanophenone
109 Sol-gel PDMS [4]
3.4 Sol-gel CN-PDMS Chapter 3 * 7.2 Sol-gel PEG Chapter 4 Benzophenone
15.2 Sol-gel dendrimer [1]
4.7 Sol-gel CN-PDMS Chapter 3 *
Ketones
Anthraquinone 32.7 Sol-gel PDMS [4]
* S. Kulkarni, L. Fang, K. Alhooshani, A. Malik, J. Chromatogr. A 1124 (2006) 205.
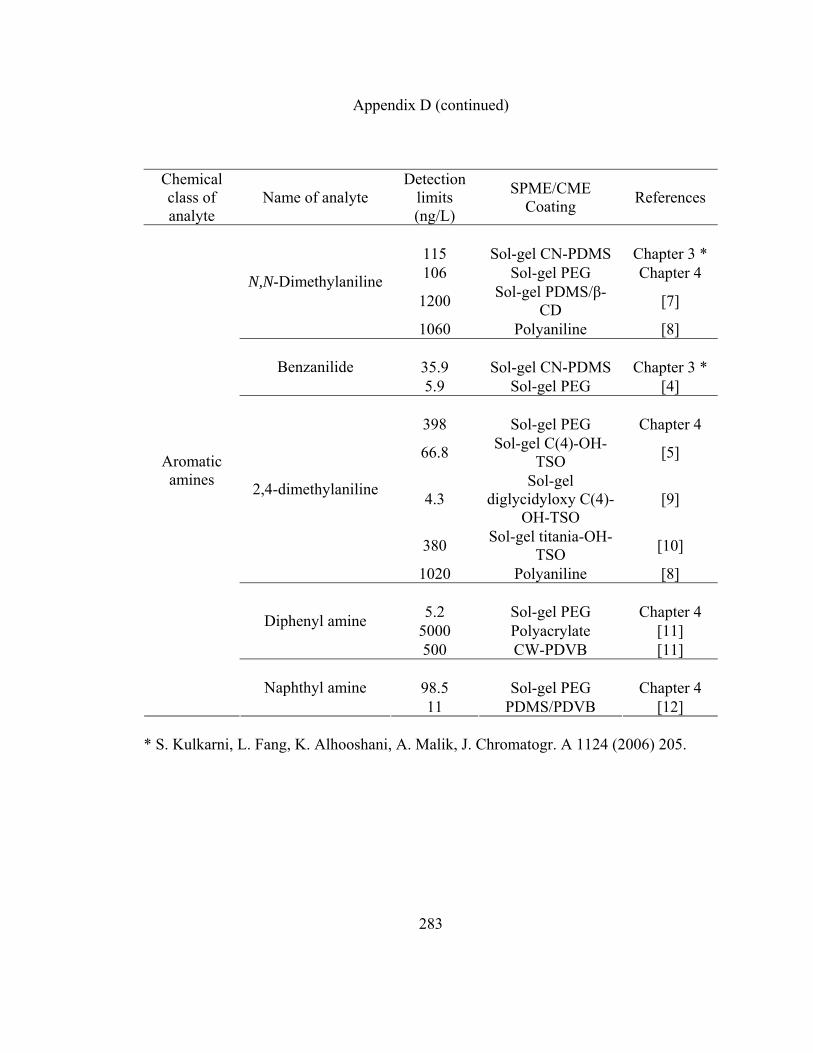
283
Appendix D (continued)
Chemical class of analyte
Name of analyte Detection
limits (ng/L)
SPME/CME Coating References
115 Sol-gel CN-PDMS Chapter 3 * 106 Sol-gel PEG Chapter 4
1200 Sol-gel PDMS/β-CD [7]
N,N-Dimethylaniline
1060 Polyaniline [8]
35.9 Sol-gel CN-PDMS Chapter 3 * Benzanilide 5.9 Sol-gel PEG [4]
398 Sol-gel PEG Chapter 4
66.8 Sol-gel C(4)-OH-TSO [5]
4.3 Sol-gel
diglycidyloxy C(4)-OH-TSO
[9]
380 Sol-gel titania-OH-TSO [10]
2,4-dimethylaniline
1020 Polyaniline [8]
5.2 Sol-gel PEG Chapter 4 5000 Polyacrylate [11] Diphenyl amine
500 CW-PDVB [11]
98.5 Sol-gel PEG Chapter 4
Aromatic amines
Naphthyl amine 11 PDMS/PDVB [12]
* S. Kulkarni, L. Fang, K. Alhooshani, A. Malik, J. Chromatogr. A 1124 (2006) 205.
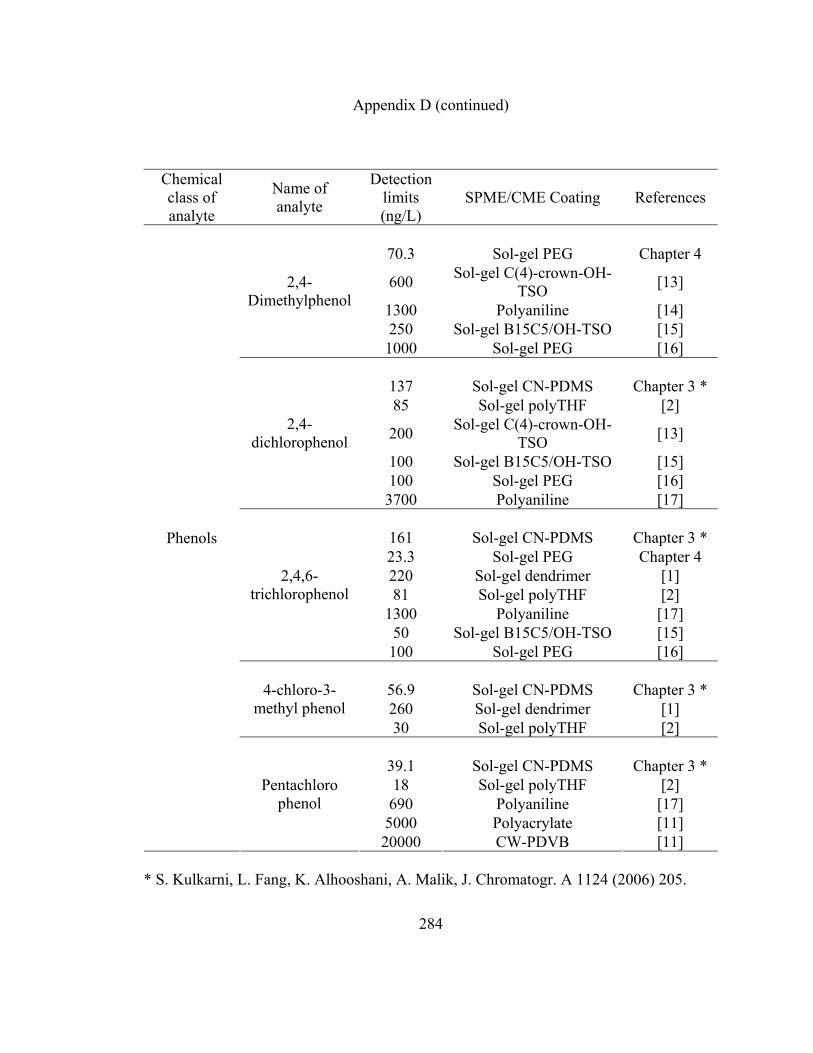
284
Appendix D (continued)
Chemical class of analyte
Name of analyte
Detection limits (ng/L)
SPME/CME Coating References
70.3 Sol-gel PEG Chapter 4
600 Sol-gel C(4)-crown-OH-TSO [13]
1300 Polyaniline [14] 250 Sol-gel B15C5/OH-TSO [15]
2,4-Dimethylphenol
1000 Sol-gel PEG [16]
137 Sol-gel CN-PDMS Chapter 3 * 85 Sol-gel polyTHF [2]
200 Sol-gel C(4)-crown-OH-TSO [13]
100 Sol-gel B15C5/OH-TSO [15] 100 Sol-gel PEG [16]
2,4-dichlorophenol
3700 Polyaniline [17]
161 Sol-gel CN-PDMS Chapter 3 * 23.3 Sol-gel PEG Chapter 4 220 Sol-gel dendrimer [1] 81 Sol-gel polyTHF [2]
1300 Polyaniline [17] 50 Sol-gel B15C5/OH-TSO [15]
2,4,6-trichlorophenol
100 Sol-gel PEG [16]
56.9 Sol-gel CN-PDMS Chapter 3 * 260 Sol-gel dendrimer [1]
4-chloro-3-methyl phenol
30 Sol-gel polyTHF [2]
39.1 Sol-gel CN-PDMS Chapter 3 * 18 Sol-gel polyTHF [2] 690 Polyaniline [17] 5000 Polyacrylate [11]
Phenols
Pentachloro phenol
20000 CW-PDVB [11] * S. Kulkarni, L. Fang, K. Alhooshani, A. Malik, J. Chromatogr. A 1124 (2006) 205.
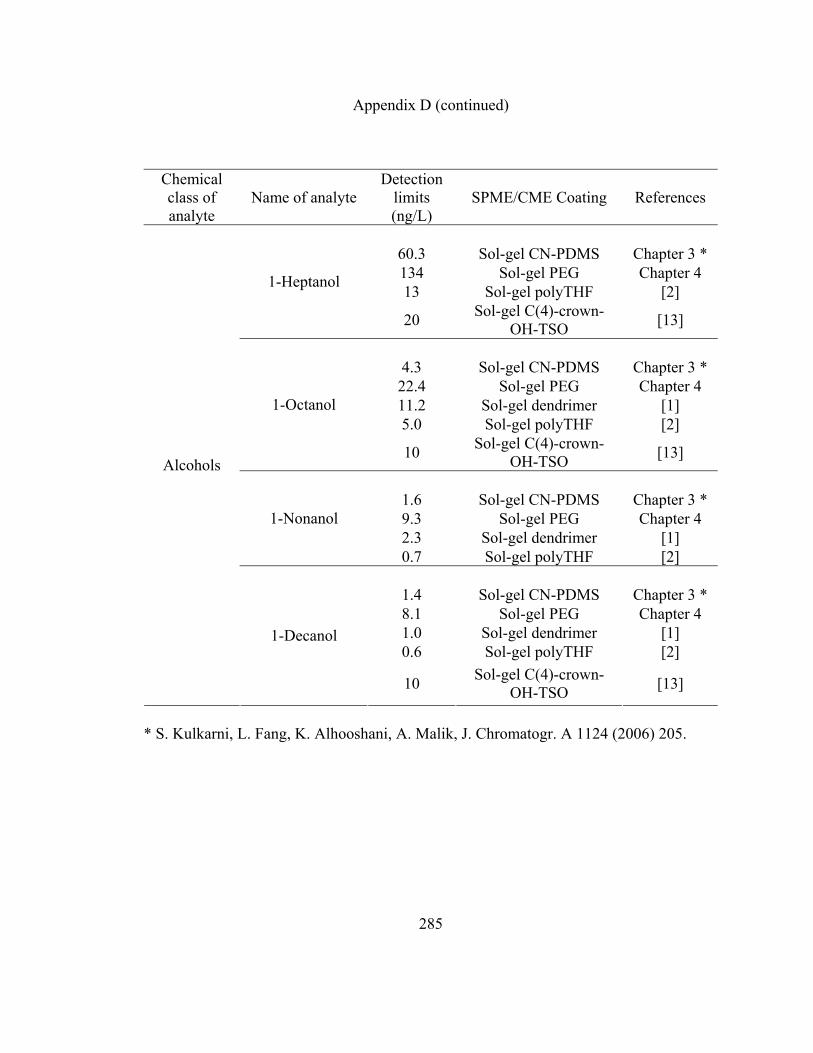
285
Appendix D (continued)
Chemical class of analyte
Name of analyte Detection
limits (ng/L)
SPME/CME Coating References
60.3 Sol-gel CN-PDMS Chapter 3 * 134 Sol-gel PEG Chapter 4 13 Sol-gel polyTHF [2] 1-Heptanol
20 Sol-gel C(4)-crown-OH-TSO [13]
4.3 Sol-gel CN-PDMS Chapter 3 * 22.4 Sol-gel PEG Chapter 4 11.2 Sol-gel dendrimer [1] 5.0 Sol-gel polyTHF [2]
1-Octanol
10 Sol-gel C(4)-crown-OH-TSO [13]
1.6 Sol-gel CN-PDMS Chapter 3 * 9.3 Sol-gel PEG Chapter 4 2.3 Sol-gel dendrimer [1]
1-Nonanol
0.7 Sol-gel polyTHF [2]
1.4 Sol-gel CN-PDMS Chapter 3 * 8.1 Sol-gel PEG Chapter 4 1.0 Sol-gel dendrimer [1] 0.6 Sol-gel polyTHF [2]
Alcohols
1-Decanol
10 Sol-gel C(4)-crown-OH-TSO [13]
* S. Kulkarni, L. Fang, K. Alhooshani, A. Malik, J. Chromatogr. A 1124 (2006) 205.
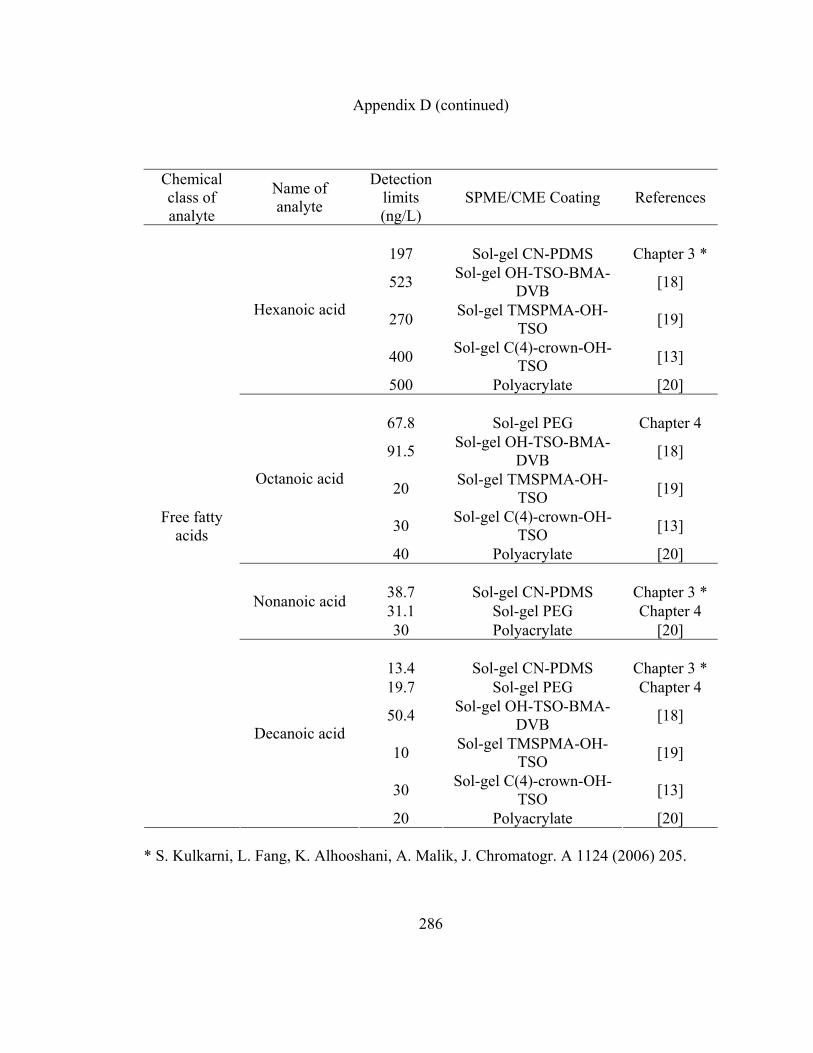
286
Appendix D (continued)
Chemical class of analyte
Name of analyte
Detection limits (ng/L)
SPME/CME Coating References
197 Sol-gel CN-PDMS Chapter 3 *
523 Sol-gel OH-TSO-BMA-DVB [18]
270 Sol-gel TMSPMA-OH-TSO [19]
400 Sol-gel C(4)-crown-OH-TSO [13]
Hexanoic acid
500 Polyacrylate [20]
67.8 Sol-gel PEG Chapter 4
91.5 Sol-gel OH-TSO-BMA-DVB [18]
20 Sol-gel TMSPMA-OH-TSO [19]
30 Sol-gel C(4)-crown-OH-TSO [13]
Octanoic acid
40 Polyacrylate [20]
38.7 Sol-gel CN-PDMS Chapter 3 * 31.1 Sol-gel PEG Chapter 4 Nonanoic acid
30 Polyacrylate [20]
13.4 Sol-gel CN-PDMS Chapter 3 * 19.7 Sol-gel PEG Chapter 4
50.4 Sol-gel OH-TSO-BMA-DVB [18]
10 Sol-gel TMSPMA-OH-TSO [19]
30 Sol-gel C(4)-crown-OH-TSO [13]
Free fatty acids
Decanoic acid
20 Polyacrylate [20] * S. Kulkarni, L. Fang, K. Alhooshani, A. Malik, J. Chromatogr. A 1124 (2006) 205.
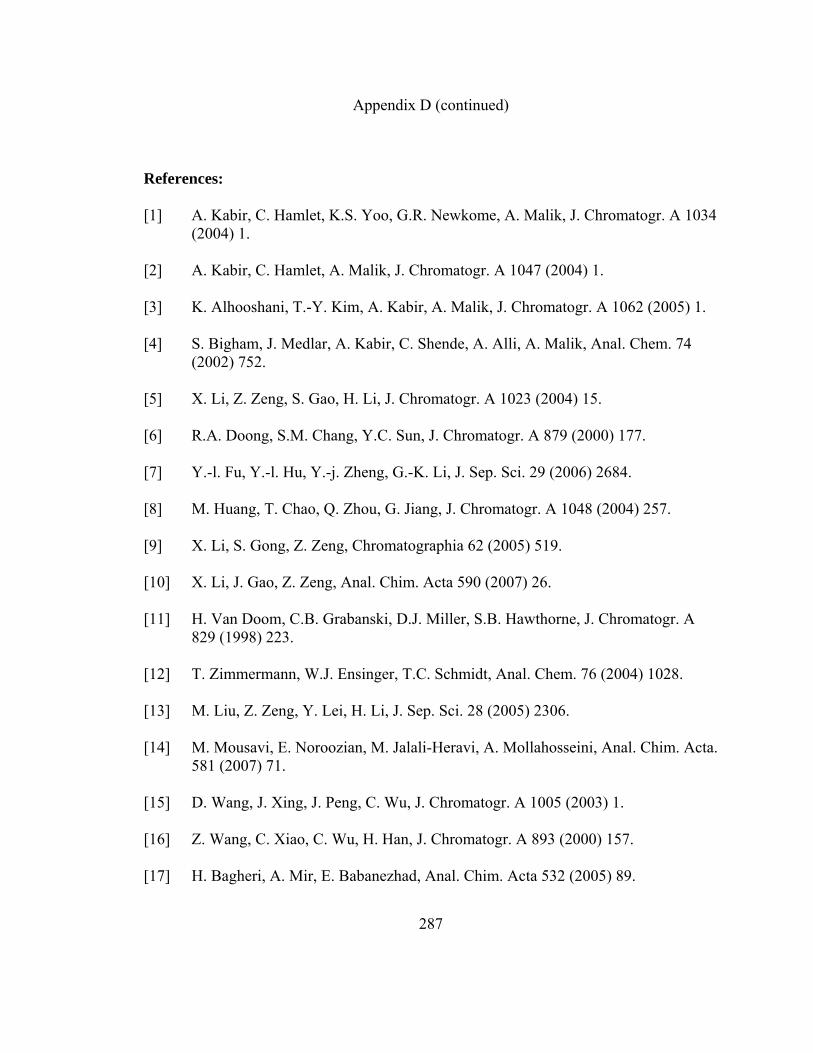
287
Appendix D (continued)
References:
[1] A. Kabir, C. Hamlet, K.S. Yoo, G.R. Newkome, A. Malik, J. Chromatogr. A 1034 (2004) 1.
[2] A. Kabir, C. Hamlet, A. Malik, J. Chromatogr. A 1047 (2004) 1.
[3] K. Alhooshani, T.-Y. Kim, A. Kabir, A. Malik, J. Chromatogr. A 1062 (2005) 1.
[4] S. Bigham, J. Medlar, A. Kabir, C. Shende, A. Alli, A. Malik, Anal. Chem. 74 (2002) 752.
[5] X. Li, Z. Zeng, S. Gao, H. Li, J. Chromatogr. A 1023 (2004) 15.
[6] R.A. Doong, S.M. Chang, Y.C. Sun, J. Chromatogr. A 879 (2000) 177.
[7] Y.-l. Fu, Y.-l. Hu, Y.-j. Zheng, G.-K. Li, J. Sep. Sci. 29 (2006) 2684.
[8] M. Huang, T. Chao, Q. Zhou, G. Jiang, J. Chromatogr. A 1048 (2004) 257.
[9] X. Li, S. Gong, Z. Zeng, Chromatographia 62 (2005) 519.
[10] X. Li, J. Gao, Z. Zeng, Anal. Chim. Acta 590 (2007) 26.
[11] H. Van Doom, C.B. Grabanski, D.J. Miller, S.B. Hawthorne, J. Chromatogr. A 829 (1998) 223.
[12] T. Zimmermann, W.J. Ensinger, T.C. Schmidt, Anal. Chem. 76 (2004) 1028.
[13] M. Liu, Z. Zeng, Y. Lei, H. Li, J. Sep. Sci. 28 (2005) 2306.
[14] M. Mousavi, E. Noroozian, M. Jalali-Heravi, A. Mollahosseini, Anal. Chim. Acta. 581 (2007) 71.
[15] D. Wang, J. Xing, J. Peng, C. Wu, J. Chromatogr. A 1005 (2003) 1.
[16] Z. Wang, C. Xiao, C. Wu, H. Han, J. Chromatogr. A 893 (2000) 157.
[17] H. Bagheri, A. Mir, E. Babanezhad, Anal. Chim. Acta 532 (2005) 89.

288
[18] M. Liu, Z. Zeng, Y. Tian, Anal. Chim. Acta 540 (2005) 341.
[19] M. Liu, Z. Zeng, B. Xiong, J. Chromatogr. A 1065 (2005) 287.
[20] L. Pan, M. Adams, J. Pawliszyn, Anal. Chem. 67 (1995) 4396.
ABOUT THE AUTHOR
Sameer M. Kulkarni was born in Mumbai (Bombay), India. He received a
Bachelor of Science degree in Chemistry from University of Mumbai in 1999. He
continued his studies at the same University and received Master of Science degree in
Inorganic Chemistry in 2001. Later, he came to United States and joined the Department
of Chemistry, Eastern Michigan University, as a Master’s student. However, later, he
decided to transfer to University of South Florida to pursue a Doctorate Degree in
Analytical Chemistry. He joined Dr. Abdul Malik’s research group in 2002 and worked
on developing polar sol-gel coatings for capillary microextraction. He has 1 publication
and 2 manuscripts submitted to international journals.


![( E )-2-Cyano-3-[4-(dimethylamino)phenyl]- N -phenylprop-2-enamide](https://img.pdfslide.net/doc/110x75/635276ec30053fbe620bf8fa/-e-2-cyano-3-4-dimethylaminophenyl-n-phenylprop-2-enamide.jpg)


