Embed Size (px)
Citation preview
Solar photovoltaic electrification andrural energy-poverty in Ghana
George Y. ObengTechnology Consultancy Centre, Kwame Nkrumah University of Science and Technology (KNUST), Kumasi, Ghana
E-mail: [email protected]
Hans-Dieter EversCenter for Development Research, University of Bonn, Germany
F.O. Akuffo and I. BraimahMechanical Engineering Department, Kwame Nkrumah University of Science and Technology (KNUST)
Kumasi, Ghana
A. Brew-HammondDepartment of Planning, Kwame Nkrumah University of Science and Technology (KNUST), Kumasi, Ghana
The relationship between solar photovoltaic (PV) rural electrification and energy-poverty was as-sessed using social, economic and environmental indicator-based questionnaires in 96 solar-elec-trified and 113 non-electrified households in rural Ghana. The purpose was to assess theenergy-poverty status of households with and without solar PV systems, and to determine the factorsthat explain energy-poverty in off-grid rural households. Principal component analysis (PCA) wasused to construct energy-poverty index scores (EPISs). On the basis of the results of the EPISs,about 80 % of the non-electrified households were assessed as relatively energy-poor compared withonly 10 % of the solar-electrified households. Three significant indicators increased linearly withincreasing energy-poverty index score (EPIS) and therefore explained the variation in EPIS. Theyare monthly savings on lighting (r2 = 0.214), number of children who can sit around lighting (r2
= 0.388) and amount paid to obtain lighting/electricity system (r2 = 0.261). On the contrary, EPISdecreased linearly with increasing monthly costs of kerosene, candles and dry-cell batteries. Thisindicates that increasing expenditure on kerosene, candles and dry-cell batteries is likely to affecthousehold savings and investment in quality energy delivery systems that can increase EPIS. Toimprove EPIS, households should invest a bit more in reliable and quality energy delivery systems,which can help to improve their quality of life. The use of EPISs successfully demonstrated thedifference in energy-poverty status between households with and without solar PV. This lays downa basis of understanding the relationship between solar PV rural electrification and energy-povertyimprovement in off-grid communities.
1. IntroductionThe vision of Ghana is to attain a middle-level incomestatus, with average economic growth rate of about 8 %in 2006-2015 and per capita income of about US$ 1000by 2015. To achieve these targets access to modern energyservices, especially electricity, is very essential. However,over two decades, the electricity sector of the country hasexperienced inadequate supply of power as a result of lowinflows into the reservoirs of the Akosombo hydroelectricdam and inadequate alternative generation capacity [EC,2004]. Though government policy is to achieve universalaccess to electricity by the year 2020, the grid access levelremains very low in the rural areas. Out of the 3.701 mil-lion households in Ghana, only 24.9 % of the rural house-holds have access to grid electricity compared to 81 %of the urban households [GSS, 2002; 2003]. The conse-
quence is that nearly 83 % of rural households in 2000,and 75 % in 2003, depended on kerosene lanterns as theirmain source of lighting [GSS, 2005a].
An important step in the country’s electrification proc-ess is the integration of solar photovoltaic (PV) systemsinto the rural electrification programme to widen electric-ity access to rural households for poverty reduction[World Bank, 2003]. Solar PV systems are considered be-cause they are a viable complement to grid-based energyservice delivery and within rural electrification they canfind a cost-effective niche and sustainable market[Cabraal et al., 1996; Wijayatunga and Attalage, 2005].Nevertheless, one of the challenges facing energy policy-makers, planners, practitioners and academics is the lackof feedback and evaluation on how existing solar PV ruralelectrification projects are contributing to alleviate en-
Energy for Sustainable Development • Volume XII No. 1 • March 2008
Articles
19
ergy-poverty. This paper uses social, economic and envi-ronmental indicators to examine the relative energy-pov-erty status of rural households with and without solar PV.
The purpose of our study is to assess the energy-povertystatus of households with and without solar PV, and todetermine the factors that explain energy-poverty in off-grid rural households. In this paper, energy-poverty is de-fined as the absence of basic energy services such aslighting and motive power provided by electricity to sup-port socio-economic development [Reddy, 2000]. We usedthis definition in our study to identify particular groupswithin the surveyed households that can be classified as“energy-poor” households. By classifying households intoenergy-poverty groups, poor households can be identifiedto improve prospects for future project design.
2. Study areas and research methods2.1. The study areasThe main survey was carried out in 17 rural communities
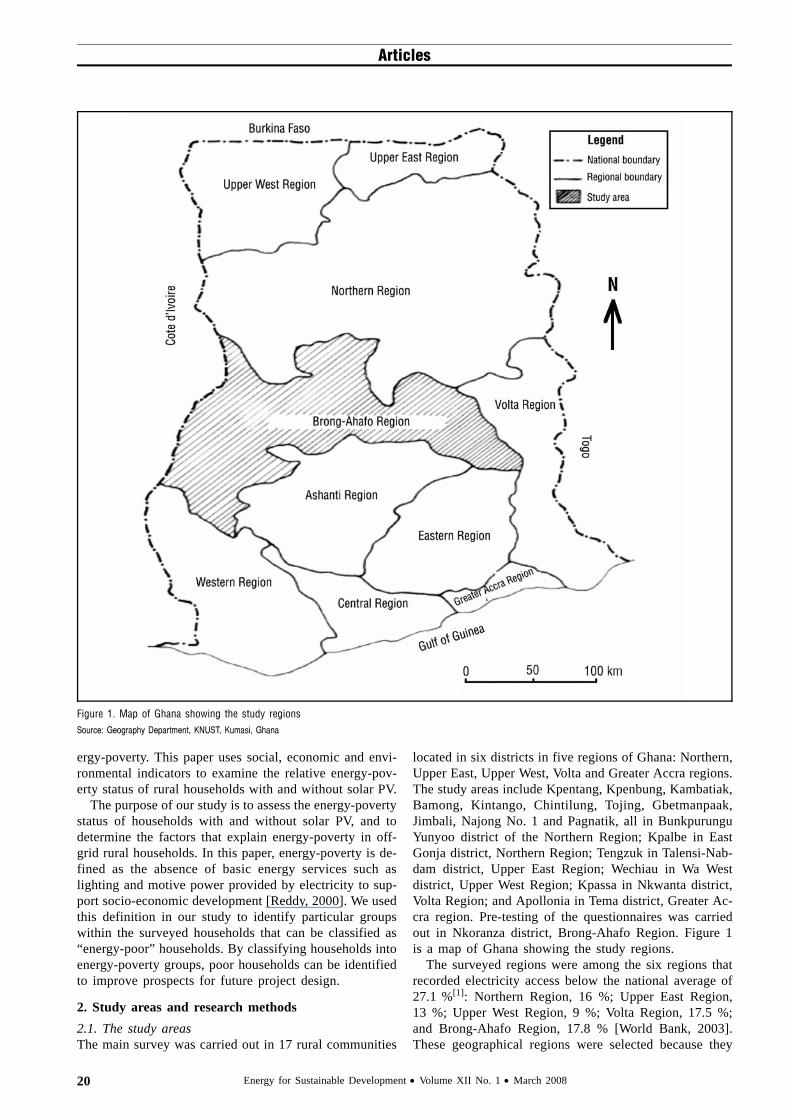
located in six districts in five regions of Ghana: Northern,Upper East, Upper West, Volta and Greater Accra regions.The study areas include Kpentang, Kpenbung, Kambatiak,Bamong, Kintango, Chintilung, Tojing, Gbetmanpaak,Jimbali, Najong No. 1 and Pagnatik, all in BunkpurunguYunyoo district of the Northern Region; Kpalbe in EastGonja district, Northern Region; Tengzuk in Talensi-Nab-dam district, Upper East Region; Wechiau in Wa Westdistrict, Upper West Region; Kpassa in Nkwanta district,Volta Region; and Apollonia in Tema district, Greater Ac-cra region. Pre-testing of the questionnaires was carriedout in Nkoranza district, Brong-Ahafo Region. Figure 1is a map of Ghana showing the study regions.
The surveyed regions were among the six regions thatrecorded electricity access below the national average of27.1 %[1]: Northern Region, 16 %; Upper East Region,13 %; Upper West Region, 9 %; Volta Region, 17.5 %;and Brong-Ahafo Region, 17.8 % [World Bank, 2003].These geographical regions were selected because they
Figure 1. Map of Ghana showing the study regionsSource: Geography Department, KNUST, Kumasi, Ghana
Energy for Sustainable Development • Volume XII No. 1 • March 2008
Articles
20
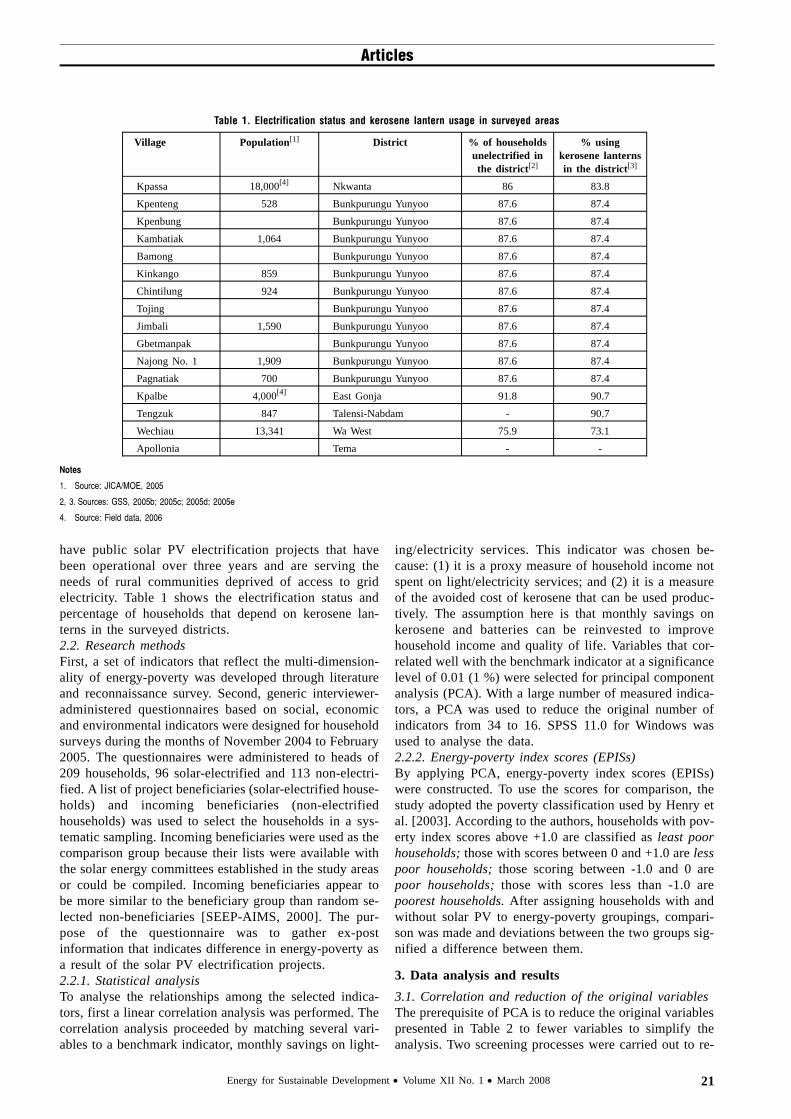
have public solar PV electrification projects that havebeen operational over three years and are serving theneeds of rural communities deprived of access to gridelectricity. Table 1 shows the electrification status andpercentage of households that depend on kerosene lan-terns in the surveyed districts.2.2. Research methodsFirst, a set of indicators that reflect the multi-dimension-ality of energy-poverty was developed through literatureand reconnaissance survey. Second, generic interviewer-administered questionnaires based on social, economicand environmental indicators were designed for householdsurveys during the months of November 2004 to February2005. The questionnaires were administered to heads of209 households, 96 solar-electrified and 113 non-electri-fied. A list of project beneficiaries (solar-electrified house-holds) and incoming beneficiaries (non-electrifiedhouseholds) was used to select the households in a sys-tematic sampling. Incoming beneficiaries were used as thecomparison group because their lists were available withthe solar energy committees established in the study areasor could be compiled. Incoming beneficiaries appear tobe more similar to the beneficiary group than random se-lected non-beneficiaries [SEEP-AIMS, 2000]. The pur-pose of the questionnaire was to gather ex-postinformation that indicates difference in energy-poverty asa result of the solar PV electrification projects.2.2.1. Statistical analysisTo analyse the relationships among the selected indica-tors, first a linear correlation analysis was performed. Thecorrelation analysis proceeded by matching several vari-ables to a benchmark indicator, monthly savings on light-
ing/electricity services. This indicator was chosen be-cause: (1) it is a proxy measure of household income notspent on light/electricity services; and (2) it is a measureof the avoided cost of kerosene that can be used produc-tively. The assumption here is that monthly savings onkerosene and batteries can be reinvested to improvehousehold income and quality of life. Variables that cor-related well with the benchmark indicator at a significancelevel of 0.01 (1 %) were selected for principal componentanalysis (PCA). With a large number of measured indica-tors, a PCA was used to reduce the original number ofindicators from 34 to 16. SPSS 11.0 for Windows wasused to analyse the data.2.2.2. Energy-poverty index scores (EPISs)By applying PCA, energy-poverty index scores (EPISs)were constructed. To use the scores for comparison, thestudy adopted the poverty classification used by Henry etal. [2003]. According to the authors, households with pov-erty index scores above +1.0 are classified as least poorhouseholds; those with scores between 0 and +1.0 are lesspoor households; those scoring between -1.0 and 0 arepoor households; those with scores less than -1.0 arepoorest households. After assigning households with andwithout solar PV to energy-poverty groupings, compari-son was made and deviations between the two groups sig-nified a difference between them.
3. Data analysis and results3.1. Correlation and reduction of the original variablesThe prerequisite of PCA is to reduce the original variablespresented in Table 2 to fewer variables to simplify theanalysis. Two screening processes were carried out to re-
Table 1. Electrification status and kerosene lantern usage in surveyed areas
Village Population[1] District % of householdsunelectrified inthe district[2]
% usingkerosene lanternsin the district[3]
Kpassa 18,000[4] Nkwanta 86 83.8
Kpenteng 528 Bunkpurungu Yunyoo 87.6 87.4
Kpenbung Bunkpurungu Yunyoo 87.6 87.4
Kambatiak 1,064 Bunkpurungu Yunyoo 87.6 87.4
Bamong Bunkpurungu Yunyoo 87.6 87.4
Kinkango 859 Bunkpurungu Yunyoo 87.6 87.4
Chintilung 924 Bunkpurungu Yunyoo 87.6 87.4
Tojing Bunkpurungu Yunyoo 87.6 87.4
Jimbali 1,590 Bunkpurungu Yunyoo 87.6 87.4
Gbetmanpak Bunkpurungu Yunyoo 87.6 87.4
Najong No. 1 1,909 Bunkpurungu Yunyoo 87.6 87.4
Pagnatiak 700 Bunkpurungu Yunyoo 87.6 87.4
Kpalbe 4,000[4] East Gonja 91.8 90.7
Tengzuk 847 Talensi-Nabdam - 90.7
Wechiau 13,341 Wa West 75.9 73.1
Apollonia Tema - -
Notes
1. Source: JICA/MOE, 2005
2, 3. Sources: GSS, 2005b; 2005c; 2005d; 2005e
4. Source: Field data, 2006
Energy for Sustainable Development • Volume XII No. 1 • March 2008
Articles
21
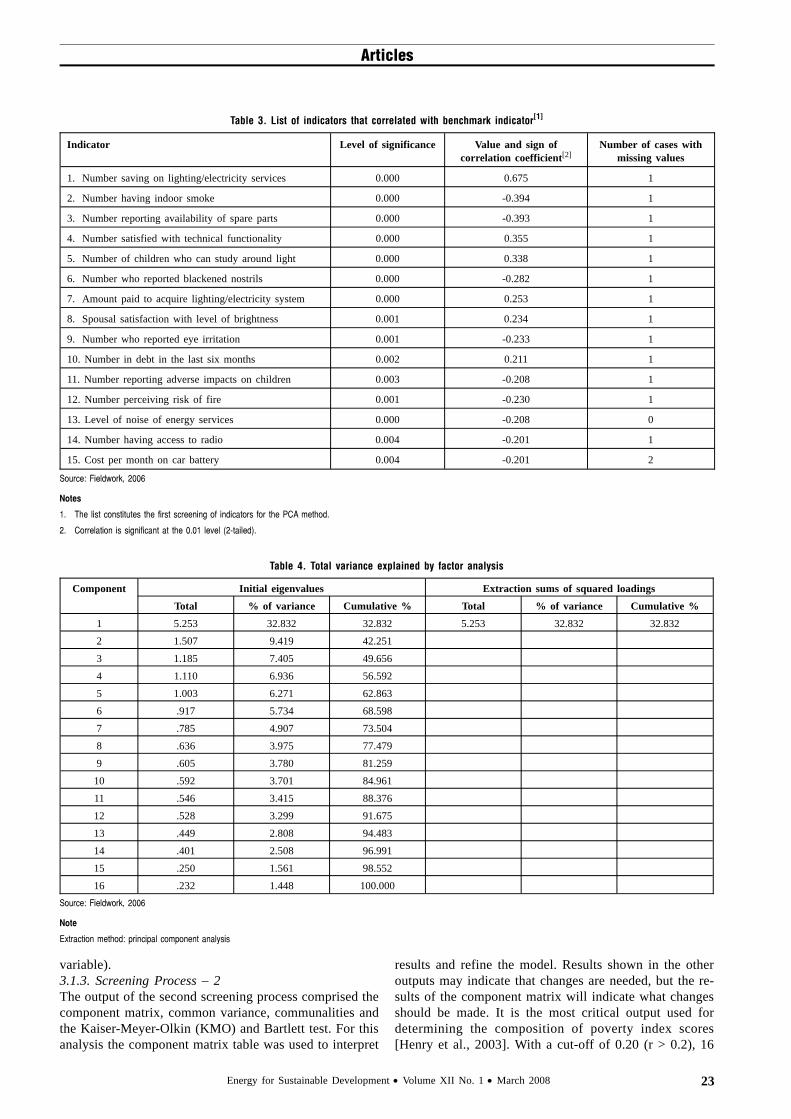
duce the number of indicator variables used for construct-ing the household energy-poverty index score (EPIS). Theapproach requires trial and error and continual scrutiny ofvariables to determine which combination yields the mostlogical results [Henry et al., 2003].3.1.1. Screening process – 1First the indicators presented in Table 2 were screened.After screening, 15 variables significantly correlated withthe benchmark indicator – monthly estimated savings onlighting/electricity services – as presented in Table 3. Ofall the correlations, the level of significance between eachindicator and the benchmark indicator was less than 0.01(p < 0.01), indicating strong association.3.1.2. Eigenvalue and the scree test
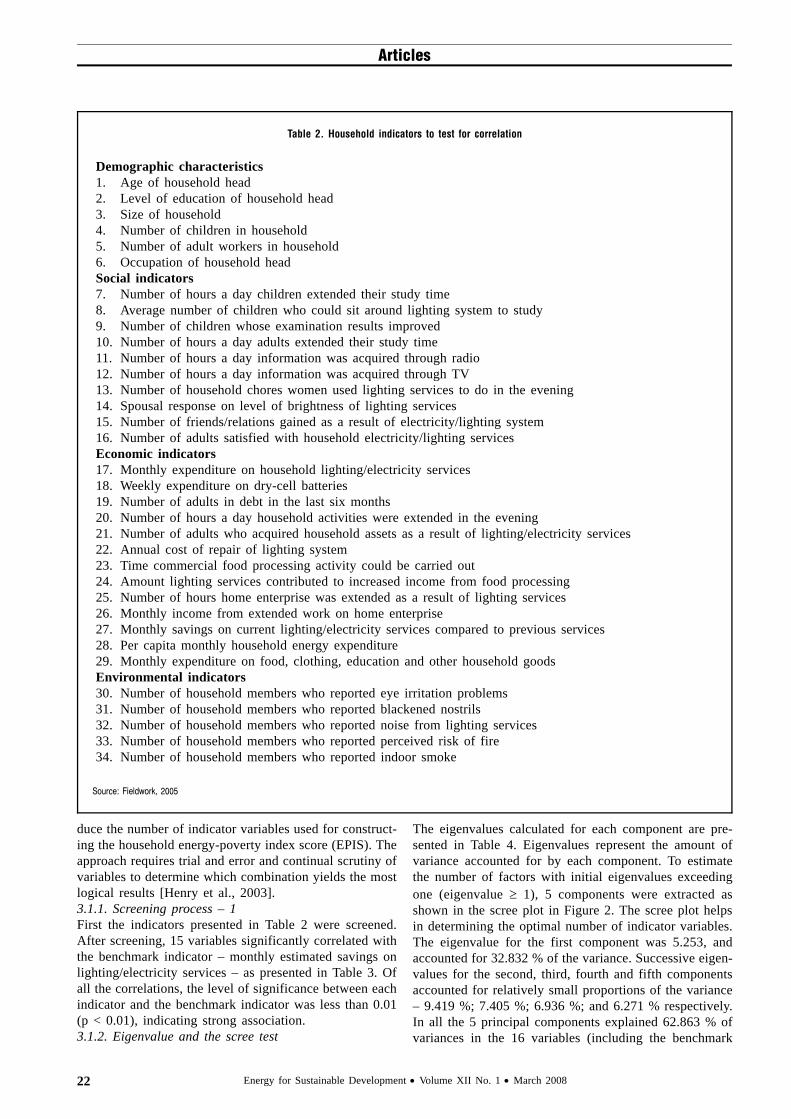
The eigenvalues calculated for each component are pre-sented in Table 4. Eigenvalues represent the amount ofvariance accounted for by each component. To estimatethe number of factors with initial eigenvalues exceedingone (eigenvalue ≥ 1), 5 components were extracted asshown in the scree plot in Figure 2. The scree plot helpsin determining the optimal number of indicator variables.The eigenvalue for the first component was 5.253, andaccounted for 32.832 % of the variance. Successive eigen-values for the second, third, fourth and fifth componentsaccounted for relatively small proportions of the variance– 9.419 %; 7.405 %; 6.936 %; and 6.271 % respectively.In all the 5 principal components explained 62.863 % ofvariances in the 16 variables (including the benchmark
Table 2. Household indicators to test for correlation
Demographic characteristics1. Age of household head2. Level of education of household head3. Size of household4. Number of children in household5. Number of adult workers in household6. Occupation of household headSocial indicators7. Number of hours a day children extended their study time8. Average number of children who could sit around lighting system to study9. Number of children whose examination results improved10. Number of hours a day adults extended their study time11. Number of hours a day information was acquired through radio12. Number of hours a day information was acquired through TV13. Number of household chores women used lighting services to do in the evening14. Spousal response on level of brightness of lighting services15. Number of friends/relations gained as a result of electricity/lighting system16. Number of adults satisfied with household electricity/lighting servicesEconomic indicators17. Monthly expenditure on household lighting/electricity services18. Weekly expenditure on dry-cell batteries19. Number of adults in debt in the last six months20. Number of hours a day household activities were extended in the evening21. Number of adults who acquired household assets as a result of lighting/electricity services22. Annual cost of repair of lighting system23. Time commercial food processing activity could be carried out24. Amount lighting services contributed to increased income from food processing25. Number of hours home enterprise was extended as a result of lighting services26. Monthly income from extended work on home enterprise27. Monthly savings on current lighting/electricity services compared to previous services28. Per capita monthly household energy expenditure29. Monthly expenditure on food, clothing, education and other household goodsEnvironmental indicators30. Number of household members who reported eye irritation problems31. Number of household members who reported blackened nostrils32. Number of household members who reported noise from lighting services33. Number of household members who reported perceived risk of fire34. Number of household members who reported indoor smoke
Source: Fieldwork, 2005
Energy for Sustainable Development • Volume XII No. 1 • March 2008
Articles
22
variable).3.1.3. Screening Process – 2The output of the second screening process comprised thecomponent matrix, common variance, communalities andthe Kaiser-Meyer-Olkin (KMO) and Bartlett test. For thisanalysis the component matrix table was used to interpret
results and refine the model. Results shown in the otheroutputs may indicate that changes are needed, but the re-sults of the component matrix will indicate what changesshould be made. It is the most critical output used fordetermining the composition of poverty index scores[Henry et al., 2003]. With a cut-off of 0.20 (r > 0.2), 16
Table 3. List of indicators that correlated with benchmark indicator[1]
Indicator Level of significance Value and sign ofcorrelation coefficient[2]
Number of cases withmissing values
1. Number saving on lighting/electricity services 0.000 0.675 1
2. Number having indoor smoke 0.000 -0.394 1
3. Number reporting availability of spare parts 0.000 -0.393 1
4. Number satisfied with technical functionality 0.000 0.355 1
5. Number of children who can study around light 0.000 0.338 1
6. Number who reported blackened nostrils 0.000 -0.282 1
7. Amount paid to acquire lighting/electricity system 0.000 0.253 1
8. Spousal satisfaction with level of brightness 0.001 0.234 1
9. Number who reported eye irritation 0.001 -0.233 1
10. Number in debt in the last six months 0.002 0.211 1
11. Number reporting adverse impacts on children 0.003 -0.208 1
12. Number perceiving risk of fire 0.001 -0.230 1
13. Level of noise of energy services 0.000 -0.208 0
14. Number having access to radio 0.004 -0.201 1
15. Cost per month on car battery 0.004 -0.201 2
Source: Fieldwork, 2006
Notes
1. The list constitutes the first screening of indicators for the PCA method.
2. Correlation is significant at the 0.01 level (2-tailed).
Table 4. Total variance explained by factor analysis
Component Initial eigenvalues Extraction sums of squared loadings
Total % of variance Cumulative % Total % of variance Cumulative %
1 5.253 32.832 32.832 5.253 32.832 32.832
2 1.507 9.419 42.251
3 1.185 7.405 49.656
4 1.110 6.936 56.592
5 1.003 6.271 62.863
6 .917 5.734 68.598
7 .785 4.907 73.504
8 .636 3.975 77.479
9 .605 3.780 81.259
10 .592 3.701 84.961
11 .546 3.415 88.376
12 .528 3.299 91.675
13 .449 2.808 94.483
14 .401 2.508 96.991
15 .250 1.561 98.552
16 .232 1.448 100.000Source: Fieldwork, 2006
Note
Extraction method: principal component analysis
Energy for Sustainable Development • Volume XII No. 1 • March 2008
Articles
23
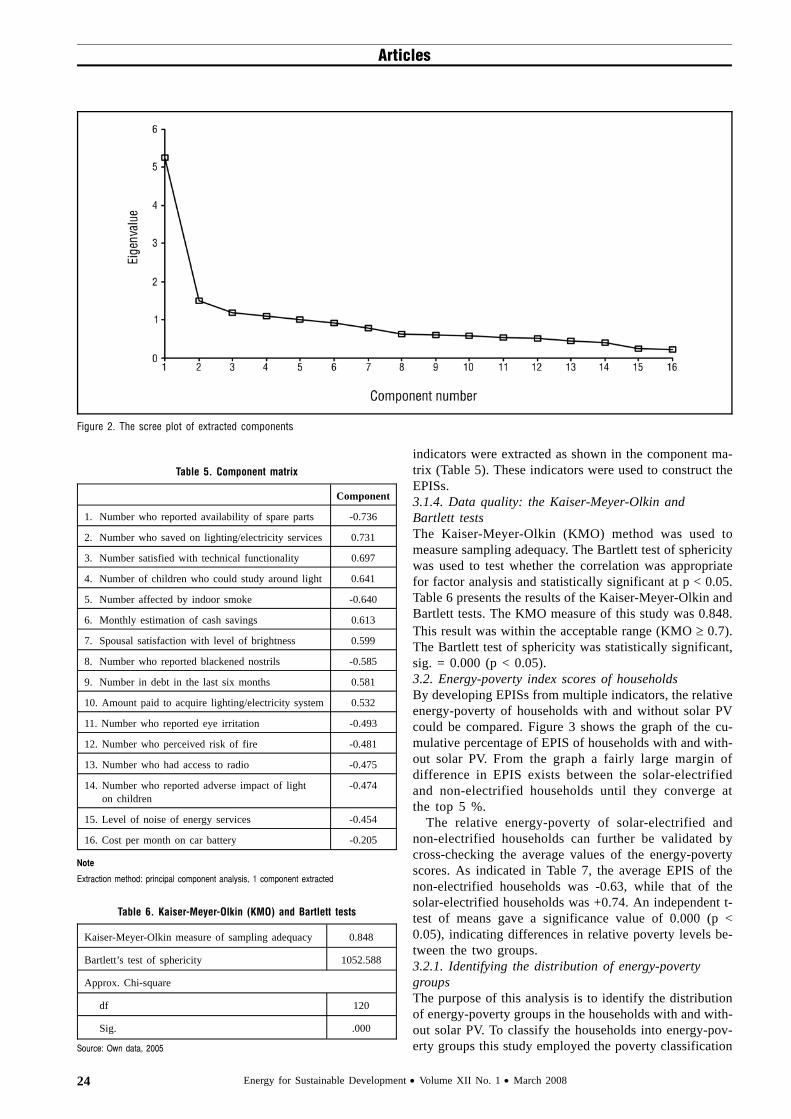
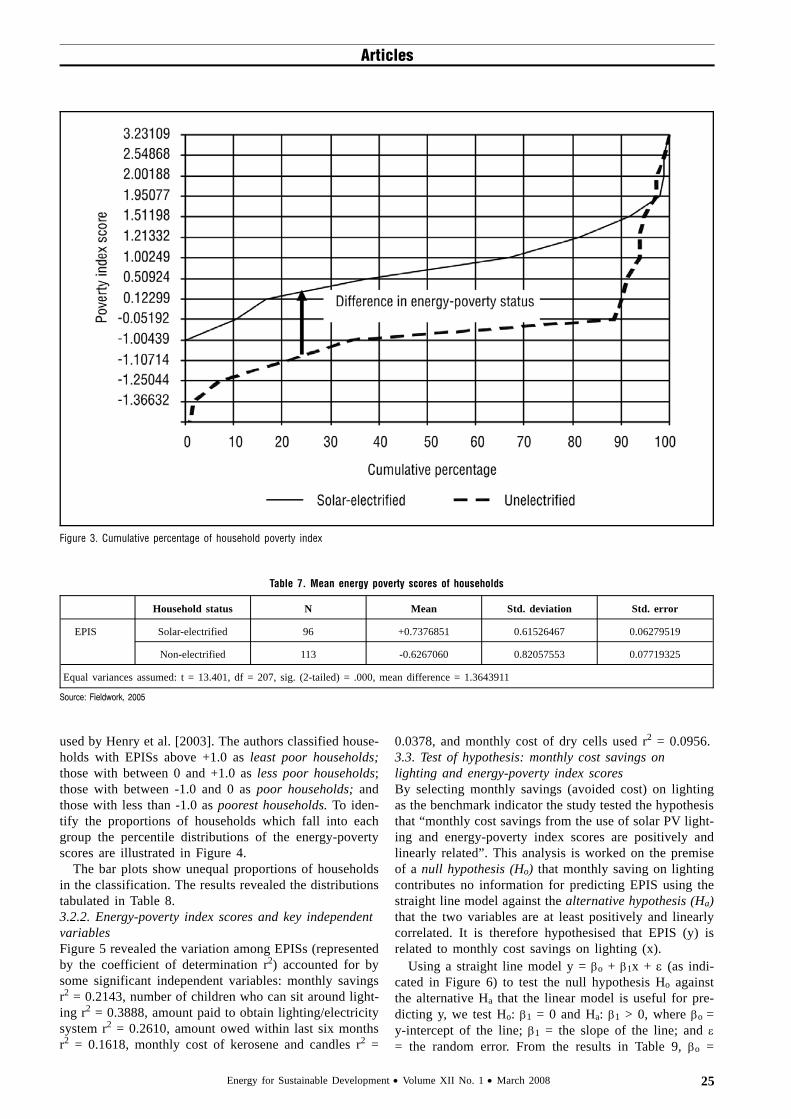
indicators were extracted as shown in the component ma-trix (Table 5). These indicators were used to construct theEPISs.3.1.4. Data quality: the Kaiser-Meyer-Olkin andBartlett testsThe Kaiser-Meyer-Olkin (KMO) method was used tomeasure sampling adequacy. The Bartlett test of sphericitywas used to test whether the correlation was appropriatefor factor analysis and statistically significant at p < 0.05.Table 6 presents the results of the Kaiser-Meyer-Olkin andBartlett tests. The KMO measure of this study was 0.848.This result was within the acceptable range (KMO ≥ 0.7).The Bartlett test of sphericity was statistically significant,sig. = 0.000 (p < 0.05).3.2. Energy-poverty index scores of householdsBy developing EPISs from multiple indicators, the relativeenergy-poverty of households with and without solar PVcould be compared. Figure 3 shows the graph of the cu-mulative percentage of EPIS of households with and with-out solar PV. From the graph a fairly large margin ofdifference in EPIS exists between the solar-electrifiedand non-electrified households until they converge atthe top 5 %.
The relative energy-poverty of solar-electrified andnon-electrified households can further be validated bycross-checking the average values of the energy-povertyscores. As indicated in Table 7, the average EPIS of thenon-electrified households was -0.63, while that of thesolar-electrified households was +0.74. An independent t-test of means gave a significance value of 0.000 (p <0.05), indicating differences in relative poverty levels be-tween the two groups.3.2.1. Identifying the distribution of energy-povertygroupsThe purpose of this analysis is to identify the distributionof energy-poverty groups in the households with and with-out solar PV. To classify the households into energy-pov-erty groups this study employed the poverty classification
Table 5. Component matrix
Component
1. Number who reported availability of spare parts -0.736
2. Number who saved on lighting/electricity services 0.731
3. Number satisfied with technical functionality 0.697
4. Number of children who could study around light 0.641
5. Number affected by indoor smoke -0.640
6. Monthly estimation of cash savings 0.613
7. Spousal satisfaction with level of brightness 0.599
8. Number who reported blackened nostrils -0.585
9. Number in debt in the last six months 0.581
10. Amount paid to acquire lighting/electricity system 0.532
11. Number who reported eye irritation -0.493
12. Number who perceived risk of fire -0.481
13. Number who had access to radio -0.475
14. Number who reported adverse impact of light on children
-0.474
15. Level of noise of energy services -0.454
16. Cost per month on car battery -0.205
Note
Extraction method: principal component analysis, 1 component extracted
Table 6. Kaiser-Meyer-Olkin (KMO) and Bartlett tests
Kaiser-Meyer-Olkin measure of sampling adequacy 0.848
Bartlett’s test of sphericity 1052.588
Approx. Chi-square
df 120
Sig. .000
Source: Own data, 2005
Figure 2. The scree plot of extracted components
Energy for Sustainable Development • Volume XII No. 1 • March 2008
Articles
24
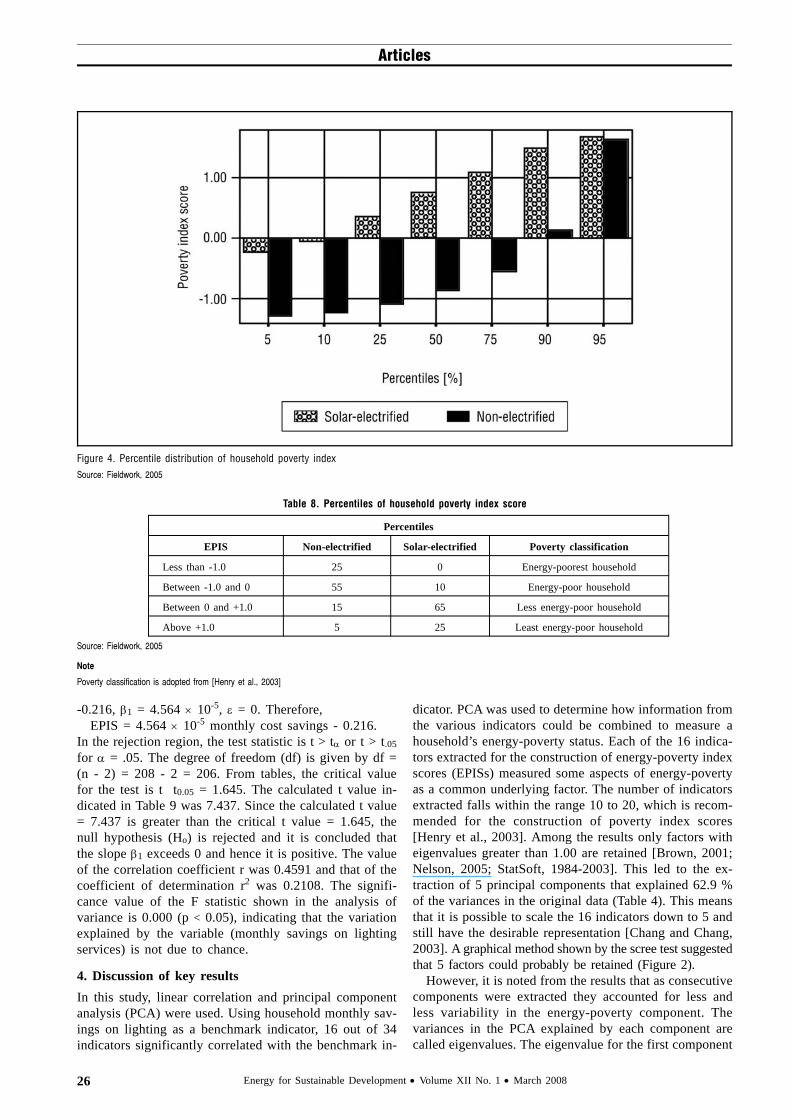
used by Henry et al. [2003]. The authors classified house-holds with EPISs above +1.0 as least poor households;those with between 0 and +1.0 as less poor households;those with between -1.0 and 0 as poor households; andthose with less than -1.0 as poorest households. To iden-tify the proportions of households which fall into eachgroup the percentile distributions of the energy-povertyscores are illustrated in Figure 4.
The bar plots show unequal proportions of householdsin the classification. The results revealed the distributionstabulated in Table 8.3.2.2. Energy-poverty index scores and key independentvariablesFigure 5 revealed the variation among EPISs (representedby the coefficient of determination r2) accounted for bysome significant independent variables: monthly savingsr2 = 0.2143, number of children who can sit around light-ing r2 = 0.3888, amount paid to obtain lighting/electricitysystem r2 = 0.2610, amount owed within last six monthsr2 = 0.1618, monthly cost of kerosene and candles r2 =
0.0378, and monthly cost of dry cells used r2 = 0.0956.3.3. Test of hypothesis: monthly cost savings onlighting and energy-poverty index scoresBy selecting monthly savings (avoided cost) on lightingas the benchmark indicator the study tested the hypothesisthat “monthly cost savings from the use of solar PV light-ing and energy-poverty index scores are positively andlinearly related”. This analysis is worked on the premiseof a null hypothesis (Ho) that monthly saving on lightingcontributes no information for predicting EPIS using thestraight line model against the alternative hypothesis (Ha)that the two variables are at least positively and linearlycorrelated. It is therefore hypothesised that EPIS (y) isrelated to monthly cost savings on lighting (x).
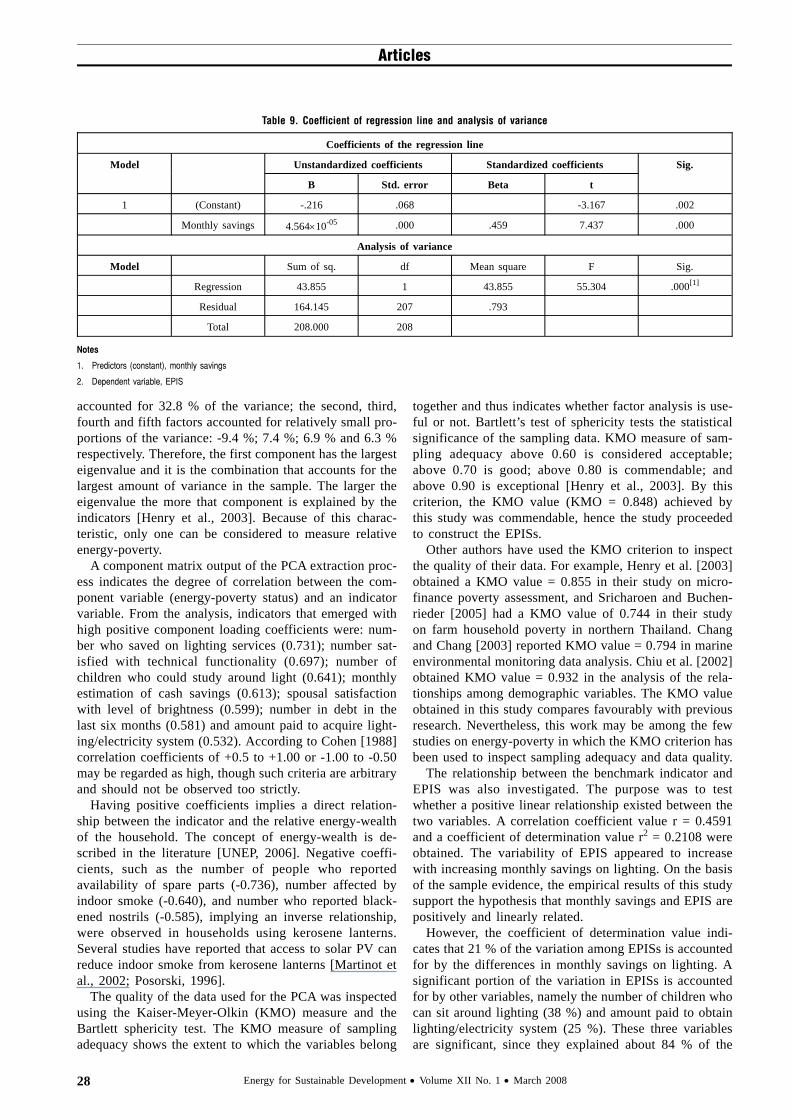
Using a straight line model y = βo + β1x + ε (as indi-cated in Figure 6) to test the null hypothesis Ho againstthe alternative Ha that the linear model is useful for pre-dicting y, we test Ho: β1 = 0 and Ha: β1 > 0, where βo =y-intercept of the line; β1 = the slope of the line; and ε= the random error. From the results in Table 9, βo =
Table 7. Mean energy poverty scores of households
Household status N Mean Std. deviation Std. error
EPIS Solar-electrified 96 +0.7376851 0.61526467 0.06279519
Non-electrified 113 -0.6267060 0.82057553 0.07719325
Equal variances assumed: t = 13.401, df = 207, sig. (2-tailed) = .000, mean difference = 1.3643911
Source: Fieldwork, 2005
Figure 3. Cumulative percentage of household poverty index
Energy for Sustainable Development • Volume XII No. 1 • March 2008
Articles
25
-0.216, β1 = 4.564 × 10⁻⁵, ε = 0. Therefore,EPIS = 4.564 × 10⁻⁵ monthly cost savings - 0.216.
In the rejection region, the test statistic is t > tα or t > t.05for α = .05. The degree of freedom (df) is given by df =(n - 2) = 208 - 2 = 206. From tables, the critical valuefor the test is t t0.05 = 1.645. The calculated t value in-dicated in Table 9 was 7.437. Since the calculated t value= 7.437 is greater than the critical t value = 1.645, thenull hypothesis (Ho) is rejected and it is concluded thatthe slope β1 exceeds 0 and hence it is positive. The valueof the correlation coefficient r was 0.4591 and that of thecoefficient of determination r2 was 0.2108. The signifi-cance value of the F statistic shown in the analysis ofvariance is 0.000 (p < 0.05), indicating that the variationexplained by the variable (monthly savings on lightingservices) is not due to chance.
4. Discussion of key resultsIn this study, linear correlation and principal componentanalysis (PCA) were used. Using household monthly sav-ings on lighting as a benchmark indicator, 16 out of 34indicators significantly correlated with the benchmark in-
dicator. PCA was used to determine how information fromthe various indicators could be combined to measure ahousehold’s energy-poverty status. Each of the 16 indica-tors extracted for the construction of energy-poverty indexscores (EPISs) measured some aspects of energy-povertyas a common underlying factor. The number of indicatorsextracted falls within the range 10 to 20, which is recom-mended for the construction of poverty index scores[Henry et al., 2003]. Among the results only factors witheigenvalues greater than 1.00 are retained [Brown, 2001;Nelson, 2005; StatSoft, 1984-2003]. This led to the ex-traction of 5 principal components that explained 62.9 %of the variances in the original data (Table 4). This meansthat it is possible to scale the 16 indicators down to 5 andstill have the desirable representation [Chang and Chang,2003]. A graphical method shown by the scree test suggestedthat 5 factors could probably be retained (Figure 2).
However, it is noted from the results that as consecutivecomponents were extracted they accounted for less andless variability in the energy-poverty component. Thevariances in the PCA explained by each component arecalled eigenvalues. The eigenvalue for the first component
Table 8. Percentiles of household poverty index score
Percentiles
EPIS Non-electrified Solar-electrified Poverty classification
Less than -1.0 25 0 Energy-poorest household
Between -1.0 and 0 55 10 Energy-poor household
Between 0 and +1.0 15 65 Less energy-poor household
Above +1.0 5 25 Least energy-poor household
Source: Fieldwork, 2005
Note
Poverty classification is adopted from [Henry et al., 2003]
Figure 4. Percentile distribution of household poverty indexSource: Fieldwork, 2005
Energy for Sustainable Development • Volume XII No. 1 • March 2008
Articles
26
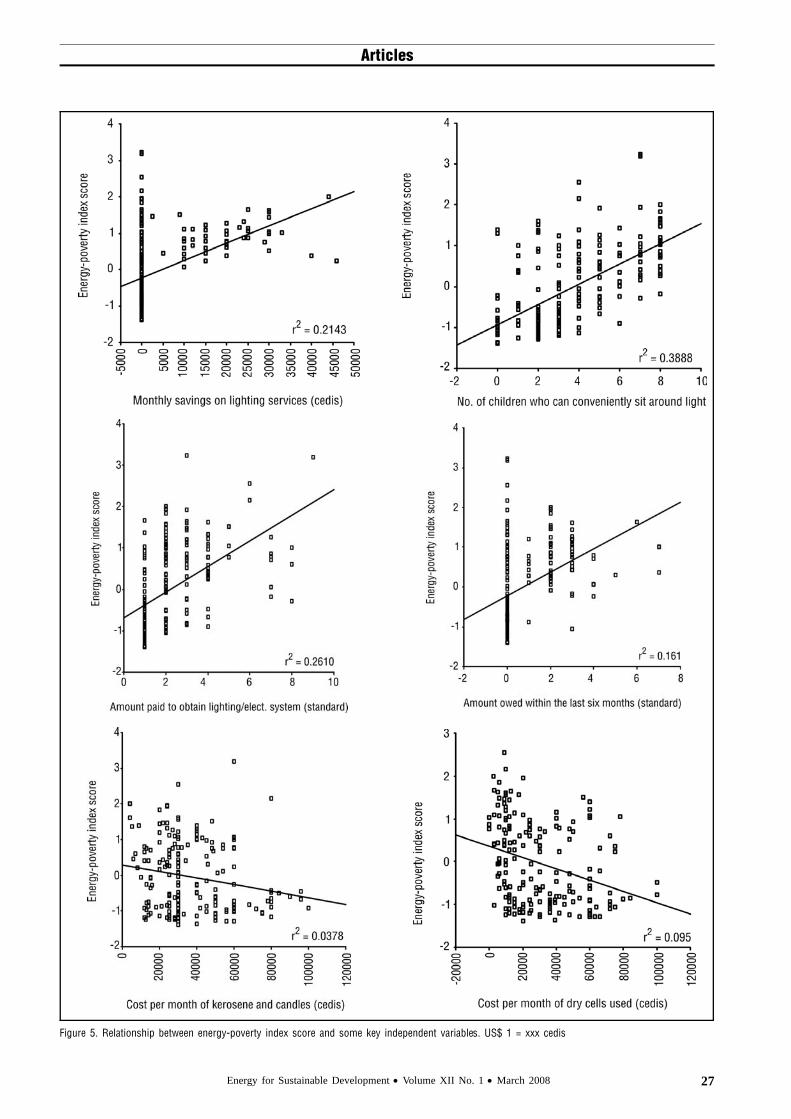
Figure 5. Relationship between energy-poverty index score and some key independent variables. US$ 1 = xxx cedis
Energy for Sustainable Development • Volume XII No. 1 • March 2008
Articles
27
accounted for 32.8 % of the variance; the second, third,fourth and fifth factors accounted for relatively small pro-portions of the variance: -9.4 %; 7.4 %; 6.9 % and 6.3 %respectively. Therefore, the first component has the largesteigenvalue and it is the combination that accounts for thelargest amount of variance in the sample. The larger theeigenvalue the more that component is explained by theindicators [Henry et al., 2003]. Because of this charac-teristic, only one can be considered to measure relativeenergy-poverty.
A component matrix output of the PCA extraction proc-ess indicates the degree of correlation between the com-ponent variable (energy-poverty status) and an indicatorvariable. From the analysis, indicators that emerged withhigh positive component loading coefficients were: num-ber who saved on lighting services (0.731); number sat-isfied with technical functionality (0.697); number ofchildren who could study around light (0.641); monthlyestimation of cash savings (0.613); spousal satisfactionwith level of brightness (0.599); number in debt in thelast six months (0.581) and amount paid to acquire light-ing/electricity system (0.532). According to Cohen [1988]correlation coefficients of +0.5 to +1.00 or -1.00 to -0.50may be regarded as high, though such criteria are arbitraryand should not be observed too strictly.
Having positive coefficients implies a direct relation-ship between the indicator and the relative energy-wealthof the household. The concept of energy-wealth is de-scribed in the literature [UNEP, 2006]. Negative coeffi-cients, such as the number of people who reportedavailability of spare parts (-0.736), number affected byindoor smoke (-0.640), and number who reported black-ened nostrils (-0.585), implying an inverse relationship,were observed in households using kerosene lanterns.Several studies have reported that access to solar PV canreduce indoor smoke from kerosene lanterns [Martinot etal., 2002; Posorski, 1996].
The quality of the data used for the PCA was inspectedusing the Kaiser-Meyer-Olkin (KMO) measure and theBartlett sphericity test. The KMO measure of samplingadequacy shows the extent to which the variables belong
together and thus indicates whether factor analysis is use-ful or not. Bartlett’s test of sphericity tests the statisticalsignificance of the sampling data. KMO measure of sam-pling adequacy above 0.60 is considered acceptable;above 0.70 is good; above 0.80 is commendable; andabove 0.90 is exceptional [Henry et al., 2003]. By thiscriterion, the KMO value (KMO = 0.848) achieved bythis study was commendable, hence the study proceededto construct the EPISs.
Other authors have used the KMO criterion to inspectthe quality of their data. For example, Henry et al. [2003]obtained a KMO value = 0.855 in their study on micro-finance poverty assessment, and Sricharoen and Buchen-rieder [2005] had a KMO value of 0.744 in their studyon farm household poverty in northern Thailand. Changand Chang [2003] reported KMO value = 0.794 in marineenvironmental monitoring data analysis. Chiu et al. [2002]obtained KMO value = 0.932 in the analysis of the rela-tionships among demographic variables. The KMO valueobtained in this study compares favourably with previousresearch. Nevertheless, this work may be among the fewstudies on energy-poverty in which the KMO criterion hasbeen used to inspect sampling adequacy and data quality.
The relationship between the benchmark indicator andEPIS was also investigated. The purpose was to testwhether a positive linear relationship existed between thetwo variables. A correlation coefficient value r = 0.4591and a coefficient of determination value r2 = 0.2108 wereobtained. The variability of EPIS appeared to increasewith increasing monthly savings on lighting. On the basisof the sample evidence, the empirical results of this studysupport the hypothesis that monthly savings and EPIS arepositively and linearly related.
However, the coefficient of determination value indi-cates that 21 % of the variation among EPISs is accountedfor by the differences in monthly savings on lighting. Asignificant portion of the variation in EPISs is accountedfor by other variables, namely the number of children whocan sit around lighting (38 %) and amount paid to obtainlighting/electricity system (25 %). These three variablesare significant, since they explained about 84 % of the
Table 9. Coefficient of regression line and analysis of variance
Coefficients of the regression line
Model Unstandardized coefficients Standardized coefficients Sig.
B Std. error Beta t
1 (Constant) -.216 .068 -3.167 .002
Monthly savings 4.564×10-05 .000 .459 7.437 .000
Analysis of variance
Model Sum of sq. df Mean square F Sig.
Regression 43.855 1 43.855 55.304 .000[1]
Residual 164.145 207 .793
Total 208.000 208
Notes
1. Predictors (constant), monthly savings
2. Dependent variable, EPIS
Energy for Sustainable Development • Volume XII No. 1 • March 2008
Articles
28
variation among EPISs. On the contrary, the findings in-dicated that monthly costs of kerosene, candles and drycells increased linearly with decreasing EPIS. The indi-cation is that high household expenditure on kerosene,candles and dry-cell batteries is likely to affect householdsavings and hence lower the household’s ability to investin reliable and quality energy delivery systems to improveits energy-poverty level.
By using PCA, the results show that in terms of EPIS,households without solar PV are assessed as poorer thanhouseholds with solar PV. The interpretation is that house-holds with solar PV whose average EPIS was relativelyhigh are likelier to have some improvements in quality oflife than households where there were inadequate energyservice delivery systems. Inadequate access to energyservices is closely linked to lack of economic and socialopportunities, contributing to poverty, poor health, re-duced educational attainment, etc. [Anderson, 2000;Allderdice and Rogers, 2000; UNDP, 2004].
Analysis of the energy-poverty groups in the house-holds with and without solar PV reveals unequal propor-tion in the energy-poverty classification. While only 10 %of the solar-electrified households fall into the energy-poor group, an overwhelming majority of about 80 % ofthe non-electrified households fall into the “energy-poor”and “energy-poorest” groups. The “energy-poor” arelikely to be households using kerosene lanterns for light-ing, and may not have access to television and in somecases radio for information and entertainment. The re-maining 20 % of the non-electrified households fall intothe “less poor” and “least poor” groups. This proportionmay be households who use generators or have access tocar batteries that enable them to watch television and insome cases light their table lamps. These findings suggestthat there exists a large proportion of rural households inthe surveyed communities that are deprived of electricityservices essential for energy-poverty reduction.
It is reported that off-grid rural households without so-lar PV mainly depend on kerosene lanterns for lighting[GSS, 2003; 2005a]. The energy-poor are those affectedby the absence of basic energy services provided by elec-tricity to support their socio-economic development. Theconcept of energy-poverty has been discussed by severalstudies [Cecelski, 2003; Reddy, 2000; UNDP/KITE,2006]. Using EPISs, this study’s finding of 80 % non-electrified households being energy-poor appears to beconsistent with the literature (see Table 1). The lack ofelectricity is mentioned as one of the characteristics ofrural poverty in Ghana [ANDA, 2004; A-ANDA, 2004].On the basis of the average EPISs, it is concluded that,overall, households without solar PV were more deprivedof electricity services than households with solar PV.
5. ConclusionIn this paper solar PV rural electrification and householdenergy-poverty status were assessed using indicators. Thestudy findings revealed that monthly savings on lighting,the number of children who can sit around lighting andamount paid to obtain lighting/electricity system are the
factors that significantly explained the variation in EPISs.On the contrary, increasing monthly costs of kerosene,candles and dry cells were correlated with decreasingEPIS. The findings suggest that to increase energy-pov-erty scores, households should invest a bit more in reliableand quality energy delivery systems, which can help toimprove their quality of life.
From the energy-poverty groupings unequal propor-tions of households emerged in each group. On averagehouseholds without solar PV were relatively energy-poorer than households with solar PV in terms of accessto electricity services. This lays down a basis of under-standing the relationship between solar PV rural electri-fication and improved energy-poverty status in off-gridcommunities. The use of EPISs successfully demonstratedthe difference in energy-poverty status between house-holds with and without solar PV. Lastly, empirical evi-dence supports the hypothesis that monthly cost savingsfrom the use of solar PV lighting and EPIS are positivelyand linearly related. Nevertheless, other indicators thatcan measure and account for more variations in EPISshould be used in other case-studies.
Acknowledgements
The authors are grateful to the staff of the Center for Development Research (ZEF), Uni-versity of Bonn, especially Solvay Gerke, and the DAAD, Bonn for a short-term scholarship,which made it possible to focus on writing this paper. Special thanks must be given to thecentral administration of the Kwame Nkrumah University of Science and Technology(KNUST), Kumasi, Ghana, for providing a grant for the fieldwork in Ghana.
Note
1. This figure was reported by the National Development and Planning Commission –NDPC 94 [see World Bank, 2003, p. 191].
References
ANDA (Akuapim North District Assembly), 2004. District Poverty Profiling and Mapping,Akuapim North District, Akuapim, Eastern Region, Ghana.
Allderdice, A., and Rogers, A.J., 2000. Renewable Energy for Micro Enterprise, NationalRenewable Energy Laboratory, Colorado, USA.
Anderson, D., 2000. “Energy and economic prosperity”, in United Nations DevelopmentProgramme (UNDP) (ed.), World Energy Assessment: Energy and the Challenge of Sus-tainability, UNDP/UNDESA/World Energy Council, New York, pp. 394-413.
A-ANDA (Asante-Akim North District Assembly), 2004. District Poverty Profiling and Map-ping, Asante-Akim North District, Konongo, Ashanti, Ghana.
Brown, J.D., 2001. “Questions and answers about language testing statistics: what is aneigenvalue?”, JALT Testing & Evaluation SIG Newsletter, Vol. 5, No. 1, April.
Cabraal, A., Cosgrove-Davies, M., and Schaeffer, L., 1996. Best Practices for PhotovoltaicHousehold Electrification Programs. Lessons from Experiences in Selected Countries, WorldBank Technical Paper 324, Asia Technical Department Series, World Bank, Washington DC.
Cecelski, E., 2003. Energy, Poverty and Gender Enabling Equitable Access to Rural Elec-trification: Current Thinking on Energy, Poverty and Gender, World Bank, Washington DC.
Chang, Y.C., and Chang, B., 2003. “Applying fussy cluster method for marine environmentaldata analysis”, Environmental Informatics Archives, Vol. 1, pp. 114-124.
Chiu, K.Y., Stewart, B., and Ehlert, M., 2002. The Validation of a Measurement Instrument:Relationships among Student Demographic Characteristics, Student Academic Achievement,Student Satisfaction, and Online Business-Course Quality Factors, University of Missouri,Columbia, USA.
Cohen, J., 1988. Statistical Power Analysis for the Behavioral Sciences (2nd ed.), LawrenceElbaum Associates, Hillsdale, NJ,USA.
EC (Energy Commission), 2004. “Strategic National Energy Plan 2000-2025, Part 1”, EnergyReview, Official Journal of the Energy Commission of Ghana, Issue 02-2004.
GSS (Ghana Statistical Service), 2002. 2000 Population and Housing Census. SummaryReport of Final Results, Ghana Statistical Service, Accra.
GSS (Ghana Statistical Service), 2003. 2003 Core Welfare Indicators Questionnaire (CWIQ)Survey, Ghana Statistical Service, Accra.
Energy for Sustainable Development • Volume XII No. 1 • March 2008
Articles
29
GSS (Ghana Statistical Service), 2005a. Population Data Analysis Report: Policy Implicationsof Population Trends (Vol. 2), Ghana Statistical Service, Accra.
GSS (Ghana Statistical Service), 2005b. 2000 Population and Housing Census, Upper WestRegion. Analysis of District Data and Implications for Planning, United Nations Fund forPopulation Activities (UNFPA)-funded Project GHA/01/P070, Accra.
GSS (Ghana Statistical Service), 2005c. 2000 Population and Housing Census, Volta Re-gion. Analysis of District Data and Implications for Planning, UNFPA-funded ProjectGHA/01/P070, Accra.
GSS (Ghana Statistical Service), 2005d. 2000 Population and Housing Census, NorthernRegion. Analysis of District Data and Implications for Planning, UNFPA-funded ProjectGHA/01/P070, Accra.
GSS (Ghana Statistical Service), 2005e. 2000 Population and Housing Census, Upper EastRegion. Analysis of District Data and Implications for Planning, UNFPA-funded ProjectGHA/01/P070, Accra.
Henry, C., Sharma, M., Lapenu, C., and Zeller, M., 2003. Microfinance Poverty AssessmentTool, Technical Tools Series No. 5CGAP, World Bank, Washington DC.
JICA/MOE, 2005. The Master Plan Study on Rural Electrification Using Renewable EnergyResources in the Northern Part of the Republic of Ghana. Interim Report. Nomura ResearchInstitute Ltd, Chubu Electric Power Co. Inc.,
Martinot, E., Chaurey, A., Lew, D., Moreira, J.R., and Wamukonya, N., 2002. “Renewableenergy markets in developing countries”, Annual Review of Energy and Environment, 27,pp. 309-348.
Nelson, L.R., 2005. “Some observations on the scree test and on coefficient alpha”, ThaiJournal of Education Research and Measurement, 3(1), pp. 1-17.
Posorski, R., 1996. From Assistance Projects to the Market. Introducing Photovoltaics Sys-tems. Experience and Strategies in Energy: Careful Use of Scarce Resource, Gate Publi-
cation, Eschborn, April-June.
Reddy, A.K.N., 2000. “Energy and social issues”, in World Energy Assessment, UNDP, NewYork.
StatSoft (1984-2003). Principal Components and Factor Analysis, StatSoft, Inc.,www.statsoft.com/textbook/stacan.html#results, accessed December 12, 2006.
SEEP-AIMS, 2000. “Using pipeline clients as comparison group”, in Learning from Clients:Assessment Tools for Microfinance Practitioners, , Washington, DC, pp. 1-7.
Sricharoen, T., and Buchenrieder, G., 2005. “Principal component analysis of poverty innorthern Thailand”, Tropentag, Conference on International Agricultural Research for Devel-opment, Stuttgart Hohenheim, October 11-13.
UNDP/KITE, 2006. Energy for Poverty Reduction Action Plan for Ghana. A Targeted Ap-proach to Delivery of Modern Energy Services to the Poor, Ministry of Energy, Accra.
United Nations Development Programme (UNDP), 2004. World Energy Assessment. Over-view 2004 Update, Goldemberg, J., and Johansson, T.B. (eds.), UNDP publication, Vienna.
United Nations Environment Programme, 2006. Tunza: The UNEP Magazine for Youth – forYoung People, by Young People,http://www.ourplanet.com/tunza/issue0402en/pages/energy_4.html, accessed January 15,2007.
Wijayatunga, P.D.C., and Attalage, R.A., 2005. “Socio-economic impact of solar home sys-tems in rural Sri Lanka: a case-study”, Energy for Sustainable Development, Vol. IX, No.1, March, pp. 5-9.
World Bank, 2003. Ghana Poverty Reduction Strategy 2003-2005. An Agenda for Growthand Prosperity. Volume 1 – Analysis and Policy Statement, Accra.
Energy for Sustainable Development • Volume XII No. 1 • March 2008
Articles
30


