Embed Size (px)
Citation preview

Solid-State Structural Evolution of Poly(ethyleneterephthalate) During Step Uniaxial Stretching fromDifferent Initial Morphologies: An In Situ Wide AngleX-ray Scattering Study
Lyudmil V. Todorov, Carla I. Martins, Julio C. Viana
Department of Polymer Engineering, Institute for Polymers and Composites/I3N, University of Minho,4800-058 Guimaraes, Portugal
Received 13 February 2011; accepted 13 April 2011DOI 10.1002/app.34706Published online 5 October 2011 in Wiley Online Library (wileyonlinelibrary.com).
ABSTRACT: This work reports an in situ wide-angle X-ray scattering (WAXS) study of the structural evolution ofPET with distinct initial morphologies during step uniaxialstretching in the solid state. Two types of samples wereanalyzed under synchrotron X-ray radiation, namelyquasi-amorphous (QA) and semicrystalline (SC) (with 2Dand 3D order). Results show that initially different QAmorphologies evolve following the same stages: (i) stage I(before neck), at almost constant orientation level theamorphous phase evolves into mesophase; (ii) stage II(neck formation), there is a rapid increase of polymer ori-entation and the appearance of a periodical mesophasefrom the highly oriented mesophase; (iii) stage III (neckingpropagation), there is a leveling off of the average polymerorientation together with partial conversion of the periodi-cal mesophase and mesophase into highly oriented amor-phous. The behaviors of the two SC morphologies are
completely distinct. A 2D order crystalline morphologyevolves with stretching likewise the QA through threestages: (i) at early stages of deformation the polymer ori-entation remains unchanged while the amorphous phaseamount increases slightly, stage I; (ii) in stage II, a fastincrease of polymer orientation is accompanied by largeformation of mesophase; and (iii) in stage III there is thelevel off of polymer orientation as the chains approachtheir finite extensibility and the 3D crystalline order isachieved. Evolution of SC sample with 3D crystallineorder mainly features constant orientation increase to-gether with mesophase increment. Structure deformationmodels are suggested. VC 2011 Wiley Periodicals, Inc. J ApplPolym Sci 124: 470–483, 2012
Key words: crystal structures; drawing; morphology;WAXS
INTRODUCTION
Poly(ethylene terephthalate) (PET) is the unques-tioned leader among thermoplastic polyestersregarding its industrial applications.1 PET is slowlycrystallizing thermoplastic polyester that can beobtained with different morphologies, either anamorphous or a semicrystalline (SC) when cooledfrom the melt, depending on the cooling rateapplied. Once rapidly quenched into its amorphousstate, PET structure can be developed by: (i) stretch-ing in the rubbery state (above Tg), which leads to
high polymer orientation and strain-induced tricliniccrystalline structure development2,3 and/or by (ii)stretching in the solid state (at room temperature)resulting in extraordinarily large chain orientationwithout actual crystallization, but developing astrain-induced mesomorphic phase, the meso-phase.4,5 Both pathways lead to strain-induced struc-tural development that improves mechanical andphysical properties, determined by the imposedthermomechanical environment during stretching.6–8
The structural evolution mechanisms taking placeduring the stretching requires in situ characterizationtechniques as synchrotron X-ray diffraction. Thestructure evolution is of academic and industrial in-terest and from extreme importance under process-ing and in-service conditions.Ex situ2,6,7,9–23 and in situ24–34 synchrotron X-ray
scattering have been used to characterize the PETstructural evolution during the uniaxial stretching inthe rubbery state. Gorlier et al.21 proposed a three-stage structure development mechanism (SDM).More recently, the SDM was correlated to the super-structure by in situ Small Angle X-ray Diffraction(SAXS)/wide-angle X-ray scattering (WAXS),35,36 by
Correspondence to: J. C. Viana ([email protected]).Contract grant sponsor: DESY, European Commission;
contract grant numbers: HASYLAB Project DESY-D-II-05-101 EC, the FP6 contracts RII3-CT-2004-506008 (IA-SFS),project APT_PACK-SRTP-505204-1.
Contract grant sponsor: Portuguese Foundation forScience and Technology, FCT; contract grant number:Microtest-POCTI/CTM/46940/2002.
Contract grant sponsor: Ph.D. Student grant; contractgrant number: SFRH/BD/44917/2008.
Journal of Applied Polymer Science, Vol. 124, 470–483 (2012)VC 2011 Wiley Periodicals, Inc.
the following stages: (i) first stage, called ‘‘orienta-tion,’’ involves the formation of mesophase from ori-ented chain segments and formation of microfibrillarstructure; (ii) second, ‘‘nucleation’’ stage, involvesthe initiation of crystallization from the mesophasethrough nucleation and growth processes, formingimperfect crystals with 2D order; and (iii) third,‘‘growth’’ stage, corresponds to the stable crystalgrowth phase with 3D order. The lamellar super-structure is responsible for the linear load increase,enabling a good lattice PET triclinic unit cell to beregistered. PETs triclinic unit cell is described with a¼ 4.62 A, b ¼ 5.92 A, c ¼ 10.68 A, a ¼ 99.8�, b ¼127.6�, and c ¼ 104.9�.37
During stretching in the solid state, amorphousPET develops in a mesophase without crystallizationto occur. Mesophase was first reported by the pio-neer studies of Bonart.4,5 Auriemma et al.38 associ-ated the meridional peak, (00�1) corresponding to d¼ 10.3 A, to the mesophase, which has a smallermonomer length than the typical PET unit cell (c ¼10.7 A). Asano et al.39 reported that stretching ofamorphous PET in the solid state results in the for-mation of an oriented nematic phase, with alternat-ing position of the phenylene rings on neighboringmolecules. After annealing at 60�C nematic trans-forms into smectic phase (00�1) 2y ¼ 8.56� (d ¼ 10.7A) with neighboring rings aligned on the plane per-pendicular to the stretching direction and slightlytilted on the molecule axis. Other works reportedthe meridional peak (10�3) appearance at 2H ¼25.8�.7,40 Ran et al.41 interpreted the emergence ofthis peak to the mesophase formation with similarpacking symmetry to the crystalline phase with 3Dcrystalline order35,42 that is described by meridionalcrystalline unit cell reflection (�103) at 2H ¼ 26.6�.40
The present study aims at contributing for adeeper understanding on the PET structure evolu-tion upon uniaxial step stretching in the solid stateby in situ WAXS characterization from distinct initialmorphologies. For that purpose two types of mor-phologies were studied: (i) two quasi-amorphous(QA) samples with different orientation level and
phase’s fractions and (ii) two SC samples with 2Dcrystalline order and the other with 3D order. Themechanism of structure evolution and effect of initialmorphologies are discussed.
EXPERIMENTAL
Material
Poly(ethylene terephthalate) with intrinsic viscosityof 0.74 6 0.02 dL g�1—bottle grade, solid density of1.40 g cm�3 and approximate average molar mass,Mn, of 20,000 g mol�1 was used in this study.
Samples
The samples used in this work were prepared fol-lowing the procedure described in a previouswork.43 In summary, PET pellets were compressionmolded and quenched to obtain amorphous plaques.The plaques were cut with a dumbbell-like shapeand uniaxially deformed in the rubbery state follow-ing a stretching program, where stretching rate (est¼ 0.003 and 0.03 s�1), stretching temperature (Tst ¼90 and 110�C), and stretching ratio (kst ¼ 1.6� and2.1�) were varied. Different morphologies wereobtained through this procedure: two QA and twoSC samples. These samples were then cut into rec-tangular tensile bars with the dimensions of: lengthof rectangular part of 25 mm and cross section of4 mm � 0.3 mm, to perform the solid-state de-formation simultaneous to the in situ X-raycharacterization.Structural parameters of the initial samples, as
revealed by WAXS analyses, are listed in Table I.For clear identification of the samples, the followingnomenclature has been adopted:
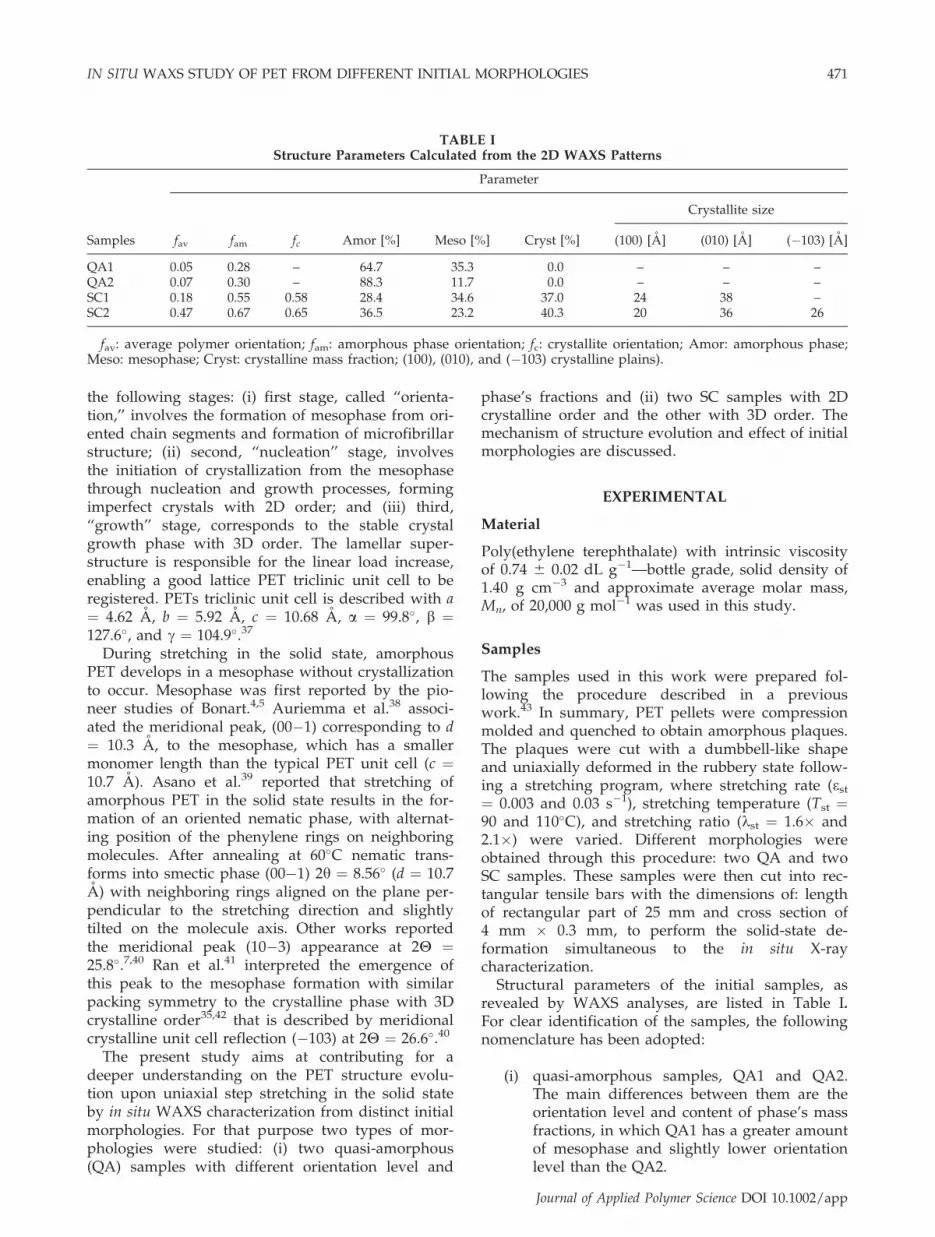
(i) quasi-amorphous samples, QA1 and QA2.The main differences between them are theorientation level and content of phase’s massfractions, in which QA1 has a greater amountof mesophase and slightly lower orientationlevel than the QA2.
TABLE IStructure Parameters Calculated from the 2D WAXS Patterns
Samples
Parameter
fav fam fc Amor [%] Meso [%] Cryst [%]
Crystallite size
(100) [A] (010) [A] (�103) [A]
QA1 0.05 0.28 – 64.7 35.3 0.0 – – –QA2 0.07 0.30 – 88.3 11.7 0.0 – – –SC1 0.18 0.55 0.58 28.4 34.6 37.0 24 38 –SC2 0.47 0.67 0.65 36.5 23.2 40.3 20 36 26
fav: average polymer orientation; fam: amorphous phase orientation; fc: crystallite orientation; Amor: amorphous phase;Meso: mesophase; Cryst: crystalline mass fraction; (100), (010), and (�103) crystalline plains).
IN SITU WAXS STUDY OF PET FROM DIFFERENT INITIAL MORPHOLOGIES 471
Journal of Applied Polymer Science DOI 10.1002/app

(ii) semicrystalline samples, SC1 and SC2. TheSC2 sample is more oriented than SC1, andshows a crystalline phase with 3D order,indicated by the meridional crystalline peakreflection (�103), while in case of SC1 thispeak is absent, showing a 2D crystallineorder.
Solid-state stretching and in situ WAXScharacterization
Solid-state stretching was carried (at controlled roomtemperature of 23�C) simultaneously to in situWAXS experiments under synchrotron radiation atHASYLAB, DESY, Hamburg (A2 soft condensedmatter beam-line) with incident X-ray beam, mono-chromatized by reflection from a bent Ge (111)single crystal (k ¼ 0.15 nm). A Microtester, micro-universal testing apparatus, developed by ourgroup44 was used to perform the uniaxial stretching.The PET samples were clamped between jaws of theMicrotester (distance between tie bar 25 mm) withits center positioned perpendicularly to the X-raybeam, at a sample-to-detector distance of 135 mmand the stretching direction pointing upward. TheMicrotester was employed in tensile mode with si-multaneous movement of the grips apart from eachother to the maximum stretching ratio of 1.5�, thelimit of apparatus. The stretching protocol was asfollows:
(i) clamp the sample in the stretching machineand start the deformation process (typicalstretching rate of 10�3 s�1);
(ii) after some deformation the stretching wasceased and allowed a 2-min pause at con-stant strain,
(iii) in meanwhile acquire the 2D WAXS patternwith an accumulation time of 20 s,
(iv) restore the stretching procedure.
This step-wise procedure results in some molecu-lar relaxation that affects the morphology develop-ment. The comparison between the continuous andstep-wise protocols was reported elsewhere.45 Theuse of step wise result in higher level of amorphousphase orientation, in case of both morphologies, isrelated to a better rearrangement of the mesophaseduring the relaxation over the interrupted deforma-tion period. On the other hand, stretching stoppingcontributes for better defined 2D WAXS patterns.
The WAXS was calibrated with the different dif-fractions of a crystalline PET sample. Backgroundscattering was subtracted and all plots were normal-ized with respect to the incident X-ray intensity,accumulation time, and specimen thickness. Actualspecimen’s thickness was obtained by first approxi-
mation of a homogeneous deformation, in whichsample thickness changes with the stretching ratio,k, according to the following equation46:
t ¼ t0k�1=2 (1)
where t—actual sample thickness and t0—initialsample thickness.
WAXS data analysis
Phase mass fraction
The two linear intensity profiles, taken along theequatorial and meridional directions from the 2DWAXD patterns were used to estimate mass frac-tions of the phases. A peak-fitting program using aGaussian function was used to deconvolute thephase’s peaks. Studied samples have two differentparticular morphologies: (a) QA and (b) SC. There-fore, two specific data analyses procedures wereadopted for the calculations of the phase’s mass frac-tions. These methodologies are described below.Quasi-amorphous morphologies. The morphology ofQA samples was assumed to consist of two mainphases: (i) amorphous—isotropic phase and (ii) mes-ophase—anisotropic phase with degree of packingand order between the crystalline and the amor-phous. The amount of amorphous phase wasassumed to be proportional to the area of the linearmeridional profile. The subtraction of the amor-phous fractions from the total area in the equatorialprofile was proportional to the amount of the meso-phase. The mass fractions of the individual phasewere taken as the ratio of the area for each phase tothe total area of the equatorial profile. As the strainincreases, the WAXS patterns can exhibit a pair ofmeridional mesomorphic reflection (10�3) at about2H ¼ 25.8�,7,40 indicating conformational regularity,and called periodical mesophase (PM). At this stageof deformation, the QA samples morphologies wereconsidered to be composed of three phases: (i) amor-phous (ii) mesophase, and (iii) periodical meso-phase—mesophase with conformational periodicityperpendicular to the stretching direction. The area offitted (10�3) peak profile was used to determine themass fraction of the PM. The sum of the area convo-luted under the equatorial intensity profile and themeridional (10�3) peak was assumed to be the totalarea. The mass fractions of the individual phasewere taken as the ratio of the area for each phase tothe total area.Semicrystalline morphologies. The morphology of ini-tially SC samples was assumed to contain three dis-tinct phases31: (i) amorphous—isotropic phase, (ii)mesophase—which has a degree of packing orderbetween the crystalline and the amorphous phase,
472 TODOROV, MARTINS, AND VIANA
Journal of Applied Polymer Science DOI 10.1002/app

and (iii) a crystalline (triclinic) phase. The amount ofcrystalline phase was assumed to be proportional tothe total area of the deconvoluted peaks (010): at 2y¼ 17.3�, (�110) at 2y ¼ 22.5�, and (100) at 2y ¼ 25.7�
from the linear equatorial profile, whereas, theamount of the unoriented amorphous phase wasassumed to be proportional to the area of the linearmeridional profile. When a crystal diffraction peakwas detected in the meridional profile, i.e., (�103) ataround 2y ¼ 26�, its area contribution wasexcluded.31 The subtraction of the crystalline andamorphous fractions from the total area of the equa-torial profile was considered to be proportional tothe amount of the mesophase. The mass fraction ofthe individual phases was taken as the ratio of thearea for each phase to the total area of the equatorialprofile.
Polymer molecular orientation
Average polymer molecular orientation. The WAXS pat-terns were integrated along an azimuthal angle of l¼ 0 � p/2 (l ¼ 0 at equator), over a section with a2H ¼ 13–28�, to calculate the average polymer mo-lecular orientation, fav. That sector encloses all possi-ble crystal reflections of crystallographic planes, iso-tropic amorphous phase, and mesophases of PET.14
The Hermans’ orientation function was used to eval-uate the fav
47:
f ¼ 3 cos2 /� �� 1
2(2)
where the hcos2/i is defined as:
cos2 /� � ¼
R p=20 Ið/Þ cos2 / sin/d/R p=2
0 Ið/Þ sin/d/(3)
where / is the azimuthal angle, I is the diffracted in-tensity and hcos2/i is the average angle that the nor-mal makes with the principal deformation direction.Amorphous phase molecular orientation. Amorphousphase molecular orientation, fam, was determinedfrom the azimuthal scans obtained over l ¼ 2p (l ¼0 at equator) between 2H values of 19.3� and 20.8�.18
This annular ring is located between the (010) at 2y¼ 17.3� and (�111) at 2y ¼ 21.2� crystalline reflec-tions, that is an angular range where the amorphouspeak is reasonably intense and has least overlapfrom the crystalline reflections, when such are pres-ent. The profiles were fitted to Gaussian peaks and ahorizontal baseline. The width of the peak was usedto calculate the fam using [eqs. (2) and (3)]. The<cos2/> was evaluated by the full-width at halfmaximum (D/) of the Gaussian peak intensity distri-
bution, by hcos2/i integrated between p/2 and �p/2for each value of D/ from the relation:
Ið/Þ ¼ exp�4/2 ln 2
D/2
� �(4)
Crystalline phase orientation. Crystalline phase orien-tation, fc, of PET in terms of the angle r betweenthe c-axis of the unit cell and the stretching direc-tion can be characterized by the normal to the(�105) lattice plane as well as by using the threeequatorial reflections, (010), (�110), and (100)according to the Wilchinsky’s method.48 The(�1,0,5) reflection is found to occur at a large scat-tering angle, 2H ¼ 43�,14 which is out of the charac-terized sector. Using Wilchinsky’s method14,48 todetermine the crystallite orientation of PET, thehcos2ri can be calculated from the experimentalhcos2 /hk0i [eq. (3)] of the three equatorial reflec-tions, by the following equation:
cos2r� � ¼ 1� A cos2/010
� �� B cos2/�110
� �� C cos2/100
� � ð5Þ
where the parameters A ¼ 0.8786, B ¼ 0.7733, and C¼ 0.3481 are derived from the triclinic crystal sys-tem.32 The hcos /hkli values were obtained by eq. (3)for each peak reflection and substituted in eq. (5), toobtain hcos2ri, which was used to calculate the fc bymeans of eq. (2).
Crystallite dimensions
The apparent crystal sizes normal to the three crys-talline reflections, (100), (010), and (�103), which arealmost orthogonal to each other, were estimated bythe analysis of the linear intensity profiles takenacross the reflection peaks. The vector normal (100)is coincided with that of benzene stacking, the vectornormal (010) is approximately parallel to the ben-zene ring and the appearance of the (�103) peakindicates ordering along the stretching axis. Thuscrystalline dimensions31,49,50 was estimated using theScherrer equation:
Dhkl ¼ Kk= b1=2cosH� �
(6)
where Dhkl represents the apparent lateral crystallitesize of the hkl reflection plane, b1/2 is the full widthat the half height of the diffraction peak hkl in radi-ans, the shape factor K is set at 0.9 for polymer sys-tems, k is the X-ray wavelength (k ¼ 1.54 A), and His half of the diffraction angle. There is the possibil-ity of lattice distortion, which would broaden theline width, leading to the underestimation of thecrystal size. According to Kawakami et al.,49 based
IN SITU WAXS STUDY OF PET FROM DIFFERENT INITIAL MORPHOLOGIES 473
Journal of Applied Polymer Science DOI 10.1002/app

on work of Salem,2,3 the contribution of the latticedistortion is likely to be small.
RESULTS AND DISCUSSION
Structural evolution from quasi-amorphousmorphologies
Figure 1 shows the evolution of the average polymerorientation, fav, as a function of the strain applied,together with the 2D WAXS patterns acquired alongthe stretching process of QA samples. Both samplesare following similar pathways on the fav—straincurve and show similar 2D WAXS patterns. Thecurve follows a trend of three stages. In the firststage, the average polymer orientation remainsalmost constant as the strain increases. Suddenly,there is a fast increase of the average polymer orien-tation, at relatively low change in strain, remarkingthe stage II. Finally, in stage III, a plateau on the ori-
entation is reached, that is maintained till the end ofthe deformation process. These stages are identifiedin the Figure 1 by I, II, and III, respectively. Alongthe stage I there is no change in 2D WAXD patterns,remaining as a typical amorphous diffraction ring,which becomes elliptic-like shape during the stage IIand transforms into two diffused spots on the equa-tor, which intensifies and reduces in area, during thestage III. In this stage, the emerging of the mesomor-phic meridional reflection (10�3) peak is observed.The results are suggesting an analogous way ofstructural evolution of QA morphology, despite theslightly greater orientation attained by QA2 in thestage III, perhaps due to the slightly higher initialorientation of this sample (see Table I).Equatorial and the meridional intensity versus 2H
profiles extracted from the 2D WAXS patterns aredepicted in Figure 2. Distinct equatorial reflectionpeaks of amorphous PET, at about 2y � 19�, isobserved for both QA samples till the end of stage I
Figure 1 Average polymer orientation, fav, evolution with strain and selected 2D WAXS patterns of samples QA1 andQA2 (fitted by Boltzmann function, R2 ¼ 0.99).
474 TODOROV, MARTINS, AND VIANA
Journal of Applied Polymer Science DOI 10.1002/app

[Fig. 2(a,c) for QA1 and QA2, respectively]. As thestretching is progressing, in stage II, this peak intensi-fies and concentrates at an angle of 2y � 20�. Duringthe stage III only an increase in intensity is observed.The meridional profiles, shown in Figure 2(b,d),undergoes an intensification of the isotropic (amor-phous) meridional peak at about 2H � 18� duringstage I. In the stage II this peak shifts to a smallerangle around 2H � 16�, following the appearance ofthe mesomorphic peak (10�3) at about 2H � 26�. It isimportant to note that the shift observed in the equa-torial profile from 2y � 19� to 2y � 20� is coincidentwith the appearance of the mesomorphic peak, in themeridional profile. The I-2y profiles do not show anynew feature along stage III.
Phase’s mass fractions and amorphous phase ori-entation evolution as function of strain are plotted inthe Figure 3, Figure 3(a) corresponds to QA1 and (b)to QA2, respectively. As can be seen, the amorphousphase orientation evolution curves have identicalshape with the average polymer orientation ones(Fig. 1). The main features of phase’s evolution areas follow: in stage I, there is a small decrease ofamorphous phase due to its transformation intomesophase. In stage II, rapid transformation of great
amount of amorphous phase into mesophase isobserved and part of the mesophase is organizedinto periodical mesophase. Such fast phase transfor-mations are taking place simultaneously to the rapidincrease of amorphous phase orientation. Finally, instage III, a higher content of ordered phases isobserved, i.e., mesophase and periodical mesophasethat reduce steadily in amount during strain, at con-stant maximum amorphous phase orientation level.This anticipates some destruction/conversion of theordered phases during deformation (eventually bychain slippage).The two QA samples are following the same
trends, as described previously; nevertheless, sincethe initial portion of mesophase in QA1 was greaterthan in QA2 sample, it originated a greater amountof periodical mesophase, during stretching. In solidstate, the deformation of QA morphologies did notlead to crystallization, but only to periodical meso-phase formation, due to the low mobility of thepolymeric chains.The structural evolution during stretching in solid
state of QA precursors can be summarized as fol-lows: (i) stage I, starts when the deformation is initi-ated and is characterized by a constant level of fam,
Figure 2 Linear intensity profiles extracted from 2D WAXS patterns: (a) equatorial and (b) meridional of QA1; (c) equa-torial and (d) meridional of QA2.
IN SITU WAXS STUDY OF PET FROM DIFFERENT INITIAL MORPHOLOGIES 475
Journal of Applied Polymer Science DOI 10.1002/app

and no notable changes in the 2D WAXD patterns,remaining as a typical amorphous hallow. Only asmall intensification of the equatorial and the merid-ional intensity profiles, at constant peak position, isobserved together with a negligible amount of amor-phous phase fraction transforming into mesophase.At the strain level applied in stage I, it would beexpected an earlier transition of the stage I to stageII, due to neck formation. Thus the lack of structuralevolution at such strains might be interpreted by theneck formation somewhere along the tensile dumb-bell-like bar, out of the region where the 2D WAXSpatterns were acquired. Nevertheless, it is expectedthe neck formation to lead to a slight polymer orien-tation, however that could be completely recoveredwhen the stretching is stopped, suggesting the ab-sence of a long range network, which could con-strain the amorphous chains from relaxing at thisstrain level in QA morphology. (ii) Further, stretch-ing leads to the beginning of the second stage, stage
II, which is characterized by a sharp increase of theamorphous orientation and by the appearance oftwo spots on the equator in the 2D WAXD patterns.The beginning of this stage is marked by the shift ofthe meridional peak position to minor angles, fol-lowed by the appearance of the meridional peak atabout 26�, corresponding to the appearance of theperiodical mesophase and by the simultaneous shiftof the equatorial peak at 2y � 19� to 2y � 20� (mark-ing already the end of this stage and the beginningof stage III).10,40,51 The rapid increment of polymerchain orientation leads to a rapid phase transforma-tion from amorphous to mesophase and the appear-ance of the first signs of organization of the meso-phase into periodical one. This fast structuralevolution can be attributed to the neck propagationalong the center of the tensile bar, where WAXSinvestigation was carried out. Thus the tensile barlateral shrinkage induces a considerable polymerchains alignment into the stretching direction, result-ing into much oriented/entangled amorphous phase,which is able to transform into mesophase. On theother hand, in consequence of neck propagation, apart of oriented mesophase evolves into periodicalone, as result of its orientation and ordering. At thisstrain level, the polymer chains relaxation is hin-dered, during the stops of the stretching protocol,due to greater orientation of polymer bulk. The stageIII starts when the polymeric chains achieve a pla-teau on the molecular orientation, which is main-tained till the end of the stretching process. Thisstage is characterized by the presence of an equato-rial peak at about 2H � 20�, and two meridionalpeaks corresponding to the isotropic and mesomor-phic phases that are maintained with no positionalterations in the intensity scans. Typical of thisstage is ordered phases transformation into less or-dered one, namely periodical mesophase into meso-phase and respectively, mesophase into highly ori-ented amorphous one. This may be the result ofrelaxation that is taking place during stretchingstops or of the destruction of ordered phases duringthe progress of deformation (e.g., by chain slippage).In terms of macro deformation, this stage is relatedto the tensile bar homogeneous deformation throughnecking propagation.
Structural evolution from semicrystallinemorphologies
The average polymer orientation evolution withstrain, for both SC specimens, is depicted in Figure 4,with respective 2D WAXD patterns. As observed,there is a considerable difference in the behavior ofboth samples that is caused by the difference in theinitial morphological state of each one (see Table I).For SC1, originally having a 2D crystalline order,
Figure 3 Phase’s mass fractions and amorphous phaseorientation, fam, evolution of samples: (a) QA1 and (b) QA2(fitted by Boltzmann function amorphous phase orientationcurves, R2 ¼ 0.99). [Color figure can be viewed in theonline issue, which is available at wileyonlinelibrary.com.]
476 TODOROV, MARTINS, AND VIANA
Journal of Applied Polymer Science DOI 10.1002/app
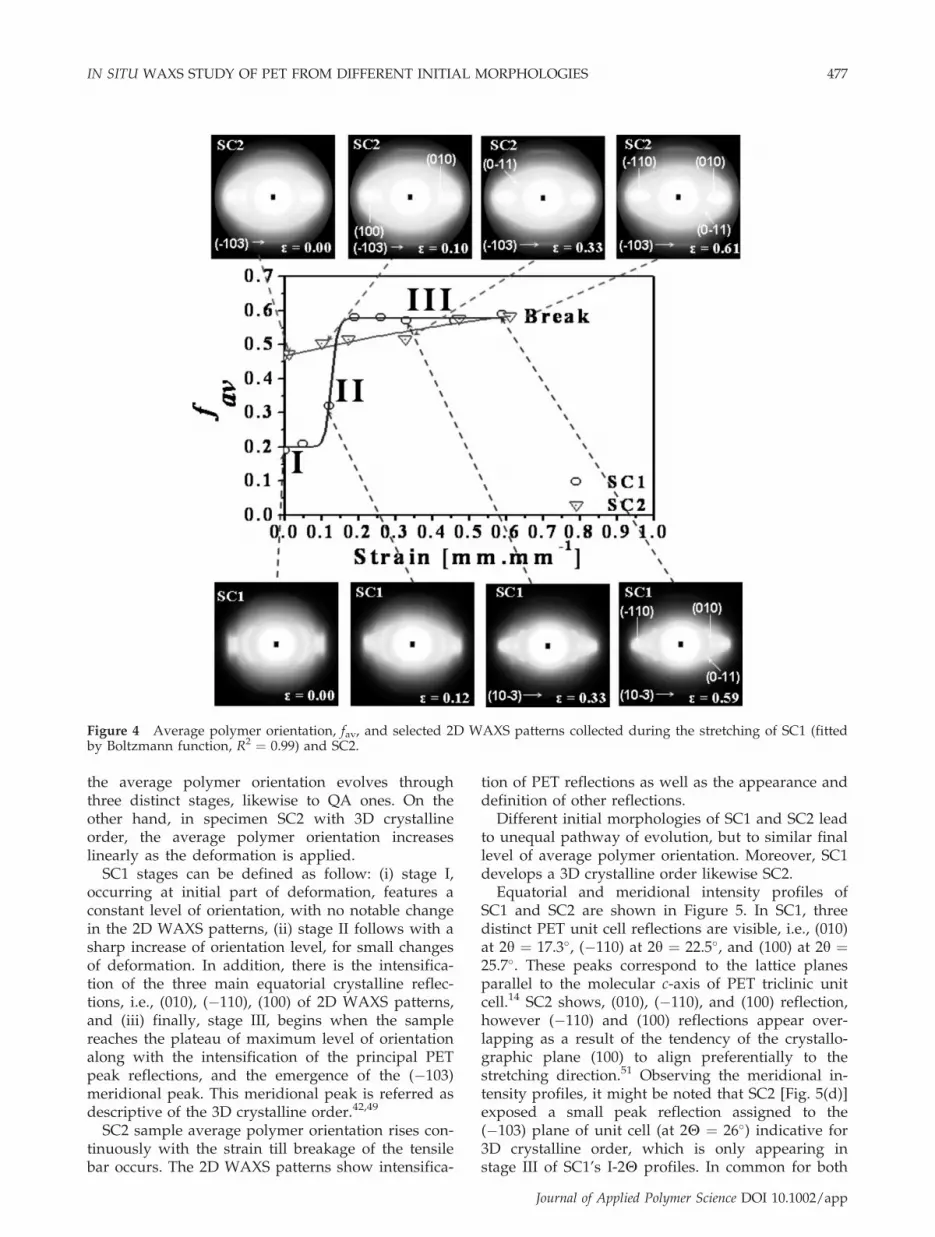
the average polymer orientation evolves throughthree distinct stages, likewise to QA ones. On theother hand, in specimen SC2 with 3D crystallineorder, the average polymer orientation increaseslinearly as the deformation is applied.
SC1 stages can be defined as follow: (i) stage I,occurring at initial part of deformation, features aconstant level of orientation, with no notable changein the 2D WAXS patterns, (ii) stage II follows with asharp increase of orientation level, for small changesof deformation. In addition, there is the intensifica-tion of the three main equatorial crystalline reflec-tions, i.e., (010), (�110), (100) of 2D WAXS patterns,and (iii) finally, stage III, begins when the samplereaches the plateau of maximum level of orientationalong with the intensification of the principal PETpeak reflections, and the emergence of the (�103)meridional peak. This meridional peak is referred asdescriptive of the 3D crystalline order.42,49
SC2 sample average polymer orientation rises con-tinuously with the strain till breakage of the tensilebar occurs. The 2D WAXS patterns show intensifica-
tion of PET reflections as well as the appearance anddefinition of other reflections.Different initial morphologies of SC1 and SC2 lead
to unequal pathway of evolution, but to similar finallevel of average polymer orientation. Moreover, SC1develops a 3D crystalline order likewise SC2.Equatorial and meridional intensity profiles of
SC1 and SC2 are shown in Figure 5. In SC1, threedistinct PET unit cell reflections are visible, i.e., (010)at 2y ¼ 17.3�, (�110) at 2y ¼ 22.5�, and (100) at 2y ¼25.7�. These peaks correspond to the lattice planesparallel to the molecular c-axis of PET triclinic unitcell.14 SC2 shows, (010), (�110), and (100) reflection,however (�110) and (100) reflections appear over-lapping as a result of the tendency of the crystallo-graphic plane (100) to align preferentially to thestretching direction.51 Observing the meridional in-tensity profiles, it might be noted that SC2 [Fig. 5(d)]exposed a small peak reflection assigned to the(�103) plane of unit cell (at 2H ¼ 26�) indicative for3D crystalline order, which is only appearing instage III of SC1’s I-2H profiles. In common for both
Figure 4 Average polymer orientation, fav, and selected 2D WAXS patterns collected during the stretching of SC1 (fittedby Boltzmann function, R2 ¼ 0.99) and SC2.
IN SITU WAXS STUDY OF PET FROM DIFFERENT INITIAL MORPHOLOGIES 477
Journal of Applied Polymer Science DOI 10.1002/app

SC I-2y profiles evolution is the intensification of theequatorial and meridional profiles with stretchingprogress.
Evolution of I-2y profiles of the SC1 sample isdescribed by stages as follows: the main characteris-tics of stage I is shift of the meridional peak to thelower angle and its narrowing; further stretchingleads to start of stage II, where meridional peak nar-rows and alters to about 2H ¼ 16�; along the laststage, stage III, its beginning is marked by appear-ance in the meridional profiles of (�103) crystallinepeak reflection, at about 2y ¼ 26.8�, while the iso-tropic peak narrows without alteration of its posi-tion. Further stretching, along stage III, leads toslight alteration of both meriodional peaks positions,i.e., isotropic to angle of about 2H ¼ 16.3� and crys-talline one respectively, to around 2H ¼ 26.3�.
SC2 equatorial profiles evolution [Fig. 5(c)] is dis-tinguished by amplification of the (�110) peak atstrain of 0.47 mm mm�1. On the other hand, the me-ridional profile features a broad isotropic peakaround 2y ¼ 16� and a weak crystalline peak (�103)at about 2y ¼ 26.2� (see also Fig. 4). This peak movesduring the stops of stretching protocol, evidencing
the crystallite longitudinal order changes and itssensibility to macromolecular chains extension/relaxation.Phase’s mass fraction, as well as the amorphous
and crystalline phases orientation evolution with de-formation, for both SC samples is shown in Figure 6.During stage I, SC1 sample features an increase ofthe amorphous phase mass fraction as a result ofsome mesophase relaxation concomitant with adecrease upon the crystalline phase orientation isalso observed. Thereafter, both amorphous and crys-talline phase’s orientations increase until the end ofstage II, being accompanied by the reduction of theamorphous phase mass fraction and the increase ofmesophase. Along stage III, the amorphous andcrystalline phase’s orientations are maintained con-stant at its maximum level. A small decrement ofthe mesophase mass fraction is observed due to itstransformation into amorphous phase at alike crys-talline phase content, similar to the QAmorphologiesIn the case of SC2 [Fig. 6(b)], it is observed the
continuous increase of mesophase content withstrain due to amorphous phase fraction reduction
Figure 5 Linear intensity profiles extracted from 2D WAXS patterns: sample SC1 (a) equatorial and (b) meridional, andsample SC2 (c) equatorial and (d) meridional.
478 TODOROV, MARTINS, AND VIANA
Journal of Applied Polymer Science DOI 10.1002/app

and some crystalline phase relaxation, which is con-comitant to the steady increase of amorphous andcrystalline phase orientation levels until samplebreakage. At ultimate strain levels, just before rup-ture, minor increase of crystalline phase is observed,as a result of a mesophase reduction; also some mes-ophase relaxation into amorphous phase is takingplace. The 3D crystalline order of SC2 hinders chainsrelaxation, leading to a linear increase of the poly-mer bulk orientation (both amorphous and crystal-line phases) levels with strain progress. In contrast,for sample SC1, such behavior is only observed dur-ing stage III, when the crystalline phase reaches the3D order.
The apparent crystal sizes, normal to the threecrystal reflections planes, (100), (010), and (�103),were estimated by the analysis of the linear inten-sity profiles taken across the reflection peaks, usingthe Scherrer equation [eq. (6)]. These results areshown in Figure 7(a,b) for SC1 and SC2 samples,
respectively. The three chosen reflections planes arealmost orthogonal to each other, thus marking theaverage lateral sizes of the crystallites induced bydeformation.The SC1 samples crystallites sustain the following
directional changes along the stages [Fig.7(a)]: stageI—the crystallites show two dimensional order withno change on its dimensions. Crystallites becomeslightly larger along the stage II. This may be attrib-uted to some rotation of the benzene rings withinthe crystallites. The start of stage III is marked byappearance of (�103) peak corresponding to longitu-dinal order (3D crystalline order), which causesshrinkage of frontal plane (100) at stable lateral size,(010) due to rearrangement of the benzene stacking.Along the stage III, the crystallites undergo reorgan-ization by a slight frontal enlargement, followed bylongitudinal contraction, till sample breakage.
Figure 6 Phase’s mass fractions and amorphous, fam, andcrystalline, fc, phases orientations evolution for samples:(a) SC1 (fam results fitted by Boltzmann function, R2 ¼0.99) and b) SC2. [Color figure can be viewed in the onlineissue, which is available at wileyonlinelibrary.com.]
Figure 7 Changes of estimated crystal size from threenearly orthogonal planes, (010), (100), and (�103) calculateby Scherer equation during uniaxial deformation of: (a)SC1 and (b) SC2.
IN SITU WAXS STUDY OF PET FROM DIFFERENT INITIAL MORPHOLOGIES 479
Journal of Applied Polymer Science DOI 10.1002/app
The SC2 has a crystalline phase with three dimen-sional order, from the start, defined by the crystal-line reflection (�103). In this case, there is a slightlaterally enlargement of (010) during the first stepsof stretching protocol, followed by stable crystallitesizes till sample breakage [Fig. 7(b)].
Crystallites with 2D order prior to deformation(samples SC1) result in significant variation of itssize along stretching protocol, whereas with 3D crys-talline order (SC2 morphology) shows only slightchange of its size.
The solid-state structural evolution of SC morphol-ogies that have not reached the 3D crystalline order(SC1) can be summarized as follows:
Stage I corresponds to a stable average polymerorientation level, while the amorphous phase orien-tation rapidly increases and orients. This behavioroccurs during the first stop of deformation of thestep deformation applied and is associated to themesophase relaxation. The crystalline orientationlevel declines along the stage I, but the crystallinephase content does not change, as well as the crys-tallite sizes. This might be related to a taut poly-mer bulk, causing a decrement of the crystalliteorientation. In terms of macroscopic deformation,during stage I, neck forms somewhere along thetensile bar, out of incident point of X-ray beam,contributing to the relatively poor structural evolu-
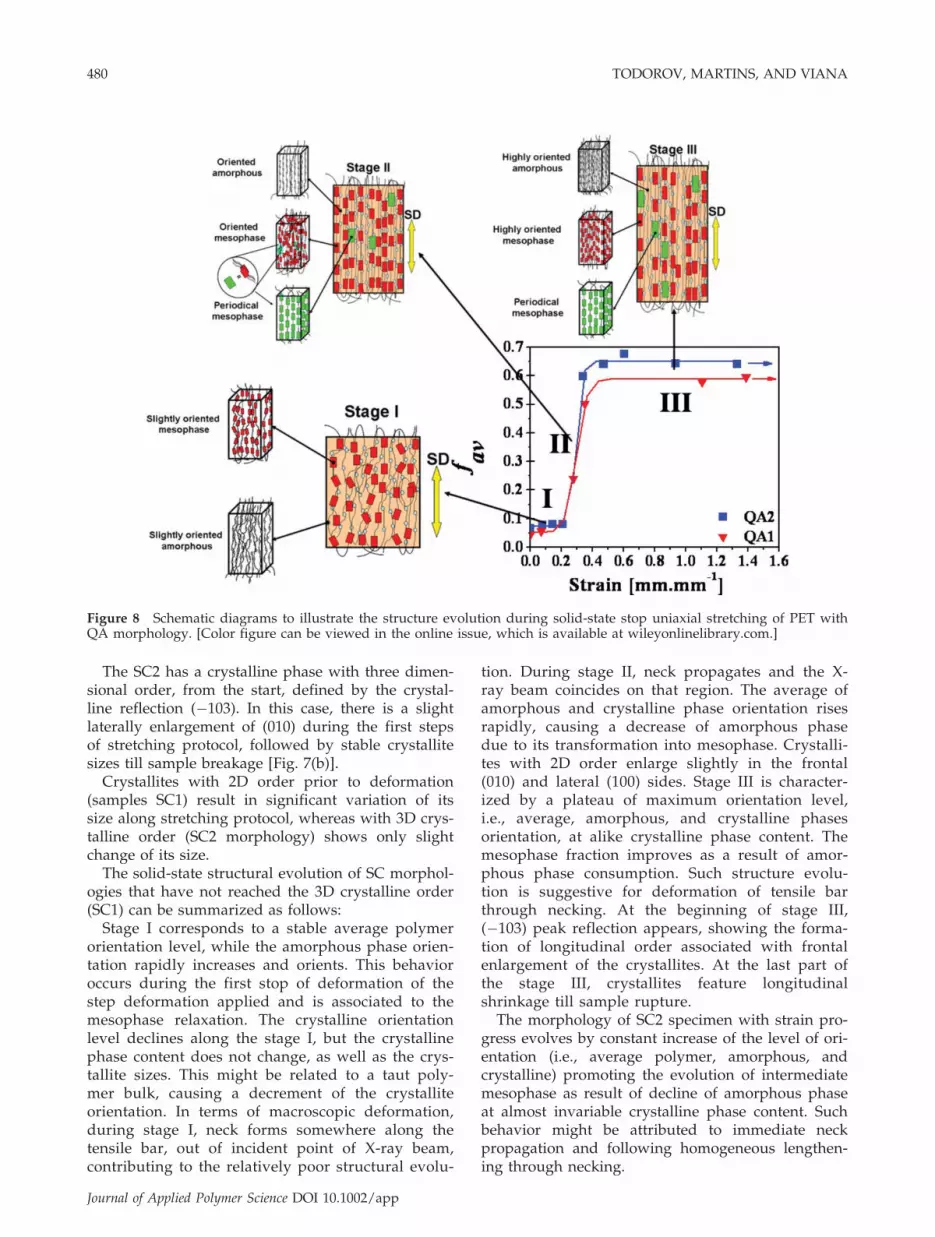
tion. During stage II, neck propagates and the X-ray beam coincides on that region. The average ofamorphous and crystalline phase orientation risesrapidly, causing a decrease of amorphous phasedue to its transformation into mesophase. Crystalli-tes with 2D order enlarge slightly in the frontal(010) and lateral (100) sides. Stage III is character-ized by a plateau of maximum orientation level,i.e., average, amorphous, and crystalline phasesorientation, at alike crystalline phase content. Themesophase fraction improves as a result of amor-phous phase consumption. Such structure evolu-tion is suggestive for deformation of tensile barthrough necking. At the beginning of stage III,(�103) peak reflection appears, showing the forma-tion of longitudinal order associated with frontalenlargement of the crystallites. At the last part ofthe stage III, crystallites feature longitudinalshrinkage till sample rupture.The morphology of SC2 specimen with strain pro-
gress evolves by constant increase of the level of ori-entation (i.e., average polymer, amorphous, andcrystalline) promoting the evolution of intermediatemesophase as result of decline of amorphous phaseat almost invariable crystalline phase content. Suchbehavior might be attributed to immediate neckpropagation and following homogeneous lengthen-ing through necking.
Figure 8 Schematic diagrams to illustrate the structure evolution during solid-state stop uniaxial stretching of PET withQA morphology. [Color figure can be viewed in the online issue, which is available at wileyonlinelibrary.com.]
480 TODOROV, MARTINS, AND VIANA
Journal of Applied Polymer Science DOI 10.1002/app

Structural models
Based on the experimental observations mentionedabove, some structural models depicting the struc-tural hierarchy or structural evolution mechanismfrom different initial morphologies, in the solid state,are proposed. In Figure 8, it is represented the struc-tural evolution mechanism for QA morphologies,whereas in Figures 9 and 10, the models for the SCprecursors with 2D and 3D crystalline order areshown, respectively.
Structural evolution from quasi-amorphousprecursors
Figure 8 represents the structural evolution of QAsamples. At the initiation of deformation, QA sam-ples consist of slight oriented amorphous phase andmesophase, and their proportion changes into moremesophase throughout stage I at constant orientationlevel. Stage I ends and stage II begins when thepolymer chain orientation rapidly increases and alarge amount of amorphous phase is transformedinto mesophase. Since the orientation has increased,a small fraction of mesophase is developed into peri-
odical mesophase, as a result of the overlapping ofthe mesophase chains perpendicular to the stretch-ing direction. As deformation further proceeds, thepolymer chains approach their extensibility limit,leading to leveling-off of the average polymer orien-tation. This is called stage III. Here, a part of the pe-riodical mesophase relaxes into mesophase and fur-ther into amorphous one, maintaining the same levelof orientation. This can be explained by the untyingof mesophase polymer chains surrounded by tightpolymer bulk, which transforms them into highlyoriented amorphous phase. These samples are notable to crystallize during deformation.
Structural evolution from semicrystallineprecursors with 2D crystalline order
The mechanism responsible for the strain-inducedstructural changes in the solid state of the SC samplewith 2D crystalline order can be summarized usingthe structural model illustrated in Figure 9. Stage I isdescribed by initially constant average polymermolecular orientation level, out of the neckingregion. As the stretching progresses, initially slightlyoriented polymer bulk evolves by increasing
Figure 9 Schematic diagrams to illustrate the structure evolution during solid-state stop uniaxial stretching of PET withSC morphology with 2D crystalline order. [Color figure can be viewed in the online issue, which is available atwileyonlinelibrary.com.]
IN SITU WAXS STUDY OF PET FROM DIFFERENT INITIAL MORPHOLOGIES 481
Journal of Applied Polymer Science DOI 10.1002/app

amorphous phase portion due to some mesophaserelaxation. A small amount of crystalline phase alsorelaxes into mesophase. A raise in the average poly-mer orientation, leading to mesophase increase isobserved in stage II, at necking. Along this stagecrystallites feature enlargement of frontal and lateralside’s parameters, owing to tightening of polymeramorphous matrix. Further stretching causes thepolymer chains orientation approaching its extensi-bility limits that results in a plateau of maximumpolymer orientation, recognized as stage III. This ori-entation level contributes for the development of 3Dordered crystalline phase and increment of meso-phase, mainly because of amorphous phase transfor-mation. Along this stage, the crystallites with 3Dorder grow into the stretching direction.
Structural evolution from semicrystallineprecursors with 3D crystalline order
For SC2 samples with 3D crystalline order, the struc-ture evolution and average polymer orientation withstrain progress is illustrated in Figure 10. The strain-induced phase transitions involved mainly meso-phase formation from oriented amorphous phaseand some from crystalline phase relaxation. Average
polymer orientation increases with the increase ofstrain, until maximum chain extensibility is reached.During the first steps of the stretching protocol crys-tallites laterally enlarge, where after feature a stablecrystallite size till sample rupture.
CONCLUSIONS
The evolution of strain-induced phase transition andaverage polymer molecular orientation with strainincrement was investigated for different initial mor-phological states of PET. QA and SC morphologiesshow distinct structure evolutions during stretching.Distinct structural models were proposed for eachtype of initial morphology, interpreting the obtainedexperimental results.Solid-state structural evolution upon deformation
is strongly dependent on the initial state of the mate-rial. Initially amorphous samples evolve into highlyoriented ones that are not able to crystallize,although a high level of average polymer molecularorientation is achieved. They are formed of highlyoriented chains in different phases (amorphous,mesophase, and periodical mesophase) whose massfractions evolve during stretching, as a result of
Figure 10 Schematic diagrams to illustrate the structure evolution during solid state stop uniaxial stretching of PET withSC morphology with 3D crystalline order. [Color figure can be viewed in the online issue, which is available atwileyonlinelibrary.com.]
482 TODOROV, MARTINS, AND VIANA
Journal of Applied Polymer Science DOI 10.1002/app

subsequent chain stretching/slippage and relaxationphenomena. A SC precursor gives rise to a finalstructure where a 3D crystalline order is attained,even when starting with 2D crystalline order. In allcases, the final average molecular orientation levelattaint is independent of the initial morphologicalstate. Its evolution follows three stages, for any kindof samples that has not achieved a 3D crystallineorder: firstly there is a small plateau of constant mo-lecular orientation (stage I) until neck formation, fol-lowed by quick rise (stage II), that than stabilizes ina new plateau of maximum molecular orientationduring necking propagation through the specimen(stage III). For 2D crystalline precursor, crystallitesize enlarges during initial deformation stages, andthen evolves due to rearrangements of benzene ringstacking during stretching. A 3D crystalline precur-sor (SC2) leads to a continuous evolution of the av-erage molecular orientation with strain until break,without almost no crystalline phase evolution.
Initially, morphological distinct PET samples showdifferent structural evolutions during stretching andalso markedly distinct mechanical behaviors.
References
1. Fakirov, S. Handbook of Thermoplastic Polymers: Homopoly-mers, Copolymers, Blends, and Composites; Wiley-VCH Ver-lag GmbH: Weinheim, 2002.
2. Salem, D. R. Polymer 1992, 33, 3189.3. Salem, D. R. Polymer 1992, 33, 3182.4. Bonart, R. Kolloid-zeitschrift and zeitschrift fur polymere
1966, 213, 1.5. Bonart, R. Kolloid Zeitschrift and Zeitschrift fuer Polymere
1969, 231, 438.6. Salem, D. R. Polymer 1994, 35, 771.7. Goschel, U. Polymer 1996, 37, 4049.8. Salem, D. R. Polymer 1995, 36, 3605.9. Chevalier, L. M. Y. Mech Mater 2007, 596.
10. Ajji, A.; Cole, K. C.; Dumoulin, M. M.; Brisson, J. Polymer1995, 36, 4023.
11. Ajji, A.; Guevremont, J.; Cole, K. C.; Dumoulin, M. M. Poly-mer 1996, 37, 3707.
12. Ajji, A.; Cole, K. C.; Dumoulin, M. M.; Ward, I. M. Polym EngSci 1997, 37, 1801.
13. Goschel, U. Polymer 1995, 36, 1157.14. Goschel, U.; Deutschert, K.; Abetzt, V. Polymer 1996, 37, 1.15. Goschel, U.; Urban, G. Polymer 1995, 36, 3633.16. Adams, A. M.; Buckley, C. P.; Jones, D. P. Polymer 2000, 41, 771.17. Smith, M. R.; Cooper, S. J.; Winter, D. J.; Everall, N. Polymer
2006, 47, 5691.18. Gowd, E. B.; Ramesh, C.; Byrne, M. S.; Murthy, N. S.; Radhak-
rishnan, J. Polymer 2004, 45, 6707.19. Morawiec, J.; Bartczak, Z.; Pluta, M.; Galeski, A. J Appl Polym
Sci 2002, 86, 1426.20. Vigny, M.; Tassin, J. F.; Gibaud, A.; Lorentz, G. Polym Eng Sci
1997, 11, 1785.21. Gorlier, E.; Haudin, J. M.; Billon, N. Polymer 2001, 42, 9541.22. Dargent, E.; Grenet, J.; Dahoun, A. Polym Eng Sci 1997, 37,
1853.
23. Martins, C. I.; Cakmak, M. Polymer 2007, 48, 2109.24. Mahendrasingam, A.; Martin, C.; Fuller, W.; Blundell, D. J.;
Oldman, R. J.; Harvie, J. L.; MacKerron, D. H.; Riekel, C.;Engstrom, P. Polymer 1999, 40, 5553.
25. Blundell, D. J.; Mahendrasingam, A.; Martin, C.; Fuller, W.;MacKerron, D. H.; Harvie, J. L.; Oldman, R. J.; Riekel, C.Polymer 2000, 41, 7793.
26. Mahendrasingam, A.; Blundell, D. J.; Martin, C.; Fuller, W.;MacKerron, D. H.; Harvie, J. L.; Oldman, R. J.; Riekel, C.Polymer 2000, 41, 7803.
27. Blundell, D. J.; MacKerron, D. H.; Fuller, W.; Mahendra-singam, A.; Martin, C.; Oldman, R. J.; Rule, R. J.; Riekel, C.Polymer 1996, 37, 3303.
28. Chaari, F.; Chaouche, M.; Doucet, J. Polymer 2003, 44, 473.29. Chaari, F.; Chaouche, M. J Polym Sci Part B Polym Phys 2004,
42, 1915.30. Kolb, R.; Seifert, S.; Stribeck, N.; Zachmann, H. G. Polymer
2000, 41, 2931.31. Kawakami, D.; Ran, S.; Burger, C.; Fu, B.; Sics, I.; Chu, B.;
Hsiao, S. B. Macromolecules 2003, 36, 9275.32. Matthews, R. G.; Ajji, A.; Dumoulin, M. M.; Prud’homme,
R. E. Polymer 2000, 41, 7139.33. Mahendrasingam, A.; Martin, C.; Fuller, W.; Blundell, D. J.;
Oldman, R. J.; MacKerron, D. H.; Harvie, J. L.; Riekel, C. Poly-mer 2000, 41, 1217.
34. Mahendrasingam, A.; Blundell, D. J.; Wright, A. K.; Urban, V.;Narayanan, T.; Fuller, W. Polymer 2003, 44, 5915.
35. Kawakami, D.; Ran, S.; Burger, C.; Avila-Orta, C.; Sics, I.; Chu,B.; Benjamin, S. H.; Kikutani, T. Macromolecules 2006, 39, 2909.
36. Kawakami, D.; Burger, C.; Ran, S.; Avila-Orta, C.; Sics, I.; Chu,B.; Chiao, S.-M.; Hsiao, B. S.; Kikutani, T. Macromolecules2008, 41, 2859.
37. Daubley, R.; Bunn, C. W.; C.J, B. Proc R Soc London Ser A1954, 226, 531.
38. Auriemma, F.; Corradini, P.; De Rosa, C.; Guerra, G.; Petrac-cone, V.; Bianchi, R.; Di Dino, G. Macromolecules 1992, 25,2490.
39. Asano, T.; Balta Calleja, F. J.; Flores, A.; Tanigaki, M.; Mina,M. F.; Sawatari, C.; Itagaki, H.; Takahashi, H.; Hatta, I. Poly-mer 1999, 40, 6475.
40. Parravicini, L.; Leone, B.; Auriemma, F.; Guerra, G.; Petrac-cone, V.; Dino, G. D.; Bianchi, R.; Vosa, R. J Appl Polym Sci1994, 52, 875.
41. Ran, S.; Wang, Z.; Burger, C.; Chu, B.; Hsiao, B. S. Macromole-cules 2002, 35, 10102.
42. Kawakami, D.; Ran, S.; Burger, C.; Fu, B.; Sics, I.; Chu, B.;Hsiao, S. B. Macromolecules 2003, 36, 9275.
43. Todorov, L. V.; Martins, C. I.; Viana, J. C. J Appl Polym Sci2011, 120, 1253.
44. Teixeira, D. S.; Fonseca, J.; Pontes, A. J.; Sepulveda, A. T.;Cortez, J.; Viana, J. C. Micro Mechanics; Europe University ofMinho: Guimaraes, Portugal, 2007; p 345.
45. Todorov, L. V.; Viana, J. C. Int J Mater Forming 2008, 1, 661.46. Oultache, A. K.; Kong, X.; Pellerin, C.; Brisson, J.; Pezolet, M.;
Prud’homme, R. E. Polymer 2001, 42, 9051.47. Stribeck, N. X-Ray Scattering of Soft Matter; Springer: Berlin,
Heidelberg, New York, 2007.48. Wilchinsky, Z. W. J Appl Phys 1960, 31, 1969.49. Kawakami, D.; Hsiao, B. S.; Ran, S.; Burger, C.; Fu, B.; Sics, I.;
Chu, B.; Kikutani, T. Polymer 2004, 45, 905.50. Kawakami, D.; Hsiao, B. S.; Burger, C.; Ran, S.; Avila-Orta, C.;
Sics, I.; Kikutani, T.; Jacob, K. I.; Chu, B. Macromolecules 2005,38, 91.
51. Alvarez, C.; Sics, I.; Nogales, A.; Denchev, Z.; Funari, S. S.;Ezquerra, T. A. Polymer 2004, 45, 3953.
IN SITU WAXS STUDY OF PET FROM DIFFERENT INITIAL MORPHOLOGIES 483
Journal of Applied Polymer Science DOI 10.1002/app


