Embed Size (px)
Citation preview
ABSTRACT: Lake Chapala is the largest natural water body inMexico and also one of the most important shallow lakes in LatinAmerica. For the past several years it has suffered various environ-mental problems such as the upstream overuse of water, contami-nation, and sedimentation. For the past 10 years the lake has hadless than 50 percent of its historical water level over the past centu-ry. No criteria are reported in the literature that establish a waterstorage volume that will guarantee water quality conditions neces-sary for the survival of the lake. After determining the behavior oftotal solids concentrations in relation to the variations in the lake’sdepth, we proposed a minimum water column height of 5.0 m, rep-resenting a storage volume of about 5,000 Mm3. This volume wouldresult in the recommended water quality standards for total dis-solved solids. Calculated distribution maps show that the totalsolids concentration in the lake has increased since the end of the1970s. The solids are primarily concentrated in the eastern part ofthe lake, as a consequence of the high solids discharged from theLerma River, its main tributary.(KEY TERMS: Lake Chapala; sediment balance; sediment trans-port; solids; erosion; hydrologic balance.)
de Anda, Jose, Harvey Shear, Ulrich Maniak, and Pedro F. Zárate-del Valle,2004. Solids Distribution in Lake Chapala, Mexico. Journal of the AmericanWater Resources Association (JAWRA) 40(1):97-109.
BACKGROUND
The impurities accumulated by water throughoutthe hydrologic cycle and as a result of human activi-ties may be in both suspended and dissolved forms(Peavy et al., 1985). “Total solids” is the term appliedto the material residue left in a vessel after evapora-tion of a sample and its subsequent drying in an oven
at a defined temperature. Total solids (TS) include“total suspended solids” (TSS) and “total dissolvedsolids” (TDS), the portion that passes through the fil-ter (American Public Health Association, 1998).
TSS can derive from a wide variety of sources, suchas silt, decaying plant and animal matter, industrialwastes, and sewage. Suspended material may beobjectionable in water for several reasons (Peavy etal., 1985). High concentrations of suspended solidscan cause many problems for aquatic life. High TSSin the water column can reduce light from reachingphytoplankton and rooted submerged vegetation. Asthe amount of light passing through the water isreduced, the rate of photosynthesis is reduced.Reduced rates of photosynthesis cause less dissolvedoxygen to be released into the water by plants. If lightis completely blocked from bottom dwelling plants,the plants will stop producing oxygen and will die. Asthe plants decompose, bacteria will consume evenmore oxygen from the water. Low dissolved oxygencan lead to fish kills. High TSS can also cause anincrease in surface water temperature because thesuspended particles absorb heat from sunlight. Thiscan cause dissolved oxygen levels to fall even furtherand can harm aquatic life in many other ways(Mitchell and Stapp, 1992).
Criteria have been established for solids and tur-bidity primarily because of their effect on primaryproductivity by reducing light penetration, as well asfor drinking water supplies (USEPA, 1987). The crite-rion for suspended solids (TSS) is that the depth of
1Paper No. 02064 of the Journal of the American Water Resources Association (JAWRA) (Copyright © 2004). Discussions are open untilAugust 1, 2004.
2Respectively, Assistant Director, Centro de Investigación y Asistencia en Tecnologia y Diseño del Estado de Jalisco, A.C. Normalistas 800,44270 Guadalajara, Jalisco, México; Regional Science Advisor, Environment Canada-Ontario Region, 4905 Dufferin Street, Toronto, CanadaM3H 5T4; Director, TU-Braunschweig, Leichtweiss-Institut für Wasserbau, Abteilung Hydrologie und Wasserwirtschaft, Beethovenstr, 51a,38106 Braunschweig, Germany; and Professor, Universidad de Guadalajara-CUCEI, Ap. Postal 4-021, Dep. de Química, 44410 Guadalajara,Jalisco, México (E-Mail/de Anda: [email protected]).
JOURNAL OF THE AMERICAN WATER RESOURCES ASSOCIATION 97 JAWRA
JOURNAL OF THE AMERICAN WATER RESOURCES ASSOCIATIONFEBRUARY AMERICAN WATER RESOURCES ASSOCIATION 2004
SOLIDS DISTRIBUTION IN LAKE CHAPALA, MEXICO1
Jose de Anda, Harvey Shear, Ulrich Maniak, and Pedro F. Zárate-del Valle2
the compensation point for photosynthetic activityshould not be reduced by more than 10 percent byTSS from its seasonally established norm. The waterquality criterion for total dissolved solids in a body ofwater is less than 500 mg/L, and in the case of waterbodies used for fish consumption the value is lessthan 250 mg/L (USEPA, 1987).
The rate of settling of a particle in a water bodydepends on the viscosity and density of the water aswell as the size, shape, and specific gravity of the par-ticle (Linsey et al., 1992). Sedimentation problemsoccur when erosion is taking place in the watershed.Surface runoff carries sand and silt into the lake,where it settles to the bottom and creates shallowerareas; these shallower water levels may interfere withlake ecology and human use and enjoyment. Sedi-ments often carry significant amounts of nutrientsthat can fertilize rooted aquatic plants and algae(Ryding and Rast, 1989; de Anda and Shear, 2001).
Total solids in Lake Chapala, as in other tropicalshallow lakes, are very sensitive to changes in waterlevel because with slight reductions of depth, the tur-bidity increases due to resuspension of solids from thebottom. The goal of this paper is to propose the totalsuspended solids as a water quality parameter thatpermits a “healthy” water depth for Lake Chapala.This parameter, as a water quality indicator, could be
used to establish a policy of upstream land usedesigned to minimize sediment production andrelease into the Lerma-Chapala system.
SEDIMENTS OF LAKE CHAPALA
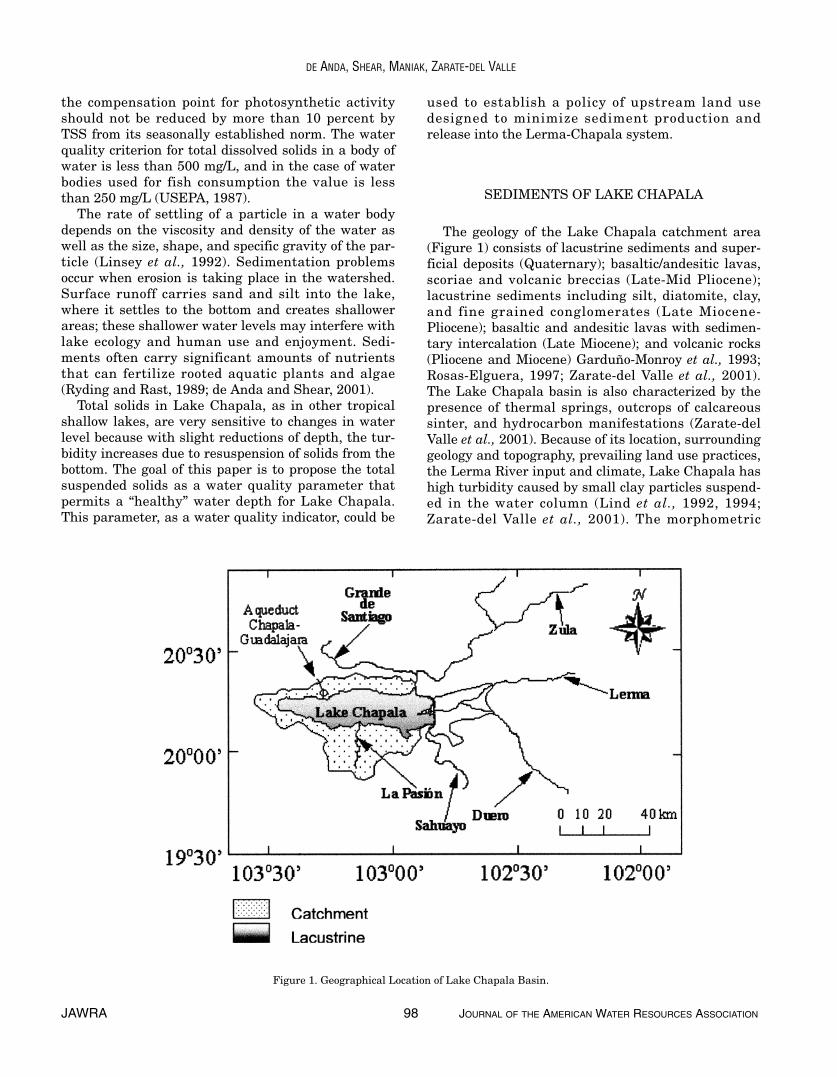
The geology of the Lake Chapala catchment area(Figure 1) consists of lacustrine sediments and super-ficial deposits (Quaternary); basaltic/andesitic lavas,scoriae and volcanic breccias (Late-Mid Pliocene);lacustrine sediments including silt, diatomite, clay,and fine grained conglomerates (Late Miocene-Pliocene); basaltic and andesitic lavas with sedimen-tary intercalation (Late Miocene); and volcanic rocks(Pliocene and Miocene) Garduño-Monroy et al., 1993;Rosas-Elguera, 1997; Zarate-del Valle et al., 2001).The Lake Chapala basin is also characterized by thepresence of thermal springs, outcrops of calcareoussinter, and hydrocarbon manifestations (Zarate-delValle et al., 2001). Because of its location, surroundinggeology and topography, prevailing land use practices,the Lerma River input and climate, Lake Chapala hashigh turbidity caused by small clay particles suspend-ed in the water column (Lind et al., 1992, 1994;Zarate-del Valle et al., 2001). The morphometric
JAWRA 98 JOURNAL OF THE AMERICAN WATER RESOURCES ASSOCIATION
DE ANDA, SHEAR, MANIAK, ZARATE-DEL VALLE
Figure 1. Geographical Location of Lake Chapala Basin.
parameters of Lake Chapala were previously dis-cussed by de Anda et al. (1998).
Terrigenous particles are the major component ofbottom sediments in Lake Chapala. From the miner-alogical point of view they reflect the neovolcanicframework of both the Lerma-Chapala watershed andthe Lake Chapala basin. Using drilling data andgravimetric modeling, it was estimated that the thick-ness of the sediments filling Lake Chapala couldreach more than 500 m in some places (Zarate-delValle et al., 2001). Shallow sediments in the lake areloose, dark, and silty and have a mean granulometricdistribution of 10 to 50 mm, although some fine sandy(80-150 mm) sediments were also encountered in thinlayers (< 2 mm) (Fernex et al., 2001). Shallow sedi-ments of Lake Chapala are also composed of someorganic components adhered to solid particles such asdiatom frustules, phytolites, and pollen (Zarate-delValle et al., 2001).
Sediments settled at the bottom of Lake Chapalahave been sampled since 1996 by means of a benthosgravity corer with 5 cm diameter. There is evidencethat some material that constitutes the sediments ofthe lake was transported by air from neighboringareas. Some of the transported particles encounteredin the sediments are acid volcanic ash, pollen, andphytolites (Ramirez-Sanchez, 1998; Fernex et al.,2001).
The sedimentation rate is an important parameterfor understanding the geological processes occurringin lakes. Sedimentation rates were estimated in LakeChapala by measuring the isotopic activity of 210Pb,
226Ra, 137Cs, 239Pu, and 240Pu. It was found that thecalculated sedimentation rates are not uniform in thelake. The rates calculated in the western sector ofLake Chapala vary approximately from 1 to 2mm/year (0.02 g/cm2/year). The rates in the centraland eastern sectors vary from 2.4 to 2.5 mm/year(0.04 g/cm2/year), and close to the mouth of LermaRiver the sedimentation rate reaches 3.5 mm/year(0.066 g/cm2/year) (Ramirez-Sanchez, 1998; Fernex,2001).
METHODOLOGY
The Mexican National Water Commission(Comisión Nacional del Agua, CNA) has sampled thelake at 0.80 m below the surface because Lake Cha-pala is considered a shallow system without signifi-cant variations in water quality throughout the watercolumn (CNA, 1997).
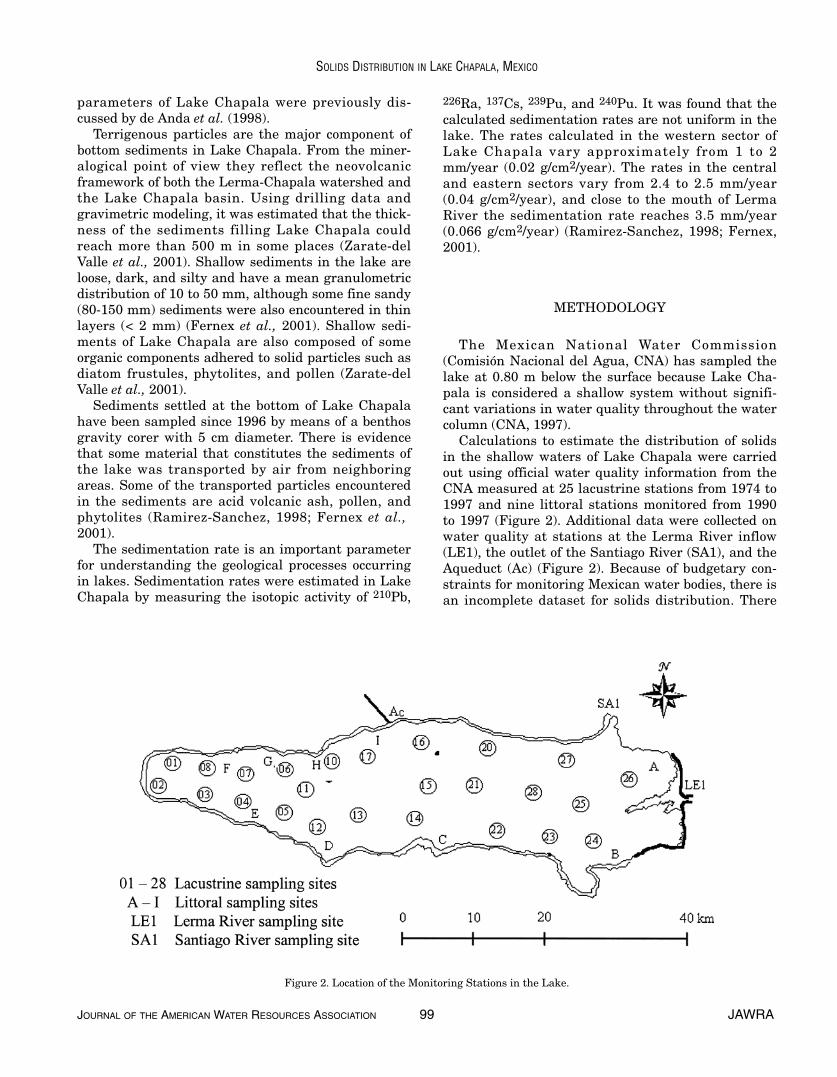
Calculations to estimate the distribution of solidsin the shallow waters of Lake Chapala were carriedout using official water quality information from theCNA measured at 25 lacustrine stations from 1974 to1997 and nine littoral stations monitored from 1990to 1997 (Figure 2). Additional data were collected onwater quality at stations at the Lerma River inflow(LE1), the outlet of the Santiago River (SA1), and theAqueduct (Ac) (Figure 2). Because of budgetary con-straints for monitoring Mexican water bodies, there isan incomplete dataset for solids distribution. There
JOURNAL OF THE AMERICAN WATER RESOURCES ASSOCIATION 99 JAWRA
SOLIDS DISTRIBUTION IN LAKE CHAPALA, MEXICO
Figure 2. Location of the Monitoring Stations in the Lake.
are only 104 monitored months in the lacustrine sta-tions in the period of study, representing 36 percent ofthe total months (288).
Concentration values at the LE-1, SA-1, and Acsampling stations were considered in a bidimensionalinterpolation process (see Figure 2). Here the term“bidimensional” assumes only the behavior of thesolids concentration in surface water. Because thelake is shallow, it was assumed that depth variationsdo not significantly affect the solids concentration.This assumption is based on observed total phospho-rus concentration in the lake’s water column (de Andaet al., 2000). The concentration values in these sta-tions are very important because they induce the dif-fusive driving force that influences the distributionprofiles in the lake. Water quality information existsin the monitoring stations located along the LermaRiver (LE-1), the Santiago River (SA-1), and the Chapala-Guadalajara Aqueduct (Ac), its main outflowsince 1990 (see Figure 2). Measurement of solids inthe Lerma and Santiago Rivers began at the end of1977. Only 38 percent of the required monthly infor-mation for the Lerma River (111 of 288 months) existsfor the period of study. Information for both TSS andTDS in the aqueduct exist for only 11 months of 1997.
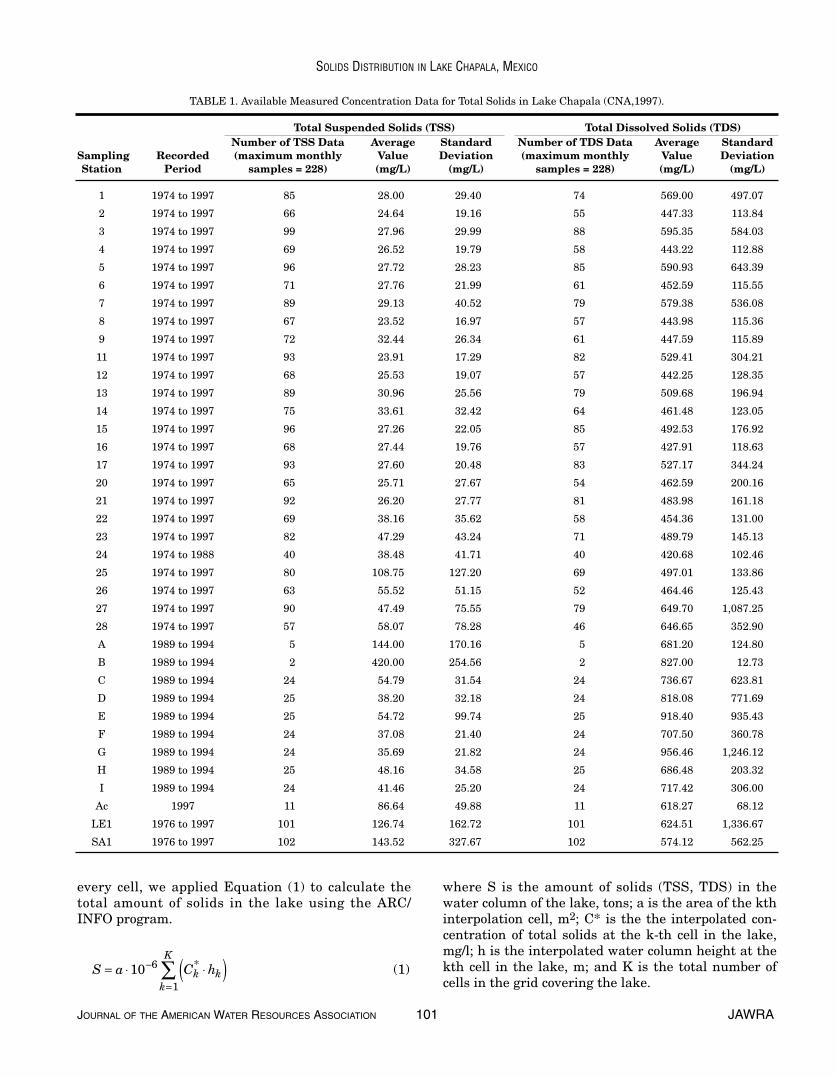
Table 1 shows the number of monitoring stations,number of samples, mean values, and their standarddeviations for the set of concentration values acquiredfor 1974 to 1997. The high standard deviations in thelake data shown in Table 1 are likely the result of sed-iment resuspension induced by wind and the nonho-mogeneous horizontal distribution of transportedsediments in the lake. The measured solids in theaqueduct have lower standard deviations because theaqueduct takes the lake waters from a channel to theaqueduct pumping station. This gives the solidsenough time to settle and so reduces the variability inthe solids concentrations over time.
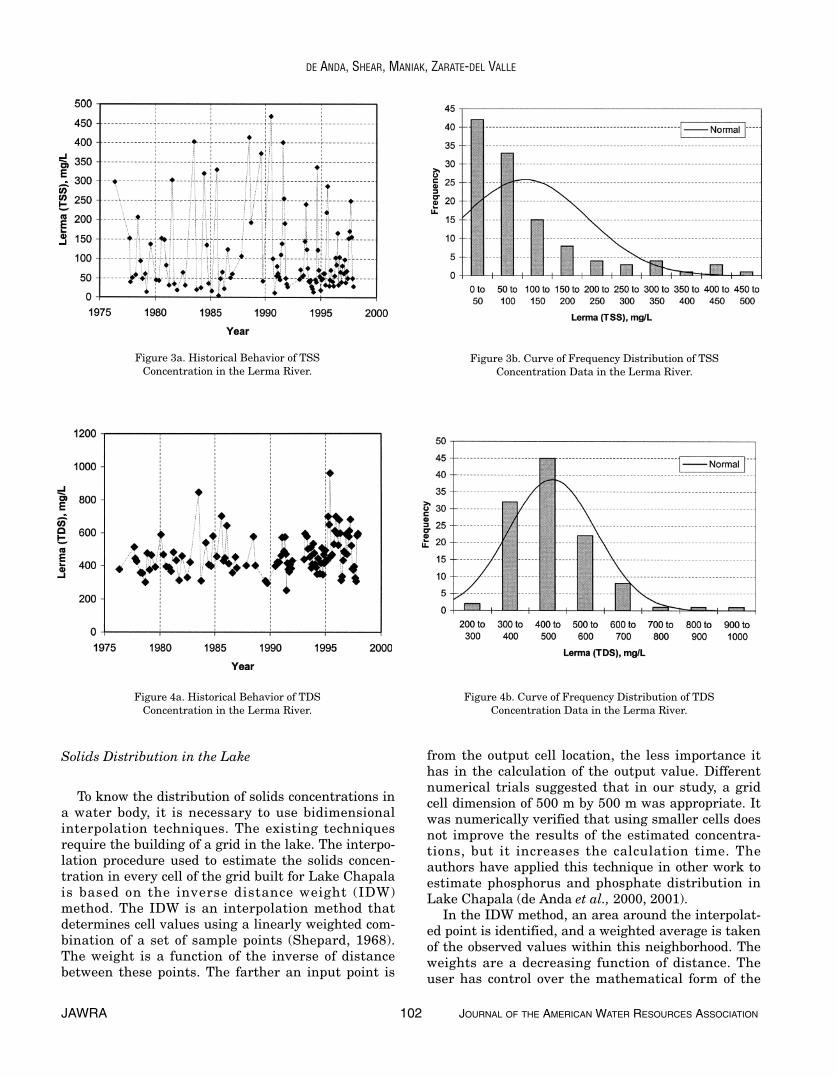
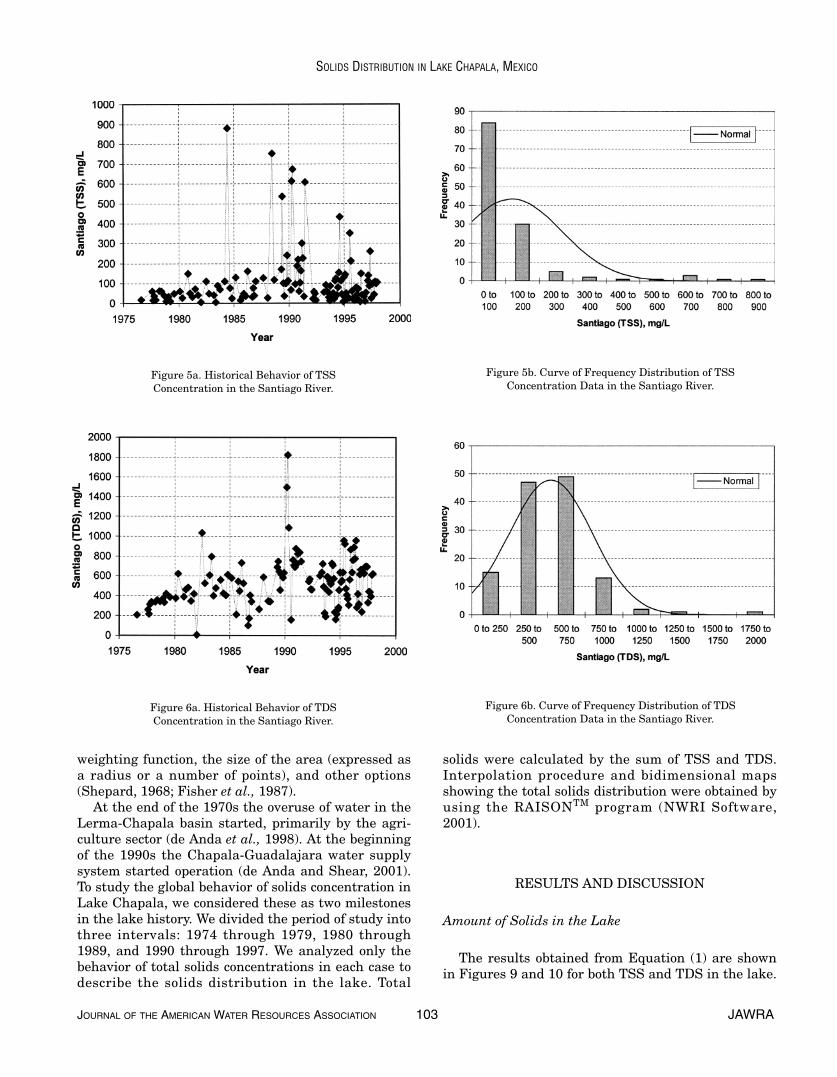
Analysis of total suspended and total dissolvedsolids concentration during the period of study revealthat values of solids in the Lerma and SantiagoRivers (monitoring stations LE-1 and SA-1 in Figure2) have relatively high standard deviations as shownin Figures 3a, 3b, 4a, 4b, 5a, 5b, 6a, and 6b, respec-tively. This is likely caused by significant changes inthe water inflow and outflow of the lake as explainedby de Anda et al. (1998, 2000) and de Anda and Shear(2001). The overuse of the Lerma-Chapala Basin andits effects in the hydrologic regime of Lake Chapala isan important topic in technical, economical, and polit-ical discussions in Mexico (Hansen and van Afferden,2001).
Not all the months in which the Lerma and Santia-go Rivers were monitored coincide with the monthsmonitored in Lake Chapala. It was therefore neces-sary to find a reliable correlation between solids
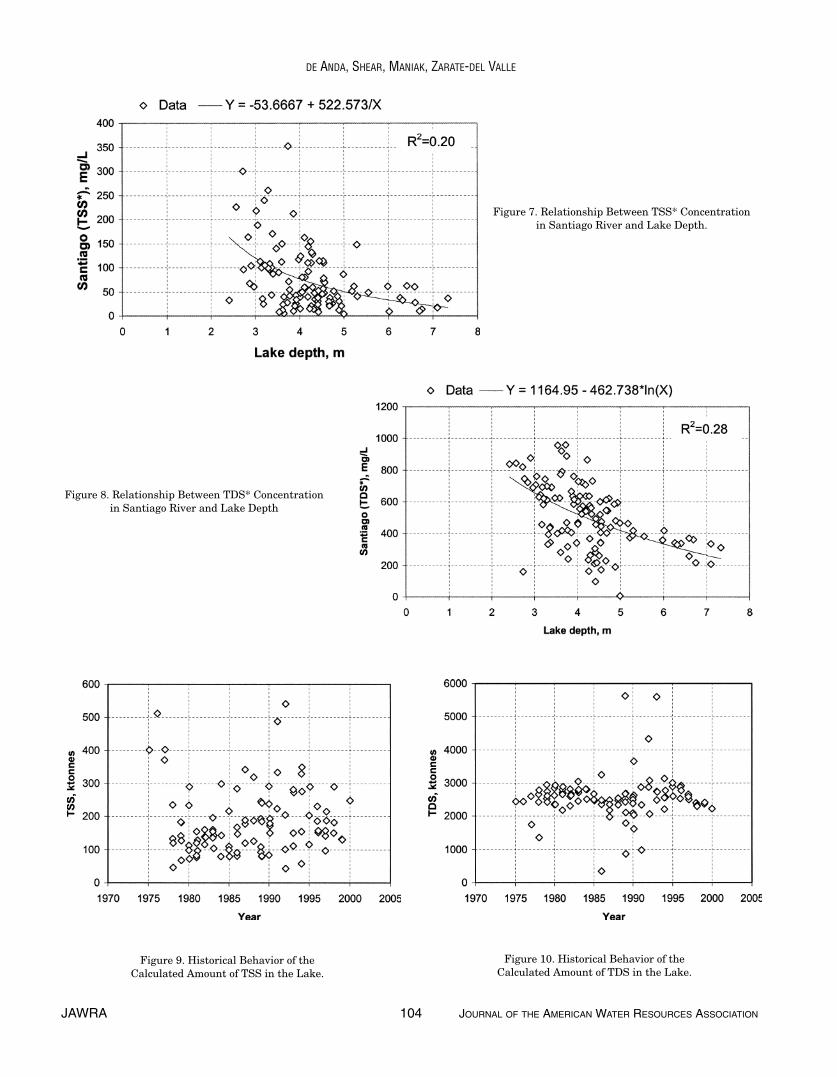
concentrations in the rivers and the hydrometric variables of the system (rainfall, volume, depth, riverflows, etc.). After applying the Pearson correlationalgorithm using WinStat (Fitch, 2001) we found thatthe Lerma River solids concentrations do not offer agood correlation with any of the tested hydrometricvariables. Furthermore, we did not find any specifictrend permitting the application of time series analy-sis. Therefore, we used a simple linear regression ofthe concentration values over time to predict the non-measured solid concentration values in the LermaRiver. On the other hand, the solids concentrationsmeasured at Santiago River offered a good correlationwith the lake depth, as shown in Figures 7 and 8,where TSS* and TDS* are the set of filtered concen-tration values used in the interpolation process. Thefiltering process eliminated the outlying data pointsin the frequency curves shown in previous figures.
Solids Concentrations in the Lake
We tried two methods of calculating solids concen-trations in the lake: (1) we used all the concentrationvalues measured at the monitoring stations (lacus-trine, littoral, LE1, SA1, and Ac) and calculated thesum of all of them and divided by the number of sam-pling stations; and (2) we interpolated all the mea-sured concentrations from all the monitoring stationsto determine the concentration distribution in thelake using a cell model. Having the lake bathymetry,it is possible to calculate the amount of solids in everycell of the grid covering the lake; then summing allcalculated amounts of solids in every cell, we obtainthe total amount of solids in the lake for a time “t.”Having the lake volume at time “t,” it is possible tohave a better estimation of the global mean totalsolids concentration in the lake by dividing theamount of solids by the lake volume. The differencesbetween (1) and (2) were quite significant in severalcases, sometimes as much as 100 percent. The accura-cy of the second method is much higher than that ofthe first one; therefore, we decided to use its resultsin estimating the total amount of solids in the lake.
To estimate the amount of solids in the lake usingMethod 2, we first built a grid to divide the lake insquares of 500 m by 500 m. The measured solids con-centrations were used to calculate interpolated solidsconcentrations in every central point of the cells com-prising the grid. This information generated a solidsdistribution profile in the lake as explained earlier. Inthe same way, we used the bathymetric information ofthe lake (SARH, 1981; de Anda et al., 1998) to esti-mate the interpolated heights in the central point ofevery cell. Having the interpolated solids concentra-tions, interpolated heights, and defined surface for
JAWRA 100 JOURNAL OF THE AMERICAN WATER RESOURCES ASSOCIATION
DE ANDA, SHEAR, MANIAK, ZARATE-DEL VALLE
every cell, we applied Equation (1) to calculate thetotal amount of solids in the lake using the ARC/INFO program.
where S is the amount of solids (TSS, TDS) in thewater column of the lake, tons; a is the area of the kthinterpolation cell, m2; C* is the the interpolated con-centration of total solids at the k-th cell in the lake,mg/l; h is the interpolated water column height at thekth cell in the lake, m; and K is the total number ofcells in the grid covering the lake.
JOURNAL OF THE AMERICAN WATER RESOURCES ASSOCIATION 101 JAWRA
SOLIDS DISTRIBUTION IN LAKE CHAPALA, MEXICO
TABLE 1. Available Measured Concentration Data for Total Solids in Lake Chapala (CNA,1997).
Total Suspended Solids (TSS) Total Dissolved Solids (TDS)Number of TSS Data Average Standard Number of TDS Data Average Standard
Sampling Recorded (maximum monthly Value Deviation (maximum monthly Value DeviationStation Period samples = 228) (mg/L) (mg/L) samples = 228) (mg/L) (mg/L)
1 1974 to 1997 85 28.00 29.40 74 569.00 497.07
2 1974 to 1997 66 24.64 19.16 55 447.33 113.84
3 1974 to 1997 99 27.96 29.99 88 595.35 584.03
4 1974 to 1997 69 26.52 19.79 58 443.22 112.88
5 1974 to 1997 96 27.72 28.23 85 590.93 643.39
6 1974 to 1997 71 27.76 21.99 61 452.59 115.55
7 1974 to 1997 89 29.13 40.52 79 579.38 536.08
8 1974 to 1997 67 23.52 16.97 57 443.98 115.36
9 1974 to 1997 72 32.44 26.34 61 447.59 115.89
11 1974 to 1997 93 23.91 17.29 82 529.41 304.21
12 1974 to 1997 68 25.53 19.07 57 442.25 128.35
13 1974 to 1997 89 30.96 25.56 79 509.68 196.94
14 1974 to 1997 75 33.61 32.42 64 461.48 123.05
15 1974 to 1997 96 27.26 22.05 85 492.53 176.92
16 1974 to 1997 68 27.44 19.76 57 427.91 118.63
17 1974 to 1997 93 27.60 20.48 83 527.17 344.24
20 1974 to 1997 65 25.71 27.67 54 462.59 200.16
21 1974 to 1997 92 26.20 27.77 81 483.98 161.18
22 1974 to 1997 69 38.16 35.62 58 454.36 131.00
23 1974 to 1997 82 47.29 43.24 71 489.79 145.13
24 1974 to 1988 40 38.48 41.71 40 420.68 102.46
25 1974 to 1997 80 108.75 127.20 69 497.01 133.86
26 1974 to 1997 63 55.52 51.15 52 464.46 125.43
27 1974 to 1997 90 47.49 75.55 79 649.70 1,087.25
28 1974 to 1997 57 58.07 78.28 46 646.65 352.90
A 1989 to 1994 5 144.00 170.16 5 681.20 124.80
B 1989 to 1994 2 420.00 254.56 2 827.00 12.73
C 1989 to 1994 24 54.79 31.54 24 736.67 623.81
D 1989 to 1994 25 38.20 32.18 24 818.08 771.69
E 1989 to 1994 25 54.72 99.74 25 918.40 935.43
F 1989 to 1994 24 37.08 21.40 24 707.50 360.78
G 1989 to 1994 24 35.69 21.82 24 956.46 1,246.12
H 1989 to 1994 25 48.16 34.58 25 686.48 203.32
I 1989 to 1994 24 41.46 25.20 24 717.42 306.00
Ac 1997 11 86.64 49.88 11 618.27 68.12
LE1 1976 to 1997 101 126.74 162.72 101 624.51 1,336.67
SA1 1976 to 1997 102 143.52 327.67 102 574.12 562.25
S a C hk kk
K= ⋅ ⋅( )−
=∑10 6
1
* (1)
Solids Distribution in the Lake
To know the distribution of solids concentrations ina water body, it is necessary to use bidimensionalinterpolation techniques. The existing techniquesrequire the building of a grid in the lake. The interpo-lation procedure used to estimate the solids concen-tration in every cell of the grid built for Lake Chapalais based on the inverse distance weight (IDW)method. The IDW is an interpolation method thatdetermines cell values using a linearly weighted com-bination of a set of sample points (Shepard, 1968).The weight is a function of the inverse of distancebetween these points. The farther an input point is
from the output cell location, the less importance ithas in the calculation of the output value. Differentnumerical trials suggested that in our study, a gridcell dimension of 500 m by 500 m was appropriate. Itwas numerically verified that using smaller cells doesnot improve the results of the estimated concentra-tions, but it increases the calculation time. Theauthors have applied this technique in other work toestimate phosphorus and phosphate distribution inLake Chapala (de Anda et al., 2000, 2001).
In the IDW method, an area around the interpolat-ed point is identified, and a weighted average is takenof the observed values within this neighborhood. Theweights are a decreasing function of distance. Theuser has control over the mathematical form of the
JAWRA 102 JOURNAL OF THE AMERICAN WATER RESOURCES ASSOCIATION
DE ANDA, SHEAR, MANIAK, ZARATE-DEL VALLE
Figure 3a. Historical Behavior of TSSConcentration in the Lerma River.
Figure 3b. Curve of Frequency Distribution of TSSConcentration Data in the Lerma River.
Figure 4a. Historical Behavior of TDSConcentration in the Lerma River.
Figure 4b. Curve of Frequency Distribution of TDSConcentration Data in the Lerma River.
weighting function, the size of the area (expressed asa radius or a number of points), and other options(Shepard, 1968; Fisher et al., 1987).
At the end of the 1970s the overuse of water in theLerma-Chapala basin started, primarily by the agri-culture sector (de Anda et al., 1998). At the beginningof the 1990s the Chapala-Guadalajara water supplysystem started operation (de Anda and Shear, 2001).To study the global behavior of solids concentration inLake Chapala, we considered these as two milestonesin the lake history. We divided the period of study intothree intervals: 1974 through 1979, 1980 through1989, and 1990 through 1997. We analyzed only thebehavior of total solids concentrations in each case todescribe the solids distribution in the lake. Total
solids were calculated by the sum of TSS and TDS.Interpolation procedure and bidimensional mapsshowing the total solids distribution were obtained byusing the RAISONTM program (NWRI Software,2001).
RESULTS AND DISCUSSION
Amount of Solids in the Lake
The results obtained from Equation (1) are shownin Figures 9 and 10 for both TSS and TDS in the lake.
JOURNAL OF THE AMERICAN WATER RESOURCES ASSOCIATION 103 JAWRA
SOLIDS DISTRIBUTION IN LAKE CHAPALA, MEXICO
Figure 5a. Historical Behavior of TSSConcentration in the Santiago River.
Figure 5b. Curve of Frequency Distribution of TSSConcentration Data in the Santiago River.
Figure 6a. Historical Behavior of TDSConcentration in the Santiago River.
Figure 6b. Curve of Frequency Distribution of TDSConcentration Data in the Santiago River.
JAWRA 104 JOURNAL OF THE AMERICAN WATER RESOURCES ASSOCIATION
DE ANDA, SHEAR, MANIAK, ZARATE-DEL VALLE
Figure 7. Relationship Between TSS* Concentrationin Santiago River and Lake Depth.
Figure 8. Relationship Between TDS* Concentrationin Santiago River and Lake Depth
Figure 9. Historical Behavior of theCalculated Amount of TSS in the Lake.
Figure 10. Historical Behavior of theCalculated Amount of TDS in the Lake.
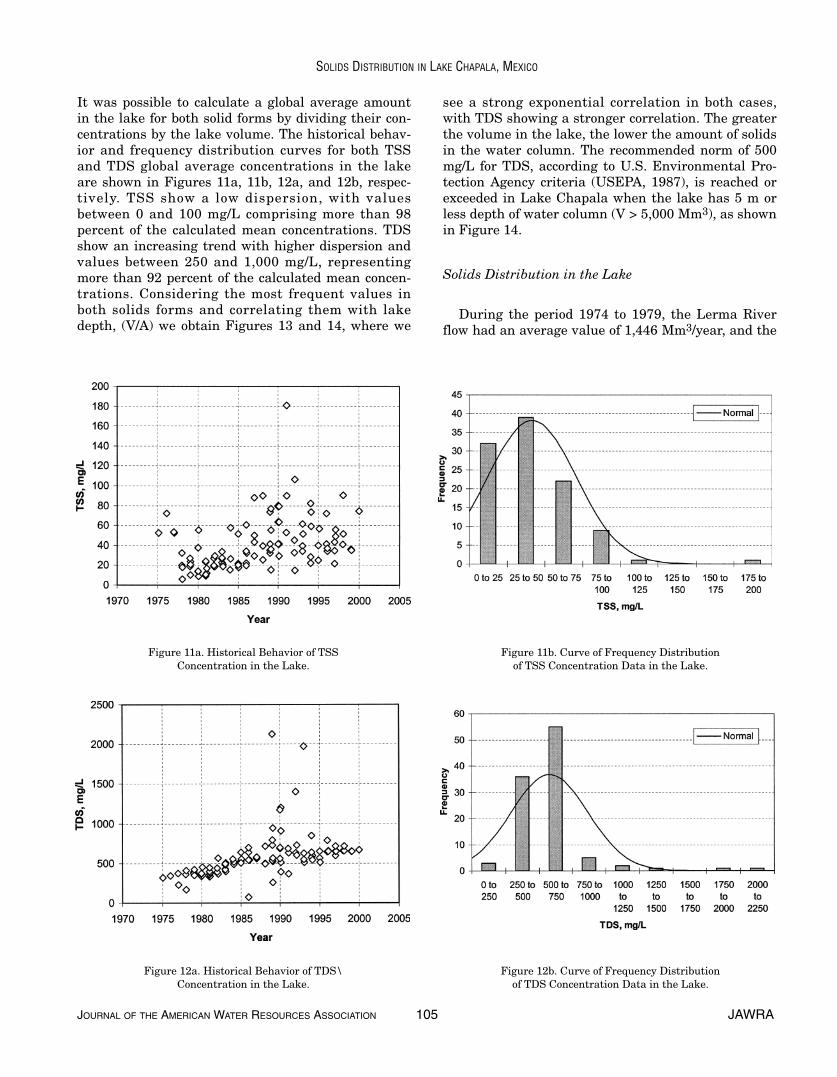
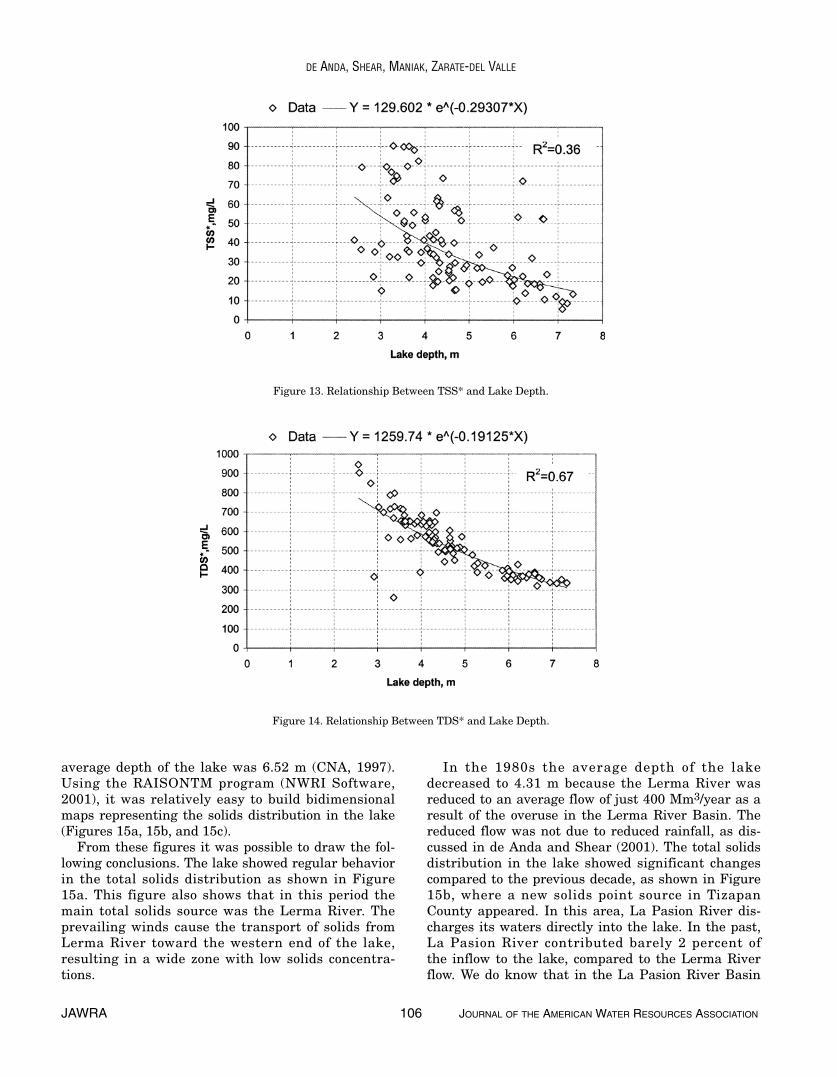
It was possible to calculate a global average amountin the lake for both solid forms by dividing their con-centrations by the lake volume. The historical behav-ior and frequency distribution curves for both TSSand TDS global average concentrations in the lakeare shown in Figures 11a, 11b, 12a, and 12b, respec-tively. TSS show a low dispersion, with valuesbetween 0 and 100 mg/L comprising more than 98percent of the calculated mean concentrations. TDSshow an increasing trend with higher dispersion andvalues between 250 and 1,000 mg/L, representingmore than 92 percent of the calculated mean concen-trations. Considering the most frequent values inboth solids forms and correlating them with lakedepth, (V/A) we obtain Figures 13 and 14, where we
see a strong exponential correlation in both cases,with TDS showing a stronger correlation. The greaterthe volume in the lake, the lower the amount of solidsin the water column. The recommended norm of 500mg/L for TDS, according to U.S. Environmental Pro-tection Agency criteria (USEPA, 1987), is reached orexceeded in Lake Chapala when the lake has 5 m orless depth of water column (V > 5,000 Mm3), as shownin Figure 14.
Solids Distribution in the Lake
During the period 1974 to 1979, the Lerma Riverflow had an average value of 1,446 Mm3/year, and the
JOURNAL OF THE AMERICAN WATER RESOURCES ASSOCIATION 105 JAWRA
SOLIDS DISTRIBUTION IN LAKE CHAPALA, MEXICO
Figure 11a. Historical Behavior of TSSConcentration in the Lake.
Figure 11b. Curve of Frequency Distributionof TSS Concentration Data in the Lake.
Figure 12b. Curve of Frequency Distributionof TDS Concentration Data in the Lake.
Figure 12a. Historical Behavior of TDS\Concentration in the Lake.
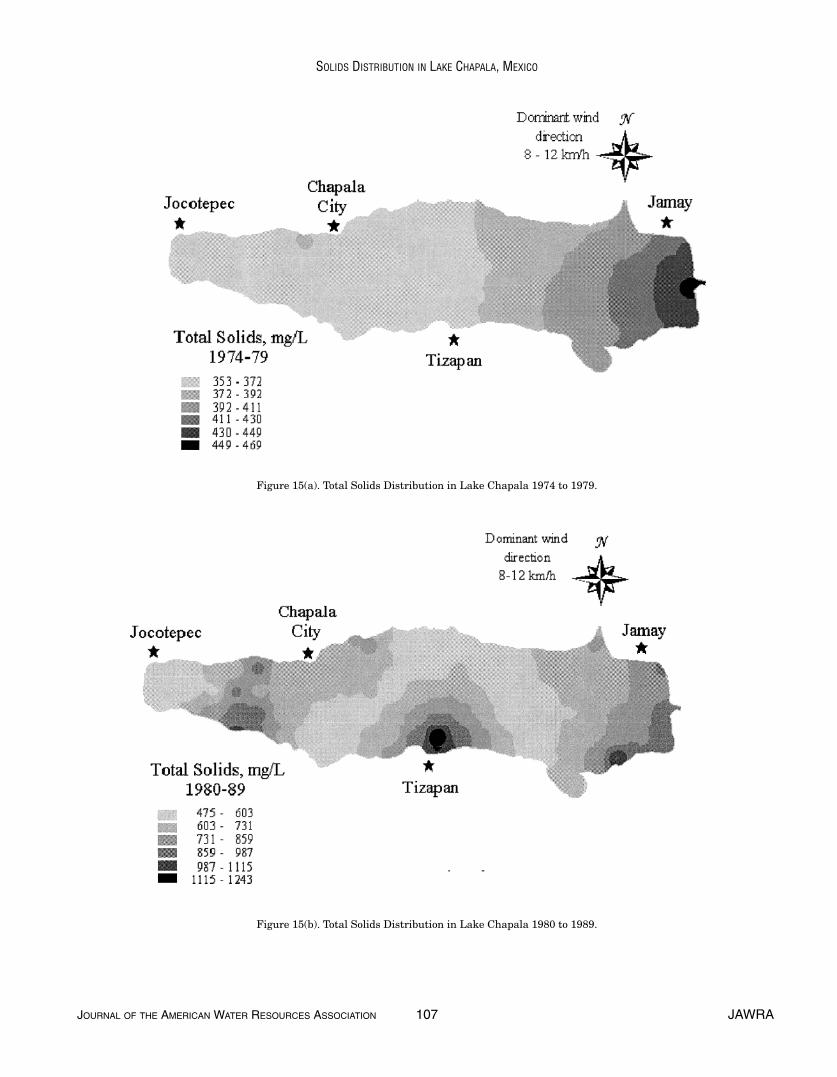
average depth of the lake was 6.52 m (CNA, 1997).Using the RAISONTM program (NWRI Software,2001), it was relatively easy to build bidimensionalmaps representing the solids distribution in the lake(Figures 15a, 15b, and 15c).
From these figures it was possible to draw the fol-lowing conclusions. The lake showed regular behaviorin the total solids distribution as shown in Figure15a. This figure also shows that in this period themain total solids source was the Lerma River. Theprevailing winds cause the transport of solids fromLerma River toward the western end of the lake,resulting in a wide zone with low solids concentra-tions.
In the 1980s the average depth of the lakedecreased to 4.31 m because the Lerma River wasreduced to an average flow of just 400 Mm3/year as aresult of the overuse in the Lerma River Basin. Thereduced flow was not due to reduced rainfall, as dis-cussed in de Anda and Shear (2001). The total solidsdistribution in the lake showed significant changescompared to the previous decade, as shown in Figure15b, where a new solids point source in TizapanCounty appeared. In this area, La Pasion River dis-charges its waters directly into the lake. In the past,La Pasion River contributed barely 2 percent of the inflow to the lake, compared to the Lerma Riverflow. We do know that in the La Pasion River Basin
JAWRA 106 JOURNAL OF THE AMERICAN WATER RESOURCES ASSOCIATION
DE ANDA, SHEAR, MANIAK, ZARATE-DEL VALLE
Figure 13. Relationship Between TSS* and Lake Depth.
Figure 14. Relationship Between TDS* and Lake Depth.
JOURNAL OF THE AMERICAN WATER RESOURCES ASSOCIATION 107 JAWRA
SOLIDS DISTRIBUTION IN LAKE CHAPALA, MEXICO
Figure 15(a). Total Solids Distribution in Lake Chapala 1974 to 1979.
Figure 15(b). Total Solids Distribution in Lake Chapala 1980 to 1989.
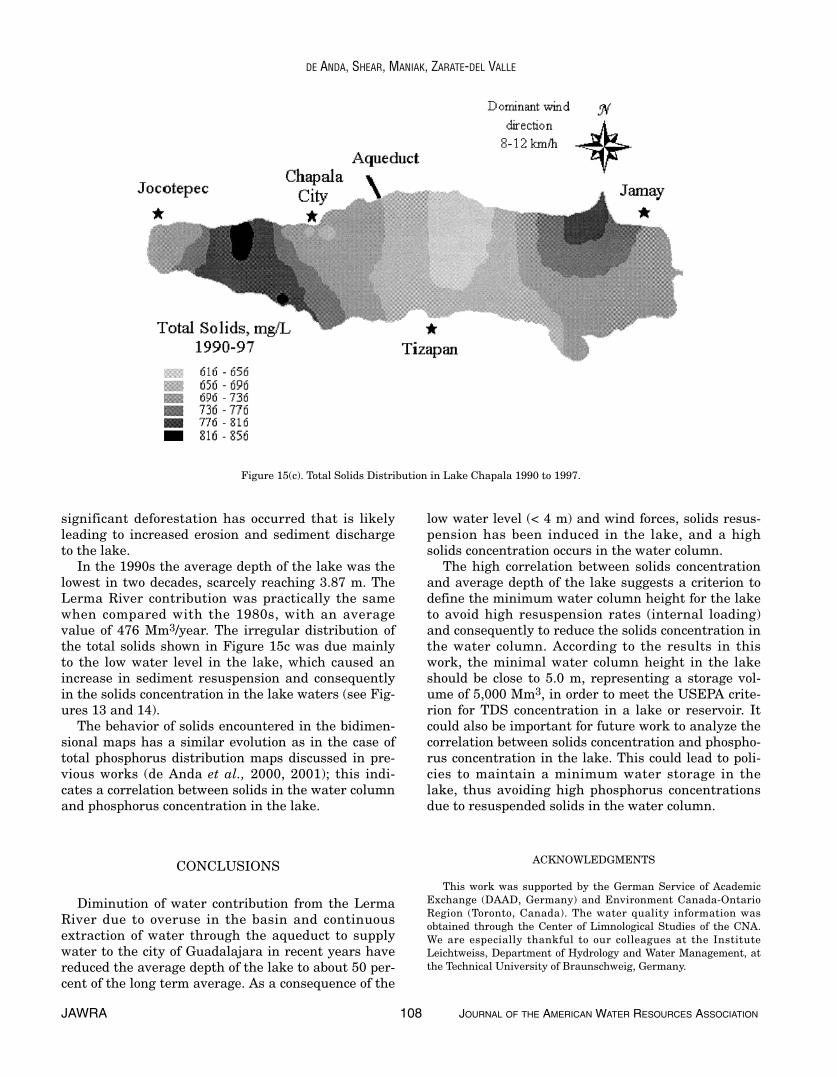
significant deforestation has occurred that is likelyleading to increased erosion and sediment dischargeto the lake.
In the 1990s the average depth of the lake was thelowest in two decades, scarcely reaching 3.87 m. TheLerma River contribution was practically the samewhen compared with the 1980s, with an averagevalue of 476 Mm3/year. The irregular distribution ofthe total solids shown in Figure 15c was due mainlyto the low water level in the lake, which caused anincrease in sediment resuspension and consequentlyin the solids concentration in the lake waters (see Fig-ures 13 and 14).
The behavior of solids encountered in the bidimen-sional maps has a similar evolution as in the case oftotal phosphorus distribution maps discussed in pre-vious works (de Anda et al., 2000, 2001); this indi-cates a correlation between solids in the water columnand phosphorus concentration in the lake.
CONCLUSIONS
Diminution of water contribution from the LermaRiver due to overuse in the basin and continuousextraction of water through the aqueduct to supplywater to the city of Guadalajara in recent years havereduced the average depth of the lake to about 50 per-cent of the long term average. As a consequence of the
low water level (< 4 m) and wind forces, solids resus-pension has been induced in the lake, and a highsolids concentration occurs in the water column.
The high correlation between solids concentrationand average depth of the lake suggests a criterion todefine the minimum water column height for the laketo avoid high resuspension rates (internal loading)and consequently to reduce the solids concentration inthe water column. According to the results in thiswork, the minimal water column height in the lakeshould be close to 5.0 m, representing a storage vol-ume of 5,000 Mm3, in order to meet the USEPA crite-rion for TDS concentration in a lake or reservoir. Itcould also be important for future work to analyze thecorrelation between solids concentration and phospho-rus concentration in the lake. This could lead to poli-cies to maintain a minimum water storage in thelake, thus avoiding high phosphorus concentrationsdue to resuspended solids in the water column.
ACKNOWLEDGMENTS
This work was supported by the German Service of AcademicExchange (DAAD, Germany) and Environment Canada-OntarioRegion (Toronto, Canada). The water quality information wasobtained through the Center of Limnological Studies of the CNA.We are especially thankful to our colleagues at the InstituteLeichtweiss, Department of Hydrology and Water Management, atthe Technical University of Braunschweig, Germany.
JAWRA 108 JOURNAL OF THE AMERICAN WATER RESOURCES ASSOCIATION
DE ANDA, SHEAR, MANIAK, ZARATE-DEL VALLE
Figure 15(c). Total Solids Distribution in Lake Chapala 1990 to 1997.
LITERATURE CITED
American Public Health Association, 1998. 2540 Solids. StandardMethods for the Examination of Water and Wastewater, 20thEdition. Leonore S. Clesceri, Arnold E. Greenberg, and AndrewD. Eaton (Editors). Prepared and published jointly by AmericanPublic Health Association, American Water Works Association,Water Environment Federation. American Public Health Associ-ation, ISBN 0-87553-235-7, pp. 2-54 to 2-60.
CNA (Comisión Nacional del Agua), 1997. Datos de las estacionesde monitoreo de calidad de agua del Lago de Chapala. Centro deEstudios Limnológicos. Gerencia Regional Lerma-Balsas,Guadalajara, Jalisco, México.
de Anda, J., S.E. Quiñones, R. French, and M. Guzmán, 1998.Hydrologic Balance of Lake Chapala (Mexico). Journal of theAmerican Water Resources Association 34(6):1319-1331.
de Anda, J. and H. Shear, 2001. Nutrients and Eutrophication inthe Lake Chapala Basin. In: Lerma-Chapala Watershed: Evalu-ation and Management, A. Hansen and M. van Afferden (Edi-tors). Kluwer Academic/Plenum Publishers, Monograph Series,New York, New York, Chapter 8, 369 pp.
de Anda, J., H. Shear, U. Maniak, and G. Riedel, 2000. PhosphorusBalance in Lake Chapala (Mexico). Journal of Great LakesResearch 26(2):129-140.
de Anda, J., H. Shear, U. Maniak, and G. Riedel, 2001. PhosphateBalance in Lake Chapala (Mexico). Journal of Lakes and Reser-voirs, Research and Management 6:313-321.
Fernex F., P. Zárate-del Valle, H. Ramírez-Sánchez, F. Michaud, C. Parron, J. Dalmasso, G. Barci-Funel, and M. Guzmán Arroyo,2001. Sedimentation Rates in Lake Chapala (Western Mexico):Possible Active tectonic Control. Chem. Geol. 177(3-4):213-228.
Fisher, N.I., T. Lewis, and B.J.J. Embleton, 1987. Statistical Analy-sis of Spherical Data, Cambridge University Press, 329 pp.
Fitch, Robert K., 2001. WinSTAT ® for Microsoft ® Excel, Version2001.1. Copyright © 2001, Robert K. Fitch, All rights reserved,R. Fitch Software.
Garduño-Monroy, V. H., J. Spinnler, and E. Ceragioli, 1993. Geolog-ical Study of the Chapala Rift, State of Jalisco, Mexico. GeofísicaInternacional 32(3):487-499.
Hansen, A. and M. van Afferden (Editors), 2001. Lerma-ChapalaWatershed: Evaluation and Management. Kluwer Academic/Plenum Publishers, Monograph Series, New York, New York.
Lind, O.T., L.O. Dávalos-Lind, T. H. Chrazanowski, and J.G. Limón,1994. Inroganic Turbidity and Failure of Fishery Models. Int.Revue ges. Hydrobiol. 79:7-16.
Lind, O.T., R. Doyle, D.S. Vodopich, B.G. Trotter, J.G. Limón, andL.O. Dávalos-Lind, 1992. Clay Turbidity: Regulation of Phyto-plankton Production in a Large, Nutrient-Rich Tropical Lake.Limnol. Oceanogr. 37(3):549-565.
Linsey, R.K., J.B. Franzini, D.L. Freyberg, and G. Tchobanoglous,1992. Water-Resources Engineering (Fourth Edition). McGraw-Hill, Inc., ISBN-0-07-038010-4, 841 pp.
Mitchell, M.K. and W.B. Stapp, 1992. Field Manual for Water Qual-ity Monitoring. Thomson-Shore Printers, Dexter, Michigan.
NWRI Software, 2001. RAISON for Windows Version 1.0. NationalWater Research Institute, Canada Centre for Inland Waters,Burlington, Ontario, Canada.
Peavy, H.S., D.R. Rowe, and G. Tchobanoglous,1985. Environmen-tal Engineering. Part 1: Water. McGraw-Hill, Inc., ISBN 0-07-049134-8, 699 pp.
Ramirez-Sanchez, H.U., 1998. Détermination des taux de sédimen-tation dans le Lac Chapala (Mexique) par les méthodesradiometriques. D.E.A. Géosciences de l’Environnement,CEREGE, Université d’Aix-Marseille III.
Rosas-Elguera, J., L. Ferrari, M. Lopez Martínez, and J. Urrutia-Fucugauchi, 1997. Stratigraphy and Tectonics of the Guadala-jara Region and Triple-Junction Area, Western Mexico.International Geology Review 39:125-140.
Ryding S.-O. and W. Rast, 1989. The Control of Eutrophication ofLakes and Reservoirs. In: Man and the Biosphere Series, Vol. I,J.N.R. Jeffers (Editor). The Parthenon Publishing Group. ParkRidge, New Jersey.
SARH (Secretaría de Agricultura y Recursos Hidráulicos), 1981.Bathimetry of Lake Chapala. Comisión Nacional del Agua,Gerencia Regional Lerma-Balsas, Guadalajara, Jalisco. Mexico.
Shepard, D., 1968. A Two-Dimensional Interpolation Function forIrregularly-Spaced Data. Proc. 23rd National Conference ACM,ACM, pp. 517-524.
USEPA (U.S. Environmental Protection Agency), 1987. Quality Cri-teria for Water. EPA-440/5-86-001, U.S. Environmental Protec-tion Agency, Office of Water Regulations and Standards,Washington, D. C.
Zarate-del Valle, P.F., F. Michaud, C. Parron, G. Solana-Espinoza, I. Israde-Alcantara, H.U. Ramírez-Sánchez, and Francois Fer-nex, 2001. Geology, Sediments and Soils (Chapter 2). In: TheLerma-Chapala Watershed (Evaluation and Management), A. Hansen and M. van Afferden (Editors). Kluwer Academic/Plenum Publishers, 369 pp.
JOURNAL OF THE AMERICAN WATER RESOURCES ASSOCIATION 109 JAWRA
SOLIDS DISTRIBUTION IN LAKE CHAPALA, MEXICO


