Embed Size (px)
Citation preview
BEFORE
THE HON’BLE BIHAR ELECTRICITY REGULATORY COMMISSION
FILING OF THE PETITION FOR TRUE UP FOR FY 2016-17,
ANNUAL PERFORMANCE REVIEW (APR) FOR FY 2017-18
AND
ANNUAL REVENUE REQUIREMENT (ARR) FOR FY 2018-19
FILED BY,
SOUTH BIHAR POWER DISTRIBUTION COMPANY LIMITED, PATNA
CHIEF ENGINEER (COMMERCIAL), SBPDCL
2nd FLOOR, VIDYUT BHAWAN, BAILEY ROAD, PATNA - 800 001
Petition for True up for FY 2016-17, APR for 2017-18 and ARR for FY 2018-19
South Bihar Power Distribution Company Limited
BEFORE THE BIHAR ELECTRICITY REGULATORY COMMISSION, PATNA
IN THE MATTER OF: Filing of the Petition for True up for FY 2016-17, Annual Performance Review
(APR) for FY 2017-18, Annual Revenue Requirement (ARR) for FY 2018-19
under Bihar Electricity Regulatory Commission (Multi Year Distribution Tariff)
Regulations, 2015 and its amendments thereof along with the other guidelines
and directives issued by the BERC from time to time and under Section 45, 46,
47, 61, 62, 64 and 86 of The Electricity Act 2003 read with the relevant
guidelines.
AND
IN THE MATTER OF: South Bihar Power Distribution Company Limited (hereinafter referred to as
"SBPDCL” or “Petitioner” which shall mean for the purpose of this petition the
Licensee),having its registered office at Vidyut Bhawan, Bailey Road, Patna.
The Petitioner respectfully submits as under: -
1. The Petitioner was formerly integrated as a part of the Bihar State Electricity Board (hereinafter
referred to as “BSEB” or “Board”) which was engaged in electricity generation, transmission,
distribution and related activities in the State of Bihar.
2. The Board is now unbundled into five (5) successor companies – Bihar State Power (Holding)
Company Limited, Bihar State Power Generating Company Limited (hereinafter referred to as
“BSPGCL”), Bihar State Power Transmission Company Limited (hereinafter referred to as
“BSPTCL”), North Bihar Power Distribution Company Limited and South Bihar Power
Distribution Company Limited (hereinafter referred to as “Discoms”) as per Energy Department,
Government of Bihar Notification no:
under The Bihar State Electricity Reforms Transfer Scheme 2012.
3. Pursuant to the enactment of the Electricity Act, 2003, every utility is required to submit its
Aggregate Revenue Requirement (ARR) for the control period and Tariff Petitions as per
procedures outlined in section 61, 62 and 64, of Electricity Act 2003, and the governing
regulations thereof.
4. The Petition for True-up for FY 2015-16, Annual Performance Review (APR) for the FY 2016-
17 and Annual Revenue Requirement (ARR) for FY 2017-18 was filed by South Bihar Power
Distribution Company Limited (SBPDCL) on 06.12.2016, and accordingly the Hon’ble
Commission had issued the relevant tariff order on 24.03.2017.
5. The present petition is filed with the Hon’ble Commission for True up for FY 2016-17, Annual
Performance Review (APR) of FY 2017-18, and estimating the Annual Revenue Requirement
(ARR) for FY 2018-19.
Petition for True up for FY 2016-17, APR for 2017-18 and ARR for FY 2018-19
South Bihar Power Distribution Company Limited
6. This Petition has been prepared in accordance with the provisions of Sections 61 and 62 of the
Electricity Act, 2003 and has taken into consideration the Bihar Electricity Regulatory
Commission (Multi Year Distribution Tariff) Regulations, 2015, Bihar Electricity Regulatory
Commission (Multi Year Distribution Tariff) (First Amendment) Regulations, 2017, other
amendments and orders issued by the Hon’ble Commission from time to time.
7. SBPDCL along with this petition is submitting the regulatory formats with data & information to
an extent applicable and would make available any further information/ additional data required
by the Hon’ble Commission during the course of proceedings.
Prayers to the Commission:
The Petitioner respectfully prays that the Hon’ble Commission may:
a. Admit this Petition;
b. Examine the proposal submitted by the Petitioner in the enclosed petition for a favorable
dispensation;
c. Approve the Annual Revenue Requirement (ARR) for FY 2018-19 under Bihar Electricity
Regulatory Commission (Multi Year Distribution Tariff) Regulations, 2015, Bihar Electricity
Regulatory Commission (Multi Year Distribution Tariff) (First Amendment) Regulations, 2017,
other amendments and orders issued by the Hon’ble Commission from time to time.
d. Pass suitable Orders with respect to the True up for FY 2016-17, Annual Performance Review
(APR) for FY 2017-18, and Annual Revenue Requirement (ARR) for FY 2018- 19.
e. Approve the proposed tariff schedule along with open access charges and the schedule for
general and miscellaneous charges as proposed in this petition for different category of
consumers to be made applicable from 1st April, 2018.
f. Pass separate Order for the Petitioner against the present petition;
g. SBPDCL may also be permitted to propose suitable changes to the respective ARRs, prior to
the final approval by the Hon’ble Commission. SBPDCL believes that such an approach would
go a long way towards providing a fair treatment to all the stakeholders and may eliminate the
need for a review or clarification.
h. Condone any inadvertent omissions / errors / shortcomings and permit SBPDCL to add /
change / modify / alter this filing and make further submissions as may be required at a future
date.
i. Pass such Order, as the Hon’ble Commission may deem fit and appropriate keeping in view
the facts and circumstances of the case.
South Bihar Power Distribution Company Limited, PatnaPetitioner
Location: PatnaDate: 05/12/2017
Petition for True up for FY 2016-17, APR for 2017-18 and ARR for FY 2018-19
South Bihar Power Distribution Company Limited
Table of Contents
1. Introduction.................................................................................................................... 11
1.1. Background............................................................................................................................................. 11
1.2. Profile of SBPDCL..................................................................................................................................12
1.3. Procedural History..................................................................................................................................14
1.4. Judgment of Hon’ble APTEL on Appeal No. 141 and Appeal No. 142 of 2016 ................................15
1.5. BERC Order against the Judgment of Hon’ble APTEL on Appeal No. 141 and Appeal No. 142 of
2016 17
1.6. Appeal No. 154 and Appeal No. 155 of 2017.......................................................................................17
1.7. Instant Petition ........................................................................................................................................17
1.8. Contents of the Petition ........................................................................................................................ 18
2. Overall approach for present filing .................................................................................. 19
2.1. Present Approach...................................................................................................................................19
2.2. Data and information sources for estimating the Aggregate Revenue Requirement........................19
3. True-up Summary for FY 2016-17 ....................................................................................20
3.1. Preamble................................................................................................................................................20
3.2. Number of Consumers, Connected Load and Sales ..........................................................................20
3.3. Distribution Loss .................................................................................................................................... 27
3.4. Transmission losses..............................................................................................................................28
3.5. Power Purchase ....................................................................................................................................28
3.6. Actual Power Purchase quantum......................................................................................................... 29
3.7. Energy Balance ......................................................................................................................................31
3.8. Power Purchase Cost ........................................................................................................................... 32
3.9. Transmission charges ........................................................................................................................... 36
3.10. Disallowance of power purchase due to excess Distribution loss ................................................... 36
3.11. Capital Investment Plan, Capitalization and Funding.......................................................................38
3.12. Gross Fixed Assets ............................................................................................................................. 39
3.13. Depreciation ........................................................................................................................................ 39
3.14. Other finance charges ........................................................................................................................40
3.15. Operation & Maintenance charges .....................................................................................................41
3.16. Interest on working capital.................................................................................................................. 44
3.17. Return on Equity.................................................................................................................................. 46
3.18. Interest on Loans ................................................................................................................................ 46
3.19. Interest on Consumer Security Deposit.............................................................................................48
3.20. Net Prior Period Credit / (Charges).................................................................................................... 49
3.21. Provision for RPO ............................................................................................................................... 49
3.22. Non-Tariff income................................................................................................................................ 49
3.23. Revenue from Sale of Power at Existing Tariff ................................................................................. 50
3.24. Net ARR and revenue gap for FY 2016-17 ........................................................................................51
4. APR Summary for FY 2017-18 ......................................................................................... 53
4.1. Preamble................................................................................................................................................ 53
Petition for True up for FY 2016-17, APR for 2017-18 and ARR for FY 2018-19
South Bihar Power Distribution Company Limited
4.2. Estimate of category wise number of consumers, connected load and sales for FY 2017-18........ 53
4.3. Distribution Loss .................................................................................................................................... 56
4.4. State Transmission losses.................................................................................................................... 57
4.5. Central Transmission Loss ................................................................................................................... 57
4.6. Power Purchase .................................................................................................................................... 57
4.7. Energy Balance ..................................................................................................................................... 63
4.8. Power Purchase Cost ........................................................................................................................... 65
4.9. Transmission Charges .......................................................................................................................... 69
4.10. Capital Investment Plan, Capitalization and Funding....................................................................... 69
4.11. Operation & Maintenance (O&M) Expenses ......................................................................................71
4.12. Gross Fixed Assets ............................................................................................................................. 76
4.13. Depreciation on Gross Fixed Assets ................................................................................................. 76
4.14. Return of Equity................................................................................................................................... 78
4.15. Interest on Consumer Security Deposit............................................................................................. 79
4.16. Interest on Working Capital ................................................................................................................ 79
4.17. Subsidy Details.................................................................................................................................... 81
4.18. Non-Tariff Income ............................................................................................................................... 81
4.19. Interest on Normative Debt ................................................................................................................ 81
4.20. Other Finance Charges ......................................................................................................................83
4.21. Revenue from Sale of Power at Existing Tariff .................................................................................83
4.22. Net ARR and Revenue Gap for FY 2017-18.....................................................................................84
5. Annual Revenue Requirement (ARR) for FY 2018-19 .........................................................86
5.1. Preamble................................................................................................................................................86
5.2. Historical Assessment of Number of Consumers and Sales .............................................................86
5.3. Projected Sales (MU), Number of Consumers and Connected Load for FY 2018-19 .....................88
5.4. Detailed category-wise projections for ARR period FY 2018-19 ........................................................91
5.5. Distribution Loss .................................................................................................................................... 99
5.6. State Transmission Losses................................................................................................................. 102
5.7. Central Transmission Losses ............................................................................................................. 102
5.8. Power Purchase .................................................................................................................................. 102
5.9. Renewable Power Purchase Obligation ............................................................................................ 107
5.10. Energy Balance ................................................................................................................................. 108
5.11. Power Purchase Cost ....................................................................................................................... 109
5.12. Transmission Charges ....................................................................................................................... 113
5.13. Capital Investment Plan, Capitalization and Funding .......................................................................114
5.14. Gross Fixed Assets ............................................................................................................................ 115
5.15. Depreciation on GFA..........................................................................................................................116
5.16. Interest on project Loans....................................................................................................................118
5.17. Other Financial Charges ................................................................................................................... 120
5.18. Operation & Maintenance (O&M) Expenses .................................................................................... 121
5.19. Return on Equity................................................................................................................................ 124
5.20. Interest on Consumer Security Deposit ............................................................................................125
Petition for True up for FY 2016-17, APR for 2017-18 and ARR for FY 2018-19
South Bihar Power Distribution Company Limited
5.21. Interest on Working Capital............................................................................................................... 126
5.22. Non-Tariff Income...............................................................................................................................127
5.23. Revenue from Sale of Power at Existing Tariff ................................................................................ 128
5.24. Net ARR for FY 2018-19................................................................................................................... 129
5.25. Net Gap at Existing Tariff .................................................................................................................. 129
5.26. Revenue from Sale of Power at Proposed Tariff ............................................................................. 130
5.27. Revenue gap for FY 2018-19 at proposed tariff ............................................................................... 131
6. Revenue Gap and Regulatory Asset ...............................................................................132
6.1. Background...........................................................................................................................................132
7. Voltage-wise cost of supply ...........................................................................................135
7.1. Preamble...............................................................................................................................................135
7.2. Background...........................................................................................................................................135
7.3. Methodology adopted for Computation of Voltage wise Cost of Supply ...........................................135
7.4. Determination of Voltage wise Losses ............................................................................................... 136
7.5. Information required for arriving Voltage Wise Cost of Supply...........................................................137
7.6. Methodology adopted for determination of Cost of Supply ............................................................... 138
8. Miscellaneous and General Charges............................................................................... 141
8.1. Schedule of Miscellaneous and General Charges .............................................................................141
8.2. Meter Rent ............................................................................................................................................141
8.2.1. Background........................................................................................................................................141
8.2.2. Existing Meter Rent .......................................................................................................................... 142
8.2.3. Meter Cost ........................................................................................................................................ 143
8.2.4. Meter Cost Realization ..................................................................................................................... 144
8.2.5. Requirement for revising existing Meter Rent ................................................................................. 144
8.2.6. State wise Comparison of Meter rent and Understanding ..............................................................145
8.2.7. Proposed Monthly Meter Rent......................................................................................................... 148
8.3. SLC charges ........................................................................................................................................ 149
8.4. Security Deposit.................................................................................................................................... 151
8.5. Interest on Security Deposit ................................................................................................................. 151
9. Proposed Tariff Schedule for FY 2018-19 ........................................................................152
9.1. Simplification of tariff structures for electricity consumers in Bihar .....................................................152
9.2. Tariff schedule for consumers under DDG scheme of DDUGJY ..................................................... 163
9.3. Terms and Conditions of Low Tension Tariff ..................................................................................... 164
10. Wheeling and Open Access Charges ..............................................................................173
10.1. Background.........................................................................................................................................173
10.4. Wheeling Charges..............................................................................................................................173
10.5. Cross Subsidy Surcharge ..................................................................................................................175
10.6. Reactive Energy charges...................................................................................................................176
10.7. Standby Charges................................................................................................................................176
10.8. Roadmap for reduction of Cross Subsidy Surcharge.......................................................................176
11. Implementation of UDAY ...............................................................................................179
11.1. Background.........................................................................................................................................179
Petition for True up for FY 2016-17, APR for 2017-18 and ARR for FY 2018-19
South Bihar Power Distribution Company Limited
11.2. Overview of the scheme ....................................................................................................................179
Annexure A – Additional Formats ..............................................................................................187
A.1. Annexure – I – Profile of SBPDCL.........................................................................................................187
A.2. Annexure – II (A) – Category wise Number of Consumers in past 4 years ........................................187
A.3. Annexure– II (B) – Category wise sanctioned / contracted Load in past 4 years .............................187
A.4. Annexure – II (C) – Category wise Energy sales in past 4 years ....................................................... 188
A.5. Annexure – II (D) – Category wise Number of Consumers of Gaya DF in past 4 years .................. 189
A.6. Annexure – II (E) – Category wise sanctioned / contracted Load of Gaya DF in past 4 years ........ 189
A.7. Annexure – II (F) – Category wise Energy sales of Gaya DF in past 4 years ................................... 190
A.8. Annexure– II (G) – Category wise Number of Consumers of Bhagalpur DF in past 4 years .......... 190
A.9. Annexure – II (H) – Category wise sanctioned / contracted Load of Bhagalpur DF in past 4 years.191
A.10. Annexure – II (I) – Category wise Energy sales of Bhagalpur DF in past 4 years......................... 192
A.11. Annexure – III (A) : Input Energy to DF Gaya.................................................................................... 192
A.12. Annexure – III (B) : Input Energy to DF Bhagalpur ........................................................................... 193
A.13. Annexure – IV : RPO Obligation achieved during FY 2016-17 ........................................................ 193
A.14. Annexure – V : Resource Gap Grants received from state government in FY 2016-17 ................ 193
A.15. Annexure – VI : Open Access consumers during FY 2016-17 ......................................................... 194
A.16. Annexure – VII : Demand based LT Consumers during FY 2016-17 .............................................. 194
A.17. Annexure – VIII : Rebate or Late Payment Charges during FY 2016-17 ........................................ 194
A.18. Annexure – IX : Details of Energy Scheduled and Actual drawal during FY 2016-17 .................... 194
A.19. Annexure – XI : Details of Central and State transmission losses during FY 2016-17 .................. 196
A.20. Annexure – XII (A) : Scheme-wise details of capital expenditure and capitalization along with source
of funding for FY 2016-17 ..............................................................................................................................197
A.21. Annexure – XII (B) : Scheme-wise details of capital expenditure and capitalization along with source
of funding for FY 2017-18 ............................................................................................................................. 199
A.22. Annexure – XII (C): Scheme-wise details of capital expenditure and capitalization along with source
of funding for FY 2018-19 ............................................................................................................................. 201
A.23. Annexure – XIII : Revenue at Existing Tariff for FY 2018-19 ...........................................................203
A.24. Proforma-I: Month-wise, Category-Wise energy sales during FY 2015-16 .....................................206
A.25. Proforma-II: Month wise Category-wise sales during FY 2016-17...................................................208
A.26. Proforma-IV: Month wise, Station/source-Wise energy procurement during FY 2015-16 ............. 210
A.27. Proforma-V : Month wise, Station/source-Wise energy procurement during FY 2016-17 ............ 212
A.28. Proforma-VI: Month wise, Station/source-Wise energy procurement during FY 2017-18 ..............215
A.29. Proforma VII: Month wise, Station/source-Wise energy procurement during FY 2018-19 ............ 218
Annexure B – Additional Data Submission to BERC....................................................................221
Petition for True up for FY 2016-17, APR for 2017-18 and ARR for FY 2018-19
South Bihar Power Distribution Company Limited
List of Tables
Table 1: Existing distribution infrastructure of SBPDCL .......................................................................................12
Table 2: Discoms’ Areas and Circles....................................................................................................................12
Table 3: Discoms’ Circles & Other Establishment ................................................................................................13
Table 4: Procedural History of Filing ....................................................................................................................14
Table 5: Highlights of the Hon’ble APTEL Judgment dated 25.11.2016 ..............................................................16
Table 6: Number of Consumers as on 31st March 2017.......................................................................................20
Table 7: No. of Consumers of Gaya Distribution Franchisee ...............................................................................21
Table 8: No. of Consumers of Bhagalpur Distribution Franchisee .......................................................................22
Table 9: Total connected load (in kW) as on 31st March 2017.............................................................................23
Table 10: Total connected load (in kW) of Bhagalpur Distribution Franchisee Area............................................24
Table 11: Total connected load (in kW) of Gaya Distribution Franchisee Area ...................................................24
Table 12: Total Energy Sales (in MU) for FY 2016-17 .........................................................................................25
Table 13: Total Energy Sales for FY 2016-17 ......................................................................................................26
Table 14: Total Energy Sales (in MU) for Bhagalpur Distribution Franchisee......................................................26
Table 15: Total Energy Sales (in MU) for Gaya Distribution Franchisee .............................................................26
Table 16: Distribution Losses (in %).....................................................................................................................27
Table 17: Renewable Purchase Obligation (%) ...................................................................................................29
Table 18: RPO met for FY 2016-17 (in INR Crore) ..............................................................................................29
Table 19: Actual Power Purchased (MU) in FY 2016-17 .....................................................................................29
Table 20: Energy balance (MU) in FY 2016-17....................................................................................................31
Table 21: Actual Power Purchased (MU) in FY 2016-17 .....................................................................................33
Table 22: PGCIL, POSCO and ERLDC charges..................................................................................................36
Table 23: State transmission charges ..................................................................................................................36
Table 24: Disallowance of power purchase cost due to excess distribution loss (in INR Crore) .........................38
Table 25: CWIP, Capex, Capitalization and Funding (in INR Crore) ...................................................................38
Table 26: Gross Fixed Assets (in INR Crore) .......................................................................................................39
Table 27: Depreciation (in INR Crore) .................................................................................................................40
Table 28: Other Finance charges (in INR Crore) .................................................................................................41
Table 29: Employee expenses (in INR Crore)......................................................................................................41
Table 30: R&M expenses (in INR Crore)..............................................................................................................42
Table 31: A&G expenses (in INR Crore) ..............................................................................................................43
Table 32: Holding cost (in INR Crore) ..................................................................................................................43
Table 33: O&M expenses (in INR Crore)..............................................................................................................44
Table 34: Interest on working capital (in INR Crore) ............................................................................................45
Table 35: Return on equity (in INR Crore)............................................................................................................46
Table 36: Interest on Loans Claimed for FY 2016-17 (in INR Crore)...................................................................46
Table 37: Interest on Loans Claimed for FY 2016-17 (in INR Crore)...................................................................47
Table 38: Interest on Consumer Security Deposit (in INR Crore) ........................................................................48
Table 39: Prior period (expense)/income (in INR Crore)......................................................................................49
Table 40: Provision for RPO (in INR Crore) .........................................................................................................49
Table 41: Non-Tariff Income (in INR Crore) .........................................................................................................49
Petition for True up for FY 2016-17, APR for 2017-18 and ARR for FY 2018-19
South Bihar Power Distribution Company Limited
Table 42: Revenue from sales of power at existing tariff .....................................................................................50
Table 43: Net ARR and revenue gap for FY 2016-17 (in INR Crore)...................................................................51
Table 44: Category-wise no. of consumers projected for FY 2017-18.................................................................54
Table 45: Category-wise sales (MUs) projected for FY 2017-18 .........................................................................55
Table 46: Category-wise connected load (kW) for FY 2017-18 ...........................................................................56
Table 47: Distribution loss trajectory ....................................................................................................................57
Table 48: Details of RPO to be met for APR ........................................................................................................58
Table 49: Power purchase Allocation projected for FY 2017-18 (in MW) ............................................................59
Table 50: Total power purchase for APR (in MU).................................................................................................62
Table 51: Energy Balance for APR FY 2017-18...................................................................................................64
Table 52: Power Purchase Projection for APR (in MW).......................................................................................66
Table 53: Transmission charges for APR (in INR Crore) .....................................................................................69
Table 54: Capitalization plan for FY 2017-18 (in INR Crore)................................................................................70
Table 55: CWIP, Capitalization and Funding of Capitalization projected for FY 2017-18 (in INR Crore) ............70
Table 56: Employee Expenses for APR (in INR Crore)........................................................................................72
Table 57: Calculation of “K” Factor for FY 2017-18..............................................................................................73
Table 58: R&M Expenses for APR (in INR Crore)................................................................................................73
Table 59: A&G Expenses for APR (in INR Crore) ................................................................................................74
Table 60: Allocation of Holding Company Cost for APR (in INR Crore)...............................................................75
Table 61: Summary of O&M Expenses for APR (in INR Crore) ...........................................................................75
Table 62: Summary GFA for FY 2017-18 (in INR Crore) .....................................................................................76
Table 63: Depreciation on GFA for APR (in INR Crore).......................................................................................77
Table 64: Return on equity for APR (in INR Crore) ..............................................................................................78
Table 65: Interest on consumer security deposit (in INR Crore) ..........................................................................79
Table 66: Interest on working capital for APR (in INR Crore)...............................................................................80
Table 67: Non-tariff income for APR (in INR Crore) .............................................................................................81
Table 68: Net-Non-tariff income for APR (in INR Crore) ......................................................................................81
Table 69: Computation of weighted average rate of interest on project loans .....................................................82
Table 70: Interest on Normative debt (in INR Crore)............................................................................................83
Table 71: Other finance charges (in INR Crore) ...................................................................................................83
Table 72: Revenue from sales of power at existing tariff for FY 2017-18 (in INR Crore).....................................83
Table 73: Revenue requirement for FY 2017-18 (in INR Crore) ..........................................................................84
Table 74: Net ARR & Revenue Gap for FY 2017-18 (in INR Crore) ....................................................................85
Table 75: Unrecovered Gap for FY 2016-17 (in INR Crore).................................................................................85
Table 76: Category wise number of consumer for past few years .......................................................................86
Table 77: Category wise sales for the past few years (in MU) .............................................................................87
Table 78: Category-wise no. of consumers projected for FY 2018-19.................................................................88
Table 79: Category-wise no. of consumers projected for Bhagalpur area in FY 2018-19 ...................................89
Table 80: Category-wise sales projected for FY 2018-19 ....................................................................................90
Table 81: Category-wise connected load (kW) projected for FY 2018-19 ...........................................................90
Table 82: Distribution Loss Trajectory ................................................................................................................101
Table 83: Power purchase Quantum for FY 2018-19 (in MW)...........................................................................103
Table 84: Total power purchase (MU) for FY 2018-19.......................................................................................105
Petition for True up for FY 2016-17, APR for 2017-18 and ARR for FY 2018-19
South Bihar Power Distribution Company Limited
Table 85: Renewable energy purchase obligation for FY 2018-19 ....................................................................107
Table 86: Energy Balancing for ARR for FY 2018-19 ........................................................................................108
Table 87: Detailed power purchase costs for FY 2018-19 (in INR Crore)..........................................................110
Table 88: Transmission charges for ARR (in INR Crore) ...................................................................................113
Table 89: Capitalization in FY 2018-19 (in INR Crore).......................................................................................114
Table 90: Capital works in progress for ARR (in INR Crore)..............................................................................114
Table 91: GFA for ARR (in INR Crore) ...............................................................................................................115
Table 92: Depreciation on GFA (in INR Crore) ..................................................................................................117
Table 93: Detailed loan schedule for ARR (in INR Crore)..................................................................................118
Table 94: Weighted Average rate of Interest on project loans for FY 2018-19 ..................................................119
Table 95: Interest on normative debt for ARR (in INR Crore) ............................................................................120
Table 96: Other finance charges (in INR Crore).................................................................................................120
Table 97: Employee numbers for ARR...............................................................................................................121
Table 98: Employee expenses for ARR (in INR Crore)......................................................................................121
Table 99: Calculation of “K” Factor for FY 2018-19............................................................................................122
Table 100: R&M Expenses for APR (in INR Crore)............................................................................................122
Table 101: A&G expenses for ARR (in INR Crore) ............................................................................................123
Table 102: Holding company cost for ARR (in INR Crore).................................................................................124
Table 103: Return on equity for ARR (in INR Crore)..........................................................................................125
Table 104: Interest on consumer security deposits (in INR Crore) ....................................................................126
Table 105: Interest on working capital for ARR (in INR Crore) ..........................................................................127
Table 106: Non-tariff income for ARR (in INR Crore).........................................................................................128
Table 107: Revenue from sale of power at existing tariff for ARR (in INR Crore)..............................................128
Table 108: Net ARR for FY 2018-19 (in INR Crore)...........................................................................................129
Table 109: Unrecovered revenue gap for FY 2017-18.......................................................................................130
Table 110: Net revenue gap at existing tariff......................................................................................................130
Table 111: Total revenue from sale of power at proposed tariff ........................................................................130
Table 112: The revenue gap at proposed tariff for FY 2018-19 ........................................................................131
Table 113: Revenue Gap approved by the Hon’ble Commission for BSPHCL (in INR Crore)........................132
Table 114: Revenue Gap approved by the Commission up to FY 2013-14 for BSPHCL (in INR Crore)........132
Table 115: Revenue Gap approved by the Hon’ble Commission up to FY 2013-14 for BSHPCL (in INR Crore)
............................................................................................................................................................................133
Table 116: Voltage wise Technical losses considered for FY 2018-19 ............................................................137
Table 117: Classification of Categories on the basis of Voltage of power supply.............................................137
Table 118: Voltage wise Technical losses considered for FY 2018-19 ............................................................138
Table 119: Apportionment of technical losses to voltage wise sale ..................................................................138
Table 120: Apportionment of Commercial losses to voltage wise sale.............................................................138
Table 121: Allocation of power purchase cost to the total energy sales ...........................................................139
Table 122: Allocation of Network Cost...............................................................................................................139
Table 123: Cost of Supply at different Voltage Levels.......................................................................................140
Table 124: Existing Monthly Meter Rent............................................................................................................142
Table 125: Procurement cost of Meters ............................................................................................................143
Table 126: Cost Recovery time of meters (in Years) ........................................................................................144
Petition for True up for FY 2016-17, APR for 2017-18 and ARR for FY 2018-19
South Bihar Power Distribution Company Limited
Table 127: Comparison of meter rents across states in India ...........................................................................147
Table 128: Proposed Monthly Meter Rent.........................................................................................................148
Table 129: Application fee..................................................................................................................................149
Table 130: Meter testing fee ..............................................................................................................................149
Table 131: Meter testing fee for own installation ...............................................................................................149
Table 132: Removal/ refixing/ change of meter fee...........................................................................................150
Table 133: Reconnection charges .....................................................................................................................150
Table 134: Supervision, labour and establishment charges for service connection ..........................................150
Table 135: Proposed tariff structure for KJ category ..........................................................................................153
Table 136: Proposed tariff structure for DS category .........................................................................................154
Table 137: Proposed tariff structure for NDS category ......................................................................................155
Table 138: Proposed tariff structure for IAS category ........................................................................................156
Table 139: Proposed tariff structure for LTIS category ......................................................................................156
Table 140: Proposed tariff structure for PWW category.....................................................................................157
Table 141: Proposed tariff structure for SS category .........................................................................................157
Table 142: Proposed tariff structure for HT category .........................................................................................158
Table 143: Proposed tariff structure for RTS category.......................................................................................158
Table 144: Tariff schedule considering ‘Zero’ GoB Subsidy ..............................................................................160
Table 145: Net tariff to consumer considering same per unit GoB subsidy as provided for FY 2017-18 ..........161
Table 146: Revenue collection under DDG scheme ..........................................................................................164
Table 147: Proposed tariff rate for seasonal supply...........................................................................................171
Table 148: Allocation Matrix ...............................................................................................................................173
Table 149: Segregation of Wires and Retail Supply Costs ................................................................................174
Table 150: Wheeling Charges at 33 kV for FY 2018-19.....................................................................................174
Table 151: Wheeling charges at 11 kV for FY 2018-19 .....................................................................................174
Table 152: Power purchase cost for FY 2018-19...............................................................................................175
Table 153: Roadmap for reduction in cross subsidy ..........................................................................................178
Table 154: Targets defined under UDAY ...........................................................................................................180
Table 155: Progress made by SBPDCL as against UDAY targets ....................................................................182
Petition for True up for FY 2016-17, APR for 2017-18 and ARR for FY 2018-19
South Bihar Power Distribution Company Limited 11
1. Introduction
1.1. Background
1.1.1. Bihar State Electricity Board (“Board” or “BSEB”) originally constituted on 1st April 1958
under Section 5 of the Electricity (Supply) Act, 1948 and was engaged in the management
of electricity generation, transmission, distribution and related activities in the State of Bihar.
1.1.2. Under the new 'Bihar State Electricity Reforms Transfer Scheme 2012', the BSEB has been
unbundled into five companies:
a. Bihar State Power (Holding) Company Limited (BSPHCL),
b. Bihar State Power Transmission Company Limited (BSPTCL),
c. Bihar State Power Generation Company Limited (BSPGCL),
d. South Bihar Power Distribution Company Limited (SBPDCL),
e. North Bihar Power Distribution Company (NBPDCL)
with effect from 1st November’ 2012 vide notification no.
dated 30-10-2012.
a) “Bihar State Power (Holding) Company Limited” means the Company that will own
shares of newly incorporated reorganized four companies i.e. Bihar State Power
Generation Company Limited, Bihar State Power Transmission Company Limited,
South Bihar Power Distribution Company Limited, and North Bihar Power
Distribution Company Limited.
b) “Bihar State Power Generation Company Limited” means the Generating Company
to which the Generating Undertakings of the Board are to be transferred in
accordance with this Scheme.
c) “Bihar State Power Transmission Company Limited” means the Transmission
Company to which the Transmission Undertakings of the Board are to be transferred
in accordance with this Scheme.
d) “South Bihar Power Distribution Company Limited” And “North Bihar Power
Distribution Company Limited”, collectively mean the Distribution Companies, to
which the Distribution Undertakings of the Board are to be transferred in accordance
with this Scheme.
1.1.3. This Petition is being submitted separately by “South Bihar Power Distribution Company
Limited”.
Petition for True up for FY 2016-17, APR for 2017-18 and ARR for FY 2018-19
South Bihar Power Distribution Company Limited 12
1.2. Profile of SBPDCL
1.2.1. SBPDCL is a company registered under the provisions of the Companies Act 1956 and is
a fully owned subsidiary Company of BSPHCL.
1.2.2. SBPDCL is engaged primarily in the business of distribution and retail supply of electricity.
It has been vested with the distribution assets, interest in property, rights and liabilities of
the erstwhile BSEB necessary for the business of distribution in its area of distribution
comprising of all 9 circles of South Bihar.
1.2.3. SBPDCL has been given the status of a Distribution Licensee as per Section 14 of the
Electricity Act 2003, in order to fulfil the obligations of the Distribution Licensee as mandated
under the provisions of the Bihar State Electricity Reforms Transfer Scheme 2012 and the
Electricity Act, 2003.
1.2.4. The Bihar State Electricity Reforms Transfer Scheme, 2012 details out the following for the
distribution business of SBPDCL:
Schedule-C, Part-I: Description of Assets, Liabilities etc.;
Schedule-C, Part-II: Provisional Balance Sheet as on 1st November 2012;
Schedule-C, Part-III: Function and Duties of SBPDCL.
1.2.5. SBPDCL has divided its area of supply into 9 Distribution Circles which further comprises
of 36 divisions and 104 subdivisions.
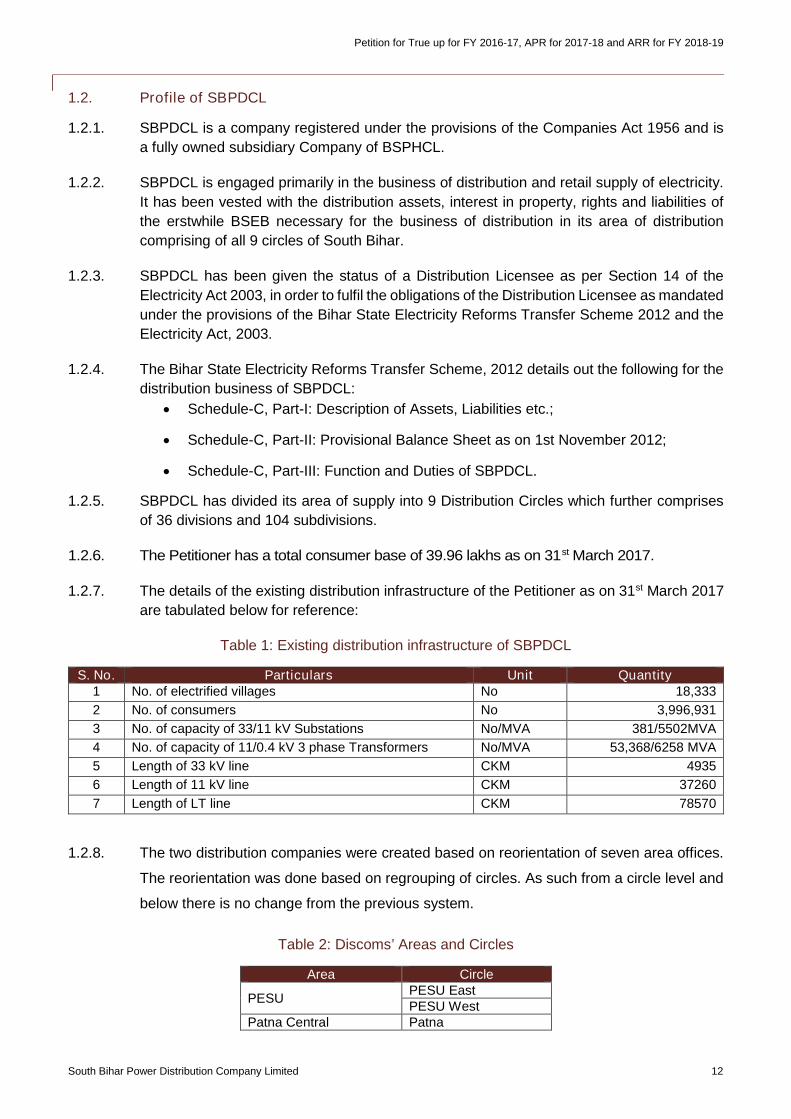
1.2.6. The Petitioner has a total consumer base of 39.96 lakhs as on 31st March 2017.
1.2.7. The details of the existing distribution infrastructure of the Petitioner as on 31st March 2017
are tabulated below for reference:
Table 1: Existing distribution infrastructure of SBPDCL
S. No. Particulars Unit Quantity1 No. of electrified villages No 18,333
2 No. of consumers No 3,996,931
3 No. of capacity of 33/11 kV Substations No/MVA 381/5502MVA
4 No. of capacity of 11/0.4 kV 3 phase Transformers No/MVA 53,368/6258 MVA
5 Length of 33 kV line CKM 4935
6 Length of 11 kV line CKM 37260
7 Length of LT line CKM 78570
1.2.8. The two distribution companies were created based on reorientation of seven area offices.
The reorientation was done based on regrouping of circles. As such from a circle level and
below there is no change from the previous system.
Table 2: Discoms’ Areas and Circles
Area Circle
PESUPESU EastPESU West
Patna Central Patna
Petition for True up for FY 2016-17, APR for 2017-18 and ARR for FY 2018-19
South Bihar Power Distribution Company Limited 13
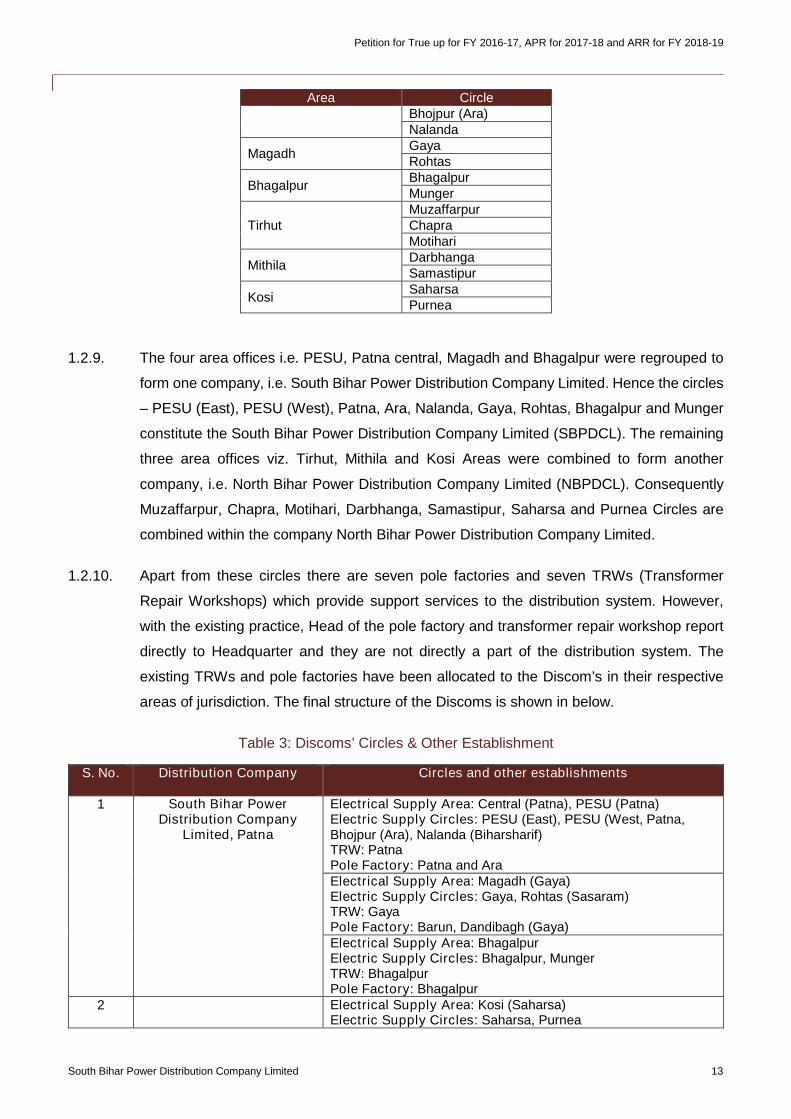
Area CircleBhojpur (Ara)Nalanda
MagadhGayaRohtas
BhagalpurBhagalpurMunger
TirhutMuzaffarpurChapraMotihari
MithilaDarbhangaSamastipur
KosiSaharsaPurnea
1.2.9. The four area offices i.e. PESU, Patna central, Magadh and Bhagalpur were regrouped to
form one company, i.e. South Bihar Power Distribution Company Limited. Hence the circles
– PESU (East), PESU (West), Patna, Ara, Nalanda, Gaya, Rohtas, Bhagalpur and Munger
constitute the South Bihar Power Distribution Company Limited (SBPDCL). The remaining
three area offices viz. Tirhut, Mithila and Kosi Areas were combined to form another
company, i.e. North Bihar Power Distribution Company Limited (NBPDCL). Consequently
Muzaffarpur, Chapra, Motihari, Darbhanga, Samastipur, Saharsa and Purnea Circles are
combined within the company North Bihar Power Distribution Company Limited.
1.2.10. Apart from these circles there are seven pole factories and seven TRWs (Transformer
Repair Workshops) which provide support services to the distribution system. However,
with the existing practice, Head of the pole factory and transformer repair workshop report
directly to Headquarter and they are not directly a part of the distribution system. The
existing TRWs and pole factories have been allocated to the Discom’s in their respective
areas of jurisdiction. The final structure of the Discoms is shown in below.
Table 3: Discoms’ Circles & Other Establishment
S. No. Distribution Company Circles and other establishments
1 South Bihar PowerDistribution Company
Limited, Patna
Electrical Supply Area: Central (Patna), PESU (Patna)Electric Supply Circles: PESU (East), PESU (West, Patna,Bhojpur (Ara), Nalanda (Biharsharif)TRW: PatnaPole Factory: Patna and AraElectrical Supply Area: Magadh (Gaya)Electric Supply Circles: Gaya, Rohtas (Sasaram)TRW: GayaPole Factory: Barun, Dandibagh (Gaya)Electrical Supply Area: BhagalpurElectric Supply Circles: Bhagalpur, MungerTRW: BhagalpurPole Factory: Bhagalpur
2 Electrical Supply Area: Kosi (Saharsa)Electric Supply Circles: Saharsa, Purnea
Petition for True up for FY 2016-17, APR for 2017-18 and ARR for FY 2018-19
South Bihar Power Distribution Company Limited 14
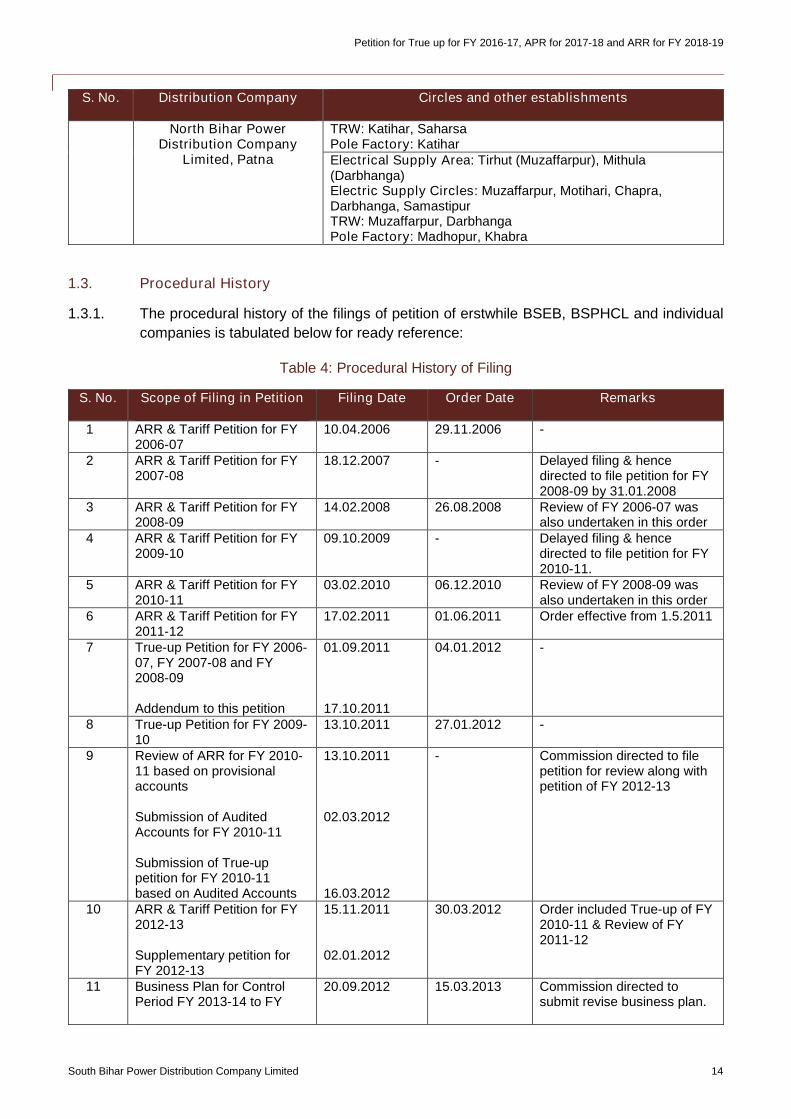
S. No. Distribution Company Circles and other establishments
North Bihar PowerDistribution Company
Limited, Patna
TRW: Katihar, SaharsaPole Factory: KatiharElectrical Supply Area: Tirhut (Muzaffarpur), Mithula(Darbhanga)Electric Supply Circles: Muzaffarpur, Motihari, Chapra,Darbhanga, SamastipurTRW: Muzaffarpur, DarbhangaPole Factory: Madhopur, Khabra
1.3. Procedural History
1.3.1. The procedural history of the filings of petition of erstwhile BSEB, BSPHCL and individual
companies is tabulated below for ready reference:
Table 4: Procedural History of Filing
S. No. Scope of Filing in Petition Filing Date Order Date Remarks
1 ARR & Tariff Petition for FY2006-07
10.04.2006 29.11.2006 -
2 ARR & Tariff Petition for FY2007-08
18.12.2007 - Delayed filing & hencedirected to file petition for FY2008-09 by 31.01.2008
3 ARR & Tariff Petition for FY2008-09
14.02.2008 26.08.2008 Review of FY 2006-07 wasalso undertaken in this order
4 ARR & Tariff Petition for FY2009-10
09.10.2009 - Delayed filing & hencedirected to file petition for FY2010-11.
5 ARR & Tariff Petition for FY2010-11
03.02.2010 06.12.2010 Review of FY 2008-09 wasalso undertaken in this order
6 ARR & Tariff Petition for FY2011-12
17.02.2011 01.06.2011 Order effective from 1.5.2011
7 True-up Petition for FY 2006-07, FY 2007-08 and FY2008-09
Addendum to this petition
01.09.2011
17.10.2011
04.01.2012 -
8 True-up Petition for FY 2009-10
13.10.2011 27.01.2012 -
9 Review of ARR for FY 2010-11 based on provisionalaccounts
Submission of AuditedAccounts for FY 2010-11
Submission of True-uppetition for FY 2010-11based on Audited Accounts
13.10.2011
02.03.2012
16.03.2012
- Commission directed to filepetition for review along withpetition of FY 2012-13
10 ARR & Tariff Petition for FY2012-13
Supplementary petition forFY 2012-13
15.11.2011
02.01.2012
30.03.2012 Order included True-up of FY2010-11 & Review of FY2011-12
11 Business Plan for ControlPeriod FY 2013-14 to FY
20.09.2012 15.03.2013 Commission directed tosubmit revise business plan.
Petition for True up for FY 2016-17, APR for 2017-18 and ARR for FY 2018-19
South Bihar Power Distribution Company Limited 15
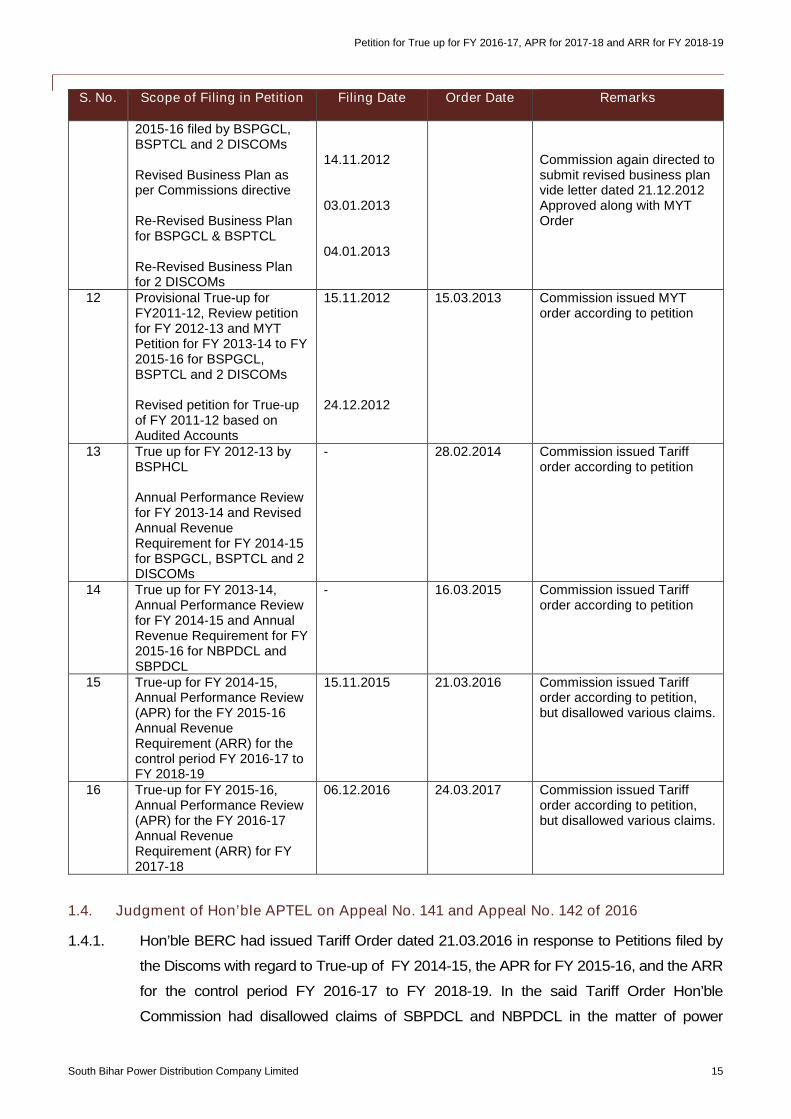
S. No. Scope of Filing in Petition Filing Date Order Date Remarks
2015-16 filed by BSPGCL,BSPTCL and 2 DISCOMs
Revised Business Plan asper Commissions directive
Re-Revised Business Planfor BSPGCL & BSPTCL
Re-Revised Business Planfor 2 DISCOMs
14.11.2012
03.01.2013
04.01.2013
Commission again directed tosubmit revised business planvide letter dated 21.12.2012Approved along with MYTOrder
12 Provisional True-up forFY2011-12, Review petitionfor FY 2012-13 and MYTPetition for FY 2013-14 to FY2015-16 for BSPGCL,BSPTCL and 2 DISCOMs
Revised petition for True-upof FY 2011-12 based onAudited Accounts
15.11.2012
24.12.2012
15.03.2013 Commission issued MYTorder according to petition
13 True up for FY 2012-13 byBSPHCL
Annual Performance Reviewfor FY 2013-14 and RevisedAnnual RevenueRequirement for FY 2014-15for BSPGCL, BSPTCL and 2DISCOMs
- 28.02.2014 Commission issued Tarifforder according to petition
14 True up for FY 2013-14,Annual Performance Reviewfor FY 2014-15 and AnnualRevenue Requirement for FY2015-16 for NBPDCL andSBPDCL
- 16.03.2015 Commission issued Tarifforder according to petition
15 True-up for FY 2014-15,Annual Performance Review(APR) for the FY 2015-16Annual RevenueRequirement (ARR) for thecontrol period FY 2016-17 toFY 2018-19
15.11.2015 21.03.2016 Commission issued Tarifforder according to petition,but disallowed various claims.
16 True-up for FY 2015-16,Annual Performance Review(APR) for the FY 2016-17Annual RevenueRequirement (ARR) for FY2017-18
06.12.2016 24.03.2017 Commission issued Tarifforder according to petition,but disallowed various claims.
1.4. Judgment of Hon’ble APTEL on Appeal No. 141 and Appeal No. 142 of 2016
1.4.1. Hon’ble BERC had issued Tariff Order dated 21.03.2016 in response to Petitions filed by
the Discoms with regard to True-up of FY 2014-15, the APR for FY 2015-16, and the ARR
for the control period FY 2016-17 to FY 2018-19. In the said Tariff Order Hon’ble
Commission had disallowed claims of SBPDCL and NBPDCL in the matter of power
Petition for True up for FY 2016-17, APR for 2017-18 and ARR for FY 2018-19
South Bihar Power Distribution Company Limited 16
Purchase Cost, Depreciation, Return on equity, Sales, Prior Period Expenses etc.
Aggrieved by the disallowance made by the Hon’ble Commission in the Tariff Orders dated
21.03.2016 Appeal No. 141 of 2016 and Appeal No. 142 of 2016 were filed by the SBPDCL
and NBPDCL respectively before Hon’ble Appellate Tribunal for Electricity (APTEL).
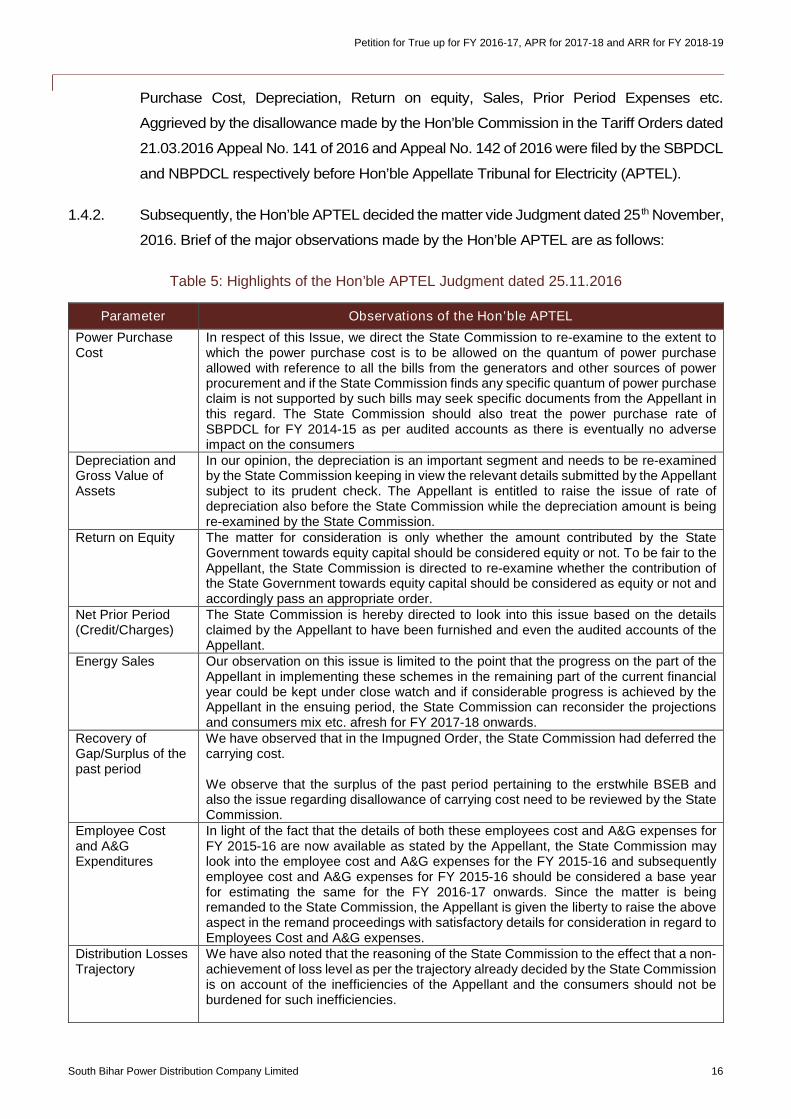
1.4.2. Subsequently, the Hon’ble APTEL decided the matter vide Judgment dated 25th November,
2016. Brief of the major observations made by the Hon’ble APTEL are as follows:
Table 5: Highlights of the Hon’ble APTEL Judgment dated 25.11.2016
Parameter Observations of the Hon’ble APTEL
Power PurchaseCost
In respect of this Issue, we direct the State Commission to re-examine to the extent towhich the power purchase cost is to be allowed on the quantum of power purchaseallowed with reference to all the bills from the generators and other sources of powerprocurement and if the State Commission finds any specific quantum of power purchaseclaim is not supported by such bills may seek specific documents from the Appellant inthis regard. The State Commission should also treat the power purchase rate ofSBPDCL for FY 2014-15 as per audited accounts as there is eventually no adverseimpact on the consumers
Depreciation andGross Value ofAssets
In our opinion, the depreciation is an important segment and needs to be re-examinedby the State Commission keeping in view the relevant details submitted by the Appellantsubject to its prudent check. The Appellant is entitled to raise the issue of rate ofdepreciation also before the State Commission while the depreciation amount is beingre-examined by the State Commission.
Return on Equity The matter for consideration is only whether the amount contributed by the StateGovernment towards equity capital should be considered equity or not. To be fair to theAppellant, the State Commission is directed to re-examine whether the contribution ofthe State Government towards equity capital should be considered as equity or not andaccordingly pass an appropriate order.
Net Prior Period(Credit/Charges)
The State Commission is hereby directed to look into this issue based on the detailsclaimed by the Appellant to have been furnished and even the audited accounts of theAppellant.
Energy Sales Our observation on this issue is limited to the point that the progress on the part of theAppellant in implementing these schemes in the remaining part of the current financialyear could be kept under close watch and if considerable progress is achieved by theAppellant in the ensuing period, the State Commission can reconsider the projectionsand consumers mix etc. afresh for FY 2017-18 onwards.
Recovery ofGap/Surplus of thepast period
We have observed that in the Impugned Order, the State Commission had deferred thecarrying cost.
We observe that the surplus of the past period pertaining to the erstwhile BSEB andalso the issue regarding disallowance of carrying cost need to be reviewed by the StateCommission.
Employee Costand A&GExpenditures
In light of the fact that the details of both these employees cost and A&G expenses forFY 2015-16 are now available as stated by the Appellant, the State Commission maylook into the employee cost and A&G expenses for the FY 2015-16 and subsequentlyemployee cost and A&G expenses for FY 2015-16 should be considered a base yearfor estimating the same for the FY 2016-17 onwards. Since the matter is beingremanded to the State Commission, the Appellant is given the liberty to raise the aboveaspect in the remand proceedings with satisfactory details for consideration in regard toEmployees Cost and A&G expenses.
Distribution LossesTrajectory
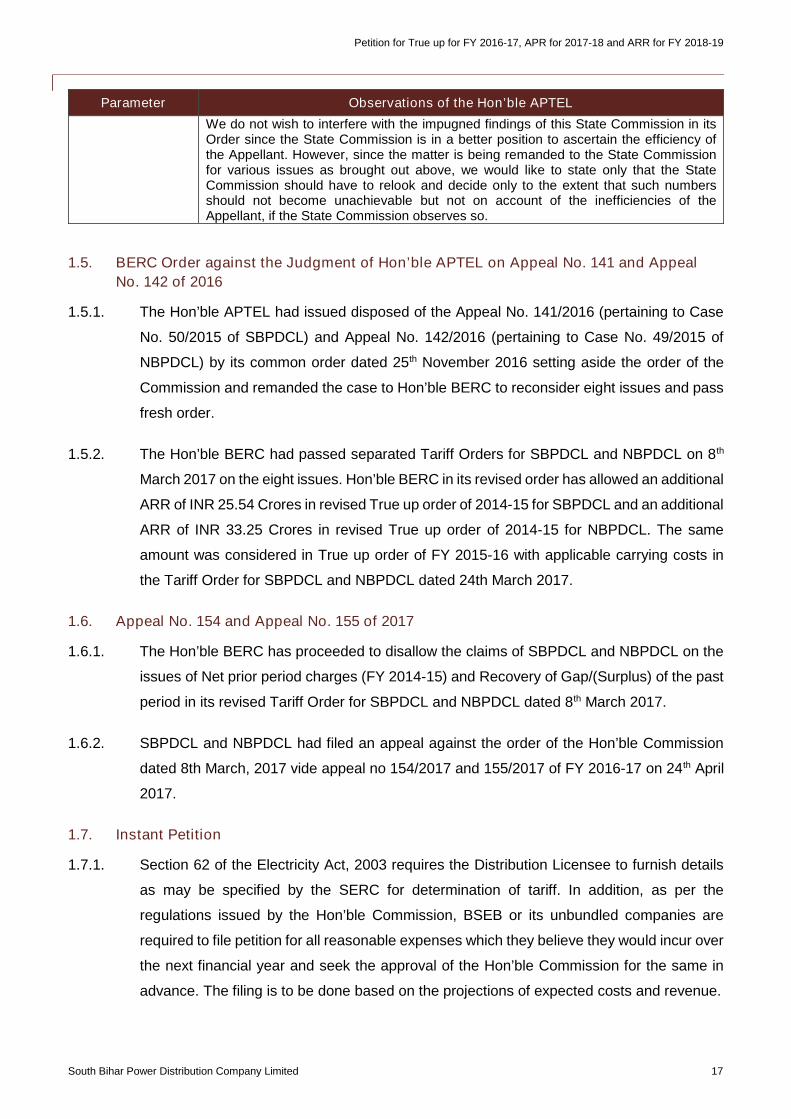
We have also noted that the reasoning of the State Commission to the effect that a non-achievement of loss level as per the trajectory already decided by the State Commissionis on account of the inefficiencies of the Appellant and the consumers should not beburdened for such inefficiencies.
Petition for True up for FY 2016-17, APR for 2017-18 and ARR for FY 2018-19
South Bihar Power Distribution Company Limited 17
Parameter Observations of the Hon’ble APTEL
We do not wish to interfere with the impugned findings of this State Commission in itsOrder since the State Commission is in a better position to ascertain the efficiency ofthe Appellant. However, since the matter is being remanded to the State Commissionfor various issues as brought out above, we would like to state only that the StateCommission should have to relook and decide only to the extent that such numbersshould not become unachievable but not on account of the inefficiencies of theAppellant, if the State Commission observes so.
1.5. BERC Order against the Judgment of Hon’ble APTEL on Appeal No. 141 and Appeal
No. 142 of 2016
1.5.1. The Hon’ble APTEL had issued disposed of the Appeal No. 141/2016 (pertaining to Case
No. 50/2015 of SBPDCL) and Appeal No. 142/2016 (pertaining to Case No. 49/2015 of
NBPDCL) by its common order dated 25th November 2016 setting aside the order of the
Commission and remanded the case to Hon’ble BERC to reconsider eight issues and pass
fresh order.
1.5.2. The Hon’ble BERC had passed separated Tariff Orders for SBPDCL and NBPDCL on 8th
March 2017 on the eight issues. Hon’ble BERC in its revised order has allowed an additional
ARR of INR 25.54 Crores in revised True up order of 2014-15 for SBPDCL and an additional
ARR of INR 33.25 Crores in revised True up order of 2014-15 for NBPDCL. The same
amount was considered in True up order of FY 2015-16 with applicable carrying costs in
the Tariff Order for SBPDCL and NBPDCL dated 24th March 2017.
1.6. Appeal No. 154 and Appeal No. 155 of 2017
1.6.1. The Hon’ble BERC has proceeded to disallow the claims of SBPDCL and NBPDCL on the
issues of Net prior period charges (FY 2014-15) and Recovery of Gap/(Surplus) of the past
period in its revised Tariff Order for SBPDCL and NBPDCL dated 8th March 2017.
1.6.2. SBPDCL and NBPDCL had filed an appeal against the order of the Hon’ble Commission
dated 8th March, 2017 vide appeal no 154/2017 and 155/2017 of FY 2016-17 on 24th April
2017.
1.7. Instant Petition
1.7.1. Section 62 of the Electricity Act, 2003 requires the Distribution Licensee to furnish details
as may be specified by the SERC for determination of tariff. In addition, as per the
regulations issued by the Hon’ble Commission, BSEB or its unbundled companies are
required to file petition for all reasonable expenses which they believe they would incur over
the next financial year and seek the approval of the Hon’ble Commission for the same in
advance. The filing is to be done based on the projections of expected costs and revenue.
Petition for True up for FY 2016-17, APR for 2017-18 and ARR for FY 2018-19
South Bihar Power Distribution Company Limited 18
1.7.2. The current petition has been prepared in accordance with the provisions of the following
Acts/ Policies/ Regulations:
a) The Electricity Act, 2003;
b) The National Electricity Policy;
c) The National Tariff Policy, and amendments issued therein;
d) Bihar Electricity Regulatory Commission (Multi Year Distribution Tariff)
Regulations, 2015, Bihar Electricity Regulatory Commission (Multi Year
Distribution Tariff) (First Amendment) Regulations, 2017 and its
amendments thereof, along with the other guidelines and directives issued
by the BERC from time to time
e) BERC (Terms and Conditions for Open Access) Regulations, 2005
1.7.3. The Petitioner has made genuine efforts for compiling all relevant information relating to the
True-up, APR, and ARR petition as required by the regulations issued by the Hon’ble
Commission and has also made every effort to ensure that the information provided to the
Hon’ble Commission is accurate and free from material errors. However, there may be
certain deficiencies owing to the limited operations of Distribution Company on independent
basis. The Petitioner therefore prays to the Hon’ble Commission that the information
provided be accepted for the current filing and at the same time assures that it is taking
appropriate measures to improve its management information system for improved data
collection.
1.8. Contents of the Petition
1.8.1. This petition comprises of following sections:
True up for FY 2016-17
Annual Performance Review for FY 2017-18
Annual Revenue Requirement for FY 2018-19
Revenue Gap and Tariff Proposal for FY 2018-19
Miscellaneous and General Charges
Voltage Wise Cost of Supply
Proposed tariff Schedule for FY 2018-19
Wheeling and Open access charges
Implementation of UDAY
Petition for True up for FY 2016-17, APR for 2017-18 and ARR for FY 2018-19
South Bihar Power Distribution Company Limited 19
2. Overall approach for present filing
2.1. Present Approach
2.1.1. The Petitioner requests the Hon’ble Commission to determine the ARR for FY 2018-19. It
further requests the Hon’ble Commission to determine norms for the Petitioner for this
period based on the learnings and its independent operations till FY 2017-18.
2.1.2. In line with the above, SBPDCL is filing its True-Up petition for FY 2016-17, Annual
Performance Review petition for FY 2017-18 and Annual Revenue Requirement petition for
FY 2018-19 for the consideration of the Hon’ble Commission.
2.1.3. The Petitioner requests the Hon’ble Commission to kindly approve the True-Up, APR and
ARR, keeping in view the actual segregated figures now available for the entire year in the
audited books of accounts for FY 2016-17.
2.2. Data and information sources for estimating the Aggregate Revenue Requirement
2.2.1. In this Petition, the true up is based on the actual audited accounts for
FY 2016-17. The APR for FY 2017-18 is based on actual figures for the first 6 months (as
available) for power purchase, and for components like O&M expenses etc. of the financial
year. Appropriate pro-rata projections and escalations have been taken over the previous
year, keeping in mind guiding principles defined by the Hon’ble Commission. The ARR for
FY 2018-19 is based on projections and escalations over the previous year, keeping in mind
the historical trends and key initiatives planned for the future, in line with the guidelines
provided by the Hon’ble Commission for determining the same.
Petition for True up for FY 2016-17, APR for 2017-18 and ARR for FY 2018-19
South Bihar Power Distribution Company Limited 20
3. True-up Summary for FY 2016-17
3.1. Preamble
3.1.1. This section outlines the performance of the Petitioner for FY 2016-17.
3.1.2. In line with the provisions of the BERC (Multi Year Distribution Tariff) Regulations, 2015 and
amendments issued thereof, the Petitioner hereby submits the True Up petition for FY 2016-
17. The expenses of the Petitioner for FY 2016-17 presented for true-up are based on the
audited books of accounts, and other principles adopted by the Hon’ble Commission for
estimating normative interest on term loan, Return on Equity, interest on working capital
loan and depreciation. The ARR so arrived has been compared with that approved by the
Hon’ble Commission vide its Tariff Order dated 24th March, 2017. Accordingly, the revised
Aggregate Revenue Requirement, revenue and gap for FY 2016-17 have been given in the
subsequent sub-sections of this chapter.
3.2. Number of Consumers, Connected Load and Sales
Number of Consumers
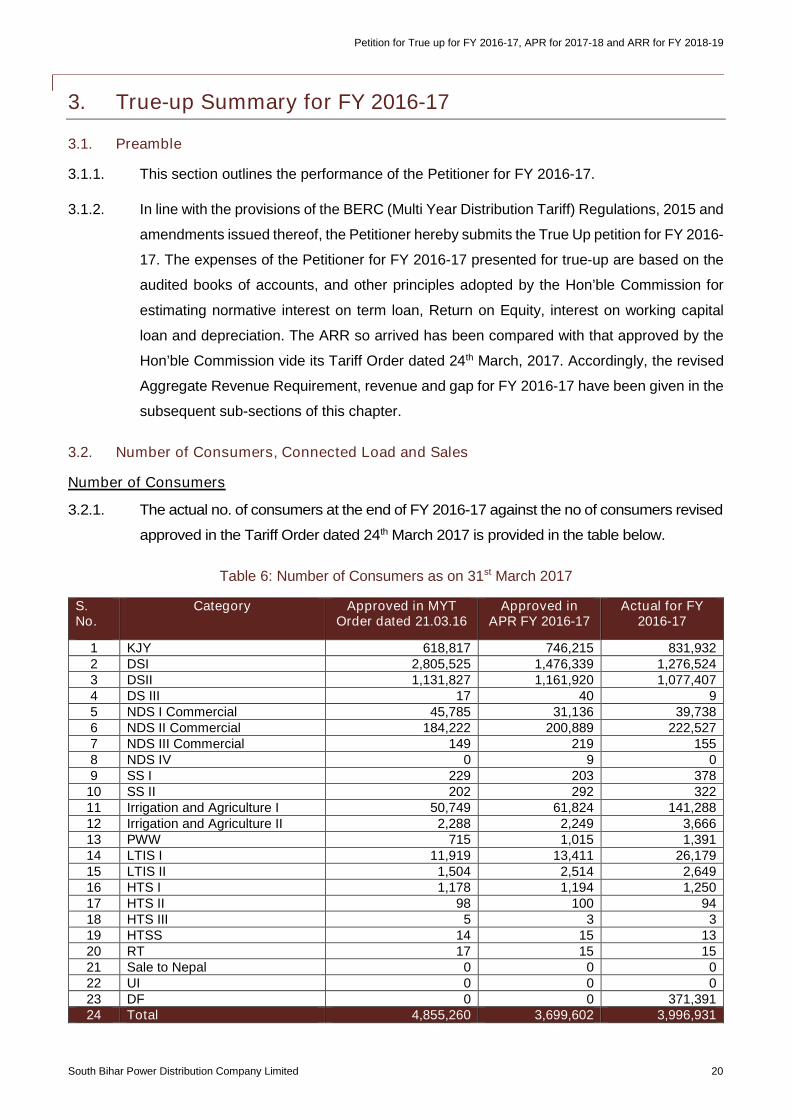
3.2.1. The actual no. of consumers at the end of FY 2016-17 against the no of consumers revised
approved in the Tariff Order dated 24th March 2017 is provided in the table below.
Table 6: Number of Consumers as on 31st March 2017
S.No.
Category Approved in MYTOrder dated 21.03.16
Approved inAPR FY 2016-17
Actual for FY2016-17
1 KJY 618,817 746,215 831,9322 DSI 2,805,525 1,476,339 1,276,5243 DSII 1,131,827 1,161,920 1,077,4074 DS III 17 40 95 NDS I Commercial 45,785 31,136 39,7386 NDS II Commercial 184,222 200,889 222,5277 NDS III Commercial 149 219 1558 NDS IV 0 9 09 SS I 229 203 378
10 SS II 202 292 32211 Irrigation and Agriculture I 50,749 61,824 141,28812 Irrigation and Agriculture II 2,288 2,249 3,66613 PWW 715 1,015 1,39114 LTIS I 11,919 13,411 26,17915 LTIS II 1,504 2,514 2,64916 HTS I 1,178 1,194 1,25017 HTS II 98 100 9418 HTS III 5 3 319 HTSS 14 15 1320 RT 17 15 1521 Sale to Nepal 0 0 022 UI 0 0 023 DF 0 0 371,39124 Total 4,855,260 3,699,602 3,996,931
Petition for True up for FY 2016-17, APR for 2017-18 and ARR for FY 2018-19
South Bihar Power Distribution Company Limited 21
3.2.2. It is pertinent to note that the total number of consumers as per the audited annual accounts
for FY 2016-17 is 40,44,120. However the Petitioner in its constant endeavor to clean up its
database, has been undertaking an exercise to validate all consumers in its record. As per
the latest assessment, the actual number of consumers ending 31st March 2017 are in fact
39,96,931, which has been used for filing the true-up petition for FY 2016-17. This
discrepancy has been identified primarily due to the change in consumer ledgers and
overlap between areas, which has been now rectified. This revision in the number of
consumers also does not have any bearing on the sales or power purchase figures for FY
2016-17. It is to be noted that this revised consumer number has been considered as the
base for the purpose of projections for the subsequent year.
3.2.3. The above comparison of consumer numbers in Table 6 clearly brings out the fact that
Petitioner has added a significant number of consumers during the year and the actual no.
of consumers is in fact higher by almost 27.27% over previous year. Increase can be
observed in certain major categories like KJY (57.45%), IAS (127%), DS-I (26.13%) and
NDS-I (40.39%) over previous year. As the Hon’ble Commission is also aware that the
Petitioner has engaged an Input based Franchisee in Gaya and Bhagalpur area for
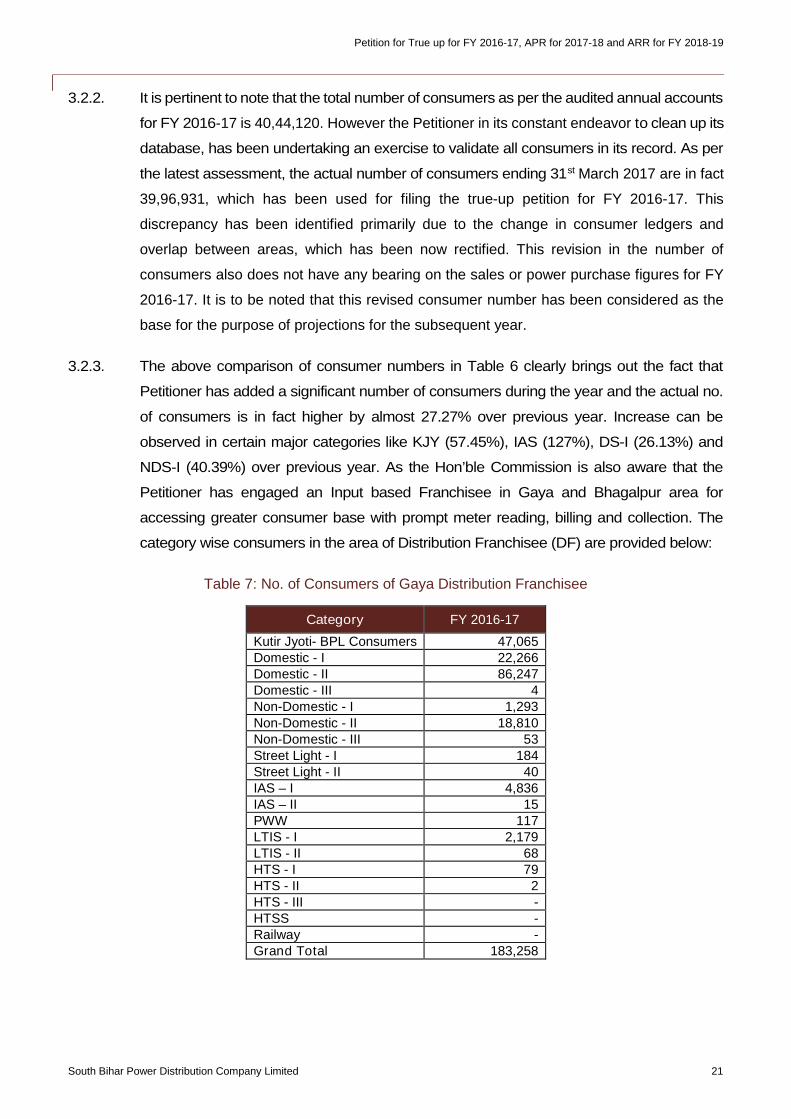
accessing greater consumer base with prompt meter reading, billing and collection. The
category wise consumers in the area of Distribution Franchisee (DF) are provided below:
Table 7: No. of Consumers of Gaya Distribution Franchisee
Category FY 2016-17
Kutir Jyoti- BPL Consumers 47,065Domestic - I 22,266Domestic - II 86,247Domestic - III 4Non-Domestic - I 1,293Non-Domestic - II 18,810Non-Domestic - III 53Street Light - I 184Street Light - II 40IAS – I 4,836IAS – II 15PWW 117LTIS - I 2,179LTIS - II 68HTS - I 79HTS - II 2HTS - III -HTSS -Railway -Grand Total 183,258
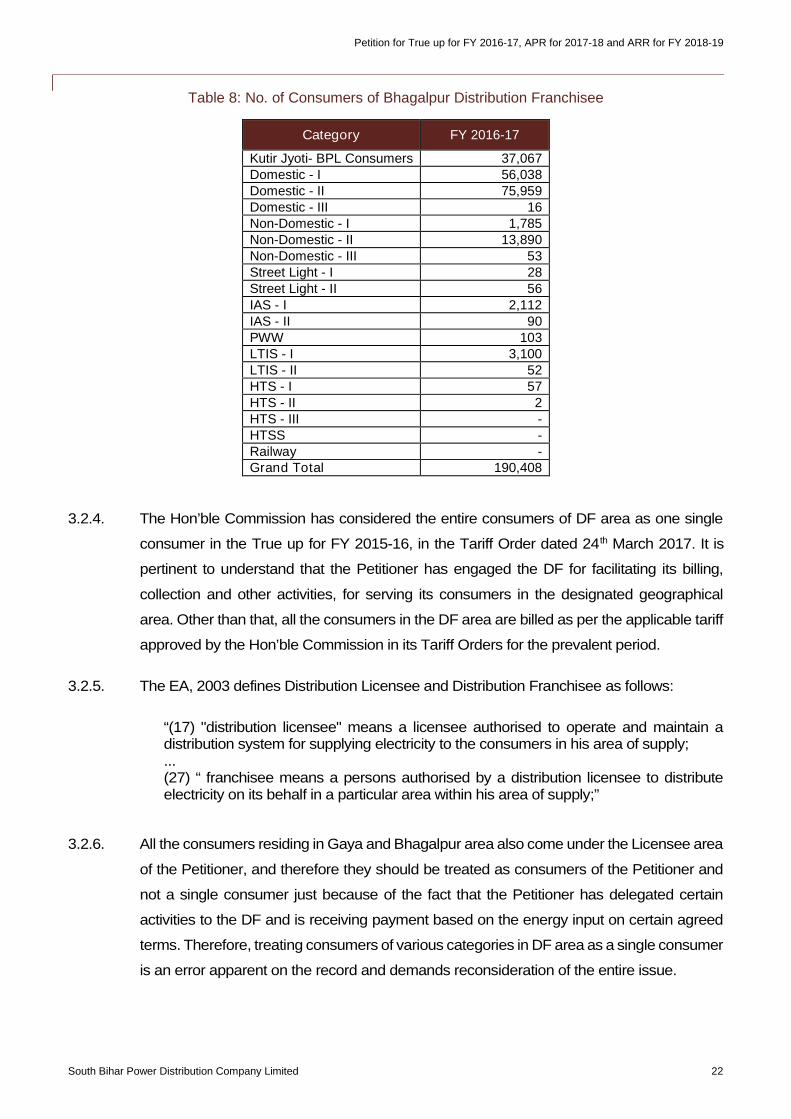
Petition for True up for FY 2016-17, APR for 2017-18 and ARR for FY 2018-19
South Bihar Power Distribution Company Limited 22
Table 8: No. of Consumers of Bhagalpur Distribution Franchisee
Category FY 2016-17
Kutir Jyoti- BPL Consumers 37,067Domestic - I 56,038Domestic - II 75,959Domestic - III 16Non-Domestic - I 1,785Non-Domestic - II 13,890Non-Domestic - III 53Street Light - I 28Street Light - II 56IAS - I 2,112IAS - II 90PWW 103LTIS - I 3,100LTIS - II 52HTS - I 57HTS - II 2HTS - III -HTSS -Railway -Grand Total 190,408
3.2.4. The Hon’ble Commission has considered the entire consumers of DF area as one single
consumer in the True up for FY 2015-16, in the Tariff Order dated 24th March 2017. It is
pertinent to understand that the Petitioner has engaged the DF for facilitating its billing,
collection and other activities, for serving its consumers in the designated geographical
area. Other than that, all the consumers in the DF area are billed as per the applicable tariff
approved by the Hon’ble Commission in its Tariff Orders for the prevalent period.
3.2.5. The EA, 2003 defines Distribution Licensee and Distribution Franchisee as follows:
“(17) "distribution licensee" means a licensee authorised to operate and maintain adistribution system for supplying electricity to the consumers in his area of supply;...(27) “ franchisee means a persons authorised by a distribution licensee to distributeelectricity on its behalf in a particular area within his area of supply;”
3.2.6. All the consumers residing in Gaya and Bhagalpur area also come under the Licensee area
of the Petitioner, and therefore they should be treated as consumers of the Petitioner and
not a single consumer just because of the fact that the Petitioner has delegated certain
activities to the DF and is receiving payment based on the energy input on certain agreed
terms. Therefore, treating consumers of various categories in DF area as a single consumer
is an error apparent on the record and demands reconsideration of the entire issue.
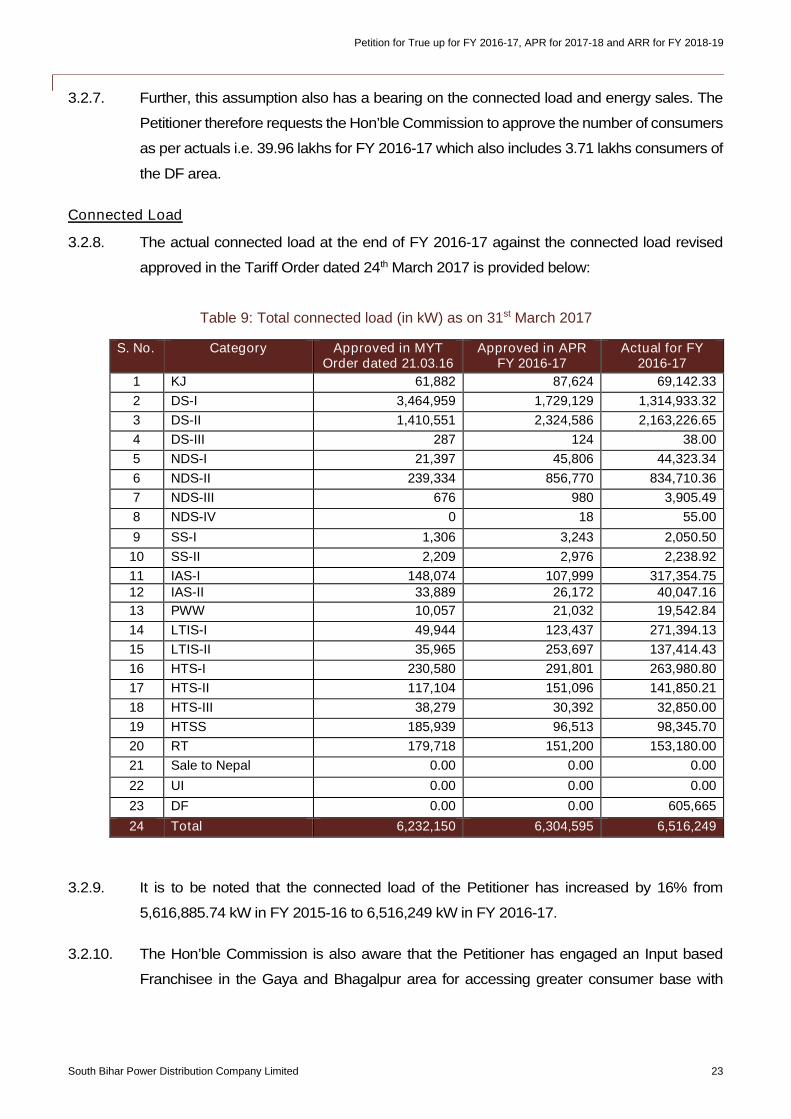
Petition for True up for FY 2016-17, APR for 2017-18 and ARR for FY 2018-19
South Bihar Power Distribution Company Limited 23
3.2.7. Further, this assumption also has a bearing on the connected load and energy sales. The
Petitioner therefore requests the Hon’ble Commission to approve the number of consumers
as per actuals i.e. 39.96 lakhs for FY 2016-17 which also includes 3.71 lakhs consumers of
the DF area.
Connected Load
3.2.8. The actual connected load at the end of FY 2016-17 against the connected load revised
approved in the Tariff Order dated 24th March 2017 is provided below:
Table 9: Total connected load (in kW) as on 31st March 2017
S. No. Category Approved in MYTOrder dated 21.03.16
Approved in APRFY 2016-17
Actual for FY2016-17
1 KJ 61,882 87,624 69,142.33
2 DS-I 3,464,959 1,729,129 1,314,933.32
3 DS-II 1,410,551 2,324,586 2,163,226.65
4 DS-III 287 124 38.00
5 NDS-I 21,397 45,806 44,323.34
6 NDS-II 239,334 856,770 834,710.36
7 NDS-III 676 980 3,905.49
8 NDS-IV 0 18 55.00
9 SS-I 1,306 3,243 2,050.50
10 SS-II 2,209 2,976 2,238.92
11 IAS-I 148,074 107,999 317,354.7512 IAS-II 33,889 26,172 40,047.16
13 PWW 10,057 21,032 19,542.84
14 LTIS-I 49,944 123,437 271,394.13
15 LTIS-II 35,965 253,697 137,414.43
16 HTS-I 230,580 291,801 263,980.80
17 HTS-II 117,104 151,096 141,850.21
18 HTS-III 38,279 30,392 32,850.00
19 HTSS 185,939 96,513 98,345.70
20 RT 179,718 151,200 153,180.00
21 Sale to Nepal 0.00 0.00 0.00
22 UI 0.00 0.00 0.00
23 DF 0.00 0.00 605,665
24 Total 6,232,150 6,304,595 6,516,249
3.2.9. It is to be noted that the connected load of the Petitioner has increased by 16% from
5,616,885.74 kW in FY 2015-16 to 6,516,249 kW in FY 2016-17.
3.2.10. The Hon’ble Commission is also aware that the Petitioner has engaged an Input based
Franchisee in the Gaya and Bhagalpur area for accessing greater consumer base with
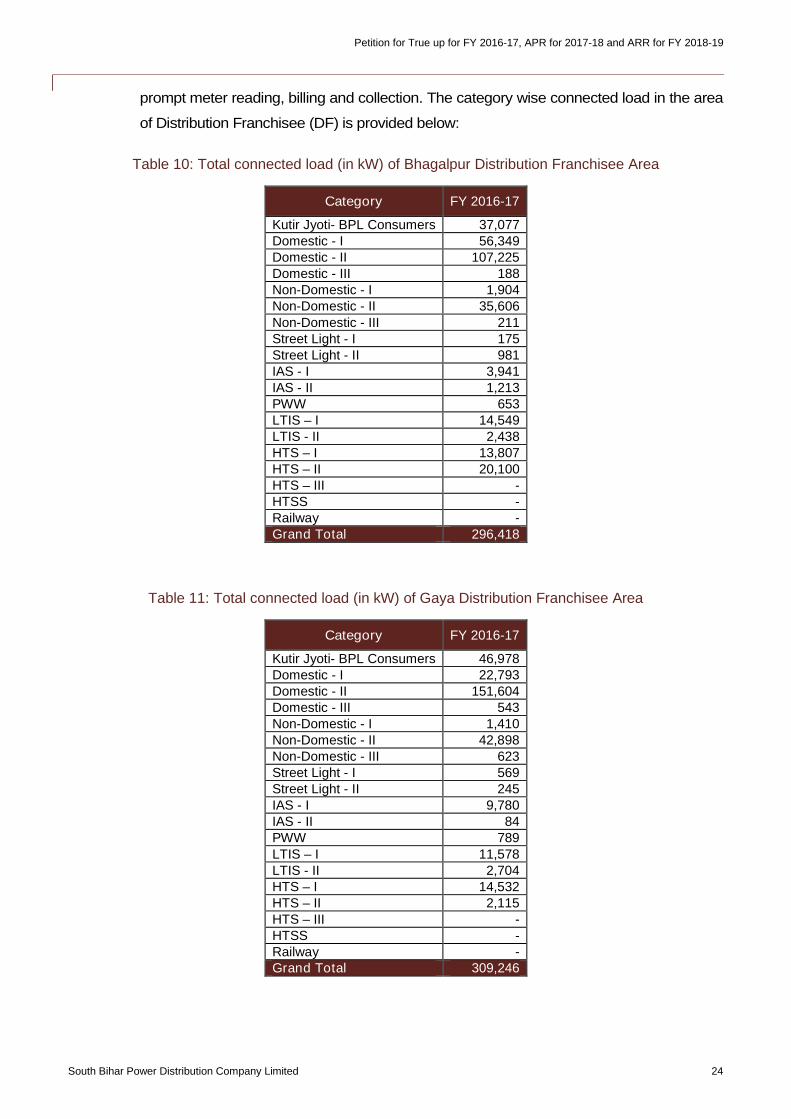
Petition for True up for FY 2016-17, APR for 2017-18 and ARR for FY 2018-19
South Bihar Power Distribution Company Limited 24
prompt meter reading, billing and collection. The category wise connected load in the area
of Distribution Franchisee (DF) is provided below:
Table 10: Total connected load (in kW) of Bhagalpur Distribution Franchisee Area
Category FY 2016-17
Kutir Jyoti- BPL Consumers 37,077Domestic - I 56,349Domestic - II 107,225Domestic - III 188Non-Domestic - I 1,904Non-Domestic - II 35,606Non-Domestic - III 211Street Light - I 175Street Light - II 981IAS - I 3,941IAS - II 1,213PWW 653LTIS – I 14,549LTIS - II 2,438HTS – I 13,807HTS – II 20,100HTS – III -HTSS -Railway -Grand Total 296,418
Table 11: Total connected load (in kW) of Gaya Distribution Franchisee Area
Category FY 2016-17
Kutir Jyoti- BPL Consumers 46,978Domestic - I 22,793Domestic - II 151,604Domestic - III 543Non-Domestic - I 1,410Non-Domestic - II 42,898Non-Domestic - III 623Street Light - I 569Street Light - II 245IAS - I 9,780IAS - II 84PWW 789LTIS – I 11,578LTIS - II 2,704HTS – I 14,532HTS – II 2,115HTS – III -HTSS -Railway -Grand Total 309,246
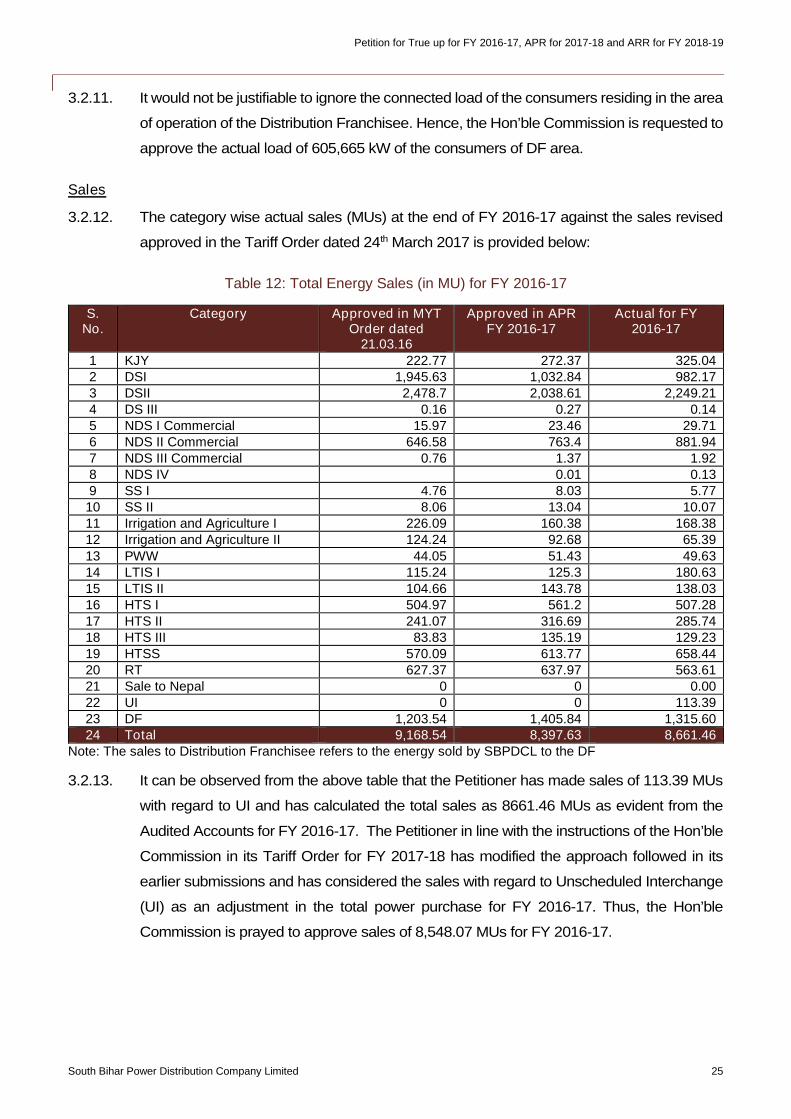
Petition for True up for FY 2016-17, APR for 2017-18 and ARR for FY 2018-19
South Bihar Power Distribution Company Limited 25
3.2.11. It would not be justifiable to ignore the connected load of the consumers residing in the area
of operation of the Distribution Franchisee. Hence, the Hon’ble Commission is requested to
approve the actual load of 605,665 kW of the consumers of DF area.
Sales
3.2.12. The category wise actual sales (MUs) at the end of FY 2016-17 against the sales revised
approved in the Tariff Order dated 24th March 2017 is provided below:
Table 12: Total Energy Sales (in MU) for FY 2016-17
S.No.
Category Approved in MYTOrder dated
21.03.16
Approved in APRFY 2016-17
Actual for FY2016-17
1 KJY 222.77 272.37 325.042 DSI 1,945.63 1,032.84 982.173 DSII 2,478.7 2,038.61 2,249.214 DS III 0.16 0.27 0.145 NDS I Commercial 15.97 23.46 29.716 NDS II Commercial 646.58 763.4 881.947 NDS III Commercial 0.76 1.37 1.928 NDS IV 0.01 0.139 SS I 4.76 8.03 5.7710 SS II 8.06 13.04 10.0711 Irrigation and Agriculture I 226.09 160.38 168.3812 Irrigation and Agriculture II 124.24 92.68 65.3913 PWW 44.05 51.43 49.6314 LTIS I 115.24 125.3 180.6315 LTIS II 104.66 143.78 138.0316 HTS I 504.97 561.2 507.2817 HTS II 241.07 316.69 285.7418 HTS III 83.83 135.19 129.2319 HTSS 570.09 613.77 658.4420 RT 627.37 637.97 563.6121 Sale to Nepal 0 0 0.0022 UI 0 0 113.3923 DF 1,203.54 1,405.84 1,315.6024 Total 9,168.54 8,397.63 8,661.46
Note: The sales to Distribution Franchisee refers to the energy sold by SBPDCL to the DF
3.2.13. It can be observed from the above table that the Petitioner has made sales of 113.39 MUs
with regard to UI and has calculated the total sales as 8661.46 MUs as evident from the
Audited Accounts for FY 2016-17. The Petitioner in line with the instructions of the Hon’ble
Commission in its Tariff Order for FY 2017-18 has modified the approach followed in its
earlier submissions and has considered the sales with regard to Unscheduled Interchange
(UI) as an adjustment in the total power purchase for FY 2016-17. Thus, the Hon’ble
Commission is prayed to approve sales of 8,548.07 MUs for FY 2016-17.
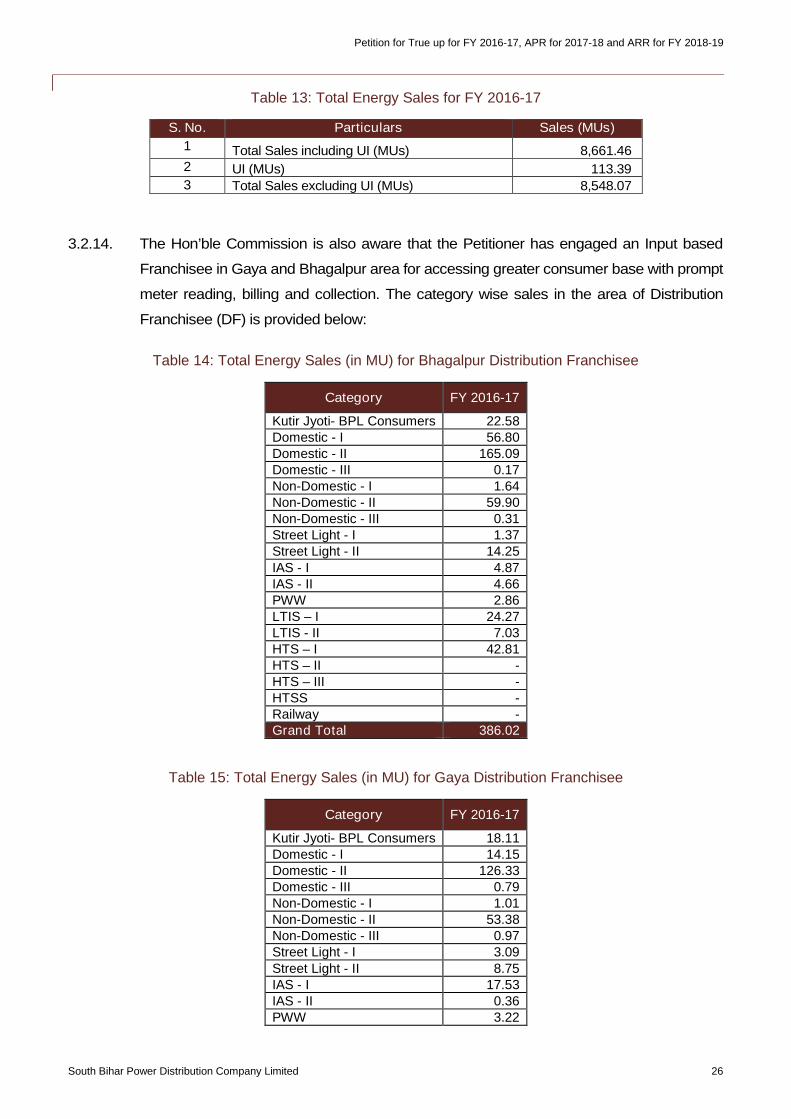
Petition for True up for FY 2016-17, APR for 2017-18 and ARR for FY 2018-19
South Bihar Power Distribution Company Limited 26
Table 13: Total Energy Sales for FY 2016-17
S. No. Particulars Sales (MUs)
1 Total Sales including UI (MUs) 8,661.462 UI (MUs) 113.393 Total Sales excluding UI (MUs) 8,548.07
3.2.14. The Hon’ble Commission is also aware that the Petitioner has engaged an Input based
Franchisee in Gaya and Bhagalpur area for accessing greater consumer base with prompt
meter reading, billing and collection. The category wise sales in the area of Distribution
Franchisee (DF) is provided below:
Table 14: Total Energy Sales (in MU) for Bhagalpur Distribution Franchisee
Category FY 2016-17
Kutir Jyoti- BPL Consumers 22.58Domestic - I 56.80Domestic - II 165.09Domestic - III 0.17Non-Domestic - I 1.64Non-Domestic - II 59.90Non-Domestic - III 0.31Street Light - I 1.37Street Light - II 14.25IAS - I 4.87IAS - II 4.66PWW 2.86LTIS – I 24.27LTIS - II 7.03HTS – I 42.81HTS – II -HTS – III -HTSS -Railway -Grand Total 386.02
Table 15: Total Energy Sales (in MU) for Gaya Distribution Franchisee
Category FY 2016-17
Kutir Jyoti- BPL Consumers 18.11Domestic - I 14.15Domestic - II 126.33Domestic - III 0.79Non-Domestic - I 1.01Non-Domestic - II 53.38Non-Domestic - III 0.97Street Light - I 3.09Street Light - II 8.75IAS - I 17.53IAS - II 0.36PWW 3.22
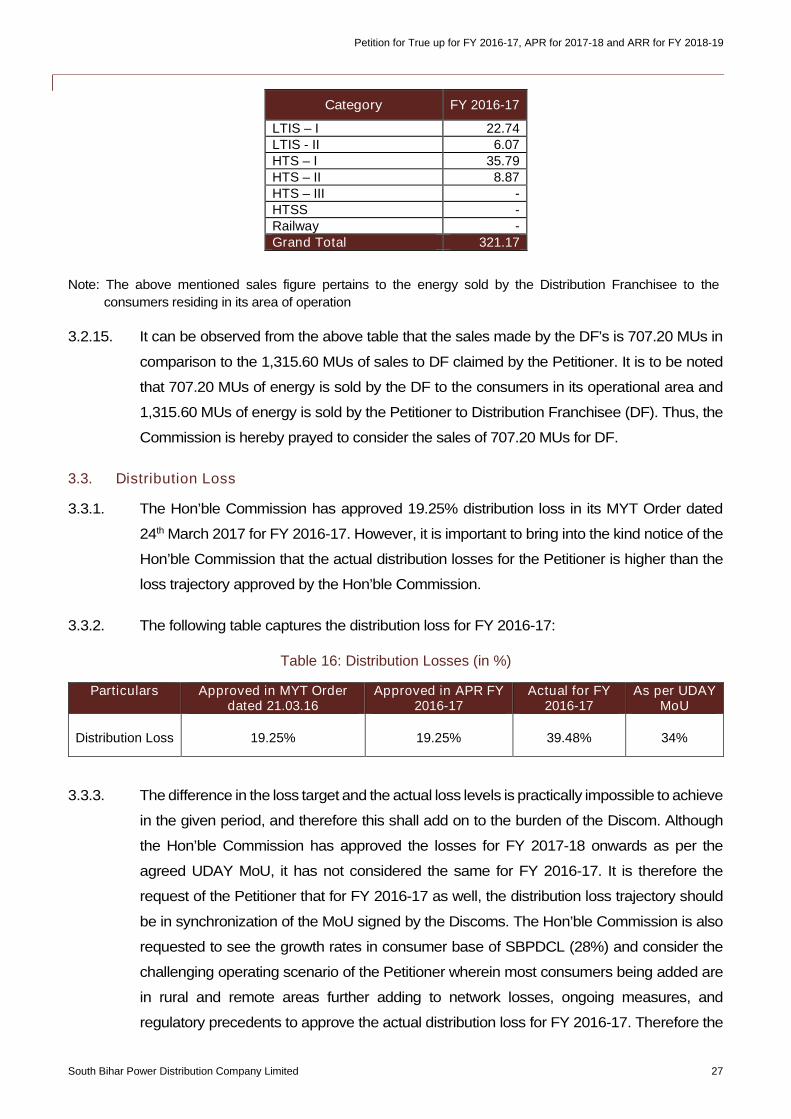
Petition for True up for FY 2016-17, APR for 2017-18 and ARR for FY 2018-19
South Bihar Power Distribution Company Limited 27
Category FY 2016-17
LTIS – I 22.74LTIS - II 6.07HTS – I 35.79HTS – II 8.87HTS – III -HTSS -Railway -Grand Total 321.17
Note: The above mentioned sales figure pertains to the energy sold by the Distribution Franchisee to the
consumers residing in its area of operation
3.2.15. It can be observed from the above table that the sales made by the DF’s is 707.20 MUs in
comparison to the 1,315.60 MUs of sales to DF claimed by the Petitioner. It is to be noted
that 707.20 MUs of energy is sold by the DF to the consumers in its operational area and
1,315.60 MUs of energy is sold by the Petitioner to Distribution Franchisee (DF). Thus, the
Commission is hereby prayed to consider the sales of 707.20 MUs for DF.
3.3. Distribution Loss
3.3.1. The Hon’ble Commission has approved 19.25% distribution loss in its MYT Order dated
24th March 2017 for FY 2016-17. However, it is important to bring into the kind notice of the
Hon’ble Commission that the actual distribution losses for the Petitioner is higher than the
loss trajectory approved by the Hon’ble Commission.
3.3.2. The following table captures the distribution loss for FY 2016-17:
Table 16: Distribution Losses (in %)
Particulars Approved in MYT Orderdated 21.03.16
Approved in APR FY2016-17
Actual for FY2016-17
As per UDAYMoU
Distribution Loss 19.25% 19.25% 39.48% 34%
3.3.3. The difference in the loss target and the actual loss levels is practically impossible to achieve
in the given period, and therefore this shall add on to the burden of the Discom. Although
the Hon’ble Commission has approved the losses for FY 2017-18 onwards as per the
agreed UDAY MoU, it has not considered the same for FY 2016-17. It is therefore the
request of the Petitioner that for FY 2016-17 as well, the distribution loss trajectory should
be in synchronization of the MoU signed by the Discoms. The Hon’ble Commission is also
requested to see the growth rates in consumer base of SBPDCL (28%) and consider the
challenging operating scenario of the Petitioner wherein most consumers being added are
in rural and remote areas further adding to network losses, ongoing measures, and
regulatory precedents to approve the actual distribution loss for FY 2016-17. Therefore the
Petition for True up for FY 2016-17, APR for 2017-18 and ARR for FY 2018-19
South Bihar Power Distribution Company Limited 28
Hon’ble Commission is kindly requested to consider the actual loss of 39.48% and adopt
the loss target as agreed in the UDAY MoU i.e. 34%.
3.4. Transmission losses
3.4.1. Intra-State Transmission Loss: It is submitted that the Petitioner has taken the State
transmission loss as per actuals i.e. 4.74% from the audited accounts for
FY 2016-17 and accordingly requests the Hon’ble Commission to approve the same.
3.4.2. Inter-State Transmission Loss: It is submitted that the Petitioner has taken the Central
Transmission loss as per actuals i.e. 2.52% from the audited accounts for FY 2016-17 and
accordingly requests the Hon’ble Commission to approve the same.
3.5. Power Purchase
3.5.1. Bihar has historically been a State with limited natural resources which has led to an
underdeveloped power generation sector in the State. As a result, the State Power
Distribution Companies rely heavily on allocation from central generating stations and other
outside State projects for procuring power for sale to consumers within the State. This
dependence as a consequence creates a significant amount of uncertainty in terms of
reliability and also significantly pushes up the power purchase costs (due to the fact that
sometimes the power allocation is done from inefficient plants in addition to the higher inter-
state transmission charges and losses). This fact should be given due consideration while
approving power purchase costs of the Petitioner.
3.5.2. Power is procured by the central power management team, and this is allocated between
the two Discoms, NBPDCL and SBPDCL, in the proportion as determined by the board
resolution based on the demand growth requirement and consequent power supply
requirement.
3.5.3. Long term power purchase: The power purchase for existing sources has primarily been
NTPC, NHPC, and PTC, and the same has been considered based on the actual quantum
with adjustments to capture overall power purchase cost in a reasonable manner. Other
sources of power include power procured from State Generating companies and IPPs.
3.5.4. Medium / Short Term power purchase : The power purchase from these sources are
namely Adani, IEX, NEA, UI etc., and these have been adequately considered as per the
actual power purchase data provided.
3.5.5. Renewable Power Purchase Obligation: It is submitted that the Hon’ble Commission has
notified the BERC (Renewable Purchase Obligation, its Compliance and REC Framework
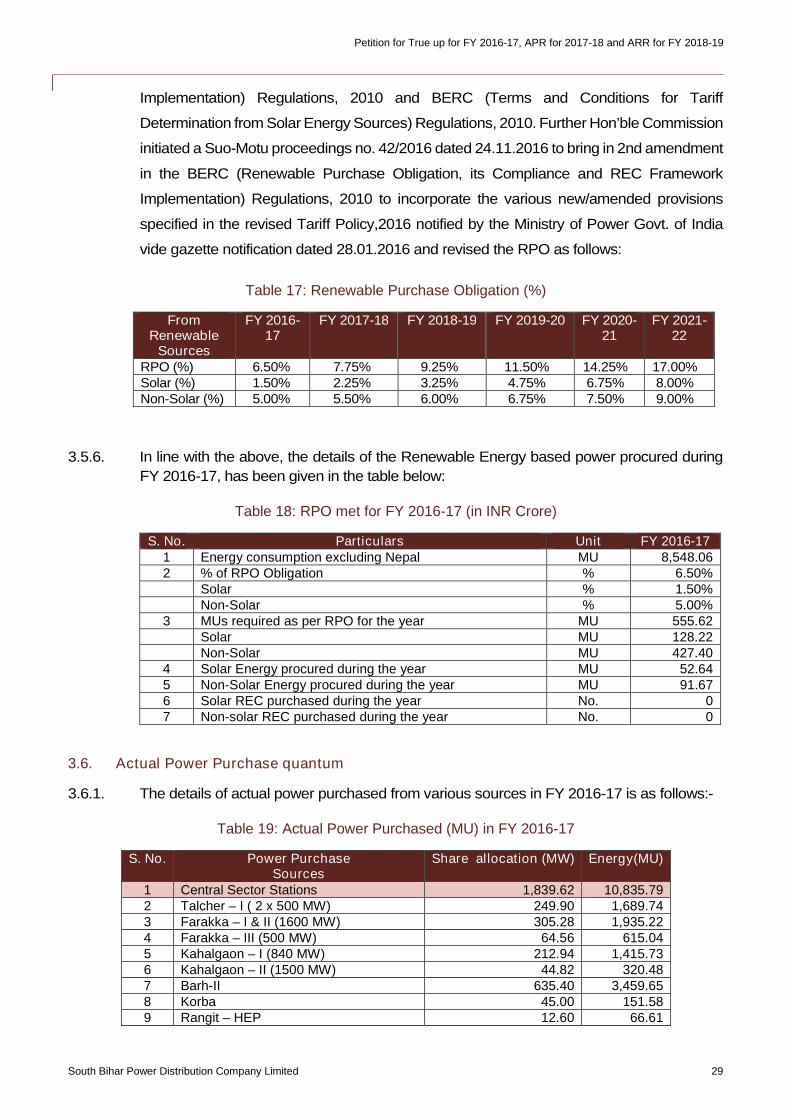
Petition for True up for FY 2016-17, APR for 2017-18 and ARR for FY 2018-19
South Bihar Power Distribution Company Limited 29
Implementation) Regulations, 2010 and BERC (Terms and Conditions for Tariff
Determination from Solar Energy Sources) Regulations, 2010. Further Hon’ble Commission
initiated a Suo-Motu proceedings no. 42/2016 dated 24.11.2016 to bring in 2nd amendment
in the BERC (Renewable Purchase Obligation, its Compliance and REC Framework
Implementation) Regulations, 2010 to incorporate the various new/amended provisions
specified in the revised Tariff Policy,2016 notified by the Ministry of Power Govt. of India
vide gazette notification dated 28.01.2016 and revised the RPO as follows:
Table 17: Renewable Purchase Obligation (%)
FromRenewable
Sources
FY 2016-17
FY 2017-18 FY 2018-19 FY 2019-20 FY 2020-21
FY 2021-22
RPO (%) 6.50% 7.75% 9.25% 11.50% 14.25% 17.00%Solar (%) 1.50% 2.25% 3.25% 4.75% 6.75% 8.00%Non-Solar (%) 5.00% 5.50% 6.00% 6.75% 7.50% 9.00%
3.5.6. In line with the above, the details of the Renewable Energy based power procured during
FY 2016-17, has been given in the table below:
Table 18: RPO met for FY 2016-17 (in INR Crore)
S. No. Particulars Unit FY 2016-171 Energy consumption excluding Nepal MU 8,548.062 % of RPO Obligation % 6.50%
Solar % 1.50%Non-Solar % 5.00%
3 MUs required as per RPO for the year MU 555.62Solar MU 128.22Non-Solar MU 427.40
4 Solar Energy procured during the year MU 52.645 Non-Solar Energy procured during the year MU 91.676 Solar REC purchased during the year No. 07 Non-solar REC purchased during the year No. 0
3.6. Actual Power Purchase quantum
3.6.1. The details of actual power purchased from various sources in FY 2016-17 is as follows:-
Table 19: Actual Power Purchased (MU) in FY 2016-17
S. No. Power PurchaseSources
Share allocation (MW) Energy(MU)
1 Central Sector Stations 1,839.62 10,835.792 Talcher – I ( 2 x 500 MW) 249.90 1,689.743 Farakka – I & II (1600 MW) 305.28 1,935.224 Farakka – III (500 MW) 64.56 615.045 Kahalgaon – I (840 MW) 212.94 1,415.736 Kahalgaon – II (1500 MW) 44.82 320.487 Barh-II 635.40 3,459.658 Korba 45.00 151.589 Rangit – HEP 12.60 66.61
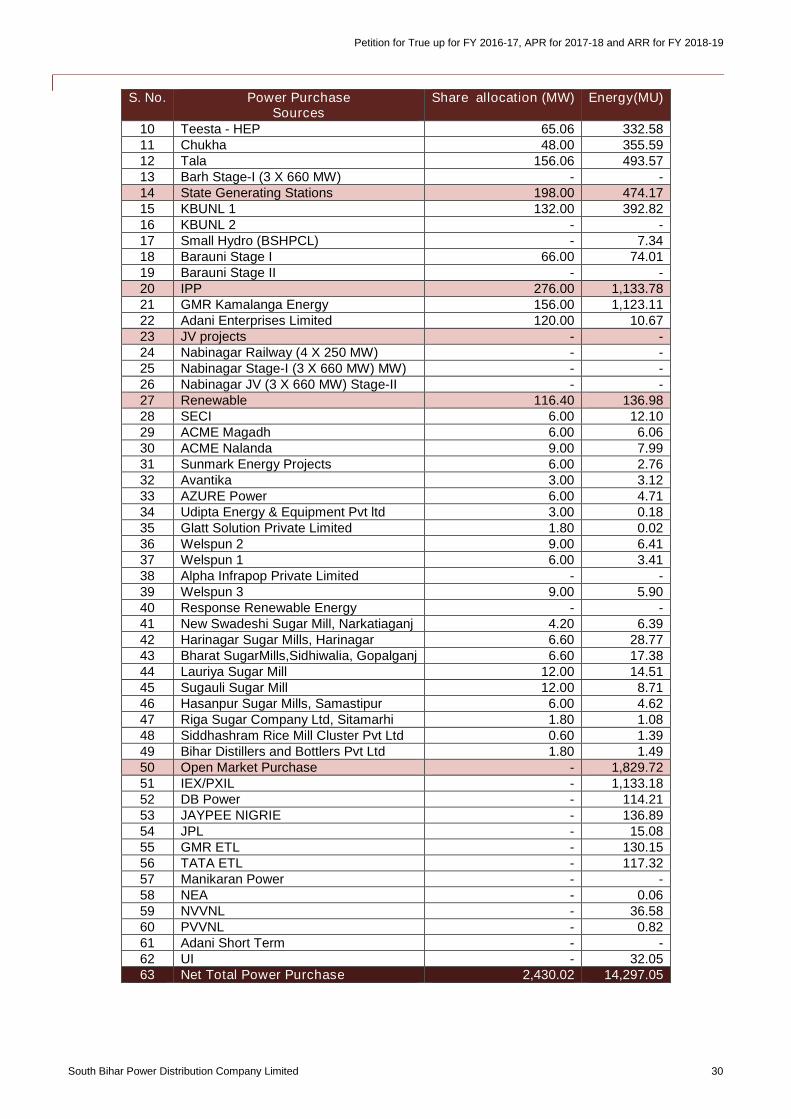
Petition for True up for FY 2016-17, APR for 2017-18 and ARR for FY 2018-19
South Bihar Power Distribution Company Limited 30
S. No. Power PurchaseSources
Share allocation (MW) Energy(MU)
10 Teesta - HEP 65.06 332.5811 Chukha 48.00 355.5912 Tala 156.06 493.5713 Barh Stage-I (3 X 660 MW) - -14 State Generating Stations 198.00 474.1715 KBUNL 1 132.00 392.8216 KBUNL 2 - -17 Small Hydro (BSHPCL) - 7.3418 Barauni Stage I 66.00 74.0119 Barauni Stage II - -20 IPP 276.00 1,133.7821 GMR Kamalanga Energy 156.00 1,123.1122 Adani Enterprises Limited 120.00 10.6723 JV projects - -24 Nabinagar Railway (4 X 250 MW) - -25 Nabinagar Stage-I (3 X 660 MW) MW) - -26 Nabinagar JV (3 X 660 MW) Stage-II - -27 Renewable 116.40 136.9828 SECI 6.00 12.1029 ACME Magadh 6.00 6.0630 ACME Nalanda 9.00 7.9931 Sunmark Energy Projects 6.00 2.7632 Avantika 3.00 3.1233 AZURE Power 6.00 4.7134 Udipta Energy & Equipment Pvt ltd 3.00 0.1835 Glatt Solution Private Limited 1.80 0.0236 Welspun 2 9.00 6.4137 Welspun 1 6.00 3.4138 Alpha Infrapop Private Limited - -39 Welspun 3 9.00 5.9040 Response Renewable Energy - -41 New Swadeshi Sugar Mill, Narkatiaganj 4.20 6.3942 Harinagar Sugar Mills, Harinagar 6.60 28.7743 Bharat SugarMills,Sidhiwalia, Gopalganj 6.60 17.3844 Lauriya Sugar Mill 12.00 14.5145 Sugauli Sugar Mill 12.00 8.7146 Hasanpur Sugar Mills, Samastipur 6.00 4.6247 Riga Sugar Company Ltd, Sitamarhi 1.80 1.0848 Siddhashram Rice Mill Cluster Pvt Ltd 0.60 1.3949 Bihar Distillers and Bottlers Pvt Ltd 1.80 1.4950 Open Market Purchase - 1,829.7251 IEX/PXIL - 1,133.1852 DB Power - 114.2153 JAYPEE NIGRIE - 136.8954 JPL - 15.0855 GMR ETL - 130.1556 TATA ETL - 117.3257 Manikaran Power - -58 NEA - 0.0659 NVVNL - 36.5860 PVVNL - 0.8261 Adani Short Term - -62 UI - 32.0563 Net Total Power Purchase 2,430.02 14,297.05
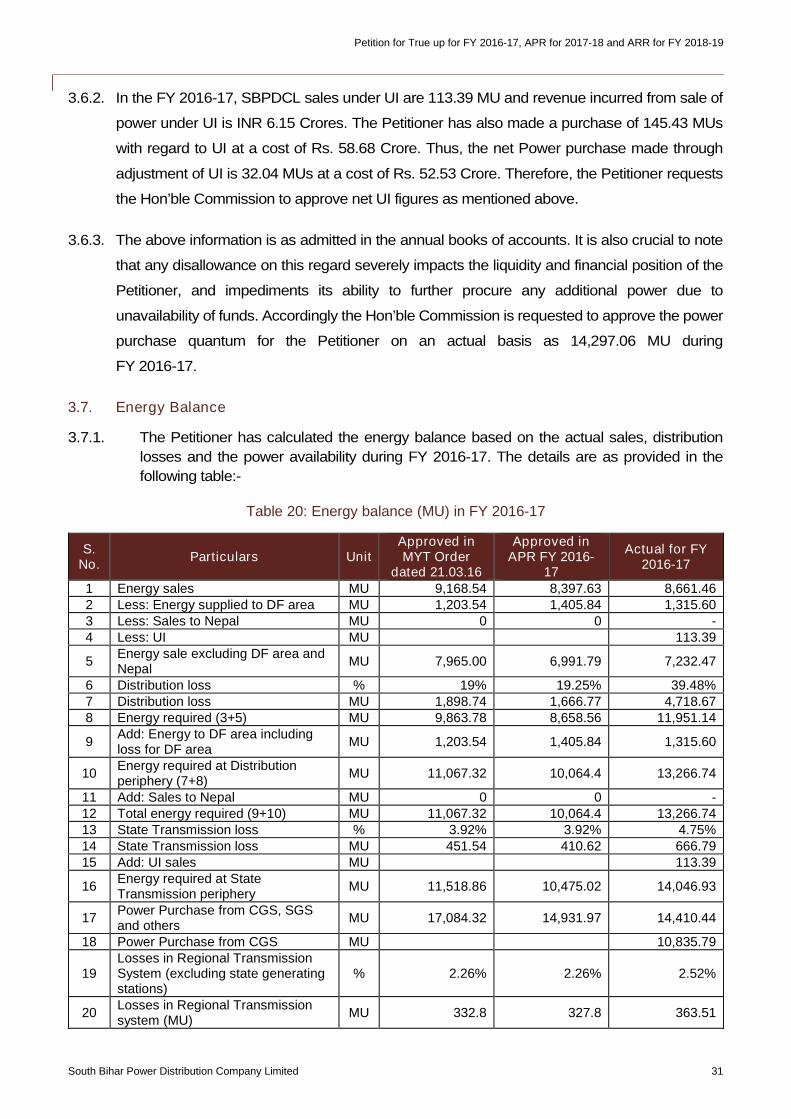
Petition for True up for FY 2016-17, APR for 2017-18 and ARR for FY 2018-19
South Bihar Power Distribution Company Limited 31
3.6.2. In the FY 2016-17, SBPDCL sales under UI are 113.39 MU and revenue incurred from sale of
power under UI is INR 6.15 Crores. The Petitioner has also made a purchase of 145.43 MUs
with regard to UI at a cost of Rs. 58.68 Crore. Thus, the net Power purchase made through
adjustment of UI is 32.04 MUs at a cost of Rs. 52.53 Crore. Therefore, the Petitioner requests
the Hon’ble Commission to approve net UI figures as mentioned above.
3.6.3. The above information is as admitted in the annual books of accounts. It is also crucial to note
that any disallowance on this regard severely impacts the liquidity and financial position of the
Petitioner, and impediments its ability to further procure any additional power due to
unavailability of funds. Accordingly the Hon’ble Commission is requested to approve the power
purchase quantum for the Petitioner on an actual basis as 14,297.06 MU during
FY 2016-17.
3.7. Energy Balance
3.7.1. The Petitioner has calculated the energy balance based on the actual sales, distribution
losses and the power availability during FY 2016-17. The details are as provided in the
following table:-
Table 20: Energy balance (MU) in FY 2016-17
S.No.
Particulars UnitApproved inMYT Order
dated 21.03.16
Approved inAPR FY 2016-
17
Actual for FY2016-17
1 Energy sales MU 9,168.54 8,397.63 8,661.462 Less: Energy supplied to DF area MU 1,203.54 1,405.84 1,315.603 Less: Sales to Nepal MU 0 0 -4 Less: UI MU 113.39
5Energy sale excluding DF area andNepal
MU 7,965.00 6,991.79 7,232.47
6 Distribution loss % 19% 19.25% 39.48%7 Distribution loss MU 1,898.74 1,666.77 4,718.678 Energy required (3+5) MU 9,863.78 8,658.56 11,951.14
9Add: Energy to DF area includingloss for DF area
MU 1,203.54 1,405.84 1,315.60
10Energy required at Distributionperiphery (7+8)
MU 11,067.32 10,064.4 13,266.74
11 Add: Sales to Nepal MU 0 0 -12 Total energy required (9+10) MU 11,067.32 10,064.4 13,266.7413 State Transmission loss % 3.92% 3.92% 4.75%14 State Transmission loss MU 451.54 410.62 666.7915 Add: UI sales MU 113.39
16Energy required at StateTransmission periphery
MU 11,518.86 10,475.02 14,046.93
17Power Purchase from CGS, SGSand others
MU 17,084.32 14,931.97 14,410.44
18 Power Purchase from CGS MU 10,835.79
19Losses in Regional TransmissionSystem (excluding state generatingstations)
% 2.26% 2.26% 2.52%
20Losses in Regional Transmissionsystem (MU)
MU 332.8 327.8 363.51
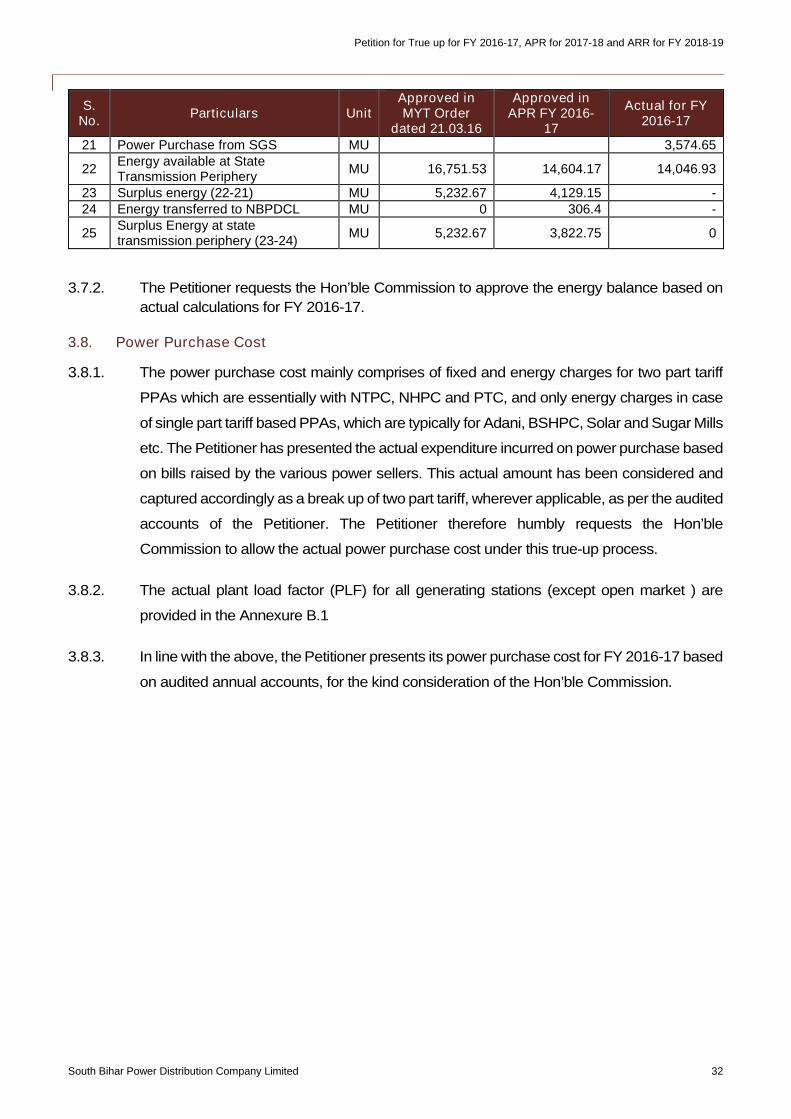
Petition for True up for FY 2016-17, APR for 2017-18 and ARR for FY 2018-19
South Bihar Power Distribution Company Limited 32
S.No.
Particulars UnitApproved inMYT Order
dated 21.03.16
Approved inAPR FY 2016-
17
Actual for FY2016-17
21 Power Purchase from SGS MU 3,574.65
22Energy available at StateTransmission Periphery
MU 16,751.53 14,604.17 14,046.93
23 Surplus energy (22-21) MU 5,232.67 4,129.15 -24 Energy transferred to NBPDCL MU 0 306.4 -
25Surplus Energy at statetransmission periphery (23-24)
MU 5,232.67 3,822.75 0
3.7.2. The Petitioner requests the Hon’ble Commission to approve the energy balance based on
actual calculations for FY 2016-17.
3.8. Power Purchase Cost
3.8.1. The power purchase cost mainly comprises of fixed and energy charges for two part tariff
PPAs which are essentially with NTPC, NHPC and PTC, and only energy charges in case
of single part tariff based PPAs, which are typically for Adani, BSHPC, Solar and Sugar Mills
etc. The Petitioner has presented the actual expenditure incurred on power purchase based
on bills raised by the various power sellers. This actual amount has been considered and
captured accordingly as a break up of two part tariff, wherever applicable, as per the audited
accounts of the Petitioner. The Petitioner therefore humbly requests the Hon’ble
Commission to allow the actual power purchase cost under this true-up process.
3.8.2. The actual plant load factor (PLF) for all generating stations (except open market ) are
provided in the Annexure B.1
3.8.3. In line with the above, the Petitioner presents its power purchase cost for FY 2016-17 based
on audited annual accounts, for the kind consideration of the Hon’ble Commission.
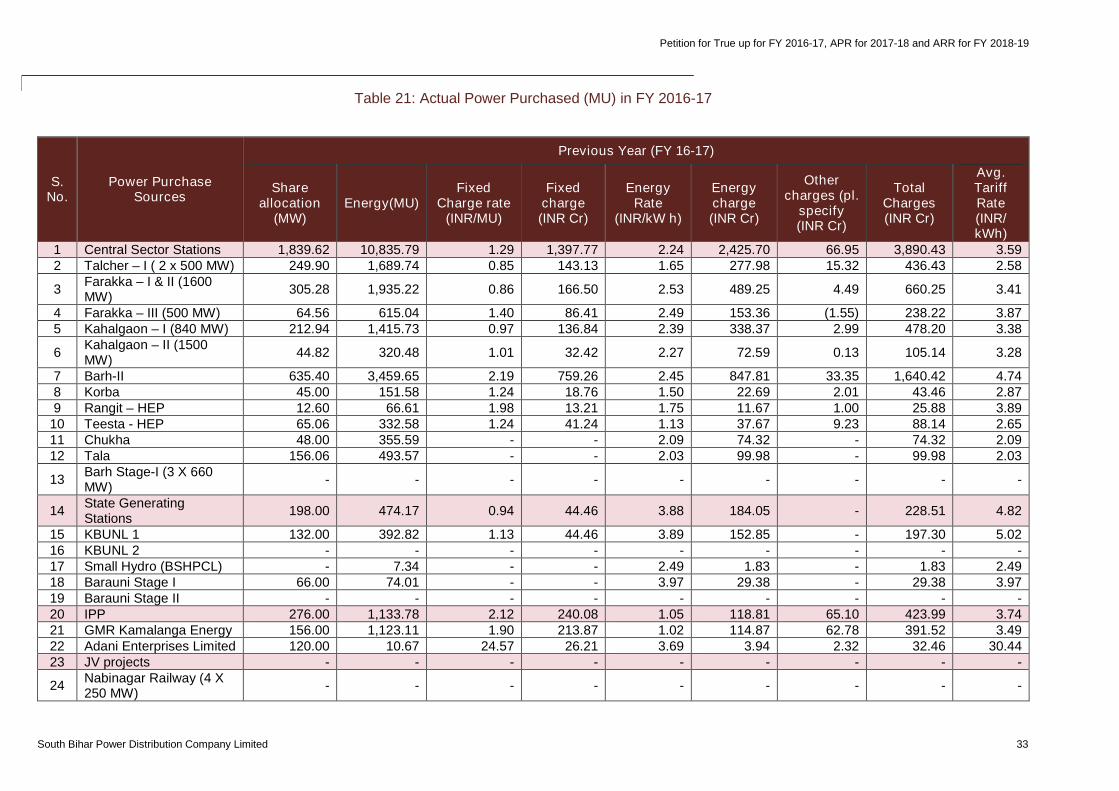
Petition for True up for FY 2016-17, APR for 2017-18 and ARR for FY 2018-19
South Bihar Power Distribution Company Limited 33
Table 21: Actual Power Purchased (MU) in FY 2016-17
S.No.
Power PurchaseSources
Previous Year (FY 16-17)
Shareallocation
(MW)Energy(MU)
FixedCharge rate
(INR/MU)
Fixedcharge(INR Cr)
EnergyRate
(INR/kW h)
Energycharge(INR Cr)
Othercharges (pl.
specify(INR Cr)
TotalCharges(INR Cr)
Avg.TariffRate(INR/kWh)
1 Central Sector Stations 1,839.62 10,835.79 1.29 1,397.77 2.24 2,425.70 66.95 3,890.43 3.592 Talcher – I ( 2 x 500 MW) 249.90 1,689.74 0.85 143.13 1.65 277.98 15.32 436.43 2.58
3Farakka – I & II (1600MW)
305.28 1,935.22 0.86 166.50 2.53 489.25 4.49 660.25 3.41
4 Farakka – III (500 MW) 64.56 615.04 1.40 86.41 2.49 153.36 (1.55) 238.22 3.875 Kahalgaon – I (840 MW) 212.94 1,415.73 0.97 136.84 2.39 338.37 2.99 478.20 3.38
6Kahalgaon – II (1500MW)
44.82 320.48 1.01 32.42 2.27 72.59 0.13 105.14 3.28
7 Barh-II 635.40 3,459.65 2.19 759.26 2.45 847.81 33.35 1,640.42 4.748 Korba 45.00 151.58 1.24 18.76 1.50 22.69 2.01 43.46 2.879 Rangit – HEP 12.60 66.61 1.98 13.21 1.75 11.67 1.00 25.88 3.89
10 Teesta - HEP 65.06 332.58 1.24 41.24 1.13 37.67 9.23 88.14 2.6511 Chukha 48.00 355.59 - - 2.09 74.32 - 74.32 2.0912 Tala 156.06 493.57 - - 2.03 99.98 - 99.98 2.03
13Barh Stage-I (3 X 660MW)
- - - - - - - - -
14State GeneratingStations
198.00 474.17 0.94 44.46 3.88 184.05 - 228.51 4.82
15 KBUNL 1 132.00 392.82 1.13 44.46 3.89 152.85 - 197.30 5.0216 KBUNL 2 - - - - - - - - -17 Small Hydro (BSHPCL) - 7.34 - - 2.49 1.83 - 1.83 2.4918 Barauni Stage I 66.00 74.01 - - 3.97 29.38 - 29.38 3.9719 Barauni Stage II - - - - - - - - -20 IPP 276.00 1,133.78 2.12 240.08 1.05 118.81 65.10 423.99 3.7421 GMR Kamalanga Energy 156.00 1,123.11 1.90 213.87 1.02 114.87 62.78 391.52 3.4922 Adani Enterprises Limited 120.00 10.67 24.57 26.21 3.69 3.94 2.32 32.46 30.4423 JV projects - - - - - - - - -
24Nabinagar Railway (4 X250 MW)
- - - - - - - - -
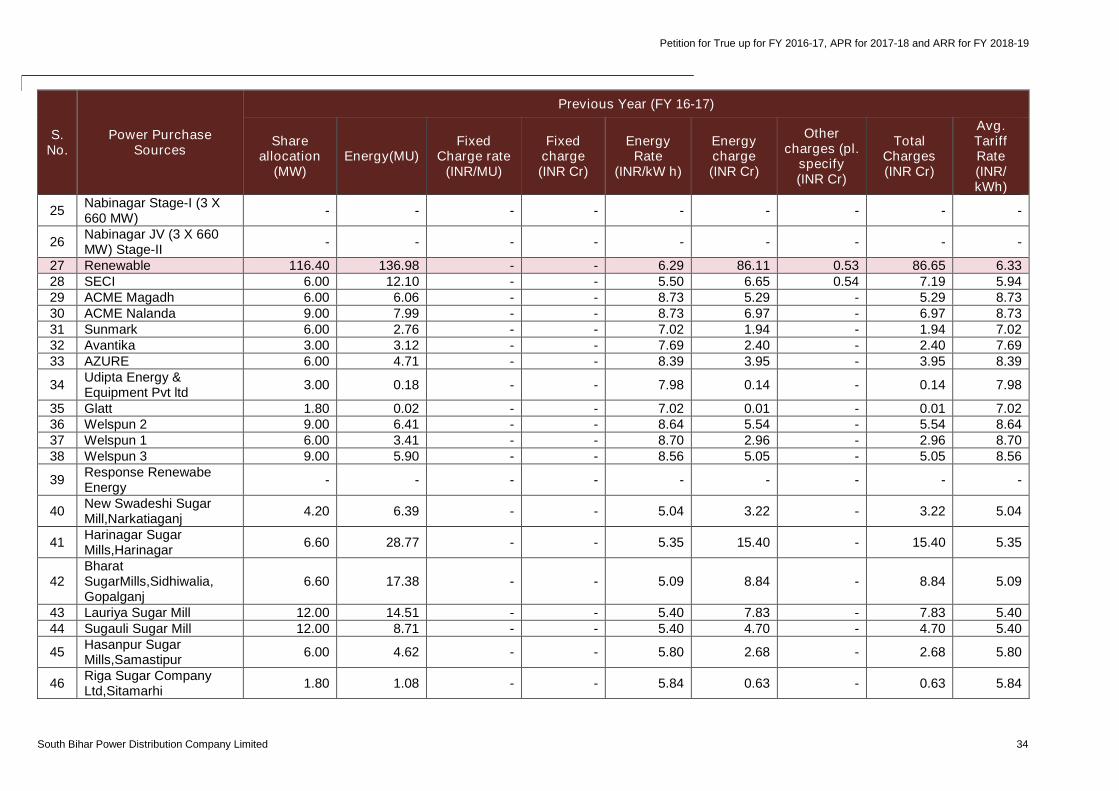
Petition for True up for FY 2016-17, APR for 2017-18 and ARR for FY 2018-19
South Bihar Power Distribution Company Limited 34
S.No.
Power PurchaseSources
Previous Year (FY 16-17)
Shareallocation
(MW)Energy(MU)
FixedCharge rate
(INR/MU)
Fixedcharge(INR Cr)
EnergyRate
(INR/kW h)
Energycharge(INR Cr)
Othercharges (pl.
specify(INR Cr)
TotalCharges(INR Cr)
Avg.TariffRate(INR/kWh)
25Nabinagar Stage-I (3 X660 MW)
- - - - - - - - -
26Nabinagar JV (3 X 660MW) Stage-II
- - - - - - - - -
27 Renewable 116.40 136.98 - - 6.29 86.11 0.53 86.65 6.3328 SECI 6.00 12.10 - - 5.50 6.65 0.54 7.19 5.9429 ACME Magadh 6.00 6.06 - - 8.73 5.29 - 5.29 8.7330 ACME Nalanda 9.00 7.99 - - 8.73 6.97 - 6.97 8.7331 Sunmark 6.00 2.76 - - 7.02 1.94 - 1.94 7.0232 Avantika 3.00 3.12 - - 7.69 2.40 - 2.40 7.6933 AZURE 6.00 4.71 - - 8.39 3.95 - 3.95 8.39
34Udipta Energy &Equipment Pvt ltd
3.00 0.18 - - 7.98 0.14 - 0.14 7.98
35 Glatt 1.80 0.02 - - 7.02 0.01 - 0.01 7.0236 Welspun 2 9.00 6.41 - - 8.64 5.54 - 5.54 8.6437 Welspun 1 6.00 3.41 - - 8.70 2.96 - 2.96 8.7038 Welspun 3 9.00 5.90 - - 8.56 5.05 - 5.05 8.56
39Response RenewabeEnergy
- - - - - - - - -
40New Swadeshi SugarMill,Narkatiaganj
4.20 6.39 - - 5.04 3.22 - 3.22 5.04
41Harinagar SugarMills,Harinagar
6.60 28.77 - - 5.35 15.40 - 15.40 5.35
42BharatSugarMills,Sidhiwalia,Gopalganj
6.60 17.38 - - 5.09 8.84 - 8.84 5.09
43 Lauriya Sugar Mill 12.00 14.51 - - 5.40 7.83 - 7.83 5.4044 Sugauli Sugar Mill 12.00 8.71 - - 5.40 4.70 - 4.70 5.40
45Hasanpur SugarMills,Samastipur
6.00 4.62 - - 5.80 2.68 - 2.68 5.80
46Riga Sugar CompanyLtd,Sitamarhi
1.80 1.08 - - 5.84 0.63 - 0.63 5.84
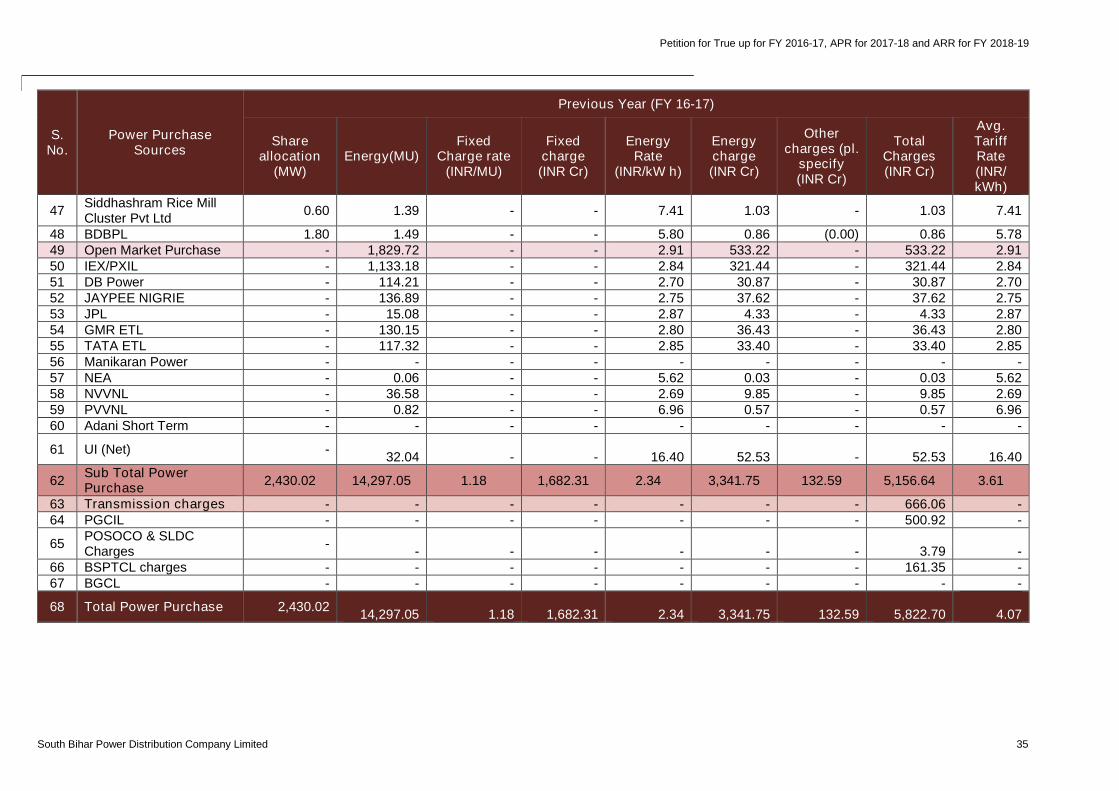
Petition for True up for FY 2016-17, APR for 2017-18 and ARR for FY 2018-19
South Bihar Power Distribution Company Limited 35
S.No.
Power PurchaseSources
Previous Year (FY 16-17)
Shareallocation
(MW)Energy(MU)
FixedCharge rate
(INR/MU)
Fixedcharge(INR Cr)
EnergyRate
(INR/kW h)
Energycharge(INR Cr)
Othercharges (pl.
specify(INR Cr)
TotalCharges(INR Cr)
Avg.TariffRate(INR/kWh)
47Siddhashram Rice MillCluster Pvt Ltd
0.60 1.39 - - 7.41 1.03 - 1.03 7.41
48 BDBPL 1.80 1.49 - - 5.80 0.86 (0.00) 0.86 5.7849 Open Market Purchase - 1,829.72 - - 2.91 533.22 - 533.22 2.9150 IEX/PXIL - 1,133.18 - - 2.84 321.44 - 321.44 2.8451 DB Power - 114.21 - - 2.70 30.87 - 30.87 2.7052 JAYPEE NIGRIE - 136.89 - - 2.75 37.62 - 37.62 2.7553 JPL - 15.08 - - 2.87 4.33 - 4.33 2.8754 GMR ETL - 130.15 - - 2.80 36.43 - 36.43 2.8055 TATA ETL - 117.32 - - 2.85 33.40 - 33.40 2.8556 Manikaran Power - - - - - - - - -57 NEA - 0.06 - - 5.62 0.03 - 0.03 5.6258 NVVNL - 36.58 - - 2.69 9.85 - 9.85 2.6959 PVVNL - 0.82 - - 6.96 0.57 - 0.57 6.9660 Adani Short Term - - - - - - - - -
61 UI (Net) -32.04 - - 16.40 52.53 - 52.53 16.40
62Sub Total PowerPurchase
2,430.02 14,297.05 1.18 1,682.31 2.34 3,341.75 132.59 5,156.64 3.61
63 Transmission charges - - - - - - - 666.06 -64 PGCIL - - - - - - - 500.92 -
65POSOCO & SLDCCharges
-- - - - - - 3.79 -
66 BSPTCL charges - - - - - - - 161.35 -67 BGCL - - - - - - - - -
68 Total Power Purchase 2,430.0214,297.05 1.18 1,682.31 2.34 3,341.75 132.59 5,822.70 4.07
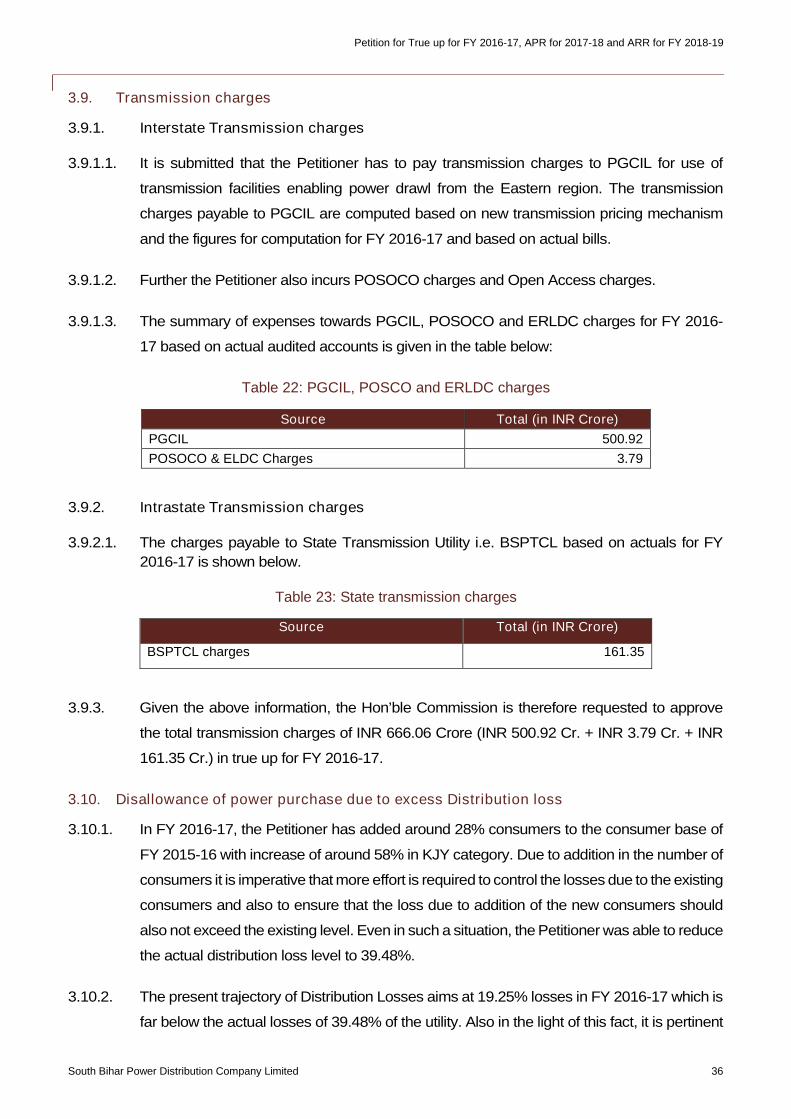
Petition for True up for FY 2016-17, APR for 2017-18 and ARR for FY 2018-19
South Bihar Power Distribution Company Limited 36
3.9. Transmission charges
3.9.1. Interstate Transmission charges
3.9.1.1. It is submitted that the Petitioner has to pay transmission charges to PGCIL for use of
transmission facilities enabling power drawl from the Eastern region. The transmission
charges payable to PGCIL are computed based on new transmission pricing mechanism
and the figures for computation for FY 2016-17 and based on actual bills.
3.9.1.2. Further the Petitioner also incurs POSOCO charges and Open Access charges.
3.9.1.3. The summary of expenses towards PGCIL, POSOCO and ERLDC charges for FY 2016-
17 based on actual audited accounts is given in the table below:
Table 22: PGCIL, POSCO and ERLDC charges
Source Total (in INR Crore)
PGCIL 500.92
POSOCO & ELDC Charges 3.79
3.9.2. Intrastate Transmission charges
3.9.2.1. The charges payable to State Transmission Utility i.e. BSPTCL based on actuals for FY
2016-17 is shown below.
Table 23: State transmission charges
Source Total (in INR Crore)
BSPTCL charges 161.35
3.9.3. Given the above information, the Hon’ble Commission is therefore requested to approve
the total transmission charges of INR 666.06 Crore (INR 500.92 Cr. + INR 3.79 Cr. + INR
161.35 Cr.) in true up for FY 2016-17.
3.10. Disallowance of power purchase due to excess Distribution loss
3.10.1. In FY 2016-17, the Petitioner has added around 28% consumers to the consumer base of
FY 2015-16 with increase of around 58% in KJY category. Due to addition in the number of
consumers it is imperative that more effort is required to control the losses due to the existing
consumers and also to ensure that the loss due to addition of the new consumers should
also not exceed the existing level. Even in such a situation, the Petitioner was able to reduce
the actual distribution loss level to 39.48%.
3.10.2. The present trajectory of Distribution Losses aims at 19.25% losses in FY 2016-17 which is
far below the actual losses of 39.48% of the utility. Also in the light of this fact, it is pertinent
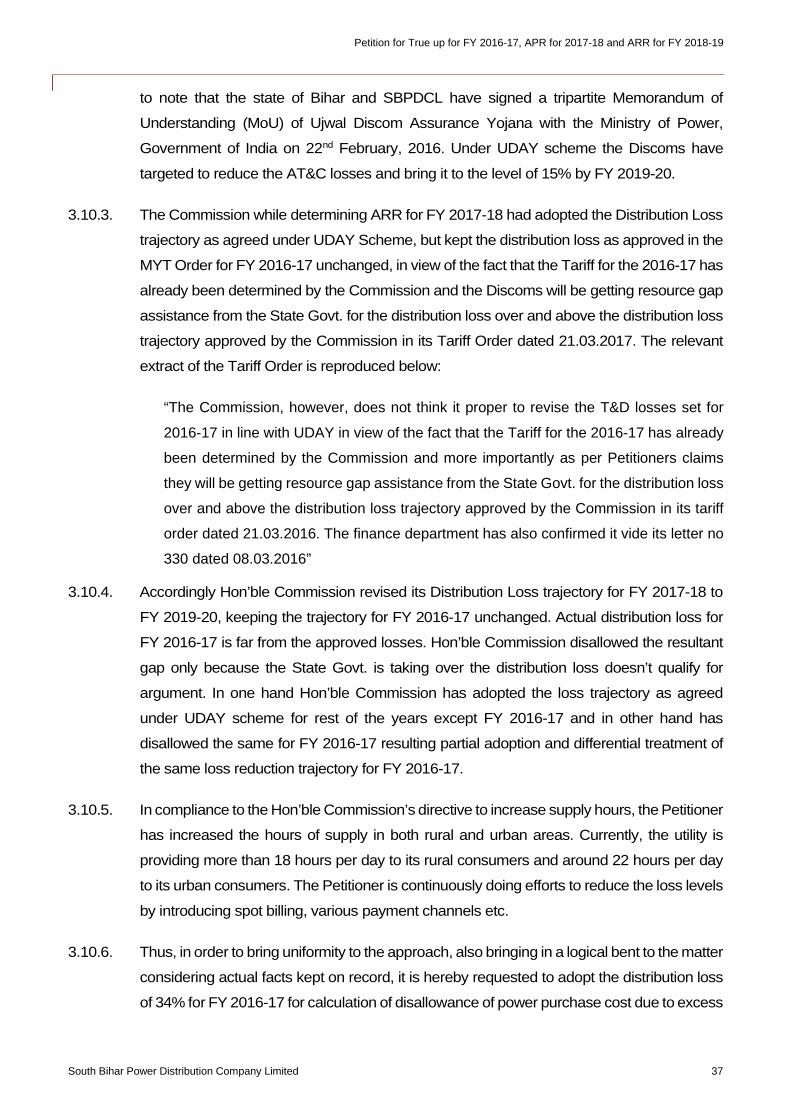
Petition for True up for FY 2016-17, APR for 2017-18 and ARR for FY 2018-19
South Bihar Power Distribution Company Limited 37
to note that the state of Bihar and SBPDCL have signed a tripartite Memorandum of
Understanding (MoU) of Ujwal Discom Assurance Yojana with the Ministry of Power,
Government of India on 22nd February, 2016. Under UDAY scheme the Discoms have
targeted to reduce the AT&C losses and bring it to the level of 15% by FY 2019-20.
3.10.3. The Commission while determining ARR for FY 2017-18 had adopted the Distribution Loss
trajectory as agreed under UDAY Scheme, but kept the distribution loss as approved in the
MYT Order for FY 2016-17 unchanged, in view of the fact that the Tariff for the 2016-17 has
already been determined by the Commission and the Discoms will be getting resource gap
assistance from the State Govt. for the distribution loss over and above the distribution loss
trajectory approved by the Commission in its Tariff Order dated 21.03.2017. The relevant
extract of the Tariff Order is reproduced below:
“The Commission, however, does not think it proper to revise the T&D losses set for
2016-17 in line with UDAY in view of the fact that the Tariff for the 2016-17 has already
been determined by the Commission and more importantly as per Petitioners claims
they will be getting resource gap assistance from the State Govt. for the distribution loss
over and above the distribution loss trajectory approved by the Commission in its tariff
order dated 21.03.2016. The finance department has also confirmed it vide its letter no
330 dated 08.03.2016”
3.10.4. Accordingly Hon’ble Commission revised its Distribution Loss trajectory for FY 2017-18 to
FY 2019-20, keeping the trajectory for FY 2016-17 unchanged. Actual distribution loss for
FY 2016-17 is far from the approved losses. Hon’ble Commission disallowed the resultant
gap only because the State Govt. is taking over the distribution loss doesn’t qualify for
argument. In one hand Hon’ble Commission has adopted the loss trajectory as agreed
under UDAY scheme for rest of the years except FY 2016-17 and in other hand has
disallowed the same for FY 2016-17 resulting partial adoption and differential treatment of
the same loss reduction trajectory for FY 2016-17.
3.10.5. In compliance to the Hon’ble Commission’s directive to increase supply hours, the Petitioner
has increased the hours of supply in both rural and urban areas. Currently, the utility is
providing more than 18 hours per day to its rural consumers and around 22 hours per day
to its urban consumers. The Petitioner is continuously doing efforts to reduce the loss levels
by introducing spot billing, various payment channels etc.
3.10.6. Thus, in order to bring uniformity to the approach, also bringing in a logical bent to the matter
considering actual facts kept on record, it is hereby requested to adopt the distribution loss
of 34% for FY 2016-17 for calculation of disallowance of power purchase cost due to excess
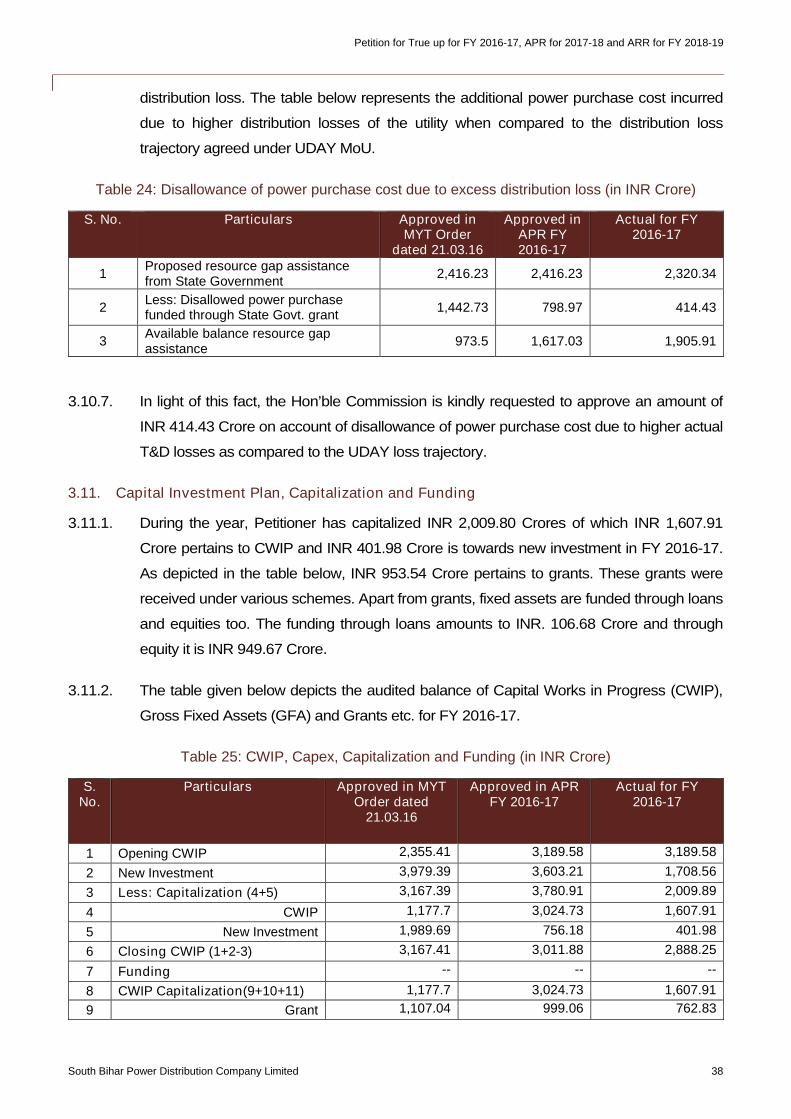
Petition for True up for FY 2016-17, APR for 2017-18 and ARR for FY 2018-19
South Bihar Power Distribution Company Limited 38
distribution loss. The table below represents the additional power purchase cost incurred
due to higher distribution losses of the utility when compared to the distribution loss
trajectory agreed under UDAY MoU.
Table 24: Disallowance of power purchase cost due to excess distribution loss (in INR Crore)
S. No. Particulars Approved inMYT Order
dated 21.03.16
Approved inAPR FY2016-17
Actual for FY2016-17
1Proposed resource gap assistancefrom State Government
2,416.23 2,416.23 2,320.34
2Less: Disallowed power purchasefunded through State Govt. grant
1,442.73 798.97 414.43
3Available balance resource gapassistance
973.5 1,617.03 1,905.91
3.10.7. In light of this fact, the Hon’ble Commission is kindly requested to approve an amount of
INR 414.43 Crore on account of disallowance of power purchase cost due to higher actual
T&D losses as compared to the UDAY loss trajectory.
3.11. Capital Investment Plan, Capitalization and Funding
3.11.1. During the year, Petitioner has capitalized INR 2,009.80 Crores of which INR 1,607.91
Crore pertains to CWIP and INR 401.98 Crore is towards new investment in FY 2016-17.
As depicted in the table below, INR 953.54 Crore pertains to grants. These grants were
received under various schemes. Apart from grants, fixed assets are funded through loans
and equities too. The funding through loans amounts to INR. 106.68 Crore and through
equity it is INR 949.67 Crore.
3.11.2. The table given below depicts the audited balance of Capital Works in Progress (CWIP),
Gross Fixed Assets (GFA) and Grants etc. for FY 2016-17.
Table 25: CWIP, Capex, Capitalization and Funding (in INR Crore)
S.No.
Particulars Approved in MYTOrder dated
21.03.16
Approved in APRFY 2016-17
Actual for FY2016-17
1 Opening CWIP 2,355.41 3,189.58 3,189.58
2 New Investment 3,979.39 3,603.21 1,708.56
3 Less: Capitalization (4+5) 3,167.39 3,780.91 2,009.89
4 CWIP 1,177.7 3,024.73 1,607.91
5 New Investment 1,989.69 756.18 401.98
6 Closing CWIP (1+2-3) 3,167.41 3,011.88 2,888.25
7 Funding -- -- --
8 CWIP Capitalization(9+10+11) 1,177.7 3,024.73 1,607.91
9 Grant 1,107.04 999.06 762.83
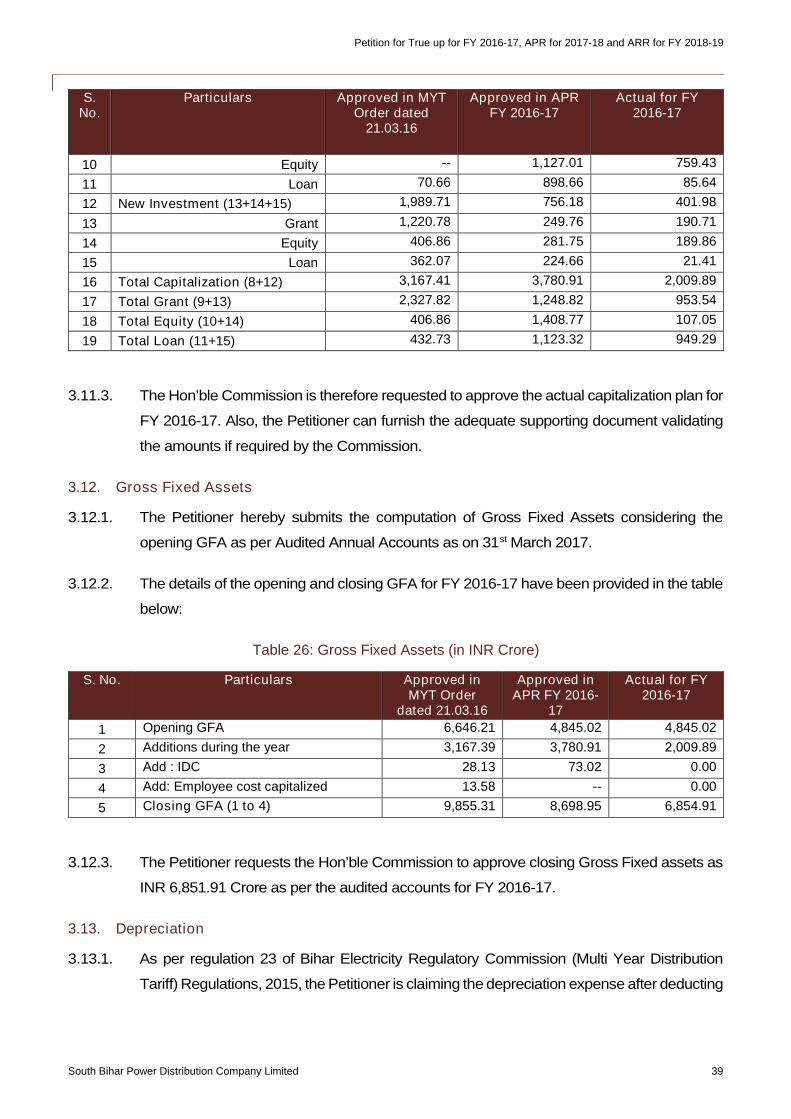
Petition for True up for FY 2016-17, APR for 2017-18 and ARR for FY 2018-19
South Bihar Power Distribution Company Limited 39
S.No.
Particulars Approved in MYTOrder dated
21.03.16
Approved in APRFY 2016-17
Actual for FY2016-17
10 Equity -- 1,127.01 759.43
11 Loan 70.66 898.66 85.64
12 New Investment (13+14+15) 1,989.71 756.18 401.98
13 Grant 1,220.78 249.76 190.71
14 Equity 406.86 281.75 189.86
15 Loan 362.07 224.66 21.41
16 Total Capitalization (8+12) 3,167.41 3,780.91 2,009.89
17 Total Grant (9+13) 2,327.82 1,248.82 953.54
18 Total Equity (10+14) 406.86 1,408.77 107.05
19 Total Loan (11+15) 432.73 1,123.32 949.29
3.11.3. The Hon’ble Commission is therefore requested to approve the actual capitalization plan for
FY 2016-17. Also, the Petitioner can furnish the adequate supporting document validating
the amounts if required by the Commission.
3.12. Gross Fixed Assets
3.12.1. The Petitioner hereby submits the computation of Gross Fixed Assets considering the
opening GFA as per Audited Annual Accounts as on 31st March 2017.
3.12.2. The details of the opening and closing GFA for FY 2016-17 have been provided in the table
below:
Table 26: Gross Fixed Assets (in INR Crore)
S. No. Particulars Approved inMYT Order
dated 21.03.16
Approved inAPR FY 2016-
17
Actual for FY2016-17
1 Opening GFA 6,646.21 4,845.02 4,845.02
2 Additions during the year 3,167.39 3,780.91 2,009.89
3 Add : IDC 28.13 73.02 0.00
4 Add: Employee cost capitalized 13.58 -- 0.00
5 Closing GFA (1 to 4) 9,855.31 8,698.95 6,854.91
3.12.3. The Petitioner requests the Hon’ble Commission to approve closing Gross Fixed assets as
INR 6,851.91 Crore as per the audited accounts for FY 2016-17.
3.13. Depreciation
3.13.1. As per regulation 23 of Bihar Electricity Regulatory Commission (Multi Year Distribution
Tariff) Regulations, 2015, the Petitioner is claiming the depreciation expense after deducting
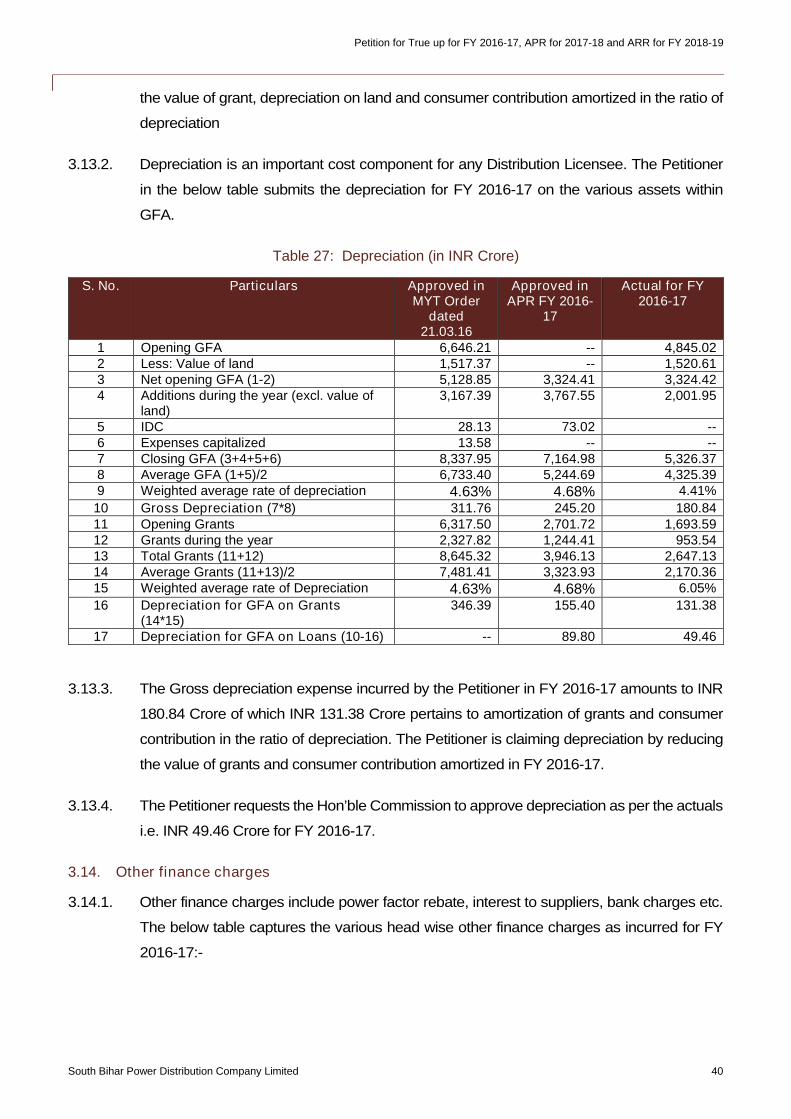
Petition for True up for FY 2016-17, APR for 2017-18 and ARR for FY 2018-19
South Bihar Power Distribution Company Limited 40
the value of grant, depreciation on land and consumer contribution amortized in the ratio of
depreciation
3.13.2. Depreciation is an important cost component for any Distribution Licensee. The Petitioner
in the below table submits the depreciation for FY 2016-17 on the various assets within
GFA.
Table 27: Depreciation (in INR Crore)
S. No. Particulars Approved inMYT Order
dated21.03.16
Approved inAPR FY 2016-
17
Actual for FY2016-17
1 Opening GFA 6,646.21 -- 4,845.022 Less: Value of land 1,517.37 -- 1,520.613 Net opening GFA (1-2) 5,128.85 3,324.41 3,324.424 Additions during the year (excl. value of
land)3,167.39 3,767.55 2,001.95
5 IDC 28.13 73.02 --6 Expenses capitalized 13.58 -- --7 Closing GFA (3+4+5+6) 8,337.95 7,164.98 5,326.378 Average GFA (1+5)/2 6,733.40 5,244.69 4,325.399 Weighted average rate of depreciation 4.63% 4.68% 4.41%
10 Gross Depreciation (7*8) 311.76 245.20 180.8411 Opening Grants 6,317.50 2,701.72 1,693.5912 Grants during the year 2,327.82 1,244.41 953.5413 Total Grants (11+12) 8,645.32 3,946.13 2,647.1314 Average Grants (11+13)/2 7,481.41 3,323.93 2,170.3615 Weighted average rate of Depreciation 4.63% 4.68% 6.05%
16 Depreciation for GFA on Grants(14*15)
346.39 155.40 131.38
17 Depreciation for GFA on Loans (10-16) -- 89.80 49.46
3.13.3. The Gross depreciation expense incurred by the Petitioner in FY 2016-17 amounts to INR
180.84 Crore of which INR 131.38 Crore pertains to amortization of grants and consumer
contribution in the ratio of depreciation. The Petitioner is claiming depreciation by reducing
the value of grants and consumer contribution amortized in FY 2016-17.
3.13.4. The Petitioner requests the Hon’ble Commission to approve depreciation as per the actuals
i.e. INR 49.46 Crore for FY 2016-17.
3.14. Other finance charges
3.14.1. Other finance charges include power factor rebate, interest to suppliers, bank charges etc.
The below table captures the various head wise other finance charges as incurred for FY
2016-17:-
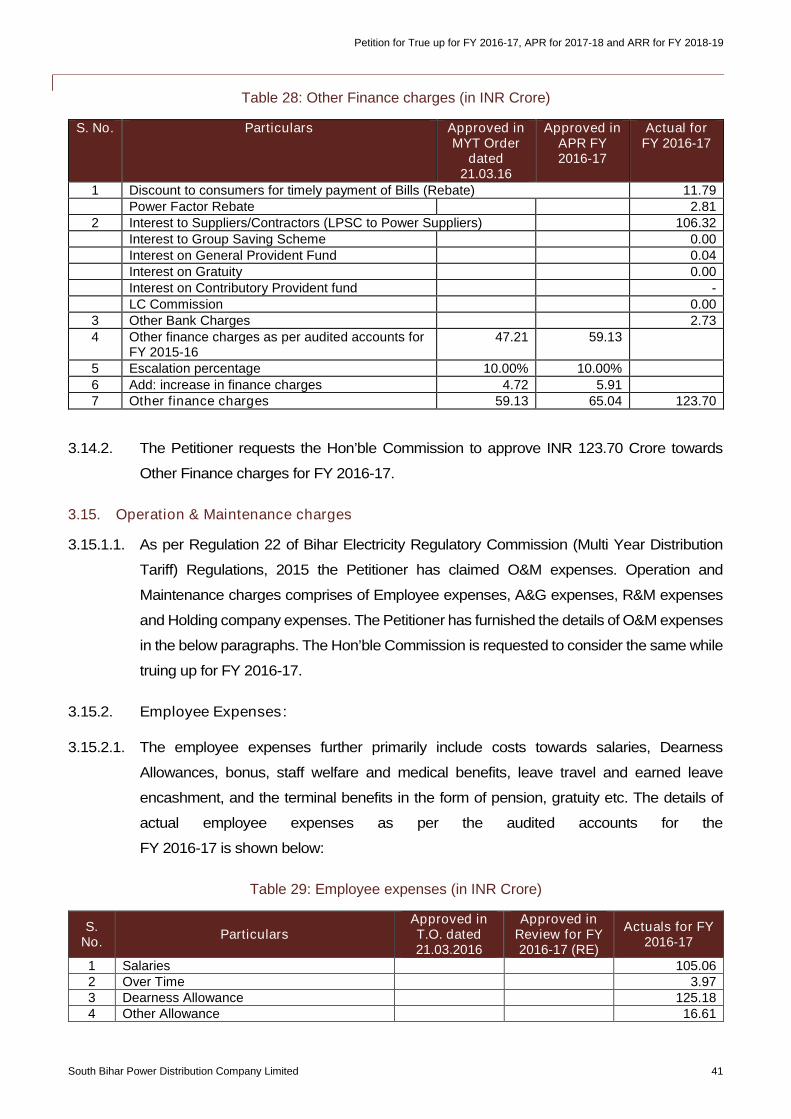
Petition for True up for FY 2016-17, APR for 2017-18 and ARR for FY 2018-19
South Bihar Power Distribution Company Limited 41
Table 28: Other Finance charges (in INR Crore)
S. No. Particulars Approved inMYT Order
dated21.03.16
Approved inAPR FY2016-17
Actual forFY 2016-17
1 Discount to consumers for timely payment of Bills (Rebate) 11.79Power Factor Rebate 2.81
2 Interest to Suppliers/Contractors (LPSC to Power Suppliers) 106.32Interest to Group Saving Scheme 0.00Interest on General Provident Fund 0.04Interest on Gratuity 0.00Interest on Contributory Provident fund -LC Commission 0.00
3 Other Bank Charges 2.734 Other finance charges as per audited accounts for
FY 2015-1647.21 59.13
5 Escalation percentage 10.00% 10.00%6 Add: increase in finance charges 4.72 5.917 Other finance charges 59.13 65.04 123.70
3.14.2. The Petitioner requests the Hon’ble Commission to approve INR 123.70 Crore towards
Other Finance charges for FY 2016-17.
3.15. Operation & Maintenance charges
3.15.1.1. As per Regulation 22 of Bihar Electricity Regulatory Commission (Multi Year Distribution
Tariff) Regulations, 2015 the Petitioner has claimed O&M expenses. Operation and
Maintenance charges comprises of Employee expenses, A&G expenses, R&M expenses
and Holding company expenses. The Petitioner has furnished the details of O&M expenses
in the below paragraphs. The Hon’ble Commission is requested to consider the same while
truing up for FY 2016-17.
3.15.2. Employee Expenses:
3.15.2.1. The employee expenses further primarily include costs towards salaries, Dearness
Allowances, bonus, staff welfare and medical benefits, leave travel and earned leave
encashment, and the terminal benefits in the form of pension, gratuity etc. The details of
actual employee expenses as per the audited accounts for the
FY 2016-17 is shown below:
Table 29: Employee expenses (in INR Crore)
S.No.
ParticularsApproved inT.O. dated21.03.2016
Approved inReview for FY2016-17 (RE)
Actuals for FY2016-17
1 Salaries 105.062 Over Time 3.973 Dearness Allowance 125.184 Other Allowance 16.61
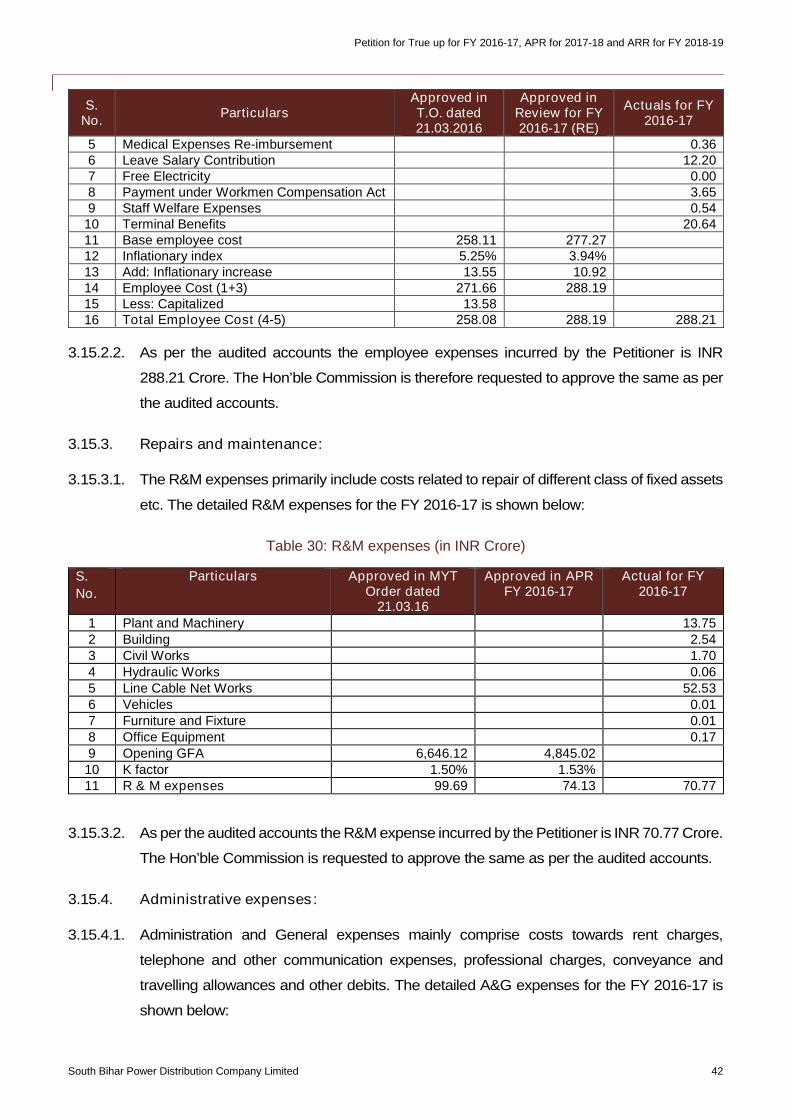
Petition for True up for FY 2016-17, APR for 2017-18 and ARR for FY 2018-19
South Bihar Power Distribution Company Limited 42
S.No.
ParticularsApproved inT.O. dated21.03.2016
Approved inReview for FY2016-17 (RE)
Actuals for FY2016-17
5 Medical Expenses Re-imbursement 0.366 Leave Salary Contribution 12.207 Free Electricity 0.008 Payment under Workmen Compensation Act 3.659 Staff Welfare Expenses 0.54
10 Terminal Benefits 20.6411 Base employee cost 258.11 277.2712 Inflationary index 5.25% 3.94%13 Add: Inflationary increase 13.55 10.9214 Employee Cost (1+3) 271.66 288.1915 Less: Capitalized 13.5816 Total Employee Cost (4-5) 258.08 288.19 288.21
3.15.2.2. As per the audited accounts the employee expenses incurred by the Petitioner is INR
288.21 Crore. The Hon’ble Commission is therefore requested to approve the same as per
the audited accounts.
3.15.3. Repairs and maintenance:
3.15.3.1. The R&M expenses primarily include costs related to repair of different class of fixed assets
etc. The detailed R&M expenses for the FY 2016-17 is shown below:
Table 30: R&M expenses (in INR Crore)
S.
No.
Particulars Approved in MYTOrder dated
21.03.16
Approved in APRFY 2016-17
Actual for FY2016-17
1 Plant and Machinery 13.752 Building 2.543 Civil Works 1.704 Hydraulic Works 0.065 Line Cable Net Works 52.536 Vehicles 0.017 Furniture and Fixture 0.018 Office Equipment 0.179 Opening GFA 6,646.12 4,845.0210 K factor 1.50% 1.53%11 R & M expenses 99.69 74.13 70.77
3.15.3.2. As per the audited accounts the R&M expense incurred by the Petitioner is INR 70.77 Crore.
The Hon’ble Commission is requested to approve the same as per the audited accounts.
3.15.4. Administrative expenses:
3.15.4.1. Administration and General expenses mainly comprise costs towards rent charges,
telephone and other communication expenses, professional charges, conveyance and
travelling allowances and other debits. The detailed A&G expenses for the FY 2016-17 is
shown below:
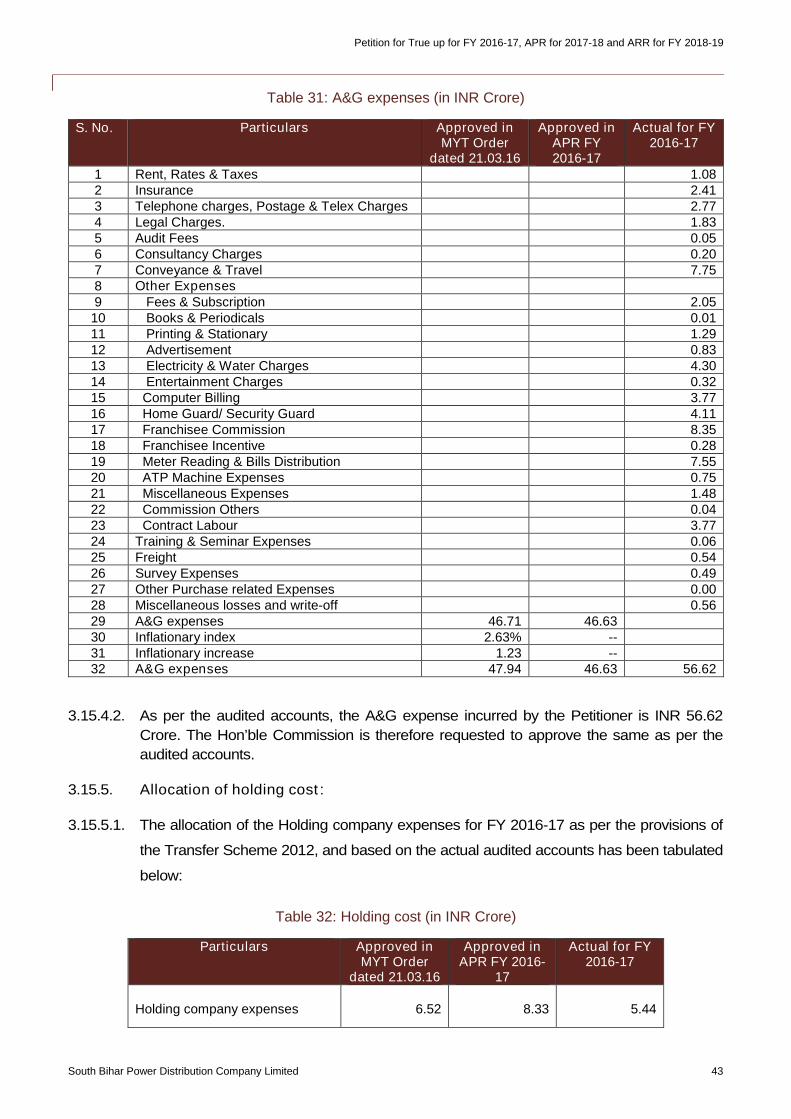
Petition for True up for FY 2016-17, APR for 2017-18 and ARR for FY 2018-19
South Bihar Power Distribution Company Limited 43
Table 31: A&G expenses (in INR Crore)
S. No. Particulars Approved inMYT Order
dated 21.03.16
Approved inAPR FY2016-17
Actual for FY2016-17
1 Rent, Rates & Taxes 1.082 Insurance 2.413 Telephone charges, Postage & Telex Charges 2.774 Legal Charges. 1.835 Audit Fees 0.056 Consultancy Charges 0.207 Conveyance & Travel 7.758 Other Expenses9 Fees & Subscription 2.0510 Books & Periodicals 0.0111 Printing & Stationary 1.2912 Advertisement 0.8313 Electricity & Water Charges 4.3014 Entertainment Charges 0.3215 Computer Billing 3.7716 Home Guard/ Security Guard 4.1117 Franchisee Commission 8.3518 Franchisee Incentive 0.2819 Meter Reading & Bills Distribution 7.5520 ATP Machine Expenses 0.7521 Miscellaneous Expenses 1.4822 Commission Others 0.0423 Contract Labour 3.7724 Training & Seminar Expenses 0.0625 Freight 0.5426 Survey Expenses 0.4927 Other Purchase related Expenses 0.0028 Miscellaneous losses and write-off 0.5629 A&G expenses 46.71 46.6330 Inflationary index 2.63% --31 Inflationary increase 1.23 --32 A&G expenses 47.94 46.63 56.62
3.15.4.2. As per the audited accounts, the A&G expense incurred by the Petitioner is INR 56.62
Crore. The Hon’ble Commission is therefore requested to approve the same as per the
audited accounts.
3.15.5. Allocation of holding cost:
3.15.5.1. The allocation of the Holding company expenses for FY 2016-17 as per the provisions of
the Transfer Scheme 2012, and based on the actual audited accounts has been tabulated
below:
Table 32: Holding cost (in INR Crore)
Particulars Approved inMYT Order
dated 21.03.16
Approved inAPR FY 2016-
17
Actual for FY2016-17
Holding company expenses 6.52 8.33 5.44
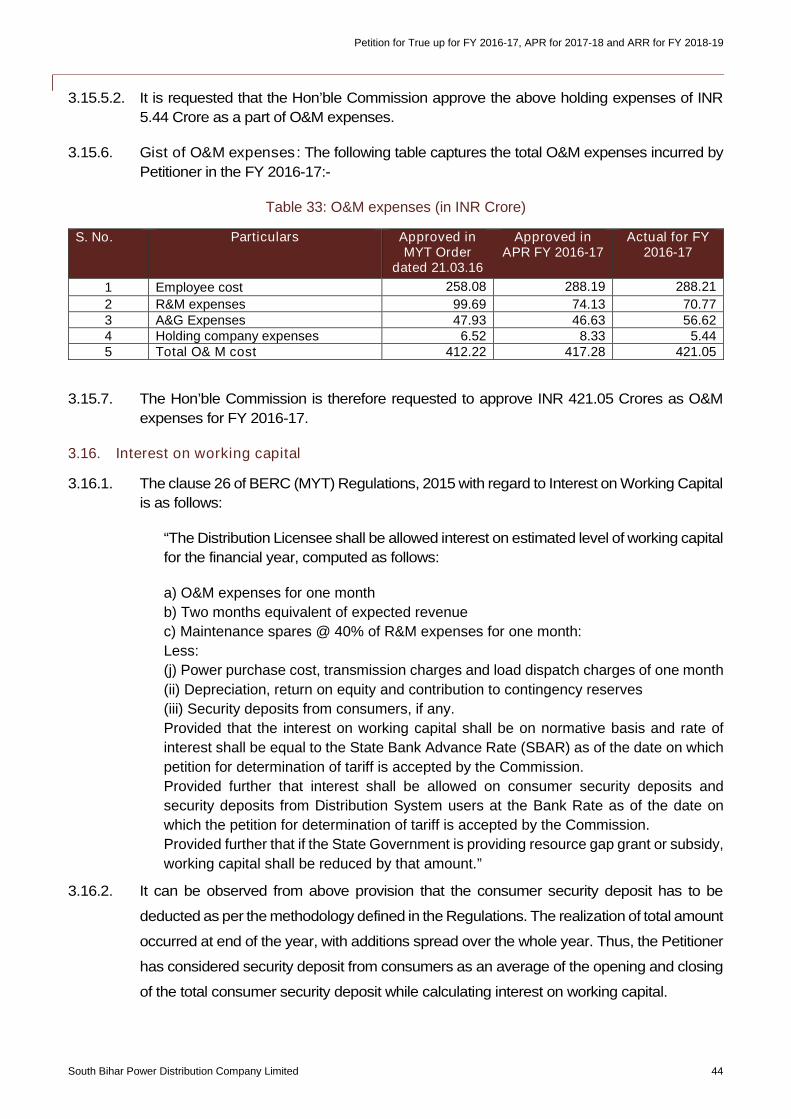
Petition for True up for FY 2016-17, APR for 2017-18 and ARR for FY 2018-19
South Bihar Power Distribution Company Limited 44
3.15.5.2. It is requested that the Hon’ble Commission approve the above holding expenses of INR
5.44 Crore as a part of O&M expenses.
3.15.6. Gist of O&M expenses: The following table captures the total O&M expenses incurred by
Petitioner in the FY 2016-17:-
Table 33: O&M expenses (in INR Crore)
S. No. Particulars Approved inMYT Order
dated 21.03.16
Approved inAPR FY 2016-17
Actual for FY2016-17
1 Employee cost 258.08 288.19 288.21
2 R&M expenses 99.69 74.13 70.773 A&G Expenses 47.93 46.63 56.624 Holding company expenses 6.52 8.33 5.445 Total O& M cost 412.22 417.28 421.05
3.15.7. The Hon’ble Commission is therefore requested to approve INR 421.05 Crores as O&M
expenses for FY 2016-17.
3.16. Interest on working capital
3.16.1. The clause 26 of BERC (MYT) Regulations, 2015 with regard to Interest on Working Capital
is as follows:
“The Distribution Licensee shall be allowed interest on estimated level of working capital
for the financial year, computed as follows:
a) O&M expenses for one month
b) Two months equivalent of expected revenue
c) Maintenance spares @ 40% of R&M expenses for one month:
Less:
(j) Power purchase cost, transmission charges and load dispatch charges of one month
(ii) Depreciation, return on equity and contribution to contingency reserves
(iii) Security deposits from consumers, if any.
Provided that the interest on working capital shall be on normative basis and rate of
interest shall be equal to the State Bank Advance Rate (SBAR) as of the date on which
petition for determination of tariff is accepted by the Commission.
Provided further that interest shall be allowed on consumer security deposits and
security deposits from Distribution System users at the Bank Rate as of the date on
which the petition for determination of tariff is accepted by the Commission.
Provided further that if the State Government is providing resource gap grant or subsidy,
working capital shall be reduced by that amount.”
3.16.2. It can be observed from above provision that the consumer security deposit has to be
deducted as per the methodology defined in the Regulations. The realization of total amount
occurred at end of the year, with additions spread over the whole year. Thus, the Petitioner
has considered security deposit from consumers as an average of the opening and closing
of the total consumer security deposit while calculating interest on working capital.
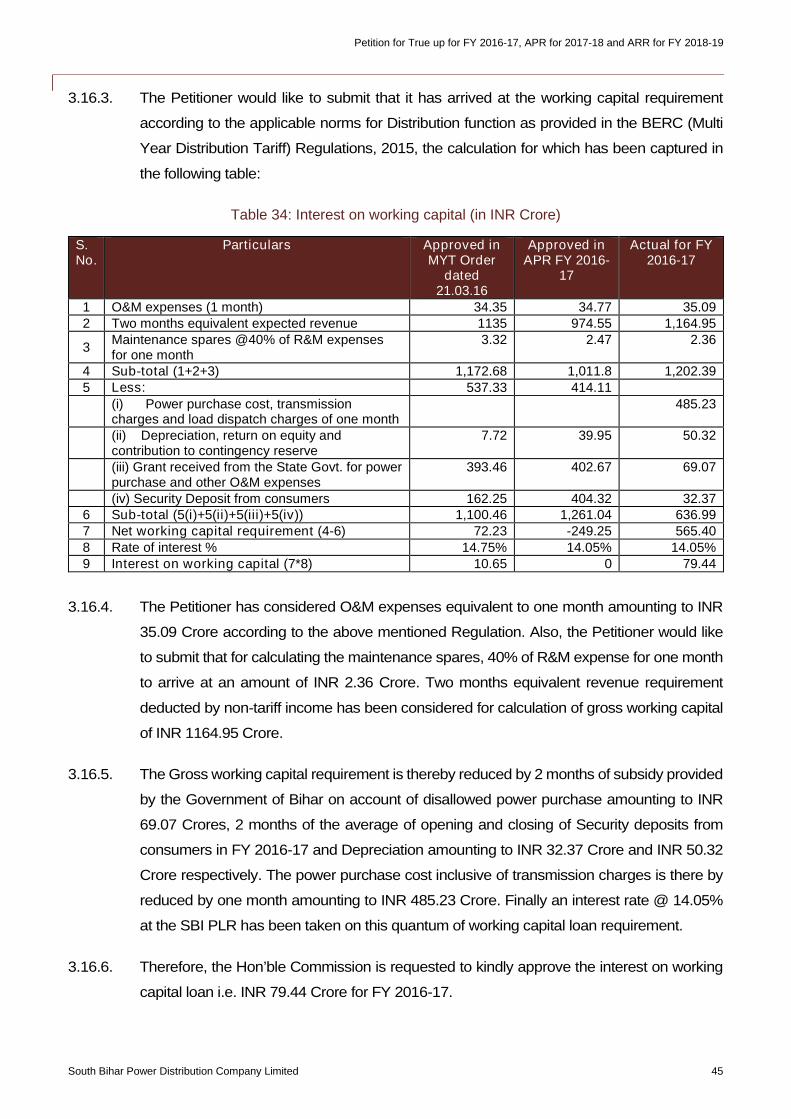
Petition for True up for FY 2016-17, APR for 2017-18 and ARR for FY 2018-19
South Bihar Power Distribution Company Limited 45
3.16.3. The Petitioner would like to submit that it has arrived at the working capital requirement
according to the applicable norms for Distribution function as provided in the BERC (Multi
Year Distribution Tariff) Regulations, 2015, the calculation for which has been captured in
the following table:
Table 34: Interest on working capital (in INR Crore)
S.No.
Particulars Approved inMYT Order
dated21.03.16
Approved inAPR FY 2016-
17
Actual for FY2016-17
1 O&M expenses (1 month) 34.35 34.77 35.092 Two months equivalent expected revenue 1135 974.55 1,164.95
3Maintenance spares @40% of R&M expensesfor one month
3.32 2.47 2.36
4 Sub-total (1+2+3) 1,172.68 1,011.8 1,202.395 Less: 537.33 414.11
(i) Power purchase cost, transmissioncharges and load dispatch charges of one month
485.23
(ii) Depreciation, return on equity andcontribution to contingency reserve
7.72 39.95 50.32
(iii) Grant received from the State Govt. for powerpurchase and other O&M expenses
393.46 402.67 69.07
(iv) Security Deposit from consumers 162.25 404.32 32.376 Sub-total (5(i)+5(ii)+5(iii)+5(iv)) 1,100.46 1,261.04 636.997 Net working capital requirement (4-6) 72.23 -249.25 565.408 Rate of interest % 14.75% 14.05% 14.05%9 Interest on working capital (7*8) 10.65 0 79.44
3.16.4. The Petitioner has considered O&M expenses equivalent to one month amounting to INR
35.09 Crore according to the above mentioned Regulation. Also, the Petitioner would like
to submit that for calculating the maintenance spares, 40% of R&M expense for one month
to arrive at an amount of INR 2.36 Crore. Two months equivalent revenue requirement
deducted by non-tariff income has been considered for calculation of gross working capital
of INR 1164.95 Crore.
3.16.5. The Gross working capital requirement is thereby reduced by 2 months of subsidy provided
by the Government of Bihar on account of disallowed power purchase amounting to INR
69.07 Crores, 2 months of the average of opening and closing of Security deposits from
consumers in FY 2016-17 and Depreciation amounting to INR 32.37 Crore and INR 50.32
Crore respectively. The power purchase cost inclusive of transmission charges is there by
reduced by one month amounting to INR 485.23 Crore. Finally an interest rate @ 14.05%
at the SBI PLR has been taken on this quantum of working capital loan requirement.
3.16.6. Therefore, the Hon’ble Commission is requested to kindly approve the interest on working
capital loan i.e. INR 79.44 Crore for FY 2016-17.
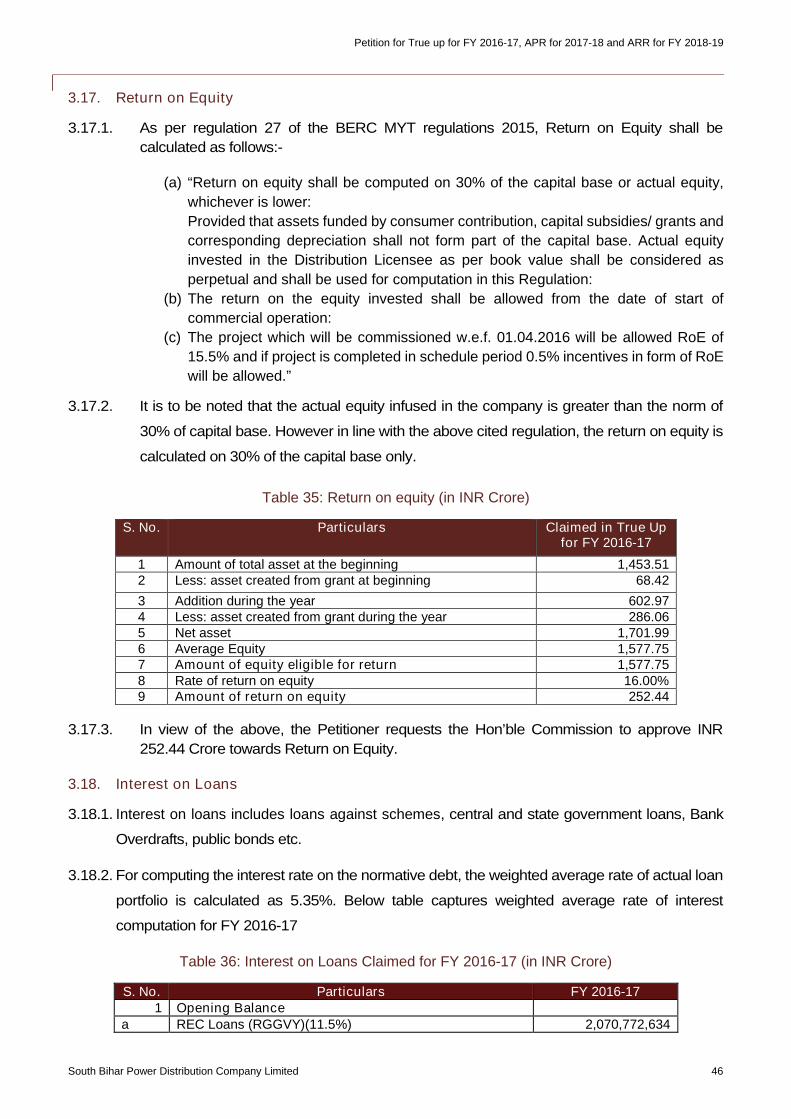
Petition for True up for FY 2016-17, APR for 2017-18 and ARR for FY 2018-19
South Bihar Power Distribution Company Limited 46
3.17. Return on Equity
3.17.1. As per regulation 27 of the BERC MYT regulations 2015, Return on Equity shall be
calculated as follows:-
(a) “Return on equity shall be computed on 30% of the capital base or actual equity,
whichever is lower:
Provided that assets funded by consumer contribution, capital subsidies/ grants and
corresponding depreciation shall not form part of the capital base. Actual equity
invested in the Distribution Licensee as per book value shall be considered as
perpetual and shall be used for computation in this Regulation:
(b) The return on the equity invested shall be allowed from the date of start of
commercial operation:
(c) The project which will be commissioned w.e.f. 01.04.2016 will be allowed RoE of
15.5% and if project is completed in schedule period 0.5% incentives in form of RoE
will be allowed.”
3.17.2. It is to be noted that the actual equity infused in the company is greater than the norm of
30% of capital base. However in line with the above cited regulation, the return on equity is
calculated on 30% of the capital base only.
Table 35: Return on equity (in INR Crore)
S. No. Particulars Claimed in True Upfor FY 2016-17
1 Amount of total asset at the beginning 1,453.512 Less: asset created from grant at beginning 68.42
3 Addition during the year 602.974 Less: asset created from grant during the year 286.065 Net asset 1,701.996 Average Equity 1,577.757 Amount of equity eligible for return 1,577.758 Rate of return on equity 16.00%9 Amount of return on equity 252.44
3.17.3. In view of the above, the Petitioner requests the Hon’ble Commission to approve INR
252.44 Crore towards Return on Equity.
3.18. Interest on Loans
3.18.1. Interest on loans includes loans against schemes, central and state government loans, Bank
Overdrafts, public bonds etc.
3.18.2. For computing the interest rate on the normative debt, the weighted average rate of actual loan
portfolio is calculated as 5.35%. Below table captures weighted average rate of interest
computation for FY 2016-17
Table 36: Interest on Loans Claimed for FY 2016-17 (in INR Crore)
S. No. Particulars FY 2016-171 Opening Balance
a REC Loans (RGGVY)(11.5%) 2,070,772,634
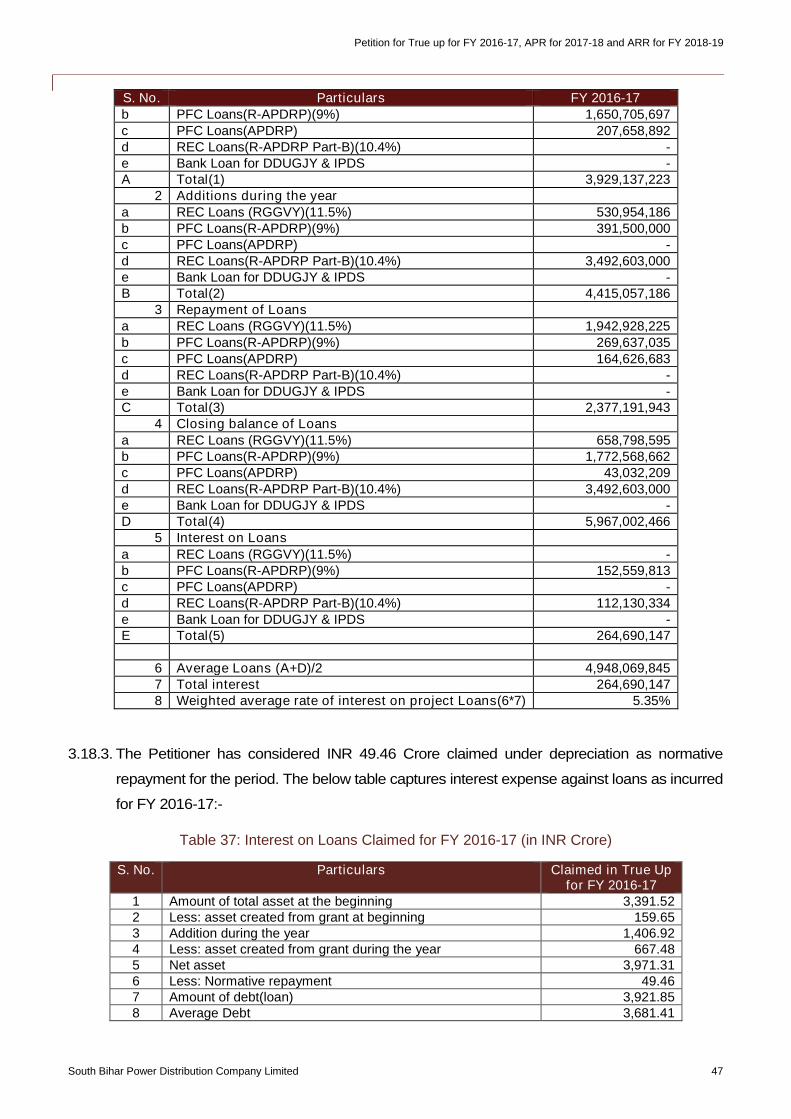
Petition for True up for FY 2016-17, APR for 2017-18 and ARR for FY 2018-19
South Bihar Power Distribution Company Limited 47
S. No. Particulars FY 2016-17b PFC Loans(R-APDRP)(9%) 1,650,705,697c PFC Loans(APDRP) 207,658,892d REC Loans(R-APDRP Part-B)(10.4%) -e Bank Loan for DDUGJY & IPDS -A Total(1) 3,929,137,223
2 Additions during the yeara REC Loans (RGGVY)(11.5%) 530,954,186b PFC Loans(R-APDRP)(9%) 391,500,000c PFC Loans(APDRP) -d REC Loans(R-APDRP Part-B)(10.4%) 3,492,603,000e Bank Loan for DDUGJY & IPDS -B Total(2) 4,415,057,186
3 Repayment of Loansa REC Loans (RGGVY)(11.5%) 1,942,928,225b PFC Loans(R-APDRP)(9%) 269,637,035c PFC Loans(APDRP) 164,626,683d REC Loans(R-APDRP Part-B)(10.4%) -e Bank Loan for DDUGJY & IPDS -C Total(3) 2,377,191,943
4 Closing balance of Loansa REC Loans (RGGVY)(11.5%) 658,798,595b PFC Loans(R-APDRP)(9%) 1,772,568,662c PFC Loans(APDRP) 43,032,209d REC Loans(R-APDRP Part-B)(10.4%) 3,492,603,000e Bank Loan for DDUGJY & IPDS -D Total(4) 5,967,002,466
5 Interest on Loans
a REC Loans (RGGVY)(11.5%) -b PFC Loans(R-APDRP)(9%) 152,559,813c PFC Loans(APDRP) -d REC Loans(R-APDRP Part-B)(10.4%) 112,130,334e Bank Loan for DDUGJY & IPDS -E Total(5) 264,690,147
6 Average Loans (A+D)/2 4,948,069,8457 Total interest 264,690,1478 Weighted average rate of interest on project Loans(6*7) 5.35%
3.18.3. The Petitioner has considered INR 49.46 Crore claimed under depreciation as normative
repayment for the period. The below table captures interest expense against loans as incurred
for FY 2016-17:-
Table 37: Interest on Loans Claimed for FY 2016-17 (in INR Crore)
S. No. Particulars Claimed in True Upfor FY 2016-17
1 Amount of total asset at the beginning 3,391.522 Less: asset created from grant at beginning 159.653 Addition during the year 1,406.924 Less: asset created from grant during the year 667.485 Net asset 3,971.316 Less: Normative repayment 49.467 Amount of debt(loan) 3,921.858 Average Debt 3,681.41
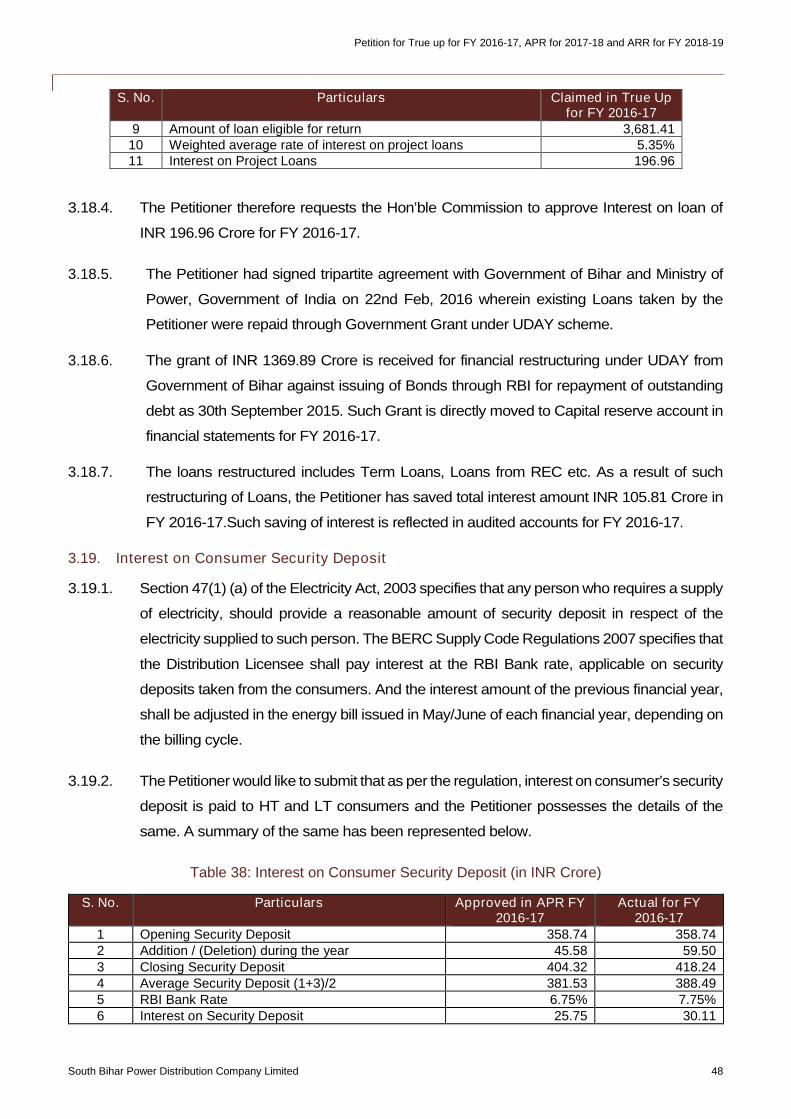
Petition for True up for FY 2016-17, APR for 2017-18 and ARR for FY 2018-19
South Bihar Power Distribution Company Limited 48
S. No. Particulars Claimed in True Upfor FY 2016-17
9 Amount of loan eligible for return 3,681.4110 Weighted average rate of interest on project loans 5.35%11 Interest on Project Loans 196.96
3.18.4. The Petitioner therefore requests the Hon’ble Commission to approve Interest on loan of
INR 196.96 Crore for FY 2016-17.
3.18.5. The Petitioner had signed tripartite agreement with Government of Bihar and Ministry of
Power, Government of India on 22nd Feb, 2016 wherein existing Loans taken by the
Petitioner were repaid through Government Grant under UDAY scheme.
3.18.6. The grant of INR 1369.89 Crore is received for financial restructuring under UDAY from
Government of Bihar against issuing of Bonds through RBI for repayment of outstanding
debt as 30th September 2015. Such Grant is directly moved to Capital reserve account in
financial statements for FY 2016-17.
3.18.7. The loans restructured includes Term Loans, Loans from REC etc. As a result of such
restructuring of Loans, the Petitioner has saved total interest amount INR 105.81 Crore in
FY 2016-17.Such saving of interest is reflected in audited accounts for FY 2016-17.
3.19. Interest on Consumer Security Deposit
3.19.1. Section 47(1) (a) of the Electricity Act, 2003 specifies that any person who requires a supply
of electricity, should provide a reasonable amount of security deposit in respect of the
electricity supplied to such person. The BERC Supply Code Regulations 2007 specifies that
the Distribution Licensee shall pay interest at the RBI Bank rate, applicable on security
deposits taken from the consumers. And the interest amount of the previous financial year,
shall be adjusted in the energy bill issued in May/June of each financial year, depending on
the billing cycle.
3.19.2. The Petitioner would like to submit that as per the regulation, interest on consumer’s security
deposit is paid to HT and LT consumers and the Petitioner possesses the details of the
same. A summary of the same has been represented below.
Table 38: Interest on Consumer Security Deposit (in INR Crore)
S. No. Particulars Approved in APR FY2016-17
Actual for FY2016-17
1 Opening Security Deposit 358.74 358.742 Addition / (Deletion) during the year 45.58 59.503 Closing Security Deposit 404.32 418.244 Average Security Deposit (1+3)/2 381.53 388.495 RBI Bank Rate 6.75% 7.75%6 Interest on Security Deposit 25.75 30.11
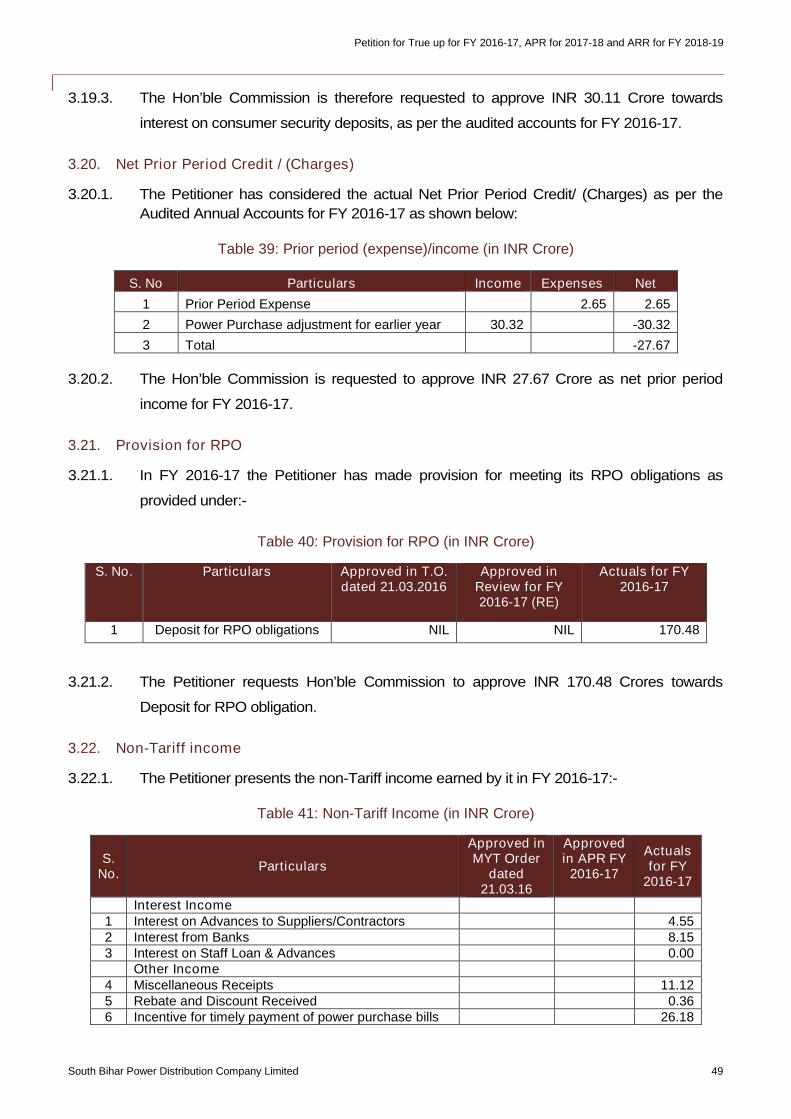
Petition for True up for FY 2016-17, APR for 2017-18 and ARR for FY 2018-19
South Bihar Power Distribution Company Limited 49
3.19.3. The Hon’ble Commission is therefore requested to approve INR 30.11 Crore towards
interest on consumer security deposits, as per the audited accounts for FY 2016-17.
3.20. Net Prior Period Credit / (Charges)
3.20.1. The Petitioner has considered the actual Net Prior Period Credit/ (Charges) as per the
Audited Annual Accounts for FY 2016-17 as shown below:
Table 39: Prior period (expense)/income (in INR Crore)
S. No Particulars Income Expenses Net
1 Prior Period Expense 2.65 2.65
2 Power Purchase adjustment for earlier year 30.32 -30.32
3 Total -27.67
3.20.2. The Hon’ble Commission is requested to approve INR 27.67 Crore as net prior period
income for FY 2016-17.
3.21. Provision for RPO
3.21.1. In FY 2016-17 the Petitioner has made provision for meeting its RPO obligations as
provided under:-
Table 40: Provision for RPO (in INR Crore)
S. No. Particulars Approved in T.O.dated 21.03.2016
Approved inReview for FY2016-17 (RE)
Actuals for FY2016-17
1 Deposit for RPO obligations NIL NIL 170.48
3.21.2. The Petitioner requests Hon’ble Commission to approve INR 170.48 Crores towards
Deposit for RPO obligation.
3.22. Non-Tariff income
3.22.1. The Petitioner presents the non-Tariff income earned by it in FY 2016-17:-
Table 41: Non-Tariff Income (in INR Crore)
S.No.
Particulars
Approved inMYT Order
dated21.03.16
Approvedin APR FY
2016-17
Actualsfor FY
2016-17
Interest Income1 Interest on Advances to Suppliers/Contractors 4.552 Interest from Banks 8.153 Interest on Staff Loan & Advances 0.00
Other Income4 Miscellaneous Receipts 11.125 Rebate and Discount Received 0.366 Incentive for timely payment of power purchase bills 26.18
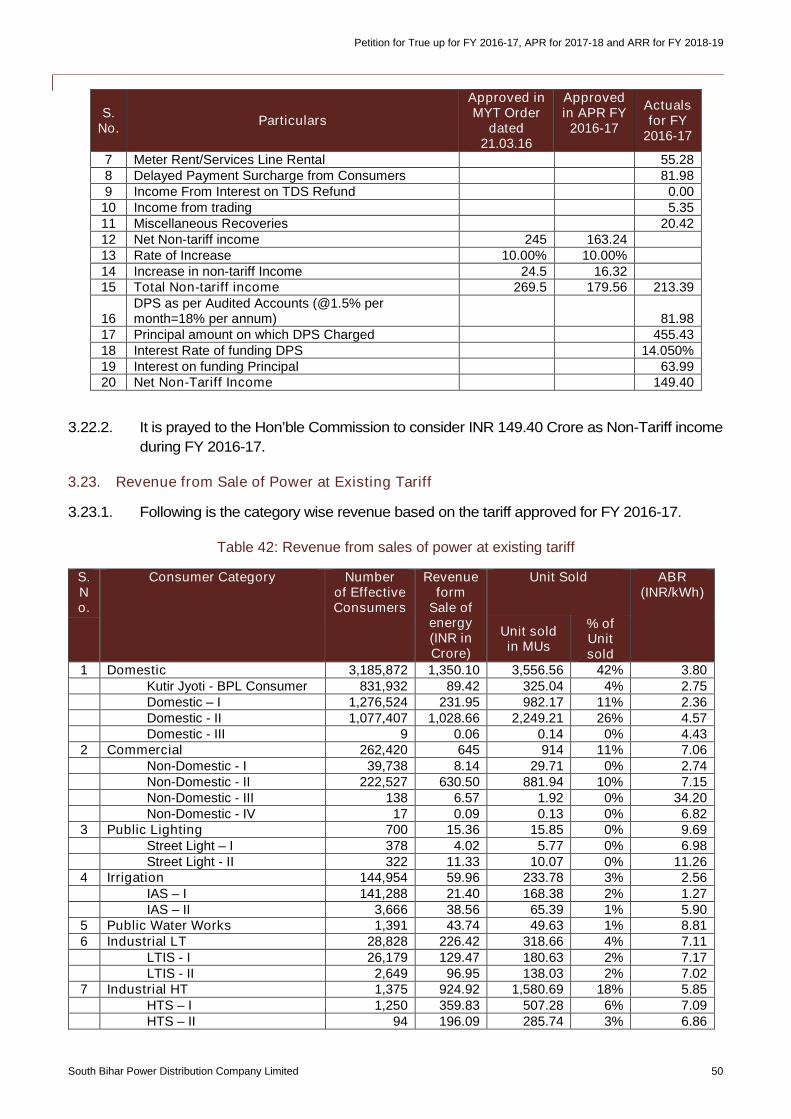
Petition for True up for FY 2016-17, APR for 2017-18 and ARR for FY 2018-19
South Bihar Power Distribution Company Limited 50
S.No.
Particulars
Approved inMYT Order
dated21.03.16
Approvedin APR FY
2016-17
Actualsfor FY
2016-17
7 Meter Rent/Services Line Rental 55.288 Delayed Payment Surcharge from Consumers 81.989 Income From Interest on TDS Refund 0.0010 Income from trading 5.3511 Miscellaneous Recoveries 20.4212 Net Non-tariff income 245 163.2413 Rate of Increase 10.00% 10.00%14 Increase in non-tariff Income 24.5 16.3215 Total Non-tariff income 269.5 179.56 213.39
16DPS as per Audited Accounts (@1.5% permonth=18% per annum) 81.98
17 Principal amount on which DPS Charged 455.4318 Interest Rate of funding DPS 14.050%19 Interest on funding Principal 63.9920 Net Non-Tariff Income 149.40
3.22.2. It is prayed to the Hon’ble Commission to consider INR 149.40 Crore as Non-Tariff income
during FY 2016-17.
3.23. Revenue from Sale of Power at Existing Tariff
3.23.1. Following is the category wise revenue based on the tariff approved for FY 2016-17.
Table 42: Revenue from sales of power at existing tariff
S.No.
Consumer Category Numberof EffectiveConsumers
Revenueform
Sale ofenergy(INR inCrore)
Unit Sold ABR(INR/kWh)
Unit soldin MUs
% ofUnitsold
1 Domestic 3,185,872 1,350.10 3,556.56 42% 3.80Kutir Jyoti - BPL Consumer 831,932 89.42 325.04 4% 2.75Domestic – I 1,276,524 231.95 982.17 11% 2.36Domestic - II 1,077,407 1,028.66 2,249.21 26% 4.57Domestic - III 9 0.06 0.14 0% 4.43
2 Commercial 262,420 645 914 11% 7.06Non-Domestic - I 39,738 8.14 29.71 0% 2.74Non-Domestic - II 222,527 630.50 881.94 10% 7.15Non-Domestic - III 138 6.57 1.92 0% 34.20Non-Domestic - IV 17 0.09 0.13 0% 6.82
3 Public Lighting 700 15.36 15.85 0% 9.69Street Light – I 378 4.02 5.77 0% 6.98Street Light - II 322 11.33 10.07 0% 11.26
4 Irrigation 144,954 59.96 233.78 3% 2.56IAS – I 141,288 21.40 168.38 2% 1.27IAS – II 3,666 38.56 65.39 1% 5.90
5 Public Water Works 1,391 43.74 49.63 1% 8.816 Industrial LT 28,828 226.42 318.66 4% 7.11
LTIS - I 26,179 129.47 180.63 2% 7.17LTIS - II 2,649 96.95 138.03 2% 7.02
7 Industrial HT 1,375 924.92 1,580.69 18% 5.85HTS – I 1,250 359.83 507.28 6% 7.09HTS – II 94 196.09 285.74 3% 6.86
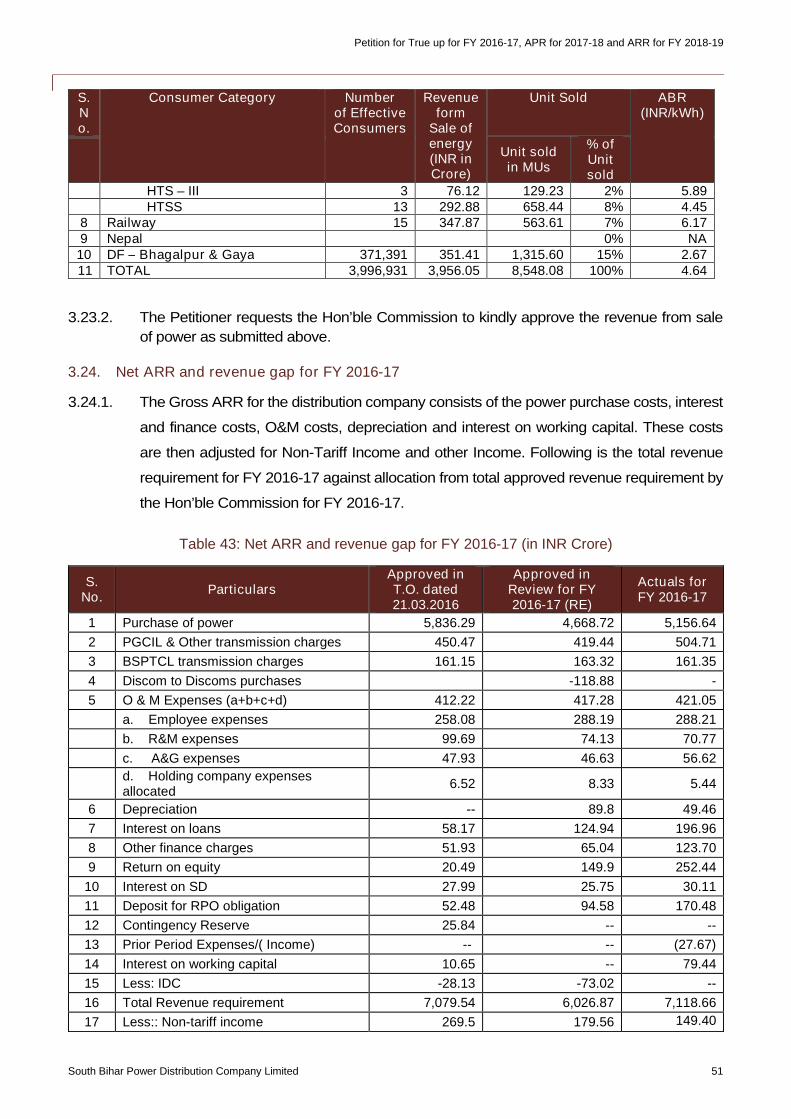
Petition for True up for FY 2016-17, APR for 2017-18 and ARR for FY 2018-19
South Bihar Power Distribution Company Limited 51
S.No.
Consumer Category Numberof EffectiveConsumers
Revenueform
Sale ofenergy(INR inCrore)
Unit Sold ABR(INR/kWh)
Unit soldin MUs
% ofUnitsold
HTS – III 3 76.12 129.23 2% 5.89HTSS 13 292.88 658.44 8% 4.45
8 Railway 15 347.87 563.61 7% 6.179 Nepal 0% NA10 DF – Bhagalpur & Gaya 371,391 351.41 1,315.60 15% 2.6711 TOTAL 3,996,931 3,956.05 8,548.08 100% 4.64
3.23.2. The Petitioner requests the Hon’ble Commission to kindly approve the revenue from sale
of power as submitted above.
3.24. Net ARR and revenue gap for FY 2016-17
3.24.1. The Gross ARR for the distribution company consists of the power purchase costs, interest
and finance costs, O&M costs, depreciation and interest on working capital. These costs
are then adjusted for Non-Tariff Income and other Income. Following is the total revenue
requirement for FY 2016-17 against allocation from total approved revenue requirement by
the Hon’ble Commission for FY 2016-17.
Table 43: Net ARR and revenue gap for FY 2016-17 (in INR Crore)
S.No.
ParticularsApproved inT.O. dated21.03.2016
Approved inReview for FY2016-17 (RE)
Actuals forFY 2016-17
1 Purchase of power 5,836.29 4,668.72 5,156.64
2 PGCIL & Other transmission charges 450.47 419.44 504.71
3 BSPTCL transmission charges 161.15 163.32 161.35
4 Discom to Discoms purchases -118.88 -
5 O & M Expenses (a+b+c+d) 412.22 417.28 421.05
a. Employee expenses 258.08 288.19 288.21
b. R&M expenses 99.69 74.13 70.77
c. A&G expenses 47.93 46.63 56.62
d. Holding company expensesallocated
6.52 8.33 5.44
6 Depreciation -- 89.8 49.46
7 Interest on loans 58.17 124.94 196.96
8 Other finance charges 51.93 65.04 123.70
9 Return on equity 20.49 149.9 252.44
10 Interest on SD 27.99 25.75 30.11
11 Deposit for RPO obligation 52.48 94.58 170.48
12 Contingency Reserve 25.84 -- --
13 Prior Period Expenses/( Income) -- -- (27.67)
14 Interest on working capital 10.65 -- 79.44
15 Less: IDC -28.13 -73.02 --
16 Total Revenue requirement 7,079.54 6,026.87 7,118.66
17 Less:: Non-tariff income 269.5 179.56 149.40
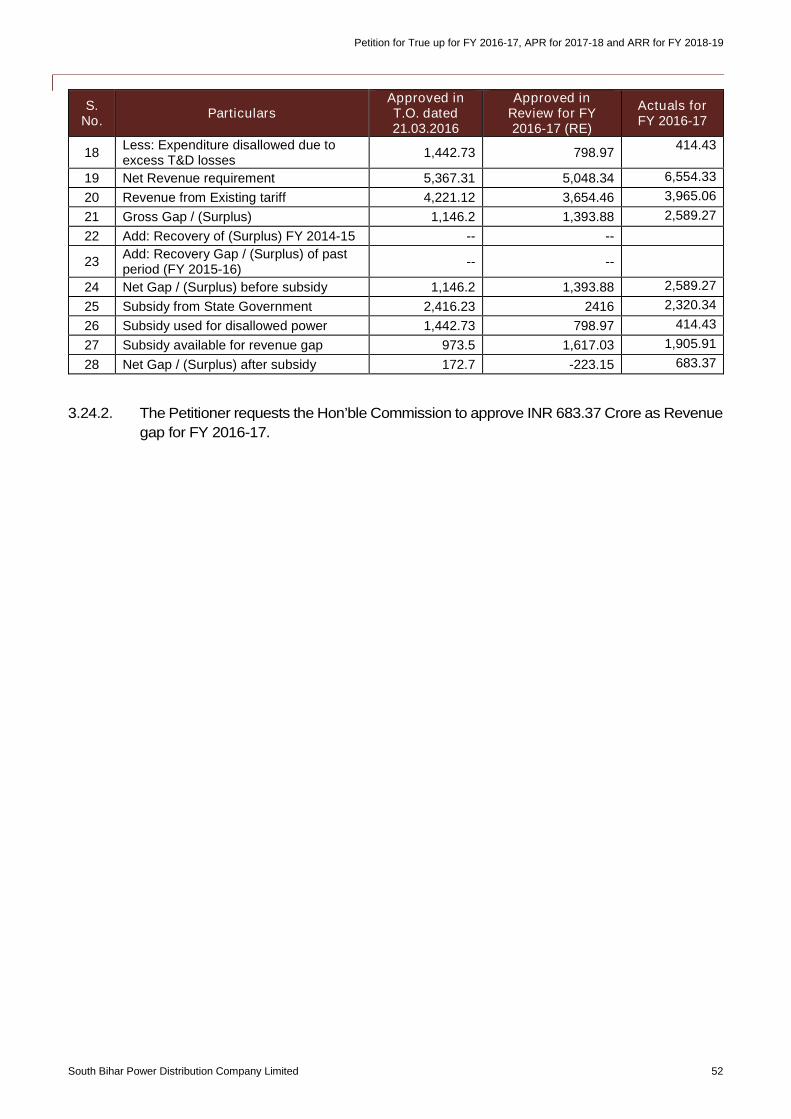
Petition for True up for FY 2016-17, APR for 2017-18 and ARR for FY 2018-19
South Bihar Power Distribution Company Limited 52
S.No.
ParticularsApproved inT.O. dated21.03.2016
Approved inReview for FY2016-17 (RE)
Actuals forFY 2016-17
18Less: Expenditure disallowed due toexcess T&D losses
1,442.73 798.97414.43
19 Net Revenue requirement 5,367.31 5,048.34 6,554.33
20 Revenue from Existing tariff 4,221.12 3,654.46 3,965.06
21 Gross Gap / (Surplus) 1,146.2 1,393.88 2,589.27
22 Add: Recovery of (Surplus) FY 2014-15 -- --
23Add: Recovery Gap / (Surplus) of pastperiod (FY 2015-16)
-- --
24 Net Gap / (Surplus) before subsidy 1,146.2 1,393.88 2,589.27
25 Subsidy from State Government 2,416.23 2416 2,320.34
26 Subsidy used for disallowed power 1,442.73 798.97 414.43
27 Subsidy available for revenue gap 973.5 1,617.03 1,905.91
28 Net Gap / (Surplus) after subsidy 172.7 -223.15 683.37
3.24.2. The Petitioner requests the Hon’ble Commission to approve INR 683.37 Crore as Revenue
gap for FY 2016-17.
Petition for True up for FY 2016-17, APR for 2017-18 and ARR for FY 2018-19
South Bihar Power Distribution Company Limited 53
4. APR Summary for FY 2017-18
4.1. Preamble
4.1.1. The Commission had determined the Multi-Year Aggregate Revenue Requirement (ARR)
for the second control period FY 2016-17 to FY 2018-19 for the Petitioner in the revised
MYT Order dated 8th March, 2017 based on the judgment of Hon’ble APTEL on Appeal
No.141 of 2016. Subsequently, the Hon’ble Commission issued its order for determination
of ARR for FY 2017-18 in its order dated 24th March 2017.
4.1.2. The Petitioner has submitted this instant Tariff Petition for FY 2018-19 which includes
Annual Performance Review (APR) for FY 2017-18. While projecting the APR for FY 2017-
18 the Petitioner has considered the actual figures for the first 6 months (i.e. from April
2017 to September 2017) for components like power purchase, O&M expenses etc. and
pro-rata projections & escalations over previous year has been considered, keeping in mind
the guiding principles defined by the Hon’ble Commission.
4.2. Estimate of category wise number of consumers, connected load and sales for FY 2017-
18
4.2.1. Estimate of category wise number of consumers
4.2.1.1. While projecting energy sales for FY 2017-18 the 24x7, Power For All plan, Har Ghar
Bijli and the Saubhagya scheme along with the large scale initiatives taken by Central
Government and the State Government are taken into consideration. These initiatives
aim for the overall development of the power sector in the State. The objective of the
24x7 Power For All initiative is to make 24x7 power available to all households,
industry, commercial businesses, public needs, any other electricity consuming entity
and adequate power to agriculture farm holdings by FY 2018-19.
4.2.1.2. These plans are mainly targeted for rural consumers in KJ, DS-I and IAS-I category and
the growth rate projected under this category is above the normal CAGR growth as large
number of new connections are to be released in the ensuing years. The Petitioner has
also considered 6 months provisional data for revising the growth in number of consumers
for FY 2017-18.
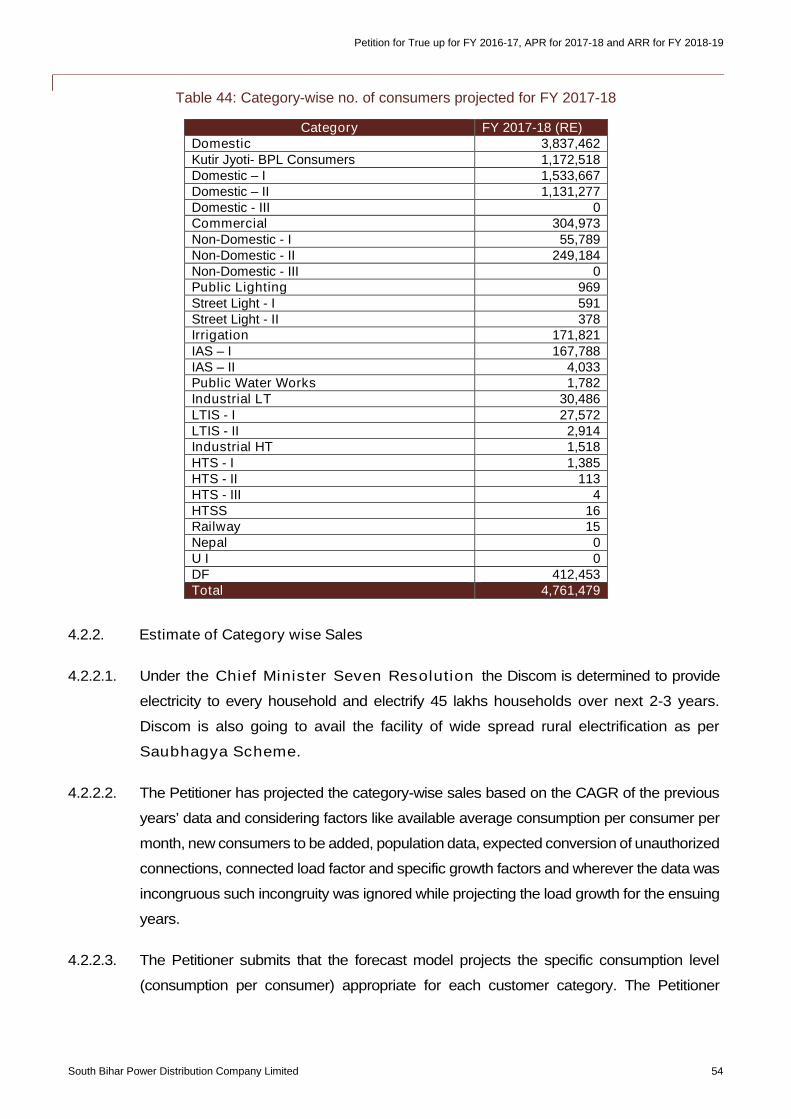
Petition for True up for FY 2016-17, APR for 2017-18 and ARR for FY 2018-19
South Bihar Power Distribution Company Limited 54
Table 44: Category-wise no. of consumers projected for FY 2017-18
Category FY 2017-18 (RE)Domestic 3,837,462Kutir Jyoti- BPL Consumers 1,172,518Domestic – I 1,533,667Domestic – II 1,131,277Domestic - III 0Commercial 304,973Non-Domestic - I 55,789Non-Domestic - II 249,184Non-Domestic - III 0Public Lighting 969Street Light - I 591Street Light - II 378Irrigation 171,821IAS – I 167,788IAS – II 4,033Public Water Works 1,782Industrial LT 30,486LTIS - I 27,572LTIS - II 2,914Industrial HT 1,518HTS - I 1,385HTS - II 113HTS - III 4HTSS 16Railway 15Nepal 0U I 0DF 412,453Total 4,761,479
4.2.2. Estimate of Category wise Sales
4.2.2.1. Under the Chief Minister Seven Resolution the Discom is determined to provide
electricity to every household and electrify 45 lakhs households over next 2-3 years.
Discom is also going to avail the facility of wide spread rural electrification as per
Saubhagya Scheme.
4.2.2.2. The Petitioner has projected the category-wise sales based on the CAGR of the previous
years’ data and considering factors like available average consumption per consumer per
month, new consumers to be added, population data, expected conversion of unauthorized
connections, connected load factor and specific growth factors and wherever the data was
incongruous such incongruity was ignored while projecting the load growth for the ensuing
years.
4.2.2.3. The Petitioner submits that the forecast model projects the specific consumption level
(consumption per consumer) appropriate for each customer category. The Petitioner
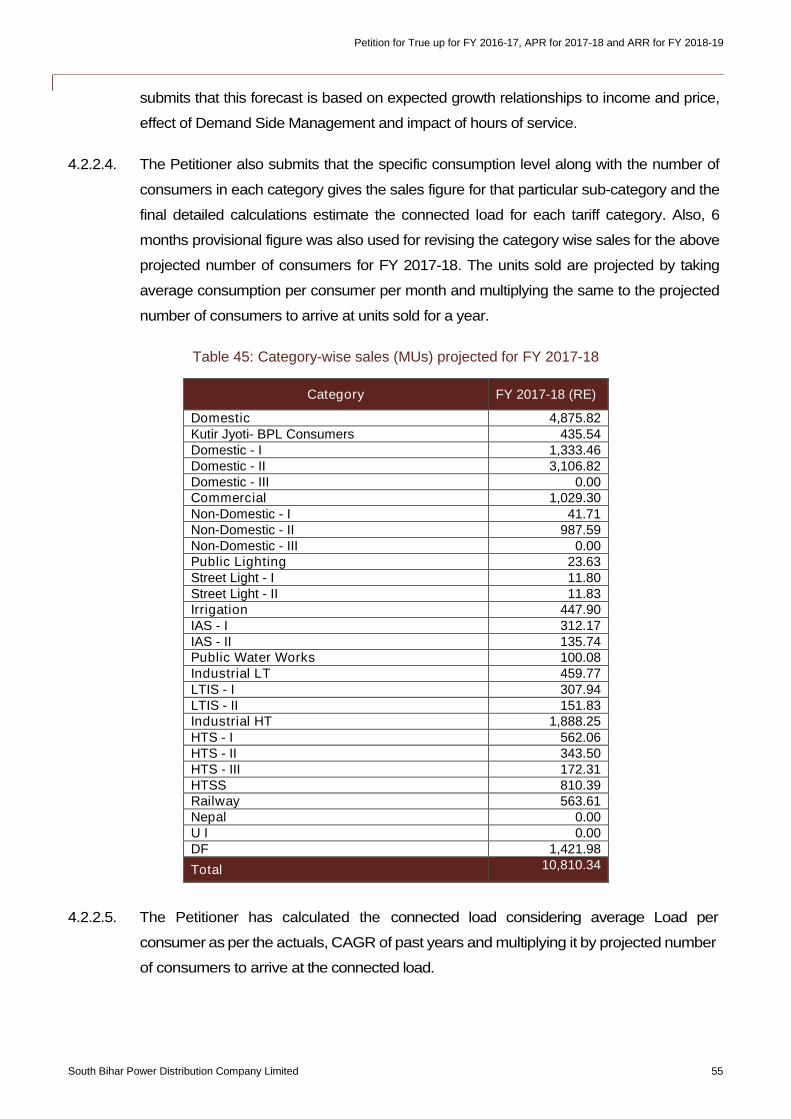
Petition for True up for FY 2016-17, APR for 2017-18 and ARR for FY 2018-19
South Bihar Power Distribution Company Limited 55
submits that this forecast is based on expected growth relationships to income and price,
effect of Demand Side Management and impact of hours of service.
4.2.2.4. The Petitioner also submits that the specific consumption level along with the number of
consumers in each category gives the sales figure for that particular sub-category and the
final detailed calculations estimate the connected load for each tariff category. Also, 6
months provisional figure was also used for revising the category wise sales for the above
projected number of consumers for FY 2017-18. The units sold are projected by taking
average consumption per consumer per month and multiplying the same to the projected
number of consumers to arrive at units sold for a year.
Table 45: Category-wise sales (MUs) projected for FY 2017-18
Category FY 2017-18 (RE)
Domestic 4,875.82Kutir Jyoti- BPL Consumers 435.54Domestic - I 1,333.46Domestic - II 3,106.82Domestic - III 0.00Commercial 1,029.30Non-Domestic - I 41.71Non-Domestic - II 987.59Non-Domestic - III 0.00Public Lighting 23.63Street Light - I 11.80Street Light - II 11.83Irrigation 447.90IAS - I 312.17IAS - II 135.74Public Water Works 100.08Industrial LT 459.77LTIS - I 307.94LTIS - II 151.83Industrial HT 1,888.25HTS - I 562.06HTS - II 343.50HTS - III 172.31HTSS 810.39Railway 563.61Nepal 0.00U I 0.00DF 1,421.98
Total 10,810.34
4.2.2.5. The Petitioner has calculated the connected load considering average Load per
consumer as per the actuals, CAGR of past years and multiplying it by projected number
of consumers to arrive at the connected load.
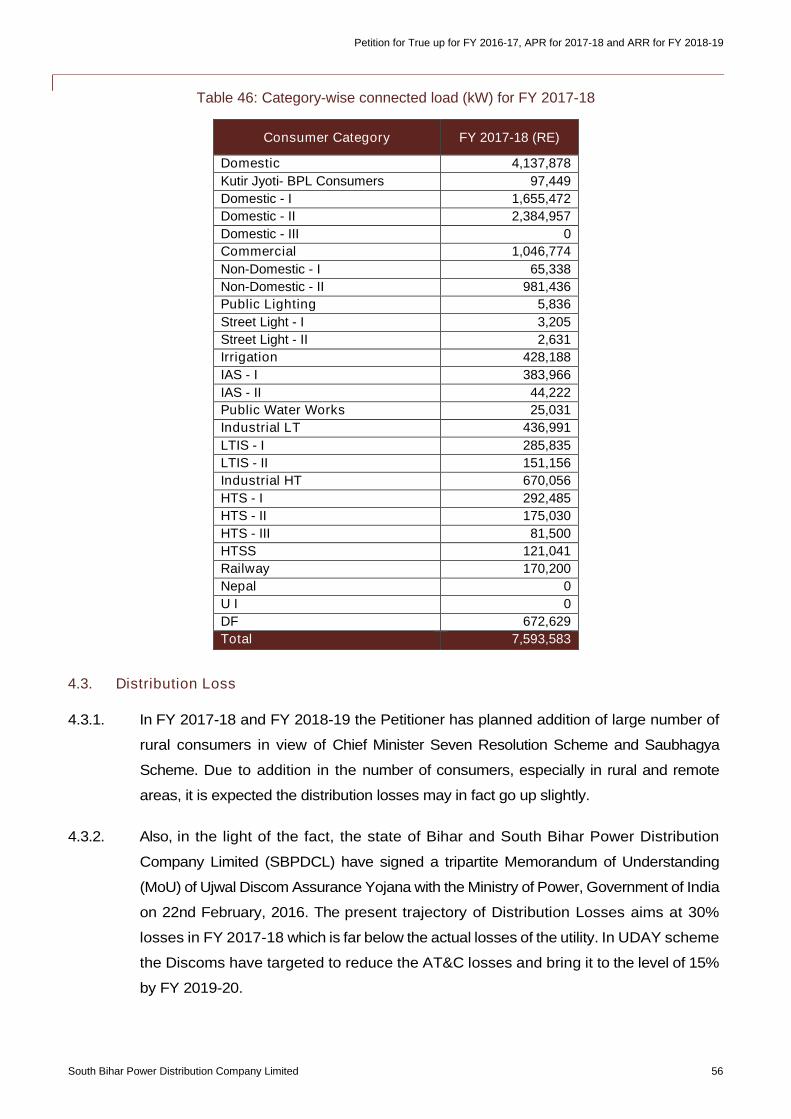
Petition for True up for FY 2016-17, APR for 2017-18 and ARR for FY 2018-19
South Bihar Power Distribution Company Limited 56
Table 46: Category-wise connected load (kW) for FY 2017-18
Consumer Category FY 2017-18 (RE)
Domestic 4,137,878
Kutir Jyoti- BPL Consumers 97,449
Domestic - I 1,655,472
Domestic - II 2,384,957
Domestic - III 0
Commercial 1,046,774
Non-Domestic - I 65,338
Non-Domestic - II 981,436
Public Lighting 5,836
Street Light - I 3,205
Street Light - II 2,631
Irrigation 428,188
IAS - I 383,966
IAS - II 44,222
Public Water Works 25,031
Industrial LT 436,991
LTIS - I 285,835
LTIS - II 151,156
Industrial HT 670,056
HTS - I 292,485
HTS - II 175,030
HTS - III 81,500
HTSS 121,041
Railway 170,200
Nepal 0
U I 0
DF 672,629
Total 7,593,583
4.3. Distribution Loss
4.3.1. In FY 2017-18 and FY 2018-19 the Petitioner has planned addition of large number of
rural consumers in view of Chief Minister Seven Resolution Scheme and Saubhagya
Scheme. Due to addition in the number of consumers, especially in rural and remote
areas, it is expected the distribution losses may in fact go up slightly.
4.3.2. Also, in the light of the fact, the state of Bihar and South Bihar Power Distribution
Company Limited (SBPDCL) have signed a tripartite Memorandum of Understanding
(MoU) of Ujwal Discom Assurance Yojana with the Ministry of Power, Government of India
on 22nd February, 2016. The present trajectory of Distribution Losses aims at 30%
losses in FY 2017-18 which is far below the actual losses of the utility. In UDAY scheme
the Discoms have targeted to reduce the AT&C losses and bring it to the level of 15%
by FY 2019-20.
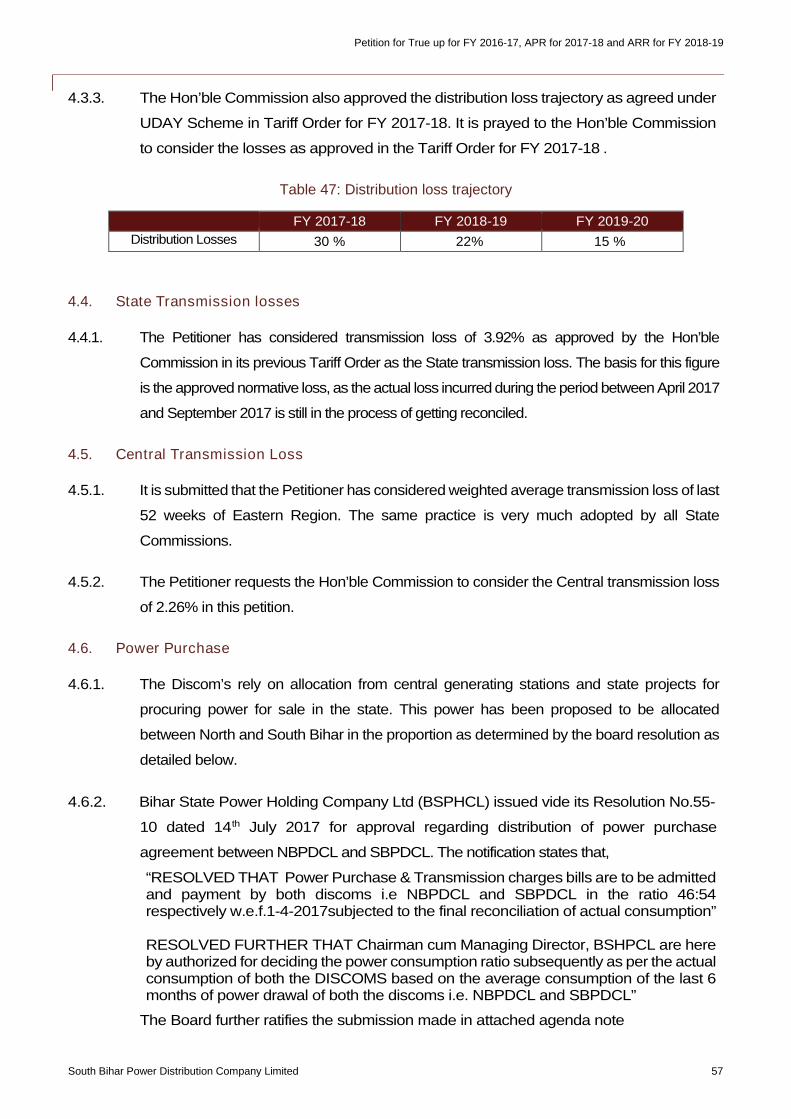
Petition for True up for FY 2016-17, APR for 2017-18 and ARR for FY 2018-19
South Bihar Power Distribution Company Limited 57
4.3.3. The Hon’ble Commission also approved the distribution loss trajectory as agreed under
UDAY Scheme in Tariff Order for FY 2017-18. It is prayed to the Hon’ble Commission
to consider the losses as approved in the Tariff Order for FY 2017-18 .
Table 47: Distribution loss trajectory
FY 2017-18 FY 2018-19 FY 2019-20
Distribution Losses 30 % 22% 15 %
4.4. State Transmission losses
4.4.1. The Petitioner has considered transmission loss of 3.92% as approved by the Hon’ble
Commission in its previous Tariff Order as the State transmission loss. The basis for this figure
is the approved normative loss, as the actual loss incurred during the period between April 2017
and September 2017 is still in the process of getting reconciled.
4.5. Central Transmission Loss
4.5.1. It is submitted that the Petitioner has considered weighted average transmission loss of last
52 weeks of Eastern Region. The same practice is very much adopted by all State
Commissions.
4.5.2. The Petitioner requests the Hon’ble Commission to consider the Central transmission loss
of 2.26% in this petition.
4.6. Power Purchase
4.6.1. The Discom’s rely on allocation from central generating stations and state projects for
procuring power for sale in the state. This power has been proposed to be allocated
between North and South Bihar in the proportion as determined by the board resolution as
detailed below.
4.6.2. Bihar State Power Holding Company Ltd (BSPHCL) issued vide its Resolution No.55-
10 dated 14th July 2017 for approval regarding distribution of power purchase
agreement between NBPDCL and SBPDCL. The notification states that,
“RESOLVED THAT Power Purchase & Transmission charges bills are to be admittedand payment by both discoms i.e NBPDCL and SBPDCL in the ratio 46:54respectively w.e.f.1-4-2017subjected to the final reconciliation of actual consumption”
RESOLVED FURTHER THAT Chairman cum Managing Director, BSHPCL are hereby authorized for deciding the power consumption ratio subsequently as per the actualconsumption of both the DISCOMS based on the average consumption of the last 6months of power drawal of both the discoms i.e. NBPDCL and SBPDCL”
The Board further ratifies the submission made in attached agenda note
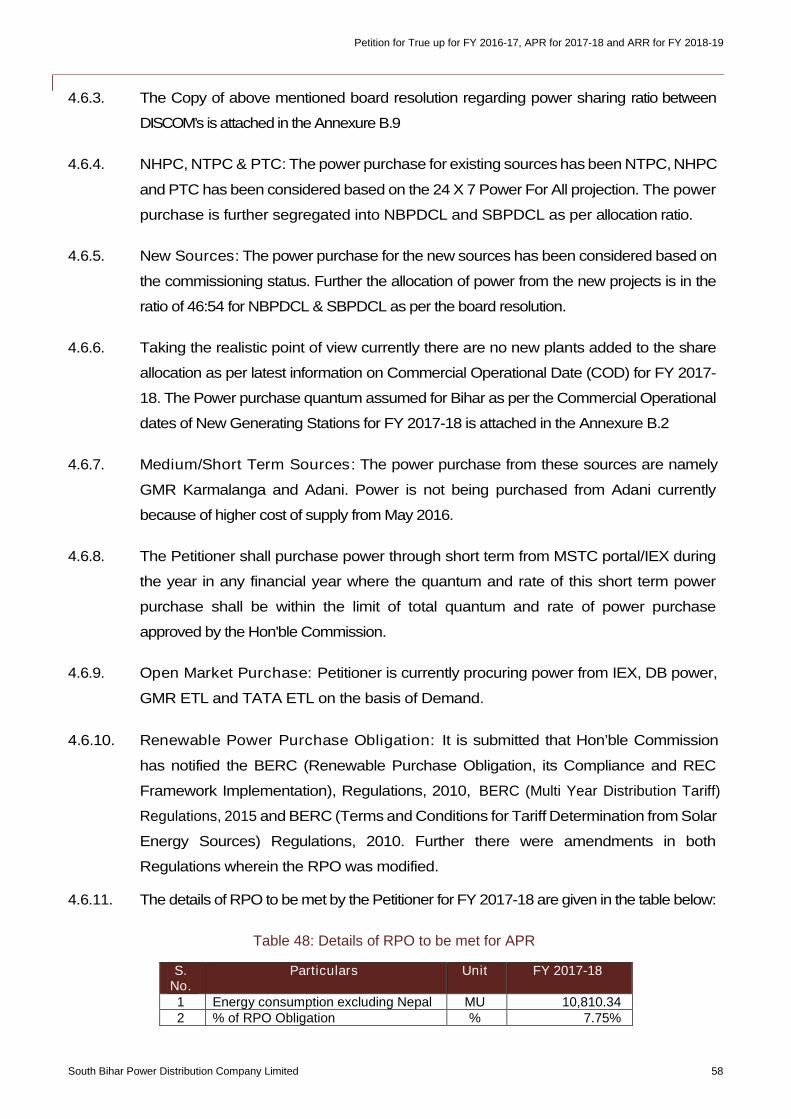
Petition for True up for FY 2016-17, APR for 2017-18 and ARR for FY 2018-19
South Bihar Power Distribution Company Limited 58
4.6.3. The Copy of above mentioned board resolution regarding power sharing ratio between
DISCOM’s is attached in the Annexure B.9
4.6.4. NHPC, NTPC & PTC: The power purchase for existing sources has been NTPC, NHPC
and PTC has been considered based on the 24 X 7 Power For All projection. The power
purchase is further segregated into NBPDCL and SBPDCL as per allocation ratio.
4.6.5. New Sources: The power purchase for the new sources has been considered based on
the commissioning status. Further the allocation of power from the new projects is in the
ratio of 46:54 for NBPDCL & SBPDCL as per the board resolution.
4.6.6. Taking the realistic point of view currently there are no new plants added to the share
allocation as per latest information on Commercial Operational Date (COD) for FY 2017-
18. The Power purchase quantum assumed for Bihar as per the Commercial Operational
dates of New Generating Stations for FY 2017-18 is attached in the Annexure B.2
4.6.7. Medium/Short Term Sources: The power purchase from these sources are namely
GMR Karmalanga and Adani. Power is not being purchased from Adani currently
because of higher cost of supply from May 2016.
4.6.8. The Petitioner shall purchase power through short term from MSTC portal/IEX during
the year in any financial year where the quantum and rate of this short term power
purchase shall be within the limit of total quantum and rate of power purchase
approved by the Hon'ble Commission.
4.6.9. Open Market Purchase: Petitioner is currently procuring power from IEX, DB power,
GMR ETL and TATA ETL on the basis of Demand.
4.6.10. Renewable Power Purchase Obligation: It is submitted that Hon’ble Commission
has notified the BERC (Renewable Purchase Obligation, its Compliance and REC
Framework Implementation), Regulations, 2010, BERC (Multi Year Distribution Tariff)
Regulations, 2015 and BERC (Terms and Conditions for Tariff Determination from Solar
Energy Sources) Regulations, 2010. Further there were amendments in both
Regulations wherein the RPO was modified.
4.6.11. The details of RPO to be met by the Petitioner for FY 2017-18 are given in the table below:
Table 48: Details of RPO to be met for APR
S.No.
Particulars Unit FY 2017-18
1 Energy consumption excluding Nepal MU 10,810.342 % of RPO Obligation % 7.75%
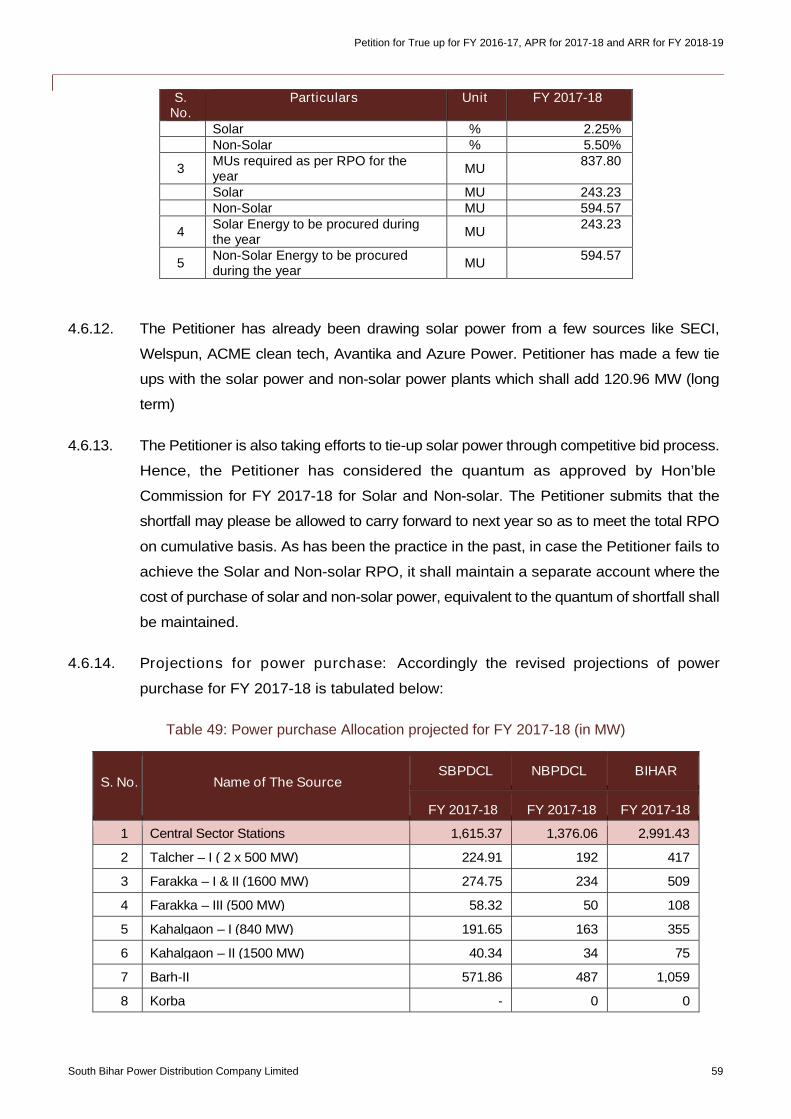
Petition for True up for FY 2016-17, APR for 2017-18 and ARR for FY 2018-19
South Bihar Power Distribution Company Limited 59
S.No.
Particulars Unit FY 2017-18
Solar % 2.25%Non-Solar % 5.50%
3MUs required as per RPO for theyear
MU837.80
Solar MU 243.23Non-Solar MU 594.57
4Solar Energy to be procured duringthe year
MU243.23
5Non-Solar Energy to be procuredduring the year
MU594.57
4.6.12. The Petitioner has already been drawing solar power from a few sources like SECI,
Welspun, ACME clean tech, Avantika and Azure Power. Petitioner has made a few tie
ups with the solar power and non-solar power plants which shall add 120.96 MW (long
term)
4.6.13. The Petitioner is also taking efforts to tie-up solar power through competitive bid process.
Hence, the Petitioner has considered the quantum as approved by Hon’ble
Commission for FY 2017-18 for Solar and Non-solar. The Petitioner submits that the
shortfall may please be allowed to carry forward to next year so as to meet the total RPO
on cumulative basis. As has been the practice in the past, in case the Petitioner fails to
achieve the Solar and Non-solar RPO, it shall maintain a separate account where the
cost of purchase of solar and non-solar power, equivalent to the quantum of shortfall shall
be maintained.
4.6.14. Projections for power purchase: Accordingly the revised projections of power
purchase for FY 2017-18 is tabulated below:
Table 49: Power purchase Allocation projected for FY 2017-18 (in MW)
S. No. Name of The SourceSBPDCL NBPDCL BIHAR
FY 2017-18 FY 2017-18 FY 2017-18
1 Central Sector Stations 1,615.37 1,376.06 2,991.43
2 Talcher – I ( 2 x 500 MW) 224.91 192 417
3 Farakka – I & II (1600 MW) 274.75 234 509
4 Farakka – III (500 MW) 58.32 50 108
5 Kahalgaon – I (840 MW) 191.65 163 355
6 Kahalgaon – II (1500 MW) 40.34 34 75
7 Barh-II 571.86 487 1,059
8 Korba - 0 0
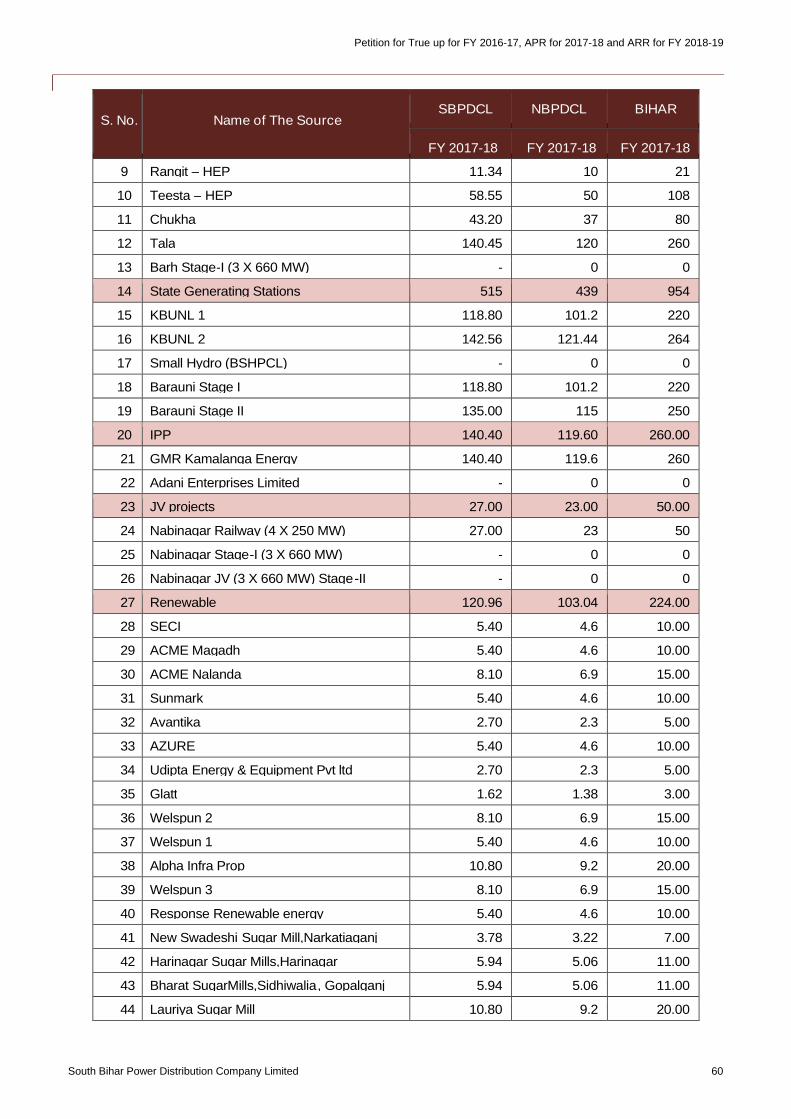
Petition for True up for FY 2016-17, APR for 2017-18 and ARR for FY 2018-19
South Bihar Power Distribution Company Limited 60
S. No. Name of The SourceSBPDCL NBPDCL BIHAR
FY 2017-18 FY 2017-18 FY 2017-18
9 Rangit – HEP 11.34 10 21
10 Teesta – HEP 58.55 50 108
11 Chukha 43.20 37 80
12 Tala 140.45 120 260
13 Barh Stage-I (3 X 660 MW) - 0 0
14 State Generating Stations 515 439 954
15 KBUNL 1 118.80 101.2 220
16 KBUNL 2 142.56 121.44 264
17 Small Hydro (BSHPCL) - 0 0
18 Barauni Stage I 118.80 101.2 220
19 Barauni Stage II 135.00 115 250
20 IPP 140.40 119.60 260.00
21 GMR Kamalanga Energy 140.40 119.6 260
22 Adani Enterprises Limited - 0 0
23 JV projects 27.00 23.00 50.00
24 Nabinagar Railway (4 X 250 MW) 27.00 23 50
25 Nabinagar Stage-I (3 X 660 MW) - 0 0
26 Nabinagar JV (3 X 660 MW) Stage-II - 0 0
27 Renewable 120.96 103.04 224.00
28 SECI 5.40 4.6 10.00
29 ACME Magadh 5.40 4.6 10.00
30 ACME Nalanda 8.10 6.9 15.00
31 Sunmark 5.40 4.6 10.00
32 Avantika 2.70 2.3 5.00
33 AZURE 5.40 4.6 10.00
34 Udipta Energy & Equipment Pvt ltd 2.70 2.3 5.00
35 Glatt 1.62 1.38 3.00
36 Welspun 2 8.10 6.9 15.00
37 Welspun 1 5.40 4.6 10.00
38 Alpha Infra Prop 10.80 9.2 20.00
39 Welspun 3 8.10 6.9 15.00
40 Response Renewable energy 5.40 4.6 10.00
41 New Swadeshi Sugar Mill,Narkatiaganj 3.78 3.22 7.00
42 Harinagar Sugar Mills,Harinagar 5.94 5.06 11.00
43 Bharat SugarMills,Sidhiwalia, Gopalganj 5.94 5.06 11.00
44 Lauriya Sugar Mill 10.80 9.2 20.00
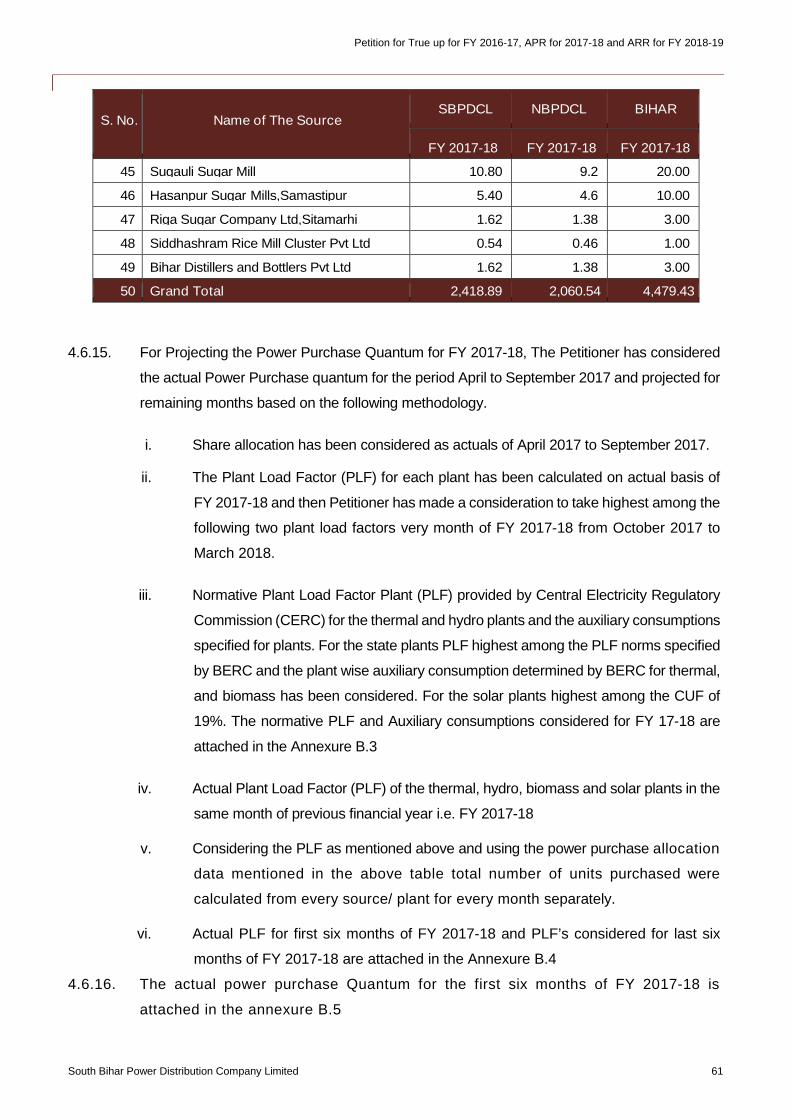
Petition for True up for FY 2016-17, APR for 2017-18 and ARR for FY 2018-19
South Bihar Power Distribution Company Limited 61
S. No. Name of The SourceSBPDCL NBPDCL BIHAR
FY 2017-18 FY 2017-18 FY 2017-18
45 Sugauli Sugar Mill 10.80 9.2 20.00
46 Hasanpur Sugar Mills,Samastipur 5.40 4.6 10.00
47 Riga Sugar Company Ltd,Sitamarhi 1.62 1.38 3.00
48 Siddhashram Rice Mill Cluster Pvt Ltd 0.54 0.46 1.00
49 Bihar Distillers and Bottlers Pvt Ltd 1.62 1.38 3.00
50 Grand Total 2,418.89 2,060.54 4,479.43
4.6.15. For Projecting the Power Purchase Quantum for FY 2017-18, The Petitioner has considered
the actual Power Purchase quantum for the period April to September 2017 and projected for
remaining months based on the following methodology.
i. Share allocation has been considered as actuals of April 2017 to September 2017.
ii. The Plant Load Factor (PLF) for each plant has been calculated on actual basis of
FY 2017-18 and then Petitioner has made a consideration to take highest among the
following two plant load factors very month of FY 2017-18 from October 2017 to
March 2018.
iii. Normative Plant Load Factor Plant (PLF) provided by Central Electricity Regulatory
Commission (CERC) for the thermal and hydro plants and the auxiliary consumptions
specified for plants. For the state plants PLF highest among the PLF norms specified
by BERC and the plant wise auxiliary consumption determined by BERC for thermal,
and biomass has been considered. For the solar plants highest among the CUF of
19%. The normative PLF and Auxiliary consumptions considered for FY 17-18 are
attached in the Annexure B.3
iv. Actual Plant Load Factor (PLF) of the thermal, hydro, biomass and solar plants in the
same month of previous financial year i.e. FY 2017-18
v. Considering the PLF as mentioned above and using the power purchase allocation
data mentioned in the above table total number of units purchased were
calculated from every source/ plant for every month separately.
vi. Actual PLF for first six months of FY 2017-18 and PLF’s considered for last six
months of FY 2017-18 are attached in the Annexure B.4
4.6.16. The actual power purchase Quantum for the first six months of FY 2017-18 is
attached in the annexure B.5
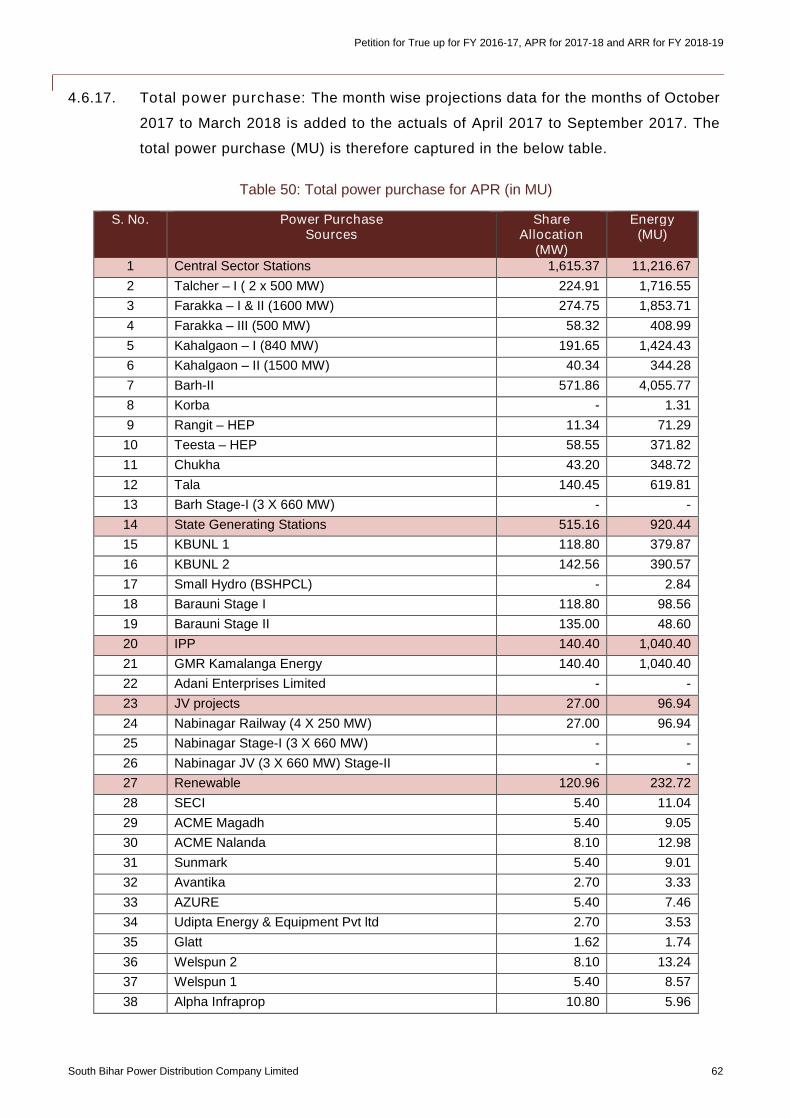
Petition for True up for FY 2016-17, APR for 2017-18 and ARR for FY 2018-19
South Bihar Power Distribution Company Limited 62
4.6.17. Total power purchase: The month wise projections data for the months of October
2017 to March 2018 is added to the actuals of April 2017 to September 2017. The
total power purchase (MU) is therefore captured in the below table.
Table 50: Total power purchase for APR (in MU)
S. No. Power PurchaseSources
ShareAllocation
(MW)
Energy(MU)
1 Central Sector Stations 1,615.37 11,216.67
2 Talcher – I ( 2 x 500 MW) 224.91 1,716.55
3 Farakka – I & II (1600 MW) 274.75 1,853.71
4 Farakka – III (500 MW) 58.32 408.99
5 Kahalgaon – I (840 MW) 191.65 1,424.43
6 Kahalgaon – II (1500 MW) 40.34 344.28
7 Barh-II 571.86 4,055.77
8 Korba - 1.31
9 Rangit – HEP 11.34 71.29
10 Teesta – HEP 58.55 371.82
11 Chukha 43.20 348.72
12 Tala 140.45 619.81
13 Barh Stage-I (3 X 660 MW) - -
14 State Generating Stations 515.16 920.44
15 KBUNL 1 118.80 379.87
16 KBUNL 2 142.56 390.57
17 Small Hydro (BSHPCL) - 2.84
18 Barauni Stage I 118.80 98.56
19 Barauni Stage II 135.00 48.60
20 IPP 140.40 1,040.40
21 GMR Kamalanga Energy 140.40 1,040.40
22 Adani Enterprises Limited - -
23 JV projects 27.00 96.94
24 Nabinagar Railway (4 X 250 MW) 27.00 96.94
25 Nabinagar Stage-I (3 X 660 MW) - -
26 Nabinagar JV (3 X 660 MW) Stage-II - -
27 Renewable 120.96 232.72
28 SECI 5.40 11.04
29 ACME Magadh 5.40 9.05
30 ACME Nalanda 8.10 12.98
31 Sunmark 5.40 9.01
32 Avantika 2.70 3.33
33 AZURE 5.40 7.46
34 Udipta Energy & Equipment Pvt ltd 2.70 3.53
35 Glatt 1.62 1.74
36 Welspun 2 8.10 13.24
37 Welspun 1 5.40 8.57
38 Alpha Infraprop 10.80 5.96
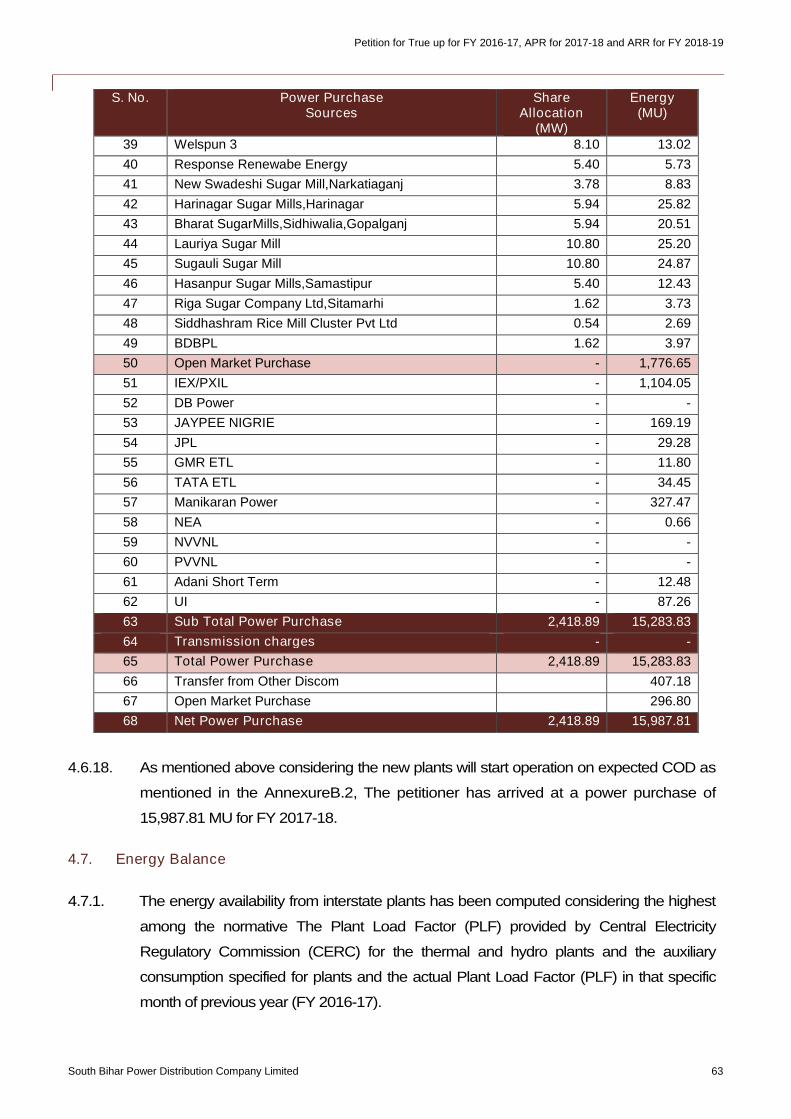
Petition for True up for FY 2016-17, APR for 2017-18 and ARR for FY 2018-19
South Bihar Power Distribution Company Limited 63
S. No. Power PurchaseSources
ShareAllocation
(MW)
Energy(MU)
39 Welspun 3 8.10 13.02
40 Response Renewabe Energy 5.40 5.73
41 New Swadeshi Sugar Mill,Narkatiaganj 3.78 8.83
42 Harinagar Sugar Mills,Harinagar 5.94 25.82
43 Bharat SugarMills,Sidhiwalia,Gopalganj 5.94 20.51
44 Lauriya Sugar Mill 10.80 25.20
45 Sugauli Sugar Mill 10.80 24.87
46 Hasanpur Sugar Mills,Samastipur 5.40 12.43
47 Riga Sugar Company Ltd,Sitamarhi 1.62 3.73
48 Siddhashram Rice Mill Cluster Pvt Ltd 0.54 2.69
49 BDBPL 1.62 3.97
50 Open Market Purchase - 1,776.65
51 IEX/PXIL - 1,104.05
52 DB Power - -
53 JAYPEE NIGRIE - 169.19
54 JPL - 29.28
55 GMR ETL - 11.80
56 TATA ETL - 34.45
57 Manikaran Power - 327.47
58 NEA - 0.66
59 NVVNL - -
60 PVVNL - -
61 Adani Short Term - 12.48
62 UI - 87.26
63 Sub Total Power Purchase 2,418.89 15,283.83
64 Transmission charges - -
65 Total Power Purchase 2,418.89 15,283.83
66 Transfer from Other Discom 407.18
67 Open Market Purchase 296.80
68 Net Power Purchase 2,418.89 15,987.81
4.6.18. As mentioned above considering the new plants will start operation on expected COD as
mentioned in the AnnexureB.2, The petitioner has arrived at a power purchase of
15,987.81 MU for FY 2017-18.
4.7. Energy Balance
4.7.1. The energy availability from interstate plants has been computed considering the highest
among the normative The Plant Load Factor (PLF) provided by Central Electricity
Regulatory Commission (CERC) for the thermal and hydro plants and the auxiliary
consumption specified for plants and the actual Plant Load Factor (PLF) in that specific
month of previous year (FY 2016-17).
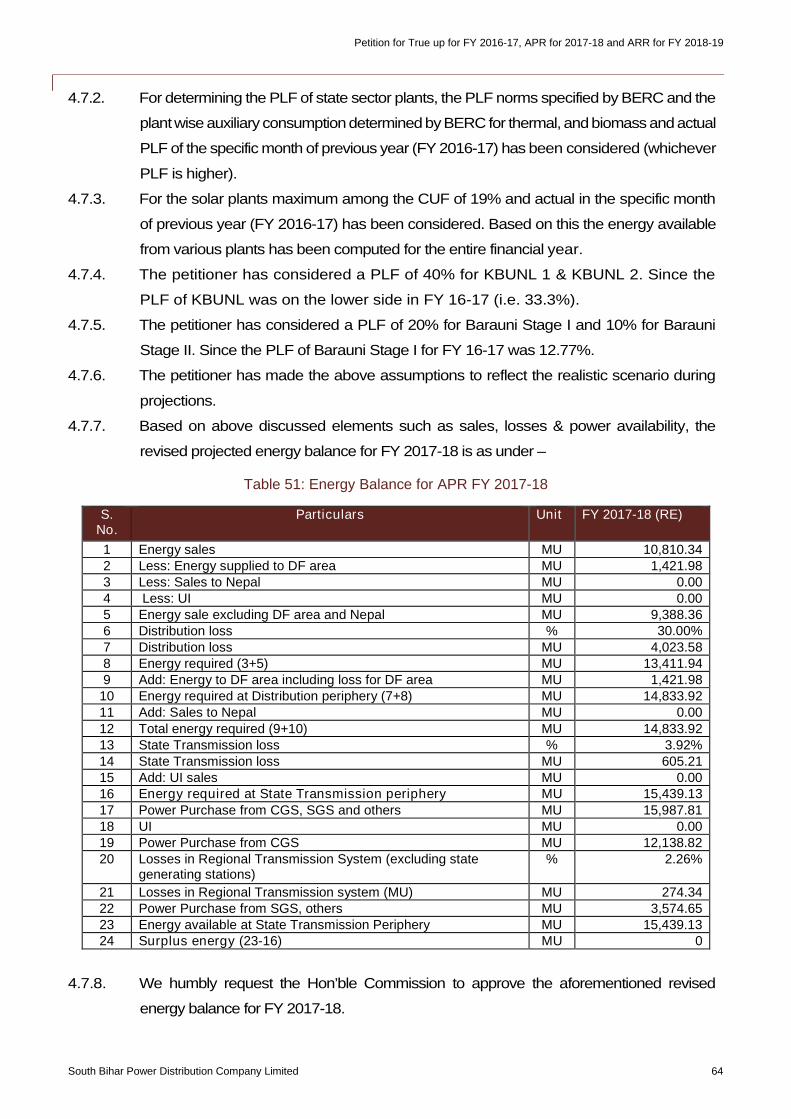
Petition for True up for FY 2016-17, APR for 2017-18 and ARR for FY 2018-19
South Bihar Power Distribution Company Limited 64
4.7.2. For determining the PLF of state sector plants, the PLF norms specified by BERC and the
plantwise auxiliary consumption determined byBERC for thermal, and biomass and actual
PLF of the specific month of previous year (FY 2016-17) has been considered (whichever
PLF is higher).
4.7.3. For the solar plants maximum among the CUF of 19% and actual in the specific month
of previous year (FY 2016-17) has been considered. Based on this the energy available
from various plants has been computed for the entire financial year.
4.7.4. The petitioner has considered a PLF of 40% for KBUNL 1 & KBUNL 2. Since the
PLF of KBUNL was on the lower side in FY 16-17 (i.e. 33.3%).
4.7.5. The petitioner has considered a PLF of 20% for Barauni Stage I and 10% for Barauni
Stage II. Since the PLF of Barauni Stage I for FY 16-17 was 12.77%.
4.7.6. The petitioner has made the above assumptions to reflect the realistic scenario during
projections.
4.7.7. Based on above discussed elements such as sales, losses & power availability, the
revised projected energy balance for FY 2017-18 is as under –
Table 51: Energy Balance for APR FY 2017-18
S.No.
Particulars Unit FY 2017-18 (RE)
1 Energy sales MU 10,810.342 Less: Energy supplied to DF area MU 1,421.983 Less: Sales to Nepal MU 0.004 Less: UI MU 0.005 Energy sale excluding DF area and Nepal MU 9,388.366 Distribution loss % 30.00%7 Distribution loss MU 4,023.588 Energy required (3+5) MU 13,411.949 Add: Energy to DF area including loss for DF area MU 1,421.98
10 Energy required at Distribution periphery (7+8) MU 14,833.9211 Add: Sales to Nepal MU 0.0012 Total energy required (9+10) MU 14,833.9213 State Transmission loss % 3.92%14 State Transmission loss MU 605.2115 Add: UI sales MU 0.0016 Energy required at State Transmission periphery MU 15,439.1317 Power Purchase from CGS, SGS and others MU 15,987.8118 UI MU 0.0019 Power Purchase from CGS MU 12,138.8220 Losses in Regional Transmission System (excluding state
generating stations)% 2.26%
21 Losses in Regional Transmission system (MU) MU 274.3422 Power Purchase from SGS, others MU 3,574.6523 Energy available at State Transmission Periphery MU 15,439.1324 Surplus energy (23-16) MU 0
4.7.8. We humbly request the Hon’ble Commission to approve the aforementioned revised
energy balance for FY 2017-18.
Petition for True up for FY 2016-17, APR for 2017-18 and ARR for FY 2018-19
South Bihar Power Distribution Company Limited 65
4.8. Power Purchase Cost
4.8.1. The power purchase cost mainly comprises of fixed charges and energy charges for two
part tariff stations i.e.NTPC,NHPC&PTCincaseofPetitioner.ThePetitionerhasconsidered
the actual energy charges and fixed cost for these power stations based on actual 12
monthsdata for FY2016-17 and actual 6 months information fromApril 2017 to September
2017.The average power purchase cost as mentioned below.
i. Petitioner has considered the new plants whose COD is in the next 6 months i.e.
October 2017 to March 2017.
ii. The powerpurchase cost projections have been undertaken by considering the average of
actual fixed cost and fuel costs respectively for the previous 6 months.
iii. The fixed cost projected using the above mentioned method is calculated to be 1.22
INR/kWh. This has also been adopted for the remaining period of FY 2017-18
iv. The fuel costs have been projected by escalating the average of actual fuel costs of
the previous 6 months data of FY 2017-18 by 0 percent.
v. The fuel costs computed by the above method is calculated to be 2.59 INR/kWh
vi. The total cost of power purchase per unit has been calculated to be 4.42 INR/kWh
inclusive of all charges.
4.8.2. The Petitioner requestsHon’bleCommission toallowpowerpurchasecosts for APR period
FY 2017-18 as provided in the table below.
4.8.3. Power purchase costs: The table here provides detailed power purchase costs-
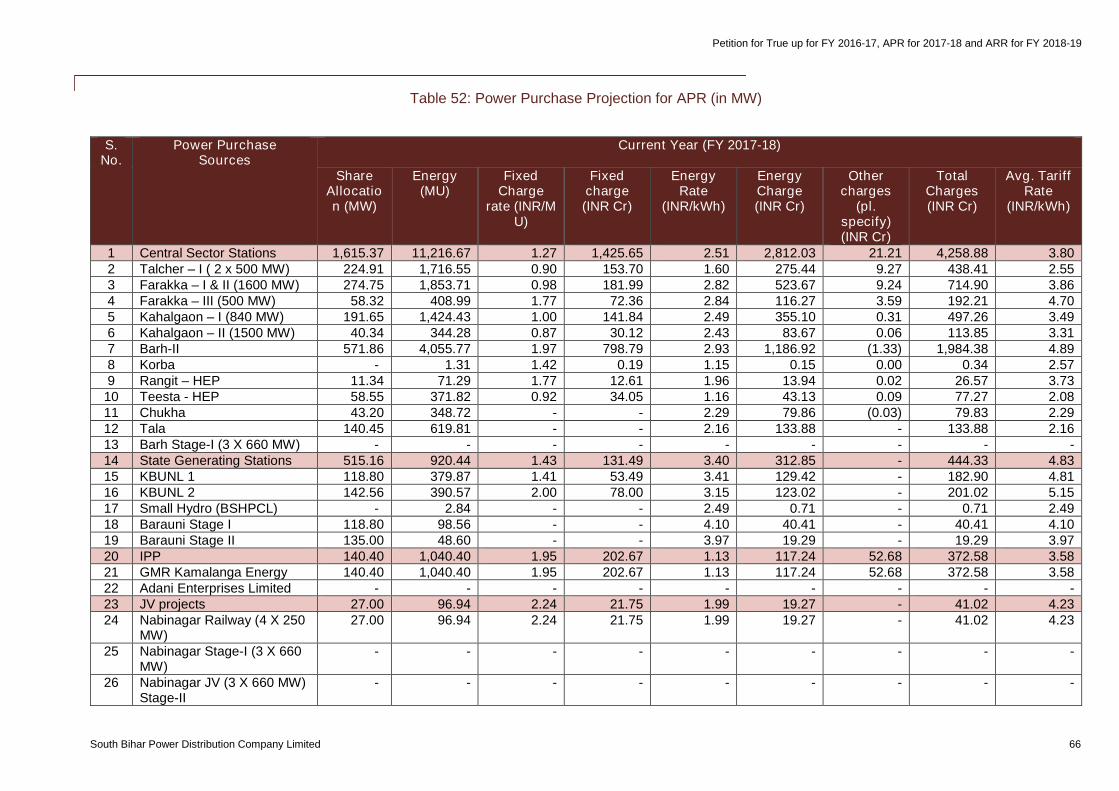
Petition for True up for FY 2016-17, APR for 2017-18 and ARR for FY 2018-19
South Bihar Power Distribution Company Limited 66
Table 52: Power Purchase Projection for APR (in MW)
S.No.
Power PurchaseSources
Current Year (FY 2017-18)
ShareAllocation (MW)
Energy(MU)
FixedCharge
rate (INR/MU)
Fixedcharge(INR Cr)
EnergyRate
(INR/kWh)
EnergyCharge(INR Cr)
Othercharges
(pl.specify)(INR Cr)
TotalCharges(INR Cr)
Avg. TariffRate
(INR/kWh)
1 Central Sector Stations 1,615.37 11,216.67 1.27 1,425.65 2.51 2,812.03 21.21 4,258.88 3.802 Talcher – I ( 2 x 500 MW) 224.91 1,716.55 0.90 153.70 1.60 275.44 9.27 438.41 2.553 Farakka – I & II (1600 MW) 274.75 1,853.71 0.98 181.99 2.82 523.67 9.24 714.90 3.864 Farakka – III (500 MW) 58.32 408.99 1.77 72.36 2.84 116.27 3.59 192.21 4.705 Kahalgaon – I (840 MW) 191.65 1,424.43 1.00 141.84 2.49 355.10 0.31 497.26 3.496 Kahalgaon – II (1500 MW) 40.34 344.28 0.87 30.12 2.43 83.67 0.06 113.85 3.317 Barh-II 571.86 4,055.77 1.97 798.79 2.93 1,186.92 (1.33) 1,984.38 4.898 Korba - 1.31 1.42 0.19 1.15 0.15 0.00 0.34 2.579 Rangit – HEP 11.34 71.29 1.77 12.61 1.96 13.94 0.02 26.57 3.7310 Teesta - HEP 58.55 371.82 0.92 34.05 1.16 43.13 0.09 77.27 2.0811 Chukha 43.20 348.72 - - 2.29 79.86 (0.03) 79.83 2.2912 Tala 140.45 619.81 - - 2.16 133.88 - 133.88 2.1613 Barh Stage-I (3 X 660 MW) - - - - - - - - -14 State Generating Stations 515.16 920.44 1.43 131.49 3.40 312.85 - 444.33 4.8315 KBUNL 1 118.80 379.87 1.41 53.49 3.41 129.42 - 182.90 4.8116 KBUNL 2 142.56 390.57 2.00 78.00 3.15 123.02 - 201.02 5.1517 Small Hydro (BSHPCL) - 2.84 - - 2.49 0.71 - 0.71 2.4918 Barauni Stage I 118.80 98.56 - - 4.10 40.41 - 40.41 4.1019 Barauni Stage II 135.00 48.60 - - 3.97 19.29 - 19.29 3.9720 IPP 140.40 1,040.40 1.95 202.67 1.13 117.24 52.68 372.58 3.5821 GMR Kamalanga Energy 140.40 1,040.40 1.95 202.67 1.13 117.24 52.68 372.58 3.5822 Adani Enterprises Limited - - - - - - - - -23 JV projects 27.00 96.94 2.24 21.75 1.99 19.27 - 41.02 4.2324 Nabinagar Railway (4 X 250
MW)27.00 96.94 2.24 21.75 1.99 19.27 - 41.02 4.23
25 Nabinagar Stage-I (3 X 660MW)
- - - - - - - - -
26 Nabinagar JV (3 X 660 MW)Stage-II
- - - - - - - - -
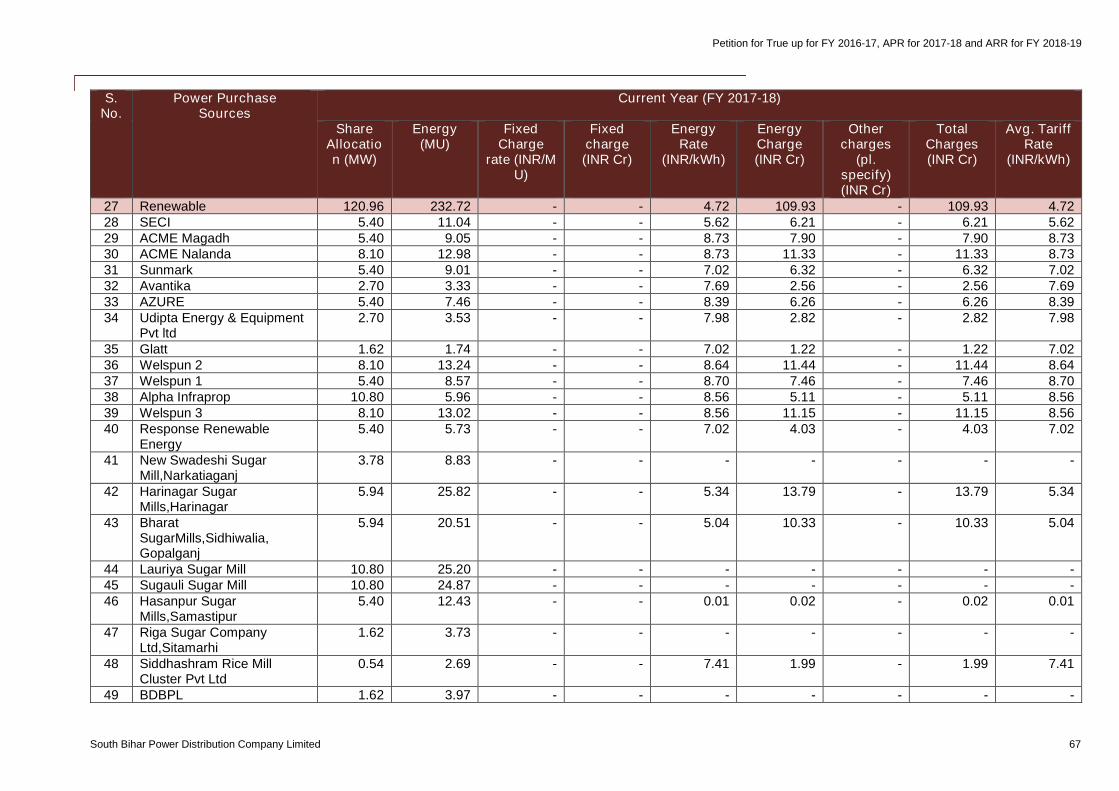
Petition for True up for FY 2016-17, APR for 2017-18 and ARR for FY 2018-19
South Bihar Power Distribution Company Limited 67
S.No.
Power PurchaseSources
Current Year (FY 2017-18)
ShareAllocation (MW)
Energy(MU)
FixedCharge
rate (INR/MU)
Fixedcharge(INR Cr)
EnergyRate
(INR/kWh)
EnergyCharge(INR Cr)
Othercharges
(pl.specify)(INR Cr)
TotalCharges(INR Cr)
Avg. TariffRate
(INR/kWh)
27 Renewable 120.96 232.72 - - 4.72 109.93 - 109.93 4.7228 SECI 5.40 11.04 - - 5.62 6.21 - 6.21 5.6229 ACME Magadh 5.40 9.05 - - 8.73 7.90 - 7.90 8.7330 ACME Nalanda 8.10 12.98 - - 8.73 11.33 - 11.33 8.7331 Sunmark 5.40 9.01 - - 7.02 6.32 - 6.32 7.0232 Avantika 2.70 3.33 - - 7.69 2.56 - 2.56 7.6933 AZURE 5.40 7.46 - - 8.39 6.26 - 6.26 8.3934 Udipta Energy & Equipment
Pvt ltd2.70 3.53 - - 7.98 2.82 - 2.82 7.98
35 Glatt 1.62 1.74 - - 7.02 1.22 - 1.22 7.0236 Welspun 2 8.10 13.24 - - 8.64 11.44 - 11.44 8.6437 Welspun 1 5.40 8.57 - - 8.70 7.46 - 7.46 8.7038 Alpha Infraprop 10.80 5.96 - - 8.56 5.11 - 5.11 8.5639 Welspun 3 8.10 13.02 - - 8.56 11.15 - 11.15 8.5640 Response Renewable
Energy5.40 5.73 - - 7.02 4.03 - 4.03 7.02
41 New Swadeshi SugarMill,Narkatiaganj
3.78 8.83 - - - - - - -
42 Harinagar SugarMills,Harinagar
5.94 25.82 - - 5.34 13.79 - 13.79 5.34
43 BharatSugarMills,Sidhiwalia,Gopalganj
5.94 20.51 - - 5.04 10.33 - 10.33 5.04
44 Lauriya Sugar Mill 10.80 25.20 - - - - - - -45 Sugauli Sugar Mill 10.80 24.87 - - - - - - -46 Hasanpur Sugar
Mills,Samastipur5.40 12.43 - - 0.01 0.02 - 0.02 0.01
47 Riga Sugar CompanyLtd,Sitamarhi
1.62 3.73 - - - - - - -
48 Siddhashram Rice MillCluster Pvt Ltd
0.54 2.69 - - 7.41 1.99 - 1.99 7.41
49 BDBPL 1.62 3.97 - - - - - - -
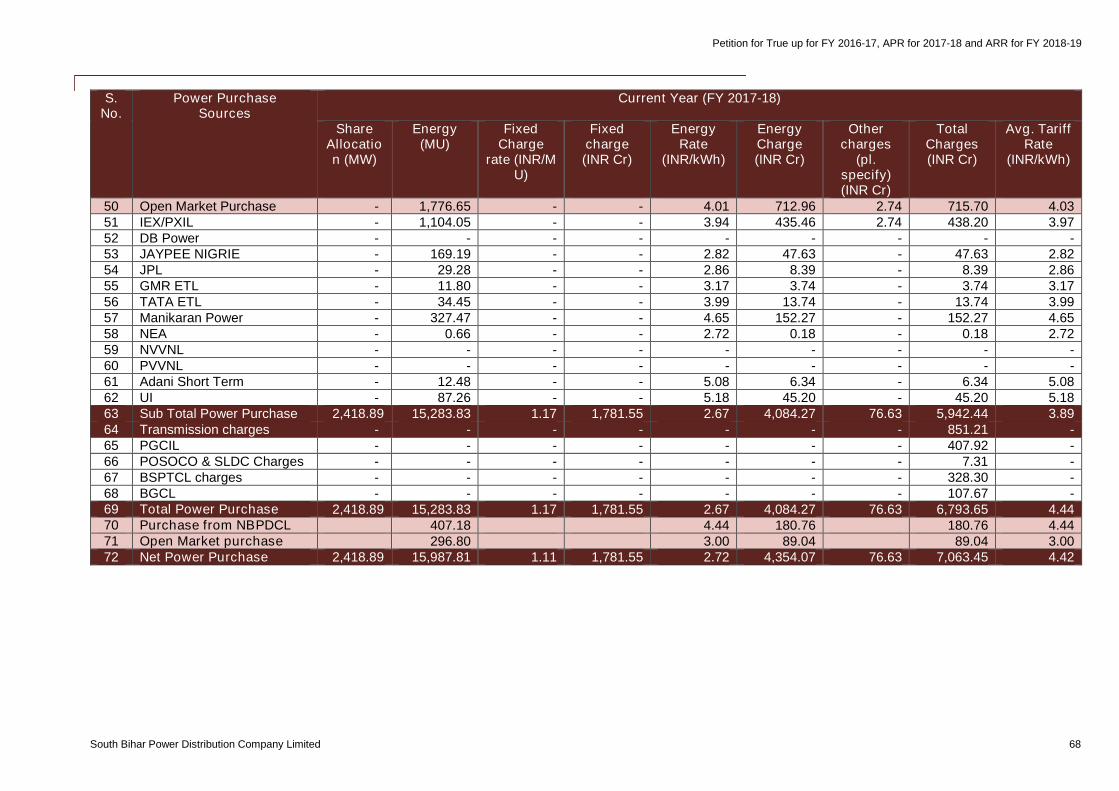
Petition for True up for FY 2016-17, APR for 2017-18 and ARR for FY 2018-19
South Bihar Power Distribution Company Limited 68
S.No.
Power PurchaseSources
Current Year (FY 2017-18)
ShareAllocation (MW)
Energy(MU)
FixedCharge
rate (INR/MU)
Fixedcharge(INR Cr)
EnergyRate
(INR/kWh)
EnergyCharge(INR Cr)
Othercharges
(pl.specify)(INR Cr)
TotalCharges(INR Cr)
Avg. TariffRate
(INR/kWh)
50 Open Market Purchase - 1,776.65 - - 4.01 712.96 2.74 715.70 4.0351 IEX/PXIL - 1,104.05 - - 3.94 435.46 2.74 438.20 3.9752 DB Power - - - - - - - - -53 JAYPEE NIGRIE - 169.19 - - 2.82 47.63 - 47.63 2.8254 JPL - 29.28 - - 2.86 8.39 - 8.39 2.8655 GMR ETL - 11.80 - - 3.17 3.74 - 3.74 3.1756 TATA ETL - 34.45 - - 3.99 13.74 - 13.74 3.9957 Manikaran Power - 327.47 - - 4.65 152.27 - 152.27 4.6558 NEA - 0.66 - - 2.72 0.18 - 0.18 2.7259 NVVNL - - - - - - - - -60 PVVNL - - - - - - - - -61 Adani Short Term - 12.48 - - 5.08 6.34 - 6.34 5.0862 UI - 87.26 - - 5.18 45.20 - 45.20 5.1863 Sub Total Power Purchase 2,418.89 15,283.83 1.17 1,781.55 2.67 4,084.27 76.63 5,942.44 3.8964 Transmission charges - - - - - - - 851.21 -65 PGCIL - - - - - - - 407.92 -66 POSOCO & SLDC Charges - - - - - - - 7.31 -67 BSPTCL charges - - - - - - - 328.30 -68 BGCL - - - - - - - 107.67 -69 Total Power Purchase 2,418.89 15,283.83 1.17 1,781.55 2.67 4,084.27 76.63 6,793.65 4.4470 Purchase from NBPDCL 407.18 4.44 180.76 180.76 4.4471 Open Market purchase 296.80 3.00 89.04 89.04 3.0072 Net Power Purchase 2,418.89 15,987.81 1.11 1,781.55 2.72 4,354.07 76.63 7,063.45 4.42
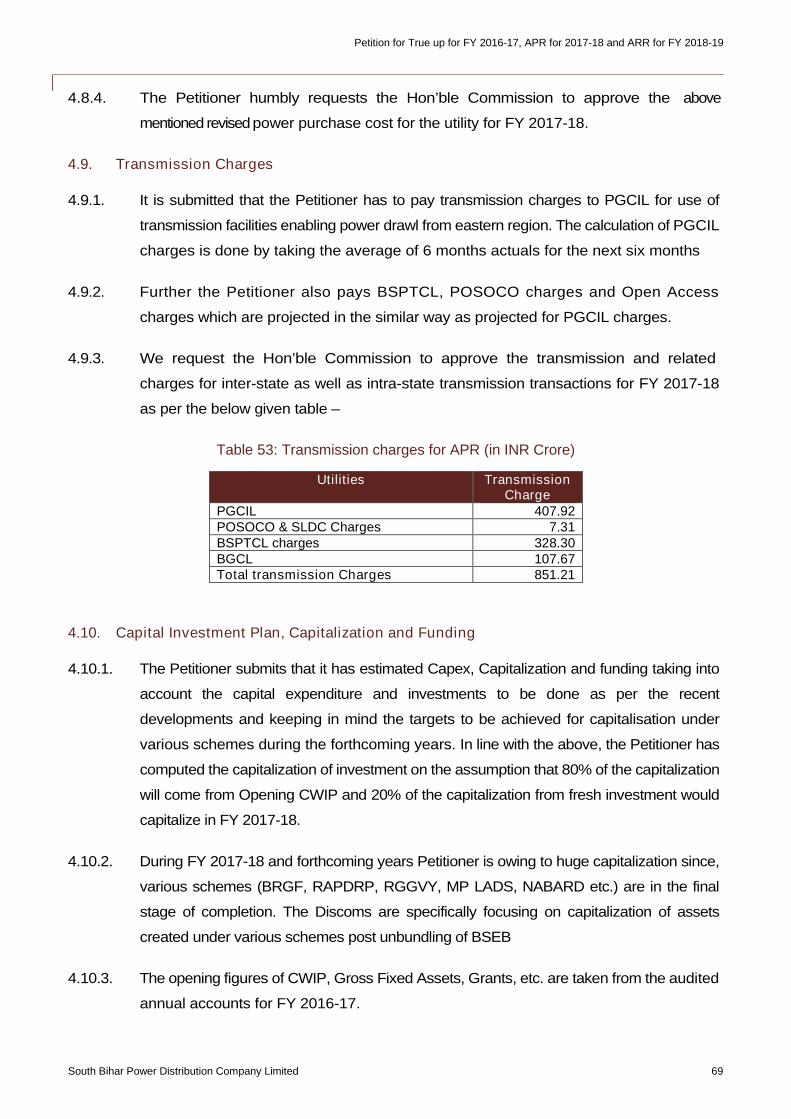
Petition for True up for FY 2016-17, APR for 2017-18 and ARR for FY 2018-19
South Bihar Power Distribution Company Limited 69
4.8.4. The Petitioner humbly requests the Hon’ble Commission to approve the above
mentioned revised power purchase cost for the utility for FY 2017-18.
4.9. Transmission Charges
4.9.1. It is submitted that the Petitioner has to pay transmission charges to PGCIL for use of
transmission facilities enabling power drawl from eastern region. The calculation of PGCIL
charges is done by taking the average of 6 months actuals for the next six months
4.9.2. Further the Petitioner also pays BSPTCL, POSOCO charges and Open Access
charges which are projected in the similar way as projected for PGCIL charges.
4.9.3. We request the Hon’ble Commission to approve the transmission and related
charges for inter-state as well as intra-state transmission transactions for FY 2017-18
as per the below given table –
Table 53: Transmission charges for APR (in INR Crore)
Utilities TransmissionCharge
PGCIL 407.92POSOCO & SLDC Charges 7.31BSPTCL charges 328.30BGCL 107.67Total transmission Charges 851.21
4.10. Capital Investment Plan, Capitalization and Funding
4.10.1. The Petitioner submits that it has estimated Capex, Capitalization and funding taking into
account the capital expenditure and investments to be done as per the recent
developments and keeping in mind the targets to be achieved for capitalisation under
various schemes during the forthcoming years. In line with the above, the Petitioner has
computed the capitalization of investment on the assumption that 80% of the capitalization
will come from Opening CWIP and 20% of the capitalization from fresh investment would
capitalize in FY 2017-18.
4.10.2. During FY 2017-18 and forthcoming years Petitioner is owing to huge capitalization since,
various schemes (BRGF, RAPDRP, RGGVY, MP LADS, NABARD etc.) are in the final
stage of completion. The Discoms are specifically focusing on capitalization of assets
created under various schemes post unbundling of BSEB
4.10.3. The opening figures of CWIP, Gross Fixed Assets, Grants, etc. are taken from the audited
annual accounts for FY 2016-17.
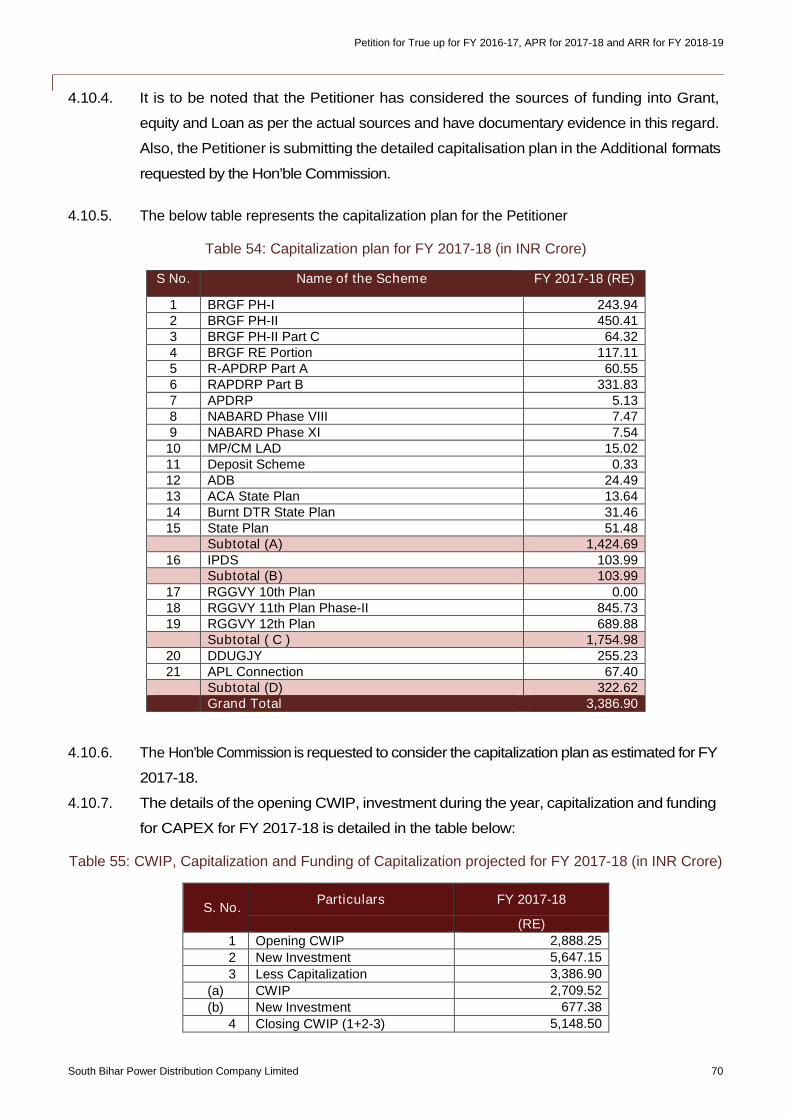
Petition for True up for FY 2016-17, APR for 2017-18 and ARR for FY 2018-19
South Bihar Power Distribution Company Limited 70
4.10.4. It is to be noted that the Petitioner has considered the sources of funding into Grant,
equity and Loan as per the actual sources and have documentary evidence in this regard.
Also, the Petitioner is submitting the detailed capitalisation plan in the Additional formats
requested by the Hon’ble Commission.
4.10.5. The below table represents the capitalization plan for the Petitioner
Table 54: Capitalization plan for FY 2017-18 (in INR Crore)
S No. Name of the Scheme FY 2017-18 (RE)
1 BRGF PH-I 243.942 BRGF PH-II 450.413 BRGF PH-II Part C 64.324 BRGF RE Portion 117.115 R-APDRP Part A 60.556 RAPDRP Part B 331.837 APDRP 5.138 NABARD Phase VIII 7.479 NABARD Phase XI 7.5410 MP/CM LAD 15.0211 Deposit Scheme 0.3312 ADB 24.4913 ACA State Plan 13.6414 Burnt DTR State Plan 31.4615 State Plan 51.48
Subtotal (A) 1,424.6916 IPDS 103.99
Subtotal (B) 103.9917 RGGVY 10th Plan 0.0018 RGGVY 11th Plan Phase-II 845.7319 RGGVY 12th Plan 689.88
Subtotal ( C ) 1,754.9820 DDUGJY 255.2321 APL Connection 67.40
Subtotal (D) 322.62Grand Total 3,386.90
4.10.6. The Hon’ble Commission is requested to consider the capitalization plan as estimated for FY
2017-18.
4.10.7. The details of the opening CWIP, investment during the year, capitalization and funding
for CAPEX for FY 2017-18 is detailed in the table below:
Table 55: CWIP, Capitalization and Funding of Capitalization projected for FY 2017-18 (in INR Crore)
S. No.Particulars FY 2017-18
(RE)
1 Opening CWIP 2,888.25
2 New Investment 5,647.15
3 Less Capitalization 3,386.90
(a) CWIP 2,709.52
(b) New Investment 677.38
4 Closing CWIP (1+2-3) 5,148.50
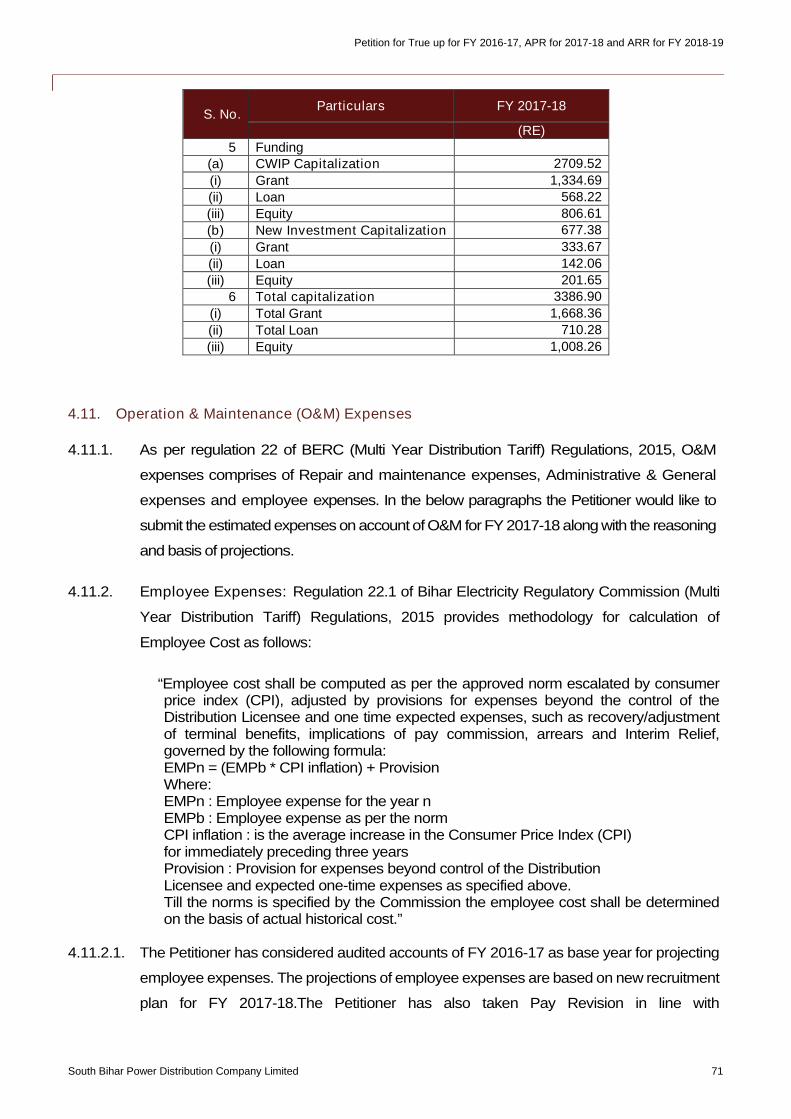
Petition for True up for FY 2016-17, APR for 2017-18 and ARR for FY 2018-19
South Bihar Power Distribution Company Limited 71
S. No.Particulars FY 2017-18
(RE)
5 Funding(a) CWIP Capitalization 2709.52
(i) Grant 1,334.69
(ii) Loan 568.22
(iii) Equity 806.61
(b) New Investment Capitalization 677.38
(i) Grant 333.67
(ii) Loan 142.06
(iii) Equity 201.65
6 Total capitalization 3386.90
(i) Total Grant 1,668.36
(ii) Total Loan 710.28
(iii) Equity 1,008.26
4.11. Operation & Maintenance (O&M) Expenses
4.11.1. As per regulation 22 of BERC (Multi Year Distribution Tariff) Regulations, 2015, O&M
expenses comprises of Repair and maintenance expenses, Administrative & General
expenses and employee expenses. In the below paragraphs the Petitioner would like to
submit the estimated expenses on account of O&M for FY 2017-18 along with the reasoning
and basis of projections.
4.11.2. Employee Expenses: Regulation 22.1 of Bihar Electricity Regulatory Commission (Multi
Year Distribution Tariff) Regulations, 2015 provides methodology for calculation of
Employee Cost as follows:
“Employee cost shall be computed as per the approved norm escalated by consumerprice index (CPI), adjusted by provisions for expenses beyond the control of theDistribution Licensee and one time expected expenses, such as recovery/adjustmentof terminal benefits, implications of pay commission, arrears and Interim Relief,governed by the following formula:EMPn = (EMPb * CPI inflation) + ProvisionWhere:EMPn : Employee expense for the year nEMPb : Employee expense as per the normCPI inflation : is the average increase in the Consumer Price Index (CPI)for immediately preceding three yearsProvision : Provision for expenses beyond control of the DistributionLicensee and expected one-time expenses as specified above.Till the norms is specified by the Commission the employee cost shall be determinedon the basis of actual historical cost.”
4.11.2.1. The Petitioner has considered audited accounts of FY 2016-17 as base year for projecting
employee expenses. The projections of employee expenses are based on new recruitment
plan for FY 2017-18.The Petitioner has also taken Pay Revision in line with
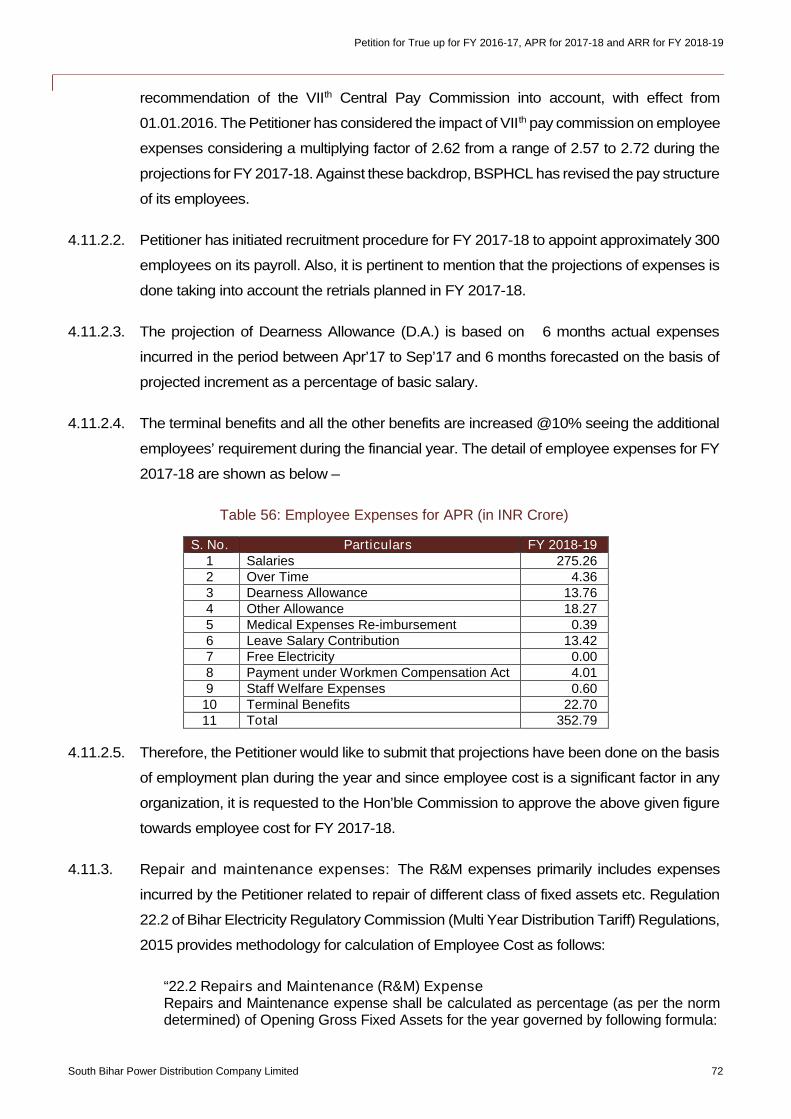
Petition for True up for FY 2016-17, APR for 2017-18 and ARR for FY 2018-19
South Bihar Power Distribution Company Limited 72
recommendation of the VIIth Central Pay Commission into account, with effect from
01.01.2016. The Petitioner has considered the impact of VIIth pay commission on employee
expenses considering a multiplying factor of 2.62 from a range of 2.57 to 2.72 during the
projections for FY 2017-18. Against these backdrop, BSPHCL has revised the pay structure
of its employees.
4.11.2.2. Petitioner has initiated recruitment procedure for FY 2017-18 to appoint approximately 300
employees on its payroll. Also, it is pertinent to mention that the projections of expenses is
done taking into account the retrials planned in FY 2017-18.
4.11.2.3. The projection of Dearness Allowance (D.A.) is based on 6 months actual expenses
incurred in the period between Apr’17 to Sep’17 and 6 months forecasted on the basis of
projected increment as a percentage of basic salary.
4.11.2.4. The terminal benefits and all the other benefits are increased @10% seeing the additional
employees’ requirement during the financial year. The detail of employee expenses for FY
2017-18 are shown as below –
Table 56: Employee Expenses for APR (in INR Crore)
S. No. Particulars FY 2018-191 Salaries 275.262 Over Time 4.363 Dearness Allowance 13.764 Other Allowance 18.275 Medical Expenses Re-imbursement 0.396 Leave Salary Contribution 13.427 Free Electricity 0.008 Payment under Workmen Compensation Act 4.019 Staff Welfare Expenses 0.60
10 Terminal Benefits 22.7011 Total 352.79
4.11.2.5. Therefore, the Petitioner would like to submit that projections have been done on the basis
of employment plan during the year and since employee cost is a significant factor in any
organization, it is requested to the Hon’ble Commission to approve the above given figure
towards employee cost for FY 2017-18.
4.11.3. Repair and maintenance expenses: The R&M expenses primarily includes expenses
incurred by the Petitioner related to repair of different class of fixed assets etc. Regulation
22.2 of Bihar Electricity Regulatory Commission (Multi Year Distribution Tariff) Regulations,
2015 provides methodology for calculation of Employee Cost as follows:
“22.2 Repairs and Maintenance (R&M) ExpenseRepairs and Maintenance expense shall be calculated as percentage (as per the normdetermined) of Opening Gross Fixed Assets for the year governed by following formula:
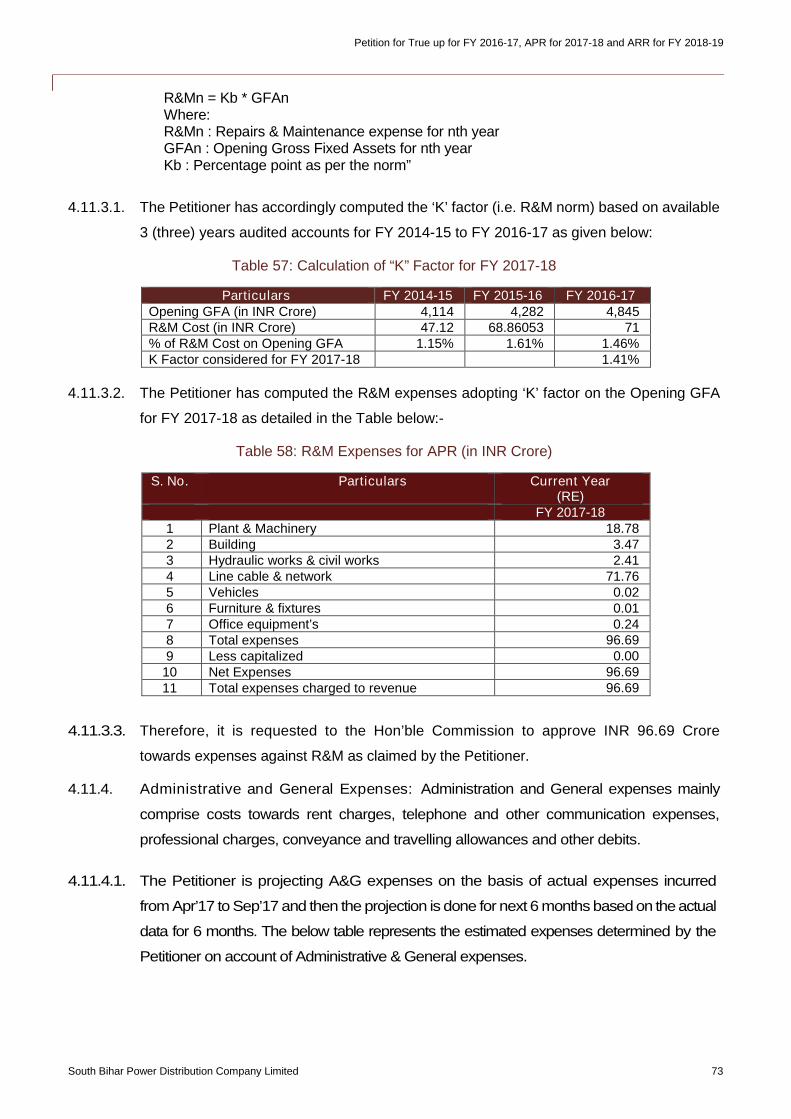
Petition for True up for FY 2016-17, APR for 2017-18 and ARR for FY 2018-19
South Bihar Power Distribution Company Limited 73
R&Mn = Kb * GFAnWhere:R&Mn : Repairs & Maintenance expense for nth yearGFAn : Opening Gross Fixed Assets for nth yearKb : Percentage point as per the norm”
4.11.3.1. The Petitioner has accordingly computed the ‘K’ factor (i.e. R&M norm) based on available
3 (three) years audited accounts for FY 2014-15 to FY 2016-17 as given below:
Table 57: Calculation of “K” Factor for FY 2017-18
Particulars FY 2014-15 FY 2015-16 FY 2016-17Opening GFA (in INR Crore) 4,114 4,282 4,845R&M Cost (in INR Crore) 47.12 68.86053 71% of R&M Cost on Opening GFA 1.15% 1.61% 1.46%K Factor considered for FY 2017-18 1.41%
4.11.3.2. The Petitioner has computed the R&M expenses adopting ‘K’ factor on the Opening GFA
for FY 2017-18 as detailed in the Table below:-
Table 58: R&M Expenses for APR (in INR Crore)
S. No. Particulars Current Year(RE)
FY 2017-181 Plant & Machinery 18.782 Building 3.473 Hydraulic works & civil works 2.414 Line cable & network 71.765 Vehicles 0.026 Furniture & fixtures 0.017 Office equipment’s 0.248 Total expenses 96.699 Less capitalized 0.00
10 Net Expenses 96.6911 Total expenses charged to revenue 96.69
4.11.3.3. Therefore, it is requested to the Hon’ble Commission to approve INR 96.69 Crore
towards expenses against R&M as claimed by the Petitioner.
4.11.4. Administrative and General Expenses: Administration and General expenses mainly
comprise costs towards rent charges, telephone and other communication expenses,
professional charges, conveyance and travelling allowances and other debits.
4.11.4.1. The Petitioner is projecting A&G expenses on the basis of actual expenses incurred
from Apr’17 to Sep’17 and then the projection is done for next 6 months based on the actual
data for 6 months. The below table represents the estimated expenses determined by the
Petitioner on account of Administrative & General expenses.
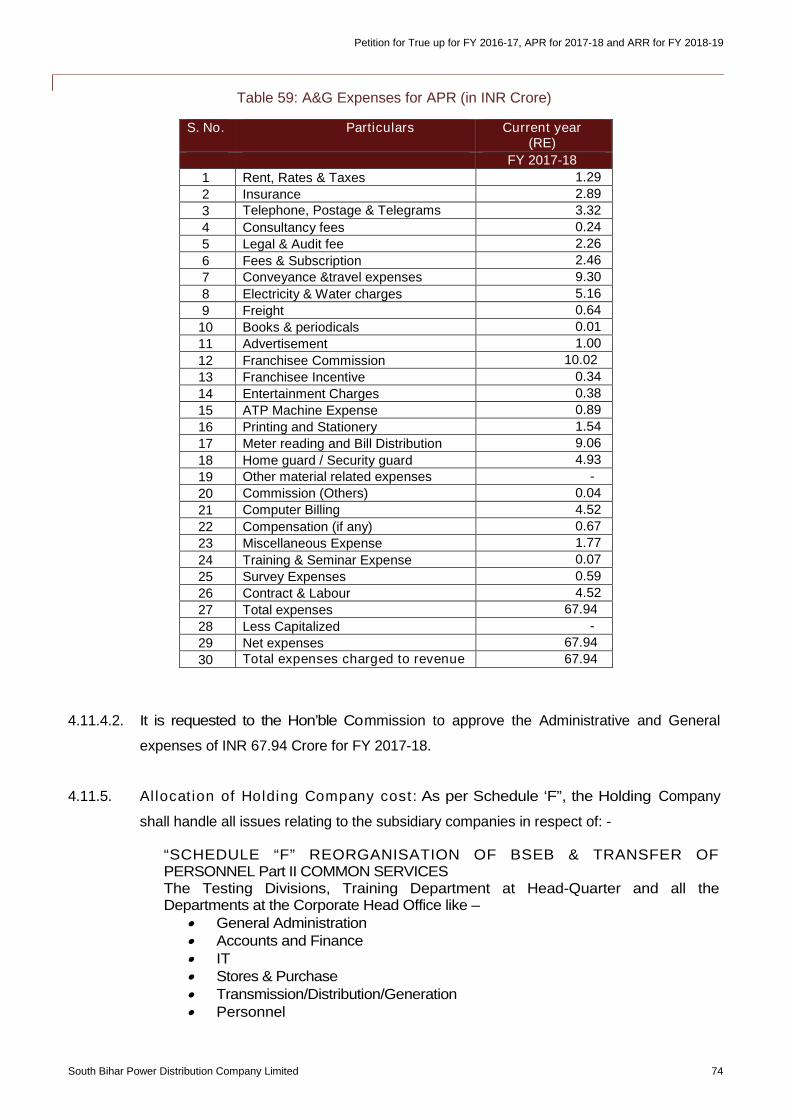
Petition for True up for FY 2016-17, APR for 2017-18 and ARR for FY 2018-19
South Bihar Power Distribution Company Limited 74
Table 59: A&G Expenses for APR (in INR Crore)
S. No. Particulars Current year(RE)
FY 2017-18
1 Rent, Rates & Taxes 1.29
2 Insurance 2.89
3 Telephone, Postage & Telegrams 3.32
4 Consultancy fees 0.24
5 Legal & Audit fee 2.26
6 Fees & Subscription 2.46
7 Conveyance &travel expenses 9.30
8 Electricity & Water charges 5.16
9 Freight 0.64
10 Books & periodicals 0.01
11 Advertisement 1.00
12 Franchisee Commission 10.02
13 Franchisee Incentive 0.34
14 Entertainment Charges 0.38
15 ATP Machine Expense 0.89
16 Printing and Stationery 1.54
17 Meter reading and Bill Distribution 9.06
18 Home guard / Security guard 4.93
19 Other material related expenses -
20 Commission (Others) 0.04
21 Computer Billing 4.52
22 Compensation (if any) 0.67
23 Miscellaneous Expense 1.77
24 Training & Seminar Expense 0.07
25 Survey Expenses 0.59
26 Contract & Labour 4.52
27 Total expenses 67.94
28 Less Capitalized -
29 Net expenses 67.94
30 Total expenses charged to revenue 67.94
4.11.4.2. It is requested to the Hon’ble Commission to approve the Administrative and General
expenses of INR 67.94 Crore for FY 2017-18.
4.11.5. Allocation of Holding Company cost: As per Schedule ‘F”, the Holding Company
shall handle all issues relating to the subsidiary companies in respect of: -
“SCHEDULE “F” REORGANISATION OF BSEB & TRANSFER OFPERSONNEL Part II COMMON SERVICESThe Testing Divisions, Training Department at Head-Quarter and all theDepartments at the Corporate Head Office like –
General Administration Accounts and Finance IT Stores & Purchase Transmission/Distribution/Generation Personnel
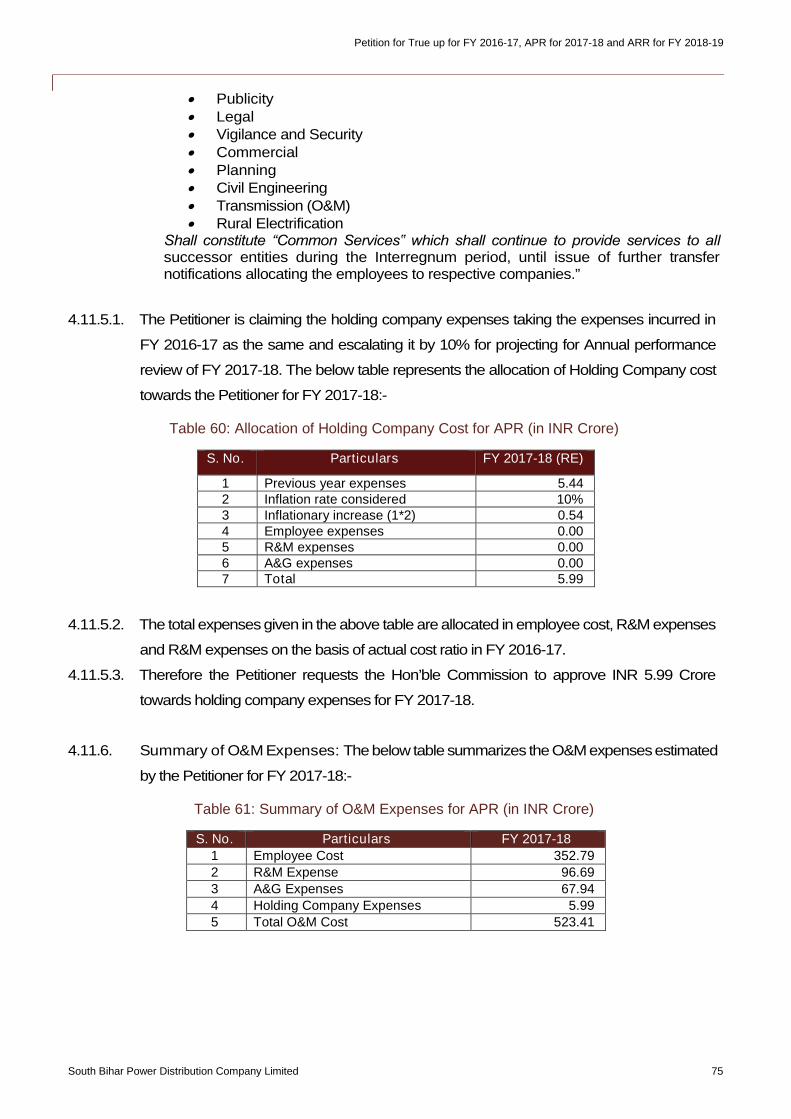
Petition for True up for FY 2016-17, APR for 2017-18 and ARR for FY 2018-19
South Bihar Power Distribution Company Limited 75
Publicity Legal Vigilance and Security Commercial Planning Civil Engineering Transmission (O&M) Rural Electrification
Shall constitute “Common Services‟ which shall continue to provide services to all successor entities during the Interregnum period, until issue of further transfernotifications allocating the employees to respective companies.”
4.11.5.1. The Petitioner is claiming the holding company expenses taking the expenses incurred in
FY 2016-17 as the same and escalating it by 10% for projecting for Annual performance
review of FY 2017-18. The below table represents the allocation of Holding Company cost
towards the Petitioner for FY 2017-18:-
Table 60: Allocation of Holding Company Cost for APR (in INR Crore)
S. No. Particulars FY 2017-18 (RE)
1 Previous year expenses 5.442 Inflation rate considered 10%3 Inflationary increase (1*2) 0.544 Employee expenses 0.005 R&M expenses 0.006 A&G expenses 0.007 Total 5.99
4.11.5.2. The total expenses given in the above table are allocated in employee cost, R&M expenses
and R&M expenses on the basis of actual cost ratio in FY 2016-17.
4.11.5.3. Therefore the Petitioner requests the Hon’ble Commission to approve INR 5.99 Crore
towards holding company expenses for FY 2017-18.
4.11.6. Summary of O&M Expenses: The below table summarizes the O&Mexpensesestimated
by the Petitioner for FY 2017-18:-
Table 61: Summary of O&M Expenses for APR (in INR Crore)
S. No. Particulars FY 2017-18
1 Employee Cost 352.79
2 R&M Expense 96.69
3 A&G Expenses 67.94
4 Holding Company Expenses 5.99
5 Total O&M Cost 523.41
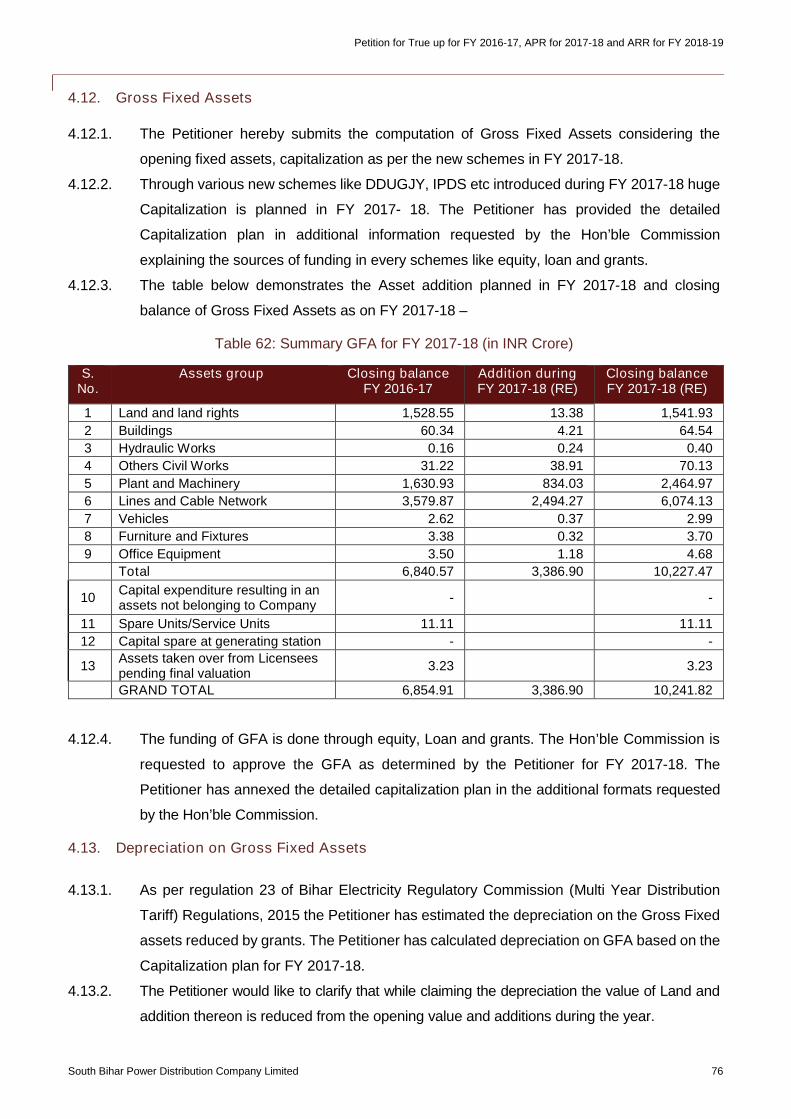
Petition for True up for FY 2016-17, APR for 2017-18 and ARR for FY 2018-19
South Bihar Power Distribution Company Limited 76
4.12. Gross Fixed Assets
4.12.1. The Petitioner hereby submits the computation of Gross Fixed Assets considering the
opening fixed assets, capitalization as per the new schemes in FY 2017-18.
4.12.2. Through various new schemes like DDUGJY, IPDS etc introduced during FY 2017-18 huge
Capitalization is planned in FY 2017- 18. The Petitioner has provided the detailed
Capitalization plan in additional information requested by the Hon’ble Commission
explaining the sources of funding in every schemes like equity, loan and grants.
4.12.3. The table below demonstrates the Asset addition planned in FY 2017-18 and closing
balance of Gross Fixed Assets as on FY 2017-18 –
Table 62: Summary GFA for FY 2017-18 (in INR Crore)
S.No.
Assets group Closing balanceFY 2016-17
Addition duringFY 2017-18 (RE)
Closing balanceFY 2017-18 (RE)
1 Land and land rights 1,528.55 13.38 1,541.93
2 Buildings 60.34 4.21 64.54
3 Hydraulic Works 0.16 0.24 0.40
4 Others Civil Works 31.22 38.91 70.13
5 Plant and Machinery 1,630.93 834.03 2,464.97
6 Lines and Cable Network 3,579.87 2,494.27 6,074.13
7 Vehicles 2.62 0.37 2.99
8 Furniture and Fixtures 3.38 0.32 3.70
9 Office Equipment 3.50 1.18 4.68
Total 6,840.57 3,386.90 10,227.47
10Capital expenditure resulting in anassets not belonging to Company
- -
11 Spare Units/Service Units 11.11 11.11
12 Capital spare at generating station - -
13Assets taken over from Licenseespending final valuation
3.23 3.23
GRAND TOTAL 6,854.91 3,386.90 10,241.82
4.12.4. The funding of GFA is done through equity, Loan and grants. The Hon’ble Commission is
requested to approve the GFA as determined by the Petitioner for FY 2017-18. The
Petitioner has annexed the detailed capitalization plan in the additional formats requested
by the Hon’ble Commission.
4.13. Depreciation on Gross Fixed Assets
4.13.1. As per regulation 23 of Bihar Electricity Regulatory Commission (Multi Year Distribution
Tariff) Regulations, 2015 the Petitioner has estimated the depreciation on the Gross Fixed
assets reduced by grants. The Petitioner has calculated depreciation on GFA based on the
Capitalization plan for FY 2017-18.
4.13.2. The Petitioner would like to clarify that while claiming the depreciation the value of Land and
addition thereon is reduced from the opening value and additions during the year.
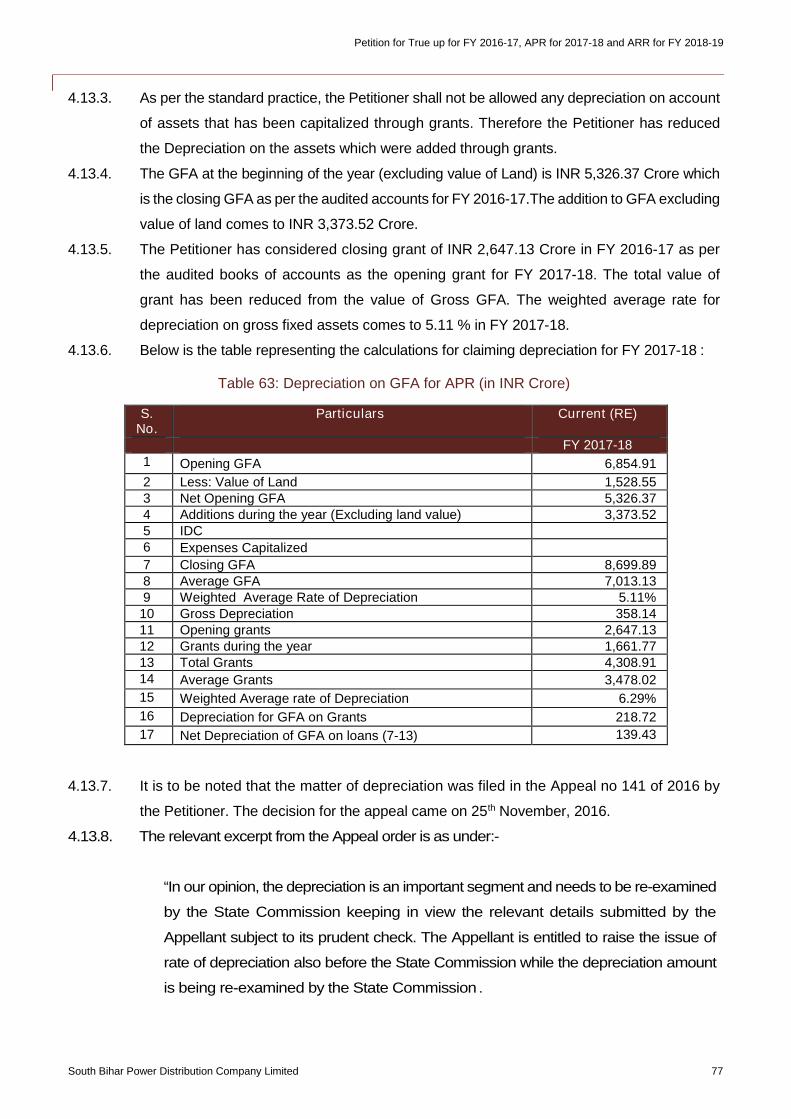
Petition for True up for FY 2016-17, APR for 2017-18 and ARR for FY 2018-19
South Bihar Power Distribution Company Limited 77
4.13.3. As per the standard practice, the Petitioner shall not be allowed any depreciation on account
of assets that has been capitalized through grants. Therefore the Petitioner has reduced
the Depreciation on the assets which were added through grants.
4.13.4. The GFA at the beginning of the year (excluding value of Land) is INR 5,326.37 Crore which
is the closing GFA as per the audited accounts for FY 2016-17.The addition to GFA excluding
value of land comes to INR 3,373.52 Crore.
4.13.5. The Petitioner has considered closing grant of INR 2,647.13 Crore in FY 2016-17 as per
the audited books of accounts as the opening grant for FY 2017-18. The total value of
grant has been reduced from the value of Gross GFA. The weighted average rate for
depreciation on gross fixed assets comes to 5.11 % in FY 2017-18.
4.13.6. Below is the table representing the calculations for claiming depreciation for FY 2017-18 :
Table 63: Depreciation on GFA for APR (in INR Crore)
S.No.
Particulars Current (RE)
FY 2017-18
1 Opening GFA 6,854.91
2 Less: Value of Land 1,528.553 Net Opening GFA 5,326.374 Additions during the year (Excluding land value) 3,373.525 IDC6 Expenses Capitalized
7 Closing GFA 8,699.898 Average GFA 7,013.139 Weighted Average Rate of Depreciation 5.11%10 Gross Depreciation 358.1411 Opening grants 2,647.1312 Grants during the year 1,661.7713 Total Grants 4,308.9114 Average Grants 3,478.02
15 Weighted Average rate of Depreciation 6.29%
16 Depreciation for GFA on Grants 218.72
17 Net Depreciation of GFA on loans (7-13) 139.43
4.13.7. It is to be noted that the matter of depreciation was filed in the Appeal no 141 of 2016 by
the Petitioner. The decision for the appeal came on 25th November, 2016.
4.13.8. The relevant excerpt from the Appeal order is as under:-
“In our opinion, the depreciation is an important segment and needs to be re-examined
by the State Commission keeping in view the relevant details submitted by the
Appellant subject to its prudent check. The Appellant is entitled to raise the issue of
rate of depreciation also before the State Commission while the depreciation amount
is being re-examined by the State Commission .
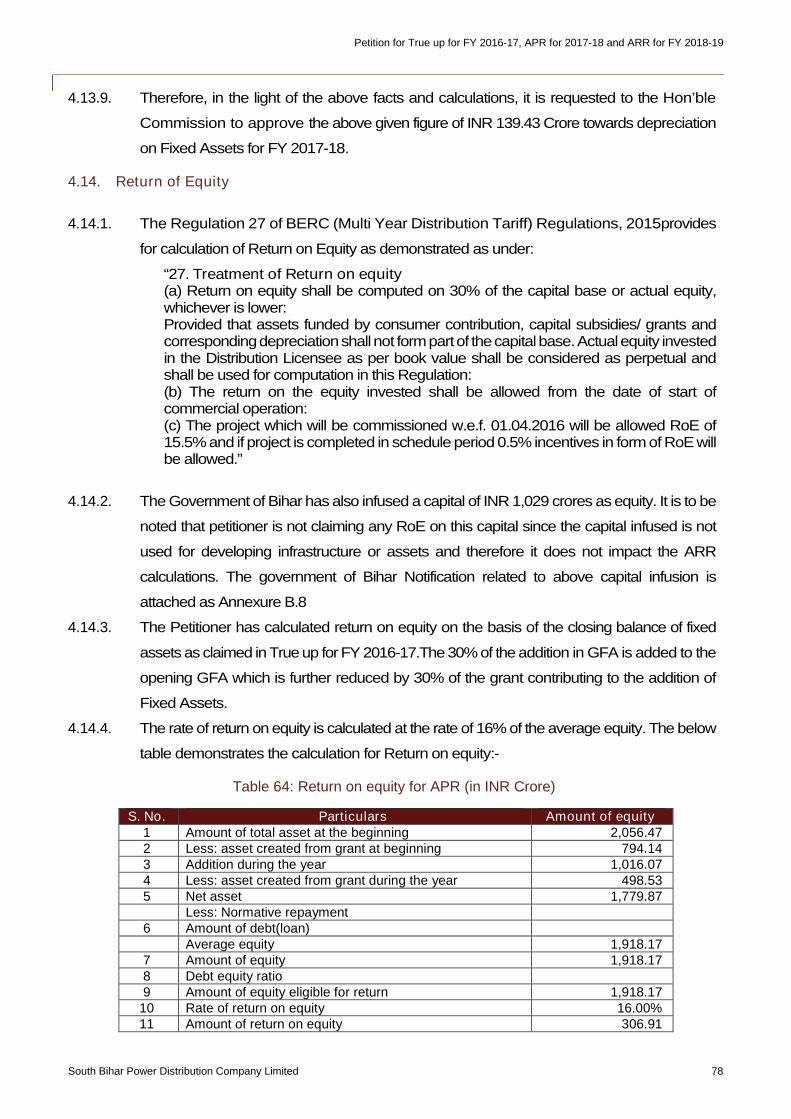
Petition for True up for FY 2016-17, APR for 2017-18 and ARR for FY 2018-19
South Bihar Power Distribution Company Limited 78
4.13.9. Therefore, in the light of the above facts and calculations, it is requested to the Hon’ble
Commission to approve the above given figure of INR 139.43 Crore towards depreciation
on Fixed Assets for FY 2017-18.
4.14. Return of Equity
4.14.1. The Regulation 27 of BERC (Multi Year Distribution Tariff) Regulations, 2015provides
for calculation of Return on Equity as demonstrated as under:
“27. Treatment of Return on equity(a) Return on equity shall be computed on 30% of the capital base or actual equity,whichever is lower:Provided that assets funded by consumer contribution, capital subsidies/ grants andcorrespondingdepreciationshall not formpartof thecapitalbase.Actualequity investedin the Distribution Licensee as per book value shall be considered as perpetual andshall be used for computation in this Regulation:(b) The return on the equity invested shall be allowed from the date of start ofcommercial operation:(c) The project which will be commissioned w.e.f. 01.04.2016 will be allowed RoE of15.5% and if project is completed in schedule period 0.5% incentives in form of RoE willbe allowed.”
4.14.2. The Government of Bihar has also infused a capital of INR 1,029 crores as equity. It is to be
noted that petitioner is not claiming any RoE on this capital since the capital infused is not
used for developing infrastructure or assets and therefore it does not impact the ARR
calculations. The government of Bihar Notification related to above capital infusion is
attached as Annexure B.8
4.14.3. The Petitioner has calculated return on equity on the basis of the closing balance of fixed
assets as claimed in True up for FY 2016-17.The 30% of the addition in GFA is added to the
opening GFA which is further reduced by 30% of the grant contributing to the addition of
Fixed Assets.
4.14.4. The rate of return on equity is calculated at the rate of 16% of the average equity. The below
table demonstrates the calculation for Return on equity:-
Table 64: Return on equity for APR (in INR Crore)
S. No. Particulars Amount of equity1 Amount of total asset at the beginning 2,056.472 Less: asset created from grant at beginning 794.143 Addition during the year 1,016.074 Less: asset created from grant during the year 498.535 Net asset 1,779.87
Less: Normative repayment6 Amount of debt(loan)
Average equity 1,918.177 Amount of equity 1,918.178 Debt equity ratio9 Amount of equity eligible for return 1,918.17
10 Rate of return on equity 16.00%11 Amount of return on equity 306.91
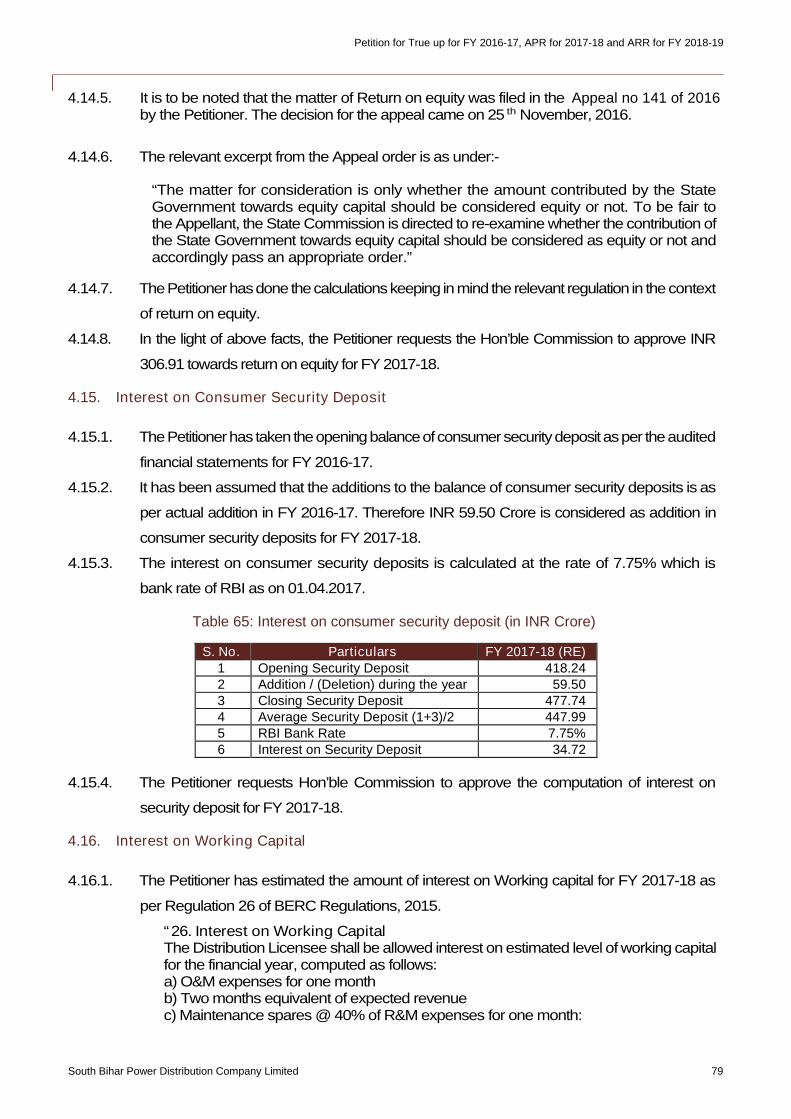
Petition for True up for FY 2016-17, APR for 2017-18 and ARR for FY 2018-19
South Bihar Power Distribution Company Limited 79
4.14.5. It is to be noted that the matter of Return on equity was filed in the Appeal no 141 of 2016by the Petitioner. The decision for the appeal came on 25 th November, 2016.
4.14.6. The relevant excerpt from the Appeal order is as under:-
“The matter for consideration is only whether the amount contributed by the StateGovernment towards equity capital should be considered equity or not. To be fair tothe Appellant, the State Commission is directed to re-examine whether the contribution ofthe State Government towards equity capital should be considered as equity or not andaccordingly pass an appropriate order.”
4.14.7. ThePetitionerhasdone thecalculationskeeping in mind the relevant regulation in the context
of return on equity.
4.14.8. In the light of above facts, the Petitioner requests the Hon’ble Commission to approve INR
306.91 towards return on equity for FY 2017-18.
4.15. Interest on Consumer Security Deposit
4.15.1. ThePetitionerhas taken theopeningbalanceofconsumersecuritydepositasper theaudited
financial statements for FY 2016-17.
4.15.2. It has been assumed that the additions to the balance of consumer security deposits is as
per actual addition in FY 2016-17. Therefore INR 59.50 Crore is considered as addition in
consumer security deposits for FY 2017-18.
4.15.3. The interest on consumer security deposits is calculated at the rate of 7.75% which is
bank rate of RBI as on 01.04.2017.
Table 65: Interest on consumer security deposit (in INR Crore)
S. No. Particulars FY 2017-18 (RE)1 Opening Security Deposit 418.242 Addition / (Deletion) during the year 59.503 Closing Security Deposit 477.744 Average Security Deposit (1+3)/2 447.995 RBI Bank Rate 7.75%6 Interest on Security Deposit 34.72
4.15.4. The Petitioner requests Hon’ble Commission to approve the computation of interest on
security deposit for FY 2017-18.
4.16. Interest on Working Capital
4.16.1. The Petitioner has estimated the amount of interest on Working capital for FY 2017-18 as
per Regulation 26 of BERC Regulations, 2015.
“26. Interest on Working CapitalThe Distribution Licensee shall be allowed interest on estimated level of working capitalfor the financial year, computed as follows:a) O&M expenses for one monthb) Two months equivalent of expected revenuec) Maintenance spares @ 40% of R&M expenses for one month:
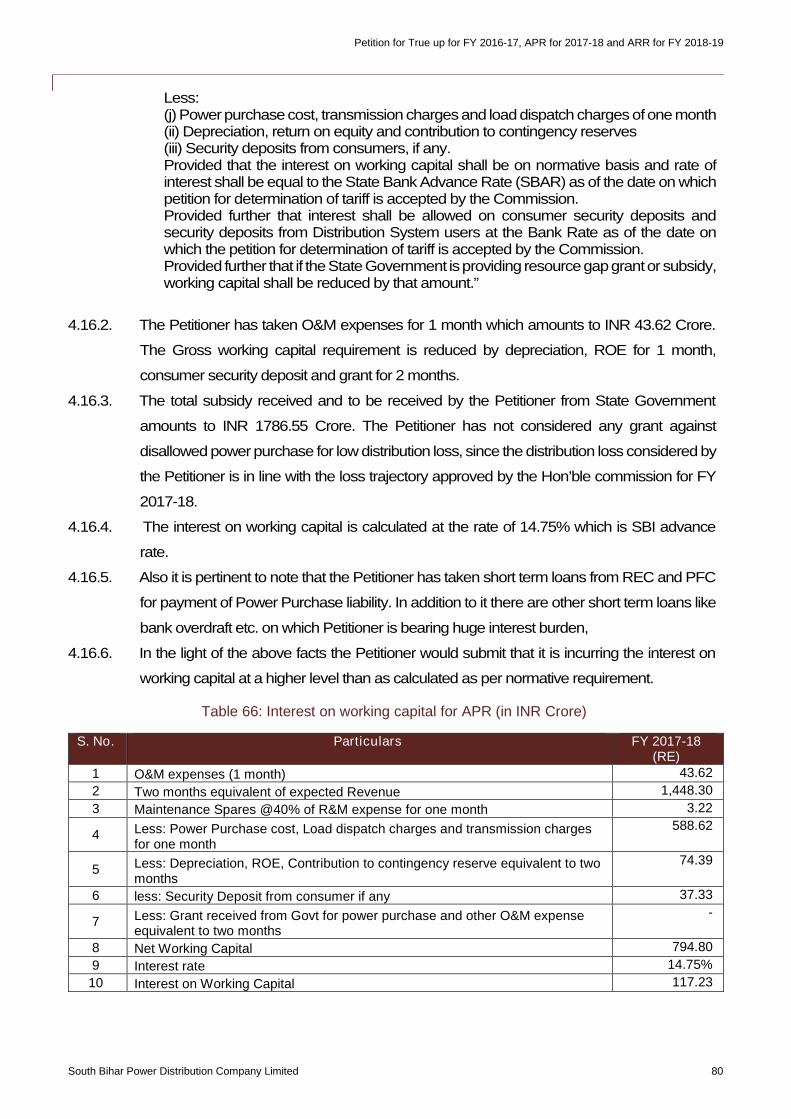
Petition for True up for FY 2016-17, APR for 2017-18 and ARR for FY 2018-19
South Bihar Power Distribution Company Limited 80
Less:(j) Powerpurchase cost, transmission charges and load dispatch charges ofone month(ii) Depreciation, return on equity and contribution to contingency reserves(iii) Security deposits from consumers, if any.Provided that the interest on working capital shall be on normative basis and rate ofinterest shall be equal to the State Bank Advance Rate (SBAR) as of the date on whichpetition for determination of tariff is accepted by the Commission.Provided further that interest shall be allowed on consumer security deposits andsecurity deposits from Distribution System users at the Bank Rate as of the date onwhich the petition for determination of tariff is accepted by the Commission.Provided further that if theStateGovernment isproviding resourcegapgrantor subsidy,working capital shall be reduced by that amount.”
4.16.2. The Petitioner has taken O&M expenses for 1 month which amounts to INR 43.62 Crore.
The Gross working capital requirement is reduced by depreciation, ROE for 1 month,
consumer security deposit and grant for 2 months.
4.16.3. The total subsidy received and to be received by the Petitioner from State Government
amounts to INR 1786.55 Crore. The Petitioner has not considered any grant against
disallowed power purchase for low distribution loss, since the distribution loss considered by
the Petitioner is in line with the loss trajectory approved by the Hon’ble commission for FY
2017-18.
4.16.4. The interest on working capital is calculated at the rate of 14.75% which is SBI advance
rate.
4.16.5. Also it is pertinent to note that the Petitioner has taken short term loans from REC and PFC
for payment of Power Purchase liability. In addition to it there are other short term loans like
bank overdraft etc. on which Petitioner is bearing huge interest burden,
4.16.6. In the light of the above facts the Petitioner would submit that it is incurring the interest on
working capital at a higher level than as calculated as per normative requirement.
Table 66: Interest on working capital for APR (in INR Crore)
S. No. Particulars FY 2017-18(RE)
1 O&M expenses (1 month) 43.62
2 Two months equivalent of expected Revenue 1,448.30
3 Maintenance Spares @40% of R&M expense for one month 3.22
4 Less: Power Purchase cost, Load dispatch charges and transmission chargesfor one month
588.62
5 Less: Depreciation, ROE, Contribution to contingency reserve equivalent to twomonths
74.39
6 less: Security Deposit from consumer if any 37.33
7 Less: Grant received from Govt for power purchase and other O&M expenseequivalent to two months
-
8 Net Working Capital 794.80
9 Interest rate 14.75%
10 Interest on Working Capital 117.23
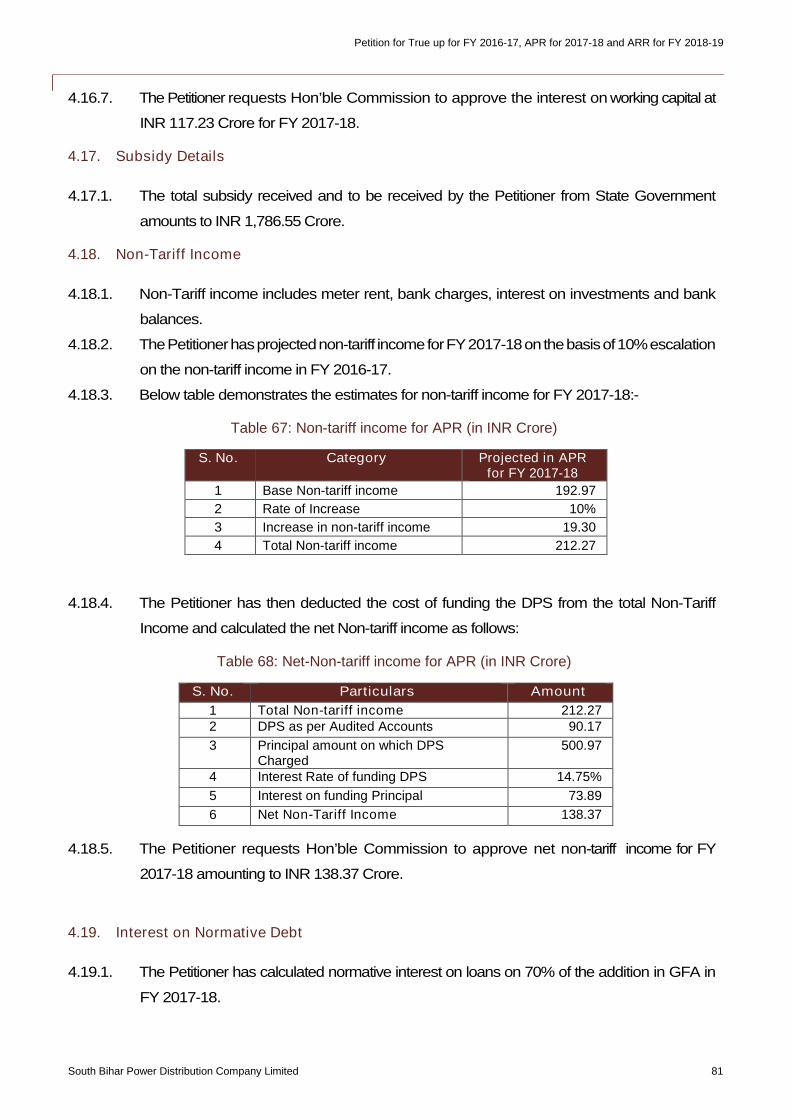
Petition for True up for FY 2016-17, APR for 2017-18 and ARR for FY 2018-19
South Bihar Power Distribution Company Limited 81
4.16.7. The Petitioner requests Hon’ble Commission to approve the interest on working capital at
INR 117.23 Crore for FY 2017-18.
4.17. Subsidy Details
4.17.1. The total subsidy received and to be received by the Petitioner from State Government
amounts to INR 1,786.55 Crore.
4.18. Non-Tariff Income
4.18.1. Non-Tariff income includes meter rent, bank charges, interest on investments and bank
balances.
4.18.2. ThePetitionerhasprojectednon-tariff incomeforFY2017-18onthebasisof10%escalation
on the non-tariff income in FY 2016-17.
4.18.3. Below table demonstrates the estimates for non-tariff income for FY 2017-18:-
Table 67: Non-tariff income for APR (in INR Crore)
S. No. Category Projected in APRfor FY 2017-18
1 Base Non-tariff income 192.97
2 Rate of Increase 10%
3 Increase in non-tariff income 19.30
4 Total Non-tariff income 212.27
4.18.4. The Petitioner has then deducted the cost of funding the DPS from the total Non-Tariff
Income and calculated the net Non-tariff income as follows:
Table 68: Net-Non-tariff income for APR (in INR Crore)
S. No. Particulars Amount
1 Total Non-tariff income 212.272 DPS as per Audited Accounts 90.17
3 Principal amount on which DPSCharged
500.97
4 Interest Rate of funding DPS 14.75%
5 Interest on funding Principal 73.89
6 Net Non-Tariff Income 138.37
4.18.5. The Petitioner requests Hon’ble Commission to approve net non-tariff income for FY
2017-18 amounting to INR 138.37 Crore.
4.19. Interest on Normative Debt
4.19.1. The Petitioner has calculated normative interest on loans on 70% of the addition in GFA in
FY 2017-18.
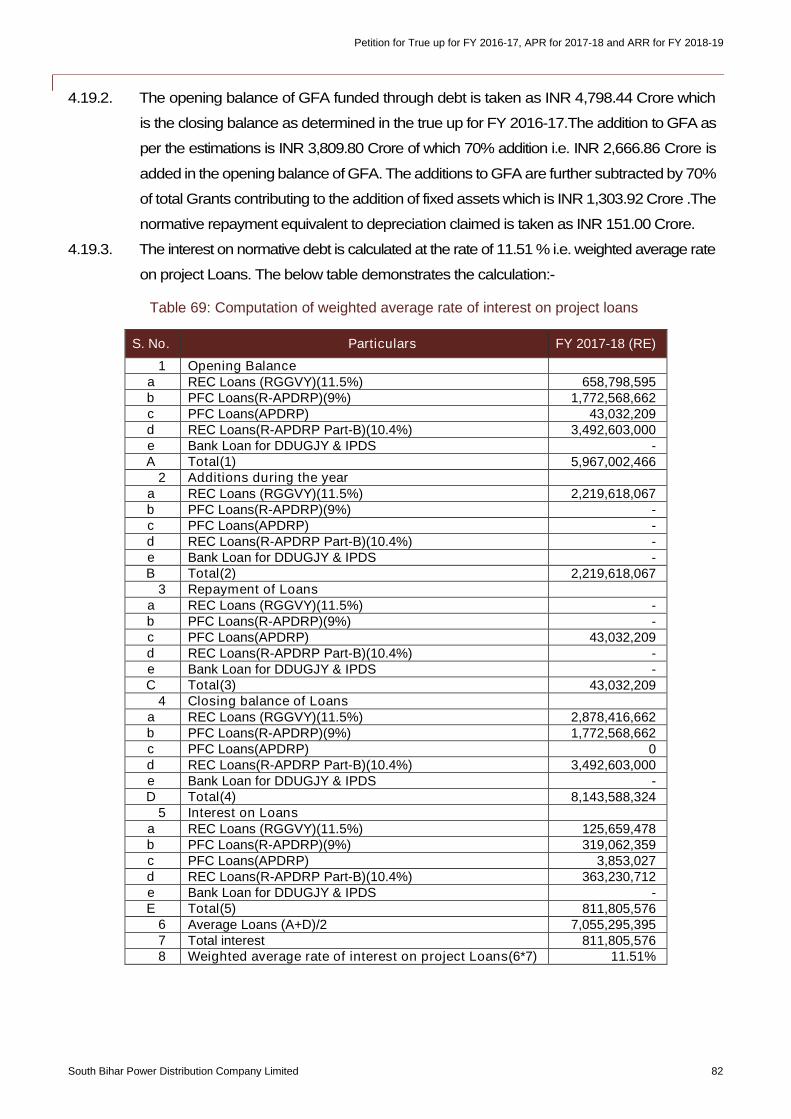
Petition for True up for FY 2016-17, APR for 2017-18 and ARR for FY 2018-19
South Bihar Power Distribution Company Limited 82
4.19.2. The opening balance of GFA funded through debt is taken as INR 4,798.44 Crore which
is the closing balance as determined in the true up for FY 2016-17.The addition to GFA as
per the estimations is INR 3,809.80 Crore of which 70% addition i.e. INR 2,666.86 Crore is
added in the opening balance of GFA. The additions to GFA are further subtracted by 70%
of total Grants contributing to the addition of fixed assets which is INR 1,303.92 Crore .The
normative repayment equivalent to depreciation claimed is taken as INR 151.00 Crore.
4.19.3. The interest on normative debt is calculated at the rate of 11.51 % i.e. weighted average rate
on project Loans. The below table demonstrates the calculation:-
Table 69: Computation of weighted average rate of interest on project loans
S. No. Particulars FY 2017-18 (RE)
1 Opening Balancea REC Loans (RGGVY)(11.5%) 658,798,595b PFC Loans(R-APDRP)(9%) 1,772,568,662c PFC Loans(APDRP) 43,032,209d REC Loans(R-APDRP Part-B)(10.4%) 3,492,603,000e Bank Loan for DDUGJY & IPDS -A Total(1) 5,967,002,466
2 Additions during the yeara REC Loans (RGGVY)(11.5%) 2,219,618,067b PFC Loans(R-APDRP)(9%) -c PFC Loans(APDRP) -d REC Loans(R-APDRP Part-B)(10.4%) -e Bank Loan for DDUGJY & IPDS -B Total(2) 2,219,618,067
3 Repayment of Loansa REC Loans (RGGVY)(11.5%) -b PFC Loans(R-APDRP)(9%) -c PFC Loans(APDRP) 43,032,209d REC Loans(R-APDRP Part-B)(10.4%) -e Bank Loan for DDUGJY & IPDS -C Total(3) 43,032,209
4 Closing balance of Loansa REC Loans (RGGVY)(11.5%) 2,878,416,662b PFC Loans(R-APDRP)(9%) 1,772,568,662c PFC Loans(APDRP) 0d REC Loans(R-APDRP Part-B)(10.4%) 3,492,603,000e Bank Loan for DDUGJY & IPDS -D Total(4) 8,143,588,324
5 Interest on Loansa REC Loans (RGGVY)(11.5%) 125,659,478b PFC Loans(R-APDRP)(9%) 319,062,359c PFC Loans(APDRP) 3,853,027d REC Loans(R-APDRP Part-B)(10.4%) 363,230,712e Bank Loan for DDUGJY & IPDS -E Total(5) 811,805,576
6 Average Loans (A+D)/2 7,055,295,3957 Total interest 811,805,5768 Weighted average rate of interest on project Loans(6*7) 11.51%
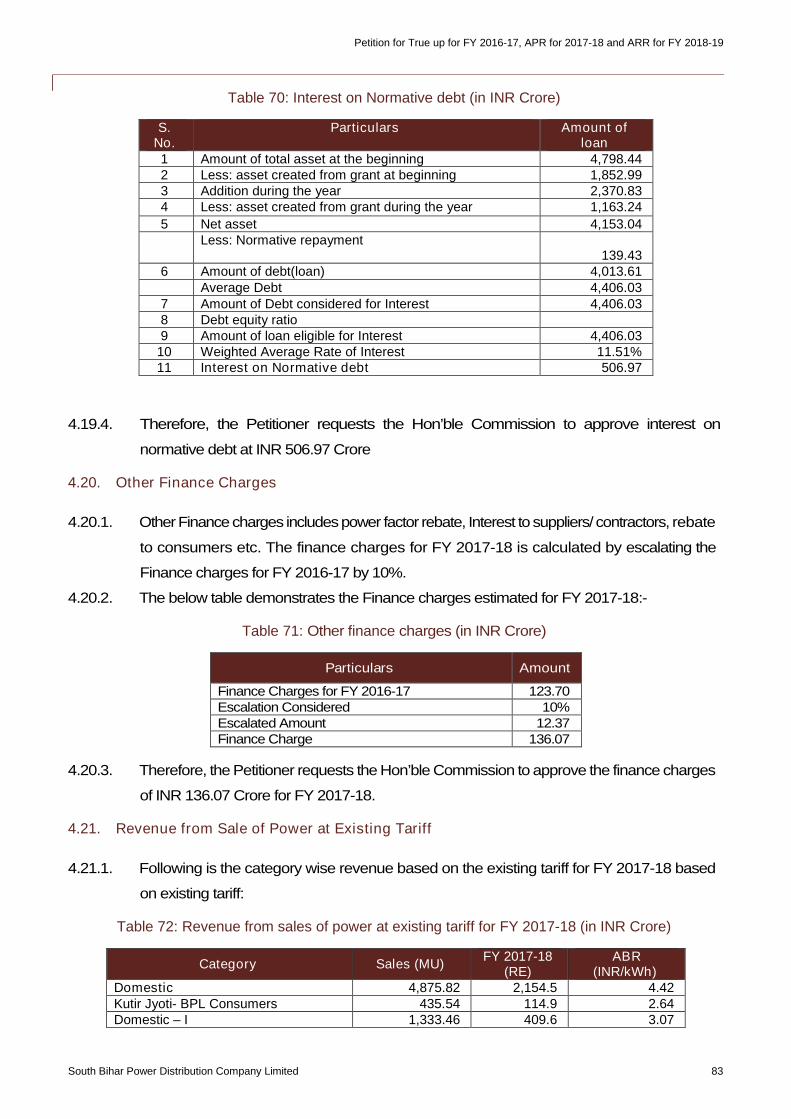
Petition for True up for FY 2016-17, APR for 2017-18 and ARR for FY 2018-19
South Bihar Power Distribution Company Limited 83
Table 70: Interest on Normative debt (in INR Crore)
S.No.
Particulars Amount ofloan
1 Amount of total asset at the beginning 4,798.442 Less: asset created from grant at beginning 1,852.993 Addition during the year 2,370.834 Less: asset created from grant during the year 1,163.24
5 Net asset 4,153.04Less: Normative repayment
139.436 Amount of debt(loan) 4,013.61
Average Debt 4,406.037 Amount of Debt considered for Interest 4,406.038 Debt equity ratio9 Amount of loan eligible for Interest 4,406.03
10 Weighted Average Rate of Interest 11.51%11 Interest on Normative debt 506.97
4.19.4. Therefore, the Petitioner requests the Hon’ble Commission to approve interest on
normative debt at INR 506.97 Crore
4.20. Other Finance Charges
4.20.1. OtherFinance charges includespower factor rebate, Interest to suppliers/ contractors, rebate
to consumers etc. The finance charges for FY 2017-18 is calculated by escalating the
Finance charges for FY 2016-17 by 10%.
4.20.2. The below table demonstrates the Finance charges estimated for FY 2017-18:-
Table 71: Other finance charges (in INR Crore)
Particulars Amount
Finance Charges for FY 2016-17 123.70Escalation Considered 10%Escalated Amount 12.37Finance Charge 136.07
4.20.3. Therefore, the Petitioner requests the Hon’ble Commission to approve the finance charges
of INR 136.07 Crore for FY 2017-18.
4.21. Revenue from Sale of Power at Existing Tariff
4.21.1. Following is the category wise revenue based on the existing tariff for FY 2017-18 based
on existing tariff:
Table 72: Revenue from sales of power at existing tariff for FY 2017-18 (in INR Crore)
Category Sales (MU)FY 2017-18
(RE)ABR
(INR/kWh)Domestic 4,875.82 2,154.5 4.42Kutir Jyoti- BPL Consumers 435.54 114.9 2.64Domestic – I 1,333.46 409.6 3.07
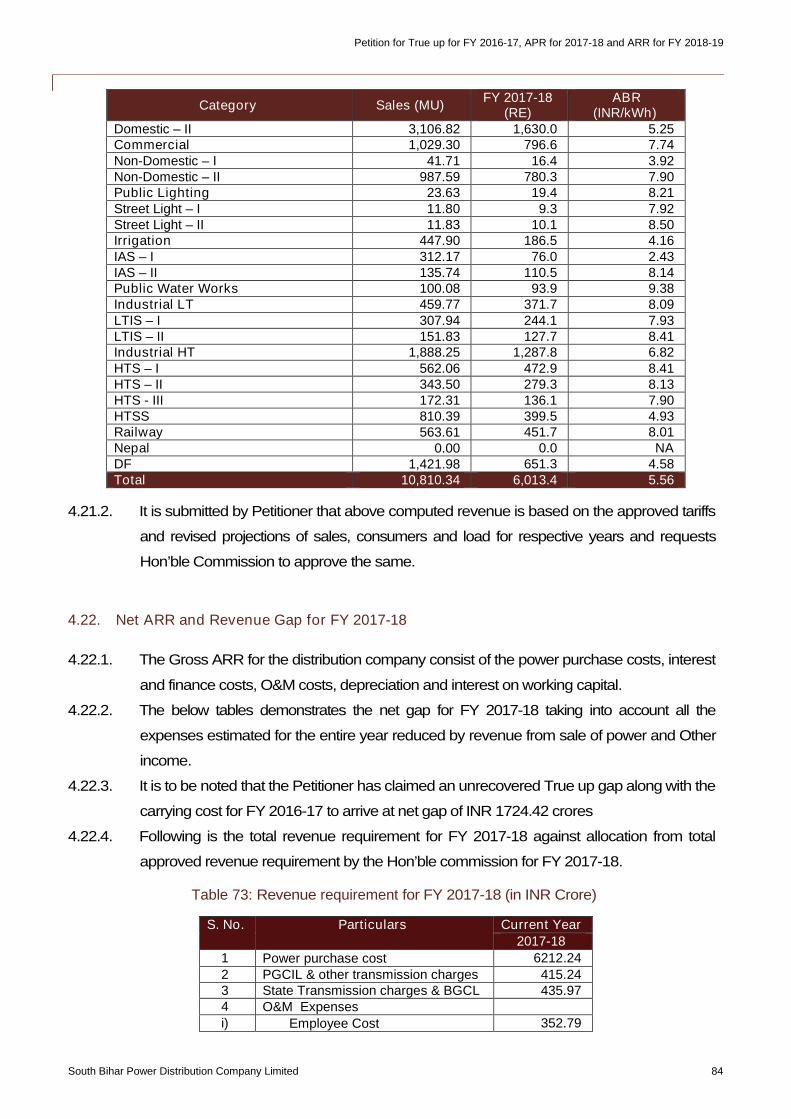
Petition for True up for FY 2016-17, APR for 2017-18 and ARR for FY 2018-19
South Bihar Power Distribution Company Limited 84
Category Sales (MU)FY 2017-18
(RE)ABR
(INR/kWh)Domestic – II 3,106.82 1,630.0 5.25Commercial 1,029.30 796.6 7.74Non-Domestic – I 41.71 16.4 3.92Non-Domestic – II 987.59 780.3 7.90Public Lighting 23.63 19.4 8.21Street Light – I 11.80 9.3 7.92Street Light – II 11.83 10.1 8.50Irrigation 447.90 186.5 4.16IAS – I 312.17 76.0 2.43IAS – II 135.74 110.5 8.14Public Water Works 100.08 93.9 9.38Industrial LT 459.77 371.7 8.09LTIS – I 307.94 244.1 7.93LTIS – II 151.83 127.7 8.41Industrial HT 1,888.25 1,287.8 6.82HTS – I 562.06 472.9 8.41HTS – II 343.50 279.3 8.13HTS - III 172.31 136.1 7.90HTSS 810.39 399.5 4.93Railway 563.61 451.7 8.01Nepal 0.00 0.0 NADF 1,421.98 651.3 4.58Total 10,810.34 6,013.4 5.56
4.21.2. It is submitted by Petitioner that above computed revenue is based on the approved tariffs
and revised projections of sales, consumers and load for respective years and requests
Hon’ble Commission to approve the same.
4.22. Net ARR and Revenue Gap for FY 2017-18
4.22.1. The Gross ARR for the distribution company consist of the power purchase costs, interest
and finance costs, O&M costs, depreciation and interest on working capital.
4.22.2. The below tables demonstrates the net gap for FY 2017-18 taking into account all the
expenses estimated for the entire year reduced by revenue from sale of power and Other
income.
4.22.3. It is to be noted that the Petitioner has claimed an unrecovered True up gap along with the
carrying cost for FY 2016-17 to arrive at net gap of INR 1724.42 crores
4.22.4. Following is the total revenue requirement for FY 2017-18 against allocation from total
approved revenue requirement by the Hon’ble commission for FY 2017-18.
Table 73: Revenue requirement for FY 2017-18 (in INR Crore)
S. No. Particulars Current Year
2017-18
1 Power purchase cost 6212.24
2 PGCIL & other transmission charges 415.243 State Transmission charges & BGCL 435.974 O&M Expensesi) Employee Cost 352.79
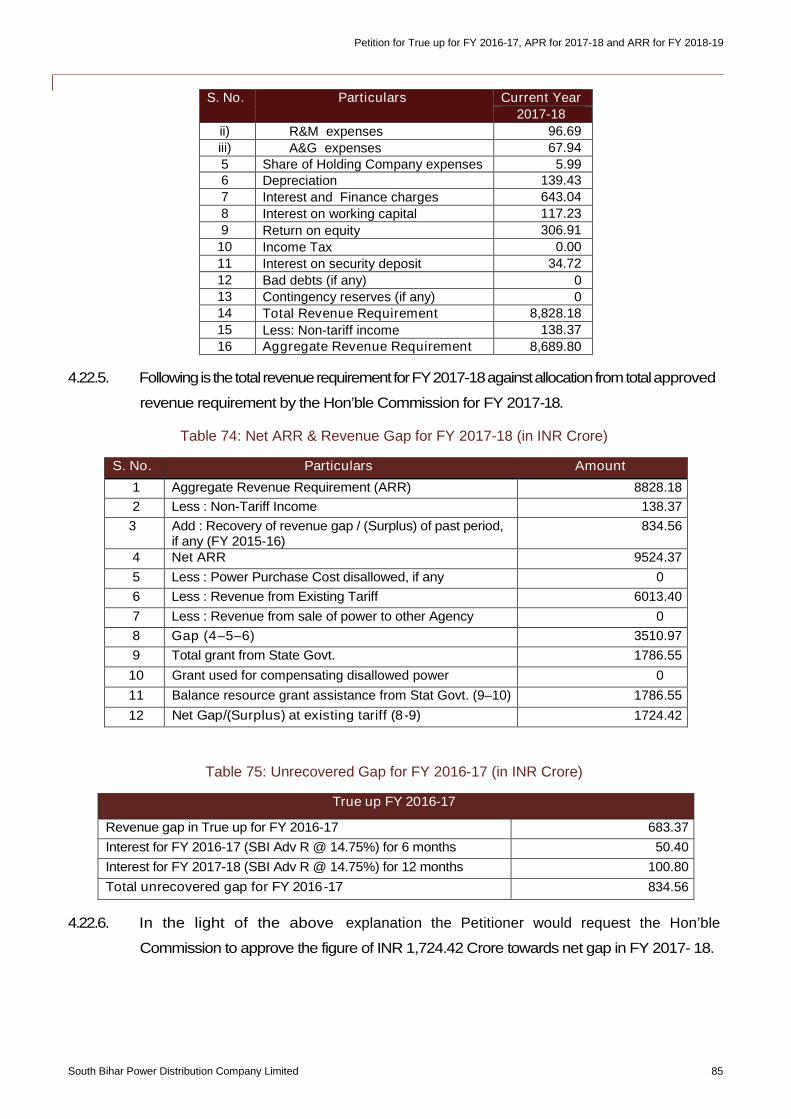
Petition for True up for FY 2016-17, APR for 2017-18 and ARR for FY 2018-19
South Bihar Power Distribution Company Limited 85
S. No. Particulars Current Year
2017-18
ii) R&M expenses 96.69
iii) A&G expenses 67.94
5 Share of Holding Company expenses 5.996 Depreciation 139.43
7 Interest and Finance charges 643.04
8 Interest on working capital 117.23
9 Return on equity 306.91
10 Income Tax 0.00
11 Interest on security deposit 34.72
12 Bad debts (if any) 013 Contingency reserves (if any) 014 Total Revenue Requirement 8,828.18
15 Less: Non-tariff income 138.37
16 Aggregate Revenue Requirement 8,689.80
4.22.5. Followingis thetotal revenuerequirementforFY2017-18againstallocationfromtotalapproved
revenue requirement by the Hon’ble Commission for FY 2017-18.
Table 74: Net ARR & Revenue Gap for FY 2017-18 (in INR Crore)
S. No. Particulars Amount
1 Aggregate Revenue Requirement (ARR) 8828.18
2 Less : Non-Tariff Income 138.37
3 Add : Recovery of revenue gap / (Surplus) of past period,if any (FY 2015-16)
834.56
4 Net ARR 9524.37
5 Less : Power Purchase Cost disallowed, if any 0
6 Less : Revenue from Existing Tariff 6013.40
7 Less : Revenue from sale of power to other Agency 0
8 Gap (4–5–6) 3510.97
9 Total grant from State Govt. 1786.55
10 Grant used for compensating disallowed power 0
11 Balance resource grant assistance from Stat Govt. (9–10) 1786.55
12 Net Gap/(Surplus) at existing tariff (8-9) 1724.42
Table 75: Unrecovered Gap for FY 2016-17 (in INR Crore)
True up FY 2016-17
Revenue gap in True up for FY 2016-17 683.37
Interest for FY 2016-17 (SBI Adv R @ 14.75%) for 6 months 50.40
Interest for FY 2017-18 (SBI Adv R @ 14.75%) for 12 months 100.80
Total unrecovered gap for FY 2016-17 834.56
4.22.6. In the light of the above explanation the Petitioner would request the Hon’ble
Commission to approve the figure of INR 1,724.42 Crore towards net gap in FY 2017- 18.
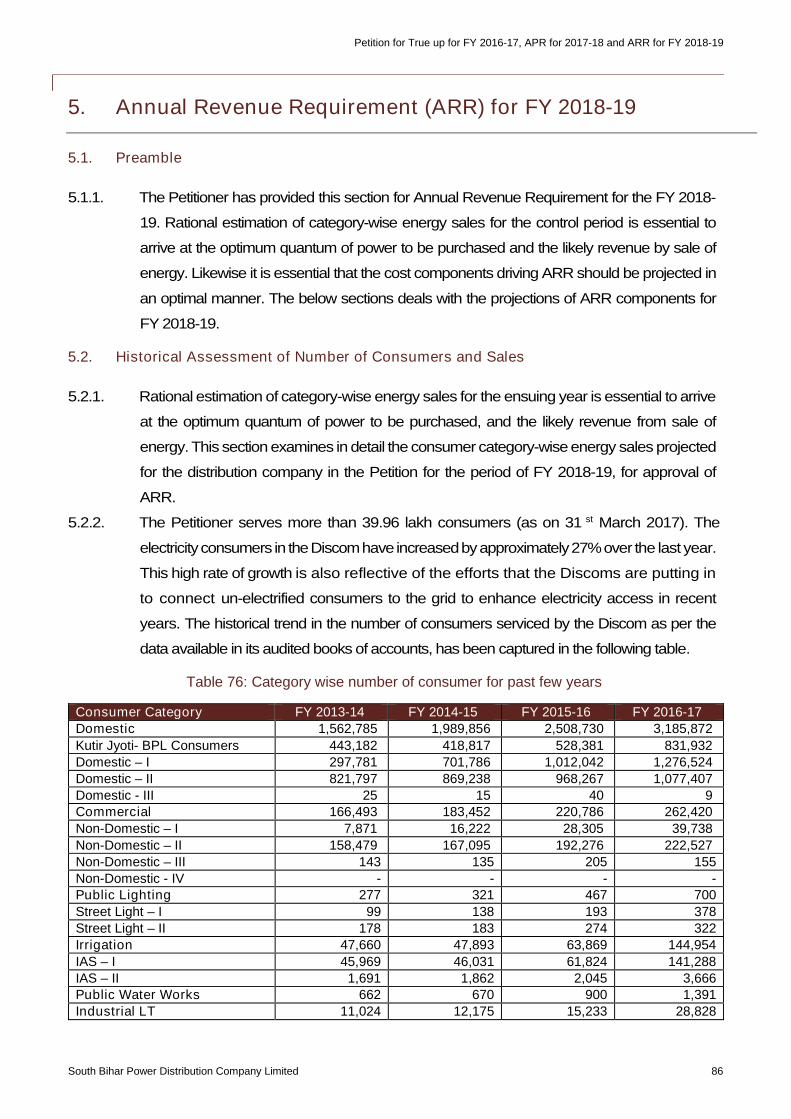
Petition for True up for FY 2016-17, APR for 2017-18 and ARR for FY 2018-19
South Bihar Power Distribution Company Limited 86
5. Annual Revenue Requirement (ARR) for FY 2018-19
5.1. Preamble
5.1.1. The Petitioner has provided this section for Annual Revenue Requirement for the FY 2018-
19. Rational estimation of category-wise energy sales for the control period is essential to
arrive at the optimum quantum of power to be purchased and the likely revenue by sale of
energy. Likewise it is essential that the cost components driving ARR should be projected in
an optimal manner. The below sections deals with the projections of ARR components for
FY 2018-19.
5.2. Historical Assessment of Number of Consumers and Sales
5.2.1. Rational estimation of category-wise energy sales for the ensuing year is essential to arrive
at the optimum quantum of power to be purchased, and the likely revenue from sale of
energy. This section examines in detail the consumer category-wise energy sales projected
for the distribution company in the Petition for the period of FY 2018-19, for approval of
ARR.
5.2.2. The Petitioner serves more than 39.96 lakh consumers (as on 31 st March 2017). The
electricityconsumers in theDiscomhave increasedbyapproximately27%over the last year.
This high rate of growth is also reflective of the efforts that the Discoms are putting in
to connect un-electrified consumers to the grid to enhance electricity access in recent
years. The historical trend in the number of consumers serviced by the Discom as per the
data available in its audited books of accounts, has been captured in the following table.
Table 76: Category wise number of consumer for past few years
Consumer Category FY 2013-14 FY 2014-15 FY 2015-16 FY 2016-17
Domestic 1,562,785 1,989,856 2,508,730 3,185,872
Kutir Jyoti- BPL Consumers 443,182 418,817 528,381 831,932
Domestic – I 297,781 701,786 1,012,042 1,276,524
Domestic – II 821,797 869,238 968,267 1,077,407
Domestic - III 25 15 40 9Commercial 166,493 183,452 220,786 262,420
Non-Domestic – I 7,871 16,222 28,305 39,738
Non-Domestic – II 158,479 167,095 192,276 222,527
Non-Domestic – III 143 135 205 155
Non-Domestic - IV - - - -Public Lighting 277 321 467 700
Street Light – I 99 138 193 378
Street Light – II 178 183 274 322
Irrigation 47,660 47,893 63,869 144,954
IAS – I 45,969 46,031 61,824 141,288
IAS – II 1,691 1,862 2,045 3,666Public Water Works 662 670 900 1,391
Industrial LT 11,024 12,175 15,233 28,828
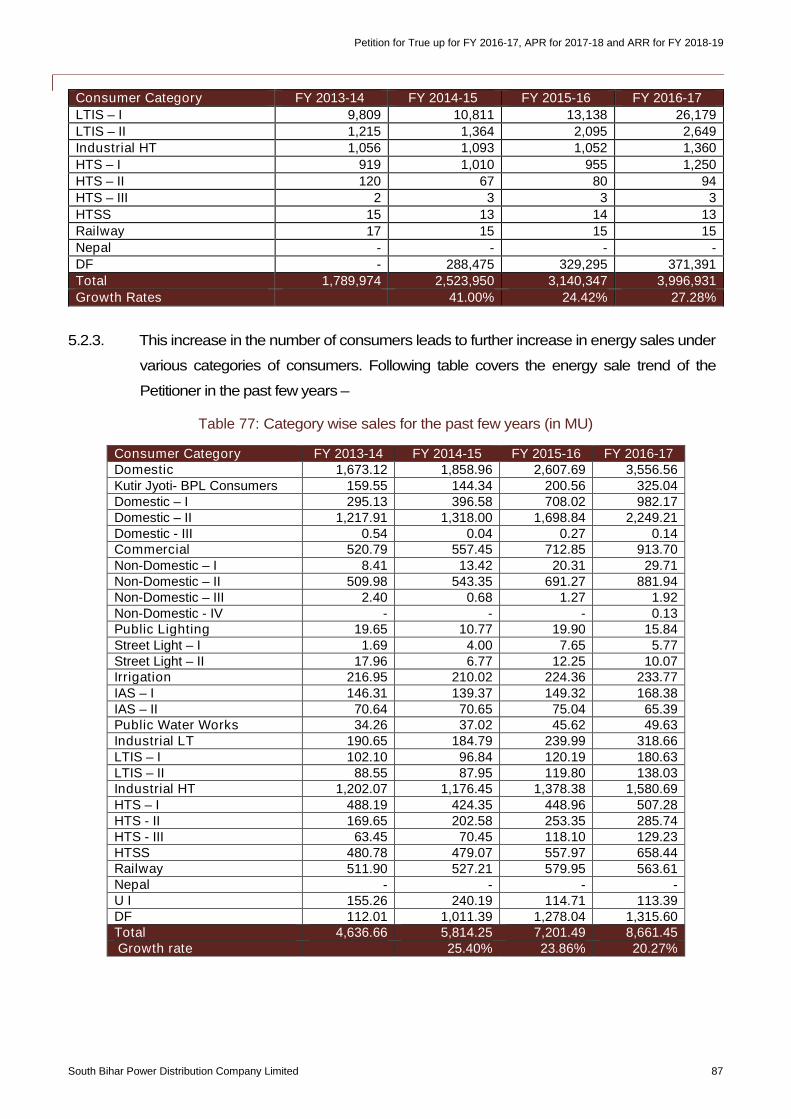
Petition for True up for FY 2016-17, APR for 2017-18 and ARR for FY 2018-19
South Bihar Power Distribution Company Limited 87
Consumer Category FY 2013-14 FY 2014-15 FY 2015-16 FY 2016-17
LTIS – I 9,809 10,811 13,138 26,179
LTIS – II 1,215 1,364 2,095 2,649Industrial HT 1,056 1,093 1,052 1,360
HTS – I 919 1,010 955 1,250
HTS – II 120 67 80 94
HTS – III 2 3 3 3
HTSS 15 13 14 13Railway 17 15 15 15Nepal - - - -DF - 288,475 329,295 371,391Total 1,789,974 2,523,950 3,140,347 3,996,931
Growth Rates 41.00% 24.42% 27.28%
5.2.3. This increase in the number of consumers leads to further increase in energy sales under
various categories of consumers. Following table covers the energy sale trend of the
Petitioner in the past few years –
Table 77: Category wise sales for the past few years (in MU)
Consumer Category FY 2013-14 FY 2014-15 FY 2015-16 FY 2016-17Domestic 1,673.12 1,858.96 2,607.69 3,556.56Kutir Jyoti- BPL Consumers 159.55 144.34 200.56 325.04Domestic – I 295.13 396.58 708.02 982.17Domestic – II 1,217.91 1,318.00 1,698.84 2,249.21Domestic - III 0.54 0.04 0.27 0.14Commercial 520.79 557.45 712.85 913.70Non-Domestic – I 8.41 13.42 20.31 29.71Non-Domestic – II 509.98 543.35 691.27 881.94Non-Domestic – III 2.40 0.68 1.27 1.92Non-Domestic - IV - - - 0.13Public Lighting 19.65 10.77 19.90 15.84Street Light – I 1.69 4.00 7.65 5.77Street Light – II 17.96 6.77 12.25 10.07Irrigation 216.95 210.02 224.36 233.77IAS – I 146.31 139.37 149.32 168.38IAS – II 70.64 70.65 75.04 65.39Public Water Works 34.26 37.02 45.62 49.63Industrial LT 190.65 184.79 239.99 318.66LTIS – I 102.10 96.84 120.19 180.63LTIS – II 88.55 87.95 119.80 138.03Industrial HT 1,202.07 1,176.45 1,378.38 1,580.69HTS – I 488.19 424.35 448.96 507.28HTS - II 169.65 202.58 253.35 285.74HTS - III 63.45 70.45 118.10 129.23HTSS 480.78 479.07 557.97 658.44Railway 511.90 527.21 579.95 563.61Nepal - - - -U I 155.26 240.19 114.71 113.39DF 112.01 1,011.39 1,278.04 1,315.60Total 4,636.66 5,814.25 7,201.49 8,661.45Growth rate 25.40% 23.86% 20.27%
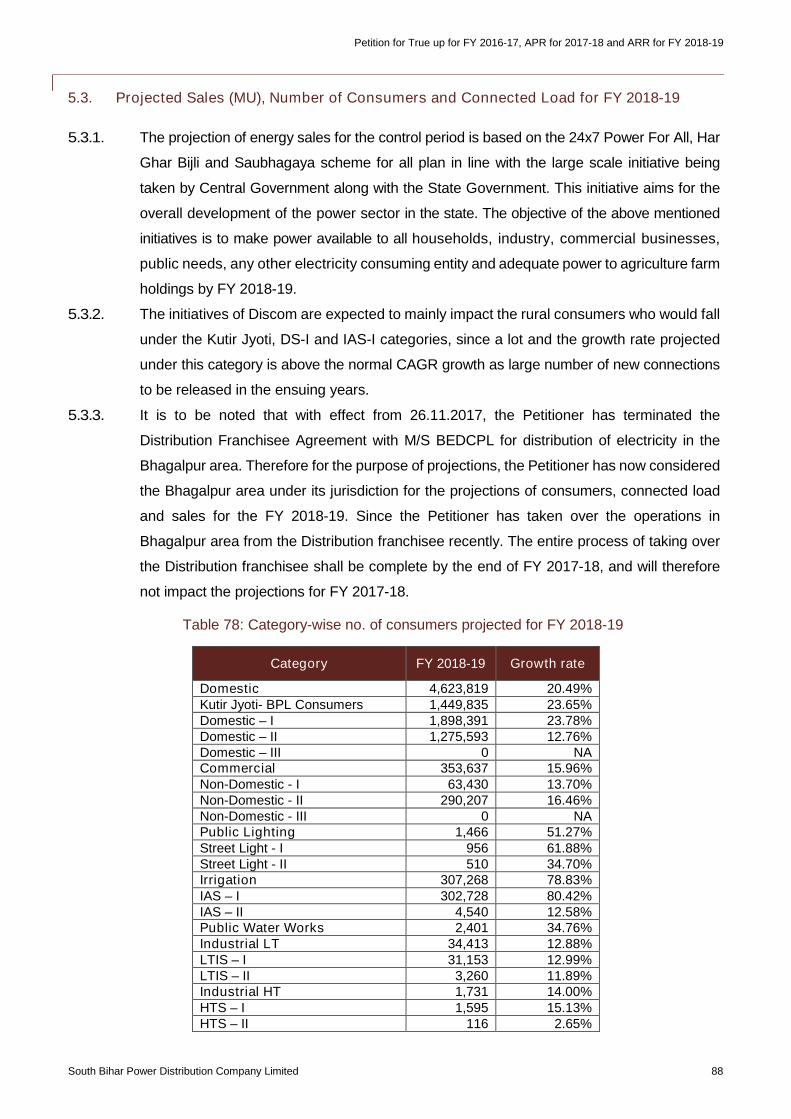
Petition for True up for FY 2016-17, APR for 2017-18 and ARR for FY 2018-19
South Bihar Power Distribution Company Limited 88
5.3. Projected Sales (MU), Number of Consumers and Connected Load for FY 2018-19
5.3.1. The projection of energy sales for the control period is based on the 24x7 Power For All, Har
Ghar Bijli and Saubhagaya scheme for all plan in line with the large scale initiative being
taken by Central Government along with the State Government. This initiative aims for the
overall development of the power sector in the state. The objective of the above mentioned
initiatives is to make power available to all households, industry, commercial businesses,
public needs, any other electricity consuming entity and adequate power to agriculture farm
holdings by FY 2018-19.
5.3.2. The initiatives of Discom are expected to mainly impact the rural consumers who would fall
under the Kutir Jyoti, DS-I and IAS-I categories, since a lot and the growth rate projected
under this category is above the normal CAGR growth as large number of new connections
to be released in the ensuing years.
5.3.3. It is to be noted that with effect from 26.11.2017, the Petitioner has terminated the
Distribution Franchisee Agreement with M/S BEDCPL for distribution of electricity in the
Bhagalpur area. Therefore for the purpose of projections, the Petitioner has now considered
the Bhagalpur area under its jurisdiction for the projections of consumers, connected load
and sales for the FY 2018-19. Since the Petitioner has taken over the operations in
Bhagalpur area from the Distribution franchisee recently. The entire process of taking over
the Distribution franchisee shall be complete by the end of FY 2017-18, and will therefore
not impact the projections for FY 2017-18.
Table 78: Category-wise no. of consumers projected for FY 2018-19
Category FY 2018-19 Growth rate
Domestic 4,623,819 20.49%Kutir Jyoti- BPL Consumers 1,449,835 23.65%Domestic – I 1,898,391 23.78%Domestic – II 1,275,593 12.76%Domestic – III 0 NACommercial 353,637 15.96%Non-Domestic - I 63,430 13.70%Non-Domestic - II 290,207 16.46%Non-Domestic - III 0 NAPublic Lighting 1,466 51.27%Street Light - I 956 61.88%Street Light - II 510 34.70%Irrigation 307,268 78.83%IAS – I 302,728 80.42%IAS – II 4,540 12.58%Public Water Works 2,401 34.76%Industrial LT 34,413 12.88%LTIS – I 31,153 12.99%LTIS – II 3,260 11.89%Industrial HT 1,731 14.00%HTS – I 1,595 15.13%HTS – II 116 2.65%
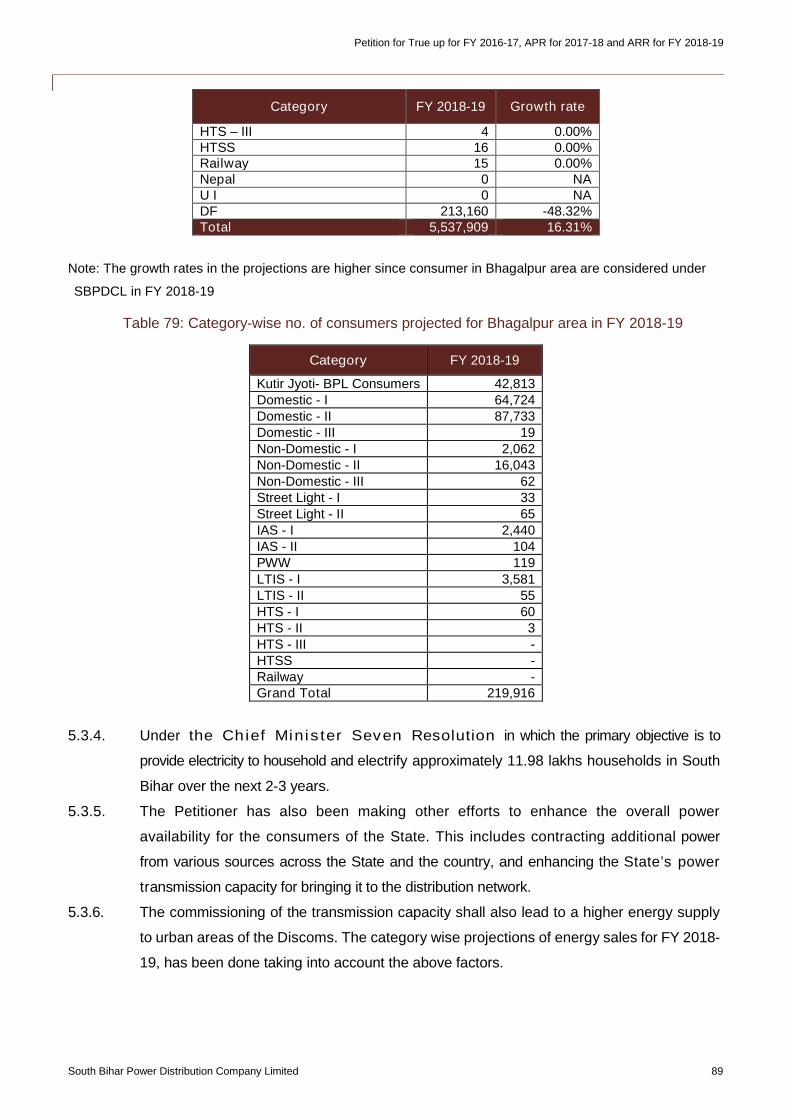
Petition for True up for FY 2016-17, APR for 2017-18 and ARR for FY 2018-19
South Bihar Power Distribution Company Limited 89
Category FY 2018-19 Growth rate
HTS – III 4 0.00%HTSS 16 0.00%Railway 15 0.00%Nepal 0 NAU I 0 NADF 213,160 -48.32%Total 5,537,909 16.31%
Note: The growth rates in the projections are higher since consumer in Bhagalpur area are considered under
SBPDCL in FY 2018-19
Table 79: Category-wise no. of consumers projected for Bhagalpur area in FY 2018-19
Category FY 2018-19
Kutir Jyoti- BPL Consumers 42,813Domestic - I 64,724Domestic - II 87,733Domestic - III 19Non-Domestic - I 2,062Non-Domestic - II 16,043Non-Domestic - III 62Street Light - I 33Street Light - II 65IAS - I 2,440IAS - II 104PWW 119LTIS - I 3,581LTIS - II 55HTS - I 60HTS - II 3HTS - III -HTSS -Railway -Grand Total 219,916
5.3.4. Under the Chief Minister Seven Resolution in which the primary objective is to
provide electricity to household and electrify approximately 11.98 lakhs households in South
Bihar over the next 2-3 years.
5.3.5. The Petitioner has also been making other efforts to enhance the overall power
availability for the consumers of the State. This includes contracting additional power
from various sources across the State and the country, and enhancing the State’s power
transmission capacity for bringing it to the distribution network.
5.3.6. The commissioning of the transmission capacity shall also lead to a higher energy supply
to urban areas of the Discoms. The category wise projections of energy sales for FY 2018-
19, has been done taking into account the above factors.
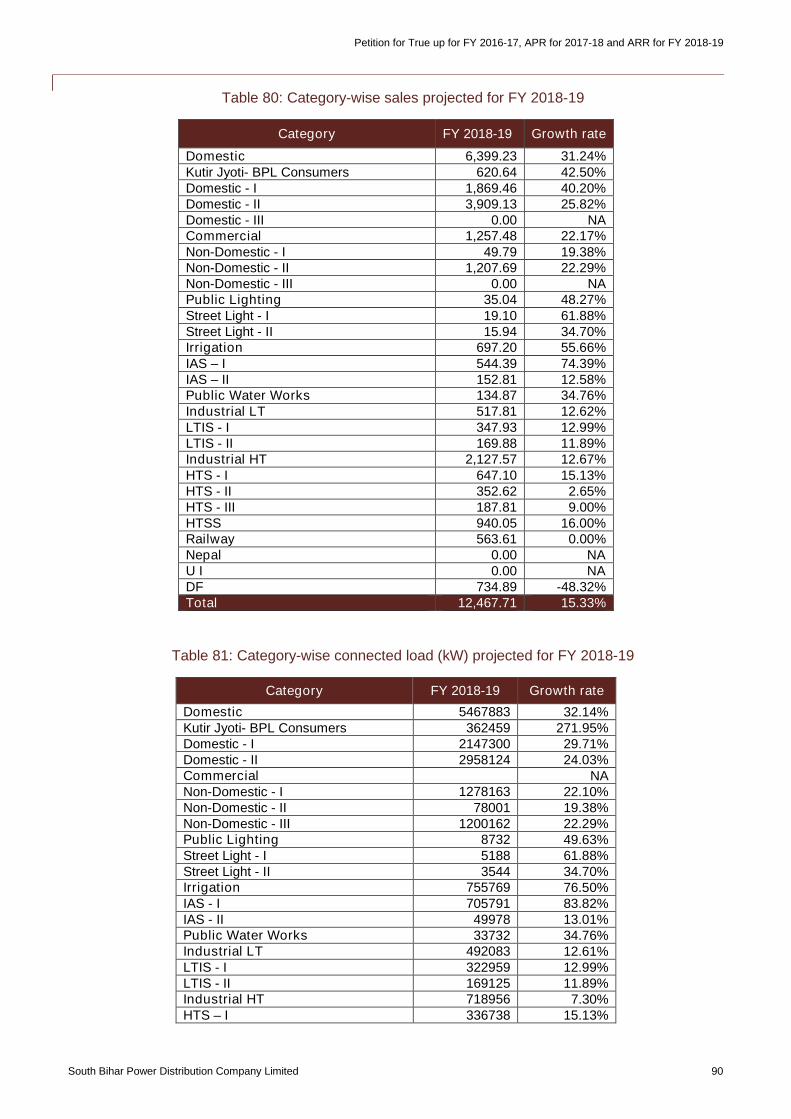
Petition for True up for FY 2016-17, APR for 2017-18 and ARR for FY 2018-19
South Bihar Power Distribution Company Limited 90
Table 80: Category-wise sales projected for FY 2018-19
Category FY 2018-19 Growth rate
Domestic 6,399.23 31.24%Kutir Jyoti- BPL Consumers 620.64 42.50%Domestic - I 1,869.46 40.20%Domestic - II 3,909.13 25.82%Domestic - III 0.00 NACommercial 1,257.48 22.17%Non-Domestic - I 49.79 19.38%Non-Domestic - II 1,207.69 22.29%Non-Domestic - III 0.00 NAPublic Lighting 35.04 48.27%Street Light - I 19.10 61.88%Street Light - II 15.94 34.70%Irrigation 697.20 55.66%IAS – I 544.39 74.39%IAS – II 152.81 12.58%Public Water Works 134.87 34.76%Industrial LT 517.81 12.62%LTIS - I 347.93 12.99%LTIS - II 169.88 11.89%Industrial HT 2,127.57 12.67%HTS - I 647.10 15.13%HTS - II 352.62 2.65%HTS - III 187.81 9.00%HTSS 940.05 16.00%Railway 563.61 0.00%Nepal 0.00 NAU I 0.00 NADF 734.89 -48.32%Total 12,467.71 15.33%
Table 81: Category-wise connected load (kW) projected for FY 2018-19
Category FY 2018-19 Growth rate
Domestic 5467883 32.14%Kutir Jyoti- BPL Consumers 362459 271.95%Domestic - I 2147300 29.71%Domestic - II 2958124 24.03%Commercial NANon-Domestic - I 1278163 22.10%Non-Domestic - II 78001 19.38%Non-Domestic - III 1200162 22.29%Public Lighting 8732 49.63%Street Light - I 5188 61.88%Street Light - II 3544 34.70%Irrigation 755769 76.50%IAS - I 705791 83.82%IAS - II 49978 13.01%Public Water Works 33732 34.76%Industrial LT 492083 12.61%LTIS - I 322959 12.99%LTIS - II 169125 11.89%Industrial HT 718956 7.30%HTS – I 336738 15.13%
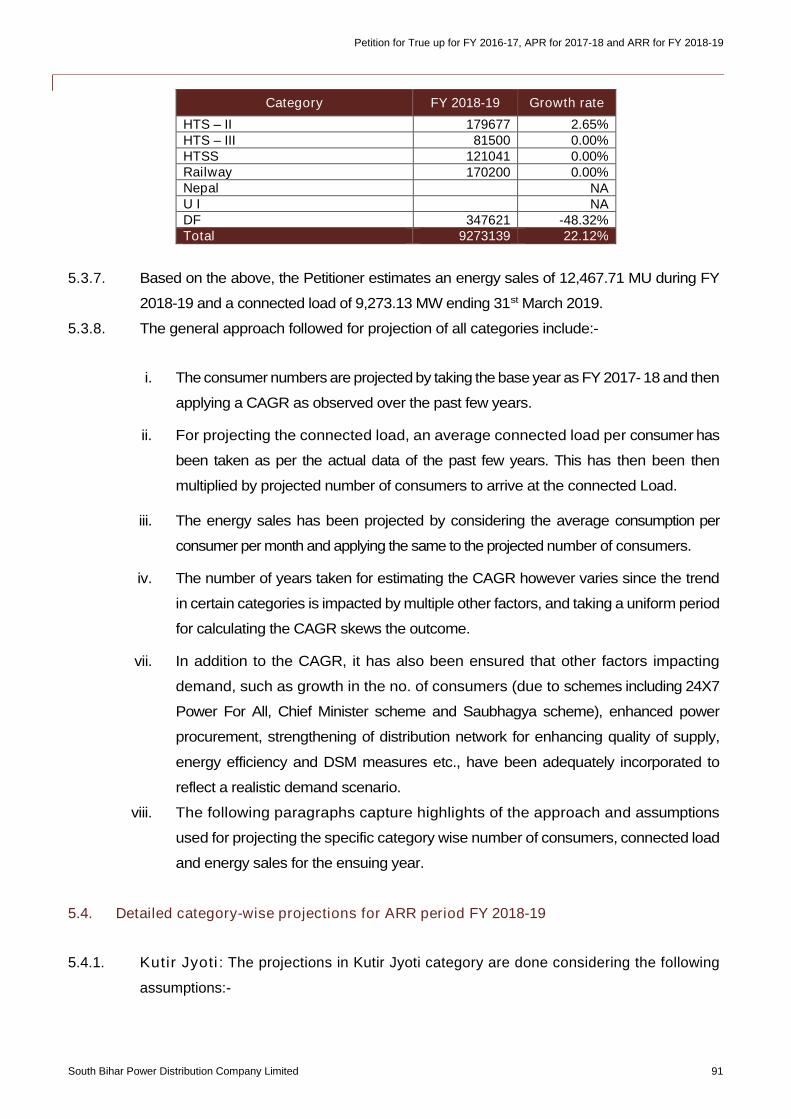
Petition for True up for FY 2016-17, APR for 2017-18 and ARR for FY 2018-19
South Bihar Power Distribution Company Limited 91
Category FY 2018-19 Growth rate
HTS – II 179677 2.65%HTS – III 81500 0.00%HTSS 121041 0.00%Railway 170200 0.00%Nepal NAU I NADF 347621 -48.32%Total 9273139 22.12%
5.3.7. Based on the above, the Petitioner estimates an energy sales of 12,467.71 MU during FY
2018-19 and a connected load of 9,273.13 MW ending 31st March 2019.
5.3.8. The general approach followed for projection of all categories include:-
i. The consumer numbers are projected by taking the base year as FY 2017- 18 and then
applying a CAGR as observed over the past few years.
ii. For projecting the connected load, an average connected load per consumer has
been taken as per the actual data of the past few years. This has then been then
multiplied by projected number of consumers to arrive at the connected Load.
iii. The energy sales has been projected by considering the average consumption per
consumer per month and applying the same to the projected number of consumers.
iv. The number of years taken for estimating the CAGR however varies since the trend
in certain categories is impacted by multiple other factors, and taking a uniform period
for calculating the CAGR skews the outcome.
vii. In addition to the CAGR, it has also been ensured that other factors impacting
demand, such as growth in the no. of consumers (due to schemes including 24X7
Power For All, Chief Minister scheme and Saubhagya scheme), enhanced power
procurement, strengthening of distribution network for enhancing quality of supply,
energy efficiency and DSM measures etc., have been adequately incorporated to
reflect a realistic demand scenario.
viii. The following paragraphs capture highlights of the approach and assumptions
used for projecting the specific category wise number of consumers, connected load
and energy sales for the ensuing year.
5.4. Detailed category-wise projections for ARR period FY 2018-19
5.4.1. Kutir Jyoti: The projections in Kutir Jyoti category are done considering the following
assumptions:-
Petition for True up for FY 2016-17, APR for 2017-18 and ARR for FY 2018-19
South Bihar Power Distribution Company Limited 92
i. Consumers: There is a major drive to enhance access to electricity in the State, and the
majority of the new potential consumers would fall under Kutir Jyoti, DS-I and IAS-I
categories. The Petitioner In line with all schemes, has estimated a growth rate of 23.7% for
the consumers in this category. In FY 2018-19, it is estimated that approximately 2.77 lakh
KJ consumers would be added by the Petitioner.
ii. Connected Load: The connected Load for this category is projected considering average
Load per consumer at 250 W and multiplying it by number of consumers to arrive at
the connected Load.
iii. Units sold: As a result of the addition of 2.27 lakhs consumers in this category,
including new connections and existing consumers of Bhagalpur, the consumption
and units sold are expected to increase at a higher rate as compared to the historical
CAGR. The Petitioner has considered an average monthly consumption of 37 kWh per
consumer per month and multiplying with total number of consumers projected in this
category for FY 2018-19 to arrive at an estimated sales figure. The overall growth rate
for sales in this category is 31.24% over FY 2017-18.
5.4.2. Domestic Service I: The projections in DS I category are done considering the following
assumptions:-
i. Consumers: A survey was also conducted to identify that number of APL households
to be electrified. It is estimated that approximately 32.98 lakh consumers need to
be electrified by the end of FY 2018-19. In order to reflect the realistic scenario in
the process of determining ARR for FY 2018-19, the Petitioner has considered 3.64
lakh consumers to be added to this category, including new connections and
projected consumers of Bhagalpur, in the FY 2018-19
ii. Connected Load: The overall connected load for this category has been projected
considering 5% escalation on the average connected load per consumer for FY 2017-
18 and multiplying it by the projected number of consumers fur FY 2018-19.
iii. Units sold: The sales in this category are projected considering 5% growth rate in
average consumption per consumer per month in FY 2017-18 and multiplying with
total number of consumers projected in this category for FY 2018-19. The overall growth
rate for sales in this category is 40.20 % over FY 2017-18.
5.4.3. Domestic Service II: The projections in DS II category are done considering the following
assumptions:-
i. Consumers: The number of consumers in this category are projected by considering
Petition for True up for FY 2016-17, APR for 2017-18 and ARR for FY 2018-19
South Bihar Power Distribution Company Limited 93
the growth rate of 5% on the total number of consumers projected in this category for FY
2017-18, and adding projected consumers of Bhagalpur for FY 2018-19 thereby directly
impacting energy sales.
ii. Connected Load: The connected load for this category is projected considering 10%
growth rate on the average load per consumer for FY 2017-18 and multiplying it by the
number of consumers.
iii. Units sold: The sales in this category are projected considering 10% growth rate in
average consumption per consumer per month in FY 2017-18, and multiplying with total
number of consumers projected in this category for FY 2018-19. The overall growth rate
for sales in this category is 18.7 % over FY 2017-18.
5.4.4. Non-Domestic Service I: The projections in NDS-I category are done considering the
following assumptions:-
i. Consumers: The number of consumers is projected considering a growth rate of 10%
on the number of consumers ending FY 2017-18. Although the historical trend shows
that there has been an accelerated growth in the number of consumers, the
Petitioner has considered a growth rate of 10 % on the total number of consumers
projected in this category for FY 2017-18, and adding projected consumers of Bhagalpur
for FY 2018-19, since there are not many significant consumers left un-electrified in
this sub-category.
ii. Connected Load: Similarly, for projecting the connected load, the Petitioner has
moved away from the historical erratic and high rate of growth and adopted a nominal
growth rate of 5% on average load per consumer in FY 2017-18, which comes to 1.23
kW and multiplying them with consumers projected in this category
iii. Units sold: The sales have therefore been projected by considering 5% growth on
the average consumption per consumer per month same as FY 2016-17 and
multiplying with total number of consumers projected in this category for FY 2018-
19. The overall growth rate for sales in this category is 19.38% over FY 2017-18.
5.4.5. Non-Domestic Service II: The projections in NDS-II category are done considering the
following assumptions:-
i. Consumers: The number of consumers are projected taking a growth rate of 10% on
the number of consumers ending FY 2017-18, and adding projected consumers of
Bhagalpur for FY 2018-19. Although the historical trend shows that there has been an
accelerated growth in the number of consumers, the Petitioner has considered a
growth rate of 10% since there are not many significant consumers left un-electrified
Petition for True up for FY 2016-17, APR for 2017-18 and ARR for FY 2018-19
South Bihar Power Distribution Company Limited 94
in this sub-category.
ii. Connected Load: For projecting connected Load in NDS-II category growth rate of
5% percent growth rate is assumed on average load per consumer in FY 2017-18 and
multiplied with total number of consumers to project the connected Load for FY 2018-
19.
iii. Units sold: The sales for NDS-II is projected considering 5% growth rate on
average consumption per consumer per month for FY 2016-17. The average
consumption per month per consumer is then multiplied by number of consumers
projected for FY 2018-19. The overall growth rate for sales in this category is 22.29 %
over FY 2017-18.
5.4.6. SS-I: The projections in SS-I category are done considering the following assumptions:-
i. Consumers: This is the metered category provided for the Street Light Supply
category and the trend of number of consumers in this sub-category is quite uneven.
The 3 year CAGR comes to approximately 56% on the total number of consumers
projected in this category for FY 2017-18, and adding projected consumers of
Bhagalpur for FY 2018-19.
ii. Connected Load: The Petitioner has made efforts towards Demand Side
Management (DSM) by replacement of 150W lamps with 40-50W sodium vapour
lamps which has reduced the average connected load per consumer drastically in
FY 2016-17. Therefore, Petitioner has considered average connected load per
consumer for FY 2018-19 same as for FY 2016-17.
iii. Units sold: Units sold in this category are projected considering 0% escalation on
average consumption per consumer per month for FY 2016-17 and multiplying with
consumers projected in this category forFY 2018-19. The overall growth rate for sales in
this category is 61.88 % over FY 2017-18.
5.4.7. SS-II: The projections in SS-II category are done considering the following assumptions:
i. Consumers: In this category Petitioner has assumed 1 year CAGR growth rate
i.e 17.52% on the total number of consumers projected in this category for FY 2017-
18, and adding projected consumers of Bhagalpur for FY 2018-19.
ii. Connected Load: The average Load in this category is calculated by considering
0% growth rate on average Load per consumer for FY 2016-17 and multiplying by
number of consumers projected in this category.
Petition for True up for FY 2016-17, APR for 2017-18 and ARR for FY 2018-19
South Bihar Power Distribution Company Limited 95
iii. Units sold: Units sold are projected based of average consumption per consumer
per month for FY 2016-17. The average consumption per consumer is multiplied by the
consumers to arrive at units sold for FY 2018-19. The overall growth rate for sales in
this category is 34.70 % over FY 2017-18. In the Street Lights category the process
is going on for replacement of 150W lamps with 40-50W Sodium vapour lamps which
shall possibly reduce the units consumed in Street Lights category.
5.4.8. IAS-I: The projections in IAS-I category are done considering the following assumptions:-
i. Consumers: The State has been taking major steps to ensure that a significant
portion of the agriculture pump-sets that are currently operating on Diesel
Gensets are converted to operate on grid connected electricity. Currently,
approximately 11 lakh pump-sets are operating in Bihar. As a resultant, the
consumers in this sub-category are increasing beyond the normal CAGR due to the
addition of approximately 1.32 lakh new connection and projected consumers of
Bhagalpur in FY 2018-19.
ii. Connected Load: The connected Load for FY 2018-19 is projected considering 1
year CAGR growth rate (1.88 %) on average load per consumer for FY 2017-18 and
multiplying with number of consumers projected in this category for FY 2018-19.
iii. Units sold: The units sold for IAS I category is projected considering and average
consumption of 155.04 kWh per consumer per month, which is the average
consumption per consumer per month during the first half of FY 2016-17.The
Petitioner has considered only 3 months consumption of 10% new connections
to be added in FY 2018-19, since most of the connections will be released
during the last quarter of FY 2018-19. The overall growth rate for sales in this
category is above 74 % over FY 2017-18. The high growth rate is due to the addition
of new consumers to the electricity grid directly impacting the sales in this category.
The Petitioner has shown a growth rate of 129% on consumers in FY 2016-17.
Agriculture feeder separation is under process, once it is done separate
transformers will be issued connecting to pump sets. PromotionofSolarPumpsets
will be done to reduce demand. Currently 11 lakh pump sets are operating in Bihar.
5.4.9. IAS- II: The projections in IAS-II category are done considering the following assumptions:-
i. Consumers: There is a constant growth around 30% every year in the consumers of
Petition for True up for FY 2016-17, APR for 2017-18 and ARR for FY 2018-19
South Bihar Power Distribution Company Limited 96
IAS II category. So. The Petitioner has considered a nominal growth rate of 10%
on the total number of consumers projected in this category for FY 2017-18, and adding
projected consumers of Bhagalpur for FY 2018-19 for this category.
ii. Connected Load: The connected Load for FY 2018-19 is projected considering 1
year CAGR growth rate (0.39 %) on average load per consumer for FY 2017-18 and
multiplying with number of consumers projected in this category for FY 2018-19.
iii. Units sold: The units sold is IAS II category are projected considering same average
consumption perconsumer permonth as in FY 2016-17 for FY 2018-19 considering 0%
growth rate and multiplying with the total number of consumers projected in this
category. The overall growth rate for sales in this category is 12.58 % over FY 2017-
18.
5.4.10. Public waterworks: The projections in PWW category are done considering the following
assumptions:-
i. Consumers: The Petitioner has considered 3 year CAGR growth rate (28.08%)
on the total number of consumers projected in this category for FY 2017-18, and adding
projected consumers of Bhagalpur for FY 2018-19.
ii. Connected Load: The Load is projected by calculating average load per consumer
and multiplying by the number of consumers projected for FY 2017-18.
iii. Units sold: The units sold in this category is projected by considering average
consumption per consumer per month same as in FY 2016-17 and multiplying the
same with number of consumers projected for FY 2018-19. The overall growth rate
for sales in this category is 34.76 % over FY 2017-18.
5.4.11. LTIS-I: The projections in LTIS-I category are done considering the following assumptions:-
i. Consumers: While projecting the number of consumers in this category, growth
rate of 0% is assumed on the total number of consumers projected in this category
for FY 2017-18, and adding projected consumers of Bhagalpur for FY 2018-19 .
ii. Connected Load: The connected Load is projected considering average Load per
consumer in FY 2016-17 for projecting average Load for FY 2018-19 and multiplying
the same with the total number of consumers.
iii. Units sold: The units sold in this category is projected by considering average
consumption per consumer per months in FY 2016-17 and multiplying the same with
number of consumers. The overall growth rate for sales in this category is 12.99 %
Petition for True up for FY 2016-17, APR for 2017-18 and ARR for FY 2018-19
South Bihar Power Distribution Company Limited 97
over FY 2017-18.
5.4.12. LTIS-II: The projections in LTIS-II category are done considering the following assumptions:-
i. Consumers: While projecting the number of consumers in this category, The
Petitioner has considered a nominal 10% growth rate on the total number of
consumers projected in this category for FY 2017-18, and adding projected consumers
of Bhagalpur for FY 2018-19, The Petitioner has assumed 10% from realistic point of
view, though the average growth rate in this category is around 30%.
ii. Connected Load: The connected load for FY 2018-19 for this category is
projected by considering average load per consumer same as in FY 2016-17 and
multiplying it with the total number of consumers.
iii. Units sold: The units sold in this category is projected by considering average
consumption per consumer per month same as in FY 2016-17 and multiplying the
same with number of consumers projected for FY 2018-19. As the growth in the
consumption was negative in past years therefore, no growth rate is assumed while
calculating average consumption per consumer per month. The overall growth rate
for sales in this category is 11.89 % over FY 2017-18.
5.4.13. HTS-I: The projections in HTS-I category are done considering the following assumptions:-
i. Consumers: Recently the Discoms have seen an increasing trend in the addition
of consumers in the HTS-I category, including both conversions from the LTIS
categories and addition of new consumers. While projecting the number of
consumers in this category growth rate of 10.8 % growth rate which is based on 1
year CAGR on the total number of consumers projected in this category for FY 2017-
18, and adding projected consumers of Bhagalpur for FY 2018-19.
ii. Connected Load: The connected Load in this category is projected by taking average
Load per consumer for FY 2016-17 and multiplying it by number of consumers
projected for FY 2018-19.
iii. Units sold: The units sold in this category is calculated on the basis of average
consumption per consumer per month in FY 2017-18 and multiplying by consumers
projected for FY 2018-19. The overall growth rate for sales in this category is 15.13
% over FY 2017-18.
5.4.14. HTS-II: The projections in HTS-II category are done considering the following assumptions:-
Petition for True up for FY 2016-17, APR for 2017-18 and ARR for FY 2018-19
South Bihar Power Distribution Company Limited 98
i. Consumers: Recently the Discoms have seen an increasing trend in the addition
of consumers in the HTS-II category, including both conversions from the LTIS
categories and addition of new consumers. The Petitioner has shown a growth
rate of approximately 20% in the first six months ( i.e up to September 2017) of
FY 2017-18. The Petitioner has considered 0 % growth rate on the total number of
consumers projected in this category for FY 2017-18, and adding projected consumers
of Bhagalpur for FY 2018-19 while projecting the number of consumers in this
category.
ii. Connected Load: The connected Load in this category is projected by taking average
Load per consumer for FY 2016-17 and multiplying it by number of consumers
projected for FY 2018-19.
iii. Units sold: The units sold in this category is calculated on the basis of average
consumption per consumer per month in FY 2017-18 and multiplied by consumers
projected for FY 2018-19. The overall growth rate for sales in this category is 2.65 %
over FY 2017-18.
5.4.15. HTS-III: The projections in HTS-III category are done considering the following assumptions:-
i. Consumers: The Petitioner has not assumed any growth rate on the total number of
consumers projected in this category for FY 2017-18, and added projected consumers
of Bhagalpur for FY 2018-19 during the projections for FY 2018-19.
ii. Connected Load: The connected Load in this category is projected by taking average
Load per consumer for FY 2016-17 and multiplying it by number of consumers
projected for FY 2018-19.
iii. Units sold: The units sold in this category is calculated assuming 9% growth rate
(Slightly lower than 1 year CAGR i.e 9.34%) on average consumption per consumer
per month for FY 2017-18 and multiplying the same by consumers projected for
FY 2018-19. The overall growth rate for sales in this category is 9 % over FY 2017-
18.
5.4.16. HTSS: The projections in HTSS category are done considering the following assumptions:-
i. Consumers: The Petitioner has not assumed any growth rate during the projections
for FY 2018-19..
ii. Connected Load: The connected Load in this category is projected by taking average
Load per consumer for FY 2016-17 and multiplying it by number of consumers
projected for FY 2018-19
Petition for True up for FY 2016-17, APR for 2017-18 and ARR for FY 2018-19
South Bihar Power Distribution Company Limited 99
iii. Units sold: The units sold in this category is calculated on the basis of average
consumption per consumer per month for FY 2016-17 and multiplying the same by
consumers projected for FY 2018-19. The overall growth rate for sales in this
category is 0 % over FY 2017-18.
5.4.17. Railways: The projections in RTS category are done considering the following assumptions:-
i. Consumers: There has been no growth rate assumed in the railways category for
projecting number of consumers. The number of consumers are considered as 15
which is equivalent to last year.
ii. Connected Load: Seeing the past trend in connected Load, no growth rate is
assumed in railways category
iii. Units sold: The Petitioner has not assumed any growth rate in railways category.
The overall growth rate for sales in this category is 0 % over FY 2017-18.
5.4.18. DF: While projecting sales and consumers for DF, 5 % growth rate for consumers and an
average consumption per consumer at 287.3 kWh is assumed on last year figure i.e.
projections for FY 2017-18. The overall growth rate for sales in this category is negative
since the Petitioner has taken over operations in Bhagalpur area
5.5. Distribution Loss
5.5.1. Emphasizing on the commitment to reform themselves by achieving a financial and
operational turnaround, the Government of Bihar and the two Distribution Companies
have signed a tripartite Memorandum of Understanding (MoU) of Ujwal Discom Assurance
Yojana (UDAY) with the Ministry of Power, Government of India on 22nd February, 2016.
This combined with other initiatives that the State Government and the Discoms are
taking, are targeted to achieve the following vision for the State of Bihar.
5.5.2. Ensuring 24X7 Power For All by 2019: A detailed action plan to achieve the vision of
providing electricity access to all Households in the State has been prepared by the state.
The aim is to achieve 24X7 availability of reliable power to all households, industrial,
commercial establishments and all other electricity consuming entities by FY19.
5.5.3. 100% village electrification in thousand days: The State has electrified
substantial no. of villages during 2015-16 and has been at top in the Country. As against
total 3056 no. of villages to be electrified as on 31st March,2015, 1686 no. of villages were
electrified during 2015-16 and the remaining 1370 nos. of villages is expected to be
electrified by March,2017. Further, the average existing supply of 12-16 hours a day in rural
areas has been planned to be increased to 24 hours. The advent of DDUGJY scheme, where
Petition for True up for FY 2016-17, APR for 2017-18 and ARR for FY 2018-19
South Bihar Power Distribution Company Limited 100
segregation of rural feeders is one of the objectives, is expected to significantly improve the
electricity access in villages.
5.5.4. Self-sufficiency in power and development of Bihar as power hub: To meet the
burgeoning power demand and considering the existing tied up capacity, the State has
planned to enhance its own generation Capacity as well tie-ups with other central
generating stations and Independent Power Producers (IPPs). The endowed coal resources
provide a promising opportunity for State to not only become self-sufficient but also to
become the power hub for the country. Further, the development of a robust transmission
system to form the back-bone has been planned.
5.5.5. Reducing AT&C losses to below 15%: Along with achieving the multiple
objectives such as enhancing the reach, reliability and quality of electricity, Petitioner
has endeavoured to bring down AT&C losses to below 15% by FY19. Several focused
interventions at all levels are being undertaken, including metering of feeders, distribution
transformers and consumers, improving and augmenting existing sub-transmission and
distribution infrastructure, enhancing revenue collection initiatives and ensuring consumer
satisfaction.
5.5.6. Reducing the gap between ACS and ARR to zero: As a foremost step towards building
a financially sustainability, the state is initiating several steps to bring down the wide gap
between Average Cost of Supply (ACS) and Average Revenue Realized (ARR).
Historically, the retail tariff for electricity in Bihar has been one of the lowest in the Country
and has remained non-reflective of the actual costs. The utility’s comprehensive plan to reduce
AT&C losses, improve billing and collection efficiency coupled with realistic tariff increase and
rationalizations to cover the costs sufficiently are key to ensuring financial viability of the sector.
5.5.7. The UDAY MoU and the corresponding action plan, which are targeted to specifically
address operational inefficiency as well, set out a clear performance improvement
roadmap, setting specific key performance targets. This would include taking multiple
initiatives towards the goals:
5.5.8. Increasing Billing Efficiency:
a. Automatic Meter Reading of Industrial Consumers
b. Metering including prepaid/ Smart Meter
c. Web based Spot Billing through Mobile
d. Image of Meter Reading on Bill
e. Consumer Indexing & GIS Mapping
f. Input Based Franchisee
g. Frequent raids and inspection of consumer premises to prevent power theft.
h. 100% feeder metering
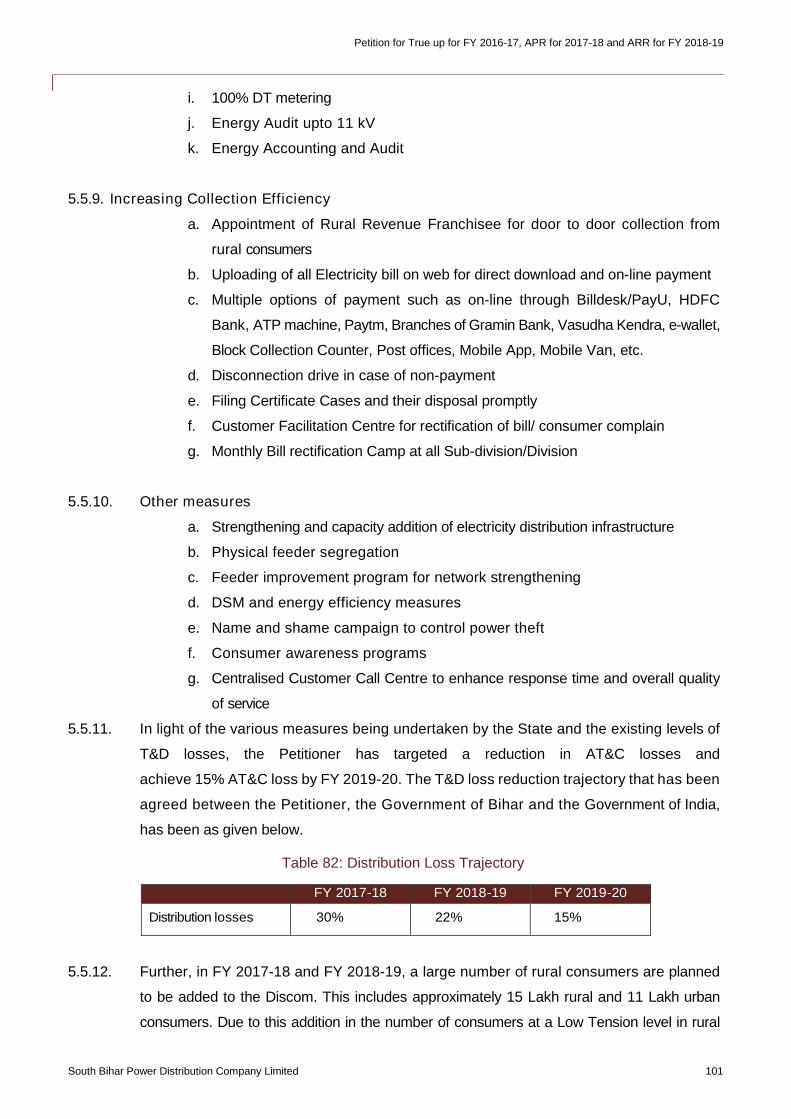
Petition for True up for FY 2016-17, APR for 2017-18 and ARR for FY 2018-19
South Bihar Power Distribution Company Limited 101
i. 100% DT metering
j. Energy Audit upto 11 kV
k. Energy Accounting and Audit
5.5.9. Increasing Collection Efficiency
a. Appointment of Rural Revenue Franchisee for door to door collection from
rural consumers
b. Uploading of all Electricity bill on web for direct download and on-line payment
c. Multiple options of payment such as on-line through Billdesk/PayU, HDFC
Bank, ATP machine, Paytm, Branches of Gramin Bank, Vasudha Kendra, e-wallet,
Block Collection Counter, Post offices, Mobile App, Mobile Van, etc.
d. Disconnection drive in case of non-payment
e. Filing Certificate Cases and their disposal promptly
f. Customer Facilitation Centre for rectification of bill/ consumer complain
g. Monthly Bill rectification Camp at all Sub-division/Division
5.5.10. Other measures
a. Strengthening and capacity addition of electricity distribution infrastructure
b. Physical feeder segregation
c. Feeder improvement program for network strengthening
d. DSM and energy efficiency measures
e. Name and shame campaign to control power theft
f. Consumer awareness programs
g. Centralised Customer Call Centre to enhance response time and overall quality
of service
5.5.11. In light of the various measures being undertaken by the State and the existing levels of
T&D losses, the Petitioner has targeted a reduction in AT&C losses and
achieve 15% AT&C loss by FY 2019-20. The T&D loss reduction trajectory that has been
agreed between the Petitioner, the Government of Bihar and the Government of India,
has been as given below.
Table 82: Distribution Loss Trajectory
FY 2017-18 FY 2018-19 FY 2019-20
Distribution losses 30% 22% 15%
5.5.12. Further, in FY 2017-18 and FY 2018-19, a large number of rural consumers are planned
to be added to the Discom. This includes approximately 15 Lakh rural and 11 Lakh urban
consumers. Due to this addition in the number of consumers at a Low Tension level in rural
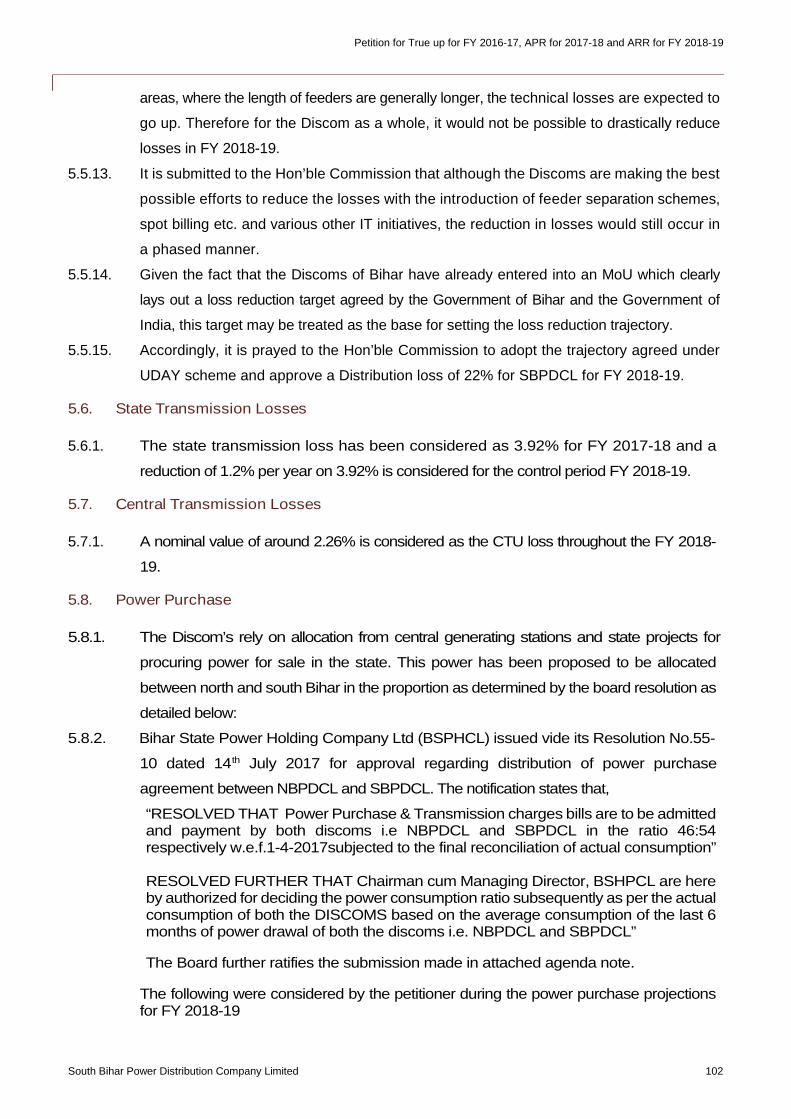
Petition for True up for FY 2016-17, APR for 2017-18 and ARR for FY 2018-19
South Bihar Power Distribution Company Limited 102
areas, where the length of feeders are generally longer, the technical losses are expected to
go up. Therefore for the Discom as a whole, it would not be possible to drastically reduce
losses in FY 2018-19.
5.5.13. It is submitted to the Hon’ble Commission that although the Discoms are making the best
possible efforts to reduce the losses with the introduction of feeder separation schemes,
spot billing etc. and various other IT initiatives, the reduction in losses would still occur in
a phased manner.
5.5.14. Given the fact that the Discoms of Bihar have already entered into an MoU which clearly
lays out a loss reduction target agreed by the Government of Bihar and the Government of
India, this target may be treated as the base for setting the loss reduction trajectory.
5.5.15. Accordingly, it is prayed to the Hon’ble Commission to adopt the trajectory agreed under
UDAY scheme and approve a Distribution loss of 22% for SBPDCL for FY 2018-19.
5.6. State Transmission Losses
5.6.1. The state transmission loss has been considered as 3.92% for FY 2017-18 and a
reduction of 1.2% per year on 3.92% is considered for the control period FY 2018-19.
5.7. Central Transmission Losses
5.7.1. A nominal value of around 2.26% is considered as the CTU loss throughout the FY 2018-
19.
5.8. Power Purchase
5.8.1. The Discom’s rely on allocation from central generating stations and state projects for
procuring power for sale in the state. This power has been proposed to be allocated
between north and south Bihar in the proportion as determined by the board resolution as
detailed below:
5.8.2. Bihar State Power Holding Company Ltd (BSPHCL) issued vide its Resolution No.55-
10 dated 14th July 2017 for approval regarding distribution of power purchase
agreement between NBPDCL and SBPDCL. The notification states that,
“RESOLVED THAT Power Purchase & Transmission charges bills are to be admittedand payment by both discoms i.e NBPDCL and SBPDCL in the ratio 46:54respectively w.e.f.1-4-2017subjected to the final reconciliation of actual consumption”
RESOLVED FURTHER THAT Chairman cum Managing Director, BSHPCL are hereby authorized for deciding the power consumption ratio subsequently as per the actualconsumption of both the DISCOMS based on the average consumption of the last 6months of power drawal of both the discoms i.e. NBPDCL and SBPDCL”
The Board further ratifies the submission made in attached agenda note.
The following were considered by the petitioner during the power purchase projectionsfor FY 2018-19
Petition for True up for FY 2016-17, APR for 2017-18 and ARR for FY 2018-19
South Bihar Power Distribution Company Limited 103
i. Barh Stage I, Unit II has been considered to be available from January of FY 2018-
19.
ii. Nabinagar Stage I has been considered to be available in February 2019
iii. Nabinagar Railway project has been considered that 25MW from Unit III will be available
in July 2018 and then subsequently 25MW from other Unit will be available from
January 2019.
5.8.3. Petitioner has attached a table summarizing month wise power purchase capacity for Bihar
for FY 2018-19 in the annexure B.6.
5.8.4. Petitioner has also attached the Plant Load Factors considered for FY 2018-19 in the
annexure B.7
5.8.5. The table attached below summarizes the power purchase Quantum for FY 2018-19
Table 83: Power purchase Quantum for FY 2018-19 (in MW)
S. No. Name of The SourceSBPDCL
(FY 2018-19)
NBPDCL
(FY 2018-19)
BIHAR
(FY 2018-19)
1 Central Sector Stations 1,892.39 1,612.04 3,504.43
2 Talcher – I ( 2 x 500 MW) 224.91 191.59 417
3 Farakka – I & II (1600 MW) 274.75 234.048 509
4 Farakka – III (500 MW) 58.32 49.68 108
5 Kahalgaon – I (840 MW) 191.65 163.254 355
6 Kahalgaon – II (1500 MW) 40.34 34.362 75
7 Barh-II 571.86 487.14 1059
8 Korba - 0 0
9 Rangit – HEP 11.34 9.66 21
10 Teesta - HEP 58.55 49.8778 108
11 Chukha 43.20 36.8 80
12 Tala 140.45 119.646 260
13 Barh Stage-I (3 X 660 MW) 277.02 235.98 513
14 State Generating Stations 521 443 964
15 KBUNL 1 118.80 101.2 220
16 KBUNL 2 142.56 121.44 264
17 Small Hydro (BSHPCL) 5.40 4.6 10
18 Barauni Stage I 118.80 101.2 220
19 Barauni Stage II 135.00 115 250
20 IPP 140.40 119.60 260.00
21 GMR Kamalanga Energy 140.40 119.6 260
22 Adani Enterprises Limited - 0 0
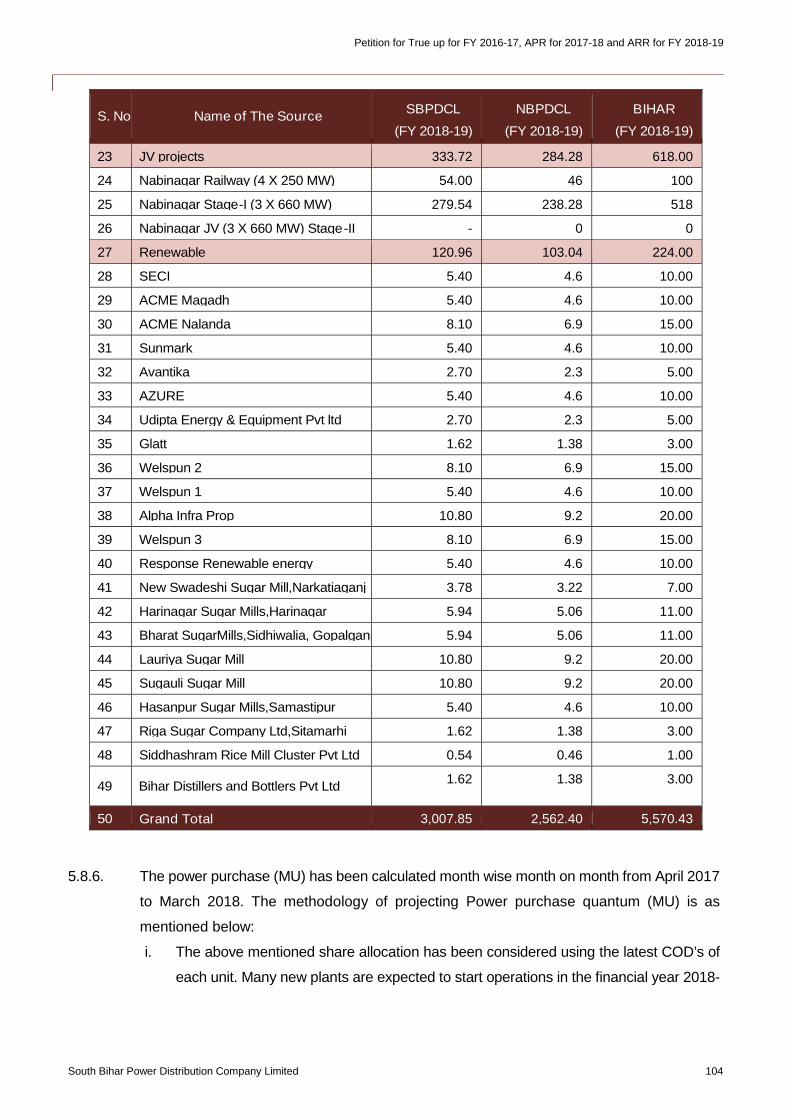
Petition for True up for FY 2016-17, APR for 2017-18 and ARR for FY 2018-19
South Bihar Power Distribution Company Limited 104
S. No. Name of The SourceSBPDCL
(FY 2018-19)
NBPDCL
(FY 2018-19)
BIHAR
(FY 2018-19)
23 JV projects 333.72 284.28 618.00
24 Nabinagar Railway (4 X 250 MW) 54.00 46 100
25 Nabinagar Stage-I (3 X 660 MW) 279.54 238.28 518
26 Nabinagar JV (3 X 660 MW) Stage-II - 0 0
27 Renewable 120.96 103.04 224.00
28 SECI 5.40 4.6 10.00
29 ACME Magadh 5.40 4.6 10.00
30 ACME Nalanda 8.10 6.9 15.00
31 Sunmark 5.40 4.6 10.00
32 Avantika 2.70 2.3 5.00
33 AZURE 5.40 4.6 10.00
34 Udipta Energy & Equipment Pvt ltd 2.70 2.3 5.00
35 Glatt 1.62 1.38 3.00
36 Welspun 2 8.10 6.9 15.00
37 Welspun 1 5.40 4.6 10.00
38 Alpha Infra Prop 10.80 9.2 20.00
39 Welspun 3 8.10 6.9 15.00
40 Response Renewable energy 5.40 4.6 10.00
41 New Swadeshi Sugar Mill,Narkatiaganj 3.78 3.22 7.00
42 Harinagar Sugar Mills,Harinagar 5.94 5.06 11.00
43 Bharat SugarMills,Sidhiwalia, Gopalganj 5.94 5.06 11.00
44 Lauriya Sugar Mill 10.80 9.2 20.00
45 Sugauli Sugar Mill 10.80 9.2 20.00
46 Hasanpur Sugar Mills,Samastipur 5.40 4.6 10.00
47 Riga Sugar Company Ltd,Sitamarhi 1.62 1.38 3.00
48 Siddhashram Rice Mill Cluster Pvt Ltd 0.54 0.46 1.00
49 Bihar Distillers and Bottlers Pvt Ltd1.62 1.38 3.00
50 Grand Total 3,007.85 2,562.40 5,570.43
5.8.6. The power purchase (MU) has been calculated month wise month on month from April 2017
to March 2018. The methodology of projecting Power purchase quantum (MU) is as
mentioned below:
i. The above mentioned share allocation has been considered using the latest COD’s of
each unit. Many new plants are expected to start operations in the financial year 2018-
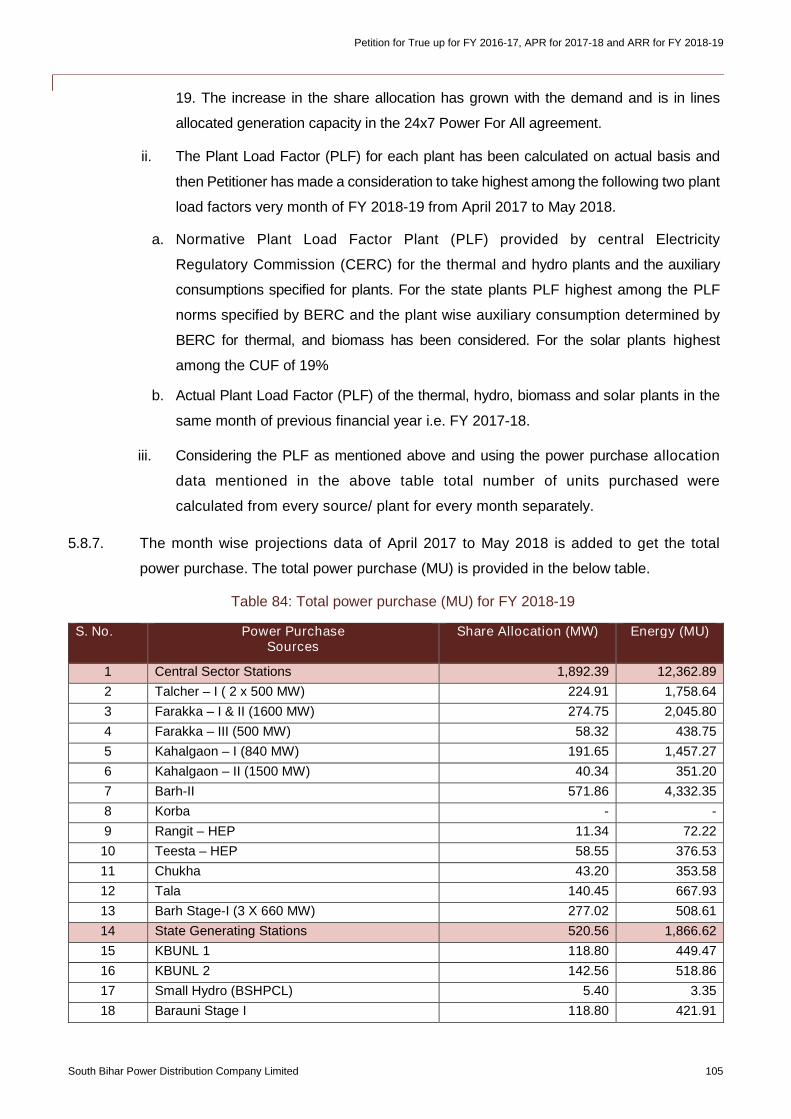
Petition for True up for FY 2016-17, APR for 2017-18 and ARR for FY 2018-19
South Bihar Power Distribution Company Limited 105
19. The increase in the share allocation has grown with the demand and is in lines
allocated generation capacity in the 24x7 Power For All agreement.
ii. The Plant Load Factor (PLF) for each plant has been calculated on actual basis and
then Petitioner has made a consideration to take highest among the following two plant
load factors very month of FY 2018-19 from April 2017 to May 2018.
a. Normative Plant Load Factor Plant (PLF) provided by central Electricity
Regulatory Commission (CERC) for the thermal and hydro plants and the auxiliary
consumptions specified for plants. For the state plants PLF highest among the PLF
norms specified by BERC and the plant wise auxiliary consumption determined by
BERC for thermal, and biomass has been considered. For the solar plants highest
among the CUF of 19%
b. Actual Plant Load Factor (PLF) of the thermal, hydro, biomass and solar plants in the
same month of previous financial year i.e. FY 2017-18.
iii. Considering the PLF as mentioned above and using the power purchase allocation
data mentioned in the above table total number of units purchased were
calculated from every source/ plant for every month separately.
5.8.7. The month wise projections data of April 2017 to May 2018 is added to get the total
power purchase. The total power purchase (MU) is provided in the below table.
Table 84: Total power purchase (MU) for FY 2018-19
S. No. Power PurchaseSources
Share Allocation (MW) Energy (MU)
1 Central Sector Stations 1,892.39 12,362.89
2 Talcher – I ( 2 x 500 MW) 224.91 1,758.64
3 Farakka – I & II (1600 MW) 274.75 2,045.80
4 Farakka – III (500 MW) 58.32 438.75
5 Kahalgaon – I (840 MW) 191.65 1,457.27
6 Kahalgaon – II (1500 MW) 40.34 351.20
7 Barh-II 571.86 4,332.35
8 Korba - -
9 Rangit – HEP 11.34 72.22
10 Teesta – HEP 58.55 376.53
11 Chukha 43.20 353.58
12 Tala 140.45 667.93
13 Barh Stage-I (3 X 660 MW) 277.02 508.61
14 State Generating Stations 520.56 1,866.62
15 KBUNL 1 118.80 449.47
16 KBUNL 2 142.56 518.86
17 Small Hydro (BSHPCL) 5.40 3.35
18 Barauni Stage I 118.80 421.91
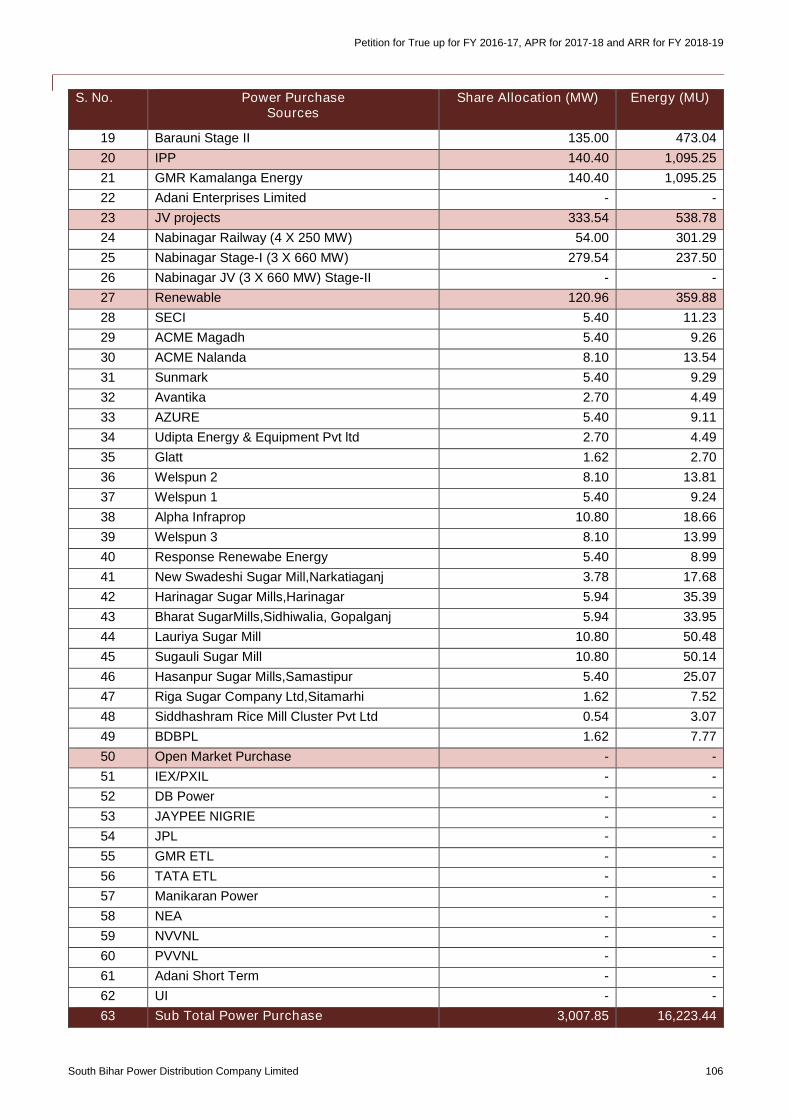
Petition for True up for FY 2016-17, APR for 2017-18 and ARR for FY 2018-19
South Bihar Power Distribution Company Limited 106
S. No. Power PurchaseSources
Share Allocation (MW) Energy (MU)
19 Barauni Stage II 135.00 473.04
20 IPP 140.40 1,095.25
21 GMR Kamalanga Energy 140.40 1,095.25
22 Adani Enterprises Limited - -
23 JV projects 333.54 538.78
24 Nabinagar Railway (4 X 250 MW) 54.00 301.29
25 Nabinagar Stage-I (3 X 660 MW) 279.54 237.50
26 Nabinagar JV (3 X 660 MW) Stage-II - -
27 Renewable 120.96 359.88
28 SECI 5.40 11.23
29 ACME Magadh 5.40 9.26
30 ACME Nalanda 8.10 13.54
31 Sunmark 5.40 9.29
32 Avantika 2.70 4.49
33 AZURE 5.40 9.11
34 Udipta Energy & Equipment Pvt ltd 2.70 4.49
35 Glatt 1.62 2.70
36 Welspun 2 8.10 13.81
37 Welspun 1 5.40 9.24
38 Alpha Infraprop 10.80 18.66
39 Welspun 3 8.10 13.99
40 Response Renewabe Energy 5.40 8.99
41 New Swadeshi Sugar Mill,Narkatiaganj 3.78 17.68
42 Harinagar Sugar Mills,Harinagar 5.94 35.39
43 Bharat SugarMills,Sidhiwalia, Gopalganj 5.94 33.95
44 Lauriya Sugar Mill 10.80 50.48
45 Sugauli Sugar Mill 10.80 50.14
46 Hasanpur Sugar Mills,Samastipur 5.40 25.07
47 Riga Sugar Company Ltd,Sitamarhi 1.62 7.52
48 Siddhashram Rice Mill Cluster Pvt Ltd 0.54 3.07
49 BDBPL 1.62 7.77
50 Open Market Purchase - -
51 IEX/PXIL - -
52 DB Power - -
53 JAYPEE NIGRIE - -
54 JPL - -
55 GMR ETL - -
56 TATA ETL - -
57 Manikaran Power - -
58 NEA - -
59 NVVNL - -
60 PVVNL - -
61 Adani Short Term - -
62 UI - -
63 Sub Total Power Purchase 3,007.85 16,223.44
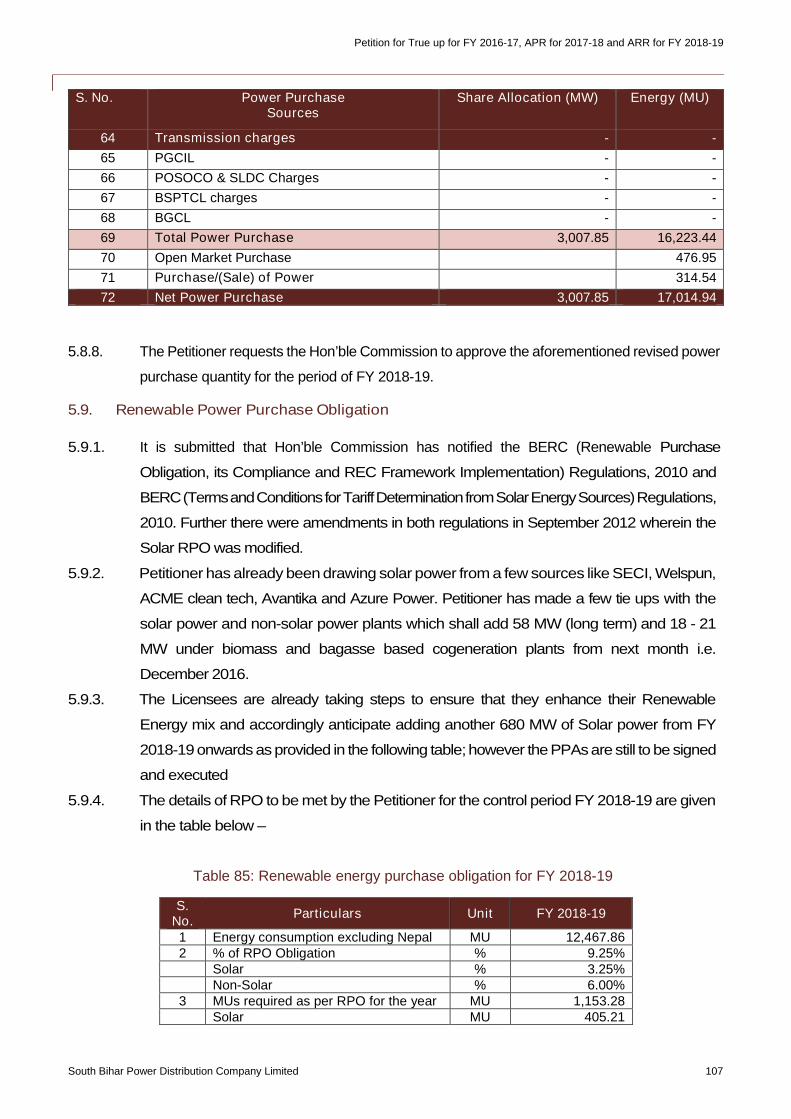
Petition for True up for FY 2016-17, APR for 2017-18 and ARR for FY 2018-19
South Bihar Power Distribution Company Limited 107
S. No. Power PurchaseSources
Share Allocation (MW) Energy (MU)
64 Transmission charges - -
65 PGCIL - -
66 POSOCO & SLDC Charges - -
67 BSPTCL charges - -
68 BGCL - -
69 Total Power Purchase 3,007.85 16,223.44
70 Open Market Purchase 476.95
71 Purchase/(Sale) of Power 314.54
72 Net Power Purchase 3,007.85 17,014.94
5.8.8. The Petitioner requests the Hon’ble Commission to approve the aforementioned revised power
purchase quantity for the period of FY 2018-19.
5.9. Renewable Power Purchase Obligation
5.9.1. It is submitted that Hon’ble Commission has notified the BERC (Renewable Purchase
Obligation, its Compliance and REC Framework Implementation) Regulations, 2010 and
BERC(TermsandConditionsforTariffDeterminationfromSolarEnergySources)Regulations,
2010. Further there were amendments in both regulations in September 2012 wherein the
Solar RPO was modified.
5.9.2. Petitioner has already been drawing solar power from a few sources like SECI, Welspun,
ACME clean tech, Avantika and Azure Power. Petitioner has made a few tie ups with the
solar power and non-solar power plants which shall add 58 MW (long term) and 18 - 21
MW under biomass and bagasse based cogeneration plants from next month i.e.
December 2016.
5.9.3. The Licensees are already taking steps to ensure that they enhance their Renewable
Energy mix and accordingly anticipate adding another 680 MW of Solar power from FY
2018-19 onwards as provided in the following table;however the PPAsare still to be signed
and executed
5.9.4. The details of RPO to be met by the Petitioner for the control period FY 2018-19 are given
in the table below –
Table 85: Renewable energy purchase obligation for FY 2018-19
S.No.
Particulars Unit FY 2018-19
1 Energy consumption excluding Nepal MU 12,467.862 % of RPO Obligation % 9.25%
Solar % 3.25%Non-Solar % 6.00%
3 MUs required as per RPO for the year MU 1,153.28Solar MU 405.21
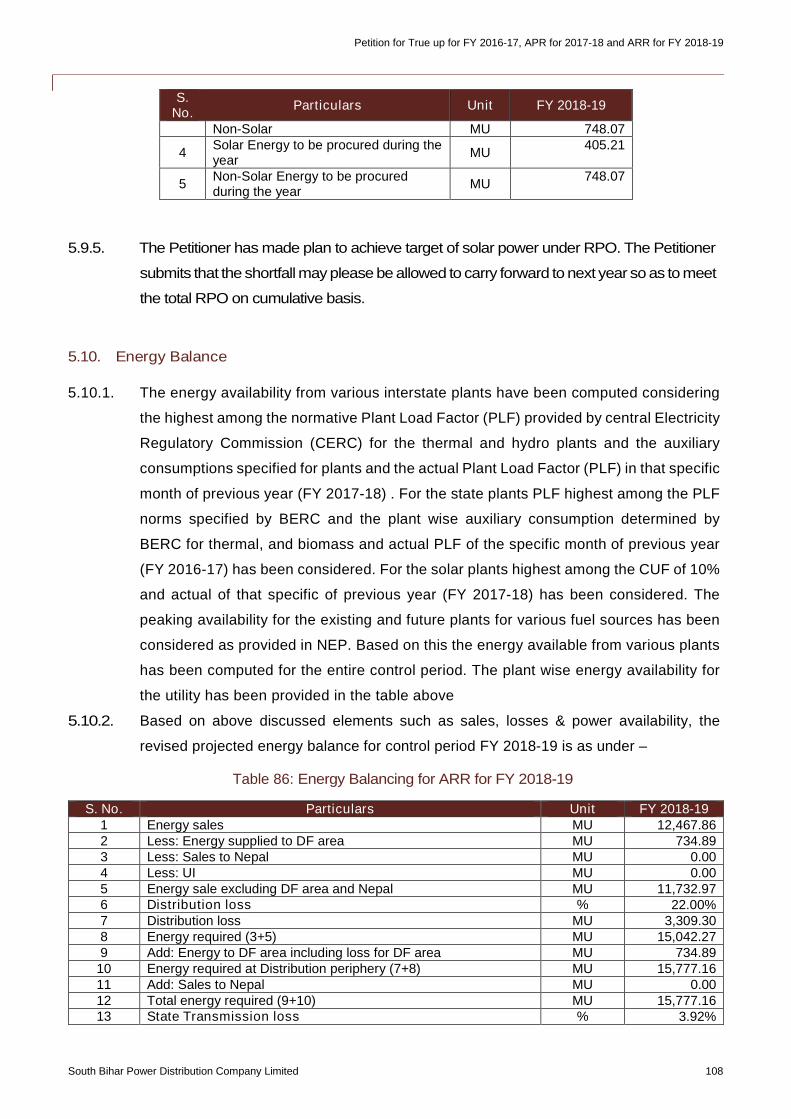
Petition for True up for FY 2016-17, APR for 2017-18 and ARR for FY 2018-19
South Bihar Power Distribution Company Limited 108
S.No.
Particulars Unit FY 2018-19
Non-Solar MU 748.07
4Solar Energy to be procured during theyear
MU405.21
5Non-Solar Energy to be procuredduring the year
MU748.07
5.9.5. The Petitioner has made plan to achieve target of solar power under RPO. The Petitioner
submits that the shortfall may please be allowed to carry forward to next year so as to meet
the total RPO on cumulative basis.
5.10. Energy Balance
5.10.1. The energy availability from various interstate plants have been computed considering
the highest among the normative Plant Load Factor (PLF) provided by central Electricity
Regulatory Commission (CERC) for the thermal and hydro plants and the auxiliary
consumptions specified for plants and the actual Plant Load Factor (PLF) in that specific
month of previous year (FY 2017-18) . For the state plants PLF highest among the PLF
norms specified by BERC and the plant wise auxiliary consumption determined by
BERC for thermal, and biomass and actual PLF of the specific month of previous year
(FY 2016-17) has been considered. For the solar plants highest among the CUF of 10%
and actual of that specific of previous year (FY 2017-18) has been considered. The
peaking availability for the existing and future plants for various fuel sources has been
considered as provided in NEP. Based on this the energy available from various plants
has been computed for the entire control period. The plant wise energy availability for
the utility has been provided in the table above
5.10.2. Based on above discussed elements such as sales, losses & power availability, the
revised projected energy balance for control period FY 2018-19 is as under –
Table 86: Energy Balancing for ARR for FY 2018-19
S. No. Particulars Unit FY 2018-191 Energy sales MU 12,467.862 Less: Energy supplied to DF area MU 734.893 Less: Sales to Nepal MU 0.004 Less: UI MU 0.005 Energy sale excluding DF area and Nepal MU 11,732.976 Distribution loss % 22.00%7 Distribution loss MU 3,309.308 Energy required (3+5) MU 15,042.279 Add: Energy to DF area including loss for DF area MU 734.89
10 Energy required at Distribution periphery (7+8) MU 15,777.1611 Add: Sales to Nepal MU 0.0012 Total energy required (9+10) MU 15,777.1613 State Transmission loss % 3.92%
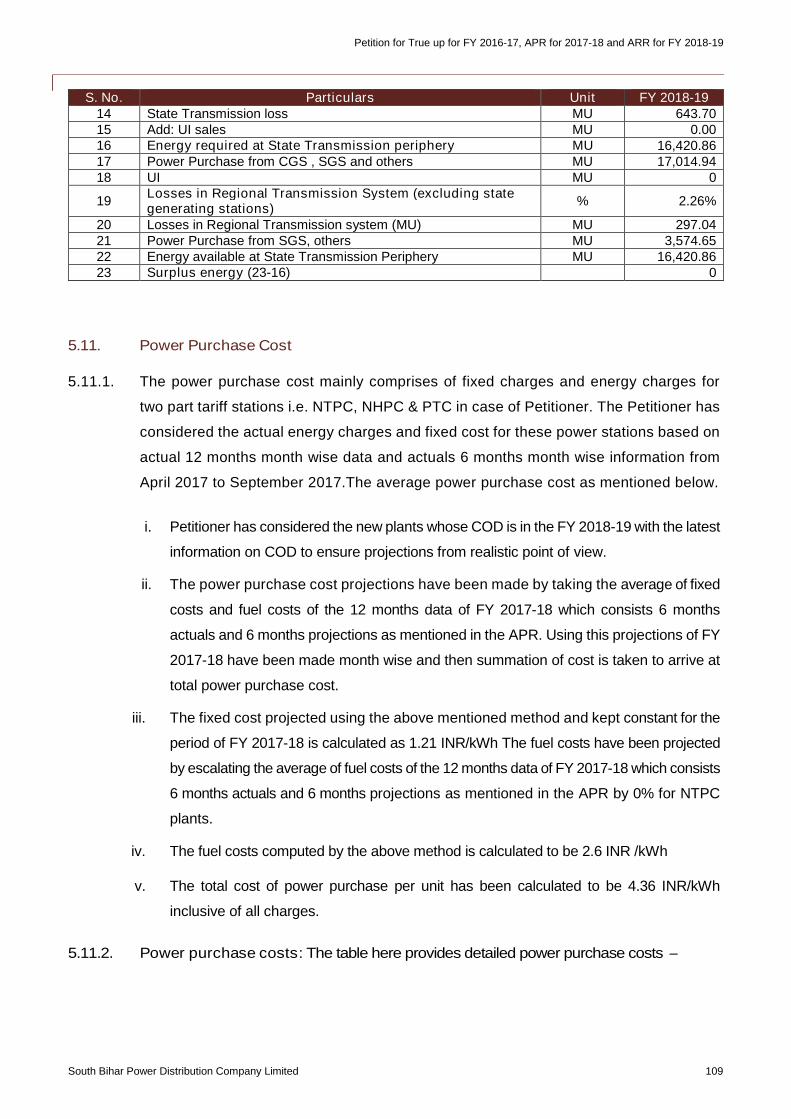
Petition for True up for FY 2016-17, APR for 2017-18 and ARR for FY 2018-19
South Bihar Power Distribution Company Limited 109
S. No. Particulars Unit FY 2018-1914 State Transmission loss MU 643.7015 Add: UI sales MU 0.0016 Energy required at State Transmission periphery MU 16,420.8617 Power Purchase from CGS , SGS and others MU 17,014.9418 UI MU 0
19Losses in Regional Transmission System (excluding stategenerating stations)
% 2.26%
20 Losses in Regional Transmission system (MU) MU 297.0421 Power Purchase from SGS, others MU 3,574.6522 Energy available at State Transmission Periphery MU 16,420.8623 Surplus energy (23-16) 0
5.11. Power Purchase Cost
5.11.1. The power purchase cost mainly comprises of fixed charges and energy charges for
two part tariff stations i.e. NTPC, NHPC & PTC in case of Petitioner. The Petitioner has
considered the actual energy charges and fixed cost for these power stations based on
actual 12 months month wise data and actuals 6 months month wise information from
April 2017 to September 2017.The average power purchase cost as mentioned below.
i. Petitioner has considered the new plants whose COD is in the FY 2018-19 with the latest
information on COD to ensure projections from realistic point of view.
ii. The power purchase cost projections have been made by taking the average of fixed
costs and fuel costs of the 12 months data of FY 2017-18 which consists 6 months
actuals and 6 months projections as mentioned in the APR. Using this projections of FY
2017-18 have been made month wise and then summation of cost is taken to arrive at
total power purchase cost.
iii. The fixed cost projected using the above mentioned method and kept constant for the
period of FY 2017-18 is calculated as 1.21 INR/kWh The fuel costs have been projected
by escalating the average of fuel costs of the 12 months data of FY 2017-18 which consists
6 months actuals and 6 months projections as mentioned in the APR by 0% for NTPC
plants.
iv. The fuel costs computed by the above method is calculated to be 2.6 INR /kWh
v. The total cost of power purchase per unit has been calculated to be 4.36 INR/kWh
inclusive of all charges.
5.11.2. Power purchase costs: The table here provides detailed power purchase costs –
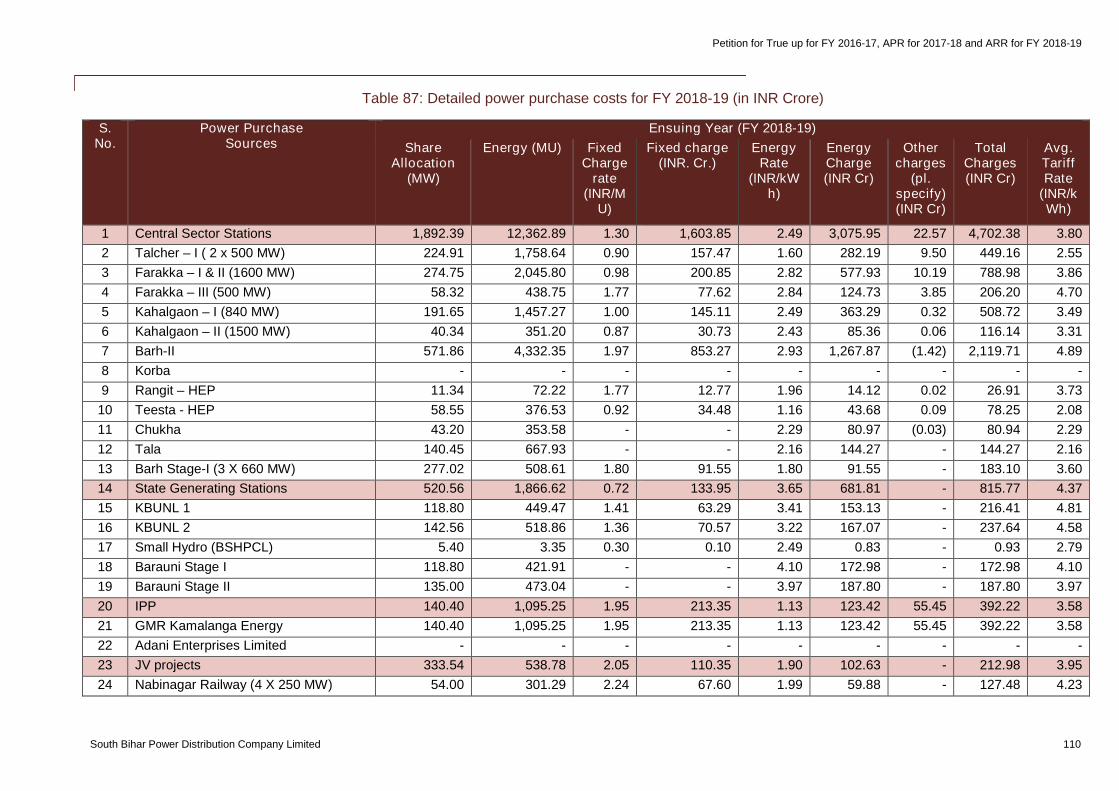
Petition for True up for FY 2016-17, APR for 2017-18 and ARR for FY 2018-19
South Bihar Power Distribution Company Limited 110
Table 87: Detailed power purchase costs for FY 2018-19 (in INR Crore)
S.No.
Power PurchaseSources
Ensuing Year (FY 2018-19)
ShareAllocation
(MW)
Energy (MU) FixedCharge
rate(INR/M
U)
Fixed charge(INR. Cr.)
EnergyRate
(INR/kWh)
EnergyCharge(INR Cr)
Othercharges
(pl.specify)(INR Cr)
TotalCharges(INR Cr)
Avg.TariffRate
(INR/kWh)
1 Central Sector Stations 1,892.39 12,362.89 1.30 1,603.85 2.49 3,075.95 22.57 4,702.38 3.80
2 Talcher – I ( 2 x 500 MW) 224.91 1,758.64 0.90 157.47 1.60 282.19 9.50 449.16 2.55
3 Farakka – I & II (1600 MW) 274.75 2,045.80 0.98 200.85 2.82 577.93 10.19 788.98 3.86
4 Farakka – III (500 MW) 58.32 438.75 1.77 77.62 2.84 124.73 3.85 206.20 4.70
5 Kahalgaon – I (840 MW) 191.65 1,457.27 1.00 145.11 2.49 363.29 0.32 508.72 3.49
6 Kahalgaon – II (1500 MW) 40.34 351.20 0.87 30.73 2.43 85.36 0.06 116.14 3.31
7 Barh-II 571.86 4,332.35 1.97 853.27 2.93 1,267.87 (1.42) 2,119.71 4.89
8 Korba - - - - - - - - -
9 Rangit – HEP 11.34 72.22 1.77 12.77 1.96 14.12 0.02 26.91 3.73
10 Teesta - HEP 58.55 376.53 0.92 34.48 1.16 43.68 0.09 78.25 2.08
11 Chukha 43.20 353.58 - - 2.29 80.97 (0.03) 80.94 2.29
12 Tala 140.45 667.93 - - 2.16 144.27 - 144.27 2.16
13 Barh Stage-I (3 X 660 MW) 277.02 508.61 1.80 91.55 1.80 91.55 - 183.10 3.60
14 State Generating Stations 520.56 1,866.62 0.72 133.95 3.65 681.81 - 815.77 4.37
15 KBUNL 1 118.80 449.47 1.41 63.29 3.41 153.13 - 216.41 4.81
16 KBUNL 2 142.56 518.86 1.36 70.57 3.22 167.07 - 237.64 4.58
17 Small Hydro (BSHPCL) 5.40 3.35 0.30 0.10 2.49 0.83 - 0.93 2.79
18 Barauni Stage I 118.80 421.91 - - 4.10 172.98 - 172.98 4.10
19 Barauni Stage II 135.00 473.04 - - 3.97 187.80 - 187.80 3.97
20 IPP 140.40 1,095.25 1.95 213.35 1.13 123.42 55.45 392.22 3.58
21 GMR Kamalanga Energy 140.40 1,095.25 1.95 213.35 1.13 123.42 55.45 392.22 3.58
22 Adani Enterprises Limited - - - - - - - - -
23 JV projects 333.54 538.78 2.05 110.35 1.90 102.63 - 212.98 3.95
24 Nabinagar Railway (4 X 250 MW) 54.00 301.29 2.24 67.60 1.99 59.88 - 127.48 4.23
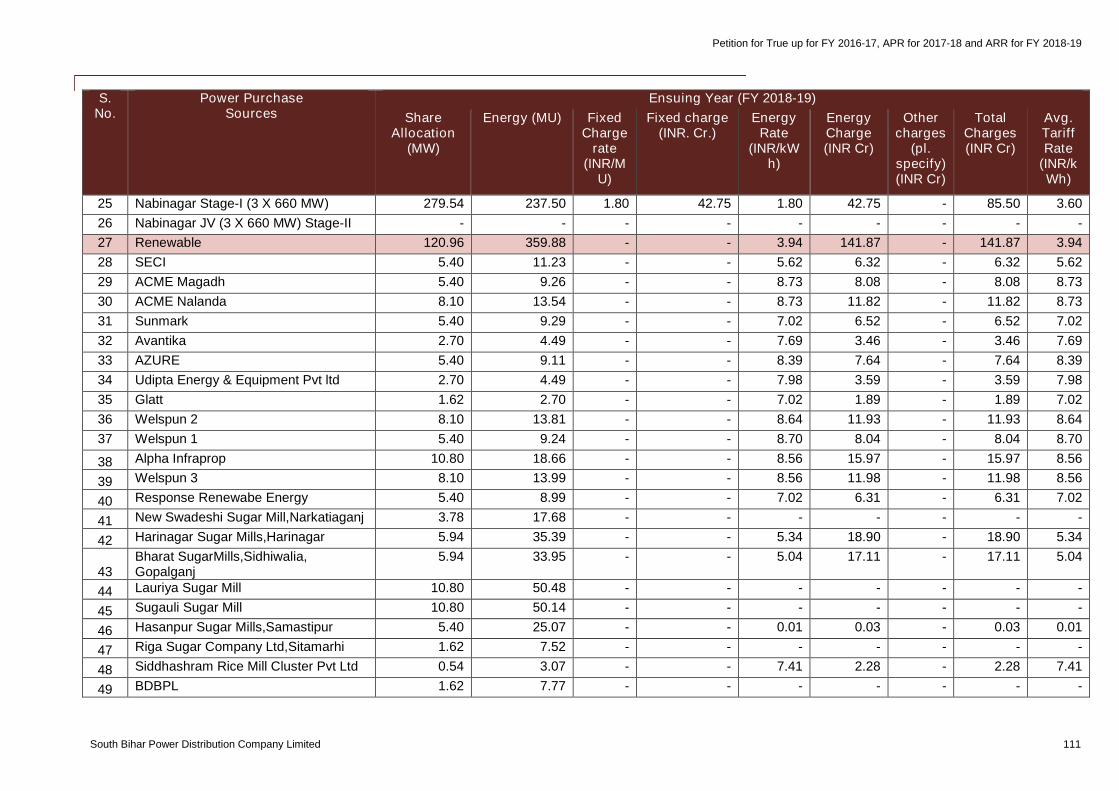
Petition for True up for FY 2016-17, APR for 2017-18 and ARR for FY 2018-19
South Bihar Power Distribution Company Limited 111
S.No.
Power PurchaseSources
Ensuing Year (FY 2018-19)
ShareAllocation
(MW)
Energy (MU) FixedCharge
rate(INR/M
U)
Fixed charge(INR. Cr.)
EnergyRate
(INR/kWh)
EnergyCharge(INR Cr)
Othercharges
(pl.specify)(INR Cr)
TotalCharges(INR Cr)
Avg.TariffRate
(INR/kWh)
25 Nabinagar Stage-I (3 X 660 MW) 279.54 237.50 1.80 42.75 1.80 42.75 - 85.50 3.60
26 Nabinagar JV (3 X 660 MW) Stage-II - - - - - - - - -
27 Renewable 120.96 359.88 - - 3.94 141.87 - 141.87 3.94
28 SECI 5.40 11.23 - - 5.62 6.32 - 6.32 5.62
29 ACME Magadh 5.40 9.26 - - 8.73 8.08 - 8.08 8.73
30 ACME Nalanda 8.10 13.54 - - 8.73 11.82 - 11.82 8.73
31 Sunmark 5.40 9.29 - - 7.02 6.52 - 6.52 7.02
32 Avantika 2.70 4.49 - - 7.69 3.46 - 3.46 7.69
33 AZURE 5.40 9.11 - - 8.39 7.64 - 7.64 8.39
34 Udipta Energy & Equipment Pvt ltd 2.70 4.49 - - 7.98 3.59 - 3.59 7.98
35 Glatt 1.62 2.70 - - 7.02 1.89 - 1.89 7.02
36 Welspun 2 8.10 13.81 - - 8.64 11.93 - 11.93 8.64
37 Welspun 1 5.40 9.24 - - 8.70 8.04 - 8.04 8.70
38 Alpha Infraprop 10.80 18.66 - - 8.56 15.97 - 15.97 8.56
39 Welspun 3 8.10 13.99 - - 8.56 11.98 - 11.98 8.56
40 Response Renewabe Energy 5.40 8.99 - - 7.02 6.31 - 6.31 7.02
41 New Swadeshi Sugar Mill,Narkatiaganj 3.78 17.68 - - - - - - -
42 Harinagar Sugar Mills,Harinagar 5.94 35.39 - - 5.34 18.90 - 18.90 5.34
43Bharat SugarMills,Sidhiwalia,Gopalganj
5.94 33.95 - - 5.04 17.11 - 17.11 5.04
44 Lauriya Sugar Mill 10.80 50.48 - - - - - - -
45 Sugauli Sugar Mill 10.80 50.14 - - - - - - -
46 Hasanpur Sugar Mills,Samastipur 5.40 25.07 - - 0.01 0.03 - 0.03 0.01
47 Riga Sugar Company Ltd,Sitamarhi 1.62 7.52 - - - - - - -
48 Siddhashram Rice Mill Cluster Pvt Ltd 0.54 3.07 - - 7.41 2.28 - 2.28 7.41
49 BDBPL 1.62 7.77 - - - - - - -
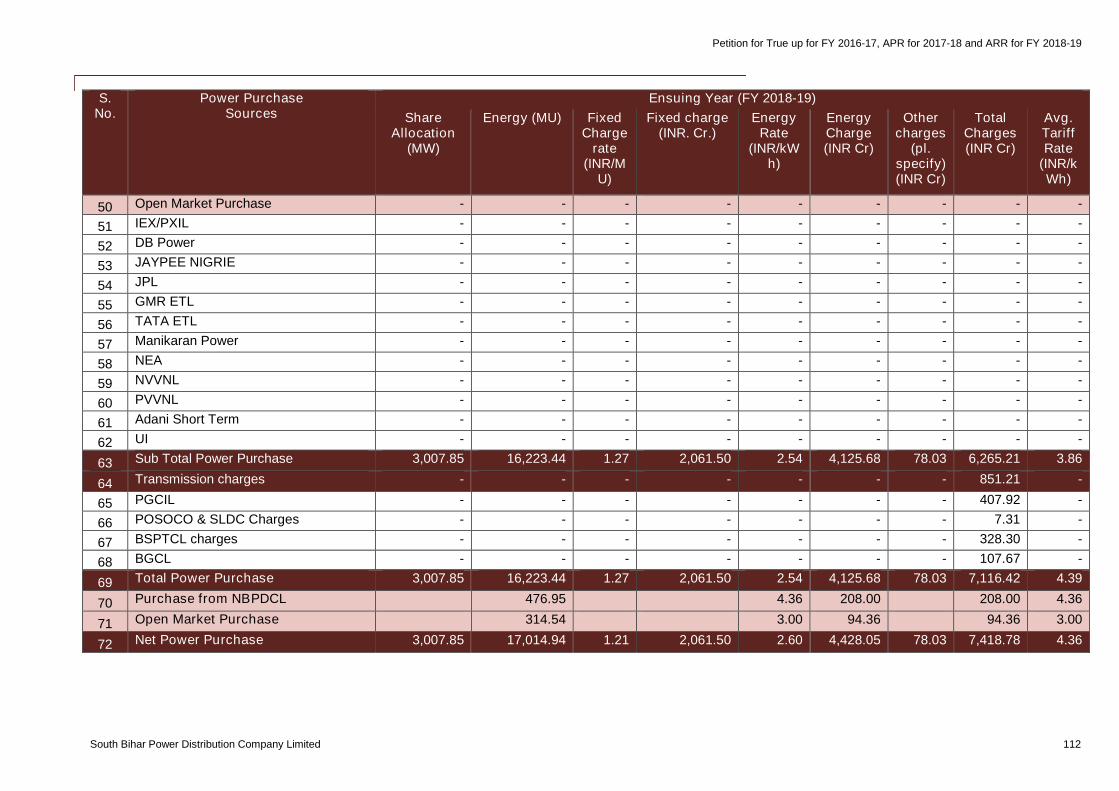
Petition for True up for FY 2016-17, APR for 2017-18 and ARR for FY 2018-19
South Bihar Power Distribution Company Limited 112
S.No.
Power PurchaseSources
Ensuing Year (FY 2018-19)
ShareAllocation
(MW)
Energy (MU) FixedCharge
rate(INR/M
U)
Fixed charge(INR. Cr.)
EnergyRate
(INR/kWh)
EnergyCharge(INR Cr)
Othercharges
(pl.specify)(INR Cr)
TotalCharges(INR Cr)
Avg.TariffRate
(INR/kWh)
50 Open Market Purchase - - - - - - - - -
51 IEX/PXIL - - - - - - - - -
52 DB Power - - - - - - - - -
53 JAYPEE NIGRIE - - - - - - - - -
54 JPL - - - - - - - - -
55 GMR ETL - - - - - - - - -
56 TATA ETL - - - - - - - - -
57 Manikaran Power - - - - - - - - -
58 NEA - - - - - - - - -
59 NVVNL - - - - - - - - -
60 PVVNL - - - - - - - - -
61 Adani Short Term - - - - - - - - -
62 UI - - - - - - - - -
63 Sub Total Power Purchase 3,007.85 16,223.44 1.27 2,061.50 2.54 4,125.68 78.03 6,265.21 3.86
64 Transmission charges - - - - - - - 851.21 -
65 PGCIL - - - - - - - 407.92 -
66 POSOCO & SLDC Charges - - - - - - - 7.31 -
67 BSPTCL charges - - - - - - - 328.30 -
68 BGCL - - - - - - - 107.67 -
69 Total Power Purchase 3,007.85 16,223.44 1.27 2,061.50 2.54 4,125.68 78.03 7,116.42 4.39
70 Purchase from NBPDCL 476.95 4.36 208.00 208.00 4.36
71 Open Market Purchase 314.54 3.00 94.36 94.36 3.00
72 Net Power Purchase 3,007.85 17,014.94 1.21 2,061.50 2.60 4,428.05 78.03 7,418.78 4.36
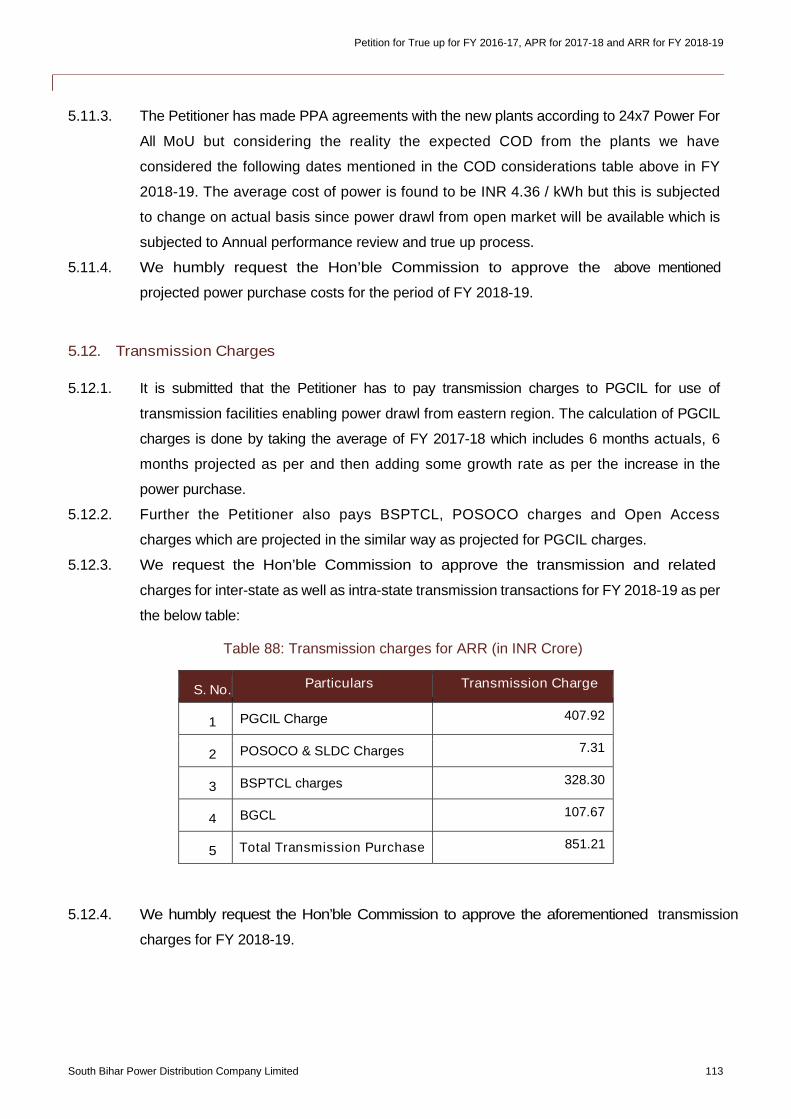
Petition for True up for FY 2016-17, APR for 2017-18 and ARR for FY 2018-19
South Bihar Power Distribution Company Limited 113
5.11.3. The Petitioner has made PPA agreements with the new plants according to 24x7 Power For
All MoU but considering the reality the expected COD from the plants we have
considered the following dates mentioned in the COD considerations table above in FY
2018-19. The average cost of power is found to be INR 4.36 / kWh but this is subjected
to change on actual basis since power drawl from open market will be available which is
subjected to Annual performance review and true up process.
5.11.4. We humbly request the Hon’ble Commission to approve the above mentioned
projected power purchase costs for the period of FY 2018-19.
5.12. Transmission Charges
5.12.1. It is submitted that the Petitioner has to pay transmission charges to PGCIL for use of
transmission facilities enabling power drawl from eastern region. The calculation of PGCIL
charges is done by taking the average of FY 2017-18 which includes 6 months actuals, 6
months projected as per and then adding some growth rate as per the increase in the
power purchase.
5.12.2. Further the Petitioner also pays BSPTCL, POSOCO charges and Open Access
charges which are projected in the similar way as projected for PGCIL charges.
5.12.3. We request the Hon’ble Commission to approve the transmission and related
charges for inter-state as well as intra-state transmission transactions for FY 2018-19 as per
the below table:
Table 88: Transmission charges for ARR (in INR Crore)
S. No.Particulars Transmission Charge
1 PGCIL Charge 407.92
2 POSOCO & SLDC Charges 7.31
3 BSPTCL charges 328.30
4 BGCL 107.67
5 Total Transmission Purchase 851.21
5.12.4. We humbly request the Hon’ble Commission to approve the aforementioned transmission
charges for FY 2018-19.
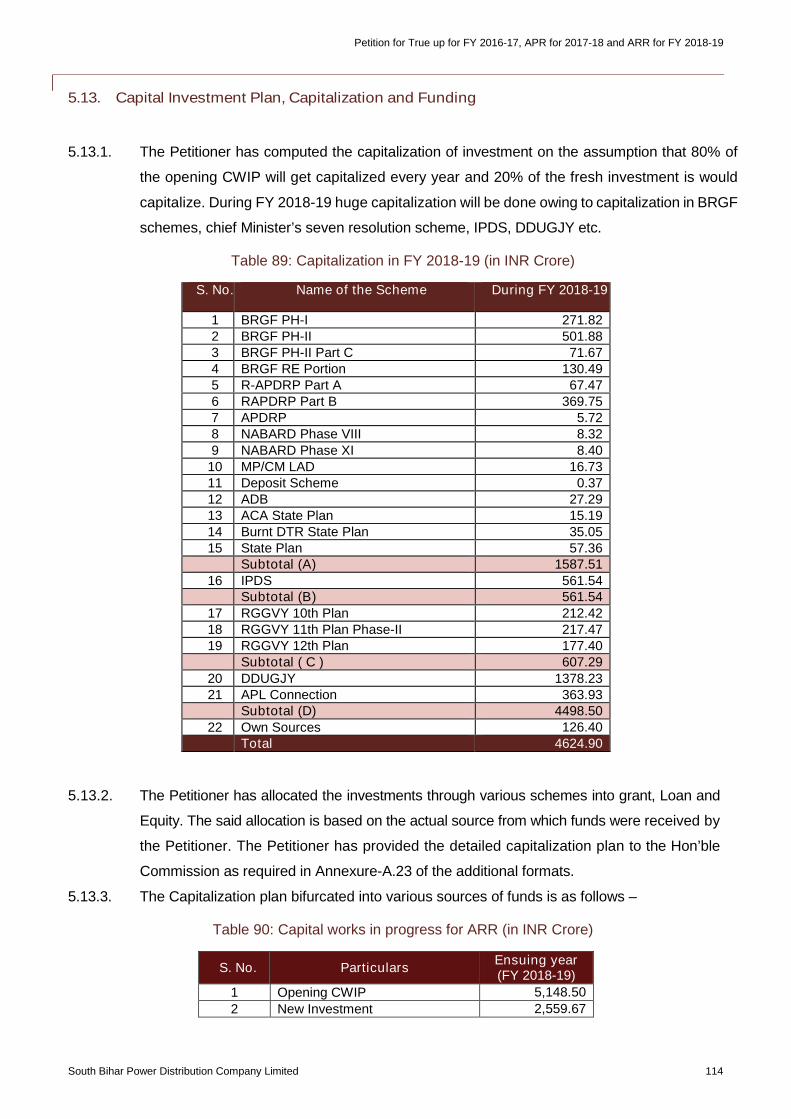
Petition for True up for FY 2016-17, APR for 2017-18 and ARR for FY 2018-19
South Bihar Power Distribution Company Limited 114
5.13. Capital Investment Plan, Capitalization and Funding
5.13.1. The Petitioner has computed the capitalization of investment on the assumption that 80% of
the opening CWIP will get capitalized every year and 20% of the fresh investment is would
capitalize. During FY 2018-19 huge capitalization will be done owing to capitalization in BRGF
schemes, chief Minister’s seven resolution scheme, IPDS, DDUGJY etc.
Table 89: Capitalization in FY 2018-19 (in INR Crore)
S. No. Name of the Scheme During FY 2018-19
1 BRGF PH-I 271.822 BRGF PH-II 501.883 BRGF PH-II Part C 71.674 BRGF RE Portion 130.495 R-APDRP Part A 67.476 RAPDRP Part B 369.757 APDRP 5.728 NABARD Phase VIII 8.329 NABARD Phase XI 8.40
10 MP/CM LAD 16.7311 Deposit Scheme 0.3712 ADB 27.2913 ACA State Plan 15.1914 Burnt DTR State Plan 35.0515 State Plan 57.36
Subtotal (A) 1587.5116 IPDS 561.54
Subtotal (B) 561.5417 RGGVY 10th Plan 212.4218 RGGVY 11th Plan Phase-II 217.4719 RGGVY 12th Plan 177.40
Subtotal ( C ) 607.2920 DDUGJY 1378.2321 APL Connection 363.93
Subtotal (D) 4498.5022 Own Sources 126.40
Total 4624.90
5.13.2. The Petitioner has allocated the investments through various schemes into grant, Loan and
Equity. The said allocation is based on the actual source from which funds were received by
the Petitioner. The Petitioner has provided the detailed capitalization plan to the Hon’ble
Commission as required in Annexure-A.23 of the additional formats.
5.13.3. The Capitalization plan bifurcated into various sources of funds is as follows –
Table 90: Capital works in progress for ARR (in INR Crore)
S. No. ParticularsEnsuing year(FY 2018-19)
1 Opening CWIP 5,148.50
2 New Investment 2,559.67
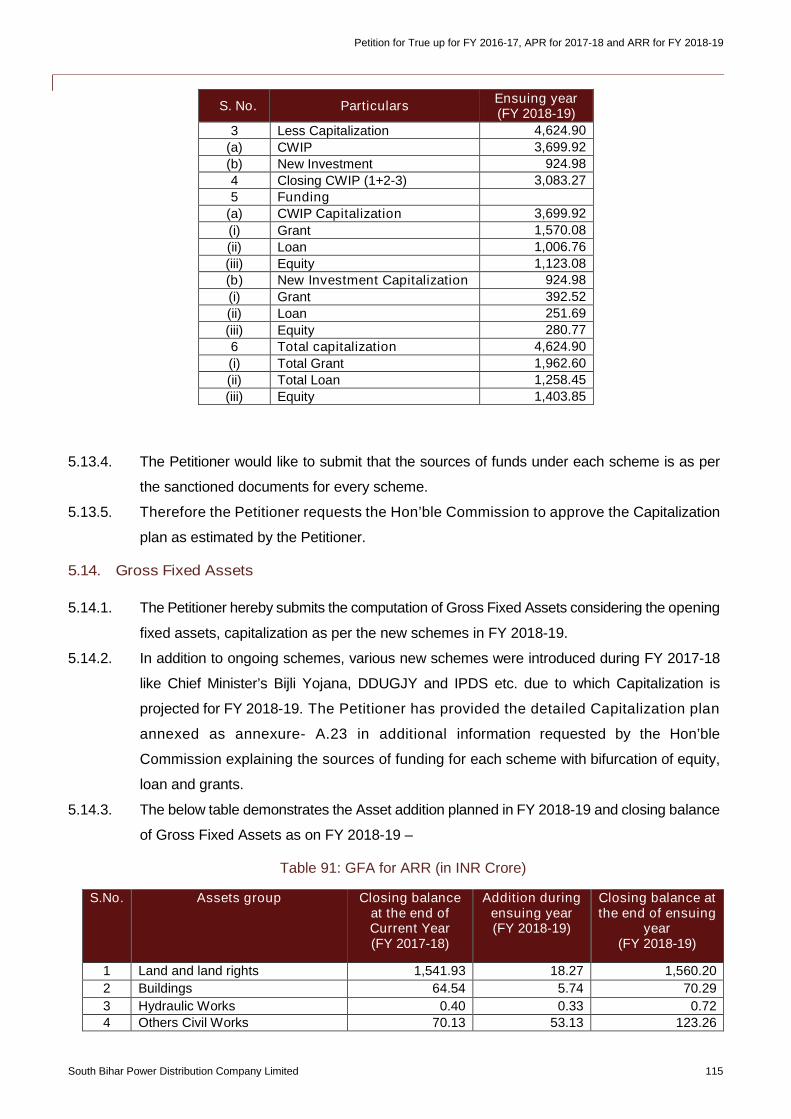
Petition for True up for FY 2016-17, APR for 2017-18 and ARR for FY 2018-19
South Bihar Power Distribution Company Limited 115
S. No. ParticularsEnsuing year(FY 2018-19)
3 Less Capitalization 4,624.90
(a) CWIP 3,699.92
(b) New Investment 924.98
4 Closing CWIP (1+2-3) 3,083.27
5 Funding
(a) CWIP Capitalization 3,699.92
(i) Grant 1,570.08
(ii) Loan 1,006.76
(iii) Equity 1,123.08
(b) New Investment Capitalization 924.98
(i) Grant 392.52
(ii) Loan 251.69
(iii) Equity 280.77
6 Total capitalization 4,624.90
(i) Total Grant 1,962.60
(ii) Total Loan 1,258.45
(iii) Equity 1,403.85
5.13.4. The Petitioner would like to submit that the sources of funds under each scheme is as per
the sanctioned documents for every scheme.
5.13.5. Therefore the Petitioner requests the Hon’ble Commission to approve the Capitalization
plan as estimated by the Petitioner.
5.14. Gross Fixed Assets
5.14.1. The Petitioner hereby submits the computation of Gross Fixed Assets considering the opening
fixed assets, capitalization as per the new schemes in FY 2018-19.
5.14.2. In addition to ongoing schemes, various new schemes were introduced during FY 2017-18
like Chief Minister’s Bijli Yojana, DDUGJY and IPDS etc. due to which Capitalization is
projected for FY 2018-19. The Petitioner has provided the detailed Capitalization plan
annexed as annexure- A.23 in additional information requested by the Hon’ble
Commission explaining the sources of funding for each scheme with bifurcation of equity,
loan and grants.
5.14.3. The below table demonstrates the Asset addition planned in FY 2018-19 and closing balance
of Gross Fixed Assets as on FY 2018-19 –
Table 91: GFA for ARR (in INR Crore)
S.No. Assets group Closing balanceat the end ofCurrent Year(FY 2017-18)
Addition duringensuing year(FY 2018-19)
Closing balance atthe end of ensuing
year(FY 2018-19)
1 Land and land rights 1,541.93 18.27 1,560.20
2 Buildings 64.54 5.74 70.29
3 Hydraulic Works 0.40 0.33 0.72
4 Others Civil Works 70.13 53.13 123.26
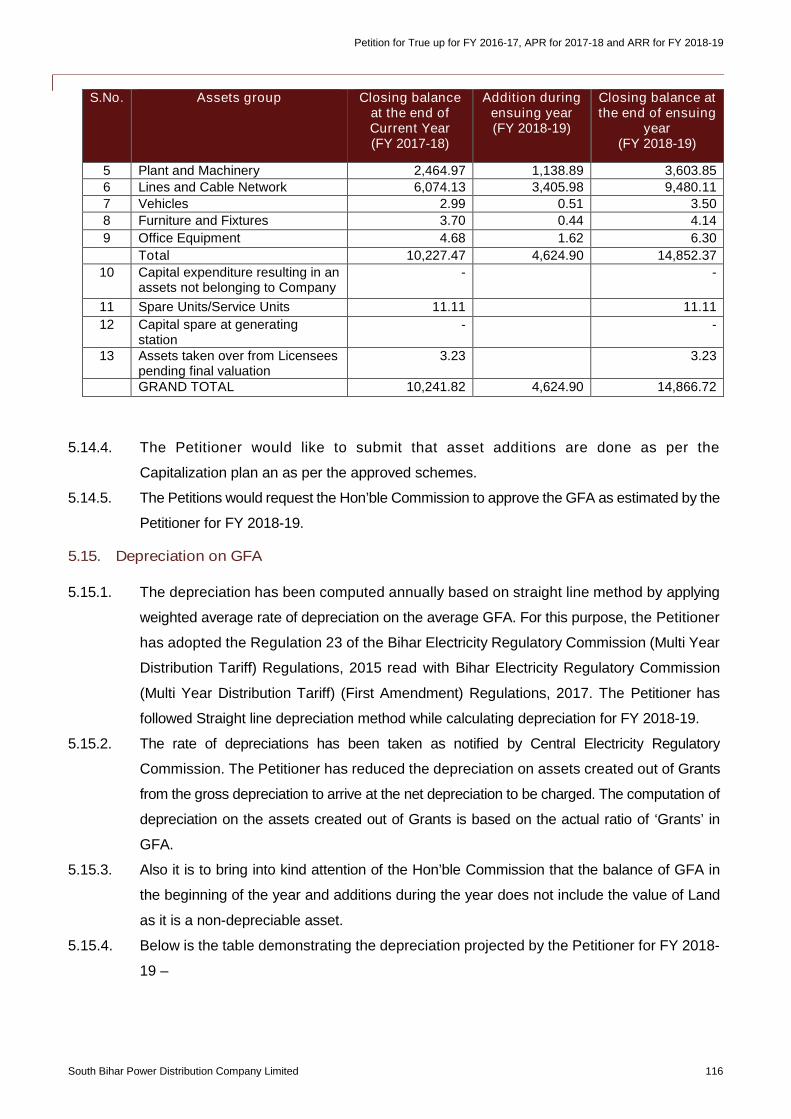
Petition for True up for FY 2016-17, APR for 2017-18 and ARR for FY 2018-19
South Bihar Power Distribution Company Limited 116
S.No. Assets group Closing balanceat the end ofCurrent Year(FY 2017-18)
Addition duringensuing year(FY 2018-19)
Closing balance atthe end of ensuing
year(FY 2018-19)
5 Plant and Machinery 2,464.97 1,138.89 3,603.85
6 Lines and Cable Network 6,074.13 3,405.98 9,480.11
7 Vehicles 2.99 0.51 3.50
8 Furniture and Fixtures 3.70 0.44 4.14
9 Office Equipment 4.68 1.62 6.30
Total 10,227.47 4,624.90 14,852.37
10 Capital expenditure resulting in anassets not belonging to Company
- -
11 Spare Units/Service Units 11.11 11.11
12 Capital spare at generatingstation
- -
13 Assets taken over from Licenseespending final valuation
3.23 3.23
GRAND TOTAL 10,241.82 4,624.90 14,866.72
5.14.4. The Petitioner would like to submit that asset additions are done as per the
Capitalization plan an as per the approved schemes.
5.14.5. The Petitions would request the Hon’ble Commission to approve the GFA as estimated by the
Petitioner for FY 2018-19.
5.15. Depreciation on GFA
5.15.1. The depreciation has been computed annually based on straight line method by applying
weighted average rate of depreciation on the average GFA. For this purpose, the Petitioner
has adopted the Regulation 23 of the Bihar Electricity Regulatory Commission (Multi Year
Distribution Tariff) Regulations, 2015 read with Bihar Electricity Regulatory Commission
(Multi Year Distribution Tariff) (First Amendment) Regulations, 2017. The Petitioner has
followed Straight line depreciation method while calculating depreciation for FY 2018-19.
5.15.2. The rate of depreciations has been taken as notified by Central Electricity Regulatory
Commission. The Petitioner has reduced the depreciation on assets created out of Grants
from the gross depreciation to arrive at the net depreciation to be charged. The computation of
depreciation on the assets created out of Grants is based on the actual ratio of ‘Grants’ in
GFA.
5.15.3. Also it is to bring into kind attention of the Hon’ble Commission that the balance of GFA in
the beginning of the year and additions during the year does not include the value of Land
as it is a non-depreciable asset.
5.15.4. Below is the table demonstrating the depreciation projected by the Petitioner for FY 2018-
19 –
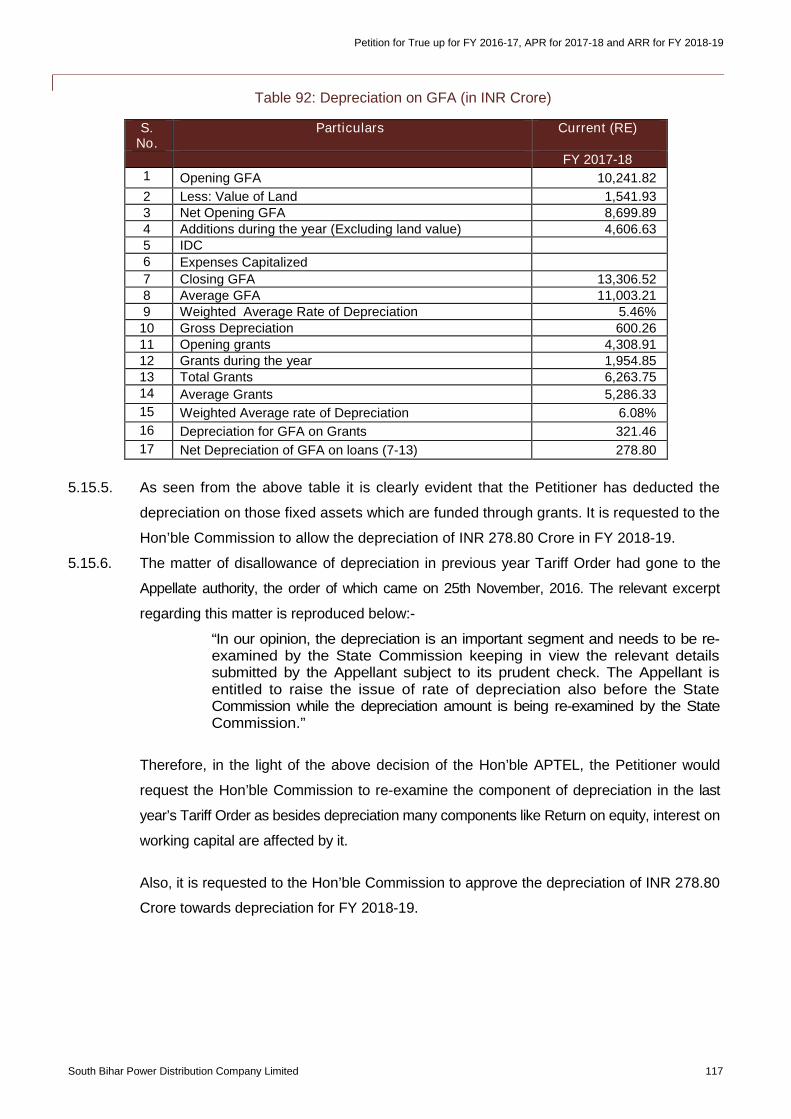
Petition for True up for FY 2016-17, APR for 2017-18 and ARR for FY 2018-19
South Bihar Power Distribution Company Limited 117
Table 92: Depreciation on GFA (in INR Crore)
S.No.
Particulars Current (RE)
FY 2017-181 Opening GFA 10,241.82
2 Less: Value of Land 1,541.933 Net Opening GFA 8,699.894 Additions during the year (Excluding land value) 4,606.635 IDC6 Expenses Capitalized
7 Closing GFA 13,306.528 Average GFA 11,003.219 Weighted Average Rate of Depreciation 5.46%10 Gross Depreciation 600.2611 Opening grants 4,308.9112 Grants during the year 1,954.8513 Total Grants 6,263.7514 Average Grants 5,286.33
15 Weighted Average rate of Depreciation 6.08%
16 Depreciation for GFA on Grants 321.46
17 Net Depreciation of GFA on loans (7-13) 278.80
5.15.5. As seen from the above table it is clearly evident that the Petitioner has deducted the
depreciation on those fixed assets which are funded through grants. It is requested to the
Hon’ble Commission to allow the depreciation of INR 278.80 Crore in FY 2018-19.
5.15.6. The matter of disallowance of depreciation in previous year Tariff Order had gone to the
Appellate authority, the order of which came on 25th November, 2016. The relevant excerpt
regarding this matter is reproduced below:-
“In our opinion, the depreciation is an important segment and needs to be re-examined by the State Commission keeping in view the relevant detailssubmitted by the Appellant subject to its prudent check. The Appellant isentitled to raise the issue of rate of depreciation also before the StateCommission while the depreciation amount is being re-examined by the StateCommission.”
Therefore, in the light of the above decision of the Hon’ble APTEL, the Petitioner would
request the Hon’ble Commission to re-examine the component of depreciation in the last
year’s Tariff Order as besides depreciation many components like Return on equity, interest on
working capital are affected by it.
Also, it is requested to the Hon’ble Commission to approve the depreciation of INR 278.80
Crore towards depreciation for FY 2018-19.
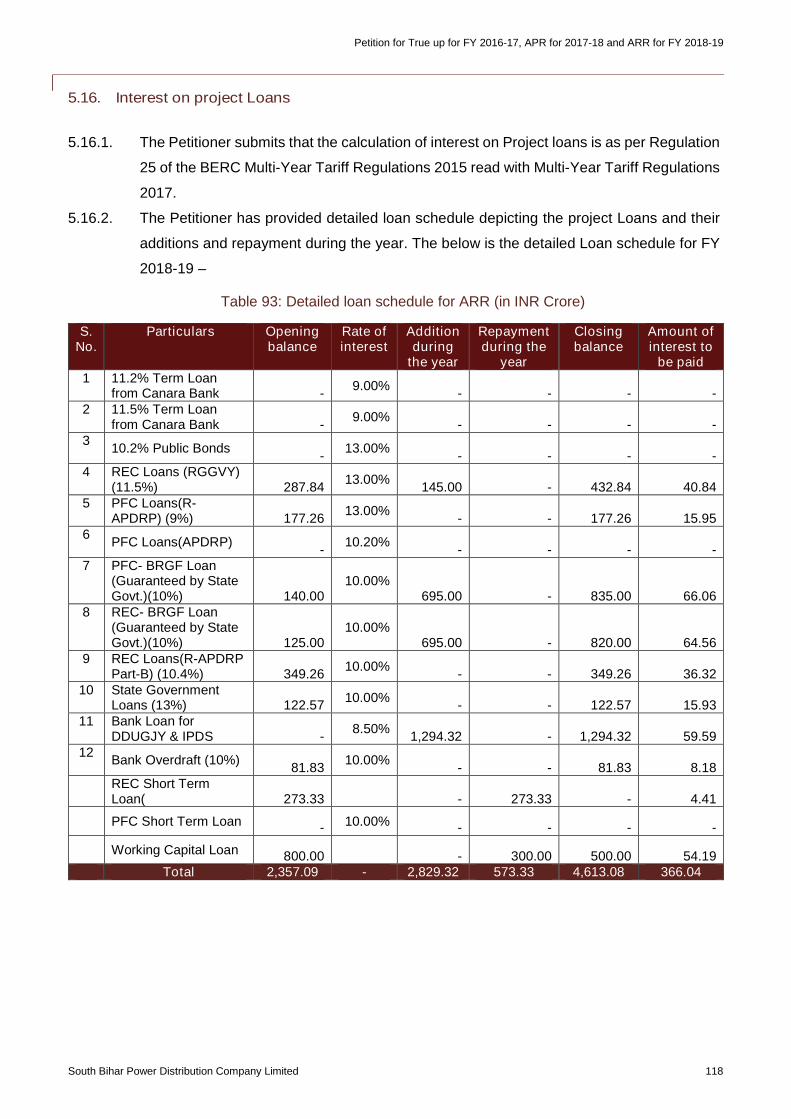
Petition for True up for FY 2016-17, APR for 2017-18 and ARR for FY 2018-19
South Bihar Power Distribution Company Limited 118
5.16. Interest on project Loans
5.16.1. The Petitioner submits that the calculation of interest on Project loans is as per Regulation
25 of the BERC Multi-Year Tariff Regulations 2015 read with Multi-Year Tariff Regulations
2017.
5.16.2. The Petitioner has provided detailed loan schedule depicting the project Loans and their
additions and repayment during the year. The below is the detailed Loan schedule for FY
2018-19 –
Table 93: Detailed loan schedule for ARR (in INR Crore)
S.No.
Particulars Openingbalance
Rate ofinterest
Additionduring
the year
Repaymentduring the
year
Closingbalance
Amount ofinterest to
be paid1 11.2% Term Loan
from Canara Bank -9.00%
- - - -2 11.5% Term Loan
from Canara Bank -9.00%
- - - -3
10.2% Public Bonds-
13.00%- - - -
4 REC Loans (RGGVY)(11.5%) 287.84
13.00%145.00 - 432.84 40.84
5 PFC Loans(R-APDRP) (9%) 177.26
13.00%- - 177.26 15.95
6PFC Loans(APDRP)
-10.20%
- - - -7 PFC- BRGF Loan
(Guaranteed by StateGovt.)(10%) 140.00
10.00%695.00 - 835.00 66.06
8 REC- BRGF Loan(Guaranteed by StateGovt.)(10%) 125.00
10.00%695.00 - 820.00 64.56
9 REC Loans(R-APDRPPart-B) (10.4%) 349.26
10.00%- - 349.26 36.32
10 State GovernmentLoans (13%) 122.57
10.00%- - 122.57 15.93
11 Bank Loan forDDUGJY & IPDS -
8.50%1,294.32 - 1,294.32 59.59
12Bank Overdraft (10%)
81.8310.00%
- - 81.83 8.18REC Short TermLoan( 273.33 - 273.33 - 4.41
PFC Short Term Loan - 10.00% - - - -
Working Capital Loan 800.00 - 300.00 500.00 54.19Total 2,357.09 - 2,829.32 573.33 4,613.08 366.04
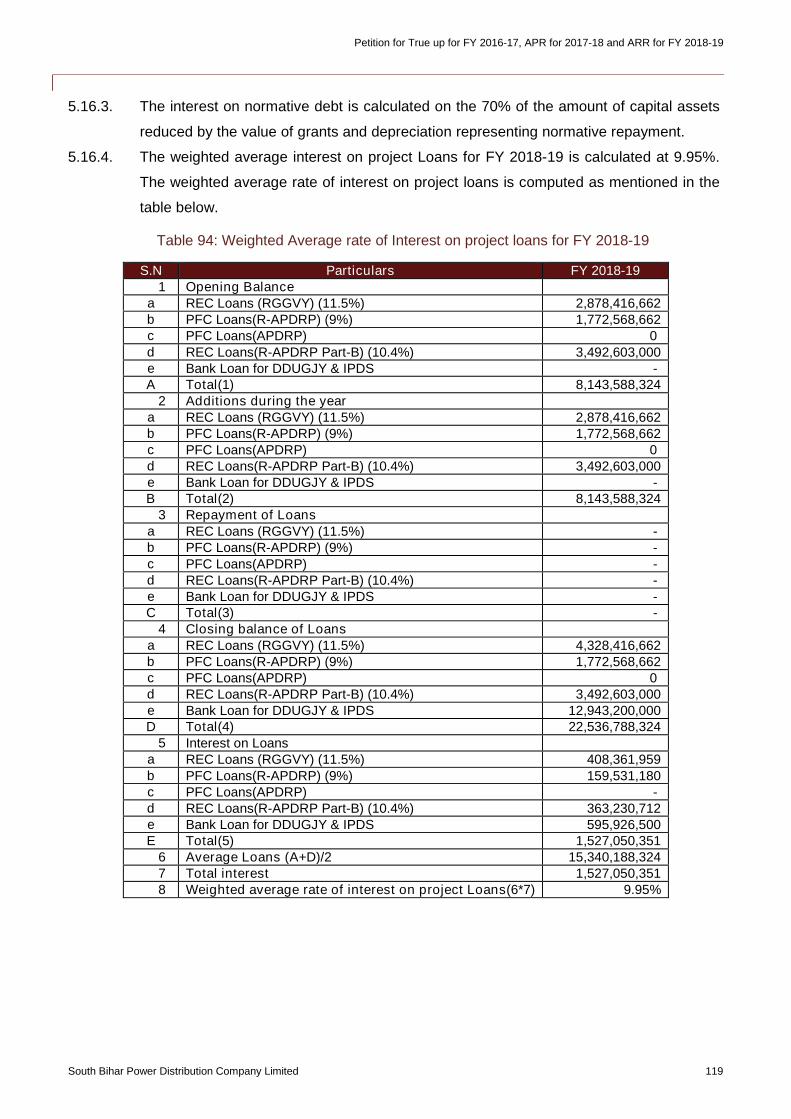
Petition for True up for FY 2016-17, APR for 2017-18 and ARR for FY 2018-19
South Bihar Power Distribution Company Limited 119
5.16.3. The interest on normative debt is calculated on the 70% of the amount of capital assets
reduced by the value of grants and depreciation representing normative repayment.
5.16.4. The weighted average interest on project Loans for FY 2018-19 is calculated at 9.95%.
The weighted average rate of interest on project loans is computed as mentioned in the
table below.
Table 94: Weighted Average rate of Interest on project loans for FY 2018-19
S.N Particulars FY 2018-191 Opening Balance
a REC Loans (RGGVY) (11.5%) 2,878,416,662b PFC Loans(R-APDRP) (9%) 1,772,568,662c PFC Loans(APDRP) 0d REC Loans(R-APDRP Part-B) (10.4%) 3,492,603,000e Bank Loan for DDUGJY & IPDS -A Total(1) 8,143,588,324
2 Additions during the yeara REC Loans (RGGVY) (11.5%) 2,878,416,662b PFC Loans(R-APDRP) (9%) 1,772,568,662c PFC Loans(APDRP) 0d REC Loans(R-APDRP Part-B) (10.4%) 3,492,603,000e Bank Loan for DDUGJY & IPDS -B Total(2) 8,143,588,324
3 Repayment of Loansa REC Loans (RGGVY) (11.5%) -b PFC Loans(R-APDRP) (9%) -c PFC Loans(APDRP) -d REC Loans(R-APDRP Part-B) (10.4%) -e Bank Loan for DDUGJY & IPDS -C Total(3) -
4 Closing balance of Loansa REC Loans (RGGVY) (11.5%) 4,328,416,662b PFC Loans(R-APDRP) (9%) 1,772,568,662c PFC Loans(APDRP) 0d REC Loans(R-APDRP Part-B) (10.4%) 3,492,603,000e Bank Loan for DDUGJY & IPDS 12,943,200,000D Total(4) 22,536,788,324
5 Interest on Loansa REC Loans (RGGVY) (11.5%) 408,361,959b PFC Loans(R-APDRP) (9%) 159,531,180c PFC Loans(APDRP) -d REC Loans(R-APDRP Part-B) (10.4%) 363,230,712e Bank Loan for DDUGJY & IPDS 595,926,500E Total(5) 1,527,050,351
6 Average Loans (A+D)/2 15,340,188,3247 Total interest 1,527,050,3518 Weighted average rate of interest on project Loans(6*7) 9.95%
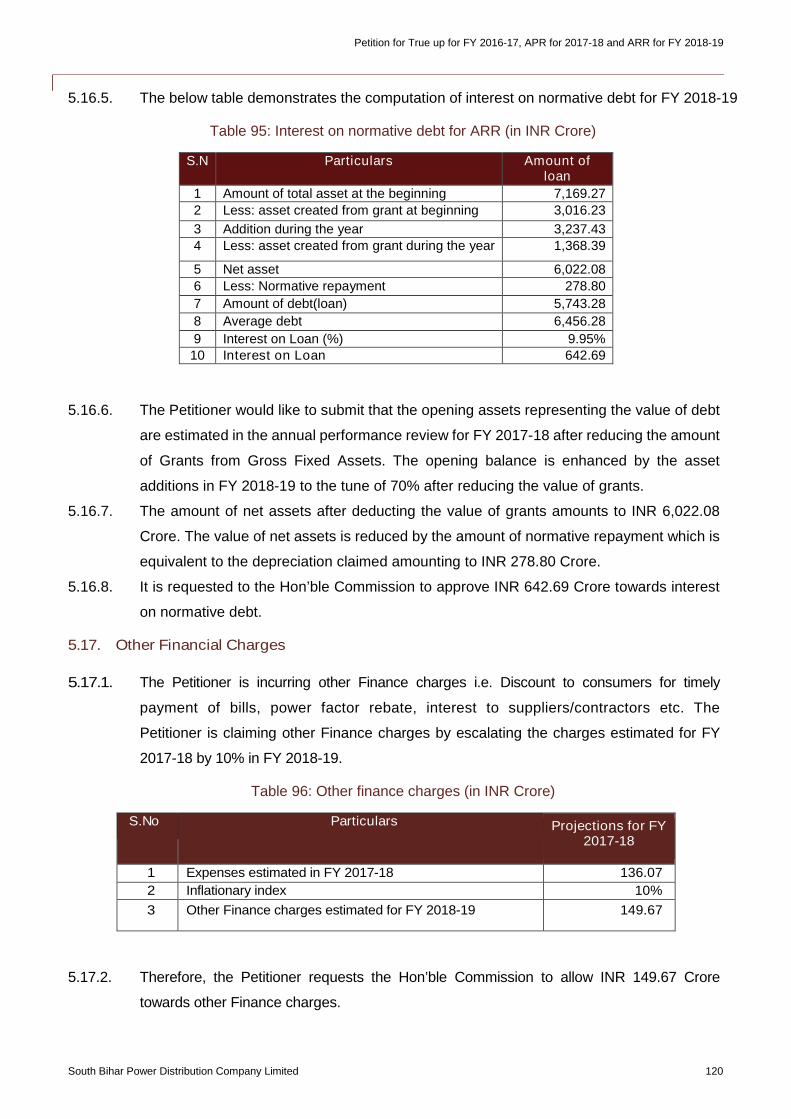
Petition for True up for FY 2016-17, APR for 2017-18 and ARR for FY 2018-19
South Bihar Power Distribution Company Limited 120
5.16.5. The below table demonstrates the computation of interest on normative debt for FY 2018-19
Table 95: Interest on normative debt for ARR (in INR Crore)
S.N Particulars Amount ofloan
1 Amount of total asset at the beginning 7,169.27
2 Less: asset created from grant at beginning 3,016.23
3 Addition during the year 3,237.43
4 Less: asset created from grant during the year 1,368.39
5 Net asset 6,022.08
6 Less: Normative repayment 278.80
7 Amount of debt(loan) 5,743.28
8 Average debt 6,456.28
9 Interest on Loan (%) 9.95%10 Interest on Loan 642.69
5.16.6. The Petitioner would like to submit that the opening assets representing the value of debt
are estimated in the annual performance review for FY 2017-18 after reducing the amount
of Grants from Gross Fixed Assets. The opening balance is enhanced by the asset
additions in FY 2018-19 to the tune of 70% after reducing the value of grants.
5.16.7. The amount of net assets after deducting the value of grants amounts to INR 6,022.08
Crore. The value of net assets is reduced by the amount of normative repayment which is
equivalent to the depreciation claimed amounting to INR 278.80 Crore.
5.16.8. It is requested to the Hon’ble Commission to approve INR 642.69 Crore towards interest
on normative debt.
5.17. Other Financial Charges
5.17.1. The Petitioner is incurring other Finance charges i.e. Discount to consumers for timely
payment of bills, power factor rebate, interest to suppliers/contractors etc. The
Petitioner is claiming other Finance charges by escalating the charges estimated for FY
2017-18 by 10% in FY 2018-19.
Table 96: Other finance charges (in INR Crore)
S.No Particulars Projections for FY2017-18
1 Expenses estimated in FY 2017-18 136.07
2 Inflationary index 10%
3 Other Finance charges estimated for FY 2018-19 149.67
5.17.2. Therefore, the Petitioner requests the Hon’ble Commission to allow INR 149.67 Crore
towards other Finance charges.
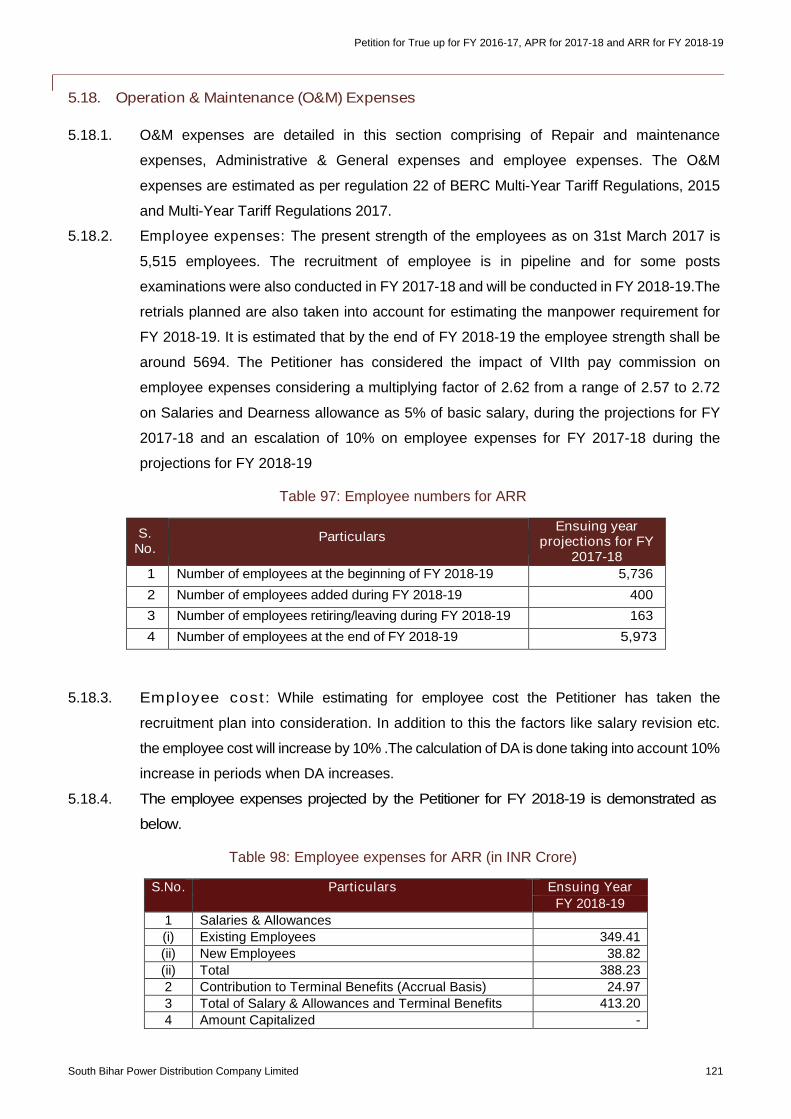
Petition for True up for FY 2016-17, APR for 2017-18 and ARR for FY 2018-19
South Bihar Power Distribution Company Limited 121
5.18. Operation & Maintenance (O&M) Expenses
5.18.1. O&M expenses are detailed in this section comprising of Repair and maintenance
expenses, Administrative & General expenses and employee expenses. The O&M
expenses are estimated as per regulation 22 of BERC Multi-Year Tariff Regulations, 2015
and Multi-Year Tariff Regulations 2017.
5.18.2. Employee expenses: The present strength of the employees as on 31st March 2017 is
5,515 employees. The recruitment of employee is in pipeline and for some posts
examinations were also conducted in FY 2017-18 and will be conducted in FY 2018-19.The
retrials planned are also taken into account for estimating the manpower requirement for
FY 2018-19. It is estimated that by the end of FY 2018-19 the employee strength shall be
around 5694. The Petitioner has considered the impact of VIIth pay commission on
employee expenses considering a multiplying factor of 2.62 from a range of 2.57 to 2.72
on Salaries and Dearness allowance as 5% of basic salary, during the projections for FY
2017-18 and an escalation of 10% on employee expenses for FY 2017-18 during the
projections for FY 2018-19
Table 97: Employee numbers for ARR
S.No.
ParticularsEnsuing year
projections for FY2017-18
1 Number of employees at the beginning of FY 2018-19 5,736
2 Number of employees added during FY 2018-19 400
3 Number of employees retiring/leaving during FY 2018-19 163
4 Number of employees at the end of FY 2018-19 5,973
5.18.3. Employee cost: While estimating for employee cost the Petitioner has taken the
recruitment plan into consideration. In addition to this the factors like salary revision etc.
the employee cost will increase by 10% .The calculation of DA is done taking into account 10%
increase in periods when DA increases.
5.18.4. The employee expenses projected by the Petitioner for FY 2018-19 is demonstrated as
below.
Table 98: Employee expenses for ARR (in INR Crore)
S.No. Particulars Ensuing Year
FY 2018-19
1 Salaries & Allowances
(i) Existing Employees 349.41
(ii) New Employees 38.82
(ii) Total 388.23
2 Contribution to Terminal Benefits (Accrual Basis) 24.97
3 Total of Salary & Allowances and Terminal Benefits 413.20
4 Amount Capitalized -
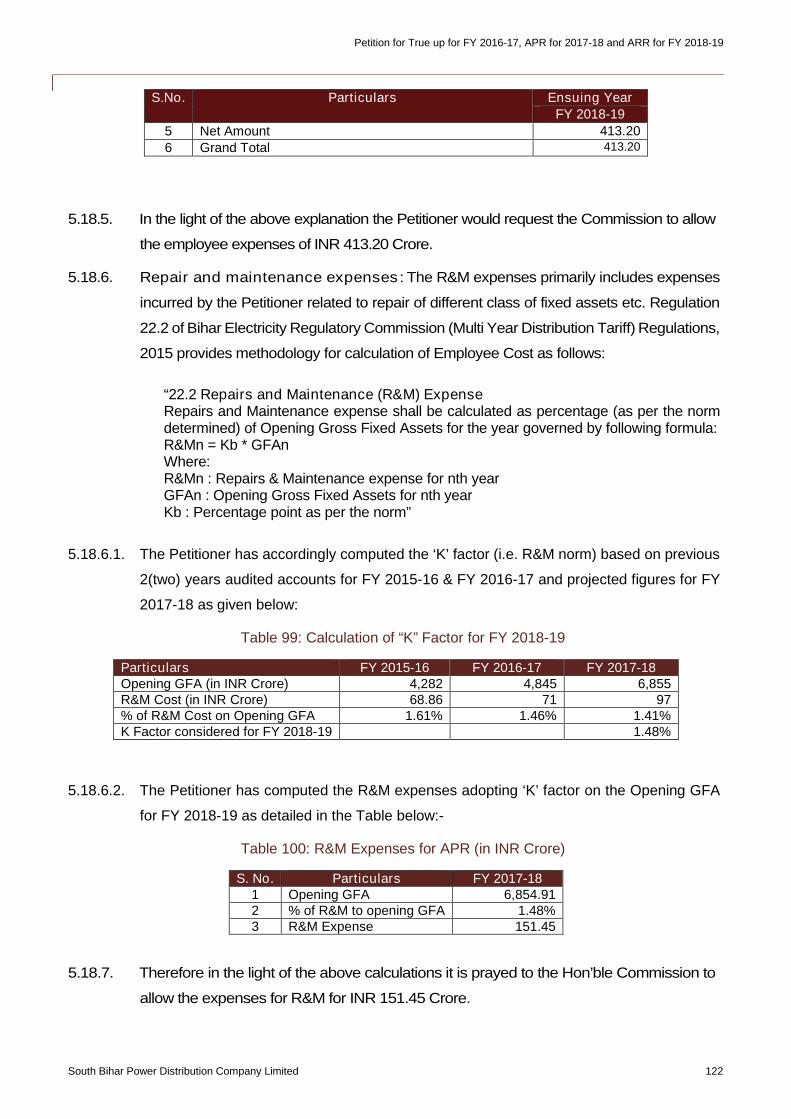
Petition for True up for FY 2016-17, APR for 2017-18 and ARR for FY 2018-19
South Bihar Power Distribution Company Limited 122
S.No. Particulars Ensuing Year
FY 2018-19
5 Net Amount 413.20
6 Grand Total 413.20
5.18.5. In the light of the above explanation the Petitioner would request the Commission to allow
the employee expenses of INR 413.20 Crore.
5.18.6. Repair and maintenance expenses: The R&M expenses primarily includes expenses
incurred by the Petitioner related to repair of different class of fixed assets etc. Regulation
22.2 of Bihar Electricity Regulatory Commission (Multi Year Distribution Tariff) Regulations,
2015 provides methodology for calculation of Employee Cost as follows:
“22.2 Repairs and Maintenance (R&M) ExpenseRepairs and Maintenance expense shall be calculated as percentage (as per the normdetermined) of Opening Gross Fixed Assets for the year governed by following formula:R&Mn = Kb * GFAnWhere:R&Mn : Repairs & Maintenance expense for nth yearGFAn : Opening Gross Fixed Assets for nth yearKb : Percentage point as per the norm”
5.18.6.1. The Petitioner has accordingly computed the ‘K’ factor (i.e. R&M norm) based on previous
2(two) years audited accounts for FY 2015-16 & FY 2016-17 and projected figures for FY
2017-18 as given below:
Table 99: Calculation of “K” Factor for FY 2018-19
Particulars FY 2015-16 FY 2016-17 FY 2017-18Opening GFA (in INR Crore) 4,282 4,845 6,855R&M Cost (in INR Crore) 68.86 71 97% of R&M Cost on Opening GFA 1.61% 1.46% 1.41%K Factor considered for FY 2018-19 1.48%
5.18.6.2. The Petitioner has computed the R&M expenses adopting ‘K’ factor on the Opening GFA
for FY 2018-19 as detailed in the Table below:-
Table 100: R&M Expenses for APR (in INR Crore)
S. No. Particulars FY 2017-181 Opening GFA 6,854.912 % of R&M to opening GFA 1.48%3 R&M Expense 151.45
5.18.7. Therefore in the light of the above calculations it is prayed to the Hon’ble Commission to
allow the expenses for R&M for INR 151.45 Crore.
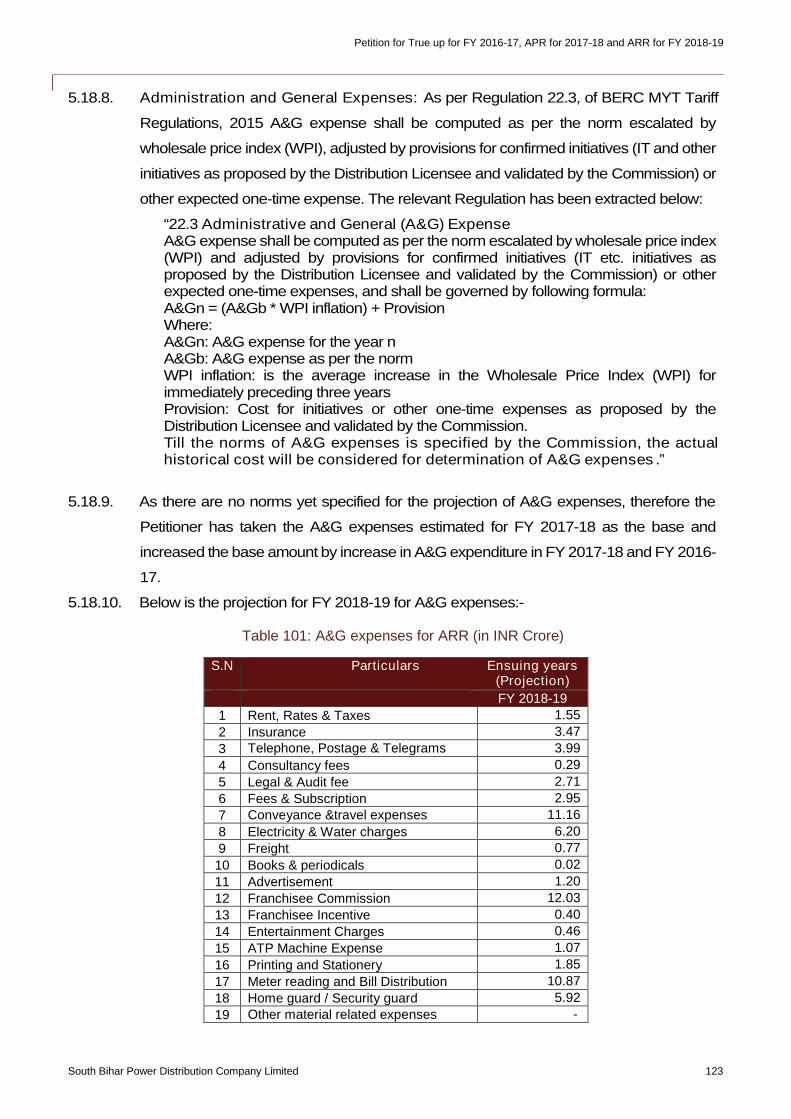
Petition for True up for FY 2016-17, APR for 2017-18 and ARR for FY 2018-19
South Bihar Power Distribution Company Limited 123
5.18.8. Administration and General Expenses: As per Regulation 22.3, of BERC MYT Tariff
Regulations, 2015 A&G expense shall be computed as per the norm escalated by
wholesale price index (WPI), adjusted by provisions for confirmed initiatives (IT and other
initiatives as proposed by the Distribution Licensee and validated by the Commission) or
other expected one-time expense. The relevant Regulation has been extracted below:
“22.3 Administrative and General (A&G) ExpenseA&G expense shall be computed as per the norm escalated by wholesale price index(WPI) and adjusted by provisions for confirmed initiatives (IT etc. initiatives asproposed by the Distribution Licensee and validated by the Commission) or otherexpected one-time expenses, and shall be governed by following formula:A&Gn = (A&Gb * WPI inflation) + ProvisionWhere:A&Gn: A&G expense for the year nA&Gb: A&G expense as per the normWPI inflation: is the average increase in the Wholesale Price Index (WPI) forimmediately preceding three yearsProvision: Cost for initiatives or other one-time expenses as proposed by theDistribution Licensee and validated by the Commission.Till the norms of A&G expenses is specified by the Commission, the actualhistorical cost will be considered for determination of A&G expenses .”
5.18.9. As there are no norms yet specified for the projection of A&G expenses, therefore the
Petitioner has taken the A&G expenses estimated for FY 2017-18 as the base and
increased the base amount by increase in A&G expenditure in FY 2017-18 and FY 2016-
17.
5.18.10. Below is the projection for FY 2018-19 for A&G expenses:-
Table 101: A&G expenses for ARR (in INR Crore)
S.N Particulars Ensuing years(Projection)
FY 2018-19
1 Rent, Rates & Taxes 1.55
2 Insurance 3.47
3 Telephone, Postage & Telegrams 3.99
4 Consultancy fees 0.29
5 Legal & Audit fee 2.71
6 Fees & Subscription 2.95
7 Conveyance &travel expenses 11.16
8 Electricity & Water charges 6.20
9 Freight 0.77
10 Books & periodicals 0.02
11 Advertisement 1.20
12 Franchisee Commission 12.03
13 Franchisee Incentive 0.40
14 Entertainment Charges 0.46
15 ATP Machine Expense 1.07
16 Printing and Stationery 1.85
17 Meter reading and Bill Distribution 10.87
18 Home guard / Security guard 5.92
19 Other material related expenses -
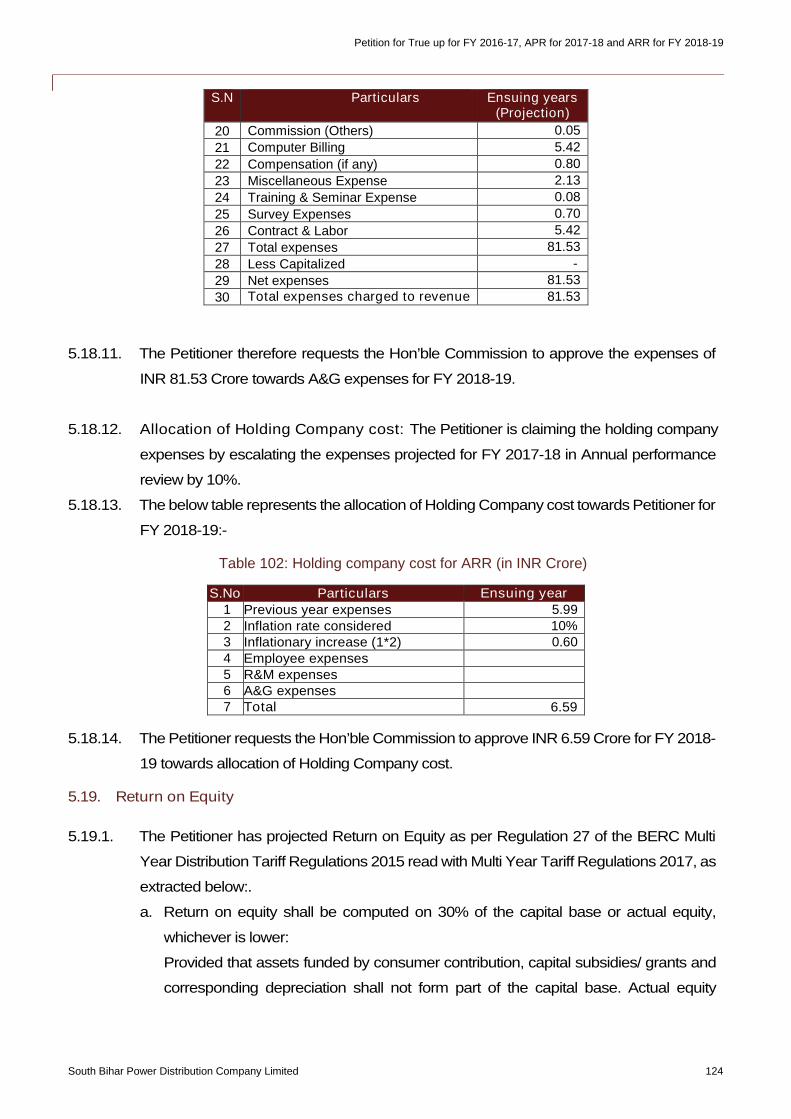
Petition for True up for FY 2016-17, APR for 2017-18 and ARR for FY 2018-19
South Bihar Power Distribution Company Limited 124
S.N Particulars Ensuing years(Projection)
20 Commission (Others) 0.05
21 Computer Billing 5.42
22 Compensation (if any) 0.80
23 Miscellaneous Expense 2.13
24 Training & Seminar Expense 0.08
25 Survey Expenses 0.70
26 Contract & Labor 5.42
27 Total expenses 81.53
28 Less Capitalized -
29 Net expenses 81.53
30 Total expenses charged to revenue 81.53
5.18.11. The Petitioner therefore requests the Hon’ble Commission to approve the expenses of
INR 81.53 Crore towards A&G expenses for FY 2018-19.
5.18.12. Allocation of Holding Company cost: The Petitioner is claiming the holding company
expenses by escalating the expenses projected for FY 2017-18 in Annual performance
review by 10%.
5.18.13. The below table represents the allocation of Holding Company cost towards Petitioner for
FY 2018-19:-
Table 102: Holding company cost for ARR (in INR Crore)
S.No Particulars Ensuing year1 Previous year expenses 5.992 Inflation rate considered 10%3 Inflationary increase (1*2) 0.604 Employee expenses5 R&M expenses6 A&G expenses7 Total 6.59
5.18.14. The Petitioner requests the Hon’ble Commission to approve INR 6.59 Crore for FY 2018-
19 towards allocation of Holding Company cost.
5.19. Return on Equity
5.19.1. The Petitioner has projected Return on Equity as per Regulation 27 of the BERC Multi
Year Distribution Tariff Regulations 2015 read with Multi Year Tariff Regulations 2017, as
extracted below:.
a. Return on equity shall be computed on 30% of the capital base or actual equity,
whichever is lower:
Provided that assets funded by consumer contribution, capital subsidies/ grants and
corresponding depreciation shall not form part of the capital base. Actual equity
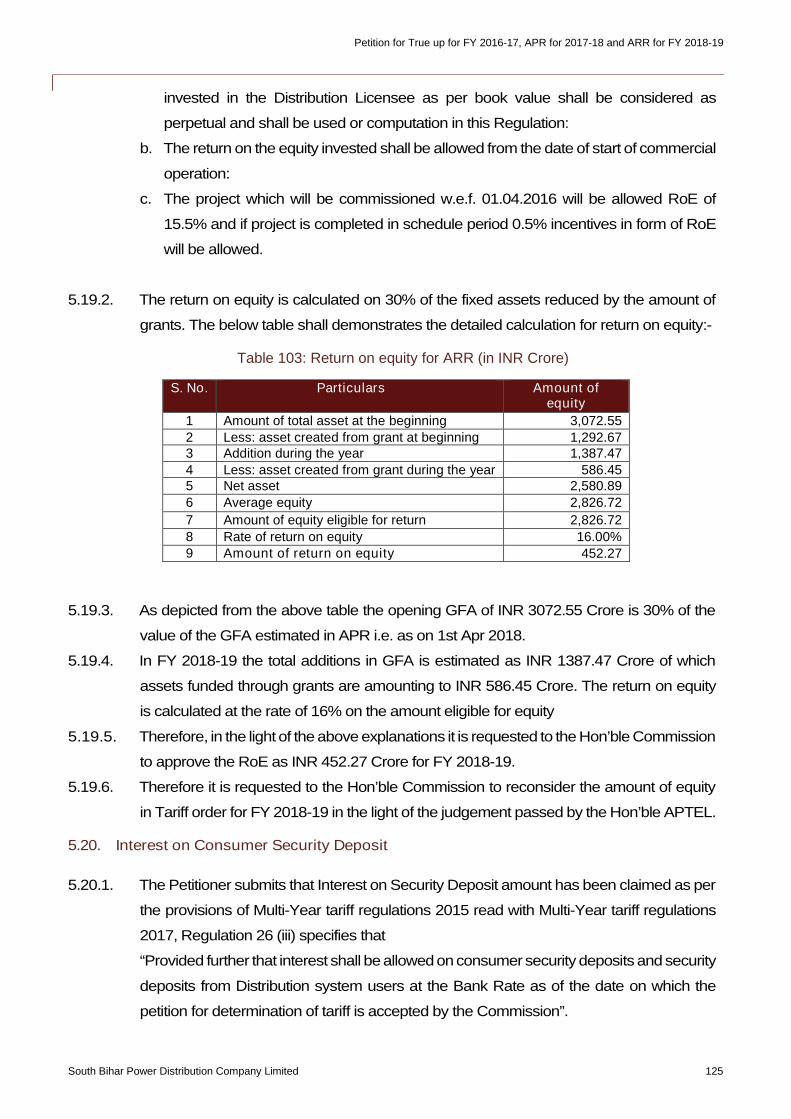
Petition for True up for FY 2016-17, APR for 2017-18 and ARR for FY 2018-19
South Bihar Power Distribution Company Limited 125
invested in the Distribution Licensee as per book value shall be considered as
perpetual and shall be used or computation in this Regulation:
b. The return on the equity invested shall be allowed from the date of start of commercial
operation:
c. The project which will be commissioned w.e.f. 01.04.2016 will be allowed RoE of
15.5% and if project is completed in schedule period 0.5% incentives in form of RoE
will be allowed.
5.19.2. The return on equity is calculated on 30% of the fixed assets reduced by the amount of
grants. The below table shall demonstrates the detailed calculation for return on equity:-
Table 103: Return on equity for ARR (in INR Crore)
S. No. Particulars Amount ofequity
1 Amount of total asset at the beginning 3,072.55
2 Less: asset created from grant at beginning 1,292.673 Addition during the year 1,387.47
4 Less: asset created from grant during the year 586.455 Net asset 2,580.89
6 Average equity 2,826.72
7 Amount of equity eligible for return 2,826.72
8 Rate of return on equity 16.00%9 Amount of return on equity 452.27
5.19.3. As depicted from the above table the opening GFA of INR 3072.55 Crore is 30% of the
value of the GFA estimated in APR i.e. as on 1st Apr 2018.
5.19.4. In FY 2018-19 the total additions in GFA is estimated as INR 1387.47 Crore of which
assets funded through grants are amounting to INR 586.45 Crore. The return on equity
is calculated at the rate of 16% on the amount eligible for equity
5.19.5. Therefore, in the light of the above explanations it is requested to the Hon’ble Commission
to approve the RoE as INR 452.27 Crore for FY 2018-19.
5.19.6. Therefore it is requested to the Hon’ble Commission to reconsider the amount of equity
in Tariff order for FY 2018-19 in the light of the judgement passed by the Hon’ble APTEL.
5.20. Interest on Consumer Security Deposit
5.20.1. The Petitioner submits that Interest on Security Deposit amount has been claimed as per
the provisions of Multi-Year tariff regulations 2015 read with Multi-Year tariff regulations
2017, Regulation 26 (iii) specifies that
“Provided further that interest shall be allowed on consumersecurity deposits and security
deposits from Distribution system users at the Bank Rate as of the date on which the
petition for determination of tariff is accepted by the Commission”.
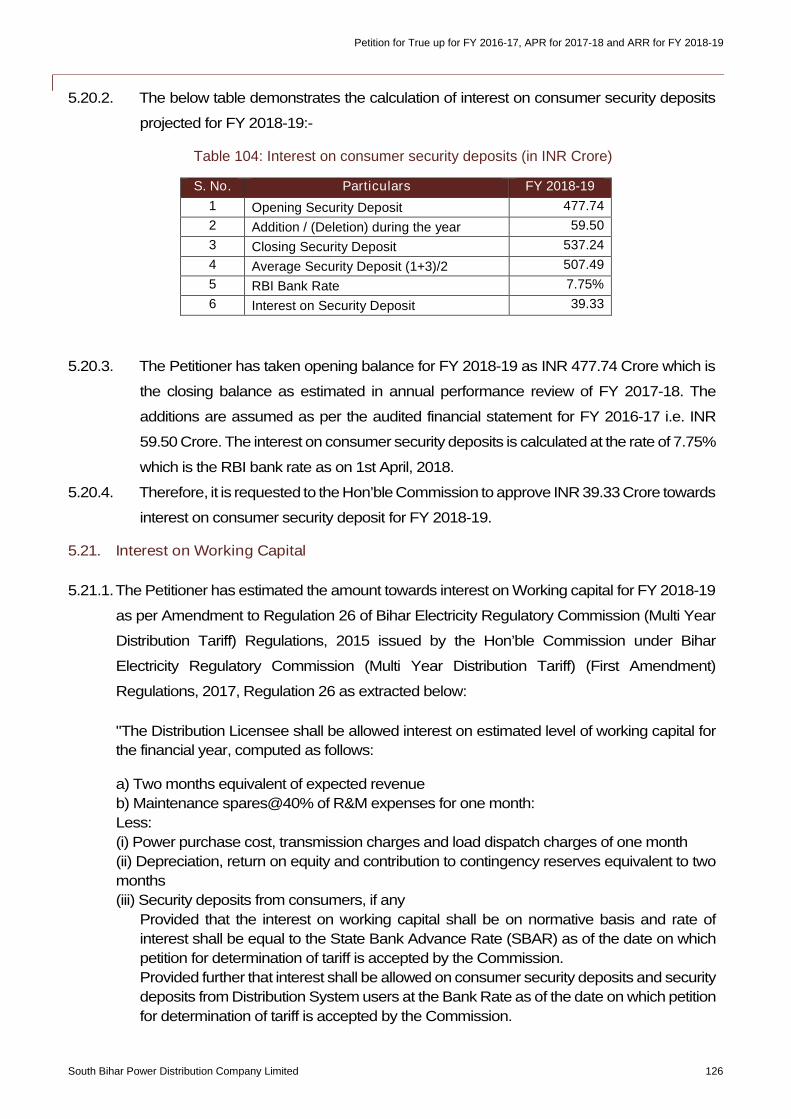
Petition for True up for FY 2016-17, APR for 2017-18 and ARR for FY 2018-19
South Bihar Power Distribution Company Limited 126
5.20.2. The below table demonstrates the calculation of interest on consumer security deposits
projected for FY 2018-19:-
Table 104: Interest on consumer security deposits (in INR Crore)
S. No. Particulars FY 2018-19
1 Opening Security Deposit 477.74
2 Addition / (Deletion) during the year 59.50
3 Closing Security Deposit 537.24
4 Average Security Deposit (1+3)/2 507.49
5 RBI Bank Rate 7.75%
6 Interest on Security Deposit 39.33
5.20.3. The Petitioner has taken opening balance for FY 2018-19 as INR 477.74 Crore which is
the closing balance as estimated in annual performance review of FY 2017-18. The
additions are assumed as per the audited financial statement for FY 2016-17 i.e. INR
59.50 Crore. The interest on consumer security deposits is calculated at the rate of 7.75%
which is the RBI bank rate as on 1st April, 2018.
5.20.4. Therefore, it is requested to the Hon’ble Commission to approve INR 39.33 Crore towards
interest on consumer security deposit for FY 2018-19.
5.21. Interest on Working Capital
5.21.1.The Petitioner has estimated the amount towards interest on Working capital for FY 2018-19
as per Amendment to Regulation 26 of Bihar Electricity Regulatory Commission (Multi Year
Distribution Tariff) Regulations, 2015 issued by the Hon’ble Commission under Bihar
Electricity Regulatory Commission (Multi Year Distribution Tariff) (First Amendment)
Regulations, 2017, Regulation 26 as extracted below:
"The Distribution Licensee shall be allowed interest on estimated level of working capital for
the financial year, computed as follows:
a) Two months equivalent of expected revenue
b) Maintenance spares@40% of R&M expenses for one month:
Less:
(i) Power purchase cost, transmission charges and load dispatch charges of one month
(ii) Depreciation, return on equity and contribution to contingency reserves equivalent to two
months
(iii) Security deposits from consumers, if any
Provided that the interest on working capital shall be on normative basis and rate of
interest shall be equal to the State Bank Advance Rate (SBAR) as of the date on which
petition for determination of tariff is accepted by the Commission.
Provided further that interest shall be allowed on consumer security deposits and security
deposits from Distribution System users at the Bank Rate as of the date on which petition
for determination of tariff is accepted by the Commission.
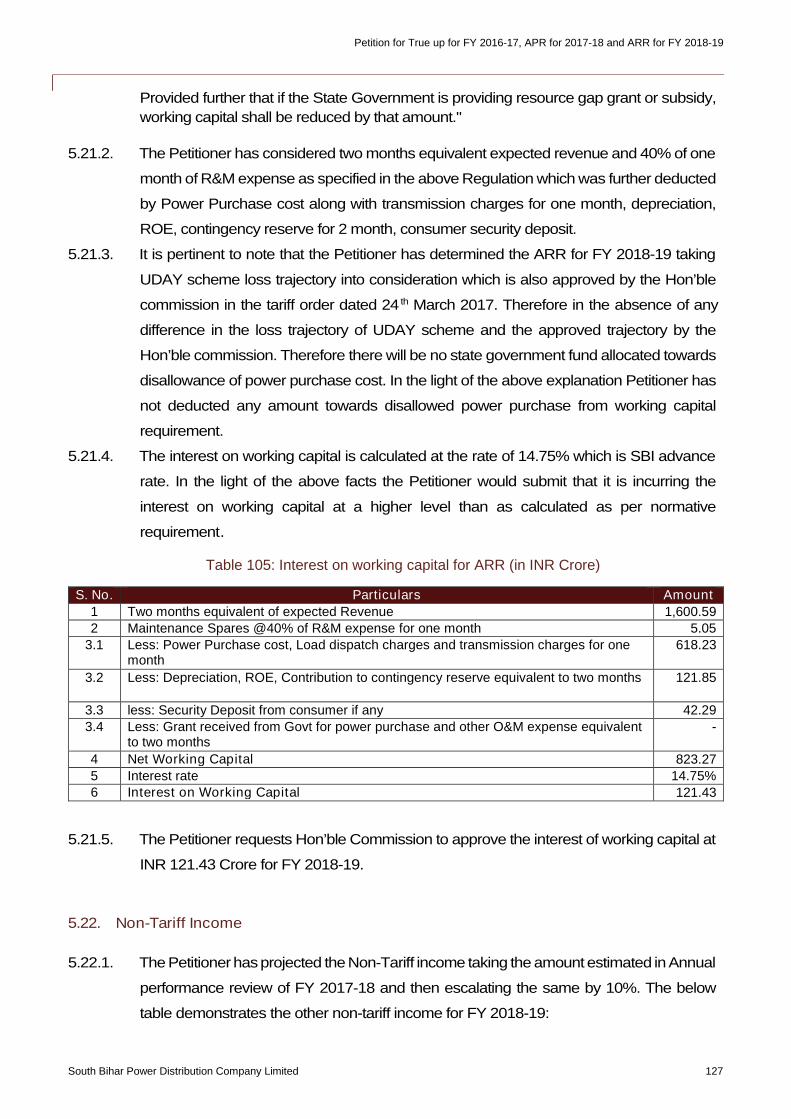
Petition for True up for FY 2016-17, APR for 2017-18 and ARR for FY 2018-19
South Bihar Power Distribution Company Limited 127
Provided further that if the State Government is providing resource gap grant or subsidy,
working capital shall be reduced by that amount."
5.21.2. The Petitioner has considered two months equivalent expected revenue and 40% of one
month of R&M expense as specified in the above Regulation which was further deducted
by Power Purchase cost along with transmission charges for one month, depreciation,
ROE, contingency reserve for 2 month, consumer security deposit.
5.21.3. It is pertinent to note that the Petitioner has determined the ARR for FY 2018-19 taking
UDAY scheme loss trajectory into consideration which is also approved by the Hon’ble
commission in the tariff order dated 24 th March 2017. Therefore in the absence of any
difference in the loss trajectory of UDAY scheme and the approved trajectory by the
Hon’ble commission. Therefore there will be no state government fund allocated towards
disallowance of power purchase cost. In the light of the above explanation Petitioner has
not deducted any amount towards disallowed power purchase from working capital
requirement.
5.21.4. The interest on working capital is calculated at the rate of 14.75% which is SBI advance
rate. In the light of the above facts the Petitioner would submit that it is incurring the
interest on working capital at a higher level than as calculated as per normative
requirement.
Table 105: Interest on working capital for ARR (in INR Crore)
S. No. Particulars Amount
1 Two months equivalent of expected Revenue 1,600.59
2 Maintenance Spares @40% of R&M expense for one month 5.05
3.1 Less: Power Purchase cost, Load dispatch charges and transmission charges for onemonth
618.23
3.2 Less: Depreciation, ROE, Contribution to contingency reserve equivalent to two months 121.85
3.3 less: Security Deposit from consumer if any 42.29
3.4 Less: Grant received from Govt for power purchase and other O&M expense equivalentto two months
-
4 Net Working Capital 823.27
5 Interest rate 14.75%6 Interest on Working Capital 121.43
5.21.5. The Petitioner requests Hon’ble Commission to approve the interest of working capital at
INR 121.43 Crore for FY 2018-19.
5.22. Non-Tariff Income
5.22.1. The Petitionerhasprojected the Non-Tariff income taking the amount estimated in Annual
performance review of FY 2017-18 and then escalating the same by 10%. The below
table demonstrates the other non-tariff income for FY 2018-19:
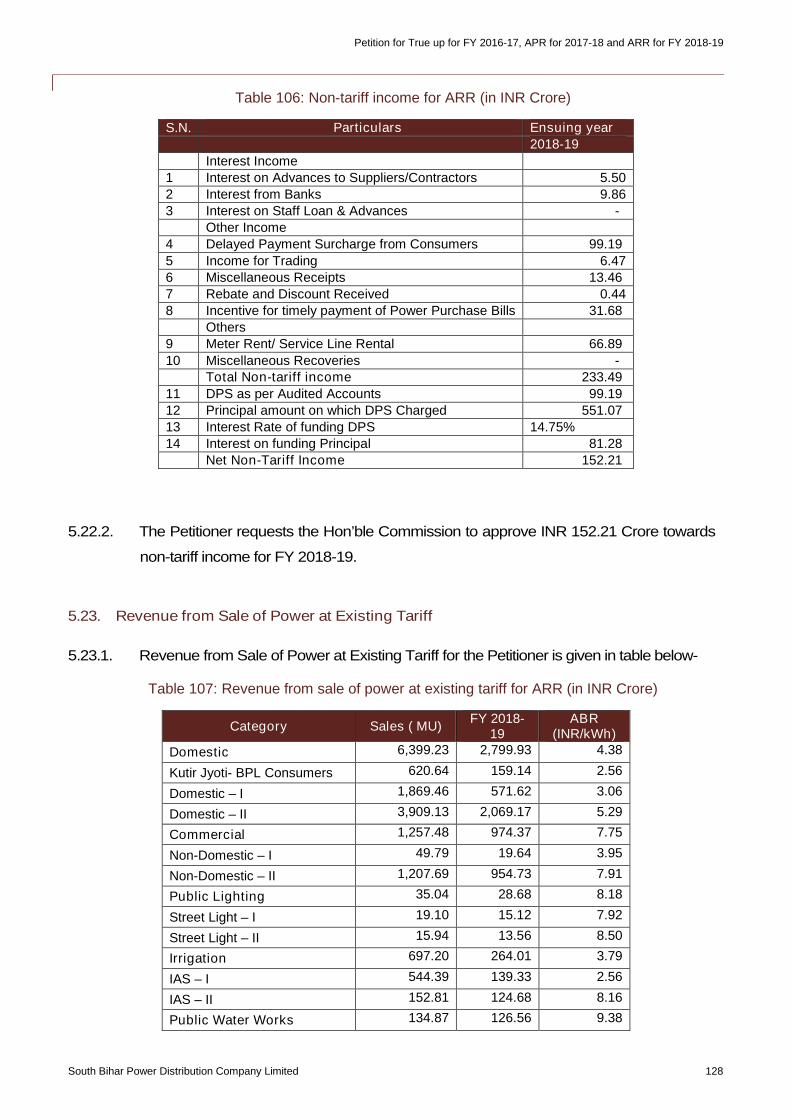
Petition for True up for FY 2016-17, APR for 2017-18 and ARR for FY 2018-19
South Bihar Power Distribution Company Limited 128
Table 106: Non-tariff income for ARR (in INR Crore)
S.N. Particulars Ensuing year
2018-19
Interest Income
1 Interest on Advances to Suppliers/Contractors 5.50
2 Interest from Banks 9.86
3 Interest on Staff Loan & Advances -
Other Income
4 Delayed Payment Surcharge from Consumers 99.19
5 Income for Trading 6.47
6 Miscellaneous Receipts 13.46
7 Rebate and Discount Received 0.44
8 Incentive for timely payment of Power Purchase Bills 31.68
Others
9 Meter Rent/ Service Line Rental 66.89
10 Miscellaneous Recoveries -Total Non-tariff income 233.49
11 DPS as per Audited Accounts 99.19
12 Principal amount on which DPS Charged 551.07
13 Interest Rate of funding DPS 14.75%
14 Interest on funding Principal 81.28
Net Non-Tariff Income 152.21
5.22.2. The Petitioner requests the Hon’ble Commission to approve INR 152.21 Crore towards
non-tariff income for FY 2018-19.
5.23. Revenue from Sale of Power at Existing Tariff
5.23.1. Revenue from Sale of Power at Existing Tariff for the Petitioner is given in table below-
Table 107: Revenue from sale of power at existing tariff for ARR (in INR Crore)
Category Sales ( MU)FY 2018-
19ABR
(INR/kWh)
Domestic 6,399.23 2,799.93 4.38
Kutir Jyoti- BPL Consumers 620.64 159.14 2.56
Domestic – I 1,869.46 571.62 3.06
Domestic – II 3,909.13 2,069.17 5.29
Commercial 1,257.48 974.37 7.75
Non-Domestic – I 49.79 19.64 3.95
Non-Domestic – II 1,207.69 954.73 7.91
Public Lighting 35.04 28.68 8.18
Street Light – I 19.10 15.12 7.92
Street Light – II 15.94 13.56 8.50
Irrigation 697.20 264.01 3.79
IAS – I 544.39 139.33 2.56
IAS – II 152.81 124.68 8.16
Public Water Works 134.87 126.56 9.38
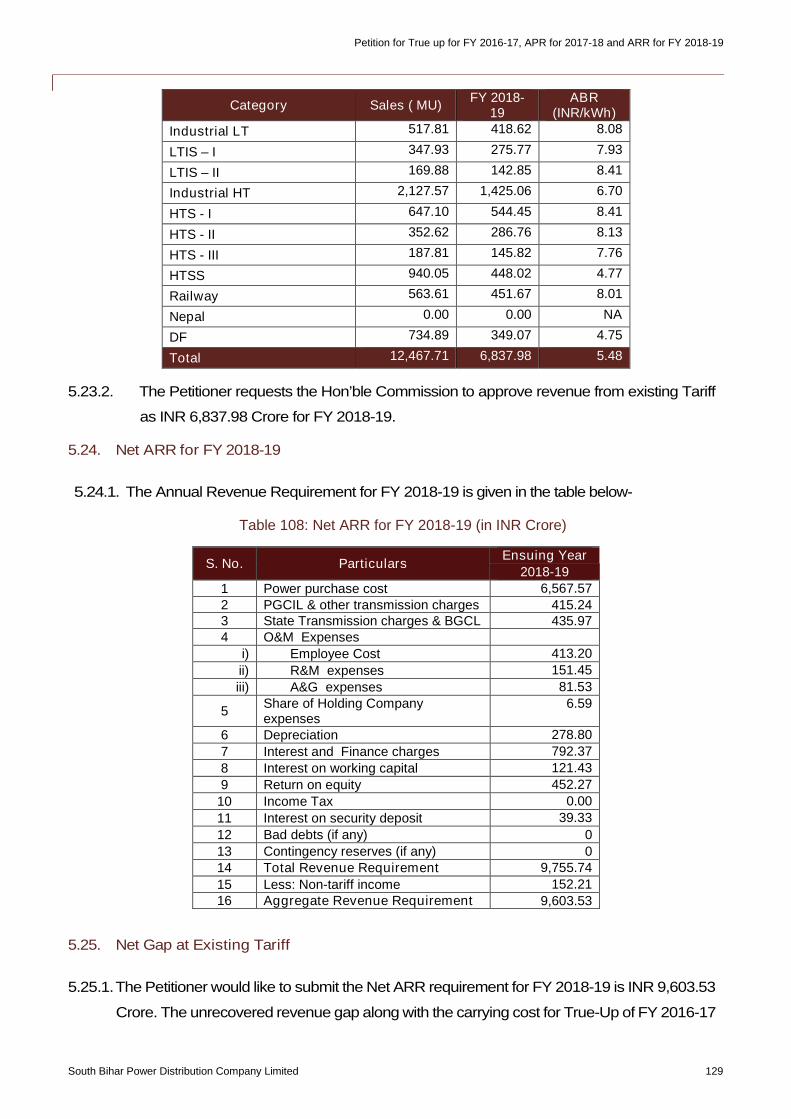
Petition for True up for FY 2016-17, APR for 2017-18 and ARR for FY 2018-19
South Bihar Power Distribution Company Limited 129
Category Sales ( MU)FY 2018-
19ABR
(INR/kWh)
Industrial LT 517.81 418.62 8.08
LTIS – I 347.93 275.77 7.93
LTIS – II 169.88 142.85 8.41
Industrial HT 2,127.57 1,425.06 6.70
HTS - I 647.10 544.45 8.41
HTS - II 352.62 286.76 8.13
HTS - III 187.81 145.82 7.76
HTSS 940.05 448.02 4.77
Railway 563.61 451.67 8.01
Nepal 0.00 0.00 NA
DF 734.89 349.07 4.75
Total 12,467.71 6,837.98 5.48
5.23.2. The Petitioner requests the Hon’ble Commission to approve revenue from existing Tariff
as INR 6,837.98 Crore for FY 2018-19.
5.24. Net ARR for FY 2018-19
5.24.1. The Annual Revenue Requirement for FY 2018-19 is given in the table below-
Table 108: Net ARR for FY 2018-19 (in INR Crore)
S. No. ParticularsEnsuing Year
2018-19
1 Power purchase cost 6,567.57
2 PGCIL & other transmission charges 415.243 State Transmission charges & BGCL 435.974 O&M Expenses
i) Employee Cost 413.20
ii) R&M expenses 151.45
iii) A&G expenses 81.53
5Share of Holding Companyexpenses
6.59
6 Depreciation 278.80
7 Interest and Finance charges 792.37
8 Interest on working capital 121.43
9 Return on equity 452.27
10 Income Tax 0.00
11 Interest on security deposit 39.33
12 Bad debts (if any) 0
13 Contingency reserves (if any) 014 Total Revenue Requirement 9,755.74
15 Less: Non-tariff income 152.2116 Aggregate Revenue Requirement 9,603.53
5.25. Net Gap at Existing Tariff
5.25.1.The Petitioner would like to submit the Net ARR requirement for FY 2018-19 is INR 9,603.53
Crore. The unrecovered revenue gap along with the carrying cost for True-Up of FY 2016-17
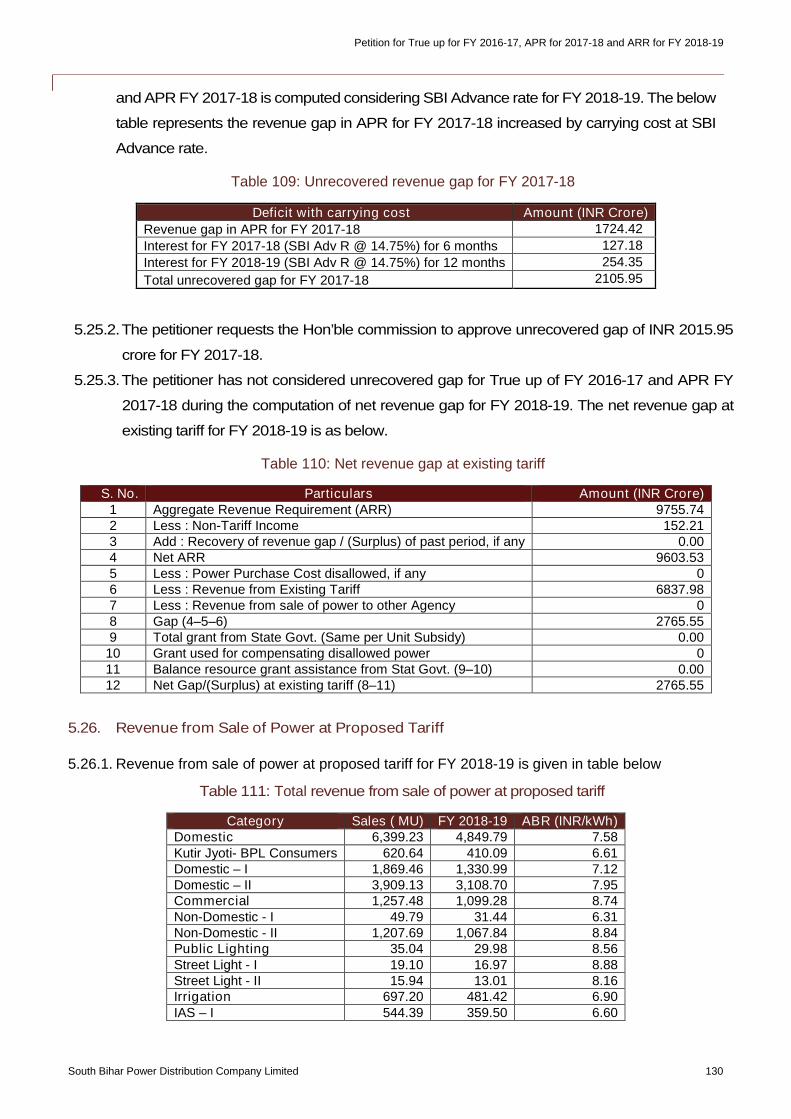
Petition for True up for FY 2016-17, APR for 2017-18 and ARR for FY 2018-19
South Bihar Power Distribution Company Limited 130
and APR FY 2017-18 is computed considering SBI Advance rate for FY 2018-19. The below
table represents the revenue gap in APR for FY 2017-18 increased by carrying cost at SBI
Advance rate.
Table 109: Unrecovered revenue gap for FY 2017-18
Deficit with carrying cost Amount (INR Crore)
Revenue gap in APR for FY 2017-18 1724.42
Interest for FY 2017-18 (SBI Adv R @ 14.75%) for 6 months 127.18
Interest for FY 2018-19 (SBI Adv R @ 14.75%) for 12 months 254.35
Total unrecovered gap for FY 2017-18 2105.95
5.25.2.The petitioner requests the Hon’ble commission to approve unrecovered gap of INR 2015.95
crore for FY 2017-18.
5.25.3.The petitioner has not considered unrecovered gap for True up of FY 2016-17 and APR FY
2017-18 during the computation of net revenue gap for FY 2018-19. The net revenue gap at
existing tariff for FY 2018-19 is as below.
Table 110: Net revenue gap at existing tariff
S. No. Particulars Amount (INR Crore)1 Aggregate Revenue Requirement (ARR) 9755.742 Less : Non-Tariff Income 152.213 Add : Recovery of revenue gap / (Surplus) of past period, if any 0.004 Net ARR 9603.535 Less : Power Purchase Cost disallowed, if any 06 Less : Revenue from Existing Tariff 6837.987 Less : Revenue from sale of power to other Agency 08 Gap (4–5–6) 2765.559 Total grant from State Govt. (Same per Unit Subsidy) 0.00
10 Grant used for compensating disallowed power 011 Balance resource grant assistance from Stat Govt. (9–10) 0.0012 Net Gap/(Surplus) at existing tariff (8–11) 2765.55
5.26. Revenue from Sale of Power at Proposed Tariff
5.26.1. Revenue from sale of power at proposed tariff for FY 2018-19 is given in table below
Table 111: Total revenue from sale of power at proposed tariff
Category Sales ( MU) FY 2018-19 ABR (INR/kWh)Domestic 6,399.23 4,849.79 7.58Kutir Jyoti- BPL Consumers 620.64 410.09 6.61Domestic – I 1,869.46 1,330.99 7.12Domestic – II 3,909.13 3,108.70 7.95Commercial 1,257.48 1,099.28 8.74Non-Domestic - I 49.79 31.44 6.31Non-Domestic - II 1,207.69 1,067.84 8.84Public Lighting 35.04 29.98 8.56Street Light - I 19.10 16.97 8.88Street Light - II 15.94 13.01 8.16Irrigation 697.20 481.42 6.90IAS – I 544.39 359.50 6.60
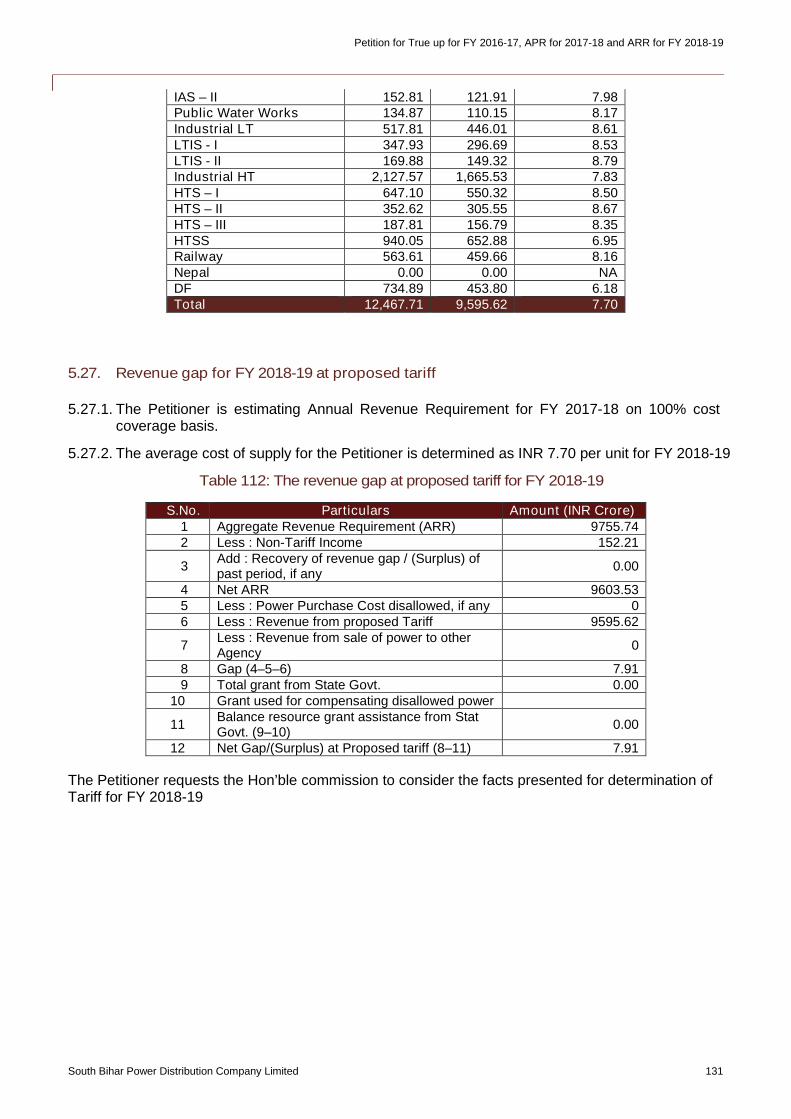
Petition for True up for FY 2016-17, APR for 2017-18 and ARR for FY 2018-19
South Bihar Power Distribution Company Limited 131
5.27. Revenue gap for FY 2018-19 at proposed tariff
5.27.1. The Petitioner is estimating Annual Revenue Requirement for FY 2017-18 on 100% costcoverage basis.
5.27.2. The average cost of supply for the Petitioner is determined as INR 7.70 per unit for FY 2018-19
Table 112: The revenue gap at proposed tariff for FY 2018-19
S.No. Particulars Amount (INR Crore)1 Aggregate Revenue Requirement (ARR) 9755.742 Less : Non-Tariff Income 152.21
3Add : Recovery of revenue gap / (Surplus) ofpast period, if any
0.00
4 Net ARR 9603.535 Less : Power Purchase Cost disallowed, if any 06 Less : Revenue from proposed Tariff 9595.62
7Less : Revenue from sale of power to otherAgency
0
8 Gap (4–5–6) 7.919 Total grant from State Govt. 0.00
10 Grant used for compensating disallowed power
11Balance resource grant assistance from StatGovt. (9–10)
0.00
12 Net Gap/(Surplus) at Proposed tariff (8–11) 7.91
The Petitioner requests the Hon’ble commission to consider the facts presented for determination ofTariff for FY 2018-19
IAS – II 152.81 121.91 7.98Public Water Works 134.87 110.15 8.17Industrial LT 517.81 446.01 8.61LTIS - I 347.93 296.69 8.53LTIS - II 169.88 149.32 8.79Industrial HT 2,127.57 1,665.53 7.83HTS – I 647.10 550.32 8.50HTS – II 352.62 305.55 8.67HTS – III 187.81 156.79 8.35HTSS 940.05 652.88 6.95Railway 563.61 459.66 8.16Nepal 0.00 0.00 NADF 734.89 453.80 6.18Total 12,467.71 9,595.62 7.70
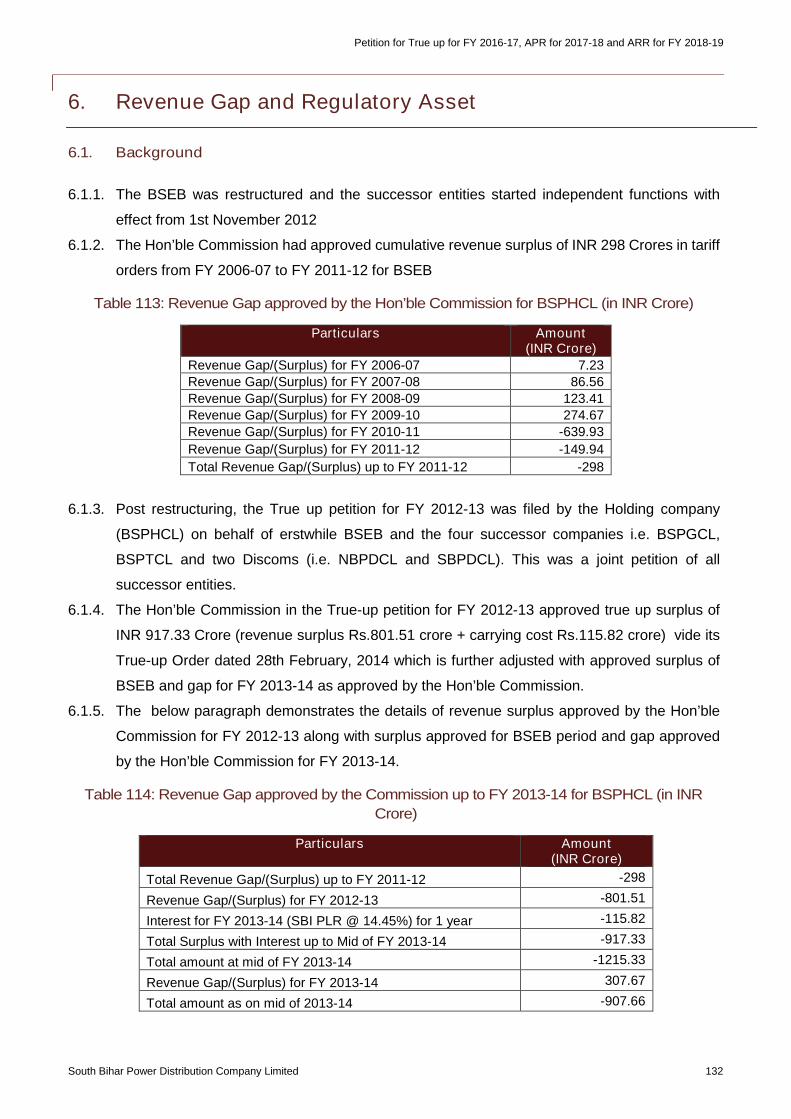
Petition for True up for FY 2016-17, APR for 2017-18 and ARR for FY 2018-19
South Bihar Power Distribution Company Limited 132
6. Revenue Gap and Regulatory Asset
6.1. Background
6.1.1. The BSEB was restructured and the successor entities started independent functions with
effect from 1st November 2012
6.1.2. The Hon’ble Commission had approved cumulative revenue surplus of INR 298 Crores in tariff
orders from FY 2006-07 to FY 2011-12 for BSEB
Table 113: Revenue Gap approved by the Hon’ble Commission for BSPHCL (in INR Crore)
Particulars Amount(INR Crore)
Revenue Gap/(Surplus) for FY 2006-07 7.23
Revenue Gap/(Surplus) for FY 2007-08 86.56
Revenue Gap/(Surplus) for FY 2008-09 123.41
Revenue Gap/(Surplus) for FY 2009-10 274.67
Revenue Gap/(Surplus) for FY 2010-11 -639.93
Revenue Gap/(Surplus) for FY 2011-12 -149.94
Total Revenue Gap/(Surplus) up to FY 2011-12 -298
6.1.3. Post restructuring, the True up petition for FY 2012-13 was filed by the Holding company
(BSPHCL) on behalf of erstwhile BSEB and the four successor companies i.e. BSPGCL,
BSPTCL and two Discoms (i.e. NBPDCL and SBPDCL). This was a joint petition of all
successor entities.
6.1.4. The Hon’ble Commission in the True-up petition for FY 2012-13 approved true up surplus of
INR 917.33 Crore (revenue surplus Rs.801.51 crore + carrying cost Rs.115.82 crore) vide its
True-up Order dated 28th February, 2014 which is further adjusted with approved surplus of
BSEB and gap for FY 2013-14 as approved by the Hon’ble Commission.
6.1.5. The below paragraph demonstrates the details of revenue surplus approved by the Hon’ble
Commission for FY 2012-13 along with surplus approved for BSEB period and gap approved
by the Hon’ble Commission for FY 2013-14.
Table 114: Revenue Gap approved by the Commission up to FY 2013-14 for BSPHCL (in INR
Crore)
Particulars Amount(INR Crore)
Total Revenue Gap/(Surplus) up to FY 2011-12 -298
Revenue Gap/(Surplus) for FY 2012-13 -801.51
Interest for FY 2013-14 (SBI PLR @ 14.45%) for 1 year -115.82
Total Surplus with Interest up to Mid of FY 2013-14 -917.33
Total amount at mid of FY 2013-14 -1215.33
Revenue Gap/(Surplus) for FY 2013-14 307.67
Total amount as on mid of 2013-14 -907.66
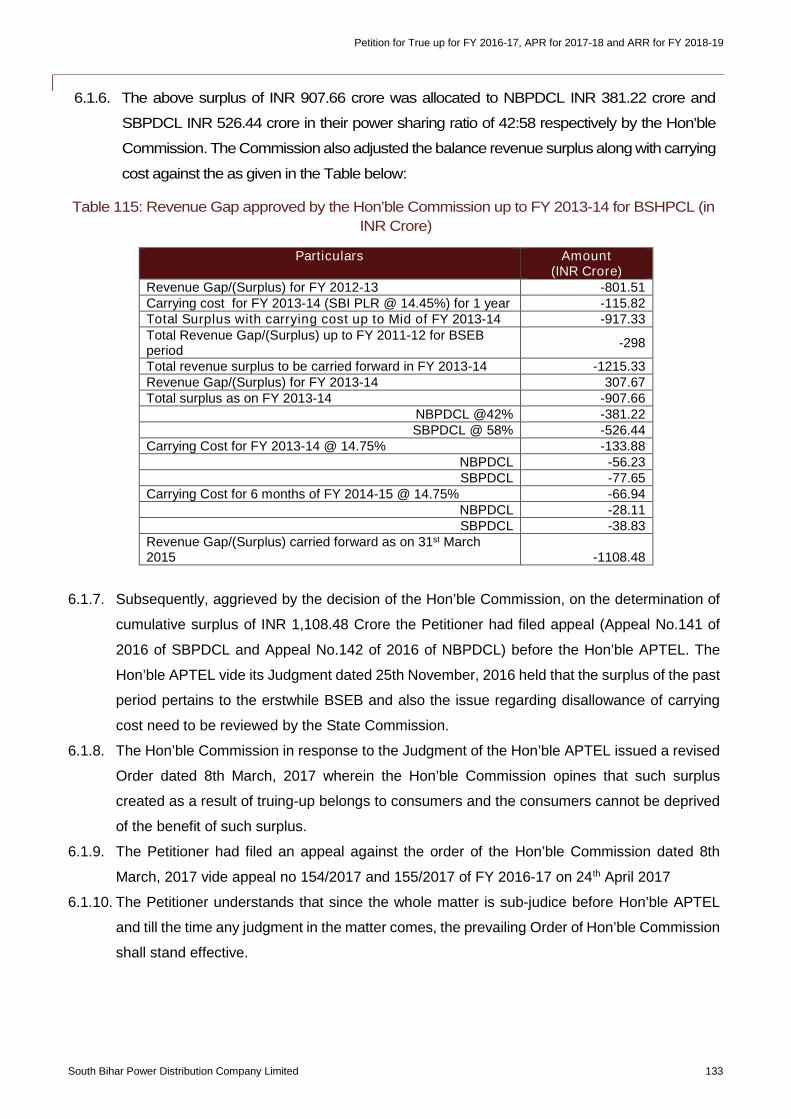
Petition for True up for FY 2016-17, APR for 2017-18 and ARR for FY 2018-19
South Bihar Power Distribution Company Limited 133
6.1.6. The above surplus of INR 907.66 crore was allocated to NBPDCL INR 381.22 crore and
SBPDCL INR 526.44 crore in their power sharing ratio of 42:58 respectively by the Hon’ble
Commission. The Commission also adjusted the balance revenue surplus along with carrying
cost against the as given in the Table below:
Table 115: Revenue Gap approved by the Hon’ble Commission up to FY 2013-14 for BSHPCL (in
INR Crore)
Particulars Amount(INR Crore)
Revenue Gap/(Surplus) for FY 2012-13 -801.51Carrying cost for FY 2013-14 (SBI PLR @ 14.45%) for 1 year -115.82Total Surplus with carrying cost up to Mid of FY 2013-14 -917.33Total Revenue Gap/(Surplus) up to FY 2011-12 for BSEBperiod
-298
Total revenue surplus to be carried forward in FY 2013-14 -1215.33Revenue Gap/(Surplus) for FY 2013-14 307.67Total surplus as on FY 2013-14 -907.66
NBPDCL @42% -381.22SBPDCL @ 58% -526.44
Carrying Cost for FY 2013-14 @ 14.75% -133.88NBPDCL -56.23SBPDCL -77.65
Carrying Cost for 6 months of FY 2014-15 @ 14.75% -66.94NBPDCL -28.11SBPDCL -38.83
Revenue Gap/(Surplus) carried forward as on 31st March2015 -1108.48
6.1.7. Subsequently, aggrieved by the decision of the Hon’ble Commission, on the determination of
cumulative surplus of INR 1,108.48 Crore the Petitioner had filed appeal (Appeal No.141 of
2016 of SBPDCL and Appeal No.142 of 2016 of NBPDCL) before the Hon’ble APTEL. The
Hon’ble APTEL vide its Judgment dated 25th November, 2016 held that the surplus of the past
period pertains to the erstwhile BSEB and also the issue regarding disallowance of carrying
cost need to be reviewed by the State Commission.
6.1.8. The Hon’ble Commission in response to the Judgment of the Hon’ble APTEL issued a revised
Order dated 8th March, 2017 wherein the Hon’ble Commission opines that such surplus
created as a result of truing-up belongs to consumers and the consumers cannot be deprived
of the benefit of such surplus.
6.1.9. The Petitioner had filed an appeal against the order of the Hon’ble Commission dated 8th
March, 2017 vide appeal no 154/2017 and 155/2017 of FY 2016-17 on 24th April 2017
6.1.10. The Petitioner understands that since the whole matter is sub-judice before Hon’ble APTEL
and till the time any judgment in the matter comes, the prevailing Order of Hon’ble Commission
shall stand effective.
Petition for True up for FY 2016-17, APR for 2017-18 and ARR for FY 2018-19
South Bihar Power Distribution Company Limited 134
6.1.11. Without prejudice to the rights and contentions of the Petitioner, this is to put on record that the
present petition for determination of tariff for FY 2018-19 is based on the order passed by this
Hon'ble Commission dated 8th March, 2017.
6.1.12. It is submitted that the Petitioner herein has filed an appeal being no 154/2017 and 155/2017
of FY 2016-17 against the above order dated 8th March, 2017 of the Hon'ble Commission and
the same is pending before the Hon'ble Tribunal. The Petitioner herein reserves the right to
make the necessary changes in the present petition depending on the outcome of appeal no
154/2017 and 155/2017 of FY 2016-17 and seek appropriate directions from this Hon'ble
Commission.
6.1.13. It is suggested that the amount recoverable for past period gap / (surplus) by the two Discoms
and the gap / (surplus) for FY 2017-18, be created into a Regulatory Asset and not passed on
to consumer tariffs for the ensuing year. This amount may be allowed to be recovered by the
Petitioner as Regulatory Surcharge at a rate as allowed by the Hon’ble Commission in the
subsequent years. Only the revenue gap for FY 2018-19 be passed on to consumer tariffs for
FY 2018-19. This shall enable the Petitioner to recover from the cascading effect of the carrying
cost and the consumers shall also be benefited by comparatively reduced tariffs.
Petition for True up for FY 2016-17, APR for 2017-18 and ARR for FY 2018-19
South Bihar Power Distribution Company Limited 135
7. Voltage-wise cost of supply
7.1. Preamble
7.1.1. This section deals with the voltage wise cost of service by the Petitioner for FY 2018-19.
7.2. Background
7.2.1. The Commission had determined the Multi Year Aggregate Revenue Requirement (ARR) for
the second control period FY 2016-17 to FY 2018-19 in the order dated 21st March, 2016.
7.2.2. The Petitioner computed the voltage wise cost of supply for both Discoms, considering energy
sales, T&D loss and fixed costs combined for both Discoms for FY 2018-19. The Petitioner
has considered distribution losses in line with UDAY distribution loss trajectory, as approved
by the Commission in the Tariff Order dated 24th March 2017. Since the approved distribution
loss trajectory is different for both the Discoms, at 22% for SBPDCL and 20% for NBPDCL,
the Petitioner has computed Voltage-wise cost of supply separately for SBPDCL and
NBPDCL.
7.3. Methodology adopted for Computation of Voltage wise Cost of Supply
7.3.1. The Hon’ble APTEL has proposed a simple methodology to functionalize use of Cost of
Supply model. The APTEL notes that identical consumers connected at different nodes of
distribution system need not to be differentiated. In addition, it is adequate to determine
voltage-wise cost of supply taking into account the major cost elements which would be
applicable to all the categories of the consumers connected at the same voltage level at
different locations in the distribution system.
7.3.2. In the method suggested by the Hon’ble APTEL, there are five major components to arrive at
the voltage wise cost of supply. These elements are:
Technical losses at each voltage level of the network: This value of the technical
losses is found by the field studies. Sampling of the feeders which are representative of
the consumers in the system will help in identifying the technical losses at each voltage
levels. The APTEL recognizes the difficulty in collecting data for technical loss at 11 kV
and LT level, hence the suggestion to compute losses using maximum possible
representative feeders for various consumer categories at respective voltage levels.
Commercial losses at each voltage level of the network: The commercial loss of the
system is the difference between approved loss in the ARR and the total technical loss
computed from system study. This difference is to be apportioned according to the sales
in each voltage level to arrive at the commercial loss at each voltage level.
Petition for True up for FY 2016-17, APR for 2017-18 and ARR for FY 2018-19
South Bihar Power Distribution Company Limited 136
Voltage wise sales: The energy sale at a particular voltage level is the sum of energy
sold for all the categories of consumers connected at the said voltage level. Due to its
share of sales in total sales, the consumers of the 132/220 kV network will be
apportioned a share of the commercial losses. The Hon’ble APTEL recognizes that in
reality, there may be minimal technical losses at that level and very low probability of
commercial losses. However, the APTEL is of the opinion that the consumers at 132/220
kV, being a part of the distribution system will bear these apportioned losses.
Power Purchase Cost: The power purchase cost is the cost of energy purchased for
sustaining the energy sales at each voltage level. This power purchase units for each
voltage level is arrived by finding the energy input at each voltage level and adding the
losses (technical and commercial) for the same voltage level and upstream. The energy
input at each voltage level is the sum of the sales at the voltage level and the losses for
the corresponding voltage level.
Network Cost: The network costs are the costs like O&M, interest and finance charges,
depreciation, return on equity etc. These costs are a part of the ARR which in turn
provides the average cost of supply. Thus, the network cost is essentially the difference
between the ARR value and the power purchase cost. The APTEL has suggested
apportioning these costs according to the sales volume in each of the voltage level.
7.3.3. The above elements will help to establish the voltage wise Cost of Supply. Due to the
methodology applied to apportion losses in the various voltage levels, all the consumer
categories at a particular voltage level will have same cost of supply. In this regard, APTEL
has noted that refinements in the methodology may be done when more data becomes
available.
7.4. Determination of Voltage wise Losses
7.4.1. Transmission & Distribution losses in a system are comprised of two separate components -
Technical losses and Commercial losses.
Technical losses occur naturally and consist mainly of power dissipation in electricity
system components such as transmission and distribution lines, and transformers.
Commercial losses are caused by actions external to the power system and consist
primarily of electricity theft, non-payment by customers, and errors in accounting and
record-keeping. Since the rationale behind these two components is quite distinct,
quantifying them separately is imperative for arriving at meaningful conclusions.
7.4.2. At each voltage level, the Technical losses consist of two major components: Transmission
losses which refer to the losses in the current carrying wires; and Transformation losses which
refer the losses incurred during the voltage transformation in the system. Aggregating the
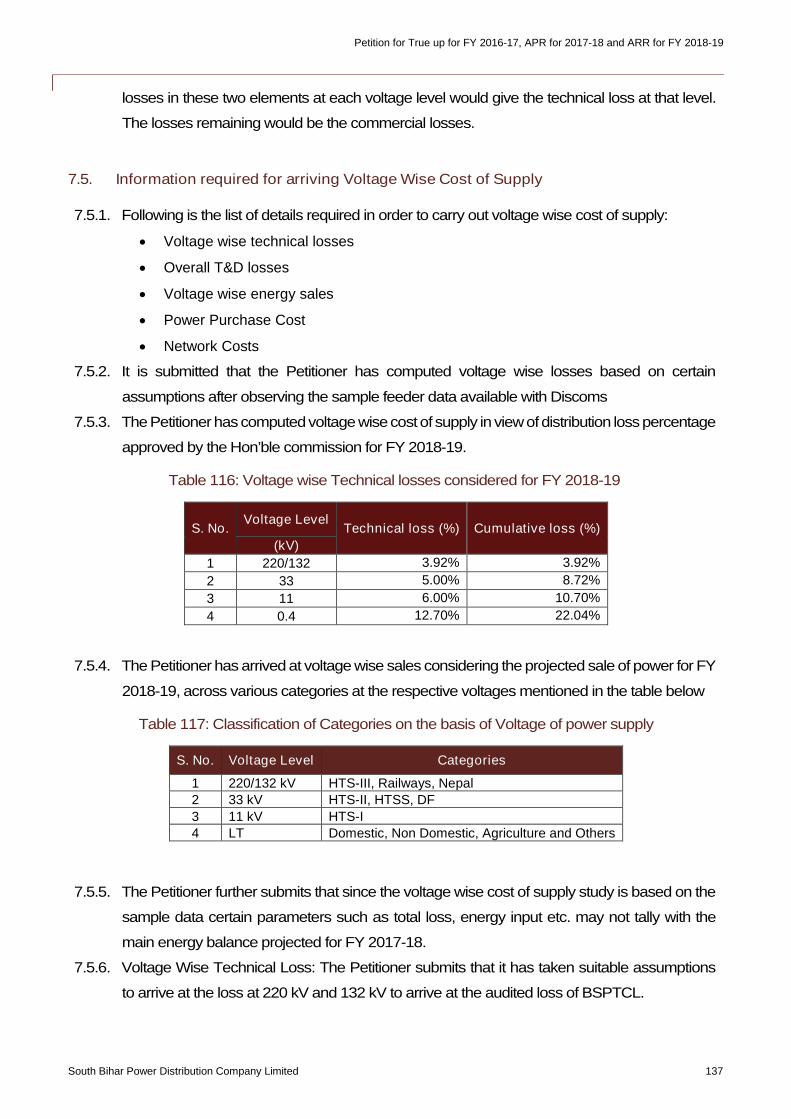
Petition for True up for FY 2016-17, APR for 2017-18 and ARR for FY 2018-19
South Bihar Power Distribution Company Limited 137
losses in these two elements at each voltage level would give the technical loss at that level.
The losses remaining would be the commercial losses.
7.5. Information required for arriving Voltage Wise Cost of Supply
7.5.1. Following is the list of details required in order to carry out voltage wise cost of supply:
Voltage wise technical losses
Overall T&D losses
Voltage wise energy sales
Power Purchase Cost
Network Costs
7.5.2. It is submitted that the Petitioner has computed voltage wise losses based on certain
assumptions after observing the sample feeder data available with Discoms
7.5.3. The Petitionerhascomputedvoltage wisecostof supply in viewofdistribution losspercentage
approved by the Hon’ble commission for FY 2018-19.
Table 116: Voltage wise Technical losses considered for FY 2018-19
S. No.Voltage Level
Technical loss (%) Cumulative loss (%)
(kV)
1 220/132 3.92% 3.92%
2 33 5.00% 8.72%
3 11 6.00% 10.70%
4 0.4 12.70% 22.04%
7.5.4. The Petitioner has arrived at voltage wise sales considering the projected sale of power for FY
2018-19, across various categories at the respective voltages mentioned in the table below
Table 117: Classification of Categories on the basis of Voltage of power supply
S. No. Voltage Level Categories
1 220/132 kV HTS-III, Railways, Nepal
2 33 kV HTS-II, HTSS, DF
3 11 kV HTS-I
4 LT Domestic, Non Domestic, Agriculture and Others
7.5.5. The Petitioner further submits that since the voltage wise cost of supply study is based on the
sample data certain parameters such as total loss, energy input etc. may not tally with the
main energy balance projected for FY 2017-18.
7.5.6. Voltage Wise Technical Loss: The Petitioner submits that it has taken suitable assumptions
to arrive at the loss at 220 kV and 132 kV to arrive at the audited loss of BSPTCL.
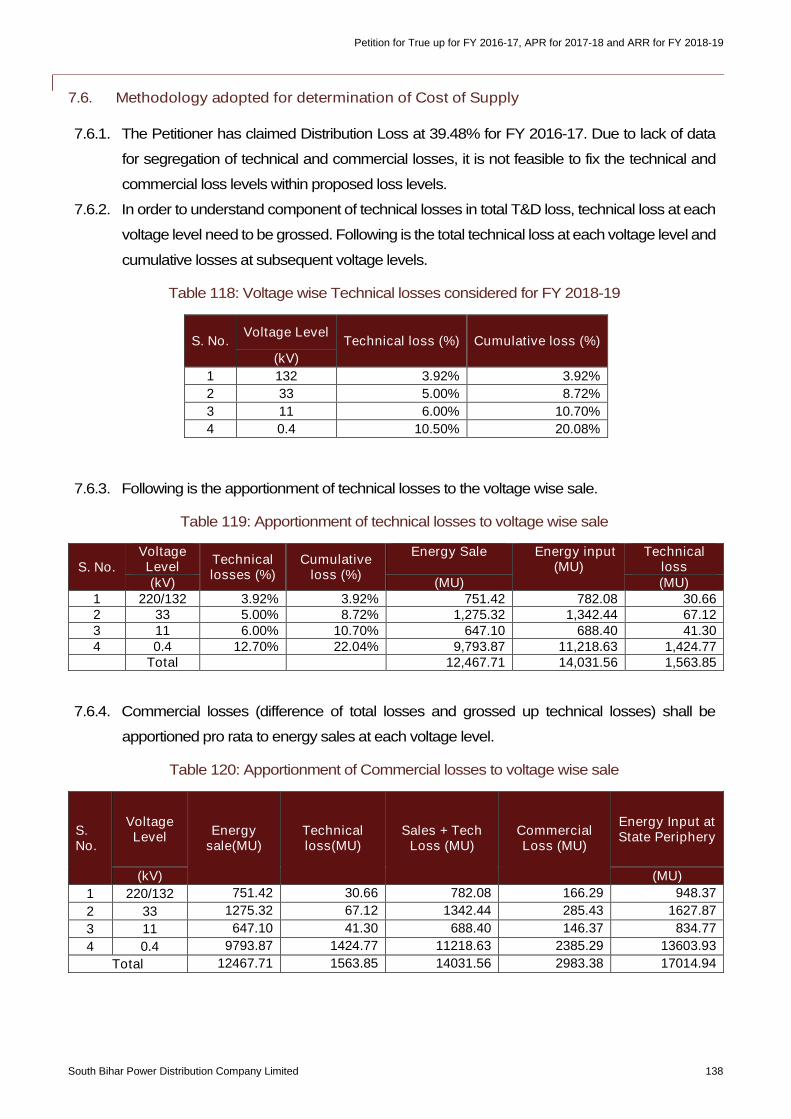
Petition for True up for FY 2016-17, APR for 2017-18 and ARR for FY 2018-19
South Bihar Power Distribution Company Limited 138
7.6. Methodology adopted for determination of Cost of Supply
7.6.1. The Petitioner has claimed Distribution Loss at 39.48% for FY 2016-17. Due to lack of data
for segregation of technical and commercial losses, it is not feasible to fix the technical and
commercial loss levels within proposed loss levels.
7.6.2. In order to understand component of technical losses in total T&D loss, technical loss at each
voltage level need to be grossed. Following is the total technical loss at each voltage level and
cumulative losses at subsequent voltage levels.
Table 118: Voltage wise Technical losses considered for FY 2018-19
S. No.Voltage Level
Technical loss (%) Cumulative loss (%)
(kV)
1 132 3.92% 3.92%
2 33 5.00% 8.72%
3 11 6.00% 10.70%
4 0.4 10.50% 20.08%
7.6.3. Following is the apportionment of technical losses to the voltage wise sale.
Table 119: Apportionment of technical losses to voltage wise sale
S. No.VoltageLevel
Technicallosses (%)
Cumulativeloss (%)
Energy Sale Energy input(MU)
Technicalloss
(kV) (MU) (MU)1 220/132 3.92% 3.92% 751.42 782.08 30.662 33 5.00% 8.72% 1,275.32 1,342.44 67.123 11 6.00% 10.70% 647.10 688.40 41.304 0.4 12.70% 22.04% 9,793.87 11,218.63 1,424.77
Total 12,467.71 14,031.56 1,563.85
7.6.4. Commercial losses (difference of total losses and grossed up technical losses) shall be
apportioned pro rata to energy sales at each voltage level.
Table 120: Apportionment of Commercial losses to voltage wise sale
S.No.
VoltageLevel Energy
sale(MU)Technicalloss(MU)
Sales + TechLoss (MU)
CommercialLoss (MU)
Energy Input atState Periphery
(kV) (MU)
1 220/132 751.42 30.66 782.08 166.29 948.37
2 33 1275.32 67.12 1342.44 285.43 1627.87
3 11 647.10 41.30 688.40 146.37 834.77
4 0.4 9793.87 1424.77 11218.63 2385.29 13603.93
Total 12467.71 1563.85 14031.56 2983.38 17014.94
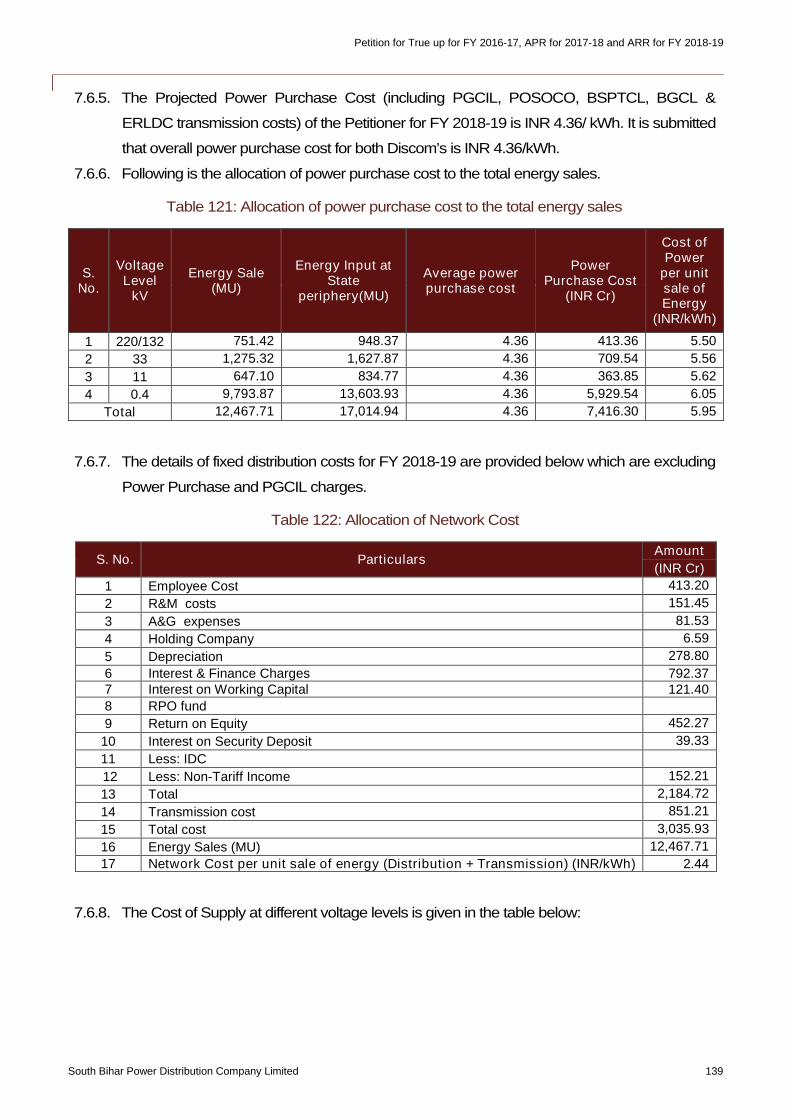
Petition for True up for FY 2016-17, APR for 2017-18 and ARR for FY 2018-19
South Bihar Power Distribution Company Limited 139
7.6.5. The Projected Power Purchase Cost (including PGCIL, POSOCO, BSPTCL, BGCL &
ERLDC transmission costs) of the Petitioner for FY 2018-19 is INR 4.36/ kWh. It is submitted
that overall power purchase cost for both Discom’s is INR 4.36/kWh.
7.6.6. Following is the allocation of power purchase cost to the total energy sales.
Table 121: Allocation of power purchase cost to the total energy sales
S.No.
VoltageLevel
kV
Energy Sale(MU)
Energy Input atState
periphery(MU)
Average powerpurchase cost
PowerPurchase Cost
(INR Cr)
Cost ofPower
per unitsale ofEnergy
(INR/kWh)
1 220/132 751.42 948.37 4.36 413.36 5.50
2 33 1,275.32 1,627.87 4.36 709.54 5.56
3 11 647.10 834.77 4.36 363.85 5.62
4 0.4 9,793.87 13,603.93 4.36 5,929.54 6.05
Total 12,467.71 17,014.94 4.36 7,416.30 5.95
7.6.7. The details of fixed distribution costs for FY 2018-19 are provided below which are excluding
Power Purchase and PGCIL charges.
Table 122: Allocation of Network Cost
S. No. ParticularsAmount
(INR Cr)
1 Employee Cost 413.20
2 R&M costs 151.45
3 A&G expenses 81.53
4 Holding Company 6.59
5 Depreciation 278.80
6 Interest & Finance Charges 792.377 Interest on Working Capital 121.40
8 RPO fund
9 Return on Equity 452.27
10 Interest on Security Deposit 39.33
11 Less: IDC
12 Less: Non-Tariff Income 152.21
13 Total 2,184.72
14 Transmission cost 851.21
15 Total cost 3,035.93
16 Energy Sales (MU) 12,467.71
17 Network Cost per unit sale of energy (Distribution + Transmission) (INR/kWh) 2.44
7.6.8. The Cost of Supply at different voltage levels is given in the table below:
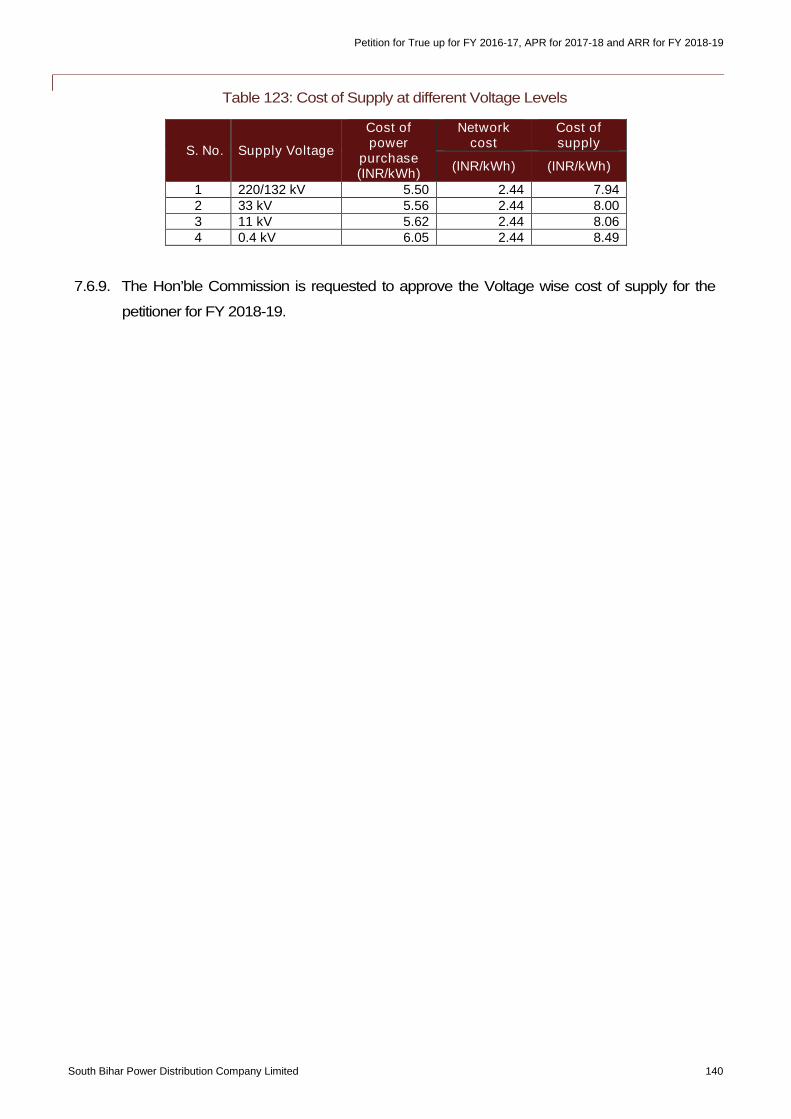
Petition for True up for FY 2016-17, APR for 2017-18 and ARR for FY 2018-19
South Bihar Power Distribution Company Limited 140
Table 123: Cost of Supply at different Voltage Levels
S. No. Supply Voltage
Cost ofpower
purchase(INR/kWh)
Networkcost
Cost ofsupply
(INR/kWh) (INR/kWh)
1 220/132 kV 5.50 2.44 7.942 33 kV 5.56 2.44 8.003 11 kV 5.62 2.44 8.064 0.4 kV 6.05 2.44 8.49
7.6.9. The Hon’ble Commission is requested to approve the Voltage wise cost of supply for the
petitioner for FY 2018-19.
Petition for True up for FY 2016-17, APR for 2017-18 and ARR for FY 2018-19
South Bihar Power Distribution Company Limited 141
8. Miscellaneous and General Charges
8.1. Schedule of Miscellaneous and General Charges
8.2. Meter Rent
8.2.1. Background
8.2.1.1. The Electricity Act, 2003 empowers the Discom to recover its legitimate business
expenses and enlist the charges to be levied on its consumers. Such charges include
fixed charge in addition to the charge for the actual electricity supplied and rent or other
charges in respect of any electric meter or electrical plant provided by the distribution
licensee. The relevant extract from the EA, 2003 is provided as under:
“(3) The charges for electricity supplied by a distribution licensee may include -(a) a fixed charge in addition to the charge for the actual electricity supplied;(b) a rent or other charges in respect of any electric meter or electrical plant providedby the distribution licensee.”
8.2.1.2. Further, Clause 55 of the EA, 2003 also mandates for supply of electricity through meter.
In its endeavor to provide metered connection, the Petitioner has been making huge
investments for procurement of meters for its consumers, which are dynamic in nature
with advanced technology. The technology of meter reading and billing in India is
continuously evolving and has undergone a paradigm shift in recent past. The Petitioner
has moved from the old electromechanical meters to electronic meters for LT consumers
and AMR meter for the consumers connected at higher voltage level. Also, the
Distribution Licensees are planning to install large number of prepaid meters and also to
introduce smart meters among the LT consumers. This shall bring in more transparency
into the system in terms of better energy accounting and less prone to tampering. The
Petitioner has also established facilities for in-house meter testing and calibration for
testing all kinds of meters for its consumers.
8.2.1.3. The cost of meters needs to be recovered from the consumers within a certain timeframe.
Section 8.7 of the Bihar Electricity Supply Code, 2007 provides for recovery of meter rent
from its consumers. The relevant extract of the said provision is provide below:-
“The licensee shall supply the meter and metering equipment, cut-out/ MCB/ CB/ loadlimiter to consumers at the time of serving new service connection or at any other timeas required. The licensee shall keep the meter in proper working condition and theconsumer shall pay the monthly rent, if any, for the meter and metering equipment atthe rate approved by the Commission.” [Emphasis Supplied]
8.2.1.4. It is to be noted that the Petitioner’s investment for purchasing meters is a cost incurred
to provide electricity to its consumers and it should be recovered in a timely manner.
However, the BERC (Multi Year Distribution Tariff) Regulation, 2015 considers the meter
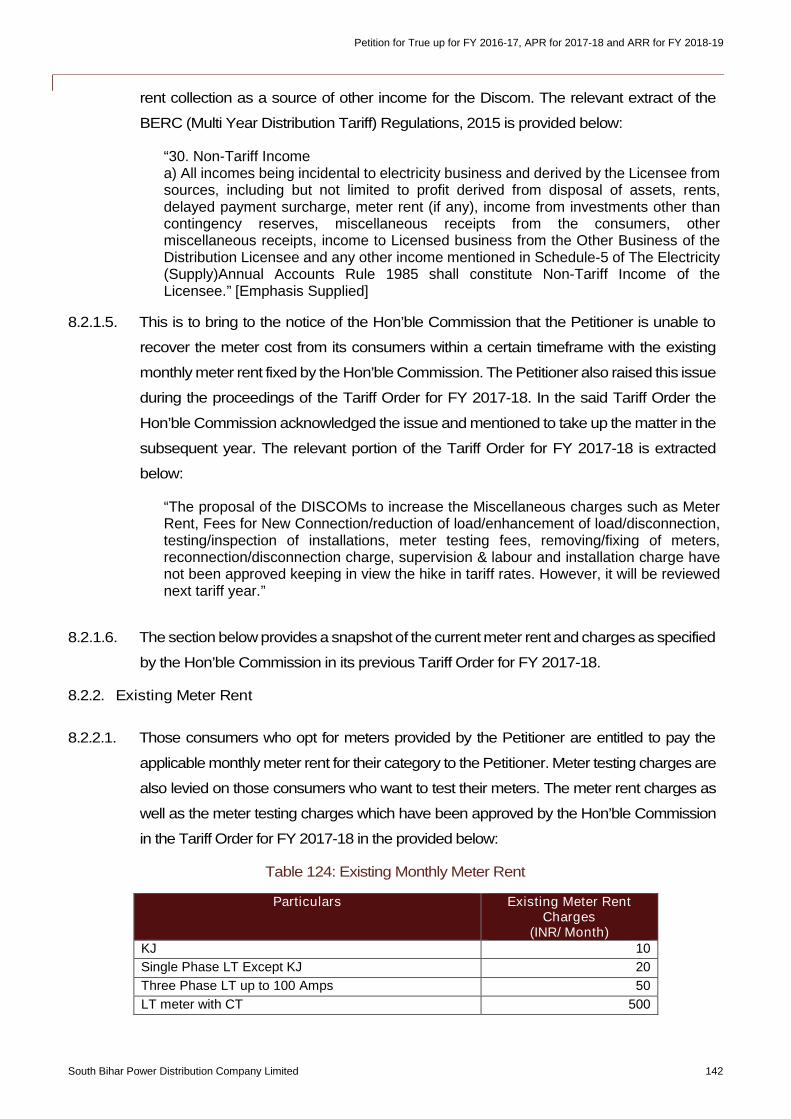
Petition for True up for FY 2016-17, APR for 2017-18 and ARR for FY 2018-19
South Bihar Power Distribution Company Limited 142
rent collection as a source of other income for the Discom. The relevant extract of the
BERC (Multi Year Distribution Tariff) Regulations, 2015 is provided below:
“30. Non-Tariff Incomea) All incomes being incidental to electricity business and derived by the Licensee fromsources, including but not limited to profit derived from disposal of assets, rents,delayed payment surcharge, meter rent (if any), income from investments other thancontingency reserves, miscellaneous receipts from the consumers, othermiscellaneous receipts, income to Licensed business from the Other Business of theDistribution Licensee and any other income mentioned in Schedule-5 of The Electricity(Supply)Annual Accounts Rule 1985 shall constitute Non-Tariff Income of theLicensee.” [Emphasis Supplied]
8.2.1.5. This is to bring to the notice of the Hon’ble Commission that the Petitioner is unable to
recover the meter cost from its consumers within a certain timeframe with the existing
monthly meter rent fixed by the Hon’ble Commission. The Petitioner also raised this issue
during the proceedings of the Tariff Order for FY 2017-18. In the said Tariff Order the
Hon’ble Commission acknowledged the issue and mentioned to take up the matter in the
subsequent year. The relevant portion of the Tariff Order for FY 2017-18 is extracted
below:
“The proposal of the DISCOMs to increase the Miscellaneous charges such as MeterRent, Fees for New Connection/reduction of load/enhancement of load/disconnection,testing/inspection of installations, meter testing fees, removing/fixing of meters,reconnection/disconnection charge, supervision & labour and installation charge havenot been approved keeping in view the hike in tariff rates. However, it will be reviewednext tariff year.”
8.2.1.6. The section below provides a snapshot of the current meter rent and charges as specified
by the Hon’ble Commission in its previous Tariff Order for FY 2017-18.
8.2.2. Existing Meter Rent
8.2.2.1. Those consumers who opt for meters provided by the Petitioner are entitled to pay the
applicable monthly meter rent for their category to the Petitioner. Meter testing charges are
also levied on those consumers who want to test their meters. The meter rent charges as
well as the meter testing charges which have been approved by the Hon’ble Commission
in the Tariff Order for FY 2017-18 in the provided below:
Table 124: Existing Monthly Meter Rent
Particulars Existing Meter RentCharges
(INR/ Month)KJ 10
Single Phase LT Except KJ 20
Three Phase LT up to 100 Amps 50
LT meter with CT 500
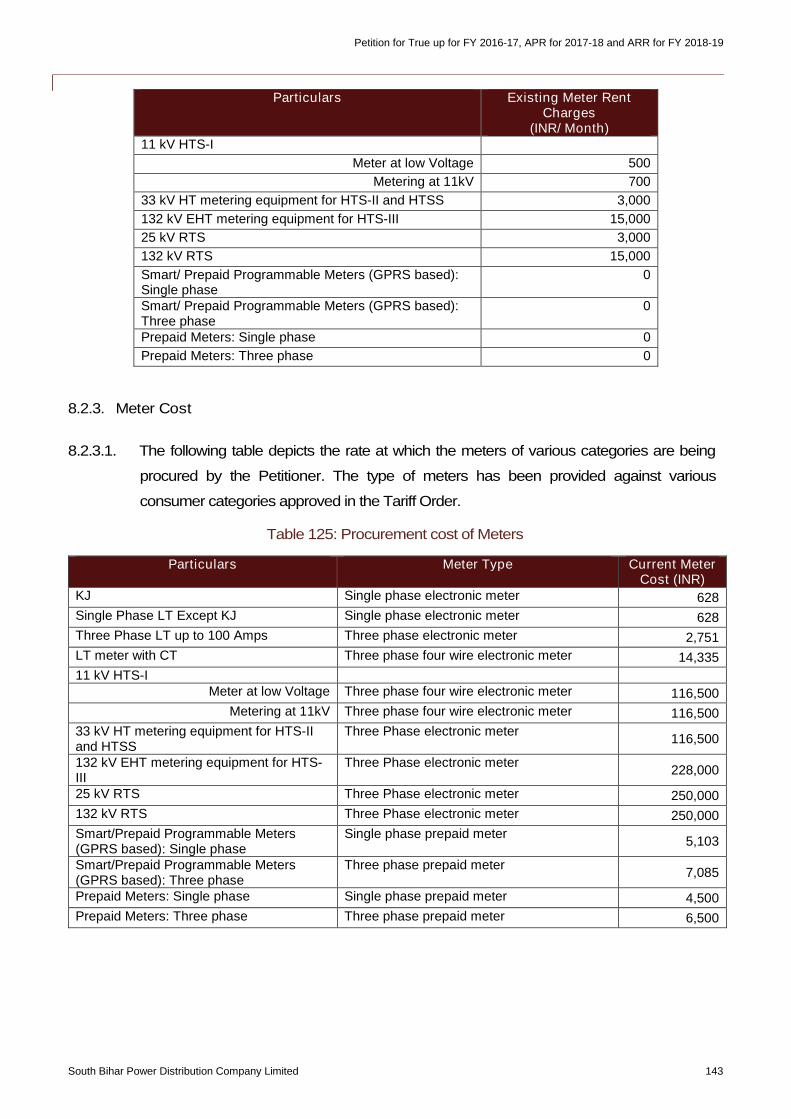
Petition for True up for FY 2016-17, APR for 2017-18 and ARR for FY 2018-19
South Bihar Power Distribution Company Limited 143
Particulars Existing Meter RentCharges
(INR/ Month)11 kV HTS-I
Meter at low Voltage 500
Metering at 11kV 700
33 kV HT metering equipment for HTS-II and HTSS 3,000
132 kV EHT metering equipment for HTS-III 15,000
25 kV RTS 3,000
132 kV RTS 15,000
Smart/ Prepaid Programmable Meters (GPRS based):Single phase
0
Smart/ Prepaid Programmable Meters (GPRS based):Three phase
0
Prepaid Meters: Single phase 0
Prepaid Meters: Three phase 0
8.2.3. Meter Cost
8.2.3.1. The following table depicts the rate at which the meters of various categories are being
procured by the Petitioner. The type of meters has been provided against various
consumer categories approved in the Tariff Order.
Table 125: Procurement cost of Meters
Particulars Meter Type Current MeterCost (INR)
KJ Single phase electronic meter 628
Single Phase LT Except KJ Single phase electronic meter 628
Three Phase LT up to 100 Amps Three phase electronic meter 2,751
LT meter with CT Three phase four wire electronic meter 14,335
11 kV HTS-IMeter at low Voltage Three phase four wire electronic meter 116,500
Metering at 11kV Three phase four wire electronic meter 116,500
33 kV HT metering equipment for HTS-IIand HTSS
Three Phase electronic meter116,500
132 kV EHT metering equipment for HTS-III
Three Phase electronic meter228,000
25 kV RTS Three Phase electronic meter 250,000
132 kV RTS Three Phase electronic meter 250,000
Smart/Prepaid Programmable Meters(GPRS based): Single phase
Single phase prepaid meter5,103
Smart/Prepaid Programmable Meters(GPRS based): Three phase
Three phase prepaid meter7,085
Prepaid Meters: Single phase Single phase prepaid meter 4,500
Prepaid Meters: Three phase Three phase prepaid meter 6,500
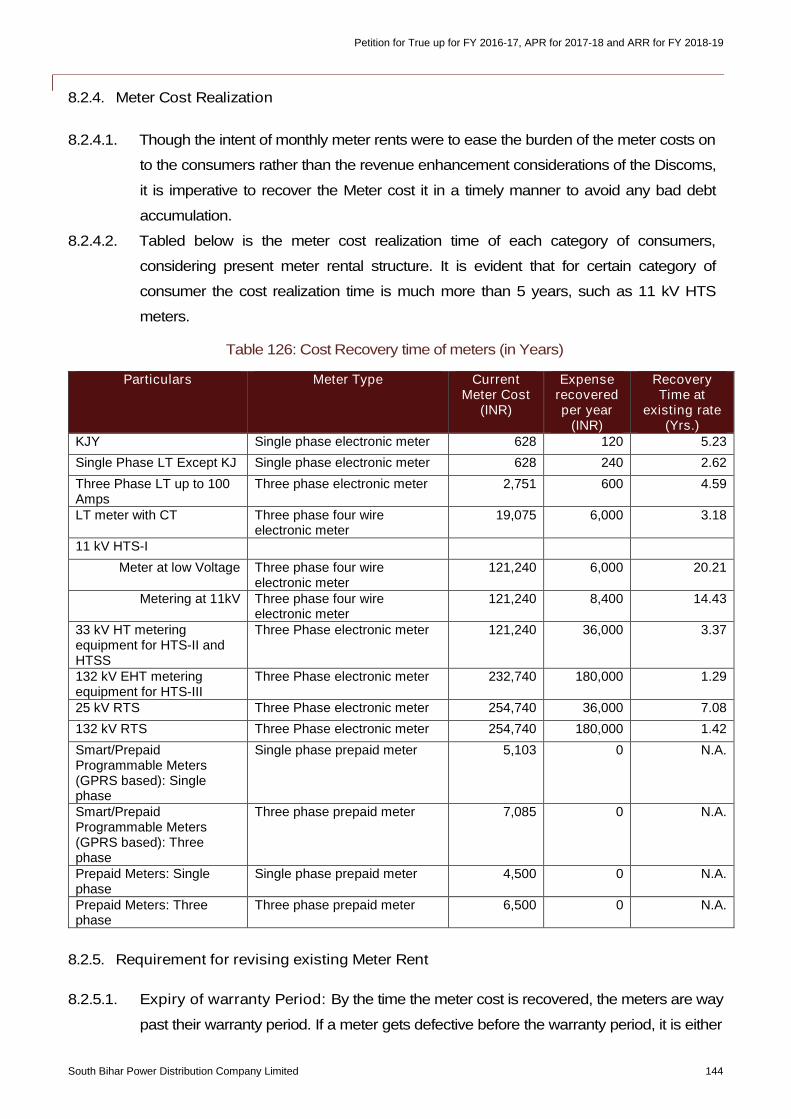
Petition for True up for FY 2016-17, APR for 2017-18 and ARR for FY 2018-19
South Bihar Power Distribution Company Limited 144
8.2.4. Meter Cost Realization
8.2.4.1. Though the intent of monthly meter rents were to ease the burden of the meter costs on
to the consumers rather than the revenue enhancement considerations of the Discoms,
it is imperative to recover the Meter cost it in a timely manner to avoid any bad debt
accumulation.
8.2.4.2. Tabled below is the meter cost realization time of each category of consumers,
considering present meter rental structure. It is evident that for certain category of
consumer the cost realization time is much more than 5 years, such as 11 kV HTS
meters.
Table 126: Cost Recovery time of meters (in Years)
Particulars Meter Type CurrentMeter Cost
(INR)
Expenserecoveredper year
(INR)
RecoveryTime at
existing rate(Yrs.)
KJY Single phase electronic meter 628 120 5.23
Single Phase LT Except KJ Single phase electronic meter 628 240 2.62
Three Phase LT up to 100Amps
Three phase electronic meter 2,751 600 4.59
LT meter with CT Three phase four wireelectronic meter
19,075 6,000 3.18
11 kV HTS-I
Meter at low Voltage Three phase four wireelectronic meter
121,240 6,000 20.21
Metering at 11kV Three phase four wireelectronic meter
121,240 8,400 14.43
33 kV HT meteringequipment for HTS-II andHTSS
Three Phase electronic meter 121,240 36,000 3.37
132 kV EHT meteringequipment for HTS-III
Three Phase electronic meter 232,740 180,000 1.29
25 kV RTS Three Phase electronic meter 254,740 36,000 7.08
132 kV RTS Three Phase electronic meter 254,740 180,000 1.42
Smart/PrepaidProgrammable Meters(GPRS based): Singlephase
Single phase prepaid meter 5,103 0 N.A.
Smart/PrepaidProgrammable Meters(GPRS based): Threephase
Three phase prepaid meter 7,085 0 N.A.
Prepaid Meters: Singlephase
Single phase prepaid meter 4,500 0 N.A.
Prepaid Meters: Threephase
Three phase prepaid meter 6,500 0 N.A.
8.2.5. Requirement for revising existing Meter Rent
8.2.5.1. Expiry of warranty Period: By the time the meter cost is recovered, the meters are way
past their warranty period. If a meter gets defective before the warranty period, it is either
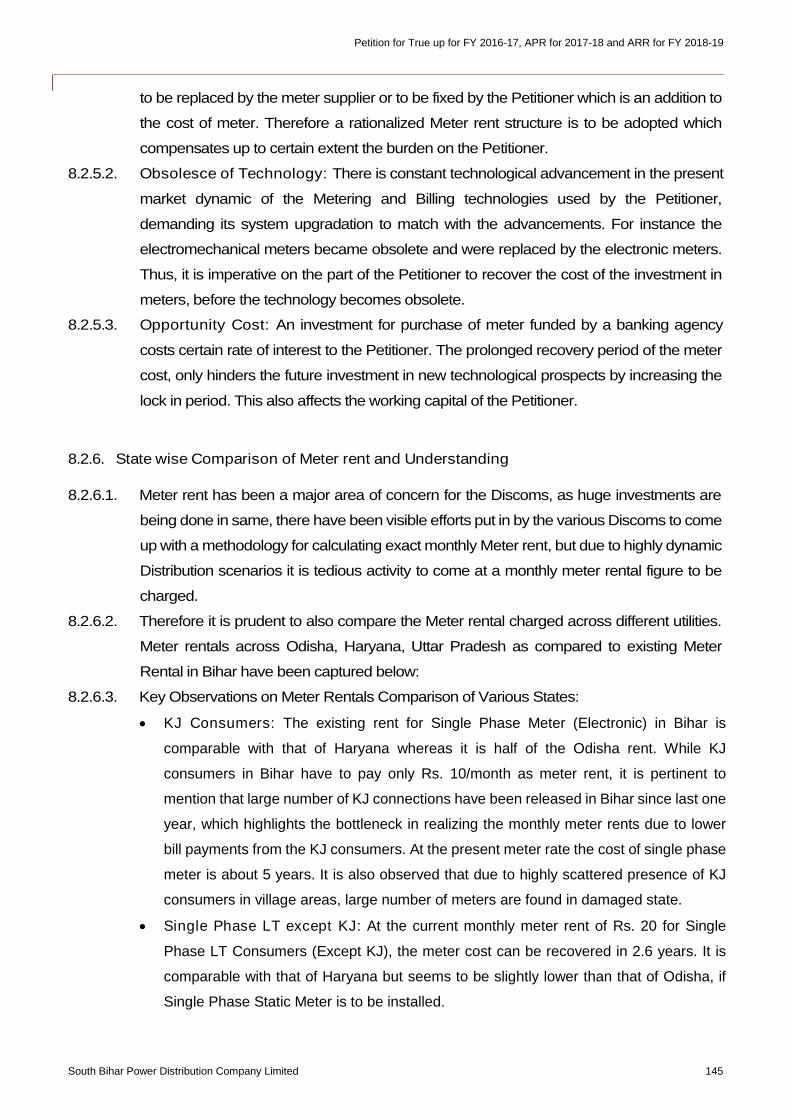
Petition for True up for FY 2016-17, APR for 2017-18 and ARR for FY 2018-19
South Bihar Power Distribution Company Limited 145
to be replaced by the meter supplier or to be fixed by the Petitioner which is an addition to
the cost of meter. Therefore a rationalized Meter rent structure is to be adopted which
compensates up to certain extent the burden on the Petitioner.
8.2.5.2. Obsolesce of Technology: There is constant technological advancement in the present
market dynamic of the Metering and Billing technologies used by the Petitioner,
demanding its system upgradation to match with the advancements. For instance the
electromechanical meters became obsolete and were replaced by the electronic meters.
Thus, it is imperative on the part of the Petitioner to recover the cost of the investment in
meters, before the technology becomes obsolete.
8.2.5.3. Opportunity Cost: An investment for purchase of meter funded by a banking agency
costs certain rate of interest to the Petitioner. The prolonged recovery period of the meter
cost, only hinders the future investment in new technological prospects by increasing the
lock in period. This also affects the working capital of the Petitioner.
8.2.6. State wise Comparison of Meter rent and Understanding
8.2.6.1. Meter rent has been a major area of concern for the Discoms, as huge investments are
being done in same, there have been visible efforts put in by the various Discoms to come
up with a methodology for calculating exact monthly Meter rent, but due to highly dynamic
Distribution scenarios it is tedious activity to come at a monthly meter rental figure to be
charged.
8.2.6.2. Therefore it is prudent to also compare the Meter rental charged across different utilities.
Meter rentals across Odisha, Haryana, Uttar Pradesh as compared to existing Meter
Rental in Bihar have been captured below:
8.2.6.3. Key Observations on Meter Rentals Comparison of Various States:
KJ Consumers: The existing rent for Single Phase Meter (Electronic) in Bihar is
comparable with that of Haryana whereas it is half of the Odisha rent. While KJ
consumers in Bihar have to pay only Rs. 10/month as meter rent, it is pertinent to
mention that large number of KJ connections have been released in Bihar since last one
year, which highlights the bottleneck in realizing the monthly meter rents due to lower
bill payments from the KJ consumers. At the present meter rate the cost of single phase
meter is about 5 years. It is also observed that due to highly scattered presence of KJ
consumers in village areas, large number of meters are found in damaged state.
Single Phase LT except KJ: At the current monthly meter rent of Rs. 20 for Single
Phase LT Consumers (Except KJ), the meter cost can be recovered in 2.6 years. It is
comparable with that of Haryana but seems to be slightly lower than that of Odisha, if
Single Phase Static Meter is to be installed.
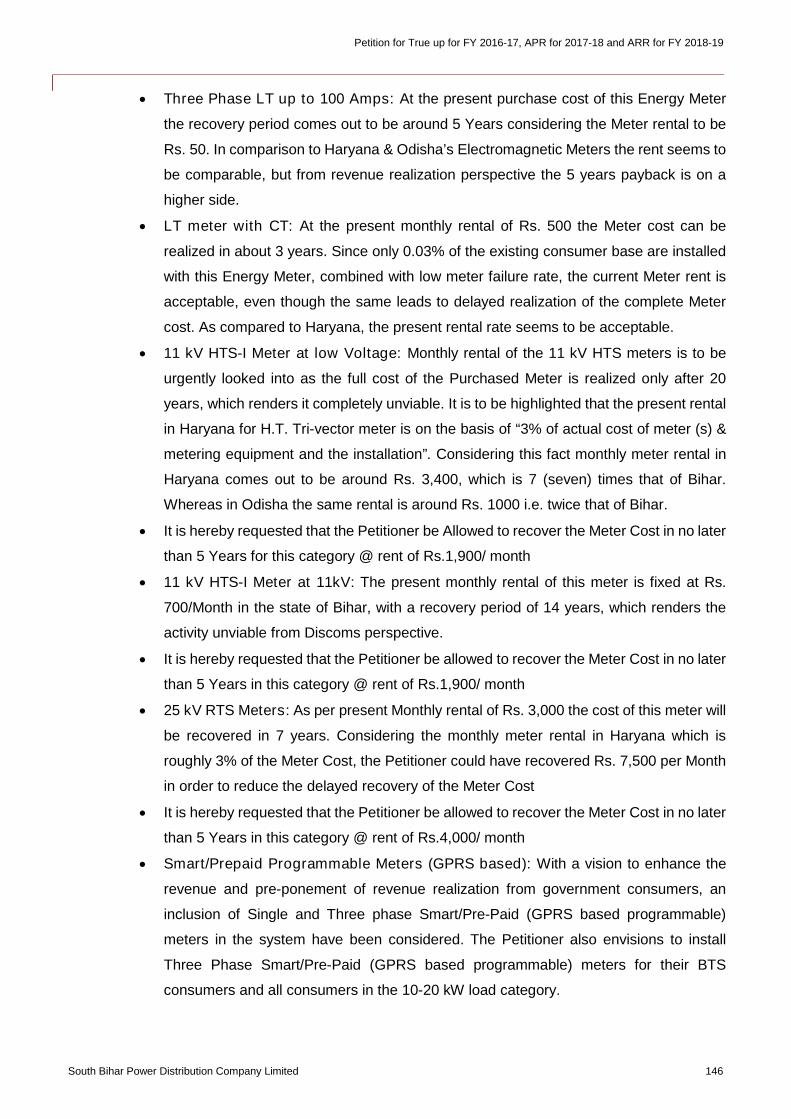
Petition for True up for FY 2016-17, APR for 2017-18 and ARR for FY 2018-19
South Bihar Power Distribution Company Limited 146
Three Phase LT up to 100 Amps: At the present purchase cost of this Energy Meter
the recovery period comes out to be around 5 Years considering the Meter rental to be
Rs. 50. In comparison to Haryana & Odisha’s Electromagnetic Meters the rent seems to
be comparable, but from revenue realization perspective the 5 years payback is on a
higher side.
LT meter with CT: At the present monthly rental of Rs. 500 the Meter cost can be
realized in about 3 years. Since only 0.03% of the existing consumer base are installed
with this Energy Meter, combined with low meter failure rate, the current Meter rent is
acceptable, even though the same leads to delayed realization of the complete Meter
cost. As compared to Haryana, the present rental rate seems to be acceptable.
11 kV HTS-I Meter at low Voltage: Monthly rental of the 11 kV HTS meters is to be
urgently looked into as the full cost of the Purchased Meter is realized only after 20
years, which renders it completely unviable. It is to be highlighted that the present rental
in Haryana for H.T. Tri-vector meter is on the basis of “3% of actual cost of meter (s) &
metering equipment and the installation”. Considering this fact monthly meter rental in
Haryana comes out to be around Rs. 3,400, which is 7 (seven) times that of Bihar.
Whereas in Odisha the same rental is around Rs. 1000 i.e. twice that of Bihar.
It is hereby requested that the Petitioner be Allowed to recover the Meter Cost in no later
than 5 Years for this category @ rent of Rs.1,900/ month
11 kV HTS-I Meter at 11kV: The present monthly rental of this meter is fixed at Rs.
700/Month in the state of Bihar, with a recovery period of 14 years, which renders the
activity unviable from Discoms perspective.
It is hereby requested that the Petitioner be allowed to recover the Meter Cost in no later
than 5 Years in this category @ rent of Rs.1,900/ month
25 kV RTS Meters: As per present Monthly rental of Rs. 3,000 the cost of this meter will
be recovered in 7 years. Considering the monthly meter rental in Haryana which is
roughly 3% of the Meter Cost, the Petitioner could have recovered Rs. 7,500 per Month
in order to reduce the delayed recovery of the Meter Cost
It is hereby requested that the Petitioner be allowed to recover the Meter Cost in no later
than 5 Years in this category @ rent of Rs.4,000/ month
Smart/Prepaid Programmable Meters (GPRS based): With a vision to enhance the
revenue and pre-ponement of revenue realization from government consumers, an
inclusion of Single and Three phase Smart/Pre-Paid (GPRS based programmable)
meters in the system have been considered. The Petitioner also envisions to install
Three Phase Smart/Pre-Paid (GPRS based programmable) meters for their BTS
consumers and all consumers in the 10-20 kW load category.
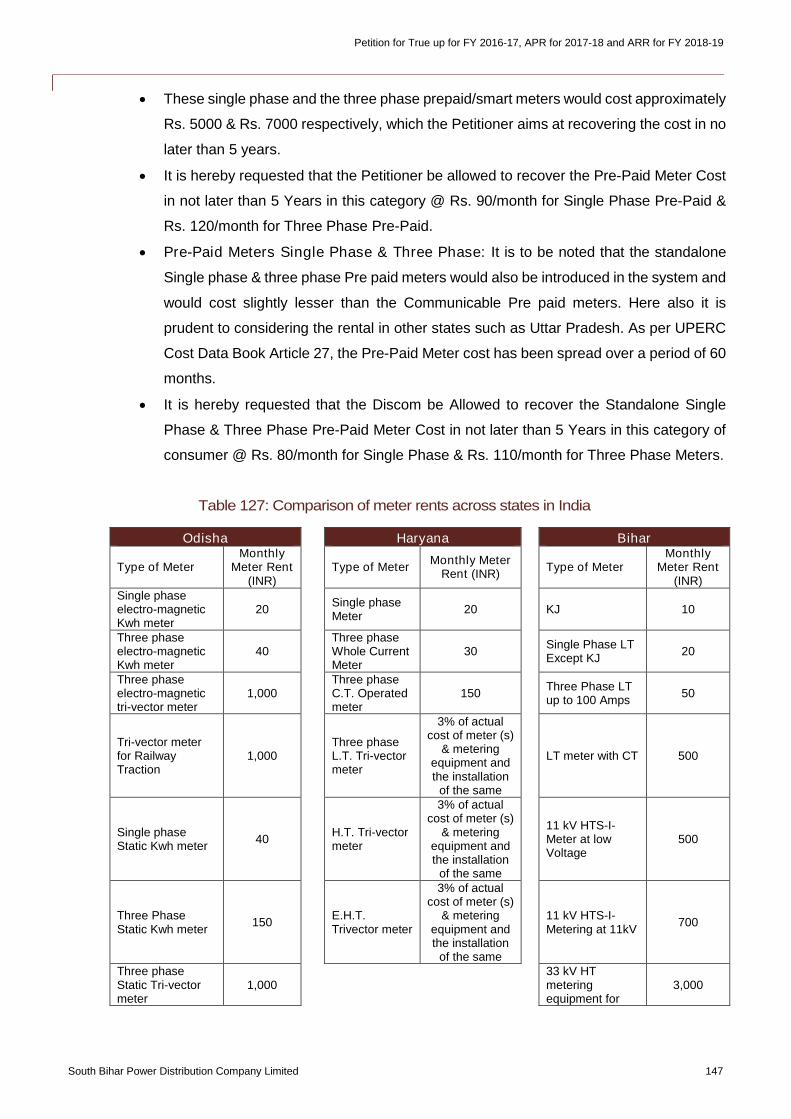
Petition for True up for FY 2016-17, APR for 2017-18 and ARR for FY 2018-19
South Bihar Power Distribution Company Limited 147
These single phase and the three phase prepaid/smart meters would cost approximately
Rs. 5000 & Rs. 7000 respectively, which the Petitioner aims at recovering the cost in no
later than 5 years.
It is hereby requested that the Petitioner be allowed to recover the Pre-Paid Meter Cost
in not later than 5 Years in this category @ Rs. 90/month for Single Phase Pre-Paid &
Rs. 120/month for Three Phase Pre-Paid.
Pre-Paid Meters Single Phase & Three Phase: It is to be noted that the standalone
Single phase & three phase Pre paid meters would also be introduced in the system and
would cost slightly lesser than the Communicable Pre paid meters. Here also it is
prudent to considering the rental in other states such as Uttar Pradesh. As per UPERC
Cost Data Book Article 27, the Pre-Paid Meter cost has been spread over a period of 60
months.
It is hereby requested that the Discom be Allowed to recover the Standalone Single
Phase & Three Phase Pre-Paid Meter Cost in not later than 5 Years in this category of
consumer @ Rs. 80/month for Single Phase & Rs. 110/month for Three Phase Meters.
Table 127: Comparison of meter rents across states in India
Odisha Haryana Bihar
Type of MeterMonthly
Meter Rent(INR)
Type of MeterMonthly Meter
Rent (INR)Type of Meter
MonthlyMeter Rent
(INR)Single phaseelectro-magneticKwh meter
20Single phaseMeter
20 KJ 10
Three phaseelectro-magneticKwh meter
40Three phaseWhole CurrentMeter
30Single Phase LTExcept KJ
20
Three phaseelectro-magnetictri-vector meter
1,000Three phaseC.T. Operatedmeter
150Three Phase LTup to 100 Amps
50
Tri-vector meterfor RailwayTraction
1,000Three phaseL.T. Tri-vectormeter
3% of actualcost of meter (s)
& meteringequipment andthe installation
of the same
LT meter with CT 500
Single phaseStatic Kwh meter
40H.T. Tri-vectormeter
3% of actualcost of meter (s)
& meteringequipment andthe installation
of the same
11 kV HTS-I-Meter at lowVoltage
500
Three PhaseStatic Kwh meter
150E.H.T.Trivector meter
3% of actualcost of meter (s)
& meteringequipment andthe installation
of the same
11 kV HTS-I-Metering at 11kV
700
Three phaseStatic Tri-vectormeter
1,00033 kV HTmeteringequipment for
3,000
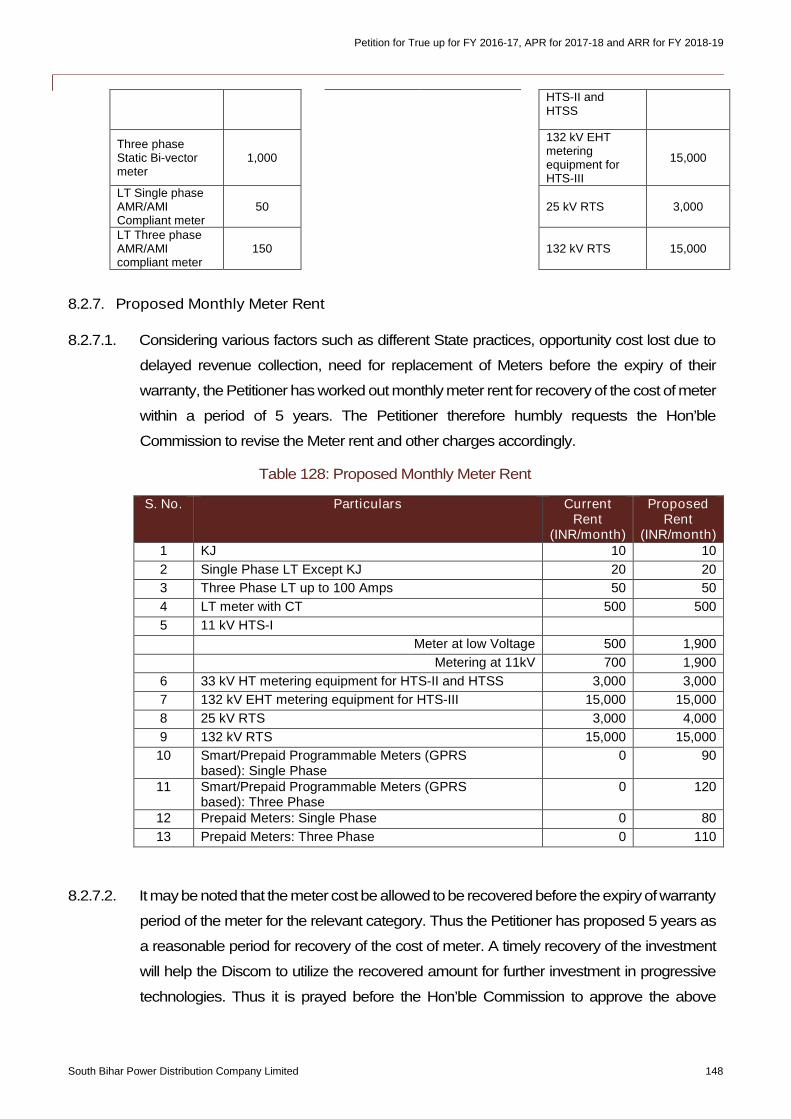
Petition for True up for FY 2016-17, APR for 2017-18 and ARR for FY 2018-19
South Bihar Power Distribution Company Limited 148
HTS-II andHTSS
Three phaseStatic Bi-vectormeter
1,000
132 kV EHTmeteringequipment forHTS-III
15,000
LT Single phaseAMR/AMICompliant meter
50 25 kV RTS 3,000
LT Three phaseAMR/AMIcompliant meter
150 132 kV RTS 15,000
8.2.7. Proposed Monthly Meter Rent
8.2.7.1. Considering various factors such as different State practices, opportunity cost lost due to
delayed revenue collection, need for replacement of Meters before the expiry of their
warranty, the Petitioner has worked out monthly meter rent for recovery of the cost of meter
within a period of 5 years. The Petitioner therefore humbly requests the Hon’ble
Commission to revise the Meter rent and other charges accordingly.
Table 128: Proposed Monthly Meter Rent
S. No. Particulars CurrentRent
(INR/month)
ProposedRent
(INR/month)1 KJ 10 10
2 Single Phase LT Except KJ 20 20
3 Three Phase LT up to 100 Amps 50 50
4 LT meter with CT 500 500
5 11 kV HTS-I
Meter at low Voltage 500 1,900
Metering at 11kV 700 1,900
6 33 kV HT metering equipment for HTS-II and HTSS 3,000 3,000
7 132 kV EHT metering equipment for HTS-III 15,000 15,000
8 25 kV RTS 3,000 4,000
9 132 kV RTS 15,000 15,000
10 Smart/Prepaid Programmable Meters (GPRSbased): Single Phase
0 90
11 Smart/Prepaid Programmable Meters (GPRSbased): Three Phase
0 120
12 Prepaid Meters: Single Phase 0 80
13 Prepaid Meters: Three Phase 0 110
8.2.7.2. It maybe noted that the meter costbe allowed to be recovered before the expiryofwarranty
period of the meter for the relevant category. Thus the Petitioner has proposed 5 years as
a reasonable period for recovery of the cost of meter. A timely recovery of the investment
will help the Discom to utilize the recovered amount for further investment in progressive
technologies. Thus it is prayed before the Hon’ble Commission to approve the above
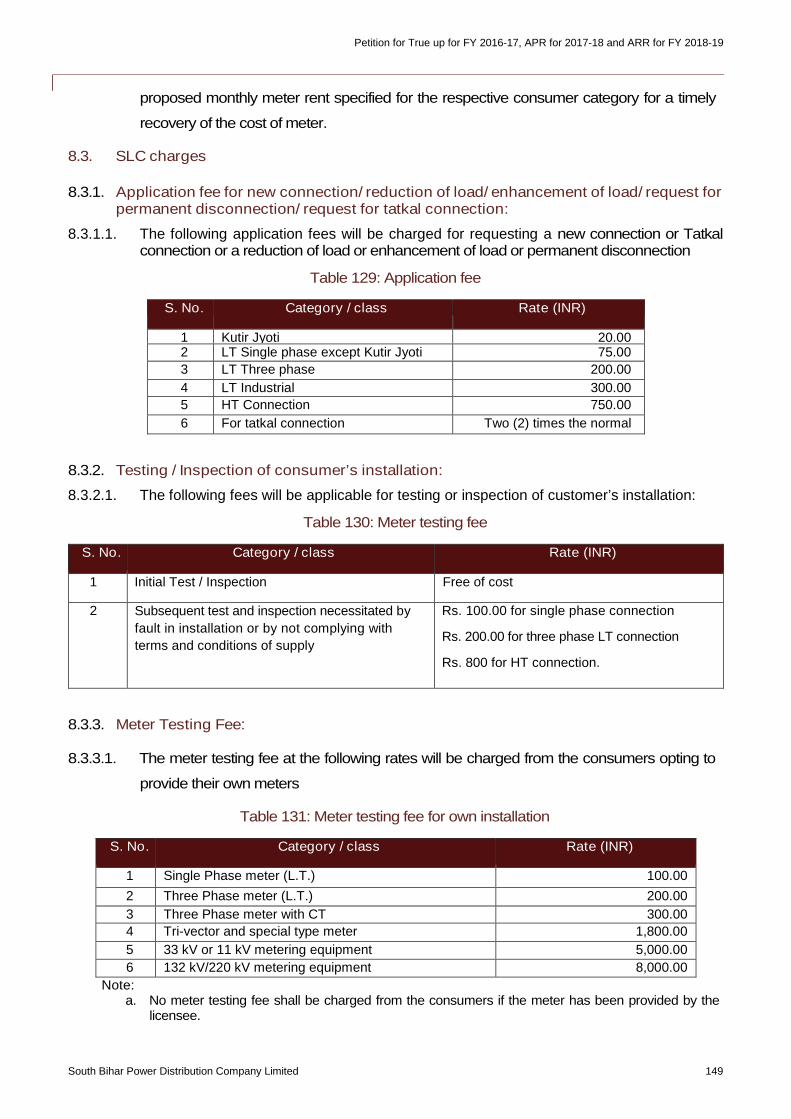
Petition for True up for FY 2016-17, APR for 2017-18 and ARR for FY 2018-19
South Bihar Power Distribution Company Limited 149
proposed monthly meter rent specified for the respective consumer category for a timely
recovery of the cost of meter.
8.3. SLC charges
8.3.1. Application fee for new connection/ reduction of load/ enhancement of load/ request forpermanent disconnection/ request for tatkal connection:
8.3.1.1. The following application fees will be charged for requesting a new connection or Tatkalconnection or a reduction of load or enhancement of load or permanent disconnection
Table 129: Application fee
S. No. Category / class Rate (INR)
1 Kutir Jyoti 20.002 LT Single phase except Kutir Jyoti 75.00
3 LT Three phase 200.00
4 LT Industrial 300.00
5 HT Connection 750.00
6 For tatkal connection Two (2) times the normalrate
8.3.2. Testing / Inspection of consumer’s installation:
8.3.2.1. The following fees will be applicable for testing or inspection of customer’s installation:
Table 130: Meter testing fee
S. No. Category / class Rate (INR)
1 Initial Test / Inspection Free of cost
2 Subsequent test and inspection necessitated by
fault in installation or by not complying with
terms and conditions of supply
Rs. 100.00 for single phase connection
Rs. 200.00 for three phase LT connection
Rs. 800 for HT connection.
8.3.3. Meter Testing Fee:
8.3.3.1. The meter testing fee at the following rates will be charged from the consumers opting to
provide their own meters
Table 131: Meter testing fee for own installation
S. No. Category / class Rate (INR)
1 Single Phase meter (L.T.) 100.00
2 Three Phase meter (L.T.) 200.00
3 Three Phase meter with CT 300.00
4 Tri-vector and special type meter 1,800.00
5 33 kV or 11 kV metering equipment 5,000.00
6 132 kV/220 kV metering equipment 8,000.00
Note:a. No meter testing fee shall be charged from the consumers if the meter has been provided by the
licensee.
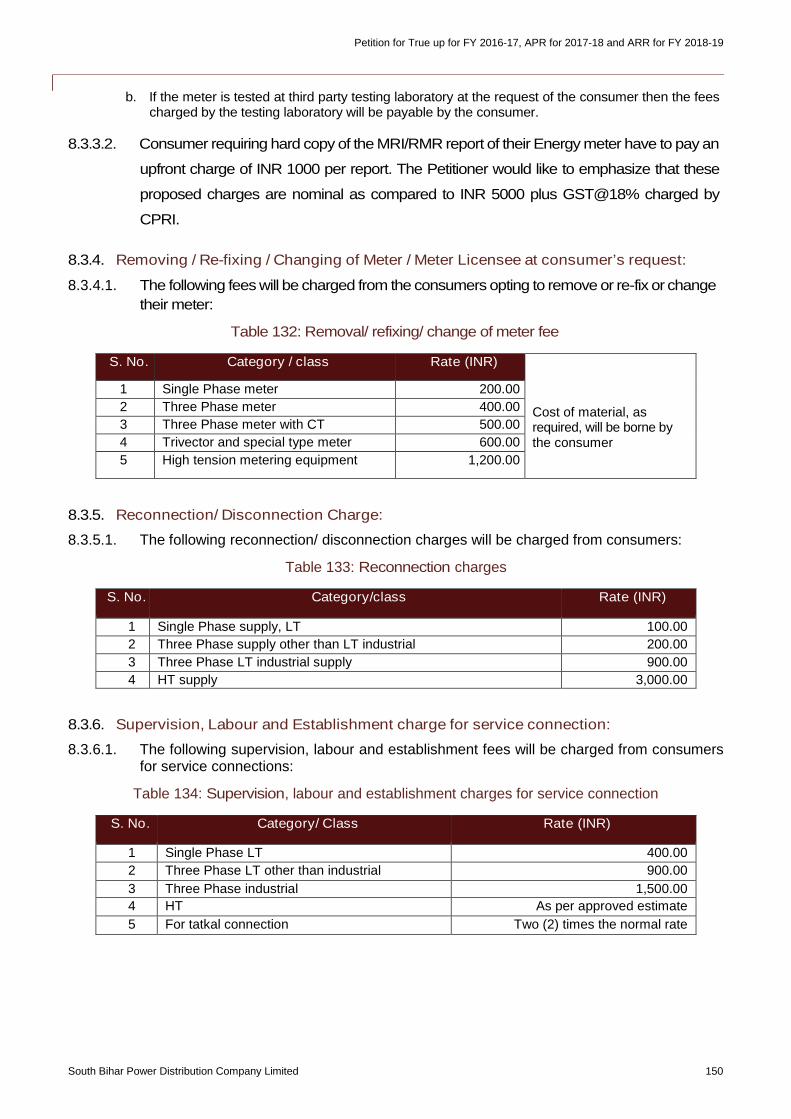
Petition for True up for FY 2016-17, APR for 2017-18 and ARR for FY 2018-19
South Bihar Power Distribution Company Limited 150
b. If the meter is tested at third party testing laboratory at the request of the consumer then the feescharged by the testing laboratory will be payable by the consumer.
8.3.3.2. Consumer requiring hard copy of the MRI/RMR report of their Energy meter have to pay an
upfront charge of INR 1000 per report. The Petitioner would like to emphasize that these
proposed charges are nominal as compared to INR 5000 plus GST@18% charged by
CPRI.
8.3.4. Removing / Re-fixing / Changing of Meter / Meter Licensee at consumer’s request:
8.3.4.1. The following fees will be charged from the consumers opting to remove or re-fix or change
their meter:
Table 132: Removal/ refixing/ change of meter fee
S. No. Category / class Rate (INR)
Cost of material, asrequired, will be borne bythe consumer
1 Single Phase meter 200.00
2 Three Phase meter 400.00
3 Three Phase meter with CT 500.00
4 Trivector and special type meter 600.00
5 High tension metering equipment 1,200.00
8.3.5. Reconnection/ Disconnection Charge:
8.3.5.1. The following reconnection/ disconnection charges will be charged from consumers:
Table 133: Reconnection charges
S. No. Category/class Rate (INR)
1 Single Phase supply, LT 100.00
2 Three Phase supply other than LT industrial 200.00
3 Three Phase LT industrial supply 900.00
4 HT supply 3,000.00
8.3.6. Supervision, Labour and Establishment charge for service connection:
8.3.6.1. The following supervision, labour and establishment fees will be charged from consumersfor service connections:
Table 134: Supervision, labour and establishment charges for service connection
S. No. Category/ Class Rate (INR)
1 Single Phase LT 400.00
2 Three Phase LT other than industrial 900.00
3 Three Phase industrial 1,500.00
4 HT As per approved estimate
5 For tatkal connection Two (2) times the normal rate
Petition for True up for FY 2016-17, APR for 2017-18 and ARR for FY 2018-19
South Bihar Power Distribution Company Limited 151
8.4. Security Deposit
8.4.1. The consumer (except Kutir Jyoti rural and Kutir Jyoti urban) shall pay initial security deposit
equivalent to the estimated energy charges including fixed / demand charges for a period of
two months or as per the provisions of Bihar Electricity Supply Code notified by the
Commission.
8.4.2. All Central Government and State Government departments are exempted from payment of
security deposit. However all public sector undertakings and local bodies shall pay security
deposit, as applicable.
8.4.3. The amount of security deposit obtained from the consumer is liable to be enhanced every
year, in April-May of next year on the basis of consumption during previous years or as
specified in clause 7.15 of Bihar Electricity Supply Code. In default of payment of additional
security deposit, wherever payable after review, the service line may be disconnected on
serving thirty days’ notice and connection thereafter can be restored only if the deposit is made
in full along with the prescribed reconnection charges and surcharge @1.5% per month or part
thereof on the amount of outstanding.
8.5. Interest on Security Deposit
8.5.1. Security deposit made by a consumer shall bear interest as specified in Bihar Electricity Supply
Code, payable at Bank rate notified by RBI from time to time. The interest will be calculated for
full calendar months only and fraction of a month in which the deposit is received or refunded,
shall be ignored. The interest for the period ending 31st March shall be adjusted and allowed
to the consumer in the energy bill for May issued in June and in subsequent month(s), if not
adjusted completely against the bill for the month of May.
Petition for True up for FY 2016-17, APR for 2017-18 and ARR for FY 2018-19
South Bihar Power Distribution Company Limited 152
9. Proposed Tariff Schedule for FY 2018-19
9.1. Simplification of tariff structures for electricity consumers in Bihar
9.1.1. Historically, the State of Bihar had a very elaborate tariff structure, with tariff categories and
slabs defined for various segments of consumers. These had been developed over the years
taking into account the socio-economic profile of the state, consumption patterns, etc. Multiple
sub-categories and slabs in each tariff category make the tariff structure highly complex and
difficult for the consumer to understand. A comparison with other states with a similar socio-
economic and consumer profile shows that Bihar has one of the highest number of electricity
tariff categories, sub-categories and slabs in the country, which in cumulatively added up to
over 100 plus charging slabs.
9.1.2. In its tariff petition filing for last year viz. FY 2017-18, and with the subsequent approval of the
Hon’ble Commission, the power Distribution companies of Bihar have been successful in
reducing the number of tariff categories, sub-categories and energy slabs to create a
comparatively simpler tariff schedule for the consumers of the State.
i. Simplifying the tariff structure,
ii. Bring in a progressive tariff structure that helps promote efficiency, and
iii. Rationalization of tariffs for the ease of consumers in the State.
9.1.3. For this year as well, the power distribution companies of Bihar have kept the following
objectives while proposing the tariff structure for FY 2018-19
Ensuring that an adequate balance is maintained between the interest of consumers
and the distribution utility,
Enabling consumers to efficiently and effectively plan their expenditure on electricity
Ensuring that tariffs progressively reflect the prudent and efficient cost of supply to the
consumers, and
Incentivizing the consumer for efficient utilization of electricity.
9.1.4. The Discoms have followed the given below key guiding principles for proposing the tariff
structure and tariffs which would be applicable for the financial year 2018-19, which is the same
as used for the prevalent tariff structure.
i. Merging or elimination of category / sub-category has been done based on relevance,
whether the categorization is still valid in the current scenario;
ii. Ensure that each major tariff category has a maximum of 3 energy slabs to maintain
simplicity of structure;
iii. Introduction of two part tariff for all metered consumer categories;
iv. Unmetered tariff category to be phased out with the large metering drives that the
Discoms are planning to undertake over the next twelve to eighteen months;
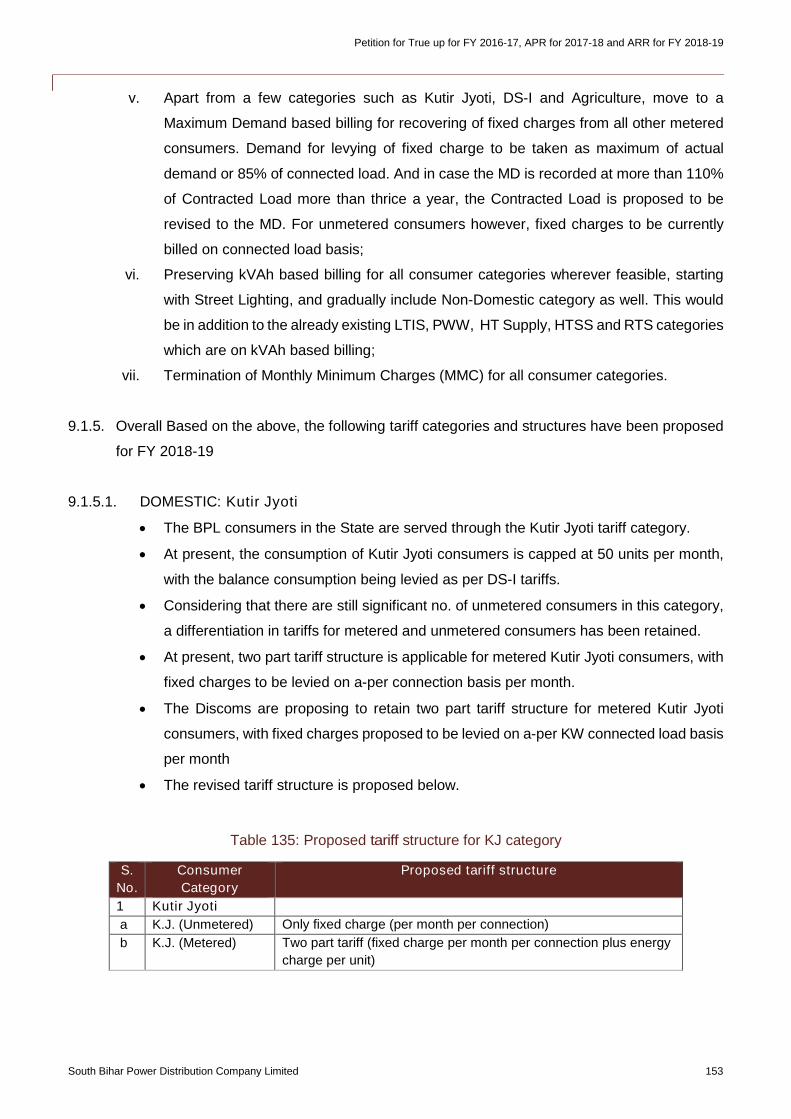
Petition for True up for FY 2016-17, APR for 2017-18 and ARR for FY 2018-19
South Bihar Power Distribution Company Limited 153
v. Apart from a few categories such as Kutir Jyoti, DS-I and Agriculture, move to a
Maximum Demand based billing for recovering of fixed charges from all other metered
consumers. Demand for levying of fixed charge to be taken as maximum of actual
demand or 85% of connected load. And in case the MD is recorded at more than 110%
of Contracted Load more than thrice a year, the Contracted Load is proposed to be
revised to the MD. For unmetered consumers however, fixed charges to be currently
billed on connected load basis;
vi. Preserving kVAh based billing for all consumer categories wherever feasible, starting
with Street Lighting, and gradually include Non-Domestic category as well. This would
be in addition to the already existing LTIS, PWW, HT Supply, HTSS and RTS categories
which are on kVAh based billing;
vii. Termination of Monthly Minimum Charges (MMC) for all consumer categories.
9.1.5. Overall Based on the above, the following tariff categories and structures have been proposed
for FY 2018-19
9.1.5.1. DOMESTIC: Kutir Jyoti
The BPL consumers in the State are served through the Kutir Jyoti tariff category.
At present, the consumption of Kutir Jyoti consumers is capped at 50 units per month,
with the balance consumption being levied as per DS-I tariffs.
Considering that there are still significant no. of unmetered consumers in this category,
a differentiation in tariffs for metered and unmetered consumers has been retained.
At present, two part tariff structure is applicable for metered Kutir Jyoti consumers, with
fixed charges to be levied on a-per connection basis per month.
The Discoms are proposing to retain two part tariff structure for metered Kutir Jyoti
consumers, with fixed charges proposed to be levied on a-per KW connected load basis
per month
The revised tariff structure is proposed below.
Table 135: Proposed tariff structure for KJ category
S.
No.
Consumer
Category
Proposed tariff structure
1 Kutir Jyoti
a K.J. (Unmetered) Only fixed charge (per month per connection)
b K.J. (Metered) Two part tariff (fixed charge per month per connection plus energy
charge per unit)
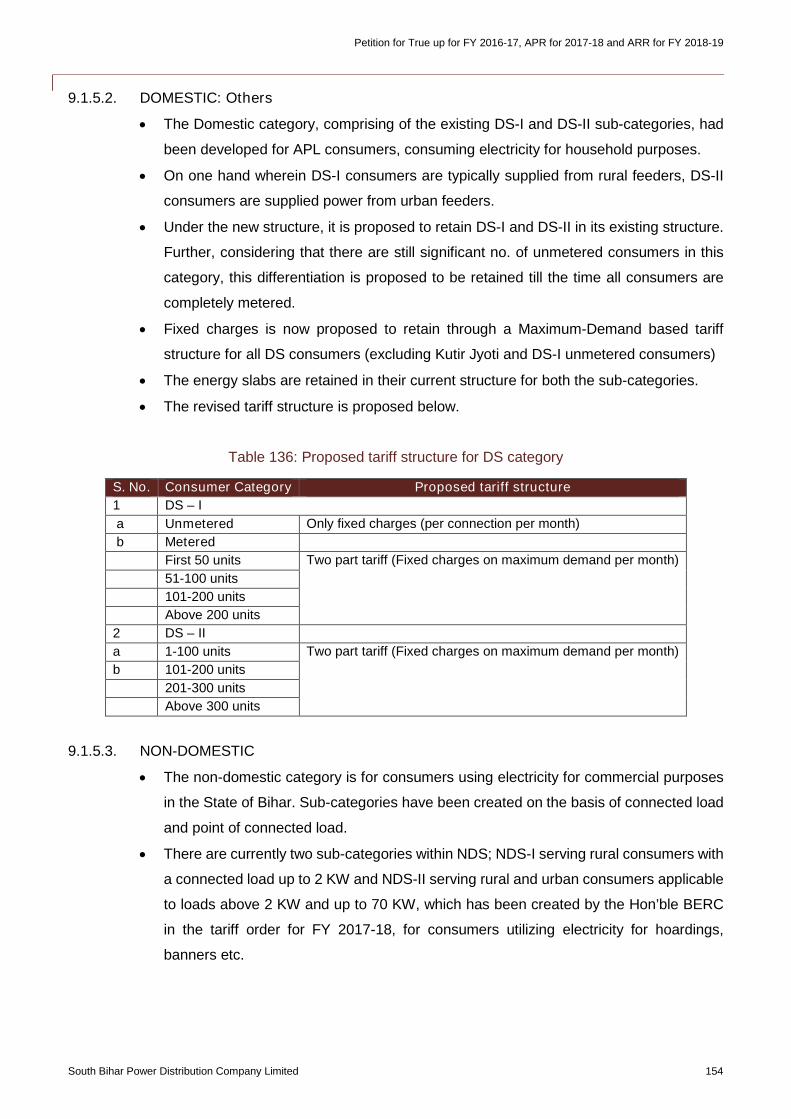
Petition for True up for FY 2016-17, APR for 2017-18 and ARR for FY 2018-19
South Bihar Power Distribution Company Limited 154
9.1.5.2. DOMESTIC: Others
The Domestic category, comprising of the existing DS-I and DS-II sub-categories, had
been developed for APL consumers, consuming electricity for household purposes.
On one hand wherein DS-I consumers are typically supplied from rural feeders, DS-II
consumers are supplied power from urban feeders.
Under the new structure, it is proposed to retain DS-I and DS-II in its existing structure.
Further, considering that there are still significant no. of unmetered consumers in this
category, this differentiation is proposed to be retained till the time all consumers are
completely metered.
Fixed charges is now proposed to retain through a Maximum-Demand based tariff
structure for all DS consumers (excluding Kutir Jyoti and DS-I unmetered consumers)
The energy slabs are retained in their current structure for both the sub-categories.
The revised tariff structure is proposed below.
Table 136: Proposed tariff structure for DS category
S. No. Consumer Category Proposed tariff structure
1 DS – I
a Unmetered Only fixed charges (per connection per month)
b Metered
First 50 units Two part tariff (Fixed charges on maximum demand per month)
51-100 units
101-200 units
Above 200 units
2 DS – II
a 1-100 units Two part tariff (Fixed charges on maximum demand per month)
b 101-200 units
201-300 units
Above 300 units
9.1.5.3. NON-DOMESTIC
The non-domestic category is for consumers using electricity for commercial purposes
in the State of Bihar. Sub-categories have been created on the basis of connected load
and point of connected load.
There are currently two sub-categories within NDS; NDS-I serving rural consumers with
a connected load up to 2 KW and NDS-II serving rural and urban consumers applicable
to loads above 2 KW and up to 70 KW, which has been created by the Hon’ble BERC
in the tariff order for FY 2017-18, for consumers utilizing electricity for hoardings,
banners etc.
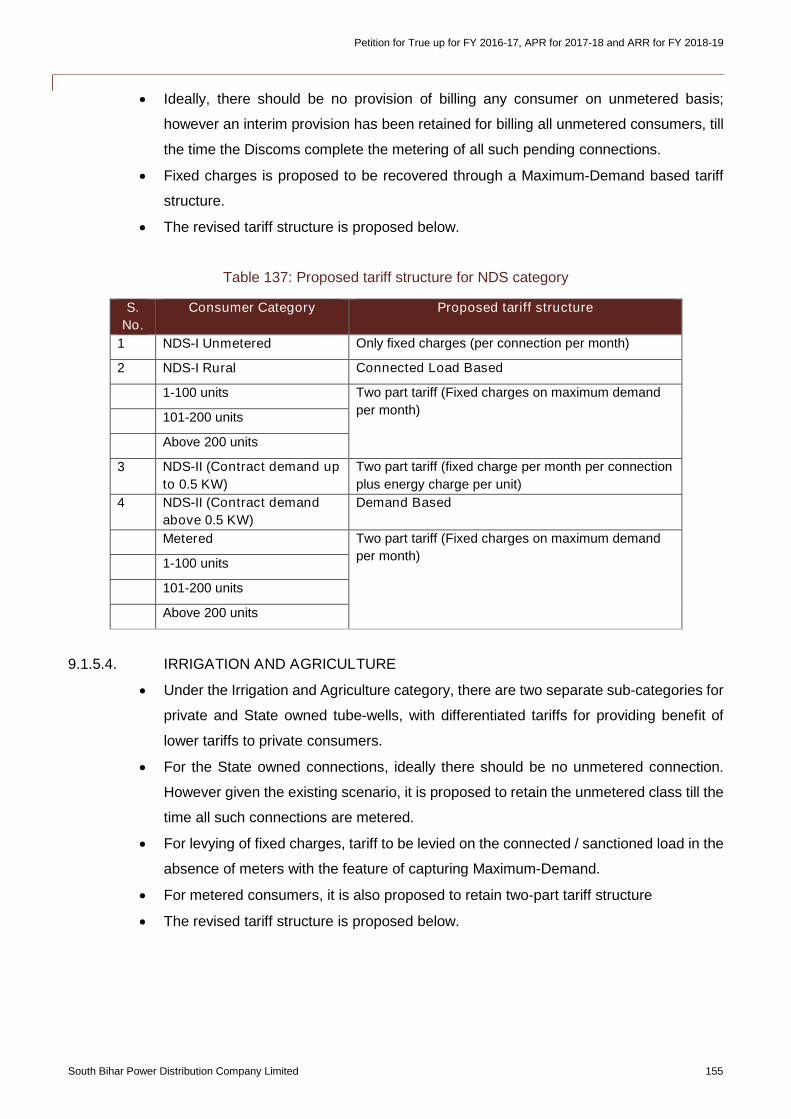
Petition for True up for FY 2016-17, APR for 2017-18 and ARR for FY 2018-19
South Bihar Power Distribution Company Limited 155
Ideally, there should be no provision of billing any consumer on unmetered basis;
however an interim provision has been retained for billing all unmetered consumers, till
the time the Discoms complete the metering of all such pending connections.
Fixed charges is proposed to be recovered through a Maximum-Demand based tariff
structure.
The revised tariff structure is proposed below.
Table 137: Proposed tariff structure for NDS category
S.
No.
Consumer Category Proposed tariff structure
1 NDS-I Unmetered Only fixed charges (per connection per month)
2 NDS-I Rural Connected Load Based
1-100 units Two part tariff (Fixed charges on maximum demand
per month)101-200 units
Above 200 units
3 NDS-II (Contract demand up
to 0.5 KW)
Two part tariff (fixed charge per month per connection
plus energy charge per unit)
4 NDS-II (Contract demand
above 0.5 KW)
Demand Based
Metered Two part tariff (Fixed charges on maximum demand
per month)1-100 units
101-200 units
Above 200 units
9.1.5.4. IRRIGATION AND AGRICULTURE
Under the Irrigation and Agriculture category, there are two separate sub-categories for
private and State owned tube-wells, with differentiated tariffs for providing benefit of
lower tariffs to private consumers.
For the State owned connections, ideally there should be no unmetered connection.
However given the existing scenario, it is proposed to retain the unmetered class till the
time all such connections are metered.
For levying of fixed charges, tariff to be levied on the connected / sanctioned load in the
absence of meters with the feature of capturing Maximum-Demand.
For metered consumers, it is also proposed to retain two-part tariff structure
The revised tariff structure is proposed below.
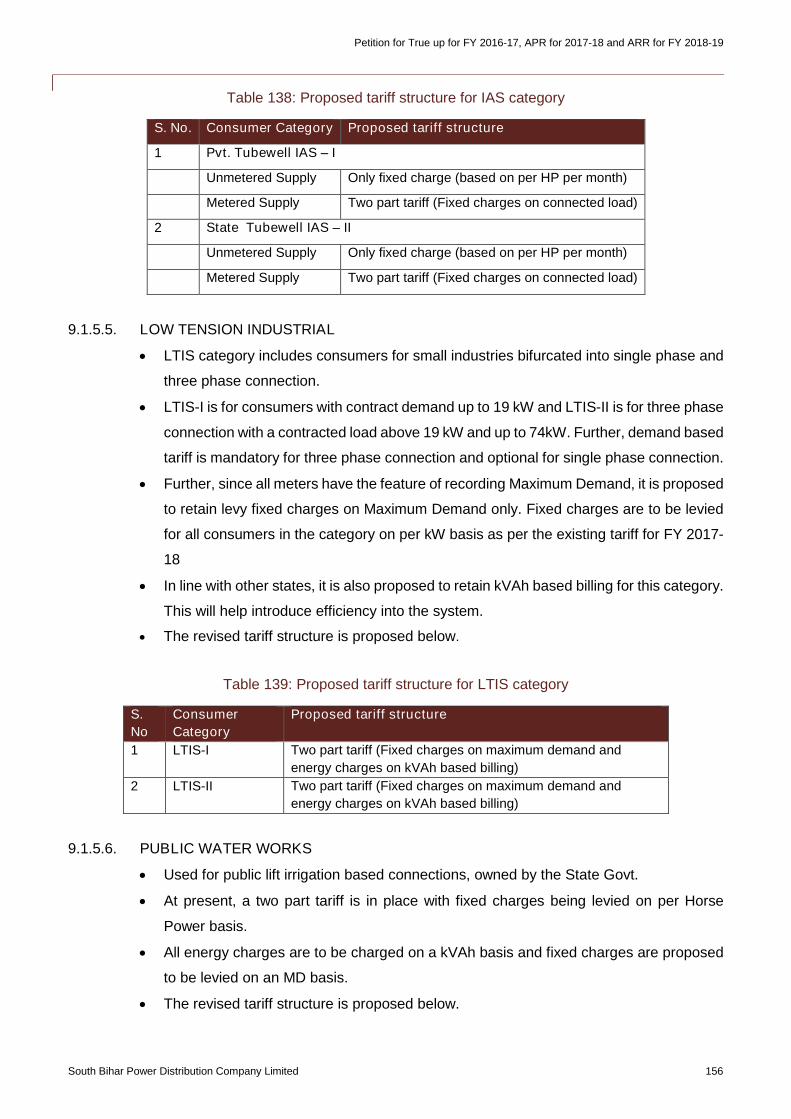
Petition for True up for FY 2016-17, APR for 2017-18 and ARR for FY 2018-19
South Bihar Power Distribution Company Limited 156
Table 138: Proposed tariff structure for IAS category
S. No. Consumer Category Proposed tariff structure
1 Pvt. Tubewell IAS – I
Unmetered Supply Only fixed charge (based on per HP per month)
Metered Supply Two part tariff (Fixed charges on connected load)
2 State Tubewell IAS – II
Unmetered Supply Only fixed charge (based on per HP per month)
Metered Supply Two part tariff (Fixed charges on connected load)
9.1.5.5. LOW TENSION INDUSTRIAL
LTIS category includes consumers for small industries bifurcated into single phase and
three phase connection.
LTIS-I is for consumers with contract demand up to 19 kW and LTIS-II is for three phase
connection with a contracted load above 19 kW and up to 74kW. Further, demand based
tariff is mandatory for three phase connection and optional for single phase connection.
Further, since all meters have the feature of recording Maximum Demand, it is proposed
to retain levy fixed charges on Maximum Demand only. Fixed charges are to be levied
for all consumers in the category on per kW basis as per the existing tariff for FY 2017-
18
In line with other states, it is also proposed to retain kVAh based billing for this category.
This will help introduce efficiency into the system.
The revised tariff structure is proposed below.
Table 139: Proposed tariff structure for LTIS category
S.
No
Consumer
Category
Proposed tariff structure
1 LTIS-I Two part tariff (Fixed charges on maximum demand and
energy charges on kVAh based billing)
2 LTIS-II Two part tariff (Fixed charges on maximum demand and
energy charges on kVAh based billing)
9.1.5.6. PUBLIC WATER WORKS
Used for public lift irrigation based connections, owned by the State Govt.
At present, a two part tariff is in place with fixed charges being levied on per Horse
Power basis.
All energy charges are to be charged on a kVAh basis and fixed charges are proposed
to be levied on an MD basis.
The revised tariff structure is proposed below.
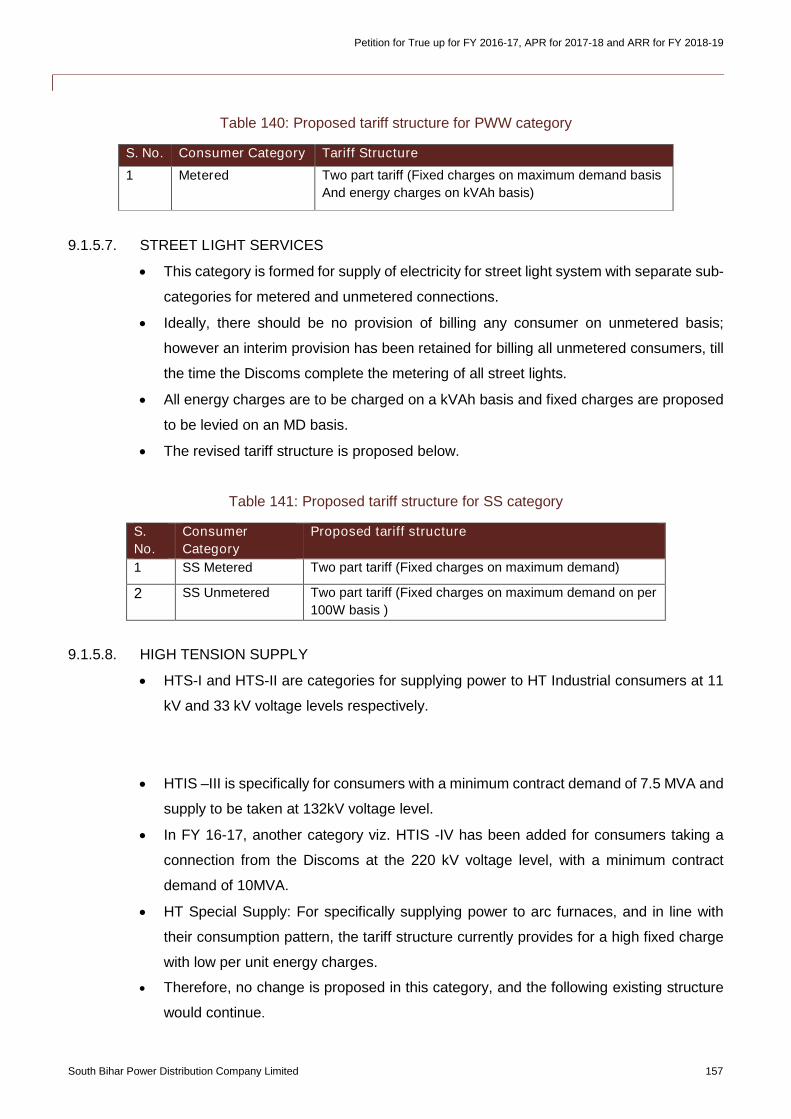
Petition for True up for FY 2016-17, APR for 2017-18 and ARR for FY 2018-19
South Bihar Power Distribution Company Limited 157
Table 140: Proposed tariff structure for PWW category
S. No. Consumer Category Tariff Structure
1 Metered Two part tariff (Fixed charges on maximum demand basis
And energy charges on kVAh basis)
9.1.5.7. STREET LIGHT SERVICES
This category is formed for supply of electricity for street light system with separate sub-
categories for metered and unmetered connections.
Ideally, there should be no provision of billing any consumer on unmetered basis;
however an interim provision has been retained for billing all unmetered consumers, till
the time the Discoms complete the metering of all street lights.
All energy charges are to be charged on a kVAh basis and fixed charges are proposed
to be levied on an MD basis.
The revised tariff structure is proposed below.
Table 141: Proposed tariff structure for SS category
S.
No.
Consumer
Category
Proposed tariff structure
1 SS Metered Two part tariff (Fixed charges on maximum demand)
2 SS Unmetered Two part tariff (Fixed charges on maximum demand on per
100W basis )
9.1.5.8. HIGH TENSION SUPPLY
HTS-I and HTS-II are categories for supplying power to HT Industrial consumers at 11
kV and 33 kV voltage levels respectively.
For HTS-II, it is proposed that minimum contract demand required for being eligible for
a connection under this category, be revised from the existing 1,000 kVA to 500 kVA.
HTIS –III is specifically for consumers with a minimum contract demand of 7.5 MVA and
supply to be taken at 132kV voltage level.
In FY 16-17, another category viz. HTIS -IV has been added for consumers taking a
connection from the Discoms at the 220 kV voltage level, with a minimum contract
demand of 10MVA.
HT Special Supply: For specifically supplying power to arc furnaces, and in line with
their consumption pattern, the tariff structure currently provides for a high fixed charge
with low per unit energy charges.
Therefore, no change is proposed in this category, and the following existing structure
would continue.
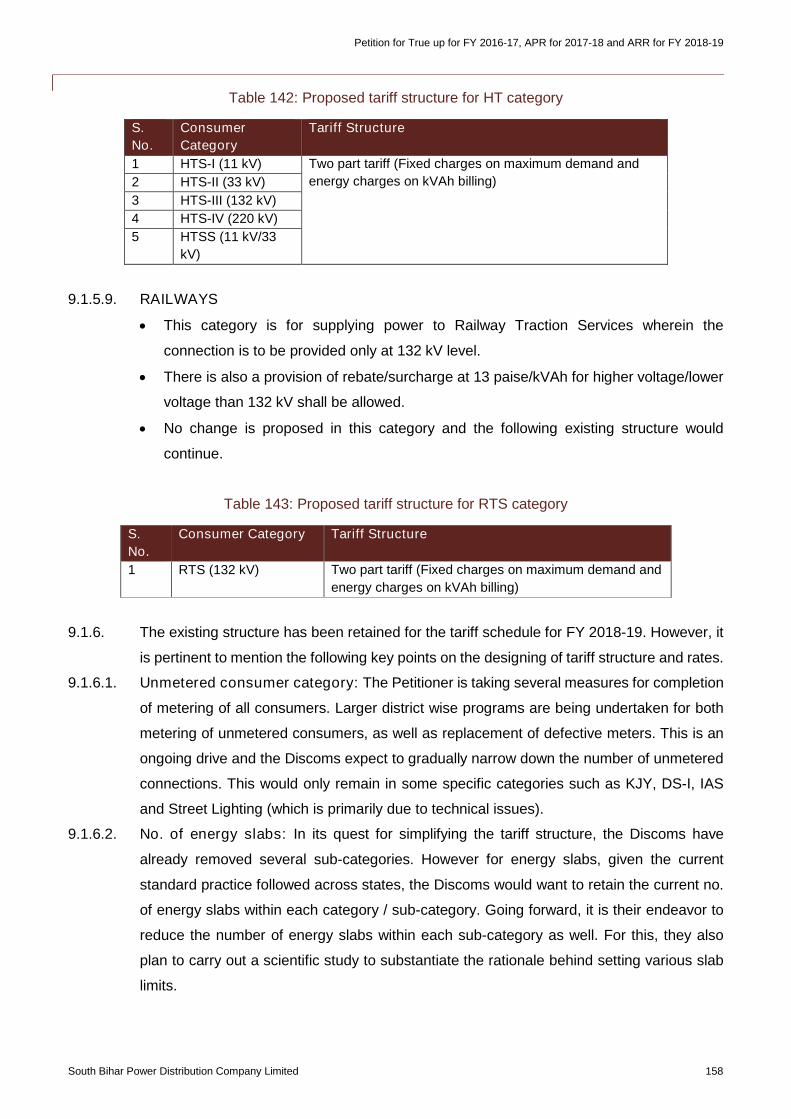
Petition for True up for FY 2016-17, APR for 2017-18 and ARR for FY 2018-19
South Bihar Power Distribution Company Limited 158
Table 142: Proposed tariff structure for HT category
S.
No.
Consumer
Category
Tariff Structure
1 HTS-I (11 kV) Two part tariff (Fixed charges on maximum demand and
energy charges on kVAh billing)2 HTS-II (33 kV)
3 HTS-III (132 kV)
4 HTS-IV (220 kV)
5 HTSS (11 kV/33
kV)
9.1.5.9. RAILWAYS
This category is for supplying power to Railway Traction Services wherein the
connection is to be provided only at 132 kV level.
There is also a provision of rebate/surcharge at 13 paise/kVAh for higher voltage/lower
voltage than 132 kV shall be allowed.
No change is proposed in this category and the following existing structure would
continue.
Table 143: Proposed tariff structure for RTS category
S.
No.
Consumer Category Tariff Structure
1 RTS (132 kV) Two part tariff (Fixed charges on maximum demand and
energy charges on kVAh billing)
9.1.6. The existing structure has been retained for the tariff schedule for FY 2018-19. However, it
is pertinent to mention the following key points on the designing of tariff structure and rates.
9.1.6.1. Unmetered consumer category: The Petitioner is taking several measures for completion
of metering of all consumers. Larger district wise programs are being undertaken for both
metering of unmetered consumers, as well as replacement of defective meters. This is an
ongoing drive and the Discoms expect to gradually narrow down the number of unmetered
connections. This would only remain in some specific categories such as KJY, DS-I, IAS
and Street Lighting (which is primarily due to technical issues).
9.1.6.2. No. of energy slabs: In its quest for simplifying the tariff structure, the Discoms have
already removed several sub-categories. However for energy slabs, given the current
standard practice followed across states, the Discoms would want to retain the current no.
of energy slabs within each category / sub-category. Going forward, it is their endeavor to
reduce the number of energy slabs within each sub-category as well. For this, they also
plan to carry out a scientific study to substantiate the rationale behind setting various slab
limits.
Petition for True up for FY 2016-17, APR for 2017-18 and ARR for FY 2018-19
South Bihar Power Distribution Company Limited 159
9.1.6.3. Existence of special categories: In Bihar, a separate category exists as HTSS for
specifically supplying power to arc furnaces, and in line with their consumption, their tariff
structure provides for a high fixed charge with a low per unit energy charge. The Discom is
planning to undertake a study for assessing the demand and consumption patterns of the
consumers on a sample basis, based on which it will develop a roadmap for merging this
category with relevant HTS category, starting FY 2019-20. For the ensuing year however,
no revision is proposed.
9.1.6.4. Levying of fixed charges: The endeavor of the Discoms is to levy the fixed tariff on
consumers based on their maximum demand in the long term, and on their contracted
demand in the short term. However for some specific unmetered consumer categories and
sub-categories, the fixed charge is proposed to be levied on each connection. The Discoms
are taking steps to reconcile the connected load of such consumers especially in the KJY,
DS-I and NDS-I categories, so as to avoid any excessive burden due to inaccurate load
records or limited energy usage.
9.1.6.5. Demand Based tariffs: The Discoms are planning to gradually move to demand based
tariffs for all consumers, and most meters being currently installed, have the feature of
recording the maximum demand.
9.1.6.6. Implementation of flat tariff: In order to simplify the tariff structure further, and also
encourage energy efficiency for consumers especially with higher specific consumption, the
Discoms have been exploring the concept of implementing a flat tariff for each energy slab.
However for the ensuing year, the existing structure has been retained wherein the benefit
of lower tariffs would continue for consumption at lower energy slabs.
9.1.6.7. Classification of consumers under urban and rural sub-category for DS-I/DS-II and
NDS-I/NDS-II: The extension of the electrical network of the Discoms has been done for
many areas, and in several cases, electrical feeders initially emerging from urban areas,
have now been extended to rural areas as well, based on financial viability. Therefore in
order to avoid any ambiguity pertaining to a classification of a consumer as Urban / Rural,
the categorization in the applicable sub-category within Domestic and Non-Domestic
categories, would be done only based on the latest / prevalent notification issued by the
relevant authority, denoting an area to be falling under Urban / Rural areas. No other
methodology would be followed.
9.1.6.8. Recovery fixed charges: The total gross ARR for FY 2018-19 for the two Discoms has
been estimated at INR 17,152 crores, with a split of 57% as fixed costs and 43% as variable
costs. The fixed costs include the establishment and network costs, as well as the fixed
costs payable to the Generators, irrespective whether power is drawn from them. The
variable costs is the energy cost paid to Generators for supply of energy. On one hand
wherein the cost structure of the two Discoms is heavily tilted towards fixed charges, the
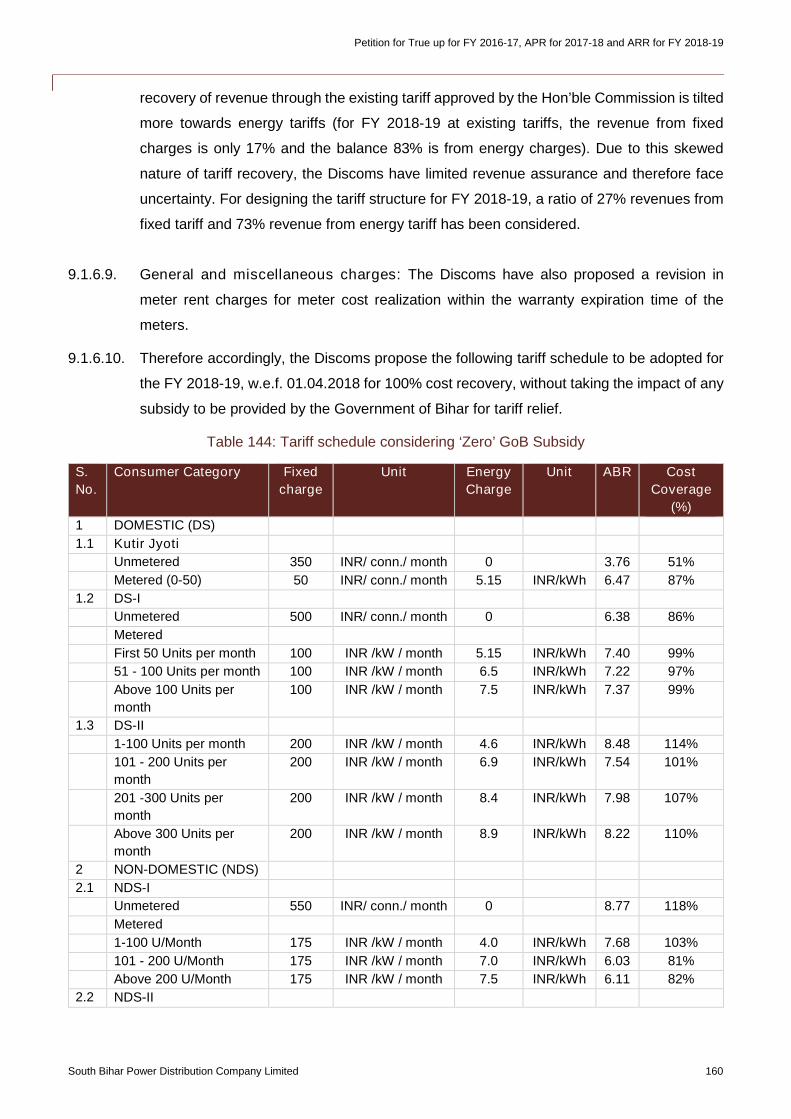
Petition for True up for FY 2016-17, APR for 2017-18 and ARR for FY 2018-19
South Bihar Power Distribution Company Limited 160
recovery of revenue through the existing tariff approved by the Hon’ble Commission is tilted
more towards energy tariffs (for FY 2018-19 at existing tariffs, the revenue from fixed
charges is only 17% and the balance 83% is from energy charges). Due to this skewed
nature of tariff recovery, the Discoms have limited revenue assurance and therefore face
uncertainty. For designing the tariff structure for FY 2018-19, a ratio of 27% revenues from
fixed tariff and 73% revenue from energy tariff has been considered.
9.1.6.9. General and miscellaneous charges: The Discoms have also proposed a revision in
meter rent charges for meter cost realization within the warranty expiration time of the
meters.
9.1.6.10. Therefore accordingly, the Discoms propose the following tariff schedule to be adopted for
the FY 2018-19, w.e.f. 01.04.2018 for 100% cost recovery, without taking the impact of any
subsidy to be provided by the Government of Bihar for tariff relief.
Table 144: Tariff schedule considering ‘Zero’ GoB Subsidy
S.
No.
Consumer Category Fixed
charge
Unit Energy
Charge
Unit ABR Cost
Coverage
(%)
1 DOMESTIC (DS)
1.1 Kutir Jyoti
Unmetered 350 INR/ conn./ month 0 3.76 51%
Metered (0-50) 50 INR/ conn./ month 5.15 INR/kWh 6.47 87%
1.2 DS-I
Unmetered 500 INR/ conn./ month 0 6.38 86%
Metered
First 50 Units per month 100 INR /kW / month 5.15 INR/kWh 7.40 99%
51 - 100 Units per month 100 INR /kW / month 6.5 INR/kWh 7.22 97%
Above 100 Units per
month
100 INR /kW / month 7.5 INR/kWh 7.37 99%
1.3 DS-II
1-100 Units per month 200 INR /kW / month 4.6 INR/kWh 8.48 114%
101 - 200 Units per
month
200 INR /kW / month 6.9 INR/kWh 7.54 101%
201 -300 Units per
month
200 INR /kW / month 8.4 INR/kWh 7.98 107%
Above 300 Units per
month
200 INR /kW / month 8.9 INR/kWh 8.22 110%
2 NON-DOMESTIC (NDS)
2.1 NDS-I
Unmetered 550 INR/ conn./ month 0 8.77 118%
Metered
1-100 U/Month 175 INR /kW / month 4.0 INR/kWh 7.68 103%
101 - 200 U/Month 175 INR /kW / month 7.0 INR/kWh 6.03 81%
Above 200 U/Month 175 INR /kW / month 7.5 INR/kWh 6.11 82%
2.2 NDS-II
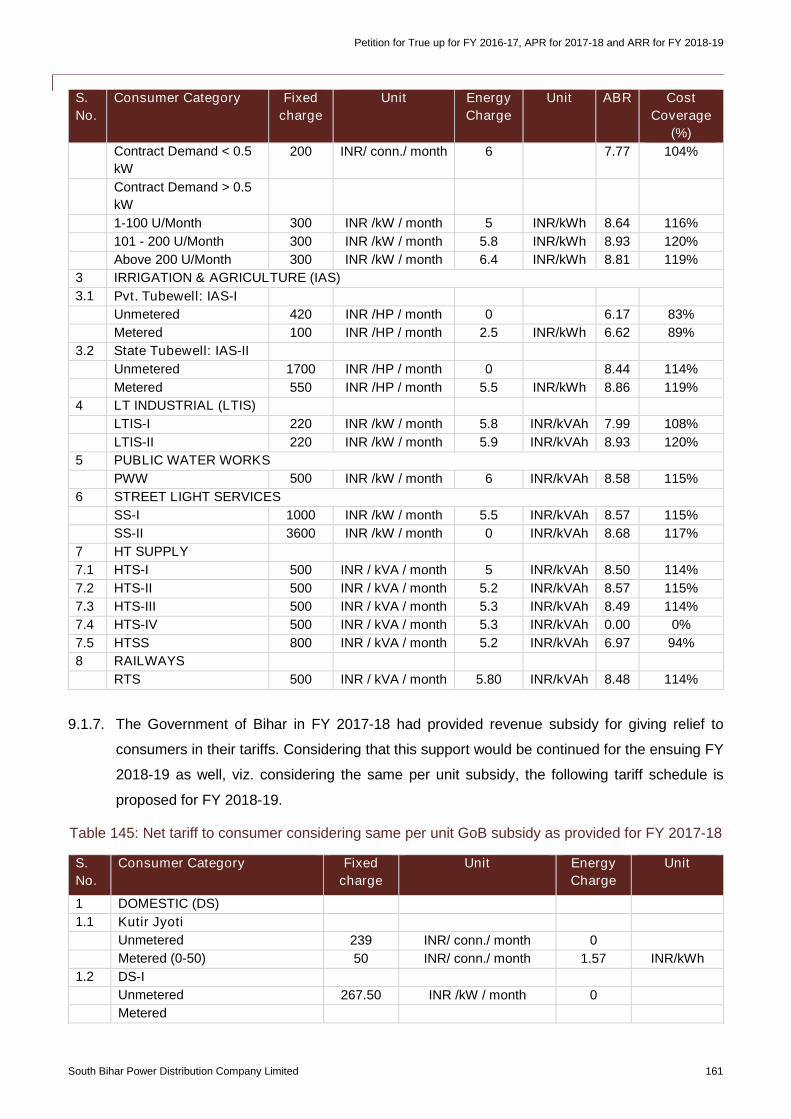
Petition for True up for FY 2016-17, APR for 2017-18 and ARR for FY 2018-19
South Bihar Power Distribution Company Limited 161
S.
No.
Consumer Category Fixed
charge
Unit Energy
Charge
Unit ABR Cost
Coverage
(%)
Contract Demand < 0.5
kW
200 INR/ conn./ month 6 7.77 104%
Contract Demand > 0.5
kW
1-100 U/Month 300 INR /kW / month 5 INR/kWh 8.64 116%
101 - 200 U/Month 300 INR /kW / month 5.8 INR/kWh 8.93 120%
Above 200 U/Month 300 INR /kW / month 6.4 INR/kWh 8.81 119%
3 IRRIGATION & AGRICULTURE (IAS)
3.1 Pvt. Tubewell: IAS-I
Unmetered 420 INR /HP / month 0 6.17 83%
Metered 100 INR /HP / month 2.5 INR/kWh 6.62 89%
3.2 State Tubewell: IAS-II
Unmetered 1700 INR /HP / month 0 8.44 114%
Metered 550 INR /HP / month 5.5 INR/kWh 8.86 119%
4 LT INDUSTRIAL (LTIS)
LTIS-I 220 INR /kW / month 5.8 INR/kVAh 7.99 108%
LTIS-II 220 INR /kW / month 5.9 INR/kVAh 8.93 120%
5 PUBLIC WATER WORKS
PWW 500 INR /kW / month 6 INR/kVAh 8.58 115%
6 STREET LIGHT SERVICES
SS-I 1000 INR /kW / month 5.5 INR/kVAh 8.57 115%
SS-II 3600 INR /kW / month 0 INR/kVAh 8.68 117%
7 HT SUPPLY
7.1 HTS-I 500 INR / kVA / month 5 INR/kVAh 8.50 114%
7.2 HTS-II 500 INR / kVA / month 5.2 INR/kVAh 8.57 115%
7.3 HTS-III 500 INR / kVA / month 5.3 INR/kVAh 8.49 114%
7.4 HTS-IV 500 INR / kVA / month 5.3 INR/kVAh 0.00 0%
7.5 HTSS 800 INR / kVA / month 5.2 INR/kVAh 6.97 94%
8 RAILWAYS
RTS 500 INR / kVA / month 5.80 INR/kVAh 8.48 114%
9.1.7. The Government of Bihar in FY 2017-18 had provided revenue subsidy for giving relief to
consumers in their tariffs. Considering that this support would be continued for the ensuing FY
2018-19 as well, viz. considering the same per unit subsidy, the following tariff schedule is
proposed for FY 2018-19.
Table 145: Net tariff to consumer considering same per unit GoB subsidy as provided for FY 2017-18
S.
No.
Consumer Category Fixed
charge
Unit Energy
Charge
Unit
1 DOMESTIC (DS)
1.1 Kutir Jyoti
Unmetered 239 INR/ conn./ month 0
Metered (0-50) 50 INR/ conn./ month 1.57 INR/kWh
1.2 DS-I
Unmetered 267.50 INR /kW / month 0
Metered
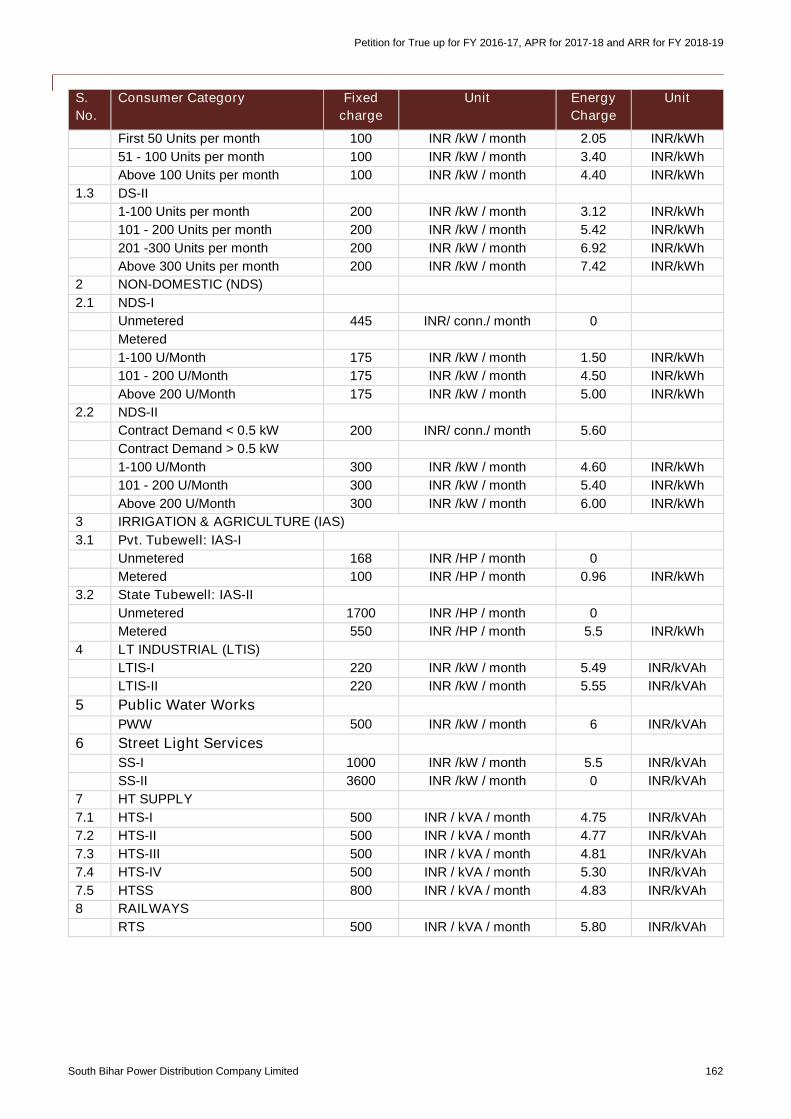
Petition for True up for FY 2016-17, APR for 2017-18 and ARR for FY 2018-19
South Bihar Power Distribution Company Limited 162
S.
No.
Consumer Category Fixed
charge
Unit Energy
Charge
Unit
First 50 Units per month 100 INR /kW / month 2.05 INR/kWh
51 - 100 Units per month 100 INR /kW / month 3.40 INR/kWh
Above 100 Units per month 100 INR /kW / month 4.40 INR/kWh
1.3 DS-II
1-100 Units per month 200 INR /kW / month 3.12 INR/kWh
101 - 200 Units per month 200 INR /kW / month 5.42 INR/kWh
201 -300 Units per month 200 INR /kW / month 6.92 INR/kWh
Above 300 Units per month 200 INR /kW / month 7.42 INR/kWh
2 NON-DOMESTIC (NDS)
2.1 NDS-I
Unmetered 445 INR/ conn./ month 0
Metered
1-100 U/Month 175 INR /kW / month 1.50 INR/kWh
101 - 200 U/Month 175 INR /kW / month 4.50 INR/kWh
Above 200 U/Month 175 INR /kW / month 5.00 INR/kWh
2.2 NDS-II
Contract Demand < 0.5 kW 200 INR/ conn./ month 5.60
Contract Demand > 0.5 kW
1-100 U/Month 300 INR /kW / month 4.60 INR/kWh
101 - 200 U/Month 300 INR /kW / month 5.40 INR/kWh
Above 200 U/Month 300 INR /kW / month 6.00 INR/kWh
3 IRRIGATION & AGRICULTURE (IAS)
3.1 Pvt. Tubewell: IAS-I
Unmetered 168 INR /HP / month 0
Metered 100 INR /HP / month 0.96 INR/kWh
3.2 State Tubewell: IAS-II
Unmetered 1700 INR /HP / month 0
Metered 550 INR /HP / month 5.5 INR/kWh
4 LT INDUSTRIAL (LTIS)
LTIS-I 220 INR /kW / month 5.49 INR/kVAh
LTIS-II 220 INR /kW / month 5.55 INR/kVAh
5 Public Water Works
PWW 500 INR /kW / month 6 INR/kVAh
6 Street Light Services
SS-I 1000 INR /kW / month 5.5 INR/kVAh
SS-II 3600 INR /kW / month 0 INR/kVAh
7 HT SUPPLY
7.1 HTS-I 500 INR / kVA / month 4.75 INR/kVAh
7.2 HTS-II 500 INR / kVA / month 4.77 INR/kVAh
7.3 HTS-III 500 INR / kVA / month 4.81 INR/kVAh
7.4 HTS-IV 500 INR / kVA / month 5.30 INR/kVAh
7.5 HTSS 800 INR / kVA / month 4.83 INR/kVAh
8 RAILWAYS
RTS 500 INR / kVA / month 5.80 INR/kVAh
Petition for True up for FY 2016-17, APR for 2017-18 and ARR for FY 2018-19
South Bihar Power Distribution Company Limited 163
9.2. Tariff schedule for consumers under DDG scheme of DDUGJY
9.2.1. There are certain localities within the licensing area of the Petitioner where traditional way of
electrifications is neither possible nor commercial viable. For such areas the Petitioner has
chosen SOLAR Power based Stand Alone system under Decentralized Distribution Generation
(DDG) Scheme of DDUGJY recommended by M/s Rural Electrification Corporation Limited,
New Delhi (REC) as per their guidelines.
9.2.2. The Petitioner has chosen M/s Larsen & Toubro Ltd, Chennai through open competitive
bidding vide NIT No. 01/PR/SBPDCL/2017 Dated 11/01/2017 to electrify, operate, maintain and
collect revenue in 7 revenue districts of South Bihar i.e Kaimur, Bhagalpur, Banka, Jamui,
Munger, Nawada & Rohtas. A formal contract agreement has been signed between the
Petitioner & L&T on 19th August 2017 vide no. 123/2017-18-CE(P1) and 124/2017-18-CE(P1).
9.2.3. As per the contract agreement; M/s Larsen & Toubro Ltd (the agency) has the following
responsibilities:
1) Survey & identify the locality targeted to be electrified under DDG Scheme of DDUGJY.
2) Detail Engineering, planning & designing of Solar Power Plant and its associated network
lines to electrify villages and extend power supply to BPL & APL Consumers in these list of
villages,
3) Procurement of all the material required for the project area.
4) Commissioning of Solar Power plant as per the approved design & Specification approved
by SBPDCL
5) Laying LT Network and other infrastructure for extending power supply to BPL & APL
consumers identified in this scheme
6) Providing connection to BPL & APL Households without meters as per the Technical
specification with 3 LED Light points and 2 Power sockets.
7) Operation & Maintenance of the system for next 5 years from actual date of commissioning.
9.2.4. As per the aforesaid Contract Agreement the agency needs to provide electricity supply to rural
households at least 75 days in a quarter as per the schedule defined in the contract agreement
as follows;
In summer period (March to October):
Morning: 5 AM to 10 AM (1 to 3 hours)
Evening: 6 PM to 11 PM (5 hours)
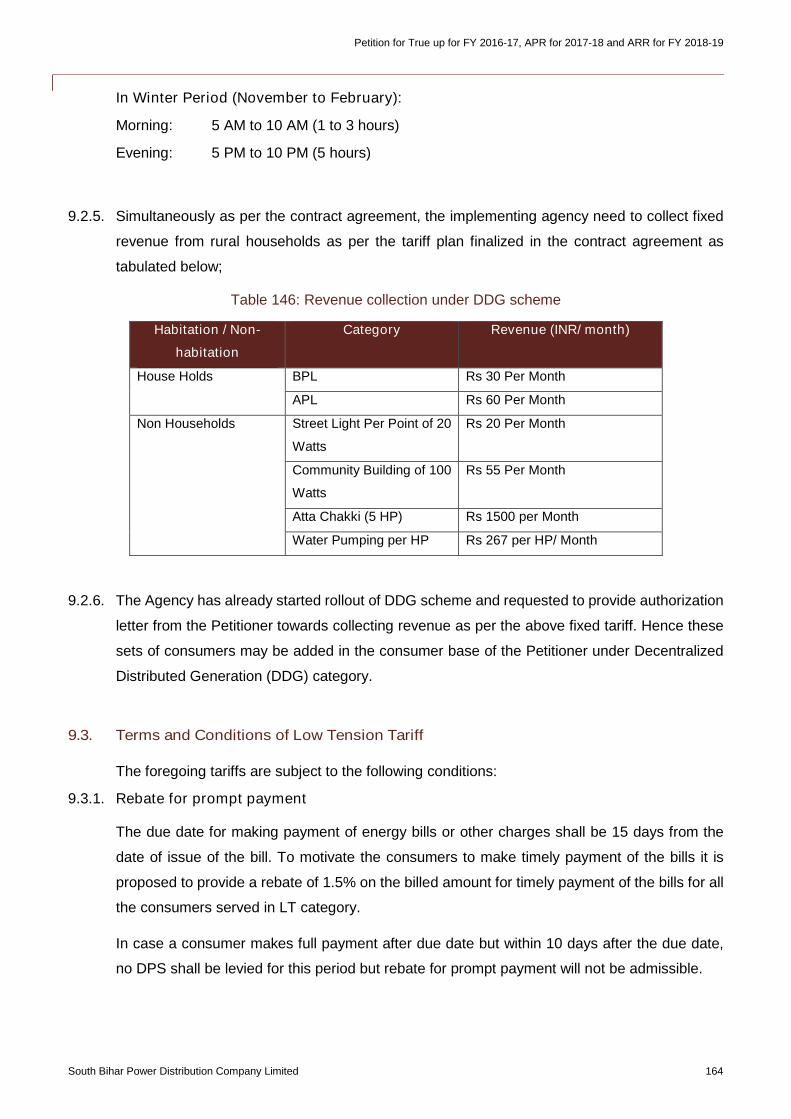
Petition for True up for FY 2016-17, APR for 2017-18 and ARR for FY 2018-19
South Bihar Power Distribution Company Limited 164
In Winter Period (November to February):
Morning: 5 AM to 10 AM (1 to 3 hours)
Evening: 5 PM to 10 PM (5 hours)
9.2.5. Simultaneously as per the contract agreement, the implementing agency need to collect fixed
revenue from rural households as per the tariff plan finalized in the contract agreement as
tabulated below;
Table 146: Revenue collection under DDG scheme
Habitation / Non-
habitation
Category Revenue (INR/ month)
House Holds BPL Rs 30 Per Month
APL Rs 60 Per Month
Non Households Street Light Per Point of 20
Watts
Rs 20 Per Month
Community Building of 100
Watts
Rs 55 Per Month
Atta Chakki (5 HP) Rs 1500 per Month
Water Pumping per HP Rs 267 per HP/ Month
9.2.6. The Agency has already started rollout of DDG scheme and requested to provide authorization
letter from the Petitioner towards collecting revenue as per the above fixed tariff. Hence these
sets of consumers may be added in the consumer base of the Petitioner under Decentralized
Distributed Generation (DDG) category.
9.3. Terms and Conditions of Low Tension Tariff
The foregoing tariffs are subject to the following conditions:
9.3.1. Rebate for prompt payment
The due date for making payment of energy bills or other charges shall be 15 days from the
date of issue of the bill. To motivate the consumers to make timely payment of the bills it is
proposed to provide a rebate of 1.5% on the billed amount for timely payment of the bills for all
the consumers served in LT category.
In case a consumer makes full payment after due date but within 10 days after the due date,
no DPS shall be levied for this period but rebate for prompt payment will not be admissible.
Petition for True up for FY 2016-17, APR for 2017-18 and ARR for FY 2018-19
South Bihar Power Distribution Company Limited 165
9.3.2. Rebate for online payment
To motivate the consumers to make online payment of the bills through online web portal of the
Petitioner it is proposed to provide a rebate of 1% of the billed amount in addition to rebate @
1.5% on the billed amount for timely payment of the bills for all the consumers served in LT
category. Payment made through all electronic modes of payment made directly in the Discom
account will be considered as online payment. However, online payment rebate shall be
applicable if the consumer makes the payment within due date in full.
In case a consumer makes full payment after due date but within 10 days after the due date,
no DPS shall be levied for this period but rebate for prompt payment will not be admissible.
9.3.3. Accounting of Partial Payment
All payment made by consumers in full or part shall be adjusted in the following order of priority:
a. Statutory taxes and duties on current consumption
b. Arrear of Statutory taxes and duties
c. Delayed payment surcharge
d. Balance of arrears
e. Balance of current bill
9.3.4. Delayed Payment Surcharge (DPS)
In case a consumer does not pay energy bills in full within 10 days grace period after due date
specified in the bill, a delayed payment surcharge of one and half (1.5) percent per month or
part thereof on the outstanding principal amount of bill will be levied from the due date for
payment until the payment is made in full without prejudice to right of the licensee to disconnect
the supply in accordance with Section 56 of the Electricity Act, 2003. The licensee shall clearly
indicate in the bill itself the total amount, including DPS, payable for different dates after the
due date after allowing for the grace period of 10 days. No DPS shall be charged on DPS arrear.
The bill shall indicate the energy charges for the month, arrears of energy charges and DPS
separately.
9.3.5. Duties and Taxes
Other statutory levies like electricity duty or any other taxes, duties etc., imposed by the State
Government / Central Government or any other competent authority, shall be extra and shall
not be part of the tariff as determined under this order.
Petition for True up for FY 2016-17, APR for 2017-18 and ARR for FY 2018-19
South Bihar Power Distribution Company Limited 166
9.3.6. Defective / Damaged / Burnt Meters Supply
In case of meter being defective / damaged / burnt the licensee or the consumer as the case
may be, shall replace it within the specified period prescribed in “Standards of Performance for
Distribution Licensee”, Regulations issued by the Commission.
Till defective / damaged / burnt meter is replaced, the consumption will be assessed
and billed on an average consumption of last 12 months from the date of meter being
out of order. Such consumption shall be treated as actual consumption for all practical
purposes including calculation of electricity duty until the meter is replaced/ rectified.
In cases of newly installed meter of a consumer becoming defective/ damaged/ burnt
after installation of the meter prior to completion of 12 months since its installation, the
billing for the period for such defective/ damaged/ burnt meter, till it is not replaced, shall
be done on the basis of average monthly consumption of the consumer or the MMC
whichever is higher.
In case of the meter of a consumer becoming defective in the first month of installation
itself, without taking any reading the consumer shall be provisionally billed on the basis
of amount of security collected for one month. However, the provisional bill will be done
for one month only and that will be finalized and adjusted on the basis of consumption
of the second month.
9.3.7. Shunt Capacitor Installation
Every LT consumer including irrigation pump set consumers whose connected load
includes induction motor (s) of capacity 3 HP and above and other low power factor
consuming appliances shall arrange to install low tension shunt capacitors of
appropriate capacity of standard make which meet the Bureau of Indian Standard
Specification at his cost across terminals of his motor (s). The consumer shall ensure
that the capacitors installed by him are properly matched with the actual rating of the
motor so as to ensure power factor of 90%.
All LT consumers having welding transformers will be required to install suitable shunt
capacitor(s) of adequate capacity so as to ensure power factor of not less than 90%.
No new supply to LT installations having low power factor consuming equipment such
as induction motor of 3 HP and above or welding transformers etc., will be released
unless shunt capacitors are installed to the satisfaction of the licensee.
The ratings of shunt capacitor to be installed on the motors of different ratings are
provided in the “Electric Supply Code” notified by the Commission.
Any LT consumer except Domestic category of consumer in whose case, the meter
installed has power factor recording feature and who fails to maintain power factor of
Petition for True up for FY 2016-17, APR for 2017-18 and ARR for FY 2018-19
South Bihar Power Distribution Company Limited 167
90% in any month shall pay a surcharge of 1% for every fall of 1% below 90% subject
to a maximum of 5% in addition to its normal tariff total current bill amount except DPS.
9.3.8. Charges to Tatkal Connections (Optional)
If any consumer (other than High Tension and Railway) opts for availing connection under
Tatkal scheme, the licensee shall release the Tatkal connection to such consumer with the
following conditions:
The Tatkal connections shall be released by licensee in half the time limit prescribed in
the Supply code for that consumer category.
Two (2) times of the following charges approved under head miscellaneous and general
charges will be taken from the consumers willing to avail Tatkal connection.
Application fees for new connection, and;
Supervision, labor and establishment charge for service connection
In case licensee fails to release connection within this time limit, licensee will refund the
additional amount claimed to the consumer in the first energy bill.
9.3.9. Contract Demand for billing under Domestic Tariff
For computation of the connected load of a domestic consumer either load of coolers/
fans or room heaters whichever is higher shall be considered. For the premises having
Air conditioner (without heater) and that of geysers, the computation of connected load
shall be as per the provision of Bihar Electricity Supply Code, 2007.
The contract demand of those consumers for the monthly billing purpose in the premises
who have opted for demand based tariff, the recorded demand or the contract demand,
whichever is higher, shall be considered.
Subject to the minimum load of 1 kW, the fraction of the load below 500 W shall be
rounded to its nearest lower level of whole number and 500 W and above shall be
rounded to its nearest higher level of whole number, as specified in the Bihar Electricity
Supply Code, 2007.
In case of demand based tariff, verification of connected load is not required.
9.3.10. Existing provision of demand based tariff being optional for three phase LT consumer should
be made compulsory.
Tri-vector meters are installed in all the three phase consumers, Petitioner proposes to cover
all three phase consumers under demand based tariff.
All the other terms and conditions for the LT supply as has been decided by the Hon’ble
Commission in its tariff order dated 16.03.2015 shall remain applicable for the FY 2016-17 also.
Petition for True up for FY 2016-17, APR for 2017-18 and ARR for FY 2018-19
South Bihar Power Distribution Company Limited 168
9.4. Terms and Conditions of High Tension Tariff
The foregoing tariffs are subject to the following conditions:
9.4.1. Rebate for prompt payment
The due date for making payment of energy bills or other charges shall be 15 days from the
date of issue of the bill. To motivate the consumers to make timely payment of the bills it is
proposed to provide a rebate of 1.5% on the billed amount for timely payment of the bills for all
the consumers served in HT category.
In case a consumer makes full payment after due date but within 10 days after the due date,
no DPS shall be levied for this period but rebate for prompt payment will not be admissible.
9.4.2. Rebate for online payment
To motivate the consumers to make online payment of the bills through online web portal of the
Petitioner it is proposed to provide a rebate of 1% of the billed amount in addition to rebate @
1.5%. Payment made through all electronic modes of payment made directly in the Discom
account will be considered as online payment. However, online payment rebate shall be
applicable if the consumer makes the payment within due date in full.
9.4.3. Accounting of Partial Payment
All payment made by consumers in full or part shall be adjusted in the following order of priority:
a. Statutory taxes and duties on current consumption
b. Arrear of Statutory taxes and duties
c. Delayed payment surcharge
d. Balance of arrears
e. Balance of current bill
9.4.4. Delayed Payment Surcharge (DPS)
In case of consumer does not pay energy bills in full within 10 days grace period after due date
specified in the bill, a delayed payment surcharge of one and half (1.5) % per month or part
thereof on the outstanding principal amount of bill will be levied form the original due date for
payment until the payment is made in full without prejudice to right of the licensee to disconnect
the supply in accordance with Section 56 of the Electricity Act, 2003. The licensee shall clearly
indicate in the bill itself the total amount, including DPS, payable for different dates after the
due date after allowing for the grace period of 10 days. No DPS shall be charged on DPS arrear.
9.4.5. Duties and Taxes
Other statutory levies like electricity duty or any other taxes, duties etc., imposed by the State
Government / Central Government or any other competent authority, shall be extra and shall
not be part of the tariff as determined under this order.
Petition for True up for FY 2016-17, APR for 2017-18 and ARR for FY 2018-19
South Bihar Power Distribution Company Limited 169
9.4.6. Defective / Damaged / Burnt Meters Supply
In case of meter being defective / damaged / burnt the licensee or the consumer as the case
may be, shall replace it within the specified period prescribed in “Standards of Performance for
Distribution Licensee”, Regulations issued by the Commission.
Till defective / damaged / burnt meter is replaced, the consumption will be assessed
and billed on an average consumption of last 12 months from the date of meter being
out of order. Such consumption shall be treated as actual consumption for all practical
purposes including calculation of electricity duty until the meter is replaced/ rectified.
In cases of newly installed meter of a consumer becoming defective/ damaged/ burnt
after installation of the meter prior to completion of 12 months since its installation, the
billing for the period for such defective/ damaged/ burnt meter, till it is not replaced, shall
be done on the basis of average monthly consumption of the consumer or the MMC
whichever is higher.
In case of the meter of a consumer becoming defective in the first month of installation
itself, without taking any reading the consumer shall be provisionally billed on the basis
of amount of security collected for one month. However, the provisional bill will be done
for one month only and that will be finalized and adjusted on the basis of consumption
of the second month.
9.4.7. Exceeding Contract Demand
If the actual recorded demand of a consumer exceeds 110% consecutively for three months
Licensee may issue a notice and inform the consumer to get additional contract demand
sanctioned or to limit their drawal as per their contract. Otherwise Licensee will take action as
per provisions of the Act/Rules/Regulations.
In case the consumer do not respond to the notice within 30 days of issue of notice, to get
additional demand sanctioned or limit their drawal as per the contract, the Distribution Licensee
may revise and enhance the contracted demand of the consumer to the extent of highest
demand in the past three months of the violation.
9.4.8. Contract Demand for Induction Furnaces
The prevailing practice will continue for determining the contract demand of induction furnaces
in the existing services connections. However, for new connections and where the furnaces are
replaced in existing connections, contract demand shall be based on the total capacity of the
furnace and equipment as per manufacturer technical specifications and in case of difference
of opinion, the provisions of clause No.6.39 and 6.40 of Bihar Electricity Supply Code shall
apply.
Petition for True up for FY 2016-17, APR for 2017-18 and ARR for FY 2018-19
South Bihar Power Distribution Company Limited 170
9.4.9. Shift to kVAH based Tariff
Understanding that the kVAH based tariff has an inbuilt mechanism for incentivizing the
consumers who maintain better power factor, the Petitioner proposes the Commission to
introduce kVAH based tariff in the state for HT consumers. This is bound to encourage HT
consumers to save on their electricity bills.
All the other terms and conditions for the HT supply as has been decided by the Hon’ble
Commission in its tariff order dated 16.03.2015 shall remain applicable for the FY 2016-17 also.
9.4.10. Temporary Supply (LT and HT)
Applicability: This tariff is for connection of temporary in nature for period of less than one year.
The applicability shall be as given in the respective category tariff rate schedule. Temporary
supply cannot be claimed by a prospective consumer as a matter of right but will normally be
arranged by the Licensee when a requisition is made giving due notice subject to technical
feasibility and in accordance with electricity supply code issued by the Commission.
Tariff: Fixed charge and energy charge shall be chargeable at one and half times the normal
tariff as applicable to the corresponding appropriate tariff category.
9.4.11. Terms of Supply
Temporary supply under any category of service may be given for a period not exceeding 30
days in the first instance, the duration of which, however may be extended on month-to- month
basis subject to maximum of one year.
In addition to the charges mentioned above, the consumer shall have to deposit the following
charges before commencement of the temporary supply:
o Estimated cost of erection of temporary service line and dismantling.
o Cost of irretrievable materials which cannot be taken back to service.
o Meter rent for the full period of temporary connection as per appropriate Tariff
Schedule and miscellaneous charges.
o Rental on the cost of materials as per estimate framed but not payable by the
consumer shall be payable at the rate of Rs. 15/- per month on every Rs. 100/-
or part thereof.
o Ten per cent on the total cost of the estimate for the temporary service
connection to cover as security for loss of materials and contingencies. In case
such loss is not noticed, the amount will be refunded.
The applicants for temporary supply shall be required to make a deposit in advance of the cost
as detailed above including the energy consumption charges estimated for full period on the
basis of connected load. This will however, be adjusted against the final bill that will be rendered
on disconnection of supply month to month basis.
Petition for True up for FY 2016-17, APR for 2017-18 and ARR for FY 2018-19
South Bihar Power Distribution Company Limited 171
If the consumer intends to extend the temporary supply beyond the period originally applied for,
he will have to deposit in advance all charges as detailed above including the estimated
electricity consumption charges, for the period to be extended and final bill for the previous
period, as well.
The temporary supply shall continue as such and be governed by the terms and conditions
specified above until the supply is terminated or converted into permanent supply at the written
request of the consumer. The supply will be governed by the terms and conditions of permanent
supply only after the consumer has duly completed all the formalities like execution of
agreement, deposit of security money, cost of service connection and full settlement of the
account in respect of the temporary supply etc.
9.4.12. Security deposit
The initial security deposit shall be calculated on the basis at a load factor of 30% and power
factor of 90% on contract demand payable at prevailing unit rate for HTS-I category.
For HTS-II category it shall be calculated on the basis at a load factor of 35% and power factor
of 90% on contract demand payable at prevailing unit rate.
For HTS-III and HTS-IV category it shall be calculated on the basis at a load factor of 50% and
power factor of 90% on contract demand payable at prevailing unit rate.
For HTSS consumer the formula for calculation of initial security deposit as below:
(Contract demand * 289 * energy charge per unit)*2 + (Contract demand * Demand Charge per kVA)*2
9.4.13. Seasonal Supply (LT and HT)
The Petitioner proposes to provide seasonal supply to any consumer on written request to the
Licensee subject to the following conditions.
Table 147: Proposed tariff rate for seasonal supply
Period of Supply Tariff Rate
Upto 3 consecutive months in a year Appropriate tariff plus 30 percent
More than 3 consecutive months and upto 6 consecutive
months in a year
Appropriate tariff plus 20 percent
More than 6 consecutive months and upto 9 consecutive
months in a year
Appropriate tariff plus 15 percent
More than 9 consecutive months but less than one year Appropriate tariff plus 5 percent.
The meter rent and other charges as provided in the appropriate tariff are applicable to seasonal
loads and would be charged extra for the entire period of supply.
Petition for True up for FY 2016-17, APR for 2017-18 and ARR for FY 2018-19
South Bihar Power Distribution Company Limited 172
The supply would be disconnected after the end of the period unless the consumer wants the
supply to be continued. Any reconnection charges have to be borne by the consumer.
Consumer proposing to avail seasonal supply shall sign an agreement with the Licensee to
avail power supply for a minimum period of 3 years in the case of HT, and 2 years in the case
of LT category of supply.
The consumers must avail supply in terms of whole calendar month continuously.
The consumer is required to apply for seasonal supply and pay initial cost and security deposit
as an applicant for normal electricity supply.
The consumer shall ensure payment of monthly energy bills within 7 days of its receipt. The
supply will be disconnected if payment is not made on due date.
Incremental charges will not be applicable for fixed charge component of the electricity bill in
case of seasonal supply.
9.4.14. Additional terms and conditions of HT tariff
The billing demand shall be the maximum demand recorded during the month or 85% of the
contract demand whichever is higher for HTS –I, HTS-II, HTS-III, RTS and HTS-IV. The billing
demand shall be the maximum demand recorded during the month or the contract demand
whichever is higher for HTSS category. In HTSS tariff if the power is availed at 11 KV a
surcharge of 5% will be charged extra on demand and energy charges.
If in any month the recorded maximum demand of the consumer exceeds 110% of contract
demand that portion of the demand in excess of the contract demand will be billed at twice the
normal charges for HTS –I, HTS-II, HTS-III, RTS and HTS-IV. Time of Day (TOD) tariff will
remain same as per tariff order for FY2017-18. In case, the consumer exceeds 110% of the
contract demand, the demand in excess of contract demand shall be billed at twice the normal
tariff applicable for day time i.e. 5:00 a.m. to 5:00 p.m. irrespective of the time of use.
Applicability of different HT categories, its capping of contract demand and character of
service will remain same as per tariff order for FY2017-18.
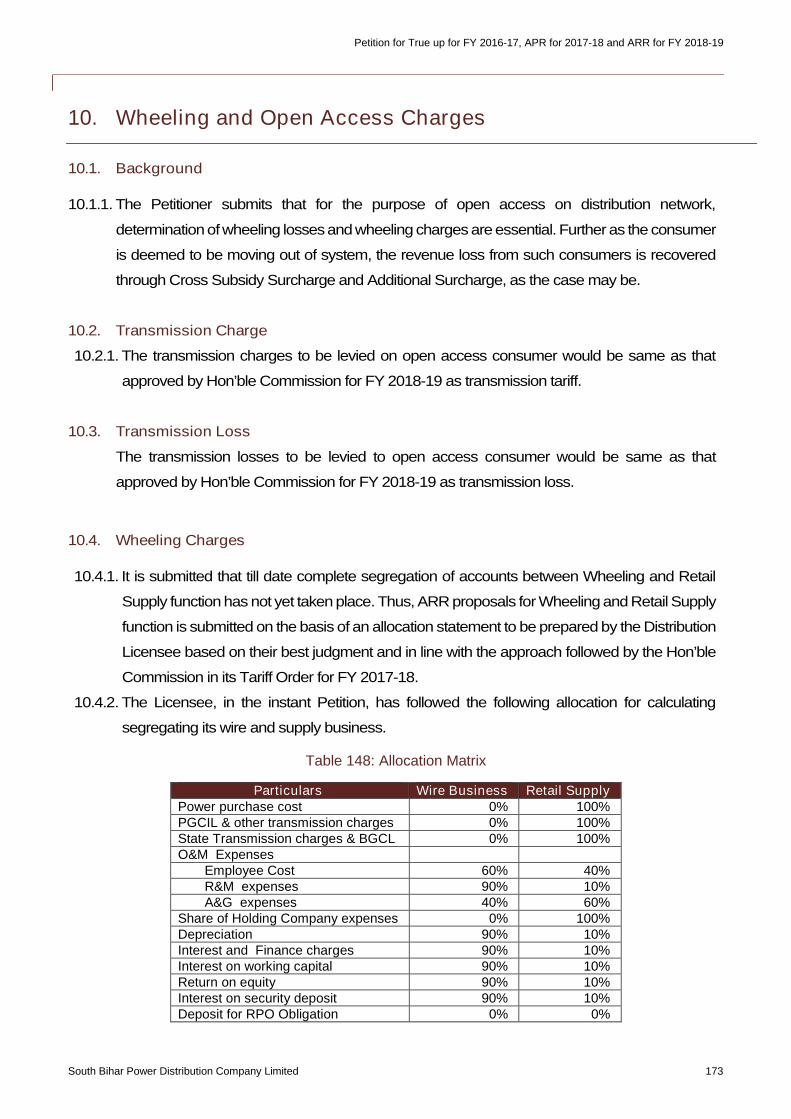
Petition for True up for FY 2016-17, APR for 2017-18 and ARR for FY 2018-19
South Bihar Power Distribution Company Limited 173
10. Wheeling and Open Access Charges
10.1. Background
10.1.1. The Petitioner submits that for the purpose of open access on distribution network,
determination ofwheeling lossesand wheeling charges are essential. Further as the consumer
is deemed to be moving out of system, the revenue loss from such consumers is recovered
through Cross Subsidy Surcharge and Additional Surcharge, as the case may be.
10.2. Transmission Charge
10.2.1. The transmission charges to be levied on open access consumer would be same as that
approved by Hon’ble Commission for FY 2018-19 as transmission tariff.
10.3. Transmission Loss
The transmission losses to be levied to open access consumer would be same as that
approved by Hon’ble Commission for FY 2018-19 as transmission loss.
10.4. Wheeling Charges
10.4.1. It is submitted that till date complete segregation of accounts between Wheeling and Retail
Supply function has not yet taken place. Thus, ARR proposals for Wheeling and Retail Supply
function is submitted on the basis of an allocation statement to be prepared by the Distribution
Licensee based on their best judgment and in line with the approach followed by the Hon’ble
Commission in its Tariff Order for FY 2017-18.
10.4.2. The Licensee, in the instant Petition, has followed the following allocation for calculating
segregating its wire and supply business.
Table 148: Allocation Matrix
Particulars Wire Business Retail SupplyPower purchase cost 0% 100%PGCIL & other transmission charges 0% 100%State Transmission charges & BGCL 0% 100%O&M Expenses
Employee Cost 60% 40%R&M expenses 90% 10%A&G expenses 40% 60%
Share of Holding Company expenses 0% 100%Depreciation 90% 10%Interest and Finance charges 90% 10%Interest on working capital 90% 10%Return on equity 90% 10%Interest on security deposit 90% 10%Deposit for RPO Obligation 0% 0%
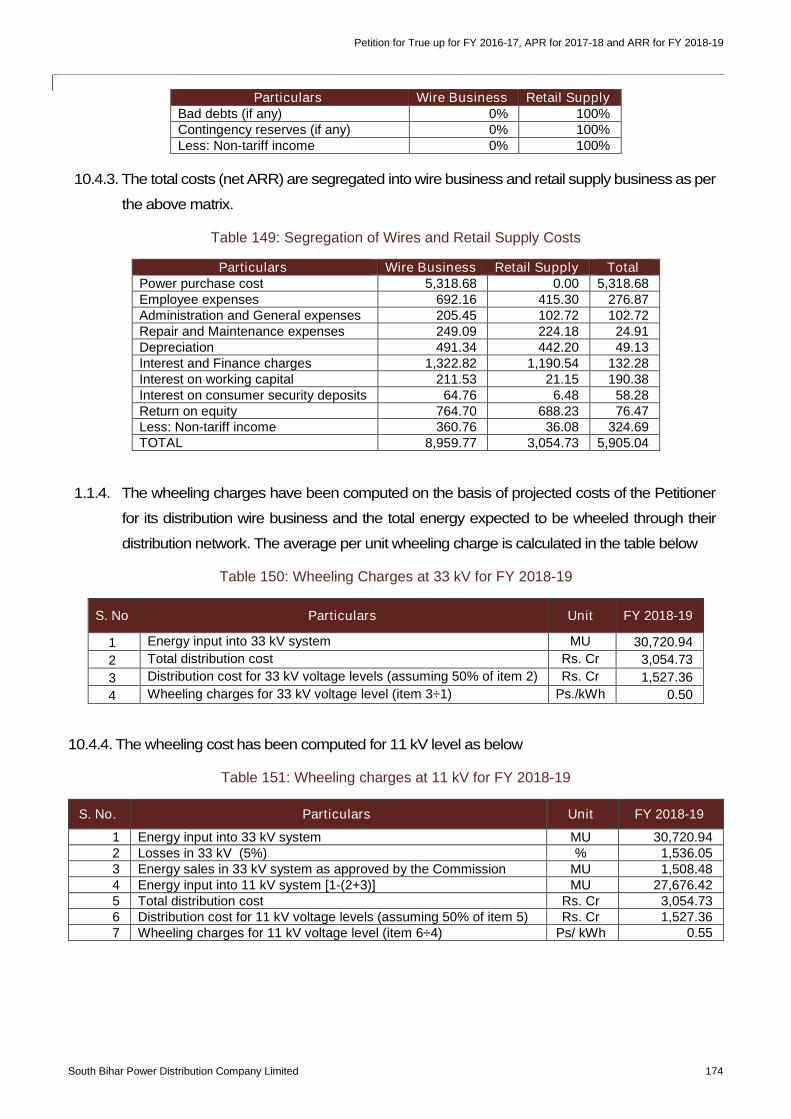
Petition for True up for FY 2016-17, APR for 2017-18 and ARR for FY 2018-19
South Bihar Power Distribution Company Limited 174
Particulars Wire Business Retail SupplyBad debts (if any) 0% 100%Contingency reserves (if any) 0% 100%Less: Non-tariff income 0% 100%
10.4.3. The total costs (net ARR) are segregated into wire business and retail supply business as per
the above matrix.
Table 149: Segregation of Wires and Retail Supply Costs
Particulars Wire Business Retail Supply TotalPower purchase cost 5,318.68 0.00 5,318.68Employee expenses 692.16 415.30 276.87Administration and General expenses 205.45 102.72 102.72Repair and Maintenance expenses 249.09 224.18 24.91Depreciation 491.34 442.20 49.13Interest and Finance charges 1,322.82 1,190.54 132.28Interest on working capital 211.53 21.15 190.38Interest on consumer security deposits 64.76 6.48 58.28Return on equity 764.70 688.23 76.47Less: Non-tariff income 360.76 36.08 324.69TOTAL 8,959.77 3,054.73 5,905.04
1.1.4. The wheeling charges have been computed on the basis of projected costs of the Petitioner
for its distribution wire business and the total energy expected to be wheeled through their
distribution network. The average per unit wheeling charge is calculated in the table below
Table 150: Wheeling Charges at 33 kV for FY 2018-19
S. No Particulars Unit FY 2018-19
1 Energy input into 33 kV system MU 30,720.94
2 Total distribution cost Rs. Cr 3,054.73
3 Distribution cost for 33 kV voltage levels (assuming 50% of item 2) Rs. Cr 1,527.36
4 Wheeling charges for 33 kV voltage level (item 3÷1) Ps./kWh 0.50
10.4.4. The wheeling cost has been computed for 11 kV level as below
Table 151: Wheeling charges at 11 kV for FY 2018-19
S. No. Particulars Unit FY 2018-19
1 Energy input into 33 kV system MU 30,720.942 Losses in 33 kV (5%) % 1,536.053 Energy sales in 33 kV system as approved by the Commission MU 1,508.484 Energy input into 11 kV system [1-(2+3)] MU 27,676.425 Total distribution cost Rs. Cr 3,054.736 Distribution cost for 11 kV voltage levels (assuming 50% of item 5) Rs. Cr 1,527.367 Wheeling charges for 11 kV voltage level (item 6÷4) Ps/ kWh 0.55
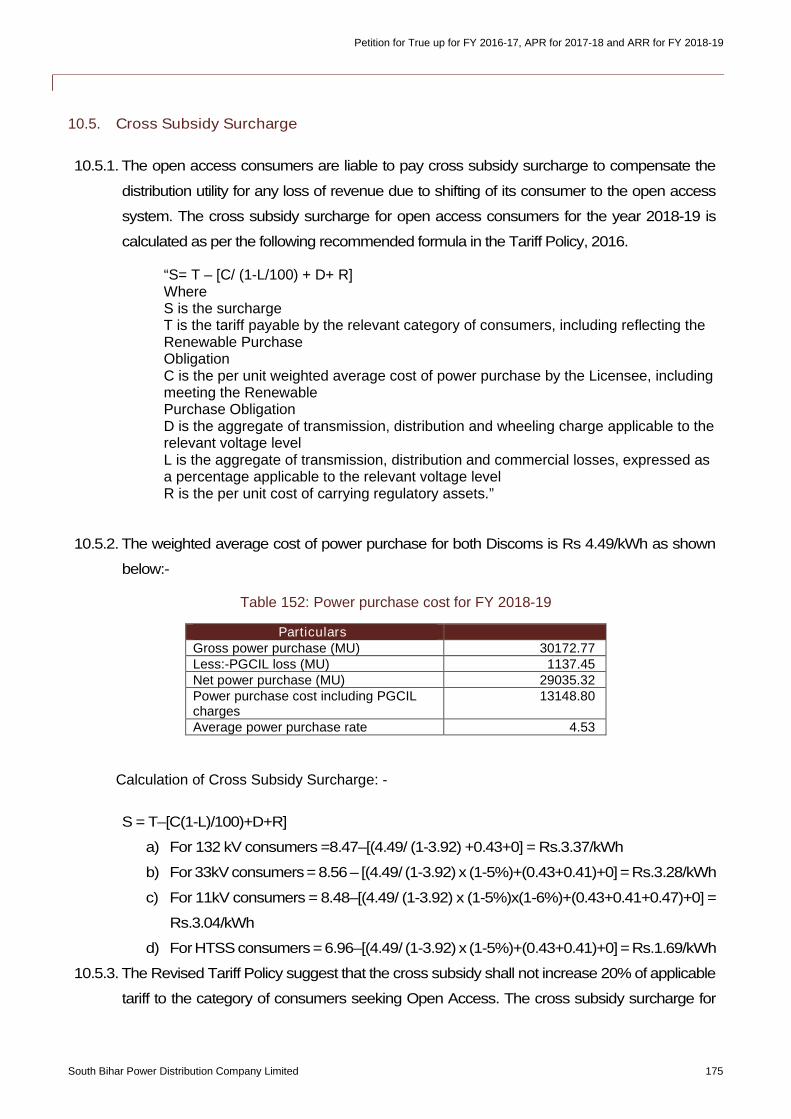
Petition for True up for FY 2016-17, APR for 2017-18 and ARR for FY 2018-19
South Bihar Power Distribution Company Limited 175
10.5. Cross Subsidy Surcharge
10.5.1. The open access consumers are liable to pay cross subsidy surcharge to compensate the
distribution utility for any loss of revenue due to shifting of its consumer to the open access
system. The cross subsidy surcharge for open access consumers for the year 2018-19 is
calculated as per the following recommended formula in the Tariff Policy, 2016.
“S= T – [C/ (1-L/100) + D+ R]WhereS is the surchargeT is the tariff payable by the relevant category of consumers, including reflecting theRenewable PurchaseObligationC is the per unit weighted average cost of power purchase by the Licensee, includingmeeting the RenewablePurchase ObligationD is the aggregate of transmission, distribution and wheeling charge applicable to therelevant voltage levelL is the aggregate of transmission, distribution and commercial losses, expressed asa percentage applicable to the relevant voltage levelR is the per unit cost of carrying regulatory assets.”
10.5.2. The weighted average cost of power purchase for both Discoms is Rs 4.49/kWh as shown
below:-
Table 152: Power purchase cost for FY 2018-19
ParticularsGross power purchase (MU) 30172.77Less:-PGCIL loss (MU) 1137.45Net power purchase (MU) 29035.32Power purchase cost including PGCILcharges
13148.80
Average power purchase rate 4.53
Calculation of Cross Subsidy Surcharge: -
S = T–[C(1-L)/100)+D+R]
a) For 132 kV consumers =8.47–[(4.49/ (1-3.92) +0.43+0] = Rs.3.37/kWh
b) For33kV consumers= 8.56 – [(4.49/ (1-3.92) x (1-5%)+(0.43+0.41)+0] = Rs.3.28/kWh
c) For 11kV consumers = 8.48–[(4.49/ (1-3.92) x (1-5%)x(1-6%)+(0.43+0.41+0.47)+0] =
Rs.3.04/kWh
d) ForHTSS consumers = 6.96–[(4.49/ (1-3.92) x (1-5%)+(0.43+0.41)+0] = Rs.1.69/kWh
10.5.3. The Revised Tariff Policy suggest that the cross subsidy shall not increase 20% of applicable
tariff to the category of consumers seeking Open Access. The cross subsidy surcharge for
Petition for True up for FY 2016-17, APR for 2017-18 and ARR for FY 2018-19
South Bihar Power Distribution Company Limited 176
132 kV, 33 kV, 11 kV and HTSS category of the consumers are approved by the Commission
at 20% of applicable tariff of the respective category of consumers seeking Open Access.
a) The cross subsidy surcharge for FY 2018-19 are:-.
b) For 132 kV consumers :- INR 1.69/kWh
c) For 33kV consumers (other than HTSS) :- INR 1.71/kWh
d) For 11kV consumers (other than HTSS) :- INR 1.70/kWh
e) For HTSS :- INR 1.39/kWh
10.6. Reactive Energy charges
10.6.1. The open access consumers should pay a reactive energy charge to Transmission and
Distribution companies as the case may be for drawl/ injection of reactive energy. Discom
proposes the same reactive charges of 04 Paisa/ kVAR for FY 2018-19.
10.6.2. The Hon’bleCommission is requested to approveall theopenaccesscharges,CrossSubsidy
Charges and other charges
10.7. Standby Charges
10.7.1. As per BERC open access regulations
“20 A. Standby Power In case of outage of a power plant supplying power to an open access
customer, the licensee will, on request, provide standby supply to meet the requirement of load
catered through open access. Such standby supply will be provided by the licensee at day
ahead request from the open access customer. The open access customer will, for that supply,
be liable to pay charges under tariff for temporary connection to that category of consumer.”
10.7.2. The Hon’ble Commission is requested to approve the same in line with the regulations
10.8. Roadmap for reduction of Cross Subsidy Surcharge
10.8.1. Section 8.3 (2) of the Tariff Policy 2016 specifies that:
“For achieving the objective that the tariff progressively reflects the cost of supply of electricity,
the Appropriate Commission would notify a roadmap such that tariffs are brought within ±20%
of the average cost of supply. The road map would also have intermediate milestones, based
on the approach of a gradual reduction in cross subsidy”.
10.8.2. The Tariff Policy provides that SERCs should notify a roadmap such that tariffs are in ±20% of
ACoS. The First proviso to para 8.5.1 of Tariff Policy 2016 also specifies that Cross Subsidy
Surcharge (CSS) should be capped at 20% of the tariff applicable to the category of the
consumers. The Petitioner aims at gradual reduction of cross subsidy surcharge in line with
National Tariff policy.
Petition for True up for FY 2016-17, APR for 2017-18 and ARR for FY 2018-19
South Bihar Power Distribution Company Limited 177
10.8.3. The Petitioner is proposing the following roadmap for reduction in cross subsidy in next 3 years
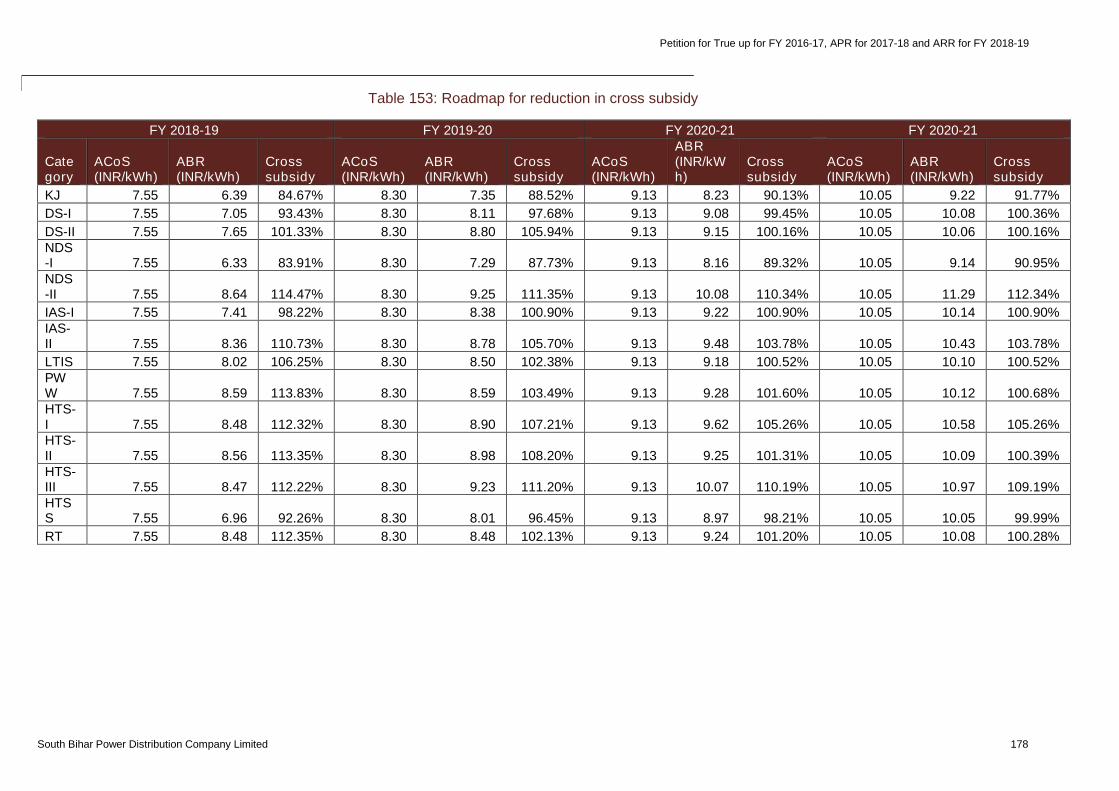
Petition for True up for FY 2016-17, APR for 2017-18 and ARR for FY 2018-19
South Bihar Power Distribution Company Limited 178
Table 153: Roadmap for reduction in cross subsidy
FY 2018-19 FY 2019-20 FY 2020-21 FY 2020-21
Category
ACoS(INR/kWh)
ABR(INR/kWh)
Crosssubsidy
ACoS(INR/kWh)
ABR(INR/kWh)
Crosssubsidy
ACoS(INR/kWh)
ABR(INR/kWh)
Crosssubsidy
ACoS(INR/kWh)
ABR(INR/kWh)
Crosssubsidy
KJ 7.55 6.39 84.67% 8.30 7.35 88.52% 9.13 8.23 90.13% 10.05 9.22 91.77%
DS-I 7.55 7.05 93.43% 8.30 8.11 97.68% 9.13 9.08 99.45% 10.05 10.08 100.36%
DS-II 7.55 7.65 101.33% 8.30 8.80 105.94% 9.13 9.15 100.16% 10.05 10.06 100.16%NDS-I 7.55 6.33 83.91% 8.30 7.29 87.73% 9.13 8.16 89.32% 10.05 9.14 90.95%NDS-II 7.55 8.64 114.47% 8.30 9.25 111.35% 9.13 10.08 110.34% 10.05 11.29 112.34%
IAS-I 7.55 7.41 98.22% 8.30 8.38 100.90% 9.13 9.22 100.90% 10.05 10.14 100.90%IAS-II 7.55 8.36 110.73% 8.30 8.78 105.70% 9.13 9.48 103.78% 10.05 10.43 103.78%
LTIS 7.55 8.02 106.25% 8.30 8.50 102.38% 9.13 9.18 100.52% 10.05 10.10 100.52%PWW 7.55 8.59 113.83% 8.30 8.59 103.49% 9.13 9.28 101.60% 10.05 10.12 100.68%HTS-I 7.55 8.48 112.32% 8.30 8.90 107.21% 9.13 9.62 105.26% 10.05 10.58 105.26%HTS-II 7.55 8.56 113.35% 8.30 8.98 108.20% 9.13 9.25 101.31% 10.05 10.09 100.39%HTS-III 7.55 8.47 112.22% 8.30 9.23 111.20% 9.13 10.07 110.19% 10.05 10.97 109.19%HTSS 7.55 6.96 92.26% 8.30 8.01 96.45% 9.13 8.97 98.21% 10.05 10.05 99.99%
RT 7.55 8.48 112.35% 8.30 8.48 102.13% 9.13 9.24 101.20% 10.05 10.08 100.28%
Petition for True up for FY 2016-17, APR for 2017-18 and ARR for FY 2018-19
South Bihar Power Distribution Company Limited 179
11. Implementation of UDAY
11.1. Background
11.1.1. The Ujwal Discom Assurance Yojana or UDAY was launched on 5 November 2015 with an aim
of providing financial and operational turnaround to debt ridden Power Distribution companies
in the country. UDAY enables the DISCOMs with the opportunity to break even in the next 2-3
years through four initiatives (i) Improving operational efficiencies of DISCOMs; (ii) Reduction
of cost of power; (iii) Reduction in interest cost of DISCOMs; (iv) Enforcing financial discipline
on DISCOMs through alignment with State finances.
11.2. Overview of the scheme
11.2.1. States shall take over 75% of DISCOM debt as on 30 September 2015 over two years - 50%
of DISCOM debt shall be taken over in 2015-16 and 25% in 2016-17.
11.2.2. States will issue non-SLR including SDL bonds in the market or directly to the respective banks/
Financial Institutions (FIs) holding the DISCOM debt to the appropriate extent
11.2.3. Non-SLR bonds issued by the State will have a maturity period of 10-15 years with a moratorium
on repayment of principal upto 5 years, as required by the State.
11.2.4. The 10 year State bonds issued will be priced at 10 year G-Sec plus 0.5% spread for 10 year
State bonds plus 0.25% spread for non-SLR status on semi-annual compounding basis, or
market determined rate, whichever is lower. This may be further reduced if interest is paid on
monthly basis.
11.2.5. States to take over future losses of DISCOMs as per trajectory in a graded manner: [0% of loss
of 14-15 & 15-16; 5% of 16-17; 10% of 17-18; 25% of 18-19 & 50% of 2019-20]
11.3. The Petitioner entered into a tripartite MoU with the Ministry of Power, Government of India and
Government of Bihar on 22 February 2016 for achieving turnaround of the Discom. The salient
features of UDAY are broadly captured below:
Cleaning up of legacy issues by clearing liabilities of 75% outstanding loan and
restructuring of 25% of outstanding loan (Total outstanding loan of SBPDCL is Rs.
1826.54 Crore as on 30.09.2015), thereby adjusting past losses of DISCOM to that
extent and continuing reduction of interest cost of DISCOM.
Defining a roadmap for achieving AT&C loss level of 15% by resorting to activities
related to Energy Accounting and Audit, Metering, Strengthening of Distribution network
and proper monitoring of Billing and Collection for increasing Billing efficiency and
Collection efficiency.
Reducing the gap between ACS and ARR to zero by way of operational turnaround and
quarterly increase in tariff.
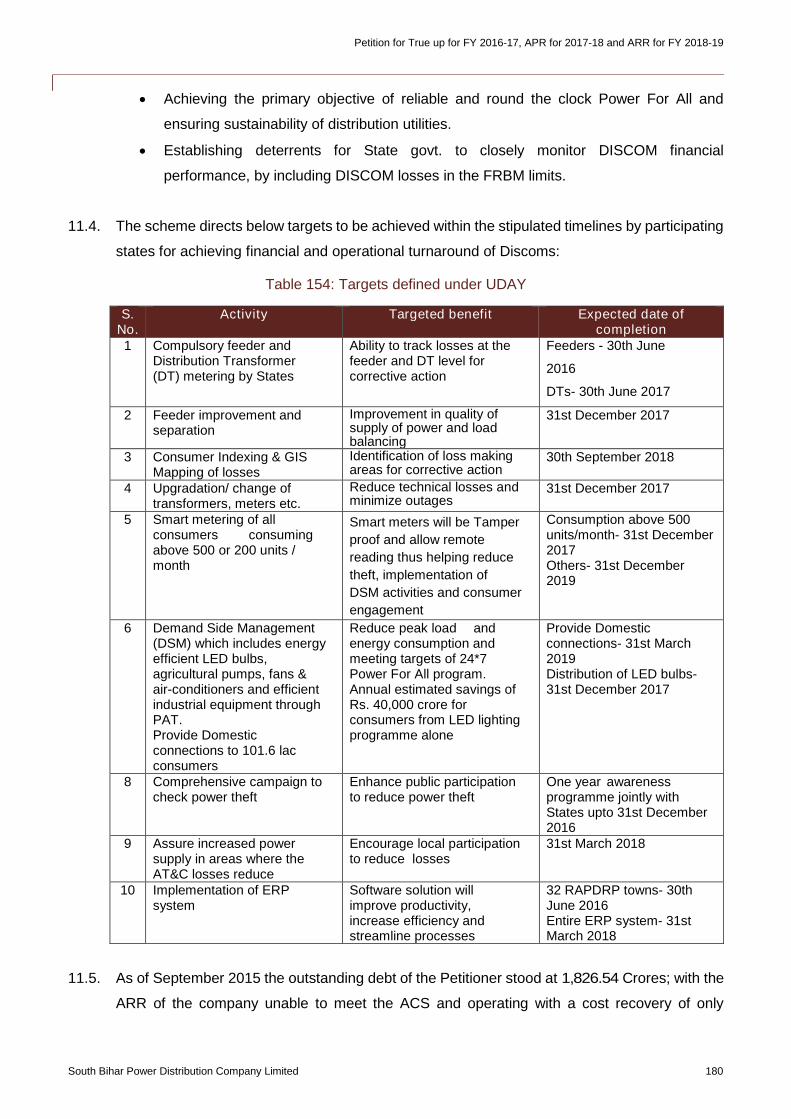
Petition for True up for FY 2016-17, APR for 2017-18 and ARR for FY 2018-19
South Bihar Power Distribution Company Limited 180
Achieving the primary objective of reliable and round the clock Power For All and
ensuring sustainability of distribution utilities.
Establishing deterrents for State govt. to closely monitor DISCOM financial
performance, by including DISCOM losses in the FRBM limits.
11.4. The scheme directs below targets to be achieved within the stipulated timelines by participating
states for achieving financial and operational turnaround of Discoms:
Table 154: Targets defined under UDAY
S.No.
Activity Targeted benefit Expected date ofcompletion
1 Compulsory feeder andDistribution Transformer(DT) metering by States
Ability to track losses at thefeeder and DT level forcorrective action
Feeders - 30th June
2016
DTs- 30th June 2017
2 Feeder improvement andseparation
Improvement in quality ofsupply of power and loadbalancing
31st December 2017
3 Consumer Indexing & GISMapping of losses
Identification of loss makingareas for corrective action
30th September 2018
4 Upgradation/ change oftransformers, meters etc.
Reduce technical losses andminimize outages
31st December 2017
5 Smart metering of allconsumers consumingabove 500 or 200 units /month
Smart meters will be Tamper
proof and allow remote
reading thus helping reduce
theft, implementation of
DSM activities and consumer
engagement
Consumption above 500units/month- 31st December2017Others- 31st December2019
6 Demand Side Management(DSM) which includes energyefficient LED bulbs,agricultural pumps, fans &air-conditioners and efficientindustrial equipment throughPAT.Provide Domesticconnections to 101.6 lacconsumers
Reduce peak load andenergy consumption andmeeting targets of 24*7Power For All program.Annual estimated savings ofRs. 40,000 crore forconsumers from LED lightingprogramme alone
Provide Domesticconnections- 31st March2019Distribution of LED bulbs-31st December 2017
8 Comprehensive campaign tocheck power theft
Enhance public participationto reduce power theft
One year awarenessprogramme jointly withStates upto 31st December2016
9 Assure increased powersupply in areas where theAT&C losses reduce
Encourage local participationto reduce losses
31st March 2018
10 Implementation of ERPsystem
Software solution willimprove productivity,increase efficiency andstreamline processes
32 RAPDRP towns- 30thJune 2016Entire ERP system- 31stMarch 2018
11.5. As of September 2015 the outstanding debt of the Petitioner stood at 1,826.54 Crores; with the
ARR of the company unable to meet the ACS and operating with a cost recovery of only
Petition for True up for FY 2016-17, APR for 2017-18 and ARR for FY 2018-19
South Bihar Power Distribution Company Limited 181
54.58%. Recognizing the need to have an action plan in place and take adequate intervention,
SBPDCL, Ministry of Power, GOI and the Government of Bihar, signed a MoU under the UDAY
scheme on 22nd February, 2016. The MoU had a commitment of eliminating the gap between
ACS and ARR, and reducing the AT&C loss from 45.83% in FY 2014-15 to 15% by FY 2019-
20.
11.6. In order to achieve reduction in AT&C loss and ACS-ARR gap the following efforts have been
undertaken by the Petitioner to comply with the UDAY targets within the stipulated timeline:
33kV and 11kV Feeder Metering: At 33kV level, the Petitioner has a total of 474
feeders of which 427 or 90% are metered. At 11 kV level there are a total of 1,328
feeders of which 1,253 or 94% are metered. The Petitioner is working towards 100%
33kV and 11 kV feeder metering by Dec 2017.
DTR Metering: In order to achieve the target of energy audit and appropriate accounting
to contain the T&D losses, the Petitioner has prepared a comprehensive distribution
transformer metering plan. The Petitioner understands the importance of effective
metering and billing, and illustrates the potential increase in metered consumption that
utility may achieve through DT metering. As of June 2016 the Petitioner has 51,102 nos.
of DTs, out of which 24,208 are metered.
Feeder Improvement and Segregation Program: The Petitioner understands the
importance of renovating the feeders in form of continuous operation & maintenance of
feeders, metering the feeders, using appropriate conductor at different voltage levels,
optimizing the feeder length, underground cabling (wherever possible) revamping the
feeders by maintain a ring system for emergency and creating necessary redundancies
in the distribution network.
In this regard, feeder data is being collected from various circles and analysis on same
is targeted to be completed at the earliest. Apart from this, the Feeder Managers have
been appointed for each feeder who will identify the requirements and steer the
revamping work on their designated feeder(s). The focus of such program shall be on
improving the quality of supply by reviewing the transformer capacity and load will be
shifted after monitoring the ring system. Under ring system, one ring network of
distributors is fed by more than one feeder. Thus, ensuring unaffected power supply to
consumers even when any feeder becomes out of order
Consumer Metering: The Petitioner has already achieved metering of over 92% of its
existing base of 3.27 Million consumers. All Industrial (LT & HT), Traction consumers
are 100% metered in the State. Out of un-metered consumers, majority are rural/ BPL
domestic consumers covered under the initial phase of the RGGVY program. The
Petitioner has proposed to cover metering for all un-metered consumers as well as
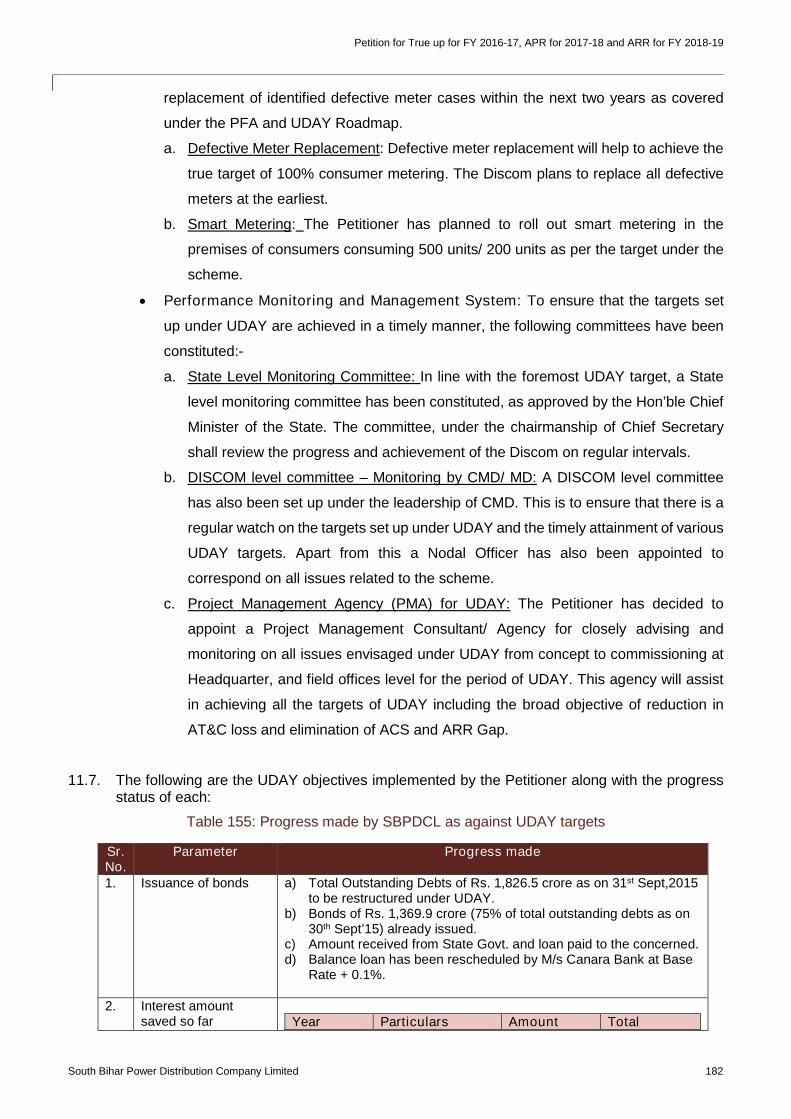
Petition for True up for FY 2016-17, APR for 2017-18 and ARR for FY 2018-19
South Bihar Power Distribution Company Limited 182
replacement of identified defective meter cases within the next two years as covered
under the PFA and UDAY Roadmap.
a. Defective Meter Replacement: Defective meter replacement will help to achieve the
true target of 100% consumer metering. The Discom plans to replace all defective
meters at the earliest.
b. Smart Metering: The Petitioner has planned to roll out smart metering in the
premises of consumers consuming 500 units/ 200 units as per the target under the
scheme.
Performance Monitoring and Management System: To ensure that the targets set
up under UDAY are achieved in a timely manner, the following committees have been
constituted:-
a. State Level Monitoring Committee: In line with the foremost UDAY target, a State
level monitoring committee has been constituted, as approved by the Hon’ble Chief
Minister of the State. The committee, under the chairmanship of Chief Secretary
shall review the progress and achievement of the Discom on regular intervals.
b. DISCOM level committee – Monitoring by CMD/ MD: A DISCOM level committee
has also been set up under the leadership of CMD. This is to ensure that there is a
regular watch on the targets set up under UDAY and the timely attainment of various
UDAY targets. Apart from this a Nodal Officer has also been appointed to
correspond on all issues related to the scheme.
c. Project Management Agency (PMA) for UDAY: The Petitioner has decided to
appoint a Project Management Consultant/ Agency for closely advising and
monitoring on all issues envisaged under UDAY from concept to commissioning at
Headquarter, and field offices level for the period of UDAY. This agency will assist
in achieving all the targets of UDAY including the broad objective of reduction in
AT&C loss and elimination of ACS and ARR Gap.
11.7. The following are the UDAY objectives implemented by the Petitioner along with the progressstatus of each:
Table 155: Progress made by SBPDCL as against UDAY targets
Sr.No.
Parameter Progress made
1. Issuance of bonds a) Total Outstanding Debts of Rs. 1,826.5 crore as on 31st Sept,2015to be restructured under UDAY.
b) Bonds of Rs. 1,369.9 crore (75% of total outstanding debts as on30th Sept’15) already issued.
c) Amount received from State Govt. and loan paid to the concerned.d) Balance loan has been rescheduled by M/s Canara Bank at Base
Rate + 0.1%.
2. Interest amountsaved so far Year Particulars Amount Total
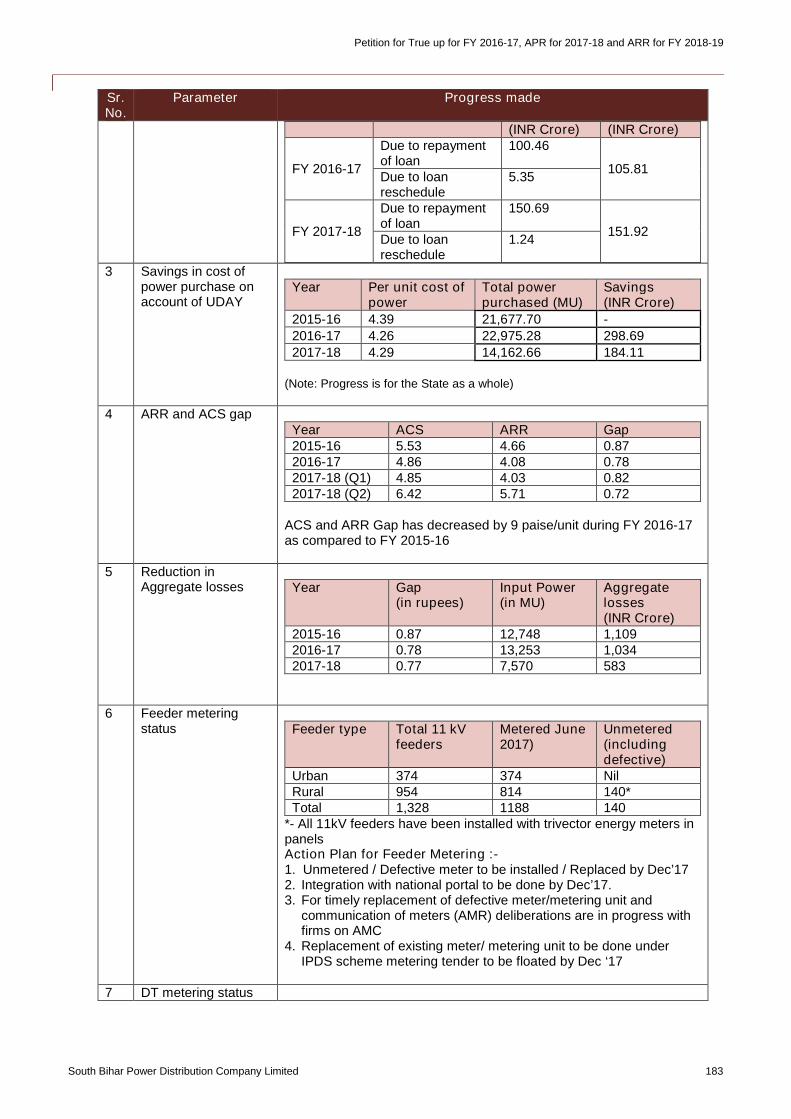
Petition for True up for FY 2016-17, APR for 2017-18 and ARR for FY 2018-19
South Bihar Power Distribution Company Limited 183
Sr.No.
Parameter Progress made
(INR Crore) (INR Crore)
FY 2016-17
Due to repaymentof loan
100.46
105.81Due to loanreschedule
5.35
FY 2017-18
Due to repaymentof loan
150.69
151.92Due to loanreschedule
1.24
3 Savings in cost ofpower purchase onaccount of UDAY
Year Per unit cost ofpower
Total powerpurchased (MU)
Savings(INR Crore)
2015-16 4.39 21,677.70 -
2016-17 4.26 22,975.28 298.69
2017-18 4.29 14,162.66 184.11
(Note: Progress is for the State as a whole)
4 ARR and ACS gapYear ACS ARR Gap2015-16 5.53 4.66 0.872016-17 4.86 4.08 0.782017-18 (Q1) 4.85 4.03 0.822017-18 (Q2) 6.42 5.71 0.72
ACS and ARR Gap has decreased by 9 paise/unit during FY 2016-17as compared to FY 2015-16
5 Reduction inAggregate losses Year Gap
(in rupees)Input Power(in MU)
Aggregatelosses(INR Crore)
2015-16 0.87 12,748 1,1092016-17 0.78 13,253 1,0342017-18 0.77 7,570 583
6 Feeder meteringstatus Feeder type Total 11 kV
feedersMetered June2017)
Unmetered(includingdefective)
Urban 374 374 NilRural 954 814 140*Total 1,328 1188 140
*- All 11kV feeders have been installed with trivector energy meters inpanelsAction Plan for Feeder Metering :-1. Unmetered / Defective meter to be installed / Replaced by Dec’172. Integration with national portal to be done by Dec’17.3. For timely replacement of defective meter/metering unit and
communication of meters (AMR) deliberations are in progress withfirms on AMC
4. Replacement of existing meter/ metering unit to be done underIPDS scheme metering tender to be floated by Dec ‘17
7 DT metering status
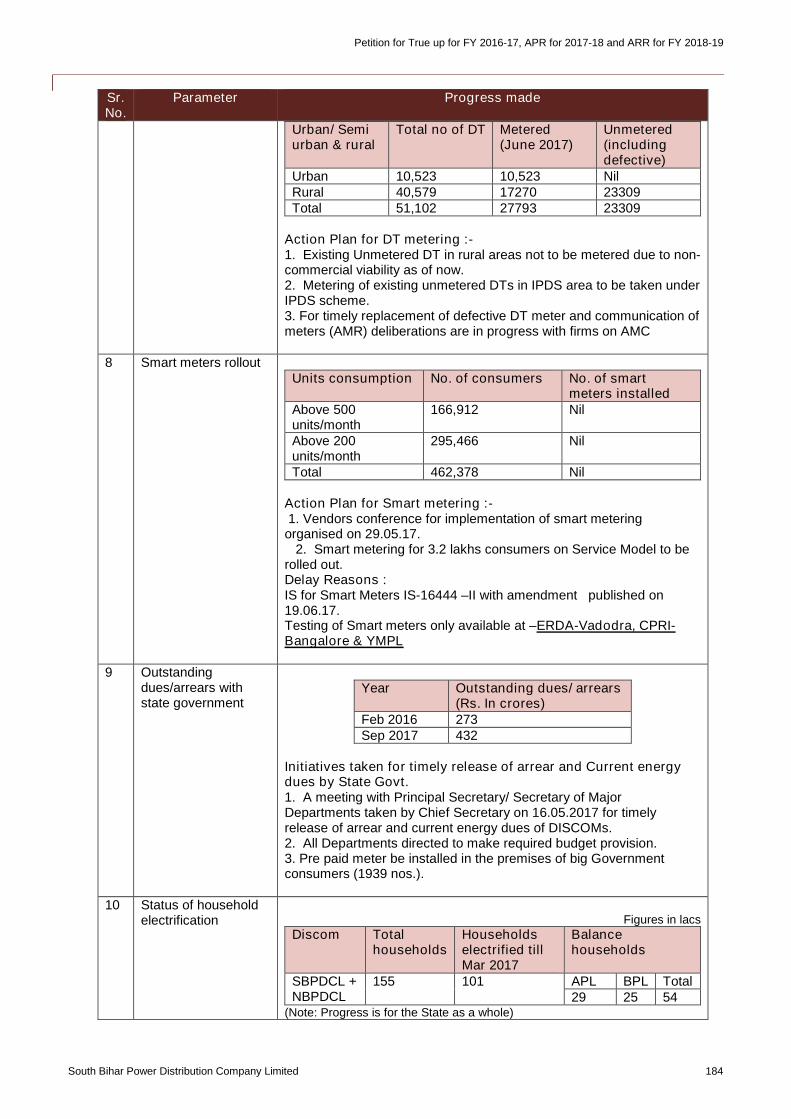
Petition for True up for FY 2016-17, APR for 2017-18 and ARR for FY 2018-19
South Bihar Power Distribution Company Limited 184
Sr.No.
Parameter Progress made
Urban/ Semiurban & rural
Total no of DT Metered(June 2017)
Unmetered(includingdefective)
Urban 10,523 10,523 NilRural 40,579 17270 23309Total 51,102 27793 23309
Action Plan for DT metering :-1. Existing Unmetered DT in rural areas not to be metered due to non-commercial viability as of now.2. Metering of existing unmetered DTs in IPDS area to be taken underIPDS scheme.3. For timely replacement of defective DT meter and communication ofmeters (AMR) deliberations are in progress with firms on AMC
8 Smart meters rolloutUnits consumption No. of consumers No. of smart
meters installedAbove 500units/month
166,912 Nil
Above 200units/month
295,466 Nil
Total 462,378 Nil
Action Plan for Smart metering :-1. Vendors conference for implementation of smart meteringorganised on 29.05.17.
2. Smart metering for 3.2 lakhs consumers on Service Model to berolled out.Delay Reasons :IS for Smart Meters IS-16444 –II with amendment published on19.06.17.Testing of Smart meters only available at –ERDA-Vadodra, CPRI-Bangalore & YMPL
9 Outstandingdues/arrears withstate government
Year Outstanding dues/ arrears(Rs. In crores)
Feb 2016 273Sep 2017 432
Initiatives taken for timely release of arrear and Current energydues by State Govt.1. A meeting with Principal Secretary/ Secretary of MajorDepartments taken by Chief Secretary on 16.05.2017 for timelyrelease of arrear and current energy dues of DISCOMs.2. All Departments directed to make required budget provision.3. Pre paid meter be installed in the premises of big Governmentconsumers (1939 nos.).
10 Status of householdelectrification Figures in lacs
Discom Totalhouseholds
Householdselectrified tillMar 2017
Balancehouseholds
SBPDCL +NBPDCL
155 101 APL BPL Total29 25 54
(Note: Progress is for the State as a whole)
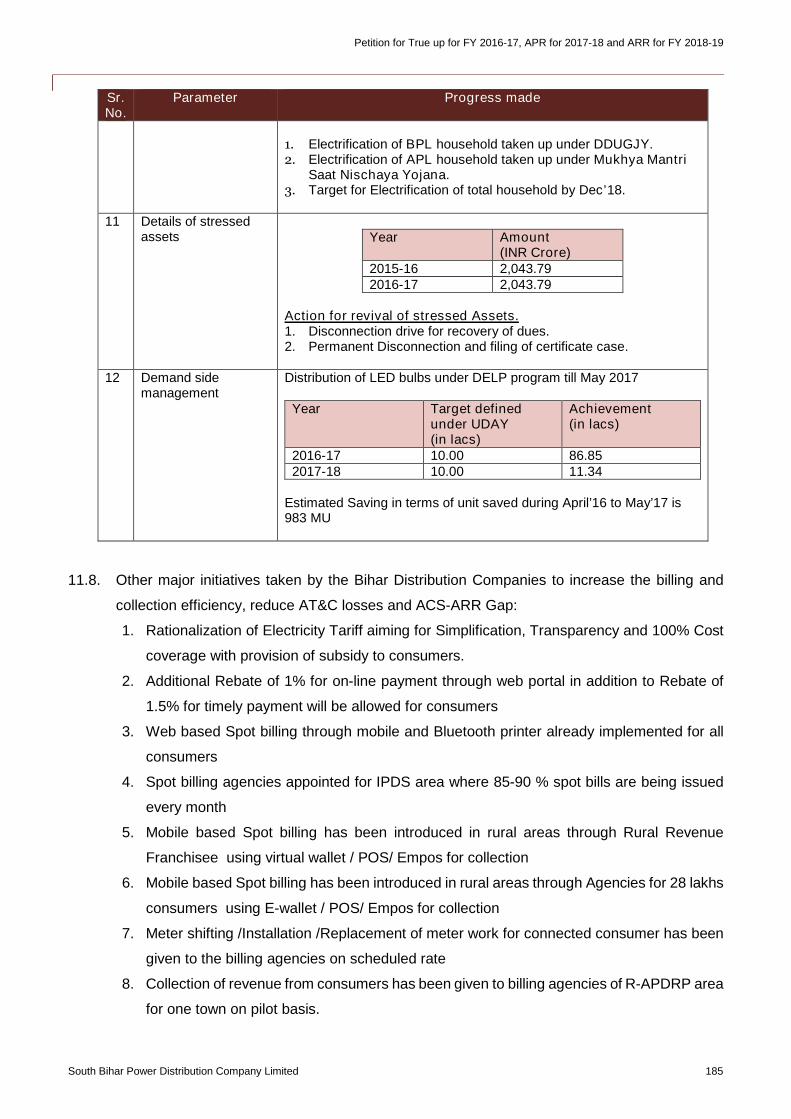
Petition for True up for FY 2016-17, APR for 2017-18 and ARR for FY 2018-19
South Bihar Power Distribution Company Limited 185
Sr.No.
Parameter Progress made
1. Electrification of BPL household taken up under DDUGJY.2. Electrification of APL household taken up under Mukhya Mantri
Saat Nischaya Yojana.3. Target for Electrification of total household by Dec’18.
11 Details of stressedassets Year Amount
(INR Crore)2015-16 2,043.792016-17 2,043.79
Action for revival of stressed Assets.1. Disconnection drive for recovery of dues.2. Permanent Disconnection and filing of certificate case.
12 Demand sidemanagement
Distribution of LED bulbs under DELP program till May 2017
Year Target definedunder UDAY(in lacs)
Achievement(in lacs)
2016-17 10.00 86.852017-18 10.00 11.34
Estimated Saving in terms of unit saved during April’16 to May’17 is983 MU
11.8. Other major initiatives taken by the Bihar Distribution Companies to increase the billing and
collection efficiency, reduce AT&C losses and ACS-ARR Gap:
1. Rationalization of Electricity Tariff aiming for Simplification, Transparency and 100% Cost
coverage with provision of subsidy to consumers.
2. Additional Rebate of 1% for on-line payment through web portal in addition to Rebate of
1.5% for timely payment will be allowed for consumers
3. Web based Spot billing through mobile and Bluetooth printer already implemented for all
consumers
4. Spot billing agencies appointed for IPDS area where 85-90 % spot bills are being issued
every month
5. Mobile based Spot billing has been introduced in rural areas through Rural Revenue
Franchisee using virtual wallet / POS/ Empos for collection
6. Mobile based Spot billing has been introduced in rural areas through Agencies for 28 lakhs
consumers using E-wallet / POS/ Empos for collection
7. Meter shifting /Installation /Replacement of meter work for connected consumer has been
given to the billing agencies on scheduled rate
8. Collection of revenue from consumers has been given to billing agencies of R-APDRP area
for one town on pilot basis.
Petition for True up for FY 2016-17, APR for 2017-18 and ARR for FY 2018-19
South Bihar Power Distribution Company Limited 186
9. Disconnection drive through deployment of dedicated gang in every section is being taken.
10. High Power Incentive scheme for 05 divisions having max. losses has been undertaken
on Pilot basis
11. Major reshuffle of engineers based on their performance done in April’17.
12. Monthly revenue collection increased from Rs. 445 crore (April’17) to Rs. 625 crore
(Sept’17).
13. Rs. 1500 crore additional revenue expected during 2017-18.
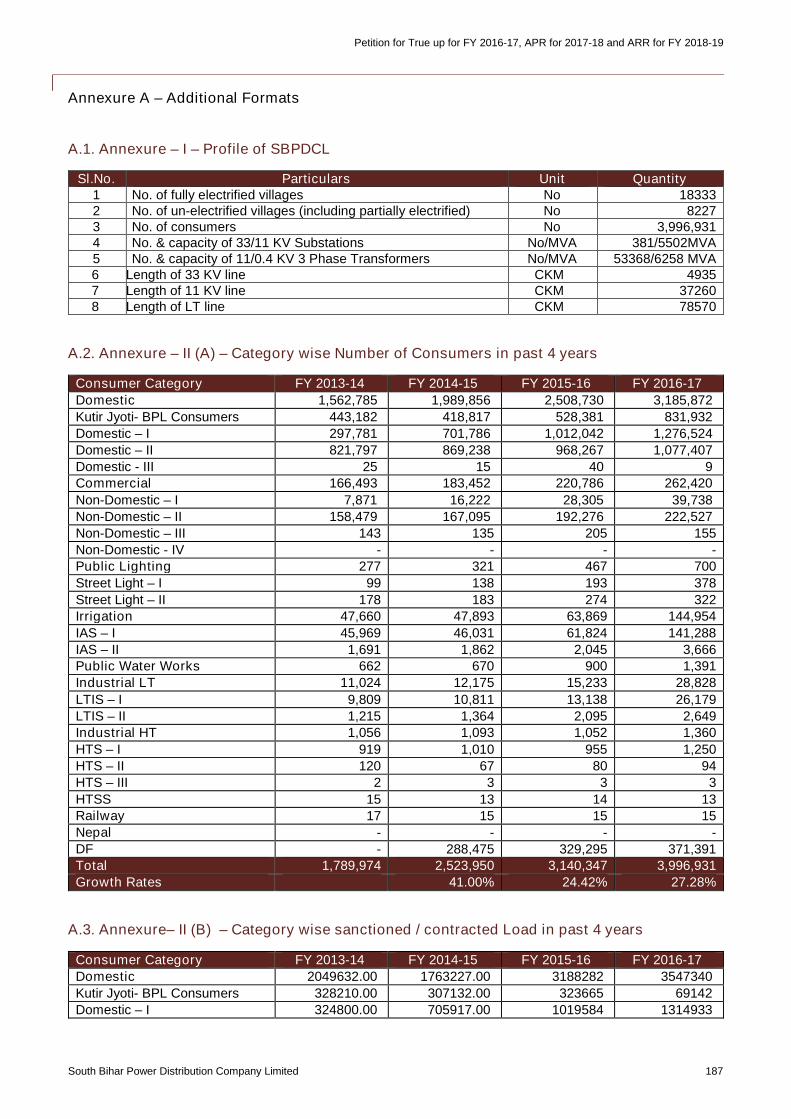
Petition for True up for FY 2016-17, APR for 2017-18 and ARR for FY 2018-19
South Bihar Power Distribution Company Limited 187
Annexure A – Additional Formats
A.1. Annexure – I – Profile of SBPDCL
Sl.No. Particulars Unit Quantity1 No. of fully electrified villages No 183332 No. of un-electrified villages (including partially electrified) No 82273 No. of consumers No 3,996,9314 No. & capacity of 33/11 KV Substations No/MVA 381/5502MVA5 No. & capacity of 11/0.4 KV 3 Phase Transformers No/MVA 53368/6258 MVA6 Length of 33 KV line CKM 49357 Length of 11 KV line CKM 372608 Length of LT line CKM 78570
A.2. Annexure – II (A) – Category wise Number of Consumers in past 4 years
Consumer Category FY 2013-14 FY 2014-15 FY 2015-16 FY 2016-17
Domestic 1,562,785 1,989,856 2,508,730 3,185,872
Kutir Jyoti- BPL Consumers 443,182 418,817 528,381 831,932
Domestic – I 297,781 701,786 1,012,042 1,276,524
Domestic – II 821,797 869,238 968,267 1,077,407
Domestic - III 25 15 40 9Commercial 166,493 183,452 220,786 262,420
Non-Domestic – I 7,871 16,222 28,305 39,738
Non-Domestic – II 158,479 167,095 192,276 222,527
Non-Domestic – III 143 135 205 155
Non-Domestic - IV - - - -Public Lighting 277 321 467 700
Street Light – I 99 138 193 378
Street Light – II 178 183 274 322Irrigation 47,660 47,893 63,869 144,954
IAS – I 45,969 46,031 61,824 141,288
IAS – II 1,691 1,862 2,045 3,666Public Water Works 662 670 900 1,391
Industrial LT 11,024 12,175 15,233 28,828
LTIS – I 9,809 10,811 13,138 26,179
LTIS – II 1,215 1,364 2,095 2,649Industrial HT 1,056 1,093 1,052 1,360
HTS – I 919 1,010 955 1,250
HTS – II 120 67 80 94
HTS – III 2 3 3 3
HTSS 15 13 14 13Railway 17 15 15 15Nepal - - - -DF - 288,475 329,295 371,391Total 1,789,974 2,523,950 3,140,347 3,996,931
Growth Rates 41.00% 24.42% 27.28%
A.3. Annexure– II (B) – Category wise sanctioned / contracted Load in past 4 years
Consumer Category FY 2013-14 FY 2014-15 FY 2015-16 FY 2016-17
Domestic 2049632.00 1763227.00 3188282 3547340
Kutir Jyoti- BPL Consumers 328210.00 307132.00 323665 69142
Domestic – I 324800.00 705917.00 1019584 1314933
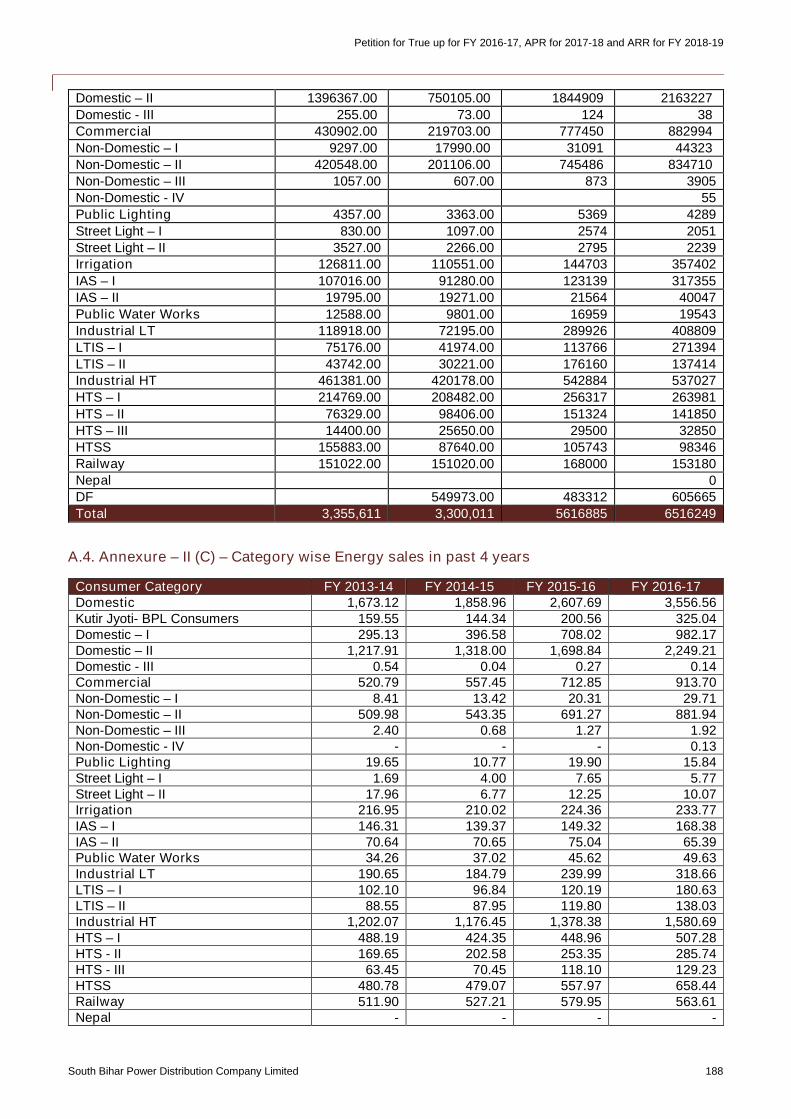
Petition for True up for FY 2016-17, APR for 2017-18 and ARR for FY 2018-19
South Bihar Power Distribution Company Limited 188
Domestic – II 1396367.00 750105.00 1844909 2163227
Domestic - III 255.00 73.00 124 38Commercial 430902.00 219703.00 777450 882994
Non-Domestic – I 9297.00 17990.00 31091 44323
Non-Domestic – II 420548.00 201106.00 745486 834710
Non-Domestic – III 1057.00 607.00 873 3905
Non-Domestic - IV 55
Public Lighting 4357.00 3363.00 5369 4289
Street Light – I 830.00 1097.00 2574 2051
Street Light – II 3527.00 2266.00 2795 2239Irrigation 126811.00 110551.00 144703 357402
IAS – I 107016.00 91280.00 123139 317355
IAS – II 19795.00 19271.00 21564 40047
Public Water Works 12588.00 9801.00 16959 19543
Industrial LT 118918.00 72195.00 289926 408809
LTIS – I 75176.00 41974.00 113766 271394
LTIS – II 43742.00 30221.00 176160 137414Industrial HT 461381.00 420178.00 542884 537027
HTS – I 214769.00 208482.00 256317 263981
HTS – II 76329.00 98406.00 151324 141850
HTS – III 14400.00 25650.00 29500 32850
HTSS 155883.00 87640.00 105743 98346Railway 151022.00 151020.00 168000 153180Nepal 0DF 549973.00 483312 605665
Total 3,355,611 3,300,011 5616885 6516249
A.4. Annexure – II (C) – Category wise Energy sales in past 4 years
Consumer Category FY 2013-14 FY 2014-15 FY 2015-16 FY 2016-17Domestic 1,673.12 1,858.96 2,607.69 3,556.56Kutir Jyoti- BPL Consumers 159.55 144.34 200.56 325.04Domestic – I 295.13 396.58 708.02 982.17Domestic – II 1,217.91 1,318.00 1,698.84 2,249.21Domestic - III 0.54 0.04 0.27 0.14Commercial 520.79 557.45 712.85 913.70Non-Domestic – I 8.41 13.42 20.31 29.71Non-Domestic – II 509.98 543.35 691.27 881.94Non-Domestic – III 2.40 0.68 1.27 1.92Non-Domestic - IV - - - 0.13Public Lighting 19.65 10.77 19.90 15.84Street Light – I 1.69 4.00 7.65 5.77Street Light – II 17.96 6.77 12.25 10.07Irrigation 216.95 210.02 224.36 233.77IAS – I 146.31 139.37 149.32 168.38IAS – II 70.64 70.65 75.04 65.39Public Water Works 34.26 37.02 45.62 49.63Industrial LT 190.65 184.79 239.99 318.66LTIS – I 102.10 96.84 120.19 180.63LTIS – II 88.55 87.95 119.80 138.03Industrial HT 1,202.07 1,176.45 1,378.38 1,580.69HTS – I 488.19 424.35 448.96 507.28HTS - II 169.65 202.58 253.35 285.74HTS - III 63.45 70.45 118.10 129.23HTSS 480.78 479.07 557.97 658.44Railway 511.90 527.21 579.95 563.61Nepal - - - -
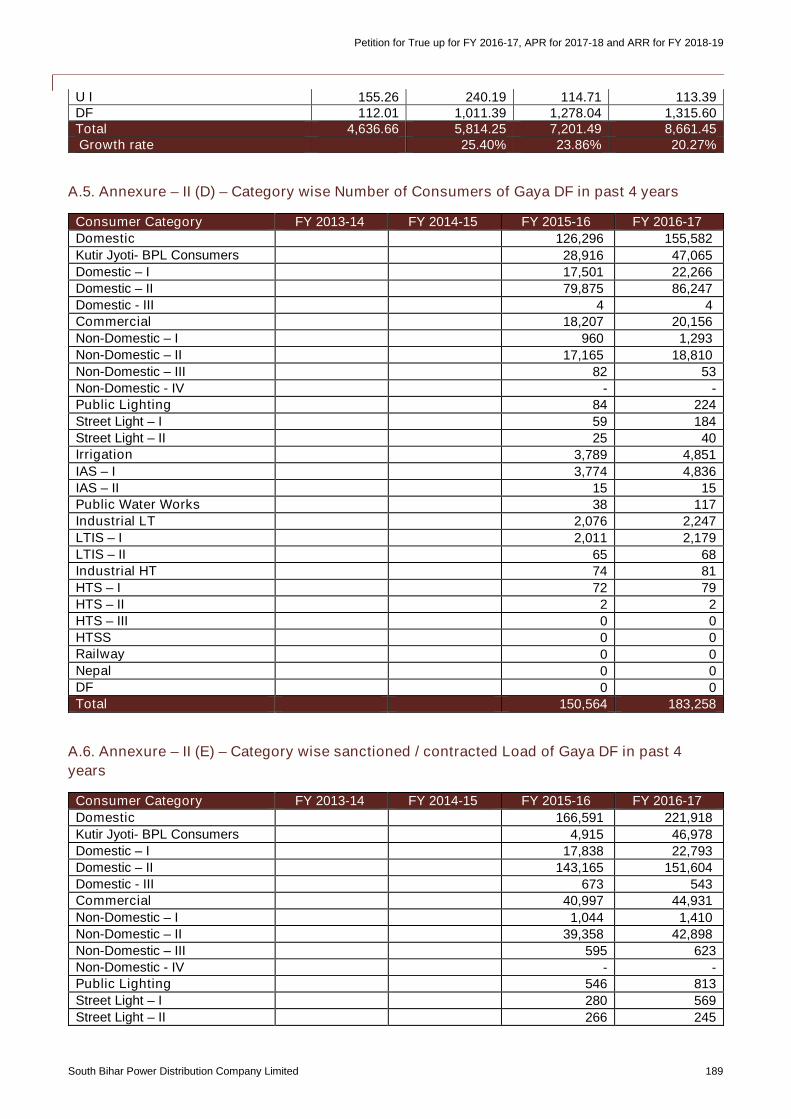
Petition for True up for FY 2016-17, APR for 2017-18 and ARR for FY 2018-19
South Bihar Power Distribution Company Limited 189
U I 155.26 240.19 114.71 113.39DF 112.01 1,011.39 1,278.04 1,315.60Total 4,636.66 5,814.25 7,201.49 8,661.45Growth rate 25.40% 23.86% 20.27%
A.5. Annexure – II (D) – Category wise Number of Consumers of Gaya DF in past 4 years
Consumer Category FY 2013-14 FY 2014-15 FY 2015-16 FY 2016-17
Domestic 126,296 155,582
Kutir Jyoti- BPL Consumers 28,916 47,065Domestic – I 17,501 22,266Domestic – II 79,875 86,247Domestic - III 4 4Commercial 18,207 20,156
Non-Domestic – I 960 1,293Non-Domestic – II 17,165 18,810Non-Domestic – III 82 53Non-Domestic - IV - -Public Lighting 84 224
Street Light – I 59 184Street Light – II 25 40Irrigation 3,789 4,851
IAS – I 3,774 4,836IAS – II 15 15Public Water Works 38 117Industrial LT 2,076 2,247
LTIS – I 2,011 2,179LTIS – II 65 68Industrial HT 74 81
HTS – I 72 79HTS – II 2 2HTS – III 0 0HTSS 0 0Railway 0 0Nepal 0 0DF 0 0Total 150,564 183,258
A.6. Annexure – II (E) – Category wise sanctioned / contracted Load of Gaya DF in past 4
years
Consumer Category FY 2013-14 FY 2014-15 FY 2015-16 FY 2016-17
Domestic 166,591 221,918
Kutir Jyoti- BPL Consumers 4,915 46,978Domestic – I 17,838 22,793Domestic – II 143,165 151,604Domestic - III 673 543Commercial 40,997 44,931
Non-Domestic – I 1,044 1,410Non-Domestic – II 39,358 42,898Non-Domestic – III 595 623Non-Domestic - IV - -Public Lighting 546 813
Street Light – I 280 569
Street Light – II 266 245
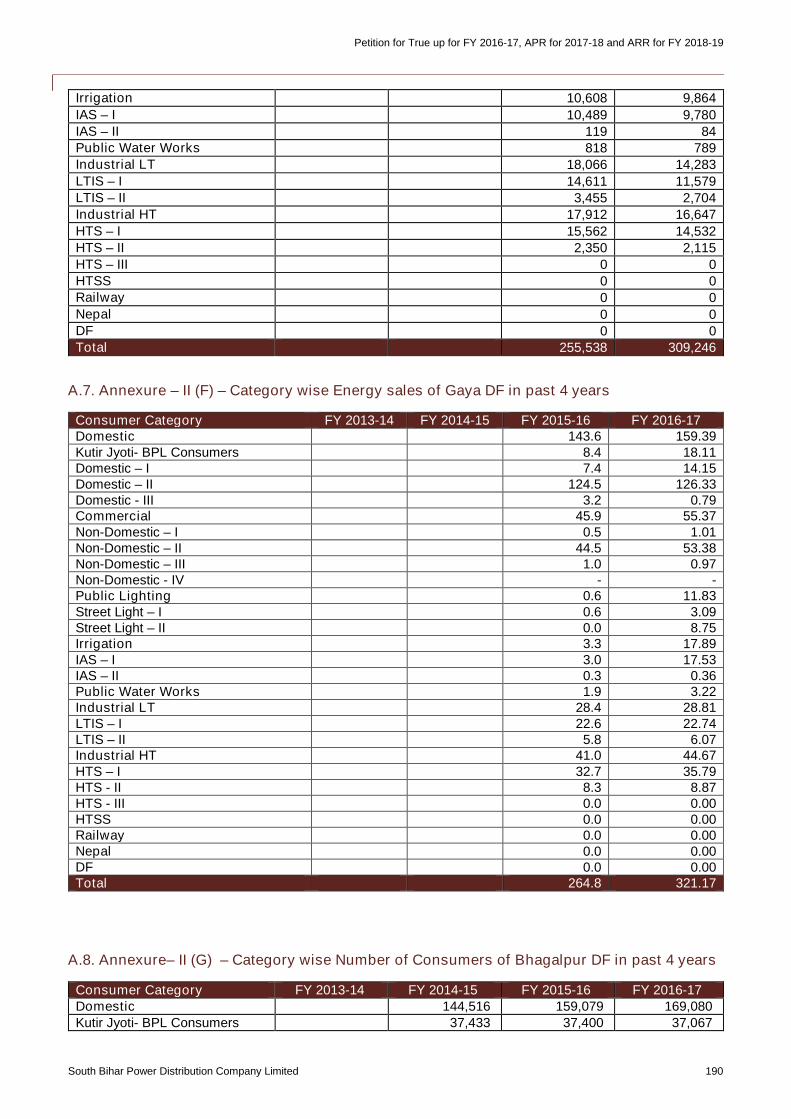
Petition for True up for FY 2016-17, APR for 2017-18 and ARR for FY 2018-19
South Bihar Power Distribution Company Limited 190
Irrigation 10,608 9,864
IAS – I 10,489 9,780IAS – II 119 84Public Water Works 818 789Industrial LT 18,066 14,283
LTIS – I 14,611 11,579LTIS – II 3,455 2,704Industrial HT 17,912 16,647
HTS – I 15,562 14,532HTS – II 2,350 2,115HTS – III 0 0HTSS 0 0Railway 0 0Nepal 0 0DF 0 0Total 255,538 309,246
A.7. Annexure – II (F) – Category wise Energy sales of Gaya DF in past 4 years
Consumer Category FY 2013-14 FY 2014-15 FY 2015-16 FY 2016-17Domestic 143.6 159.39Kutir Jyoti- BPL Consumers 8.4 18.11Domestic – I 7.4 14.15Domestic – II 124.5 126.33Domestic - III 3.2 0.79Commercial 45.9 55.37Non-Domestic – I 0.5 1.01Non-Domestic – II 44.5 53.38Non-Domestic – III 1.0 0.97Non-Domestic - IV - -Public Lighting 0.6 11.83Street Light – I 0.6 3.09Street Light – II 0.0 8.75Irrigation 3.3 17.89IAS – I 3.0 17.53IAS – II 0.3 0.36Public Water Works 1.9 3.22Industrial LT 28.4 28.81LTIS – I 22.6 22.74LTIS – II 5.8 6.07Industrial HT 41.0 44.67HTS – I 32.7 35.79HTS - II 8.3 8.87HTS - III 0.0 0.00HTSS 0.0 0.00Railway 0.0 0.00Nepal 0.0 0.00DF 0.0 0.00Total 264.8 321.17
A.8. Annexure– II (G) – Category wise Number of Consumers of Bhagalpur DF in past 4 years
Consumer Category FY 2013-14 FY 2014-15 FY 2015-16 FY 2016-17Domestic 144,516 159,079 169,080Kutir Jyoti- BPL Consumers 37,433 37,400 37,067
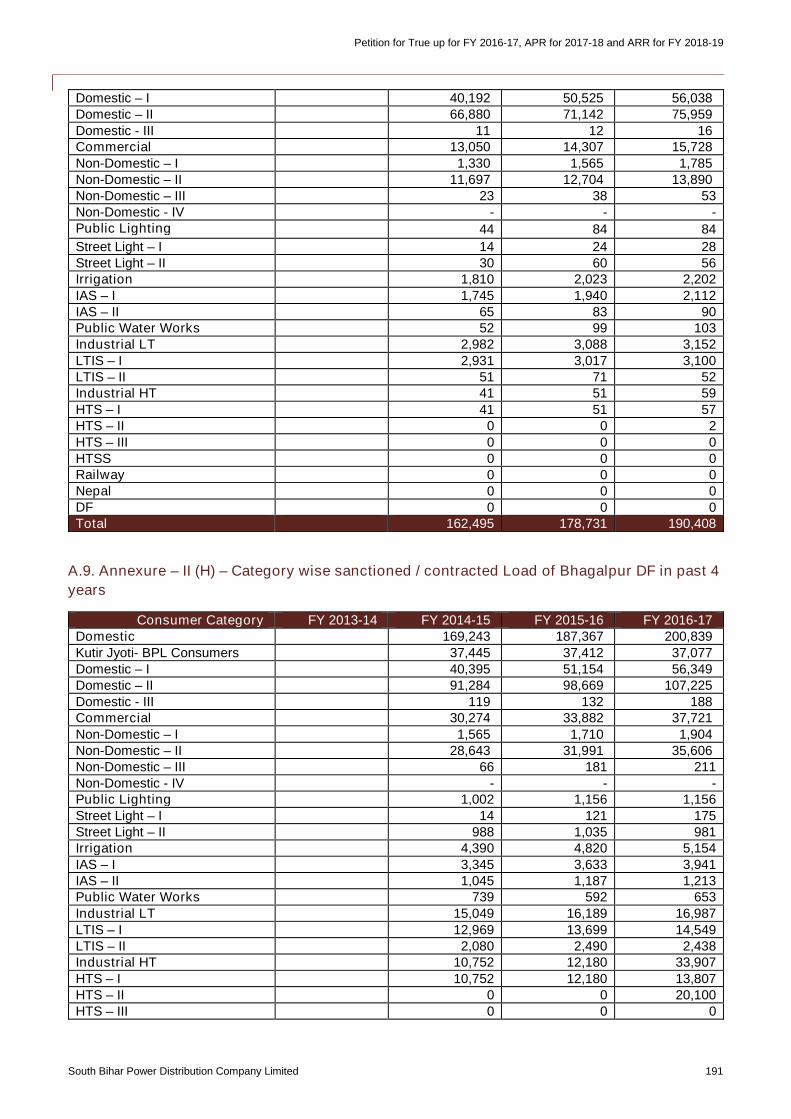
Petition for True up for FY 2016-17, APR for 2017-18 and ARR for FY 2018-19
South Bihar Power Distribution Company Limited 191
Domestic – I 40,192 50,525 56,038Domestic – II 66,880 71,142 75,959Domestic - III 11 12 16Commercial 13,050 14,307 15,728Non-Domestic – I 1,330 1,565 1,785Non-Domestic – II 11,697 12,704 13,890Non-Domestic – III 23 38 53Non-Domestic - IV - - -Public Lighting 44 84 84
Street Light – I 14 24 28Street Light – II 30 60 56Irrigation 1,810 2,023 2,202IAS – I 1,745 1,940 2,112IAS – II 65 83 90Public Water Works 52 99 103Industrial LT 2,982 3,088 3,152LTIS – I 2,931 3,017 3,100LTIS – II 51 71 52Industrial HT 41 51 59HTS – I 41 51 57HTS – II 0 0 2HTS – III 0 0 0HTSS 0 0 0Railway 0 0 0Nepal 0 0 0DF 0 0 0Total 162,495 178,731 190,408
A.9. Annexure – II (H) – Category wise sanctioned / contracted Load of Bhagalpur DF in past 4
years
Consumer Category FY 2013-14 FY 2014-15 FY 2015-16 FY 2016-17Domestic 169,243 187,367 200,839Kutir Jyoti- BPL Consumers 37,445 37,412 37,077Domestic – I 40,395 51,154 56,349Domestic – II 91,284 98,669 107,225Domestic - III 119 132 188Commercial 30,274 33,882 37,721Non-Domestic – I 1,565 1,710 1,904Non-Domestic – II 28,643 31,991 35,606Non-Domestic – III 66 181 211Non-Domestic - IV - - -Public Lighting 1,002 1,156 1,156Street Light – I 14 121 175Street Light – II 988 1,035 981Irrigation 4,390 4,820 5,154IAS – I 3,345 3,633 3,941IAS – II 1,045 1,187 1,213Public Water Works 739 592 653Industrial LT 15,049 16,189 16,987LTIS – I 12,969 13,699 14,549LTIS – II 2,080 2,490 2,438Industrial HT 10,752 12,180 33,907HTS – I 10,752 12,180 13,807HTS – II 0 0 20,100HTS – III 0 0 0
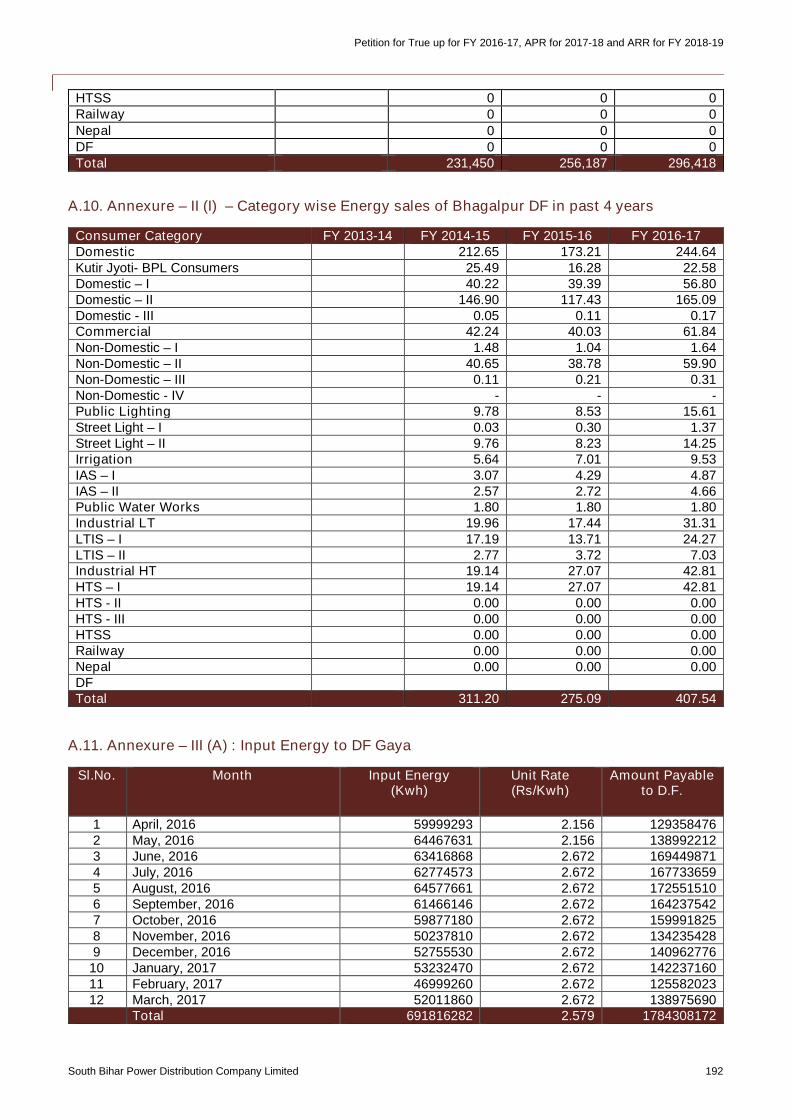
Petition for True up for FY 2016-17, APR for 2017-18 and ARR for FY 2018-19
South Bihar Power Distribution Company Limited 192
HTSS 0 0 0Railway 0 0 0Nepal 0 0 0DF 0 0 0Total 231,450 256,187 296,418
A.10. Annexure – II (I) – Category wise Energy sales of Bhagalpur DF in past 4 years
Consumer Category FY 2013-14 FY 2014-15 FY 2015-16 FY 2016-17Domestic 212.65 173.21 244.64Kutir Jyoti- BPL Consumers 25.49 16.28 22.58Domestic – I 40.22 39.39 56.80Domestic – II 146.90 117.43 165.09Domestic - III 0.05 0.11 0.17Commercial 42.24 40.03 61.84Non-Domestic – I 1.48 1.04 1.64Non-Domestic – II 40.65 38.78 59.90Non-Domestic – III 0.11 0.21 0.31Non-Domestic - IV - - -Public Lighting 9.78 8.53 15.61Street Light – I 0.03 0.30 1.37Street Light – II 9.76 8.23 14.25Irrigation 5.64 7.01 9.53IAS – I 3.07 4.29 4.87IAS – II 2.57 2.72 4.66Public Water Works 1.80 1.80 1.80Industrial LT 19.96 17.44 31.31LTIS – I 17.19 13.71 24.27LTIS – II 2.77 3.72 7.03Industrial HT 19.14 27.07 42.81HTS – I 19.14 27.07 42.81HTS - II 0.00 0.00 0.00HTS - III 0.00 0.00 0.00HTSS 0.00 0.00 0.00Railway 0.00 0.00 0.00Nepal 0.00 0.00 0.00DF 311.20 275.09 407.54Total 311.20 275.09 407.54
A.11. Annexure – III (A) : Input Energy to DF Gaya
Sl.No. Month Input Energy(Kwh)
Unit Rate(Rs/Kwh)
Amount Payableto D.F.
1 April, 2016 59999293 2.156 1293584762 May, 2016 64467631 2.156 1389922123 June, 2016 63416868 2.672 1694498714 July, 2016 62774573 2.672 1677336595 August, 2016 64577661 2.672 1725515106 September, 2016 61466146 2.672 1642375427 October, 2016 59877180 2.672 1599918258 November, 2016 50237810 2.672 1342354289 December, 2016 52755530 2.672 140962776
10 January, 2017 53232470 2.672 14223716011 February, 2017 46999260 2.672 12558202312 March, 2017 52011860 2.672 138975690
Total 691816282 2.579 1784308172
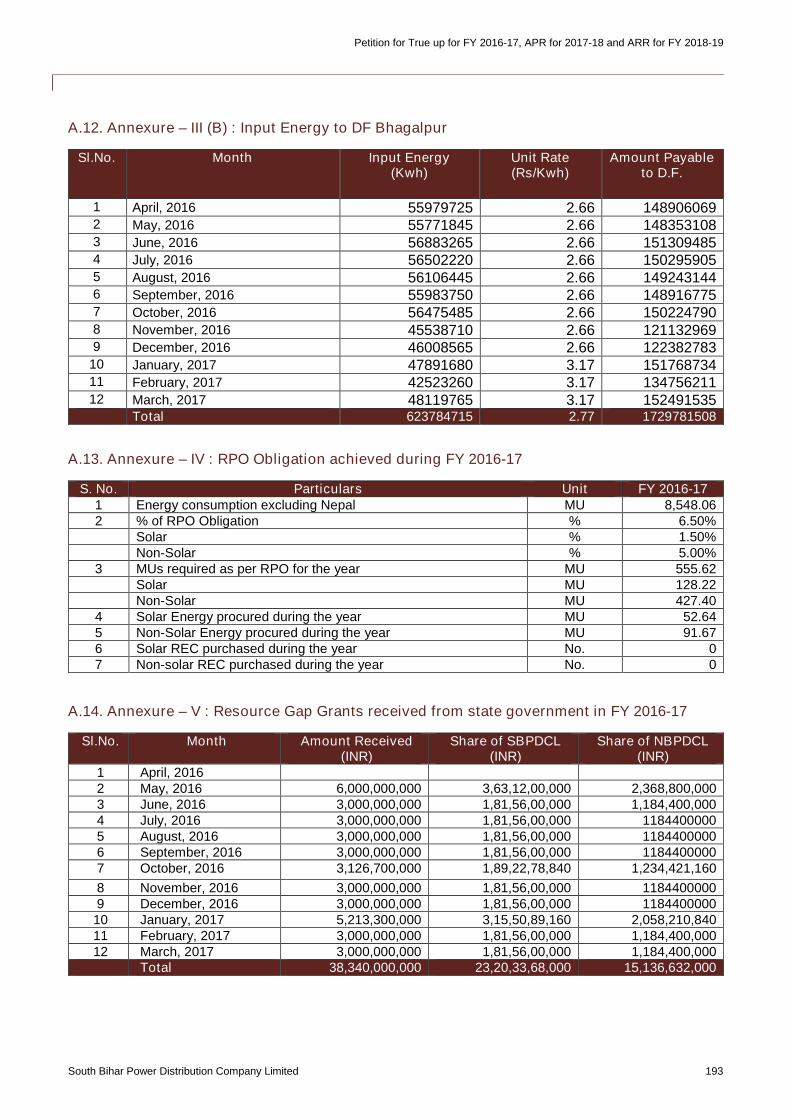
Petition for True up for FY 2016-17, APR for 2017-18 and ARR for FY 2018-19
South Bihar Power Distribution Company Limited 193
A.12. Annexure – III (B) : Input Energy to DF Bhagalpur
Sl.No. Month Input Energy(Kwh)
Unit Rate(Rs/Kwh)
Amount Payableto D.F.
1 April, 2016 55979725 2.66 1489060692 May, 2016 55771845 2.66 1483531083 June, 2016 56883265 2.66 1513094854 July, 2016 56502220 2.66 1502959055 August, 2016 56106445 2.66 1492431446 September, 2016 55983750 2.66 1489167757 October, 2016 56475485 2.66 1502247908 November, 2016 45538710 2.66 1211329699 December, 2016 46008565 2.66 122382783
10 January, 2017 47891680 3.17 15176873411 February, 2017 42523260 3.17 13475621112 March, 2017 48119765 3.17 152491535
Total 623784715 2.77 1729781508
A.13. Annexure – IV : RPO Obligation achieved during FY 2016-17
S. No. Particulars Unit FY 2016-171 Energy consumption excluding Nepal MU 8,548.062 % of RPO Obligation % 6.50%
Solar % 1.50%Non-Solar % 5.00%
3 MUs required as per RPO for the year MU 555.62Solar MU 128.22Non-Solar MU 427.40
4 Solar Energy procured during the year MU 52.645 Non-Solar Energy procured during the year MU 91.676 Solar REC purchased during the year No. 07 Non-solar REC purchased during the year No. 0
A.14. Annexure – V : Resource Gap Grants received from state government in FY 2016-17
Sl.No. Month Amount Received(INR)
Share of SBPDCL(INR)
Share of NBPDCL(INR)
1 April, 20162 May, 2016 6,000,000,000 3,63,12,00,000 2,368,800,0003 June, 2016 3,000,000,000 1,81,56,00,000 1,184,400,0004 July, 2016 3,000,000,000 1,81,56,00,000 11844000005 August, 2016 3,000,000,000 1,81,56,00,000 11844000006 September, 2016 3,000,000,000 1,81,56,00,000 11844000007 October, 2016 3,126,700,000 1,89,22,78,840 1,234,421,160
8 November, 2016 3,000,000,000 1,81,56,00,000 11844000009 December, 2016 3,000,000,000 1,81,56,00,000 118440000010 January, 2017 5,213,300,000 3,15,50,89,160 2,058,210,84011 February, 2017 3,000,000,000 1,81,56,00,000 1,184,400,00012 March, 2017 3,000,000,000 1,81,56,00,000 1,184,400,000
Total 38,340,000,000 23,20,33,68,000 15,136,632,000
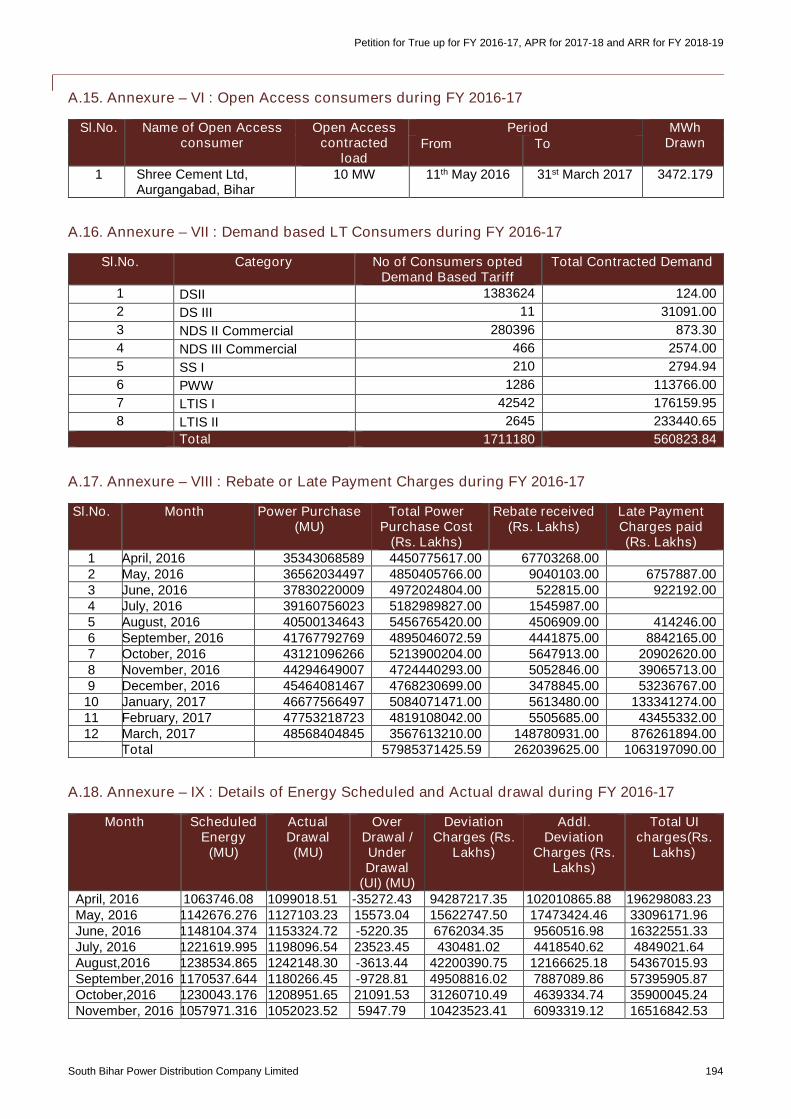
Petition for True up for FY 2016-17, APR for 2017-18 and ARR for FY 2018-19
South Bihar Power Distribution Company Limited 194
A.15. Annexure – VI : Open Access consumers during FY 2016-17
Sl.No. Name of Open Accessconsumer
Open Accesscontracted
load
Period MWhDrawnFrom To
1 Shree Cement Ltd,Aurgangabad, Bihar
10 MW 11th May 2016 31st March 2017 3472.179
A.16. Annexure – VII : Demand based LT Consumers during FY 2016-17
Sl.No. Category No of Consumers optedDemand Based Tariff
Total Contracted Demand
1 DSII 1383624 124.00
2 DS III 11 31091.00
3 NDS II Commercial 280396 873.30
4 NDS III Commercial 466 2574.00
5 SS I 210 2794.94
6 PWW 1286 113766.00
7 LTIS I 42542 176159.95
8 LTIS II 2645 233440.65
Total 1711180 560823.84
A.17. Annexure – VIII : Rebate or Late Payment Charges during FY 2016-17
Sl.No. Month Power Purchase(MU)
Total PowerPurchase Cost
(Rs. Lakhs)
Rebate received(Rs. Lakhs)
Late PaymentCharges paid(Rs. Lakhs)
1 April, 2016 35343068589 4450775617.00 67703268.002 May, 2016 36562034497 4850405766.00 9040103.00 6757887.003 June, 2016 37830220009 4972024804.00 522815.00 922192.004 July, 2016 39160756023 5182989827.00 1545987.005 August, 2016 40500134643 5456765420.00 4506909.00 414246.006 September, 2016 41767792769 4895046072.59 4441875.00 8842165.007 October, 2016 43121096266 5213900204.00 5647913.00 20902620.008 November, 2016 44294649007 4724440293.00 5052846.00 39065713.009 December, 2016 45464081467 4768230699.00 3478845.00 53236767.00
10 January, 2017 46677566497 5084071471.00 5613480.00 133341274.0011 February, 2017 47753218723 4819108042.00 5505685.00 43455332.0012 March, 2017 48568404845 3567613210.00 148780931.00 876261894.00
Total 57985371425.59 262039625.00 1063197090.00
A.18. Annexure – IX : Details of Energy Scheduled and Actual drawal during FY 2016-17
Month ScheduledEnergy
(MU)
ActualDrawal(MU)
OverDrawal /UnderDrawal
(UI) (MU)
DeviationCharges (Rs.
Lakhs)
Addl.Deviation
Charges (Rs.Lakhs)
Total UIcharges(Rs.
Lakhs)
April, 2016 1063746.08 1099018.51 -35272.43 94287217.35 102010865.88 196298083.23May, 2016 1142676.276 1127103.23 15573.04 15622747.50 17473424.46 33096171.96June, 2016 1148104.374 1153324.72 -5220.35 6762034.35 9560516.98 16322551.33July, 2016 1221619.995 1198096.54 23523.45 430481.02 4418540.62 4849021.64August,2016 1238534.865 1242148.30 -3613.44 42200390.75 12166625.18 54367015.93September,2016 1170537.644 1180266.45 -9728.81 49508816.02 7887089.86 57395905.87October,2016 1230043.176 1208951.65 21091.53 31260710.49 4639334.74 35900045.24November, 2016 1057971.316 1052023.52 5947.79 10423523.41 6093319.12 16516842.53
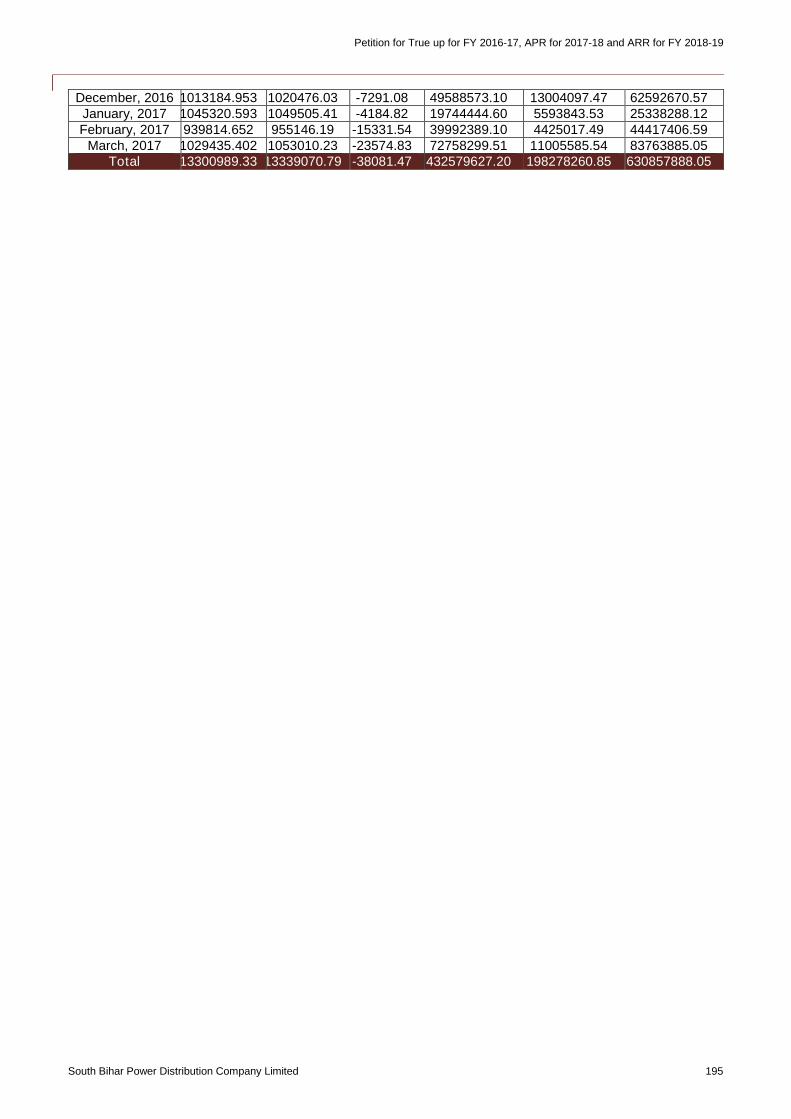
Petition for True up for FY 2016-17, APR for 2017-18 and ARR for FY 2018-19
South Bihar Power Distribution Company Limited 195
December, 2016 1013184.953 1020476.03 -7291.08 49588573.10 13004097.47 62592670.57January, 2017 1045320.593 1049505.41 -4184.82 19744444.60 5593843.53 25338288.12February, 2017 939814.652 955146.19 -15331.54 39992389.10 4425017.49 44417406.59
March, 2017 1029435.402 1053010.23 -23574.83 72758299.51 11005585.54 83763885.05Total 13300989.33 13339070.79 -38081.47 432579627.20 198278260.85 630857888.05
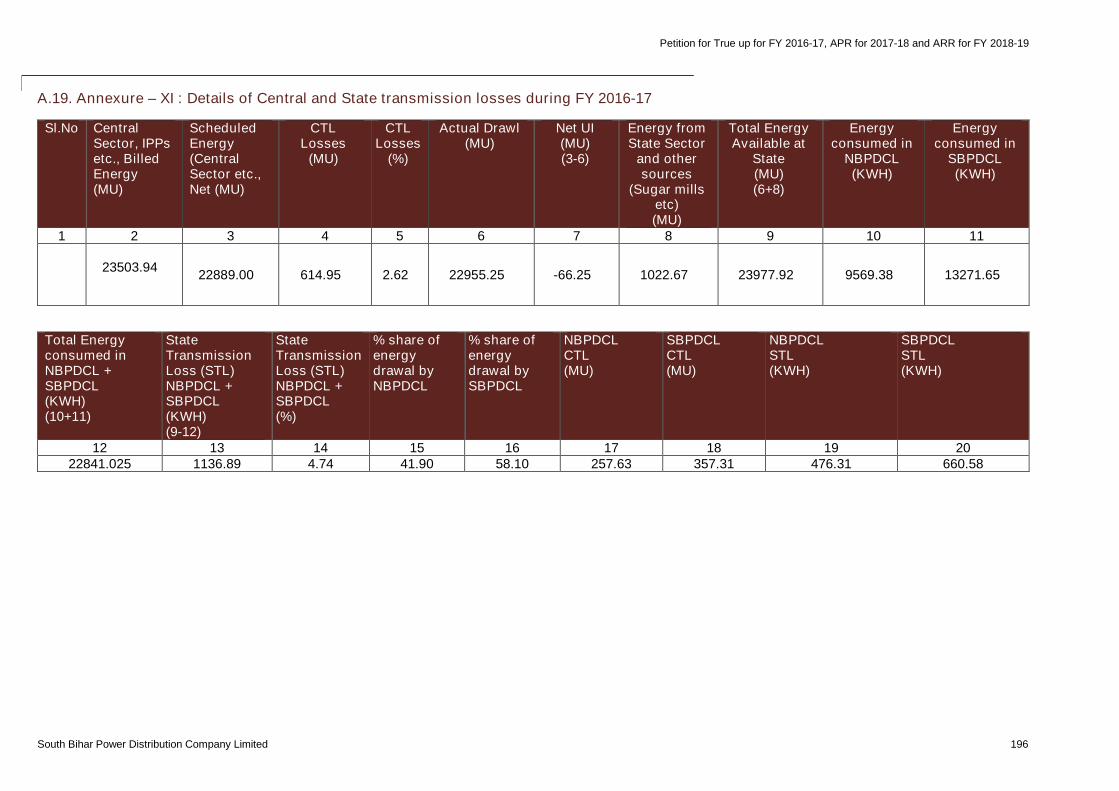
Petition for True up for FY 2016-17, APR for 2017-18 and ARR for FY 2018-19
South Bihar Power Distribution Company Limited 196
A.19. Annexure – XI : Details of Central and State transmission losses during FY 2016-17
Sl.No CentralSector, IPPsetc., BilledEnergy(MU)
ScheduledEnergy(CentralSector etc.,Net (MU)
CTLLosses
(MU)
CTLLosses
(%)
Actual Drawl(MU)
Net UI(MU)(3-6)
Energy fromState Sector
and othersources
(Sugar millsetc)(MU)
Total EnergyAvailable at
State(MU)(6+8)
Energyconsumed in
NBPDCL(KWH)
Energyconsumed in
SBPDCL(KWH)
1 2 3 4 5 6 7 8 9 10 11
23503.9422889.00 614.95 2.62 22955.25 -66.25 1022.67 23977.92 9569.38 13271.65
Total Energyconsumed inNBPDCL +SBPDCL(KWH)(10+11)
StateTransmissionLoss (STL)NBPDCL +SBPDCL(KWH)(9-12)
StateTransmissionLoss (STL)NBPDCL +SBPDCL(%)
% share ofenergydrawal byNBPDCL
% share ofenergydrawal bySBPDCL
NBPDCLCTL(MU)
SBPDCLCTL(MU)
NBPDCLSTL(KWH)
SBPDCLSTL(KWH)
12 13 14 15 16 17 18 19 2022841.025 1136.89 4.74 41.90 58.10 257.63 357.31 476.31 660.58

Petition for True up for FY 2016-17, APR for 2017-18 and ARR for FY 2018-19
South Bihar Power Distribution Company Limited 197
A.20. Annexure – XII (A) : Scheme-wise details of capital expenditure and capitalization along with source of funding for FY 2016-17
SI.No
Name of theScheme
Name ofthe
fundingagency
Sources of FundingCapital ExpenditureIncurred/Invested
CapitalisationBalanceCapex to
beInvested
insubsequ
entyears
Up to31.03.
16
Equity
Grant/Capital
Subsidy
Consumer
Contribution
Loan
As at31.03.
17
Up to31.03.
16
During FY2016-
17
As at31.03.1
7
Up to31.03.
16
During FY2016-
17
As at31.03.1
7
1 2 3 4 5 6 7 89 (4 to
8)10 11
12(10+11)
13 1415
(13+14)15 (12-
15)OngoingSchemes
1 BRGF PH-I GOI/GOB333.5
257.1
20.00 0.00 0.00 390.63
333.52
57.12 390.63158.2
2182.3
5340.57 50.06
2 BRGF PH-II GOI/GOB400.8
3183.75
0.00 0.00 0.00 584.58400.8
3183.7
5584.58 10.86 71.51 82.38 502.20
3BRGF PH-II
Part CGOI/GOB 22.50
22.10
0.00 0.00 0.00 44.60 22.50 22.10 44.60 0.00 0.52 0.52 44.07
4BRGF RE
PortionGOI/GOB
210.96
110.67
0.00 0.00 0.00 321.63210.9
6110.6
7321.63 0.00
225.30
225.30 96.33
5R-APDRP
Part AGOI(PFC)/
GOB24.35 0.00 0.00 0.00
54.44
78.79 24.35 54.44 78.79 3.22 0.00 3.22 75.57
6RAPDRP
Part BGOI(PFC)/
GOB425.3
70.00 0.00 0.00
160.37
585.74425.3
7160.3
7585.74 0.00 1.65 1.65 584.08
7 APDRP GoI 15.04 0.00 0.00 0.00 0.00 15.05 15.04 0.00 15.05 0.00 0.39 0.39 14.66
8NABARDPhase VIII
9.83 0.00 1.69 0.00 0.00 11.52 9.83 1.69 11.52 9.13 2.68 11.81 -0.29
9NABARDPhase XI
14.12 0.00 0.26 0.00 0.00 14.39 14.12 0.26 14.39 13.00 1.39 14.39 0.00
10 MP/CM LAD 9.99 0.00 3.18 0.00 0.00 13.17 9.99 3.18 13.17 9.06 3.29 12.35 0.81
11DepositScheme
2.25 0.00 1.79 0.00 0.00 4.04 2.25 1.79 4.04 2.09 1.11 3.19 0.85
12 ADB GoI 63.71 0.00 0.00 0.00 6.26 69.97 63.71 6.26 69.97 0.00 0.00 0.00 69.97
13ACA State
PlanGoB 57.62
82.15
0.00 0.00 0.00 139.77 57.62 82.15 139.77 14.71 86.11 100.81 38.96
14Burnt DTRState Plan
GoB 54.7219.4
00.00 0.00 0.00 74.12 54.72 19.40 74.12 0.00 24.09 24.09 50.03
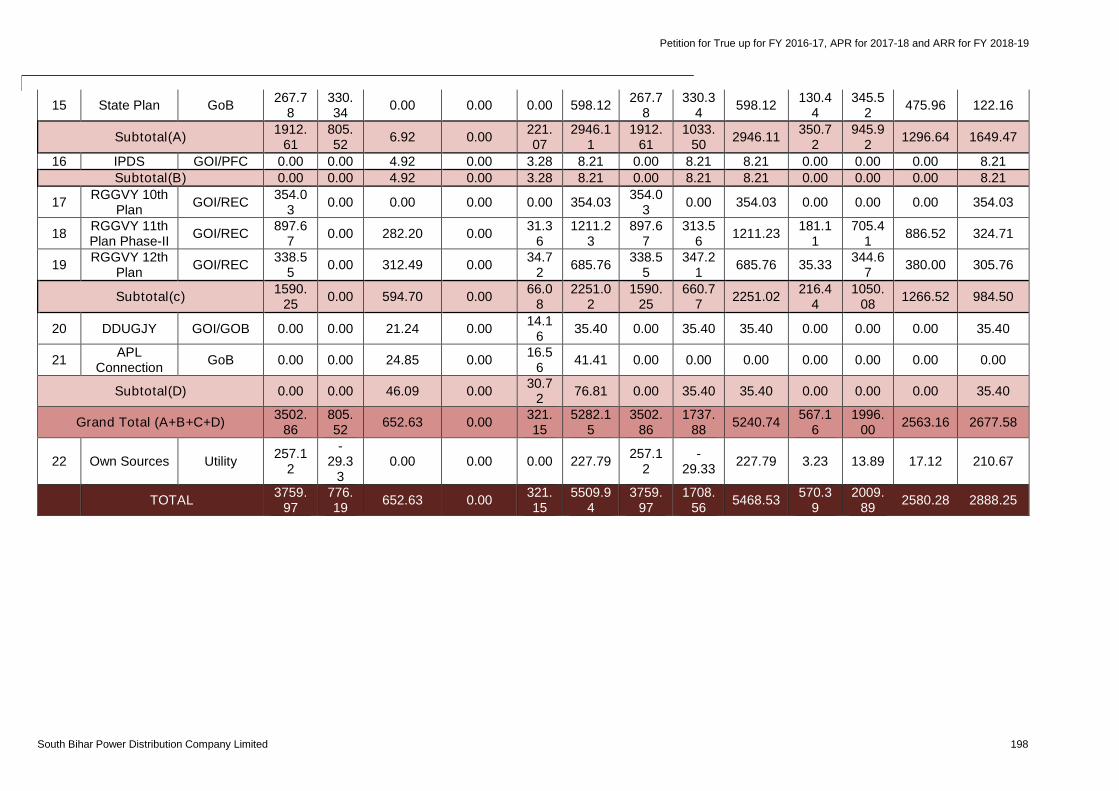
Petition for True up for FY 2016-17, APR for 2017-18 and ARR for FY 2018-19
South Bihar Power Distribution Company Limited 198
15 State Plan GoB267.7
8330.34
0.00 0.00 0.00 598.12267.7
8330.3
4598.12
130.44
345.52
475.96 122.16
Subtotal(A)1912.
61805.52
6.92 0.00221.07
2946.11
1912.61
1033.50
2946.11350.7
2945.9
21296.64 1649.47
16 IPDS GOI/PFC 0.00 0.00 4.92 0.00 3.28 8.21 0.00 8.21 8.21 0.00 0.00 0.00 8.21Subtotal(B) 0.00 0.00 4.92 0.00 3.28 8.21 0.00 8.21 8.21 0.00 0.00 0.00 8.21
17RGGVY 10th
PlanGOI/REC
354.03
0.00 0.00 0.00 0.00 354.03354.0
30.00 354.03 0.00 0.00 0.00 354.03
18RGGVY 11thPlan Phase-II
GOI/REC897.6
70.00 282.20 0.00
31.36
1211.23
897.67
313.56
1211.23181.1
1705.4
1886.52 324.71
19RGGVY 12th
PlanGOI/REC
338.55
0.00 312.49 0.0034.7
2685.76
338.55
347.21
685.76 35.33344.6
7380.00 305.76
Subtotal(c)1590.
250.00 594.70 0.00
66.08
2251.02
1590.25
660.77
2251.02216.4
41050.
081266.52 984.50
20 DDUGJY GOI/GOB 0.00 0.00 21.24 0.0014.1
635.40 0.00 35.40 35.40 0.00 0.00 0.00 35.40
21APL
ConnectionGoB 0.00 0.00 24.85 0.00
16.56
41.41 0.00 0.00 0.00 0.00 0.00 0.00 0.00
Subtotal(D) 0.00 0.00 46.09 0.0030.7
276.81 0.00 35.40 35.40 0.00 0.00 0.00 35.40
Grand Total (A+B+C+D)3502.
86805.52
652.63 0.00321.15
5282.15
3502.86
1737.88
5240.74567.1
61996.
002563.16 2677.58
22 Own Sources Utility257.1
2
-29.3
30.00 0.00 0.00 227.79
257.12
-29.33
227.79 3.23 13.89 17.12 210.67
TOTAL3759.
97776.19
652.63 0.00321.15
5509.94
3759.97
1708.56
5468.53570.3
92009.
892580.28 2888.25
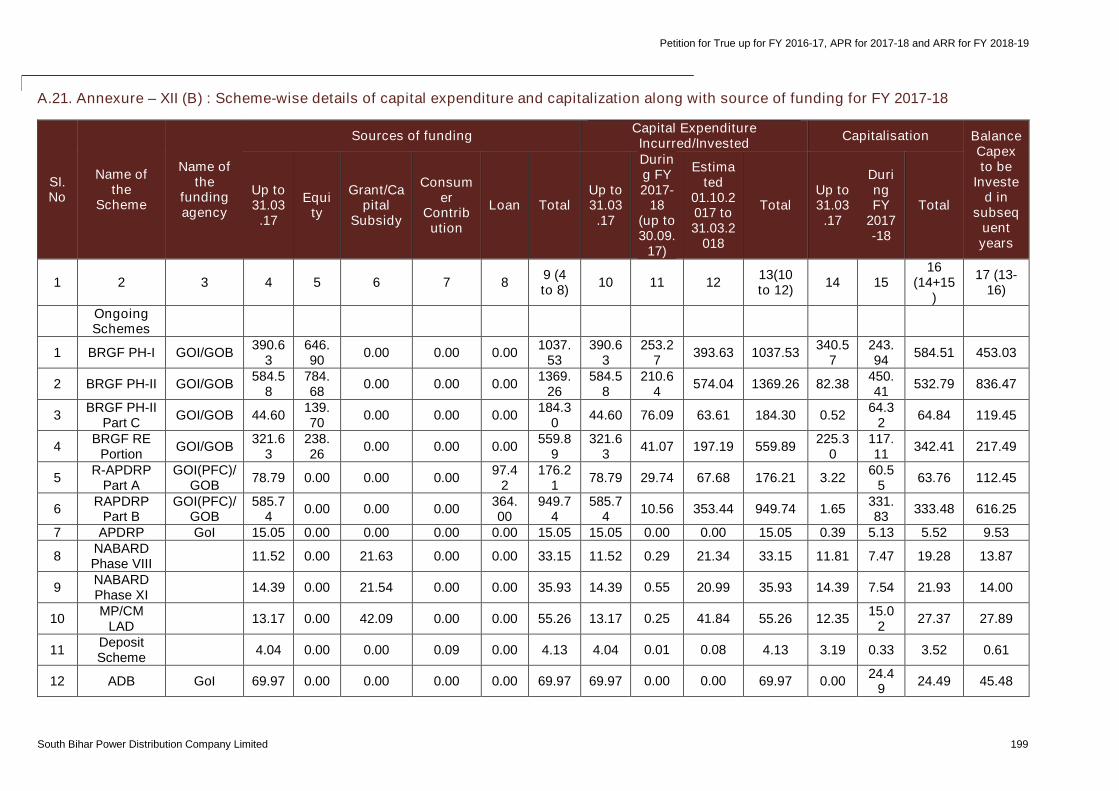
Petition for True up for FY 2016-17, APR for 2017-18 and ARR for FY 2018-19
South Bihar Power Distribution Company Limited 199
A.21. Annexure – XII (B) : Scheme-wise details of capital expenditure and capitalization along with source of funding for FY 2017-18
SI.No
Name ofthe
Scheme
Name ofthe
fundingagency
Sources of fundingCapital ExpenditureIncurred/Invested
Capitalisation BalanceCapexto be
Invested in
subsequentyears
Up to31.03
.17
Equity
Grant/Capital
Subsidy
Consumer
Contribution
Loan TotalUp to31.03
.17
During FY2017-
18(up to30.09.
17)
Estimated
01.10.2017 to31.03.2
018
TotalUp to31.03
.17
DuringFY
2017-18
Total
1 2 3 4 5 6 7 89 (4to 8)
10 11 1213(10to 12)
14 1516
(14+15)
17 (13-16)
OngoingSchemes
1 BRGF PH-I GOI/GOB390.6
3646.90
0.00 0.00 0.001037.
53390.6
3253.2
7393.63 1037.53
340.57
243.94
584.51 453.03
2 BRGF PH-II GOI/GOB584.5
8784.68
0.00 0.00 0.001369.
26584.5
8210.6
4574.04 1369.26 82.38
450.41
532.79 836.47
3BRGF PH-II
Part CGOI/GOB 44.60
139.70
0.00 0.00 0.00184.3
044.60 76.09 63.61 184.30 0.52
64.32
64.84 119.45
4BRGF RE
PortionGOI/GOB
321.63
238.26
0.00 0.00 0.00559.8
9321.6
341.07 197.19 559.89
225.30
117.11
342.41 217.49
5R-APDRP
Part AGOI(PFC)/
GOB78.79 0.00 0.00 0.00
97.42
176.21
78.79 29.74 67.68 176.21 3.2260.5
563.76 112.45
6RAPDRP
Part BGOI(PFC)/
GOB585.7
40.00 0.00 0.00
364.00
949.74
585.74
10.56 353.44 949.74 1.65331.83
333.48 616.25
7 APDRP GoI 15.05 0.00 0.00 0.00 0.00 15.05 15.05 0.00 0.00 15.05 0.39 5.13 5.52 9.53
8NABARDPhase VIII
11.52 0.00 21.63 0.00 0.00 33.15 11.52 0.29 21.34 33.15 11.81 7.47 19.28 13.87
9NABARDPhase XI
14.39 0.00 21.54 0.00 0.00 35.93 14.39 0.55 20.99 35.93 14.39 7.54 21.93 14.00
10MP/CM
LAD13.17 0.00 42.09 0.00 0.00 55.26 13.17 0.25 41.84 55.26 12.35
15.02
27.37 27.89
11DepositScheme
4.04 0.00 0.00 0.09 0.00 4.13 4.04 0.01 0.08 4.13 3.19 0.33 3.52 0.61
12 ADB GoI 69.97 0.00 0.00 0.00 0.00 69.97 69.97 0.00 0.00 69.97 0.0024.4
924.49 45.48
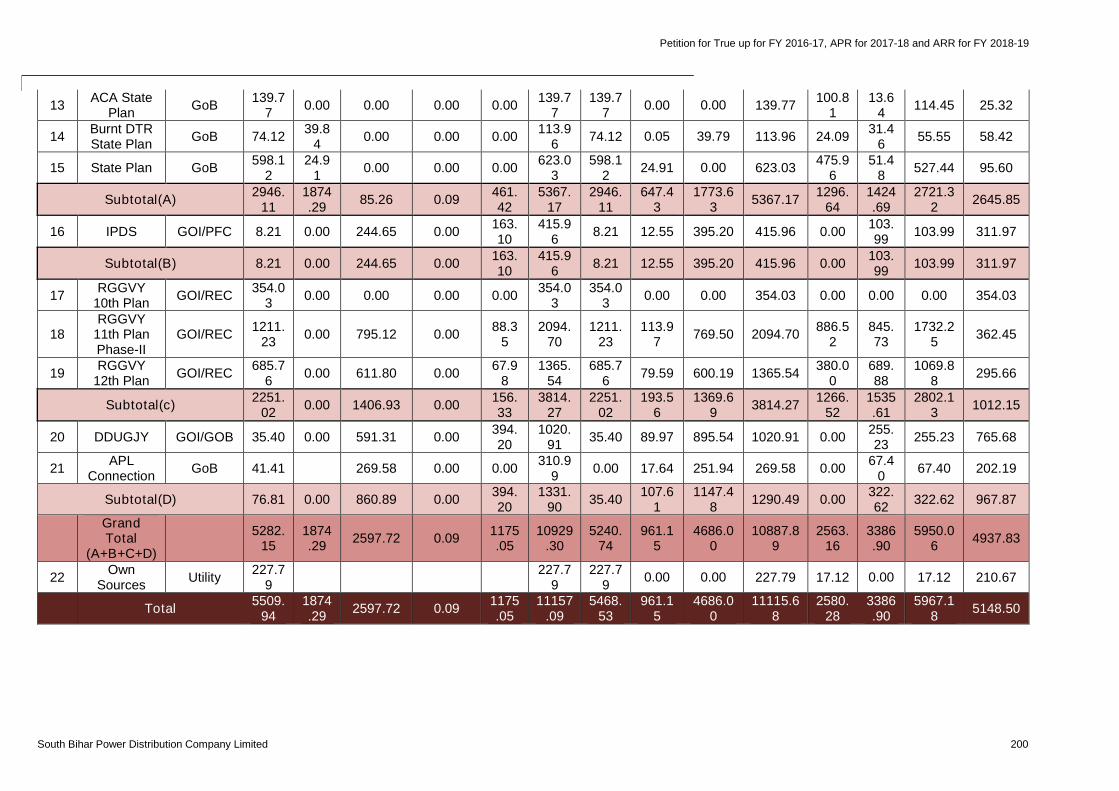
Petition for True up for FY 2016-17, APR for 2017-18 and ARR for FY 2018-19
South Bihar Power Distribution Company Limited 200
13ACA State
PlanGoB
139.77
0.00 0.00 0.00 0.00139.7
7139.7
70.00 0.00 139.77
100.81
13.64
114.45 25.32
14Burnt DTRState Plan
GoB 74.1239.8
40.00 0.00 0.00
113.96
74.12 0.05 39.79 113.96 24.0931.4
655.55 58.42
15 State Plan GoB598.1
224.9
10.00 0.00 0.00
623.03
598.12
24.91 0.00 623.03475.9
651.4
8527.44 95.60
Subtotal(A)2946.
111874.29
85.26 0.09461.42
5367.17
2946.11
647.43
1773.63
5367.171296.
641424.69
2721.32
2645.85
16 IPDS GOI/PFC 8.21 0.00 244.65 0.00163.10
415.96
8.21 12.55 395.20 415.96 0.00103.99
103.99 311.97
Subtotal(B) 8.21 0.00 244.65 0.00163.10
415.96
8.21 12.55 395.20 415.96 0.00103.99
103.99 311.97
17RGGVY
10th PlanGOI/REC
354.03
0.00 0.00 0.00 0.00354.0
3354.0
30.00 0.00 354.03 0.00 0.00 0.00 354.03
18RGGVY
11th PlanPhase-II
GOI/REC1211.
230.00 795.12 0.00
88.35
2094.70
1211.23
113.97
769.50 2094.70886.5
2845.73
1732.25
362.45
19RGGVY
12th PlanGOI/REC
685.76
0.00 611.80 0.0067.9
81365.
54685.7
679.59 600.19 1365.54
380.00
689.88
1069.88
295.66
Subtotal(c)2251.
020.00 1406.93 0.00
156.33
3814.27
2251.02
193.56
1369.69
3814.271266.
521535.61
2802.13
1012.15
20 DDUGJY GOI/GOB 35.40 0.00 591.31 0.00394.20
1020.91
35.40 89.97 895.54 1020.91 0.00255.23
255.23 765.68
21APL
ConnectionGoB 41.41 269.58 0.00 0.00
310.99
0.00 17.64 251.94 269.58 0.0067.4
067.40 202.19
Subtotal(D) 76.81 0.00 860.89 0.00394.20
1331.90
35.40107.6
11147.4
81290.49 0.00
322.62
322.62 967.87
GrandTotal
(A+B+C+D)
5282.15
1874.29
2597.72 0.091175.05
10929.30
5240.74
961.15
4686.00
10887.89
2563.16
3386.90
5950.06
4937.83
22Own
SourcesUtility
227.79
227.79
227.79
0.00 0.00 227.79 17.12 0.00 17.12 210.67
Total5509.
941874.29
2597.72 0.091175.05
11157.09
5468.53
961.15
4686.00
11115.68
2580.28
3386.90
5967.18
5148.50
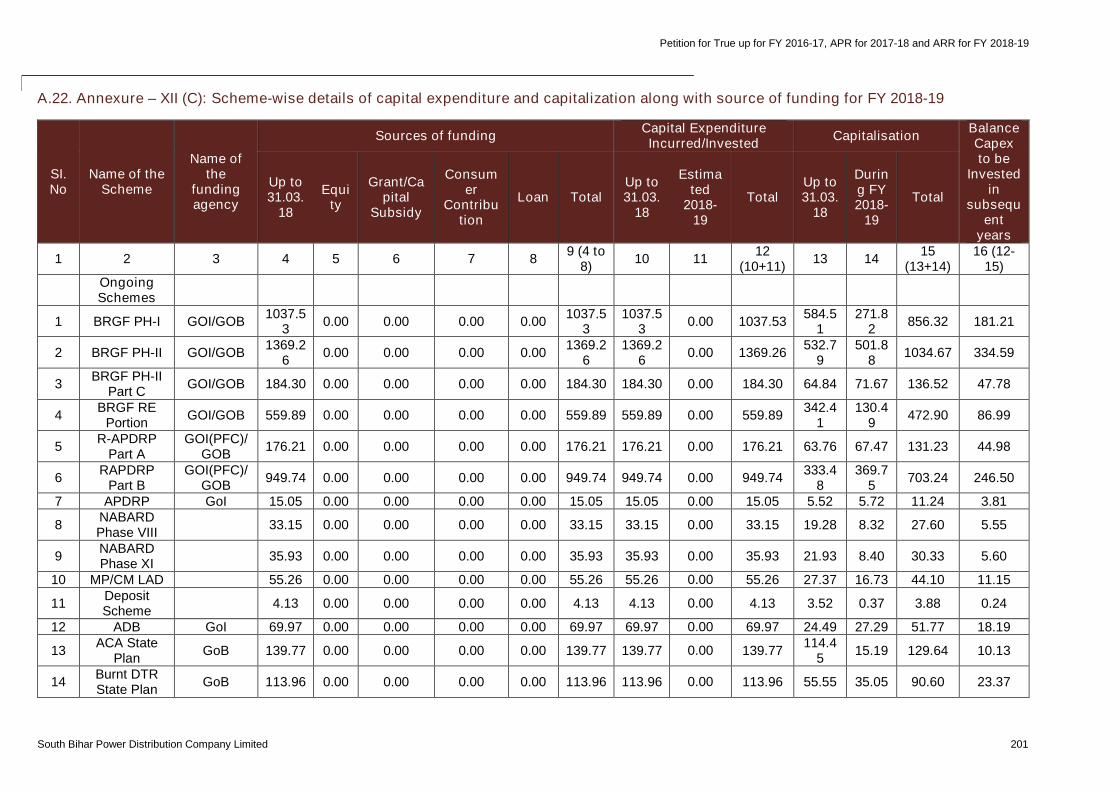
Petition for True up for FY 2016-17, APR for 2017-18 and ARR for FY 2018-19
South Bihar Power Distribution Company Limited 201
A.22. Annexure – XII (C): Scheme-wise details of capital expenditure and capitalization along with source of funding for FY 2018-19
SI.No
Name of theScheme
Name ofthe
fundingagency
Sources of fundingCapital ExpenditureIncurred/Invested
CapitalisationBalanceCapexto be
Investedin
subsequent
years
Up to31.03.
18
Equity
Grant/Capital
Subsidy
Consumer
Contribution
Loan TotalUp to31.03.
18
Estimated
2018-19
TotalUp to31.03.
18
During FY2018-
19
Total
1 2 3 4 5 6 7 89 (4 to
8)10 11
12(10+11)
13 1415
(13+14)16 (12-
15)OngoingSchemes
1 BRGF PH-I GOI/GOB1037.5
30.00 0.00 0.00 0.00
1037.53
1037.53
0.00 1037.53584.5
1271.8
2856.32 181.21
2 BRGF PH-II GOI/GOB1369.2
60.00 0.00 0.00 0.00
1369.26
1369.26
0.00 1369.26532.7
9501.8
81034.67 334.59
3BRGF PH-II
Part CGOI/GOB 184.30 0.00 0.00 0.00 0.00 184.30 184.30 0.00 184.30 64.84 71.67 136.52 47.78
4BRGF RE
PortionGOI/GOB 559.89 0.00 0.00 0.00 0.00 559.89 559.89 0.00 559.89
342.41
130.49
472.90 86.99
5R-APDRP
Part AGOI(PFC)/
GOB176.21 0.00 0.00 0.00 0.00 176.21 176.21 0.00 176.21 63.76 67.47 131.23 44.98
6RAPDRP
Part BGOI(PFC)/
GOB949.74 0.00 0.00 0.00 0.00 949.74 949.74 0.00 949.74
333.48
369.75
703.24 246.50
7 APDRP GoI 15.05 0.00 0.00 0.00 0.00 15.05 15.05 0.00 15.05 5.52 5.72 11.24 3.81
8NABARDPhase VIII
33.15 0.00 0.00 0.00 0.00 33.15 33.15 0.00 33.15 19.28 8.32 27.60 5.55
9NABARDPhase XI
35.93 0.00 0.00 0.00 0.00 35.93 35.93 0.00 35.93 21.93 8.40 30.33 5.60
10 MP/CM LAD 55.26 0.00 0.00 0.00 0.00 55.26 55.26 0.00 55.26 27.37 16.73 44.10 11.15
11DepositScheme
4.13 0.00 0.00 0.00 0.00 4.13 4.13 0.00 4.13 3.52 0.37 3.88 0.24
12 ADB GoI 69.97 0.00 0.00 0.00 0.00 69.97 69.97 0.00 69.97 24.49 27.29 51.77 18.19
13ACA State
PlanGoB 139.77 0.00 0.00 0.00 0.00 139.77 139.77 0.00 139.77
114.45
15.19 129.64 10.13
14Burnt DTRState Plan
GoB 113.96 0.00 0.00 0.00 0.00 113.96 113.96 0.00 113.96 55.55 35.05 90.60 23.37
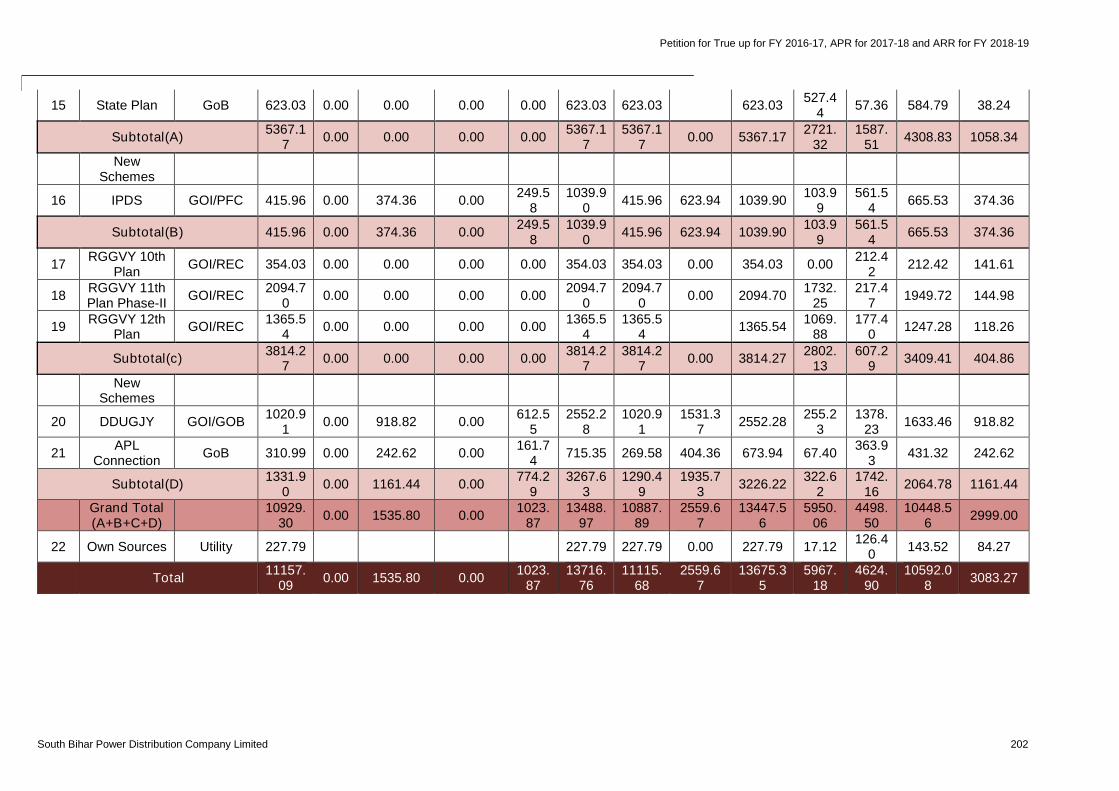
Petition for True up for FY 2016-17, APR for 2017-18 and ARR for FY 2018-19
South Bihar Power Distribution Company Limited 202
15 State Plan GoB 623.03 0.00 0.00 0.00 0.00 623.03 623.03 623.03527.4
457.36 584.79 38.24
Subtotal(A)5367.1
70.00 0.00 0.00 0.00
5367.17
5367.17
0.00 5367.172721.
321587.
514308.83 1058.34
NewSchemes
16 IPDS GOI/PFC 415.96 0.00 374.36 0.00249.5
81039.9
0415.96 623.94 1039.90
103.99
561.54
665.53 374.36
Subtotal(B) 415.96 0.00 374.36 0.00249.5
81039.9
0415.96 623.94 1039.90
103.99
561.54
665.53 374.36
17RGGVY 10th
PlanGOI/REC 354.03 0.00 0.00 0.00 0.00 354.03 354.03 0.00 354.03 0.00
212.42
212.42 141.61
18RGGVY 11thPlan Phase-II
GOI/REC2094.7
00.00 0.00 0.00 0.00
2094.70
2094.70
0.00 2094.701732.
25217.4
71949.72 144.98
19RGGVY 12th
PlanGOI/REC
1365.54
0.00 0.00 0.00 0.001365.5
41365.5
41365.54
1069.88
177.40
1247.28 118.26
Subtotal(c)3814.2
70.00 0.00 0.00 0.00
3814.27
3814.27
0.00 3814.272802.
13607.2
93409.41 404.86
NewSchemes
20 DDUGJY GOI/GOB1020.9
10.00 918.82 0.00
612.55
2552.28
1020.91
1531.37
2552.28255.2
31378.
231633.46 918.82
21APL
ConnectionGoB 310.99 0.00 242.62 0.00
161.74
715.35 269.58 404.36 673.94 67.40363.9
3431.32 242.62
Subtotal(D)1331.9
00.00 1161.44 0.00
774.29
3267.63
1290.49
1935.73
3226.22322.6
21742.
162064.78 1161.44
Grand Total(A+B+C+D)
10929.30
0.00 1535.80 0.001023.
8713488.
9710887.
892559.6
713447.5
65950.
064498.
5010448.5
62999.00
22 Own Sources Utility 227.79 227.79 227.79 0.00 227.79 17.12126.4
0143.52 84.27
Total11157.
090.00 1535.80 0.00
1023.87
13716.76
11115.68
2559.67
13675.35
5967.18
4624.90
10592.08
3083.27
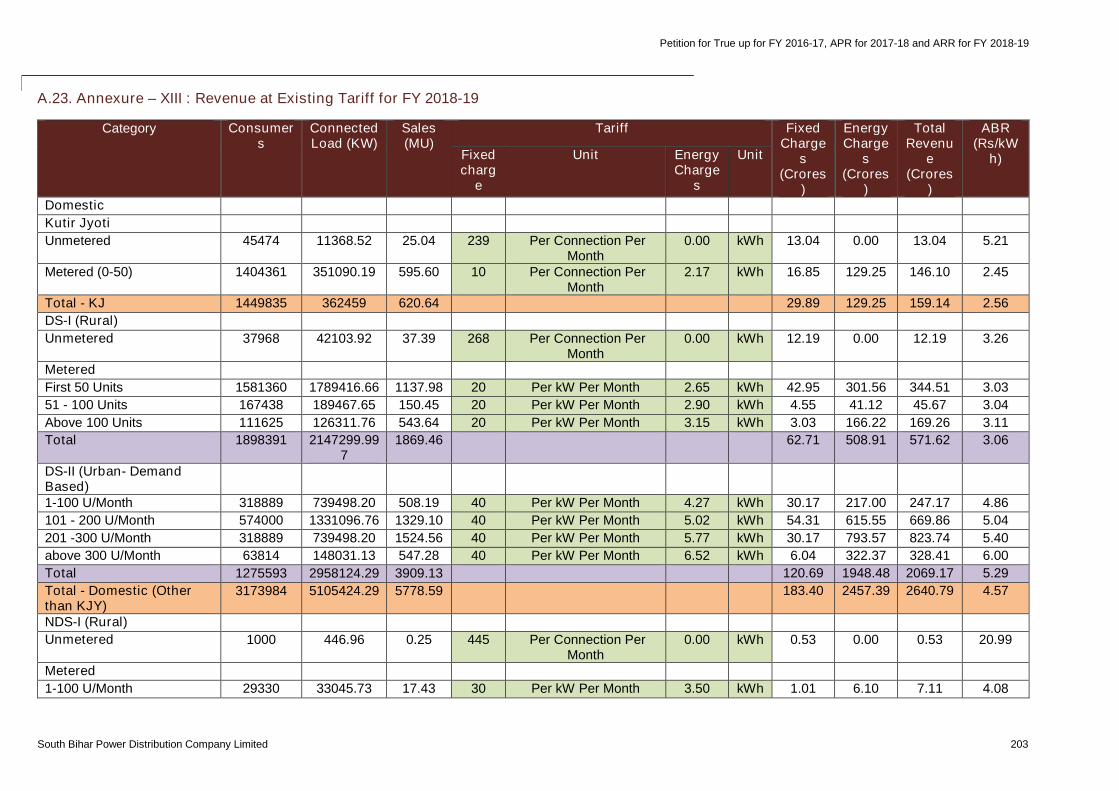
Petition for True up for FY 2016-17, APR for 2017-18 and ARR for FY 2018-19
South Bihar Power Distribution Company Limited 203
A.23. Annexure – XIII : Revenue at Existing Tariff for FY 2018-19
Category Consumers
ConnectedLoad (KW)
Sales(MU)
Tariff FixedCharge
s(Crores
)
EnergyCharge
s(Crores
)
TotalRevenu
e(Crores
)
ABR(Rs/kW
h)Fixedcharg
e
Unit EnergyCharge
s
Unit
Domestic
Kutir Jyoti
Unmetered 45474 11368.52 25.04 239 Per Connection PerMonth
0.00 kWh 13.04 0.00 13.04 5.21
Metered (0-50) 1404361 351090.19 595.60 10 Per Connection PerMonth
2.17 kWh 16.85 129.25 146.10 2.45
Total - KJ 1449835 362459 620.64 29.89 129.25 159.14 2.56
DS-I (Rural)
Unmetered 37968 42103.92 37.39 268 Per Connection PerMonth
0.00 kWh 12.19 0.00 12.19 3.26
Metered
First 50 Units 1581360 1789416.66 1137.98 20 Per kW Per Month 2.65 kWh 42.95 301.56 344.51 3.03
51 - 100 Units 167438 189467.65 150.45 20 Per kW Per Month 2.90 kWh 4.55 41.12 45.67 3.04
Above 100 Units 111625 126311.76 543.64 20 Per kW Per Month 3.15 kWh 3.03 166.22 169.26 3.11
Total 1898391 2147299.997
1869.46 62.71 508.91 571.62 3.06
DS-II (Urban- DemandBased)1-100 U/Month 318889 739498.20 508.19 40 Per kW Per Month 4.27 kWh 30.17 217.00 247.17 4.86
101 - 200 U/Month 574000 1331096.76 1329.10 40 Per kW Per Month 5.02 kWh 54.31 615.55 669.86 5.04
201 -300 U/Month 318889 739498.20 1524.56 40 Per kW Per Month 5.77 kWh 30.17 793.57 823.74 5.40
above 300 U/Month 63814 148031.13 547.28 40 Per kW Per Month 6.52 kWh 6.04 322.37 328.41 6.00
Total 1275593 2958124.29 3909.13 120.69 1948.48 2069.17 5.29
Total - Domestic (Otherthan KJY)
3173984 5105424.29 5778.59 183.40 2457.39 2640.79 4.57
NDS-I (Rural)
Unmetered 1000 446.96 0.25 445 Per Connection PerMonth
0.00 kWh 0.53 0.00 0.53 20.99
Metered
1-100 U/Month 29330 33045.73 17.43 30 Per kW Per Month 3.50 kWh 1.01 6.10 7.11 4.08
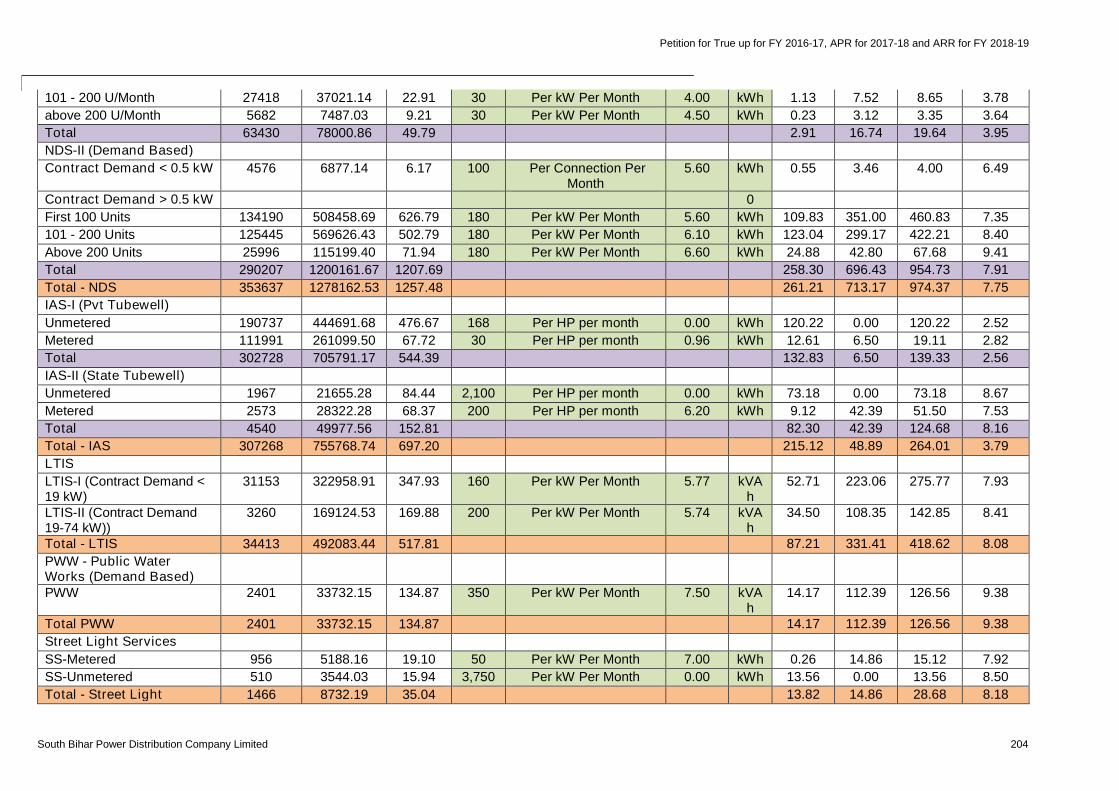
Petition for True up for FY 2016-17, APR for 2017-18 and ARR for FY 2018-19
South Bihar Power Distribution Company Limited 204
101 - 200 U/Month 27418 37021.14 22.91 30 Per kW Per Month 4.00 kWh 1.13 7.52 8.65 3.78
above 200 U/Month 5682 7487.03 9.21 30 Per kW Per Month 4.50 kWh 0.23 3.12 3.35 3.64
Total 63430 78000.86 49.79 2.91 16.74 19.64 3.95
NDS-II (Demand Based)
Contract Demand < 0.5 kW 4576 6877.14 6.17 100 Per Connection PerMonth
5.60 kWh 0.55 3.46 4.00 6.49
Contract Demand > 0.5 kW 0
First 100 Units 134190 508458.69 626.79 180 Per kW Per Month 5.60 kWh 109.83 351.00 460.83 7.35
101 - 200 Units 125445 569626.43 502.79 180 Per kW Per Month 6.10 kWh 123.04 299.17 422.21 8.40
Above 200 Units 25996 115199.40 71.94 180 Per kW Per Month 6.60 kWh 24.88 42.80 67.68 9.41
Total 290207 1200161.67 1207.69 258.30 696.43 954.73 7.91
Total - NDS 353637 1278162.53 1257.48 261.21 713.17 974.37 7.75
IAS-I (Pvt Tubewell)
Unmetered 190737 444691.68 476.67 168 Per HP per month 0.00 kWh 120.22 0.00 120.22 2.52
Metered 111991 261099.50 67.72 30 Per HP per month 0.96 kWh 12.61 6.50 19.11 2.82
Total 302728 705791.17 544.39 132.83 6.50 139.33 2.56
IAS-II (State Tubewell)
Unmetered 1967 21655.28 84.44 2,100 Per HP per month 0.00 kWh 73.18 0.00 73.18 8.67
Metered 2573 28322.28 68.37 200 Per HP per month 6.20 kWh 9.12 42.39 51.50 7.53
Total 4540 49977.56 152.81 82.30 42.39 124.68 8.16
Total - IAS 307268 755768.74 697.20 215.12 48.89 264.01 3.79
LTIS
LTIS-I (Contract Demand <19 kW)
31153 322958.91 347.93 160 Per kW Per Month 5.77 kVAh
52.71 223.06 275.77 7.93
LTIS-II (Contract Demand19-74 kW))
3260 169124.53 169.88 200 Per kW Per Month 5.74 kVAh
34.50 108.35 142.85 8.41
Total - LTIS 34413 492083.44 517.81 87.21 331.41 418.62 8.08
PWW - Public WaterWorks (Demand Based)PWW 2401 33732.15 134.87 350 Per kW Per Month 7.50 kVA
h14.17 112.39 126.56 9.38
Total PWW 2401 33732.15 134.87 14.17 112.39 126.56 9.38
Street Light Services
SS-Metered 956 5188.16 19.10 50 Per kW Per Month 7.00 kWh 0.26 14.86 15.12 7.92
SS-Unmetered 510 3544.03 15.94 3,750 Per kW Per Month 0.00 kWh 13.56 0.00 13.56 8.50
Total - Street Light 1466 8732.19 35.04 13.82 14.86 28.68 8.18
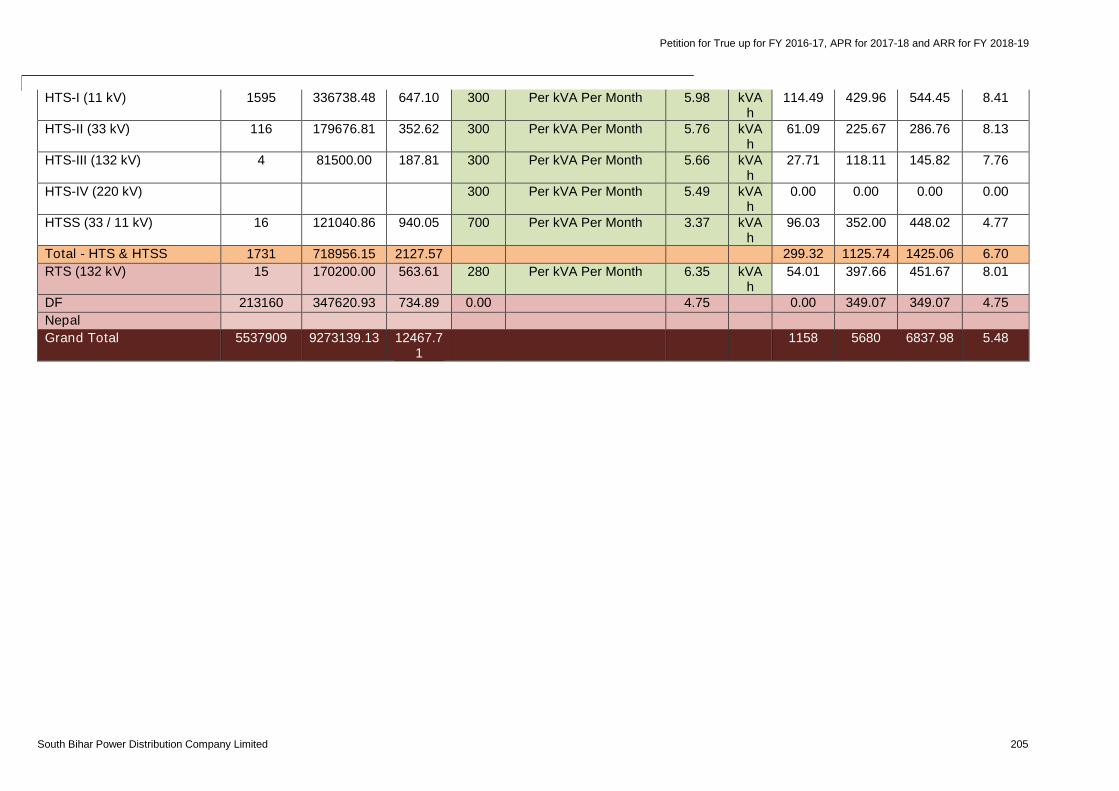
Petition for True up for FY 2016-17, APR for 2017-18 and ARR for FY 2018-19
South Bihar Power Distribution Company Limited 205
HTS-I (11 kV) 1595 336738.48 647.10 300 Per kVA Per Month 5.98 kVAh
114.49 429.96 544.45 8.41
HTS-II (33 kV) 116 179676.81 352.62 300 Per kVA Per Month 5.76 kVAh
61.09 225.67 286.76 8.13
HTS-III (132 kV) 4 81500.00 187.81 300 Per kVA Per Month 5.66 kVAh
27.71 118.11 145.82 7.76
HTS-IV (220 kV) 300 Per kVA Per Month 5.49 kVAh
0.00 0.00 0.00 0.00
HTSS (33 / 11 kV) 16 121040.86 940.05 700 Per kVA Per Month 3.37 kVAh
96.03 352.00 448.02 4.77
Total - HTS & HTSS 1731 718956.15 2127.57 299.32 1125.74 1425.06 6.70
RTS (132 kV) 15 170200.00 563.61 280 Per kVA Per Month 6.35 kVAh
54.01 397.66 451.67 8.01
DF 213160 347620.93 734.89 0.00 4.75 0.00 349.07 349.07 4.75
Nepal
Grand Total 5537909 9273139.13 12467.71
1158 5680 6837.98 5.48
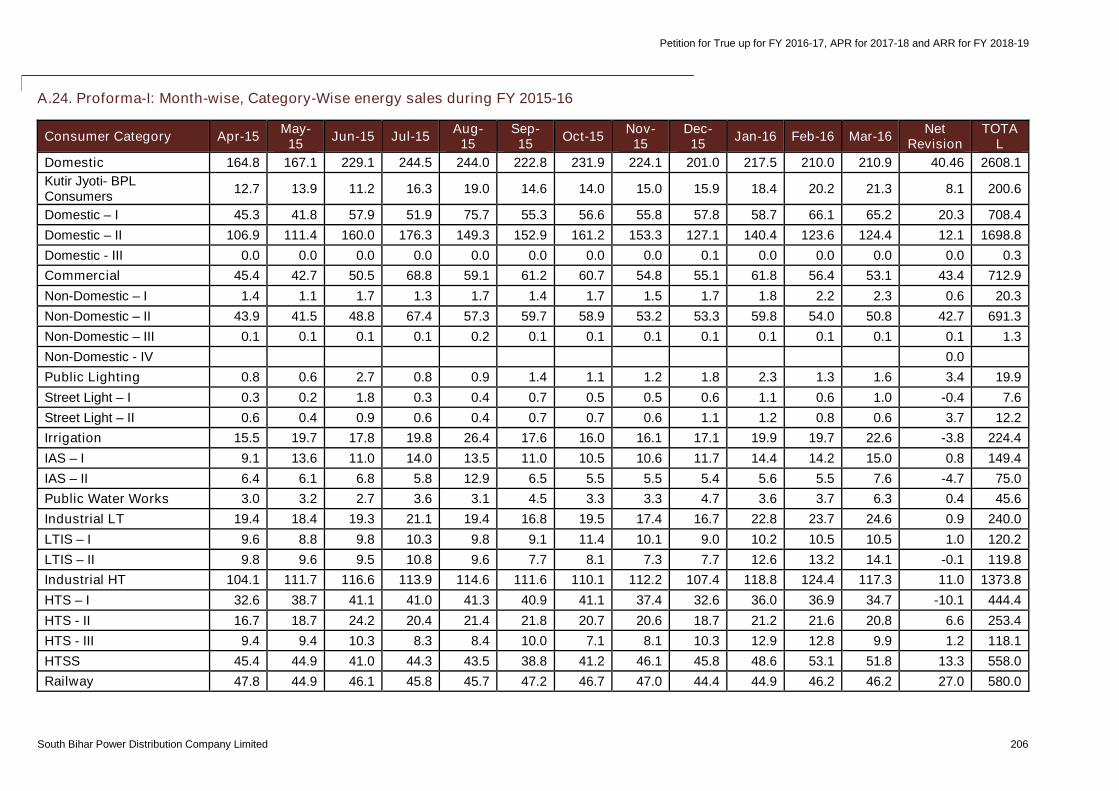
Petition for True up for FY 2016-17, APR for 2017-18 and ARR for FY 2018-19
South Bihar Power Distribution Company Limited 206
A.24. Proforma-I: Month-wise, Category-Wise energy sales during FY 2015-16
Consumer Category Apr-15May-
15Jun-15 Jul-15
Aug-15
Sep-15
Oct-15Nov-15
Dec-15
Jan-16 Feb-16 Mar-16Net
RevisionTOTA
L
Domestic 164.8 167.1 229.1 244.5 244.0 222.8 231.9 224.1 201.0 217.5 210.0 210.9 40.46 2608.1
Kutir Jyoti- BPLConsumers
12.7 13.9 11.2 16.3 19.0 14.6 14.0 15.0 15.9 18.4 20.2 21.3 8.1 200.6
Domestic – I 45.3 41.8 57.9 51.9 75.7 55.3 56.6 55.8 57.8 58.7 66.1 65.2 20.3 708.4
Domestic – II 106.9 111.4 160.0 176.3 149.3 152.9 161.2 153.3 127.1 140.4 123.6 124.4 12.1 1698.8
Domestic - III 0.0 0.0 0.0 0.0 0.0 0.0 0.0 0.0 0.1 0.0 0.0 0.0 0.0 0.3
Commercial 45.4 42.7 50.5 68.8 59.1 61.2 60.7 54.8 55.1 61.8 56.4 53.1 43.4 712.9
Non-Domestic – I 1.4 1.1 1.7 1.3 1.7 1.4 1.7 1.5 1.7 1.8 2.2 2.3 0.6 20.3
Non-Domestic – II 43.9 41.5 48.8 67.4 57.3 59.7 58.9 53.2 53.3 59.8 54.0 50.8 42.7 691.3
Non-Domestic – III 0.1 0.1 0.1 0.1 0.2 0.1 0.1 0.1 0.1 0.1 0.1 0.1 0.1 1.3
Non-Domestic - IV 0.0
Public Lighting 0.8 0.6 2.7 0.8 0.9 1.4 1.1 1.2 1.8 2.3 1.3 1.6 3.4 19.9
Street Light – I 0.3 0.2 1.8 0.3 0.4 0.7 0.5 0.5 0.6 1.1 0.6 1.0 -0.4 7.6
Street Light – II 0.6 0.4 0.9 0.6 0.4 0.7 0.7 0.6 1.1 1.2 0.8 0.6 3.7 12.2
Irrigation 15.5 19.7 17.8 19.8 26.4 17.6 16.0 16.1 17.1 19.9 19.7 22.6 -3.8 224.4
IAS – I 9.1 13.6 11.0 14.0 13.5 11.0 10.5 10.6 11.7 14.4 14.2 15.0 0.8 149.4
IAS – II 6.4 6.1 6.8 5.8 12.9 6.5 5.5 5.5 5.4 5.6 5.5 7.6 -4.7 75.0
Public Water Works 3.0 3.2 2.7 3.6 3.1 4.5 3.3 3.3 4.7 3.6 3.7 6.3 0.4 45.6
Industrial LT 19.4 18.4 19.3 21.1 19.4 16.8 19.5 17.4 16.7 22.8 23.7 24.6 0.9 240.0
LTIS – I 9.6 8.8 9.8 10.3 9.8 9.1 11.4 10.1 9.0 10.2 10.5 10.5 1.0 120.2
LTIS – II 9.8 9.6 9.5 10.8 9.6 7.7 8.1 7.3 7.7 12.6 13.2 14.1 -0.1 119.8
Industrial HT 104.1 111.7 116.6 113.9 114.6 111.6 110.1 112.2 107.4 118.8 124.4 117.3 11.0 1373.8
HTS – I 32.6 38.7 41.1 41.0 41.3 40.9 41.1 37.4 32.6 36.0 36.9 34.7 -10.1 444.4
HTS - II 16.7 18.7 24.2 20.4 21.4 21.8 20.7 20.6 18.7 21.2 21.6 20.8 6.6 253.4
HTS - III 9.4 9.4 10.3 8.3 8.4 10.0 7.1 8.1 10.3 12.9 12.8 9.9 1.2 118.1
HTSS 45.4 44.9 41.0 44.3 43.5 38.8 41.2 46.1 45.8 48.6 53.1 51.8 13.3 558.0
Railway 47.8 44.9 46.1 45.8 45.7 47.2 46.7 47.0 44.4 44.9 46.2 46.2 27.0 580.0

Petition for True up for FY 2016-17, APR for 2017-18 and ARR for FY 2018-19
South Bihar Power Distribution Company Limited 207
Nepal 0.0 0.0 0.0 0.0 0.0 0.0 0.0 0.0 0.0 0.0 0.0 0.0 0.0 0.0
UI 0.0 0.0 0.0 0.0 0.0 0.0 0.0 0.0 0.0 0.0 0.0 0.0 114.7 114.7
DF 0.0 0.0 0.0 0.0 0.0 0.0 0.0 0.0 0.0 0.0 0.0 0.0 1278.0 1278.0
Total 400.8 408.4 484.8 518.5 513.2 483.0 489.3 476.0 448.2 491.7 485.3 482.6 1515.5 7197.3
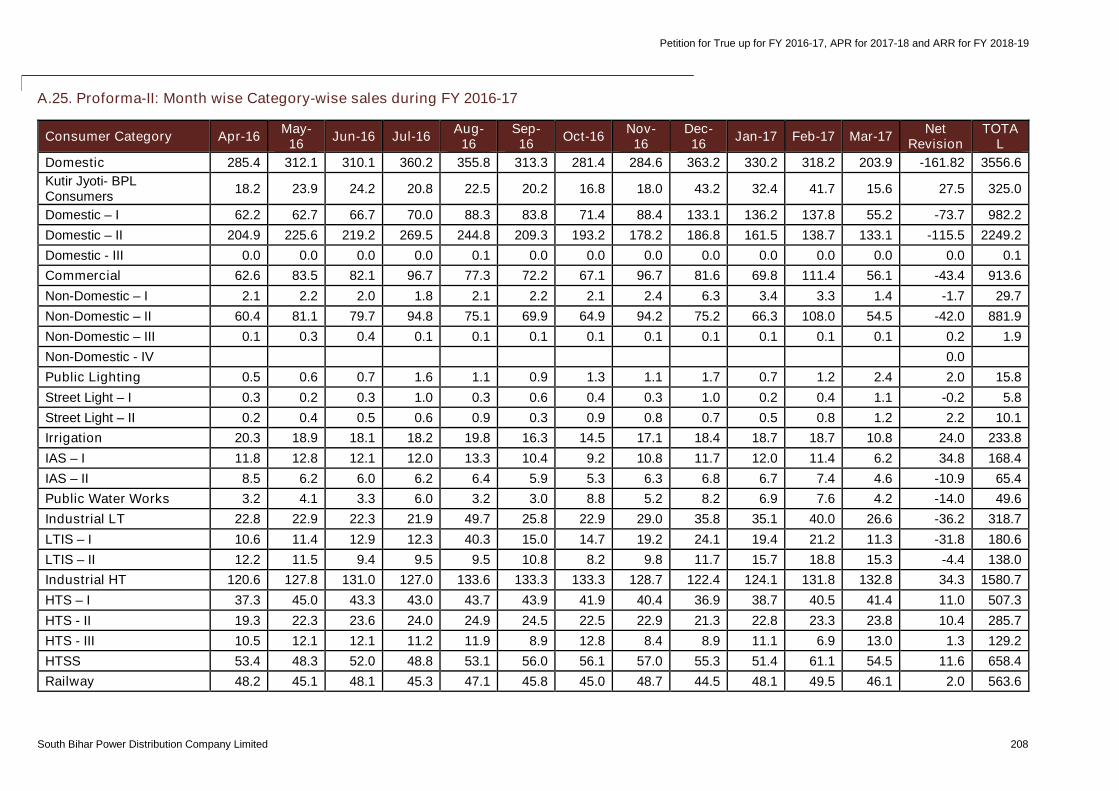
Petition for True up for FY 2016-17, APR for 2017-18 and ARR for FY 2018-19
South Bihar Power Distribution Company Limited 208
A.25. Proforma-II: Month wise Category-wise sales during FY 2016-17
Consumer Category Apr-16May-
16Jun-16 Jul-16
Aug-16
Sep-16
Oct-16Nov-16
Dec-16
Jan-17 Feb-17 Mar-17Net
RevisionTOTA
L
Domestic 285.4 312.1 310.1 360.2 355.8 313.3 281.4 284.6 363.2 330.2 318.2 203.9 -161.82 3556.6
Kutir Jyoti- BPLConsumers
18.2 23.9 24.2 20.8 22.5 20.2 16.8 18.0 43.2 32.4 41.7 15.6 27.5 325.0
Domestic – I 62.2 62.7 66.7 70.0 88.3 83.8 71.4 88.4 133.1 136.2 137.8 55.2 -73.7 982.2
Domestic – II 204.9 225.6 219.2 269.5 244.8 209.3 193.2 178.2 186.8 161.5 138.7 133.1 -115.5 2249.2
Domestic - III 0.0 0.0 0.0 0.0 0.1 0.0 0.0 0.0 0.0 0.0 0.0 0.0 0.0 0.1
Commercial 62.6 83.5 82.1 96.7 77.3 72.2 67.1 96.7 81.6 69.8 111.4 56.1 -43.4 913.6
Non-Domestic – I 2.1 2.2 2.0 1.8 2.1 2.2 2.1 2.4 6.3 3.4 3.3 1.4 -1.7 29.7
Non-Domestic – II 60.4 81.1 79.7 94.8 75.1 69.9 64.9 94.2 75.2 66.3 108.0 54.5 -42.0 881.9
Non-Domestic – III 0.1 0.3 0.4 0.1 0.1 0.1 0.1 0.1 0.1 0.1 0.1 0.1 0.2 1.9
Non-Domestic - IV 0.0
Public Lighting 0.5 0.6 0.7 1.6 1.1 0.9 1.3 1.1 1.7 0.7 1.2 2.4 2.0 15.8
Street Light – I 0.3 0.2 0.3 1.0 0.3 0.6 0.4 0.3 1.0 0.2 0.4 1.1 -0.2 5.8
Street Light – II 0.2 0.4 0.5 0.6 0.9 0.3 0.9 0.8 0.7 0.5 0.8 1.2 2.2 10.1
Irrigation 20.3 18.9 18.1 18.2 19.8 16.3 14.5 17.1 18.4 18.7 18.7 10.8 24.0 233.8
IAS – I 11.8 12.8 12.1 12.0 13.3 10.4 9.2 10.8 11.7 12.0 11.4 6.2 34.8 168.4
IAS – II 8.5 6.2 6.0 6.2 6.4 5.9 5.3 6.3 6.8 6.7 7.4 4.6 -10.9 65.4
Public Water Works 3.2 4.1 3.3 6.0 3.2 3.0 8.8 5.2 8.2 6.9 7.6 4.2 -14.0 49.6
Industrial LT 22.8 22.9 22.3 21.9 49.7 25.8 22.9 29.0 35.8 35.1 40.0 26.6 -36.2 318.7
LTIS – I 10.6 11.4 12.9 12.3 40.3 15.0 14.7 19.2 24.1 19.4 21.2 11.3 -31.8 180.6
LTIS – II 12.2 11.5 9.4 9.5 9.5 10.8 8.2 9.8 11.7 15.7 18.8 15.3 -4.4 138.0
Industrial HT 120.6 127.8 131.0 127.0 133.6 133.3 133.3 128.7 122.4 124.1 131.8 132.8 34.3 1580.7
HTS – I 37.3 45.0 43.3 43.0 43.7 43.9 41.9 40.4 36.9 38.7 40.5 41.4 11.0 507.3
HTS - II 19.3 22.3 23.6 24.0 24.9 24.5 22.5 22.9 21.3 22.8 23.3 23.8 10.4 285.7
HTS - III 10.5 12.1 12.1 11.2 11.9 8.9 12.8 8.4 8.9 11.1 6.9 13.0 1.3 129.2
HTSS 53.4 48.3 52.0 48.8 53.1 56.0 56.1 57.0 55.3 51.4 61.1 54.5 11.6 658.4
Railway 48.2 45.1 48.1 45.3 47.1 45.8 45.0 48.7 44.5 48.1 49.5 46.1 2.0 563.6
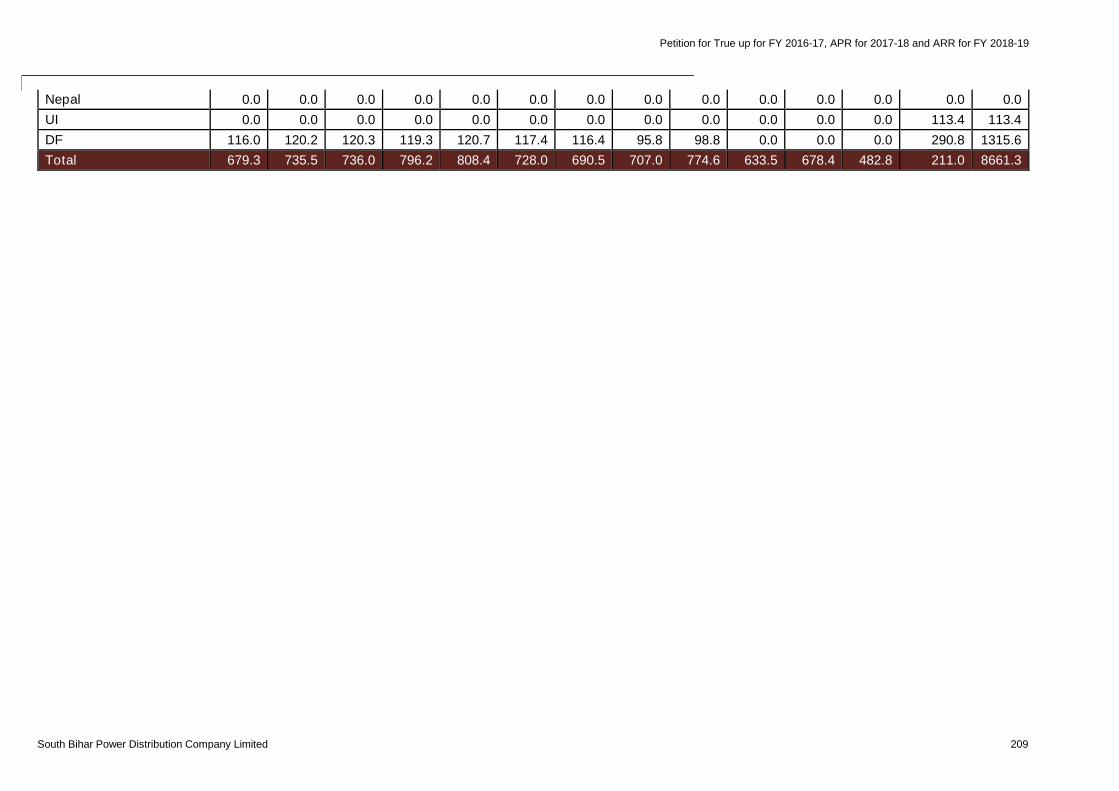
Petition for True up for FY 2016-17, APR for 2017-18 and ARR for FY 2018-19
South Bihar Power Distribution Company Limited 209
Nepal 0.0 0.0 0.0 0.0 0.0 0.0 0.0 0.0 0.0 0.0 0.0 0.0 0.0 0.0
UI 0.0 0.0 0.0 0.0 0.0 0.0 0.0 0.0 0.0 0.0 0.0 0.0 113.4 113.4
DF 116.0 120.2 120.3 119.3 120.7 117.4 116.4 95.8 98.8 0.0 0.0 0.0 290.8 1315.6
Total 679.3 735.5 736.0 796.2 808.4 728.0 690.5 707.0 774.6 633.5 678.4 482.8 211.0 8661.3
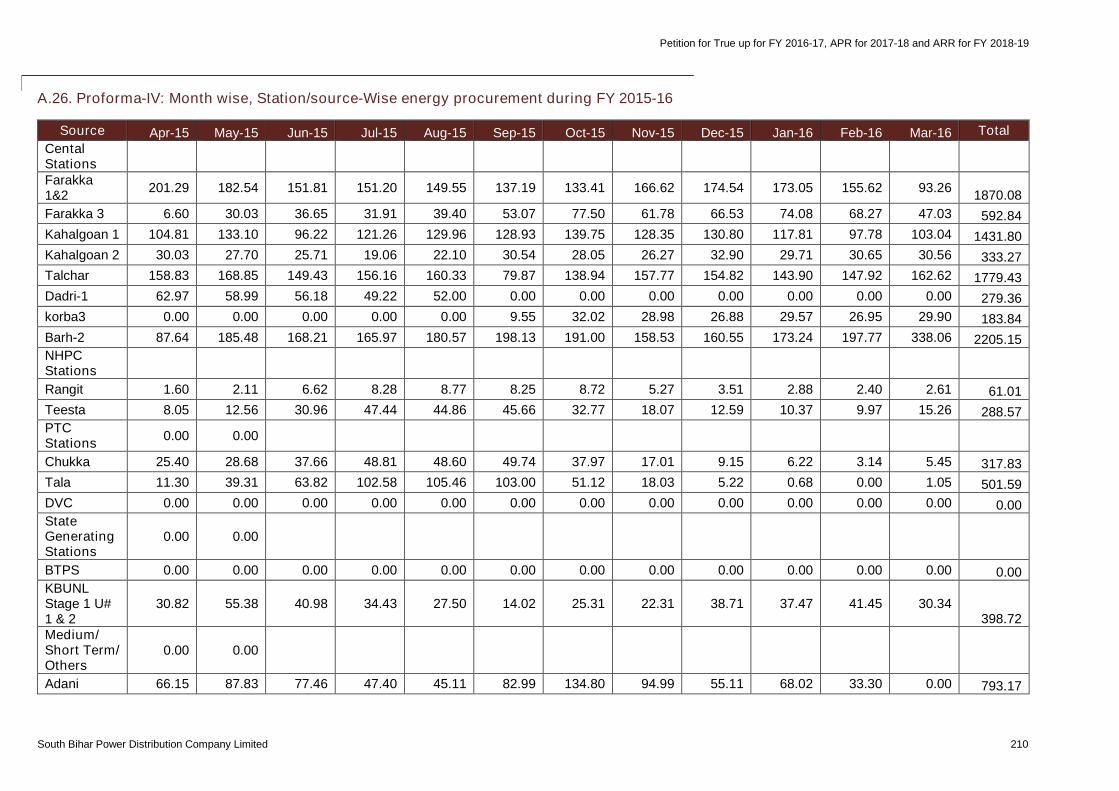
Petition for True up for FY 2016-17, APR for 2017-18 and ARR for FY 2018-19
South Bihar Power Distribution Company Limited 210
A.26. Proforma-IV: Month wise, Station/source-Wise energy procurement during FY 2015-16
Source Apr-15 May-15 Jun-15 Jul-15 Aug-15 Sep-15 Oct-15 Nov-15 Dec-15 Jan-16 Feb-16 Mar-16 Total
CentalStationsFarakka1&2
201.29 182.54 151.81 151.20 149.55 137.19 133.41 166.62 174.54 173.05 155.62 93.261870.08
Farakka 3 6.60 30.03 36.65 31.91 39.40 53.07 77.50 61.78 66.53 74.08 68.27 47.03 592.84
Kahalgoan 1 104.81 133.10 96.22 121.26 129.96 128.93 139.75 128.35 130.80 117.81 97.78 103.04 1431.80
Kahalgoan 2 30.03 27.70 25.71 19.06 22.10 30.54 28.05 26.27 32.90 29.71 30.65 30.56 333.27
Talchar 158.83 168.85 149.43 156.16 160.33 79.87 138.94 157.77 154.82 143.90 147.92 162.62 1779.43
Dadri-1 62.97 58.99 56.18 49.22 52.00 0.00 0.00 0.00 0.00 0.00 0.00 0.00 279.36
korba3 0.00 0.00 0.00 0.00 0.00 9.55 32.02 28.98 26.88 29.57 26.95 29.90 183.84
Barh-2 87.64 185.48 168.21 165.97 180.57 198.13 191.00 158.53 160.55 173.24 197.77 338.06 2205.15NHPCStations
Rangit 1.60 2.11 6.62 8.28 8.77 8.25 8.72 5.27 3.51 2.88 2.40 2.61 61.01
Teesta 8.05 12.56 30.96 47.44 44.86 45.66 32.77 18.07 12.59 10.37 9.97 15.26 288.57PTCStations
0.00 0.00
Chukka 25.40 28.68 37.66 48.81 48.60 49.74 37.97 17.01 9.15 6.22 3.14 5.45 317.83
Tala 11.30 39.31 63.82 102.58 105.46 103.00 51.12 18.03 5.22 0.68 0.00 1.05 501.59
DVC 0.00 0.00 0.00 0.00 0.00 0.00 0.00 0.00 0.00 0.00 0.00 0.00 0.00StateGeneratingStations
0.00 0.00
BTPS 0.00 0.00 0.00 0.00 0.00 0.00 0.00 0.00 0.00 0.00 0.00 0.00 0.00KBUNLStage 1 U#1 & 2
30.82 55.38 40.98 34.43 27.50 14.02 25.31 22.31 38.71 37.47 41.45 30.34398.72
Medium/Short Term/Others
0.00 0.00
Adani 66.15 87.83 77.46 47.40 45.11 82.99 134.80 94.99 55.11 68.02 33.30 0.00 793.17
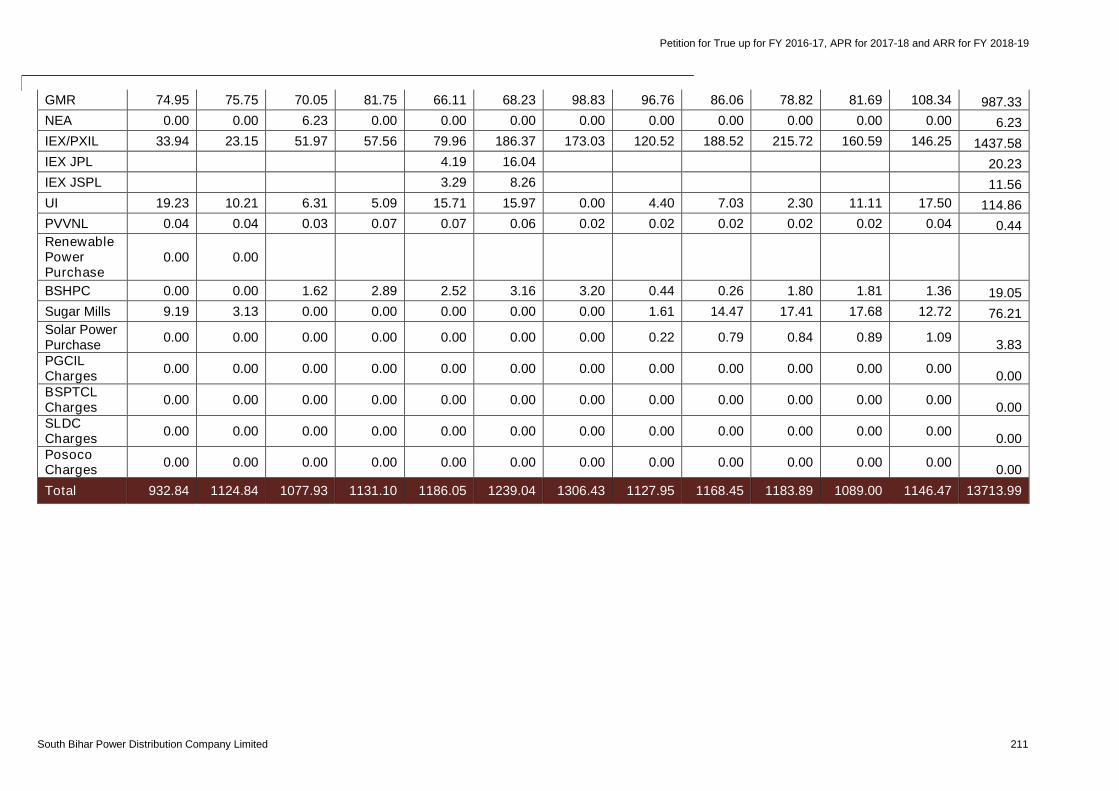
Petition for True up for FY 2016-17, APR for 2017-18 and ARR for FY 2018-19
South Bihar Power Distribution Company Limited 211
GMR 74.95 75.75 70.05 81.75 66.11 68.23 98.83 96.76 86.06 78.82 81.69 108.34 987.33
NEA 0.00 0.00 6.23 0.00 0.00 0.00 0.00 0.00 0.00 0.00 0.00 0.00 6.23
IEX/PXIL 33.94 23.15 51.97 57.56 79.96 186.37 173.03 120.52 188.52 215.72 160.59 146.25 1437.58
IEX JPL 4.19 16.04 20.23
IEX JSPL 3.29 8.26 11.56
UI 19.23 10.21 6.31 5.09 15.71 15.97 0.00 4.40 7.03 2.30 11.11 17.50 114.86
PVVNL 0.04 0.04 0.03 0.07 0.07 0.06 0.02 0.02 0.02 0.02 0.02 0.04 0.44RenewablePowerPurchase
0.00 0.00
BSHPC 0.00 0.00 1.62 2.89 2.52 3.16 3.20 0.44 0.26 1.80 1.81 1.36 19.05
Sugar Mills 9.19 3.13 0.00 0.00 0.00 0.00 0.00 1.61 14.47 17.41 17.68 12.72 76.21Solar PowerPurchase
0.00 0.00 0.00 0.00 0.00 0.00 0.00 0.22 0.79 0.84 0.89 1.093.83
PGCILCharges
0.00 0.00 0.00 0.00 0.00 0.00 0.00 0.00 0.00 0.00 0.00 0.000.00
BSPTCLCharges
0.00 0.00 0.00 0.00 0.00 0.00 0.00 0.00 0.00 0.00 0.00 0.000.00
SLDCCharges
0.00 0.00 0.00 0.00 0.00 0.00 0.00 0.00 0.00 0.00 0.00 0.000.00
PosocoCharges
0.00 0.00 0.00 0.00 0.00 0.00 0.00 0.00 0.00 0.00 0.00 0.000.00
Total 932.84 1124.84 1077.93 1131.10 1186.05 1239.04 1306.43 1127.95 1168.45 1183.89 1089.00 1146.47 13713.99
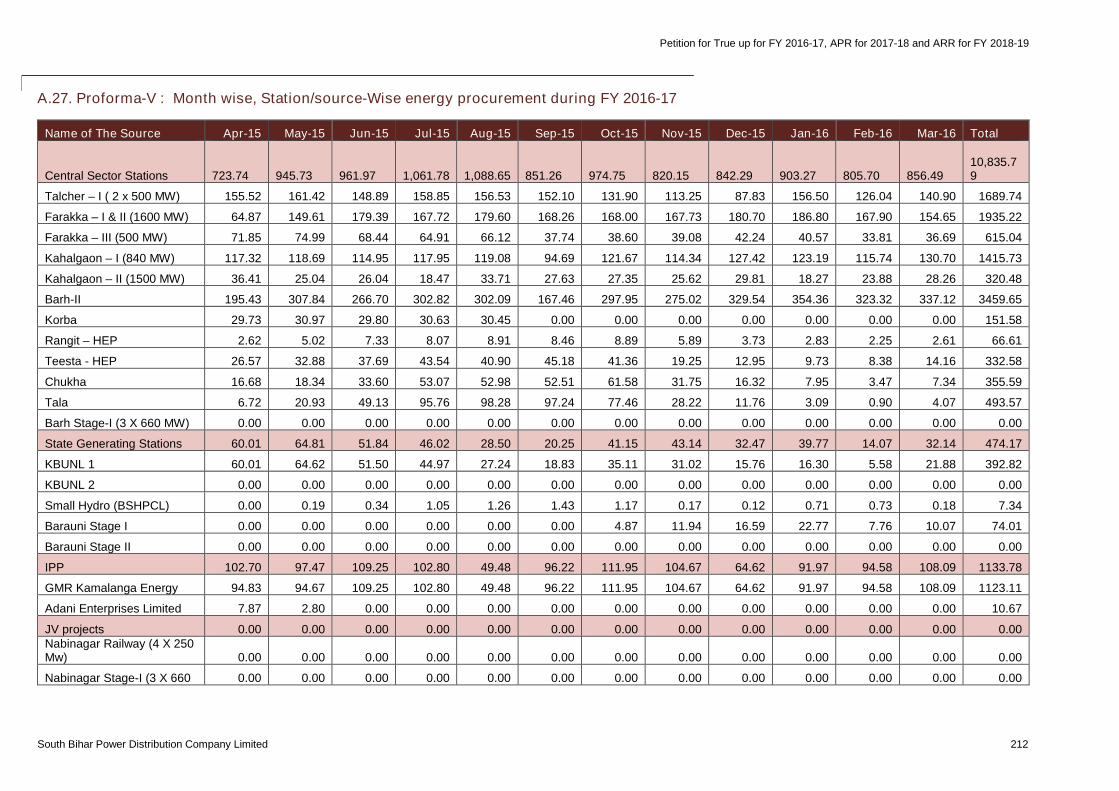
Petition for True up for FY 2016-17, APR for 2017-18 and ARR for FY 2018-19
South Bihar Power Distribution Company Limited 212
A.27. Proforma-V : Month wise, Station/source-Wise energy procurement during FY 2016-17
Name of The Source Apr-15 May-15 Jun-15 Jul-15 Aug-15 Sep-15 Oct-15 Nov-15 Dec-15 Jan-16 Feb-16 Mar-16 Total
Central Sector Stations 723.74 945.73 961.97 1,061.78 1,088.65 851.26 974.75 820.15 842.29 903.27 805.70 856.4910,835.79
Talcher – I ( 2 x 500 MW) 155.52 161.42 148.89 158.85 156.53 152.10 131.90 113.25 87.83 156.50 126.04 140.90 1689.74
Farakka – I & II (1600 MW) 64.87 149.61 179.39 167.72 179.60 168.26 168.00 167.73 180.70 186.80 167.90 154.65 1935.22
Farakka – III (500 MW) 71.85 74.99 68.44 64.91 66.12 37.74 38.60 39.08 42.24 40.57 33.81 36.69 615.04
Kahalgaon – I (840 MW) 117.32 118.69 114.95 117.95 119.08 94.69 121.67 114.34 127.42 123.19 115.74 130.70 1415.73
Kahalgaon – II (1500 MW) 36.41 25.04 26.04 18.47 33.71 27.63 27.35 25.62 29.81 18.27 23.88 28.26 320.48
Barh-II 195.43 307.84 266.70 302.82 302.09 167.46 297.95 275.02 329.54 354.36 323.32 337.12 3459.65
Korba 29.73 30.97 29.80 30.63 30.45 0.00 0.00 0.00 0.00 0.00 0.00 0.00 151.58
Rangit – HEP 2.62 5.02 7.33 8.07 8.91 8.46 8.89 5.89 3.73 2.83 2.25 2.61 66.61
Teesta - HEP 26.57 32.88 37.69 43.54 40.90 45.18 41.36 19.25 12.95 9.73 8.38 14.16 332.58
Chukha 16.68 18.34 33.60 53.07 52.98 52.51 61.58 31.75 16.32 7.95 3.47 7.34 355.59
Tala 6.72 20.93 49.13 95.76 98.28 97.24 77.46 28.22 11.76 3.09 0.90 4.07 493.57
Barh Stage-I (3 X 660 MW) 0.00 0.00 0.00 0.00 0.00 0.00 0.00 0.00 0.00 0.00 0.00 0.00 0.00
State Generating Stations 60.01 64.81 51.84 46.02 28.50 20.25 41.15 43.14 32.47 39.77 14.07 32.14 474.17
KBUNL 1 60.01 64.62 51.50 44.97 27.24 18.83 35.11 31.02 15.76 16.30 5.58 21.88 392.82
KBUNL 2 0.00 0.00 0.00 0.00 0.00 0.00 0.00 0.00 0.00 0.00 0.00 0.00 0.00
Small Hydro (BSHPCL) 0.00 0.19 0.34 1.05 1.26 1.43 1.17 0.17 0.12 0.71 0.73 0.18 7.34
Barauni Stage I 0.00 0.00 0.00 0.00 0.00 0.00 4.87 11.94 16.59 22.77 7.76 10.07 74.01
Barauni Stage II 0.00 0.00 0.00 0.00 0.00 0.00 0.00 0.00 0.00 0.00 0.00 0.00 0.00
IPP 102.70 97.47 109.25 102.80 49.48 96.22 111.95 104.67 64.62 91.97 94.58 108.09 1133.78
GMR Kamalanga Energy 94.83 94.67 109.25 102.80 49.48 96.22 111.95 104.67 64.62 91.97 94.58 108.09 1123.11
Adani Enterprises Limited 7.87 2.80 0.00 0.00 0.00 0.00 0.00 0.00 0.00 0.00 0.00 0.00 10.67
JV projects 0.00 0.00 0.00 0.00 0.00 0.00 0.00 0.00 0.00 0.00 0.00 0.00 0.00Nabinagar Railway (4 X 250Mw) 0.00 0.00 0.00 0.00 0.00 0.00 0.00 0.00 0.00 0.00 0.00 0.00 0.00
Nabinagar Stage-I (3 X 660 0.00 0.00 0.00 0.00 0.00 0.00 0.00 0.00 0.00 0.00 0.00 0.00 0.00
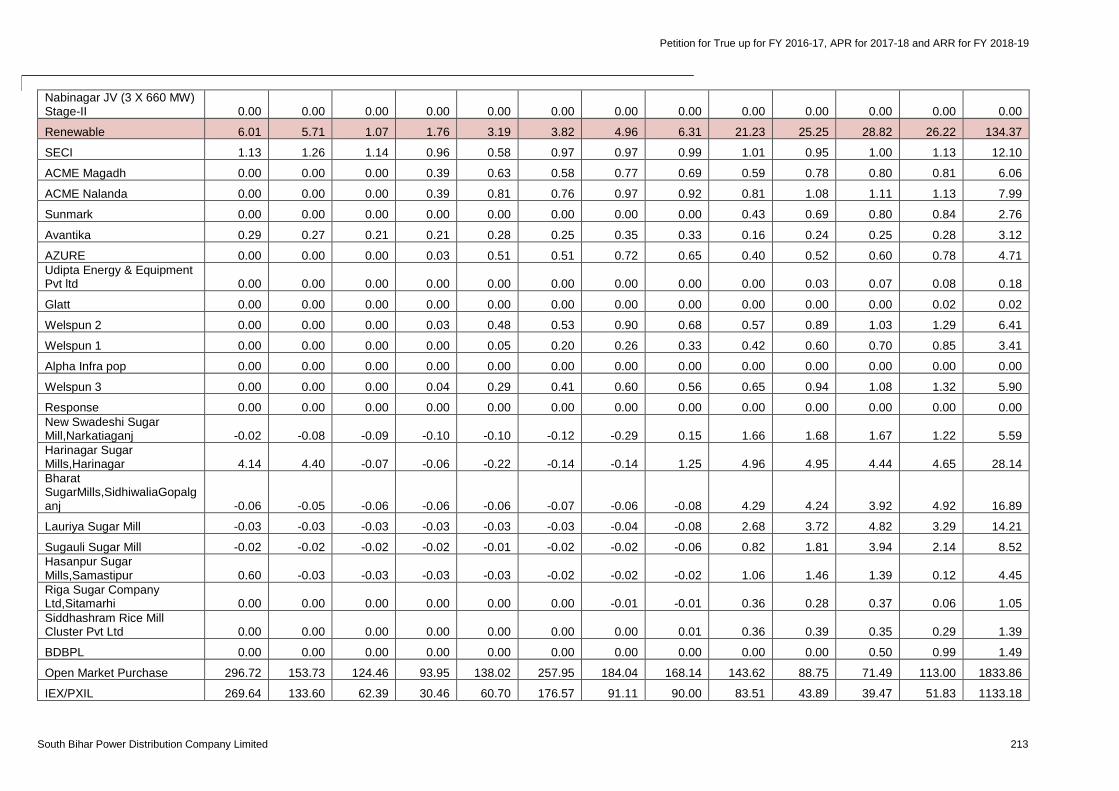
Petition for True up for FY 2016-17, APR for 2017-18 and ARR for FY 2018-19
South Bihar Power Distribution Company Limited 213
Nabinagar JV (3 X 660 MW)Stage-II 0.00 0.00 0.00 0.00 0.00 0.00 0.00 0.00 0.00 0.00 0.00 0.00 0.00
Renewable 6.01 5.71 1.07 1.76 3.19 3.82 4.96 6.31 21.23 25.25 28.82 26.22 134.37
SECI 1.13 1.26 1.14 0.96 0.58 0.97 0.97 0.99 1.01 0.95 1.00 1.13 12.10
ACME Magadh 0.00 0.00 0.00 0.39 0.63 0.58 0.77 0.69 0.59 0.78 0.80 0.81 6.06
ACME Nalanda 0.00 0.00 0.00 0.39 0.81 0.76 0.97 0.92 0.81 1.08 1.11 1.13 7.99
Sunmark 0.00 0.00 0.00 0.00 0.00 0.00 0.00 0.00 0.43 0.69 0.80 0.84 2.76
Avantika 0.29 0.27 0.21 0.21 0.28 0.25 0.35 0.33 0.16 0.24 0.25 0.28 3.12
AZURE 0.00 0.00 0.00 0.03 0.51 0.51 0.72 0.65 0.40 0.52 0.60 0.78 4.71Udipta Energy & EquipmentPvt ltd 0.00 0.00 0.00 0.00 0.00 0.00 0.00 0.00 0.00 0.03 0.07 0.08 0.18
Glatt 0.00 0.00 0.00 0.00 0.00 0.00 0.00 0.00 0.00 0.00 0.00 0.02 0.02
Welspun 2 0.00 0.00 0.00 0.03 0.48 0.53 0.90 0.68 0.57 0.89 1.03 1.29 6.41
Welspun 1 0.00 0.00 0.00 0.00 0.05 0.20 0.26 0.33 0.42 0.60 0.70 0.85 3.41
Alpha Infra pop 0.00 0.00 0.00 0.00 0.00 0.00 0.00 0.00 0.00 0.00 0.00 0.00 0.00
Welspun 3 0.00 0.00 0.00 0.04 0.29 0.41 0.60 0.56 0.65 0.94 1.08 1.32 5.90
Response 0.00 0.00 0.00 0.00 0.00 0.00 0.00 0.00 0.00 0.00 0.00 0.00 0.00New Swadeshi SugarMill,Narkatiaganj -0.02 -0.08 -0.09 -0.10 -0.10 -0.12 -0.29 0.15 1.66 1.68 1.67 1.22 5.59Harinagar SugarMills,Harinagar 4.14 4.40 -0.07 -0.06 -0.22 -0.14 -0.14 1.25 4.96 4.95 4.44 4.65 28.14BharatSugarMills,SidhiwaliaGopalganj -0.06 -0.05 -0.06 -0.06 -0.06 -0.07 -0.06 -0.08 4.29 4.24 3.92 4.92 16.89
Lauriya Sugar Mill -0.03 -0.03 -0.03 -0.03 -0.03 -0.03 -0.04 -0.08 2.68 3.72 4.82 3.29 14.21
Sugauli Sugar Mill -0.02 -0.02 -0.02 -0.02 -0.01 -0.02 -0.02 -0.06 0.82 1.81 3.94 2.14 8.52Hasanpur SugarMills,Samastipur 0.60 -0.03 -0.03 -0.03 -0.03 -0.02 -0.02 -0.02 1.06 1.46 1.39 0.12 4.45Riga Sugar CompanyLtd,Sitamarhi 0.00 0.00 0.00 0.00 0.00 0.00 -0.01 -0.01 0.36 0.28 0.37 0.06 1.05Siddhashram Rice MillCluster Pvt Ltd 0.00 0.00 0.00 0.00 0.00 0.00 0.00 0.01 0.36 0.39 0.35 0.29 1.39
BDBPL 0.00 0.00 0.00 0.00 0.00 0.00 0.00 0.00 0.00 0.00 0.50 0.99 1.49
Open Market Purchase 296.72 153.73 124.46 93.95 138.02 257.95 184.04 168.14 143.62 88.75 71.49 113.00 1833.86
IEX/PXIL 269.64 133.60 62.39 30.46 60.70 176.57 91.11 90.00 83.51 43.89 39.47 51.83 1133.18
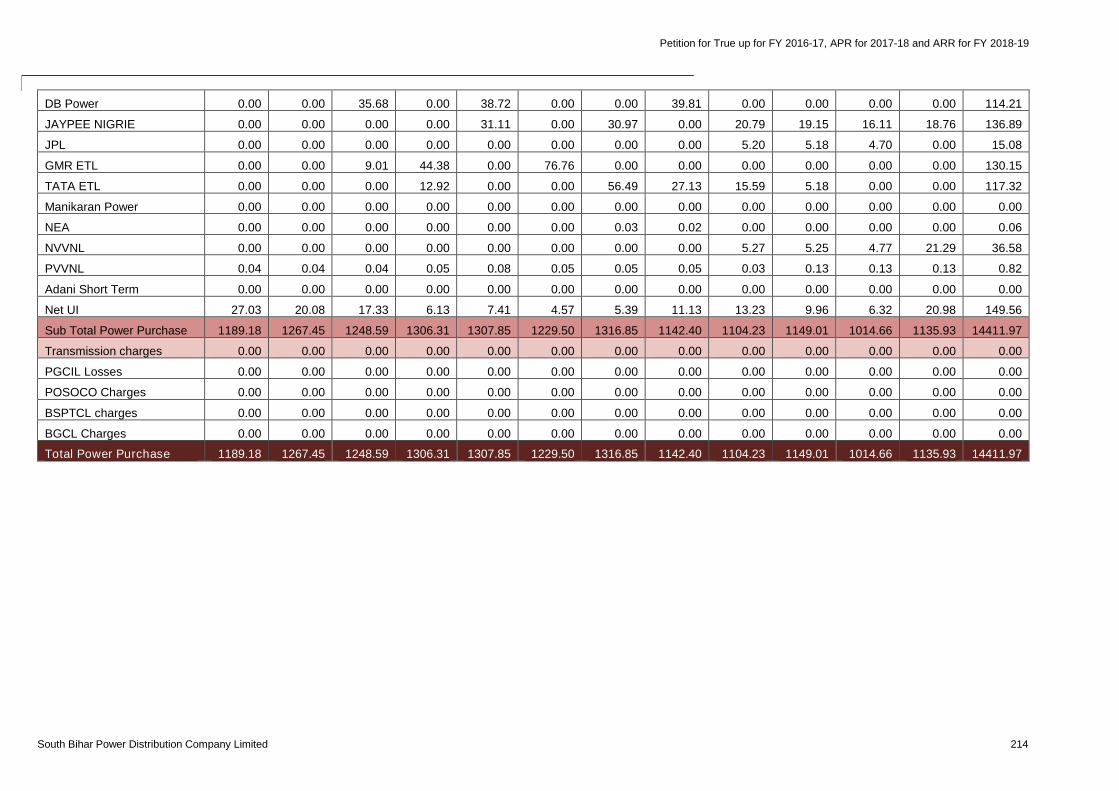
Petition for True up for FY 2016-17, APR for 2017-18 and ARR for FY 2018-19
South Bihar Power Distribution Company Limited 214
DB Power 0.00 0.00 35.68 0.00 38.72 0.00 0.00 39.81 0.00 0.00 0.00 0.00 114.21
JAYPEE NIGRIE 0.00 0.00 0.00 0.00 31.11 0.00 30.97 0.00 20.79 19.15 16.11 18.76 136.89
JPL 0.00 0.00 0.00 0.00 0.00 0.00 0.00 0.00 5.20 5.18 4.70 0.00 15.08
GMR ETL 0.00 0.00 9.01 44.38 0.00 76.76 0.00 0.00 0.00 0.00 0.00 0.00 130.15
TATA ETL 0.00 0.00 0.00 12.92 0.00 0.00 56.49 27.13 15.59 5.18 0.00 0.00 117.32
Manikaran Power 0.00 0.00 0.00 0.00 0.00 0.00 0.00 0.00 0.00 0.00 0.00 0.00 0.00
NEA 0.00 0.00 0.00 0.00 0.00 0.00 0.03 0.02 0.00 0.00 0.00 0.00 0.06
NVVNL 0.00 0.00 0.00 0.00 0.00 0.00 0.00 0.00 5.27 5.25 4.77 21.29 36.58
PVVNL 0.04 0.04 0.04 0.05 0.08 0.05 0.05 0.05 0.03 0.13 0.13 0.13 0.82
Adani Short Term 0.00 0.00 0.00 0.00 0.00 0.00 0.00 0.00 0.00 0.00 0.00 0.00 0.00
Net UI 27.03 20.08 17.33 6.13 7.41 4.57 5.39 11.13 13.23 9.96 6.32 20.98 149.56
Sub Total Power Purchase 1189.18 1267.45 1248.59 1306.31 1307.85 1229.50 1316.85 1142.40 1104.23 1149.01 1014.66 1135.93 14411.97
Transmission charges 0.00 0.00 0.00 0.00 0.00 0.00 0.00 0.00 0.00 0.00 0.00 0.00 0.00
PGCIL Losses 0.00 0.00 0.00 0.00 0.00 0.00 0.00 0.00 0.00 0.00 0.00 0.00 0.00
POSOCO Charges 0.00 0.00 0.00 0.00 0.00 0.00 0.00 0.00 0.00 0.00 0.00 0.00 0.00
BSPTCL charges 0.00 0.00 0.00 0.00 0.00 0.00 0.00 0.00 0.00 0.00 0.00 0.00 0.00
BGCL Charges 0.00 0.00 0.00 0.00 0.00 0.00 0.00 0.00 0.00 0.00 0.00 0.00 0.00
Total Power Purchase 1189.18 1267.45 1248.59 1306.31 1307.85 1229.50 1316.85 1142.40 1104.23 1149.01 1014.66 1135.93 14411.97
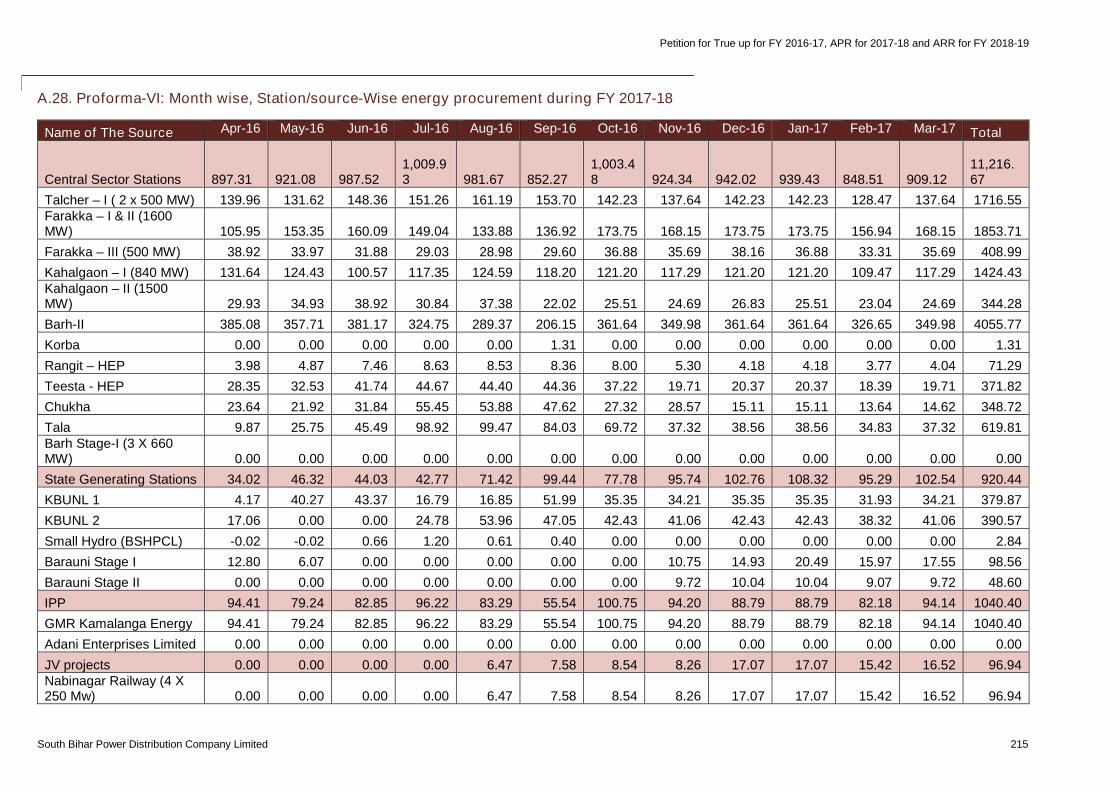
Petition for True up for FY 2016-17, APR for 2017-18 and ARR for FY 2018-19
South Bihar Power Distribution Company Limited 215
A.28. Proforma-VI: Month wise, Station/source-Wise energy procurement during FY 2017-18
Name of The Source Apr-16 May-16 Jun-16 Jul-16 Aug-16 Sep-16 Oct-16 Nov-16 Dec-16 Jan-17 Feb-17 Mar-17 Total
Central Sector Stations 897.31 921.08 987.521,009.93 981.67 852.27
1,003.48 924.34 942.02 939.43 848.51 909.12
11,216.67
Talcher – I ( 2 x 500 MW) 139.96 131.62 148.36 151.26 161.19 153.70 142.23 137.64 142.23 142.23 128.47 137.64 1716.55Farakka – I & II (1600MW) 105.95 153.35 160.09 149.04 133.88 136.92 173.75 168.15 173.75 173.75 156.94 168.15 1853.71
Farakka – III (500 MW) 38.92 33.97 31.88 29.03 28.98 29.60 36.88 35.69 38.16 36.88 33.31 35.69 408.99
Kahalgaon – I (840 MW) 131.64 124.43 100.57 117.35 124.59 118.20 121.20 117.29 121.20 121.20 109.47 117.29 1424.43Kahalgaon – II (1500MW) 29.93 34.93 38.92 30.84 37.38 22.02 25.51 24.69 26.83 25.51 23.04 24.69 344.28
Barh-II 385.08 357.71 381.17 324.75 289.37 206.15 361.64 349.98 361.64 361.64 326.65 349.98 4055.77
Korba 0.00 0.00 0.00 0.00 0.00 1.31 0.00 0.00 0.00 0.00 0.00 0.00 1.31
Rangit – HEP 3.98 4.87 7.46 8.63 8.53 8.36 8.00 5.30 4.18 4.18 3.77 4.04 71.29
Teesta - HEP 28.35 32.53 41.74 44.67 44.40 44.36 37.22 19.71 20.37 20.37 18.39 19.71 371.82
Chukha 23.64 21.92 31.84 55.45 53.88 47.62 27.32 28.57 15.11 15.11 13.64 14.62 348.72
Tala 9.87 25.75 45.49 98.92 99.47 84.03 69.72 37.32 38.56 38.56 34.83 37.32 619.81Barh Stage-I (3 X 660MW) 0.00 0.00 0.00 0.00 0.00 0.00 0.00 0.00 0.00 0.00 0.00 0.00 0.00
State Generating Stations 34.02 46.32 44.03 42.77 71.42 99.44 77.78 95.74 102.76 108.32 95.29 102.54 920.44
KBUNL 1 4.17 40.27 43.37 16.79 16.85 51.99 35.35 34.21 35.35 35.35 31.93 34.21 379.87
KBUNL 2 17.06 0.00 0.00 24.78 53.96 47.05 42.43 41.06 42.43 42.43 38.32 41.06 390.57
Small Hydro (BSHPCL) -0.02 -0.02 0.66 1.20 0.61 0.40 0.00 0.00 0.00 0.00 0.00 0.00 2.84
Barauni Stage I 12.80 6.07 0.00 0.00 0.00 0.00 0.00 10.75 14.93 20.49 15.97 17.55 98.56
Barauni Stage II 0.00 0.00 0.00 0.00 0.00 0.00 0.00 9.72 10.04 10.04 9.07 9.72 48.60
IPP 94.41 79.24 82.85 96.22 83.29 55.54 100.75 94.20 88.79 88.79 82.18 94.14 1040.40
GMR Kamalanga Energy 94.41 79.24 82.85 96.22 83.29 55.54 100.75 94.20 88.79 88.79 82.18 94.14 1040.40
Adani Enterprises Limited 0.00 0.00 0.00 0.00 0.00 0.00 0.00 0.00 0.00 0.00 0.00 0.00 0.00
JV projects 0.00 0.00 0.00 0.00 6.47 7.58 8.54 8.26 17.07 17.07 15.42 16.52 96.94Nabinagar Railway (4 X250 Mw) 0.00 0.00 0.00 0.00 6.47 7.58 8.54 8.26 17.07 17.07 15.42 16.52 96.94
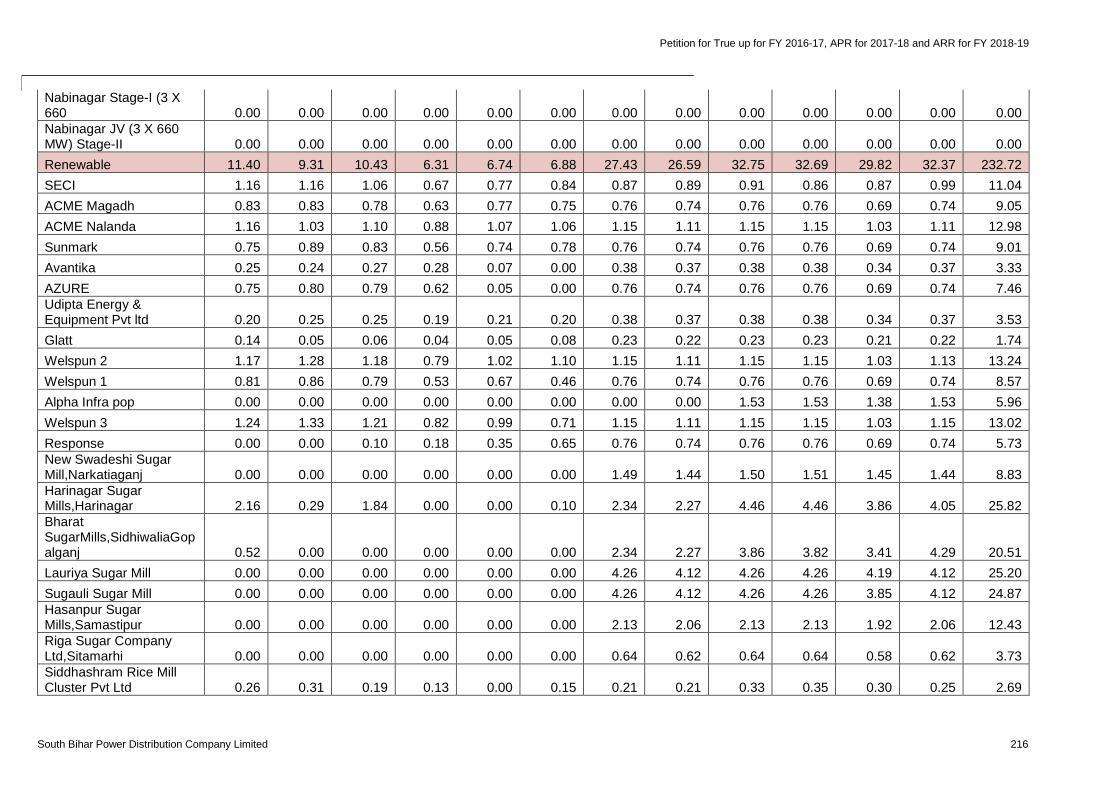
Petition for True up for FY 2016-17, APR for 2017-18 and ARR for FY 2018-19
South Bihar Power Distribution Company Limited 216
Nabinagar Stage-I (3 X660 0.00 0.00 0.00 0.00 0.00 0.00 0.00 0.00 0.00 0.00 0.00 0.00 0.00Nabinagar JV (3 X 660MW) Stage-II 0.00 0.00 0.00 0.00 0.00 0.00 0.00 0.00 0.00 0.00 0.00 0.00 0.00
Renewable 11.40 9.31 10.43 6.31 6.74 6.88 27.43 26.59 32.75 32.69 29.82 32.37 232.72
SECI 1.16 1.16 1.06 0.67 0.77 0.84 0.87 0.89 0.91 0.86 0.87 0.99 11.04
ACME Magadh 0.83 0.83 0.78 0.63 0.77 0.75 0.76 0.74 0.76 0.76 0.69 0.74 9.05
ACME Nalanda 1.16 1.03 1.10 0.88 1.07 1.06 1.15 1.11 1.15 1.15 1.03 1.11 12.98
Sunmark 0.75 0.89 0.83 0.56 0.74 0.78 0.76 0.74 0.76 0.76 0.69 0.74 9.01
Avantika 0.25 0.24 0.27 0.28 0.07 0.00 0.38 0.37 0.38 0.38 0.34 0.37 3.33
AZURE 0.75 0.80 0.79 0.62 0.05 0.00 0.76 0.74 0.76 0.76 0.69 0.74 7.46Udipta Energy &Equipment Pvt ltd 0.20 0.25 0.25 0.19 0.21 0.20 0.38 0.37 0.38 0.38 0.34 0.37 3.53
Glatt 0.14 0.05 0.06 0.04 0.05 0.08 0.23 0.22 0.23 0.23 0.21 0.22 1.74
Welspun 2 1.17 1.28 1.18 0.79 1.02 1.10 1.15 1.11 1.15 1.15 1.03 1.13 13.24
Welspun 1 0.81 0.86 0.79 0.53 0.67 0.46 0.76 0.74 0.76 0.76 0.69 0.74 8.57
Alpha Infra pop 0.00 0.00 0.00 0.00 0.00 0.00 0.00 0.00 1.53 1.53 1.38 1.53 5.96
Welspun 3 1.24 1.33 1.21 0.82 0.99 0.71 1.15 1.11 1.15 1.15 1.03 1.15 13.02
Response 0.00 0.00 0.10 0.18 0.35 0.65 0.76 0.74 0.76 0.76 0.69 0.74 5.73New Swadeshi SugarMill,Narkatiaganj 0.00 0.00 0.00 0.00 0.00 0.00 1.49 1.44 1.50 1.51 1.45 1.44 8.83Harinagar SugarMills,Harinagar 2.16 0.29 1.84 0.00 0.00 0.10 2.34 2.27 4.46 4.46 3.86 4.05 25.82BharatSugarMills,SidhiwaliaGopalganj 0.52 0.00 0.00 0.00 0.00 0.00 2.34 2.27 3.86 3.82 3.41 4.29 20.51
Lauriya Sugar Mill 0.00 0.00 0.00 0.00 0.00 0.00 4.26 4.12 4.26 4.26 4.19 4.12 25.20
Sugauli Sugar Mill 0.00 0.00 0.00 0.00 0.00 0.00 4.26 4.12 4.26 4.26 3.85 4.12 24.87Hasanpur SugarMills,Samastipur 0.00 0.00 0.00 0.00 0.00 0.00 2.13 2.06 2.13 2.13 1.92 2.06 12.43Riga Sugar CompanyLtd,Sitamarhi 0.00 0.00 0.00 0.00 0.00 0.00 0.64 0.62 0.64 0.64 0.58 0.62 3.73Siddhashram Rice MillCluster Pvt Ltd 0.26 0.31 0.19 0.13 0.00 0.15 0.21 0.21 0.33 0.35 0.30 0.25 2.69
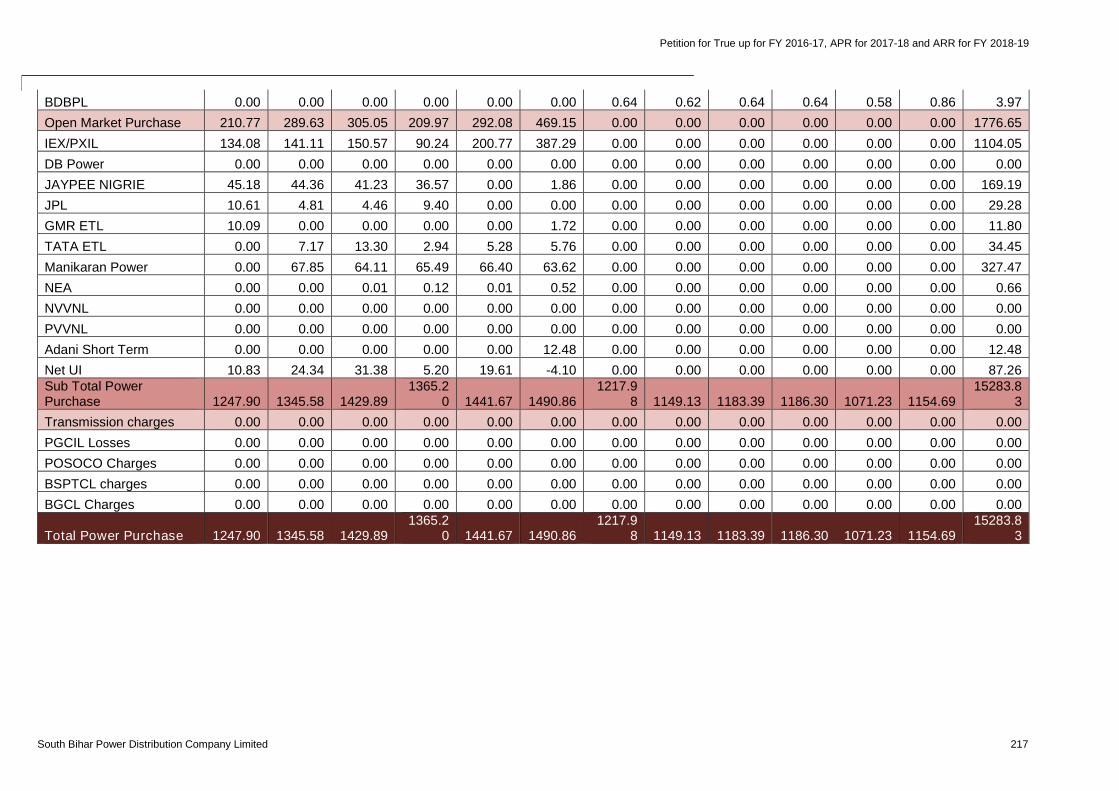
Petition for True up for FY 2016-17, APR for 2017-18 and ARR for FY 2018-19
South Bihar Power Distribution Company Limited 217
BDBPL 0.00 0.00 0.00 0.00 0.00 0.00 0.64 0.62 0.64 0.64 0.58 0.86 3.97
Open Market Purchase 210.77 289.63 305.05 209.97 292.08 469.15 0.00 0.00 0.00 0.00 0.00 0.00 1776.65
IEX/PXIL 134.08 141.11 150.57 90.24 200.77 387.29 0.00 0.00 0.00 0.00 0.00 0.00 1104.05
DB Power 0.00 0.00 0.00 0.00 0.00 0.00 0.00 0.00 0.00 0.00 0.00 0.00 0.00
JAYPEE NIGRIE 45.18 44.36 41.23 36.57 0.00 1.86 0.00 0.00 0.00 0.00 0.00 0.00 169.19
JPL 10.61 4.81 4.46 9.40 0.00 0.00 0.00 0.00 0.00 0.00 0.00 0.00 29.28
GMR ETL 10.09 0.00 0.00 0.00 0.00 1.72 0.00 0.00 0.00 0.00 0.00 0.00 11.80
TATA ETL 0.00 7.17 13.30 2.94 5.28 5.76 0.00 0.00 0.00 0.00 0.00 0.00 34.45
Manikaran Power 0.00 67.85 64.11 65.49 66.40 63.62 0.00 0.00 0.00 0.00 0.00 0.00 327.47
NEA 0.00 0.00 0.01 0.12 0.01 0.52 0.00 0.00 0.00 0.00 0.00 0.00 0.66
NVVNL 0.00 0.00 0.00 0.00 0.00 0.00 0.00 0.00 0.00 0.00 0.00 0.00 0.00
PVVNL 0.00 0.00 0.00 0.00 0.00 0.00 0.00 0.00 0.00 0.00 0.00 0.00 0.00
Adani Short Term 0.00 0.00 0.00 0.00 0.00 12.48 0.00 0.00 0.00 0.00 0.00 0.00 12.48
Net UI 10.83 24.34 31.38 5.20 19.61 -4.10 0.00 0.00 0.00 0.00 0.00 0.00 87.26Sub Total PowerPurchase 1247.90 1345.58 1429.89
1365.20 1441.67 1490.86
1217.98 1149.13 1183.39 1186.30 1071.23 1154.69
15283.83
Transmission charges 0.00 0.00 0.00 0.00 0.00 0.00 0.00 0.00 0.00 0.00 0.00 0.00 0.00
PGCIL Losses 0.00 0.00 0.00 0.00 0.00 0.00 0.00 0.00 0.00 0.00 0.00 0.00 0.00
POSOCO Charges 0.00 0.00 0.00 0.00 0.00 0.00 0.00 0.00 0.00 0.00 0.00 0.00 0.00
BSPTCL charges 0.00 0.00 0.00 0.00 0.00 0.00 0.00 0.00 0.00 0.00 0.00 0.00 0.00
BGCL Charges 0.00 0.00 0.00 0.00 0.00 0.00 0.00 0.00 0.00 0.00 0.00 0.00 0.00
Total Power Purchase 1247.90 1345.58 1429.891365.2
0 1441.67 1490.861217.9
8 1149.13 1183.39 1186.30 1071.23 1154.6915283.8
3
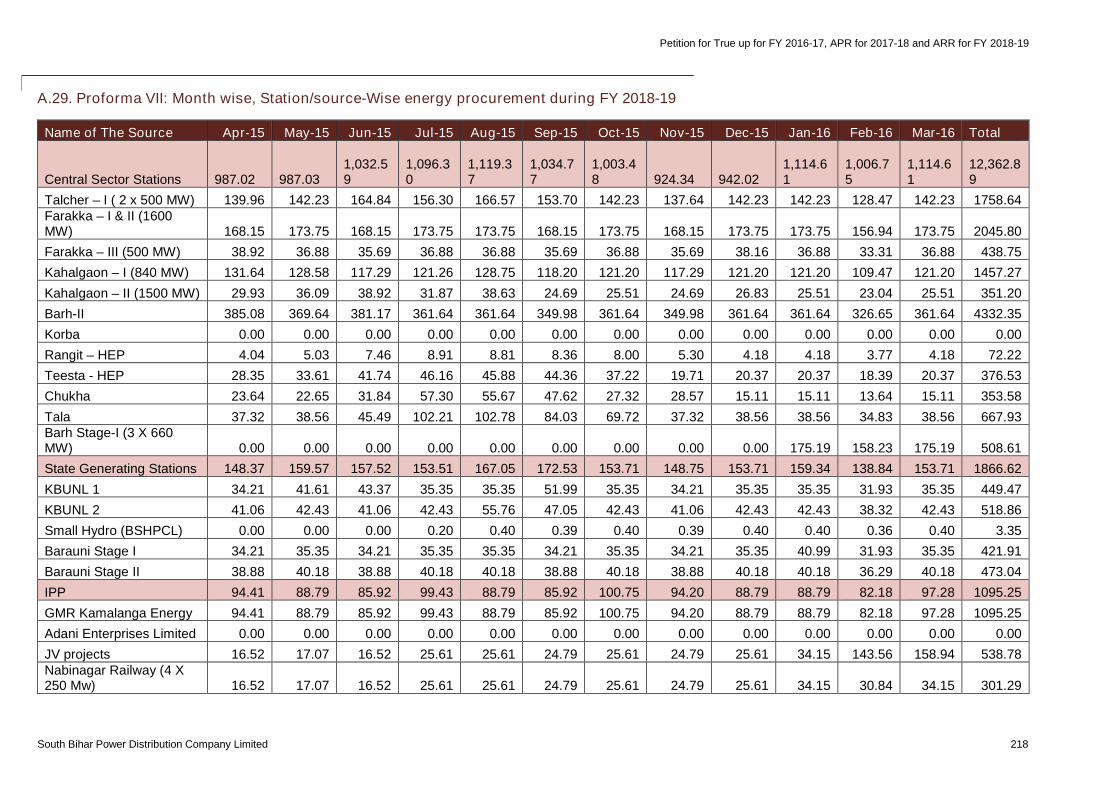
Petition for True up for FY 2016-17, APR for 2017-18 and ARR for FY 2018-19
South Bihar Power Distribution Company Limited 218
A.29. Proforma VII: Month wise, Station/source-Wise energy procurement during FY 2018-19
Name of The Source Apr-15 May-15 Jun-15 Jul-15 Aug-15 Sep-15 Oct-15 Nov-15 Dec-15 Jan-16 Feb-16 Mar-16 Total
Central Sector Stations 987.02 987.031,032.59
1,096.30
1,119.37
1,034.77
1,003.48 924.34 942.02
1,114.61
1,006.75
1,114.61
12,362.89
Talcher – I ( 2 x 500 MW) 139.96 142.23 164.84 156.30 166.57 153.70 142.23 137.64 142.23 142.23 128.47 142.23 1758.64Farakka – I & II (1600MW) 168.15 173.75 168.15 173.75 173.75 168.15 173.75 168.15 173.75 173.75 156.94 173.75 2045.80
Farakka – III (500 MW) 38.92 36.88 35.69 36.88 36.88 35.69 36.88 35.69 38.16 36.88 33.31 36.88 438.75
Kahalgaon – I (840 MW) 131.64 128.58 117.29 121.26 128.75 118.20 121.20 117.29 121.20 121.20 109.47 121.20 1457.27
Kahalgaon – II (1500 MW) 29.93 36.09 38.92 31.87 38.63 24.69 25.51 24.69 26.83 25.51 23.04 25.51 351.20
Barh-II 385.08 369.64 381.17 361.64 361.64 349.98 361.64 349.98 361.64 361.64 326.65 361.64 4332.35
Korba 0.00 0.00 0.00 0.00 0.00 0.00 0.00 0.00 0.00 0.00 0.00 0.00 0.00
Rangit – HEP 4.04 5.03 7.46 8.91 8.81 8.36 8.00 5.30 4.18 4.18 3.77 4.18 72.22
Teesta - HEP 28.35 33.61 41.74 46.16 45.88 44.36 37.22 19.71 20.37 20.37 18.39 20.37 376.53
Chukha 23.64 22.65 31.84 57.30 55.67 47.62 27.32 28.57 15.11 15.11 13.64 15.11 353.58
Tala 37.32 38.56 45.49 102.21 102.78 84.03 69.72 37.32 38.56 38.56 34.83 38.56 667.93Barh Stage-I (3 X 660MW) 0.00 0.00 0.00 0.00 0.00 0.00 0.00 0.00 0.00 175.19 158.23 175.19 508.61
State Generating Stations 148.37 159.57 157.52 153.51 167.05 172.53 153.71 148.75 153.71 159.34 138.84 153.71 1866.62
KBUNL 1 34.21 41.61 43.37 35.35 35.35 51.99 35.35 34.21 35.35 35.35 31.93 35.35 449.47
KBUNL 2 41.06 42.43 41.06 42.43 55.76 47.05 42.43 41.06 42.43 42.43 38.32 42.43 518.86
Small Hydro (BSHPCL) 0.00 0.00 0.00 0.20 0.40 0.39 0.40 0.39 0.40 0.40 0.36 0.40 3.35
Barauni Stage I 34.21 35.35 34.21 35.35 35.35 34.21 35.35 34.21 35.35 40.99 31.93 35.35 421.91
Barauni Stage II 38.88 40.18 38.88 40.18 40.18 38.88 40.18 38.88 40.18 40.18 36.29 40.18 473.04
IPP 94.41 88.79 85.92 99.43 88.79 85.92 100.75 94.20 88.79 88.79 82.18 97.28 1095.25
GMR Kamalanga Energy 94.41 88.79 85.92 99.43 88.79 85.92 100.75 94.20 88.79 88.79 82.18 97.28 1095.25
Adani Enterprises Limited 0.00 0.00 0.00 0.00 0.00 0.00 0.00 0.00 0.00 0.00 0.00 0.00 0.00
JV projects 16.52 17.07 16.52 25.61 25.61 24.79 25.61 24.79 25.61 34.15 143.56 158.94 538.78Nabinagar Railway (4 X250 Mw) 16.52 17.07 16.52 25.61 25.61 24.79 25.61 24.79 25.61 34.15 30.84 34.15 301.29
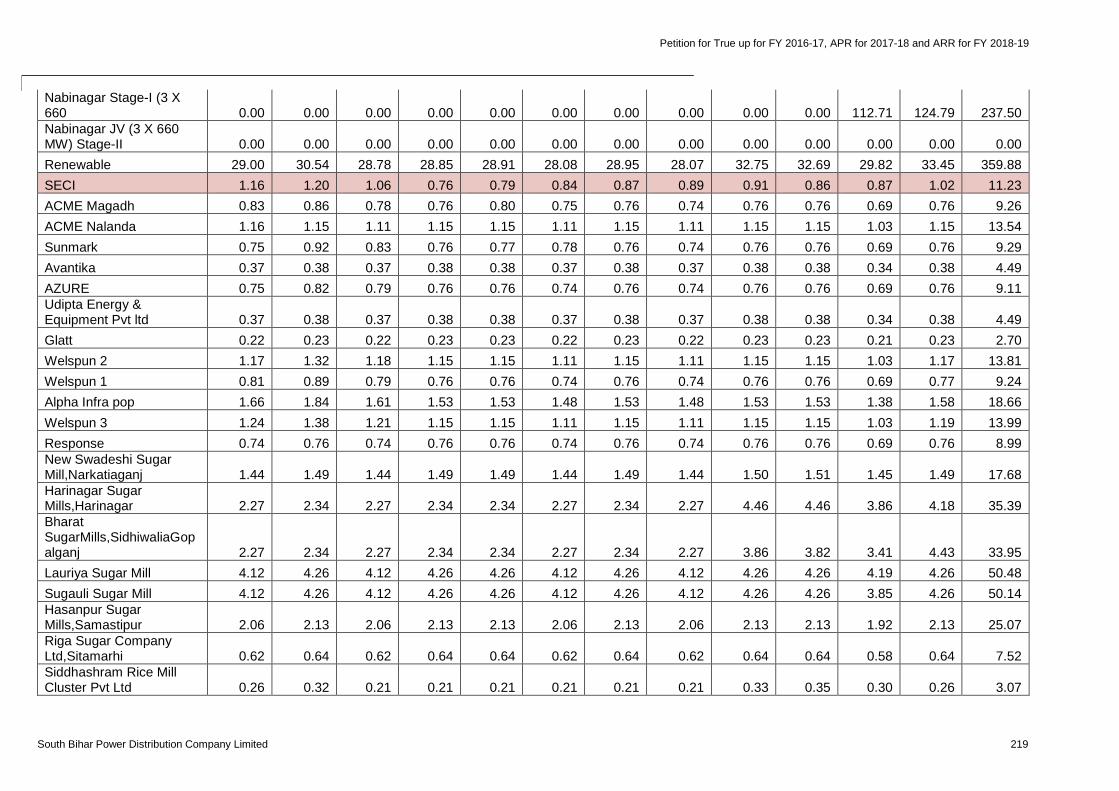
Petition for True up for FY 2016-17, APR for 2017-18 and ARR for FY 2018-19
South Bihar Power Distribution Company Limited 219
Nabinagar Stage-I (3 X660 0.00 0.00 0.00 0.00 0.00 0.00 0.00 0.00 0.00 0.00 112.71 124.79 237.50Nabinagar JV (3 X 660MW) Stage-II 0.00 0.00 0.00 0.00 0.00 0.00 0.00 0.00 0.00 0.00 0.00 0.00 0.00
Renewable 29.00 30.54 28.78 28.85 28.91 28.08 28.95 28.07 32.75 32.69 29.82 33.45 359.88
SECI 1.16 1.20 1.06 0.76 0.79 0.84 0.87 0.89 0.91 0.86 0.87 1.02 11.23
ACME Magadh 0.83 0.86 0.78 0.76 0.80 0.75 0.76 0.74 0.76 0.76 0.69 0.76 9.26
ACME Nalanda 1.16 1.15 1.11 1.15 1.15 1.11 1.15 1.11 1.15 1.15 1.03 1.15 13.54
Sunmark 0.75 0.92 0.83 0.76 0.77 0.78 0.76 0.74 0.76 0.76 0.69 0.76 9.29
Avantika 0.37 0.38 0.37 0.38 0.38 0.37 0.38 0.37 0.38 0.38 0.34 0.38 4.49
AZURE 0.75 0.82 0.79 0.76 0.76 0.74 0.76 0.74 0.76 0.76 0.69 0.76 9.11Udipta Energy &Equipment Pvt ltd 0.37 0.38 0.37 0.38 0.38 0.37 0.38 0.37 0.38 0.38 0.34 0.38 4.49
Glatt 0.22 0.23 0.22 0.23 0.23 0.22 0.23 0.22 0.23 0.23 0.21 0.23 2.70
Welspun 2 1.17 1.32 1.18 1.15 1.15 1.11 1.15 1.11 1.15 1.15 1.03 1.17 13.81
Welspun 1 0.81 0.89 0.79 0.76 0.76 0.74 0.76 0.74 0.76 0.76 0.69 0.77 9.24
Alpha Infra pop 1.66 1.84 1.61 1.53 1.53 1.48 1.53 1.48 1.53 1.53 1.38 1.58 18.66
Welspun 3 1.24 1.38 1.21 1.15 1.15 1.11 1.15 1.11 1.15 1.15 1.03 1.19 13.99
Response 0.74 0.76 0.74 0.76 0.76 0.74 0.76 0.74 0.76 0.76 0.69 0.76 8.99New Swadeshi SugarMill,Narkatiaganj 1.44 1.49 1.44 1.49 1.49 1.44 1.49 1.44 1.50 1.51 1.45 1.49 17.68Harinagar SugarMills,Harinagar 2.27 2.34 2.27 2.34 2.34 2.27 2.34 2.27 4.46 4.46 3.86 4.18 35.39BharatSugarMills,SidhiwaliaGopalganj 2.27 2.34 2.27 2.34 2.34 2.27 2.34 2.27 3.86 3.82 3.41 4.43 33.95
Lauriya Sugar Mill 4.12 4.26 4.12 4.26 4.26 4.12 4.26 4.12 4.26 4.26 4.19 4.26 50.48
Sugauli Sugar Mill 4.12 4.26 4.12 4.26 4.26 4.12 4.26 4.12 4.26 4.26 3.85 4.26 50.14Hasanpur SugarMills,Samastipur 2.06 2.13 2.06 2.13 2.13 2.06 2.13 2.06 2.13 2.13 1.92 2.13 25.07Riga Sugar CompanyLtd,Sitamarhi 0.62 0.64 0.62 0.64 0.64 0.62 0.64 0.62 0.64 0.64 0.58 0.64 7.52Siddhashram Rice MillCluster Pvt Ltd 0.26 0.32 0.21 0.21 0.21 0.21 0.21 0.21 0.33 0.35 0.30 0.26 3.07
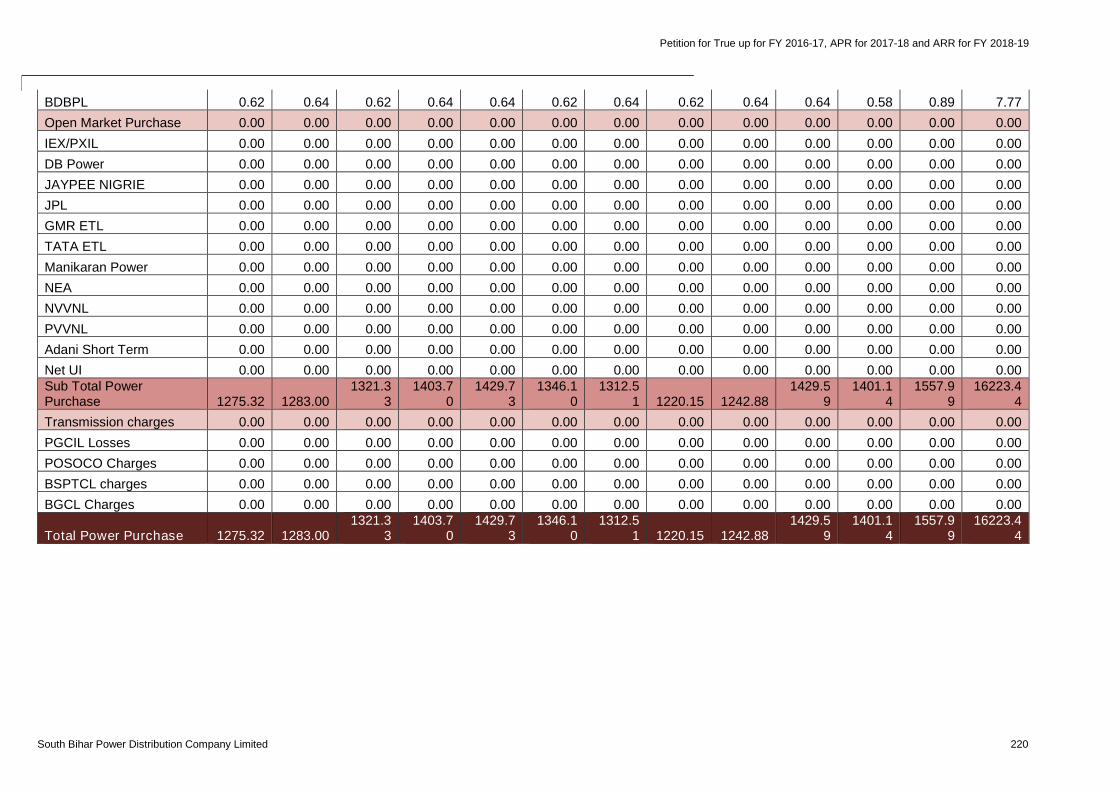
Petition for True up for FY 2016-17, APR for 2017-18 and ARR for FY 2018-19
South Bihar Power Distribution Company Limited 220
BDBPL 0.62 0.64 0.62 0.64 0.64 0.62 0.64 0.62 0.64 0.64 0.58 0.89 7.77
Open Market Purchase 0.00 0.00 0.00 0.00 0.00 0.00 0.00 0.00 0.00 0.00 0.00 0.00 0.00
IEX/PXIL 0.00 0.00 0.00 0.00 0.00 0.00 0.00 0.00 0.00 0.00 0.00 0.00 0.00
DB Power 0.00 0.00 0.00 0.00 0.00 0.00 0.00 0.00 0.00 0.00 0.00 0.00 0.00
JAYPEE NIGRIE 0.00 0.00 0.00 0.00 0.00 0.00 0.00 0.00 0.00 0.00 0.00 0.00 0.00
JPL 0.00 0.00 0.00 0.00 0.00 0.00 0.00 0.00 0.00 0.00 0.00 0.00 0.00
GMR ETL 0.00 0.00 0.00 0.00 0.00 0.00 0.00 0.00 0.00 0.00 0.00 0.00 0.00
TATA ETL 0.00 0.00 0.00 0.00 0.00 0.00 0.00 0.00 0.00 0.00 0.00 0.00 0.00
Manikaran Power 0.00 0.00 0.00 0.00 0.00 0.00 0.00 0.00 0.00 0.00 0.00 0.00 0.00
NEA 0.00 0.00 0.00 0.00 0.00 0.00 0.00 0.00 0.00 0.00 0.00 0.00 0.00
NVVNL 0.00 0.00 0.00 0.00 0.00 0.00 0.00 0.00 0.00 0.00 0.00 0.00 0.00
PVVNL 0.00 0.00 0.00 0.00 0.00 0.00 0.00 0.00 0.00 0.00 0.00 0.00 0.00
Adani Short Term 0.00 0.00 0.00 0.00 0.00 0.00 0.00 0.00 0.00 0.00 0.00 0.00 0.00
Net UI 0.00 0.00 0.00 0.00 0.00 0.00 0.00 0.00 0.00 0.00 0.00 0.00 0.00Sub Total PowerPurchase 1275.32 1283.00
1321.33
1403.70
1429.73
1346.10
1312.51 1220.15 1242.88
1429.59
1401.14
1557.99
16223.44
Transmission charges 0.00 0.00 0.00 0.00 0.00 0.00 0.00 0.00 0.00 0.00 0.00 0.00 0.00
PGCIL Losses 0.00 0.00 0.00 0.00 0.00 0.00 0.00 0.00 0.00 0.00 0.00 0.00 0.00
POSOCO Charges 0.00 0.00 0.00 0.00 0.00 0.00 0.00 0.00 0.00 0.00 0.00 0.00 0.00
BSPTCL charges 0.00 0.00 0.00 0.00 0.00 0.00 0.00 0.00 0.00 0.00 0.00 0.00 0.00
BGCL Charges 0.00 0.00 0.00 0.00 0.00 0.00 0.00 0.00 0.00 0.00 0.00 0.00 0.00
Total Power Purchase 1275.32 1283.001321.3
31403.7
01429.7
31346.1
01312.5
1 1220.15 1242.881429.5
91401.1
41557.9
916223.4
4
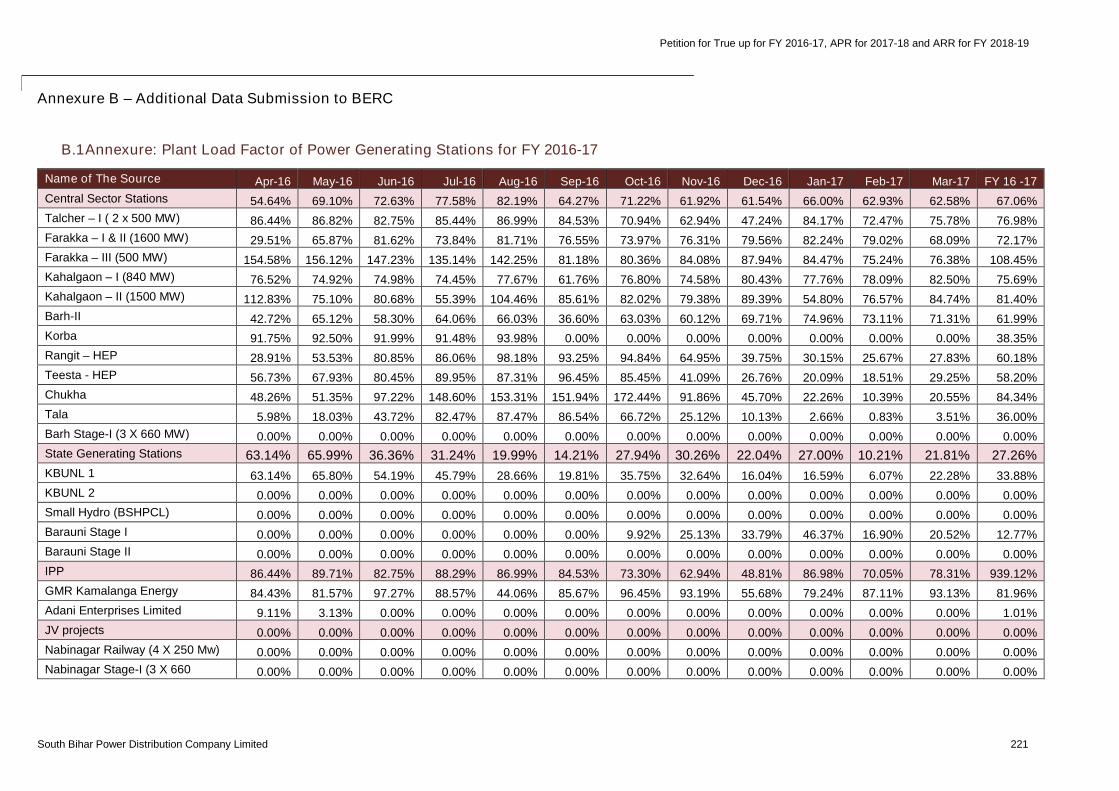
Petition for True up for FY 2016-17, APR for 2017-18 and ARR for FY 2018-19
South Bihar Power Distribution Company Limited 221
Annexure B – Additional Data Submission to BERC
B.1Annexure: Plant Load Factor of Power Generating Stations for FY 2016-17
Name of The Source Apr-16 May-16 Jun-16 Jul-16 Aug-16 Sep-16 Oct-16 Nov-16 Dec-16 Jan-17 Feb-17 Mar-17 FY 16 -17
Central Sector Stations 54.64% 69.10% 72.63% 77.58% 82.19% 64.27% 71.22% 61.92% 61.54% 66.00% 62.93% 62.58% 67.06%
Talcher – I ( 2 x 500 MW) 86.44% 86.82% 82.75% 85.44% 86.99% 84.53% 70.94% 62.94% 47.24% 84.17% 72.47% 75.78% 76.98%
Farakka – I & II (1600 MW) 29.51% 65.87% 81.62% 73.84% 81.71% 76.55% 73.97% 76.31% 79.56% 82.24% 79.02% 68.09% 72.17%
Farakka – III (500 MW) 154.58% 156.12% 147.23% 135.14% 142.25% 81.18% 80.36% 84.08% 87.94% 84.47% 75.24% 76.38% 108.45%
Kahalgaon – I (840 MW) 76.52% 74.92% 74.98% 74.45% 77.67% 61.76% 76.80% 74.58% 80.43% 77.76% 78.09% 82.50% 75.69%
Kahalgaon – II (1500 MW) 112.83% 75.10% 80.68% 55.39% 104.46% 85.61% 82.02% 79.38% 89.39% 54.80% 76.57% 84.74% 81.40%
Barh-II 42.72% 65.12% 58.30% 64.06% 66.03% 36.60% 63.03% 60.12% 69.71% 74.96% 73.11% 71.31% 61.99%
Korba 91.75% 92.50% 91.99% 91.48% 93.98% 0.00% 0.00% 0.00% 0.00% 0.00% 0.00% 0.00% 38.35%
Rangit – HEP 28.91% 53.53% 80.85% 86.06% 98.18% 93.25% 94.84% 64.95% 39.75% 30.15% 25.67% 27.83% 60.18%
Teesta - HEP 56.73% 67.93% 80.45% 89.95% 87.31% 96.45% 85.45% 41.09% 26.76% 20.09% 18.51% 29.25% 58.20%
Chukha 48.26% 51.35% 97.22% 148.60% 153.31% 151.94% 172.44% 91.86% 45.70% 22.26% 10.39% 20.55% 84.34%
Tala 5.98% 18.03% 43.72% 82.47% 87.47% 86.54% 66.72% 25.12% 10.13% 2.66% 0.83% 3.51% 36.00%
Barh Stage-I (3 X 660 MW) 0.00% 0.00% 0.00% 0.00% 0.00% 0.00% 0.00% 0.00% 0.00% 0.00% 0.00% 0.00% 0.00%
State Generating Stations 63.14% 65.99% 36.36% 31.24% 19.99% 14.21% 27.94% 30.26% 22.04% 27.00% 10.21% 21.81% 27.26%
KBUNL 1 63.14% 65.80% 54.19% 45.79% 28.66% 19.81% 35.75% 32.64% 16.04% 16.59% 6.07% 22.28% 33.88%
KBUNL 2 0.00% 0.00% 0.00% 0.00% 0.00% 0.00% 0.00% 0.00% 0.00% 0.00% 0.00% 0.00% 0.00%
Small Hydro (BSHPCL) 0.00% 0.00% 0.00% 0.00% 0.00% 0.00% 0.00% 0.00% 0.00% 0.00% 0.00% 0.00% 0.00%
Barauni Stage I 0.00% 0.00% 0.00% 0.00% 0.00% 0.00% 9.92% 25.13% 33.79% 46.37% 16.90% 20.52% 12.77%
Barauni Stage II 0.00% 0.00% 0.00% 0.00% 0.00% 0.00% 0.00% 0.00% 0.00% 0.00% 0.00% 0.00% 0.00%
IPP 86.44% 89.71% 82.75% 88.29% 86.99% 84.53% 73.30% 62.94% 48.81% 86.98% 70.05% 78.31% 939.12%
GMR Kamalanga Energy 84.43% 81.57% 97.27% 88.57% 44.06% 85.67% 96.45% 93.19% 55.68% 79.24% 87.11% 93.13% 81.96%
Adani Enterprises Limited 9.11% 3.13% 0.00% 0.00% 0.00% 0.00% 0.00% 0.00% 0.00% 0.00% 0.00% 0.00% 1.01%
JV projects 0.00% 0.00% 0.00% 0.00% 0.00% 0.00% 0.00% 0.00% 0.00% 0.00% 0.00% 0.00% 0.00%
Nabinagar Railway (4 X 250 Mw) 0.00% 0.00% 0.00% 0.00% 0.00% 0.00% 0.00% 0.00% 0.00% 0.00% 0.00% 0.00% 0.00%
Nabinagar Stage-I (3 X 660 0.00% 0.00% 0.00% 0.00% 0.00% 0.00% 0.00% 0.00% 0.00% 0.00% 0.00% 0.00% 0.00%
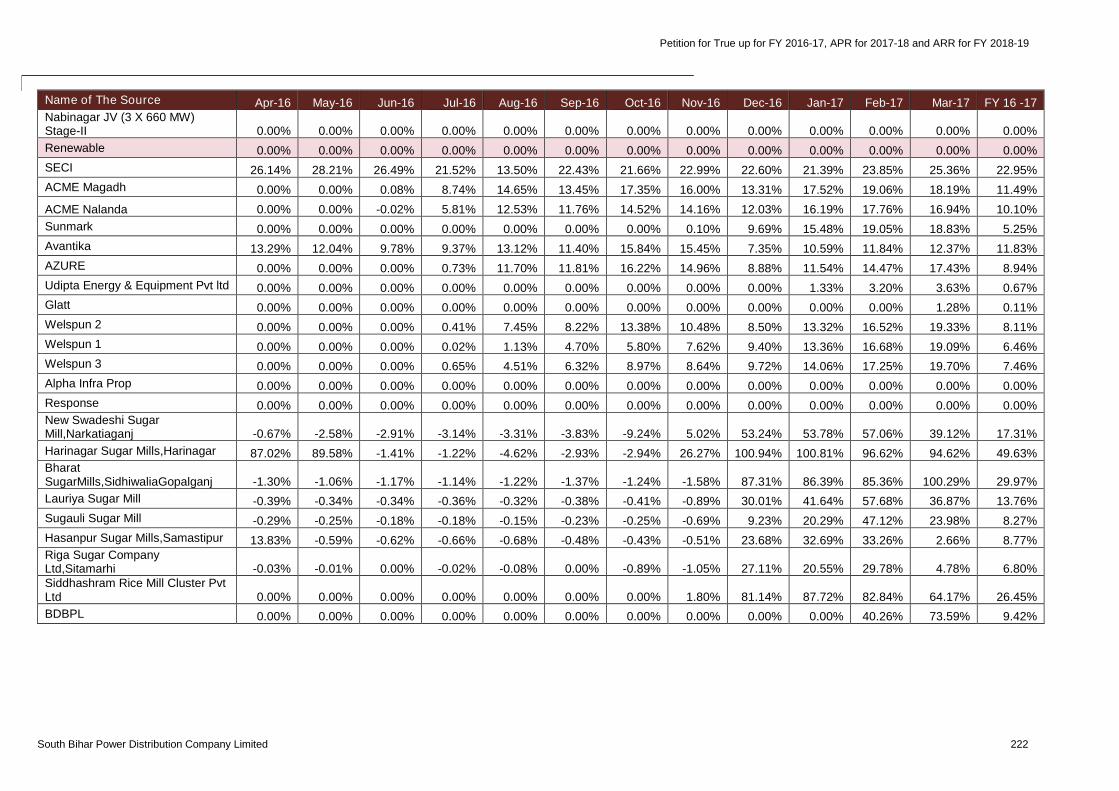
Petition for True up for FY 2016-17, APR for 2017-18 and ARR for FY 2018-19
South Bihar Power Distribution Company Limited 222
Name of The Source Apr-16 May-16 Jun-16 Jul-16 Aug-16 Sep-16 Oct-16 Nov-16 Dec-16 Jan-17 Feb-17 Mar-17 FY 16 -17Nabinagar JV (3 X 660 MW)Stage-II 0.00% 0.00% 0.00% 0.00% 0.00% 0.00% 0.00% 0.00% 0.00% 0.00% 0.00% 0.00% 0.00%
Renewable 0.00% 0.00% 0.00% 0.00% 0.00% 0.00% 0.00% 0.00% 0.00% 0.00% 0.00% 0.00% 0.00%
SECI 26.14% 28.21% 26.49% 21.52% 13.50% 22.43% 21.66% 22.99% 22.60% 21.39% 23.85% 25.36% 22.95%
ACME Magadh 0.00% 0.00% 0.08% 8.74% 14.65% 13.45% 17.35% 16.00% 13.31% 17.52% 19.06% 18.19% 11.49%
ACME Nalanda 0.00% 0.00% -0.02% 5.81% 12.53% 11.76% 14.52% 14.16% 12.03% 16.19% 17.76% 16.94% 10.10%
Sunmark 0.00% 0.00% 0.00% 0.00% 0.00% 0.00% 0.00% 0.10% 9.69% 15.48% 19.05% 18.83% 5.25%
Avantika 13.29% 12.04% 9.78% 9.37% 13.12% 11.40% 15.84% 15.45% 7.35% 10.59% 11.84% 12.37% 11.83%
AZURE 0.00% 0.00% 0.00% 0.73% 11.70% 11.81% 16.22% 14.96% 8.88% 11.54% 14.47% 17.43% 8.94%
Udipta Energy & Equipment Pvt ltd 0.00% 0.00% 0.00% 0.00% 0.00% 0.00% 0.00% 0.00% 0.00% 1.33% 3.20% 3.63% 0.67%
Glatt 0.00% 0.00% 0.00% 0.00% 0.00% 0.00% 0.00% 0.00% 0.00% 0.00% 0.00% 1.28% 0.11%
Welspun 2 0.00% 0.00% 0.00% 0.41% 7.45% 8.22% 13.38% 10.48% 8.50% 13.32% 16.52% 19.33% 8.11%
Welspun 1 0.00% 0.00% 0.00% 0.02% 1.13% 4.70% 5.80% 7.62% 9.40% 13.36% 16.68% 19.09% 6.46%
Welspun 3 0.00% 0.00% 0.00% 0.65% 4.51% 6.32% 8.97% 8.64% 9.72% 14.06% 17.25% 19.70% 7.46%
Alpha Infra Prop 0.00% 0.00% 0.00% 0.00% 0.00% 0.00% 0.00% 0.00% 0.00% 0.00% 0.00% 0.00% 0.00%
Response 0.00% 0.00% 0.00% 0.00% 0.00% 0.00% 0.00% 0.00% 0.00% 0.00% 0.00% 0.00% 0.00%New Swadeshi SugarMill,Narkatiaganj -0.67% -2.58% -2.91% -3.14% -3.31% -3.83% -9.24% 5.02% 53.24% 53.78% 57.06% 39.12% 17.31%
Harinagar Sugar Mills,Harinagar 87.02% 89.58% -1.41% -1.22% -4.62% -2.93% -2.94% 26.27% 100.94% 100.81% 96.62% 94.62% 49.63%BharatSugarMills,SidhiwaliaGopalganj -1.30% -1.06% -1.17% -1.14% -1.22% -1.37% -1.24% -1.58% 87.31% 86.39% 85.36% 100.29% 29.97%
Lauriya Sugar Mill -0.39% -0.34% -0.34% -0.36% -0.32% -0.38% -0.41% -0.89% 30.01% 41.64% 57.68% 36.87% 13.76%
Sugauli Sugar Mill -0.29% -0.25% -0.18% -0.18% -0.15% -0.23% -0.25% -0.69% 9.23% 20.29% 47.12% 23.98% 8.27%
Hasanpur Sugar Mills,Samastipur 13.83% -0.59% -0.62% -0.66% -0.68% -0.48% -0.43% -0.51% 23.68% 32.69% 33.26% 2.66% 8.77%Riga Sugar CompanyLtd,Sitamarhi -0.03% -0.01% 0.00% -0.02% -0.08% 0.00% -0.89% -1.05% 27.11% 20.55% 29.78% 4.78% 6.80%Siddhashram Rice Mill Cluster PvtLtd 0.00% 0.00% 0.00% 0.00% 0.00% 0.00% 0.00% 1.80% 81.14% 87.72% 82.84% 64.17% 26.45%
BDBPL 0.00% 0.00% 0.00% 0.00% 0.00% 0.00% 0.00% 0.00% 0.00% 0.00% 40.26% 73.59% 9.42%
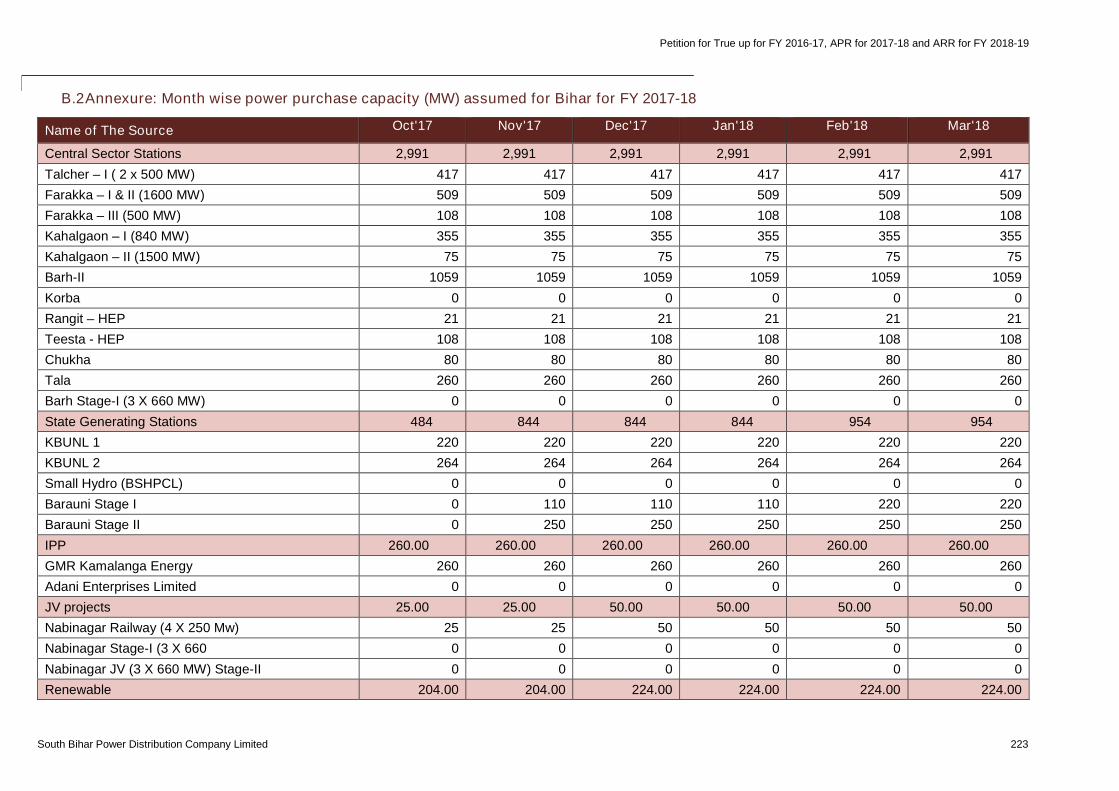
Petition for True up for FY 2016-17, APR for 2017-18 and ARR for FY 2018-19
South Bihar Power Distribution Company Limited 223
B.2Annexure: Month wise power purchase capacity (MW) assumed for Bihar for FY 2017-18
Name of The Source Oct'17 Nov'17 Dec'17 Jan'18 Feb'18 Mar'18
Central Sector Stations 2,991 2,991 2,991 2,991 2,991 2,991
Talcher – I ( 2 x 500 MW) 417 417 417 417 417 417
Farakka – I & II (1600 MW) 509 509 509 509 509 509
Farakka – III (500 MW) 108 108 108 108 108 108
Kahalgaon – I (840 MW) 355 355 355 355 355 355
Kahalgaon – II (1500 MW) 75 75 75 75 75 75
Barh-II 1059 1059 1059 1059 1059 1059
Korba 0 0 0 0 0 0
Rangit – HEP 21 21 21 21 21 21
Teesta - HEP 108 108 108 108 108 108
Chukha 80 80 80 80 80 80
Tala 260 260 260 260 260 260
Barh Stage-I (3 X 660 MW) 0 0 0 0 0 0
State Generating Stations 484 844 844 844 954 954
KBUNL 1 220 220 220 220 220 220
KBUNL 2 264 264 264 264 264 264
Small Hydro (BSHPCL) 0 0 0 0 0 0
Barauni Stage I 0 110 110 110 220 220
Barauni Stage II 0 250 250 250 250 250
IPP 260.00 260.00 260.00 260.00 260.00 260.00
GMR Kamalanga Energy 260 260 260 260 260 260
Adani Enterprises Limited 0 0 0 0 0 0
JV projects 25.00 25.00 50.00 50.00 50.00 50.00
Nabinagar Railway (4 X 250 Mw) 25 25 50 50 50 50
Nabinagar Stage-I (3 X 660 0 0 0 0 0 0
Nabinagar JV (3 X 660 MW) Stage-II 0 0 0 0 0 0
Renewable 204.00 204.00 224.00 224.00 224.00 224.00
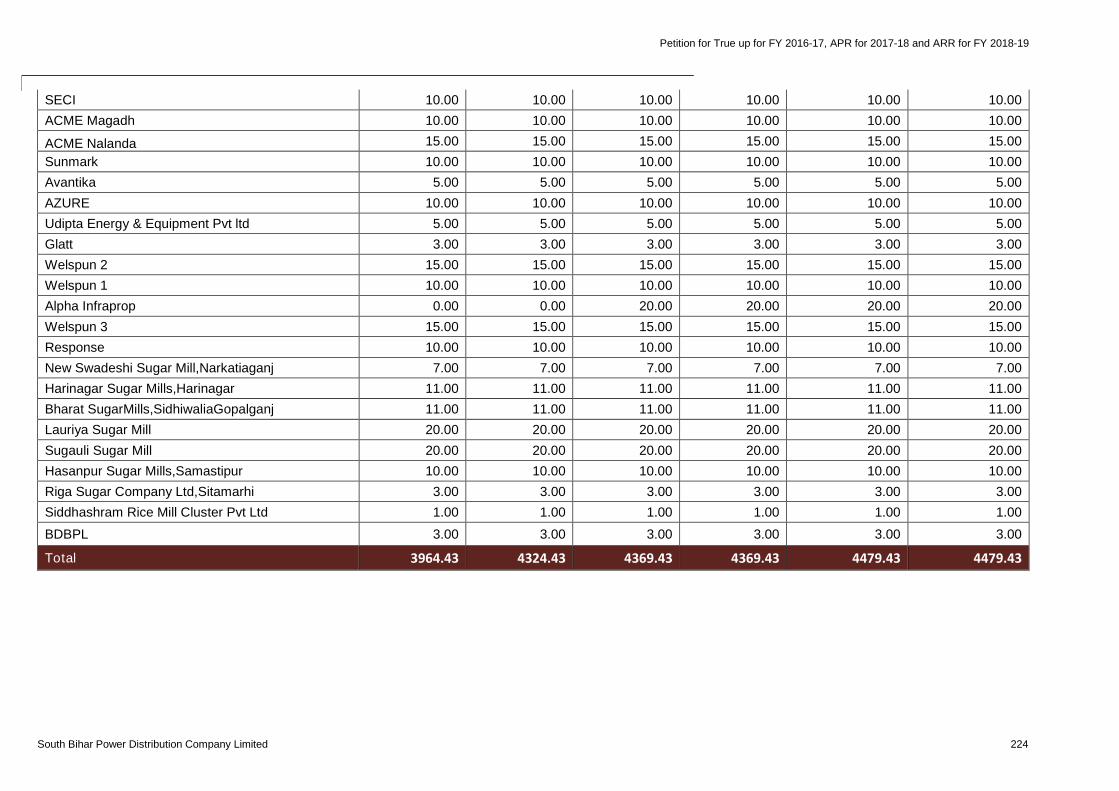
Petition for True up for FY 2016-17, APR for 2017-18 and ARR for FY 2018-19
South Bihar Power Distribution Company Limited 224
SECI 10.00 10.00 10.00 10.00 10.00 10.00
ACME Magadh 10.00 10.00 10.00 10.00 10.00 10.00
ACME Nalanda 15.00 15.00 15.00 15.00 15.00 15.00
Sunmark 10.00 10.00 10.00 10.00 10.00 10.00
Avantika 5.00 5.00 5.00 5.00 5.00 5.00
AZURE 10.00 10.00 10.00 10.00 10.00 10.00
Udipta Energy & Equipment Pvt ltd 5.00 5.00 5.00 5.00 5.00 5.00
Glatt 3.00 3.00 3.00 3.00 3.00 3.00
Welspun 2 15.00 15.00 15.00 15.00 15.00 15.00
Welspun 1 10.00 10.00 10.00 10.00 10.00 10.00
Alpha Infraprop 0.00 0.00 20.00 20.00 20.00 20.00
Welspun 3 15.00 15.00 15.00 15.00 15.00 15.00
Response 10.00 10.00 10.00 10.00 10.00 10.00
New Swadeshi Sugar Mill,Narkatiaganj 7.00 7.00 7.00 7.00 7.00 7.00
Harinagar Sugar Mills,Harinagar 11.00 11.00 11.00 11.00 11.00 11.00
Bharat SugarMills,SidhiwaliaGopalganj 11.00 11.00 11.00 11.00 11.00 11.00
Lauriya Sugar Mill 20.00 20.00 20.00 20.00 20.00 20.00
Sugauli Sugar Mill 20.00 20.00 20.00 20.00 20.00 20.00
Hasanpur Sugar Mills,Samastipur 10.00 10.00 10.00 10.00 10.00 10.00
Riga Sugar Company Ltd,Sitamarhi 3.00 3.00 3.00 3.00 3.00 3.00
Siddhashram Rice Mill Cluster Pvt Ltd 1.00 1.00 1.00 1.00 1.00 1.00
BDBPL 3.00 3.00 3.00 3.00 3.00 3.00
Total 3964.43 4324.43 4369.43 4369.43 4479.43 4479.43
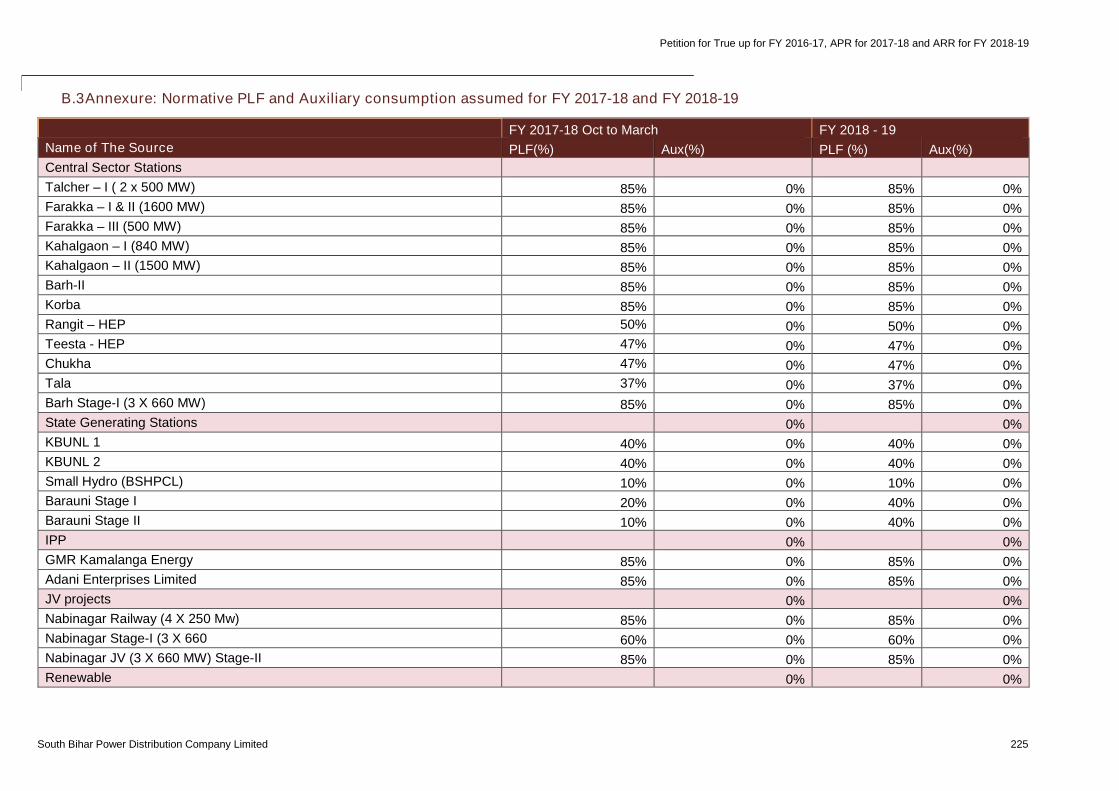
Petition for True up for FY 2016-17, APR for 2017-18 and ARR for FY 2018-19
South Bihar Power Distribution Company Limited 225
B.3Annexure: Normative PLF and Auxiliary consumption assumed for FY 2017-18 and FY 2018-19
FY 2017-18 Oct to March FY 2018 - 19
Name of The Source PLF(%) Aux(%) PLF (%) Aux(%)
Central Sector Stations
Talcher – I ( 2 x 500 MW) 85% 0% 85% 0%
Farakka – I & II (1600 MW) 85% 0% 85% 0%
Farakka – III (500 MW) 85% 0% 85% 0%
Kahalgaon – I (840 MW) 85% 0% 85% 0%
Kahalgaon – II (1500 MW) 85% 0% 85% 0%
Barh-II 85% 0% 85% 0%
Korba 85% 0% 85% 0%
Rangit – HEP 50% 0% 50% 0%
Teesta - HEP 47% 0% 47% 0%
Chukha 47% 0% 47% 0%
Tala 37% 0% 37% 0%
Barh Stage-I (3 X 660 MW) 85% 0% 85% 0%
State Generating Stations 0% 0%
KBUNL 1 40% 0% 40% 0%
KBUNL 2 40% 0% 40% 0%
Small Hydro (BSHPCL) 10% 0% 10% 0%
Barauni Stage I 20% 0% 40% 0%
Barauni Stage II 10% 0% 40% 0%
IPP 0% 0%
GMR Kamalanga Energy 85% 0% 85% 0%
Adani Enterprises Limited 85% 0% 85% 0%
JV projects 0% 0%
Nabinagar Railway (4 X 250 Mw) 85% 0% 85% 0%
Nabinagar Stage-I (3 X 660 60% 0% 60% 0%
Nabinagar JV (3 X 660 MW) Stage-II 85% 0% 85% 0%
Renewable 0% 0%
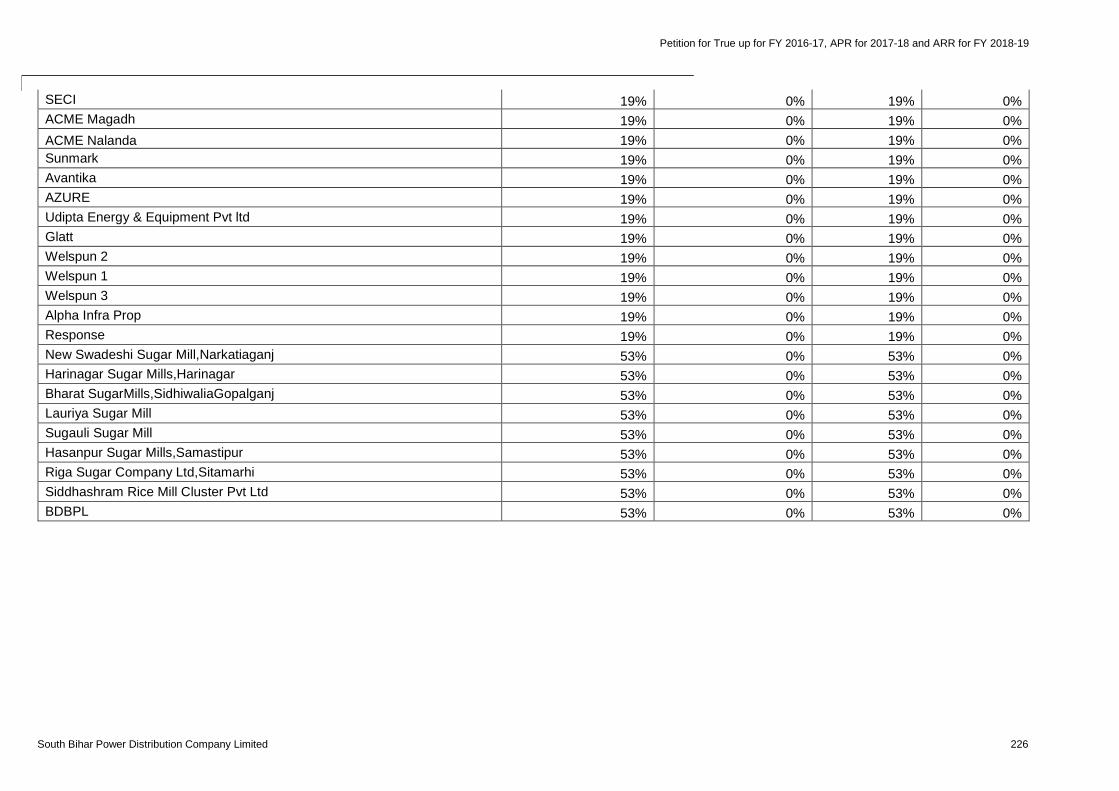
Petition for True up for FY 2016-17, APR for 2017-18 and ARR for FY 2018-19
South Bihar Power Distribution Company Limited 226
SECI 19% 0% 19% 0%
ACME Magadh 19% 0% 19% 0%
ACME Nalanda 19% 0% 19% 0%
Sunmark 19% 0% 19% 0%
Avantika 19% 0% 19% 0%
AZURE 19% 0% 19% 0%
Udipta Energy & Equipment Pvt ltd 19% 0% 19% 0%
Glatt 19% 0% 19% 0%
Welspun 2 19% 0% 19% 0%
Welspun 1 19% 0% 19% 0%
Welspun 3 19% 0% 19% 0%
Alpha Infra Prop 19% 0% 19% 0%
Response 19% 0% 19% 0%
New Swadeshi Sugar Mill,Narkatiaganj 53% 0% 53% 0%
Harinagar Sugar Mills,Harinagar 53% 0% 53% 0%
Bharat SugarMills,SidhiwaliaGopalganj 53% 0% 53% 0%
Lauriya Sugar Mill 53% 0% 53% 0%
Sugauli Sugar Mill 53% 0% 53% 0%
Hasanpur Sugar Mills,Samastipur 53% 0% 53% 0%
Riga Sugar Company Ltd,Sitamarhi 53% 0% 53% 0%
Siddhashram Rice Mill Cluster Pvt Ltd 53% 0% 53% 0%
BDBPL 53% 0% 53% 0%
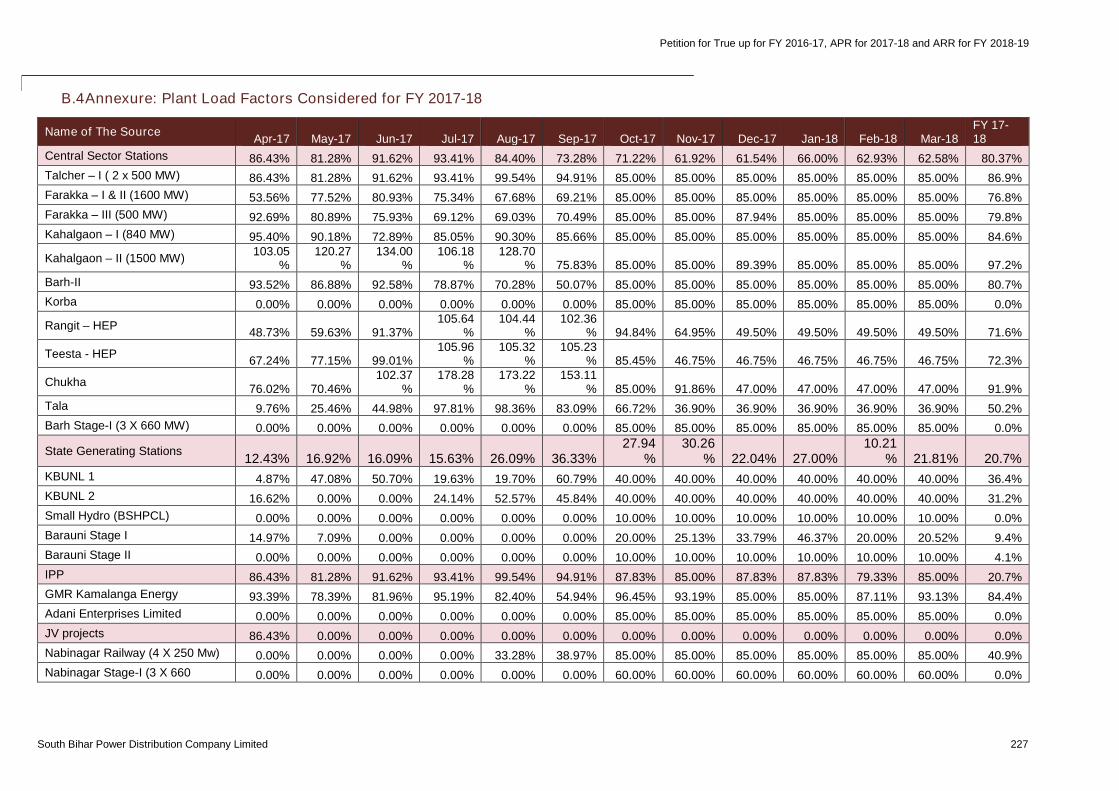
Petition for True up for FY 2016-17, APR for 2017-18 and ARR for FY 2018-19
South Bihar Power Distribution Company Limited 227
B.4Annexure: Plant Load Factors Considered for FY 2017-18
Name of The SourceApr-17 May-17 Jun-17 Jul-17 Aug-17 Sep-17 Oct-17 Nov-17 Dec-17 Jan-18 Feb-18 Mar-18
FY 17-18
Central Sector Stations 86.43% 81.28% 91.62% 93.41% 84.40% 73.28% 71.22% 61.92% 61.54% 66.00% 62.93% 62.58% 80.37%
Talcher – I ( 2 x 500 MW) 86.43% 81.28% 91.62% 93.41% 99.54% 94.91% 85.00% 85.00% 85.00% 85.00% 85.00% 85.00% 86.9%
Farakka – I & II (1600 MW) 53.56% 77.52% 80.93% 75.34% 67.68% 69.21% 85.00% 85.00% 85.00% 85.00% 85.00% 85.00% 76.8%
Farakka – III (500 MW) 92.69% 80.89% 75.93% 69.12% 69.03% 70.49% 85.00% 85.00% 87.94% 85.00% 85.00% 85.00% 79.8%
Kahalgaon – I (840 MW) 95.40% 90.18% 72.89% 85.05% 90.30% 85.66% 85.00% 85.00% 85.00% 85.00% 85.00% 85.00% 84.6%
Kahalgaon – II (1500 MW)103.05
%120.27
%134.00
%106.18
%128.70
% 75.83% 85.00% 85.00% 89.39% 85.00% 85.00% 85.00% 97.2%
Barh-II 93.52% 86.88% 92.58% 78.87% 70.28% 50.07% 85.00% 85.00% 85.00% 85.00% 85.00% 85.00% 80.7%
Korba 0.00% 0.00% 0.00% 0.00% 0.00% 0.00% 85.00% 85.00% 85.00% 85.00% 85.00% 85.00% 0.0%
Rangit – HEP48.73% 59.63% 91.37%
105.64%
104.44%
102.36% 94.84% 64.95% 49.50% 49.50% 49.50% 49.50% 71.6%
Teesta - HEP67.24% 77.15% 99.01%
105.96%
105.32%
105.23% 85.45% 46.75% 46.75% 46.75% 46.75% 46.75% 72.3%
Chukha76.02% 70.46%
102.37%
178.28%
173.22%
153.11% 85.00% 91.86% 47.00% 47.00% 47.00% 47.00% 91.9%
Tala 9.76% 25.46% 44.98% 97.81% 98.36% 83.09% 66.72% 36.90% 36.90% 36.90% 36.90% 36.90% 50.2%
Barh Stage-I (3 X 660 MW) 0.00% 0.00% 0.00% 0.00% 0.00% 0.00% 85.00% 85.00% 85.00% 85.00% 85.00% 85.00% 0.0%
State Generating Stations12.43% 16.92% 16.09% 15.63% 26.09% 36.33%
27.94%
30.26% 22.04% 27.00%
10.21% 21.81% 20.7%
KBUNL 1 4.87% 47.08% 50.70% 19.63% 19.70% 60.79% 40.00% 40.00% 40.00% 40.00% 40.00% 40.00% 36.4%
KBUNL 2 16.62% 0.00% 0.00% 24.14% 52.57% 45.84% 40.00% 40.00% 40.00% 40.00% 40.00% 40.00% 31.2%
Small Hydro (BSHPCL) 0.00% 0.00% 0.00% 0.00% 0.00% 0.00% 10.00% 10.00% 10.00% 10.00% 10.00% 10.00% 0.0%
Barauni Stage I 14.97% 7.09% 0.00% 0.00% 0.00% 0.00% 20.00% 25.13% 33.79% 46.37% 20.00% 20.52% 9.4%
Barauni Stage II 0.00% 0.00% 0.00% 0.00% 0.00% 0.00% 10.00% 10.00% 10.00% 10.00% 10.00% 10.00% 4.1%
IPP 86.43% 81.28% 91.62% 93.41% 99.54% 94.91% 87.83% 85.00% 87.83% 87.83% 79.33% 85.00% 20.7%
GMR Kamalanga Energy 93.39% 78.39% 81.96% 95.19% 82.40% 54.94% 96.45% 93.19% 85.00% 85.00% 87.11% 93.13% 84.4%
Adani Enterprises Limited 0.00% 0.00% 0.00% 0.00% 0.00% 0.00% 85.00% 85.00% 85.00% 85.00% 85.00% 85.00% 0.0%
JV projects 86.43% 0.00% 0.00% 0.00% 0.00% 0.00% 0.00% 0.00% 0.00% 0.00% 0.00% 0.00% 0.0%
Nabinagar Railway (4 X 250 Mw) 0.00% 0.00% 0.00% 0.00% 33.28% 38.97% 85.00% 85.00% 85.00% 85.00% 85.00% 85.00% 40.9%
Nabinagar Stage-I (3 X 660 0.00% 0.00% 0.00% 0.00% 0.00% 0.00% 60.00% 60.00% 60.00% 60.00% 60.00% 60.00% 0.0%
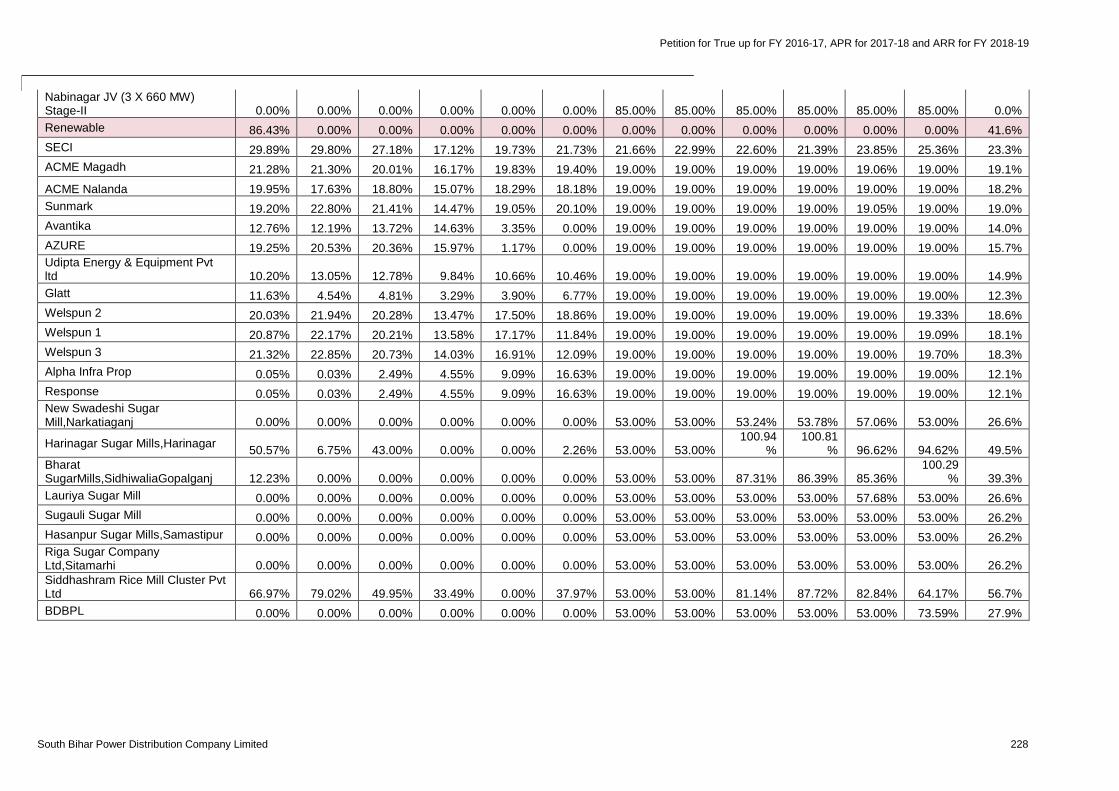
Petition for True up for FY 2016-17, APR for 2017-18 and ARR for FY 2018-19
South Bihar Power Distribution Company Limited 228
Nabinagar JV (3 X 660 MW)Stage-II 0.00% 0.00% 0.00% 0.00% 0.00% 0.00% 85.00% 85.00% 85.00% 85.00% 85.00% 85.00% 0.0%
Renewable 86.43% 0.00% 0.00% 0.00% 0.00% 0.00% 0.00% 0.00% 0.00% 0.00% 0.00% 0.00% 41.6%
SECI 29.89% 29.80% 27.18% 17.12% 19.73% 21.73% 21.66% 22.99% 22.60% 21.39% 23.85% 25.36% 23.3%
ACME Magadh 21.28% 21.30% 20.01% 16.17% 19.83% 19.40% 19.00% 19.00% 19.00% 19.00% 19.06% 19.00% 19.1%
ACME Nalanda 19.95% 17.63% 18.80% 15.07% 18.29% 18.18% 19.00% 19.00% 19.00% 19.00% 19.00% 19.00% 18.2%
Sunmark 19.20% 22.80% 21.41% 14.47% 19.05% 20.10% 19.00% 19.00% 19.00% 19.00% 19.05% 19.00% 19.0%
Avantika 12.76% 12.19% 13.72% 14.63% 3.35% 0.00% 19.00% 19.00% 19.00% 19.00% 19.00% 19.00% 14.0%
AZURE 19.25% 20.53% 20.36% 15.97% 1.17% 0.00% 19.00% 19.00% 19.00% 19.00% 19.00% 19.00% 15.7%Udipta Energy & Equipment Pvtltd 10.20% 13.05% 12.78% 9.84% 10.66% 10.46% 19.00% 19.00% 19.00% 19.00% 19.00% 19.00% 14.9%
Glatt 11.63% 4.54% 4.81% 3.29% 3.90% 6.77% 19.00% 19.00% 19.00% 19.00% 19.00% 19.00% 12.3%
Welspun 2 20.03% 21.94% 20.28% 13.47% 17.50% 18.86% 19.00% 19.00% 19.00% 19.00% 19.00% 19.33% 18.6%
Welspun 1 20.87% 22.17% 20.21% 13.58% 17.17% 11.84% 19.00% 19.00% 19.00% 19.00% 19.00% 19.09% 18.1%
Welspun 3 21.32% 22.85% 20.73% 14.03% 16.91% 12.09% 19.00% 19.00% 19.00% 19.00% 19.00% 19.70% 18.3%
Alpha Infra Prop 0.05% 0.03% 2.49% 4.55% 9.09% 16.63% 19.00% 19.00% 19.00% 19.00% 19.00% 19.00% 12.1%
Response 0.05% 0.03% 2.49% 4.55% 9.09% 16.63% 19.00% 19.00% 19.00% 19.00% 19.00% 19.00% 12.1%New Swadeshi SugarMill,Narkatiaganj 0.00% 0.00% 0.00% 0.00% 0.00% 0.00% 53.00% 53.00% 53.24% 53.78% 57.06% 53.00% 26.6%
Harinagar Sugar Mills,Harinagar50.57% 6.75% 43.00% 0.00% 0.00% 2.26% 53.00% 53.00%
100.94%
100.81% 96.62% 94.62% 49.5%
BharatSugarMills,SidhiwaliaGopalganj 12.23% 0.00% 0.00% 0.00% 0.00% 0.00% 53.00% 53.00% 87.31% 86.39% 85.36%
100.29% 39.3%
Lauriya Sugar Mill 0.00% 0.00% 0.00% 0.00% 0.00% 0.00% 53.00% 53.00% 53.00% 53.00% 57.68% 53.00% 26.6%
Sugauli Sugar Mill 0.00% 0.00% 0.00% 0.00% 0.00% 0.00% 53.00% 53.00% 53.00% 53.00% 53.00% 53.00% 26.2%
Hasanpur Sugar Mills,Samastipur 0.00% 0.00% 0.00% 0.00% 0.00% 0.00% 53.00% 53.00% 53.00% 53.00% 53.00% 53.00% 26.2%Riga Sugar CompanyLtd,Sitamarhi 0.00% 0.00% 0.00% 0.00% 0.00% 0.00% 53.00% 53.00% 53.00% 53.00% 53.00% 53.00% 26.2%Siddhashram Rice Mill Cluster PvtLtd 66.97% 79.02% 49.95% 33.49% 0.00% 37.97% 53.00% 53.00% 81.14% 87.72% 82.84% 64.17% 56.7%
BDBPL 0.00% 0.00% 0.00% 0.00% 0.00% 0.00% 53.00% 53.00% 53.00% 53.00% 53.00% 73.59% 27.9%
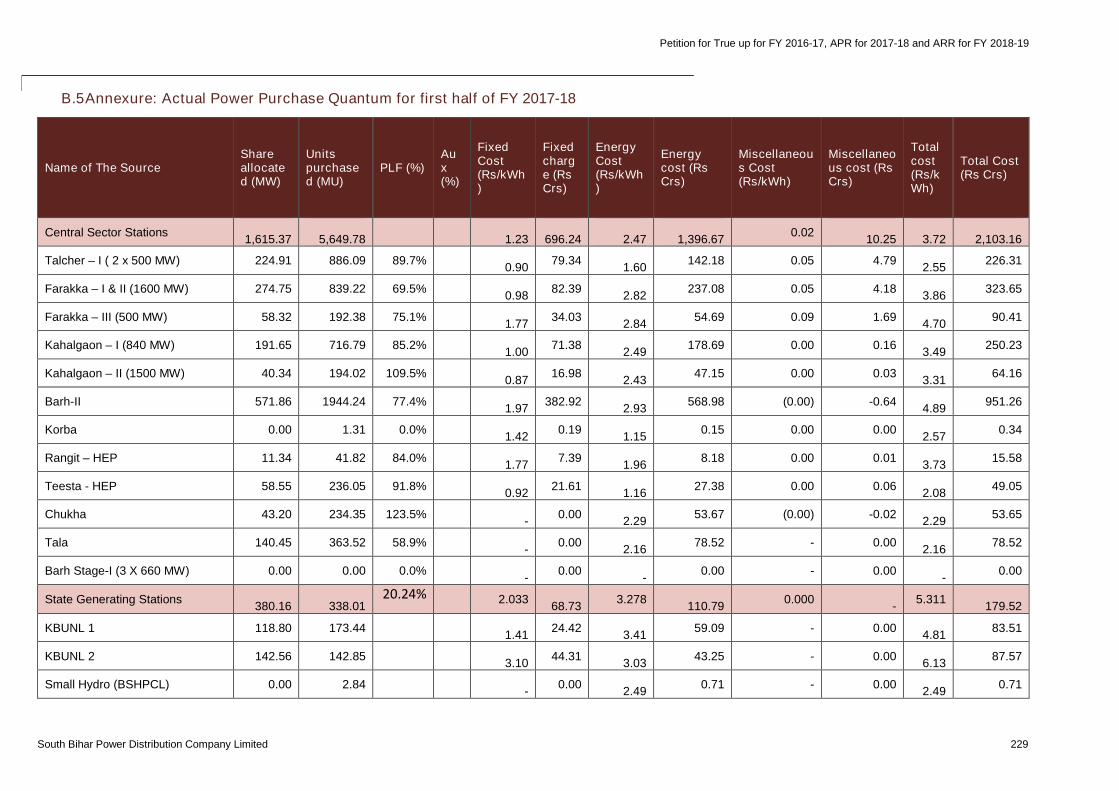
Petition for True up for FY 2016-17, APR for 2017-18 and ARR for FY 2018-19
South Bihar Power Distribution Company Limited 229
B.5Annexure: Actual Power Purchase Quantum for first half of FY 2017-18
Name of The SourceShareallocated (MW)
Unitspurchased (MU)
PLF (%)Aux(%)
FixedCost(Rs/kWh)
Fixedcharge (RsCrs)
EnergyCost(Rs/kWh)
Energycost (RsCrs)
Miscellaneous Cost(Rs/kWh)
Miscellaneous cost (RsCrs)
Totalcost(Rs/kWh)
Total Cost(Rs Crs)
Central Sector Stations1,615.37 5,649.78 1.23 696.24 2.47 1,396.67
0.0210.25 3.72 2,103.16
Talcher – I ( 2 x 500 MW) 224.91 886.09 89.7%0.90
79.341.60
142.18 0.05 4.792.55
226.31
Farakka – I & II (1600 MW) 274.75 839.22 69.5%0.98
82.392.82
237.08 0.05 4.183.86
323.65
Farakka – III (500 MW) 58.32 192.38 75.1%1.77
34.032.84
54.69 0.09 1.694.70
90.41
Kahalgaon – I (840 MW) 191.65 716.79 85.2%1.00
71.382.49
178.69 0.00 0.163.49
250.23
Kahalgaon – II (1500 MW) 40.34 194.02 109.5%0.87
16.982.43
47.15 0.00 0.033.31
64.16
Barh-II 571.86 1944.24 77.4%1.97
382.922.93
568.98 (0.00) -0.644.89
951.26
Korba 0.00 1.31 0.0%1.42
0.191.15
0.15 0.00 0.002.57
0.34
Rangit – HEP 11.34 41.82 84.0%1.77
7.391.96
8.18 0.00 0.013.73
15.58
Teesta - HEP 58.55 236.05 91.8%0.92
21.611.16
27.38 0.00 0.062.08
49.05
Chukha 43.20 234.35 123.5%-
0.002.29
53.67 (0.00) -0.022.29
53.65
Tala 140.45 363.52 58.9%-
0.002.16
78.52 - 0.002.16
78.52
Barh Stage-I (3 X 660 MW) 0.00 0.00 0.0%-
0.00-
0.00 - 0.00-
0.00
State Generating Stations380.16 338.01
20.24% 2.03368.73
3.278110.79
0.000-
5.311179.52
KBUNL 1 118.80 173.441.41
24.423.41
59.09 - 0.004.81
83.51
KBUNL 2 142.56 142.853.10
44.313.03
43.25 - 0.006.13
87.57
Small Hydro (BSHPCL) 0.00 2.84-
0.002.49
0.71 - 0.002.49
0.71
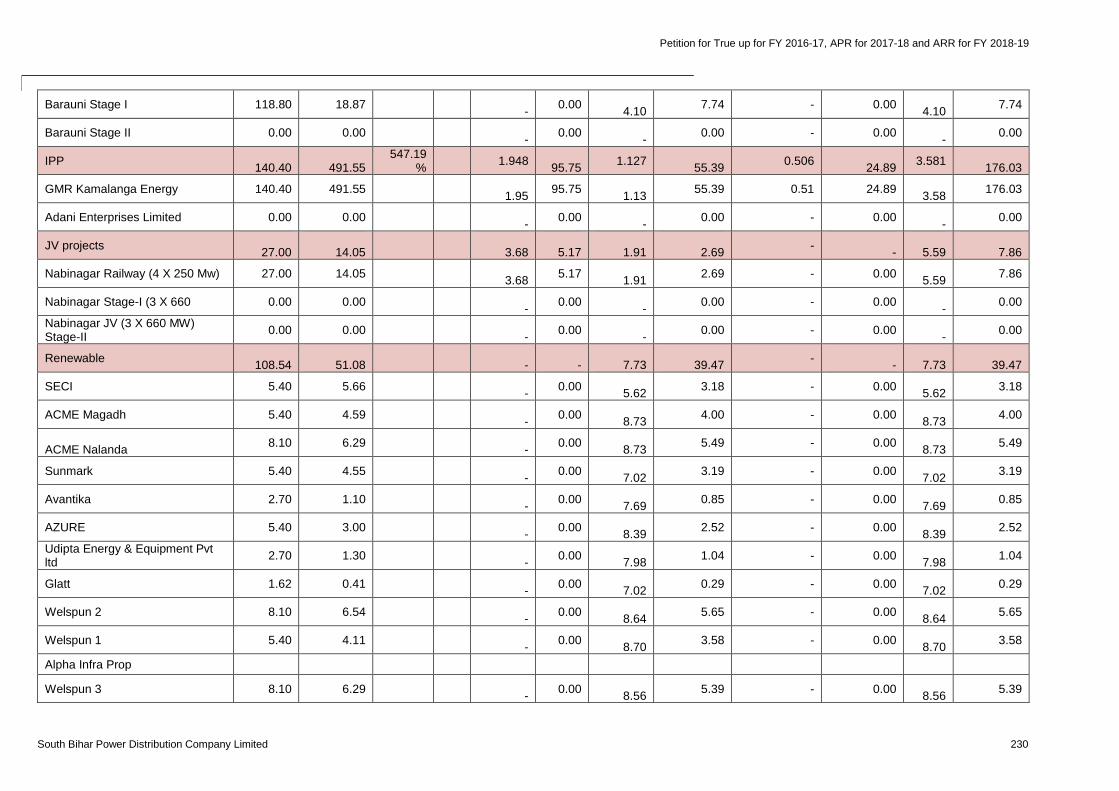
Petition for True up for FY 2016-17, APR for 2017-18 and ARR for FY 2018-19
South Bihar Power Distribution Company Limited 230
Barauni Stage I 118.80 18.87-
0.004.10
7.74 - 0.004.10
7.74
Barauni Stage II 0.00 0.00-
0.00-
0.00 - 0.00-
0.00
IPP140.40 491.55
547.19%
1.94895.75
1.12755.39
0.50624.89
3.581176.03
GMR Kamalanga Energy 140.40 491.551.95
95.751.13
55.39 0.51 24.893.58
176.03
Adani Enterprises Limited 0.00 0.00-
0.00-
0.00 - 0.00-
0.00
JV projects27.00 14.05 3.68 5.17 1.91 2.69
-- 5.59 7.86
Nabinagar Railway (4 X 250 Mw) 27.00 14.053.68
5.171.91
2.69 - 0.005.59
7.86
Nabinagar Stage-I (3 X 660 0.00 0.00-
0.00-
0.00 - 0.00-
0.00
Nabinagar JV (3 X 660 MW)Stage-II
0.00 0.00-
0.00-
0.00 - 0.00-
0.00
Renewable108.54 51.08 - - 7.73 39.47
-- 7.73 39.47
SECI 5.40 5.66-
0.005.62
3.18 - 0.005.62
3.18
ACME Magadh 5.40 4.59-
0.008.73
4.00 - 0.008.73
4.00
ACME Nalanda8.10 6.29
-0.00
8.735.49 - 0.00
8.735.49
Sunmark 5.40 4.55-
0.007.02
3.19 - 0.007.02
3.19
Avantika 2.70 1.10-
0.007.69
0.85 - 0.007.69
0.85
AZURE 5.40 3.00-
0.008.39
2.52 - 0.008.39
2.52
Udipta Energy & Equipment Pvtltd
2.70 1.30-
0.007.98
1.04 - 0.007.98
1.04
Glatt 1.62 0.41-
0.007.02
0.29 - 0.007.02
0.29
Welspun 2 8.10 6.54-
0.008.64
5.65 - 0.008.64
5.65
Welspun 1 5.40 4.11-
0.008.70
3.58 - 0.008.70
3.58
Alpha Infra Prop
Welspun 3 8.10 6.29-
0.008.56
5.39 - 0.008.56
5.39
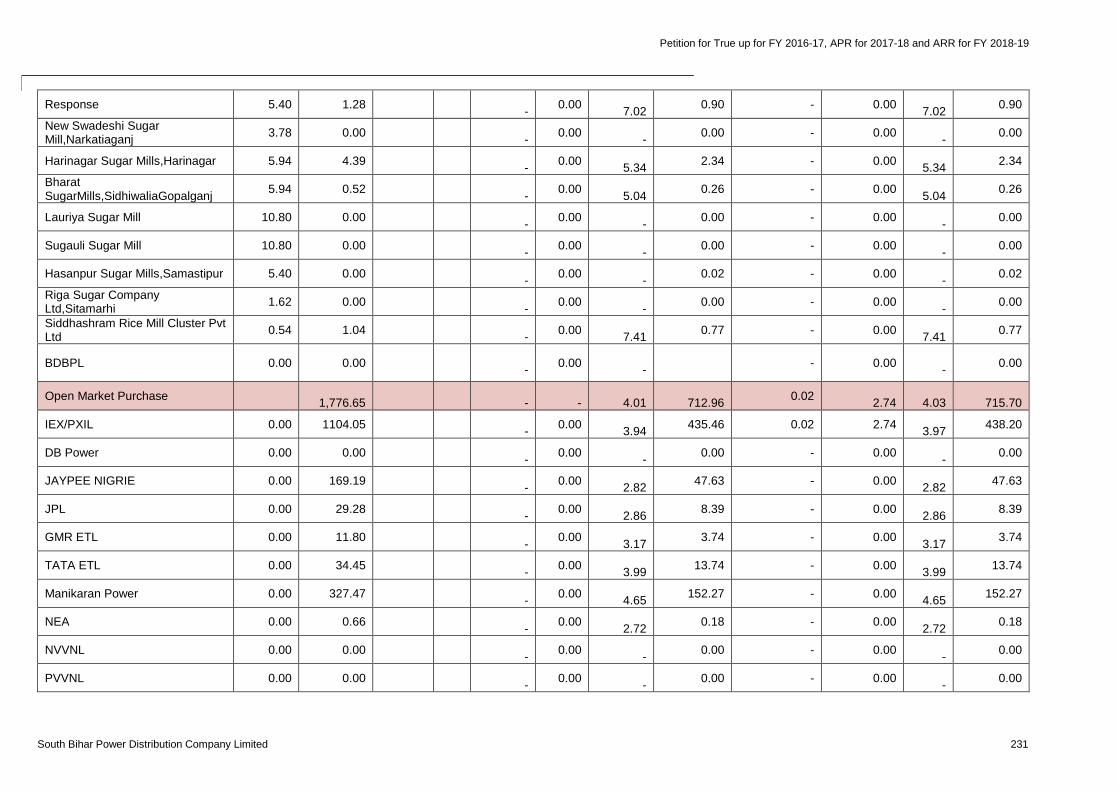
Petition for True up for FY 2016-17, APR for 2017-18 and ARR for FY 2018-19
South Bihar Power Distribution Company Limited 231
Response 5.40 1.28-
0.007.02
0.90 - 0.007.02
0.90
New Swadeshi SugarMill,Narkatiaganj
3.78 0.00-
0.00-
0.00 - 0.00-
0.00
Harinagar Sugar Mills,Harinagar 5.94 4.39-
0.005.34
2.34 - 0.005.34
2.34
BharatSugarMills,SidhiwaliaGopalganj
5.94 0.52-
0.005.04
0.26 - 0.005.04
0.26
Lauriya Sugar Mill 10.80 0.00-
0.00-
0.00 - 0.00-
0.00
Sugauli Sugar Mill 10.80 0.00-
0.00-
0.00 - 0.00-
0.00
Hasanpur Sugar Mills,Samastipur 5.40 0.00-
0.00-
0.02 - 0.00-
0.02
Riga Sugar CompanyLtd,Sitamarhi
1.62 0.00-
0.00-
0.00 - 0.00-
0.00
Siddhashram Rice Mill Cluster PvtLtd
0.54 1.04-
0.007.41
0.77 - 0.007.41
0.77
BDBPL 0.00 0.00-
0.00-
- 0.00-
0.00
Open Market Purchase1,776.65 - - 4.01 712.96
0.022.74 4.03 715.70
IEX/PXIL 0.00 1104.05-
0.003.94
435.46 0.02 2.743.97
438.20
DB Power 0.00 0.00-
0.00-
0.00 - 0.00-
0.00
JAYPEE NIGRIE 0.00 169.19-
0.002.82
47.63 - 0.002.82
47.63
JPL 0.00 29.28-
0.002.86
8.39 - 0.002.86
8.39
GMR ETL 0.00 11.80-
0.003.17
3.74 - 0.003.17
3.74
TATA ETL 0.00 34.45-
0.003.99
13.74 - 0.003.99
13.74
Manikaran Power 0.00 327.47-
0.004.65
152.27 - 0.004.65
152.27
NEA 0.00 0.66-
0.002.72
0.18 - 0.002.72
0.18
NVVNL 0.00 0.00-
0.00-
0.00 - 0.00-
0.00
PVVNL 0.00 0.00-
0.00-
0.00 - 0.00-
0.00
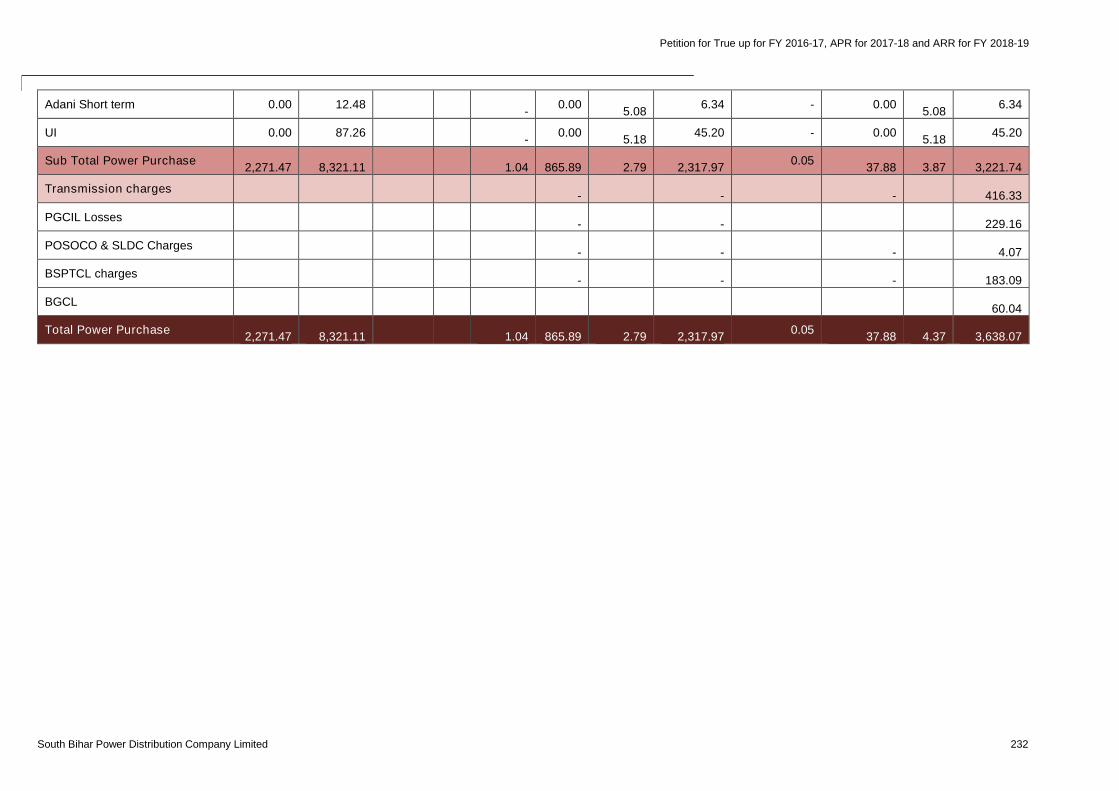
Petition for True up for FY 2016-17, APR for 2017-18 and ARR for FY 2018-19
South Bihar Power Distribution Company Limited 232
Adani Short term 0.00 12.48-
0.005.08
6.34 - 0.005.08
6.34
UI 0.00 87.26-
0.005.18
45.20 - 0.005.18
45.20
Sub Total Power Purchase2,271.47 8,321.11 1.04 865.89 2.79 2,317.97
0.0537.88 3.87 3,221.74
Transmission charges- - - 416.33
PGCIL Losses- - 229.16
POSOCO & SLDC Charges- - - 4.07
BSPTCL charges- - - 183.09
BGCL60.04
Total Power Purchase2,271.47 8,321.11 1.04 865.89 2.79 2,317.97
0.0537.88 4.37 3,638.07
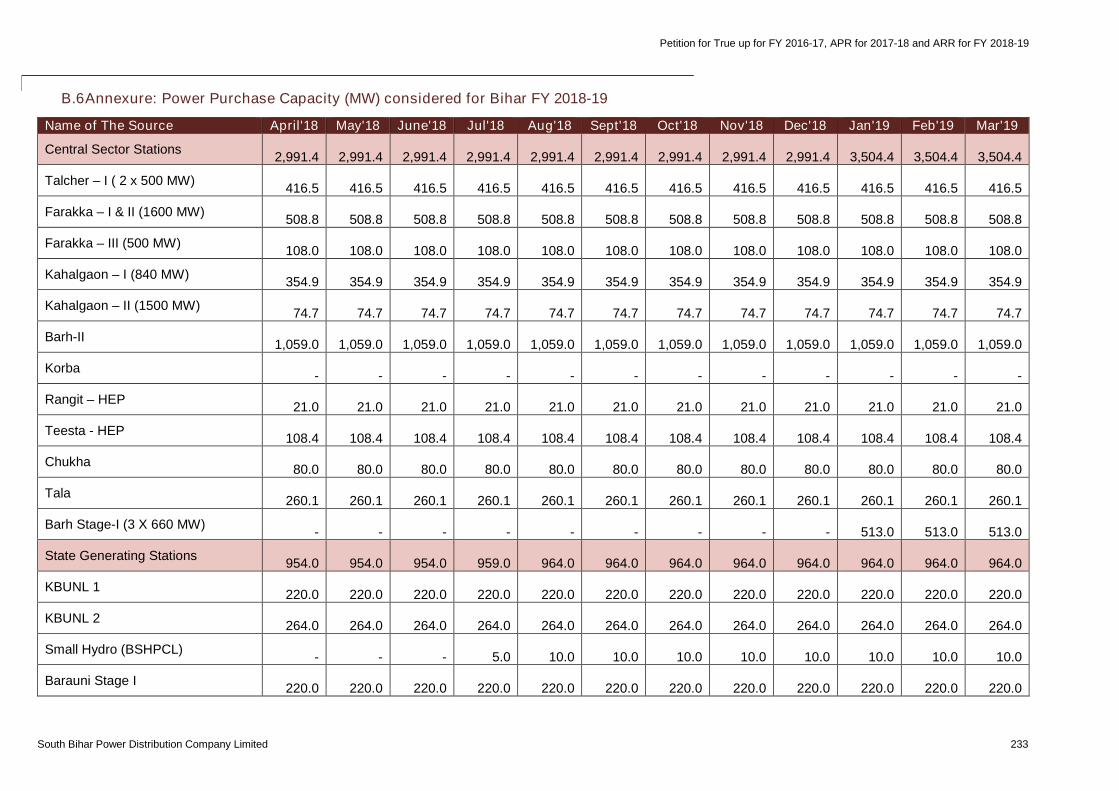
Petition for True up for FY 2016-17, APR for 2017-18 and ARR for FY 2018-19
South Bihar Power Distribution Company Limited 233
B.6Annexure: Power Purchase Capacity (MW) considered for Bihar FY 2018-19
Name of The Source April'18 May'18 June'18 Jul'18 Aug'18 Sept'18 Oct'18 Nov'18 Dec'18 Jan'19 Feb'19 Mar'19
Central Sector Stations2,991.4 2,991.4 2,991.4 2,991.4 2,991.4 2,991.4 2,991.4 2,991.4 2,991.4 3,504.4 3,504.4 3,504.4
Talcher – I ( 2 x 500 MW)416.5 416.5 416.5 416.5 416.5 416.5 416.5 416.5 416.5 416.5 416.5 416.5
Farakka – I & II (1600 MW)508.8 508.8 508.8 508.8 508.8 508.8 508.8 508.8 508.8 508.8 508.8 508.8
Farakka – III (500 MW)108.0 108.0 108.0 108.0 108.0 108.0 108.0 108.0 108.0 108.0 108.0 108.0
Kahalgaon – I (840 MW)354.9 354.9 354.9 354.9 354.9 354.9 354.9 354.9 354.9 354.9 354.9 354.9
Kahalgaon – II (1500 MW)74.7 74.7 74.7 74.7 74.7 74.7 74.7 74.7 74.7 74.7 74.7 74.7
Barh-II1,059.0 1,059.0 1,059.0 1,059.0 1,059.0 1,059.0 1,059.0 1,059.0 1,059.0 1,059.0 1,059.0 1,059.0
Korba- - - - - - - - - - - -
Rangit – HEP21.0 21.0 21.0 21.0 21.0 21.0 21.0 21.0 21.0 21.0 21.0 21.0
Teesta - HEP108.4 108.4 108.4 108.4 108.4 108.4 108.4 108.4 108.4 108.4 108.4 108.4
Chukha80.0 80.0 80.0 80.0 80.0 80.0 80.0 80.0 80.0 80.0 80.0 80.0
Tala260.1 260.1 260.1 260.1 260.1 260.1 260.1 260.1 260.1 260.1 260.1 260.1
Barh Stage-I (3 X 660 MW)- - - - - - - - - 513.0 513.0 513.0
State Generating Stations954.0 954.0 954.0 959.0 964.0 964.0 964.0 964.0 964.0 964.0 964.0 964.0
KBUNL 1220.0 220.0 220.0 220.0 220.0 220.0 220.0 220.0 220.0 220.0 220.0 220.0
KBUNL 2264.0 264.0 264.0 264.0 264.0 264.0 264.0 264.0 264.0 264.0 264.0 264.0
Small Hydro (BSHPCL)- - - 5.0 10.0 10.0 10.0 10.0 10.0 10.0 10.0 10.0
Barauni Stage I220.0 220.0 220.0 220.0 220.0 220.0 220.0 220.0 220.0 220.0 220.0 220.0
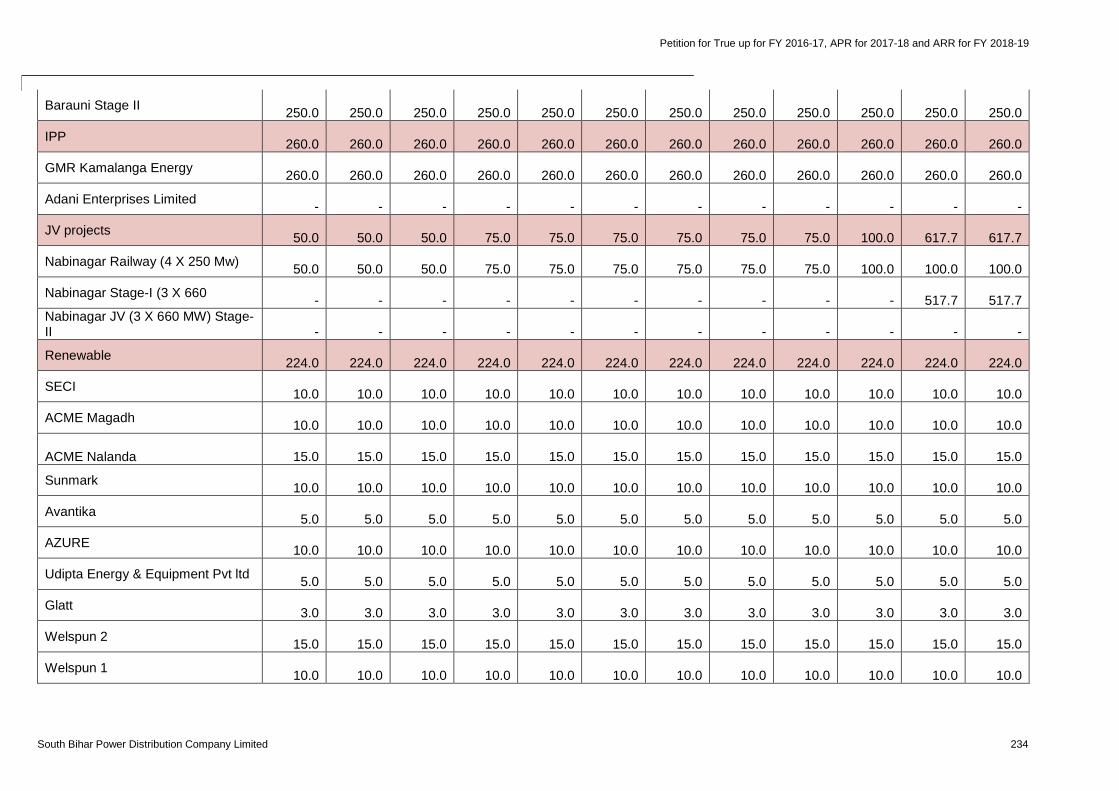
Petition for True up for FY 2016-17, APR for 2017-18 and ARR for FY 2018-19
South Bihar Power Distribution Company Limited 234
Barauni Stage II250.0 250.0 250.0 250.0 250.0 250.0 250.0 250.0 250.0 250.0 250.0 250.0
IPP260.0 260.0 260.0 260.0 260.0 260.0 260.0 260.0 260.0 260.0 260.0 260.0
GMR Kamalanga Energy260.0 260.0 260.0 260.0 260.0 260.0 260.0 260.0 260.0 260.0 260.0 260.0
Adani Enterprises Limited- - - - - - - - - - - -
JV projects50.0 50.0 50.0 75.0 75.0 75.0 75.0 75.0 75.0 100.0 617.7 617.7
Nabinagar Railway (4 X 250 Mw)50.0 50.0 50.0 75.0 75.0 75.0 75.0 75.0 75.0 100.0 100.0 100.0
Nabinagar Stage-I (3 X 660- - - - - - - - - - 517.7 517.7
Nabinagar JV (3 X 660 MW) Stage-II - - - - - - - - - - - -
Renewable224.0 224.0 224.0 224.0 224.0 224.0 224.0 224.0 224.0 224.0 224.0 224.0
SECI10.0 10.0 10.0 10.0 10.0 10.0 10.0 10.0 10.0 10.0 10.0 10.0
ACME Magadh10.0 10.0 10.0 10.0 10.0 10.0 10.0 10.0 10.0 10.0 10.0 10.0
ACME Nalanda 15.0 15.0 15.0 15.0 15.0 15.0 15.0 15.0 15.0 15.0 15.0 15.0
Sunmark10.0 10.0 10.0 10.0 10.0 10.0 10.0 10.0 10.0 10.0 10.0 10.0
Avantika5.0 5.0 5.0 5.0 5.0 5.0 5.0 5.0 5.0 5.0 5.0 5.0
AZURE10.0 10.0 10.0 10.0 10.0 10.0 10.0 10.0 10.0 10.0 10.0 10.0
Udipta Energy & Equipment Pvt ltd5.0 5.0 5.0 5.0 5.0 5.0 5.0 5.0 5.0 5.0 5.0 5.0
Glatt3.0 3.0 3.0 3.0 3.0 3.0 3.0 3.0 3.0 3.0 3.0 3.0
Welspun 215.0 15.0 15.0 15.0 15.0 15.0 15.0 15.0 15.0 15.0 15.0 15.0
Welspun 110.0 10.0 10.0 10.0 10.0 10.0 10.0 10.0 10.0 10.0 10.0 10.0
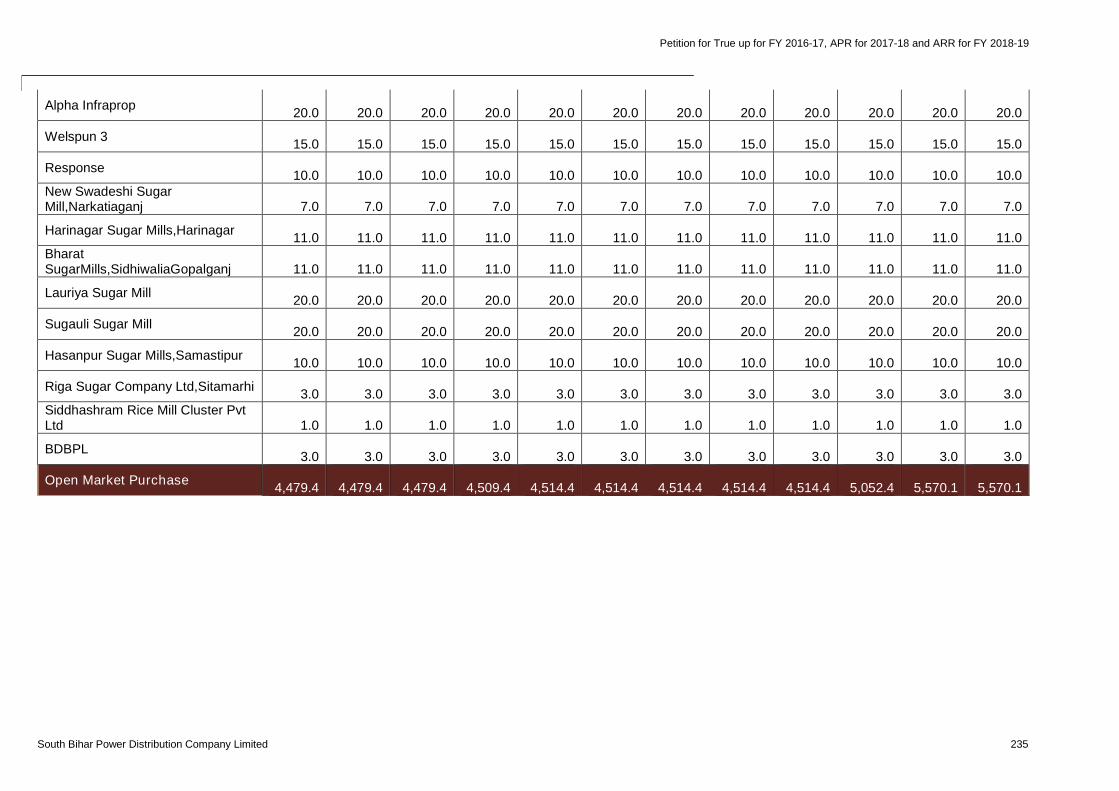
Petition for True up for FY 2016-17, APR for 2017-18 and ARR for FY 2018-19
South Bihar Power Distribution Company Limited 235
Alpha Infraprop20.0 20.0 20.0 20.0 20.0 20.0 20.0 20.0 20.0 20.0 20.0 20.0
Welspun 315.0 15.0 15.0 15.0 15.0 15.0 15.0 15.0 15.0 15.0 15.0 15.0
Response10.0 10.0 10.0 10.0 10.0 10.0 10.0 10.0 10.0 10.0 10.0 10.0
New Swadeshi SugarMill,Narkatiaganj 7.0 7.0 7.0 7.0 7.0 7.0 7.0 7.0 7.0 7.0 7.0 7.0
Harinagar Sugar Mills,Harinagar11.0 11.0 11.0 11.0 11.0 11.0 11.0 11.0 11.0 11.0 11.0 11.0
BharatSugarMills,SidhiwaliaGopalganj 11.0 11.0 11.0 11.0 11.0 11.0 11.0 11.0 11.0 11.0 11.0 11.0
Lauriya Sugar Mill20.0 20.0 20.0 20.0 20.0 20.0 20.0 20.0 20.0 20.0 20.0 20.0
Sugauli Sugar Mill20.0 20.0 20.0 20.0 20.0 20.0 20.0 20.0 20.0 20.0 20.0 20.0
Hasanpur Sugar Mills,Samastipur10.0 10.0 10.0 10.0 10.0 10.0 10.0 10.0 10.0 10.0 10.0 10.0
Riga Sugar Company Ltd,Sitamarhi3.0 3.0 3.0 3.0 3.0 3.0 3.0 3.0 3.0 3.0 3.0 3.0
Siddhashram Rice Mill Cluster PvtLtd 1.0 1.0 1.0 1.0 1.0 1.0 1.0 1.0 1.0 1.0 1.0 1.0
BDBPL3.0 3.0 3.0 3.0 3.0 3.0 3.0 3.0 3.0 3.0 3.0 3.0
Open Market Purchase4,479.4 4,479.4 4,479.4 4,509.4 4,514.4 4,514.4 4,514.4 4,514.4 4,514.4 5,052.4 5,570.1 5,570.1
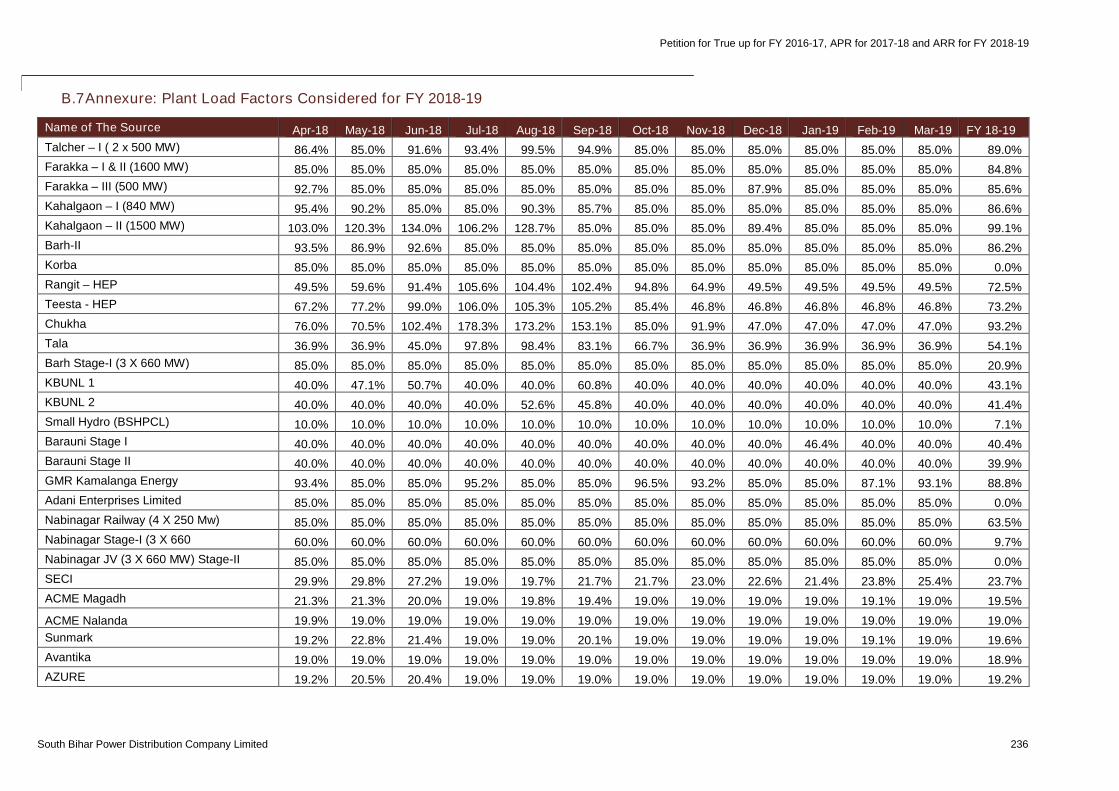
Petition for True up for FY 2016-17, APR for 2017-18 and ARR for FY 2018-19
South Bihar Power Distribution Company Limited 236
B.7Annexure: Plant Load Factors Considered for FY 2018-19
Name of The Source Apr-18 May-18 Jun-18 Jul-18 Aug-18 Sep-18 Oct-18 Nov-18 Dec-18 Jan-19 Feb-19 Mar-19 FY 18-19
Talcher – I ( 2 x 500 MW) 86.4% 85.0% 91.6% 93.4% 99.5% 94.9% 85.0% 85.0% 85.0% 85.0% 85.0% 85.0% 89.0%
Farakka – I & II (1600 MW) 85.0% 85.0% 85.0% 85.0% 85.0% 85.0% 85.0% 85.0% 85.0% 85.0% 85.0% 85.0% 84.8%
Farakka – III (500 MW) 92.7% 85.0% 85.0% 85.0% 85.0% 85.0% 85.0% 85.0% 87.9% 85.0% 85.0% 85.0% 85.6%
Kahalgaon – I (840 MW) 95.4% 90.2% 85.0% 85.0% 90.3% 85.7% 85.0% 85.0% 85.0% 85.0% 85.0% 85.0% 86.6%
Kahalgaon – II (1500 MW) 103.0% 120.3% 134.0% 106.2% 128.7% 85.0% 85.0% 85.0% 89.4% 85.0% 85.0% 85.0% 99.1%
Barh-II 93.5% 86.9% 92.6% 85.0% 85.0% 85.0% 85.0% 85.0% 85.0% 85.0% 85.0% 85.0% 86.2%
Korba 85.0% 85.0% 85.0% 85.0% 85.0% 85.0% 85.0% 85.0% 85.0% 85.0% 85.0% 85.0% 0.0%
Rangit – HEP 49.5% 59.6% 91.4% 105.6% 104.4% 102.4% 94.8% 64.9% 49.5% 49.5% 49.5% 49.5% 72.5%
Teesta - HEP 67.2% 77.2% 99.0% 106.0% 105.3% 105.2% 85.4% 46.8% 46.8% 46.8% 46.8% 46.8% 73.2%
Chukha 76.0% 70.5% 102.4% 178.3% 173.2% 153.1% 85.0% 91.9% 47.0% 47.0% 47.0% 47.0% 93.2%
Tala 36.9% 36.9% 45.0% 97.8% 98.4% 83.1% 66.7% 36.9% 36.9% 36.9% 36.9% 36.9% 54.1%
Barh Stage-I (3 X 660 MW) 85.0% 85.0% 85.0% 85.0% 85.0% 85.0% 85.0% 85.0% 85.0% 85.0% 85.0% 85.0% 20.9%
KBUNL 1 40.0% 47.1% 50.7% 40.0% 40.0% 60.8% 40.0% 40.0% 40.0% 40.0% 40.0% 40.0% 43.1%
KBUNL 2 40.0% 40.0% 40.0% 40.0% 52.6% 45.8% 40.0% 40.0% 40.0% 40.0% 40.0% 40.0% 41.4%
Small Hydro (BSHPCL) 10.0% 10.0% 10.0% 10.0% 10.0% 10.0% 10.0% 10.0% 10.0% 10.0% 10.0% 10.0% 7.1%
Barauni Stage I 40.0% 40.0% 40.0% 40.0% 40.0% 40.0% 40.0% 40.0% 40.0% 46.4% 40.0% 40.0% 40.4%
Barauni Stage II 40.0% 40.0% 40.0% 40.0% 40.0% 40.0% 40.0% 40.0% 40.0% 40.0% 40.0% 40.0% 39.9%
GMR Kamalanga Energy 93.4% 85.0% 85.0% 95.2% 85.0% 85.0% 96.5% 93.2% 85.0% 85.0% 87.1% 93.1% 88.8%
Adani Enterprises Limited 85.0% 85.0% 85.0% 85.0% 85.0% 85.0% 85.0% 85.0% 85.0% 85.0% 85.0% 85.0% 0.0%
Nabinagar Railway (4 X 250 Mw) 85.0% 85.0% 85.0% 85.0% 85.0% 85.0% 85.0% 85.0% 85.0% 85.0% 85.0% 85.0% 63.5%
Nabinagar Stage-I (3 X 660 60.0% 60.0% 60.0% 60.0% 60.0% 60.0% 60.0% 60.0% 60.0% 60.0% 60.0% 60.0% 9.7%
Nabinagar JV (3 X 660 MW) Stage-II 85.0% 85.0% 85.0% 85.0% 85.0% 85.0% 85.0% 85.0% 85.0% 85.0% 85.0% 85.0% 0.0%
SECI 29.9% 29.8% 27.2% 19.0% 19.7% 21.7% 21.7% 23.0% 22.6% 21.4% 23.8% 25.4% 23.7%
ACME Magadh 21.3% 21.3% 20.0% 19.0% 19.8% 19.4% 19.0% 19.0% 19.0% 19.0% 19.1% 19.0% 19.5%
ACME Nalanda 19.9% 19.0% 19.0% 19.0% 19.0% 19.0% 19.0% 19.0% 19.0% 19.0% 19.0% 19.0% 19.0%
Sunmark 19.2% 22.8% 21.4% 19.0% 19.0% 20.1% 19.0% 19.0% 19.0% 19.0% 19.1% 19.0% 19.6%
Avantika 19.0% 19.0% 19.0% 19.0% 19.0% 19.0% 19.0% 19.0% 19.0% 19.0% 19.0% 19.0% 18.9%
AZURE 19.2% 20.5% 20.4% 19.0% 19.0% 19.0% 19.0% 19.0% 19.0% 19.0% 19.0% 19.0% 19.2%
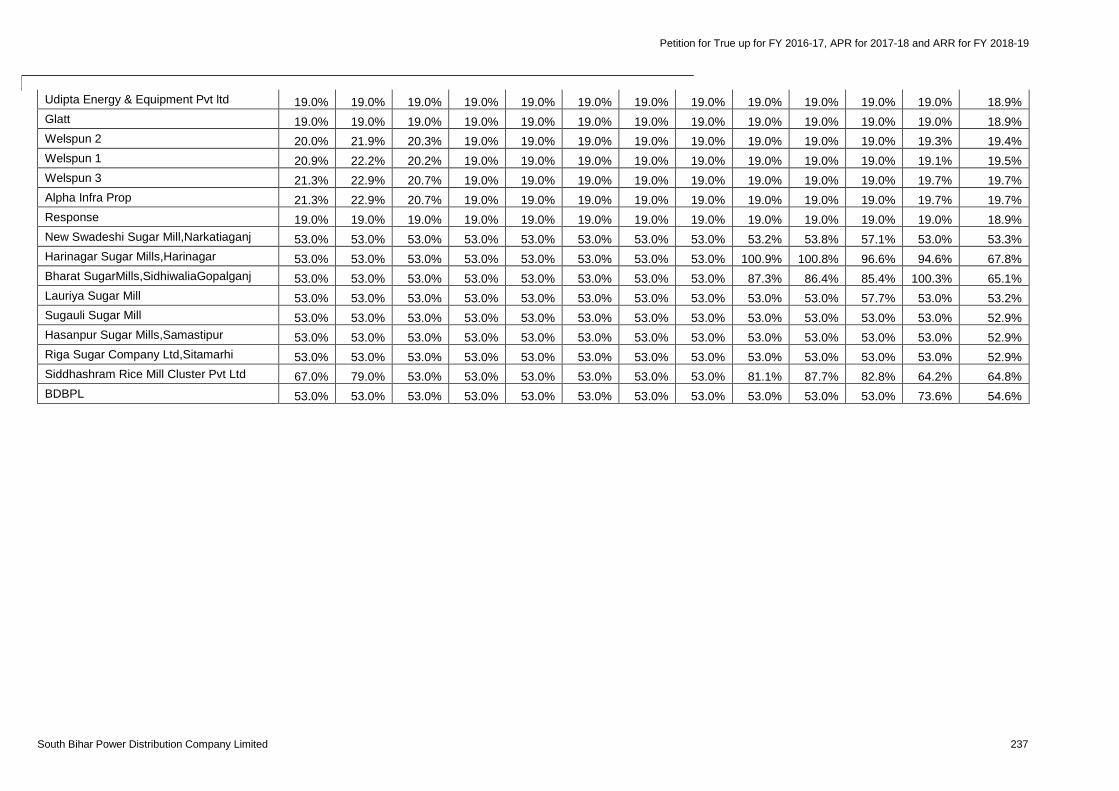
Petition for True up for FY 2016-17, APR for 2017-18 and ARR for FY 2018-19
South Bihar Power Distribution Company Limited 237
Udipta Energy & Equipment Pvt ltd 19.0% 19.0% 19.0% 19.0% 19.0% 19.0% 19.0% 19.0% 19.0% 19.0% 19.0% 19.0% 18.9%
Glatt 19.0% 19.0% 19.0% 19.0% 19.0% 19.0% 19.0% 19.0% 19.0% 19.0% 19.0% 19.0% 18.9%
Welspun 2 20.0% 21.9% 20.3% 19.0% 19.0% 19.0% 19.0% 19.0% 19.0% 19.0% 19.0% 19.3% 19.4%
Welspun 1 20.9% 22.2% 20.2% 19.0% 19.0% 19.0% 19.0% 19.0% 19.0% 19.0% 19.0% 19.1% 19.5%
Welspun 3 21.3% 22.9% 20.7% 19.0% 19.0% 19.0% 19.0% 19.0% 19.0% 19.0% 19.0% 19.7% 19.7%
Alpha Infra Prop 21.3% 22.9% 20.7% 19.0% 19.0% 19.0% 19.0% 19.0% 19.0% 19.0% 19.0% 19.7% 19.7%
Response 19.0% 19.0% 19.0% 19.0% 19.0% 19.0% 19.0% 19.0% 19.0% 19.0% 19.0% 19.0% 18.9%
New Swadeshi Sugar Mill,Narkatiaganj 53.0% 53.0% 53.0% 53.0% 53.0% 53.0% 53.0% 53.0% 53.2% 53.8% 57.1% 53.0% 53.3%
Harinagar Sugar Mills,Harinagar 53.0% 53.0% 53.0% 53.0% 53.0% 53.0% 53.0% 53.0% 100.9% 100.8% 96.6% 94.6% 67.8%
Bharat SugarMills,SidhiwaliaGopalganj 53.0% 53.0% 53.0% 53.0% 53.0% 53.0% 53.0% 53.0% 87.3% 86.4% 85.4% 100.3% 65.1%
Lauriya Sugar Mill 53.0% 53.0% 53.0% 53.0% 53.0% 53.0% 53.0% 53.0% 53.0% 53.0% 57.7% 53.0% 53.2%
Sugauli Sugar Mill 53.0% 53.0% 53.0% 53.0% 53.0% 53.0% 53.0% 53.0% 53.0% 53.0% 53.0% 53.0% 52.9%
Hasanpur Sugar Mills,Samastipur 53.0% 53.0% 53.0% 53.0% 53.0% 53.0% 53.0% 53.0% 53.0% 53.0% 53.0% 53.0% 52.9%
Riga Sugar Company Ltd,Sitamarhi 53.0% 53.0% 53.0% 53.0% 53.0% 53.0% 53.0% 53.0% 53.0% 53.0% 53.0% 53.0% 52.9%
Siddhashram Rice Mill Cluster Pvt Ltd 67.0% 79.0% 53.0% 53.0% 53.0% 53.0% 53.0% 53.0% 81.1% 87.7% 82.8% 64.2% 64.8%
BDBPL 53.0% 53.0% 53.0% 53.0% 53.0% 53.0% 53.0% 53.0% 53.0% 53.0% 53.0% 73.6% 54.6%
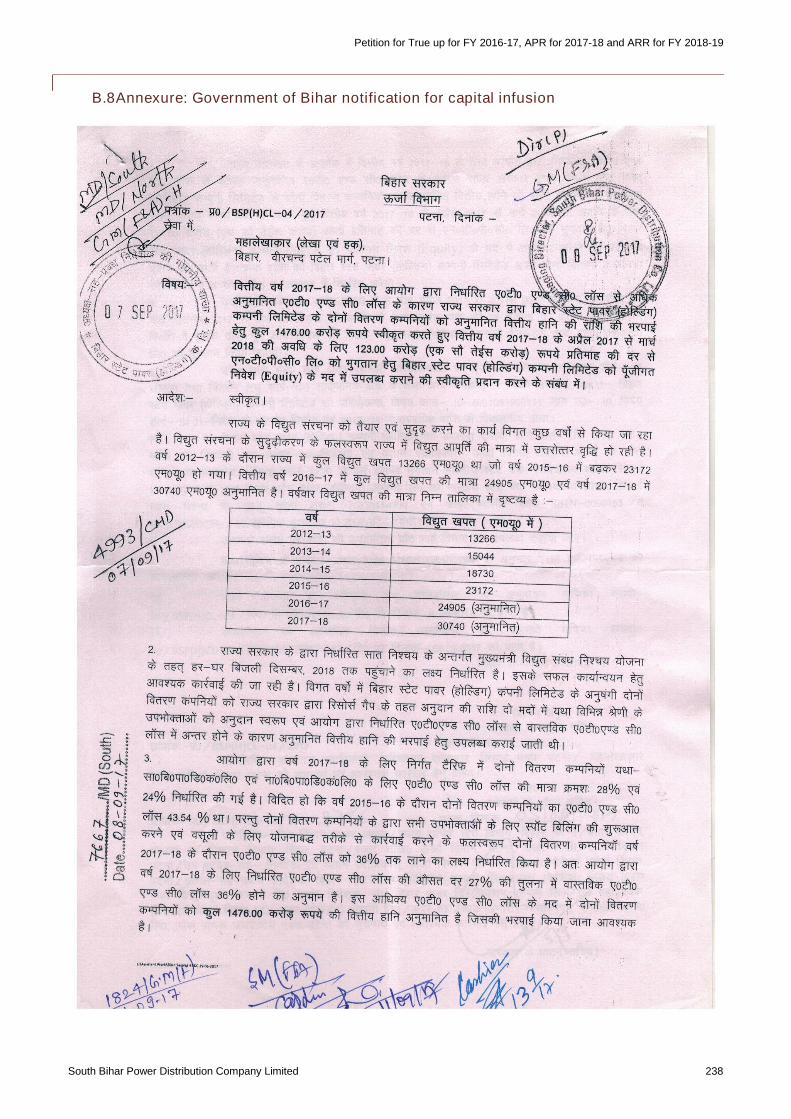
Petition for True up for FY 2016-17, APR for 2017-18 and ARR for FY 2018-19
South Bihar Power Distribution Company Limited 238
B.8Annexure: Government of Bihar notification for capital infusion
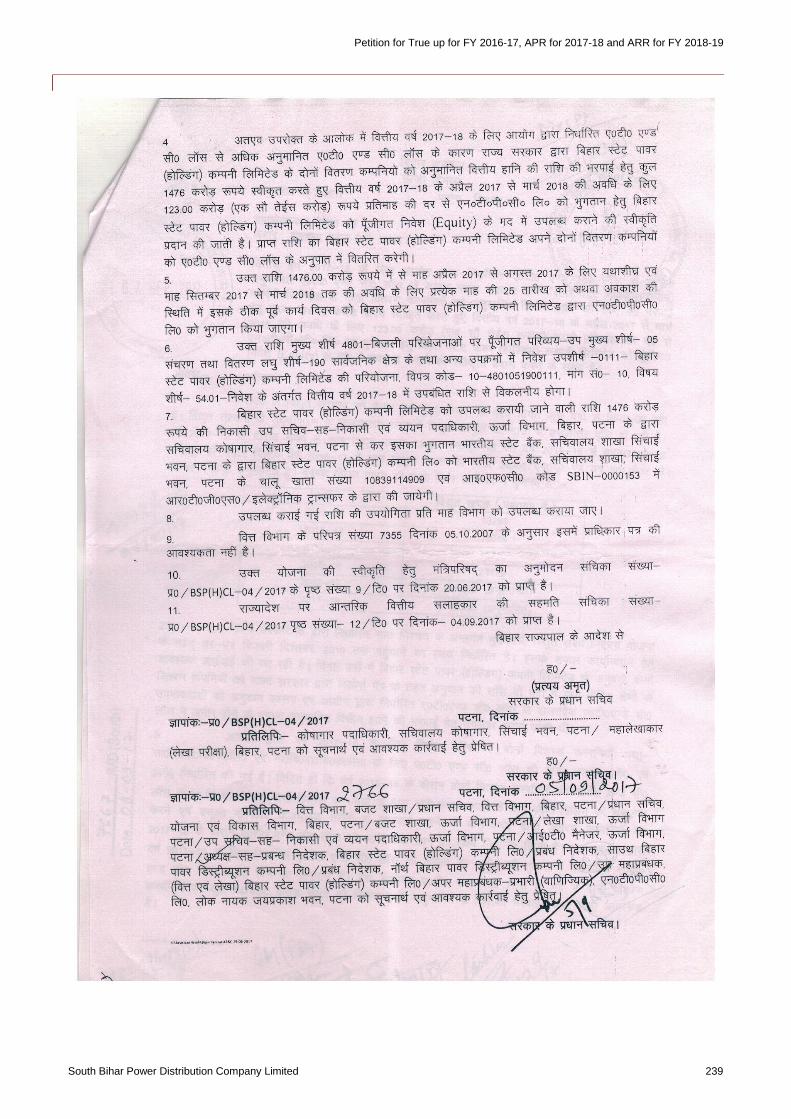
Petition for True up for FY 2016-17, APR for 2017-18 and ARR for FY 2018-19
South Bihar Power Distribution Company Limited 239
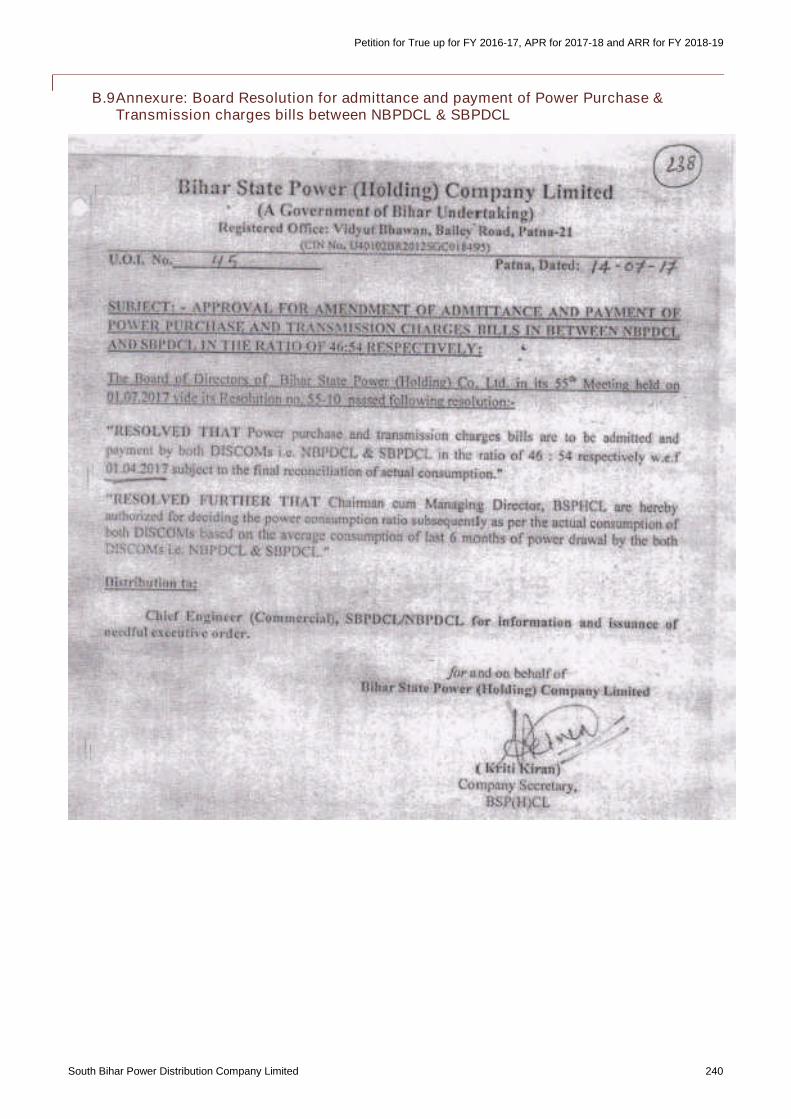
Petition for True up for FY 2016-17, APR for 2017-18 and ARR for FY 2018-19
South Bihar Power Distribution Company Limited 240
B.9Annexure: Board Resolution for admittance and payment of Power Purchase &Transmission charges bills between NBPDCL & SBPDCL
Petition for True up for FY 2016-17, APR for 2017-18 and ARR for FY 2018-19
South Bihar Power Distribution Company Limited 241


