Embed Size (px)
Citation preview
Southward migration of continental volcanic activity in the Sierra de Las Cruces, Mexico:
palaeomagnetic and radiometric evidence
Maria Luisa Osete a, *, Vicente-Carlos Ruiz-Martinez a, Cecilia Caballero b, Carmen Galindo c, Jaime Urrutia-Fucugauchi b, Donald H. Tarling d
a Departamento de Fisica de la Tierra, Facultad de Ciencias Fisicas, Universidad Complutense de Madrid, 28040 Madrid, Spain
b Laboratorio de Paleomagnetismo y Geofisica Nuclear, Instituto de Geofisica. Universidad Nacional Aut6noma de Mexico,
Mexico D.F. 04510, Mexico
C Deparfamenfo de Petrologia y Geoquimica, Facultad de Ciencias Geol6gicas, Universidad Complutense de Madrid,
28040 Madrid, Spain
d Department of Geological Sciences, University of Plymouth, Plymouth PL4 8AA, UK
Abstract
New Palaeomagnetic data for 30 sites (271 samples) and K-Ar data from five units in the Sierra de Las Cruces,
western Basin of Mexico, provide constraints on the spatial-temporal evolution of arc magmatism in the central
Trans-Mexican Volcanic Belt. The normal and reversed directions show a polarity pattern with a consistent spatial
zonation perpendicular to the NNW-SSE trend of the range. The magnetostratigraphy and K-Ar dates indicate that
volcanic activity in the Sierra de Las Cruces migrated southeastward at a mean rate of 1.6 cm/a, between 3.6 and
1.8 Ma, and that the rate of migration may have been higher, up to 4 cm/a, during the Gauss Chron. Normal and
reversed directions pass the reversal test at a 95% confidence level. The mean Plio-Quaternary palaeomagnetic
direction for Sierra de Las Cruces is D=350.7\ I=30.6° (N=25, k=30.7, :;(95=5.3°). The declination deviates to the
west of the expected direction, which suggests that small counterclockwise rotations could take place during formation
of the Sierra de Las Cruces volcanics.
Keywords: continental volcanism; K-Ar dating; palaeomagnetism; Trans-Mexican Volcanic Belt; volcanic activity migration
1. Introduction
The Trans-Mexican Volcanic Belt (TMVB) is
an E-W-elongated structure that crosses central
Mexico from the Pacific Ocean to the Gulf of
Mexico between the 19th and 21 st parallels
( Fig. l a inset) . The TMVB is superimposed on the
* Corresponding author. Fax: + 34-91-3944-398. E-mail address:[email protected] (M.L. Osete)
NNW-SSE structural grain of Mexico, crossing
Oligocene-Miocene ignimbrites and associated
rocks of Sierra Madre Occidental, the Mesozoic fold belt of the Sierra Madre Oriental, overthrust
terranes of the Cordillera and Palaeozoic basement rocks. On the basis of geochronological, petrological and structural data, the TMVB is often divided into three sectors: the western sector from the
Pacific coast to the Colima graben, the central sector extending from the Michoacan volcanic zone towards either the Valley of Mexico and
w�. (a) s
D
THIS STUDY: • NORMAL SITES oREVERSED SITES o RADIOMETRIC
DATA .0 Previous @ palaeomagnetic
and radiometric studies
(b)
��
o
\� P'
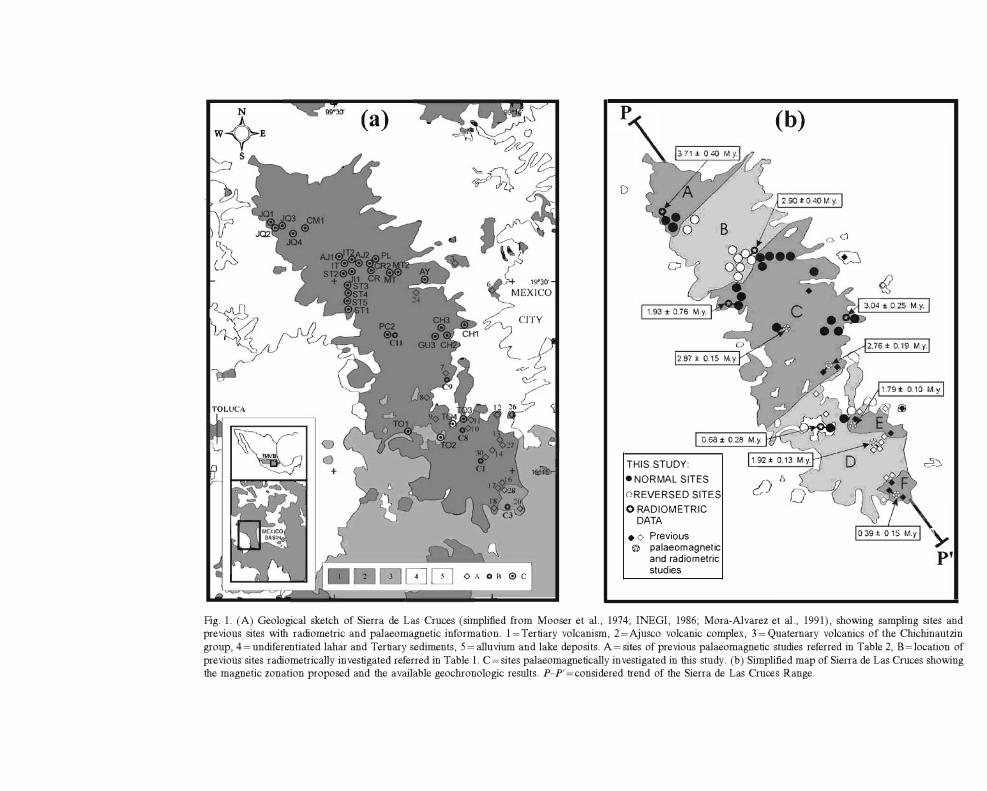
Fig. 1. (A) Geological sketch of Sierra de Las Cruces (simplified from Mooser et al., 1974; INEGI, 1986; Mora-Alvarez et al., 1991), showing sampling sites and previous sites with radiometric and palaeomagnetic information. 1 = Tertiary volcanism, 2 = Ajusco volcanic complex, 3 = Quaternary volcanics of the Chichinautzin group, 4 =undiferentiated lahar and Tertiary sediments, 5 = alluvium and lake deposits. A= sites of previous palaeomagnetic studies referred in Table 2, B=location of previous sites radiometrically investigated referred in Table 1. C= sites palaeomagnetically investigated in this study. (b) Simplified map of Sierra de Las Cruces showing the magnetic zonation proposed and the available geochronologic results. P-P' = considered trend of the Sierra de Las Cruces Range.
Sierra Nevada (Nixon et al., 1987) or towards the Queretaro-Taxco lineament (Pasquare et al., 1991), and the eastern segment from Sierra Nevada, or the Queretaro-Taxco lineament, eastwards towards the Gulf of Mexico. The chemical and petrological characteristics indicate that the TMVB volcanic sequences are generally calc-alkaline, although some localized zones of alkaline volcanism occur, particularly in the western sector (e.g. Luhr et al., 1985; Nixon et al., 1987). In addition, young volcanism is represented by the eastern alkaline province of Oligocene to Quaternary age (Cantagrel and Robin, 1979). There are three fundamental characteristics of the TMVB that are controversial: its orientation relative to the Middle America Trench, the time of onset of arc volcanism, and whether there has been systematic spatial-temporal migration of volcanic activity:
(1) One of the most striking structural features of the TMVB is its oblique (�16°) orientation relative to the Middle American Trench. This geometry has given rise to several contrasting models to explain this non-parallelism and to relate the volcanism with the northeasterly subduction of oceanic lithosphere beneath the southern Mexican continental margin (Molnar and Sykes, 1969; Urrutia-Fucugauchi and Del Castillo, 1977; Demant, 1978; Nixon, 1982; Pardo and Suarez 1995 and others). Other models consider that the TMVB has no direct tectonic relation with the subd uction along the Middle American Trench, being a consequence of zones of weakness within the crust in this area, which have been inherited from earlier episodes of deformation (e.g. Mooser, 1972; Shurbert and Cebull, 1973). On the basis of seismic information, Pardo and Suarez (1995) suggested that the non-parallelism is due to the changing geometry of the Rivera and Cocos plates beneath southern Mexico.
(2) Earlier studies suggested that the onset of volcanic activity in the TMVB was in the Quaternary (Demant, 1978), the Late Pliocene (Cantagrel and Robin, 1979), the Early Pliocene (Nixon et al., 1987) or Late Oligocene (Mooser, 1972). Ferrari et al. (1994) reviewed these alternatives together with chronologic, stratigraphic and structural data, and concluded that the TMVB
began at about 16 Ma and that its tectonic evolution comprised a Middle Miocene phase of transcurrent faulting followed by a transtensional to extensional phase between the Late Miocene and present. In this model, the NW-SE and E-W transcurrent faults provided preferential conduits for crustal magma, resulting in an oblique orientation with respect to the trench. The early stages of TMVB activity have been recently traced to widespread mafic to intermediate volcanism, between about 11 and 7 Ma (Ferrari et al., 2000 - this volume). This volcanism has been documented in western and central Mexico, where it is characterized by plateau sequences, shield volcanoes, fissural lava flows and monogenetic cinder cones (e.g. Ferrari et al., 1994,2000 - this volume; Moore et al., 1994; Rosas-Elguera et al., 1997).
(3) An apparent spatial north-south migration of volcanic activity in the TMVB has been pointed out in several studies (e.g. Cantagrel and Robin, 1979; Nixon et al., 1987; Mora-Alvarez et al., 1991; Delgado-Granados et aI., 1995). However, this general trend has only been investigated in detail in the Michoacan-Guanajuato and Chapala regions (Ban et al., 1992; Delgado-Granados et al., 1995). Preliminary radiometric studies (MoraAlvarez et al., 1991) in the central and southern part of the Sierra de Las Cruces, within the Mexico Basin, have also indicated an apparent southward migration of volcanic activity.
In this paper, the suggested southward migration in the Sierra de Las Cruces region is considered further in the light of new geochronological information and detailed palaeomagnetic investigations. This study was also intended as a pilot study to establish a magnetoestratigraphy that can be applied to the TMVB and to assess the best criteria for selecting future sites for further radiometric and palaeomagnetic study. The palaeomagnetic aspects were mainly concerned with evaluating the extent to which block rotations have played an important role in the structural evolution of the TMVB, as proposed by UrrutiaFucugauchi and B6hnel (1988). The palaeomagnetic sampling sites were mostly concentrated in the central and northern part of the Sierra de Las Cruces. A total of 329 cores (481 specimens) from 30 sites were obtained, and 271 samples were
analyzed in the laboratory. After consideration of the palaeomagnetic results, five of the sites were selected for K-Ar dating.
2. Geologic setting and sampling
The Sierra de Las Cruces is formed by a series of volcanic structures and associated lava flows, pyroclastic and lahar products, distributed along a NNW-SSE range in the central part of the TMVB (Fig. la). This range marks the western margin of the Basin of Mexico and separates it from the Valley of Toluca. A formal stratigraphy of this area was first provided by Fries (1960) and Schlaepfer (1968). Three formations can be distinguished from North to South: Las Cruces Formation, the El Ajusco Formation and the Chichinautzin Group. Towards the south, Las Cruces Formation underlies the Ajusco Formation and is covered by the pyroclasts and lavas of the Chichinautzin Group. A detailed volcanic stratigraphy for the Basin of Mexico has been difficult to establish, mainly because of the lack of radiometric dates and field studies. Mooser et al. (1974) considered that the main mass of Sierra de Las Cruces was formed by consecutive episodes of faulting accompanied by the formation of stratovolcanoes that were pro-
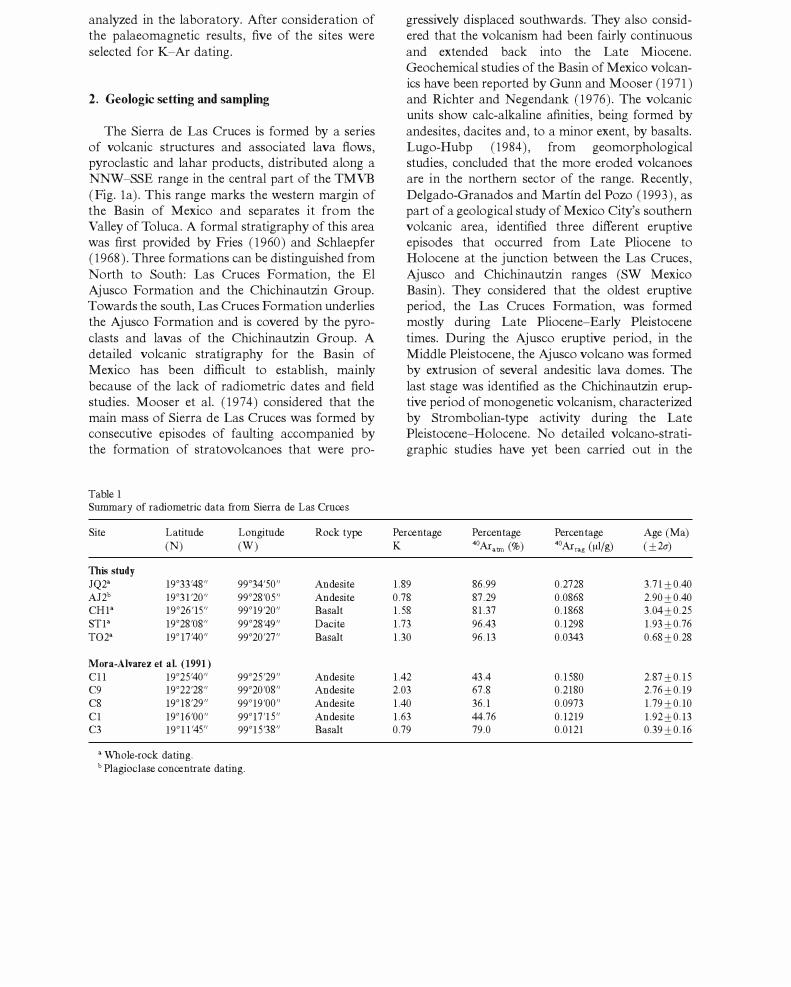
Table 1 Summary of radiometric data from Sierra de Las Cruces
Site Latitude Longitude (N) (W)
This study JQ2a 19°33'48') 99°34'50') AJ2b 19°31'20') 99°28'05') CH1a 19°26'15') 99°19'20') ST1a 19°28'08') 99°28'49') T02a 19° 17'40') 99°20'27')
Mora-Alvarez et al. (1991) C11 19°25'40') 99°25'29') C9 19°22'28') 99°20'08') C8 19° 18'29') 99°19'00') Cl 19° 16'00') 99°17'15') C3 19°11'45') 99°15'38')
a Whole-rock dating. b Plagioc1ase concentrate dating.
Rock type
Andesite Andesite Basalt Dacite Basalt
Andesite Andesite Andesite Andesite Basalt
gressively displaced southwards. They also considered that the volcanism had been fairly continuous and extended back into the Late Miocene. Geochemical studies of the Basin of Mexico volcanics have been reported by Gunn and Mooser (1971) and Richter and Negendank (1976). The volcanic units show calc-alkaline afinities, being formed by andesites, dacites and, to a minor exent, by basalts. Lugo-Hubp (1984), from geomorphological studies, concluded that the more eroded volcanoes are in the northern sector of the range. Recently, Delgado-Granados and Martin del Pozo ( 1993), as part of a geological study of Mexico City's southern volcanic area, identified three different eruptive episodes that occurred from Late Pliocene to Holocene at the junction between the Las Cruces, Ajusco and Chichinautzin ranges (SW Mexico Basin). They considered that the oldest eruptive period, the Las Cruces Formation, was formed mostly during Late Pliocene-Early Pleistocene times. During the Ajusco eruptive period, in the Middle Pleistocene, the Ajusco volcano was formed by extrusion of several andesitic lava domes. The last stage was identified as the Chichinautzin eruptive period of monogenetic volcanism, characterized by Strombolian-type activity during the Late Pleistocene-Holocene. No detailed volcano-stratigraphic studies have yet been carried out in the
Percentage Percen tage Percen tage Age (Ma) K 4°Aratm (%) 4°Arrag (�/g) (± 20")
1.89 86.99 0.2728 3.71 ± 0.40 0.78 87.29 0.0868 2.90 ± 0.40 1.58 81.37 0.1868 3.04±0.25 1.73 96.43 0.1298 1.93±0.76 1.30 96.13 0.0343 0.68±0.28
1.42 43.4 0.1580 2.87 ± 0.15 2.03 67.8 0.2180 2.76±0.19 1.40 36.1 0.0973 1.79±0.1O 1.63 44.76 0.1219 1.92±0.13 0.79 79.0 0.0121 0.39 ± 0.16
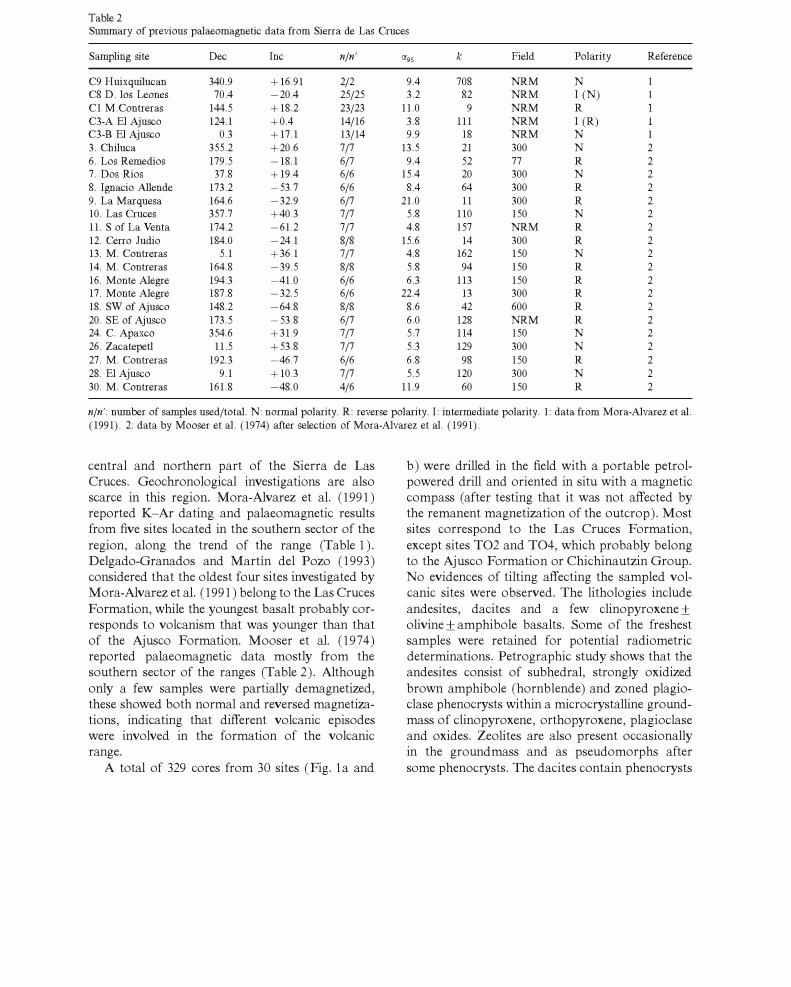
Table 2 Summary of previous palaeomagnetic data from Sierra de Las Cruces
Sampling site Dec Inc n/n' ()(95 k Field Polarity Reference
C9 H ui x quiluc an 340.9 + 16.91 2/2 9.4 708 NRM N C8 D. los Leones 70.4 -20.4 25/25 3.2 82 NRM I (N) Cl M.Contreras 144.5 + 18.2 23/23 11.0 9 NRM R C3-A El Ajusco 124.1 +0.4 14/16 3.8 111 NRM I (R) C3-B El Ajusco 0.3 +17.1 13/14 9.9 18 NRM N 1 3. Chiluca 355.2 +20.6 7/7 13.5 21 300 N 2 6. Los Remedios 179.5 -18.1 6/7 9.4 52 77 R 2 7. Dos Rios 37.8 + 19.4 6/6 15.4 20 300 N 2 8. Ignacio Allende 173.2 -53.7 6/6 8.4 64 300 R 2 9. La Marquesa 164.6 -32.9 6/7 21.0 11 300 R 2 10. Las Cruces 357.7 +40.3 7/7 5.8 110 150 N 2 11. S of La Venta 174.2 -61.2 7/7 4.8 157 NRM R 2 12. Cerro Judio 184.0 -24.1 8/8 15.6 14 300 R 2 13. M. Contreras 5.1 +36.1 7/7 4.8 162 150 N 2 14. M. Contreras 164.8 -39.5 8/8 5.8 94 150 R 2 16. Monte Alegre 194.3 -41.0 6/6 6.3 113 150 R 2 17. Monte Alegre 187.8 -32.5 6/6 22.4 13 300 R 2 18. SW of Ajusco 148.2 -64.8 8/8 8.6 42 600 R 2 20. SE of Ajusco 173.5 -53.8 6/7 6.0 128 NRM R 2 24. C. Apaxco 354.6 +31.9 7/7 5.7 114 150 N 2 26. Zacatepetl 11.5 +53.8 7/7 5.3 129 300 N 2 27. M. Contreras 192.3 -46.7 6/6 6.8 98 150 R 2 28. El Ajusco 9.1 + 10.3 7/7 5.5 120 300 N 2 30. M. Contreras 161.8 -48.0 4/6 11.9 60 150 R 2
n/n': number of samples used/total. N: normal polarity. R: reverse polarity. I: intermediate polarity. 1: data from Mora-Alvarez et al. (1991). 2: data by Mooser et al. (1974) after selection of Mora-Alvarez et al. (1991).
central and northern part of the Sierra de Las Cruces. Geochronological investigations are also scarce in this region. Mora -Alvarez et al. (1991) reported K-Ar dating and palaeomagnetic results from five sites located in the southern sector of the region, along the trend of the range (Table 1). Delgado-Granados and Martin del Pozo (1993) considered that the oldest four sites investigated by Mora-Alvarez et al. (1991) belong to the Las Cruces Formation, while the youngest basalt probably corresponds to volcanism that was younger than that of the Ajusco Formation. Mooser et al. (1974) reported palaeomagnetic data mostly from the southern sector of the ranges (Table 2). Although only a few samples were partially demagnetized, these showed both normal and reversed magnetizations, indicating that different volcanic episodes were involved in the formation of the volcanic range.
A total of 329 cores from 30 sites (Fig. la and
b) were drilled in the field with a portable petrolpowered drill and oriented in situ with a magnetic compass (after testing that it was not affected by the remanent magnetization of the outcrop). Most sites correspond to the Las Cruces Formation, except sites T02 and T04, which probably belong to the Ajusco Formation or Chichinautzin Group. No evidences of tilting affecting the sampled volcanic sites were observed. The lithologies include andesites, dacites and a few clinopyroxene ± olivine ± amphibole basalts. Some of the freshest samples were retained for potential radiometric determinations. Petrographic study shows that the andesites consist of subhedral, strongly oxidized brown amphibole (hornblende) and zoned plagioclase phenocrysts within a microcrystalline groundmass of clinopyroxene, orthopyroxene, plagioclase and oxides. Zeolites are also present occasionally in the ground mass and as pseudomorphs after some phenocrysts. The dacites contain phenocrysts
a) JQ2.06A np/W
C) AJ2.06A
Mo= 3.25 Aim
2 5
e) AY04A up/w
g) T03.04A
AF (mT) b) JQ2.09A "plW o TH (OC)
25
5750r'"""----------- N
Mo= 1.25 Aim Mo= 1.14Alm
AF(mT) d) AJ2.10A TH (0C) llp/W
Mo= 3.07 Aim up/W
100 N N 575
500
300
AF(mT) f) AY05A TH (OC)
� IIp/W
100 700 N N
TH (OC) np/W AF (mT) h) T03.06A up/W Mo= 0.79 Aim
35 100
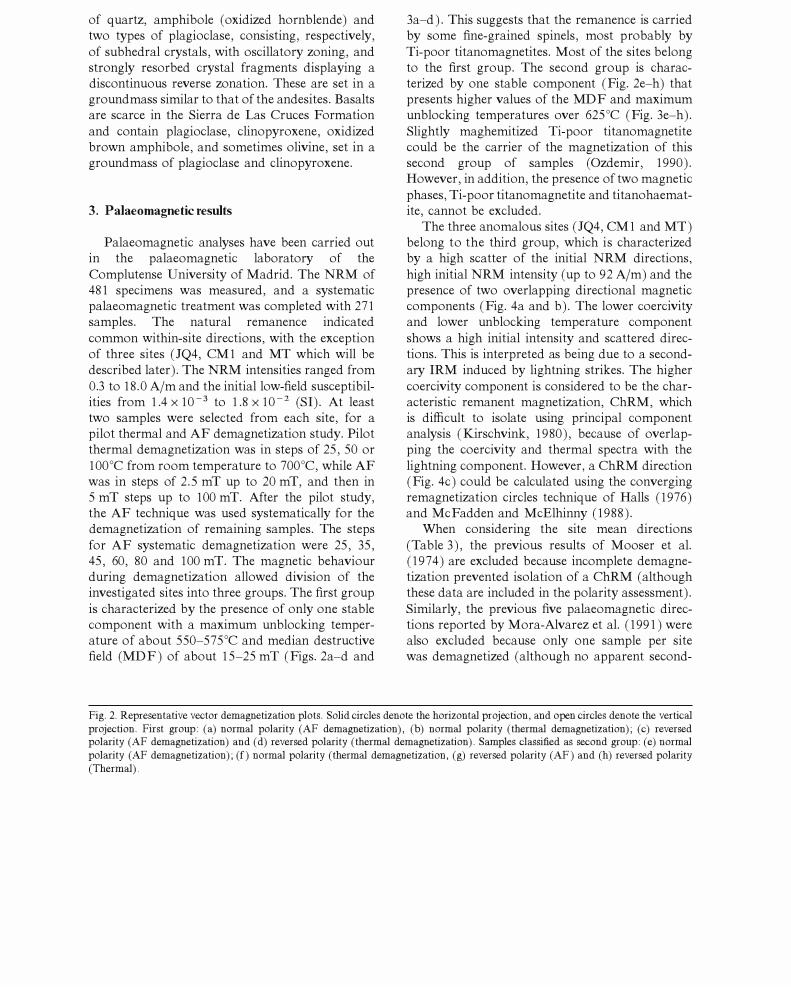
of quartz, amphibole (oxidized hornblende) and two types of plagioclase, consisting, respectively, of subhedral crystals, with oscillatory zoning, and strongly resorbed crystal fragments displaying a discontinuous reverse zonation. These are set in a ground mass similar to that of the andesites. Basalts are scarce in the Sierra de Las Cruces Formation and contain plagioclase, clinopyroxene, oxidized brown amphibole, and sometimes olivine, set in a ground mass of plagioclase and clinopyroxene.
3. Palaeomagnetic results
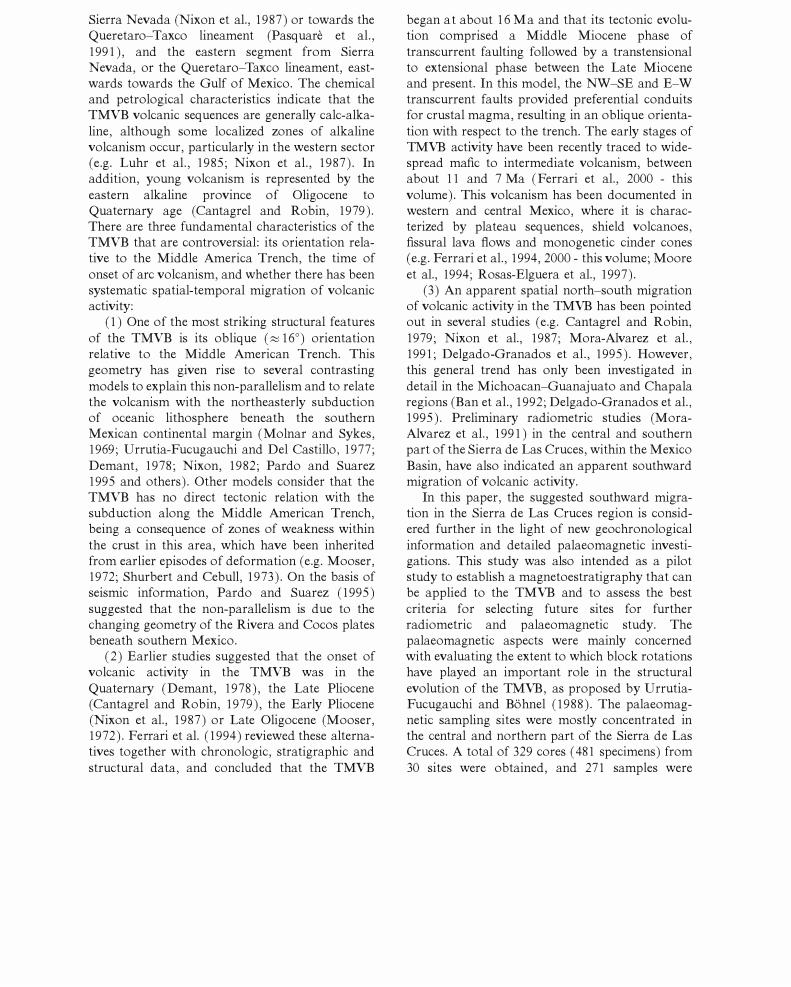
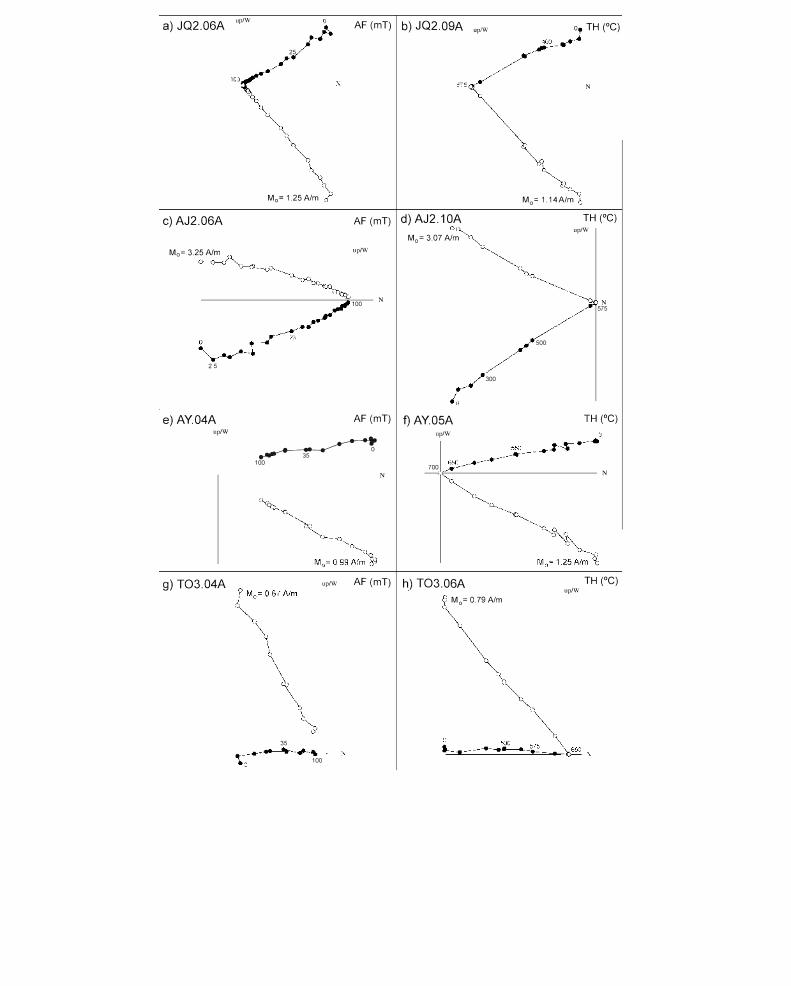
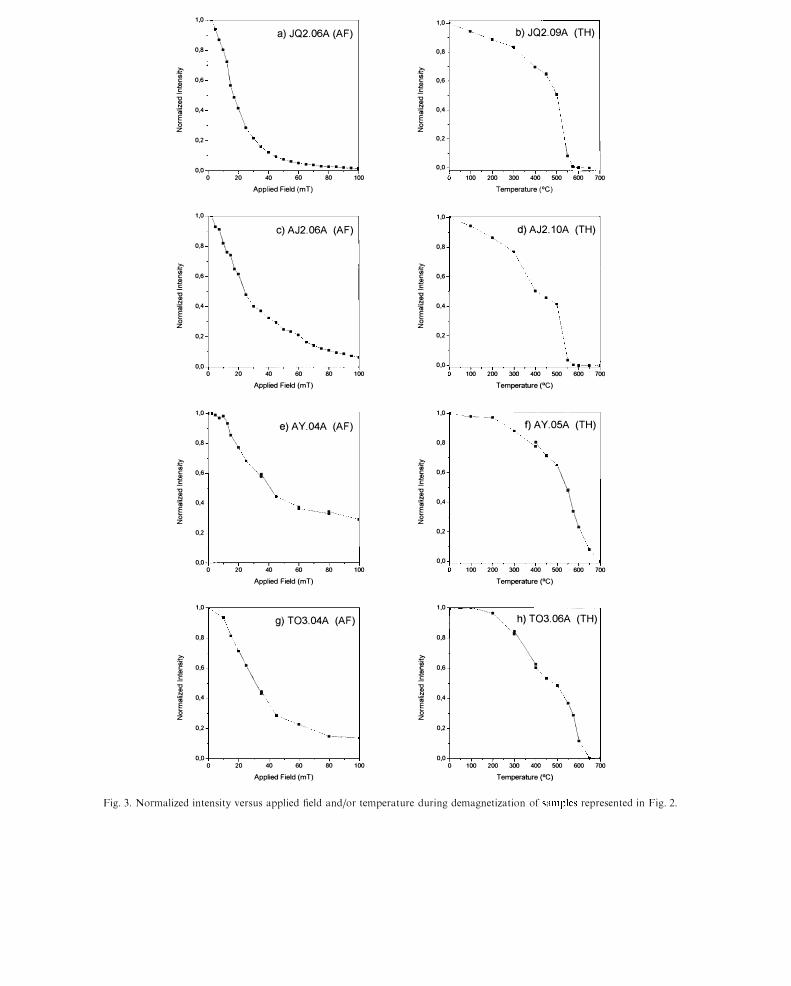
Palaeomagnetic analyses have been carried out in the palaeomagnetic laboratory of the Complutense University of Madrid. The NRM of 481 specimens was measured, and a systematic palaeomagnetic treatment was completed with 271 samples. The natural remanence indicated common within-site directions, with the exception of three sites (JQ4, CM1 and MT which will be described later). The NRM intensities ranged from 0.3 to 18.0 A/m and the initial low-field susceptibilities from 1.4 x 10⁻³ to 1.8 X 10⁻² (SI). At least two samples were selected from each site, for a pilot thermal and AF demagnetization study. Pilot thermal demagnetization was in steps of 25, 50 or 100°C from room temperature to 700°C, while AF was in steps of 2.5 mT up to 20 mT, and then in 5 mT steps up to 100 mT. After the pilot study, the AF technique was used systematically for the demagnetization of remaining samples. The steps for AF systematic demagnetization were 25, 35, 45, 60, 80 and 100 mT. The magnetic behaviour during demagnetization allowed division of the investigated sites into three groups. The first group is characterized by the presence of only one stable component with a maximum unblocking temperature of about 550-575°C and median destructive field (MDF ) of about 15-25 mT (Figs. 2a-d and
3a-d ). This suggests that the remanence is carried by some fine-grained spinels, most probably by Ti-poor titanomagnetites. Most of the sites belong to the first group. The second group is characterized by one stable component (Fig. 2e-h) that presents higher values of the MDF and maximum unblocking temperatures over 625°C (Fig. 3e-h). Slightly maghemitized Ti-poor titanomagnetite could be the carrier of the magnetization of this second group of samples (Ozdemir, 1990). However, in addition, the presence of two magnetic phases, Ti-poor titanomagnetite and titanohaematite, cannot be excluded.
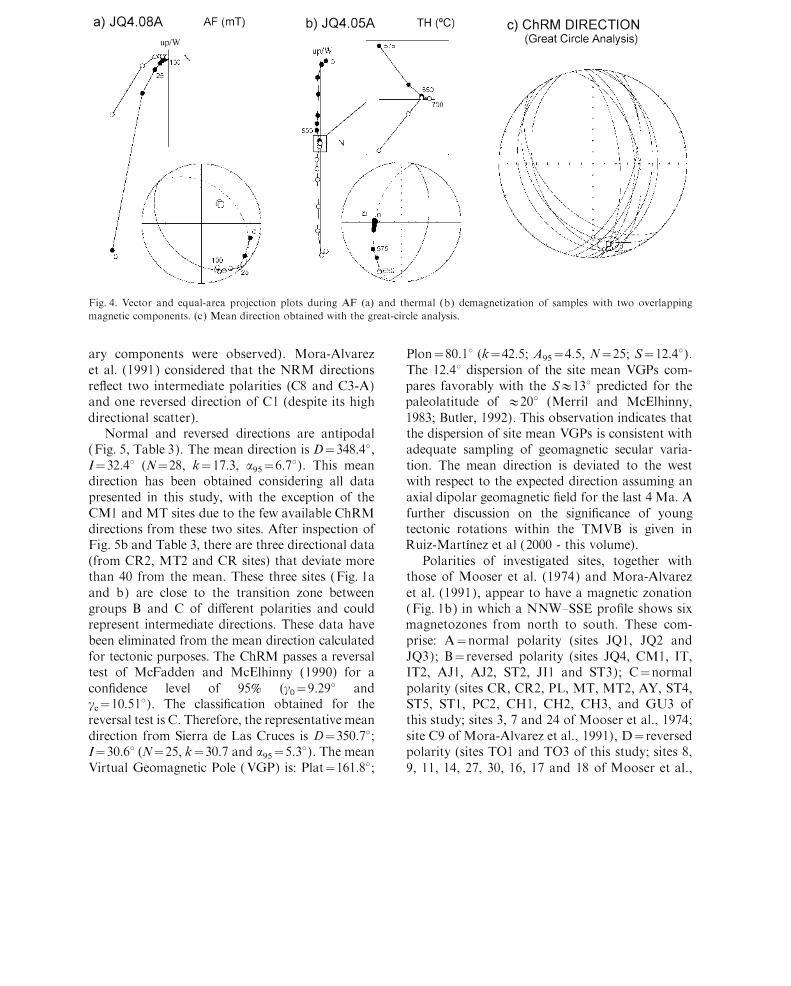
The three anomalous sites (JQ4, CM1 and MT) belong to the third group, which is characterized by a high scatter of the initial NRM directions, high initial NRM intensity (up to 92 A/m) and the presence of two overlapping directional magnetic components (Fig. 4a and b). The lower coercivity and lower unblocking temperature component shows a high initial intensity and scattered directions. This is interpreted as being due to a secondary IRM induced by lightning strikes. The higher coercivity component is considered to be the characteristic remanent magnetization, ChRM, which is difficult to isolate using principal component analysis ( Kirschvink, 1980), because of overlapping the coercivity and thermal spectra with the lightning component. However, a ChRM direction (Fig. 4c) could be calculated using the converging remagnetization circles technique of Halls (1976) and McFadden and McElhinny (1988).
When considering the site mean directions (Table 3), the previous results of Mooser et al. ( 1974) are excluded because incomplete demagnetization prevented isolation of a ChRM (although these data are included in the polarity assessment). Similarly, the previous five palaeomagnetic directions reported by Mora-Alvarez et al. (1991) were also excluded because only one sample per site was demagnetized (although no apparent second-
Fig. 2. Representative vector demagnetization plots. Solid circles denote the horizontal projection, and open circles denote the vertical projection. First group: (a) normal polarity (AF demagnetization), (b) normal polarity (thermal demagnetization); (c) reversed polarity (AF demagnetization) and (d) reversed polarity (thermal demagnetization). Samples classified as second group: (e) normal polarity (AF demagnetization); (f ) normal polarity (thermal demagnetization, (g) reversed polarity (AF ) and (h) reversed polarity (Thermal).
1,0 \. 1,0
a) JQ2.06A (AF) .. b) JQ2.09A (TH) \ ' .. .•.
0,8 \ 0,8 ..
\ ,
� \ � '. '.
0,6 '" \ c 0,6 � \ � \ '0 '0
\ .� \ ., 0,4 .t>/ 0,' m
\ m
\ E E 0 0 z " Z
0,2 \.., 0,2 ... � ...,---. --... -.----------
\ 0,0 0,0 .-.-.
0 20 .0 60 80 100 100 200 300 400 500 600 700 Applied Field (mT) Temperature (QC)
1,0 1,0 \.
.. .. . C) AJ2.06A (AF) d) AJ2,10A (TH)
\. .... 0,8 0,8
·f \.. ·f \ 0,6 0,6 \
$ \ $ \ .!'; .!'; al �
' .. \ .
N 0,' 0,'
\ 1i '. . m E '. E 0 '. 0 z ' .. ,-.
Z 0,2 . 0,2
\ ... -.. ,,--.
0,0 0,0 .' ... --
0 20 40 60 80 100 100 200 300 400 500 600 700 Applied Field (mT) Temperature (OC)
1,0 1,0 -.-\.
..... ---.- --e) AY.04A (AF) ""- " f) AY.05A (TH)
\ 0,8 \ 0,8 ",:,
\ 'a " � .� .. '"
"'\ .. 0,6
\ c 0,6 c $ � .!'; al al
\ .!:! ., .t>/ m 0,4 m 0.4 �
L ............ � ... � z Z 0,2 0,2
\ 0,0 0,0
0 20 40 60 80 100 100 200 300 400 500 600 700 Applied Field (mT) Temperature ('C)
1,0 1,0 '. ----.--.
\ g) T03,04A (AF) "'" h) T03.06A (TH) "
0,8 0,8 '� \ \. \
� \ .� \ '" 0,6 1! 0,6 ! \
'. �
" ..
'0 '0 "
.� 0,' I. .� 0,' \ m \ m • � E \ \ 0 z z
\ 0,2 ..... -.. 0,2 .. -�-
0,0 0,0 \ 0 20 40 60 80 100 0 100 200 300 400 500 600 700
Applied Field (mT) Temperature (OC)
Fig, 3, Normalized intensity versus applied field and/or temperature during demagnetization of samples represented in Fig, 2,
a) JQ4.08A AF (mT)
up/W
b) JQ4.05A TH (QC) c) ChRM DIRECTION (Great Circle Analysis)
Fig. 4. Vector and equal-area projection plots during AF (a) and thermal (b) demagnetization of samples with two overlapping magnetic components. (c) Mean direction obtained with the great-circle analysis.
ary components were observed). Mora-Alvarez
et al. (1991) considered that the NRM directions
reflect two intermediate polarities (C8 and C3-A)
and one reversed direction of C l (despite its high
directi onal sca tier) .
Normal and reversed directions are antipodal
(Fig. 5, Table 3). The mean direction is D=348.4°,
1=32.4° (N=28, k=17.3, !X9s=6.7°). This mean
direction has been obtained considering all data
presented in this study, with the exception of the
CMl and MT sites due to the few available ChRM
directions from these two sites. After inspection of
Fig. 5b and Table 3, there are three directional data
(from CR2, MT2 and CR sites) that deviate more
than 40 from the mean. These three sites (Fig. l a
and b) are close to the transition zone between
groups B and C of different polarities and could
represent intermediate directions. These data have
been eliminated from the mean direction calculated
for tectonic purposes. The ChRM passes a reversal
test of McFadden and McElhinny (1990) for a
confidence level of 95% (Yo = 9.29° and
yc= 10.51°). The classification obtained for the
reversal test is C. Therefore, the representative mean
direction from Sierra de Las Cruces is D=350.7°;
1 = 30.6° (N = 25, k= 30.7 and !X9S = 5.3°). The mean
Virtual Geomagnetic Pole ( VGP) is: Plat= 161.8°;
Plon=80.1° (k=42.5; A9s=4.5, N=25; S=12.4°).
The 12.4° dispersion of the site mean VGPs com
pares favorably with the S:::::; 13° predicted for the
paleolatitude of :::::; 200 (Merril and McElhinny,
1983; Butler, 1992). This observation indicates that
the dispersion of site mean VGPs is consistent with
adequate sampling of geomagnetic secular varia
tion. The mean direction is deviated to the west
with respect to the expected direction assuming an
axial dipolar geomagnetic field for the last 4 Ma. A
further discussion on the significance of young
tectonic rotations within the TMVB is given in
Ruiz-Martinez et al ( 2000 - this volume).
Polarities of investigated sites, together with
those of Mooser et al. (1974) and Mora-Alvarez
et al. (1991), appear to have a magnetic zonation
(Fig. 1 b) in which a NNW-SSE profile shows six
magnetozones from north to south. These com
prise: A = normal polarity (sites JQ1, JQ2 and
J Q3); B=reversed polarity (sites JQ4, CM1, IT,
IT2, AJl , AJ2, ST2, 111 and ST3); C=normal
polarity (sites CR, CR2, PL, MT, MT2, AY, ST4,
ST5, ST I , PC2, CHI, CH2, CH3, and GU3 of
this study; sites 3, 7 and 24 of Mooser et aI., 1974;
site C9 of Mora-Alvarez et aI., 1991), D=reversed
polarity (sites TO 1 and T03 of this study; sites 8,
9, 11, 14, 27, 30, 16, 17 and 18 of Mooser et aI.,
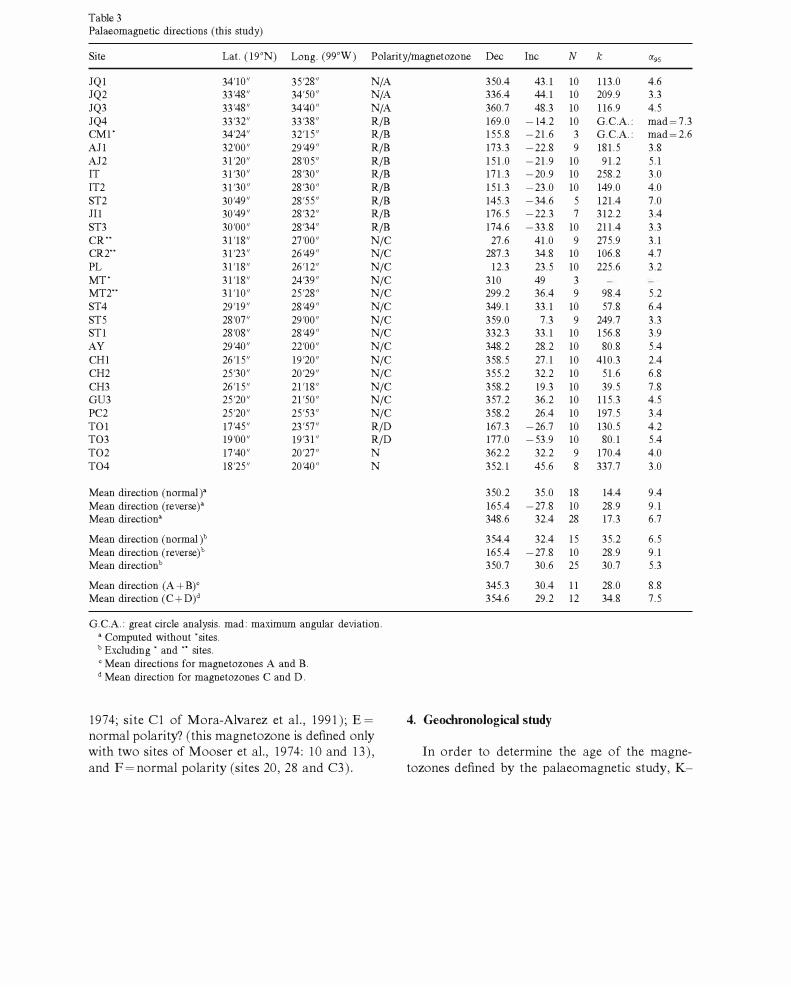
Table 3 Palaeomagnetic directions (this study)
Site Lat. (19°N) Long. (99°W) P olari t y jmagnetozone Dec Inc N k ()(95
JQ1 34'10'1 35'28'1 NjA 350.4 43.1 10 113.0 4.6 JQ2 33'48'1 34'50'1 NjA 336.4 44.1 10 209.9 3.3 JQ3 33'48'1 34'40'1 NjA 360.7 48.3 10 116.9 4.5 JQ4 33'32'1 33'38'1 RjB 169.0 -14.2 10 G.C.A.: mad=7.3 CM1' 34'24'1 32'15'1 RjB 155.8 -21.6 3 G.C.A.: mad=2.6 All 32'00'1 29'49'1 RjB 173.3 -22.8 9 181.5 3.8 AJ2 31'20'1 28'05'1 RjB 151.0 -21.9 10 91.2 5.1 IT 31'30'1 28'30'1 RjB 171.3 -20.9 10 258.2 3.0 IT2 31'30'1 28'30'1 RjB 151.3 -23.0 10 149.0 4.0 ST2 30'49'1 28'55'1 RjB 145.3 -34.6 5 121.4 7.0 111 30'49'1 28'32'1 RjB 176.5 -22.3 7 312.2 3.4 ST3 30'00'1 28'34'1 RjB 174.6 -33.8 10 211.4 3.3 CR" 31'18'1 27'00'1 NjC 27.6 41.0 9 275.9 3.1 CR2" 31'23'1 26'49'1 NjC 287.3 34.8 10 106.8 4.7 PL 31'18'1 26'12'1 NjC 12.3 23.5 10 225.6 3.2 MT' 31'18'1 24'39'1 NjC 310 49 3 MT2" 31'10'1 25'28'1 NjC 299.2 36.4 9 98.4 5.2 ST4 29'19'1 28'49'1 NjC 349.1 33.1 10 57.8 6.4 ST5 28'07'1 29'00'1 NjC 359.0 7.3 9 249.7 3.3 ST1 28'08'1 28'49'1 NjC 332.3 33.1 10 156.8 3.9 AY 29'40'1 22'00'1 NjC 348.2 28.2 10 80.8 5.4 CHI 26'15'1 19'20'1 NjC 358.5 27.1 10 410.3 2.4 CH2 25'30'1 20'29'1 NjC 355.2 32.2 10 51.6 6.8 CH3 26'15'1 21'18'1 NjC 358.2 19.3 10 39.5 7.8 GU3 25'20'1 21'50'1 NjC 357.2 36.2 10 115.3 4.5 PC2 25'20'1 25'53'1 NjC 358.2 26.4 10 197.5 3.4 T01 17'45'1 23'57'1 RjD 167.3 -26.7 10 130.5 4.2 T03 19'00'1 19'31'1 RjD 177.0 -53.9 10 80.1 5.4 T02 17'40'1 20'27'1 N 362.2 32.2 9 170.4 4.0 T04 18'25'1 20'40'1 N 352.1 45.6 8 337.7 3.0
Mean direction (normal Y 350.2 35.0 18 14.4 9.4 Mean direction (re verse) a 165.4 -27.8 10 28.9 9.1 Mean directiona 348.6 32.4 28 17.3 6.7
Mean direction (normal? 354.4 32.4 15 35.2 6.5 Mean direction (reverse? 165.4 -27.8 10 28.9 9.1 Mean direction b 350.7 30.6 25 30.7 5.3
Mean direction (A + B)C 345.3 30.4 11 28.0 8.8 Mean direction (C+D)d 354.6 29.2 12 34.8 7.5
G.C.A.: great circle analysis. mad: maximum angular deviation. a Computed without 'sites. b Excluding ' and " sites. C Mean directions for magnetozones A and B. d Mean direction for magnetozones C and D.
1974; site Cl of Mora-Alvarez et aI., 1991); E= 4. Geochronological study normal polarity? (this magnetozone is defined only with two sites of Mooser et aI., 1974: 10 and 13), In order to determine the age of the magne-and F = normal polarity (sites 20, 28 and C3). tozones defined by the palaeomagnetic study, K-
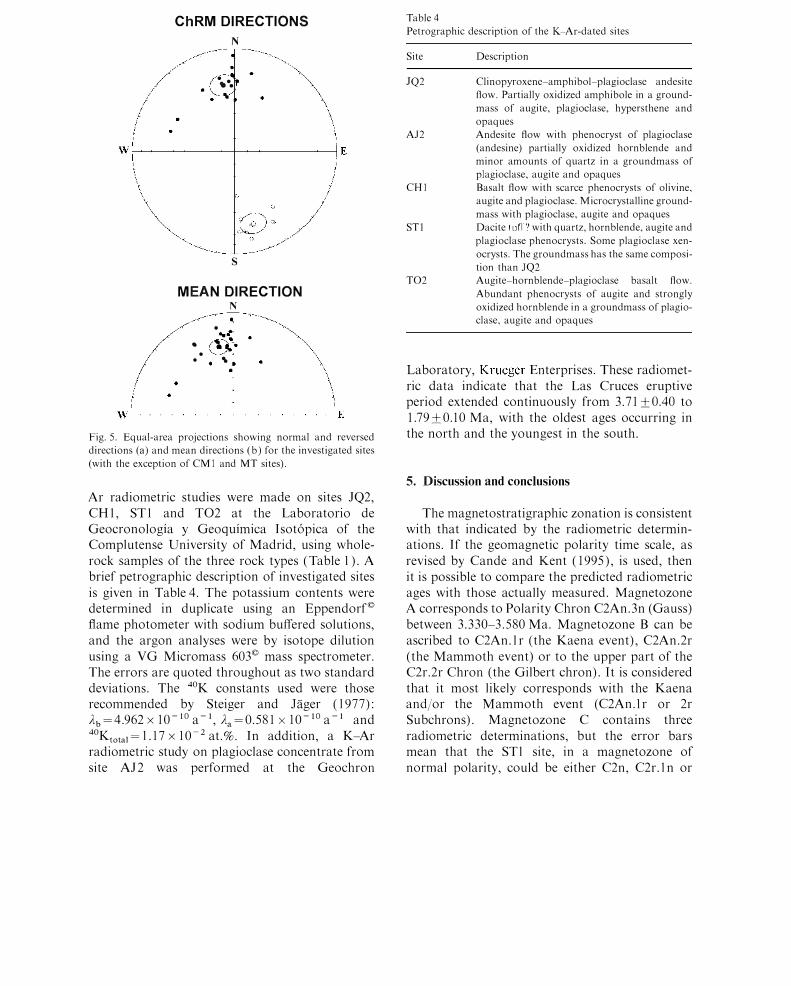
ChRM DIRECTIONS N
. . ••
s
MEAN DIRECTION N
. .. .. �.
. ...
Fig. S. Equal-area projections showing normal and reversed directions (a) and mean directions (b) for the investigated sites
(with the exception of CMI and MT sites).
Ar radiometric studies were made on sites JQ2,
CHI, STI and T02 at the Laboratorio de
Geocronologia y Geoquimica Isotopica of the
Complutense University of Madrid, using whole
rock samples of the three rock types (Table I ). A
brief petrographic description of investigated sites
is given in Table 4. The potassium contents were
determined in duplicate using an Eppendorf ©
flame photometer with sodium buffered solutions,
and the argon analyses were by isotope dilution
using a VG Micromass 603© mass spectrometer.
The errors are quoted throughout as two standard
deviations. The 4°K constants used were those
recommended by Steiger and lager (1977):
}'b=4.962 x 10⁻¹⁰ a-I, Aa =0.581 X 10⁻¹⁰ a-I and
4°Ktotal = 1.17 x 10 - 2 at. %. In addition, a K-Ar
radiometric study on plagioclase concentrate from
site AJ2 was performed at the Geochron
Table 4 Petrographic description of the K-Ar-dated sites
Site
JQ2
Al2
CHI
STI
T02
Description
Clinopyroxene-amphibol-plagioclase andesite flow. Partially oxidized amphibole in a ground
mass of augite, plagiodase, hypersthene and opaques Andesite flow with phenocryst of plagioc1ase
(andesine) partially oxidized hornblende and minor amounts of quartz in a groundmass of pJagioclase, augite and opaques
Basalt flow with scarce phenocrysts of olivine, augite and plagioc1ase. Microcrystalline ground
mass with plagioclase. augite and opaques Dacite tuff? with quartz, hornblende. augite and
plagioc1ase phenocrysts. Some plagioc1ase xen
ocrysts. The groundmass has the same composi
tion than JQ2 Augite-hornblende-plagioclase basalt flow.
Abundant phenocrysts of augite and strongly oxidized hornblende in a groundmass of plagioclase, augite and opaques
Laboratory, Krueger Enterprises. These radiomet
ric data indicate that the Las Cruces eruptive
period extended continuously from 3.71 ±OAO to
1.79±0.10 Ma, with the oldest ages occurring in
the north and the youngest in the south.
5. Discussion and conclusions
The magnetostratigraphic zonation is consistent
with that indicated by the radiometric determin
ations. If the geomagnetic polarity time scale, as
revised by Cande and Kent (1995), is used, then
it is possible to compare the predicted radiometric
ages with those actually measured. Magnetozone
A corresponds to Polarity Chron C2An.3n (Gauss)
between 3.330-3.580 Ma. Magnetozone B can be
ascribed to C2An. l r (the Kaena event), C2An. 2r
(the Mammoth event) or to the upper part of the
C2r.2r Chron (the Gilbert chron). It is considered
that it most likely corresponds with the Kaena
and/or the Mammoth event (C2An.lr or 2r
Subchrons). Magnetozone C contains three
radiometric determinations, but the error bars
mean that the ST l site, in a magnetozone of
normal polarity, could be either C2n, C2r.1 n or
C2An.1n, while the Cll and C9 sites of MoraAlvarez et al. (1991), also of normal polarity, probably belong to 2An.ln Chron, but taking into account the 2a error, they could also belong to 2An.2n Chron. If all the volcanic episodes correspond to the same magnetic chron, then the most likely is the 2An.1 n Chron (Gauss). Magnetozone D is of reversed polarity. The radiometric data Cl from Mora-Alvarez et al. (1991) suggest correspondence with either C2r.1r or C2r.2r Chrons (Matuyama). Magnetozone E is a small region of normal polarity that is only defined by palaeomagnetic data from Mooser et al. (1974). As discussed earlier, the lack of adequate demagnetization may raise doubts about the polarity of their samples. However, the only radiometric data from this region is that of the C8 site of Mora-Alvarez et al. (1991) (Table 1), which is of an intermediate direction and could be ascribed to the C2r-C2n transItIon (Matuyama-Old uvai-Matuyama). Therefore, with the available data, this magnetozone, if it exists, could be related to the C2n Subchron (Olduvai). Magnetozone F corresponds to the Cln Chron (Brunhes).
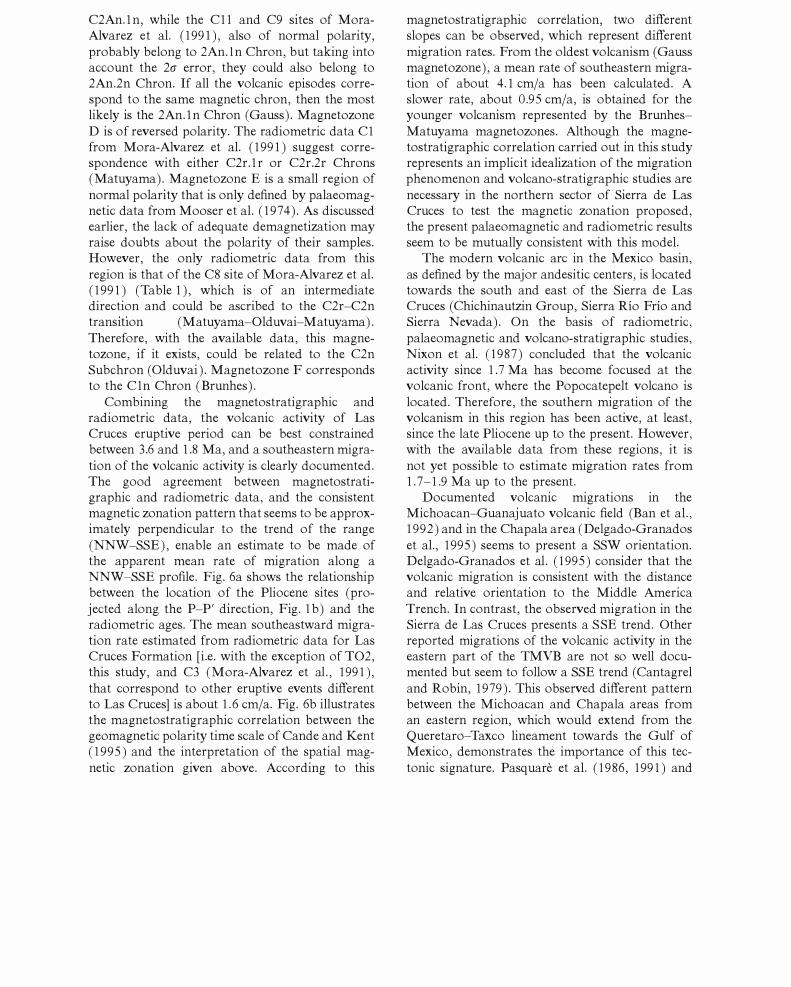
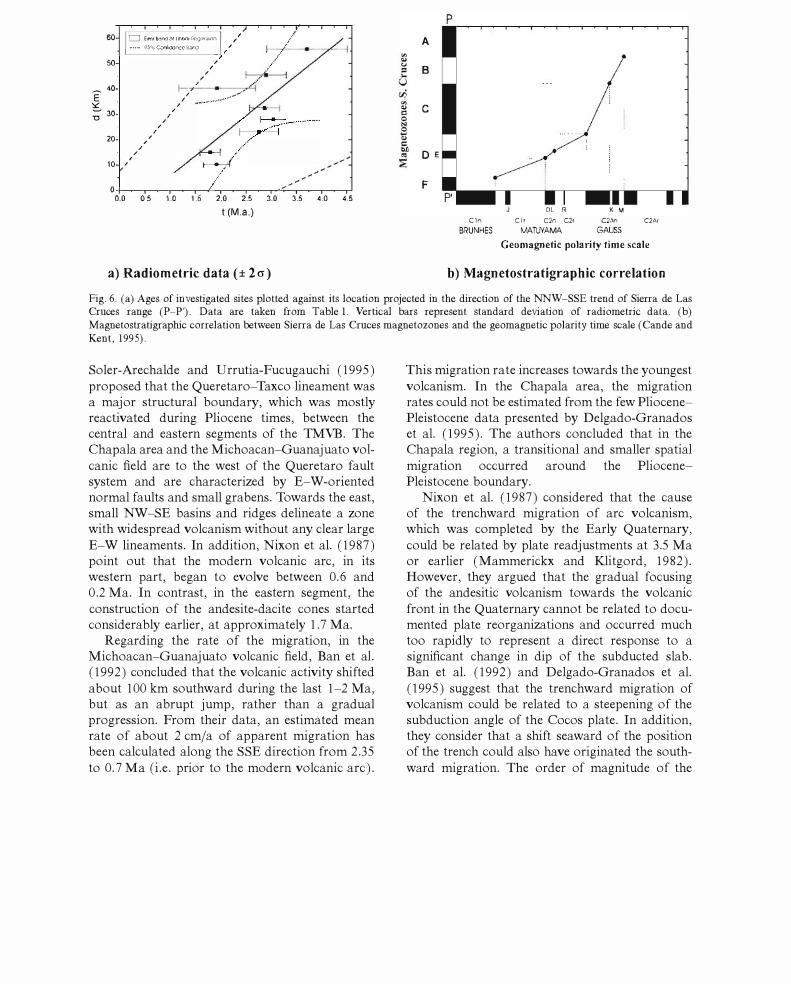
Combining the magnetostratigraphic and radiometric data, the volcanic activity of Las Cruces eruptive period can be best constrained between 3.6 and 1.8 Ma, and a southeastern migration of the volcanic activity is clearly documented. The good agreement between magnetostratigraphic and radiometric data, and the consistent magnetic zonation pattern that seems to be approximately perpendicular to the trend of the range (NNW-SSE), enable an estimate to be made of the apparent mean rate of migration along a NNW-SSE profile. Fig. 6a shows the relationship between the location of the Pliocene sites (projected along the P-P' direction, Fig. 1 b) and the radiometric ages. The mean southeastward migration rate estimated from radiometric data for Las Cruces Formation [i.e. with the exception of T02, this study, and C3 (Mora-Alvarez et al., 1991), that correspond to other eruptive events different to Las Cruces] is about 1.6 cm/a. Fig. 6b illustrates the magnetostratigraphic correlation between the geomagnetic polarity time scale of Cande and Kent (1995) and the interpretation of the spatial magnetic zonation given above. According to this
magnetostratigraphic correlation, two different slopes can be observed, which represent different migration rates. From the oldest volcanism (Gauss magnetozone), a mean rate of southeastern migration of about 4.1 cm/a has been calculated. A slower rate, about 0.95 cm/a, is obtained for the younger volcanism represented by the BrunhesMatuyama magnetozones. Although the magnetostratigraphic correlation carried out in this study represents an implicit idealization of the migration phenomenon and volcano-stratigraphic studies are necessary in the northern sector of Sierra de Las Cruces to test the magnetic zonation proposed, the present palaeomagnetic and radiometric results seem to be mutually consistent with this model.
The modern volcanic arc in the Mexico basin, as defined by the major andesitic centers, is located towards the south and east of the Sierra de Las Cruces (Chichinautzin Group, Sierra Rio Frio and Sierra Nevada). On the basis of radiometric, palaeomagnetic and volcano-stratigraphic studies, Nixon et al. (1987) concluded that the volcanic activity since 1.7 Ma has become focused at the volcanic front, where the Popocatepelt volcano is located. Therefore, the southern migration of the volcanism in this region has been active, at least, since the late Pliocene up to the present. However, with the available data from these regions, it is not yet possible to estimate migration rates from 1. 7-1.9 Ma up to the present.
Documented volcanic migrations in the Michoacan-Guanajuato volcanic field (Ban et aI., 1992) and in the Chapala area (Delgado-Granados et al., 1995) seems to present a SSW orientation. Delgado-Granados et al. (1995) consider that the volcanic migration is consistent with the distance and relative orientation to the Middle America Trench. In contrast, the observed migration in the Sierra de Las Cruces presents a SSE trend. Other reported migrations of the volcanic activity in the eastern part of the TMVB are not so well documented but seem to follow a SSE trend (Cantagrel and Robin, 1979). This observed different pattern between the Michoacan and Chapala areas from an eastern region, which would extend from the Queretaro-Taxco lineament towards the Gulf of Mexico, demonstrates the importance of this tectonic signature. Pasquare et al. (1986, 1991) and
60
50
....... 40 E
�
o "Emr B(lM 01 LlnOOt ��re::s<1n J /
/
•••••• 9.1"b Ccro'<:leI'CG Bono /
L--______ // /
/ / /
/
.�l··
"
/ /
/ I .... ,,'
.-"1 ......... , .....
........ � . ... �.
/ I
.� • .1
.:; 30
/ 20 /
/ /
/
I � ..... ·��r·L
.... -.-.-.-
./ /
10 /
./ / ./
7/ .I O+-����-.�-.�.-�����-.�-r
0.0 05 1.0 2.0 2.5 3.0 3.5 4.0 4.5
t(M.a.)
a) Radiometric data (± 20')
A
Cln
BRUNHES
OL R Clr C:2" C2(
MATUYAMA
K M
C2,\n
GAUSS
C2Ac
Geomagnetic polarity time scale
b) Magnetostratigraphic correlation
Fig. 6. (a) Ages of investigated sites plotted against its location projected in the direction of the NNW-SSE trend of Sierra de Las Cruces range (P-P'). Data are taken from Table l. Vertical bars represent standard deviation of radiometric data. (b) Magnetostratigraphic correlation between Sierra de Las Cruces magnetozones and the geomagnetic polarity time scale (Cande and Kent, 1995).
Soler-Arechalde and Urrutia-Fucugauchi (1995) proposed that the Queretaro-Taxco lineament was a major structural boundary, which was mostly reactivated during Pliocene times, between the central and eastern segments of the TMVB. The Chapala area and the Michoacan-Guanajuato volcanic field are to the west of the Queretaro fault system and are characterized by E-W -oriented normal faults and small grabens. Towards the east, small NW-SE basins and ridges delineate a zone with widespread volcanism without any clear large E-W lineaments. In addition, Nixon et al. (1987) point out that the modern volcanic arc, in its western part, began to evolve between 0.6 and 0.2 Ma. In contrast, in the eastern segment, the construction of the andesite-dacite cones started considerably earlier, at approximately 1.7 Ma.
Regarding the rate of the migration, in the Michoacan-Guanajuato volcanic field, Ban et al. (1992) concluded that the volcanic activity shifted about 100 km southward during the last 1-2 Ma, but as an abrupt jump, rather than a gradual progression. From their data, an estimated mean rate of about 2 cm/a of apparent migration has been calculated along the SSE direction from 2.35 to 0.7 Ma (i.e. prior to the modern volcanic arc).
This migration rate increases towards the youngest volcanism. In the Chapala area, the migration rates could not be estimated from the few PliocenePleistocene data presented by Delgado-Granados et al. (1995). The authors concluded that in the Chapala region, a transitional and smaller spatial migration occurred around the PliocenePleistocene boundary.
Nixon et al. (1987) considered that the cause of the trenchward migration of arc volcanism, which was completed by the Early Quaternary, could be related by plate readjustments at 3.5 Ma or earlier (Mammerickx and Klitgord, 1982). However, they argued that the gradual focusing of the andesitic volcanism towards the volcanic front in the Quaternary cannot be related to documented plate reorganizations and occurred much too rapidly to represent a direct response to a significant change in dip of the subducted slab. Ban et al. (1992) and Delgado-Granados et al. ( 1995) suggest that the trenchward migration of volcanism could be related to a steepening of the subduction angle of the Cocos plate. In addition, they consider that a shift seaward of the position of the trench could also have originated the southward migration. The order of magnitude of the
reported southward migration of volcanic activity in both regions prior to the development of the modern magmatic arc seems to indicate that the mechanism responsible for this phenomenon is related to plate tectonic readjustments. However, the differences in the orientation of the volcanic drift stress the role of the orientation of the crustal fault zones that provided suitable magma paths from the source region to the surface.
The mean direction calculated in the previous section (D= 350.r; 1= 30.6°, N= 25, k= 30.7 and [;(95 =5.3°) represents a mean of the 3.6-0.7 Ma time span. This direction could reflect a small counterclockwise rotation. A mean direction has also been computed from the older and younger magnetozones (Table 3). Magnetozones A and B give a mean direction of D = 345.3 0, 1 = 30.4 ° (N = 11, k= 28.0, [;(95= 8.8°), and for the magnetozones C and D, the mean direction is D = 354.6°, 1= 29.2° (N = 12, k= 34.8, [;(95 = 7.5°). Although, strictly speaking, both directions are statistically undifferentiated and it is not certain that the secular variation has been averaged, a difference in declination of about 9° between both directions is observed that is not shown in inclination values. This suggests that a small counterclockwise rotational component may be coeval with the southeastern migration of the Sierra de Las Cruces. However, this should be considered only as a speculative hypothesis and must be tested in other regions in the eastern TMVB.
Acknowledgements
Most of the K-Ar analyses were carried out at the CA!: Laboratorio de Geocronologia y Geoquimica Isot6pica of the Complutense University. We are very grateful for the facilities and the service that this Institution has provided. We thank Juan N ufiez-Aguilar and Cristina Osete for their help with the drawings. The field work was completed during a stay of three months by one of the authors (M.L.O.) at the Instituto de Geofisica of UNAM, Mexico, which was funded by Intercambio Academico ( UNAM). M.L. O. also very much appreciates the help of Martin Espinosa and Teodoro Hernandez and is indebted
to Ana Maria Soler and her family and to Dante Moran for their friendly support. Avto Gogichaishvili and two anonymous reviewers provided useful comments that have improved the manuscript. The project was supported by the European Union (project: CI-CT94-0114).
References
Ban, M., Hasenaka, T., Delgado-Granados, H., Takaoka, N., 1992. K-Ar ages of lavas from shield volcanoes in the Michoacan-Guanajuato volcanic field, Mexico. Geofis. Int. 31, 467-475.
Butler, R.F., 1992. Paleomagnetism: Magnetic Domains to Geological Terranes. Blackwell Scien tific Publications, Boston, MA. 319 pp.
Cande, S.C, Kent, D.V., 1995. Revised calibration of the geomagnetic polarity timescale for the Late Cretaceous and Cenozoic. 1. Geophys. Res. 100, B46093-B46095.
Cantagrel, 1.M., Robin, c., 1979. K-Ar dating on Eastern Mexican volcanic rocks - Relations between the andesitic and the alkaline Provinces. 1. Volcanol. Geotherm. Res. 5, 99-114.
Delgado-Granados, H., Martin del Pozo, A.L., 1993. Pliocene to Holocene volcanic geology at the junction of Las Cruces Chichinautzin and Ajusco ranges, southwest of Mexico City. Geofis. Int. 32 (3), 511-522.
Delgado-Granados, H., Urrutia-Fucugacuhi, J., Hasenaka, T., Ban, M., 1995. Southwestward volcanic migration in the western Trans-Mexican Volcanic Belt during the last 2 Ma. Geofis. Int. 34 (3), 341-352.
Demant, A., 1978. Caracteristicas del Eje Neovolcanico Transmexicano y sus problemas de interpretacion. Revista Inst. Geol. U.N.A.M. 2, 172-187.
Ferrari, L., Gar dufi 0 , V.H., Pasquare, G., Tibaldi, A., 1994. Volcanic and tectonic evolution of central Mexico: Oligocene to present. Geofis. Int. 33 (1),91-105.
Ferrari, L., Vaggelli, G., Petrone, CM., Manetti, P., Conticelli, S., 2000. Late Miocene volcanism and intra-arc tectonics during the early development of the Trans-Mexican volcanic belt. Tectonophysics 318, 161-185.
Fries, C, 1960. Geologia del Estado de Morelos y partes adyacentes de Mexico y Guerrero, region central meridional de Mexico. U.N.A.M. Inst. Geol. Bol. 60, 236.
Gunn, B.M., Mooser, F., 1971. Geochemistry of the volcanics of central Mexico. Bull. Volcanol. 34, 577-616.
Halls, H.C, 1976. A least-squares method to find a remanence direction from con verging remagnetization circles. Geophys. J. R. Astron. Soc. 45, 297-304.
INEGI, 1986. Carta geologica EI4-2. Direccion General de Geograffa. Secretaria de Programaci6n y Presupuesto, Mexico.
Kirschvink, J.L., 1980. The least-squares line and plane and the
analysis of pal eo magnetic data. Geophys. 1. R. Astron. Soc. 62, 699-718.
Lugo-Hubp, 1. , 1984. Geomorfologia del sur de la cuenca de Mexico. Inst. Geografia, UNAM, Serie Varia 1 (9), 95 pp.
Luhr, J.F., Nelson, S.A., Allan, J.F, Carmichael, LS.E., 1985. Active rifting in southwestern Mexico: Manifestations of an incipient eastward spreading-ridge jump. Geology 13, 54-57.
McFadden, P.L., McElhinny, M.W., 1988. The combined analysis of remagnetization circles and direct observations in palaeomagnetism. Earth Planet. Sci. Lett. 87, 161-172.
McFadden, P.L., McElhinny, M.W., 1990. Oassification of the reversal test in paleomagnetism. Geophys. 1. Int. 103,
725-729. M ammerick x , 1. , Klitgord, K., 1982. Northern East Pacific
Rise: Evolution from 25 m.y. RP. to the present. 1. Geo
phys. Res. 87, 6751-6759. Merril, RT., McElhinny, M.W., 1983. The Earth's Magnetic
field: Its History Origin and Planetary Perspective. Aca
demic Press, London. 401 pp. Molnar, P., Sykes, L., 1969. Tectonics of the Caribbean and
Middle American regions from focal mechanisms and
seismicity. Geol. Soc. Am. Bull. 80, 1639-1684. Moore, G., Marone, c., Carmichael, LS.E., Renne, P., 1994.
Basaltic volcanism and extension near the intersection of the Sierra Madre volcanic province and the Mexican volcanic belt. Geol. Soc. Am. Bull. 106, 383-394.
Mooser, F, 1972. The Mexican volcanic belt: Structure and tectonics. Geofis. Int. 12, 55-70.
Mooser, F., Nairn, A.E.M., Negendank, J.FW., 1974. Palaeomagnetic investigations of the Tertiary and Quaternary igneous rocks: VIII A Palaeomagnetic and petrologic study of
volcanics of Valley of Mexico. Geol. Rundsch. 63, 451-483. Mora-Alvarez, G., Caballero, c., Urrutia-Fucugauchi, J., Uchi
umi , S., 1991. Southward migration of volcanic activity in the Sierra de Las Cruces, basin of Mexico? A preliminary K-Ar dating and palaeomagnetic study. Geofis. Int. 30
(2), 61-70. Nixon, G.T., 1982. The relationship between Quaternary volca
nism in central Mexico and the seismicity and the structure
of subducted oceanic lithosphere. Geol. Soc. Am. Bull. 93, 514-523.
Nixon, GT., Demant, A., Amstrong, R.L., Harakal, J.E., 1987. K-Ar and geologic data bearing on the age and evolution
of the T rans-Mexican Volcanic Belt. Geofis. In t. 26 (1), 109-158.
Ozdemir, 0 . , 1990. High-temperature hysteresis and thermoremanence of single-domain maghemite. Phys. Earth Planet. In ter. 65, 125-136.
Pardo, M., Suarez, G., 1995. Shape of the subducted Rivera and Cocos plates in southern Mexico: Seismic and tectonic implications. 1. Geophys. Res. B, 100 (7), 12 357-12 373.
Pasquare, G., Forcella, F., Tibaldi, A., Vezzoli, L., Zanchi, A., 1986. Structural behaviour of a continental volcanic arc. In: Wezel, C. (Ed.), The Mexican Volcanic Belt. The Origin of Arcs. Elsevier, Amsterdam, pp. 509-527.
Pasquare, G., Ferrari, L., Gardullo, V.H., Tibaldi, A., Vezzoli, L., 1991. In: Geology of the Central Sector of the Mexican Volcanic Belt States of Guanajuato and Michoacan. Geol. Soc. Am. Map and Chart Series MCH072, 22 pp.
Richter, R., Negendank, J.F.W., 1976. Spurenelementuntersuchungen an Vulkaniten des Tales von Mexiko. Muenster. Forsch. Geol. Palaeontol. 38-39, 179-200.
Rosas-Elguera, 1. , Ferrari, L., L6pez-Martinez, M., UrrutiaFucugauchi, J., 1997. Stratigraphy and tectonics of the Guadalajara region and the triple-junction area western Mexico. Int. Geol. Rev. 39, 125-140.
Ruiz-Martinez, v.c., Osete, M.L., Vegas, R., Niifiez-Aguilar, J.I., Urrutia-Fucugauchi, J., Tarling, D.H., 2000. Palaeomagnetism of Late Miocene to Quaternary rocks from the Eastern Segment of the Trans-Mexican Volcanic Belt. Tectonophy�cs 318, 217-233.
Soler-Arechalde, A.M., Urrutia-Fucugauchi, J., 1995. Evidencias de geosutura en el centro de Mexico. Bol. Geos. 15, 71.
Schlaepfer, c., 1968. Hoja Mexico 14Q-h(5), con resumen de la Hoja Mexico, Distrito Federal y Estados de Mexico y Morelos, Carta Geol. de Mex., serie 1:100.000. U.N.A.M. Inst. Geol.
Shurbet, D.H., Cebull, S.E., 1973. Tectonic interpretation of the Trans-Mexican volcanic belt. Tectonophysics 101, 159-165.
Steiger, R.H., Jager, E., 1977. Subcommission of geochronology: Convention on the use of decay constants in geochronology and cosmochronology. Earth Planet. Sci. Lett. 36, 359-362.
Urrutia-Fucugauchi, 1. , Bohnel, H., 1988. Tectonics along the Trans-Mexican volcanic belt according to palaeomagnetic data. Phys. Earth Planet. Inter. 52, 320-329.
Urrutia-Fucugauchi, J., Del Castillo, L., 1997. Un modelo del eje neovolcanico mexicano. Bol. Soc. Geol. Mex. 38, 18-26.


