Embed Size (px)
Citation preview
BioMed Central
International Journal of Health Geographics
ss
Open AcceResearchSpatial correlations of mapped malaria rates with environmental factors in Belize, Central AmericaShilpa Hakre*1, Penny Masuoka1,2, Errol Vanzie3 and Donald R Roberts1Address: 1Department of Preventive Medicine and Biometrics, Uniformed Services University of the Health Sciences, Bethesda, Maryland, USA, 2Laboratory for Terrestrial Physics, Goddard Space Flight Center, Greenbelt, Maryland, USA and 3Ministry of Health, Belmopan, Cayo, Belize
Email: Shilpa Hakre* - [email protected]; Penny Masuoka - [email protected]; Errol Vanzie - [email protected]; Donald R Roberts - [email protected]
* Corresponding author
AbstractBackground: The purposes of this study were to map overall malaria incidence rates from 1989through 1999 for villages in Belize; to assess the seasonal distribution of malaria incidence by region;and to correlate malaria incidence rates with vegetation cover and rivers in villages, usinggeographic information system technology.
Malaria information on 156 villages was obtained from an electronic database maintained by theBelize National Malaria Control Program. Average annual malaria incidence rates per 1000population over 10 years were calculated for villages using the 1991 population census as adenominator. Malaria incidence rates were integrated with vegetation cover from a 1995vegetation map, and with river data from a digital data set.
Results: Mapping malaria incidence over the 10-year period in the study villages indicated theexistence of a spatial pattern: the southern and western areas of Belize had consistently higherrates of malaria than northern areas. Examination of the seasonal distribution of malaria incidenceby month over 10 years indicated that a statistically significant difference existed among districtsand among months (p < 0.05). Spatial analysis of malaria incidence rates and of vegetation in Belizeshowed villages with high malaria rates having more broadleaf hill forests, agricultural land, andwetland vegetation types (i.e. SWF-seasonally waterlogged fire-induced shrubland of the plains).Statistical and spatial analyses of malaria incidence and of river distributions in Belize determinedthe high 10 percentile malaria incidence villages in western and southern Belize to have more riverswithin two kilometers of the center of a village and a statistically significant correlation betweenproximity to rivers and villages (Spearman's γ = -0.23; p < 0.05), especially in Stann Creek District(Spearman's γ = -0.82; p < 0.05).
Conclusions: Examination of the distribution of malaria during 10 years indicated transmissionvaried among geographic areas and among seasons. Additional studies are needed to examine, inmore detail, the association between environmental and meteorological factors and malariatransmission. Furthermore, the role of An. darlingi in malaria transmission in Stann Creek needsfurther study since, of the three main vectors in Belize, An. darlingi has been found stronglyassociated with rivers.
Published: 22 March 2004
International Journal of Health Geographics 2004, 3:6
Received: 13 January 2004Accepted: 22 March 2004
This article is available from: http://www.ij-healthgeographics.com/content/3/1/6
© 2004 Hakre et al; licensee BioMed Central Ltd. This is an Open Access article: verbatim copying and redistribution of this article are permitted in all media for any purpose, provided this notice is preserved along with the article's original URL.
Page 1 of 12(page number not for citation purposes)
International Journal of Health Geographics 2004, 3 http://www.ij-healthgeographics.com/content/3/1/6
BackgroundGeographic information systems (GIS) are computerizedsystems utilized to process and manage spatial data. A GISis capable of integrating topographical maps, satelliteimages, and aerial photos with attribute data such asdemographic and socioeconomic characteristics and dis-ease incidence. The systems have been used widely to pro-duce maps of disease distribution and for analyzingspatial patterns in disease distribution [1-7]. These mapshave been used as tools for developing control and inter-vention strategies.
In this study, a GIS was used to map malaria incidencerates for villages in Belize. The country of Belize, which isdivided into six administrative districts, is geologically,environmentally and topographically diverse [8-10]. Ele-vation varies from 0 to 20 meters in the marshes andswamp forests of the coastal plain to 1124 meters at thehighest peak in the Maya Mountains. Annual rainfall var-ies from 1200 millimeters in the north to 4000 millime-ters in the south. Generally, the months of June throughNovember are considered the wet season and Januarythrough April constitute the dry season. December andMay are transitional months when rainfall occurs but notfor prolonged periods as in the wet season. Vegetationtypes in Belize encompass savanna, mangrove, pine for-ests, and broadleaf hill forests.
Three anopheline species, considered as potential malariavectors in Belize, have larval habitats characterized by aspecific vegetation type. Anopheles albimanus, the mostwidely distributed mosquito in Belize, is associated withcyanobacterial mat and submerged-periphyton habitats[11]. Anopheles darlingi, primarily a riverine mosquito, hasbeen found, during both wet and dry seasons, in shadedor partly shaded patches of floating debris and submergedplants along creek and river margins [12]. Anopheles vestiti-pennis, found throughout the year, is most abundant inthe wet season in swamp forest and tall dense macrophytemarsh habitats [13,14].
The epidemiology of arthropod-borne diseases is directlyinfluenced by vector characteristics. The survival, distribu-tion, and abundance of vectors are closely linked to envi-ronmental and climatic conditions such as vegetation,rainfall, and availability of adequate aquatic environ-ments for larval habitats. The aquatic habitats are particu-larly important for mosquito-borne diseases. GIS, withthe ability to integrate and manage multiple geographicand attribute data sources, aid in the study of the environ-mental and climatic factors associated with diseases suchas malaria, lymphatic filariasis, and onchocerciasis [15-19].
The purposes of this study were to map average annualmalaria incidence rates for 1989 through 1999 for villagesin Belize, to assess the seasonal distribution of averageannual malaria incidence rates by region, and to correlatemalaria incidence rates with vegetation cover and rivers invillages. We conducted the study by creating and analyz-ing a GIS composed of topographical maps of Belize, a1995 vegetation map, a rivers/streams digital data set,malaria cases from 1989 through 1999 for 156 villagesand the 1991 national population census.
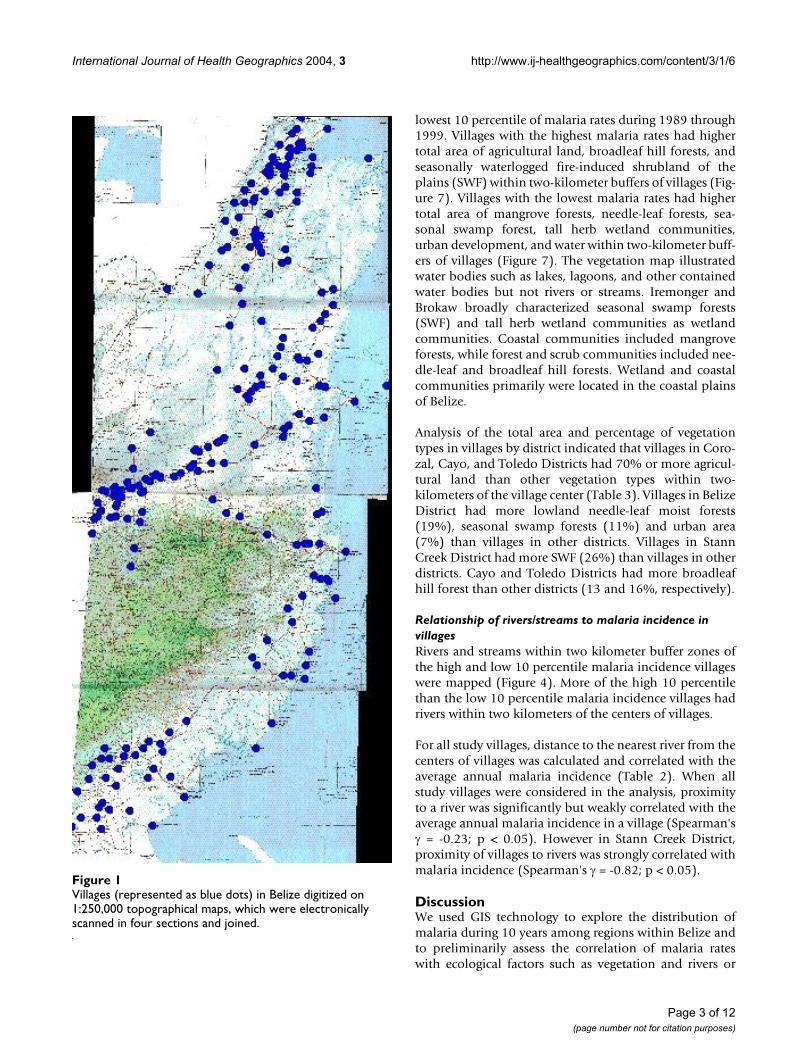
ResultsOnly villages with malaria, census, and geographic loca-tion information were selected for mapping of malariadistribution for the years 1989 through 1999. The topo-graphical maps had the locations of 213 villages in Belize(Figure 1). The study included 156 villages and excludedfifty-seven villages due to lack of population census infor-mation (Table 1). It is likely that the fifty-seven villageswere not included in the census due to their small size(perhaps only a few families). The fact that none of thesevillages appeared in the malaria database is also an indi-cation that these villages did not have malaria cases dur-ing the 10 years covered in this study. Higher percentages(32 to 38) of the excluded villages were located in Belize,Cayo, and Stann Creek Districts.
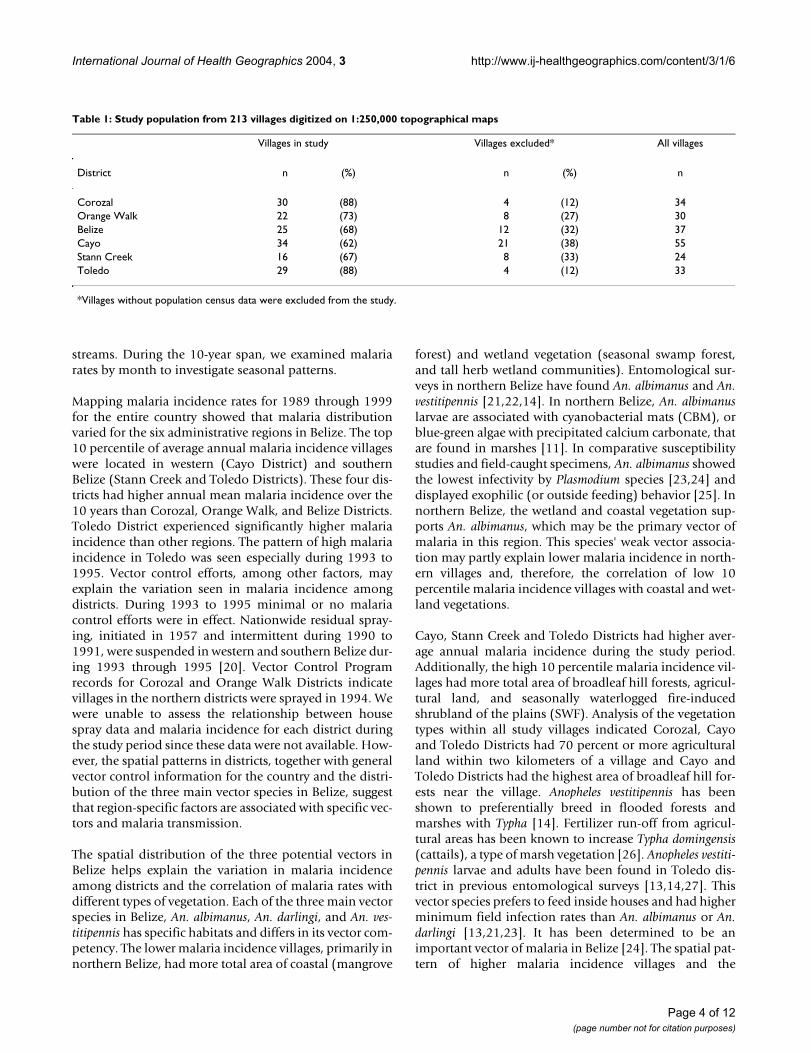
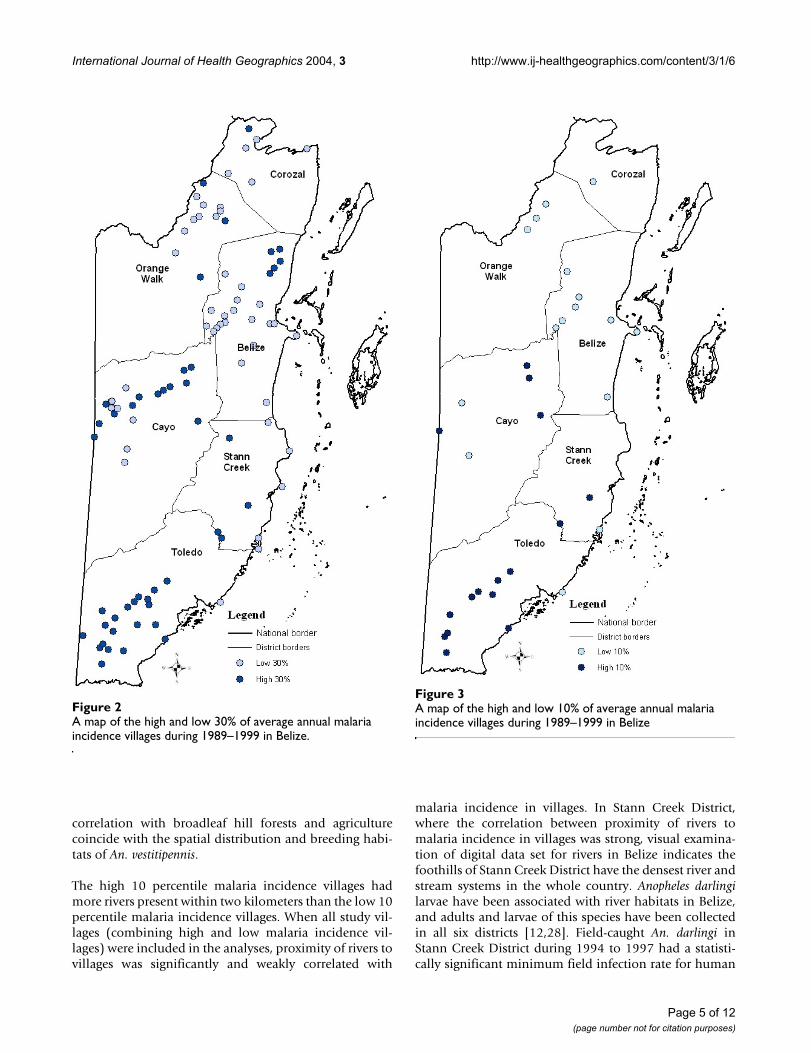
Spatial distribution of malaria ratesA spatial pattern is seen in the distribution of high andlow 30 (Figure 2) and 10 (Figure 3) percentile malariaincidence (averaged annual rates) villages in the study.The villages with higher malaria incidence rates (top 30%and 10%) were located in southern (Toledo and StannCreek Districts) and western Belize (Cayo District). Thevillages with lower malaria incidence rates (low 30% and10%) during 10 years were located in the northern areasof Belize (Corozal, Orange Walk and Belize Districts).
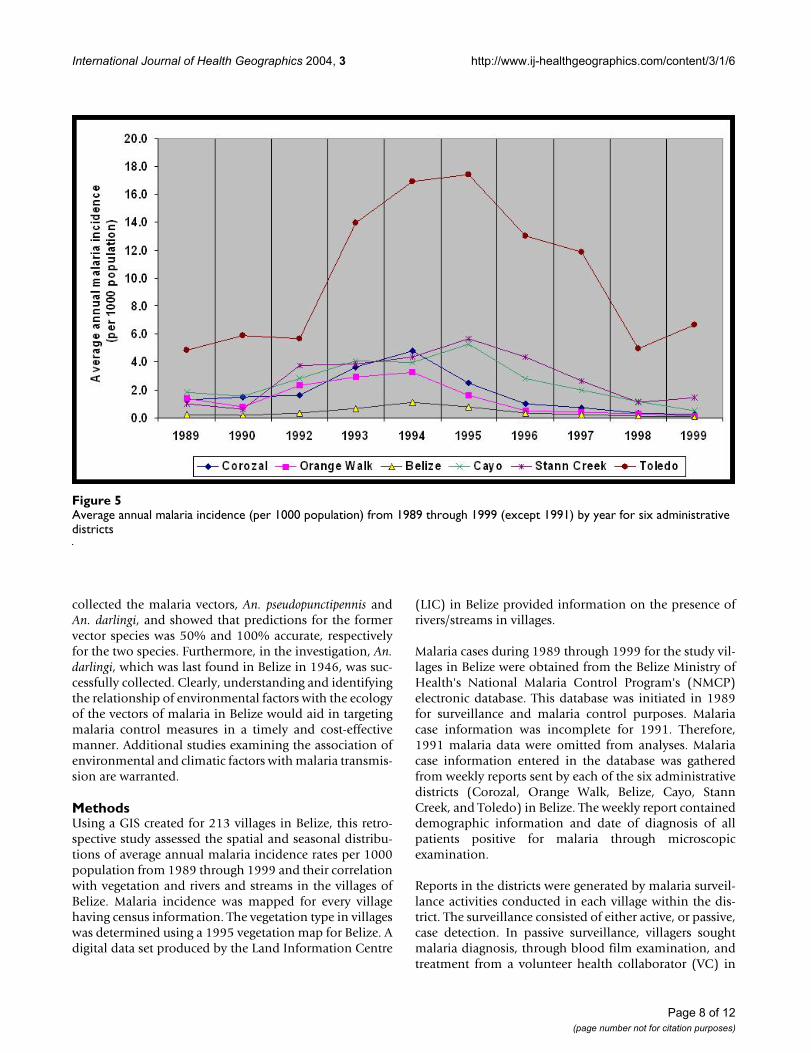
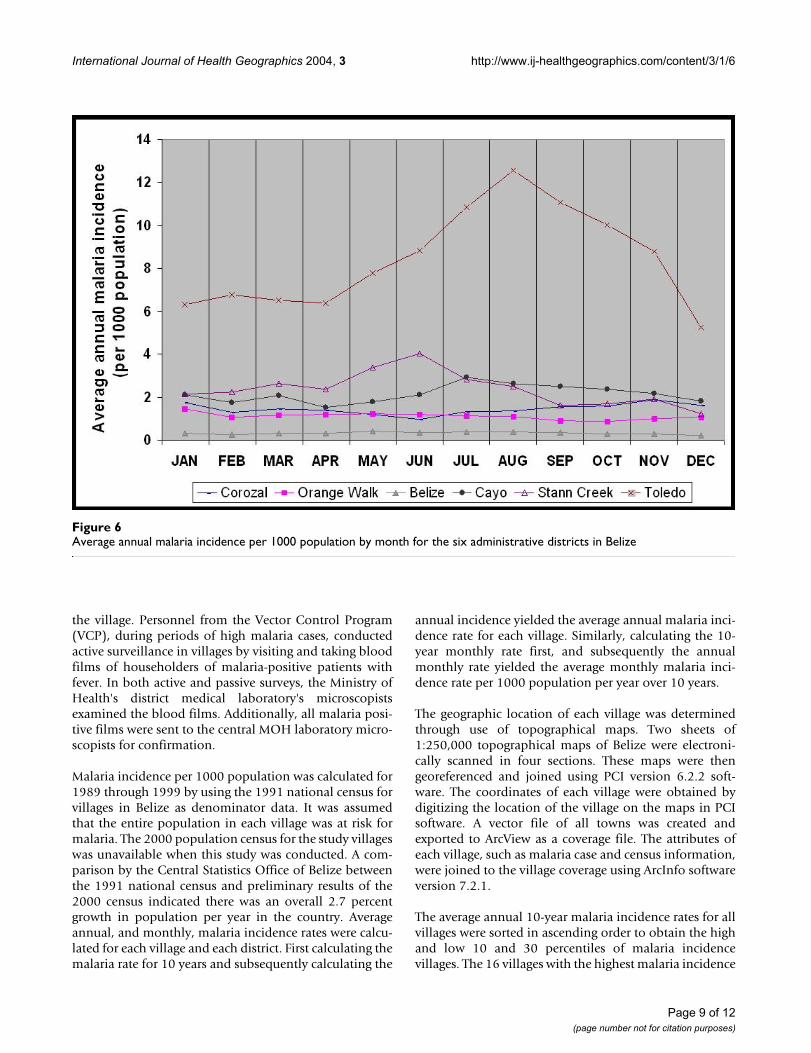
Seasonal distribution of malaria incidenceAmong all districts, Toledo had the highest averageannual malaria incidence from 1989 through 1999 (Table2, Figure 5). During the study period, Cayo, Stann Creek,and Toledo Districts had higher average annual malariaincidence than Corozal, Orange Walk, and Belize Districts(Table 2), which corroborates the results of mapping thehigh and low malaria incidence villages (Figures 2 and 3).Average monthly malaria incidence varied significantly inmagnitude among districts and among months (p < 0.05).Average monthly malaria incidence for 1989 through1999 was highest in August in Toledo District and in Junein Stann Creek District.
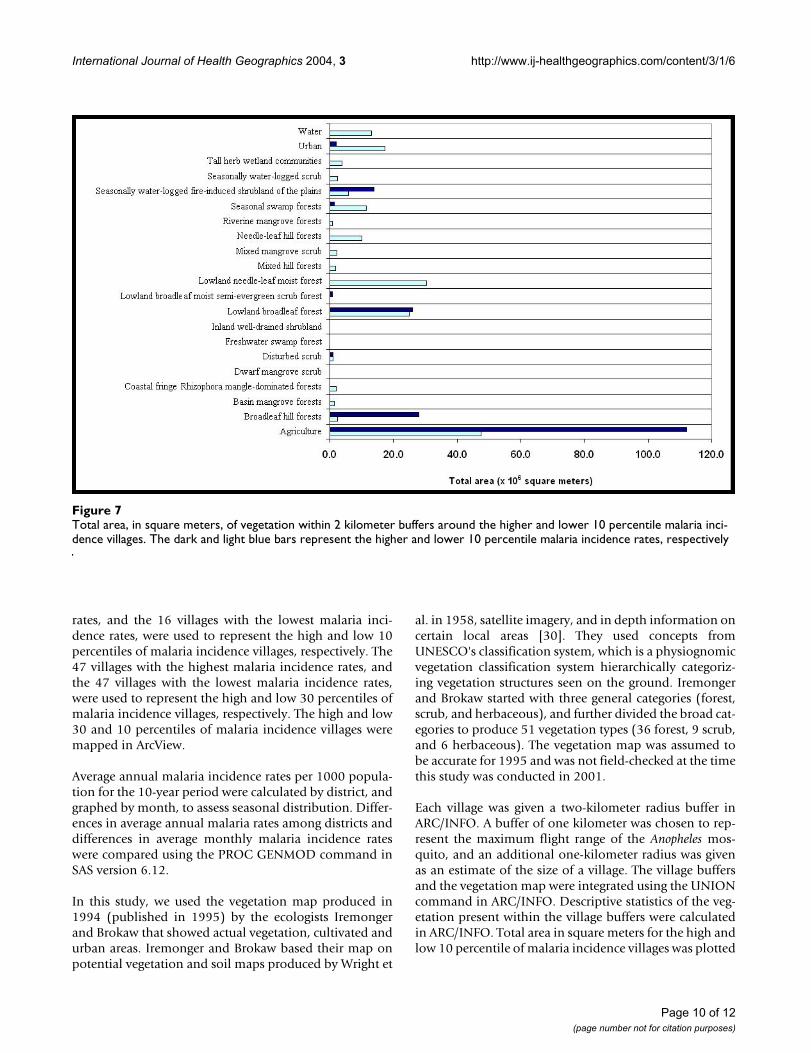
Vegetation in study villagesThe total area of vegetation types was determined withintwo-kilometer buffers of villages with the highest and
Page 2 of 12(page number not for citation purposes)
International Journal of Health Geographics 2004, 3 http://www.ij-healthgeographics.com/content/3/1/6
lowest 10 percentile of malaria rates during 1989 through1999. Villages with the highest malaria rates had highertotal area of agricultural land, broadleaf hill forests, andseasonally waterlogged fire-induced shrubland of theplains (SWF) within two-kilometer buffers of villages (Fig-ure 7). Villages with the lowest malaria rates had highertotal area of mangrove forests, needle-leaf forests, sea-sonal swamp forest, tall herb wetland communities,urban development, and water within two-kilometer buff-ers of villages (Figure 7). The vegetation map illustratedwater bodies such as lakes, lagoons, and other containedwater bodies but not rivers or streams. Iremonger andBrokaw broadly characterized seasonal swamp forests(SWF) and tall herb wetland communities as wetlandcommunities. Coastal communities included mangroveforests, while forest and scrub communities included nee-dle-leaf and broadleaf hill forests. Wetland and coastalcommunities primarily were located in the coastal plainsof Belize.
Analysis of the total area and percentage of vegetationtypes in villages by district indicated that villages in Coro-zal, Cayo, and Toledo Districts had 70% or more agricul-tural land than other vegetation types within two-kilometers of the village center (Table 3). Villages in BelizeDistrict had more lowland needle-leaf moist forests(19%), seasonal swamp forests (11%) and urban area(7%) than villages in other districts. Villages in StannCreek District had more SWF (26%) than villages in otherdistricts. Cayo and Toledo Districts had more broadleafhill forest than other districts (13 and 16%, respectively).
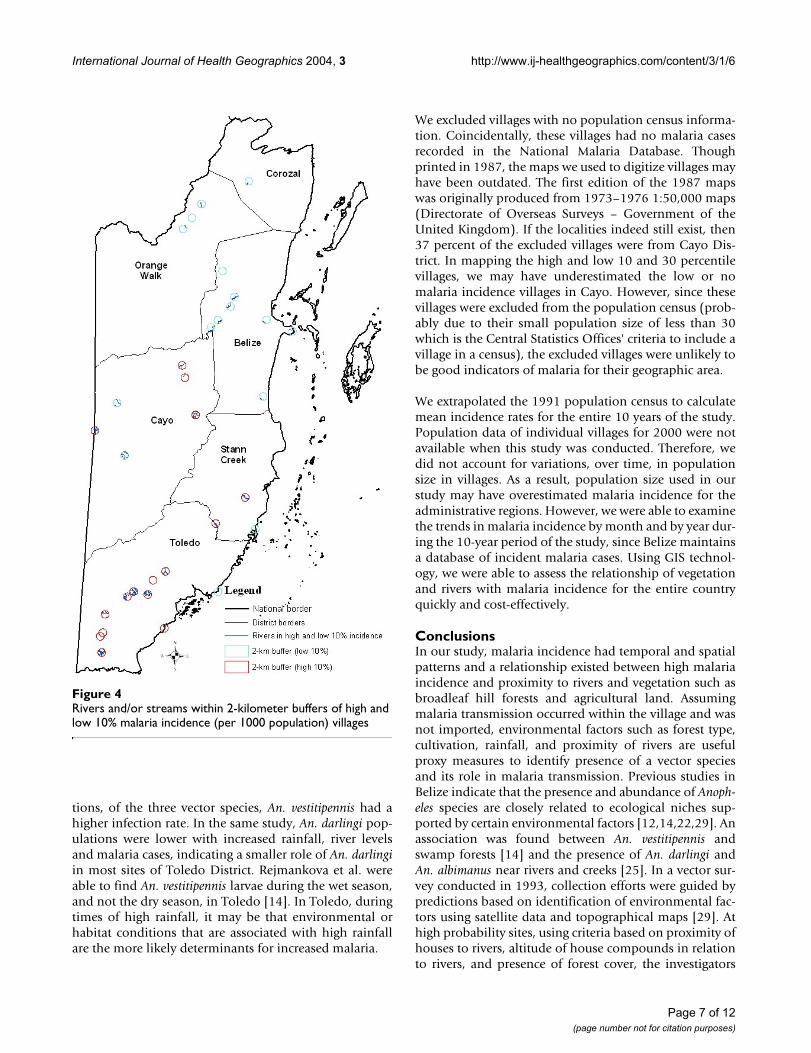
Relationship of rivers/streams to malaria incidence in villagesRivers and streams within two kilometer buffer zones ofthe high and low 10 percentile malaria incidence villageswere mapped (Figure 4). More of the high 10 percentilethan the low 10 percentile malaria incidence villages hadrivers within two kilometers of the centers of villages.
For all study villages, distance to the nearest river from thecenters of villages was calculated and correlated with theaverage annual malaria incidence (Table 2). When allstudy villages were considered in the analysis, proximityto a river was significantly but weakly correlated with theaverage annual malaria incidence in a village (Spearman'sγ = -0.23; p < 0.05). However in Stann Creek District,proximity of villages to rivers was strongly correlated withmalaria incidence (Spearman's γ = -0.82; p < 0.05).
DiscussionWe used GIS technology to explore the distribution ofmalaria during 10 years among regions within Belize andto preliminarily assess the correlation of malaria rateswith ecological factors such as vegetation and rivers or
Villages (represented as blue dots) in Belize digitized on 1:250,000 topographical maps, which were electronically scanned in four sections and joinedFigure 1Villages (represented as blue dots) in Belize digitized on 1:250,000 topographical maps, which were electronically scanned in four sections and joined.
Page 3 of 12(page number not for citation purposes)
International Journal of Health Geographics 2004, 3 http://www.ij-healthgeographics.com/content/3/1/6
streams. During the 10-year span, we examined malariarates by month to investigate seasonal patterns.
Mapping malaria incidence rates for 1989 through 1999for the entire country showed that malaria distributionvaried for the six administrative regions in Belize. The top10 percentile of average annual malaria incidence villageswere located in western (Cayo District) and southernBelize (Stann Creek and Toledo Districts). These four dis-tricts had higher annual mean malaria incidence over the10 years than Corozal, Orange Walk, and Belize Districts.Toledo District experienced significantly higher malariaincidence than other regions. The pattern of high malariaincidence in Toledo was seen especially during 1993 to1995. Vector control efforts, among other factors, mayexplain the variation seen in malaria incidence amongdistricts. During 1993 to 1995 minimal or no malariacontrol efforts were in effect. Nationwide residual spray-ing, initiated in 1957 and intermittent during 1990 to1991, were suspended in western and southern Belize dur-ing 1993 through 1995 [20]. Vector Control Programrecords for Corozal and Orange Walk Districts indicatevillages in the northern districts were sprayed in 1994. Wewere unable to assess the relationship between housespray data and malaria incidence for each district duringthe study period since these data were not available. How-ever, the spatial patterns in districts, together with generalvector control information for the country and the distri-bution of the three main vector species in Belize, suggestthat region-specific factors are associated with specific vec-tors and malaria transmission.
The spatial distribution of the three potential vectors inBelize helps explain the variation in malaria incidenceamong districts and the correlation of malaria rates withdifferent types of vegetation. Each of the three main vectorspecies in Belize, An. albimanus, An. darlingi, and An. ves-titipennis has specific habitats and differs in its vector com-petency. The lower malaria incidence villages, primarily innorthern Belize, had more total area of coastal (mangrove
forest) and wetland vegetation (seasonal swamp forest,and tall herb wetland communities). Entomological sur-veys in northern Belize have found An. albimanus and An.vestitipennis [21,22,14]. In northern Belize, An. albimanuslarvae are associated with cyanobacterial mats (CBM), orblue-green algae with precipitated calcium carbonate, thatare found in marshes [11]. In comparative susceptibilitystudies and field-caught specimens, An. albimanus showedthe lowest infectivity by Plasmodium species [23,24] anddisplayed exophilic (or outside feeding) behavior [25]. Innorthern Belize, the wetland and coastal vegetation sup-ports An. albimanus, which may be the primary vector ofmalaria in this region. This species' weak vector associa-tion may partly explain lower malaria incidence in north-ern villages and, therefore, the correlation of low 10percentile malaria incidence villages with coastal and wet-land vegetations.
Cayo, Stann Creek and Toledo Districts had higher aver-age annual malaria incidence during the study period.Additionally, the high 10 percentile malaria incidence vil-lages had more total area of broadleaf hill forests, agricul-tural land, and seasonally waterlogged fire-inducedshrubland of the plains (SWF). Analysis of the vegetationtypes within all study villages indicated Corozal, Cayoand Toledo Districts had 70 percent or more agriculturalland within two kilometers of a village and Cayo andToledo Districts had the highest area of broadleaf hill for-ests near the village. Anopheles vestitipennis has beenshown to preferentially breed in flooded forests andmarshes with Typha [14]. Fertilizer run-off from agricul-tural areas has been known to increase Typha domingensis(cattails), a type of marsh vegetation [26]. Anopheles vestiti-pennis larvae and adults have been found in Toledo dis-trict in previous entomological surveys [13,14,27]. Thisvector species prefers to feed inside houses and had higherminimum field infection rates than An. albimanus or An.darlingi [13,21,23]. It has been determined to be animportant vector of malaria in Belize [24]. The spatial pat-tern of higher malaria incidence villages and the
Table 1: Study population from 213 villages digitized on 1:250,000 topographical maps
Villages in study Villages excluded* All villages
District n (%) n (%) n
Corozal 30 (88) 4 (12) 34Orange Walk 22 (73) 8 (27) 30Belize 25 (68) 12 (32) 37Cayo 34 (62) 21 (38) 55Stann Creek 16 (67) 8 (33) 24Toledo 29 (88) 4 (12) 33
*Villages without population census data were excluded from the study.
Page 4 of 12(page number not for citation purposes)
International Journal of Health Geographics 2004, 3 http://www.ij-healthgeographics.com/content/3/1/6
correlation with broadleaf hill forests and agriculturecoincide with the spatial distribution and breeding habi-tats of An. vestitipennis.
The high 10 percentile malaria incidence villages hadmore rivers present within two kilometers than the low 10percentile malaria incidence villages. When all study vil-lages (combining high and low malaria incidence vil-lages) were included in the analyses, proximity of rivers tovillages was significantly and weakly correlated with
malaria incidence in villages. In Stann Creek District,where the correlation between proximity of rivers tomalaria incidence in villages was strong, visual examina-tion of digital data set for rivers in Belize indicates thefoothills of Stann Creek District have the densest river andstream systems in the whole country. Anopheles darlingilarvae have been associated with river habitats in Belize,and adults and larvae of this species have been collectedin all six districts [12,28]. Field-caught An. darlingi inStann Creek District during 1994 to 1997 had a statisti-cally significant minimum field infection rate for human
A map of the high and low 30% of average annual malaria incidence villages during 1989–1999 in BelizeFigure 2A map of the high and low 30% of average annual malaria incidence villages during 1989–1999 in Belize.
A map of the high and low 10% of average annual malaria incidence villages during 1989–1999 in BelizeFigure 3A map of the high and low 10% of average annual malaria incidence villages during 1989–1999 in Belize
Page 5 of 12(page number not for citation purposes)
International Journal of Health Geographics 2004, 3 http://www.ij-healthgeographics.com/content/3/1/6
Plasmodium circumsporozoite protein [23]. This Anophelesspecies is a competent vector because it is easily infectedby malaria parasites, especially P. falciparum, and readilyenters dwellings to blood-feed [24,25,28]. The highermalaria incidence in Stann Creek District together withthe correlation with rivers and malaria incidence indicatethat An. darlingi may play an important role in malariatransmission in this district.
Malaria incidence varied significantly by month withinthe six regions. Average monthly malaria incidence washighest in Toledo in August. Southern Belize has morebroadleaf hill forests, extensive river systems, and getsmore rainfall than northern areas. The ecology of this dis-trict (and Cayo) supports An. darlingi, An. vestitipennis,and An. albimanus [12,13,24,25]. At two sites in Toledo,Grieco found An. vestitipennis and An. albimanus popula-tions to be associated with rainfall and river levels [24]. Inthe study's circumsporozoite analysis of landing collec-
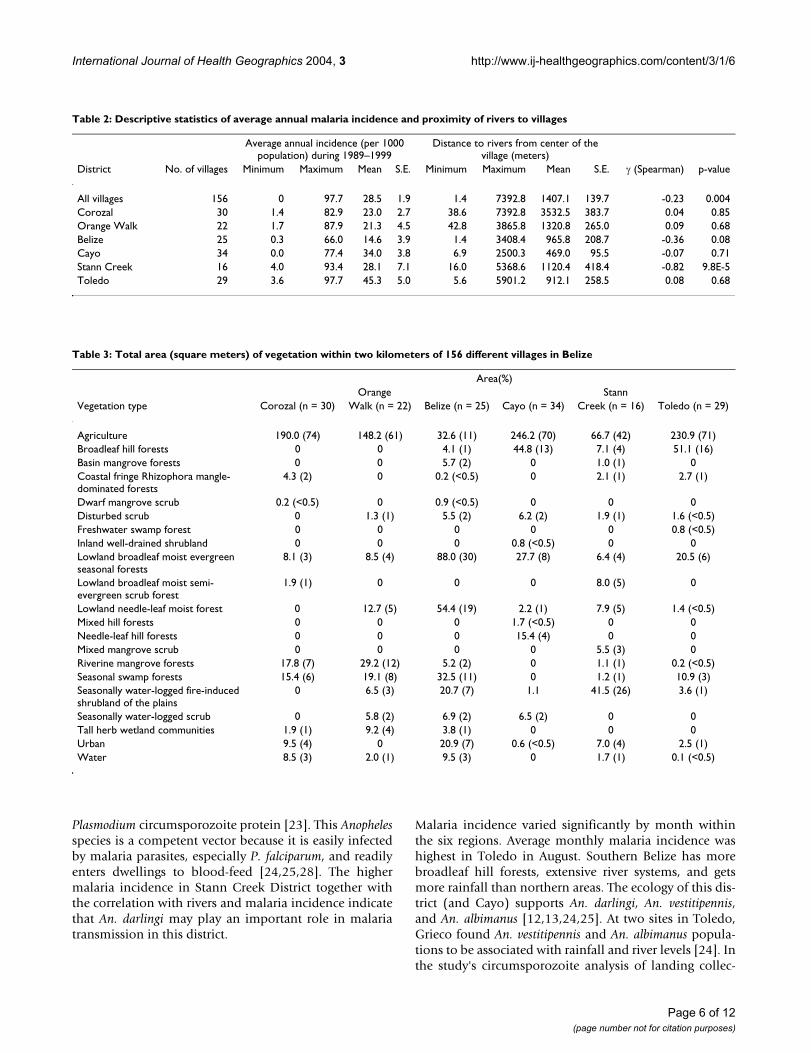
Table 2: Descriptive statistics of average annual malaria incidence and proximity of rivers to villages
Average annual incidence (per 1000 population) during 1989–1999
Distance to rivers from center of the village (meters)
District No. of villages Minimum Maximum Mean S.E. Minimum Maximum Mean S.E. γ (Spearman) p-value
All villages 156 0 97.7 28.5 1.9 1.4 7392.8 1407.1 139.7 -0.23 0.004Corozal 30 1.4 82.9 23.0 2.7 38.6 7392.8 3532.5 383.7 0.04 0.85Orange Walk 22 1.7 87.9 21.3 4.5 42.8 3865.8 1320.8 265.0 0.09 0.68Belize 25 0.3 66.0 14.6 3.9 1.4 3408.4 965.8 208.7 -0.36 0.08Cayo 34 0.0 77.4 34.0 3.8 6.9 2500.3 469.0 95.5 -0.07 0.71Stann Creek 16 4.0 93.4 28.1 7.1 16.0 5368.6 1120.4 418.4 -0.82 9.8E-5Toledo 29 3.6 97.7 45.3 5.0 5.6 5901.2 912.1 258.5 0.08 0.68
Table 3: Total area (square meters) of vegetation within two kilometers of 156 different villages in Belize
Area(%) Orange Stann
Vegetation type Corozal (n = 30) Walk (n = 22) Belize (n = 25) Cayo (n = 34) Creek (n = 16) Toledo (n = 29)
Agriculture 190.0 (74) 148.2 (61) 32.6 (11) 246.2 (70) 66.7 (42) 230.9 (71)Broadleaf hill forests 0 0 4.1 (1) 44.8 (13) 7.1 (4) 51.1 (16)Basin mangrove forests 0 0 5.7 (2) 0 1.0 (1) 0Coastal fringe Rhizophora mangle-dominated forests
4.3 (2) 0 0.2 (<0.5) 0 2.1 (1) 2.7 (1)
Dwarf mangrove scrub 0.2 (<0.5) 0 0.9 (<0.5) 0 0 0Disturbed scrub 0 1.3 (1) 5.5 (2) 6.2 (2) 1.9 (1) 1.6 (<0.5)Freshwater swamp forest 0 0 0 0 0 0.8 (<0.5)Inland well-drained shrubland 0 0 0 0.8 (<0.5) 0 0Lowland broadleaf moist evergreen seasonal forests
8.1 (3) 8.5 (4) 88.0 (30) 27.7 (8) 6.4 (4) 20.5 (6)
Lowland broadleaf moist semi-evergreen scrub forest
1.9 (1) 0 0 0 8.0 (5) 0
Lowland needle-leaf moist forest 0 12.7 (5) 54.4 (19) 2.2 (1) 7.9 (5) 1.4 (<0.5)Mixed hill forests 0 0 0 1.7 (<0.5) 0 0Needle-leaf hill forests 0 0 0 15.4 (4) 0 0Mixed mangrove scrub 0 0 0 0 5.5 (3) 0Riverine mangrove forests 17.8 (7) 29.2 (12) 5.2 (2) 0 1.1 (1) 0.2 (<0.5)Seasonal swamp forests 15.4 (6) 19.1 (8) 32.5 (11) 0 1.2 (1) 10.9 (3)Seasonally water-logged fire-induced shrubland of the plains
0 6.5 (3) 20.7 (7) 1.1 41.5 (26) 3.6 (1)
Seasonally water-logged scrub 0 5.8 (2) 6.9 (2) 6.5 (2) 0 0Tall herb wetland communities 1.9 (1) 9.2 (4) 3.8 (1) 0 0 0Urban 9.5 (4) 0 20.9 (7) 0.6 (<0.5) 7.0 (4) 2.5 (1)Water 8.5 (3) 2.0 (1) 9.5 (3) 0 1.7 (1) 0.1 (<0.5)
Page 6 of 12(page number not for citation purposes)
International Journal of Health Geographics 2004, 3 http://www.ij-healthgeographics.com/content/3/1/6
tions, of the three vector species, An. vestitipennis had ahigher infection rate. In the same study, An. darlingi pop-ulations were lower with increased rainfall, river levelsand malaria cases, indicating a smaller role of An. darlingiin most sites of Toledo District. Rejmankova et al. wereable to find An. vestitipennis larvae during the wet season,and not the dry season, in Toledo [14]. In Toledo, duringtimes of high rainfall, it may be that environmental orhabitat conditions that are associated with high rainfallare the more likely determinants for increased malaria.
We excluded villages with no population census informa-tion. Coincidentally, these villages had no malaria casesrecorded in the National Malaria Database. Thoughprinted in 1987, the maps we used to digitize villages mayhave been outdated. The first edition of the 1987 mapswas originally produced from 1973–1976 1:50,000 maps(Directorate of Overseas Surveys – Government of theUnited Kingdom). If the localities indeed still exist, then37 percent of the excluded villages were from Cayo Dis-trict. In mapping the high and low 10 and 30 percentilevillages, we may have underestimated the low or nomalaria incidence villages in Cayo. However, since thesevillages were excluded from the population census (prob-ably due to their small population size of less than 30which is the Central Statistics Offices' criteria to include avillage in a census), the excluded villages were unlikely tobe good indicators of malaria for their geographic area.
We extrapolated the 1991 population census to calculatemean incidence rates for the entire 10 years of the study.Population data of individual villages for 2000 were notavailable when this study was conducted. Therefore, wedid not account for variations, over time, in populationsize in villages. As a result, population size used in ourstudy may have overestimated malaria incidence for theadministrative regions. However, we were able to examinethe trends in malaria incidence by month and by year dur-ing the 10-year period of the study, since Belize maintainsa database of incident malaria cases. Using GIS technol-ogy, we were able to assess the relationship of vegetationand rivers with malaria incidence for the entire countryquickly and cost-effectively.
ConclusionsIn our study, malaria incidence had temporal and spatialpatterns and a relationship existed between high malariaincidence and proximity to rivers and vegetation such asbroadleaf hill forests and agricultural land. Assumingmalaria transmission occurred within the village and wasnot imported, environmental factors such as forest type,cultivation, rainfall, and proximity of rivers are usefulproxy measures to identify presence of a vector speciesand its role in malaria transmission. Previous studies inBelize indicate that the presence and abundance of Anoph-eles species are closely related to ecological niches sup-ported by certain environmental factors [12,14,22,29]. Anassociation was found between An. vestitipennis andswamp forests [14] and the presence of An. darlingi andAn. albimanus near rivers and creeks [25]. In a vector sur-vey conducted in 1993, collection efforts were guided bypredictions based on identification of environmental fac-tors using satellite data and topographical maps [29]. Athigh probability sites, using criteria based on proximity ofhouses to rivers, altitude of house compounds in relationto rivers, and presence of forest cover, the investigators
Rivers and/or streams within 2-kilometer buffers of high and low 10% malaria incidence (per 1000 population) villagesFigure 4Rivers and/or streams within 2-kilometer buffers of high and low 10% malaria incidence (per 1000 population) villages
Page 7 of 12(page number not for citation purposes)
International Journal of Health Geographics 2004, 3 http://www.ij-healthgeographics.com/content/3/1/6
collected the malaria vectors, An. pseudopunctipennis andAn. darlingi, and showed that predictions for the formervector species was 50% and 100% accurate, respectivelyfor the two species. Furthermore, in the investigation, An.darlingi, which was last found in Belize in 1946, was suc-cessfully collected. Clearly, understanding and identifyingthe relationship of environmental factors with the ecologyof the vectors of malaria in Belize would aid in targetingmalaria control measures in a timely and cost-effectivemanner. Additional studies examining the association ofenvironmental and climatic factors with malaria transmis-sion are warranted.
MethodsUsing a GIS created for 213 villages in Belize, this retro-spective study assessed the spatial and seasonal distribu-tions of average annual malaria incidence rates per 1000population from 1989 through 1999 and their correlationwith vegetation and rivers and streams in the villages ofBelize. Malaria incidence was mapped for every villagehaving census information. The vegetation type in villageswas determined using a 1995 vegetation map for Belize. Adigital data set produced by the Land Information Centre
(LIC) in Belize provided information on the presence ofrivers/streams in villages.
Malaria cases during 1989 through 1999 for the study vil-lages in Belize were obtained from the Belize Ministry ofHealth's National Malaria Control Program's (NMCP)electronic database. This database was initiated in 1989for surveillance and malaria control purposes. Malariacase information was incomplete for 1991. Therefore,1991 malaria data were omitted from analyses. Malariacase information entered in the database was gatheredfrom weekly reports sent by each of the six administrativedistricts (Corozal, Orange Walk, Belize, Cayo, StannCreek, and Toledo) in Belize. The weekly report containeddemographic information and date of diagnosis of allpatients positive for malaria through microscopicexamination.
Reports in the districts were generated by malaria surveil-lance activities conducted in each village within the dis-trict. The surveillance consisted of either active, or passive,case detection. In passive surveillance, villagers soughtmalaria diagnosis, through blood film examination, andtreatment from a volunteer health collaborator (VC) in
Average annual malaria incidence (per 1000 population) from 1989 through 1999 (except 1991) by year for six administrative districtsFigure 5Average annual malaria incidence (per 1000 population) from 1989 through 1999 (except 1991) by year for six administrative districts
Page 8 of 12(page number not for citation purposes)
International Journal of Health Geographics 2004, 3 http://www.ij-healthgeographics.com/content/3/1/6
the village. Personnel from the Vector Control Program(VCP), during periods of high malaria cases, conductedactive surveillance in villages by visiting and taking bloodfilms of householders of malaria-positive patients withfever. In both active and passive surveys, the Ministry ofHealth's district medical laboratory's microscopistsexamined the blood films. Additionally, all malaria posi-tive films were sent to the central MOH laboratory micro-scopists for confirmation.
Malaria incidence per 1000 population was calculated for1989 through 1999 by using the 1991 national census forvillages in Belize as denominator data. It was assumedthat the entire population in each village was at risk formalaria. The 2000 population census for the study villageswas unavailable when this study was conducted. A com-parison by the Central Statistics Office of Belize betweenthe 1991 national census and preliminary results of the2000 census indicated there was an overall 2.7 percentgrowth in population per year in the country. Averageannual, and monthly, malaria incidence rates were calcu-lated for each village and each district. First calculating themalaria rate for 10 years and subsequently calculating the
annual incidence yielded the average annual malaria inci-dence rate for each village. Similarly, calculating the 10-year monthly rate first, and subsequently the annualmonthly rate yielded the average monthly malaria inci-dence rate per 1000 population per year over 10 years.
The geographic location of each village was determinedthrough use of topographical maps. Two sheets of1:250,000 topographical maps of Belize were electroni-cally scanned in four sections. These maps were thengeoreferenced and joined using PCI version 6.2.2 soft-ware. The coordinates of each village were obtained bydigitizing the location of the village on the maps in PCIsoftware. A vector file of all towns was created andexported to ArcView as a coverage file. The attributes ofeach village, such as malaria case and census information,were joined to the village coverage using ArcInfo softwareversion 7.2.1.
The average annual 10-year malaria incidence rates for allvillages were sorted in ascending order to obtain the highand low 10 and 30 percentiles of malaria incidencevillages. The 16 villages with the highest malaria incidence
Average annual malaria incidence per 1000 population by month for the six administrative districts in BelizeFigure 6Average annual malaria incidence per 1000 population by month for the six administrative districts in Belize
Page 9 of 12(page number not for citation purposes)
International Journal of Health Geographics 2004, 3 http://www.ij-healthgeographics.com/content/3/1/6
rates, and the 16 villages with the lowest malaria inci-dence rates, were used to represent the high and low 10percentiles of malaria incidence villages, respectively. The47 villages with the highest malaria incidence rates, andthe 47 villages with the lowest malaria incidence rates,were used to represent the high and low 30 percentiles ofmalaria incidence villages, respectively. The high and low30 and 10 percentiles of malaria incidence villages weremapped in ArcView.
Average annual malaria incidence rates per 1000 popula-tion for the 10-year period were calculated by district, andgraphed by month, to assess seasonal distribution. Differ-ences in average annual malaria rates among districts anddifferences in average monthly malaria incidence rateswere compared using the PROC GENMOD command inSAS version 6.12.
In this study, we used the vegetation map produced in1994 (published in 1995) by the ecologists Iremongerand Brokaw that showed actual vegetation, cultivated andurban areas. Iremonger and Brokaw based their map onpotential vegetation and soil maps produced by Wright et
al. in 1958, satellite imagery, and in depth information oncertain local areas [30]. They used concepts fromUNESCO's classification system, which is a physiognomicvegetation classification system hierarchically categoriz-ing vegetation structures seen on the ground. Iremongerand Brokaw started with three general categories (forest,scrub, and herbaceous), and further divided the broad cat-egories to produce 51 vegetation types (36 forest, 9 scrub,and 6 herbaceous). The vegetation map was assumed tobe accurate for 1995 and was not field-checked at the timethis study was conducted in 2001.
Each village was given a two-kilometer radius buffer inARC/INFO. A buffer of one kilometer was chosen to rep-resent the maximum flight range of the Anopheles mos-quito, and an additional one-kilometer radius was givenas an estimate of the size of a village. The village buffersand the vegetation map were integrated using the UNIONcommand in ARC/INFO. Descriptive statistics of the veg-etation present within the village buffers were calculatedin ARC/INFO. Total area in square meters for the high andlow 10 percentile of malaria incidence villages was plotted
Total area, in square meters, of vegetation within 2 kilometer buffers around the higher and lower 10 percentile malaria inci-dence villagesFigure 7Total area, in square meters, of vegetation within 2 kilometer buffers around the higher and lower 10 percentile malaria inci-dence villages. The dark and light blue bars represent the higher and lower 10 percentile malaria incidence rates, respectively
Page 10 of 12(page number not for citation purposes)
International Journal of Health Geographics 2004, 3 http://www.ij-healthgeographics.com/content/3/1/6
by vegetation type. Additionally, total area and percentageof vegetation types in villages were calculated by district.
To assess the correlation of malaria incidence with riversin Belize, we used a digital data set of rivers purchasedfrom the LIC, Belize. The LIC produced the data set by dig-itizing rivers and streams using 1:50,000 and 1:250,000Belize topographical maps. To assess the distribution ofrivers in high versus low malaria incidence villages, two-kilometer buffers of high and low 10 percent malaria vil-lages were integrated with the rivers data set using theINTERSECT command in ARC/INFO. Distances from thecenter of all study villages to the closest river were calcu-lated using the NEAR command in ARC/INFO. Atnational and district levels, correlations between distancesto rivers from village centers, and average annual malariarates, were calculated using Spearman's correlation (SPSSversion 11.0 for Windows).
Authors' contributionsSH co-designed the study, developed the study's GIS, con-ducted spatial and statistical analyses, and drafted themanuscript. PM designed the study, co-developed thestudy's GIS, and conducted spatial analyses. EV initiatedand developed the National Malaria Database in Belize.DR participated in the study design and drafting of themanuscript.
All authors read, edited and accepted the final manuscript.
DisclaimerThis manuscript was completed in partial fulfillment ofthe Doctor of Public Health degree earned at the Depart-ment of Preventive Medicine and Biometrics, UniformedServices University of the Health Sciences, Bethesda, Mar-yland, USA. The opinions of the authors expressed in themanuscript do not reflect the views of the authors' affili-ated organizations.
AcknowledgementsWe would like to thank Dr. Paul Hshieh and Mrs. Cara Olsen for their help in statistical analyses. We would also like to thank the anonymous review-ers whose comments helped in improving the manuscript. This study was partially funded by NASA grant number NAG5-8532.
References1. Beyers N, Gie RP, Zietsman HL, Kunneke M, Hauman J, Tatley M,
Donald PR: The use of a geographical information system(GIS) to evaluate the distribution of tuberculosis in a high-incidence community. S Afr Med J 1996, 86:40-1, 44.
2. Brooker S, Rowlands M, Haller L, Savioli L, Bundy DA: Towards anatlas of human helminth infection in sub-Saharan Africa: theuse of geographical information systems (GIS). Parasitol Today2000, 16:303-307.
3. Cattani P, Jannin J, Lucas P: Sleeping sickness surveillance: anessential step towards elimination. Trop Med Int Health 2001,6:348-361.
4. Cherkasskiy BL: A national register of historic and contempo-rary anthrax foci. J Appl Microbiol 1999, 87:192-195.
5. Kitron U: Landscape ecology and epidemiology of vector-borne diseases: tools for spatial analysis. J Med Entomol 1998,35:435-445.
6. Moncayo AC, Edman JD, Finn JT: Application of geographic infor-mation technology in determining risk of eastern equineencephalomyelitis virus transmission. J Am Mosq Control Assoc2000, 16:28-35.
7. Omumbo J, Ouma J, Rapuoda B, Craig MH, le Sueur D, Snow RW:Mapping malaria transmission intensity using geographicalinformation systems (GIS): an example from Kenya. Ann TropMed Parasitol 1998, 92:7-21.
8. Wright ACS, Romney RH, Arbuckle RH, Vial VE: Land in BritishHonduras. Volume Colonial Research Publication No. 24. London, HerMajesty's Stationery Office; 1959:327.
9. King RB, Baillie IC, Abell TMB, Dunsmore JR, Gray DA, Pratt JH, Ver-sey HR, Wright ACS, Zisman SA: Land Resources Assessment ofNorthern Belize. 1992, National Resources Institute BulletinNo. 43:513.
10. Meerman JC, Sabido W: Central American Ecosystems Map:Belize. Volume 1. Belize City, Programme for Belize; 2001.
11. Rejmankova E, Harbach RE, Pecor J, Peyton EL, Manguin S, Krieg R,Polanco J, Legters L: Environmental and regional determinantsof Anopheles (Diptera: Culicidae) larval distribution inBelize, Central America. Environ Entomol 1993, 22:978-992.
12. Manguin S, Roberts DR, Andre RG, Rejmankova E, Hakre S: Charac-terization of Anopheles darlingi (Diptera: Culicidae) larvalhabitats in Belize, Central America. J Med Entomol 1996,33:205-211.
13. Roberts DR, Chan O, Pecor J, Rejmankova E, Manguin S, Polanco J,Legters LJ: Preliminary observations on the changing roles ofmalaria vectors in southern Belize. J Am Mosq Control Assoc 1993,9:456-459.
14. Rejmankova E, Pope KO, Roberts DR, Lege MG, Andre R, Greico J,Alonzo Y: Characterization and detection of Anopheles ves-titipennis and Anopheles punctimacula (Diptera: Culicidae)larval habitats in Belize with field survey and SPOT satelliteimagery. J Vector Ecol 1998, 23:74-88.
15. Bergquist NR: Vector-borne parasitic diseases: new trends indata collection and risk assessment. Acta Trop 2001, 79:13-20.
16. Sabesan S, Palaniyandi M, Das PK, Michael E: Mapping of lymphaticfilariasis in India. Ann Trop Med Parasitol 2000, 94:591-606.
17. Seketeli A, Adeoye G, Eyamba A, Nnoruka E, Drameh P, Amazigo UV,Noma M, Agboton F, Aholou Y, Kale OO, Dadzie KY: The achieve-ments and challenges of the African Programme forOnchocerciasis Control (APOC). Ann Trop Med Parasitol 2002,96 Suppl 1:S15-28.
18. Sharma VP, Srivastava A: Role of geographic information systemin malaria control. Indian J Med Res 1997, 106:198-204.
19. Yamagata Y, Suzuki T, Garcia Manzo GA: Geographical distribu-tion of the prevalence of nodules of Onchocerca volvulus inGuatemala over the last four decades. Trop Med Parasitol 1986,37:28-34.
20. Roberts DR, Vanzie E, Bangs MJ, Grieco JP, Lenares H, Hshieh P, Rej-mankova E, Manguin S, Andre RG, Polanco J: Role of residualspraying for malaria control in Belize. J Vector Ecol 2002,27:63-69.
21. Bangs MJ: The susceptibility and behavioral response ofAnopheles albimanus Weidemann and Anopheles vestiti-pennis Dyar and Knab (Diptera: Culicidae) to insecticides innorthern Belize, Central America. Department of Preventive Med-icine and Biometrics Bethesda, Maryland, Uniformed Services Univer-sity of the Health Sciences; 1999:448.
22. Rejmankova E, Roberts DR, Pawley A, Manguin S, Polanco J: Predic-tions of adult Anopheles albimanus densities in villages basedon distances to remotely sensed larval habitats. Am J Trop MedHyg 1995, 53:482-488.
23. Achee NL, Korves CT, Bangs MJ, Rejmankova E, Lege MG, Curtin D,Lenares H, Alonzo Y, Andre RG, Roberts DR: Plasmodium vivaxpolymorphs and Plasmodium falciparum circumsporozoiteproteins in Anopheles (Diptera: Culicidae) from Belize, C.A.J Vector Ecol 2000, 25:203-211.
24. Grieco JP: The bionomics and vector competence of Anophe-les albimanus Wiedemann and Anopheles vestitipennis Dyarand Knab (Diptera: Culicidae) in southern Belize, CentralAmerica. Preventive Medicine and Biometrics Bethesda, UniformedServices University of the Health Sciences; 2000:445.
Page 11 of 12(page number not for citation purposes)
International Journal of Health Geographics 2004, 3 http://www.ij-healthgeographics.com/content/3/1/6
Publish with BioMed Central and every scientist can read your work free of charge
"BioMed Central will be the most significant development for disseminating the results of biomedical research in our lifetime."
Sir Paul Nurse, Cancer Research UK
Your research papers will be:
available free of charge to the entire biomedical community
peer reviewed and published immediately upon acceptance
cited in PubMed and archived on PubMed Central
yours — you keep the copyright
Submit your manuscript here:http://www.biomedcentral.com/info/publishing_adv.asp
BioMedcentral
25. Roberts DR, Manguin S, Rejmankova E, Andre R, Harbach RE, VanzieE, Hakre S, Polanco J: Spatial distribution of adult Anophelesdarlingi and Anopheles albimanus in relation to riparian hab-itats in Belize, Central America. J Vector Ecol 2002, 27:21-30.
26. Selby S: Ecological change in the wetland of northern Belize.Journal of Belizean Affairs 2001, 3:97-117.
27. Grieco JP, Achee NL, Andre RG, Roberts DR: A comparison studyof house entering and exiting behavior of Anopheles vestiti-pennis (Diptera: Culicidae) using experimental huts sprayedwith DDT or deltamethrin in the southern district of Toledo,Belize, C.A. J Vector Ecol 2000, 25:62-73.
28. Kumm HW: Observations on the Anopheles of BritishHonduras. Am J Trop Med Hyg 1941, 21:559-566.
29. Roberts DR, Paris JF, Manguin S, Harbach RE, Woodruff R, Rejmank-ova E, Polanco J, Wullschleger B, Legters LJ: Predictions of malariavector distribution in Belize based on multispectral satellitedata. Am J Trop Med Hyg 1996, 54:304-308.
30. Brokaw NVL: A history of plant ecology in Belize. Journal ofBelizean Affairs 2001, 3:1-39.
Page 12 of 12(page number not for citation purposes)