Embed Size (px)
Citation preview

Species delimitation and digit number in a North Africanskink
R. P. Brown1, T. Tejangkura1, E. H. El Mouden2, M. A. Ait Baamrane2 & M. Znari2
1School of Natural Sciences and Psychology, Liverpool John Moores University, Liverpool, L3 3AF2Department of Biology, Faculty of Science – Semlalia, Cadi Ayyad University, Marrakech, 40000, Morocco
Keywords
Methods, molecular ecology, population
genetics
Correspondence
R. P. Brown, School of Natural Sciences and
Psychology, Liverpool John Moores University,
Liverpool L3 3AF. Tel: +XXXXXXXX1 ; Fax:
+XXXXXXXXX; E-mail: [email protected]
Funding Information
Fieldwork was supported by a grant from the
Percy Sladen Memorial Trust.
Received: 30 May 2012; Revised: 13 June
2012; Accepted: 18 June 2012
doi: 10.1002/ece3.326
Abstract
Delimitation of species is an important and controversial area within evolution-
ary biology. Many species boundaries have been defined using morphological
data. New genetic approaches now offer more objective evaluation and assess-
ment of the reliability of morphological variation as an indicator that speciation
has occurred. We examined geographic variation in morphology of the contin-
uously distributed skink Chalcides mionecton from Morocco and used Bayesian
analyses of nuclear and mitochondrial DNA (mtDNA) loci to examine: (i) their
concordance with morphological patterns, (ii) support for species delimitation,
(iii) timing of speciation, and (iv) levels of gene flow between species. Four
digit individuals were found at sites between Cap Rhir (in the south) to the
northern extreme of the range, whereas five-digit individuals were found in two
disjunct areas: (i) south of Cap Rhir and (ii) the north of the range where they
were often syntopic with four-digit individuals. The pattern of variation in gen-
eralized body dimensions was largely concordant with that in digit number,
suggesting two general morphotypes. Bayesian analyses of population structure
showed that individuals from sites south of Cap Rhir formed one genetic clus-
ter, but that northern four- and five-digit individuals clustered together. Statis-
tical support for delimitation of these genetic clusters into two species was
provided by a recent Bayesian method. Phylogenetic–coalescent dating with
external time calibrations indicates that speciation was relatively recent, with a
95% posterior interval of 0.46–2.66 mya. This postdates equivalent phylogenetic
dating estimates of sequence divergence by approximately 1 Ma. Statistical anal-
yses of a small number of independent loci provide important insights into the
history of the speciation process and support delimitation of populations into
two species with distributions that are spatially discordant with patterns of
morphological variation.
Introduction
Traditionally, most species have been described using
morphology, but morphological analyses cannot easily
demonstrate isolation and so genetic analyses are gener-
ally required (Wiens 2007). Statistical techniques that
estimate key parameters associated with population sizes,
divergence times, and assess concordance between gene
trees have further encouraged the use of molecular
sequence data for establishing species boundaries (e.g.,
Nielsen and Wakeley 2001; Yang and Rannala 2010).
Specifically, the program BPP (Yang and Rannala 2010) pro-
vides a test of whether species can be delimited genetically
using a Bayesian coalescent method that examines splits
in multiple gene trees relative to a user-defined guide tree.
It also accommodates uncertainty in the gene trees (as
well as stochastic fluctuations in the coalescent process)
which may be useful for intraspecific analyses of loci that
contain relatively little genealogical information. Analyses
of sequence data simulated under a two species model
show that this method has great power to correctly deli-
mit the species with only 1–2 loci when >5 individuals
are sampled from each (Zhang et al. 2011). One criticism
of statistical genetic species delimitations is that they lack
weight without additional support from independent data
sets describing other important characteristics such as
1
2
3
4
5
6
7
8
9
10
11
12
13
14
15
16
17
18
19
20
21
22
23
24
25
26
27
28
29
30
31
32
33
34
35
36
37
38
39
40
41
42
43
44
45
46
47
48
49
50
51
52
53
ª 2012 The Authors. Published by Blackwell Publishing Ltd. This is an open access article under the terms of the Creative
Commons Attribution Non-Commercial License, which permits use, distribution and reproduction in any medium, provided
the original work is properly cited and is not used for commercial purposes.
1
EC
E3
32
6B
Dispa
tch:
5.7.12
Jour
nal:
ECE3
CE:P
rave
ena
JournalName
ManuscriptNo.
Autho
rRec
eive
d:No.
ofpa
ges:
12PE
:Sug
anya

morphology or ecology (Bauer et al. 2011). Comparisons
between genetic delimitations with morphological variation
and ecology/geography should help reveal the consistency
between these alternative sources of information.
Additional approaches can provide other important
insights into speciation. Algorithms implemented within
programs such as IMa2 (Hey and Nielsen 2007; Hey
2010) jointly examine migration and divergence times of
two or more genetic lineages. This approach may be use-
ful because metapopulation lineages that separated a long
time ago and subsequently exchanged relatively few genes
are more likely to merit full species status. Rigorous esti-
mates of the timing of the population split also require a
Bayesian approach. The simple model in IMa2 may pro-
vide suitably accurate estimates, but many real data sets
lack sufficient information to allow estimation of both
migration and timing of the ancestral population split
(Hey 2010). Also, the model does not incorporate rate
variation between lineages (Hey and Nielsen 2004).
Hence, when conditions allow, it might be preferable to
use a phylogenetic approach that incorporates time cali-
bration information on a tree containing the populations
of interest (Thorne and Kishino 2002; Yang and Rannala
2006). Phylogenetic dating does not incorporate migra-
tion and so might be more suitable when migration is
low. However, until recently, this approach dates
sequence divergence times rather than species divergence
times. The latter may postdate the former by quite a sig-
nificant amount on recent timescales. A new approach
that overcomes these difficulties by taking account of the
ancestral coalescent process has been implemented within
the program *BEAST (Drummond and Rambaut 2007;
McCormack et al. 2010). This combined phylogenetic–
coalescent approach may represent a significant advance
in estimation of species divergence times on shallow phy-
logenies.
Here, we examine populations of the skink Chalcides
mionecton Bottger 1874 which is found along ~900 km of
the Atlantic coast of Morocco. It is mainly restricted to
coastal habitats but has been cited up to 150-km inland
(Bons and Geniez 1996). Geographic variation in digit
number has been used to describe two subspecies. Chal-
cides mionecton mionecton Bottger 1874 will be referred to
as the northern form because it is applied to populations
from Tangiers in the north to Cap Rhir ~700 km to the
southwest (Schleich et al. 1996). It is characterized by
possession of four digits on both the manus and the pes.
The southern form, C. mionecton trifasciatus Chabanaud
1917, has five digits on the manus and the pes and has
been recorded from Cap Rhir south to Foum Assaka
(Bons 1959). Known deviations from this categorical
north–south pattern include a northern locality, Mehdia
Plage, where five digit individuals are found (Mateo et al.
1995). Southern individuals with four digits have also
been documented (Pasteur 1962). Northern and southern
forms are not separated by any obvious physical barriers,
although Schleich et al. (1996) suggested that the narrow-
ing of the coastal plain at Cap Rhir reduced gene flow
between them.
Gain and loss of digits occurs frequently among scincid
lizard lineages (e.g., Pasteur 1981; Greer 1987; Kohlsdorf
and Wagner 2006; Brandley et al. 2008; Skinner et al.
2008; Siler and Brown 2011). Anatomically, four-toed
C. mionecton possess fifth metatarsal/metacarpal bones
but lack distal or proximal phalanges for this digit (Ray-
naud et al. 1989). In squamates, changes in numbers of
digits can be associated with body elongation and limb
reduction (Wiens and Slingluff 2001). This trend toward
a snake-like body in some lizards seems to be associated
with the evolution of either a burrowing or surface-dwell-
ing ecomorph (Wiens et al. 2006).
The pattern of digit variation in C. mionecton could
reflect independent evolution in lineages that diverged
some time ago. In this case, concordant splits are
expected at multiple independent loci. Alternatively it
could reflect natural selection without lineage divergence
and therefore solely affect loci associated with digit num-
ber. A comprehensive phylogenetic analysis of European
and African Chalcides included both subspecies of
C. mionecton (Carranza et al. 2008). It demonstrated reci-
procal monophyly between them, supporting lineage
divergence. However, this was a cross-species mitochon-
drial DNA (mtDNA) study and therefore only analyzed
some of the genetic diversity within C. mionecton, making
this conclusion tentative.
Chalcides mionecton represents an interesting model for
investigating speciation in relation to morphological
evolution. Here, we examine (i) the evidence for genetic
species within C. mionecton, (ii) whether these reflect
morphological differences, and (iii) the timing of diver-
gence and degree of gene flow between these putative
species.
Materials and Methods
Specimens and sites
A total of 192 Chalcides mionecton were captured from 16
sites extending from the north to the south of its range
during field trips carried out between June 2006 and June
2008 (Fig. 1, Appendix 1). Sites were quite evenly spaced,
apart from northern sites 2–5. (This was because all indi-
viduals from site 5 had five digits and so 1–3 specimens
were obtained from neighboring areas to explore the
extent of this form.) DNA was extracted from tail tips
that were removed from 102 specimens, stored in ethanol,
2 © 2012 The Authors. Published by Blackwell Publishing Ltd.
Bayesian Delimitation of Skink Populations R. P. Brown et al.
1
2
3
4
5
6
7
8
9
10
11
12
13
14
15
16
17
18
19
20
21
22
23
24
25
26
27
28
29
30
31
32
33
34
35
36
37
38
39
40
41
42
43
44
45
46
47
48
49
50
51
52
53

and then one or more loci were sequenced from these
individuals (see later). Captured specimens were eutha-
nized by injection of pentobarbital, fixed in formaldehyde,
and deposited in the Natural History Museum of
Marrakech.
Canary Island skinks belong to the same Western
Chalcides clade as C. mionecton (Carranza et al. 2008).
Divergence times between the Canary Islands of La
Gomera and El Hierro are known, providing a time cali-
bration for divergence within C. mionecton (see below).
We used individuals that had been collected for previous
research projects (e.g., Pestano and Brown 1999; Brown
et al. 2000); see Brown and Pestano (1998) for more
information and La Gomera-El Hierro divergence. One
individual was used from each site, unless otherwise
stated: Chalcides viridanus from Guaza and Igueste in
Tenerife, C. sexlinea tus from Tafira Baja (n = 2) and
Juan Grande in Gran Canaria, and C. coeruleopunctatus
from Calera and Vallehermoso in La Gomera and from
Valverde and Frontera in El Hierro.
Morphology
External morphology of the 192 museum specimens was
recorded. The numbers of digits was recorded from both
the manus and the pes. The following 12 body dimen-
sions were measured to the nearest 0.1 mm using digital
calipers: snout–vent length (SVL), head length (HL), head
depth (HD), head width (HW), jaw length (JL), snout–
thorax (ST), snout–hind limb length (SHL), fore–limb
length (FLL), rear–limb length (RLL), fourth toe on fore–
limb length (FTFL), fourth toe on hind limb length
(FTHL), and body width at thorax (BWT). The following
three scalation characters were also recorded: the number
of ventral scales rows between the rostral scale and the
cloaca, the number of scales counted around the mid-
trunk, and the number of infra-digital lamellae on the
fourth toe of the hind limb. (Postnasal, supralabial,
supraciliary, supranasal, and frenocular scales were
recorded but not analyzed because variation was negligi-
ble.) Bilateral measurements were recorded from the
right-hand side.
Morphological analyses
Sexes were analyzed separately. The pooled within-group
coefficients from the least-squares regressions of log10body dimensions against log10 SVL were used to adjust
each body dimension to its value at the overall mean
log10 SVL. Discriminant function analyses (DFA) were
computed on these size-adjusted values, with individuals
grouped by sampling locality. This method provides
functions that maximize among-group relative to
within-group variation, and therefore allows investiga-
tion of whether body dimensions differ between regions.
DFAs were also applied to the three scalation
characters.
DNA sequencing
DNA was extracted from tail-tips using a standard phenol
–chloroform procedure. Primers were designed or used
from previous studies (Appendix 2). The following
mtDNA fragments were amplified: (i) 737—795 bp
(depending on primers used) of NADH dehydrogenase
subunits 1 and 2 and three intervening tRNAs (this frag-
ment will be referred to as “ND1 and 2”) and (ii) 655 bp
from the cytochrome b gene (cytb). Two nuclear gene
fragments were also amplified: (i) 371 bp of the c-mos
gene and (ii) 713 bp of the RAG-1 gene. Polymerase
chain reaction (PCR) products were sequenced by GATC
11
14 5 1
2
4 54 , 567 4,5
3
68 7
8
Atlantic
Ocean
9 8
9
Morocco
C. mionecton mionecton
C. mionecton trifasciatus
9
101 1 1 21 31 41 5 10
11
1213
141 6 200 Km15
16
Figure 1. Sample sites, pie charts with proportions of four digits
(black) and five digits (gray) at sites, and subspecies of Chalcides
mionecton. (Note that both subspecies were described from Cap Rhir,
site 10, by previous work (Schleich et al. 1996), but only the northern
subspecies was found by this study).
© 2012 The Authors. Published by Blackwell Publishing Ltd. 3
R. P. Brown et al. Bayesian Delimitation of Skink Populations
1
2
3
4
5
6
7
8
9
10
11
12
13
14
15
16
17
18
19
20
21
22
23
24
25
26
27
28
29
30
31
32
33
34
35
36
37
38
39
40
41
42
43
44
45
46
47
48
49
50
51
52
53

Biotech and Source BioScience3 . Wherever possible, several
individuals were sequenced from each site for the ND1
and 2 (total number of individuals sequenced, n = 62)
and c-mos (n = 84) fragments in order to gain insights
into within-site genetic diversity. One or two individuals
were sequenced per site for cytb (n = 21) and RAG-1
(n = 20).
Genetic relationships and clustering
Median-joining networks were used to portray relation-
ships among sequences (software: Network 4.6.0.0, Flux-
us engineering). Multilocus genetic structure within C.
mionecton was investigated using the program BAPS
(Corander et al. 2003). When using sequence data, BAPS
has advantages over other structuring programs because it
can treat individual base positions within a locus as
linked loci, while treating different loci as independent.
Forty-six specimens that had been sequenced for both
mtDNA and c-mos were selected for this analysis. Twenty
of these specimens had also been sequenced for RAG-1
and these sequences were also included in the analysis.
No prior information on geographic location was speci-
fied. Replicated runs were performed on different values
of k from 2 to 10.
Migration and isolation
The Bayesian MCMC approach implemented in the
program IMa2 (Hey and Nielsen 2007; Hey 2010) was
used to jointly examine migration and isolation between
the primary genetic clusters detected by BAPS. Other
coalescent analyses used to analyze these data (see
below) assume no migration, and so it was important
to evaluate this assumption. The mtDNA was repre-
sented by all ND1 and 2 sequences. Nuclear loci were
represented by all c-mos and RAG-1 sequences (note
that, unlike many phylogenetic methods, different speci-
mens can be sampled for different loci). We obtained
the multilocus maximum likelihood values of the per
locus Watterson’s estimator of population mutation rate
(see Ross-Ibarra et al. 2009). This is estimated as
h = Nl for mtDNA and h = 4Nl for nuclear loci,
where N is the population size and l is the mutation
rate per generation, for the genetic clusters and for each
locus. Geometric means across loci were obtained for
each cluster, and the largest of the two (hMAX) was
used to specify upper bounds on uniform prior distri-
butions. Specifically, population sizes were specified
from the uniform distribution, U(0,5hMAX), splitting
time, t (in generations) was specified from U(0,2ΘMAX),
and migration rates per mutation (m) were specified
from U(0,2/hMAX). The rationale for using these prior
upper bounds is outlined in the IMa2 documentation
(http://lifesci.rutgers.edu/~heylab/ProgramsandData/Pro-
grams/IMa2/Using_IMa2_8_24_2011.pdf). The mutation
rate for the ND1 and 2 sequence (per locus per year)
was calibrated using a 1.1 Ma divergence between Chal-
cides from the Canary islands of La Gomera and El
Hierro (see next section; Brown and Pestano 1998; Car-
ranza et al. 2008). This enabled estimation of parame-
ters on demographic scales. The MCMC chain was run
for 1.505 9 107 generations, with a sample interval of
100, and the first 50,000 generations were discarded.
Twenty simultaneous chains were run, with a geometric
heating model used for chain swapping. Marginal poste-
riors were estimated from the first half of the run and
compared with those from the second half to ensure
the entire chain was sampling from the correct posterior
and runs were repeated several times from different
starting points and convergence on the same posterior
assessed.
Probabilities of differences between population sizes
and migration rates were obtained by pairwise compari-
sons of posteriors. Population migration rates were
obtained as 2NM (where M = ml and is the probability
of migration in a specific direction, per gene copy per
generation). A likelihood ratio test (LLR) (Nielsen and
Wakeley 2001) was used to investigate whether 2NM dif-
fered significantly from zero.
Species delimitation
The program BPP (Yang and Rannala 2010) was used to
examine delimitation of genetic clusters identified using
BAPS. We used the two primary genetic clusters to map
specimens onto the two species guide tree used in the
analysis. The rjMCMC algorithm in BPP provided a pos-
terior probability for the two species tree. The loci used
in the IMa2 analyses were used. Population size parame-
ters (Θ) were specified from a gamma prior, G(1,10). The
age of the root in the species tree (τ0) was assigned from
the gamma prior G(1,10), while the other divergence time
parameters were assigned from a Dirichlet prior (Yang
and Rannala 2010, equation 2). It should be noted that
descriptions of probability distributions match the defini-
tions for individual programs in this report and are not
necessarily consistent between programs. The priors were
determined after preliminary analyses in which τ0 and Θ
were specified using a range of gamma distributions, from
G(1,10) to G(1,2000). Not surprisingly, this led to slightly
different posterior estimates of these parameters, although
the posterior probability for the two species model was
unaffected. Analyses were run several times to check for
consistency (2 9 105 iterations of the chain, sampling
interval of 15, burnin = 10,000).
4 © 2012 The Authors. Published by Blackwell Publishing Ltd.
Bayesian Delimitation of Skink Populations R. P. Brown et al.
1
2
3
4
5
6
7
8
9
10
11
12
13
14
15
16
17
18
19
20
21
22
23
24
25
26
27
28
29
30
31
32
33
34
35
36
37
38
39
40
41
42
43
44
45
46
47
48
49
50
51
52
53

Divergence times
The Bayesian methodology implemented within *BEAST
(ver. 1.6.1) was used for robust estimation of divergence
times between genetic clusters identified by BAPS (Drum-
mond and Rambaut 2007). The method combines tree
inference, phylogenetic dating, and the coalescent and
allows time constraints to be imposed on the species tree
rather than on individual gene trees (through the addition
of commands to BEAUTI-generated xml input files). ND1
and 2 and cytb sequences from C. mionecton from all sites
(n = 21), together with the nine Canary Island Chalcides
described above, were included in the analysis. Nuclear
loci showed negligible diversity across the Canary Island
taxa and so we used only the mitochondrial locus for the
phylogenetic analyses (in phylogenetic dating, slowly
evolving or short sequences often have little influence on
the posterior, Brown and Yang 2010). The sequences were
divided into four sequence partitions corresponding to
the three codon positions (across all mitochondrial genes)
and the tRNA region of the ND1 and 2 sequence.
Species were defined as follows: (i) Northern genetic
cluster of C. mionecton, (ii) Southern C. mionecton, (iii)
C. sexlineatus (Gran Canaria), (iv) C. viridanus (Tenerife),
(v) C. coeruleopunctatus (La Gomera), (vi) C. coeruleo-
punctatus (El Hierro). Time priors were placed on the
species tree, with 1 time unit = 10 Ma. The general prior
on divergence times was specified using a Birth–Death
model, with the birth–death rate specified from the uni-
form distribution U(0,+∞) and death rate relative to birth
rate specified from U(0,1). The times of the most recent
common ancestors (tMRCAs) of different species groups
were constrained using geological information. The oldest
emerged parts of the Canary island of El Hierro have
been dated at 1.12 Ma with the island likely to have been
colonized soon after its subaerial emergence (Brown and
Pestano 1998). The gamma distribution G(110,0.001) was
therefore used to quite tightly constrain the C. coeruleo-
punctatus (La Gomera, El Hierro) node. Two other nodes
were also constrained albeit more loosely. The age of the
root was specified from the gamma distribution G
(6.8,0.1), and the ancestor of all Canary Islands sequences
was specified from G(5.3,0.1), following previously pub-
lished estimates (Brown and Pestano 1998; Carranza et al.
2008).
A relaxed lognormal clock was used for rates on the
gene tree, with the mean assigned from a G(1,1) distribution,
and the standard deviation from the exponential distribu-
tion Exp(0.33), for all partitions. The HKY+G model was
specified with kappa parameters assigned from G(1,10)
and alpha parameters from U(0,20), for all partitions.
Monophyly constraints were imposed on sequences from
the same island, on La Gomera and El Hierro together,
on all Canary Island Chalcides, and on each of the two
forms of C. mionecton (see Brown et al. 1998 4, Carranza
et al. 2008).
MCMC chains were run for 3 9 107 generations with a
sampling interval of 1000, and the first 3000 samples were
discarded as burn-in. Convergence diagnostics as well as
posteriors on the gene and species trees were obtained
using Tracer (v1.4.1) (Rambaut and Drummond 2007)
and TreeAnnotator (v1.6.1)(Drummond and Rambaut
2007).
To date, it has been common to use Bayesian phylo-
genetic methods to date sequence divergence. In these
analyses, time calibrations are applied to sequences and
sequence divergence times are estimated. We also used
this approach (we refer to it as the BEAST analysis)
for comparison with the *BEAST phylogenetic–coales-
cent analysis described above. The priors within the
analysis were the same as for the *BEAST analysis, but
applied to tMRCAs of the sequences within the relevant
species.
Results
Morphology
All individuals obtained from sites south of Cap Rhir (sites
11–16) were found to have five digits on the manus and
the pes, except for one individual at site 16 which possessed
four digits on the pes only (Fig. 1). Individuals captured
from Cap Rhir (site 10) north to site 7 had four digits on
the manus and the pes. Four- and five-digit individuals
were detected in the most northern group of samples from
sites 1–6: both forms were detected at sites 1 and 6, while
only five-digit forms were detected at sites 2, 3, 4, and 5.
For female body dimensions, the first discriminant func-
tion (DF1) represented 35.4% of the total variation among
sites, while the second function (DF2) represented 28.1%.
Values were similar for males: DF1 = 36.2%, DF2 = 24.6%.
Patterns of pooled within-group correlations between
body dimensions and standardized DFs were quite similar
between sexes (Table 1). However, female DF1 was most
highly correlated with HL and ST, while male DF1 was
quite highly correlated with several body dimensions (SVL,
BWT, FLL, FTFL, ST). DF2 was most highly correlated with
BWT for both males and females.
The northern populations with one or more five-digit
individuals were ostensibly intermediate between the
remaining four-digit northern populations and the
five-digit southern group (Fig. 2). There was generally
considerable overlap between the two. Geographic
concordance between digit number and DFs was inves-
tigated using correlation between population means
(sites 2–5 grouped). Male DF2 (r = 0.76, P = 0.003)
© 2012 The Authors. Published by Blackwell Publishing Ltd. 5
R. P. Brown et al. Bayesian Delimitation of Skink Populations
1
2
3
4
5
6
7
8
9
10
11
12
13
14
15
16
17
18
19
20
21
22
23
24
25
26
27
28
29
30
31
32
33
34
35
36
37
38
39
40
41
42
43
44
45
46
47
48
49
50
51
52
53
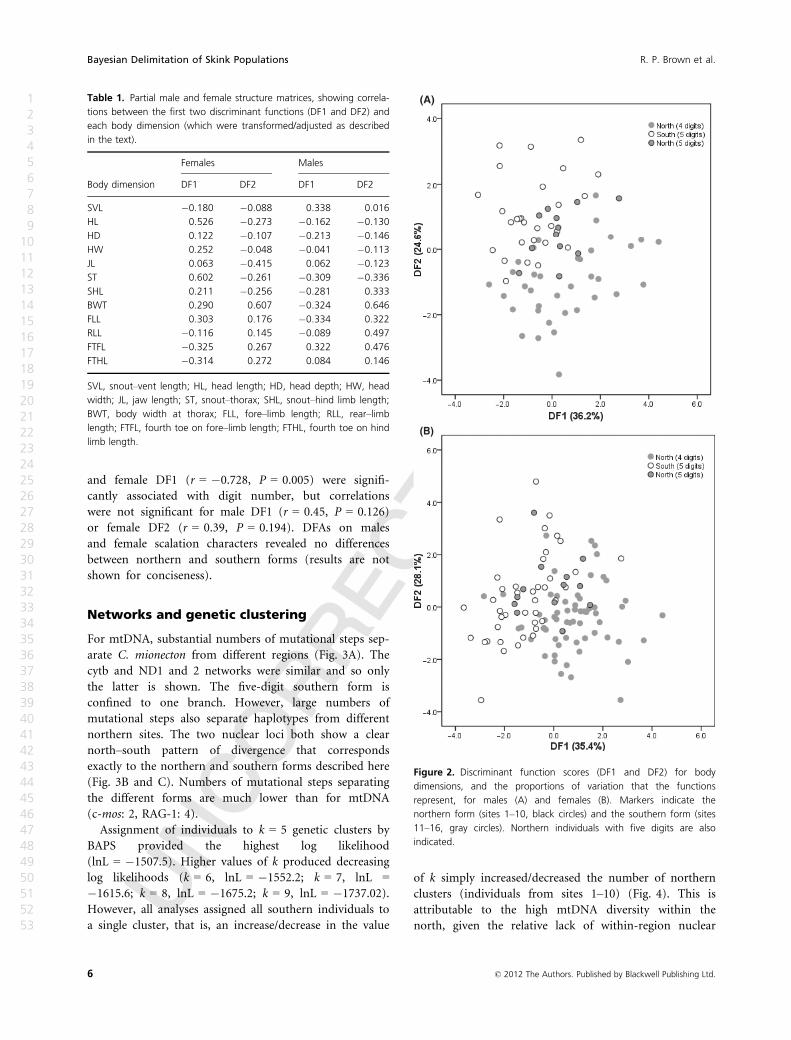
and female DF1 (r = �0.728, P = 0.005) were signifi-
cantly associated with digit number, but correlations
were not significant for male DF1 (r = 0.45, P = 0.126)
or female DF2 (r = 0.39, P = 0.194). DFAs on males
and female scalation characters revealed no differences
between northern and southern forms (results are not
shown for conciseness).
Networks and genetic clustering
For mtDNA, substantial numbers of mutational steps sep-
arate C. mionecton from different regions (Fig. 3A). The
cytb and ND1 and 2 networks were similar and so only
the latter is shown. The five-digit southern form is
confined to one branch. However, large numbers of
mutational steps also separate haplotypes from different
northern sites. The two nuclear loci both show a clear
north–south pattern of divergence that corresponds
exactly to the northern and southern forms described here
(Fig. 3B and C). Numbers of mutational steps separating
the different forms are much lower than for mtDNA
(c-mos: 2, RAG-1: 4).
Assignment of individuals to k = 5 genetic clusters by
BAPS provided the highest log likelihood
(lnL = �1507.5). Higher values of k produced decreasing
log likelihoods (k = 6, lnL = �1552.2; k = 7, lnL =
�1615.6; k = 8, lnL = �1675.2; k = 9, lnL = �1737.02).
However, all analyses assigned all southern individuals to
a single cluster, that is, an increase/decrease in the value
of k simply increased/decreased the number of northern
clusters (individuals from sites 1–10) (Fig. 4). This is
attributable to the high mtDNA diversity within the
north, given the relative lack of within-region nuclear
Table 1. Partial male and female structure matrices, showing correla-
tions between the first two discriminant functions (DF1 and DF2) and
each body dimension (which were transformed/adjusted as described
in the text).
Body dimension
Females Males
DF1 DF2 DF1 DF2
SVL �0.180 �0.088 0.338 0.016
HL 0.526 �0.273 �0.162 �0.130
HD 0.122 �0.107 �0.213 �0.146
HW 0.252 �0.048 �0.041 �0.113
JL 0.063 �0.415 0.062 �0.123
ST 0.602 �0.261 �0.309 �0.336
SHL 0.211 �0.256 �0.281 0.333
BWT 0.290 0.607 �0.324 0.646
FLL 0.303 0.176 �0.334 0.322
RLL �0.116 0.145 �0.089 0.497
FTFL �0.325 0.267 0.322 0.476
FTHL �0.314 0.272 0.084 0.146
SVL, snout–vent length; HL, head length; HD, head depth; HW, head
width; JL, jaw length; ST, snout–thorax; SHL, snout–hind limb length;
BWT, body width at thorax; FLL, fore–limb length; RLL, rear–limb
length; FTFL, fourth toe on fore–limb length; FTHL, fourth toe on hind
limb length.
(A)
(B)
Figure 2. Discriminant function scores (DF1 and DF2) for body
dimensions, and the proportions of variation that the functions
represent, for males (A) and females (B). Markers indicate the
northern form (sites 1–10, black circles) and the southern form (sites
11–16, gray circles). Northern individuals with five digits are also
indicated.
6 © 2012 The Authors. Published by Blackwell Publishing Ltd.
Bayesian Delimitation of Skink Populations R. P. Brown et al.
1
2
3
4
5
6
7
8
9
10
11
12
13
14
15
16
17
18
19
20
21
22
23
24
25
26
27
28
29
30
31
32
33
34
35
36
37
38
39
40
41
42
43
44
45
46
47
48
49
50
51
52
53

diversity. Because the optimal number of clusters
appeared dependent on this single marker, it was sensible
to focus on the primary north–south genetic clusters. To
confirm this, we also ran analyses in which k = 2. This
produced a lower likelihood (lnL = �1914.1) but the two
genetic clusters represented northern individuals from
sites 1–10, and southern individuals from sites 11–16
(Fig. 4).
Migration and isolation
To facilitate interpretation, we will report on migration
rates in the natural (forward) direction of time rather
than coalescent time. Population migration rates from the
south to the north are negligible (Fig. 5A), with a poster-
ior mean of 0.048 and a 95% highest posterior density
interval (HPD) which included zero (0.000, 0.150). The
hypothesis of no migration was supported by the LLR test
(P > 0.05). Population migration rates from the north to
the south were also very low (mean = 0.060, 95% HPD
[0.000, 0.158])(Fig. 5A), but here, the hypothesis of no
migration was rejected by the LLR test (P < 0.001). Mar-
ginal posteriors on current population size parameters (h)
were represented by single peaks. For the southern form,
hS was small: posterior mean = 0.401, 95% HPD (0.125–
0.731), compared with hN (northern form): posterior
19
20
7
7
15
9
6
6
1
2 21
4 5 539 9 98 8 7 7 7 7 1 0 1 01 0 1 06 66 6 6 6 66
1 61 61 61 21 1 1 11 11 2 1 4 1 4 1 41 31 31 51 5 1 51 5 1 51 5(A)
2 1 1 , 1 2 , 1 3 ,1 4 , 1 5 , 1 61 , 2 , 3 , 4 , 5 ,6 , 7 , 8 , 9 , 1 098
1 05
(B)
2 1 1 , 1 2 , 1 3 ,1 4 , 1 5 , 1 61 , 2 , 3 , 4 , 5 ,6 , 7 , 8 , 9 , 1 09
1 054
1 31 1 , 1 2 , 1 4 ,1 5 , 1 61 , 3 , 4 , 5 , 7 ,8 , 9 , 1 0 ,2
6(C)
4 1 1 , 1 2 , 1 4 ,1 5 , 1 61 , 3 , 4 , 5 , 7 ,8 , 9 , 1 0 ,Figure 3. Median-joining networks showing
relationships between haplotypes for ND1 and
2 (A), c-mos (B), and RAG-1 (C). Haplotypes
are represented as gray (southern) or black
(northern) circles, with diameters proportional
to frequencies and labeled by sites at which
they were found. Lengths of the longer
branches of each network (in mutational steps)
are given in italics. Small dark circles with no
labels are median vectors.
© 2012 The Authors. Published by Blackwell Publishing Ltd. 7
R. P. Brown et al. Bayesian Delimitation of Skink Populations
1
2
3
4
5
6
7
8
9
10
11
12
13
14
15
16
17
18
19
20
21
22
23
24
25
26
27
28
29
30
31
32
33
34
35
36
37
38
39
40
41
42
43
44
45
46
47
48
49
50
51
52
53

mean = 1.007, 95% HPD (0.390–1.730). The difference
between hS and hN was significant (Pr [h N> h
S] = 0.997). Various exploratory analyses with different
priors indicated that the data were relatively uninforma-
tive about the ancestral population size parameter, hA, or
the population splitting time.
Species delimitation
The posterior probability of the north–south species
delimitation was 1.00. As for IMa2, the posterior on Θ
for the northern form indicated a larger population size
(mean 0.0268, 95% HPD [0.0192, 0.0365]), compared
with the southern form (mean 0.0096, 95% HPD
[0.0059,0.0147]). Note that BPP and IMa2 are parameter-
ized differently and so parameters are not directly
comparable between programs. The posterior mean and
95% HPD for τ0 were 0.0064 (0.0038, 0.0097).
Divergence times
The *BEAST coalescent analysis provided strong posterior
support for the C. mionecton (North, South) species node
(P = 0.98). The corresponding posterior mean speciation
time was 1.43 Ma (95% posterior interval: 0.46–2.66 Ma)
(Fig. 5B). Comparison of sequence divergence times with
species divergence times is complicated by topological
uncertainty in the mtDNA gene tree and discordance with
the species tree. The posterior mean on the tMRCA of all
C. mionecton sequences was 2.36 Ma, with a 95%
posterior interval of (1.42, 3.60), which was approxi-
mately 1 Ma older than the posterior north–south
speciation time within C. mionecton (see above). How-
ever, this does not represent a north–south split between
sequences. The ancestral node that is common to
the two mtDNA lineages comprising sequences from
northern (7–10) and southern sites (11–16) is quite well
supported (P = 0.94) and has a posterior mean and pos-
terior interval of 1.58 and (0.94, 2.46) Ma, respectively,
which is quite similar to that obtained under the
phylogenetic–coalescent analysis.
Discussion
Species delimitation can require a combination of genetic,
morphological, and biogeographical information in order
to be convincing. Here, coalescent analyses of genetic data
alone demonstrate negligible gene flow between northern
and southern groups of contiguously distributed popula-
tions, indicating that they form separate metapopulation
lineages (de Quieroz 2007). Integration over gene trees
from three loci provides strong statistical support for the
species delimitation. We also show that this splitting
event is likely to have occurred during the Pleistocene, or
possibly late Pliocene. Comparisons of recognized sister
species of reptiles have suggested that speciation events
that connect extant sister taxa are generally older than
this, often coinciding with the early Pliocene or late Mio-
cene (Avise 2000). However, the taxa examined here were
originally recognized as subspecies, not species. A conse-
quence of widespread application of the approach used
here could be species inflation because statistical evidence
allows delimitation of more closely related forms. This
will cause a concomitant decrease in the average timing
of speciation between sister species.
It is notable that the mtDNA tree shows evidence of
incomplete lineage sorting between northern and south-
ern species and fails to provide unequivocal support for
the delimitation. In contrast, both nuclear loci show clear
north–south sorting, despite a much slower substitution
rate. Although microsatellite nuclear markers have been
widely used in intraspecific studies because of their
elevated evolutionary rates, here we show that more con-
served nuclear sequences can also be useful when analyzed
within a coalescent framework. Another important find-
ing was that clear delimitation was achieved using just
three loci. This reinforces the finding that coalescent anal-
yses with just a few loci can have considerable statistical
power to detect speciation when multiple individuals are
available per population (Yang and Rannala 2010; Zhang
et al. 2011).
Until recently, many phylogeography studies have used
phylogenetic dating of sequence divergence times (Leache
S o u t ha )b ) N o r t h
4d i git s(A)
B)
S o u t h5 d i g i t s4 d i g i t s5 d i g i t s
1 2 1 44 5 6 7 1 1 1 21 08 9 1 3 1 5 1 63Figure 4. BAPS clustering of ND1 and 2, c-mos, and RAG-1 loci. It
shows the assignment of individuals to clusters when k = 2 (A), and
the assignment when k = 5 (the value of k with the highest
likelihood) (B). The numbers at the bottom of the figure are the site
numbers shown in Figure 1. Genetic clusters correspond to
geography rather than morphotypes.
8 © 2012 The Authors. Published by Blackwell Publishing Ltd.
Bayesian Delimitation of Skink Populations R. P. Brown et al.
1
2
3
4
5
6
7
8
9
10
11
12
13
14
15
16
17
18
19
20
21
22
23
24
25
26
27
28
29
30
31
32
33
34
35
36
37
38
39
40
41
42
43
44
45
46
47
48
49
50
51
52
53

and Mulcahay 2007; Brown and Yang 2010). We show
that estimation of speciation times instead of sequence
divergence times appears to considerably influence
estimation of the timing of the north–south split. The
speciation time (posterior mean 1.5 Ma) under the phylo-
genetic–coalescent analysis postdates the oldest sequence
divergence time in the C. mionecton lineage by almost
1 Ma. It postdates the north–south mtDNA sequence
divergence time from another phylogenetic study (Car-
ranza et al. 2008) by an even greater margin. This is not
entirely expected. Under the phylogenetic approach,
constraints are placed on sequence divergence times and
so predate speciation times. This incorrect calibration
might be partially compensated by the fact that the poste-
riors on (uncalibrated) nodes of interest also represent
sequence divergence and not speciation times, that is,
sequence divergence times on uncalibrated nodes should
predate speciation times by a margin similar to that on
calibrated nodes. However, comparison between the two
approaches was complicated by incomplete lineage sorting
of mtDNA. In fact, the sequence divergence between the
reciprocally monophyletic northern and southern
sequences (the second most basal node within the C. mio-
necton mtDNA tree) is dated at 1.6 Ma which is not too
different from the phylogenetic–coalescent date for diver-
gence of northern and southern forms. While this
highlights important differences between the dating
approaches, detailed future comparisons between methods
would be more informative in cases where it is appropri-
ate to use a single topology for each analysis, rather than
integrating over the range of possible topologies.
In C. mionecton, we find that digit number varies in a
quite complex manner with five digits being more
common throughout the far north of the range than
previously thought (Schleich et al. 1996; Bons and Geniez
1996) as well as being polymorphic in some populations.
(A)
(B)
Figure 5. Coalescent analyses. Posterior
distributions of population migration rates
(2NM) between northern and southern forms
are shown (forwards in time) (A). The
consensus species phylogeny (B) shows 95%
posterior intervals for species divergence times
(where node support >0.5; 1 time
unit = 10 Ma), and posterior node support on
the branch above each node.
© 2012 The Authors. Published by Blackwell Publishing Ltd. 9
R. P. Brown et al. Bayesian Delimitation of Skink Populations
1
2
3
4
5
6
7
8
9
10
11
12
13
14
15
16
17
18
19
20
21
22
23
24
25
26
27
28
29
30
31
32
33
34
35
36
37
38
39
40
41
42
43
44
45
46
47
48
49
50
51
52
53

This pattern is also quite concordant with variation in
body dimensions. Within-population variation in mor-
phological characters is substantial relative to between-
population variation even for the discrete digit number
character. This does not readily allow delimitation of
populations into two taxa. Furthermore, the pattern of
morphological differentiation is discordant with the two
species delimitation.
It is interesting to speculate why some individuals from
the most northerly populations should show morphologi-
cal similarity with the most southern populations, despite
delimitation of northern and southern individuals into
discrete genetic clusters. The most parsimonious explana-
tion is that the ancestral state in this species is five digits.
Other morphological states found in the extreme north
and south, such as a wider thorax, would also be consid-
ered ancestral but for clarity we focus our argument on
digit number. The sister group to C. mionecton has five
digits (Carranza et al. 2008) which would support this
hypothesis. (Note that Brandley et al.’s (2008) interesting
analysis of digit reduction in skinks infers an ambiguous
ancestral state for C. mionecton, but they erroneously
defined it as a three-digit species.) One hypothesis is that
the four-digit morphology arose due to mutations that
appeared in the northern form after N–S speciation. Gene
flow between northern populations allowed these muta-
tions to spread north, while restricted gene flow between
species impeded southern movement. This scenario sug-
gests that these morphological differences originated
recently. However, it does not explain why the distribu-
tion of the four-digit morphology is interrupted by a
northern area in which only five-digit individuals were
found. It has been proposed that digit loss is evolutionary
labile, with complete loss of digits over approximately
3.5 Ma in some Australian skink lineages (Skinner et al.
2008). Rapid evolution might indicate that digit number
is determined by quite a simple genetic system. The Aus-
tralian lizard genus Hemiergis shows interspecific patterns
of digit number reduction that are similar to those for
C. mionecton in which the phalanges that comprise the
fifth digit are lost but metacarpals/metatarsals remain
(Shapiro et al. 2003). This seems to be determined by
regulatory genes that influence the duration and location
of expression of the Sonic hedgehog (Shh) gene.
This paper does not aim to reconstruct the historical
biogeography of C. mionecton. However, it does provide
information on current distributions and divergence
times. There was no evidence of unsuitable habitat
between the southernmost four digit sample from Cap
Rhir and the adjacent five-digit sample from Taghazoute
(separated by a distance of around 25 km), so it is probable
that the two forms come into contact without significant
hybridization. Bons and Geniez (1996) reported syntopy
of four- and five-digit forms at Cap Rhir, but we found
no evidence to corroborate this. Our analyses suggest that
a historical event led to divergence between forms which
interrupted gene flow between them. This appears more
likely than the hypothesis that divergence is due to an
ongoing restriction to gene flow mediated by a physical
barrier such as the Atlas Mountains, as suggested by
Schleich et al. (1996). Other North African lizards show
evidence of phylogeographical divisions associated with
the Atlas range (e.g., Brown et al. 2002; Harris et al.
2007; Perera and Harris 2010) 5. Levels of sequence diver-
gence differ greatly between species, and so different
evolutionary scenarios for different species appear likely.
What might have caused population isolation in the
Pleistocene is unknown. This was an important period for
speciation of many African groups due to climatic fluctu-
ations that affected vegetation patterns (e.g., deMenocal
1995; Swart et al. 2009; Trauth et al. 2009; Voje et al.
2009). The hypothesis that there was a break in suitable
habitat, which led to fragmentation of C. mionecton
populations, would appear plausible.
To summarize, we are able to examine key features of
the speciation process, namely timing of divergence and
gene flow between lineages, using only a small number of
loci, two of which have low substitution rates. Bayesian
methods provide strong statistical support for divergence
of two lineages in the Pleistocene after which very few
genes were exchanged. Previously described subspecies of
C. mionecton therefore appear to represent good species
under the unified species concept, but these species are
not diagnosed by digit number or other external morpho-
logical characteristics.
Acknowledgments
We thank Louise Hudson and Paul Hoskisson for help
with sequencing. Fieldwork was supported by a grant
from the Percy Sladen Memorial Trust, we thank the
Moroccan authorities for fieldwork permits, and Z. Yang
for helpful discussions.
Conflict of interest
None declared.
References
Avise, J. C. 2000. Phylogeography: the history and formation
of species. Harvard University Press, ?????. 6
Bauer, A. M., J. F. Parham, R. M. Brown, B. L. Stuart, L.
Grismer, T. J. Papenfuss, et al. 2011. Availability of new
Bayesian-delimited gecko names and the importance of
character-based species descriptions. Proc. R. Soc. Lond. B
Biol. Sci. 278:490–492.
10 © 2012 The Authors. Published by Blackwell Publishing Ltd.
Bayesian Delimitation of Skink Populations R. P. Brown et al.
1
2
3
4
5
6
7
8
9
10
11
12
13
14
15
16
17
18
19
20
21
22
23
24
25
26
27
28
29
30
31
32
33
34
35
36
37
38
39
40
41
42
43
44
45
46
47
48
49
50
51
52
53

Bons, J. 1959. Les Lacertiliens du Sud-Ouest marocain. Travax
de l’Institut Scientifique Cherifien, Rabat, Serie Zoologie
18:1–130.
Bons, J., and P. Geniez. 1996. Amphibiens et reptiles du
Maroc (Sahara Occidental compris) Atlas Biogeographique.
Asociacion Herpetologica Espanola, Barcelona.
Brandley, M. C., J. P. Huelsenbeck, and J. J. Wiens. 2008.
Rates and patterns in the evolution of snake-like body form
in squamate reptiles: evidencefor repeated re-evolution of
lost digits and long-term persistence of intermediate body
forms. Evolution 62:2042–2064.
Brown, R. P., and J. Pestano. 1998. Phylogeography of Canary
Island skinks inferred from mtDNA sequences. Mol. Ecol.
7:1183–1191.
Brown, R. P., and Z. Yang. 2010. Bayesian dating of shallow
phylogenies with a relaxed clock. Syst. Biol. 59:119–131.
Brown, R. P., R. Campos-Delgado, and J. Pestano. 2000.
Mitochondrial DNA evolution and population history of the
Tenerife skink Chalcides viridanus. Mol. Ecol. 9:1061–1069.
Brown, R. P., N. M. Suarez, and J. Pestano. 2002. The Atlas
mountains as a biogeographical divide in North-West
Africa: evidence from mtDNA evolution in the Agamid
lizard Agama impalearis. Mol. Phylogenet. Evol. 24:324–332.
Carranza, S., E. N. Arnold, P. Geniez, J. Roca, and J. A.
Mateo. 2008. Radiation, multiple dispersal and parallelism
in the skinks, Chalcides and Sphenops (Squamata:
Scincidae), with comments on Scincus and Scincopus and
the age of the Sahara Desert. Mol. Phylogenet. Evol.
46:1071–1094.
Corander, J., P. Waldmann, and M. J. Sillanpaa. 2003.
Bayesian analysis of genetic differentiation between
populations. Genetics 163:367–374.
Drummond, A. J., and A. Rambaut. 2007. BEAST: Bayesian
evolutionary analysis by sampling trees. BMC Evol. Biol.
7:214.
Greer, A. E. 1987. Limb reduction in the lizard genus Lerista.
1. Variation in the number of phalanges and presacral
vertebrae. J. Herpetol. 21:267–276.
Harris, D. J., R. Vasconcelos, and J. C. Brito. 2007. Genetic
variation within African spiny-tailed lizards (Agamidae:
Uromastyx) estimated using mitochondrial DNA sequences.
Amphibia Reptilia 28:1–6.
Hey, J. 2010. Isolation with migration models for more than
two populations. Mol. Biol. Evol. 27:905–920.
Hey, J., and R. Nielsen. 2004. Multilocus methods for
estimating population sizes, migration rates and divergence
time, with applications to thedivergence of Drosophila
pseudoobscura and D. persimilis. Genetics 167:747–760.
Hey, J., and R. Nielsen. 2007. Integration within the
Felsenstein equation for improved Markov chain Monte
Carlo methods in population genetics. Proc. Natl. Acad. Sci.
USA 104:2785–2790.
Kohlsdorf, T., and G. P. Wagner. 2006. Evidence for the
reversibility of digit loss: a phylogenetic study of limb
evolution in Bachia (Gymnophthalmidae: Squamata).
Evolution 60:1896–1912.
Leache, A. D., and D. G. Mulcahay. 2007. Phylogeny,
divergence times and species limits of spiny lizards
(Sceloporus magister species group) in western North
American deserts and Baja California. Mol. Ecol.
16:5216–5233.
Mateo, J. A., P. Geniez, and J. Bons. 1995. Saurians of the
genus Chalcides Laurenti 1768 (Reptilia, Scincidae) in
Morocco, I: review and distribution. Rev. Esp. Herpetol.
9:7–36.
McCormack, J. A., J. Heled, K. S. Delaney, A. T. Peterson, and
L. L. Knowles. 2010. Calibrating divergence times on species
trees versus gene trees: implications for speciation history of
Aphelocoma jays. Evolution 65:181–202.
deMenocal, P. 1995. Plio-Pleistocene African climate. Science
270:53–59.
Nielsen, R., and J. Wakeley. 2001. Distinguishing migration
from isolation: a Markov chain Monte Carlo approach.
Genetics 158:885–896.
Pasteur, G. 1962. Notes sur les sauriens du genre Chalcides
(Scincides) I. La super-espece Chalcides mionecton-atlantis.
Bull. Soc. Sc. Nat. Maroc. 42:57–60.
Pasteur, G. 1981. A survey of the species groups of the old
world Scincid genus Chalcides. J. Herpetol. 15:1–16.
Perera, A., and D. J. Harris. 2010. Genetic variability within
the Oudri’s fan-footed gecko Ptyodactylus oudrii in North
Africa assessed using mitochondrial and nuclear DNA
sequences. Mol. Phylogenet. Evol. 54:634–639.
Pestano, J., and R. P. Brown. 1999. Geographical structuring
of mitochondrial DNA in Chalcides sexlineatus within the
island of Gran Canaria. Proc. R. Soc. Lond. B Biol. Sci.
266:805–812.
De Quieroz, K. 2007. Species concepts and species
delimitation. Syst. Biol. 56:879–886.
Rambaut, A. J., and A. Drummond. 2007. Tracer v1.4. ?????,
???? Available at http://beast.bio.ed.ac.uk/tracer (accessed
????? ??, ????). 7
Raynaud, A., J. L. Perret, J. Bons, and M. Clerque-Gazeau.
1989. Modalites de reduction digitale chez quelque Scincides
africains (Reptiles). Rev. Suisse Zool. 96:779–802.
Ross-Ibarra, J., M. Tenaillon, and B. S. Gaut. 2009.
Historical divergence in the genus Zea. Genetics 181:1399–
1413.
Schleich, H. H., W. Kiistle, and K. Kabisch. 1996. Amphibians
and reptiles of North Africa. Koeltz, Koenigstein, Germany.
Shapiro, M. D., J. Hanken, and N. Rosenthal. 2003.
Developmental basis of evolutionary digit loss in the
Australian lizard Hemiergis. J. Exp. Zool. B (Mol. Dev.
Evol.) 297B:48–56.
Siler, C. D., and R. M. Brown. 2011. Evidence for repeated
acquisition and loss of complex body form characters in an
insular clade of Southeast Asian semi-fossorial skinks.
Evolution 65:2641–2663.
© 2012 The Authors. Published by Blackwell Publishing Ltd. 11
R. P. Brown et al. Bayesian Delimitation of Skink Populations
1
2
3
4
5
6
7
8
9
10
11
12
13
14
15
16
17
18
19
20
21
22
23
24
25
26
27
28
29
30
31
32
33
34
35
36
37
38
39
40
41
42
43
44
45
46
47
48
49
50
51
52
53

Skinner, A., M. S. Y. Lee, and M. N. Hutchinson. 2008. Rapid
and repeated limb loss in a clade of scincid lizards. BMC
Evol. Biol. 8:310.
Swart, B. L., K. A. Tolley, and C. A. Matthee. 2009. Climate
change drives speciation in the Southern rock Agama
(Agama atra) in the Cape Floristic Region, South Africa.
J. Biogeogr. 36:78–87.
Thorne, J. L., and H. Kishino. 2002. Divergence time
estimation and rate evolution with multilocus data sets.
Syst. Biol. 51:689–702.
Trauth, M. H., J. C. Larrasoana, and M. Mudelsee. 2009.
Trends, rhythms and events in Plio-Pleistocene African
climate. Quat. Sci. Rev. 28:399–411.
Voje, K. L., C. Hemp, Y. Flagstad, G. P. Saetre, and N. C.
Stenseth. 2009. Climatic change as an engine for speciation
in flightless Orthoptera species inhabiting African
mountains. Mol. Ecol. 18:93–108.
Wiens, J. J. 2007. Species delimitation: new approaches for
discovering diversity. Syst. Biol. 56:875–878.
Wiens, J. J., and J. L. Slingluff. 2001. How lizards turn into
snakes: a phylogenetic analysis of body-form evolution in
Anguid lizards. Evolution 55:2303–2318.
Wiens, J. J., M. C. Brandley, and T. W. Reeder. 2006. Why
does a trait evolve multiple times within a clade? Repeated
evolution of snake-like body form in squamate reptiles.
Evolution 60:123–141.
Yang, Z., and B. Rannala. 2006. Bayesian estimation of species
divergence times under a molecular clock using multiple
fossil calibrations with soft bounds. Mol. Biol. Evol. 23:
212–226.
Yang, Z., and B. Rannala. 2010. Bayesian species delimitation
using multilocus sequence data. Proc. Natl. Acad. Sci. USA
107:9264–9269.
Zhang, C., D.-X. Zhang, T. Zhu, and Z. Yang. 2011.
Evaluation of a Bayesian coalescent method of species
delimitation. Syst. Biol. 60:747–761.
Supporting Information
Additional Supporting Information may be found in the
online version of this article:
Appendix S1. Site names and numbers of individuals
sequenced/measured.
Appendix S2. Primers. All primers were all designed for
the current study, except where indicated.
Appendix S3. Data for all three loci (mtDNA, c-mos,
RAG-1) are provided in the file “Threeloci.txt.” Labels
provide a site and a specimen identifier, for example,
“8.02^1” is specimen 2 from site 8 (see Fig. 1). The “^1”
suffix can be ignored but is useful if you run BPP 2on
these data. The mtDNA data used for the estimation of
divergence times are provided in MEGA format in the file
“MtDNA.meg.” Data partitions (ND1, ND2, tRNA, cyto-
chrome b) are shown together with codon positions
within these partitions, where applicable. C. mionecton
sequences are labeled by site and individual identifiers (as
above), whereas Chalcides from other Canary Islands are
labeled by the names of their collection sites (see Materi-
als and Methods).
Please note: Wiley-Blackwell are not responsible for the
content or functionality of any supporting materials sup-
plied by the authors. Any queries (other than missing
material) should be directed to the corresponding author
for the article.
12 © 2012 The Authors. Published by Blackwell Publishing Ltd.
Bayesian Delimitation of Skink Populations R. P. Brown et al.
1
2
3
4
5
6
7
8
9
10
11
12
13
14
15
16
17
18
19
20
21
22
23
24
25
26
27
28
29
30
31
32
33
34
35
36
37
38
39
40
41
42
43
44
45
46
47
48
49
50
51
52
53

Graphical AbstractThe contents of this page will be used as part of the graphical abstract
of html only. It will not be published as part of main.
S o u t ha )b ) N o r t h
4d i git s(A)
(B)
S o u t h5 d i g i t s4 d i g i t s5 d i g i t s
1 2 1 44 5 6 7 1 1 1 21 08 9 1 3 1 5 1 63Geographic variation in morphology and sequences from three loci were studied in the Moroccan skink, Chalcides mio-
necton. Bayesian analyses of population structure showed that five-digit individuals from southern Morocco formed one
genetic cluster, while northern four- and five-digit individuals clustered together. There was strong statistical support for
delimitation of C. mionecton into northern and southern species which appear to have diverged 0.46–2.66 mya.

Author Query Form
Journal: ECE3
Article: 326
Dear Author,
During the copy-editing of your paper, the following queries arose. Please respond to these by marking up your
proofs with the necessary changes/additions. Please write your answers on the query sheet if there is insufficientspace on the page proofs. Please write clearly and follow the conventions shown on the attached corrections sheet.
If returning the proof by fax do not write too close to the paper’s edge. Please remember that illegible mark-ups
may delay publication.
Many thanks for your assistance.
Query reference Query Remarks
1 AUTHOR: Please provide the Tel and Fax numbers for the corresponding
author.
2 AUTHOR: Please provide an expansion for BPP, BAPS, MCMC.
3 AUTHOR: Please give address information for GATC Biotech and Source Bio-
Science: town, state (if applicable), and country.
4 AUTHOR: Brown et al. 1998 has not been included in the Reference List, please
supply full publication details.
5 AUTHOR: Perera et al. 2010 has been changed to Perera and Harris 2010 so
that this citation matches the Reference List. Please confirm that this is correct.
6 AUTHOR: Please provide the city location of publisher for reference Avise
(2000).
7 AUTHOR: Please provide the name of the publisher, city location of publisher,
and accessed date for reference Rambaut and Drummond (2007).

O n c e y o u h a v e A c r o b a t R e a d e r o p e n o n y o u r c o m p u t e r , c l i c k o n t h e C o m m e n t t a b a t t h e r i g h t o f t h e t o o l b a r :
S t r i k e s a l i n e t h r o u g h t e x t a n d o p e n s u p a t e x tb o x w h e r e r e p l a c e m e n t t e x t c a n b e e n t e r e d .‚ H i g h l i g h t a w o r d o r s e n t e n c e .‚ C l i c k o n t h e R e p l a c e ( I n s ) i c o n i n t h e A n n o t a t i o n ss e c t i o n .‚ T y p e t h e r e p l a c e m e n t t e x t i n t o t h e b l u e b o x t h a ta p p e a r s .
T h i s w i l l o p e n u p a p a n e l d o w n t h e r i g h t s i d e o f t h e d o c u m e n t . T h e m a j o r i t y o ft o o l s y o u w i l l u s e f o r a n n o t a t i n g y o u r p r o o f w i l l b e i n t h e A n n o t a t i o n s s e c t i o n ,p i c t u r e d o p p o s i t e . W e ’ v e p i c k e d o u t s o m e o f t h e s e t o o l s b e l o w :S t r i k e s a r e d l i n e t h r o u g h t e x t t h a t i s t o b ed e l e t e d .
‚ H i g h l i g h t a w o r d o r s e n t e n c e .‚ C l i c k o n t h e S t r i k e t h r o u g h ( D e l ) i c o n i n t h eA n n o t a t i o n s s e c t i o n .
H i g h l i g h t s t e x t i n y e l l o w a n d o p e n s u p a t e x tb o x w h e r e c o m m e n t s c a n b e e n t e r e d .‚ H i g h l i g h t t h e r e l e v a n t s e c t i o n o f t e x t .‚ C l i c k o n t h e A d d n o t e t o t e x t i c o n i n t h eA n n o t a t i o n s s e c t i o n .‚ T y p e i n s t r u c t i o n o n w h a t s h o u l d b e c h a n g e dr e g a r d i n g t h e t e x t i n t o t h e y e l l o w b o x t h a ta p p e a r s .
M a r k s a p o i n t i n t h e p r o o f w h e r e a c o m m e n tn e e d s t o b e h i g h l i g h t e d .‚ C l i c k o n t h e A d d s t i c k y n o t e i c o n i n t h eA n n o t a t i o n s s e c t i o n .‚ C l i c k a t t h e p o i n t i n t h e p r o o f w h e r e t h e c o m m e n ts h o u l d b e i n s e r t e d .‚ T y p e t h e c o m m e n t i n t o t h e y e l l o w b o x t h a ta p p e a r s .

I n s e r t s a n i c o n l i n k i n g t o t h e a t t a c h e d f i l e i n t h ea p p r o p r i a t e p a c e i n t h e t e x t .‚ C l i c k o n t h e A t t a c h F i l e i c o n i n t h e A n n o t a t i o n ss e c t i o n .‚ C l i c k o n t h e p r o o f t o w h e r e y o u ’ d l i k e t h e a t t a c h e df i l e t o b e l i n k e d .‚ S e l e c t t h e f i l e t o b e a t t a c h e d f r o m y o u r c o m p u t e ro r n e t w o r k .‚ S e l e c t t h e c o l o u r a n d t y p e o f i c o n t h a t w i l l a p p e a ri n t h e p r o o f . C l i c k O K .
I n s e r t s a s e l e c t e d s t a m p o n t o a n a p p r o p r i a t ep l a c e i n t h e p r o o f .‚ C l i c k o n t h e A d d s t a m p i c o n i n t h e A n n o t a t i o n ss e c t i o n .‚ S e l e c t t h e s t a m p y o u w a n t t o u s e . ( T h e A p p r o v e ds t a m p i s u s u a l l y a v a i l a b l e d i r e c t l y i n t h e m e n u t h a ta p p e a r s ) .‚ C l i c k o n t h e p r o o f w h e r e y o u ’ d l i k e t h e s t a m p t oa p p e a r . ( W h e r e a p r o o f i s t o b e a p p r o v e d a s i t i s ,t h i s w o u l d n o r m a l l y b e o n t h e f i r s t p a g e ) .
A l l o w s s h a p e s , l i n e s a n d f r e e f o r m a n n o t a t i o n s t o b e d r a w n o n p r o o f s a n d f o rc o m m e n t t o b e m a d e o n t h e s e m a r k s . .‚ C l i c k o n o n e o f t h e s h a p e s i n t h e D r a w i n gM a r k u p s s e c t i o n .‚ C l i c k o n t h e p r o o f a t t h e r e l e v a n t p o i n t a n dd r a w t h e s e l e c t e d s h a p e w i t h t h e c u r s o r .‚
T o a d d a c o m m e n t t o t h e d r a w n s h a p e ,m o v e t h e c u r s o r o v e r t h e s h a p e u n t i l a na r r o w h e a d a p p e a r s .‚
D o u b l e c l i c k o n t h e s h a p e a n d t y p e a n yt e x t i n t h e r e d b o x t h a t a p p e a r s .