Embed Size (px)
Citation preview
Acta Geophysica vol. 56, no. 2, pp. 344-356
DOI: 10.2478/s11600-008-00012-3
© 2008 Institute of Geophysics, Polish Academy of Sciences
Spectral characteristics of natural and artificial seismic events in the Lop Nor test site, China
Ibrahim M. KORRAT1, Ali A. GHARIB2, Kamal A. ABOU ELENEAN2, Hesham M. HUSSEIN2, and Mohamed N. EL GABRY2,3
1Geology Department, Faculty of Science, Mansoura University, Mansoura, Egypt e-mail: [email protected]
2National Research Institute of Astronomy and Geophysics, NRIAG, Helwan, Cairo, Egypt e-mails: [email protected]; [email protected] (corresponding author)
3International Centre for Theoretical Physics, Trieste, Italy e-mail: [email protected]
A b s t r a c t
Seismic discriminants based on the spectral seismogram and spectral magni-tude techniques have been tested to discriminate between three events; a nuclear explosion which took place in Lop Nor, China with mb 6.1 and two earthquakes from the closest area with mb 5.5 and 5.3, respectively. The spectral seismogram of the three events shows that the frequency content of the nuclear explosion differs from that of the earthquakes where the P wave is richier in high frequency content in the nuclear explosion than the corresponding earthquakes. It is also observed that the energy decays more rapidly for the nuclear explosion than for the earthquakes. Furthermore, the spectral magnitudes reveal significant differences in the spectra between the nuclear explosion and the two earthquakes. The observed differences appear to be quite enough to provide a reliable discriminant. The estimated stress drop from the magnitude spectra indicates a higher stress drop of the nuclear explo-sion relative to the earthquakes of the same tectonic region.
Key words: spectral seismogram, spectral magnitude, source parameter, earth-quake-explosion discrimination.
1. INTRODUCTION
Discrimination between earthquakes and underground nuclear explosions is a difficult task which has gained considerable attention in the seismological community. Seismic
SPECTRAL CHARACTERISTICS EARTHQUAKES IN CHINA
345
methods provide the principal means for verification of nuclear test ban (Basham and Dahlman 1988). The discrepancies in signals from earthquakes and explosions arise from differences in their source mechanisms, source dimensions and duration. An un-derground nuclear explosion has a small point source compared to an earthquake. It sends out compressional waves of equal strength in all directions. An earthquake oc-curs along a rupture as a result of sliding rupture sides. Due to this frictional sliding an earthquake emits more shear waves and surface waves than a nuclear explosion. As the source dimensions of earthquakes tend to be larger than those of nuclear explo-sions, wavelengths of the radiated seismic waves emitted are longer. Thus, earth-quakes usually produce signals with lower frequencies than explosions.
Classical discriminates such as mb/MS , ratio of body wave magnitude and surface wave magnitude; M0/ML , ratio of seismic moment and local magnitude and various spectral ratios showed promising results in many instances. Denny et al. (1987) and Taylor et al. (1989) show that mb/MS works well down to mb = 4. Generally, the explo-sion generates lower-amplitude surface waves than an earthquake of equal magnitude. However, in some cases these methods failed to discriminate between natural earth-quakes and nuclear explosions. For example, intermediate and deep earthquakes can cause problems with mb/MS because they can result in relatively high mb/MS differen-tials and sampling of Rayleigh waves near radiation nodes can bias the MS estimates (Dreger and Woods 2002). Additionally, all nuclear explosions produce some nonisot-ropic radiation (Wallace 1991) and the mode of the nonisotropic radiation (strike-slip vs. dip-slip) can have quite different effects on Rayleigh wave amplitudes and, hence, MS (Patton 1991). Surface waves also have source area dependent behavior (Stevens 1986). As shown by Patton (1991), the degree of such bias is a strong function of the F-factor, F = (α2 M0 /2β2 MI), where α and β are the compressional and shear wave ve-locities at the source, and M0 and MI are the nonisotropic and isotropic scalar seismic moments, respectively. The ratio of mb/M0 and ML/M0 discriminants are based on the same principle as the mb/MS method with the exception that M0 is determined by wave-form modeling to account for source depth and radiation pattern influences (Woods et al. 1993).
The seismic waves observed in earthquake records manifest clearly non-stationary characteristics, as well as wide frequency content. Those characteristics are twofold (Huerta-López et al. 2003). The first characteristic involves variations of the intensity of ground motion with the time. The second characteristic involves time variation of the frequency content, with a tendency to shift to lower frequencies as the time in-creases. This phenomenon is well known as the frequency dependent dispersive effect which is very complex and involves the arrival of different seismic phases (P, S and surface waves), the intensity of ground motion, the magnitude of earthquake, source and path effects, and the local soil conditions. Spectral characteristics of different seismic waves have been used before for the discrimination analysis and source pa-rameter evaluations of different tectonic origin earthquakes (Hussein et al. 1998, Lyskova et al. 1998, and Abou Elenean et al. 2000). Moreover, Chernobay and Gabsa-tarov (1999) applied the spectrogram method for routine discrimination between re-
I.M. KORRAT et al. 346
gional earthquakes and chemical explosions of comparable magnitudes in northern Caucasus. Recently, the spectrogram was implemented in the routine analysis used by Comprehensive Nuclear-Test-Ban Treaty Organization (CTBTO).
The need for a suitable tool for measuring strength of any seismic event, as well as for discrimination between natural and artificial ones, is very important issue. Our study has been put forward to apply both the spectral seismogram (spectrogram) and spectral magnitudes tools for the verification of a nuclear explosion at the Lop Nor test site, China and the two natural earthquakes which occurred close to the test site. These tools can help in resolving possible biases in the identification of an explosion.
2. DATA
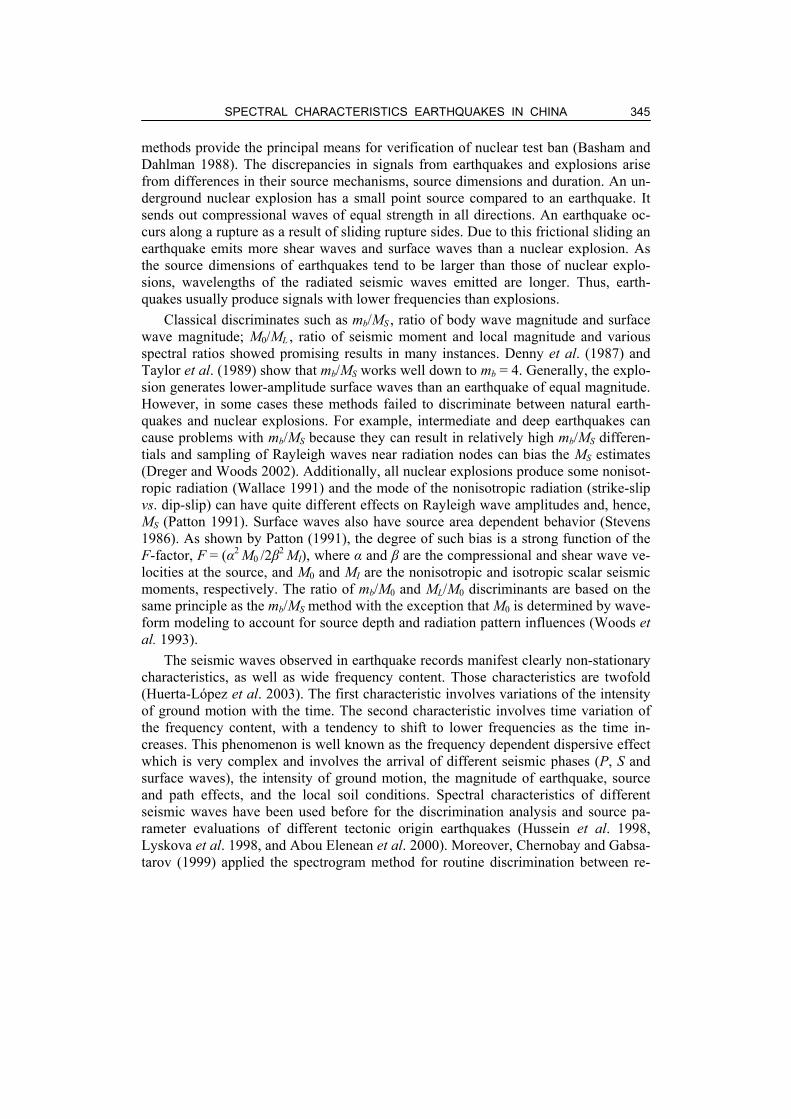
In this study, we used three events; a known nuclear explosion and two natural earth-quakes which are both located in the China Lop Nor area. The selection is based upon event size (magnitude), focal depth and location proximity. We search for the avail-able natural earthquakes with relatively comparable magnitudes to that of the explo-sion and very close to the test site. This ensures that dissimilarities observed between both events would originate from the type of the source rather than from different propagation paths and origin areas. Table 1 shows the parameters of the three tested events. The broadband records of IRIS data base were utilized. We tried to use the same stations with the same time window during our analysis. Six seismic stations equipped with 3 components Streckeisen STS-1 broadband seismometers (Fig. 1) which have good signal to noise ratio were used. The available selected stations have epicentral distances ranging from 20°-60°.
Fig. 1. Broadband stations used for discrimination between the nuclear explosion and the two studied natural earthquakes.
SPECTRAL CHARACTERISTICS EARTHQUAKES IN CHINA
347
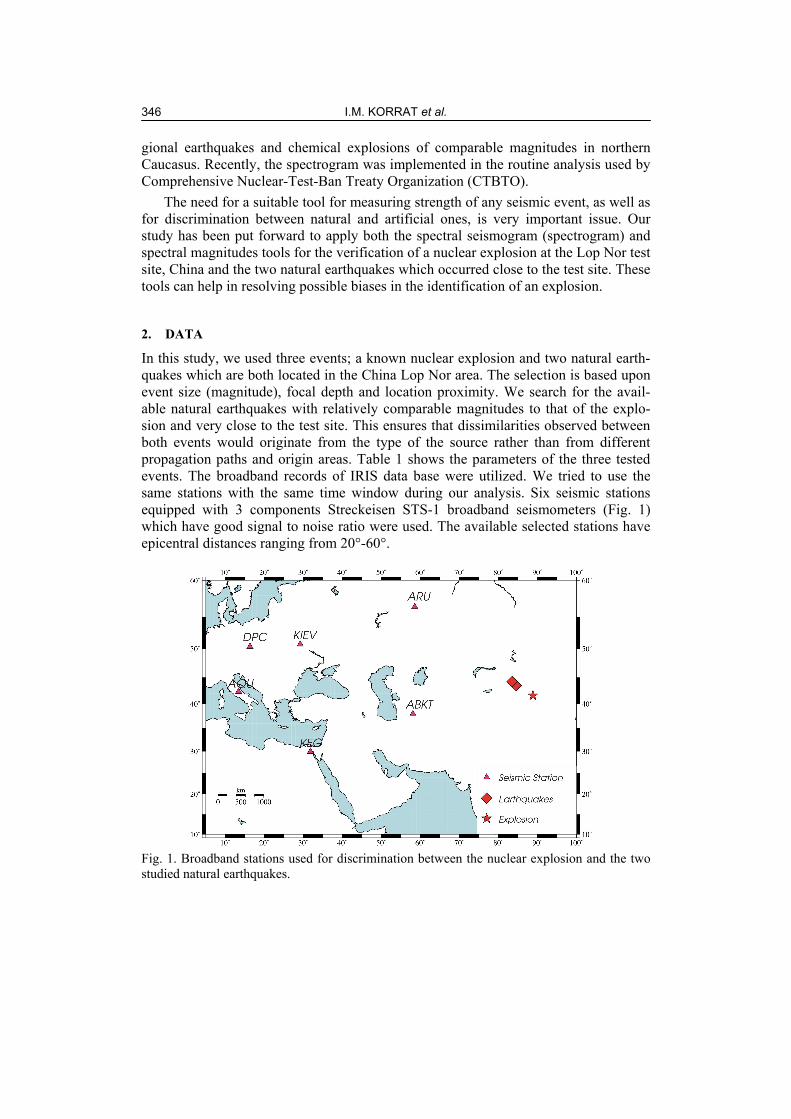
Table 1 Parameters of the studied events
Event Date Origin time Lat. N [deg]
Long. E[deg]
H [km] mb
Earthquake (1) 02 May 1995 11h48m12s 43.490 84.54 18 5.5 Earthquake (2) 23 Nov. 2006 11 04 49 44.230 83.50 28 5.3 Nuclear explosion 15 May 1995 04 05 57 41.603 88.82 ~0 6.1
3. SPECTRAL SEISMOGRAM
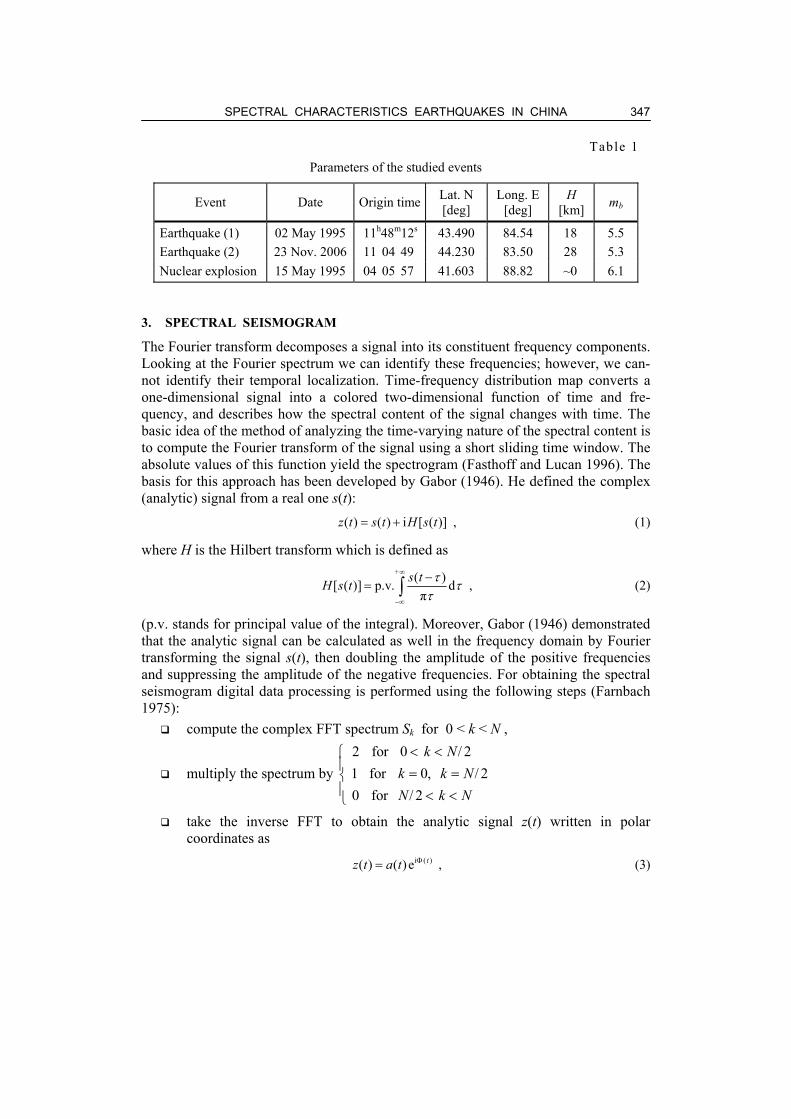
The Fourier transform decomposes a signal into its constituent frequency components. Looking at the Fourier spectrum we can identify these frequencies; however, we can-not identify their temporal localization. Time-frequency distribution map converts a one-dimensional signal into a colored two-dimensional function of time and fre-quency, and describes how the spectral content of the signal changes with time. The basic idea of the method of analyzing the time-varying nature of the spectral content is to compute the Fourier transform of the signal using a short sliding time window. The absolute values of this function yield the spectrogram (Fasthoff and Lucan 1996). The basis for this approach has been developed by Gabor (1946). He defined the complex (analytic) signal from a real one s(t): ( ) ( ) i [ ( )]z t s t H s t= + , (1)
where H is the Hilbert transform which is defined as
+ ( )[ ( )] p.v. d
πs tH s t τ τ
τ
∞
−∞
−= ∫ , (2)
(p.v. stands for principal value of the integral). Moreover, Gabor (1946) demonstrated that the analytic signal can be calculated as well in the frequency domain by Fourier transforming the signal s(t), then doubling the amplitude of the positive frequencies and suppressing the amplitude of the negative frequencies. For obtaining the spectral seismogram digital data processing is performed using the following steps (Farnbach 1975):
compute the complex FFT spectrum Sk for 0 < k < N ,
multiply the spectrum by 2 for 0 / 21 for 0, / 2 0 for / 2
k Nk k NN k N
< <⎧⎪ = =⎨⎪ < <⎩
take the inverse FFT to obtain the analytic signal z(t) written in polar coordinates as
i ( )( ) ( ) e tz t a t Φ= , (3)
I.M. KORRAT et al. 348
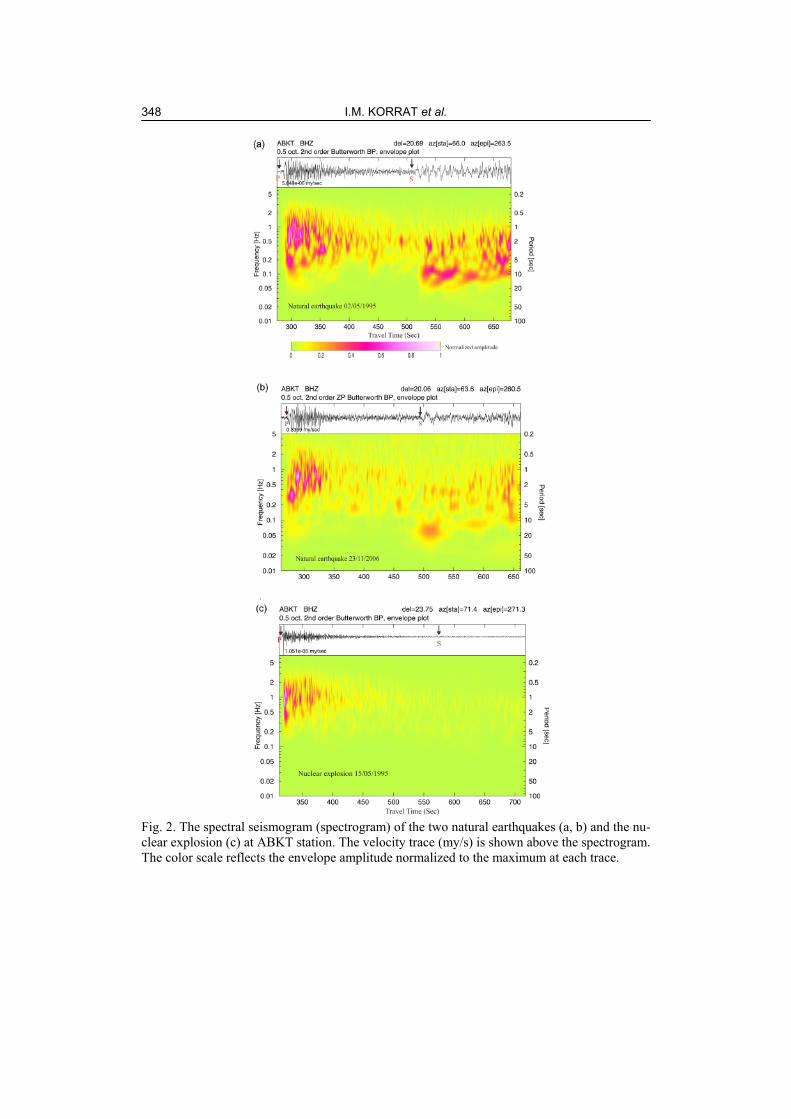
Fig. 2. The spectral seismogram (spectrogram) of the two natural earthquakes (a, b) and the nu-clear explosion (c) at ABKT station. The velocity trace (my/s) is shown above the spectrogram. The color scale reflects the envelope amplitude normalized to the maximum at each trace.
SPECTRAL CHARACTERISTICS EARTHQUAKES IN CHINA
349
where 2 2( ) ( ) ( ) [ ( )]a t z t s t H s t= = + , (4)
[ ( )]( ) arctan( )
H s tts t
Φ⎧ ⎫
= ⎨ ⎬⎩ ⎭
. (5)
The parameter a(t) is named instantaneous amplitude or envelope and Φ(t) is referred to as the instantaneous phase. The envelope and instantaneous phase are used in seis-mology for analyzing the dispersion of surface waves and detection of secondary phases. The display of the variation of frequency content with time of the signal can be considered as a good indicator of rupture process, complexity of the source, dis-crimination between different tectonic regime earthquakes and/or natural and artificial events.
In our attempt to analyze the time-frequency distribution of the selected broadband records, we follow the procedures of Levshin et al. (1972) in the dispersion analysis by applying the nfilter algorithm (Saul 1995). Different time windows of the selected records were analyzed (P-wave window (60 s), S-wave window (60 s) and nearly 400 s after P-wave onset) to inspect the variation of the ground motion intensity and their temporal frequency content with travel times.
The spectrograms of the three tested events at the vertical component of the ABKT station illustrate some essential differences between the natural earthquakes (Fig. 2a,b) and the nuclear explosion (Fig. 2c). First, the P-wave energy decays rapidly for the nuclear explosion whereas, in the earthquakes, the energy takes more time (i.e. slow rate) to vanish (either for the P waves or for the whole trace). Second, the P-wave en-ergy of the explosion is much higher than any other later phases that are usually not notable due to the great difference in their energy level relative to P-wave group. This usually occurs due to the isotropic character of the nuclear explosion sources, which generate mainly compressional P wave with S waves completely vanishing or being very weak. On the other hand, earthquakes show clearly both P- and S-waves groups. Generally, the S-wave energy is much higher than P-waves energy. A third difference appears in the frequency content of P and S-wave groups observed for the earthquakes and the explosion. In the case of the explosion, the P-wave frequency band ranges from 0.3-4.0 Hz, while in the earthquakes it ranges from 0.07 up to 3.0 Hz. The lower frequency content of the earthquakes may be related to the characteristics of its sources. The S-wave group in the earthquakes is clear and has a frequency band range from 0.05-1 Hz while it is not clear for the explosion which is limited within 0.2-0.7 Hz. Moreover, the P waves are rich in higher frequencies than S waves due to stronger shear attenuation relative to the bulk attenuation of the earth (Borman 2002).
4. SPECTRAL MAGNITUDES
The spectral magnitudes (magnitude spectra) are a quasi-continuous estimate of the velocity density spectrum of P (or S) waves expressed in magnitude units (Kaiser and
I.M. KORRAT et al. 350
Duda 1988). Unlike the conventional body wave magnitudes, the magnitude spectrum represents the complete P (or S) wave energy radiated from the source. Broadband re-cords of seismic waves enable one to extend the magnitude definition to bandpass seismograms and to determine a set of magnitudes corresponding to the respective set of seismograms. These magnitudes are called spectral magnitudes (Nortmann and Duda 1982, Duda and Yanovskaya 1994). The period corresponding to the maximum spectral magnitude varies between seismic events depending on the source characteris-tics. The maximum spectral magnitude together with its period is considered as diag-nostic quantities for seismic events.
Duda and Yanovskaya (1994) found that it is better for the determination of spec-tral magnitudes to use the spectrum instead of amplitudes from bandpass seismograms to avoid the effect of the band width. The magnitude spectrum Ms(T) is obtained from the formula:
( ) ( ) ( , , )s I IM T S T h Tσ ∆= + , (6)
where I refers to either the vertical Z or radial R component of the ground velocity density SI(T) and σI(∆, h, T) is the P-wave calibrating function. Ms(T) is a distribution of magnitude values in the period range from Tmin = 2 ∆t (∆t is the sampling interval of the seismogram) to Tmax = 60 s (length of the P-wave time window). ∆ is the epi-central distance and h is the focal depth. The magnitude spectrum is subsequently av-eraged in period intervals of a width equal to one octave and centered at the periods 0.25, 0.5, 1, 2, 4, 8, 16 and 32 s. In this case the spectrum is smoothed and yields 8 discrete values.
In this analysis, the PASTA algorithm (Roslov 1994) was used. It estimates the radiation intensities of P waves in the whole applicable period range, on the basis of broadband records of seismic waves. The program incorporates spectral magnitude calibrating functions developed by Duda and Yanovskaya (1994). In addition, it pro-duces the P-wave magnitude for a given event in the form of a P-wave magnitude spectrum. The spectral magnitude calibrating functions are normalized to a record length of 60 seconds. Prior to the analysis, the data were corrected for the instrumental response and a 10% cosine tapering function was applied at both ends of the win-dowed signal.
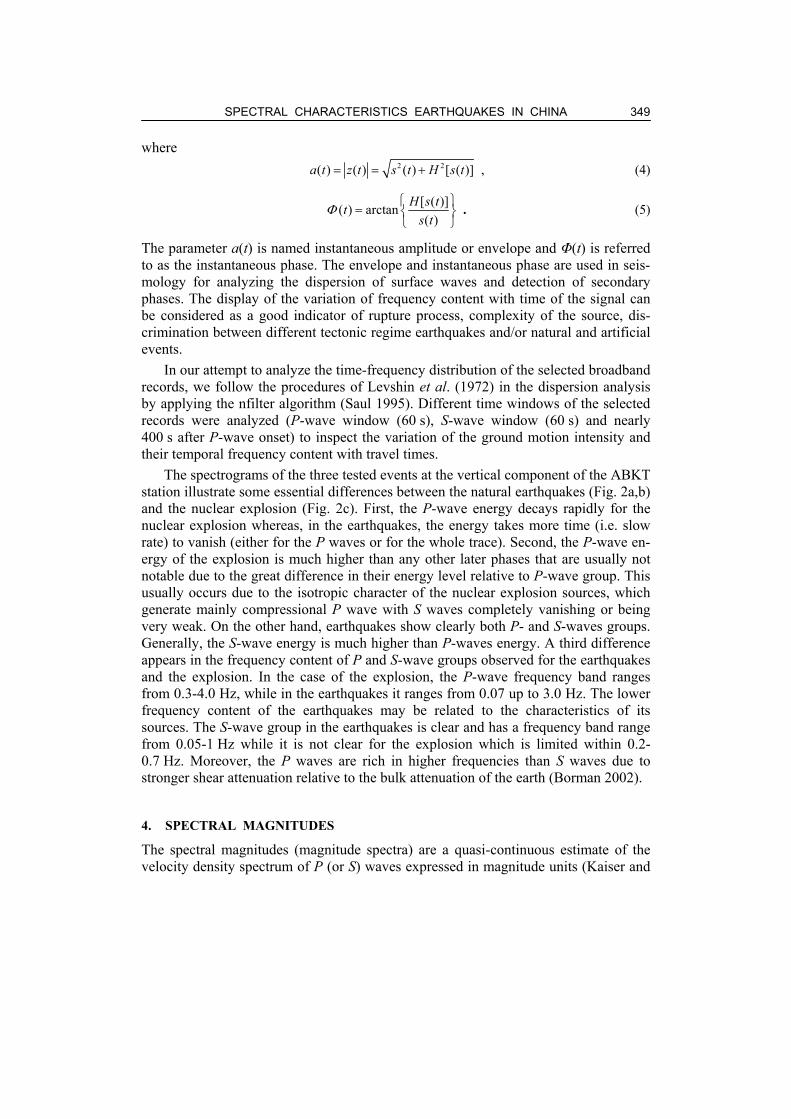
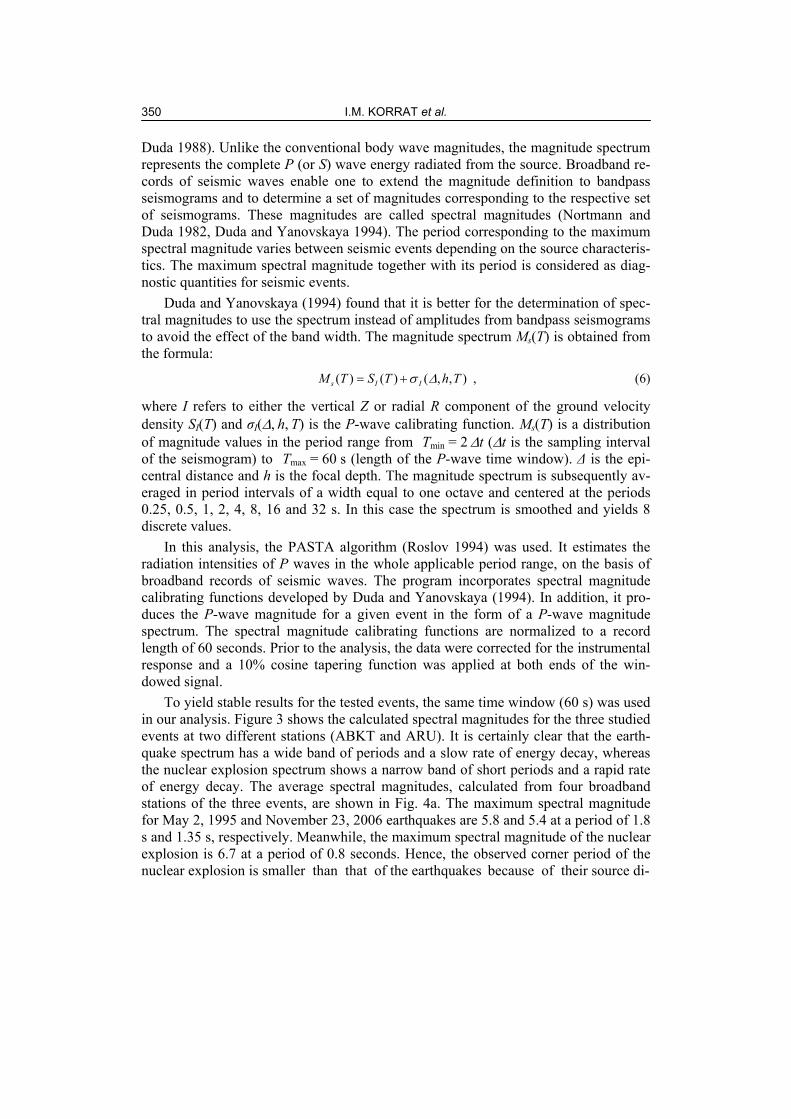
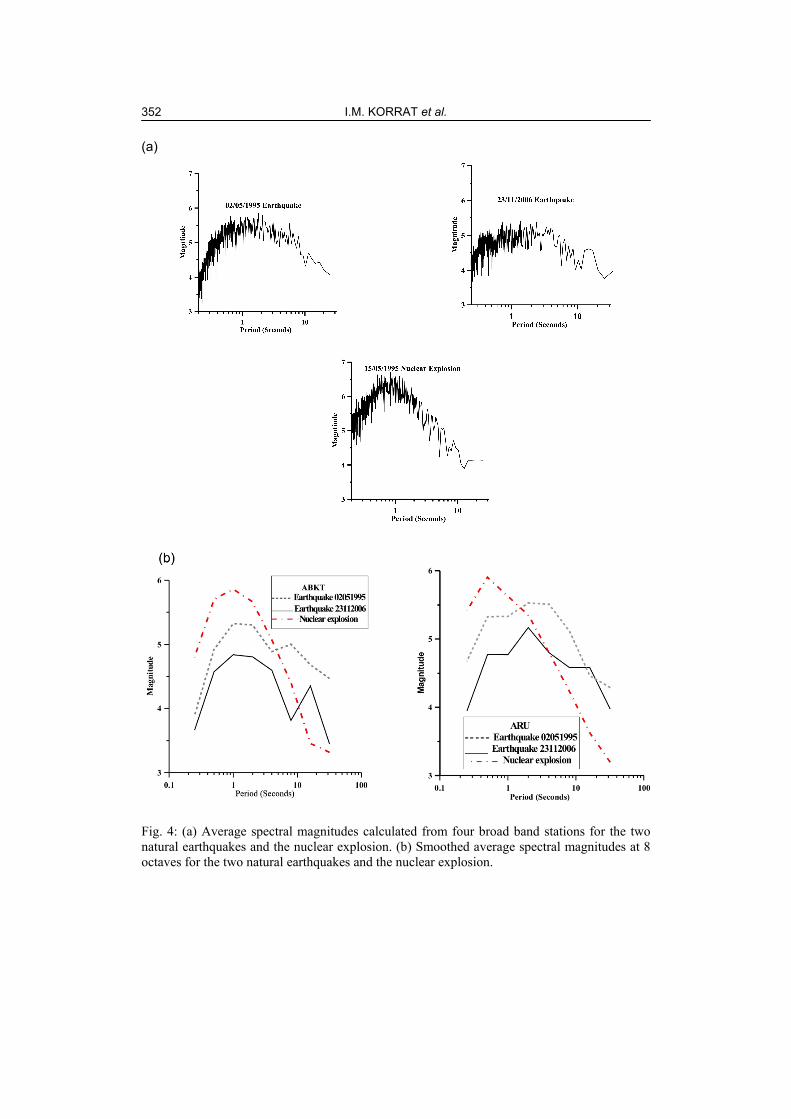
To yield stable results for the tested events, the same time window (60 s) was used in our analysis. Figure 3 shows the calculated spectral magnitudes for the three studied events at two different stations (ABKT and ARU). It is certainly clear that the earth-quake spectrum has a wide band of periods and a slow rate of energy decay, whereas the nuclear explosion spectrum shows a narrow band of short periods and a rapid rate of energy decay. The average spectral magnitudes, calculated from four broadband stations of the three events, are shown in Fig. 4a. The maximum spectral magnitude for May 2, 1995 and November 23, 2006 earthquakes are 5.8 and 5.4 at a period of 1.8 s and 1.35 s, respectively. Meanwhile, the maximum spectral magnitude of the nuclear explosion is 6.7 at a period of 0.8 seconds. Hence, the observed corner period of the nuclear explosion is smaller than that of the earthquakes because of their source di-
SPECTRAL CHARACTERISTICS EARTHQUAKES IN CHINA
351
Fig. 3: (a) Spectral magnitudes from ABKT broadband stations for the two natural earthquakes and the nuclear explosion. (b) Spectral magnitudes from ARU broadband stations for the two natural earthquakes and the nuclear explosion.
(a) (b)
I.M. KORRAT et al. 352
(a)
Fig. 4: (a) Average spectral magnitudes calculated from four broad band stations for the two natural earthquakes and the nuclear explosion. (b) Smoothed average spectral magnitudes at 8 octaves for the two natural earthquakes and the nuclear explosion.
SPECTRAL CHARACTERISTICS EARTHQUAKES IN CHINA
353
mensions. The smoothed average spectral magnitude at eight octaves, specified above for the nuclear explosion and the two earthquakes at ABKT and ARU stations, are shown in Fig. 4b. It reflects a significant deviation of their radiated energy related to their failure condition. Our spectral magnitude plots for the studied events (Figs. 3, 4) show good agreement with source spectra plots for natural and nuclear explosion pre-sented by New Manual of Seismological Observatory Practice (NMSOP).
The differences in the corner periods and in the complexities of the spectra appar-ently indicate some profound differences in the source parameters of the studied events. The seismic moment M0, rupture length L, dislocation D, stress drop ∆σ are derived from the magnitude spectrum following the equations of Kaiser et al. (1996) assuming far-field omega-square spectral model:
1/ 24
0.70 2
210π
fm r r sc
C CM TRΘΦ
ρ− ⎛ ⎞= ⎜ ⎟
⎝ ⎠ , (7)
where ρr, Cr are the density and P-wave velocity of the material near the receiver, Cs is the P-wave velocity near the source, mf and Tc are the maximum observed spectral magnitude and its corresponding period and RθΦ is the P-wave radiation pattern coef-ficient (0.44), which is the average value over the focal sphere (Boore and Boatwright 1984). The values of ρr, Cr are 2740 kg m-3 and 6140 m s-1 while the Cs values are 5080 m s-1 and 6140 m s-1 (Bukchin et al. 2001) for the explosion and earthquake, re-spectively. The fault length L is approximated by the diameter 2a0 of the Brune (1970) circular fault model. Thus
0.74 s cL C T= , (8)
00 2
0πMD
aµ= , (9)
030
716
Ma
∆σ = , (10)
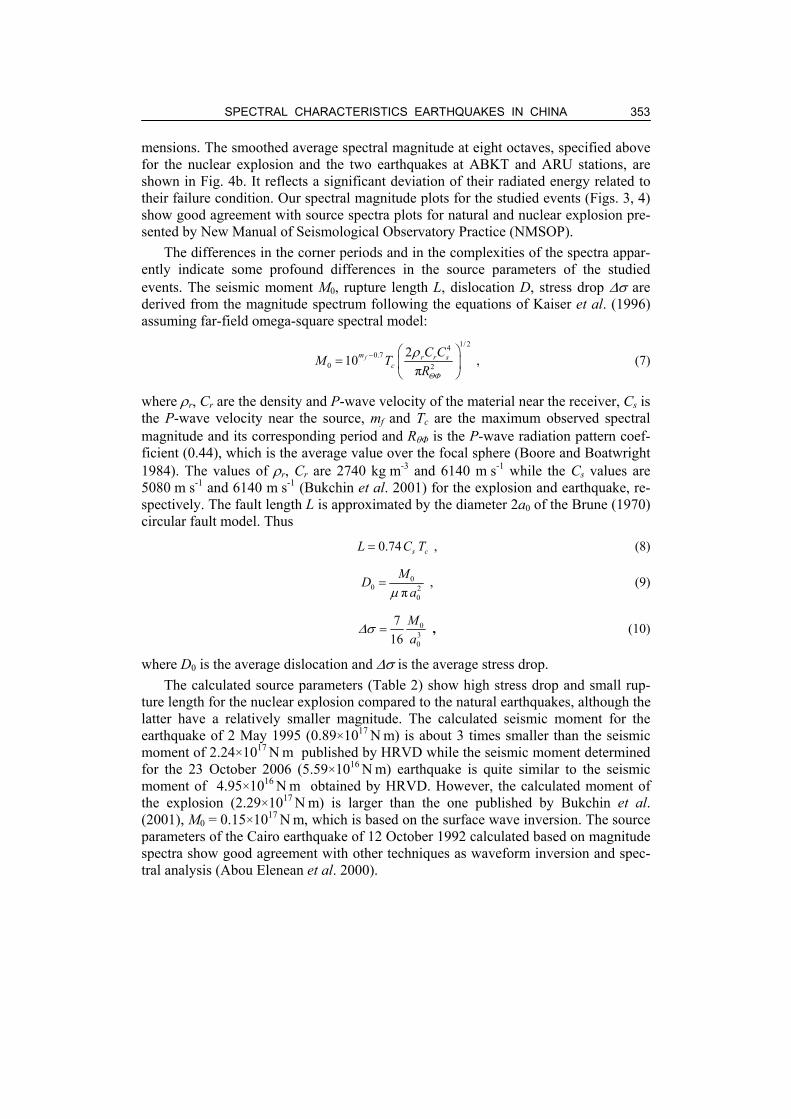
where D0 is the average dislocation and ∆σ is the average stress drop. The calculated source parameters (Table 2) show high stress drop and small rup-
ture length for the nuclear explosion compared to the natural earthquakes, although the latter have a relatively smaller magnitude. The calculated seismic moment for the earthquake of 2 May 1995 (0.89×10¹⁷ N m) is about 3 times smaller than the seismic moment of 2.24×10¹⁷ N m published by HRVD while the seismic moment determined for the 23 October 2006 (5.59×10¹⁶ N m) earthquake is quite similar to the seismic moment of 4.95×10¹⁶ N m obtained by HRVD. However, the calculated moment of the explosion (2.29×10¹⁷ N m) is larger than the one published by Bukchin et al. (2001), M0 = 0.15×10¹⁷ N m, which is based on the surface wave inversion. The source parameters of the Cairo earthquake of 12 October 1992 calculated based on magnitude spectra show good agreement with other techniques as waveform inversion and spec-tral analysis (Abou Elenean et al. 2000).
I.M. KORRAT et al. 354
Table 2 Source parameters calculated using the magnitude spectrum for the three studied events
Events Station M0 ×1017 [N·m]
∆σ [MPa]
L [m]
D0 [m]
ABKT 2.00 15.00 3562 0.75ARU 1.35 17.39 3004 0.70 KEG 3.53 26.42 3605 1.28
Nuclear explosion
Average 2.29 19.60 3390 0.91 ABKT 0 66 1 39 5493 0 11ARU 1.01 1.18 6867 0.11DPC 1.00 2.45 5279 0.17
Natural earthquake 02051995
Average 0.89 1.67 5879 0.13 ABKT 0.54 1.01 5708 0.08ARU 0.27 1.11 4390 0.07
MALT 0.56 1.10 5622 0.08 OBN 0.87 1.44 5837 0.11
Natural earthquake 23112006
Average 0.56 1.17 5389 0.09
5. CONCLUSIONS
The spectral seismograms (spectrograms) exhibit interesting features that may prove useful in discriminating nuclear explosions from shallow earthquakes. An inspection of spectrogram clearly indicates a concentration of the spectral power in the explo-sion’s P wave relative to S wave or any later phases. Meanwhile, the S-wave power is usually clear and relatively larger than P-wave power for the shallow earthquakes. When nuclear explosion fired close to the Earth surface, the P-wave energy decays rapidly whereas in the earthquake the energy takes more time (i.e., slow rate) to vanish (either for the P waves or for the whole trace). Besides, the frequency content of the explosion’s P wave reflects a limited band of higher frequencies compared to the natu-ral earthquakes with comparable size and epicentral distance. These observed dissimi-larities between nuclear explosion and earthquake spectral content arise from their source mechanisms. Nevertheless, the nuclear explosion has a spectral magnitude of 6.7, that is larger than the values of 5.8 and 5.4 obtained for the two studied earth-quakes, its observed corner period is smaller that confirm its small source dimension. Additional significant differences between two studied events are in the values of the stress drop and the rupture length estimated from the magnitude spectra. These values can be used as another criterion for the discrimination studies.
Acknowledgemen t s . We thank Mrs. Dilys Girilli, ICTP, Italy for reviewing the manuscript.
SPECTRAL CHARACTERISTICS EARTHQUAKES IN CHINA
355
R e f e r e n c e s
Abou Elenean, K., H. Hussein, A. Abu El-Ata, and E. Ibrahim (2000), Seismological aspects of the Cairo earthquake 12th October 1992, Ann. Geofis. 143, 485-503.
Basham, W., and O. Dahlman (1988), International seismological verification. In: J. Goldbaltt and D. Cox (eds.), Nuclear Weapon Testes: Prohibition or limitation, Oxford Univer-sity Press, New York, 169-189.
Boore, D.M., and J. Boatwright (1984), Average body-wave radiation coefficients, Bull. Seism. Soc. Am. 94, 1615-1621.
Borman, P., K. Klinge, and S. Wendt (2002), Data analysis and seismogram interpretation. In: P. Borman (ed.), IASPI New Manual of Seismological Observatory Practice (NMSOP), GeoForschungZentrum, Potsdam, vol. 1, ch. 11, 100 pp.
Brune, J. (1970), Tectonic stress and the spectra of seismic shear waves from earthquakes, J. Geophys. Res. 75, 4997-5009.
Bukchin, B., A. Mostinsky, A. Egorkin, A. Levshin, and M. Ritzwoller (2001), Isotropic and non-isotropic components of the earthquakes and nuclear explosions on the Lop Nor test site, China, Pure and Appl. Geophys. 158, 1497-1515.
Chernobay, I.P., and I.P. Gabsatarova (1999), Source classification in northern Caucasus, Phys. Earth Planet. Int. 113, 183-201.
Denny, M.D., S.R. Taylor, and E.S. Vergino (1987), Investigation of mb and Ms formulas for the Western United States and their impact on the Ms:mb discriminant, Bull. Seism. Soc. Am. 77, 987-995.
Dreger, D., and B. Woods (2002), Regional distance seismic moment tensor of nuclear explo-sions, Tectonophysics 356, 139-156.
Duda, S.J., and T.B. Yanovskaya (1994), Calibrating functions for P-wave spectral magni-tudes, Acta Geophys. Pol. 42, 4, 293-306.
Farnbach, J. (1975), The complex envelope in seismic signal analysis, Bull. Seism. Soc. Am. 65, 951-962.
Fasthoff, S., and G. Lucan (1996), Introduction to spectral seismograms, Institute of Geophys-ics, Hamburg University, Hamburg (unpublished paper).
Gabor, D. (1946), Theory of communication, J. Inst. Electr. Eng. III, 93,429-457. Huerta-López, C.I., J. Pulliam, K.H. Stokoe, J.M. Roësset, C. Valle-Molina (2003), Spectral
characteristics of earthquakes recorded on the Gulf of México seafloor and soft sedi-ment characterization, ASME invited lecture at the Offshore Geotechnics Workshop of the 22nd Offshore Mechanics and Arctic Engineering International Conference 06/2003, Proc. 22nd Offshore Mechanics and Arctic Engineering 2003 Intern. Conf., paper No. 37504, 1-9.
Hussein, H.M., K.M. Abou Elenean, E.M. Ibrahim, S. Ahmed Abou El Atta, and S.J. Duda (1998), Spectral magnitudes and source parameters for some damaging earthquakes in Egypt, Bull. IISEE 32, 1-16.
Kaiser, D., and S.J. Duda (1988), Magnitude spectra and other source parameters for some ma-jor 1985 and 1986 earthquakes, Tectonophysics 152, 303-318.
I.M. KORRAT et al. 356
Kaiser, D., S.J. Duda, and D.K. Chowdhury (1996), P-wave magnitude spectra, stress drop, rupture complexities and other source parameters from broadband seismograms of three 1987 Southern California earthquakes, Geofizika 13, 1-29.
Levshin, A.L., V.F. Pisarenko, and G.A. Pogrebinsky (1972), On a frequency-time analysis of oscillations, Ann. Geophys. 28, 211-218.
Lyskova, E.L., T.B. Yanovskaya, and S.J. Duda (1998), Spectral characteristics of earthquakes along plate boundaries, Geofizika 15, 69-81.
Nortmann, R., and S.J. Duda (1982b), Calibration functions for P- and SH-waves tables, Insti-tute of Geophysics, Hamburg University, Hamburg.
Patton, H.J. (1991), Seismic moment estimation and the scaling of the long-period explosion source spectrum. In: S.R. Taylor, H.J. Patton, and P.G. Richards (eds.), Explosion Source Phenomenology, Geophysical Monograph, Am. Geophys. Union, Washington, 65, 171-183.
Roslov, Yu.V. (1994), Program for amplitude spectra treatment and analysis, Acta Geophys. Pol. 42, 4, 315-319.
Saul, J. (1995), A computer program (nfilter) for spectral seismogram calculation, Institute of Geophysics, Hamburg University, Hamburg.
Stevens, J.L. (1986), Estimation of scalar moments from explosion-generated surface waves, Bull. Seismol. Soc. Am. 76, 123-151.
Taylor, S.R., M.D. Denny, E.S. Vergino, and R.E. Glaser (1989), Regional discrimination be-tween NTS explosions and western U.S. earthquakes, Bull. Seism. Soc. Am. 79, 1142-1176.
Wallace, T.C. (1991), Body wave observations of tectonic release. In: S.R. Taylor, H.J. Patton, and P.G. Richards (eds.), Explosion Source Phenomenology, Am. Geophys. Union, Washington 65, 161-170.
Woods, B., S. Kedar, and D. Helmberger (1993), ML:M0 as a regional seismic discriminant, Bull. Seism. Soc. Am. 83, 1167-1183.
Received 19 December 2006 Accepted 16 January 2008