Embed Size (px)
Citation preview

arX
iv:a
stro
-ph/
0204
343v
1 1
9 A
pr 2
002
Spectrophotometric Observations of Blue Compact Dwarf
Galaxies: Mrk 370
Luz M. Cairos
Universitats-Sternwarte Gottingen, Geismarlandstr. 11, 37083, Gottingen, Germany. Instituto deAstrofısica de Canarias , E-38200 La Laguna, Tenerife, Canary Islands, Spain. Departamento de
Astronomıa, Universidad de Chile, Casilla 36-D, Santiago, Chile
Nicola Caon
Instituto de Astrofısica de Canarias, E-38200 La Laguna, Tenerife, Canary Islands, Spain
Begona Garcıa Lorenzo
Isaac Newton Group of Telescopes (ING), E-38780 Santa Cruz de La Palma, La Palma, Canary Islands,Spain
Jose M. Vılchez
Instituto de Astrofısica de Andalucıa, CSIC, Apdo. 3004, 18080 Granada, Spain
Casiana Munoz-Tunon
Instituto de Astrofısica de Canarias, E-38200 La Laguna, Tenerife, Canary Islands, Spain
ABSTRACT
We present results from a detailed spectrophotometric analysis of the blue compact dwarfgalaxy (BCD) Mrk 370, based on deep UBV RI broad-band and Hα narrow-band observations,and long-slit and two-dimensional spectroscopy of its brightest knots.
The spectroscopic data are used to derive the internal extinction, and to compute metallic-ities, electronic density and temperature in the knots. By subtracting the contribution of theunderlying older stellar population, modeled by an exponential function, removing the contri-bution from emission lines, and correcting for extinction, we can measure the true colors of theyoung star-forming knots. We show that the colors obtained this way differ significantly fromthose derived without the above corrections, and lead to different estimates of the ages and star-forming history of the knots. Using predictions of evolutionary synthesis models, we estimatethe ages of both the starburst regions and the underlying stellar component. We found that wecan reproduce the colors of all the knots with an instantaneous burst of star formation and theSalpeter initial mass function (imf) with an upper mass limit of 100 M⊙. The resulting agesrange between 3 and 6 Myrs. The colors of the low surface brightness component are consistentwith ages larger than 5 Gyr. The kinematic results suggest ordered motion around the majoraxis of the galaxy.
Subject headings: galaxies: dwarf galaxies - galaxies: starburst - galaxies: compact - galaxies: kinematics
and dynamics - galaxies: evolution
1

1. Introduction
Blue Compact Dwarf galaxies (BCD) are low-luminosity (MB ≥ −18 mag), compact (starburstdiameter ≤ 1 kpc) objects, which have opticalspectra similar to those presented by H II regionsin spiral galaxies (Sargent & Searle 1970; Thuan& Martin 1981). They are metal deficient galaxies— the metallicities of their ionized gas ranging be-tween Z⊙/50 and Z⊙/2 — that form stars at highrates, able to exhaust their available gas contentin a time much smaller than the age of the Uni-verse. This fact implies that either these galaxiesare young systems, experiencing their first burstof star formation, or that star formation occurs inshort bursts separated by long quiescent periods(Sargent & Searle 1970). Nowadays, the latter ex-planation is the more widely accepted, at least forthe majority of BCDs (Thuan 1991).
In the recent years BCDs have attracted agreat deal of interest, and have become key ob-jects for understanding fundamental astrophysicalproblems. Much effort has been devoted to thestudy of these galaxies, driven by the followingfundamental questions: 1) what is the mechanismthat triggers the starburst activity and is therea unique one in all BCD subtypes? 2) what arethe properties of the underlying stellar population(age, metallicity, dynamical status)? Answeringthe above questions would allow to form a gen-eral view of dwarf galaxy formation and evolution,and in particular to test those evolutionary sce-narios linking the different classes of dwarf galax-ies, namely, dwarf irregulars (dIs), dwarf ellipticals(dEs) and BCDs (Thuan 1985; Davies & Phillipps1988; Papaderos et al. 1996b; Marlowe et al. 1997;Marlowe, Meurer, & Heckman 1999), or the dif-ferent morphological classes of BCDs (Noeske etal. 2000). However, most of the work carriedout so far has focused on a statistical analysisof BCD samples by means of surface photometry(Papaderos et al. 1996a; Telles 1995; Doublier etal. 1997; Doublier, Caulet, & Comte 1999; Ostlin1998), and has rather demonstrated the complex-ity of the topic than given firm answers.
Prompted by this lack of conclusive results, westarted an extensive study of a large sample ofBCDs. The first step was the analysis of broad-band observations in B, V , R and I for a sam-ple of 28 BCDs. In Cairos et al. (2001a, hereafter
Paper I) we presented deep contour maps in theB band, and surface brightness and color profiles,which were used to examine and discuss their mor-phology and structure. In Cairos et al. (2001b,hereafter Paper II) we enlarged the dataset by in-cluding U and Hα observations; we provided inte-grated photometry of the galaxies and producedan atlas of detailed color and Hα maps. The qual-ity of the data allowed us to identify the differentstar-forming regions, and discriminate them fromthe regions where the star formation has alreadyceased.
One of our main conclusions was that opti-cal broad-band photometry alone does not allowto disentangle the distinct stellar components inBCDs and derive their evolutionary status. Themeasured broad-band colors are strongly affectedby interstellar reddening and gaseous emission; be-sides, we need to separate the light coming fromyoung stars from the emission of those born in pre-vious star-formation episodes — a methodologicalaspect often overlooked. Spectroscopic informa-tion is required in order to correct for interstellarreddening and emission line contamination, andU -band and Hα measurements are fundamental,since they are much more sensitive to the star-formation properties. Nevertheless, such kind ofanalysis is scarce in the literature, mainly becauseit requires a lot of observing time. In particular,not enough effort has been devoted so far to thecharacterization of the stellar population hostingthe actual burst, indeed a challenging task.
For these reasons, we decided to perform a moredetailed study of a number of individual galax-ies, based on a new strategy that combines broad-and narrow-band photometry with long-slit and 2-D spectroscopy. The objects were selected amongthose presented in Papers I and II, so as to form asample including the different subtypes of objectsclassified as BCDs — a not so well defined classwhich spans a wide range of luminosities, metal-licities and morphologies (Kunth & Ostlin 2000;Cairos 2000; Cairos et al. 2001b).
This paper is the first in a series which presentthe results obtained from the use of this techniqueto analyze the selected galaxies. Here we describethe technique and its application to the galaxyMrk 370, a luminous BCD, with MB = −17.20(Paper II), located at a distance of 12.9 Mpc
2
(Thuan & Martin 1981)1.
We have chosen this galaxy in order to studya prototype of the group of BCDs populating thehigher luminosity and metallicity range within themost common BCD morphological subclass, the iEtype (Loose & Thuan 1986, hereafter LT86). Thistype is characterized by an underlying, low bright-ness elliptical component which hosts numerousstar-forming regions.
In Mrk 370, the brighter knots of star-formationare located in the inner part of the galaxy, fromwhere smaller star-forming knots emerge and forma structure resembling spiral arms (see Papers Iand II). The choice of Mrk 370 rests also on thefact that the comparison of the properties of itsmany individual starburst knots provides valuableinformation on the mechanisms that trigger thestar formation, allowing to study how it prop-agates within the galaxy, and is a possible testof the stochastic self-propagating star formationmechanism (Gerola, Seiden, & Schulman 1980),which has been suggested to explain how the star-formation process in dwarfs is maintained (Coziol1996).
In addition, Mrk 370 may be seen as a pro-totype of the BCDs classified as multiple nu-cleus starburst galaxies. The presence of two cen-tral star-forming knots led Mazzarella & Boroson(1993) to label this galaxy as a ”double nucleus”BCD, prompting further suggestions of its mergerorigin. As we will show in this work, the kinematicand spectrophotometric results obtained cast seri-ous doubts on the merger scenario.
A complete collection of color and Hα mapsof this galaxy can be found at the following Webpage: http://www.iac.es/proyect/GEFE/BCDs.The basic data of Mrk 370 are shown in Table 1.
2. Observations and Data Reduction
2.1. Long-slit spectra
Long-slit spectroscopy of Mrk 370 was obtainedin September 1998, with the Isaac Newton Tele-
1For consistency with Papers I and II, we use here the dis-tance from Thuan & Martin (1981), which is based onthe radial velocity with respect to the Local Group andH0 = 75 km sec−1 Mpc−1; applying the correction forLG infall into Virgo would give D = 10.9 Mpc, and totalluminosities, absolute magnitudes and sizes would changeaccordingly.
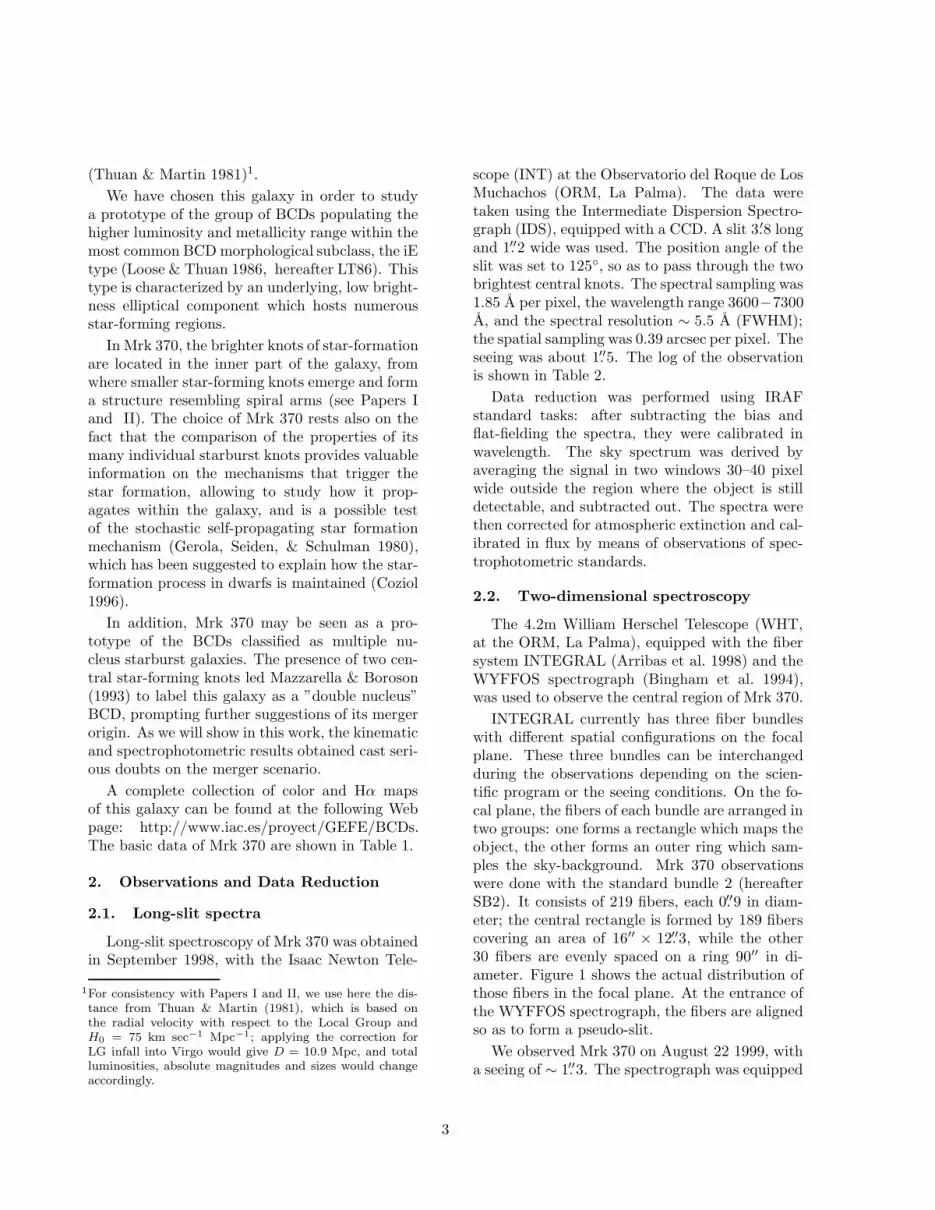
scope (INT) at the Observatorio del Roque de LosMuchachos (ORM, La Palma). The data weretaken using the Intermediate Dispersion Spectro-graph (IDS), equipped with a CCD. A slit 3.′8 longand 1.′′2 wide was used. The position angle of theslit was set to 125, so as to pass through the twobrightest central knots. The spectral sampling was1.85 A per pixel, the wavelength range 3600−7300A, and the spectral resolution ∼ 5.5 A (FWHM);the spatial sampling was 0.39 arcsec per pixel. Theseeing was about 1.′′5. The log of the observationis shown in Table 2.
Data reduction was performed using IRAFstandard tasks: after subtracting the bias andflat-fielding the spectra, they were calibrated inwavelength. The sky spectrum was derived byaveraging the signal in two windows 30–40 pixelwide outside the region where the object is stilldetectable, and subtracted out. The spectra werethen corrected for atmospheric extinction and cal-ibrated in flux by means of observations of spec-trophotometric standards.
2.2. Two-dimensional spectroscopy
The 4.2m William Herschel Telescope (WHT,at the ORM, La Palma), equipped with the fibersystem INTEGRAL (Arribas et al. 1998) and theWYFFOS spectrograph (Bingham et al. 1994),was used to observe the central region of Mrk 370.
INTEGRAL currently has three fiber bundleswith different spatial configurations on the focalplane. These three bundles can be interchangedduring the observations depending on the scien-tific program or the seeing conditions. On the fo-cal plane, the fibers of each bundle are arranged intwo groups: one forms a rectangle which maps theobject, the other forms an outer ring which sam-ples the sky-background. Mrk 370 observationswere done with the standard bundle 2 (hereafterSB2). It consists of 219 fibers, each 0.′′9 in diam-eter; the central rectangle is formed by 189 fiberscovering an area of 16′′ × 12.′′3, while the other30 fibers are evenly spaced on a ring 90′′ in di-ameter. Figure 1 shows the actual distribution ofthose fibers in the focal plane. At the entrance ofthe WYFFOS spectrograph, the fibers are alignedso as to form a pseudo-slit.
We observed Mrk 370 on August 22 1999, witha seeing of ∼ 1.′′3. The spectrograph was equipped
3

with a grating of 600 groove/mm, and a Tek6 CCDarray of 1124x1124 24-micron pixels. The spectralrange coverage was 4400−7150 A, with a spectralresolution of about 6 A; it includes the Hβ, [O III],Hα, [N II], and [S II] emission lines (see AppendixA).
Data reduction was performed within the IRAFenvironment, and includes bias and scattered lightsubtraction, fiber extraction, fiber throughput cor-rection, wavelength calibration, rejection of cosmicray events, and correction from differential atmo-spheric refraction effects (for details on reductionof fiber data see e.g. Garcıa-Lorenzo, Mediavilla,& Arribas 1999, and references therein).
In Appendix A we present the nuclear spectrumof Mrk 370 in the full wavelength range observedwith the fiber system. We also show the individ-ual spectra corresponding to each of the 189 ob-served positions (fibers) in a selected spectral in-terval which includes the most important emissionlines.
2.3. Hα imaging
Narrow-band images centered on the Hα lineand on the adjacent continuum were taken in1997 December at the 2.2-m telescope of theGerman-Spanish Astronomical Observatory onCalar Alto (Almerıa, Spain). The instrumentationconsisted of the Calar Alto Faint Object Spectro-graph, CAFOS, and a 2048×2048 SiTe CCD chip.With a pixel size of 0.53 arcsec, it provides a field16 arcmin wide; however, due to the physical sizeof the available filters, only the central round areaof about 11 arcmin is free from vignetting. Theaverage seeing was 1.5 arcsec.
The image reduction was carried out usingIRAF. Each image was corrected for bias, usingan average bias frame, and was flattened by divid-ing by a mean twilight flatfield image. The frameswere then registered (for each filter we took a set ofdithered exposures) and combined to obtain the fi-nal frame, with cosmic ray events removed and badpixels cleaned out. The average sky level was esti-mated by computing the mean value within severalboxes surrounding the object, and subtracted outas a constant. Flux calibration was done throughthe observation of spectrophotometric stars fromthe lists in Oke (1990).
The complete log of the observations is shown
in Table 2.
2.4. Broadband Imaging
UBVRI imaging of Mrk 370 was carried out inOctober 1998 at the 1-m Jacobus Kapteyn Tele-scope, JKT (ORM, La Palma). We collected CCDimages at the f/15 Cassegrain focus, using a Tek1024×1024 pixel chip, yielding a pixel size of 0.33arcsec and a field of view of 5.6× 5.6 arcmin. Theaverage seeing was 1.′′5.
A log of the observations is given in Table 2.The image processing was performed using stan-dard procedures available in IRAF. Flux calibra-tion was done through the observation of photo-metric stars from Landolt (1992) throughout thenight.
3. Spectroscopic Analysis
3.1. Long-slit spectroscopy
The position of the slit we used is shown inFigure 2, overplotted on a contour map of thecontinuum-subtracted Hα image. (The meaningof the labels is explained in Section 4). The spatialrun of the intensity of the brightest emission lines(Hα, Hβ, [O III]) has been used as a base for defin-ing the regions from where the one-dimensionalspectra of each knot were extracted by integratingthe signal within them. Two distinct starburstregions have been identified, marked a and b inFigure 2.
Figure 3 shows the summed spectra of the twoknots, and the spectrum integrated over the wholegalaxy (which we shall refer to as s). The spec-trum of region a shows a high continuum level.Absorption wings are resolved in Hβ and Hγ,Hδ being visible in absorption only. The Balmerdiscontinuity, together with these absorption fea-tures, can be interpreted as the product of a sub-stantial population of older stars, with ages con-siderably larger than 10 million years. Region bshows an almost flat spectrum, characteristic ofa dominant OB population, with no evident ab-sorption features. The integrated spectrum, s, issimilar to that of region a.
Fluxes and equivalent widths of the emissionlines were measured using the gaussian profile fit-ting option in the iraf task splot (a direct inte-gration of the flux inside each line gave very simi-
4

lar results). It is known that these measurementsare an underestimate of the real flux of the Balmerlines, because of the underlying absorption compo-nent. In the present spectra we could not deblendthe two components. To correct for the underlyingstellar absorption, some authors (McCall, Rybski& Shields 1985; Skillman & Kennicutt 1993) adopta constant equivalent width (1.5− 2 A) for all thehydrogen absorption lines. However, the actualvalue of their equivalent width is uncertain anddepends on the age of the star formation burst(Dıaz 1988; Cananzi, Augarde, & Lequeux 1993;Olofsson 1995). Thus we preferred to leave it as afree parameter, which was determined as follows.
We assume that the equivalent width, Wabs, ofthe absorption line is the same for all the Balmerlines, but can vary from knot to knot. We thenstart with an initial guess for Wabs, correct themeasured fluxes, and determine the extinction co-efficient at λ = 4861 A, C(Hβ), and its uncer-tainty, ∆C(Hβ), through a fit to the Balmer decre-ment, given by the equation:
F (λ)
F (Hβ)=
I(λ)
I(Hβ)× 10C(Hβ)×f(λ) (1)
where F (λ)F (Hβ) is the line flux corrected for absorp-
tion and normalized to Hβ; I(λ)I(Hβ) is the theoretical
value for case B recombination, from Brocklehurst(1971), and f(λ) is the reddening curve normal-ized to Hβ which we took from Whitford (1958).
We then search, for each knot, the value of Wabs
that provides the best match — that is, the lowest∆C(Hβ) — between the corrected and the theo-retical line ratios.
Reddening-corrected intensity ratios and equiv-alent widths are quoted in Table 3.
The [O III] λ 4363 line could not be detectedin the spectra, so the oxygen abundance for thedifferent regions of Mrk 370 was derived using theempirical 12+log O/H vs R23 relation, first de-rived by Pagel et al. (1979). We have used the R23
calibration according to McGaugh (1991). Theratio [N II]/[O II] was used to break the degen-eracy in the calibration in order to select eitherthe upper or the lower branch (McGaugh 1991).Since the values of [N II]/[O II] for the three spec-tra analyzed are always above the 0.1 threshold(log λ6584/λ3727 = −0.59, −0.81, −0.75 for re-
gions a, b and s), the upper branch of the calibra-tion has been used for the determination of theabundance. We have derived the following values:12 + log O/H = 8.7, 8.6 and 8.7 for the spectraof regions a, b and s respectively, for which thecorresponding values for the logarithm of electrondensity are 2.07, 2.2 and 2.3.
The average value for the nitrogen to oxygenratio is log N/O = −1.1. The derived averageoxygen abundance is approximately Z⊙/2. Theabundances are equal for regions a and b, withinthe uncertainties.
3.2. Two-dimensional spectroscopy
Two-dimensional spectroscopy with opticalfibers allows to collect simultaneously the spectraof many different regions of an extended object,combining photometry and spectroscopy in thesame dataset.
From the individual measurements (line fluxesand ratios, continuum level, radial velocity, etc.)obtained at each fiber, we can build 2-D mapsby using a two-dimensional interpolation tech-nique, such as the Renka & Cline algorithm (im-plemented in the E01SAF and E01SBF routinesin the NAG Fortran Library). This requires a pre-cise knowledge of the exact location of each fiber,which is determined by a metrology machine. Inthis way we built up images of 95× 95 pixels witha scale ∼ 0.′′2 pixel−1. While the spatial sam-pling (that is, the fiber diameter) of INTEGRAL(STD2) is 0.9 arcsec, the centroid of any peak inour maps can be measured with an accuracy ofaround 0.2 arcsec (that is 1/5 of the fiber diame-ter; see for instance Mediavilla et al. 1998)
3.2.1. Continuum and Line-Intensity Maps
Because of non-photometric conditions dur-ing INTEGRAL observations, we could not flux-calibrate directly our spectra. The flux calibrationwas done by using the long-slit data as a refer-ence. We integrated the signal in our 2-D spectrawithin two regions matching regions a and b in thelong-slit spectra. Comparing the fluxes of differ-ent lines, we could compute the conversion factorwith an accuracy of about 20%. This is the errorassociated to the fluxes derived from INTEGRALdata using this calibration.
Figure 4(a) shows a continuum map (within
5

a spectral region where no emission lines arepresent) of Mrk 370 from INTEGRAL spectra.We also present in Figure 4(b) a V band imageof the galaxy, in order to evidence the excellentagreement between the continuum map and thebroad-band images.
The INTEGRAL data show that the position ofthe peak in the continuum maps does not dependon what spectral range was used to build them.Therefore, we can safely define this point as the”optical nucleus” of the galaxy, and we set it as theorigin of the coordinate system in all our spectralmaps.
By fitting a single-gaussian to each emission linein our spectra, we have obtained emission line fluxmaps. Figure 4 (c) shows the Hα emission map.We also fitted an absorption component to Balmerlines in those spatial positions where the absorp-tion wings were clear. For comparison, an Hα nar-row band filter image of Mrk 370 is displayed inFigure 4 (d). The area covered by INTEGRAL in-cludes four of the many star-forming knots presentin the galaxy. The optical nucleus does not coin-cide with any of them.
Figure 4 (e) is the map of the [O III]/Hβ ratio,which is commonly used as an indicator of the ex-citation. The morphology of the [O III]/Hβ map issimilar to the emission lines intensity maps. Theregions with the highest ionization coincide withthe knot peaks, and the level of excitation is nor-mal for star-forming regions. Figure 4 (f) is themap of the extinction coefficient C(Hβ) computedfrom the observed Hα/Hβ ratio.
The peaks in the extinction coefficient map areclose to, but not coincident with, the peaks of theHα knots. The average offset for the four knots inour observed area is 0.26±0.11 arcsec. While thisdisplacement is small — in fact, it is at our de-tection limit —, it may suggest a real spatial shiftbetween the center of the HII regions and the holesin the C(Hα) distribution. A similar case has beenreported before by Maız-Apellaniz et al. (1998) forthe starburst knots of the galaxy NGC 4214. Theyfind the dust to be concentrated at the boundariesof the ionized regions. The explanation that theypropose is that stellar winds have contributed todiffuse the dust into the inter-cluster medium.
3.2.2. Kinematical Pattern
The kinematic analysis is limited to the emis-sion features, as absorption lines are too weak tobe of some utility.
Individual Radial Velocities
Radial velocities were obtained by fitting a sin-gle gaussian to each emission line present in ourspectra. Although the spectral resolution of theIntegral Field Spectroscopy is ∼ 275 km/s, thecentroid of the emission features could be mea-sured with an accuracy of ±10 km/s, as indicatedby the scatter among the radial velocities obtainedfrom different lines. The final radial velocities ofthe ionized gas were obtained by averaging the re-sults derived from individual emission lines. Wecompared the results for the two different indi-vidual exposures of Mrk 370. The mean differ-ence among the individual values was 0±12 km/s.Therefore, by adding the error on the wavelengthcalibration (∼ 7 km/s), we estimate that the fi-nal uncertainties on the velocity measurements are. 20 km/s.
The Mean Ionized Gas Velocity Field
Figure 5 shows that the velocity field appears tobe regular and similar to that of a rotating disk.The west region is receding, the east part is ap-proaching. In order to determine the location ofthe kinematic center (k hereafter), we computedthe ”differential” of the velocity field, averagingthe absolute differences between one point and itsnearest neighbors. This procedure emphasizes re-gions in which the velocity is changing rapidly.The position derived in this way is placed ∼ 2.′′4SE (−2.′′36, 0.′′37) of the optical nucleus. k is lo-cated between regions a and b, in an apparentlynon-significant location in the galaxy, and has avelocity value of 766±20 km/s, consistent with thesystemic velocity of the galaxy, 783±16 km/s, re-ported by Falco et al. (2000).
k is nearly coinciding with the geometrical cen-ter of the external isophotes, obtained from ourbroad band images. This fact might suggest thatthe star-forming knots in the central region ofMrk 370 could share the same velocity field of themain body.
Velocity Field Parameters
To quantify the relevant parameters of the ion-ized gas velocity field, we adopted a simple kine-
6

matic model (Mihalas & Binney 1981):
Vr(R, θ) = Vsys+Z(R) cos i+Ω(R) cos[θ−δ(R)] sin i(2)
where Vsys is the systemic velocity, Ω(R) is thestrength of the velocity field projection onto thegalactic plane, and δ(R) is the PA of the majorkinematic axis. R and θ are the galactocentricpolar coordinates in the plane of the galaxy.
We fit this model to the data, keeping fixed theposition of the center at k, and assuming an initialestimate of the position angle of the kinematicalmajor axis δ0 ∼ 90, and an inclination of thegalaxy i ∼ 40 (Nordgren et al. 1995). The resultsdo not depend on δ0, and are rather insensitive toreasonable changes in i. In Figure 6 we presentthe dependence on galactocentric distance of theparameters resulting from the fit. The systemicvelocity we derived is 761 km/s, with an internalerror of ±2 km/s.
4. Photometric Analysis
4.1. Hα photometry of the starburst knots
The left panel of Figure 7 shows a grey-scaleHα image of Mrk 370. The galaxy reveals a com-plex structure consisting of several resolved knotslocated atop an extended low surface brightness(LSB) component having regular appearance (seethe R band map in Figure 7, right panel) and sub-stantially redder colors (Paper I and Paper II).
In the central part of the galaxy are two largestar-forming regions (labeled 11 and 12 in Fig-ure 2), ≈ 7 arcsec (450 pc) apart, which appear tobe connected by a faint bridge-like structure; thesetwo star-forming regions have been previously cat-aloged as ”double nucleus” by Mazzarella & Boro-son (1993). Smaller star-forming knots extend outin the north-east and south-west directions, to ap-proximately 40 arcsec (2.5 kpc) from the opticalcenter (i.e., the center of the outer isophotes). Thestar-formation activity is concentrated along thisdirection, with the exception of region 11).
We have used the focas package to identifyand analyze the different knots in the continuum-subtracted Hα images. The focas task looks forlocal maxima and minima in the adu counts ofeach pixel in the image. We have adopted thecriteria that, for a knot to be detected, its areamust be larger than 12 pixels (corresponding to
an equivalent diameter of 2 arcsec or 125 pc), toensure that the diameter of the knot is larger thanthe psf, and the counts of each of its pixels mustbe higher than 3 times the standard deviation ofthe sky background. Using these criteria, a to-tal of 16 knots were detected; they are labeled inFigure 2.2
Data on the Hα flux, luminosity, number of ion-izing photons, ionized hydrogen mass and equiv-alent width of each knot were calculated; theseresults are presented in Table 4. The number ofionizing photons and the ionized hydrogen masswere calculated following Kennicutt (1988). Theelectron temperature and density needed to calcu-late the mass of the hydrogen ionized gas and thenumber of ionizing photons were obtained fromthe long-slit spectra.
The resulting parameters have been correctedfor interstellar extinction and for the contributionof the [N II] lines. For the Knots 11 and 12, weused the spectroscopic parameters derived for thesubregions b and a (see Figure 2). We used thebi-dimensional data to correct knots inside the in-tegral field. For those knots outside the regioncovered by our 2-D spectra, the above correctionshave been applied by using averaged values de-rived from the central region.
The luminosity of the brightest knots (11 and12) are comparable to those of individual giantH II regions (typically 1039–1040 erg sec−1; Ken-nicutt 1991). The range in luminosities is similarto that found for the H II regions cataloged in theMagellanic Irregular NGC 4449 (Fuentes-Masip etal. 2000).
The equivalent width W (Hα) was computed as:
W (Hα) = CHα/Ccont × ∆WHα (3)
where CHα is the total number of net counts ofthe knot, Ccont is the corresponding total numberof counts in the rescaled continuum image, and∆WHα is the width of the Hα filter transmissioncurve.
The Hα equivalent width has been corrected forthe contribution of the underlying stellar emissionto the continuum level; it means that Ccont arethe total counts measured in the continuum band
2The Integral continuum maps show another fainter knot,not detected by Focas as it does not satisfy these criteria.
7

after subtracting the counts due to the emissionof the older stars. In order to estimate this lattercontribution, we assumed that the underlying pop-ulation can be described by an exponential model(this procedure is explained in the next section).As the exposures in the continuum narrow-bandfilter were not deep enough to derive the propertiesof the underlying disk, the structural parametersderived in R band have been used. The continuumflux map through the Hα filter has been derivedfrom the R frame after the latter has been rescaledso as to match the continuum in the former. Wefollowed the same procedure, based on field stars,commonly employed to match Hα and its adjacentcontinuum (see Paper II for a description of thistechnique).
In Table 4 we show the values of W(Hα) of thedifferent star-forming regions in Mrk 370; we havelisted the values before and after applying the cor-rection for the contribution of the older stars, toprovide a direct estimation of the importance ofsuch contribution. We found the difference to besignificant in most cases.
4.2. Broad-band Photometry
4.2.1. The Starburst
The young starburst regions have been isolatedin each broad-band filter image. Using focas, webuilt a mask where the emission regions delimitedin the Hα frame have the constant value one andthe rest are set to zero. Each broad-band image isthen multiplied by this mask. Finally we performaperture photometry on these images, to derivemagnitudes and colors of each knot.
Table 5 shows the broad-band photometry ofthe sixteen knots detected in Mrk 370; the mea-surements have been corrected from Galactic ex-tinction using the data published by Burstein &Heiles (1984). The extinction coefficient in theother bands were related to the B value followingRieke & Lebofsky (1985).
In order to characterize the stellar populationof the individual regions, we compare their inte-grated properties with the predictions of evolu-tionary synthesis models. This task is especiallydifficult in this case, because at least three differ-ent contributors are producing the observed light:the young stars, the gaseous nebula surroundingthem, and the older stars underlying the ongoing
burst. Broad-band colors must be corrected fromthe contribution of these different factors beforethey can be compared with the model predictions.In order to derive the ”true” colors of the star-burst, we proceeded in the following way.
First, colors were corrected for interstellar red-dening, using the value of C(Hβ) derived from ourlong slit spectra. For those knots lacking spectro-scopic data, we used the C(Hβ) averaged over thewhole long-slit spectrum (which is probably ourbest possible guess).
Second, we have corrected for the contributionof emission lines. In gas rich objects, like BCDs,the presence of strong emission lines in the spec-tra can severely affect broad-band colors; the exactamount of the contribution of the lines to the fluxobserved in a given filter depends on the equivalentwidth of the line and on its precise location underthe filter transmission profile. We used our spec-troscopic information to compute the fraction offlux in the observed broad-band filters accountedfor by each emission line, by using the task cal-
cphot in the synphot package of STSDAS.
Last, we subtracted the emission of the under-lying population of stars. We assumed that thegalaxy is composed of the starburst regions delim-ited by the focas task, and of an underlying lowsurface brightness component, which is describedby an exponential function (see next section).
The integrated magnitude of a knot, in a givenband, λ, is given by:
mλ = −2.5 × log(
CSBλ + CD
λ
)
+ Kλ (4)
where CSBλ is the number of counts in the knot
coming from the starburst; CDλ is the contribu-
tion of the underlying disk within the knot region,and Kλ is the corresponding calibration constant(which incorporates exposure time, airmass, etc.).
CDλ is easily computed from the central surface
brightness and scale length of the best-fit expo-nential model, and subtracted out in the previousformula, yielding the corrected magnitude of eachknot:
mλ(SB) = −2.5 × log(
CSBλ
)
+ Kλ (5)
This process has been applied to the B, V , Rand I bands. The images in U were not deep
8
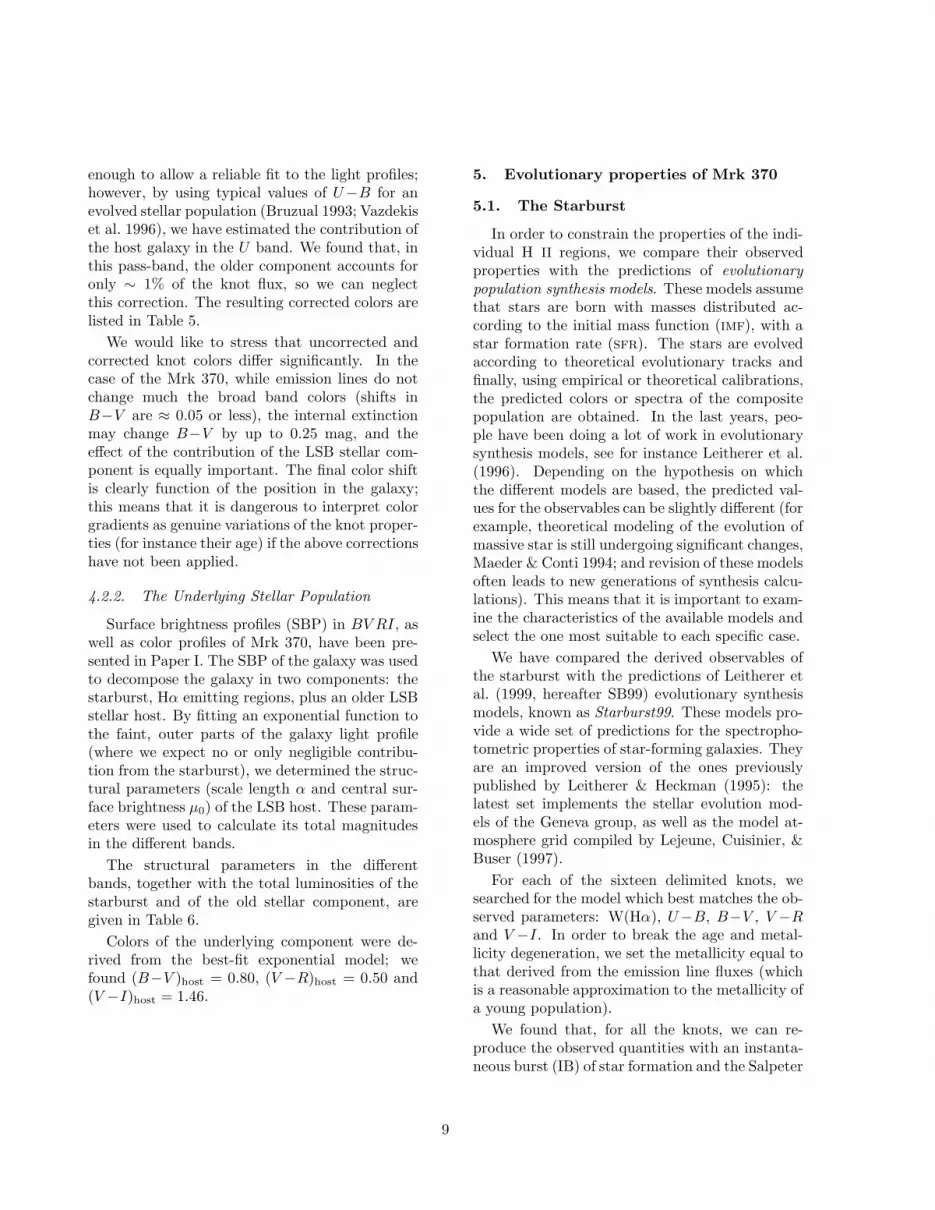
enough to allow a reliable fit to the light profiles;however, by using typical values of U−B for anevolved stellar population (Bruzual 1993; Vazdekiset al. 1996), we have estimated the contribution ofthe host galaxy in the U band. We found that, inthis pass-band, the older component accounts foronly ∼ 1% of the knot flux, so we can neglectthis correction. The resulting corrected colors arelisted in Table 5.
We would like to stress that uncorrected andcorrected knot colors differ significantly. In thecase of the Mrk 370, while emission lines do notchange much the broad band colors (shifts inB−V are ≈ 0.05 or less), the internal extinctionmay change B−V by up to 0.25 mag, and theeffect of the contribution of the LSB stellar com-ponent is equally important. The final color shiftis clearly function of the position in the galaxy;this means that it is dangerous to interpret colorgradients as genuine variations of the knot proper-ties (for instance their age) if the above correctionshave not been applied.
4.2.2. The Underlying Stellar Population
Surface brightness profiles (SBP) in BV RI, aswell as color profiles of Mrk 370, have been pre-sented in Paper I. The SBP of the galaxy was usedto decompose the galaxy in two components: thestarburst, Hα emitting regions, plus an older LSBstellar host. By fitting an exponential function tothe faint, outer parts of the galaxy light profile(where we expect no or only negligible contribu-tion from the starburst), we determined the struc-tural parameters (scale length α and central sur-face brightness µ0) of the LSB host. These param-eters were used to calculate its total magnitudesin the different bands.
The structural parameters in the differentbands, together with the total luminosities of thestarburst and of the old stellar component, aregiven in Table 6.
Colors of the underlying component were de-rived from the best-fit exponential model; wefound (B−V )host = 0.80, (V −R)host = 0.50 and(V −I)host = 1.46.
5. Evolutionary properties of Mrk 370
5.1. The Starburst
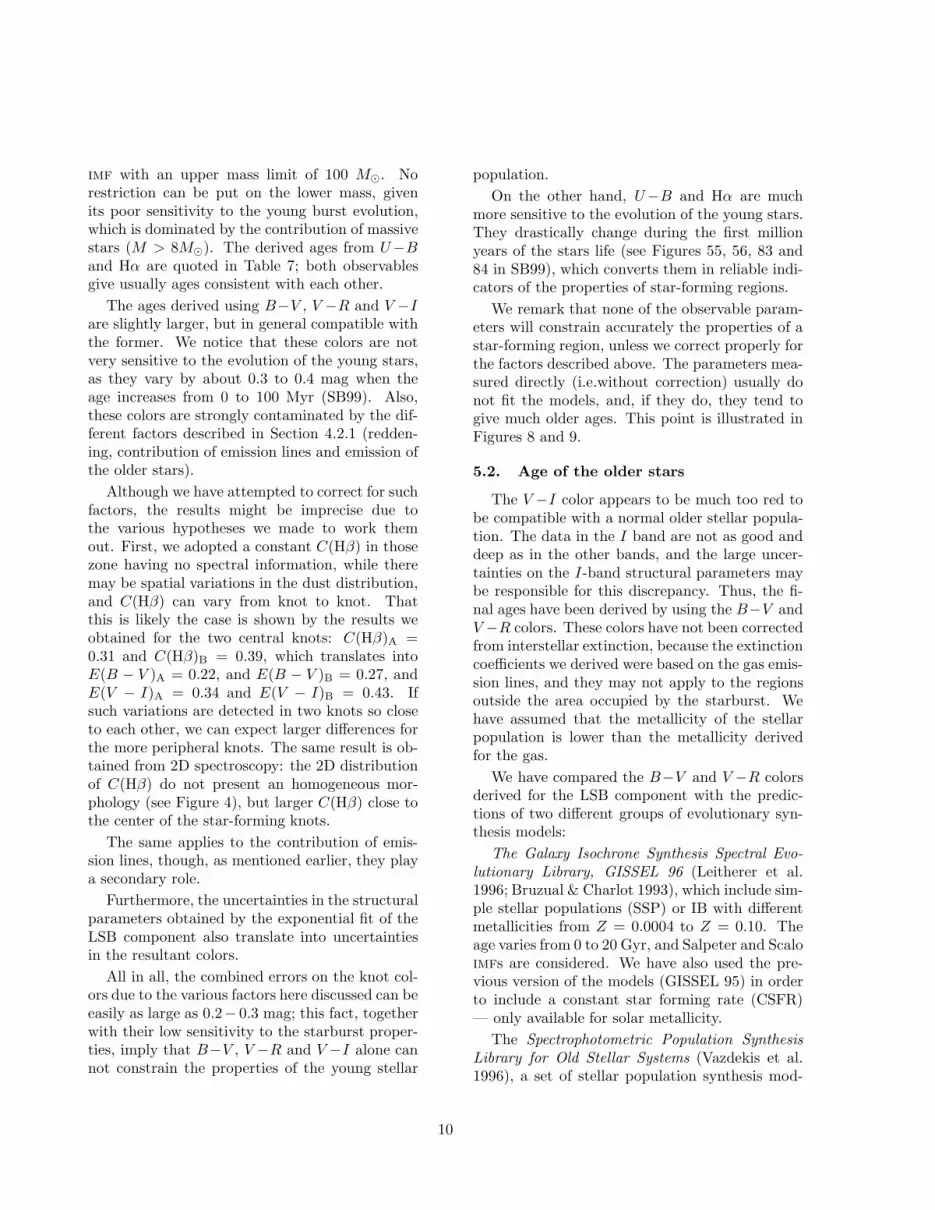
In order to constrain the properties of the indi-vidual H II regions, we compare their observedproperties with the predictions of evolutionarypopulation synthesis models. These models assumethat stars are born with masses distributed ac-cording to the initial mass function (imf), with astar formation rate (sfr). The stars are evolvedaccording to theoretical evolutionary tracks andfinally, using empirical or theoretical calibrations,the predicted colors or spectra of the compositepopulation are obtained. In the last years, peo-ple have been doing a lot of work in evolutionarysynthesis models, see for instance Leitherer et al.(1996). Depending on the hypothesis on whichthe different models are based, the predicted val-ues for the observables can be slightly different (forexample, theoretical modeling of the evolution ofmassive star is still undergoing significant changes,Maeder & Conti 1994; and revision of these modelsoften leads to new generations of synthesis calcu-lations). This means that it is important to exam-ine the characteristics of the available models andselect the one most suitable to each specific case.
We have compared the derived observables ofthe starburst with the predictions of Leitherer etal. (1999, hereafter SB99) evolutionary synthesismodels, known as Starburst99. These models pro-vide a wide set of predictions for the spectropho-tometric properties of star-forming galaxies. Theyare an improved version of the ones previouslypublished by Leitherer & Heckman (1995): thelatest set implements the stellar evolution mod-els of the Geneva group, as well as the model at-mosphere grid compiled by Lejeune, Cuisinier, &Buser (1997).
For each of the sixteen delimited knots, wesearched for the model which best matches the ob-served parameters: W(Hα), U−B, B−V , V −Rand V −I. In order to break the age and metal-licity degeneration, we set the metallicity equal tothat derived from the emission line fluxes (whichis a reasonable approximation to the metallicity ofa young population).
We found that, for all the knots, we can re-produce the observed quantities with an instanta-neous burst (IB) of star formation and the Salpeter
9
imf with an upper mass limit of 100 M⊙. Norestriction can be put on the lower mass, givenits poor sensitivity to the young burst evolution,which is dominated by the contribution of massivestars (M > 8M⊙). The derived ages from U−Band Hα are quoted in Table 7; both observablesgive usually ages consistent with each other.
The ages derived using B−V , V −R and V −Iare slightly larger, but in general compatible withthe former. We notice that these colors are notvery sensitive to the evolution of the young stars,as they vary by about 0.3 to 0.4 mag when theage increases from 0 to 100 Myr (SB99). Also,these colors are strongly contaminated by the dif-ferent factors described in Section 4.2.1 (redden-ing, contribution of emission lines and emission ofthe older stars).
Although we have attempted to correct for suchfactors, the results might be imprecise due tothe various hypotheses we made to work themout. First, we adopted a constant C(Hβ) in thosezone having no spectral information, while theremay be spatial variations in the dust distribution,and C(Hβ) can vary from knot to knot. Thatthis is likely the case is shown by the results weobtained for the two central knots: C(Hβ)A =0.31 and C(Hβ)B = 0.39, which translates intoE(B − V )A = 0.22, and E(B − V )B = 0.27, andE(V − I)A = 0.34 and E(V − I)B = 0.43. Ifsuch variations are detected in two knots so closeto each other, we can expect larger differences forthe more peripheral knots. The same result is ob-tained from 2D spectroscopy: the 2D distributionof C(Hβ) do not present an homogeneous mor-phology (see Figure 4), but larger C(Hβ) close tothe center of the star-forming knots.
The same applies to the contribution of emis-sion lines, though, as mentioned earlier, they playa secondary role.
Furthermore, the uncertainties in the structuralparameters obtained by the exponential fit of theLSB component also translate into uncertaintiesin the resultant colors.
All in all, the combined errors on the knot col-ors due to the various factors here discussed can beeasily as large as 0.2− 0.3 mag; this fact, togetherwith their low sensitivity to the starburst proper-ties, imply that B−V , V −R and V −I alone cannot constrain the properties of the young stellar
population.
On the other hand, U−B and Hα are muchmore sensitive to the evolution of the young stars.They drastically change during the first millionyears of the stars life (see Figures 55, 56, 83 and84 in SB99), which converts them in reliable indi-cators of the properties of star-forming regions.
We remark that none of the observable param-eters will constrain accurately the properties of astar-forming region, unless we correct properly forthe factors described above. The parameters mea-sured directly (i.e.without correction) usually donot fit the models, and, if they do, they tend togive much older ages. This point is illustrated inFigures 8 and 9.
5.2. Age of the older stars
The V −I color appears to be much too red tobe compatible with a normal older stellar popula-tion. The data in the I band are not as good anddeep as in the other bands, and the large uncer-tainties on the I-band structural parameters maybe responsible for this discrepancy. Thus, the fi-nal ages have been derived by using the B−V andV −R colors. These colors have not been correctedfrom interstellar extinction, because the extinctioncoefficients we derived were based on the gas emis-sion lines, and they may not apply to the regionsoutside the area occupied by the starburst. Wehave assumed that the metallicity of the stellarpopulation is lower than the metallicity derivedfor the gas.
We have compared the B−V and V −R colorsderived for the LSB component with the predic-tions of two different groups of evolutionary syn-thesis models:
The Galaxy Isochrone Synthesis Spectral Evo-lutionary Library, GISSEL 96 (Leitherer et al.1996; Bruzual & Charlot 1993), which include sim-ple stellar populations (SSP) or IB with differentmetallicities from Z = 0.0004 to Z = 0.10. Theage varies from 0 to 20 Gyr, and Salpeter and Scaloimfs are considered. We have also used the pre-vious version of the models (GISSEL 95) in orderto include a constant star forming rate (CSFR)— only available for solar metallicity.
The Spectrophotometric Population SynthesisLibrary for Old Stellar Systems (Vazdekis et al.1996), a set of stellar population synthesis mod-
10

els designed to study old stellar systems. Theysynthesize SSP or follow the galaxy through itsevolution from an initial gas cloud to the presenttime, assuming an analytical functional form forthe SFR (see Section 3.1 in Vazdekis et al. 1996),and including the chemical evolution. Two differ-ent imfs are considered: a unimodal imf, with apower law form whose slope is a free parameter,and a bimodal imf, equal to the unimodal imffor stars with masses above 0.6 M⊙, but with areduced influence of the stars with lower masses.
When comparing with the predictions of the IBapproximation, both models give ages of ∼ 5 Gyrfor the older stellar component of Mrk 370.
However, when changing the star forming his-tory, we obtained different results. the B−V andV −R colors could not be reproduced by GIS-SEL95 with a CSFR. Next, we applied Vazdekiset al. (1996) models, which include chemical evolu-tion. We considered Salpeter imf, and the differ-ent ν (ν is a constant fixing the timescale of starformation, see Sect 3.1 in Vazdekis et al. 1996),provided by the models. We found the followingresults: when ν = 1 the observed colors are incon-sistent with the predictions of the models; withν = 5 colors agree with ages between 9 and 11Gyr; and in the rest of the cases (ν = 10, 20 and50) colors are consistent with ages between 4 and7 Gyrs.
Optical colors are not very sensitive to the evo-lution of the older stars; for instance, B−V in-crease by ≈ 0.1 mag when ages varies from 5 to17 Gyr and the same applies to V −R. Such vari-ations are of the order of the uncertainties in ourmeasured colors. Although no firm constraintscould be put on the age of the underlying stel-lar population, the above comparison with mod-els point to a minimum age of 5 Gyrs; but it isclear that in order to better constrain the age ofthe LSB host, it is indispensable to include near-infrared colors in the analysis.
6. Discussion
It turns out from the above results that the kindof spectrophotometric study we have carried outis fundamental in order to disentangle the stellarpopulations in BCDs and derive their star forminghistories. However, as we have already pointedout in the introduction, most of the work carried
out so far has focused on statistical analysis ofBCDs samples, while only a few papers have beendevoted to examining in detail the characteristicof individual objects:
The two extremely compact and low-metallicityBCDs, SBS 0335-052 and Tololo 65, both classifiedas i0 (LT86), have been the subject of recent spec-trophotometric studies by Papaderos et al. (1998,1999). They found in both cases that the prop-erties of the underlying component are consistentwith those of a stellar population not older thanone Gyr.
Noeske et al. (2000) report on results from aspectrophotometric analysis of two iI,C (”CometaryBCDs”, LT86) Mrk 59 and Mrk 71. Spectral popu-lation synthesis models, in combination with colormagnitudes diagrams and color profiles, yield amost probable formation age of ≈ 2 Gyr for theold stars in both galaxies. Two other cometaryBCDs have been studied by Fricke et al. (2001)— Tololo 1214-277 — and Guseva et al. (2001) —SBS0940+544. In the latter case, no compellingevidences favor either a young or an old age.
Despite the fact that nE/iEs are the most com-mon type of BCD, there are very few studies, withthe same quality, of objects belonging to this class.Steel et al. (1996) and Mendez et al. (1999) haveperformed spectrophotometric observations of theiE BCDs Haro 3 and II Zw 33 respectively. Al-though in both cases an underlying component ofolder stars was detected, their data did not per-mit to determine its properties, and both stud-ies limited the analysis to the young starburst.The ages and star-forming scenarios they foundfor these two objects are consistent with our find-ings. They also found metallicities comparable tothe metallicity we have derived for Mrk 370. Morerecently, a comprehensive analysis of the iE BCDgalaxy Mrk 86 has been published by Gil de Pazet al. (2000) and Gil de Paz, Zamorano, & Gallego(2000). They studied the properties of 46 individ-ual star-forming knots as well as the underlyingpopulation of older stars. By applying evolution-ary synthesis models, they found that three welldefined stellar populations are present in Mrk 86:the star-forming regions, with ages between 5 and13 Myr, and no significant age or metallicity gra-dient, a central starburst with an intermediate ageof 30 Myr, and an underlying population of stars,with a surface brightness profile that can be de-
11

scribed by an exponential, with no color gradientsand an age between 5 and 13 Gyrs.
In all the above studies the star-forming knotspresent a similar range of ages, consistent with ourfindings for Mrk 370. However, the galaxies ap-pear to be different with respect to the propertiesof their underlying population of stars: while i0and cometary BCDs seem to be less evolved sys-tems, the structural properties and ages derivedfor the LSB of Mrk 370 are quite similar to thosepresented by the iE BCD Mrk 86. This fact mayimply that BCDs are objects which have in com-mon the presence of an active starburst, whichdominates their optical properties but, when thecharacteristics of the underlying stellar componentare taken into account, they form a more heteroge-neous class. This picture could naturally explainthe different evolutionary stages derived for thegalaxies.
We argue that considering BCD as a class mightbe then inappropriate. Therefore, looking for ab-solute unifying scenarios — for instance, trying tolink the whole BCD class with the different typesof dwarf galaxies (when only a fraction of themcould be actually connected) — may be specula-tive at this time.
On the other hand, Noeske et al. (2000) sug-gested that an evolutionary sequence might ex-ist connecting the different BCD subtypes, theiI,C galaxies being a possible link between the ex-tremely young galaxy candidates (iO class) andthe more evolved iE/nE BCDs.
The information available at the present timedoes not permit to discard any of these hypothesis.Comprehensive studies of larger samples of BCDsare required in order to find out which scenario isthe correct one.
Our kinematic results suggest ordered motionaround the north-south axis of Mrk 370, the kine-matic center being located close to the center ofthe external isophotes; this could imply that thegas is rotating coupled with the main body ofthe galaxy (the underlying population hosting thestarburst). However, we should take into accountthat, because of our limited spectral resolution,more complex gas motions could escape detec-tion. In fact, Ostlin et al. (1999, 2001), analyzinghigh-resolution (velocity sampling ≃ 5 km sec−1)Fabry-Perot observations of BCD galaxies, found
that, in general, the velocity fields of the studiedgalaxies are irregular and distorted. Spectroscopicobservations of Mrk 370 with high velocity resolu-tion are needed to better trace its gas kinematics.
Besides, Mrk 370 present some other puzzlingpeculiarities: the peak in the continuum map doesnot coincide with the kinematic center, nor withthe center of the outer isophotes, nor with one ofthe knots; and the position angle of the outer re-gions, seen in the R-band grey-scale map, differsby about 30 degrees from the position angle dis-played by the Hα map.
7. Summary and Conclusions
Broad- and narrow- band images of the BCDMrk 370, together with long-slit and two-dimensionalspectra, have been analyzed in order to derivethe properties of the different components of thegalaxy and to constrain its evolutionary status.Our results can be summarized as follow:
• Two different stellar components are clearlydistinguished in the galaxy: the present star-burst and an underlying older population.The current star formation activity takesplace in numerous knots, aligned in a north-east south-west direction. An extended LSBcomponent, with regular appearance, hoststhis star-forming area.
• The oxygen abundance derived from thespectra is Z ≃ Z⊙/2, a value relatively highfor the BCD class; the high blue continuum,the absorption wings in the Balmer lines andthe pronounced Balmer discontinuity in itsspectrum are clear indicators of the presenceof an evolved stellar population.
• The starburst region is resolved into smalland compact star-forming regions. We iden-tified a total of sixteen knots, and derivedtheir individual properties. The brightestknots have luminosities similar to those ofgiant H II regions in M33 and in the LMC.
The photometric parameters of the individ-ual star-forming knots were corrected fromthe contribution of emission lines, internalextinction and emission from the underlyingLSB component. The colors before and af-ter the corrections are significantly different.
12

In Mrk 370 the internal extinction and thecontribution of older stars are more impor-tant than emission lines in shifting the ob-served broad-band colors of the knots Thecolor shifts are function of the position ofthe knot in the galaxy, and we strongly cau-tion against interpreting observed color gra-dients as age gradients before applying suchcorrections.
We found that we can reproduce the colorsof all the knots with an IB of star forma-tion and the Salpeter initial mass function(imf) with an upper mass limit of 100 M⊙.The ages of the knots range between 3 and6 Myrs.
• The age of the underlying stellar populationhas been estimated by comparing its opticalcolors with two different groups of evolution-ary synthesis models. Colors are consistentwith ages larger than 5 Gyr.
• The inner, brightest star forming-regions,previously cataloged as double nucleus, arenormal H II regions. We would like tostress that the ”multiple nuclei” often seen inbroad-band images of BCD galaxies may bejust the superposition of off-center luminousH II regions. If Mrk 370 is not a double-nucleus galaxy, then there may be no com-pelling evidence that it has experienced re-cent interactions. Indeed, there are no othersigns of interactions; the regularity of thevelocity field, and the fact that the centralknots share the same kinematics of the mainbody point against a recent merger or in-teraction event. Also, Noeske et al. (2001)report that Mrk 370 is an isolated galaxy.
• We obtained the mean ionized gas velocityfield in the central part of the galaxy. Thevelocity field seems to be regular and sim-ilar to that of a rotating disk (west regionapproaching, east region receding).
All in all, spectrophotometric studies of BCDsare of paramount importance in order to derivetheir evolutionary status. These analyses must in-clude, in addition to the whole optical dataset,near-infrared photometry (NIR) — colors in theNIR better trace the properties of the older stellar
component — as well as deep optical spectropho-tometry of the host galaxy. Besides, high reso-lution spectroscopy of BCDs will help trace thekinematics of the galaxy and provide valuable in-formation on the mechanisms triggering the starformation.
Based on observations with the JKT, INT andWHT, operated on the island of La Palma by theRoyal Greenwich Observatory in the Spanish Ob-servatorio del Roque de los Muchachos of the In-stituto de Astrofısica de Canarias. Based also onobservations taken at the German-Spanish Astro-nomical Center, Calar Alto, Spain, operated bythe Max-Planck-Institut fur Astronomie (MPIA),Heidelberg, jointly with the spanish ”ComisionNacional de Astronomia”. We thank the staff ofboth observatories. This research has made use ofthe NASA/IPAC Extragalactic Database (NED),which is operated by the Jet Propulsion Labora-tory, Caltech, under contract with the NationalAeronautics and Space Administration.
We thank J. Iglesias-Paramo and J.N. Gonzalez-Perez for their help in the initial stages of thisproject. We thank A. Vazdekis, P. Papaderos andK. Noeske for valuable comments and discussions.We also acknowledge the anonymous referee forhis/her helpful comments which helped us im-prove this paper.
This work has been partially funded by thespanish “Ministerio de Ciencia y Tecnologia”(grants AYA2001-3939 and PB97-0158). L.M.Cairos acknowledges support by the EC grantHPMF-CT-2000-00774.
REFERENCES
Arribas, S., Carter, D., Cavaller, L., del Burgo,C., Edwards, R., Fuentes, F. J., Garcia, A. A.,Herreros, J. M., Jones, L. R., Mediavilla, E.,Pi, M., Pollacco, D., Rasilla, J. L., Rees, P. C.,Sosa, N. A., et al. 1998, Proc. SPIE, 3355, 821
Bingham, R. G., Gellatly, D. W., Jenkins, C. R.,& Worswick, S. P. 1994, Proc. SPIE, 2198, 56
Brocklehurst, M. 1971, MNRAS, 153, 471
Bruzual, A. G. 1993, Revista Mexicana de As-tronomia y Astrofisica, vol. 26, 26, 126
Bruzual, A. G. & Charlot, S. 1993, ApJ, 405, 538
13

Burstein, D. & Heiles, C. 1984, ApJS, 54, 33
Cairos, L. M. 2000, PhD Thesis
Cairos, L. M., Vılchez, J. M., Gonzalez-Perez,J. N., Iglesias-Paramo, J., & Caon, N. 2001a,ApJS, 133, 321 (= Paper I)
Cairos, L. M., Caon, N., Vılchez, J. M., Gonzalez-Perez, J. N., & Munoz-Tunon, C. 2001b, ApJS,136, 2 (= Paper II)
Cananzi, K., Augarde, R., & Lequeux, J. 1993,A&A, 101, 599
Coziol, R. 1996, A&A, 309, 345
Davies, J. I. & Phillipps, S. 1988, MNRAS, 233,553
Dıaz, A. I. 1988, MNRAS, 231, 57
Doublier, V., Comte, G., Petrosian, A., Surace,C., & Turatto, M. 1997, A&AS, 124, 405
Doublier, V., Caulet, A., & Comte, G. 1999,A&AS, 138, 213
Falco, E., Kurtz, M., Gellar, M., Huchra, J., Pe-ters, J., Berlind, P., Mink, D., Tokarz, S., &Elwell, B. 2000, The Updated Zwicky Catalog(UZC)
Fricke, K. J., Izotov, Y. I., Papaderos, P., Guseva,N. G., & Thuan, T. X. 2001, AJ, 121, 169
Fuentes-Masip, O., Munoz-Tunon, C., Castaneda,H. O., & Tenorio-Tagle, G. 2000, AJ, 120, 752
Garcıa-Lorenzo, B., Mediavilla, E., & Arribas, S.1999, ApJ, 518, 190
Gil de Paz, A., Zamorano, J., & Gallego, J. 2000,A&A, 361, 465
Gil de Paz, A., Zamorano, J., Gallego, J., &Domınguez, F. 2000, A&AS, 145, 377
Gerola, H., Seiden, P. E., & Schulman, L. S. 1980,BAAS, 12, 528
Guseva, N. G. et al. 2001, A&A, 378, 756
Kennicutt, R. C., Jr. 1988, ApJ, 334, 144
Kennicutt, R. C., Jr. 1991, in IAU Symp. 148, TheMagellanic Clouds, ed. R. Haynes, D. Milne(Dordrecht: Kluwer), 139
Kunth, D. & Ostlin, G. 2000, A&A Rev., 10, 1
Landolt, A. U. 1992, AJ, 104, 340
Leitherer, C. & Heckman, T. M. 1995, ApJS, 96,9
Leitherer, C. et al. 1996, PASP, 108, 996
Leitherer, C. et al. 1999, ApJS, 123, 3
Lejeune, T., Cuisinier, F., & Buser, R. 1997,A&AS, 125, 229
Loose, H. H. & Thuan, T. X. 1986, in Star FormingDwarf Galaxies and Related Objects, eds. D.Kunth, T. X. Thuan, J. T. T. Van (Gif-sur-Yvette: Editions Frontires), 73 (= LT86)
Maeder, A. & Conti, P. S. 1994, ARA&A, 32, 227
Maız-Apellaniz, J., Mas-Hesse, J. M., Munoz-Tunon, C., Vılchez, J. M., & Castaneda, H. O.1998, A&A, 329, 409
Marlowe, A. T., Meurer, G. R., Heckman, T. M.,& Schommer, R. 1997, ApJS, 112, 285
Marlowe, A. T., Meurer, G. R., & Heckman, T. M.1999, ApJ, 522, 183
Mazzarella, J. M. & Boroson, T. A. 1993, ApJS,85, 27
McCall, M. L., Rybski, P. M., & Shields, G. A.1985, ApJS, 57, 1
McGaugh, S. S. 1991, ApJ, 380, 140
Mediavilla, E., Arribas, S., del Burgo, C., Os-coz, A., Serra-Ricart, M., Alcalde, D., Falco,E. E., Goicoechea, L. J., Garcıa-Lorenzo, B., &Buitrago, J. 1998, ApJ, 503, L27.
Mendez, D. I., Cairos, L.M., Esteban, C., &Vılchez, J. 1999, AJ, 117, 1688
Mihalas, D. & Binney, J. 1981, Science, 214, 829
Noeske, K. G., Guseva, N. G., Fricke, K. J., Izo-tov, Y. I., Papaderos, P., & Thuan, T. X. 2000,A&A, 361, 33
Noeske, K. G., Iglesias-Paramo, J., Vilchez, J. M.,Papaderos, P., & Fricke, K. J. 2001, A&A, 371,806
14

Nordgren, T. E., Helou, G., Chengalur, J. N.,Terzian, Y., & Khachikian, E. 1995, ApJS, 99,461
Oke, J. B. 1990, AJ, 99, 1621
Olofsson, K. 1995, A&A, 111, 57
Ostlin, G. 1998, Ph.D. Thesis
Ostlin, G., Amram, P., Masegosa, J., Bergvall, N.,& Boulesteix, J. 1999, A&AS, 137, 419
Ostlin, G., Amram, P., Bergvall, N., Masegosa, J.,Boulesteix, J., & Marquez, I. 2001, A&A, 374,800
Pagel, B. E. J., Edmunds, M. G., Blackwell, D. E.,Chun, M. S., & Smith, G. 1979, MNRAS, 189,95
Papaderos, P., Loose, H.-H., Thuan, T. X., &Fricke, K. J. 1996a, A&AS, 120, 207
Papaderos, P., Loose, H.-H., Fricke, K. J., &Thuan, T. X. 1996b, A&A, 314, 59
Papaderos, P., Izotov, Y. I., Fricke, K. J., Thuan,T. X., & Guseva, N. G. 1998, A&A, 338, 43
Papaderos, P., Fricke, K. J., Thuan, T. X., Izotov,Y. I., & Nicklas, H. 1999, A&A, 352, L57
Rieke, G. H. & Lebofsky, M. J. 1985, ApJ, 288,618
Sargent, W. L. W. & Searle, L. 1970, ApJ, 162,L155
Skillman, E.D. & Kennicutt, R. C., Jr. 1993, ApJ,411, 655
Steel, S. J., Smith, N., Metcalfe, L., Rabbette, M.,& McBreen, B. 1996, A&A, 311, 721
Telles, J. E. 1995, Ph.D. Thesis
Thuan, T. X. & Martin, G. E. 1981, ApJ, 247, 823
Thuan, T. X. 1985, ApJ, 299, 881
Thuan, T. X. 1991, in Massive Stars in Star-burst. In: Leitherer C., Walborn N.R., Heck-man T.M., Norman C.A. (eds). Cambridge:Cambridge University Press, p. 183
Vazdekis, A., Casuso, E., Peletier, R. F., & Beck-man, J. E. 1996, ApJS, 106, 307
Whitford, A.E. 1958, AJ, 63, 201
This 2-column preprint was prepared with the AAS LATEXmacros v5.0.
15

Table 1
Basic data of Mrk 370
Galaxy Other designations R.A. (1950) Dec. MB D (Mpc) M1HI M1
T
Mrk 370 NGC 1036, 02h 37m 40s 19 05′ 01′′ −17.20 12.9 0.36×10⁹ 4.2 × 10⁹
UGC 02160
Note.—(1) Neutral hydrogen mass MHI and total mass MT in units of M⊙; both from Thuan and Martin(1981).
Table 2
Log of the observations
Date Telescope Instrument Filter/grism Exposure time (s)
Oct. 98 JKT 1.0m Cass. focus U 2400Oct. 98 JKT 1.0m Cass. focus B 1500Oct. 98 JKT 1.0m Cass. focus V 1000Oct. 98 JKT 1.0m Cass. focus R 800Oct. 98 JKT 1.0m Cass. focus I 1200Dec. 97 CAHA 2.2m CAFOS 6569 (113) 5400Dec. 97 CAHA 2.2m CAFOS 6462 ( 98) 5400Sep. 98 INT 2.5m IDS R300V 1800Aug. 99 WHT 4.2m INTEGRAL 600g/mm 3600
Note.— JKT = Jacobous Kapteyn Telescope, ORM (La Palma), Spain(detector: Tek 1024×1024, 0.′′33/pixel). CAHA = Centro Astronomico HispanoAleman, Almerıa, Spain (Site-1D 2048×2048, 0.′′53/pixel)/ INT = Isaac NewtonTelescope, ORM (La Palma), Spain (EEV10 4100 × 2048 13.5µ pixels). WHT= William Herschel Telescope, ORM (La Palma), Spain (Tex 1024× 1024 24µpixels).
16

Table 3
Reddening corrected line intensity ratios
Line Ion f(λ) A B S(A) Fλ −Wλ Fλ −Wλ Fλ −Wλ
3727 [O II] 0.26 2.74 ± 0.06 35.1 ± 0.9 3.22 ± 0.09 136 ± 10 2.68 ± 0.04 48 ± 13869 [Ne III] 0.23 0.50 ± 0.07 5.1 ± 0.8 1.1 ± 0.2 330 ± 166 0.49 ± 0.06 7 ± 14101 Hδ 0.18 0.28 ± 0.03 2.1 ± 0.4 0.24 ± 0.04 7 ± 1 0.26 ± 0.02 2.5 ± 0.34340 Hγ 0.14 0.45 ± 0.02 3.0 ± 0.2 0.50 ± 0.02 14.0 ± 0.8 0.49 ± 0.07 5 ± 14861 Hβ 0 1.00 ± 0.01 12.6 ± 0.1 1.00 ± 0.02 26.9 ± 0.8 1.00 ± 0.01 16.0 ± 0.34959 [O III] −0.02 0.53 ± 0.01 6.1 ± 0.2 0.60 ± 0.02 15.5 ± 0.6 0.52 ± 0.01 7.6 ± 0.15007 [O III] −0.03 1.60 ± 0.02 19.2 ± 0.2 1.93 ± 0.03 51.2 ± 0.6 1.63 ± 0.02 25.0 ± 0.25876 HeI −0.23 0.06 ± 0.01 0.8 ± 0.1 0.10 ± 0.01 3.5 ± 0.3 0.069 ± 0.006 1.3 ± 0.16548 [N II] −0.34 0.14 ± 0.01 2.5 ± 0.2 0.11 ± 0.01 4.2 ± 0.6 0.149 ± 0.008 3.4 ± 0.26563 Hα −0.34 2.85 ± 0.05 56.8 ± 0.6 2.93 ± 0.09 112 ± 2 2.86 ± 0.03 68.1 ± 0.76584 [N II] −0.34 0.50 ± 0.02 10.1 ± 0.5 0.49 ± 0.02 24 ± 2 0.476 ± 0.009 11.6 ± 0.36678 He I −0.35 0.04 ± 0.02 0.8 ± 0.4 0.06 ± 0.03 3 ± 1 0.030 ± 0.008 0.7 ± 0.26717 [S II] −0.36 0.50 ± 0.01 10.0 ± 0.2 0.45 ± 0.02 21.3 ± 0.9 0.471 ± 0.008 11.5 ± 0.26731 [S II] −0.36 0.38 ± 0.01 7.4 ± 0.3 0.34 ± 0.02 17 ± 2 0.365 ± 0.007 9.0 ± 0.27135 [Ar III] −0.41 0.11 ± 0.01 2.4 ± 0.4 0.10 ± 0.01 4.9 ± 0.8 0.093 ± 0.006 2.5 ± 0.2
C(Hβ) 0.31±0.02 0.39±0.03 0.285±0.004Wabs(A) 1.3 0.0 1.4F (Hβ) 2.67±0.0014 1.55±0.12 3.87 ± 0.06
Note.—Reddening-corrected line intensities (normalized to Hβ = 1) for the regions extracted from the long slitspectrum of Mrk 370. The integrated spectrum S is presented in the rightmost columns. Balmer lines are correctedfrom underlying stellar absorption. The reddening coefficient, C(Hβ), the value of the absorption correction, Wabs,and the measured Hβ flux, F (Hβ) (×10−14 erg cm−2 sec−1) are also included.
17

Table 4
Hα photometry of the individual knots in Mrk 370
Knot Flux(Hα) log L(Hα) log NLym log(MHII/M⊙) −W (Hα) −W (Hα)corr
1 5.70 38.05 49.92 3.13 201 3642 1.96 37.59 49.46 2.67 170 5343 5.08 38.00 49.87 3.08 138 2604 8.01 38.20 50.01 3.28 173 3295 4.13 37.91 49.78 2.99 45 716 0.68 37.13 49.00 2.20 94 · · ·
7 1.64 37.51 49.38 2.59 38 1168 37.30 38.87 50.74 3.95 58 639 7.29 38.16 50.03 3.24 81 119
10 4.56 37.96 49.82 3.03 114 57811 147.07 39.47 51.33 4.64 373 53312 232.17 39.66 51.53 4.96 192 22613 2.32 37.66 49.53 2.74 71 · · ·
14 33.31 38.82 50.69 3.90 237 57915 4.01 37.90 49.77 2.98 73 22316 5.39 38.03 49.90 3.11 220 656
Note.—The data are corrected from interstellar extinction and from [N II] emission. Theequivalent widths are shown before and after correction from the contribution of the underlyingstellar emission to the underlying continuum (except knots 6 and 13). Hα fluxes are in 10−15
erg cm−2 sec−1 units; Hα luminosities in erg sec−1 units. W (Hα) in Amstrongs
18

Table 5
Broad-band photometry of the individual knots detected in Mrk 370.
Knot B U − B B − V V − R V − I Bc (U − B)c (B − V )c (V − R)c (V − I)c
1 20.19 −0.57 0.39 0.25 0.88 19.67 −0.94 0.05 0.04 0.242 21.01 −0.56 0.33 0.38 1.01 20.70 −1.05 −0.14 0.23 0.263 20.15 −0.45 0.47 0.39 1.00 19.69 −0.88 0.12 0.21 0.474 19.88 −0.54 0.42 0.44 1.02 19.43 −0.97 0.05 0.30 0.475 19.28 −0.20 0.53 0.38 0.96 18.76 −0.57 0.24 0.17 0.456 21.82 −0.23 0.67 0.31 1.41 22.24 −1.54 0.14 −0.04 1.207 20.11 −0.09 0.60 0.41 1.07 19.88 −0.74 0.24 0.17 0.468 16.80 −0.42 0.28 0.29 0.66 16.04 −0.55 0.06 0.10 0.339 19.17 −0.20 0.50 0.40 0.94 18.56 −0.47 0.24 0.18 0.55
10 20.00 −0.24 0.57 0.47 1.13 19.73 −0.85 0.21 0.24 0.6611 17.46 −0.65 0.33 0.39 0.69 17.37 −0.79 0.19 0.28 0.4612 15.77 −0.45 0.31 0.33 0.66 14.80 −0.60 0.02 0.05 0.2113 20.13 −0.11 0.56 0.48 1.06 19.97 −0.84 0.12 0.10 0.4314 18.43 −0.56 0.35 0.41 0.82 17.90 −0.92 −0.01 0.14 0.1715 19.81 −0.45 0.42 0.41 1.25 19.61 −1.14 −0.15 0.26 0.7616 20.50 −0.48 0.32 0.47 0.84 20.21 −1.08 −0.28 0.45 −1.68
Note.—Columns 2 to 6: only the Galactic extinction correction has been applied; columns 7 to 11: valuescorrected from interstellar extinction, contribution of emission line and emission from the underlying host galaxy.
19

Table 6
Structural parameters characterizing the LSB host.
Band µ0 α MSB Mhost RSB/host
B 22.56 1.06 −16.69 −16.13 1.68V 21.74 1.05 −16.91 −16.93 0.98R 21.04 0.96 −17.32 −17.44 0.89I 20.57 1.14 −17.23 −18.28 0.38
Note.—Columns 2, 3: centrals surface brightness(mag arcsec−2) and scale-length (kpc); column 3, 4:absolute magnitude of the starburst and of the hostLSB in each band; column 5: the ratio of the lumi-nosity of the starburst over the luminosity of the un-derlying component. As mentioned in the text, theU -band image was too shallow to reach out the outer,starburst-free regions.
Table 7
Derived ages (in Myr) for the individual star-forming knots in Mrk 370
Knot AgeU−B AgeEW (Hα) Knot AgeU−B AgeEW (Hα)
1 3.2–4.8 4.8–5.1 9 5.6–6.4 5.9–6.32 3.1–3.8 4.6–4.8 10 4.5–5.0 4.6–4.83 3.5–5.0 5.0–5.5 11 4.6–5.1 4.6–4.84 3.2–4.7 4.8–5.2 12 5.1–5.9 5.1–5.75 5.1–6.0 6.4–7.0 13 4.5–5.1 —6 — 6.1–6.6 14 3.2–4.8 4.6–4.87 4.8–5.3 5.9–6.3 15 2.2–3.3 5.1–5.78 5.3–6.2 6.4–7.0 16 2.9–3.5 4.3–4.7
20

Fig. 1.— (left) Image of Mrk 370 through the Hαfilter, taken with the 2.2m telescope at CAHA.The spatial distribution of the fibers (SB2) on thefocal plane has been overlaid. (right) Fibers inthe central array. Numbers indicate the actualposition of the fibers at the slit.
Fig. 2.— Contour plot of the continuum sub-tracted Hα image of Mrk 370. The slit positionis indicated, and the two subregions selected inthe long-slit spectrum are marked a and b. Theindividual star-forming regions are labeled. Northis at the top and East is on the left.
Fig. 3.— Spectra of regions a and b, and the totalintegrated spectrum (region s).
21

Fig. 4.— [from left to right, top to bottom] (a) Mrk 370 continuum map obtained from the 2D spectroscopicdata by integrating the signal in the indicated spectral interval; (b) V filter image; (c) Intensity map of theHα emission line obtained by fitting a single gaussian to 2D spectroscopy data; (d) Hα filter image from the2.2m CAHA; (e) Two-dimensional distribution of [O III]/Hβ ratio; (f) Two-dimensional distribution of theextinction coefficient C(Hβ). A cross marks the optical nucleus in each map. The geometrical center of theouter isophotes is indicated by a star.
22

Fig. 5.— Velocity field of the ionized gas in thecentral region of Mrk 370, determined by averag-ing measurements from different emission lines. Ablack cross marks the optical nucleus. The kine-matic center is indicated by an X. The center ofthe outer isophotes is indicated by a black star.
Fig. 6.— Radial dependence of the systemic veloc-ity Vsys, amplitude of the velocity field projectionon the galactic plane Ω, and position angle of themajor kinematical axis δ. Error bars only reflectthe local rms in the measurements, and do notreflect the actual uncertainties, which are likelyaffected by systematic errors.
Ηα ΝΕΤ R BAND
Fig. 7.— left panel: Continuum-subtracted Hαgrey-scale map of Mrk 370; right panel: R-bandimage. North is at the top and East is on the left;axis units are arcsec.
(U-B)
EQ
W(H
)
α
Fig. 8.— Equivalent width of the Hα line ver-sus (U − B). We also plot the tracks of an in-stantaneous burst of z = 0.008, aged from 1 to30 Myr (Leitherer et al. 1999), for three imfs:solid line, α=2.35, Mup=100M⊙; dotted line:α=3.30, Mup=100M⊙; short-dash line, α=2.35,Mup=30M⊙. Triangles represent the observed(uncorrected) parameters of the individual knots;squares represent the knots parameters after ap-plying the corrections from reddening and fromthe contribution of emission lines and older stars.
23

(B-V)
(U -
B)
Fig. 9.— (U − B) versus (B − V ). The track ofan instantaneous burst of z = 0.008, aged from 1to 30 Myr (Leitherer et al. 1999), are also plot-ted, for three different imfs: solid line, α=2.35,Mup=100M⊙; dotted line: α=3.30, Mup=100M⊙;short-dash line, α=2.35, Mup=30M⊙. Symbolsare the same as in the previous figure
24

8. APPENDIX A
8.1. Atlas of Spectra
The nuclear spectrum of Mrk 370 derived fromthe INTEGRAL data is shown in figure 10, in thewhole wavelength range observed. We can easilyrecognize several emission lines. Here we only plotsome of selected emission as spectrum diagrams(figures 11 through 14). Spectrum diagrams rep-resent line profiles from individual spectra at eachpoint in the observed region and in a small spectralrange. The spectra at each location are normal-ized by the local peak so as to better display theprofile shape (lines nearer to the bright knots arebrighter than those farther out). Fig. 10.— Nuclear spectrum of Mrk 370, obtained
by averaging the 7 fibers closest to the continuummaximum (r < 1′′.2).
Fig. 11.— Spectra distribution diagrams of thecentral 16′′ × 12′′ of Mrk 370. Two-dimensionaldistribution of the Hβ lines (the absorption wingsare visible). The spectral range plotted is 4795–4950 A.
25

Fig. 12.— Two-dimensional distribution of[O III]λ4959+[O III]λ5007 (4950–5045 A).
Fig. 13.— Two-dimensional distribution ofHα+[N II]λλ6548, 6584 (6550–6640 A).
Fig. 14.— Two-dimensional distribution of[S II]λλ6716, 6731 (6720–6785) A).
26


