Embed Size (px)
Citation preview

G
C
S
Ma
b
a
ARRAA
KGXDXIa
1
ftapchtapzdCics
bgc5ii
0d
ARTICLE IN PRESS Model
ATTOD-7843; No. of Pages 9
Catalysis Today xxx (2012) xxx– xxx
Contents lists available at SciVerse ScienceDirect
Catalysis Today
jou rn al h om epage: www.elsev ier .com/ locate /ca t tod
pectroscopic characterization of gold supported on tungstated zirconia
. Kantchevaa,∗, M. Milanovaa, I. Avramovab, S. Mametsheripova
Department of Chemistry, Bilkent University, 06800 Bilkent, Ankara, TurkeyInstitute of General and Inorganic Chemistry, Bulgarian Academy of Sciences, Sofia 1113, Bulgaria
r t i c l e i n f o
rticle history:eceived 30 June 2011eceived in revised form 1 December 2011ccepted 12 February 2012vailable online xxx
a b s t r a c t
Gold catalysts supported on tungstated zirconia (containing 5–20 wt% WO3) are prepared by cationicadsorption from aqueous solution of [Au(en)2]Cl3 complex. The materials are characterized by XRD, DR-UV–vis spectroscopy and XPS. The nature of the deposited gold species is studied by FT-IR spectroscopyof adsorbed CO. It is concluded that the gold particles occupy preferentially the WOx-free zirconia surfaceand the dispersion of gold depends on the amount of coodinatively unsaturated (cus) Zr4+ ions. Modi-fication of zirconia by tungsten increases the gold uptake but at the same time causes decrease in the
eywords:old supported on tungstated zirconiaRDR-UV–vis spectroscopyPS
n situ FT-IR spectroscopy of adsorbed CO
concentration of (cus) Zr4+ ions thus lowering the dispersion of gold clusters. According to the results ofin situ FT-IR spectroscopy, the Au/WOx ZrO2 catalysts display higher activity in the CO oxidation in thelow-temperature range (up to 150 ◦C) than the WOx-free Au/ZrO2 sample. The low-temperature activ-ity of the W-containing catalysts could be associated with decreased basicity of the support oxide ionsresulting in reduced accumulation of stable carbonate species.
nd CO + O2
. Introduction
Supported gold catalysts are highly active in reactions importantor the environmental catalysis [1], in particular for low-emperature CO oxidation [1–9]. Crucial factors that control thectivity of gold catalysts are the metal particle size, the nature andarticle size of the oxide support, and the structure of Au-oxideontacts [1]. The practical application of gold catalysts, however, isindered because of their tendency for deactivation with the opera-ion time. The most probable reason for the decrease in the catalyticctivity is the formation of stable carbonate species which block theerimeter of gold–support interface considered as active reactionone [3–6]. The accumulation of COx species on the catalyst surfaceuring the course of CO oxidation takes place by readsorption ofO2 product molecules [5]. Since CO2 is an acidic molecule, lower-
ng of the basicity of the support surface by introduction of an acidicomponent would prevent the formation or reduce the amount oftable carbonate species.
Highly dispersed (2–5 nm) gold particles on oxide supports cane obtained by deposition–precipitation (DP) using HAuCl4 as aold precursor [1]. However, this method cannot be applied in thease of acidic oxide supports with a point of zero charge (PZC) below
Please cite this article in press as: M. Kantcheva, et al., Spectroscopic cha(2012), doi:10.1016/j.cattod.2012.02.027
such as silica or WO3 [1]. This is because the support surfaces negatively charged above the PZC which does not allow strongnteraction between the support and the anionic gold precursor
∗ Corresponding author.E-mail address: [email protected] (M. Kantcheva).
920-5861/$ – see front matter © 2012 Elsevier B.V. All rights reserved.oi:10.1016/j.cattod.2012.02.027
© 2012 Elsevier B.V. All rights reserved.
(AuCl4−). Cationic exchange is presumed to be an effective way ofintroducing gold into acidic oxides, e.g. SiO2-based supports [8–12].
Herein, we report the results of characterization of gold cata-lyst supported on tungstated zirconias. The Au/WOx ZrO2 sampleswere prepared by cationic adsorption using [Au(en)2]Cl3 as the pre-cursor (en = ethylenediamine). This method was developed first byGuillemot et al. [10] for the introduction of gold into Y zeolitesand used also by others [8,9,11] for deposition of gold on silica. Inorder to evaluate the potential of a new material as a catalyst inthe process of CO oxidation, it is important to investigate the inter-action of the reactants with the surface. For that purpose we usedin situ FT-IR spectroscopy to study the adsorption of CO and itscoadsorption with oxygen over Au-promoted and Au-free zirconiaand tungstated zirconias.
2. Experimental
2.1. Sample preparation
Two different procedures were used for preparation of hydratedzirconia. According to procedure 1, hydrated zirconia (denoted asHZ-1) was prepared by hydrolysis of 0.3 M solution of zirconylchloride (ZrOCl2·H2O, Aldrich) with concentrated (25%) ammoniasolution at pH 9. The slurry of the precipitated material was keptfor aging at room temperature for 12 h. Then the product was sepa-
racterization of gold supported on tungstated zirconia, Catal. Today
rated by vacuum filtration, redispersed in deionized water, washedthoroughly to remove the chloride ions and dried at 100 ◦C. Thecrystallographic structure of the material obtained after calcina-tion at 600 ◦C was predominantly monoclinic zirconia. Tungstated

ARTICLE IN PRESSG Model
CATTOD-7843; No. of Pages 9
2 M. Kantcheva et al. / Catalysis Today xxx (2012) xxx– xxx
Table 1Sample notation, BET surface areas, nominal tungsten and analytical gold contents.
Sample SBET (m2/g) WO3 (wt%) Wa (at/nm2) Au loading (wt%) Au loading (at %) Au particle size (nm)b
Au/ZrO2 143 – – 1.43 ± 0.03 0.30 8Au/5WZ-I 116 5.0 1.2 1.27 ± 0.01 0.27 8Au/12WZ-I 115 11.8 3.0 1.83 ± 0.01 0.40 9Au/20WZ-I 140 19.4 4.5 2.06 ± 0.03 0.44 10Au/18WZ-CP 118 18.0 4.8 2.27 ± 0.01 0.48 10
zcomozltd[ttcftlcr
attotepafCorzWTtswpdpaiwTz
2
tssT3p
a The W surface density is calculated based on the weight of zirconia.b According to XRD.
irconia was synthesized by coprecipitation [13] with nominalontent of 18 wt% WO3 and by impregnation of HZ-1 with aque-us solution of ammonium metatungstate (AMT, Fluka) using theethod proposed by Martinez et al. [14]. This procedure consisted
f impregnation of HZ-1 with aqueous solution (3 mL/g hydratedirconia) containing the required amount of AMT to obtain WO3oadings corresponding to 5, 12 and 20 wt%. The final calcina-ion temperature of all tungstated zirconias was 600 ◦C. Gold waseposited by cation adsorption for 2 h from aqueous solution ofAu(en)2]3+ complex (5.85 × 10⁻³ M) at pH = 9.6 and room tempera-ure. After the separation of the gold complex solution by filtration,he solid was washed by deionized water until negative test forhloride ions. The samples were dried at 80 ◦C for 48 h and calcinedor 1 h at 400 ◦C. The cationic gold precursor was prepared followinghe procedure of Block and Bailar [15]. The obtained materials wereabeled as Au/xWZ-CP or I, where x stands for the WO3 nominalontent in wt%. CP and I denote co-precipitation and impregnation,espectively (see Table 1).
In order to study the effect of tungsten, gold was depositedlso on zirconia by cation adsorption of [Au(en)2]3+ complex usinghe same conditions applied to the W-containing samples. Sincehe incorporation of WOx species stabilizes the tetragonal phasef zirconia [14,16–22], WOx-free tetragonal zirconia was used forhe preparation of ZrO2-supported gold sample. The goal was toliminate the effect of crystal phase on the interaction of goldrecursor with the support because there are differences in thecid–base properties [23], and types and concentration of the sur-ace hydroxyl groups [24] of zirconia polymorphs. In addition, theO adsorption capacity of monoclinic zirconia is larger than thatf the tetragonal phase [23] which may affect the CO + O2 surfaceeaction. Li et al. [25] have found that Au supported on monoclinicirconia exhibited much higher activity in the low-temperature
GS reaction than the catalyst supported on tetragonal zirconia.etragonal phase of zirconia was prepared by a method similar tohat described by Jung and Bell [24] denoted as procedure 2. Theynthesis consisted of hydrolysis of 0.6 M solution of ZrO2Cl2·8H2Oith concentrated ammonia solution (25%) at pH = 9 and room tem-erature. The obtained precipitate was washed several times witheionized water until negative test for Cl− ions. Then the washedrecipitate was aged in aqueous solution of ammonia (with pH = 9)t 100 ◦C for 48 h under reflux and periodical supplement of NH3(aq)n order to keep constant pH of 9. The resultant hydrated zirconia
as dried at 100 ◦C for 24 h. The material was denoted as HZ-2.etragonal zirconia was obtained by calcination of the hydratedirconia HZ-2 at 600 ◦C for 6 h.
.2. Sample characterization
XRD analysis was performed on a Rigaku Miniflex diffractome-er with Ni-filtered Cu K� radiation (� = 1.5405 A). The DR-UV–Vispectra were obtained under ambient conditions with a fiber optic
Please cite this article in press as: M. Kantcheva, et al., Spectroscopic cha(2012), doi:10.1016/j.cattod.2012.02.027
pectrometer AvaSpec-2048 (Avantes) using WS-2 as a reference.he BET surface area measurements were performed with a TriStar000 automated gas adsorption analyzer (Micrometrics). The sam-les were dehydrated under vacuum (10−2 Torr) for 3 h at 250 ◦C
before the measurements in order to remove adsorbed water andvolatile compounds.
The content of gold was determined by ICP-MS analysis. Thetungsten content in the samples was calculated as differencebetween the nominal content in the solid and the concentrationof tungsten in the filtrate produced during the deposition of goldfrom the gold precursor. The tungsten content in the filtrate wasdetermined spectrophotometrically by the thiocyanate method at� = 410 nm [20,26,27].
The X-ray photoelectron spectra were obtained using un-monochromatized Al K� (1486.6 eV) radiation in a VG ESCALABMK II electron spectrometer under base pressure of 1 × 10⁻⁸ Pa.The spectrometer resolution was calculated from the Ag 3d5/2 linewith the analyzer transmission energy of 20 eV. The half-width ofthis line was 1 eV. The spectrometer was calibrated against the Au4f7/2 line (84.0 eV) and the sample charging was estimated fromC 1s (285 eV) spectra from natural hydrocarbon contaminationson the surface. The accuracy of the BE measured was 0.2 eV. Thephotoelectron spectra of C 1s, O 1s, Zr 3d, W 4f and Au 4f wererecorded and corrected by subtracting a Shirley-type backgroundand quantified using the peak area and Scofield’s photoionizationcross-sections. The Au particle size was obtained from the XPS peakintensity treated according to the Kerkhof–Moulijn model [28,29].
The FT-IR spectra were recorded using a Bomem Hartman &Braun MB-102 model FT-IR spectrometer with a liquid-nitrogencooled MCT detector at a resolution of 4 cm−1 (100 scans). Theself-supporting discs (∼0.01 g/cm2) were activated in the IR cellby heating for 1 h in a vacuum at 400 ◦C, and in oxygen (100 Torr,passed through a trap cooled in liquid nitrogen) at the same tem-perature, followed by evacuation for 1 h at 400 ◦C. The spectra ofadsorbed gases were obtained by subtracting the spectra of theactivated sample from the spectra recorded. The sample spectrawere also gas-phase corrected.
3. Results and discussion
3.1. Structural characterization
According to the XRD data (Fig. 1) all of the samples stud-ied (except Au/5WZ-I) have the structure of tetragonal zirconia(ICDD Cart No. 04-005-4479). The Au/5WZ-I sample contains smallamount of monoclinic zirconia (ICDD Cart No. 00-013-030).
With increase in the tungsten loading, the analytical content ofgold increases (Table 1). It is well known that tungstated zirconiacontains acidic protons and their amount increases with the sur-face density of the WOx species [13,16–20,30]. It is reasonable topropose that as higher the concentration of acidic hydroxyls onthe support surface as larger the amount of deprotonated M O−
surface sites (M = W and Zr) thus leading to greater number ofanchoring sites for the [Au(en)2]3+ complex resulting in higher
racterization of gold supported on tungstated zirconia, Catal. Today
surface concentration of gold. The average size of gold particles,calculated by using Scherrer equation and the main gold diffrac-tion line of 2� = 38.2◦ (ICDD Cart No. 00-004-0784), increases withthe W content (Table 1).

ARTICLE ING Model
CATTOD-7843; No. of Pages 9
M. Kantcheva et al. / Catalysis T
sAaa
3
Tocsi(opTasbttgCd
3
iwlh
Fig. 1. XRD patterns of the samples studied (t: tetragonal; m: monoclinic).
The basic medium used for the [Au(en)2]3+ adsorption causedome leaching of WOx species only in the case of Au/12WZ-I andu/20WZ-I samples. After the deposition of gold, the tungsten lossmounts to 0.20 ± 0.05 and 0.61 ± 0.02 wt% of WO3 for Au/12WZ-Ind Au/20WZ-I, respectively.
.2. DR-UV–vis spectra
Fig. 2 compares the optical spectra of the samples studied.he absorption band at 293–270 nm with a shoulder at 260 nmbserved in the spectra of the Au-free samples (Fig. 2, spectra (a))orresponds to LMCT (O2− → W6+) transition in oligomeric WOx
pecies with different degree of polymerization [14,17–21]. Thentroduction of gold causes drastic change in the optical spectraFig. 2, spectra (b)). The broad absorption with maximum at 550 nmbserved on the gold-containing samples is characteristic of thelasmonic oscillation mode of nanosized gold particles [11,31,32].he strong band at 270–293 nm has disappeared and weak signalst 225–230 and 260–275 nm are observed instead. Based on thepectrum of Au/ZrO2 sample (Fig. 2A, spectrum (c)), the formerand is attributed to the O2− → Zr4+ CT transition. The spectra ofhe Au-containing samples indicate that gold hinders the detec-ion of LMCT transitions. Due to the high absorption coefficient ofold particles [33], the support cannot interact with the radiation.onsequently, the fundamental bands of tungstated zirconia areetected with significantly lower intensities.
.3. XPS analysis
The results of XPS analysis for all samples are summarized
Please cite this article in press as: M. Kantcheva, et al., Spectroscopic cha(2012), doi:10.1016/j.cattod.2012.02.027
n Table 2. Binding energy of Au 4f7/2 is around 82.8–83.5 eVhich, in agreement with the literature data on Au/ZrO2 cata-
ysts [7,25,34–36], is assigned to metallic gold. The full width atalf maximum (FWHM) of Au 4f photoelectron line decreases with
PRESSoday xxx (2012) xxx– xxx 3
increasing the WO3 content. This is a sign of more uniform distribu-tion of Au particles on the W-modified sample surfaces most likelydue to the increased gold uptake. The reason for the formation ofmetallic gold without additional reduction step is the low thermalstability of the [Au(en)2]3+ precursor complex when adsorbed onoxide surfaces [10,11,37]. The initial color of the samples was lightyellow, however, during the drying at 80 ◦C the samples becamegray-black. The change in the color was faster for the sampleswith higher W content, which suggests that tungsten assists in thedecomposition of gold precursor complex.
Since the XRD data provide information about the size of largegold clusters (larger than 5 nm [38]), the size of the gold particleswas estimated by XPS intensity ratios using the model proposed byKerkhof and Moulijn [28]. This model is based on the metal loadingand specific surface area of the catalysts and is useful for the char-acterization of very small metal particles [38]. The average particlesize calculated from XPS for all gold containing samples is around3 nm. These results indicate that large (8–10 nm) and small (∼3 nm)gold particles are present on the surfaces of the samples preparedby cationic adsorption of the [Au(en)2]3+ precursor.
The spectra of the samples in the W 4f region contain intensedoublet with W 4f7/2 line at 35.1–36.3 eV corresponding to W6+
[22,30]. The Zr 3d photoelectron line for all Au catalysts exhibitspeak for Zr 3d5/2 at 182.0–182.9 eV, close to that observed for Zr4+
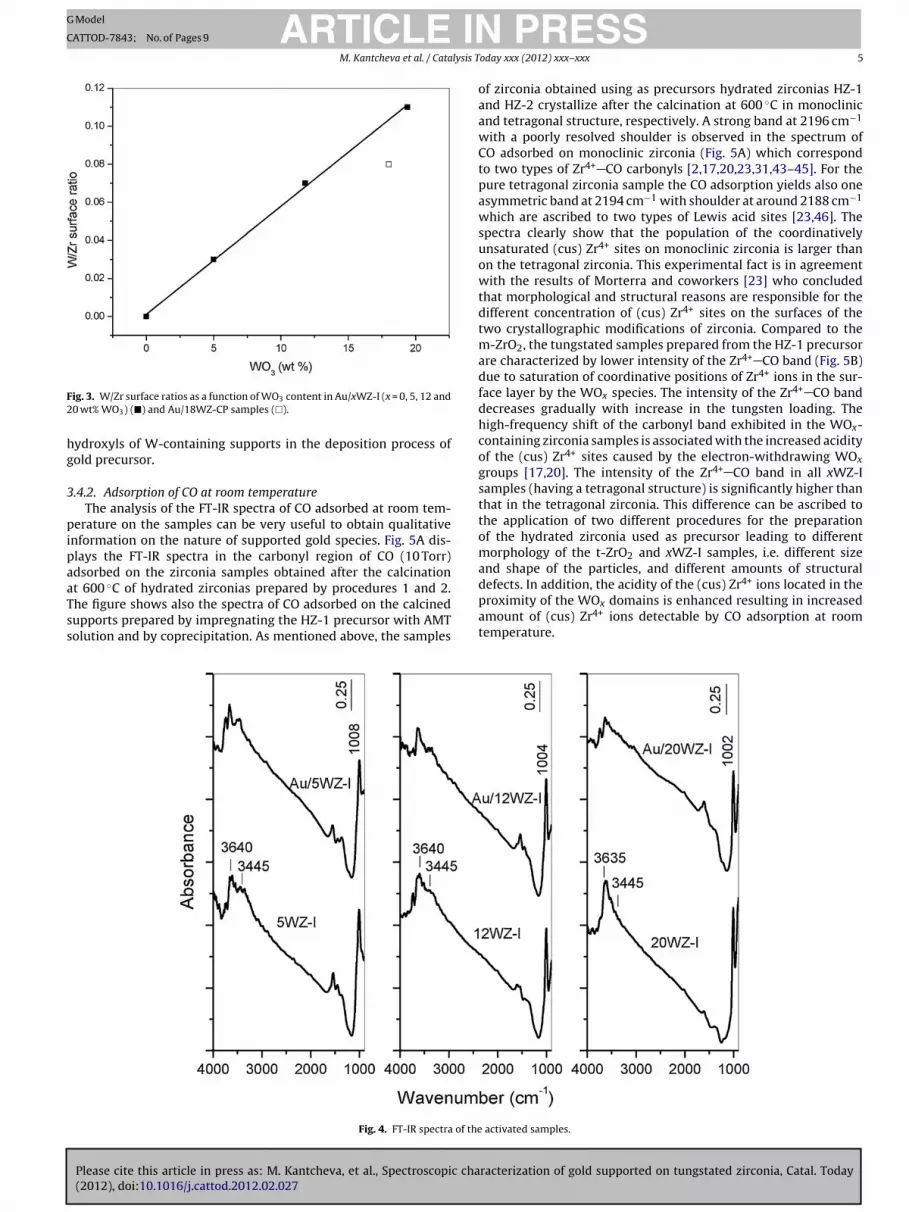
ions [25,30,34,36,39–41]. Fig. 3 shows that the W/Zr surface ratiosfor the gold catalysts supported on tungstated zirconia prepared byimpregnation increases linearly as a function of the tungsten con-tent. This suggests that the dispersion of the WOx species on thesurface of the gold catalysts is uniform [19,22]. For the Au/WZ-CPsample the calculated W/Zr surface atomic ratio deviates from theestablished linear dependence. It has been shown that all tungstenis located on the surface when tungstated zirconia was preparedby impregnation whereas using co-precipitation results in incor-poration of W atoms into ZrO2 lattice, stabilizing the tetragonalstructure [16,30].
In the O 1s XPS region an intensive peak at ∼530.4 eV is observedfor all investigated catalysts. Small asymmetry at higher bindingenergy side is detected too. This second peak can be related to theexistence of O− ions [42]. This suggests the presence in the subsur-face of oxygen ions that bear lower electron density than the “O2−”ions; formally these oxide ions could be described as “O−” species.They could be associated with sites having higher covalence of theM O bonds and smaller coordination number of oxygen ions thana regular site. A reasonable hypothesis is to consider the existence,in variable proportions, of defects in the subsurface.
The results in Table 2 show that the method of introduction ofWOx species to zirconia (coprecipitation versus impregnation) doesnot affect the surface concentration of gold. However, in agree-ment with the chemical analysis, the amount of gold on the surfaceincreases with the WO3 loading.
3.4. In situ FT-IR spectroscopy
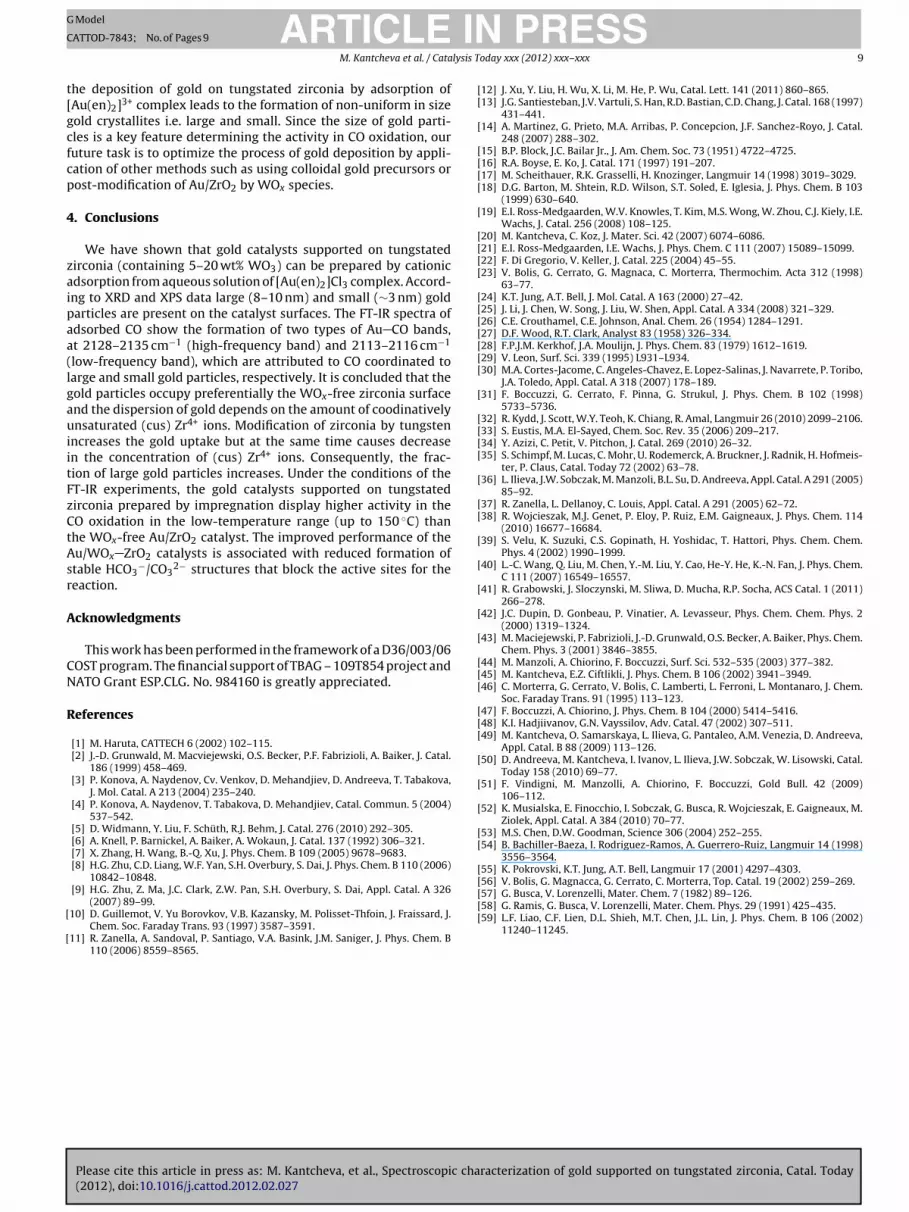
3.4.1. FT-IR spectra of the activated samplesFig. 4 compares the spectra of the activated Au-free and Au-
containing xWZ-I samples. In the OH stretching region all samplesof tungstated zirconia contain a band at 3640–3635 cm−1 which isattributed to W OH groups [20]. The broad absorption at approx-imately 3445 cm−1 indicates the presence of H-bonded hydroxyls.The spectra in the fundamental W O stretching region show asharp band at 1008–1002 cm−1 typical of W O species [17,19–21].
racterization of gold supported on tungstated zirconia, Catal. Today
The deposition of gold does not cause perturbation of the W Oband. However, compared to the xWZ-I supports, all Au-containingsamples display bands in the OH stretching region with lowerintensities. This is associated with the involvement of the surface

Please cite this article in press as: M. Kantcheva, et al., Spectroscopic characterization of gold supported on tungstated zirconia, Catal. Today(2012), doi:10.1016/j.cattod.2012.02.027
ARTICLE IN PRESSG Model
CATTOD-7843; No. of Pages 9
4 M. Kantcheva et al. / Catalysis Today xxx (2012) xxx– xxx
Fig. 2. (Panel A) Optical spectra of 18WZ-CP (a), Au/18WZ-CP (b) and Au/ZrO2 (c). (Panel B) Optical spectra of 20WZ-I (a) and Au/20WZ-I (b). (Panel C) Optical spectra of12WZ-I (a) and Au/12WZ-I (b). (Panel D) Optical spectra of 5WZ-I (a) and Au/5WZ-I (b).
Table 2Binding energies, surface composition and gold particle size for the samples.
Sample O 1s Zr 3d5/2 W 4f7/2 Au 4f7/2 Au particle size (nm)
BE (eV) at% BE (eV) at% BE (eV) at% BE (eV) at% FWHMa
Au/ZrO2 530.2 65.2 182.5 34.6 – – 82.8 0.2 2.03 2.6Au/5WZ-I 530.0 63.3 182.1 35.3 35.1 1.2 82.8 0.2 1.87 2.9Au/12WZ-I 530.5 63.5 182.6 33.9 35.8 2.3 83.0 0.3 1.88 2.8Au/20WZ-I 530.6 63.0 182.6 33.0 35.9 3.7 83.4 0.3 1.71 3.1Au/18WZ-CP 530.4 64.7 182.9 32.4 36.3 2.6 83.5 0.3 1.68 3.3
a FWHM for the Au 4f7/2 of metallic gold is 1.18 eV.
ARTICLE ING Model
CATTOD-7843; No. of Pages 9
M. Kantcheva et al. / Catalysis T
F2
hg
3
pipaaTss
ig. 3. W/Zr surface ratios as a function of WO3 content in Au/xWZ-I (x = 0, 5, 12 and0 wt% WO3) (�) and Au/18WZ-CP samples (�).
ydroxyls of W-containing supports in the deposition process ofold precursor.
.4.2. Adsorption of CO at room temperatureThe analysis of the FT-IR spectra of CO adsorbed at room tem-
erature on the samples can be very useful to obtain qualitativenformation on the nature of supported gold species. Fig. 5A dis-lays the FT-IR spectra in the carbonyl region of CO (10 Torr)dsorbed on the zirconia samples obtained after the calcination
Please cite this article in press as: M. Kantcheva, et al., Spectroscopic cha(2012), doi:10.1016/j.cattod.2012.02.027
t 600 ◦C of hydrated zirconias prepared by procedures 1 and 2.he figure shows also the spectra of CO adsorbed on the calcinedupports prepared by impregnating the HZ-1 precursor with AMTolution and by coprecipitation. As mentioned above, the samples
Fig. 4. FT-IR spectra of the
PRESSoday xxx (2012) xxx– xxx 5
of zirconia obtained using as precursors hydrated zirconias HZ-1and HZ-2 crystallize after the calcination at 600 ◦C in monoclinicand tetragonal structure, respectively. A strong band at 2196 cm−1
with a poorly resolved shoulder is observed in the spectrum ofCO adsorbed on monoclinic zirconia (Fig. 5A) which correspondto two types of Zr4+ CO carbonyls [2,17,20,23,31,43–45]. For thepure tetragonal zirconia sample the CO adsorption yields also oneasymmetric band at 2194 cm−1 with shoulder at around 2188 cm−1
which are ascribed to two types of Lewis acid sites [23,46]. Thespectra clearly show that the population of the coordinativelyunsaturated (cus) Zr4+ sites on monoclinic zirconia is larger thanon the tetragonal zirconia. This experimental fact is in agreementwith the results of Morterra and coworkers [23] who concludedthat morphological and structural reasons are responsible for thedifferent concentration of (cus) Zr4+ sites on the surfaces of thetwo crystallographic modifications of zirconia. Compared to them-ZrO2, the tungstated samples prepared from the HZ-1 precursorare characterized by lower intensity of the Zr4+ CO band (Fig. 5B)due to saturation of coordinative positions of Zr4+ ions in the sur-face layer by the WOx species. The intensity of the Zr4+ CO banddecreases gradually with increase in the tungsten loading. Thehigh-frequency shift of the carbonyl band exhibited in the WOx-containing zirconia samples is associated with the increased acidityof the (cus) Zr4+ sites caused by the electron-withdrawing WOx
groups [17,20]. The intensity of the Zr4+ CO band in all xWZ-Isamples (having a tetragonal structure) is significantly higher thanthat in the tetragonal zirconia. This difference can be ascribed tothe application of two different procedures for the preparationof the hydrated zirconia used as precursor leading to differentmorphology of the t-ZrO2 and xWZ-I samples, i.e. different sizeand shape of the particles, and different amounts of structural
racterization of gold supported on tungstated zirconia, Catal. Today
defects. In addition, the acidity of the (cus) Zr4+ ions located in theproximity of the WOx domains is enhanced resulting in increasedamount of (cus) Zr4+ ions detectable by CO adsorption at roomtemperature.
activated samples.

ARTICLE IN PRESSG Model
CATTOD-7843; No. of Pages 9
6 M. Kantcheva et al. / Catalysis Today xxx (2012) xxx– xxx
peratu
2tZdgtoctCtsttbcetiRtdlaTsl(alsd
aHgi
same time causes decrease in the concentration of (cus) Zr ions.The decrease in the amount of nucleation sites for gold particleswith increase in the W loading lowers the dispersion.
Table 3Integrated areas of the gold carbonyl bands recorded at room temperature andPCO = 10 Torr (see Fig. 5).
Sample HF banda (cm−1) IHF (a.u.) LF bandb (cm−1) ILF (a.u.) IHF/ILF
Au/ZrO2 2128 0.78 2113 0.97 0.80Au/5WZ-I 2132 1.28 2115 1.35 0.95Au/12WZ-I 2136 1.79 2116 1.38 1.30
Fig. 5. FT-IR spectra of CO (10 Torr) adsorbed at room tem
As with the Au-free materials, the absorption at195–2198 cm−1 observed for all Au-promoted samples is assignedo CO adsorbed on Zr4+ surface sites (Fig. 5C). The intensity of ther4+ CO band in the W-containing samples decreases after theeposition of gold (compare with Fig. 5B) indicating that there areold nanoparticles located on the zirconia surface. Lower concen-ration of the (cus) Zr4+ ions has been detected also on the surfacef Au/ZrO2 sample as compared with the Au-free tetragonal zir-onia. According to data from the literature [2,10,31,43,44,47–51],he absorption with maximum at 2113–2116 cm−1 is assigned toO adsorbed on small three-dimensional gold clusters, whereashe shoulder at 2128–2135 cm−1 is usually attributed to Auı+ COpecies. Formation of positively polarized gold on ZrO2 is assumedo be caused by the presence of adsorbed oxygen on the gold par-icles or their interaction with the support [2,31,43,47]. It shoulde noted that the last activation step of the investigated samplesonsisted of evacuation at 400 ◦C and adsorbed oxygen cannot bexpected under these conditions. Moreover, after the reduction ofhe samples at 400 ◦C with CO, the absorption at 2128–2135 cm−1
s still present in the spectra of CO adsorbed at room temperature.ecently, absorption band at 2130–2140 cm−1 observed duringhe CO adsorption on Au/Nb2O5 has been attributed to CO coor-inated to larger gold nanoparticles [52]. Therefore, based on the
atter interpretation the feature at 2128–2135 cm−1 (Fig. 5C) isssigned tentatively to CO coordinated to larger gold nanoparticles.his proposition is supported by the estimates of gold particleizes from XRD and XPS data showing that the samples have ateast two fractions of crystallites, large (∼8–10 nm) and small∼3 nm). For convenience, the absorptions at 2128–2135 cm−1
nd 2113–2116 cm−1 are denoted as high-frequency (HF) andow-frequency (LF) gold carbonyls, respectively. The bands corre-ponding to the Zr4+ CO and Au CO species are removed uponynamic evacuation at room temperature.
According to the chemical analysis the Au loading on Au/ZrO2
Please cite this article in press as: M. Kantcheva, et al., Spectroscopic cha(2012), doi:10.1016/j.cattod.2012.02.027
nd Au/5WZ-I samples is very close, 1.43 and 1.27 wt%, respectively.owever, the intensities of the bands due to CO adsorbed on theold sites are higher for the W-containing sample (Fig. 5C) suggest-ng higher gold dispersion. Using the same arguments (Au loading
re on the samples studied (t: tetragonal; m: monoclinic).
and intensities of the Au carbonyl bands), better gold dispersion canbe deduced for the Au/20WZ-I (2.06 wt% Au) when compared withthe Au/18WZ-CP sample (2.27 wt% Au). The spectra of CO adsorbedon the Au-free supports show that the amount of (cus) Zr4+ ions ishigher on the 5WZ-I sample than on t-ZrO2. Likewise, the surfaceconcentration of (cus) Zr4+ ions on the 20WZ-I sample is higher thanthat on the 18WZ-CP sample. It can be proposed that the dispersionof gold depends on the amount of (cus) Zr4+ ions. This assumptioncan be supported by the results of Chen and Goodman [53] whoshowed by using HREELS and CO adsorption that Au bonds directlyto coordinatively unsaturated Ti atom on TiO2 (1 1 0).
For the Au/xWZ-I sample series, the increase in the intensities ofAu carbonyl bands with the amount of tungsten is associated withthe increase in the Au loading. According to the results of curvefitting of the gold carbonyl bands (Table 3), the fraction of largergold particles giving rise to the HF carbonyl band increases withthe W loading by larger extent than the fraction of the smaller goldparticles characterized by the LF carbonyl band. This experimentalfact could be explained by the assumption that in the case of W-containing samples the gold particles formed during the calcinationoccupy preferentially the WOx-free zirconia surface. The modifica-tion of zirconia by tungsten facilitates the gold uptake but at the
4+
racterization of gold supported on tungstated zirconia, Catal. Today
Au/20WZ-I 2136 2.66 2116 1.53 1.74Au/18WZ-CP 2134 0.84 2115 0.73 1.15
a HF band corresponds to CO adsorbed on large Au particles.b LF band corresponds to CO adsorbed on small gold particles.

ARTICLE IN PRESSG Model
CATTOD-7843; No. of Pages 9
M. Kantcheva et al. / Catalysis Today xxx (2012) xxx– xxx 7
F ) and At -I sam
3A
l
TA
ig. 6. FT-IR spectra collected during the exposure of the samples Au/ZrO2 (Panel Aemperatures. (Panels B and D) Gas phase spectra above the Au/ZrO2 and Au/12WZ
Please cite this article in press as: M. Kantcheva, et al., Spectroscopic cha(2012), doi:10.1016/j.cattod.2012.02.027
.4.3. FT-IR spectroscopic investigation of CO oxidation overu/xWZ-I samples
In order to evaluate the potential of a new material as a cata-yst, we studied by FT-IR spectroscopy the CO oxidation as a size
able 4ssignment of the IR absorption bands observed upon CO + O2 adsorption on Au/ZrO2 and
IR band (cm−1) Assignment
2352, 1344 Zr O C O
2193–2197 Zr4+ CO
2135, 2115 Auı+ CO, Au0 CO
1755 Bridged CO32−
u/12WZ-I (Panel C) to a (10 Torr CO + 10 Torr O2) gas mixture for 10 min at variousples, respectively (RT = room temperature).
racterization of gold supported on tungstated zirconia, Catal. Today
sensitive probe reaction. In this investigation we used the gold cat-alysts supported on tungstated zirconia prepared by impregnation.In order to find information about the effect of tungsten, the CO + O2reaction has been studied on the Au/ZrO2 sample as well. Fig. 6
Au/12WZ-I samples at various temperatures.
IR band (cm−1) Assignment
1660–1650, 1375 CO2−
1615, 1220 Bidentate HCO3−
1555, 1320 Bidentate CO32−
1452–1450, 1425–1418 Polydentate CO32−

IN PRESSG Model
C
8 lysis Today xxx (2012) xxx– xxx
sAioFmctBfagatdsdaataiisHttbcmittd1sCsbi(aaittio
iaaataas
Catesooo
Fig. 7. CO conversion over the Au/xZW-I and Au/ZrO2 catalysts as a function ofthe temperature. The CO conversion (in %) is estimated from the integrated area
ARTICLEATTOD-7843; No. of Pages 9
M. Kantcheva et al. / Cata
hows the spectra obtained during the contact of the Au/ZrO2 andu/12WZ-I catalysts with a (10 Torr CO + 10 Torr O2) mixture in the
solated IR cell at various temperatures for 10 min. The spectrumf Au/ZrO2 catalyst detected at room temperature (spectrum RT inig. 6A) contains absorptions at 2193, 2135 and 2115 cm−1 the for-er band being assigned to Zr4+ CO whereas the latter two bands
orrespond to HF and LF gold carbonyls, respectively. The spec-rum in the 1620–1000 cm−1 region is similar to that reported byachiller-Baeza et al. [54], Pokrovski et al. [55] and Bolis et al. [56]
or CO2 adsorbed on tetragonal zirconia. Accordingly, the peakst 1615 and 1220 cm−1 reveal the presence of bidentate hydro-encarbonates (b-HCO3
−). The bands at 1555 and 1320 cm−1 arettributed to bidentate carbonate species (b-CO3
2−) [54–56] andhe pair of bands at 1450 and 1425 cm−1 are assigned to poly-entate carbonates (p-CO3
2−) [54,55] or monodentate carbonatepecies peculiar of the t-ZrO2 phase [56]. The latter two bands areetected upon the adsorption of CO (10 Torr) at room temperaturelthough with much weaker intensities. The absorption centeredt 1755 cm−1 can be assigned to bridged CO3
2− [56,57], whereashe weak bands at 1660–1650 and 1375 cm−1 (see also Fig. 6C) arettributed to carboxylate, CO2
−, species [57–59]. In the gas phase,n addition to the signal of CO, very weak absorption correspond-ng to CO2 is detected (Fig. 6B, spectrum RT). The experimental datahow that some oxidation of CO takes place at room temperature.owever, the product of oxidation is retained on the surface of
he catalyst mainly as carbonate–carboxylate structures. Increasinghe temperature to 50 ◦C causes enhancement of the absorptionsetween 1800 and 1000 cm−1 and decrease in the intensities of thearbonyl bands (Fig. 6A, spectrum 50 ◦C). At the same time, the for-ation of a new sharp band at 2352 cm−1 is observed. This signal
s attributed to the �3 mode of CO2 molecule linearly adsorbed onhe surface Zr cationic sites through one O atom [56,58,59], i.e. tohe Zr O C O configuration. Increasing the temperature to 100 ◦Coes not affect the intensities of the bands of the p-CO3
2− species at450–1425 cm−1 (Fig. 6A, spectrum 100 ◦C). However, there is con-iderable decrease in the absorptions corresponding to adsorbedO2 (2352 cm−1), b-HCO3
− (1615 and 1220 cm−1) and b-CO32−
pecies (1555 and 1320 cm−1). Decrease in the intensities of theroad signal centered at 1755 cm−1 and the shoulder at 1660 cm−1
s observed as well. The bands at 2193 (Zr4+ CO) and 2115 cm−1
LF Au carbonyl) are no longer present. However, the species char-cterized by the HF Au carbonyl band display higher stability andre observed in the spectrum taken at 150 ◦C (not shown here). Thisndicates that CO adsorbed on the larger gold particles (giving riseo the band at 2135 cm−1) is less reactive than that coordinated tohe smaller gold clusters. Low reactivity of gold species character-zed by carbonyl bands at 2125–2140 cm−1 has been reported forther gold containing samples [2,31,43].
The gas phase spectrum taken at 100 ◦C (Fig. 6B) shows decreasen the intensity of the CO band and significant increase in themount of CO2 produced. Further raise in the temperature to 200nd 300 ◦C causes vanishing of the bands at 1755 and 1660 cm−1
nd the absorptions due to adsorbed CO2 and CO, and lowering ofhe surface concentration of the hydrogencarbonate and carbon-te species. Under these conditions the CO in the gas phase haslmost disappeared and the amount of CO2 formed has increasedignificantly.
The spectra obtained during the interaction of a (10 TorrO + 10 Torr O2) mixture in the 25–300 ◦C with the Au/12WZ-I cat-lyst (Fig. 6C and D) contain the same type of absorption bands ashose observed on the Au/ZrO2 sample. However, there are differ-nces that should be noted: (i) CO2 adsorbed on the Au/12WZ-I
Please cite this article in press as: M. Kantcheva, et al., Spectroscopic cha(2012), doi:10.1016/j.cattod.2012.02.027
ample is observed already at room temperature and the amountf CO2 produced at 25 ◦C is significantly higher than that in the casef the Au/ZrO2 sample. The larger concentration of CO2 adsorbedn the Au/12WZ-I sample allows the detection of the �1 mode
of the IR absorption of gaseous CO obtained at a given temperature in the pres-ence (A) and absence of a catalyst (A0) according to the equation: CO conversion(%) = (A0 − A)100/A0.
of the adsorbed molecule at 1344 cm−1, otherwise IR inactive forgas-phase CO2; (ii) between 25 and 100 ◦C there is approximately2.5-fold increase in the surface concentration of adsorbed CO2whereas the amount of surface HCO3
− and CO32− increases only
slightly and is much lower than that on the Au/ZrO2 sample. Thisfact reflects the reduced basicity of the oxide ions of zirconia causedby the deposited WOx species. CO2 is acidic and it is used as aprobe molecule for basic surface sites [54,56]. The assignment ofthe absorption bands is summarized in Table 4.
It should be pointed out that Au-free WOx ZrO2 samples do notcatalyze the oxidation of CO in the 25–300 ◦C temperature rangeunder the same partial pressures of the reacting gases. Fig. 7 showsthe CO conversion over the Au/xZW-I and Au/ZrO2 catalysts as afunction of the temperature. The CO conversion (in %) is estimatedfrom the integrated area of the IR absorption of gaseous CO obtainedat a given temperature in the presence (A) and absence of a cata-lyst (A0) according to the equation: CO conversion = (A0 − A)100/A0.The curves clearly indicate that under the conditions of the FT-IR experiment, the Au/ZrO2 catalyst displays the lowest activityin the low-temperature range (up to 150 ◦C). The behavior of thelatter sample can be explained by extensive formation of surfaceHCO3
−/CO32− structures (see Fig. 6A) that block the active sites
for the reaction. The amount of carbonates retained on the surfacedepends on the basicity of the oxide ions, i.e. on the W concentra-tion. The spectra in Fig. 6A and C show that the most resistant todecomposition are the p-CO3
2− species and their surface concen-tration decreases with the increase in the W content.
The Au/5WZ-I sample has the best high-temperature activity(above 150 ◦C) among the samples studied. The poorer performanceof the gold catalysts with WO3 loading of 12 and 20 wt% under theseconditions could be explained by the presence of significant amountof large gold particles (see Table 3). The reactivity of CO adsorbedon large gold clusters is low resulting in lower CO oxidation activ-ity. As mentioned above, both Au/ZrO2 and Au/5WZ-I catalystshave similar Au loading and the fraction of small gold particles iscomparable (Table 3). The lower activity of the Au/ZrO2 catalystthan that of Au/5WZ-I could be attributed to the presence of stable
− 2−
racterization of gold supported on tungstated zirconia, Catal. Today
HCO3 /CO3 structures which are accumulated at temperaturesbelow 150 ◦C and cannot be removed even at 300 ◦C. The resultsobtained indicate that gold catalysts supported on tungstated zirco-nia show low-temperature activity in the oxidation of CO. However,
ING Model
C
lysis T
t[gcfcp
4
zaipaa(lgauiitFzCtAsr
A
CN
R
[
[
[[
[
[[[[
[
[[[[
[[[[[[[
[
[[[[
[
[[
[
[
[
[
[
[[[
[[[
[
[
[
[[
[[56] V. Bolis, G. Magnacca, G. Cerrato, C. Morterra, Top. Catal. 19 (2002) 259–269.[57] G. Busca, V. Lorenzelli, Mater. Chem. 7 (1982) 89–126.
ARTICLEATTOD-7843; No. of Pages 9
M. Kantcheva et al. / Cata
he deposition of gold on tungstated zirconia by adsorption ofAu(en)2]3+ complex leads to the formation of non-uniform in sizeold crystallites i.e. large and small. Since the size of gold parti-les is a key feature determining the activity in CO oxidation, ouruture task is to optimize the process of gold deposition by appli-ation of other methods such as using colloidal gold precursors orost-modification of Au/ZrO2 by WOx species.
. Conclusions
We have shown that gold catalysts supported on tungstatedirconia (containing 5–20 wt% WO3) can be prepared by cationicdsorption from aqueous solution of [Au(en)2]Cl3 complex. Accord-ng to XRD and XPS data large (8–10 nm) and small (∼3 nm) goldarticles are present on the catalyst surfaces. The FT-IR spectra ofdsorbed CO show the formation of two types of Au CO bands,t 2128–2135 cm−1 (high-frequency band) and 2113–2116 cm−1
low-frequency band), which are attributed to CO coordinated toarge and small gold particles, respectively. It is concluded that theold particles occupy preferentially the WOx-free zirconia surfacend the dispersion of gold depends on the amount of coodinativelynsaturated (cus) Zr4+ ions. Modification of zirconia by tungsten
ncreases the gold uptake but at the same time causes decreasen the concentration of (cus) Zr4+ ions. Consequently, the frac-ion of large gold particles increases. Under the conditions of theT-IR experiments, the gold catalysts supported on tungstatedirconia prepared by impregnation display higher activity in theO oxidation in the low-temperature range (up to 150 ◦C) thanhe WOx-free Au/ZrO2 catalyst. The improved performance of theu/WOx ZrO2 catalysts is associated with reduced formation oftable HCO3
−/CO32− structures that block the active sites for the
eaction.
cknowledgments
This work has been performed in the framework of a D36/003/06OST program. The financial support of TBAG – 109T854 project andATO Grant ESP.CLG. No. 984160 is greatly appreciated.
eferences
[1] M. Haruta, CATTECH 6 (2002) 102–115.[2] J.-D. Grunwald, M. Macviejewski, O.S. Becker, P.F. Fabrizioli, A. Baiker, J. Catal.
186 (1999) 458–469.[3] P. Konova, A. Naydenov, Cv. Venkov, D. Mehandjiev, D. Andreeva, T. Tabakova,
J. Mol. Catal. A 213 (2004) 235–240.[4] P. Konova, A. Naydenov, T. Tabakova, D. Mehandjiev, Catal. Commun. 5 (2004)
537–542.[5] D. Widmann, Y. Liu, F. Schüth, R.J. Behm, J. Catal. 276 (2010) 292–305.[6] A. Knell, P. Barnickel, A. Baiker, A. Wokaun, J. Catal. 137 (1992) 306–321.[7] X. Zhang, H. Wang, B.-Q. Xu, J. Phys. Chem. B 109 (2005) 9678–9683.[8] H.G. Zhu, C.D. Liang, W.F. Yan, S.H. Overbury, S. Dai, J. Phys. Chem. B 110 (2006)
10842–10848.[9] H.G. Zhu, Z. Ma, J.C. Clark, Z.W. Pan, S.H. Overbury, S. Dai, Appl. Catal. A 326
Please cite this article in press as: M. Kantcheva, et al., Spectroscopic cha(2012), doi:10.1016/j.cattod.2012.02.027
(2007) 89–99.10] D. Guillemot, V. Yu Borovkov, V.B. Kazansky, M. Polisset-Thfoin, J. Fraissard, J.
Chem. Soc. Faraday Trans. 93 (1997) 3587–3591.11] R. Zanella, A. Sandoval, P. Santiago, V.A. Basink, J.M. Saniger, J. Phys. Chem. B
110 (2006) 8559–8565.
[[
PRESSoday xxx (2012) xxx– xxx 9
12] J. Xu, Y. Liu, H. Wu, X. Li, M. He, P. Wu, Catal. Lett. 141 (2011) 860–865.13] J.G. Santiesteban, J.V. Vartuli, S. Han, R.D. Bastian, C.D. Chang, J. Catal. 168 (1997)
431–441.14] A. Martinez, G. Prieto, M.A. Arribas, P. Concepcion, J.F. Sanchez-Royo, J. Catal.
248 (2007) 288–302.15] B.P. Block, J.C. Bailar Jr., J. Am. Chem. Soc. 73 (1951) 4722–4725.16] R.A. Boyse, E. Ko, J. Catal. 171 (1997) 191–207.17] M. Scheithauer, R.K. Grasselli, H. Knozinger, Langmuir 14 (1998) 3019–3029.18] D.G. Barton, M. Shtein, R.D. Wilson, S.T. Soled, E. Iglesia, J. Phys. Chem. B 103
(1999) 630–640.19] E.I. Ross-Medgaarden, W.V. Knowles, T. Kim, M.S. Wong, W. Zhou, C.J. Kiely, I.E.
Wachs, J. Catal. 256 (2008) 108–125.20] M. Kantcheva, C. Koz, J. Mater. Sci. 42 (2007) 6074–6086.21] E.I. Ross-Medgaarden, I.E. Wachs, J. Phys. Chem. C 111 (2007) 15089–15099.22] F. Di Gregorio, V. Keller, J. Catal. 225 (2004) 45–55.23] V. Bolis, G. Cerrato, G. Magnaca, C. Morterra, Thermochim. Acta 312 (1998)
63–77.24] K.T. Jung, A.T. Bell, J. Mol. Catal. A 163 (2000) 27–42.25] J. Li, J. Chen, W. Song, J. Liu, W. Shen, Appl. Catal. A 334 (2008) 321–329.26] C.E. Crouthamel, C.E. Johnson, Anal. Chem. 26 (1954) 1284–1291.27] D.F. Wood, R.T. Clark, Analyst 83 (1958) 326–334.28] F.P.J.M. Kerkhof, J.A. Moulijn, J. Phys. Chem. 83 (1979) 1612–1619.29] V. Leon, Surf. Sci. 339 (1995) L931–L934.30] M.A. Cortes-Jacome, C. Angeles-Chavez, E. Lopez-Salinas, J. Navarrete, P. Toribo,
J.A. Toledo, Appl. Catal. A 318 (2007) 178–189.31] F. Boccuzzi, G. Cerrato, F. Pinna, G. Strukul, J. Phys. Chem. B 102 (1998)
5733–5736.32] R. Kydd, J. Scott, W.Y. Teoh, K. Chiang, R. Amal, Langmuir 26 (2010) 2099–2106.33] S. Eustis, M.A. El-Sayed, Chem. Soc. Rev. 35 (2006) 209–217.34] Y. Azizi, C. Petit, V. Pitchon, J. Catal. 269 (2010) 26–32.35] S. Schimpf, M. Lucas, C. Mohr, U. Rodemerck, A. Bruckner, J. Radnik, H. Hofmeis-
ter, P. Claus, Catal. Today 72 (2002) 63–78.36] L. Ilieva, J.W. Sobczak, M. Manzoli, B.L. Su, D. Andreeva, Appl. Catal. A 291 (2005)
85–92.37] R. Zanella, L. Dellanoy, C. Louis, Appl. Catal. A 291 (2005) 62–72.38] R. Wojcieszak, M.J. Genet, P. Eloy, P. Ruiz, E.M. Gaigneaux, J. Phys. Chem. 114
(2010) 16677–16684.39] S. Velu, K. Suzuki, C.S. Gopinath, H. Yoshidac, T. Hattori, Phys. Chem. Chem.
Phys. 4 (2002) 1990–1999.40] L.-C. Wang, Q. Liu, M. Chen, Y.-M. Liu, Y. Cao, He-Y. He, K.-N. Fan, J. Phys. Chem.
C 111 (2007) 16549–16557.41] R. Grabowski, J. Sloczynski, M. Sliwa, D. Mucha, R.P. Socha, ACS Catal. 1 (2011)
266–278.42] J.C. Dupin, D. Gonbeau, P. Vinatier, A. Levasseur, Phys. Chem. Chem. Phys. 2
(2000) 1319–1324.43] M. Maciejewski, P. Fabrizioli, J.-D. Grunwald, O.S. Becker, A. Baiker, Phys. Chem.
Chem. Phys. 3 (2001) 3846–3855.44] M. Manzoli, A. Chiorino, F. Boccuzzi, Surf. Sci. 532–535 (2003) 377–382.45] M. Kantcheva, E.Z. Ciftlikli, J. Phys. Chem. B 106 (2002) 3941–3949.46] C. Morterra, G. Cerrato, V. Bolis, C. Lamberti, L. Ferroni, L. Montanaro, J. Chem.
Soc. Faraday Trans. 91 (1995) 113–123.47] F. Boccuzzi, A. Chiorino, J. Phys. Chem. B 104 (2000) 5414–5416.48] K.I. Hadjiivanov, G.N. Vayssilov, Adv. Catal. 47 (2002) 307–511.49] M. Kantcheva, O. Samarskaya, L. Ilieva, G. Pantaleo, A.M. Venezia, D. Andreeva,
Appl. Catal. B 88 (2009) 113–126.50] D. Andreeva, M. Kantcheva, I. Ivanov, L. Ilieva, J.W. Sobczak, W. Lisowski, Catal.
Today 158 (2010) 69–77.51] F. Vindigni, M. Manzolli, A. Chiorino, F. Boccuzzi, Gold Bull. 42 (2009)
106–112.52] K. Musialska, E. Finocchio, I. Sobczak, G. Busca, R. Wojcieszak, E. Gaigneaux, M.
Ziolek, Appl. Catal. A 384 (2010) 70–77.53] M.S. Chen, D.W. Goodman, Science 306 (2004) 252–255.54] B. Bachiller-Baeza, I. Rodriguez-Ramos, A. Guerrero-Ruiz, Langmuir 14 (1998)
3556–3564.55] K. Pokrovski, K.T. Jung, A.T. Bell, Langmuir 17 (2001) 4297–4303.
racterization of gold supported on tungstated zirconia, Catal. Today
58] G. Ramis, G. Busca, V. Lorenzelli, Mater. Chem. Phys. 29 (1991) 425–435.59] L.F. Liao, C.F. Lien, D.L. Shieh, M.T. Chen, J.L. Lin, J. Phys. Chem. B 106 (2002)
11240–11245.


