Embed Size (px)
Citation preview
Speleoseismology in the
Dinaric Karst of Slovenia
Bou-Rabee Donna
University of Trieste
A Thesis submitted for the degree of
Doctor of Philosophy
November 2021
I
Abstract
Cave sediments may be used not only as archives for past climate changes but also as
an important and until recently overlooked archive for seismic events. This has been
done in many karstic areas around the world, but not in the Dinaric Karst area of
Slovenia making this study a pioneer work. The Dinaric Karst covers the area between
the Ljubljana Marsh (Slovenia) to the east and the Bay of Trieste (Italy) to the west
and Rijeka (Croatia) to the south. There are around 6,000 known and explored caves
and other karstic phenomena in this area that covers approximately 6,400 km2 or 27%
of the territory of Slovenia. In the present study, speleothems from several caves in the
Slovenian part of the Dinaric Karst area are sampled (more than 90 samples were taken
and analyzed) and so far 34 were dated using the radiometric U/Th method. The
sampling excluded deformed speleothems other than seismically deformed ones
therefore validating the samples as records of paleoearthquakes. Two temporal clusters
(around 3kyr BP and 10kyr BP) could be identified from our results. Therefore, the
the Dinaric Karst in Slovenia was not only affected by the 1511 magnitude 6.9
historical earthquake sequence but most likely also by two newly inferred large paleo
earthquakes.
Keywords: Dinaric Karst, speleothems, U/th dating, paleoearthquakes,
speleoseismology.
I
Table of Contents
1 Introduction .................................................................................................1
2 Methods .......................................................................................................3
2.1 Radiometric Dating Techniques of Speleothems 9
2.1.1 General Information on the Dating Method 9
2.1.2 Laboratory Procedures 11
3 Scientific Background ............................................................................... 16
3.1 Prerequisites for the formation of karsts 16
3.2 Paleoseismicity Archives in Cave Deposits 18
3.3 Speleoseismicity and archives in Slovenia and the NW Dinarides 24
4 Study Area ................................................................................................. 26
4.1 Geographical and Geological Setting 26
4.2 Seismotectonic overview of NW Dinarides and current seismic activity 34
4.3 Known historic earthquakes in the area 39
4.3.1 1511 Idrija Earthquake 40
4.3.2 1956 and 1995 Ilirska Bistrica earthquakes 41
4.3.3 1998 Bovec Earthquake 42
5 Caves and Sampling .................................................................................. 44
5.1 Sampled Caves and sample descriptions 44
5.1.1 Divača cave 47
5.1.2 Vilenica Cave 51
5.1.3 Lipica 53
5.1.4 Bergevčeva cave 55
5.1.5 Pečina pod Medvejcom 57
5.1.6 Dimnice 58
5.1.7 Vodnica 61
5.1.8 Predjama 62
5.1.9 Mačkovica cave 64
5.1.10 Žegnana cave 66
5.2 Ages of sampled speleothems 68
6 Results, Discussion and Conclusions ........................................................ 72
7 Acknowledgements .................................................................................... 76
8 References .................................................................................................. 77
1
1 Introduction
Cave sediments may be used not only as an archive for past climate changes but also
as an important and until recently overlooked archive for seismic events. Reports of
probable earthquake effects in caves date back to the early 20th century. Documented
studies of seismic event effects in caves started to emerge in scientific journals in the
1960s (McCalpin, 2009). While this has been done in many places around the world,
the method is relatively new to the seismically active north-eastern Mediterranean,
especially to the Dinaric Karst territory, north-western Dinarides. Dinaric Karst covers
the area between the Ljubljana Marsh (Slovenia) to the east and the Bay of Trieste
(Italy) to the west and Rijeka (Croatia) to the south (Kranjc, 1997). There are around
6,000 known and explored caves and other karstic phenomena in this area that covers
approximately 6,400 km2 or 27% of the territory of Slovenia.
In the present study, speleothems, cave sediments, from several caves in the Dinaric
Karst area in south-western Slovenia are sampled and dated using the radiometric U/Th
method. The data are then correlated with known seismic events and their feasibility
as paleo seismic archives is verified.
2
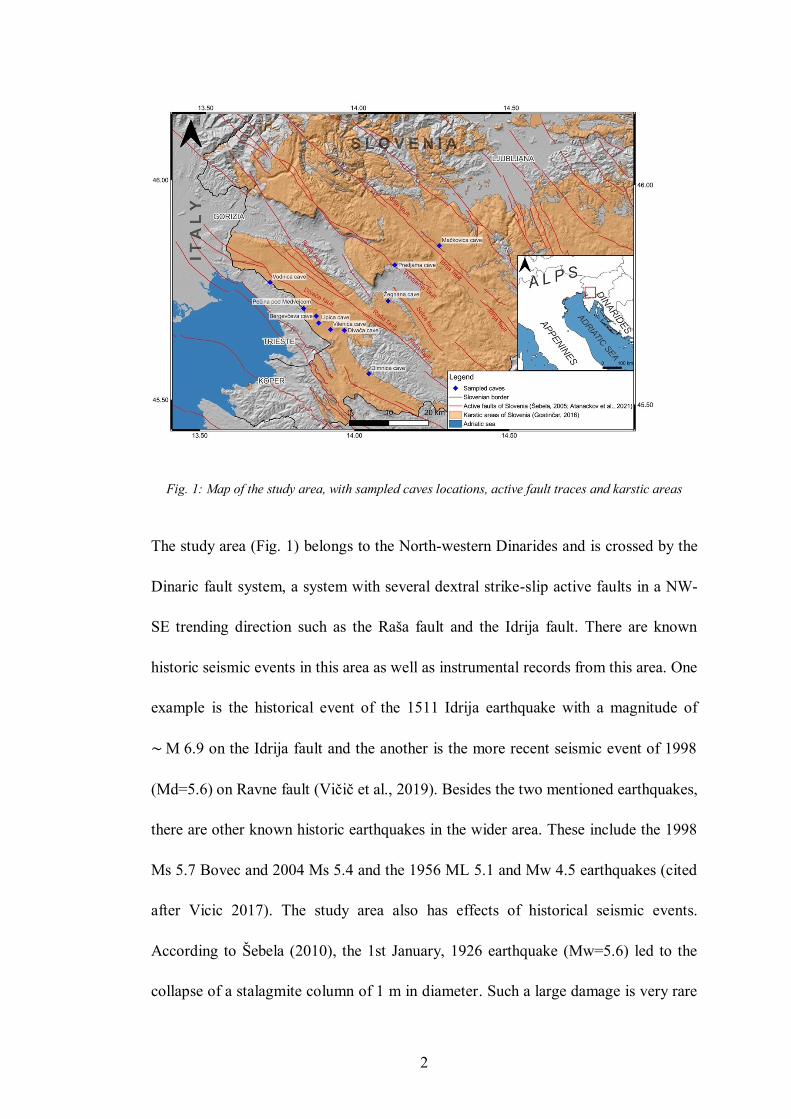
Fig. 1: Map of the study area, with sampled caves locations, active fault traces and karstic areas
The study area (Fig. 1) belongs to the North-western Dinarides and is crossed by the
Dinaric fault system, a system with several dextral strike-slip active faults in a NW-
SE trending direction such as the Raša fault and the Idrija fault. There are known
historic seismic events in this area as well as instrumental records from this area. One
example is the historical event of the 1511 Idrija earthquake with a magnitude of
∼ M 6.9 on the Idrija fault and the another is the more recent seismic event of 1998
(Md=5.6) on Ravne fault (Vičič et al., 2019). Besides the two mentioned earthquakes,
there are other known historic earthquakes in the wider area. These include the 1998
Ms 5.7 Bovec and 2004 Ms 5.4 and the 1956 ML 5.1 and Mw 4.5 earthquakes (cited
after Vicic 2017). The study area also has effects of historical seismic events.
According to Šebela (2010), the 1st January, 1926 earthquake (Mw=5.6) led to the
collapse of a stalagmite column of 1 m in diameter. Such a large damage is very rare
3
in karst caves and possibly it only took place because the epicenter was in the very
vicinity. In addition, there are modern paleo seismic studies where seismic records
from surface-near trenching have been investigated (Grützner et al. 2021).
2 Methods
All the caves are situated in Mesozoic carbonate rocks, spanning from Lower to Upper
Cretaceous. The main selection of the ten sampled cave sites was based on
geographical location, their vicinity to the major seismically active NW-SE trending
fault zones and their spatial distribution crosswise (SW-NE) the fault zones. Thus
permitting the use of data for regional paleo seismic event interpretation in the study
area. Before a seismic origin of the deformed speleothem can be inferred, all other
possible causes of the disturbance must be ruled out. Therefore the sampling sites of
speleothems in the caves were selected in a manner that they excluded any signs of
biogenic or anthropogenic impacts, effects of sediment subsidence or landslides,
impacts of ice flows, effects of the outside climate (freezing-thawing cycles) and
impacts of running water (Shanov and Kostov, 2015).
The selected speleothems show clear signs of seismic disruption such as breakage or
even just a distinct change in growth direction. According to suggestions from
literature, the sampled speleothems should be cylindrical stalagmites. Most of the
sampled speleothems were sampled in caves’ dry collapse chambers. They were
situated on older structures, fallen bedrock blocks, pillars and stalactites. The sampled
speleothems that inferred the same event had to exhibit uniform growth characteristics,
size and shape, and had to belong to a group that had a sufficient number of deformed
4
speleothems, which allow statistical analysis (Shanov and Kostov, 2015). Samples
from horizontal surfaces were preferred to minimize influence of gravity. Such an
influence could lead to secondary redeposition and has a higher likelihood on non-
horizontal surfaces.
Samples from ten different caves were taken by using an electrical drill with a diamond
core drill bit from the contact between pre-event sediment and post-event sediment.
The diamond core drill bit was used to ensure minimal destruction of the speleothems.
The situation before and after sampling was documented photographically. The
locations of all sampled speleothems were documented and logged on the cave map
and cave profile. As per nature conservational legislature of Republic of Slovenia a
sampling permit was acquired for each cave and a report of sampled speleothem sites
was submitted to the Institute of the Republic of Slovenia for Nature Conservation.
The speleothem samples were prepared and dated at the laboratory at the University
of Oxford. Prior to the preparation, a little chip of sample of around 100 mg was cut
using a saw blade mounted on a “Dremel” tool in the preparation laboratory. The
measurements were carried out with a Thermofinnigan element 2 ICP-MS instrument.
Speleothems and Sampling Technique
Deformed, broken and collapsed speleothems in caves can form as a result of multiple
reasons. In our study, the sampled speleothems were chosen accordingly to directions
and procedures published by Šebela (2004) and Kostov & Shanov (2015). We
excluded deformed speleothems, which could have formed from reasons other than
seismic activity. Examples of processes behind deformed speleothems are:

5
• Biogenic or anthropogenic activity; traces of negative human impact is
normally represented as broken stalagmites and stalactites in easily accessible,
entry parts of the caves. Anthropogenic activity can be easily recognised.
Occasionally there is a negative destructive biogenic impact on speleothems as
a result of activity of Pleistocene large mammals. This can be distinguished by
the presence of fossil bones.
• Effects of subsidence and gravitational processes; if the speleothems are
forming on fluvial or colluvial sediments they can be inclined, collapsed or
broken.
• Impacts of ice movement; this applies only for karst areas near the snow lines
during ice age conditions of the Pleistocene and to contemporary ice caves.
• Effects of the outside climate; freezing-thawing cycles at the entry parts of the
caves can result in broken and collapsed speleothems and rock falls.
• Impacts of running water; hydrological active parts of caves should be avoided.
Speleothems could be broken due to torrent flows.
6
At first, a suitable speleothem was identified in the cave, avoiding previously described
scenarios. According to Akgöz & Eren (2013), cylindrical stalagmites with uniform
growth in sufficient numbers should be the preferred specimens for paleo
seismological studies. They state, that these samples usually work best because they
have not been affected by changing hydrological and chemical conditions. A change
in grow rate could suggest a change in the precipitation pattern and would in this way
prohibit the use of such a speleothem for analysis of earthquake influence. Changing
grow rate of speleothems could also be influenced by changes in water chemistry such
as pH or the amount of dissolved carbonates or in physical parameters such as changes
in water temperature.
Only speleothems which were cemented to the cave floor were sampled, as lose
speleothems could have been changed post seismically for example by human impact
or gravitational processes (Delaby (2001)). In accordance with Delaby (2001), samples
from horizontal surfaces were preferred to minimize influence by gravity. The selected
speleothems should be calcified to an older generation of secondary formations, so
there is relative age evidence of events that caused the deformation.
As per nature conservational legislature of Republic of Slovenia all the caves in
Slovenia are protected by the law and registered under “The Register of valuable
natural features”. Therefore, a sampling permit was acquired from the Slovenian
Environment Agency for all of the sampled caves. After each cave sampling a detailed
report of each specimen micro-locations including photographs of pre- and post-
sampling situation was submitted to the Institute of the Republic of Slovenia for Nature
Conservation.
7
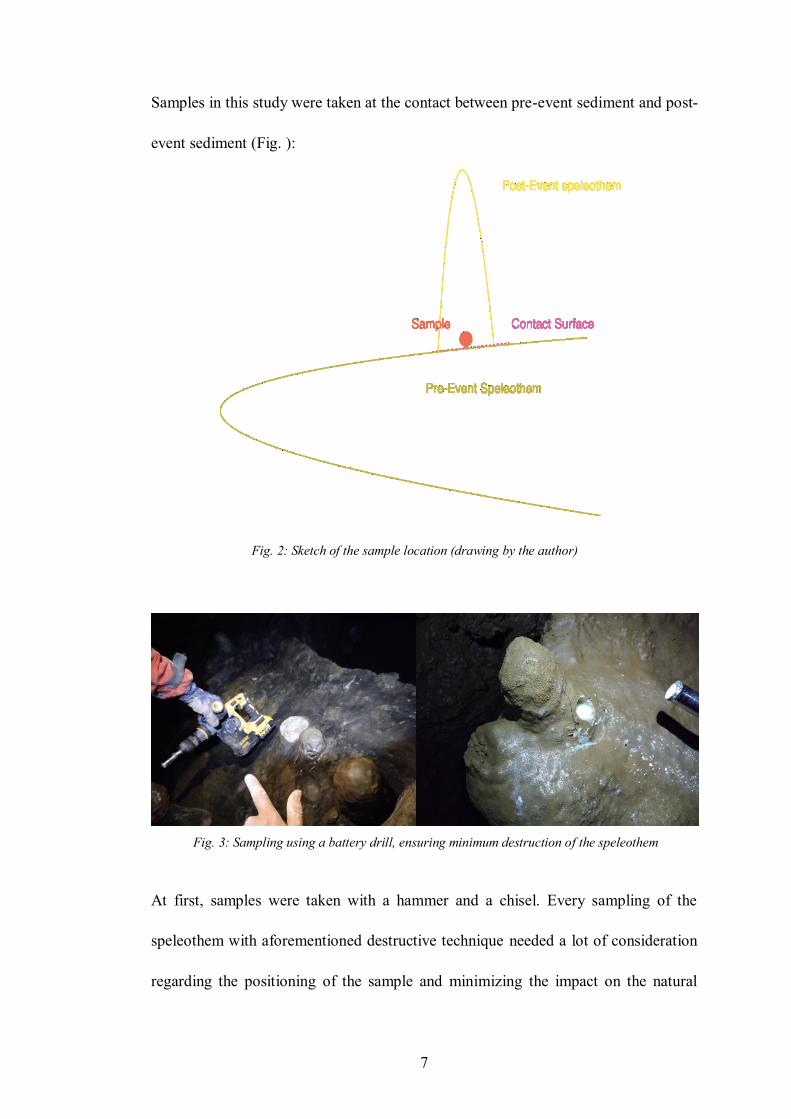
Samples in this study were taken at the contact between pre-event sediment and post-
event sediment (Fig. ):
At first, samples were taken with a hammer and a chisel. Every sampling of the
speleothem with aforementioned destructive technique needed a lot of consideration
regarding the positioning of the sample and minimizing the impact on the natural
Fig. 2: Sketch of the sample location (drawing by the author)
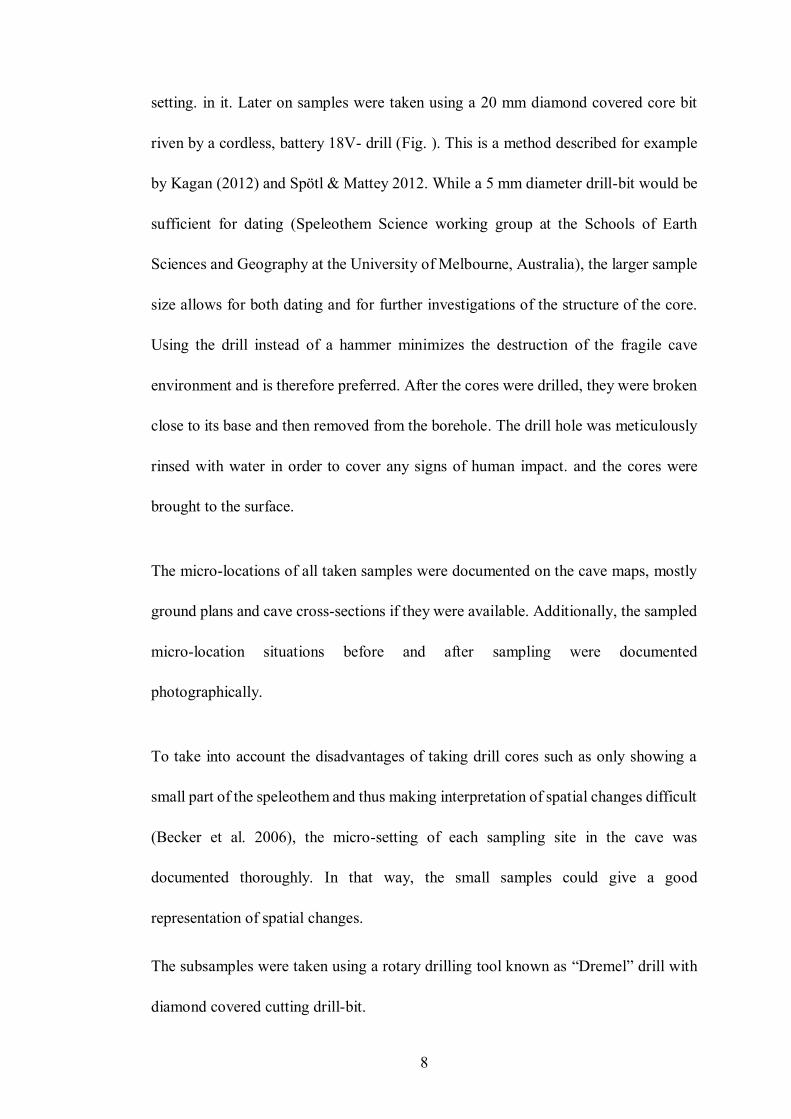
Fig. 3: Sampling using a battery drill, ensuring minimum destruction of the speleothem
8
setting. in it. Later on samples were taken using a 20 mm diamond covered core bit
riven by a cordless, battery 18V- drill (Fig. ). This is a method described for example
by Kagan (2012) and Spötl & Mattey 2012. While a 5 mm diameter drill-bit would be
sufficient for dating (Speleothem Science working group at the Schools of Earth
Sciences and Geography at the University of Melbourne, Australia), the larger sample
size allows for both dating and for further investigations of the structure of the core.
Using the drill instead of a hammer minimizes the destruction of the fragile cave
environment and is therefore preferred. After the cores were drilled, they were broken
close to its base and then removed from the borehole. The drill hole was meticulously
rinsed with water in order to cover any signs of human impact. and the cores were
brought to the surface.
The micro-locations of all taken samples were documented on the cave maps, mostly
ground plans and cave cross-sections if they were available. Additionally, the sampled
micro-location situations before and after sampling were documented
photographically.
To take into account the disadvantages of taking drill cores such as only showing a
small part of the speleothem and thus making interpretation of spatial changes difficult
(Becker et al. 2006), the micro-setting of each sampling site in the cave was
documented thoroughly. In that way, the small samples could give a good
representation of spatial changes.
The subsamples were taken using a rotary drilling tool known as “Dremel” drill with
diamond covered cutting drill-bit.
9
2.1 Radiometric Dating Techniques of Speleothems
2.1.1 General Information on the Dating Method
Dating can be carried out by different methods. As carbonates contain carbon,
geologically young sediments can be dated using the radiocarbon method (e. g. used
by Becker et al. 2005). For older sediments, U-Th-Pb dating can be used (e. g. Kagan
2012). If even older sediments need to be dated, the U-Pb series can be used, enabling
the dating of sediments as old as 10 Myr (Woodhead et al. 2016). Besides using these
radiometric dating methods, it is also possible to use paleomagnetic reversals as time
markers and this technique has for example been used by Sasowski et al. (2003).
Besides dating the carbon in the carbonate, also organic micro remains within
sediments can be dated. The results need to be corrected for “dead carbon” which is
carbon from the surrounding limestone. According to Becker et al. (2012), samples
containing dispersed organic material need to be wet sieved and then treated by an
acid-alkali-acid (AAA) pre-treatment. This treatment consists of 4% HCl for 30
minutes, then 3 steps of 4 % NaOH for a period of one hour and finally 4% HCl for
another hour. According to Becker et al. (2012) material should be centrifuged
between each step.
Samples from the carbonate are dissolved in acid (HCl) and the resulting CO2 is
collected and converted to graphite.
Finally the 14C/12C ratio is measured, due to small sample sizes and relatively old
samples, this measurements needs to be carried out by accelerator mass spectrometry
(AMS). Laboratories for AMS radiocarbon dating exist at several institutes, for
10
example at Lund University in Sweden, in Heidelberg, Cologne, Kiel in Germany, and
Zürich/Hönggerberg in Switzerland.
For U-Th-Dating, the amount of material needed depends on the uranium
concentration. The sample is then dissolved in 7N HNO3 and thereafter spiked with a
236U-229Th spike (Kagan 2012). The U and Th of the carbonate fraction of the
speleothems are chemically separated using chromatography and then the isotopes
238U, 234U, 230Th and 232Th are measured by a Multi-Collector Inductively Coupled
Plasma Mass Spectrometer (MC-ICP-MS). To test the instrument performance, a
standard reference material for U isotope ratio measurements needs to be used. The
isotopic mass discrimination of the instrument also needs to be corrected for.
The U-Th dating method assumes that all 230Th present in the calcite is formed within
the speleothem by radioactive decay of uranium which co-precipitated with the calcite.
This is not the case in speleothems where Thorium may also have been added by the
integration of detrital material such as clay. Therefore, the measured data need to be
corrected for detritus (Kagan et al. 2017).
After the correction, the 230Th /234U age is calculated (Becker et al. 2012). The U-Th-
measurements in their study were carried out at Heidelberg University while Kagan et
al. (2017) used the laboratory of the Geological Survey of Israel. Another laboratory
where U-Th-dating may be carried out is the laboratory of Prof Gideon Henderson,
research group on Isotopes and Climate, Department of Earth Sciences at the
University of Oxford.
11
In the paper by Sasowski et al. (2002), samples are taken for paleomagnetic analyses
in plastic cubes and their spatial orientation is noted. In the laboratory, the samples are
magnetically cleaned in a stepwise alternating field (AF) demagnetizer and are then
measured in a large-bore, 3-axis 2-G superconducting rock magnetometer (SRM). By
inspecting the plots and using principal component analysis, the characteristic remnant
magnetic vector is determined. In addition to this vector, the samples are also analyzed
for magnetic susceptibility and isothermal remnant magnetization. Paleomagnetic
laboratories exist at institutes such as the University of Pittsburgh, the University of
Liverpool, and Lund University.
Delaby (2001) suggests that a broken stalagmite on which a new stalagmite developed
is a good source for age data. If both the oldest part of the new stalagmite and the
youngest part of the fallen stalagmite are dated, it is possible to construct minimum
and maximum ages for the rupture and thus for the event (e. g. the earthquake) which
led to the creation of the rupture. To exclude dating errors, also the dating should be
performed on a sufficiently large number of speleothems and the age data should then
be averaged.
2.1.2 Laboratory Procedures
2.1.2.1 Beaker preparation
Teflon beakers are taken to the clean laboratory and filled partially with 8M reagent
grade nitric acid. The beakers are covered and are cleaned with the acid overnight at
130°C before they are rinsed three times with ultrapure water (18MΩ resistivity).

12
Afterwards the beakers are filled completely with nitric acid, a lid is put on them and
then the beakers are cleaned for another night, also this time at 130°C.
2.1.2.2 Resin preparation
For the analyses in this study, 100-200 mesh resin is used. A clean bottle is filled to a
level of 10-20% with the resin and afterwards the bottle is filled to the top with ultra
pure water and shaked well. The resin is allowed to settle by gravity and as much
water as possible is decanted from the bottle. The process is repeated 2-3 times or until
the water is clear and no more foam is forming.
After washing the resin with water, new water is added to 3/4 of the bottle and 20-
50ml HCl is added before the bottle is filled with water to the top and shaked. After
allowing the sediment to settle, the acid-water mixture is removed by decanting.
After the cleaning with diluted HCl, another 3-4 cleaning steps using water (see above
for detailed procedure) are executed.
Finally water is added to the bottle and a small amount of HCl is added. Then the
columns may be stored until using them.
2.1.2.3 Column preparation
The columns used for U-Th and U-isotope measurements in carbonates are 2 ml Biorad
columns. They are stored in ultra clean water. To prepare them they are first immersed
for 1-2 hours in 8N HNO3 (50% by volume) and then cleaned with water. Afterwards
they are immersed in 6N HCl (50% by volume) for another 3-4 hours. Afterwards they
are left in a PP wide neck bottle and are covered with 2N HCl at room temperature
overnight.

13
After cleaning the lab and the hood properly using 18MΩ water the columns are taken
from their storage vessel and are rinsed 3 times using 18MΩ water. Then the columns
are put into the column rack. A waste beaker is placed beneath each column and 2ml
of resin is added to the columns using a 5ml pipette.
The resin is then washed with 7.5 M HNO3 followed by 2% HNO3 and 7.5 M HNO3
and another round of 2% HNO3. Afterwards the resin is washed with 6M HCl followed
by ultrapure water. The columns are then conditioned with 2x5 ml of 7.5M HNO3.
2.1.2.4 Sample preparation for dating
For preparing the samples, a little chip of sample (around 100mg) is cut using a saw
blade mounted on a “Dremel” tool in the preparation laboratory. The chip is moved to
the clean laboratory and put into a bottle and rinsed with 18MΩ ultrapure water in an
ultrasound bath. Afterwards the water is removed and new ultrapure water with around
2 % 8M nitric acid is added. The beaker is put back into an ultrasound bath for another
minute. Afterwards, the diluted acid is removed and replaced by ultrapure water for
another 1 minute ultrasound treatment.
To take into account for the loss of material in column chemistry, a carbonate spike
with known 236U/229Th ratio of .554 g is split into 11 parts of 50mg and added to
each sample. The spike is added using to the beakers using a pipette 20-200µl with a
tip size 50-1000µl).
Afterwards 400µl of 16 molar nitric acid are added to each beaker to convert the
sample into nitrate form, and the beaker is then covered with a lid. After standing on
14
the hot plate at 130°C over night to equilibrate, the lid is removed, and the nitric acid
is evaporated.
The samples are loaded into the column directly from the sample beaker. The column
is then washed with 2x5 ml of 7.5M HNO3. The column is then converted with 4x
0.25 ml and 1x 0.5ml of 6M HCl. As the spike is radioactive, the waste from these
steps needs to be treated as radioactive waste.
The Thorium cut is eluted with 2x1 ml and 2x2 ml of 6M HCl. The Uranium cut is
eluted with 2x1 ml and 1x4 ml of H2O.
Each cut is dried down in an oven without boiling it. 0.2 ml of concentrated HNO3 is
added and the sample is dried down. The dried sample is dissolved in 42µl of 7.5N
HNO3 and stored for mass spectroscopy.
0.2 ml of 2% HNO3 is added to the sample and the sample is put on a hot plate at
100°C over night before the uranium measurement. When the samples are dry, another
1 ml of HNO3 is added to the beaker.
The Th sample beakers are covered and put on 80-90°C hot plate overnight.
In preparation for mass spectroscopy, the samples are then transferred to Eppendorf
tubes.
2.1.2.5 Sample preparation for uranium concentration measurement
For uranium concentration, a hole is drilled into the sample and around 500 µg of
drilling powder is collected for analysis. Around 250 µg of the sample is then weighed
and collected on a clean piece of foil.
15
2.1.2.6 Measurements
The measurements are carried out using a THERMOFINNIGAN ELEMENT 2 ICP-
MS instrument at the laboratory of Philip Holdship at the University of Oxford.
The samples are loaded into an auto sampler and are pumped into a sample chamber
as a fine mist.
Inside the MS, a plasma at 10,000 Kelvin is created. The plasma desolvates atomizes
and ionizes the sample which is then formed into a beam of highly energized particles
by use of electromagnetic. The ions are accelerated in a high vacuum environment and
are then filtered according to their mass to charge ratio (m/z) and are then sequentially
detected by a secondary electron multiplier.
2.1.2.7 Calculation of concentrations
The weight (in grams) of the sample is determined and the volume of the solution (5
ml -> 5 grams) is divided by the weight of the sample, and the result is the dilution
factor.
The measured concentration of uranium is multiplied by the dilution factor to calculate
the concentration of uranium in the rock sample.
16
3 Scientific Background
3.1 Prerequisites for the formation of karsts
Karst is a landscape type which is formed by the chemical dissolution of rocks. Mainly
soluble carbonate rocks such as limestone, dolomite and gypsum are susceptible to this
type of dissolution. However, karstic landscapes can form even in metamorphic rocks,
such as quartzites.
A speleothem is an autochthonous “in situ” cave deposit or cave formation. According
to Forti & Onac (2016), a speleothem can consist of any secondary mineral deposited
within a cave, regardless of the composition or external shape or internal crystal
structure. This is in contrast to early research where only calcium carbonate deposits
were subsumed under this term. Later on, also gypsum deposits were included in the
term of speleothems.
The most important characteristic of karst landscapes is subterraneous water drainage.
A large part of the drainage may flow via subterraneous cavities and caves. Surface
water flow may be limited by sinkholes, making rivers and lakes a rare occurrence in
karst type terrain. Karst phenomena are quite common on a global scale with 44% of
Slovenia, 30% of Europe and 20% of the world being covered by karst.
While also other processes for mineralization exist, chemical dissolution and
precipitation are the dominant processes in karst landscape evolution. The process
formula 𝐶𝑎𝐶𝑜3(𝑠) +𝐻2𝑂 + 𝐶𝑂2(𝑔) ⇄ 𝐶𝑎(𝑎𝑞)2+ + 2𝐻𝐶𝑂3
− can be read in both ways.
If the formula is read from left to right it describes the dissolution of calcium carbonate
by meteoric water (i. e. precipitation such as rain) which is acidified during its passage
17
through the soil. This chemical dissolution is the main process for the formation and
other karst features.
While this dissolution is enough to create small dissolution forms in the limestone,
another process is mixture-corrosion (Bögli, 1963), which is crucial for the formation
of larger dissolution forms and larger caves. Bögli (1963) described that two liquids
which are saturated with calcium carbonate and which are mixed will act in a way
which dissolutes limestone. This process is caused by the fact that the amount of
dissolved calcium carbonate does not increase linearly with the concentration of
dissolved CO2 in water. The mixture of two CaCO3-saturated solutions is not saturated
with CaCO3 and has therefore an excess of CO2 which in turn will dissolve more
CaCO3 until the solution is saturated.
If the above mentioned process formula is read from right to left instead, the
precipitation of calcium carbonate by degassing of the liquid and the formation of
speleothems is described. Precipitation of carbonate occurs if CO2 leaves the solution,
i. e. if the CO2 partial pressure drops.
If the carbonate-saturated water leaves the bedrock at the ceiling of a cave, CO2 level
drops and a stalactite starts to form. If the water drop which still contains carbonate
reaches the floor of the cavity, further CO2 is expelled which in turn leads to further
precipitation of calcium carbonate and this is how the formation of stalagmites is
induced.
As these processes are gravity-driven, formation of speleothems usually occurs in
regular, often symmetrically shaped layers which mark different seasons. To create
18
significant changes in growth axis either the dripping point or the deposition point
need to be moved.
As speleothems mainly occur in karst caves (with the name karst derived from the Kras
[Italian: carso] region in Slovenia, much of the early karst research was carried out in
this area. Other early karst research has been carried out in areas such as south west
Germany and central and southern France (Gilli 1999).
3.2 Paleoseismicity Archives in Cave Deposits
When it comes to using speleothems as archives for paleo seismic processes, research
has been carried out in Slovenia, but also in other areas around the world, such as the
U. S. (Panno et al. 2009), Israel (Kagan et al. 2005) , Italy(Postpischl et al. 1991, Kagan
et al. 2017, Di Domenica & Pizzi, 2017, Alfonsi & Cinti, 2021), Switzerland (Becker
et al., 2005, 2012), China (Xueqin & Fudong, 2017), the Kamaun Himalayas (India)
(Rajendran et al., 2016), the lower Tatra mountains in Slovakia (Szczygiel et al., 2021),
the Carpathians in the Czech republic(Babek et al. (2015), Monaco(Gilli, 1999) among
others.
In the 2009 book “Paleoseismology” by McCalpin, a very short overview on paleo
seismic research on cave sediments (or as the author names it “speleoseismology”) is
given, from the beginnings of the discipline to more recent developments. The author
also writes about the importance of ruling out all other possibilities before inferring an
earthquake origin of any structure in the cave.
In 2015, Shanov and Kostov published another monograph on the issue with the goal
of providing a comprehensive monograph.
19
It has been reported from areas of low strain and infrequent damaging earthquakes,
that cave features and speleothems may fail spontaneously without a triggering event.
This possibility has been reported by Lang et al. 2021.
Panno et al. (2009) could show that cave sediments from southwestern Illinois and
southeastern Missouri can be used as archives for earthquakes from the New Madrid
Seismic Zone (NMSZ). According to the authors, the timing of the initiation and
regrowth of stalagmites in southwestern Illinois and southeastern Missouri caves is
consistent with the historic and prehistoric record of seismic events in the U.S. mid
continent region. They conclude that dating the initiation of original stalagmite growth
and later post-seismic-event rejuvenation may be used as paleo seismic method and
that these methods may be used for caves all over the world.
There are several studies published for paleo seismic events in Israel which are related
to the Dead Sea transform. Two examples for well-studied caves are the Soreq and the
Har-Tuv caves which lie very close. A good example of paleo seismic research in
Israel is given by Kagan (2012) where they analyzed two different types of archives:
lacustrine sediments from the paleo-Dead Sea and speleothems from the two caves
mentioned above. While the lacustrine sediments only cover a time span of 70 kyr, the
speleothems provide a 400 kyr earthquake history. They analyzed damaged cave
deposits such as collapsed stalactites, fallen stalagmites, standing but severed
stalagmites, collapsed bedrock ceilings, cracked speleothems and collapsed soil
mounds. The author distinguishes between pre-event sedimentation and post-event
deposits which can also be called regrowth. To date the event, both pre-event and post-
event sediments are sampled as close as possible to the contact and both samples are
then dated by measuring the U-Th-Pb ratios by applying the MC-ICP-MS
(Multicollector-Inductively Coupled Plasma Mass Spectrometer) method. The
20
acquired dates are then checked for errors and grouped into 26 groups which Kagan
(2012) interprets to represent single events or earthquakes.
For Switzerland, Becker et al. (2005, 2012) could reconstruct several events from
geological evidence. They could see records of the 1356 Basel earthquake, the 1601
Unterwalden earthquake and the 1774 Altdorf Earthquake in the record and used these
events for calibration of the data. In total, they could find evidence for 13 earthquakes
of M 6 or greater in their records. In the Becker et al. studies (2005, 2012), samples
were dated by the radiocarbon method.
A study from the foreland of the Western Carpathians was published by Bábek et al.
(2015), where they could show indication of a tectonic origin of the breakage of
speleothems. By dating soft sediments with optically stimulated luminescence (OSL)
and 14C-dating, they could assign the events to a late Pleistocene to early Holocene age
(MIS 2 to 1).
A general overview of the use of speleothems for seismo tectonic and paleo seismic
studies has been published by Forti (2001). The author suggests that the study of
speleothems may be used to reconstruct the location and epicenter of past earthquakes,
their relative and absolute dating and their magnitude and proposes these studies to be
used to improve seismic hazard evaluation.
While speleothem damage may be caused by seismic events of a larger magnitude,
even moderate earthquake activity might be recorded in speleothems due to changes
in the hydrogeologic conditions. Besides damaged speleothems, research may also be
carried out on still growing stalagmites, as the growing axis may be perturbed by
several factors such as the migration of the dripping point along a fracture on the
ceiling and by gravity sliding of the stalagmite.
21
As a certain magnitude of an earthquake and a certain measure of horizontal
movements is needed to fracture a speleothem, the presence of fragile but non-
fractured speleothems such as soda straw speleothems in a cave is a sign for the
absence of strong seismic events in that area (Bokelmann & Gribovszki, 2015). With
knowledge about the mechanical properties of speleothems and their structural
stability it is also possible to reconstruct a maximum magnitude of seismic events
which they could resist. This can be an indicator of the maximum magnitude of seismic
events which could have happened in the area, and which are not directly recorded in
the speleothem. Every event with a magnitude that exceeds the stability of the
speleothem would have destroyed it. Forti & Postpischl (1984) modeled stalagmites
as simple inverted pendulums, which they then subjected to pseudo static engineering
analyses.
Lacave et al. (2000),investigated the mechanical properties of speleothems and
measured the natural frequencies and the damping on several different speleothems.
They could show that most of the speleothems do not show dynamic amplification
phenomena of the seismic motion because their natural moving frequency is higher
than the frequency range produced by seismic events. A fundamental frequency higher
than the seismic frequencies means that the speleothem moves, with its basement, as
a rigid structure. The exceptions from these findings were extremely thin soda straw
speleothems. According to Lacave et al. (2000), most of the broken speleothems are
an indicator of the peak ground acceleration.
In another study, Lacave et al. (2004), measured the stability of speleothems by
carrying out static bending tests on stalactites and soda straws. In this way, they could
22
measure the mean tensile resistance of the structure. The key finding of this study was,
that not all speleothems have similar tensile strength but there is a large variation
between the measured samples. These variations make it very complicated to estimate
the acceleration necessary to break an individual speleothem. To overcome this issue,
the authors developed a statistical approach which allowed them to study the
speleothems and to estimate the probability that at least one moderate earthquake
occurred in their study area.
It is also possible to use deformation structures in soft cave sediments as an archive.
While the use of speleothems and other cave minerals as paleo seismic archives is a
well-established field of research, there is also criticism to this method (Becker et al.,
2006). Many of the critics attribute the fracturing of speleothems to other factors such
as cave ice and thus argue that speleothems should not be used as archives for
paleoseismic events. As Forti and Postpischl wrote in 1984 “the geological,
morphological and speleogenetic analyses can be useful in distinguishing the various
types of collapses that may be present in caves, even if such analyses will never be
able to give a definitive certainty as to their cause “.
The focus of the critics differs a bit with Gilli (1999) putting the emphasis on creeping
of cave ice and displacement of soft sediment. The author states that soft sediments in
a cave are inflated during freezing and that they move gravity driven downwards
slopes if the gallery is not horizontal. If a speleothem formed on this sediment, it is
pulled down-slope and is in this way deformed or in cases of more pronounced
displacement the speleothem is broken by that motion.
23
Kempe (2004) mentions some more possible causes for speleothem damages. The first
cause mentioned is inkasion (rock fall) if sediments from the ceiling of the cave fall
on sediments at the floor. Mass wasting can occur when limestone is formed on top of
clay stone which can then act as a failure plane. The weight of stalagmite and flow
stones can cause the underlaying soft sediment to compact, in turn leading to tilting of
the stalagmite. Erosion of the sediment beneath a stalagmite can also cause tilting and
breakage of the stalagmite. In caves which have been inhabited by animals or which
have been open to humans, also biogenic factors and even vandalism need to be taken
into account. Besides these reasons, Kempe (2004) also mentions cave ice as a cause
for the destruction of speleothems, and one focus of this study is on how to reconstruct
the zero-degree-line from the damaged speleothems.
One way of discriminating between speleothem fractioning by seismic activity or by
ice movement is analyzing the way the fragments have been moved. While fragments
produced by an earthquake may only have been moved by gravity or by major floods,
the fragments produced by moving ice have been moved coherently during the flow
(Kempe et al. 2009, Forti & Onac 2016).
Another possible method would be the shape of the breakage, with failure planes
parallel to the stalagmite base being typical for fragmenting by a seismic event and
seismic stress.
Mendecki and Szczygiel (2019) postulated that there is a correlation between the
earthquake minimum magnitude required to damage a cave and the distance from the
source of the earthquake. They estimated natural frequencies from P- and S-wave
24
moduli and describe the influences of caves depth on Peak Ground Acceleration (PGA)
and give an introduction to the tunnel wave phenomenon in caves.
Gribovszki et al. (2018) simulated the oscillation of a given stalagmite by setting up
four simplified models of the stalagmite. They measured the geometries of intact
stalagmites in situ and the dimension of the fragments of broken speleothems in the
geotechnical laboratory. They then calculated the eigenfrequencies of the stalagmites
(the frequencies at which the stalagmite is prone to vibrate) and could in comparison
to the measured stalagmites show that there is a splitting. This splitting could be
reproduced in the calculation when the asymmetric shape of the speleothems was taken
into account. They tested if intact stalagmites in caves can give important constraints
on seismic hazard since they have survived all earthquakes over their (rather long) life
span and argue that this can only be stated if the pattern of earthquake oscillation is
fully understood.
3.3 Speleoseismicity and archives in Slovenia and the NW Dinarides
The very first observer that focused on the problematic of broken stalactites in Postojna
cave was Hohenwart (1830), who wrote about them in his touristic cave guide.
The first scientific research of speleoseismicity in Slovenia was carried out in the
1960’s in Postojna cave by Rado Gospodarič (1964, 1968). In his research on the
morphology and cave deposits of the Postojna cave the author concludes that broken
stalactites formed because of rockfalls, seismic activity or erosion of siliciclastic
allochthonous cave sediments. Gospodarič (1964) found a fault in siliciclastic cave
deposits in an artificial tunnel in Postojna cave with kinematic indicators, sinistral
25
strike-slip fault motion. Years later Sasowsky et. al. (2003) constricted the age of
tectonic movements of the faults crosscutting sediments with paleomagnetism, to be
younger than 780 ka.
Additionally, Sasowski et al. (2003) studied the directions of fallen stalactites in the
Magical garden (Slovenian: Čarobni Vrt) in the Postojna cave and came to the
conclusion that the stalactites in this cave do not show any preferable directions which
could have formed due to seismic activity.
In 2008, Sebela notes, that most broken and non-ideal stalagmites are formed due to
deformation of the unstable ground, which may be both caused by tectonic movements,
seismic events but also by cryoturbation and cave ice. However, as reported by Sebela
(2010), there are speleothem damages in the Postojna cave in Slovenia which can be
clearly attributed to seismic events.
According to Sebela (2010), the 1st January, 1926 earthquake (M=5.6) led to the
collapse of a stalagmite column of 1 m in diameter. The author admits that such a
large damage is very rare in karst caves and that it only took place because the
earthquake epicenter was in the very vicinity. While only strong and close earthquakes
can be felt as ground shaking or waving inside the caves, weaker earthquakes induce
brontides which can be heard inside the cave.
Zivcic et al. (2014) described the installation of a seismic station in the Postojna cave
system. A first, temporary station was installed in May 2010 and was operational until
21 December 2010. In their paper, they also propose the installation of a permanent
seismic station and give advice of where to install and how to operate it.
26
Grützner et. al (2021a, 2021b) investigated several surface paleoseismological
trenches across the strike-slip Dinaric trending faults in Slovenia: Idrija fault, Raša
fault and Selce fault. All the faults show signs of Holocene rupture deformations,
younger than 15 ka.
4 Study Area
4.1 Geographical and Geological Setting
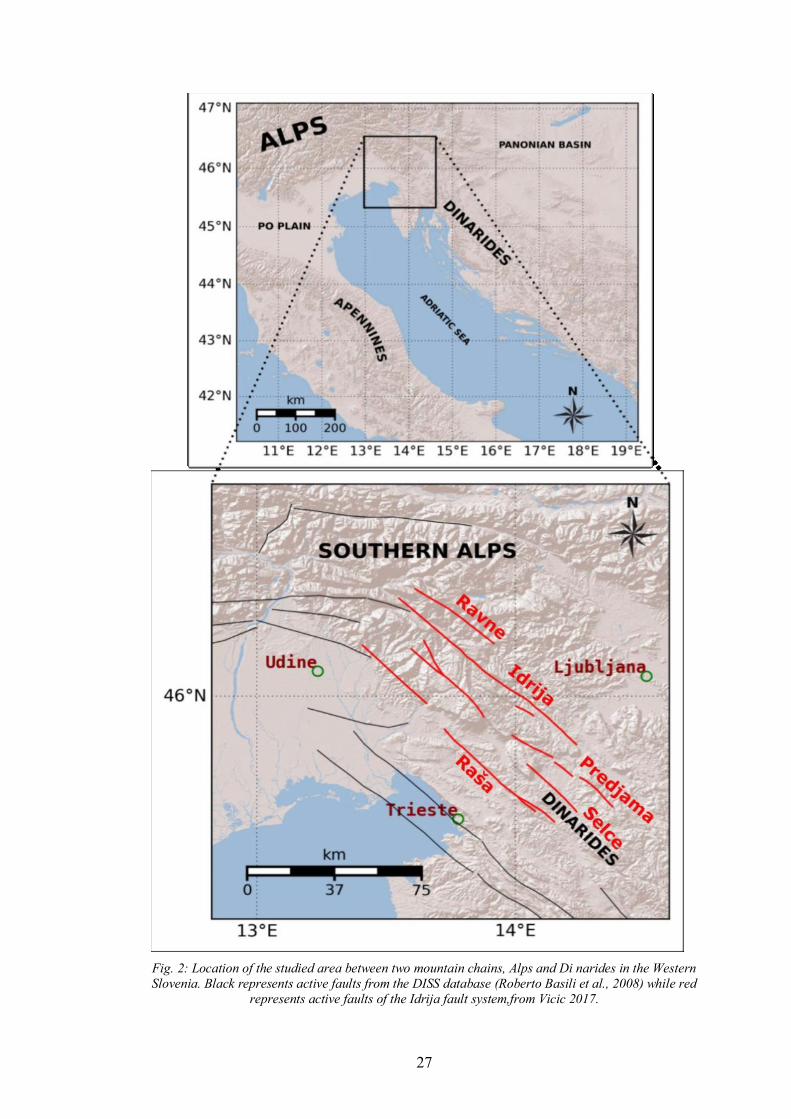
The study area is situated in the Dinaric Karst region in south-western Slovenia. The
area is situated in NE Italy and W Slovenia at the transition between two different
orogens, E-W trending Alps and the NW-SE trending Dinarides (Fig. 2). While caves
are ubiquitous to most karstic parts of Slovenia, the highest density of caves is in the
south-western region of Slovenia, called the Dinaric Karst (Fig. 3). Dinaric Karst
covers the area between the Ljubljana Marsh (Slovenia) to the east and the Bay of
Trieste (Italy) to the west and Rijeka (Croatia) to the south (Kranjc, 1997). It’s
comprised mostly of karstified Mesozoic carbonate strata. There are around 6,000
known and explored caves and other karstic phenomena such as karst polje, dolines
etc. in this area that covers approximately 6,400 km2 or 27% of the territory of
Slovenia. The area of Dianaric Karst has a diverse relief, which strongly reflects the
past and ongoing tectonic processes.
27
Fig. 2: Location of the studied area between two mountain chains, Alps and Di narides in the Western
Slovenia. Black represents active faults from the DISS database (Roberto Basili et al., 2008) while red
represents active faults of the Idrija fault system,from Vicic 2017.
28
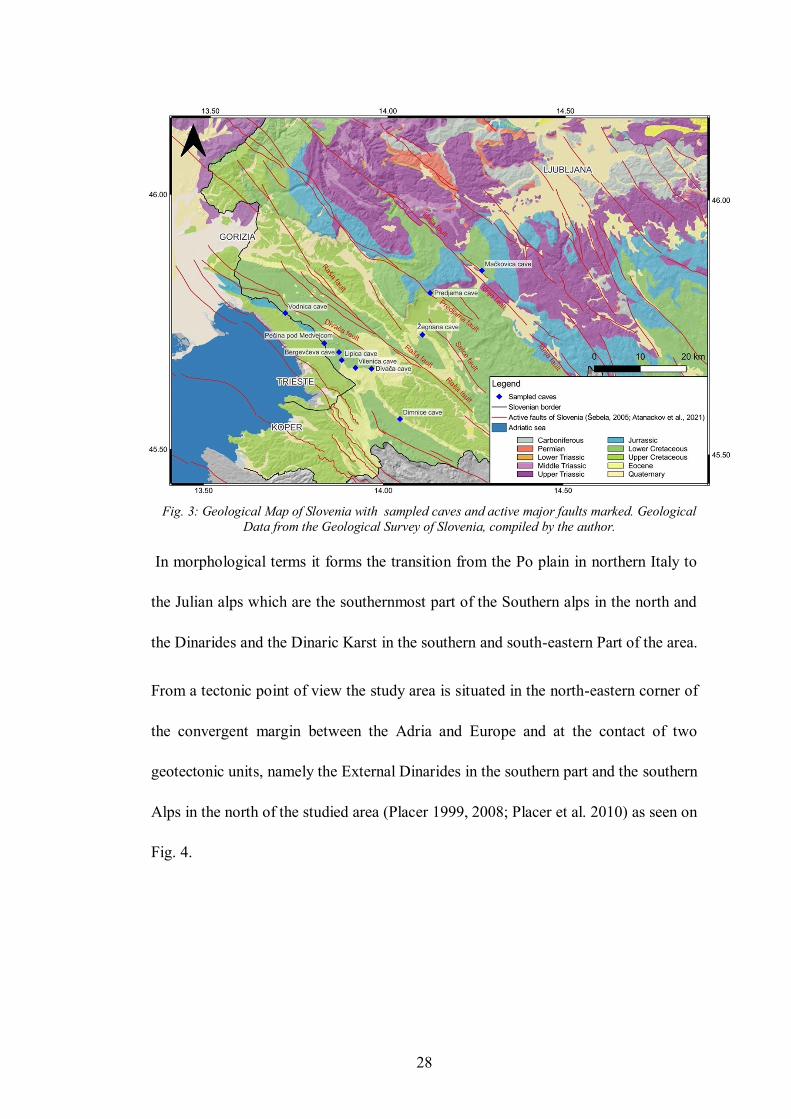
In morphological terms it forms the transition from the Po plain in northern Italy to
the Julian alps which are the southernmost part of the Southern alps in the north and
the Dinarides and the Dinaric Karst in the southern and south-eastern Part of the area.
From a tectonic point of view the study area is situated in the north-eastern corner of
the convergent margin between the Adria and Europe and at the contact of two
geotectonic units, namely the External Dinarides in the southern part and the southern
Alps in the north of the studied area (Placer 1999, 2008; Placer et al. 2010) as seen on
Fig. 4.
Fig. 3: Geological Map of Slovenia with sampled caves and active major faults marked. Geological
Data from the Geological Survey of Slovenia, compiled by the author.
29
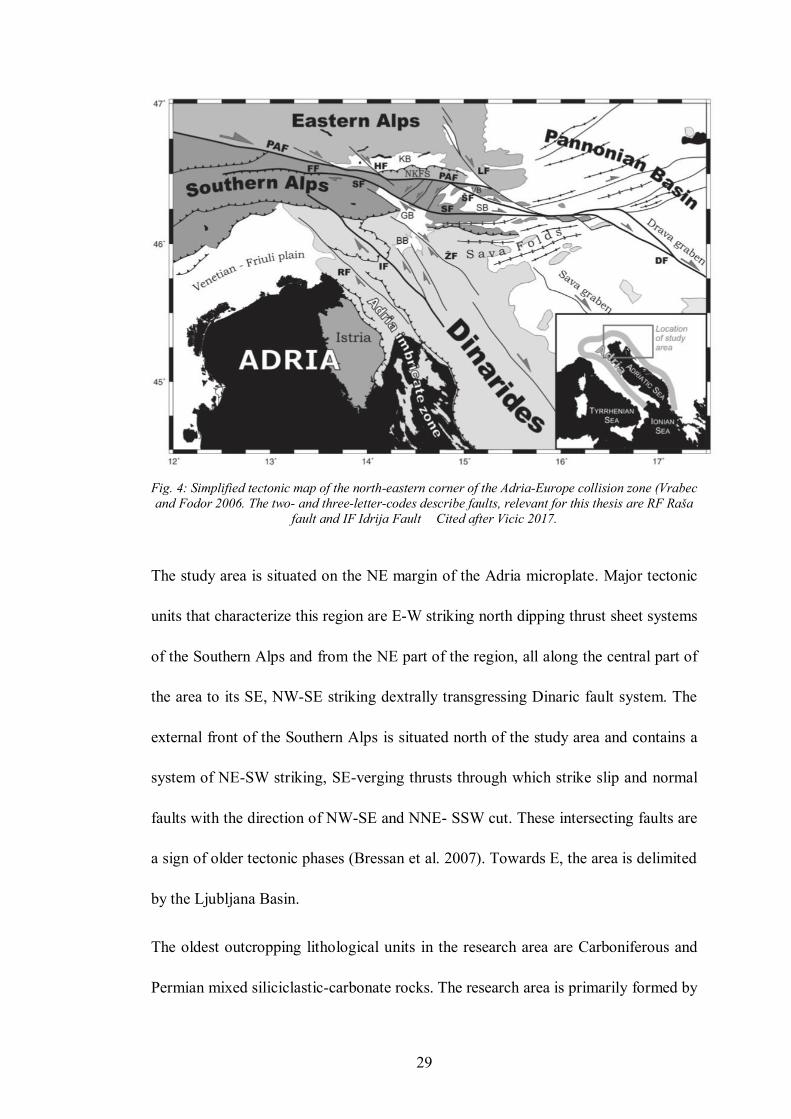
Fig. 4: Simplified tectonic map of the north-eastern corner of the Adria-Europe collision zone (Vrabec
and Fodor 2006. The two- and three-letter-codes describe faults, relevant for this thesis are RF Raša
fault and IF Idrija Fault Cited after Vicic 2017.
The study area is situated on the NE margin of the Adria microplate. Major tectonic
units that characterize this region are E-W striking north dipping thrust sheet systems
of the Southern Alps and from the NE part of the region, all along the central part of
the area to its SE, NW-SE striking dextrally transgressing Dinaric fault system. The
external front of the Southern Alps is situated north of the study area and contains a
system of NE-SW striking, SE-verging thrusts through which strike slip and normal
faults with the direction of NW-SE and NNE- SSW cut. These intersecting faults are
a sign of older tectonic phases (Bressan et al. 2007). Towards E, the area is delimited
by the Ljubljana Basin.
The oldest outcropping lithological units in the research area are Carboniferous and
Permian mixed siliciclastic-carbonate rocks. The research area is primarily formed by
30
heavily karstified Mesozoic carbonate rocks and secondarily clastic rocks. The
southern part consists of both Mesozoic carbonates and Tertiary, predominately
siliciclastic rocks (flysch). Mesozoic carbonates paleo-geographically belong to the
Adriatic Carbonate platform. Within the Dinaric fault system, mainly on the Idrija fault
there are several pull-apart basins, which are mostly filled with younger Quaternary
sediments (Buser, 2009).
The convergence between Africa and Eurasia is the main driver behind the regional
geotectonic processes. When the Atlantic Ocean opened around 140Myr ago, the
convergence in the study area started (Stampfli et al., 1998; Stampfli & Borel, 2002).
The African promontory began to move independently from the African plate between
67-35 Myr ago, carving the Adriatic microplate between the European plate to the
north the Iberian microplate to the west and the African plate to the south (Handy,et
al. 2010). Around 40-35 Myr ago, the collision between the Adria microplate and the
European plate started (Lippitsch, 2003; O’Brien, 2001; Stampfli et al., 1998; Stampfli
& Borel, 2002), forming two orogens, the Dinarides at the north-eastern margin of the
Adria microplate and the Alps at the northern margin of that microplate.
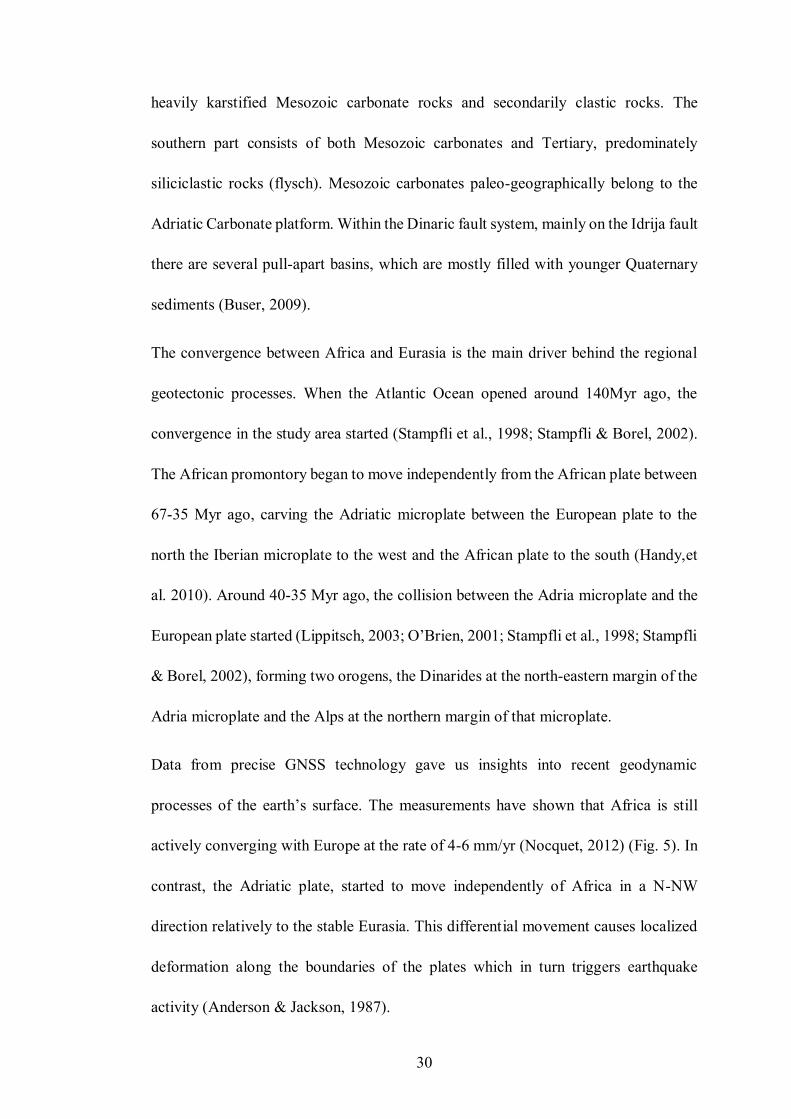
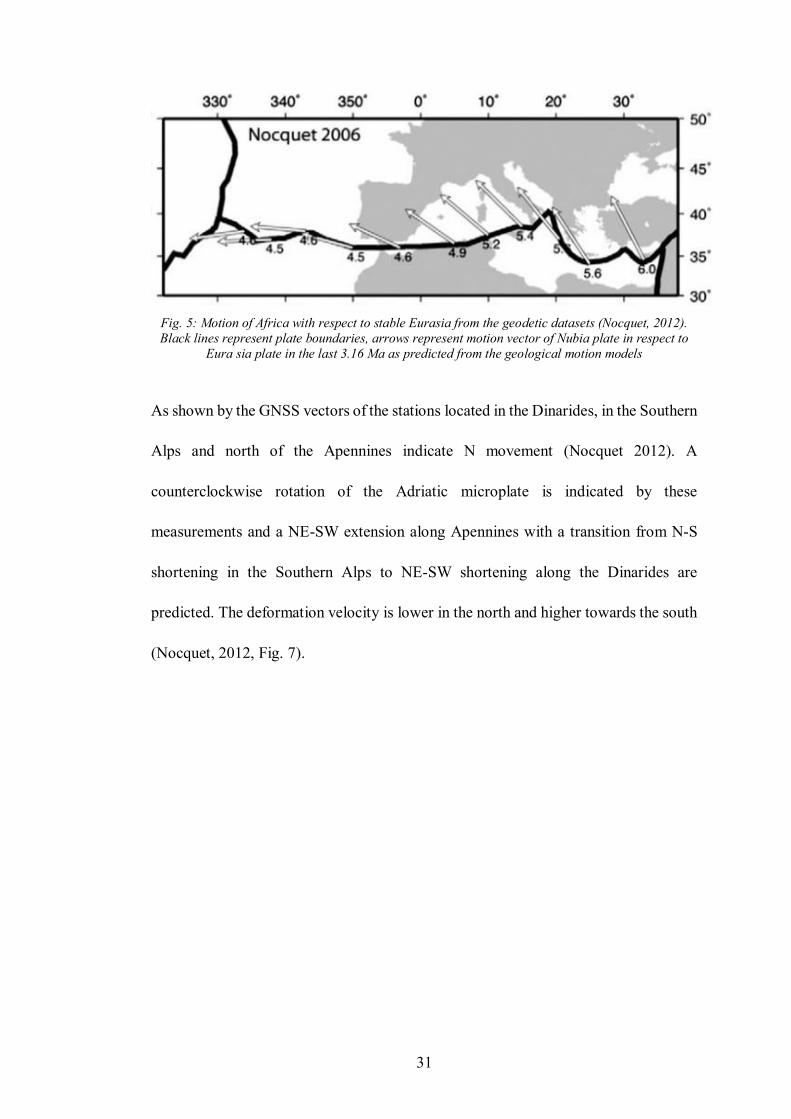
Data from precise GNSS technology gave us insights into recent geodynamic
processes of the earth’s surface. The measurements have shown that Africa is still
actively converging with Europe at the rate of 4-6 mm/yr (Nocquet, 2012) (Fig. 5). In
contrast, the Adriatic plate, started to move independently of Africa in a N-NW
direction relatively to the stable Eurasia. This differential movement causes localized
deformation along the boundaries of the plates which in turn triggers earthquake
activity (Anderson & Jackson, 1987).
31
Fig. 5: Motion of Africa with respect to stable Eurasia from the geodetic datasets (Nocquet, 2012).
Black lines represent plate boundaries, arrows represent motion vector of Nubia plate in respect to
Eura sia plate in the last 3.16 Ma as predicted from the geological motion models
As shown by the GNSS vectors of the stations located in the Dinarides, in the Southern
Alps and north of the Apennines indicate N movement (Nocquet 2012). A
counterclockwise rotation of the Adriatic microplate is indicated by these
measurements and a NE-SW extension along Apennines with a transition from N-S
shortening in the Southern Alps to NE-SW shortening along the Dinarides are
predicted. The deformation velocity is lower in the north and higher towards the south
(Nocquet, 2012, Fig. 7).
32
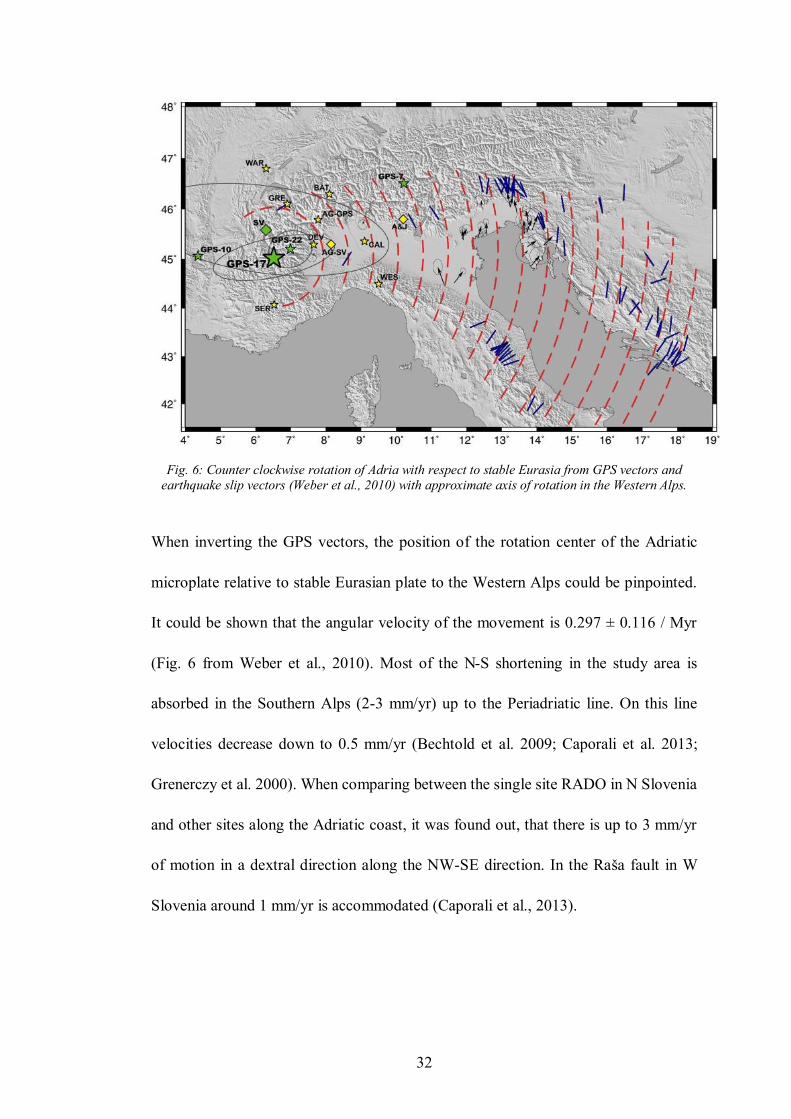
Fig. 6: Counter clockwise rotation of Adria with respect to stable Eurasia from GPS vectors and
earthquake slip vectors (Weber et al., 2010) with approximate axis of rotation in the Western Alps.
When inverting the GPS vectors, the position of the rotation center of the Adriatic
microplate relative to stable Eurasian plate to the Western Alps could be pinpointed.
It could be shown that the angular velocity of the movement is 0.297 ± 0.116 / Myr
(Fig. 6 from Weber et al., 2010). Most of the N-S shortening in the study area is
absorbed in the Southern Alps (2-3 mm/yr) up to the Periadriatic line. On this line
velocities decrease down to 0.5 mm/yr (Bechtold et al. 2009; Caporali et al. 2013;
Grenerczy et al. 2000). When comparing between the single site RADO in N Slovenia
and other sites along the Adriatic coast, it was found out, that there is up to 3 mm/yr
of motion in a dextral direction along the NW-SE direction. In the Raša fault in W
Slovenia around 1 mm/yr is accommodated (Caporali et al., 2013).
33
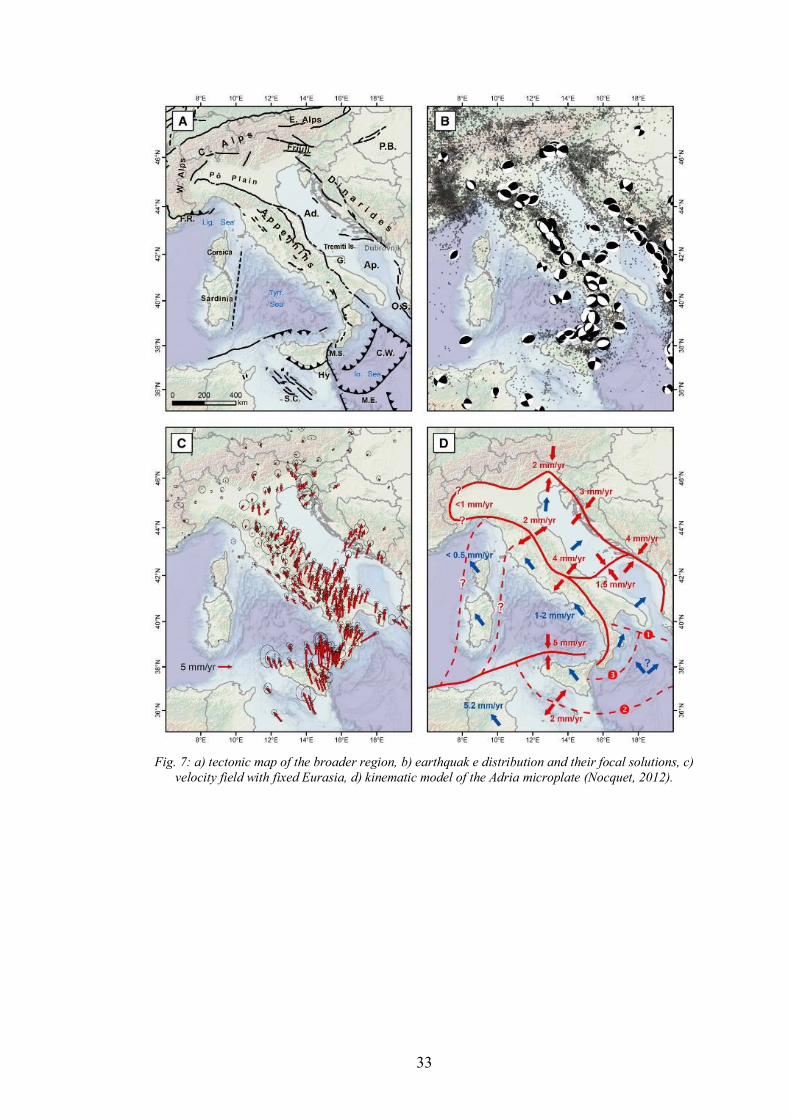
Fig. 7: a) tectonic map of the broader region, b) earthquak e distribution and their focal solutions, c)
velocity field with fixed Eurasia, d) kinematic model of the Adria microplate (Nocquet, 2012).
34
4.2 Seismotectonic overview of NW Dinarides and current seismic
activity
Slovenia is overall considered as a region with moderate seismicity, especially the
western parts of Slovenia. Here we find the largest and most active faults in Slovenia
present there, the regional dextral-strike slip faults, the so called Dinaric fault system
(Atanackov et al. 2021). The fault zone is formed by several seismically active NW-
SE trending faults which are the main focus of this study.
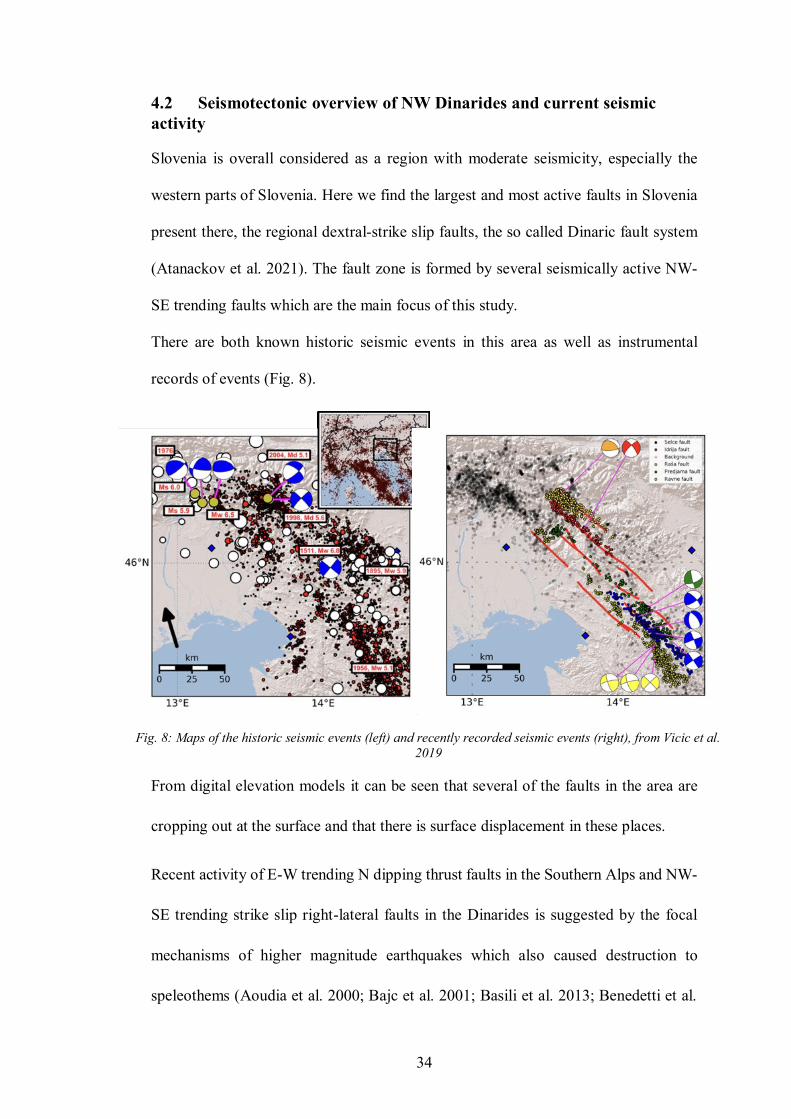
There are both known historic seismic events in this area as well as instrumental
records of events (Fig. 8).
From digital elevation models it can be seen that several of the faults in the area are
cropping out at the surface and that there is surface displacement in these places.
Recent activity of E-W trending N dipping thrust faults in the Southern Alps and NW-
SE trending strike slip right-lateral faults in the Dinarides is suggested by the focal
mechanisms of higher magnitude earthquakes which also caused destruction to
speleothems (Aoudia et al. 2000; Bajc et al. 2001; Basili et al. 2013; Benedetti et al.
Fig. 8: Maps of the historic seismic events (left) and recently recorded seismic events (right), from Vicic et al.
2019
35
2000; Burrato et al. 2008; Fitzko et al. 2005; Galadini et al. 2005; Kastelic et al. 2004,
2008; Poljak et al. 2000; Ribarič 1982; Vrabec and Fodor 2006; Zupančič et al. 2001).
In the northernmost part of the Dinarides older thrust faults are present which are
oriented in the NW-SE direction dipping towards the northeast.
There are also younger, active strike slip faults with the same direction and which are
sub-vertical. The direction of the younger faults is inherited from the older structures
(Kastelic et al., 2008; Placer, 2008a). These faults are named »Dinaric faults«, the
name is derived from their orientation which is in the same direction as the older
mainly compression related structures in the Dinarides. While they also mainly consist
of NW-SE oriented NE dipping thrusts, they are not related to the Dinaric thrusting
episode (Vrabec & Fodor, 2006). The whole fault system has a length of around 150
km and stretches between 46.3°N and 45.2°N along a N315 – S135 direction. Between
the faults there is a separation zone consisting of 10 to 15 km of width with 10 to 18
km long segments (Moulin, 2014, Moulin et al., 2016).
While several of the strike-slip faults have a geomorphological expression and
morphologic activity on the surface, only some of them show a direct connection to
recent earthquake activity in the area. The other ones may be connected to older
activity.
36
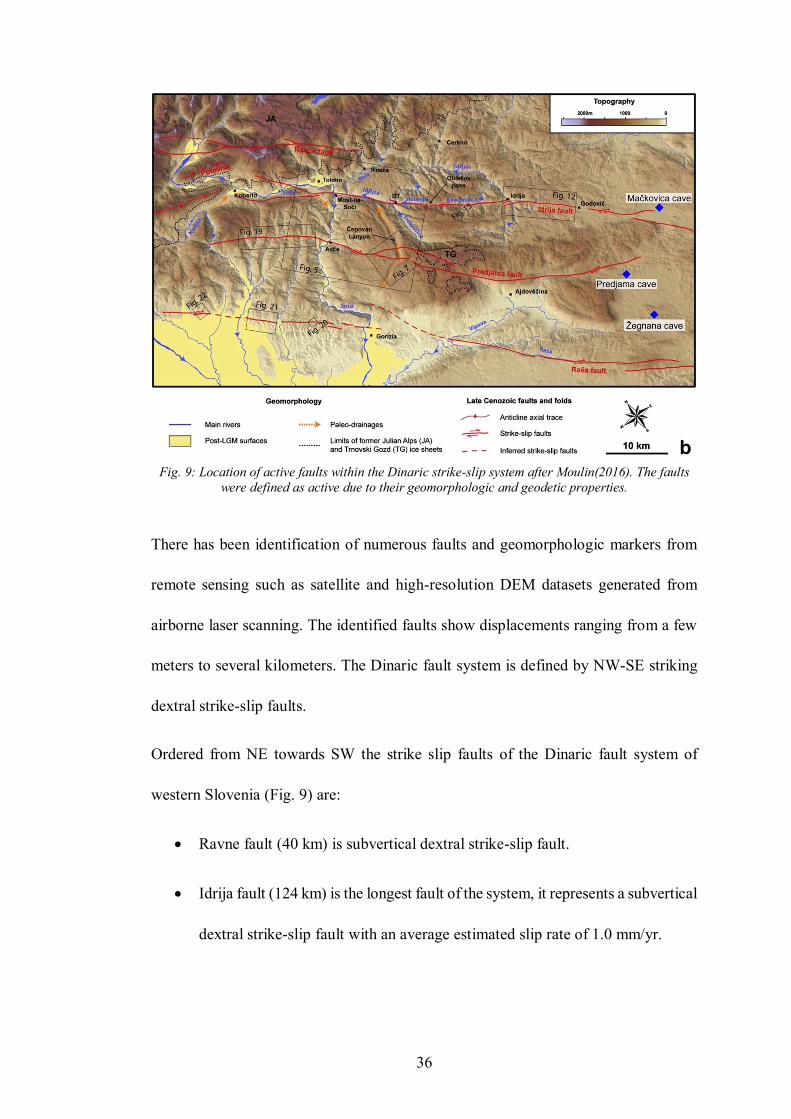
Fig. 9: Location of active faults within the Dinaric strike-slip system after Moulin(2016). The faults
were defined as active due to their geomorphologic and geodetic properties.
There has been identification of numerous faults and geomorphologic markers from
remote sensing such as satellite and high-resolution DEM datasets generated from
airborne laser scanning. The identified faults show displacements ranging from a few
meters to several kilometers. The Dinaric fault system is defined by NW-SE striking
dextral strike-slip faults.
Ordered from NE towards SW the strike slip faults of the Dinaric fault system of
western Slovenia (Fig. 9) are:
• Ravne fault (40 km) is subvertical dextral strike-slip fault.
• Idrija fault (124 km) is the longest fault of the system, it represents a subvertical
dextral strike-slip fault with an average estimated slip rate of 1.0 mm/yr.
37
• Predjama fault (75 km) fault is a steeply NE-dipping dextral transpressive fault,
with an average estimated slip rate of 0.7 mm/yr.
• Raša fault (87 km) is a subvertical dextral strike-slip fault with an average
estimated slip rate of 0.7 mm/yr.
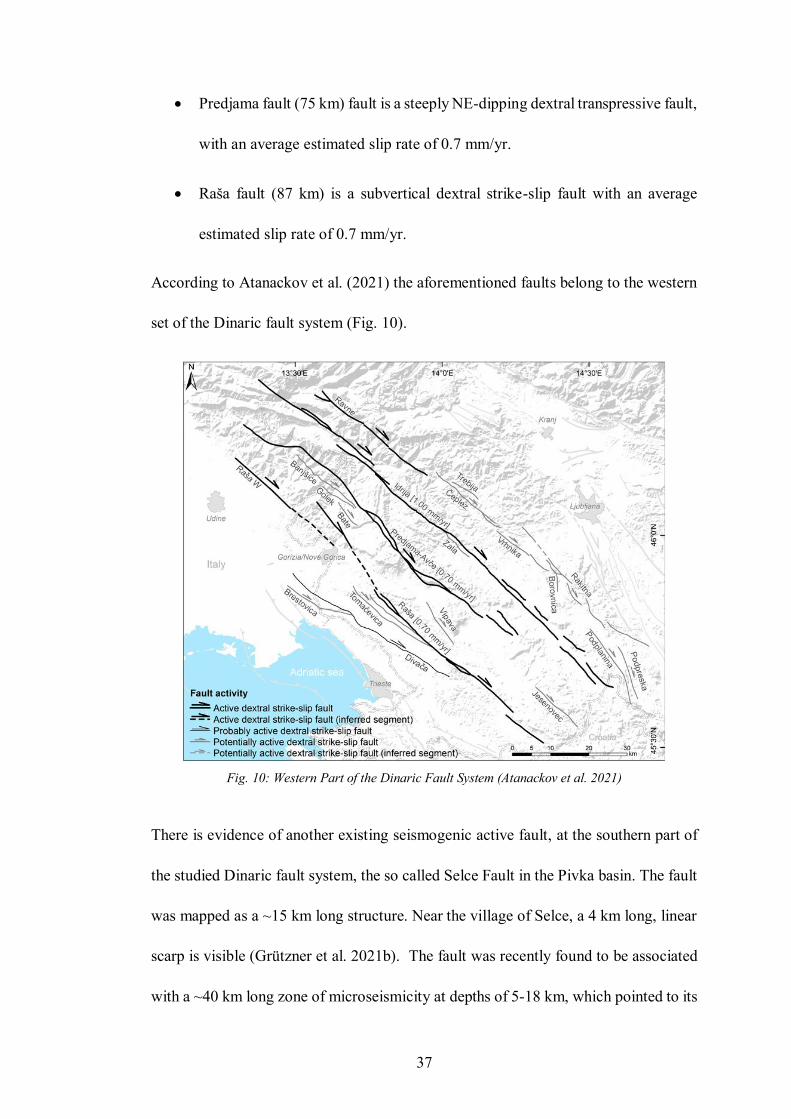
According to Atanackov et al. (2021) the aforementioned faults belong to the western
set of the Dinaric fault system (Fig. 10).
Fig. 10: Western Part of the Dinaric Fault System (Atanackov et al. 2021)
There is evidence of another existing seismogenic active fault, at the southern part of
the studied Dinaric fault system, the so called Selce Fault in the Pivka basin. The fault
was mapped as a ~15 km long structure. Near the village of Selce, a 4 km long, linear
scarp is visible (Grützner et al. 2021b). The fault was recently found to be associated
with a ~40 km long zone of microseismicity at depths of 5-18 km, which pointed to its
38
activity (Vičič et al., 2019). In 2008 and 2014, earthquakes with magnitudes of ML3.0
and ML4.7, showed a right-lateral focal mechanism (Vičič et al., 2019).
All of these faults show recent activity when judged from a geomorphological
perspective. Along the Predjama fault there is a bend in the fault strike and a
bifurcation into two branches. The general trend of the Predjama fault is parallel with
the Idrija fault, which could mean that both could merge at depth (Moulin et al., 2016).
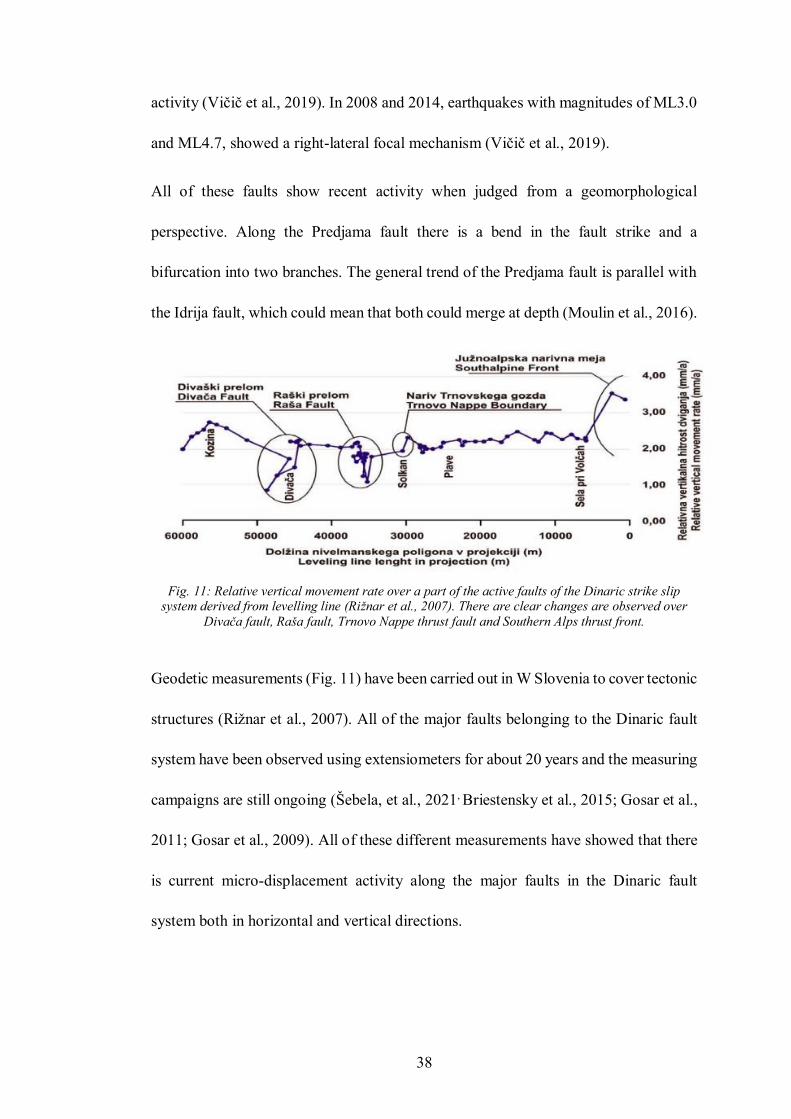
Fig. 11: Relative vertical movement rate over a part of the active faults of the Dinaric strike slip system derived from levelling line (Riznar et al., 2007). There are clear changes are observed over
Divaca fault, Raša fault, Trnovo Nappe thrust fault and Southern Alps thrust front.
Geodetic measurements (Fig. 11) have been carried out in W Slovenia to cover tectonic
structures (Riznar et al., 2007). All of the major faults belonging to the Dinaric fault
system have been observed using extensiometers for about 20 years and the measuring
campaigns are still ongoing (Šebela, et al., 2021, Briestensky et al., 2015; Gosar et al.,
2011; Gosar et al., 2009). All of these different measurements have showed that there
is current micro-displacement activity along the major faults in the Dinaric fault
system both in horizontal and vertical directions.
39
4.3 Known historic earthquakes in the area
While there are numerous known historic earthquakes from the study area (for a
compilation see Vicic 2017), only a few of them have been observed as being recorded
in the speleothems investigated in this study. For example, Šebela (2010) and
references therein states, there is sufficient proof of broken speleothems as a co-
seismic effect in Postojna cave during the 1st January 1926 earthquake (M=5.6). A
newspaper reported a few days later after the earthquake that a massive stalagmite of
almost 1 m in diameter collapsed due to the earthquake. The collapsed stalagmite was
removed from the cave shortly after the event. A that time Zagreb seismic observatory
determined the epicentral area of the earthquake to be in Cerknica polje. However, the
Venice observatory calculated Postojna as the epicenter. The depth was estimated at
around 17 km.
While this is not a common event in karst cave, it probably resulted because of the
close proximity of the Postojna cave to the proposed epicenter. The epicenter was
located either on the SE part of Idrija fault zone or in the Javorniki mountains.
For the other historic earthquakes, it is quite likely, that the source was too far from
the investigated cave for the magnitude of the earthquake to have any significant effect
on the speleothems.
In the following the two earthquakes which could be related to the dated disruption
events in the investigated speleothems are described in more detail. These are the 1511
Idrija earthquake and the 1998 Bovec earthquake.
40
4.3.1 1511 Idrija Earthquake
The 1511 Idrija earthquake happened on 26th of March 1511 between 3 and 4 pm local
time. According to Ribaric (1979), the event consisted of two earthquakes happening
after each other. The center of the first event was NW of the town Tolmin which is
situated on the border between Slovenia and Italy. The first event had M 6.9.
The second event had its center east of the city of Gemona in Friuli, Italy and is
estimated to have had a magnitude of approx. 7.0 to 7.2.
All other sources except Ribaric (1979) only report one earthquake during this event.
Later on this discrepancy was noted by Košir and Cecić (2011) who could show that
the available historic information was not interpreted in a correct way by Ribaric.
Fitzko et al. (2005) further discussed the problematics of two mainshocks vs. one main
shock. They created a best fit scenario by doing modelling with synthetic earthquakes
and comparing the results to reported intensities.
According to Fitzko et al. (2005) the most likely candidate was a right lateral strike
slip earthquake along the Idrija fault with MW 6.9 with a 50-km long rupture,
propagating towards NW. This is a likely result as similar hypotheses were found by
other researchers such as Tiberi (2014). Bavec (2013) discussed a surface rupture
which could also be observed in reality.
41
4.3.2 1956 and 1995 Ilirska Bistrica earthquakes
The 1956 Ilirska Bistrica earthquake occurred on the 31st January in 1956, and it was
one of the most devastating earthquakes of the 20th century in Slovenia. With a
magnitude of 5.1 and the intensity of VII EMS. The depth of the source was
approximated at 7 km. The damage was mostly confined to the town and surroundings
of Ilirska Bistrica, with 30% of buildings heavily affected, although the event was felt
in a radius of about 140 km.
On 22nd of May 1995 two earthquakes occurred and they were ranked as some of the
more devastating ones in the last 30 years. The first event had a magnitude of 4.4 and
intensity of VI EMS, at the depth of 17 km. Just an hour later a second earthquake
occurred with a magnitude of 4.7, with the intensity of VI EMS, at a depth of about 10
km. Around 80 aftershocks were reported in the following days.
The 1956 ML 5.1 Ilirska Bistrica earthquake might have been caused by the Raša fault
(Ribarič, 1982). Two coseismic effects of 1995 Ilirska Bistrica in caves were reported
(Šebela, 2010 and references in therein). In Dimnice cave a strong wind and a sound
and splashing of water in the under-ground river were noticed by a group of cavers
that were in the cave at that time. In the Zelše cave, a fallen rock hit a flowstone column
about 1.3 m high and broke it off beneath the cave ceiling, causing the column to
overturn.
42
4.3.3 1998 Bovec Earthquake
The “Bovec” earthquake occurred on the 12th of April 1998 at 10:55 am UTC and had
a magnitude of M 5.7. The event happened along the Ravne fault in NW Slovenia.
Intensities up to VIII EMS were reported in the area. The depth of the source was
estimated at 8 km.
The earthquake caused damage to a number of buildings and triggered rockfalls. This
geomorphologic change was supported by the relief in the mountainous area. After the
main earthquake, a number of aftershocks with magnitudes up to M 4.2 occurred in a
period of several weeks.
Bajc et al. (2001) relocated the 1998 sequence and gave a new depth of the center of
around 7.6 km. They used the Joint Hypocentre Determination method for teleseismic
events and suggested that there was a fault rupture with an upper boundary at 3 km
along a length of 13 km. They reported that the rupture had a width of 7 km. According
to Bajc et al. (2001) the rupture propagated in both directions which is also compatible
with the aftershock distribution. Bressan et al. (2008) suggested that the fault zone is
characterised by mechanical heterogeneities.
The surface of the area was studied by a group of geomorphologists (Cunningham et
al. 2006). They used modern remote sensing data acquired using the LiDAR method.
With the high resolution data available, they observed many splays along the Ravne
fault with not so apparent strike-slip offsets. The Tolminka Springs basin close to the
epicenters of both earthquakes was defined as a transtensional basin constructed in an
overall transpressional system. No evident continuous surface trace of the Ravne fault
43
could be observed by Kastelic et al. (2008), instead at the surface they observed a fault
zone of moderate to steep NE dipping fault planes at the surface, demonstrating
thrust/reverse mechanisms.
After the 1998 earthquake another earthquake occurred in 2004. So far this was the
last earthquake which was observed here.
The geological slip rate along the Predjama, Idrija and Raša fault is as an average over
the last 255 ka estimated to range between 1.15 and 1.45 mm/yr, while the overall slip
rate along the fault system is estimated to be 3.75 ± 0.6 mm/yr. There are changes in
slip rates along different sites within the same segment, probably the slip towards the
tips of the activated fault segment is lower (Moulin et al., 2016). Atanackov et al.
(2021) approximated a slip rate of 2.5 mm/yr of dextral strike slip across the 25 km
wide zone of the Predjama, Idrija and Raša fault.
44
5 Caves and Sampling
5.1 Sampled Caves and sample descriptions
In this study ten caves situated in Slovenia, north-western Dinarides, were visited and
multiple samples were taken from these caves (Fig. 1). Primarily the selection of
sampled cave was based on geographical location, their vicinity to the major
seismically active NW-SE trending fault zones and their spatial distribution crosswise
(SW-NE) the fault zones. Permitting the use of data for regional paleo seismic event
interpretation in the study area. Secondarily it was based on the aforementioned factors
which exclude deformed speleothems other than seismically deformed ones. All
studied caves are formed within Jurassic carbonate rocks, mainly limestone (Fig. 3).
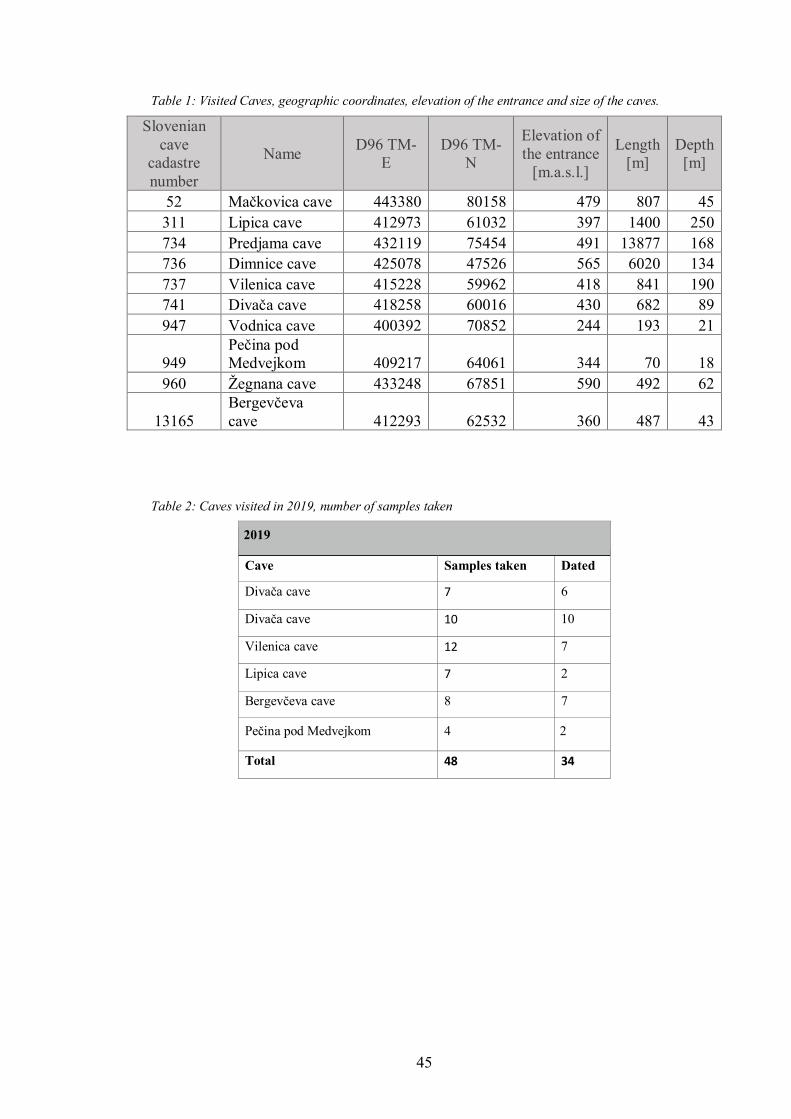
The sampling began in the spring of 2019 and ended in summer of 2021. All caves had
one sampling campaign, except Divača cave which had two. The total number of
sampled speleothems amounted to 90, 34 of which were dated until now. Samples
from more recent cave sampling campaigns are expected to be tested. The caves, their
basic information (according to the Slovenian cave cadastre, November 2021; cadastre
number, coordinates, elevation of the entrance, length and depth) along with the
sample quantities are to be found in the following tables (Table 1-Table 4):
45
Table 1: Visited Caves, geographic coordinates, elevation of the entrance and size of the caves.
Slovenian
cave
cadastre
number
Name D96 TM-
E
D96 TM-
N
Elevation of
the entrance
[m.a.s.l.]
Length
[m]
Depth
[m]
52 Mačkovica cave 443380 80158 479 807 45
311 Lipica cave 412973 61032 397 1400 250
734 Predjama cave 432119 75454 491 13877 168
736 Dimnice cave 425078 47526 565 6020 134
737 Vilenica cave 415228 59962 418 841 190
741 Divača cave 418258 60016 430 682 89
947 Vodnica cave 400392 70852 244 193 21
949
Pečina pod
Medvejkom 409217 64061 344 70 18
960 Žegnana cave 433248 67851 590 492 62
13165
Bergevčeva
cave 412293 62532 360 487 43
Table 2: Caves visited in 2019, number of samples taken
2019
Cave Samples taken Dated
Divača cave 7 6
Divača cave 10 10
Vilenica cave 12 7
Lipica cave 7 2
Bergevčeva cave 8 7
Pečina pod Medvejkom 4 2
Total 48 34

46
Table 3:Caves visited in 2020, number of samples taken
2020
Cave Samples taken
Dimnice cave 11
Vodnica cave 5
Predjama cave 14
Mačkovica cave 10
Total 40
Table 4: Cave visited in 2021, number of samples taken
2021
Cave Samples taken
Žegnana cave 2
Total 2
47
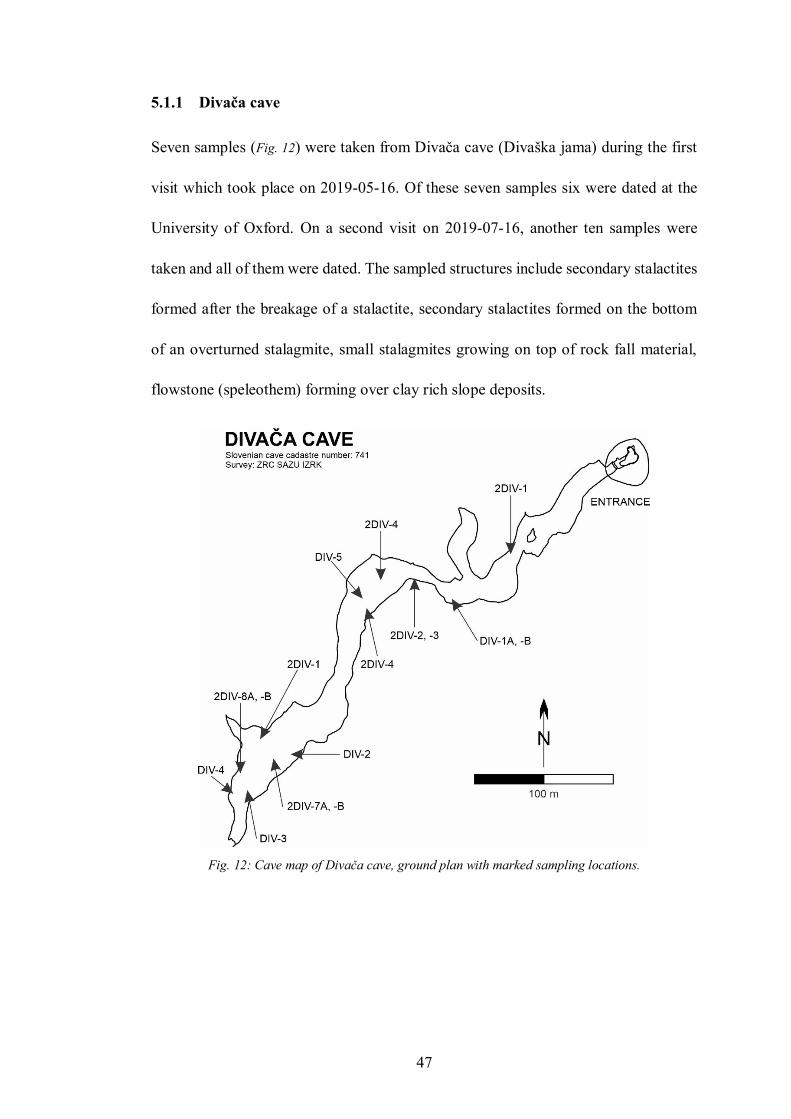
5.1.1 Divača cave
Seven samples (Fig. 12) were taken from Divača cave (Divaška jama) during the first
visit which took place on 2019-05-16. Of these seven samples six were dated at the
University of Oxford. On a second visit on 2019-07-16, another ten samples were
taken and all of them were dated. The sampled structures include secondary stalactites
formed after the breakage of a stalactite, secondary stalactites formed on the bottom
of an overturned stalagmite, small stalagmites growing on top of rock fall material,
flowstone (speleothem) forming over clay rich slope deposits.
Fig. 12: Cave map of Divaca cave, ground plan with marked sampling locations.
48
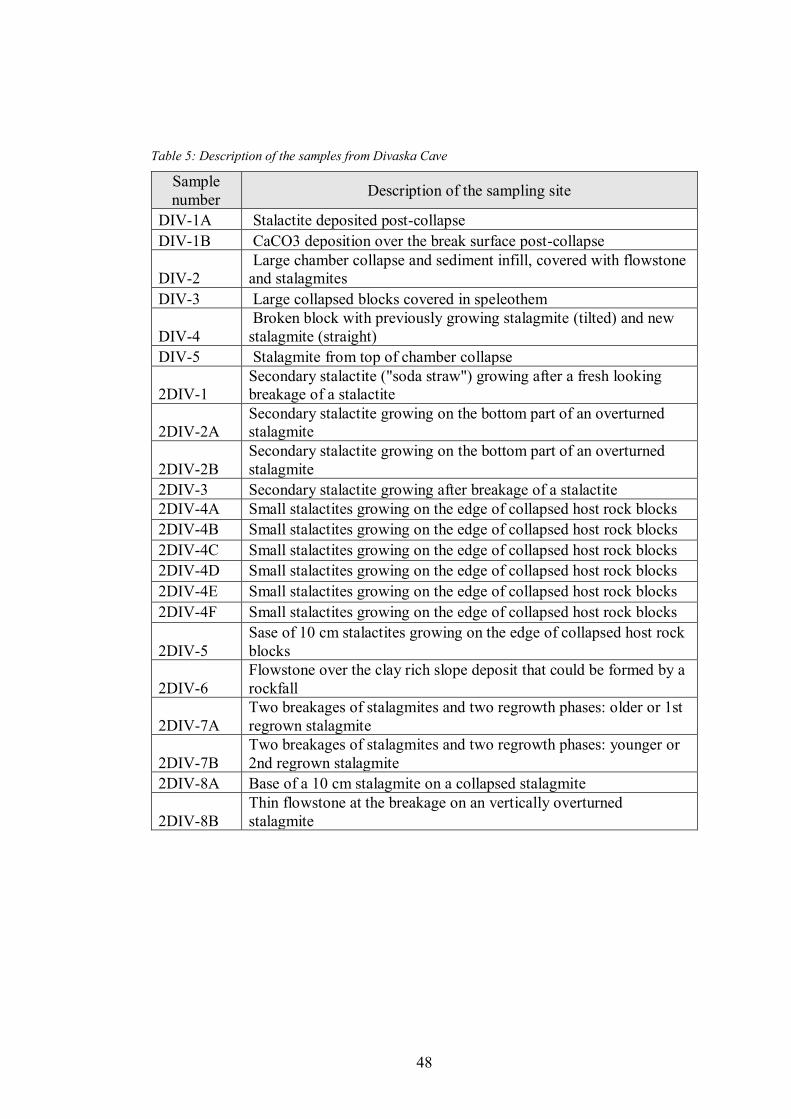
Table 5: Description of the samples from Divaska Cave
Sample
number Description of the sampling site
DIV-1A Stalactite deposited post-collapse
DIV-1B CaCO3 deposition over the break surface post-collapse
DIV-2
Large chamber collapse and sediment infill, covered with flowstone
and stalagmites
DIV-3 Large collapsed blocks covered in speleothem
DIV-4
Broken block with previously growing stalagmite (tilted) and new
stalagmite (straight)
DIV-5 Stalagmite from top of chamber collapse
2DIV-1
Secondary stalactite ("soda straw") growing after a fresh looking
breakage of a stalactite
2DIV-2A
Secondary stalactite growing on the bottom part of an overturned
stalagmite
2DIV-2B
Secondary stalactite growing on the bottom part of an overturned
stalagmite
2DIV-3 Secondary stalactite growing after breakage of a stalactite
2DIV-4A Small stalactites growing on the edge of collapsed host rock blocks
2DIV-4B Small stalactites growing on the edge of collapsed host rock blocks
2DIV-4C Small stalactites growing on the edge of collapsed host rock blocks
2DIV-4D Small stalactites growing on the edge of collapsed host rock blocks
2DIV-4E Small stalactites growing on the edge of collapsed host rock blocks
2DIV-4F Small stalactites growing on the edge of collapsed host rock blocks
2DIV-5
Sase of 10 cm stalactites growing on the edge of collapsed host rock
blocks
2DIV-6
Flowstone over the clay rich slope deposit that could be formed by a
rockfall
2DIV-7A
Two breakages of stalagmites and two regrowth phases: older or 1st
regrown stalagmite
2DIV-7B
Two breakages of stalagmites and two regrowth phases: younger or
2nd regrown stalagmite
2DIV-8A Base of a 10 cm stalagmite on a collapsed stalagmite
2DIV-8B
Thin flowstone at the breakage on an vertically overturned
stalagmite
49
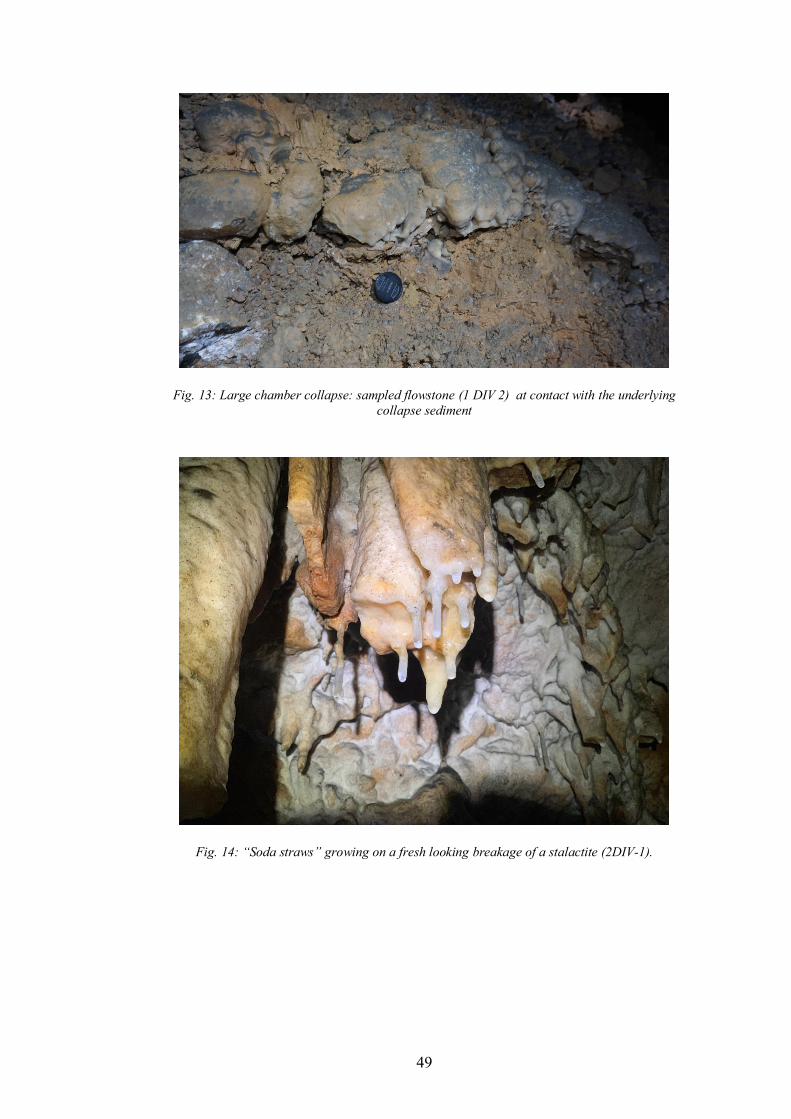
Fig. 13: Large chamber collapse: sampled flowstone (1 DIV 2) at contact with the underlying
collapse sediment
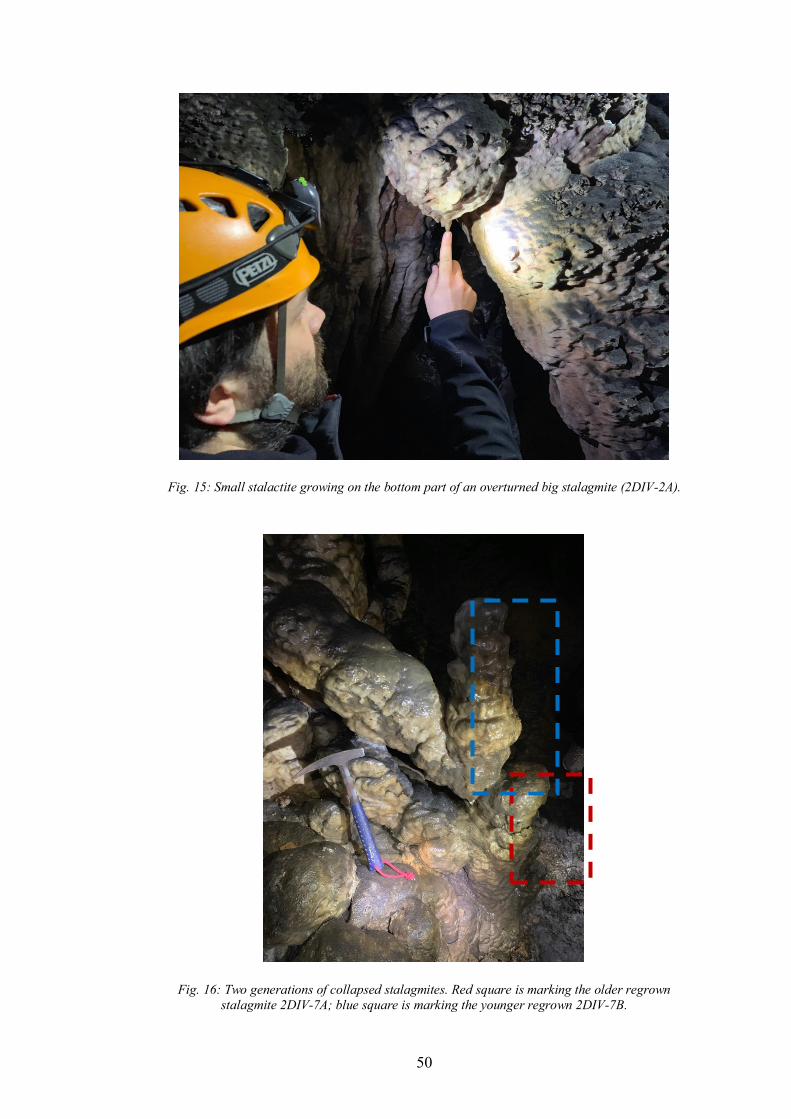
Fig. 14: “Soda straws” growing on a fresh looking breakage of a stalactite (2DIV-1).
50
Fig. 15: Small stalactite growing on the bottom part of an overturned big stalagmite (2DIV-2A).
Fig. 16: Two generations of collapsed stalagmites. Red square is marking the older regrown
stalagmite 2DIV-7A; blue square is marking the younger regrown 2DIV-7B.
51
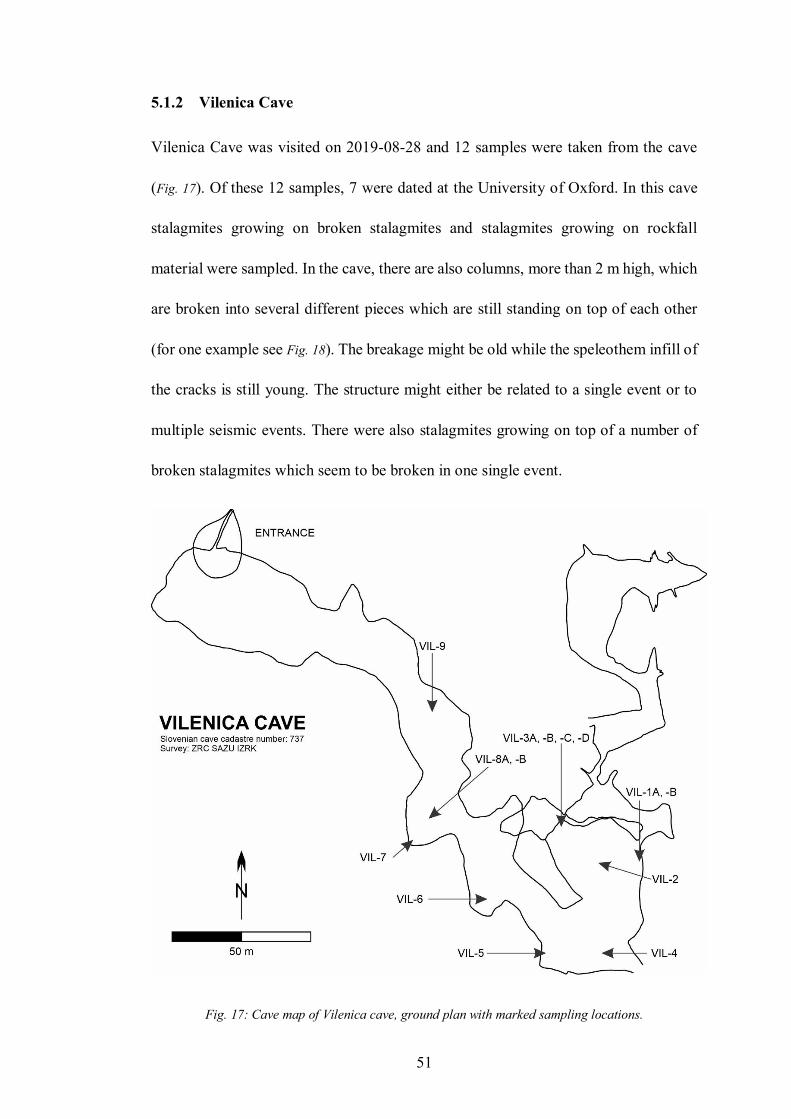
5.1.2 Vilenica Cave
Vilenica Cave was visited on 2019-08-28 and 12 samples were taken from the cave
(Fig. 17). Of these 12 samples, 7 were dated at the University of Oxford. In this cave
stalagmites growing on broken stalagmites and stalagmites growing on rockfall
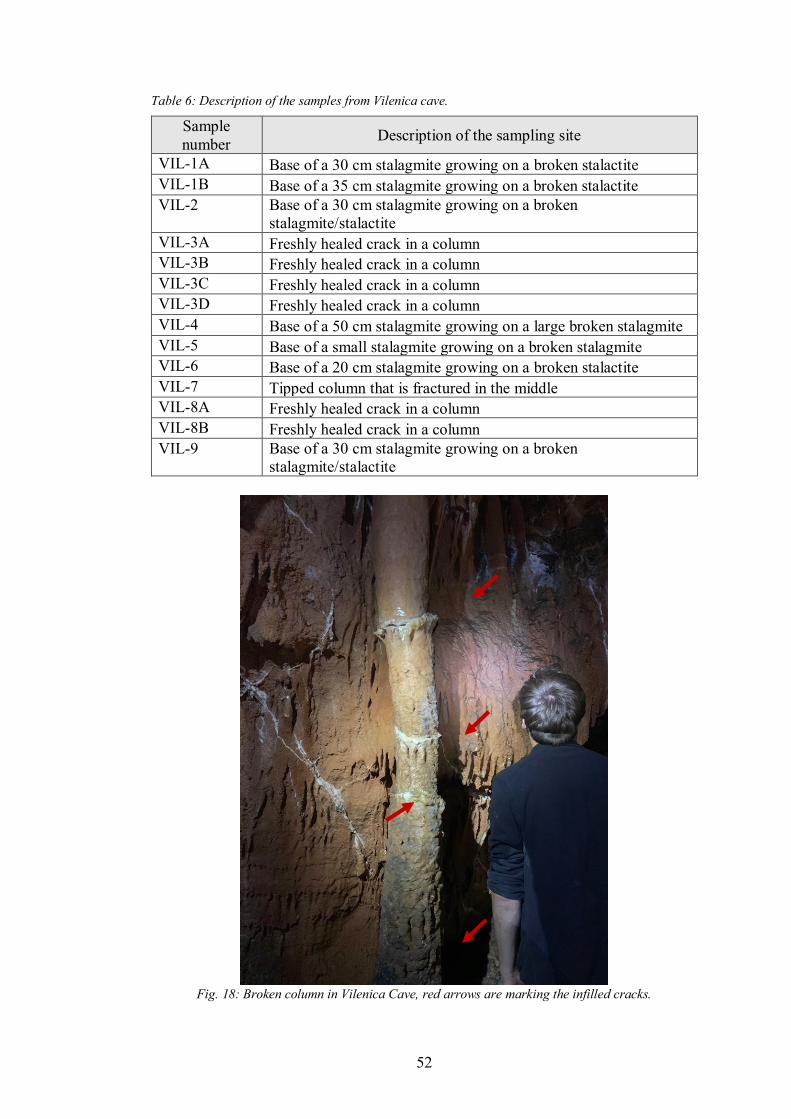
material were sampled. In the cave, there are also columns, more than 2 m high, which
are broken into several different pieces which are still standing on top of each other
(for one example see Fig. 18). The breakage might be old while the speleothem infill of
the cracks is still young. The structure might either be related to a single event or to
multiple seismic events. There were also stalagmites growing on top of a number of
broken stalagmites which seem to be broken in one single event.
Fig. 17: Cave map of Vilenica cave, ground plan with marked sampling locations.
52
Table 6: Description of the samples from Vilenica cave.
Sample
number Description of the sampling site
VIL-1A Base of a 30 cm stalagmite growing on a broken stalactite
VIL-1B Base of a 35 cm stalagmite growing on a broken stalactite
VIL-2 Base of a 30 cm stalagmite growing on a broken
stalagmite/stalactite
VIL-3A Freshly healed crack in a column
VIL-3B Freshly healed crack in a column
VIL-3C Freshly healed crack in a column
VIL-3D Freshly healed crack in a column
VIL-4 Base of a 50 cm stalagmite growing on a large broken stalagmite
VIL-5 Base of a small stalagmite growing on a broken stalagmite
VIL-6 Base of a 20 cm stalagmite growing on a broken stalactite
VIL-7 Tipped column that is fractured in the middle
VIL-8A Freshly healed crack in a column
VIL-8B Freshly healed crack in a column
VIL-9 Base of a 30 cm stalagmite growing on a broken
stalagmite/stalactite
Fig. 18: Broken column in Vilenica Cave, red arrows are marking the infilled cracks.
53
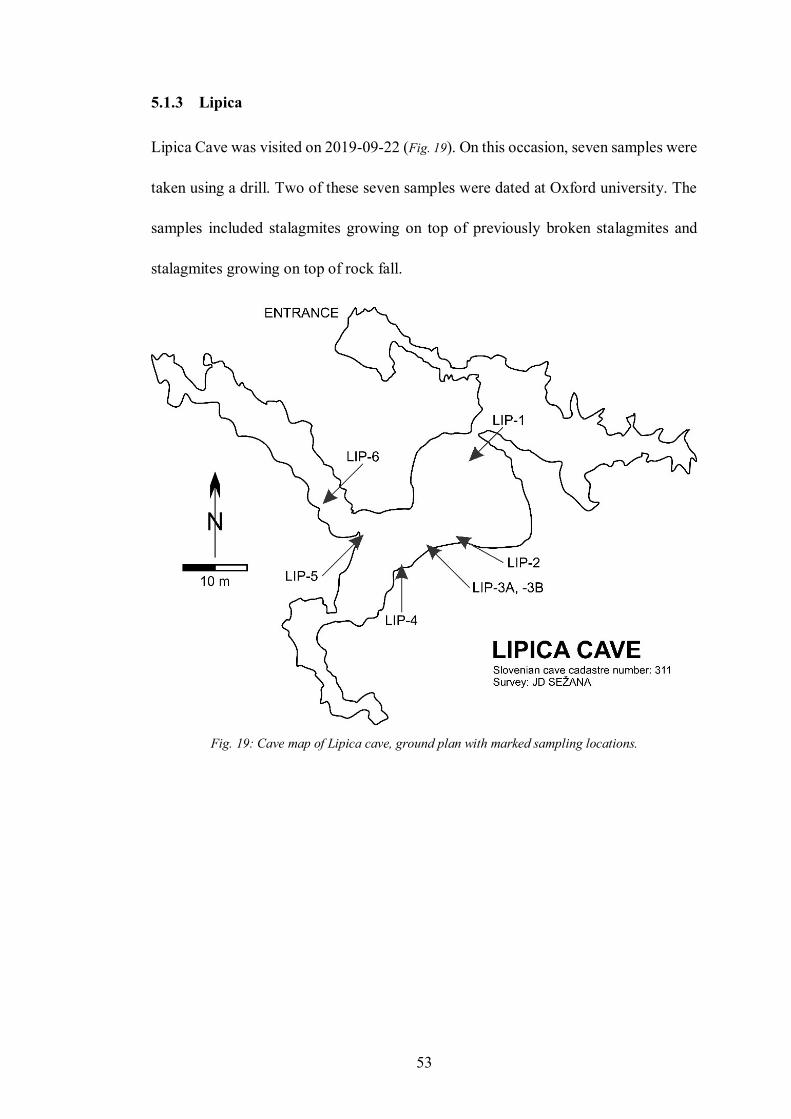
5.1.3 Lipica
Lipica Cave was visited on 2019-09-22 (Fig. 19). On this occasion, seven samples were
taken using a drill. Two of these seven samples were dated at Oxford university. The
samples included stalagmites growing on top of previously broken stalagmites and
stalagmites growing on top of rock fall.
Fig. 19: Cave map of Lipica cave, ground plan with marked sampling locations.
54
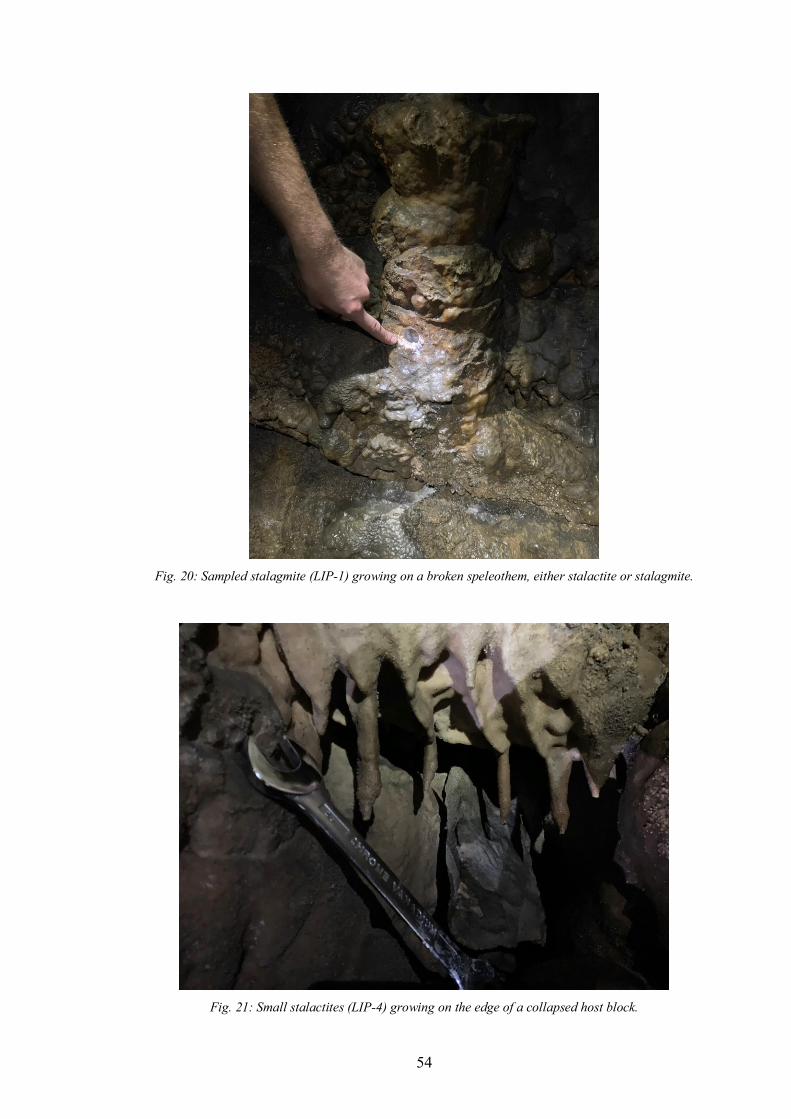
Fig. 20: Sampled stalagmite (LIP-1) growing on a broken speleothem, either stalactite or stalagmite.
Fig. 21: Small stalactites (LIP-4) growing on the edge of a collapsed host block.
55
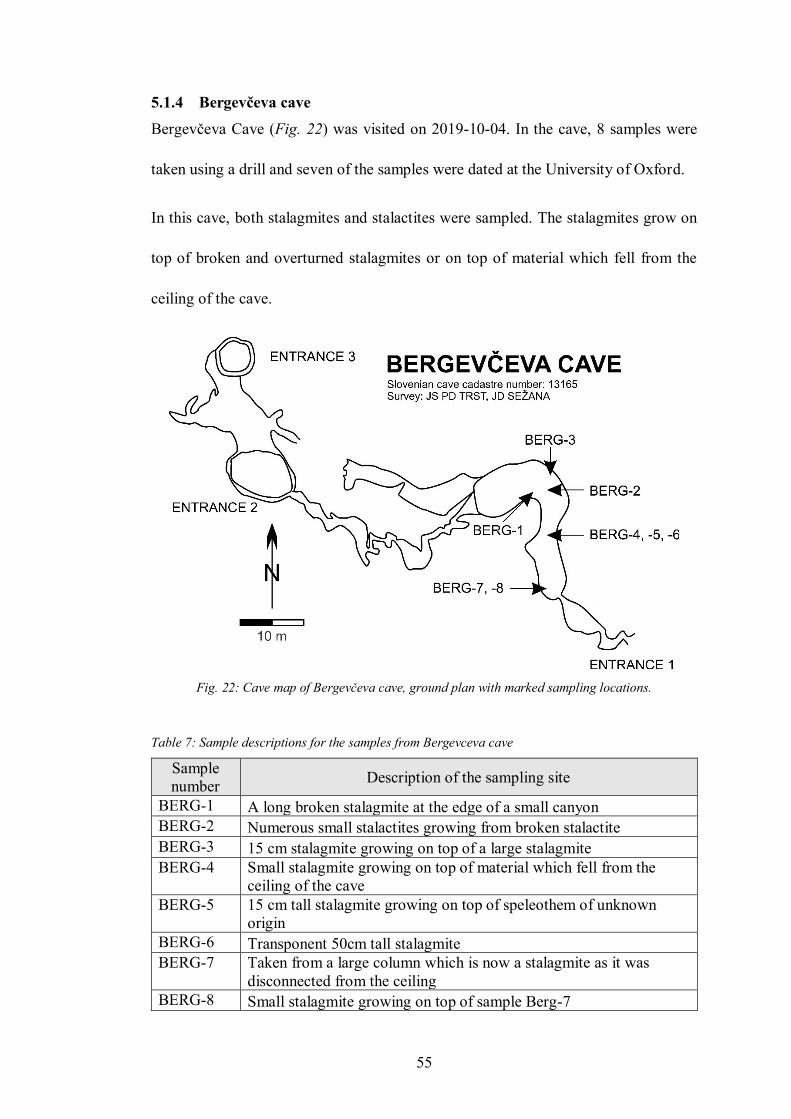
5.1.4 Bergevčeva cave
Bergevčeva Cave (Fig. 22) was visited on 2019-10-04. In the cave, 8 samples were
taken using a drill and seven of the samples were dated at the University of Oxford.
In this cave, both stalagmites and stalactites were sampled. The stalagmites grow on
top of broken and overturned stalagmites or on top of material which fell from the
ceiling of the cave.
Fig. 22: Cave map of Bergevceva cave, ground plan with marked sampling locations.
Table 7: Sample descriptions for the samples from Bergevceva cave
Sample
number Description of the sampling site
BERG-1 A long broken stalagmite at the edge of a small canyon
BERG-2 Numerous small stalactites growing from broken stalactite
BERG-3 15 cm stalagmite growing on top of a large stalagmite
BERG-4 Small stalagmite growing on top of material which fell from the
ceiling of the cave
BERG-5 15 cm tall stalagmite growing on top of speleothem of unknown
origin
BERG-6 Transponent 50cm tall stalagmite
BERG-7 Taken from a large column which is now a stalagmite as it was
disconnected from the ceiling
BERG-8 Small stalagmite growing on top of sample Berg-7
56
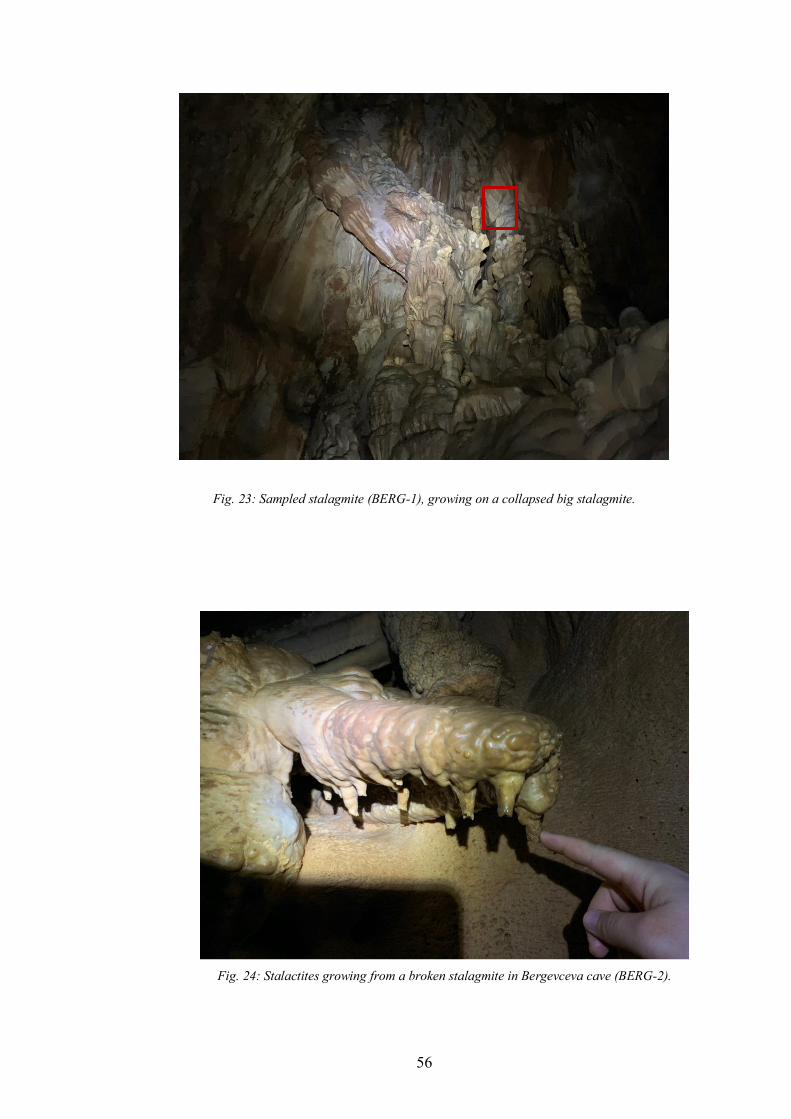
Fig. 23: Sampled stalagmite (BERG-1), growing on a collapsed big stalagmite.
Fig. 24: Stalactites growing from a broken stalagmite in Bergevceva cave (BERG-2).
57
The stalactites grow from a broken stalagmite and have a size of about 2 cm (Fig. 24:
Stalactites growing from a broken stalagmite in Bergevceva cave (BERG-2).There is
also one sample (Berg-7) where limestone is deposited on top of a clay bed forming a
column which was detached from the ceiling after the clay in the bottom has been
eroded leading to a collapse of the bottom part of the column making it a stalagmite.
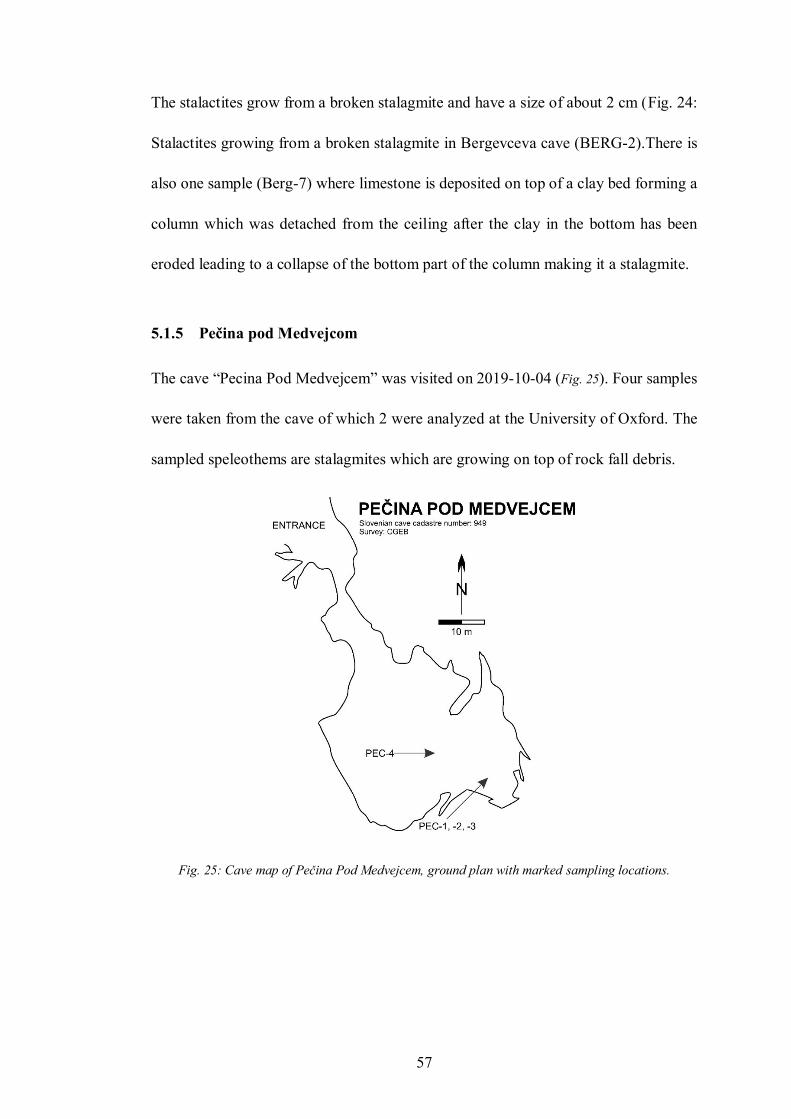
5.1.5 Pečina pod Medvejcom
The cave “Pecina Pod Medvejcem” was visited on 2019-10-04 (Fig. 25). Four samples
were taken from the cave of which 2 were analyzed at the University of Oxford. The
sampled speleothems are stalagmites which are growing on top of rock fall debris.
Fig. 25: Cave map of Pecina Pod Medvejcem, ground plan with marked sampling locations.
58
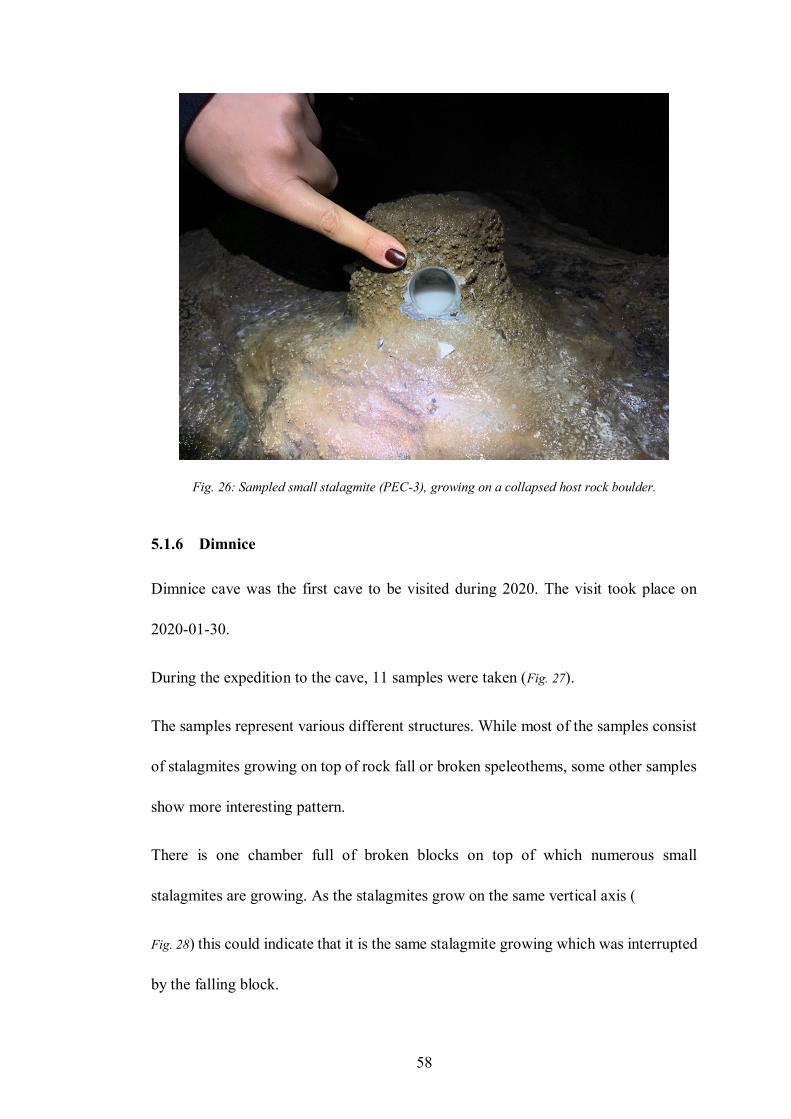
Fig. 26: Sampled small stalagmite (PEC-3), growing on a collapsed host rock boulder.
5.1.6 Dimnice
Dimnice cave was the first cave to be visited during 2020. The visit took place on
2020-01-30.
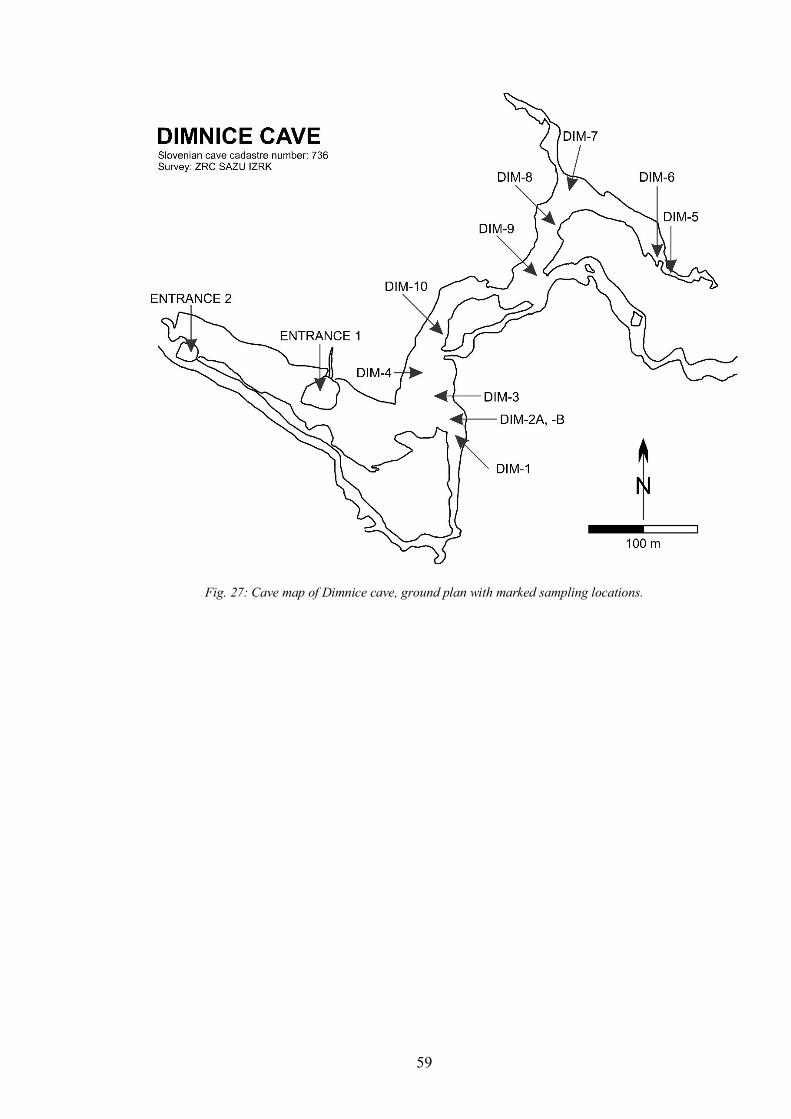
During the expedition to the cave, 11 samples were taken (Fig. 27).
The samples represent various different structures. While most of the samples consist
of stalagmites growing on top of rock fall or broken speleothems, some other samples
show more interesting pattern.
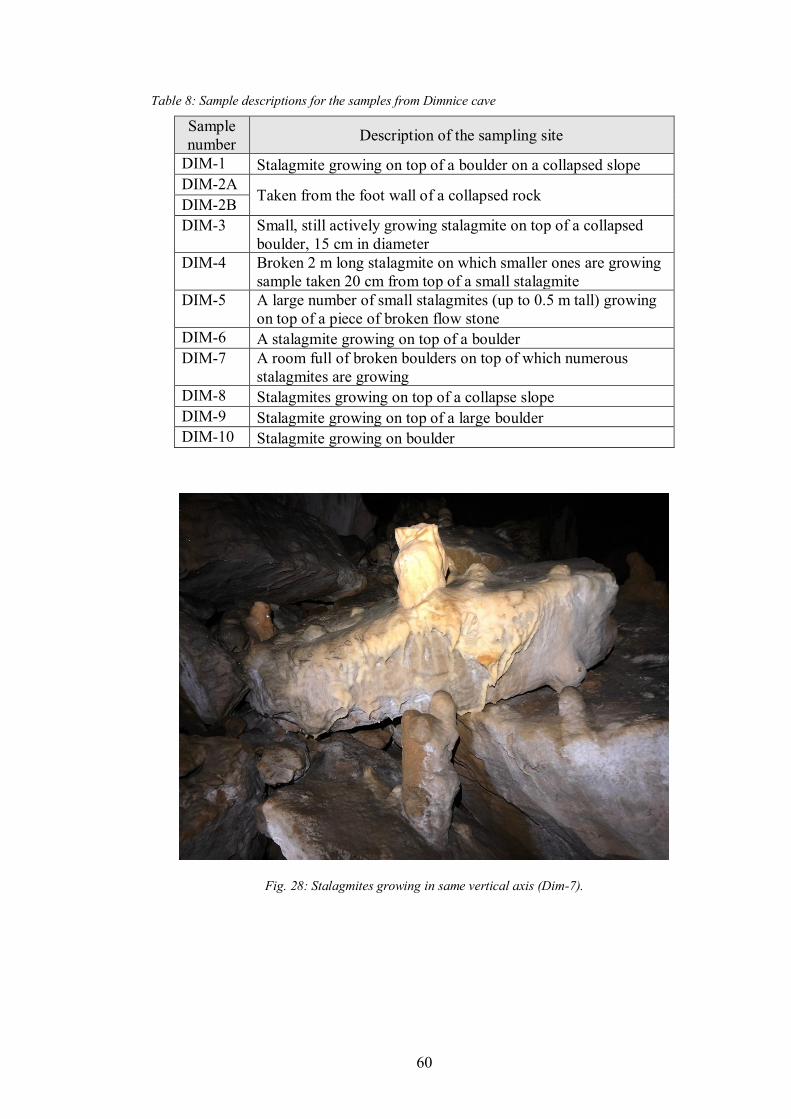
There is one chamber full of broken blocks on top of which numerous small
stalagmites are growing. As the stalagmites grow on the same vertical axis (
Fig. 28) this could indicate that it is the same stalagmite growing which was interrupted
by the falling block.
59
Fig. 27: Cave map of Dimnice cave, ground plan with marked sampling locations.
60
Table 8: Sample descriptions for the samples from Dimnice cave
Sample
number Description of the sampling site
DIM-1 Stalagmite growing on top of a boulder on a collapsed slope
DIM-2A Taken from the foot wall of a collapsed rock
DIM-2B
DIM-3 Small, still actively growing stalagmite on top of a collapsed
boulder, 15 cm in diameter
DIM-4 Broken 2 m long stalagmite on which smaller ones are growing
sample taken 20 cm from top of a small stalagmite
DIM-5 A large number of small stalagmites (up to 0.5 m tall) growing
on top of a piece of broken flow stone
DIM-6 A stalagmite growing on top of a boulder
DIM-7 A room full of broken boulders on top of which numerous
stalagmites are growing
DIM-8 Stalagmites growing on top of a collapse slope
DIM-9 Stalagmite growing on top of a large boulder
DIM-10 Stalagmite growing on boulder
Fig. 28: Stalagmites growing in same vertical axis (Dim-7).
61
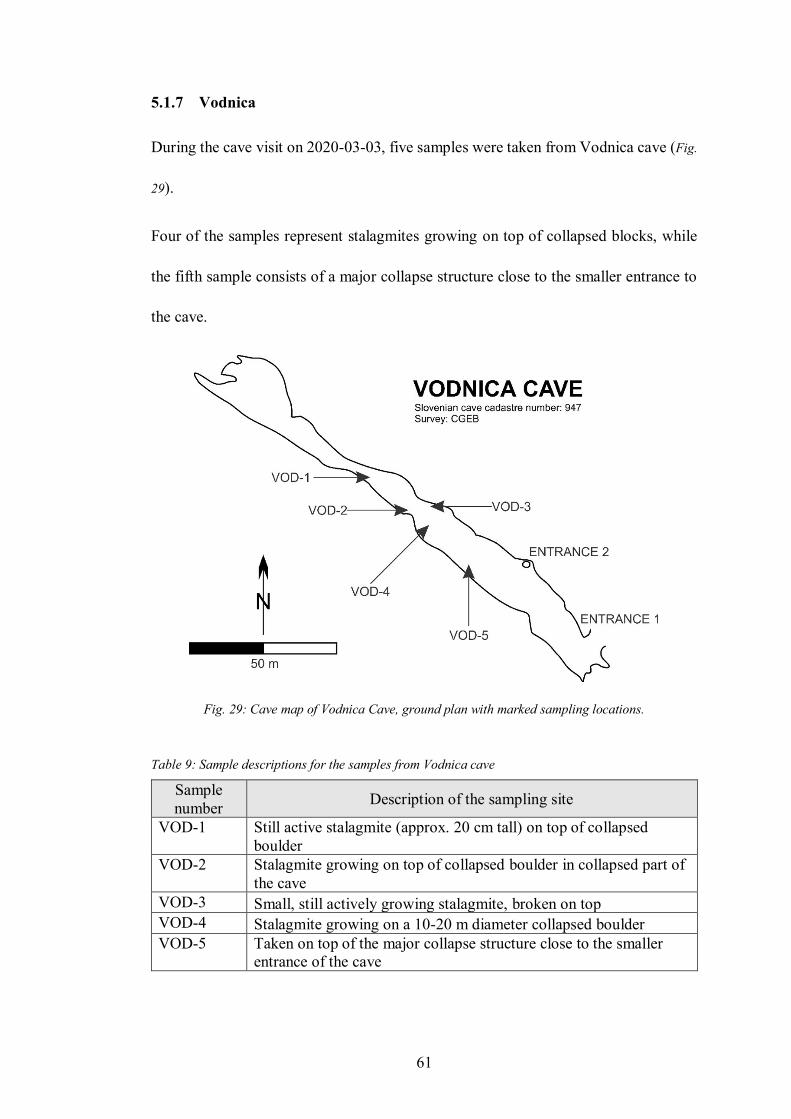
5.1.7 Vodnica
During the cave visit on 2020-03-03, five samples were taken from Vodnica cave (Fig.
29).
Four of the samples represent stalagmites growing on top of collapsed blocks, while
the fifth sample consists of a major collapse structure close to the smaller entrance to
the cave.
Fig. 29: Cave map of Vodnica Cave, ground plan with marked sampling locations.
Table 9: Sample descriptions for the samples from Vodnica cave
Sample
number Description of the sampling site
VOD-1 Still active stalagmite (approx. 20 cm tall) on top of collapsed
boulder
VOD-2 Stalagmite growing on top of collapsed boulder in collapsed part of
the cave
VOD-3 Small, still actively growing stalagmite, broken on top
VOD-4 Stalagmite growing on a 10-20 m diameter collapsed boulder
VOD-5 Taken on top of the major collapse structure close to the smaller
entrance of the cave
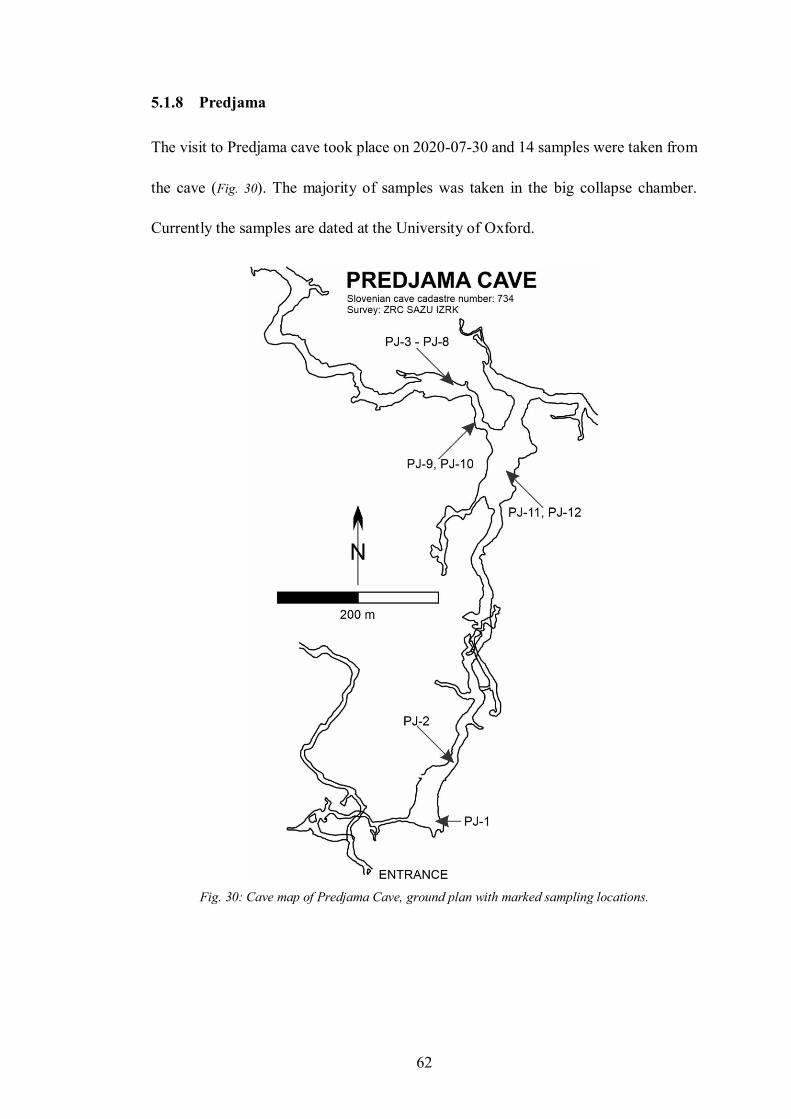
62
5.1.8 Predjama
The visit to Predjama cave took place on 2020-07-30 and 14 samples were taken from
the cave (Fig. 30). The majority of samples was taken in the big collapse chamber.
Currently the samples are dated at the University of Oxford.
Fig. 30: Cave map of Predjama Cave, ground plan with marked sampling locations.
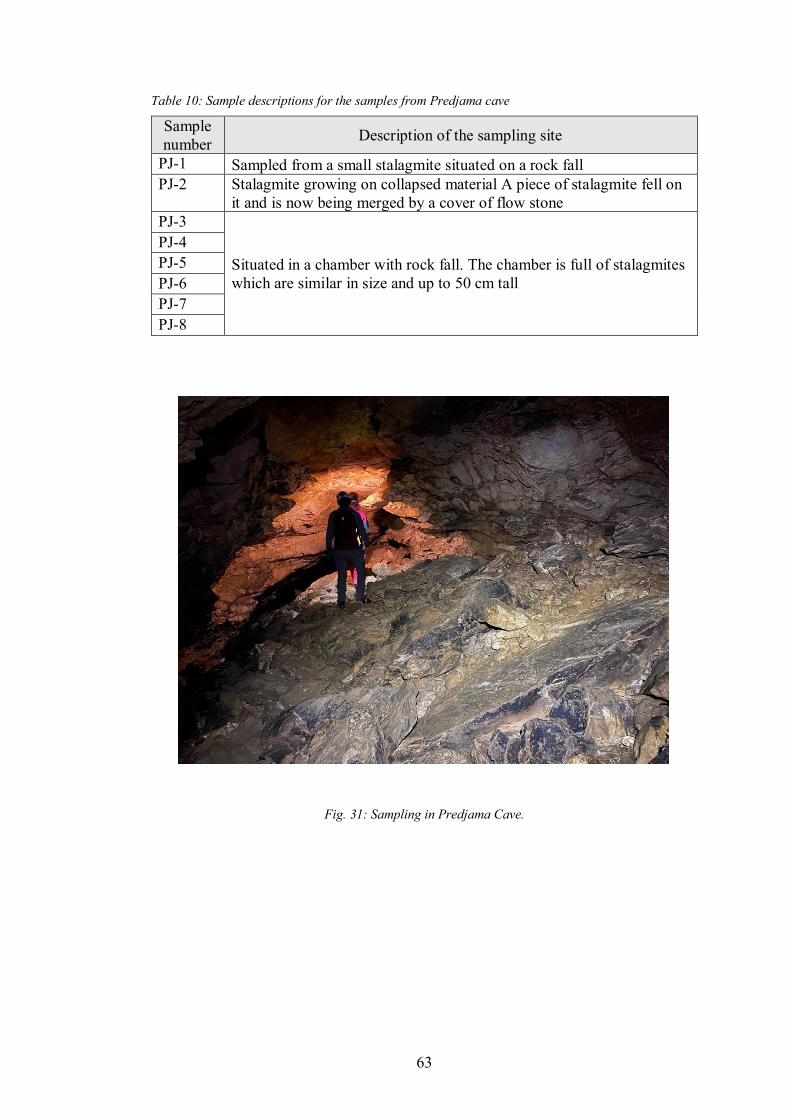
63
Table 10: Sample descriptions for the samples from Predjama cave
Sample
number Description of the sampling site
PJ-1 Sampled from a small stalagmite situated on a rock fall
PJ-2 Stalagmite growing on collapsed material A piece of stalagmite fell on
it and is now being merged by a cover of flow stone
PJ-3
Situated in a chamber with rock fall. The chamber is full of stalagmites
which are similar in size and up to 50 cm tall
PJ-4
PJ-5
PJ-6
PJ-7
PJ-8
Fig. 31: Sampling in Predjama Cave.
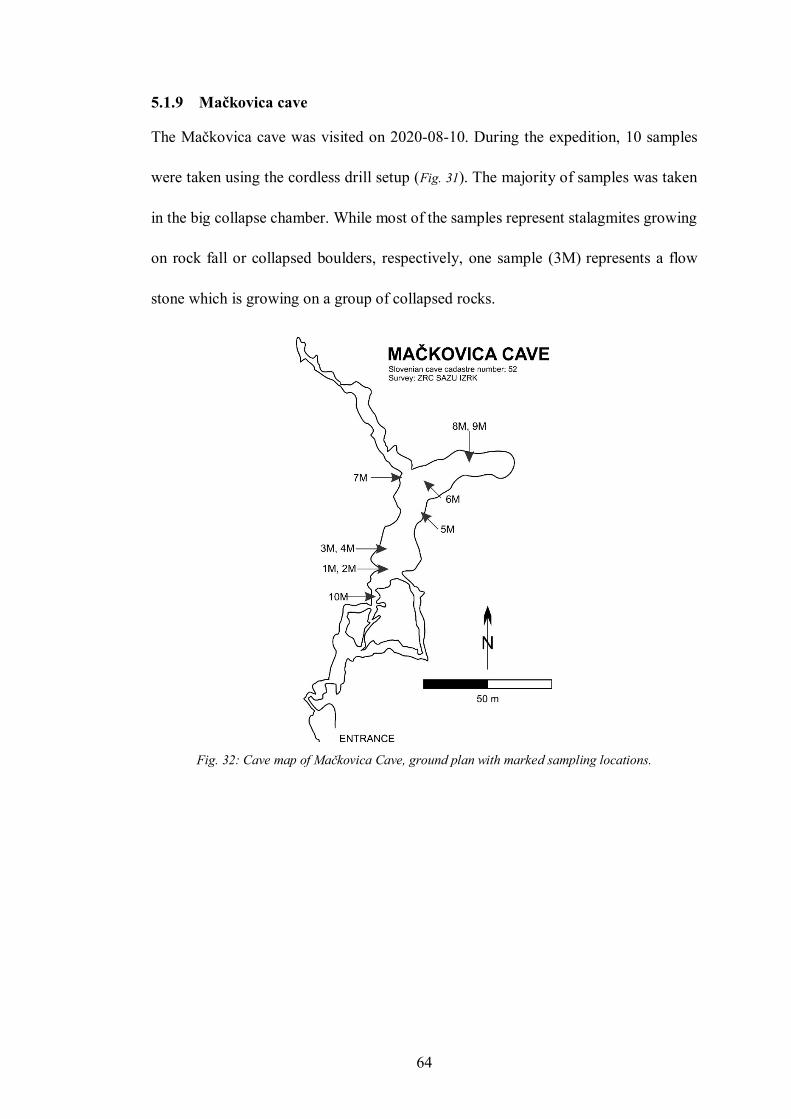
64
5.1.9 Mačkovica cave
The Mačkovica cave was visited on 2020-08-10. During the expedition, 10 samples
were taken using the cordless drill setup (Fig. 31). The majority of samples was taken
in the big collapse chamber. While most of the samples represent stalagmites growing
on rock fall or collapsed boulders, respectively, one sample (3M) represents a flow
stone which is growing on a group of collapsed rocks.
Fig. 32: Cave map of Mackovica Cave, ground plan with marked sampling locations.
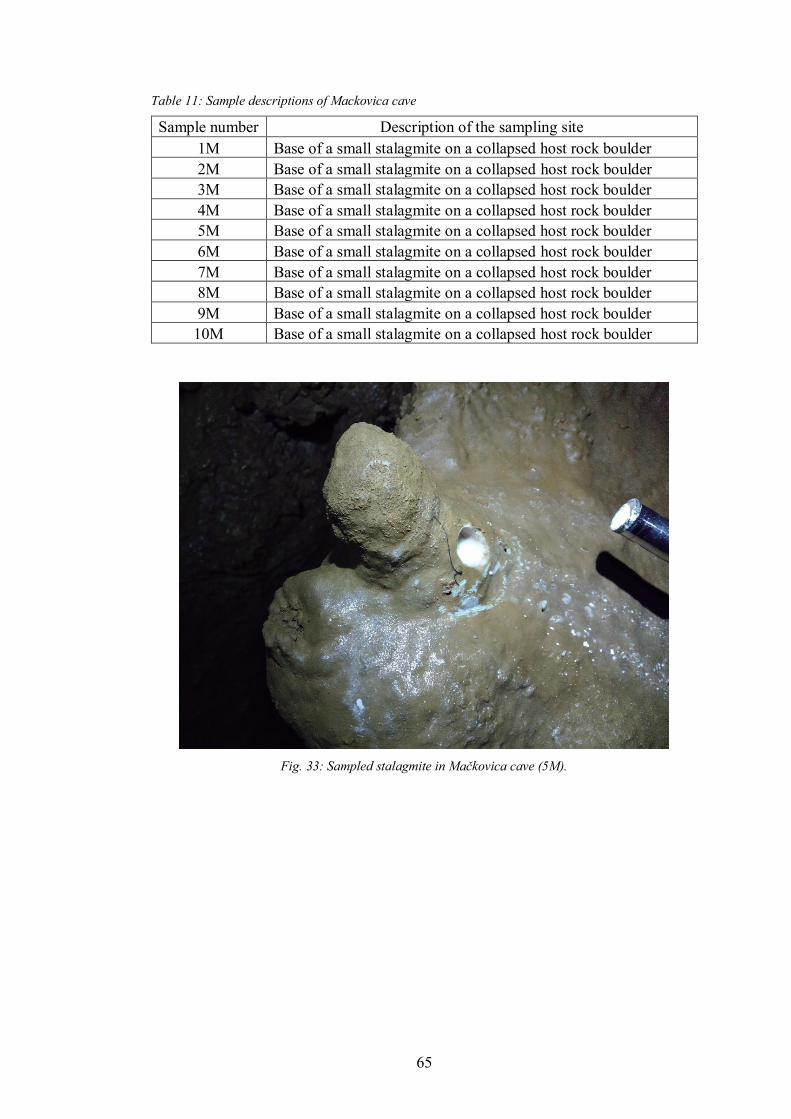
65
Table 11: Sample descriptions of Mackovica cave
Sample number Description of the sampling site
1M Base of a small stalagmite on a collapsed host rock boulder
2M Base of a small stalagmite on a collapsed host rock boulder
3M Base of a small stalagmite on a collapsed host rock boulder
4M Base of a small stalagmite on a collapsed host rock boulder
5M Base of a small stalagmite on a collapsed host rock boulder
6M Base of a small stalagmite on a collapsed host rock boulder
7M Base of a small stalagmite on a collapsed host rock boulder
8M Base of a small stalagmite on a collapsed host rock boulder
9M Base of a small stalagmite on a collapsed host rock boulder
10M Base of a small stalagmite on a collapsed host rock boulder
Fig. 33: Sampled stalagmite in Mackovica cave (5M).
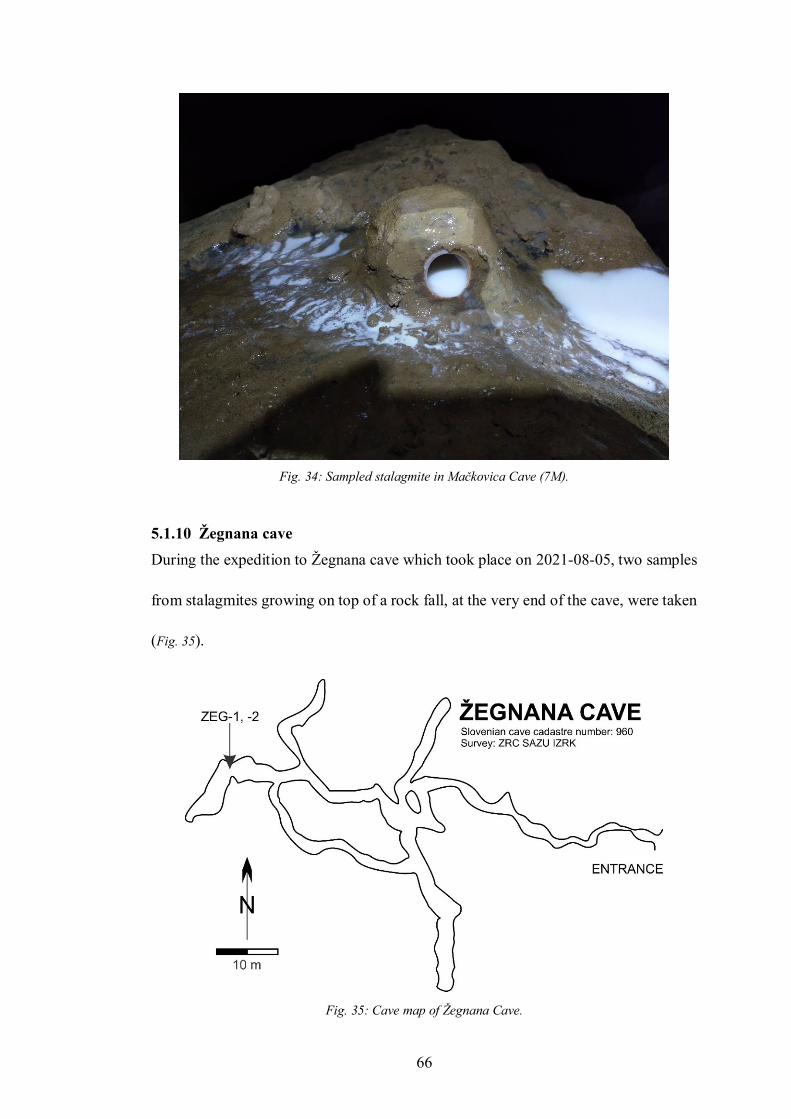
66
Fig. 34: Sampled stalagmite in Mackovica Cave (7M).
5.1.10 Žegnana cave
During the expedition to Žegnana cave which took place on 2021-08-05, two samples
from stalagmites growing on top of a rock fall, at the very end of the cave, were taken
(Fig. 35).
Fig. 35: Cave map of Žegnana Cave.
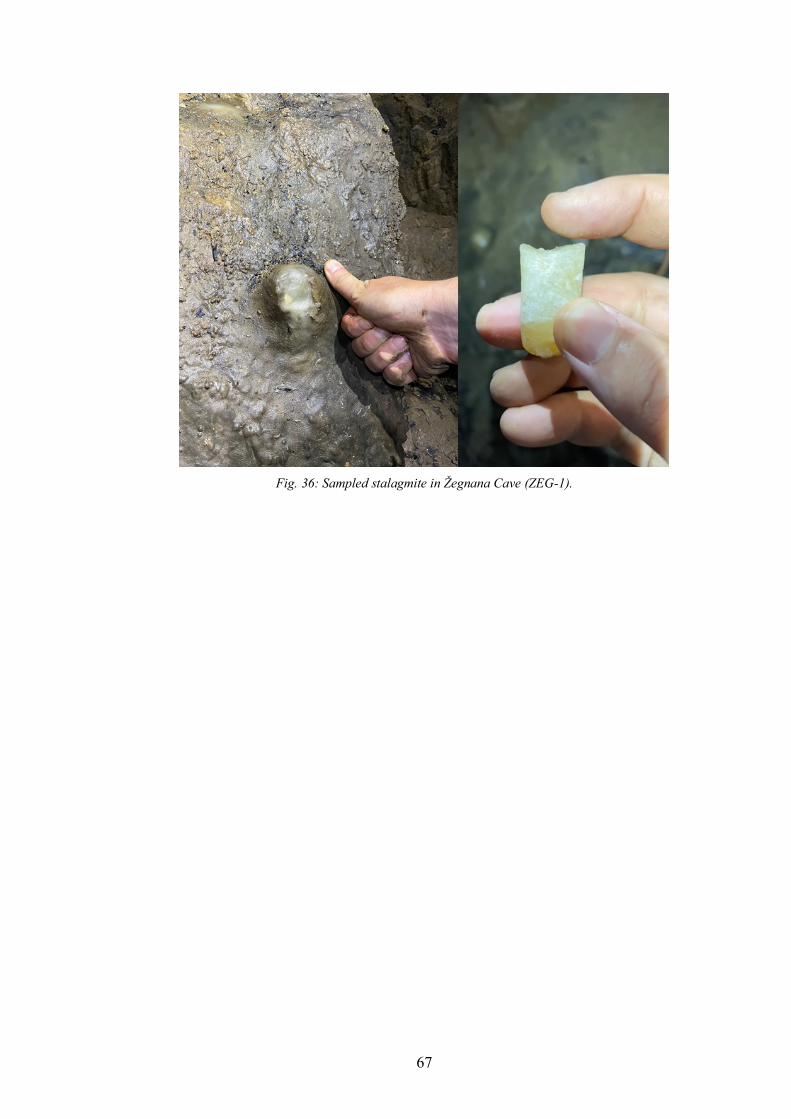
67
Fig. 36: Sampled stalagmite in Žegnana Cave (ZEG-1).
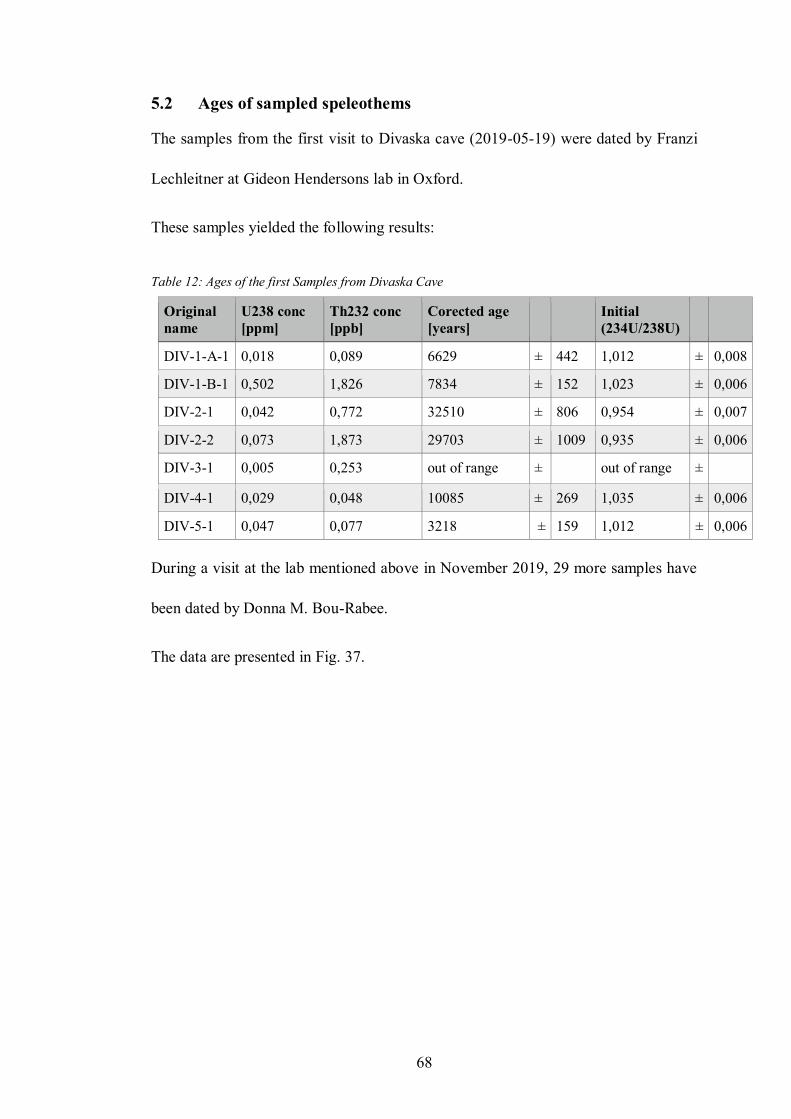
68
5.2 Ages of sampled speleothems
The samples from the first visit to Divaska cave (2019-05-19) were dated by Franzi
Lechleitner at Gideon Hendersons lab in Oxford.
These samples yielded the following results:
Table 12: Ages of the first Samples from Divaska Cave
Original
name
U238 conc
[ppm]
Th232 conc
[ppb]
Corected age
[years]
Initial
(234U/238U)
DIV-1-A-1 0,018 0,089 6629 ± 442 1,012 ± 0,008
DIV-1-B-1 0,502 1,826 7834 ± 152 1,023 ± 0,006
DIV-2-1 0,042 0,772 32510 ± 806 0,954 ± 0,007
DIV-2-2 0,073 1,873 29703 ± 1009 0,935 ± 0,006
DIV-3-1 0,005 0,253 out of range ± out of range ±
DIV-4-1 0,029 0,048 10085 ± 269 1,035 ± 0,006
DIV-5-1 0,047 0,077 3218 ± 159 1,012 ± 0,006
During a visit at the lab mentioned above in November 2019, 29 more samples have
been dated by Donna M. Bou-Rabee.
The data are presented in Fig. 37.
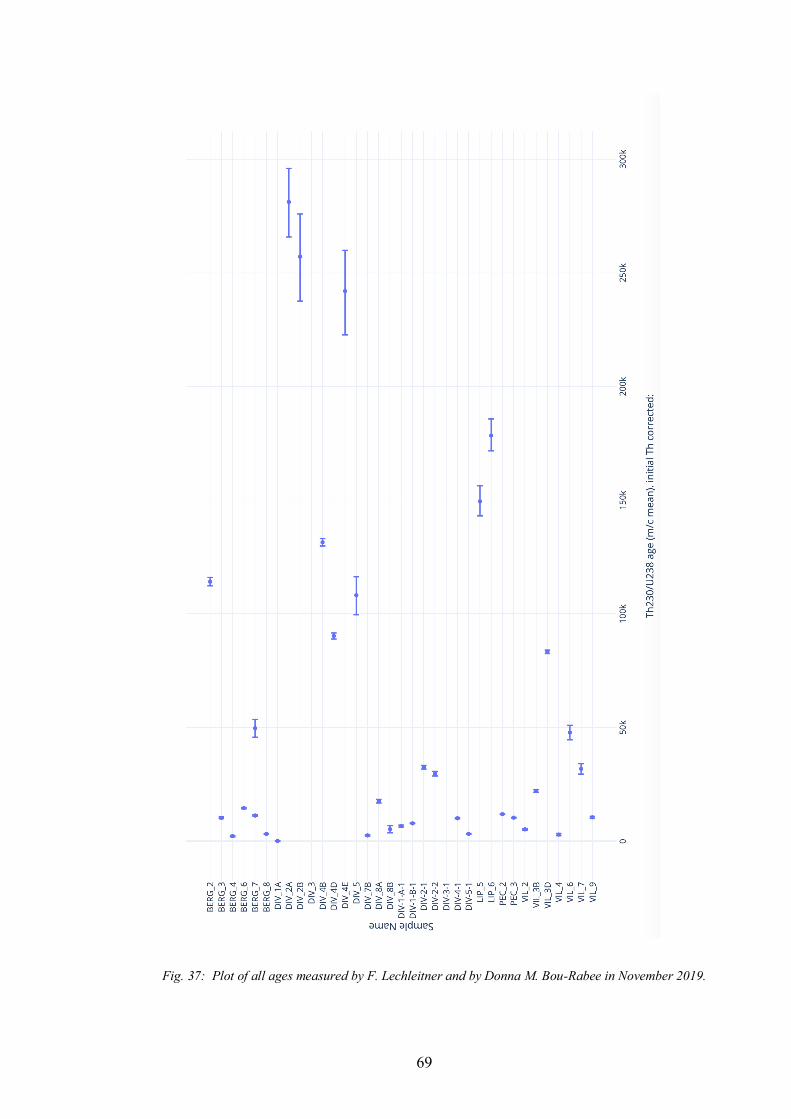
69
Fig. 37: Plot of all ages measured by F. Lechleitner and by Donna M. Bou-Rabee in November 2019.
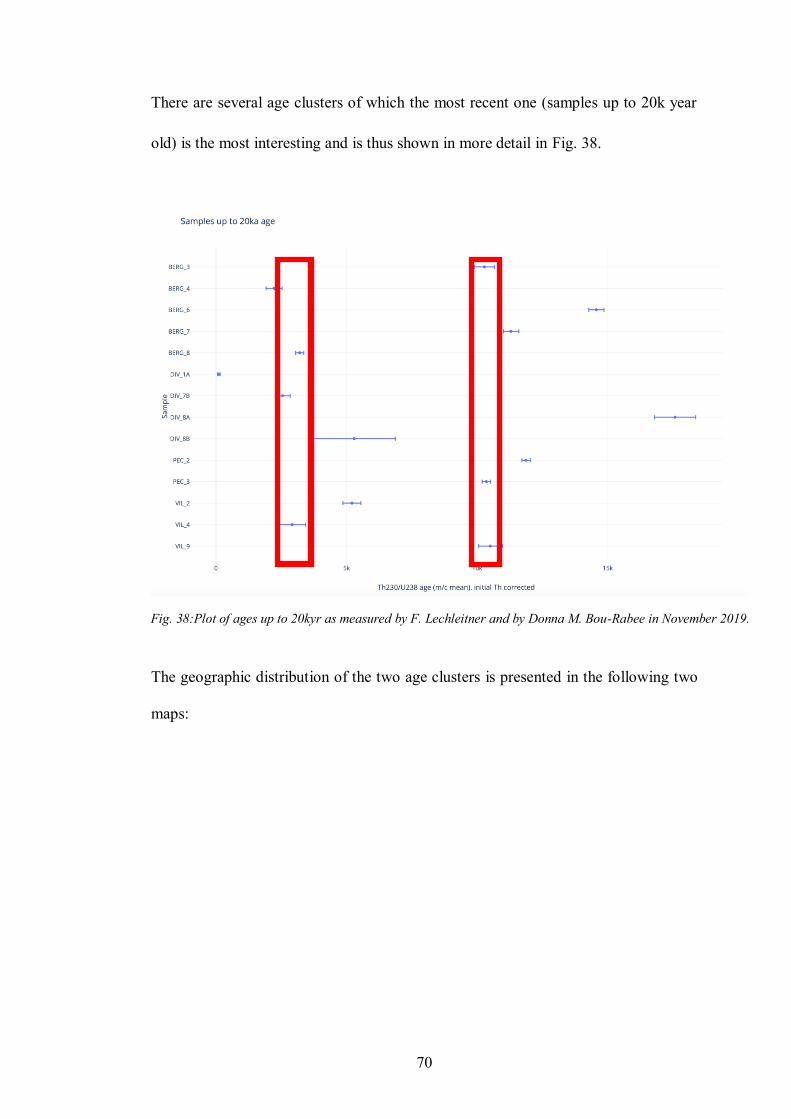
70
There are several age clusters of which the most recent one (samples up to 20k year
old) is the most interesting and is thus shown in more detail in Fig. 38.
The geographic distribution of the two age clusters is presented in the following two
maps:
Fig. 38:Plot of ages up to 20kyr as measured by F. Lechleitner and by Donna M. Bou-Rabee in November 2019.
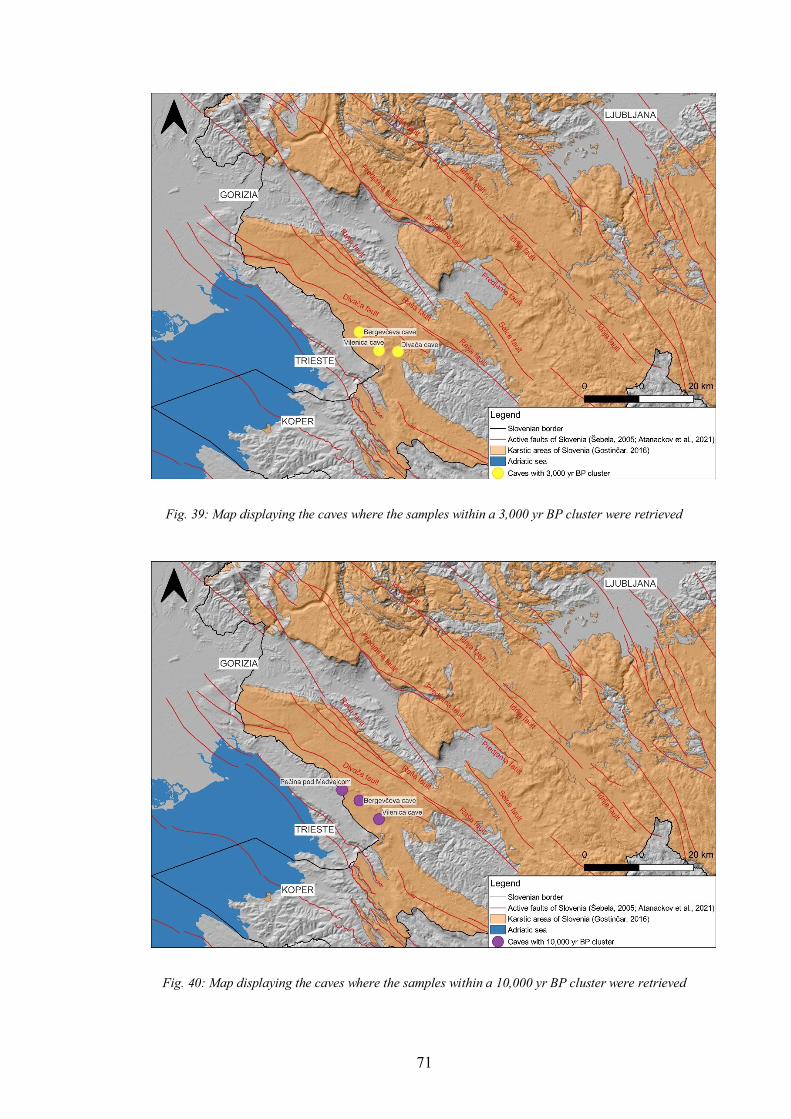
71
Fig. 39: Map displaying the caves where the samples within a 3,000 yr BP cluster were retrieved
Fig. 40: Map displaying the caves where the samples within a 10,000 yr BP cluster were retrieved
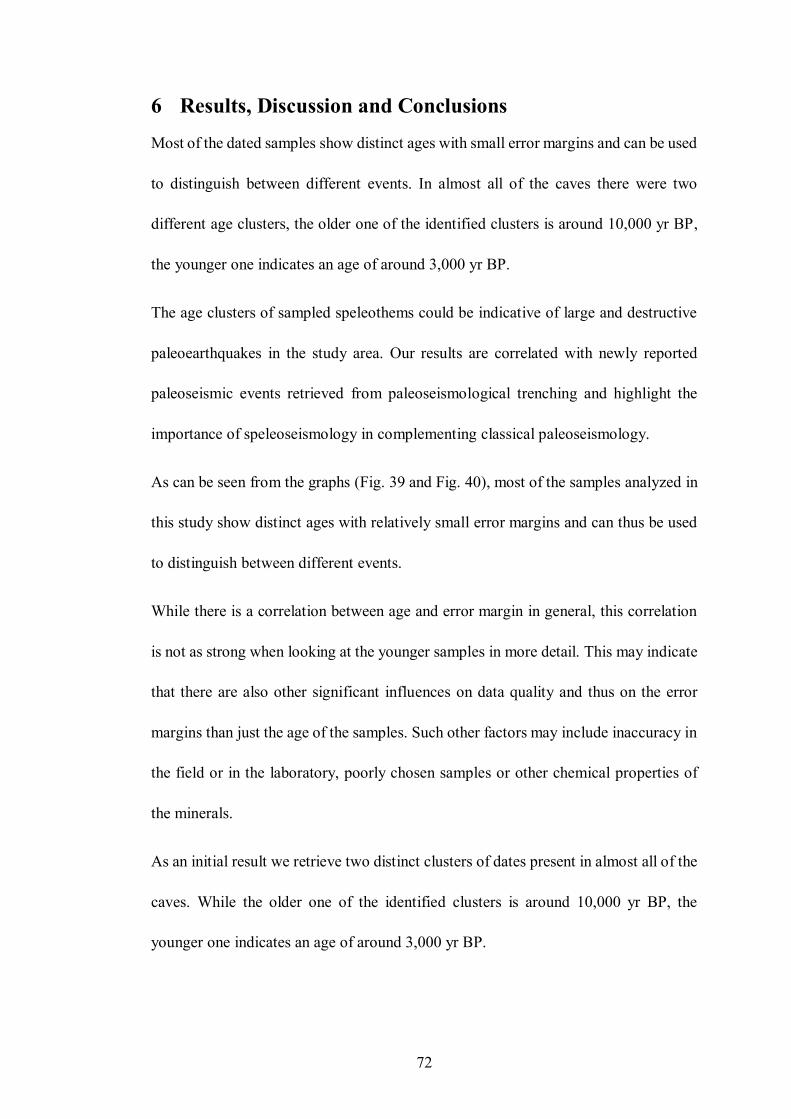
72
6 Results, Discussion and Conclusions
Most of the dated samples show distinct ages with small error margins and can be used
to distinguish between different events. In almost all of the caves there were two
different age clusters, the older one of the identified clusters is around 10,000 yr BP,
the younger one indicates an age of around 3,000 yr BP.
The age clusters of sampled speleothems could be indicative of large and destructive
paleoearthquakes in the study area. Our results are correlated with newly reported
paleoseismic events retrieved from paleoseismological trenching and highlight the
importance of speleoseismology in complementing classical paleoseismology.
As can be seen from the graphs (Fig. 39 and Fig. 40), most of the samples analyzed in
this study show distinct ages with relatively small error margins and can thus be used
to distinguish between different events.
While there is a correlation between age and error margin in general, this correlation
is not as strong when looking at the younger samples in more detail. This may indicate
that there are also other significant influences on data quality and thus on the error
margins than just the age of the samples. Such other factors may include inaccuracy in
the field or in the laboratory, poorly chosen samples or other chemical properties of
the minerals.
As an initial result we retrieve two distinct clusters of dates present in almost all of the
caves. While the older one of the identified clusters is around 10,000 yr BP, the
younger one indicates an age of around 3,000 yr BP.
73
The two distinct clusters could be indicative of large earthquakes in the study area.
Our results are correlated with newly reported paleoseismic events retrieved from
trenching and highlight the importance if speleoseismology in complementing
classical paleoseismology.
Such clustering has also been reported from the Dead Sea Graben by Shmuel et al.
(1996). They investigated laminated sediments from Lake Lisan (which represents the
paleo-Dead Sea). In the sediments, they found distinct seismite bands, which they
interpret as being formed on the sediment-water interface. They assume, that these
have been formed during slip events. In their record, which they consider to be one of
the longest on Earth, they found cluster in approx. 10kyr periods which are separated
by quiet periods of similar length. They conclude that seismic hazard assessment
should be based on records of at least 20 kyr length, otherwise one might miss the
seismic event.
The distinct clusters also offer a possibility to indicate periods of higher seismic
activity in the region and to distinguish between these more active periods and other
periods which show a lower level of activity.
Specifically, speleoeseismology is important in an area like Northwestern Dinarides
characterized by a large number of caves and where trenching is challenging because
of the absence of fresh and recent sediments across active fault scarp.
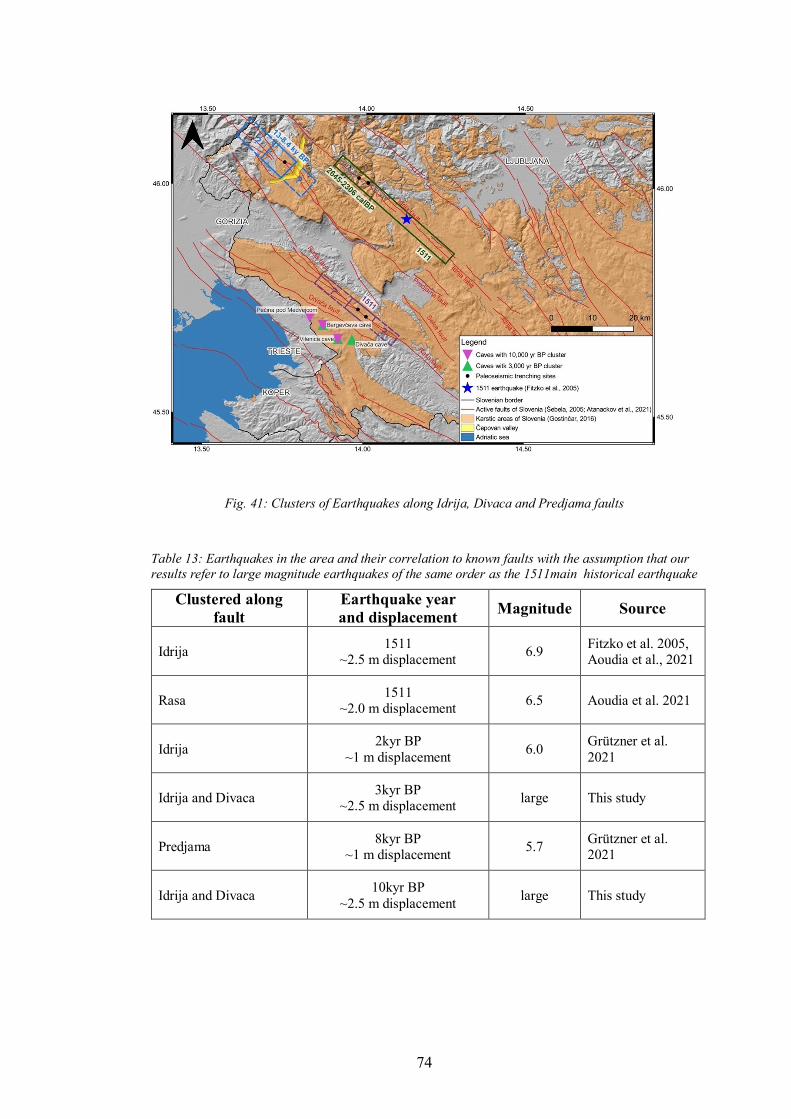
74
Fig. 41: Clusters of Earthquakes along Idrija, Divaca and Predjama faults
Table 13: Earthquakes in the area and their correlation to known faults with the assumption that our
results refer to large magnitude earthquakes of the same order as the 1511main historical earthquake
Clustered along
fault
Earthquake year
and displacement Magnitude Source
Idrija 1511
~2.5 m displacement 6.9
Fitzko et al. 2005,
Aoudia et al., 2021
Rasa 1511
~2.0 m displacement 6.5 Aoudia et al. 2021
Idrija 2kyr BP
~1 m displacement 6.0
Grützner et al.
2021
Idrija and Divaca 3kyr BP
~2.5 m displacement large This study
Predjama 8kyr BP
~1 m displacement 5.7
Grützner et al.
2021
Idrija and Divaca 10kyr BP
~2.5 m displacement large This study
75
In Table 13, further to the two newly identified paleoearthquakes inferred from this
study we report a total of six large earthquakes that have been accommodated in the
Dinaric Karst region with an estimated average displacement of 11.5 m over 10,000
years of time. This would correspond to an average co-seismic strain of ~1.2 mm/year
during the last 10,000 years which is about 50% of the geodetic strain which equals to
~ 2 mm/year as inferred by recent GPS studies (Weber et al.2010; Metois et al.2015)
and far less than geologic slip rates of ~ 3mm/year (e. g. Moulin et al., 2016 and Moulin
and Benedetti, 2021). This would in turn mean that the active fault system in the
Dinaric Karst is in a seismic slip deficit period therefore increasing the future hazard
in the region.
Specifically, speleoeseismology is important in an area like North-western Dinarides
characterized by vast karstic territories, a large number of caves and where trenching
is challenging because of the absence of fresh and recent sediments across active fault
scarp.
In summary, by using modern speleothem sampling, analysis and speleothem U/Th
dating method, this study represents one of the first systematic speleoseismic studies
in North-western Dinarides and in Slovenia, With around 6000 caves in the Dinaric
Karst and Slovenia having more than 14,000 caves, the study represents a basis for
future speleoseismic research in the study area. Research that has the possibility of
increasing the understanding the characteristics of strong paleoearthquakes and
modelling scenarios and in due course enhancing seismic hazard and risk assessment
in North-western Dinarides.

76
7 Acknowledgements
I am out of words to express my gratitude for my supervisor, Prof. Abdelkrim Aoudia
for his invaluable advice, patience, support and for encouraging me to always work
harder as a single mother in a tremendously competitive scientific world.
Prof. Gideon Henderson and Dr. Franziska Lechleitner from the University of Oxford
for the possibility to use their laboratory and for their support.
Prof. Stanka Sebela from the Karst institute for her help in the field and for sharing her
extensive knowledge about my study area.
Both, Prof. Svante Björck from Lund University in Sweden and Prof. Sobhi Nasir from
Sultan Qaboos University in Oman have given me valuable feedback and it has been
much appreciated.
Post doc. assigned to my PhD project, Dr. Blaz Vicic and PhD candidate Uros Novak
are thanked for helping me take samples in the caves and for being there during the
field work.
All ICTP staff welcomed me to Trieste and made me feel like it was my second home.
Finally for my friends, I couldn't have achieved this without them: Kilian Barth, Daniel
Manu-Marfo, Marta D’Ambra, and most of all with all my heart Riccardo Delise.
My beautiful and smart siblings who are all over the globe but very close to me always,
Noura, Nawaf, Khalid and Ahmed who I cherish with all my heart and have taught me
to always strive for perfection and to work with diligence.
Finally, to my wonderful, beautiful, strong and smart mother, Professor Firyal Bou-
Rabee who always pulled me up when I was down and pushed me to focus on my
academics, who continues to remain my role-model. Most importantly to my son, Saud
Al-Wazzan, his smile always made me work harder to achieve my goals and always
soar higher.
77
8 References
Alfonsi and Cinti, 2021: Earthquake effects and insights on fault activity at the
Beatrice Cenci cave (Abruzzo, Central Apennines). In: Annals of Geophysics, Vol. 64
no. 4, SE 435, p. 1-13.
Anderson & Jackson, 1987: Active tectonics of the Adriatic Region. Geophysical
Journal of the Royal Astronomical Society, 91(3), 937–983.
https://doi.org/10.1111/ j.1365- 246X.1987.tb01675. x
Akgöz & Eren, 2013: Traces of earthquakes in the caves: Sakarlak Ponor and Kepez
Cave, Mersin, (southern Turkey). In: Journal of Cave and Karst studies, Vol. 77, no.
1, p. 63 - 74.
Aoudia et al., 2000: The 1976 Friuli (NE Italy) thrust faulting earthquake: a reappraisal
23 years later. Geophysical Research Letters, 27(4), 573–576.
Aoudia et al., 2021: Mechanics of the Raša fault and earthquake hazard on the city of
Trieste. Conference talk at the 90° Congresso della Società Geologica Italiana, Trieste,
14th-16th of September, 2021.
Babek, et al. 2015: Pleistocene speleothem fracturing in the foreland of the Western
Carpathians: a case study from the seismically active eastern margin of the Bohemian
Massif, in: Geological Quarterly, 2015, Vol. 59 (3), p. 491–506 .
Bajc et al., 2001: The 1998 Bovec-Krn Mountain (Slovenia) Earthquake Sequence.
Geophysical Research Letters, 28(9), 1839–1842.
Basili et al., 2013: The European Database of Seismogenic Faults (EDSF) compiled in
the framework of the Project SHARE. URL: Http://diss. Rm. Ingv. It/share-Edsf.
Bechtold et al., 2009: Constraints on the active tectonics of the Friuli/NW Slovenia
area from CGPS measurements and three- dimensional kinematic modeling. Journal
of Geophysical Research, 114(B3), B03408. https://doi.org/10.1029/2008JB005638
78
Becker et al., 2005: Multiarchive paleoseismic record of late Pleistocene and Holocene
strong earthquakes in Switzerland. in: Tectonophysics, Vol. 400, 1-4, p. 153 - 177.
Becker et al., 2006: Speleoseismology: A critical perspective. In: Journal of
Seismology, Vol. 10, p. 371-388.
Becker et al., 2012: Active tectonics and earthquake destructions in caves of northern
and central Switzerland. in: International Journal of Speleology, Vol. 41, no. 1, p. 35-
49.
Benedetti et al., 2000: Growth folding and active thrusting in the Montello region,
Veneto, northern Italy. Journal of Geophysical Research: Solid Earth, 105(B1), 739–
766.
Bokelmann & Gribovszki, 2015: Constraints on Long-Term Seismic Hazard From
Vulnerable Stalagmites. in: CSNI Workshop on “Testing PSHA Results and Benefit
of Bayesian Techniques for Seismic Hazard Assessment” 4-6 February 2015, Eucentre
Foundation, Pavia, Italy.
Bressan et al., 2007: Source parameters and stress release of seismic sequences
occurred in the Friuli-Venezia Giulia region (Northeastern Italy) and in Western
Slovenia. Physics of the Earth and Planetary Interiors, 160(3–5), 192–214.
https://doi.org/10.1016/j.pepi.2006.10.005
Briestensky et al., 2015: Evidence of a plate-wide tectonic pressure pulse provided by
extensometric monitoring in the Balkan Mountains (Bulgaria). Geologica Carpathica,
66(5), 427–438.
Burrato et al., 2008: Sources of M w 5+ earthquakes in northeastern Italy and western
Slovenia: An updated view based on geological and seismological evidence.
Tectonophysics, 453(1), 157–176.
Buser, 2009: Geological Map of Slovenia, 1:250.000.
79
Di Domenica & Pizzi, 2017: Defining a mid-Holocene earthquake through
speleoseismological and independent data: implications for the outer Central
Apennines (Italy) seismotectonic framework. in: Solid Earth, Vol. 8, p. 161 - 176.
Caporali et al., 2013: Modeling surface GPS velocities in the Southern and Eastern
Alps by finite dislocations at crustal depths. Tectonophysics, 590, 136–150.
https://doi.org/10.1016/j.tecto.2013.01.016
Delaby, 2001: Palaeoseismic investigations in Belgian caves. in: Netherlands Journal
of Geosciences / Geologie en Mijnbouw, Vol. 80, no. 3-4, p. 323 - 332.
Fitzko et al., 2005: Constraints on the location and mechanism of the 1511 Western-
Slovenia earthquake from active tectonics and modeling of macroseismic data.
Tectonophysics, 404(1), 77–90.
Forti, 2001: Seismotectonic and Paleoseismic Studies from Speleothems: The State of
the Art. in: Geologica Belgica, vol. Karst and Tectonics, 4/3-4: 175 - 185.
Forti & Onac, 2016: Caves and Mineral Deposits. in: Zeitschrift für Geomorphologie,
Vol. 60, Suppl. 2, p. 57-102.
Galadini et al., 2005: Seismogenic sources potentially responsible for earthquakes with
M≥ 6 in the eastern Southern Alps (Thiene-Udine sector, NE Italy). Geophysical
Journal International, 161(3), 739–762.
Gilli, E. 1999: Evidence of palaeoseismicity in a flowstone of the Observatoire cave
(Monaco), in: Geodinamica Acta Vol. 12, issue 3-4, p. 159-168.
Gosar et al., 2011: On the state of the TM 71 extensometer monitoring in Slovenia:
seven years of micro-tectonic displacement measurements. Acta Geodyn Geomater,
8(4), 389–402.
Gosar et al., 2009: Surface Versus Underground Measurements of Active Tectonic
Displacements with TM 71 Exstensometers in Slovenia. Acta Carsologica, 38(2–3).
80
Gospodaric, R., 1964: Sledovi tektonskih premikov iz ledene dobe v Postojnski jami.-
Naše jame 5 (1963), 5-11, Ljubljana.
Gospodarič¬, R., 1968: Podrti kapniki v Postojnski jami.- Naše jame 9 (1-2), 15-31,
Ljubljana.
Grenerczy et al., 2000: Present crustal movement and strain distribution in Central
Europe inferred from GPS measurements. Journal of Geophysical Research: Solid
Earth, 105(B9), 21835–21846.
Gribovszki et al., 2018: Numerical Modeling of Stalagmite Vibrations. In: Pure and
Applied Geophysics, 175, 4501-4514.
Grützner, C., et al., 2021: Holocene surface-rupturing earthquakes on the Dinaric Fault
System, western Slovenia: Solid Earth, Vol. 12, pages 2211–2234.
Kagan et al., 2005: Dating large infrequent earthquakes by damaged cave deposits. in:
Geology, Vol. 33 no. 4, p. 261 - 264.
Kagan, 2012: Multi-site late Quaternary paleoseismology in the Dead Sea transform
region: Independent recording by lake and cave sediments. Ministry of Energy and
Water Resources-Geological Survey of Israel.
Kagan et al., 2017: Broken speleothems reveal Holocene and Late Pleistocene
paleoearthquakes in Northern Calabria, Italy. in: Quaternary International, Vol. 451,
p. 176 - 184.
Kastelic et al., 2004: Seismotectonic characteristics of the 2004 earthquake in Krn
mountains. Potresi v Letu, 78–87.
Kastelic et al., 2008: Neo-Alpine structural evolution and present-day tectonic activity
of the eastern Southern Alps: the case of the Ravne Fault, NW Slovenia. Journal of
Structural Geology, 30(8), 963–975.
81
Kempe, 2004: Natural Speleothem Damage in Postojnska Jama, Slovenia, Caused by
Glacial Cave Ice? A First Assessment. in: Acta Carsologica, Vol. 33 No. 1, p. 266 -
290.
Kempe et al., 2009: Glacial cave ice as the cause of widespread destruction of
interglacial and interstadial speleothem generation in Central Europe. in: White, W. B.
(ed.): Proceedings of the 15th International Congress of Speleology, Kerrville, TX,
vol.. 2, p. 1026-1031.
Kranjc, A., (ed), 1997: Slovene Dinaric Karst, Kras. ZRC SAZU.
Lacave et al., 2000: Measurement of natural frequencies and damping of speleothems.
in: Proceedings of the 12th World Conference on Earthquake Engineering, Auckland,
New Zealand, Sunday 30 January - Friday 4 February 2000, abstract no. 2118.
Lacave et al., 2004: What can be concluded about seismic history from broken and
unbroken speleothems? in: Journal of Earthquake Engineering vol. 8, no. 3, p. 431-
455.
Lang et al., 2021: Macro-characterisation of cave damage for palaeoseismological
investigations in regions of low strain: A case study from centralewestern North Island
(Waitomo caves), New Zealand. in: Quaternary Science Reviews Vol. 272, 107202, p.
1-28.
Lippitsch, R., 2003: Upper mantle structure beneath the Alpine orogen from high-
resolution teleseismic tomography. Journal of Geophysical Research, 108(B8), 2376.
https://doi.org/10.1029/2002JB002016
McCalpin (ed.), 2009: Paleoseismology. Academic Press /Elsevier, Burlington.
Mendecki & Szczygiel, 2019: Physical Constraints on speleothem deformations
caused by earthquakes, seen from a new perspective: Implications for
paleoseismology. In: Journal of Structural Geology, Vol. 126, 146-155.
Metois, M. et al., 2015. Insights on continental collisional processes from GPS data:
dynamics of the peri-Adriatic belts, J. geophys. Res.: Solid Earth, 120(12), 8701–8719.
82
Moulin, A., 2014: Active tectonics of the Alps-Dinarides junction: quantitative
morphology, fault kinematics and implications for the Adria microplate geodynamics.
Doctoral Thesis.
Moulin et al., 2016: The Dinaric fault system: Large-scale structure, rates of slip, and
Plio-Pleistocene evolution of the transpressive northeastern boundary of the Adria
microplate. Tectonics, 35(10), 2258–2292.
Moulin & Benedetti, 2021: Fragmentation of the Adriatic Promontory: New
Chronological Constraints From Neogene Shortening Rates Across the Southern Alps
(NE Italy). In: Tectonics, Vol. 37, Issue 9, 3328 – 3348.
Nocquet, J. M., 2012: Present-day kinematics of the Mediterranean: A comprehensive
overview of GPS results. Tectonophysics, 579, 220–242.
O’Brien, P.J., 2001: Subduction followed by collision: Alpine and Himalayan
examples. Physics of the Earth and Planetary Interiors, 127(1–4), 277–291.
https://doi.org/10.1016/S0031- 9201(01)00232- 1
Panno et. al, 2009: Major Earthquakes Recorded by Speleothems in Midwestern U.S.
Caves. in: Bulletin of the Seismological Society of America, Vol. 99, No. 4, pp. 2147–
2154.
Placer, 1999: Contribution to the macrotectonic subdivision of the border region
between Southern Alps and External Dinarides. Geologija, 41(1998), 223–255.
Placer, 2008: Principles of the tectonic subdivision of Slovenia. Geologija, 51(2), 205–
217.
Placer et al., 2010: The bases for understanding of the NW Dinarides and Istria
Peninsula tectonics. Geologija, 53(1), 55–86.
Poljak et al., 2000: The seismotectonic characteristics of Slovenia. In Seismic Hazard
of the Circum-Pannonian Region (pp. 37–55). Springer.
83
Postpischl et al., 1991: Palaeoseismicity from karst sediments: the “Grotta del Cervo”
cave case study (Central Italy). in: Tectonophysics, Vol. 193, no. 1, p. 33 - 44.
Rajendran et al., 2016: Stalagmite growth perturbations from the Kumaun Himalaya
as potential earthquake recorders. in: Journal of Seismology Vol. 20, p. 579-594.
Ribaric, 1982: Seismicity of Slovenia; catalogue of earthquakes (792 AD--1981).
Seizmološki zavod SR Slovenije.
Riznar et al. 2007: Recentna aktivnost regionalnih geoloških struktur v zahodni
Sloveniji. Geologija, 50(1), 111–120.
Sasowski et al., 2003, Concurrent tectonism and aquifer evolution >100,000 years
recorded in cave sediments, Dinaric karst, Slovenia. in: Environmental Geology, Vol.
44, p. 8-13.
Sebela, 2008: Broken speleothems as indicators of tectonic movements. in: Acta
Carsologica, Vol. 37 no. 1, p. 51-62.
Sebela, 2010: Effects of earthquakes in Postojna cave system. in: Acta Carsologica,
Vol. 39 no. 3, p. 597-604.
Sebela et al., 2021: Micro-displacement monitoring in caves at the Southern Alps–
Dinarides–Southwestern Pannonian Basin junction. In: Bulletin of Engineering
Geology and the Environment, Vol. 80, 7591 – 7611.
Shanov, S., Kostov, K., 2015: Dynamic Tectonica and Karst. Springer-Verlag Berlin
Heidelberg.
Shmuel et al., 1996: Long‐term earthquake clustering: A 50,000‐year paleoseismic
record in the Dead Sea Graben. In: Journal of Geophysical Research: Solid Earth, Vol
101, B3, 6179-6191.
Spötl & Mattey, 2012: Scientific drilling of speleothems – a technical note. in:
International Journal of Speleology, Vol. 41, p. 29 - 34.
84
Stampfli et al., 1998: Subduction and obduction processes in the Swiss Alps.
Tectonophysics, 296(1–2), 159–204. https://doi.org/10.1016/S0040-1951(98)00142-5
Stampfli & Borel, 2002: A plate tectonic model for the Paleozoic and Mesozoic
constrained by dynamic plate boundaries and restored synthetic oceanic isochrons.
Earth and Planetary Science Letters, 196(1–2), 17–33.https://doi.or g/10.1016/S0012-
821X(01 )00588- X
Szczygiel et al. 2021: Quaternary faulting in the Western Carpathians: Insights into
paleoseismology from cave deformations and damaged speleothems (Demänová Cave
System, Low Tatra Mts. in: Tectonophysics, Vol. 820, p. 229111.
Vicic, B., 2017: High resolution earthquake relocation along Idrija fault system in
Western Slovenia and its application in understanding the deformation along the active
faults of NW External Dinarides, PhD-Thesis.
Vicic et al., 2019: Geometry and mechanics of the active fault system in western
Slovenia. In: Geophysical Journal International, Vol. 217 Issue 3, 1755-1766.
Vrabec & Fodor, 2006: Late Cenozoic tectonics of Slovenia: structural styles at the
Northeastern corner of the Adriatic microplate. The Adria Microplate: GPS Geodesy,
Tectonics and Hazards, 151–168.
Weber et al., 2010: GPS-derived motion of the Adriatic microplate from Istria
Peninsula and Po Plain sites, and geodynamic implications. Tectonophysics, 483(3),
214–222.
Woodhead et al., 2016: Developing a radiometrically-dated chronologic sequence for
Neogene biotic change in Australia, from the Riversleigh World Heritage Area of
Queensland. in: Gondwana Research Vol. 29, p. 153-167.
Xueqin & Fudong: Damaged Speleothems of the Ms 8.0 Wenchuan Earthquake,
China, and the Implications for Seismology. in: Geophysical Research Abstracts, Vol.
19, EGU General Assembly 2017.

85
Zivcic et al., 2014: Temporary seismological measurements in the Postojna Cave
System. in: Acta Carsologica, Vol. 43 no. 1, p. 149-157.
Zupancic et al., 2001: The earthquake of 12 April 1998 in the Krn Mountains (Upper
Soča valley, Slovenia) and its seismotectonic characteristics. Geologija, 44(1), 169–
192.

86
Web pages without Author
http://www.speleothemscience.org/who/, accessed 2018-08-11
https://www.earth.ox.ac.uk/research-groups/isotopes-and-climate/people/, accessed
2018-08-15


