Embed Size (px)
Citation preview
5
Sanja Klempić – Split as an In-migration Centre
Split as an In-migration Centre
Sanja Klempić
HRVATSKI GEOGRAFSKI GLASNIK 66/1, 5 – 28 (2004.)
UDC 911.3:314.7 (497.5 Split) Original Scientifi c PaperIzvorni znanstveni članak
This paper deals with problems of demographic development in Split with an emphasis on in-migration. The analysis covers the central urban zone of Split (central city). Industriali-sation after the Second World War had a decisive impact on the economic and demographic development of the city. This process attracted a large number of in-migrants from the neighbouring islands, from Zagora (i.e. the Dalmatian Hinterland) and from other parts of Dalmatia. This paper presents the results of research carried out in Split in 2002.
Key words: in-migration, indigenous and in-migrated population, origin of in-mi-grants, in-migration factors
Split kao imigracijsko središte
Rad se bavi problematikom demografskog razvoja Splita, s težištem na ulozi do-seljavanja. Analizom je obuhvaćeno centralno gradsko područje Splita (matični grad). Industrijalizacija nakon Drugoga svjetskog rata presudno je utjecala kako na gospodarski, tako i na demografski razvoj grada. Ona je privukla veliki broj doseljenika s obližnjih otoka, iz Zagore, ali i drugih dijelova Dalmacije. U radu su izneseni i rezultati istraživanja provedenog u Splitu 2002. godine.
Ključne riječi: imigracija, domorodno i doseljeno stanovništvo, podrijetlo doselje-nika, čimbenici doseljavanja
INTRODUCTION
When a city, known for its beauty, historical heritage, particular mentality and nu-merous other specifi c qualities is declared a “problem city” (a “case” to be resolved), it is high time to ask why it is so. Precisely this happened to Split, a Mediterranean city with a famous and rich history, the last residence of a Roman emperor, a city situated on an interesting part of the coast, in an area between an austere hinterland and a beautiful string of islands.
6
Hrvatski geografski glasnik 66/1 (2004.)
The Mediterranean ambient has left its mark on the city’s social identity and infl uenced the temperament and openness, for which the people of Split are known. Apart from an intensive social life, the city was proud of its urban identity. However, mass construction after the Second World War, mostly uncontrolled, undermined the city’s former character, and the infl ow of migrants changed its people’s mentality. Today Split is the city, in which the infl u-ence of in-migrants’ is stronger than that of the indigenous population. In the 1990s the city suffered economic problems. There was high unemployment, leading to feelings of depression and hopelessness, which caused numerous problems, even criminal.
The area of research of this paper is Split – the second-largest city in Croatia and the largest city on the Croatian coast. Because of its size and functions, it has given motion to many processes in the region. Thus, under the infl uence of the central city, the Split urban agglomeration developed along the strip: Trogir-Kaštela-Solin-Split-Omiš.
The aim of our research was to analyse and defi ne the principal processes pertaining to the city’s demographic development. For that purpose, in 2002, fi eld work was carried out in Split, using a questionnaire survey.1 The area studied was Split’s central urban zone (central city). By the Decision of Split’s City Council, published in Službeni
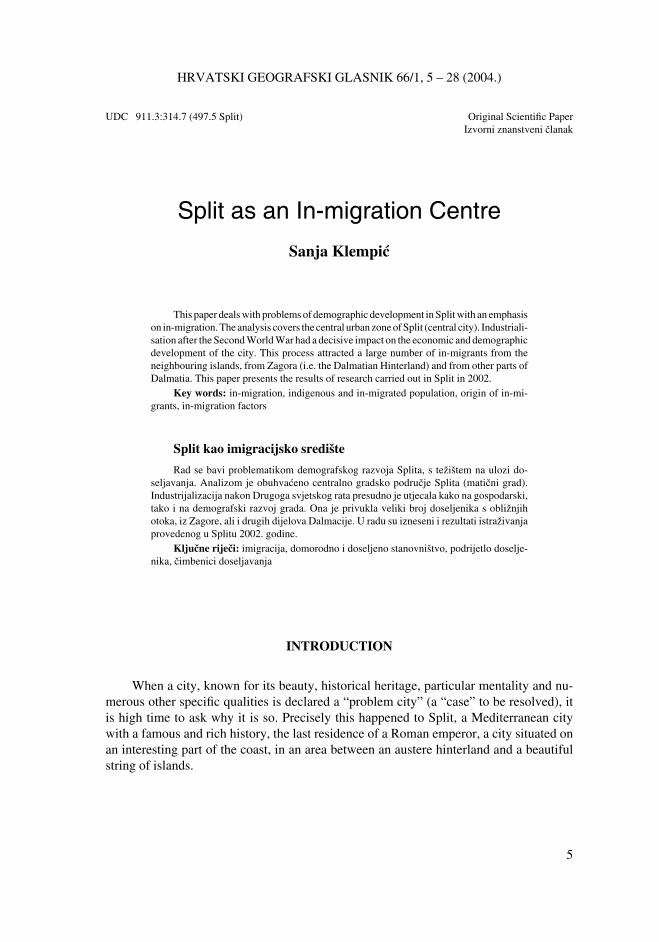
glasnik Splita (Offi cial Bulletin of Split) on July 10th 2002, this area was divided into 27 urban districts: Bačvice, Blatine-Škrape, Bol, Brda, Grad, Gripe, Kman, Kocunar, Lokve, Lovret, Lučac-Manuš, Mejaši, Meje, Mertojak, Neslanovac, Plokite, Pujanke, Ravne Njive, Sirobuja, Split 3, Sućidar, Šine, Špinut, Trstenik, Varoš, Visoka i Žnjan (Fig. 1.).
Fig. 1 Split – Borders of City DistrictsSl. 1. Podjela Splita na gradske četvrti
11
0K
m2
3
7
Sanja Klempić – Split as an In-migration Centre
THE CITY OF SPLIT: TOTAL POPULATION CHANGE 1948-2001
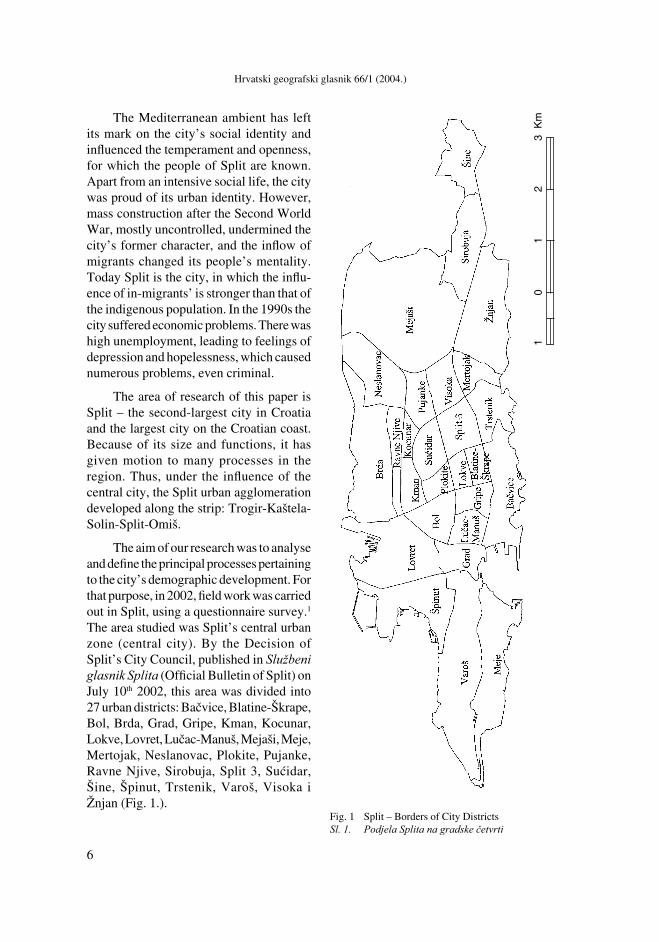
After the Second World War, the (demographic) pull of Split became strong. It developed economic and non-economic functions that reinforced its role as Dalmatia’s regional centre. In 1948, after completion of the railway along the river Una, a further transportation link with Zagreb came into being. A new shipyard was built in the city, industrial and construction companies were established, tourism and trade developed. The city’s economic development stimulated intensive migration from the islands and from the adjacent hinterland. After the Second World War, the highest average annual rates of population growth, as high as 4,5%, was recorded in the inter-census period 1961–1971 (Tab. 1.). The rates were lower in the periods 1948–1953 (3.82%), 1953–1961 (3.56%), 1971–1981 (3.17%) and 1981–1991 (1.12%). Yet in the early 1960s Split had already doubled its population – it needed less than 25 years to do so. This can be explained by rapid industrialisation and strong in-migration.
During the period when Split’s population experienced its most dynamic development (1961–1971), Dalmatia had the average annual population growth rate of 0.92%, and Croatia of only 0.62%. Since in contemporary urban conditions natural growth usually assures only a slight linear increase of the total urban population, exponential growth in this observed case clearly points to strong in-migration (I. Nejašmić 1995,67). In 1961, Split for the fi rst time had more inhabitants than Rijeka, and has remained the most populated coastal town in Croatia ever since. As early as 1978, the city doubled the number of its inhabitants for the second time in the post-war period. After 1981, Split’s population grew more slowly, due to lower birth rates and decreasing in-migration.
In the inter-census period 1991–2001, Split’s population decreased for the fi rst time, since modern censuses were conducted in the city. In this ten-year period, Split lost 14,248
Tab. 1 City of Split: Population Change 1948-2001 Tab. 1. Kretanje broja stanovnika grada Splita 1948.-2001. godine
CensusNumber of
inhabitants
Chain
index
Inter-census
change
Average
annual change
Average
annual change
rate (%)
1948 48,248 136.6 12,916 759.8 1.82
1953 58,443 121.1 10,195 2,039.0 3.82
1961 77,822 133.2 19,379 2,422.4 3.56
1971 123,027 158.1 45,205 4,520.5 4.50
1981 169,322 137.6 46,295 4,629.5 3.17
1991 189,388 111.9 20,066 2,006.6 1.12
2001 175,140 92.5 – 14,248 – 1,424.8 – 0.78
Source: Until 1971. M. Korenčić (1979), Naselja i stanovništvo SR Hrvatske 1857-1971., Djela JAZU knjiga 54, JAZU, Zagreb
Popis stanovništva 1981., Dokumentacija 553. RZS, Zagreb, 1984. Popis stanovništva 1991., Dokumentacija 882, DZS, Zagreb, 1994. Popis stanovništva 2001., CD, DZS, Zagreb, 2002.
8
Hrvatski geografski glasnik 66/1 (2004.)
inhabitants or 7.5% of its 1991-year population. One of the reasons was surely the collapse of former Yugoslavia and Croatian War of Independence. During that time, many active and retired offi cers of the former Yugoslav Army (JNA) and their families, who had lived in great numbers in Split (a military and naval stronghold of the former state), migrated out of Split. In-migration towards Split was still in progress during that period, but the greater part of the in-migrants settled in areas around the city, i.e. in the suburban zone.
MECHANICAL POPULATION MOVEMENTS
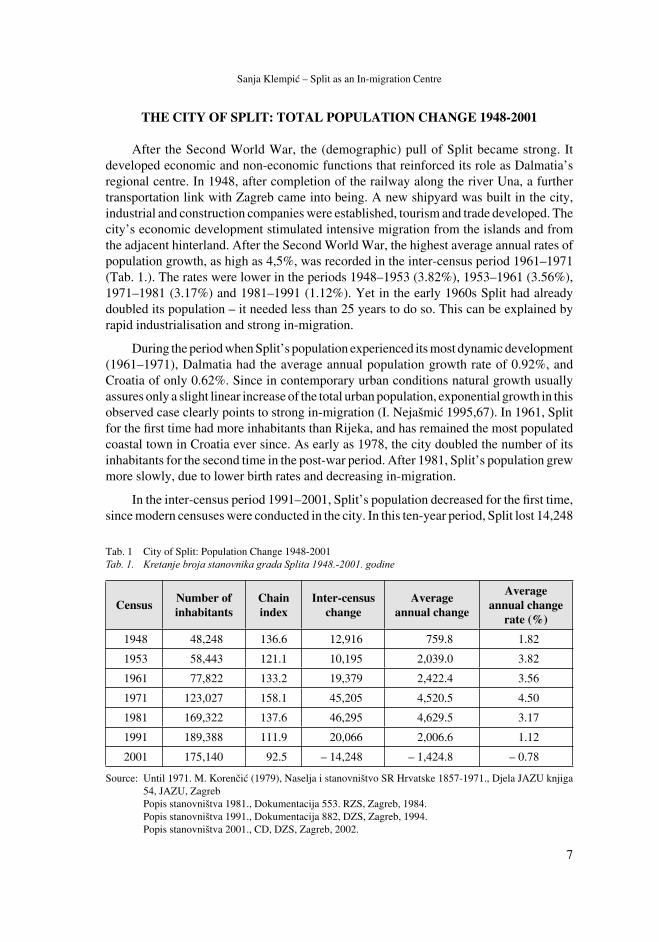
Split, Dalmatia’s largest city, has been an in-migration area for decades. In the period after the Second World War, in-migration was greater than out-migration. Together with natural growth, this was the reason why the population increased. Net migration can be deduced by comparing the absolute inter-census change of the total population with the portion of it due to natural growth. Net migration can be calculated for the greater Split area for the period 1961–2001, and from 1981, it is also possible to calculate it for the central city.
Tab. 2 The Greater Split Area*: Net Migration 1971-2001, General Population TrendTab. 2. Neto migracijski saldo stanovništva šireg gradskog područja Splita* od 1971. do 2001., tip općeg
kretanja stanovništva i trend
Inter-census
period
Population
change
Natural
change
Net migration ** General
Population TrendAbsolute Relative(%)***
1961–1971 53,291 13,443**** 39,846 40.0 I1- Expansion through in-migration
1971–1981 52,00921,588
30,421 19.8 I1- Expansion through in-migration
1981–1991 29,752 17,947 11,805 5.7 I1- Expansion through in-migration
1991–2001 – 4,804 9,747 – 14,551 – 6.2 E2 - Depopulation
* This relates to the “greater” Split area, which included 16 current independent settlements – Donje Sitno, Gornje Sitno, Srinjine, Kamen, Kućine, Mravince, Stobreč, Podstrana (from 1991 Strožanac has also been included), Žr-novnica, Slatine, Solin, Kaštel Sućurac, Kaštel Gomilica, Kaštel Kambelovac, Vranjic and Split (central city).** Net migration amounts to the difference between the change in the population size and natural change.*** Relative net migration is the share of absolute net migration in the total population at the beginning of an inter-census period.**** In the absence of vital statistics data for 1961 and 1962, the author has estimated natural change.
Source: Calculated according to census and vital statistics data.
The highest net migration in the Split agglomeration area was recorded between 1961 and 1971, when it was 39,846 and accounted for 74.7% of the total population increase. In the inter-census period 1971–1981, net migration amounted to 30,421 and had a strong impact on the total population increase (58.5%). In the inter-census period 1981–1991, net migration was considerably smaller – only 11,805 persons, which made up only 39.7% on the total population increase. It was almost three times less in comparison with the previous
9
Sanja Klempić – Split as an In-migration Centre
period. In the inter-census period 1991–2001, net migration was negative, meaning that more people migrated out of the area than into it. A large number of former Yugoslav military persons and their families left. At the same time, there was a population out-fl ow from the central city to the suburbs. At this stage, commuting become more and more frequent, and permanent migration became less intense.
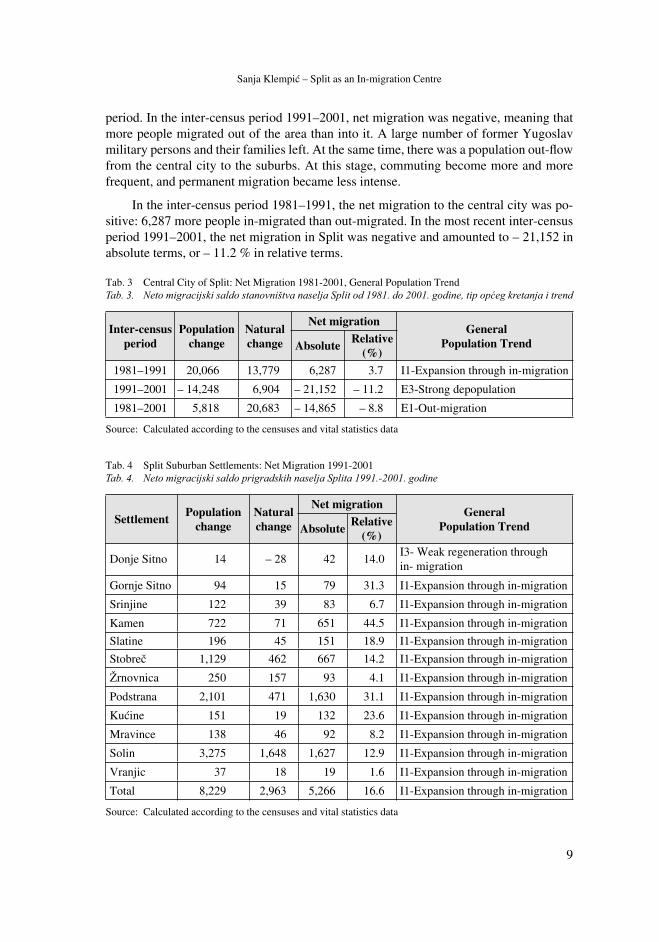
In the inter-census period 1981–1991, the net migration to the central city was po-sitive: 6,287 more people in-migrated than out-migrated. In the most recent inter-census period 1991–2001, the net migration in Split was negative and amounted to – 21,152 in absolute terms, or – 11.2 % in relative terms.
Tab. 3 Central City of Split: Net Migration 1981-2001, General Population TrendTab. 3. Neto migracijski saldo stanovništva naselja Split od 1981. do 2001. godine, tip općeg kretanja i trend
Inter-census
period
Population
change
Natural
change
Net migrationGeneral
Population TrendAbsoluteRelative
(%)
1981–1991 20,066 13,779 6,287 3.7 I1-Expansion through in-migration
1991–2001 – 14,248 6,904 – 21,152 – 11.2 E3-Strong depopulation
1981–2001 5,818 20,683 – 14,865 – 8.8 E1-Out-migration
Source: Calculated according to the censuses and vital statistics data
Tab. 4 Split Suburban Settlements: Net Migration 1991-2001Tab. 4. Neto migracijski saldo prigradskih naselja Splita 1991.-2001. godine
SettlementPopulation
change
Natural
change
Net migration General
Population TrendAbsoluteRelative
(%)
Donje Sitno 14 – 28 42 14.0I3- Weak regeneration through in- migration
Gornje Sitno 94 15 79 31.3 I1-Expansion through in-migration
Srinjine 122 39 83 6.7 I1-Expansion through in-migration
Kamen 722 71 651 44.5 I1-Expansion through in-migration
Slatine 196 45 151 18.9 I1-Expansion through in-migration
Stobreč 1,129 462 667 14.2 I1-Expansion through in-migration
Žrnovnica 250 157 93 4.1 I1-Expansion through in-migration
Podstrana 2,101 471 1,630 31.1 I1-Expansion through in-migration
Kućine 151 19 132 23.6 I1-Expansion through in-migration
Mravince 138 46 92 8.2 I1-Expansion through in-migration
Solin 3,275 1,648 1,627 12.9 I1-Expansion through in-migration
Vranjic 37 18 19 1.6 I1-Expansion through in-migration
Total 8,229 2,963 5,266 16.6 I1-Expansion through in-migration
Source: Calculated according to the censuses and vital statistics data
10
Hrvatski geografski glasnik 66/1 (2004.)
Split is in a post-transitional stage of demographic development characterised by low birth and death rates, the result of which is low natural growth. The population incre-ase in the post-war period was primarily the result of position net migration, and less of natural growth. In the inter-census period 1991–2001, there were more births than de-aths, but there was also strong depopulation, due to the net migration loss.
Intensive in-migration until the early 1990s reinforced the population’s vitali-ty, speeded-up physical-morphological changes, but also burdened the municipal infrastructure to the utmost. In-migration had a strong impact on the spirit and the mentality of the city and also brought about the extinction of many traditional values and particular features of old Split (“the city outgrew itself”) (I. Nejašmić 1995,73).
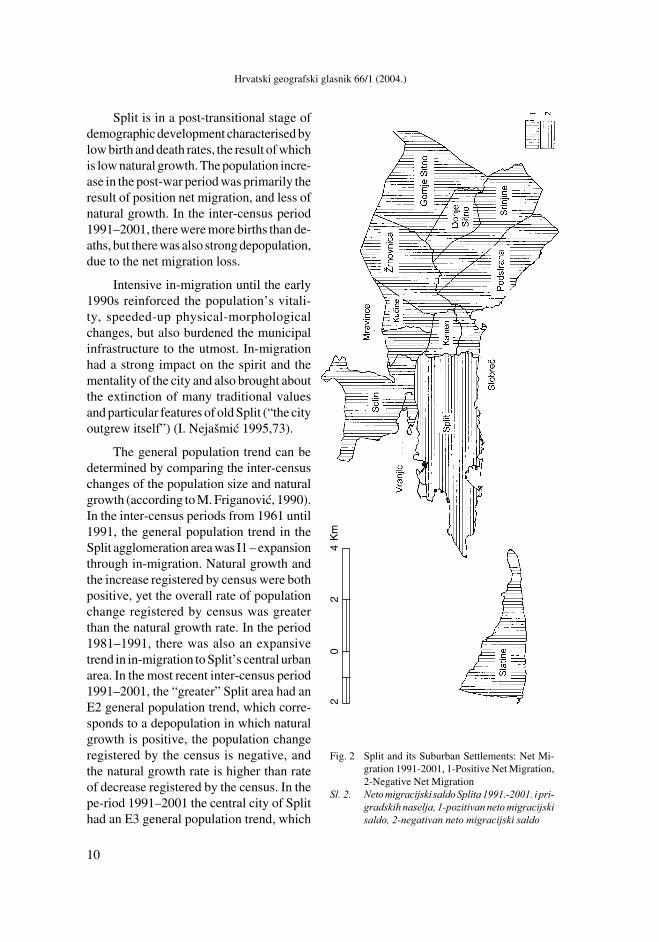
The general population trend can be determined by comparing the inter-census changes of the population size and natural growth (according to M. Friganović, 1990). In the inter-census periods from 1961 until 1991, the general population trend in the Split agglomeration area was I1 – expansion through in-migration. Natural growth and the increase registered by census were both positive, yet the overall rate of population change registered by census was greater than the natural growth rate. In the period 1981–1991, there was also an expansive trend in in-migration to Split’s central urban area. In the most recent inter-census period 1991–2001, the “greater” Split area had an E2 general population trend, which corre-sponds to a depopulation in which natural growth is positive, the population change registered by the census is negative, and the natural growth rate is higher than rate of decrease registered by the census. In the pe-riod 1991–2001 the central city of Split had an E3 general population trend, which
Fig. 2 Split and its Suburban Settlements: Net Mi-gration 1991-2001, 1-Positive Net Migration, 2-Negative Net Migration
Sl. 2. Neto migracijski saldo Splita 1991.-2001. i pri-
gradskih naselja, 1-pozitivan neto migracijski
saldo, 2-negativan neto migracijski saldo
22
0K
m4
11
Sanja Klempić – Split as an In-migration Centre
means strong depopulation due to a natural growth rate lower than the rate of decrease registered by census. In the same period (1991–2001), suburban settlements (Tab. 4) had a I1 population trend, i.e. expansion by in-migration. The exception was the settlement of Donje Sitno, which had a I3 general population trend – weak regeneration through in-migration.
THE INDIGENOUS AND IN-MIGRATED POPULATION
The ratio of the indigenous to the in-migrated population gives us some partial insight into spatial mobility within an area, and it can be one of the indicators of a settlement’s economic development.
The percentage of indigenous inhabitants in settlements is not always constant, since it depends on the scale and dynamics of migration changes in a particular period. The development of industry and other activities requires a large workforce, which involves attracting population from surrounding areas, primarily from rural ones.
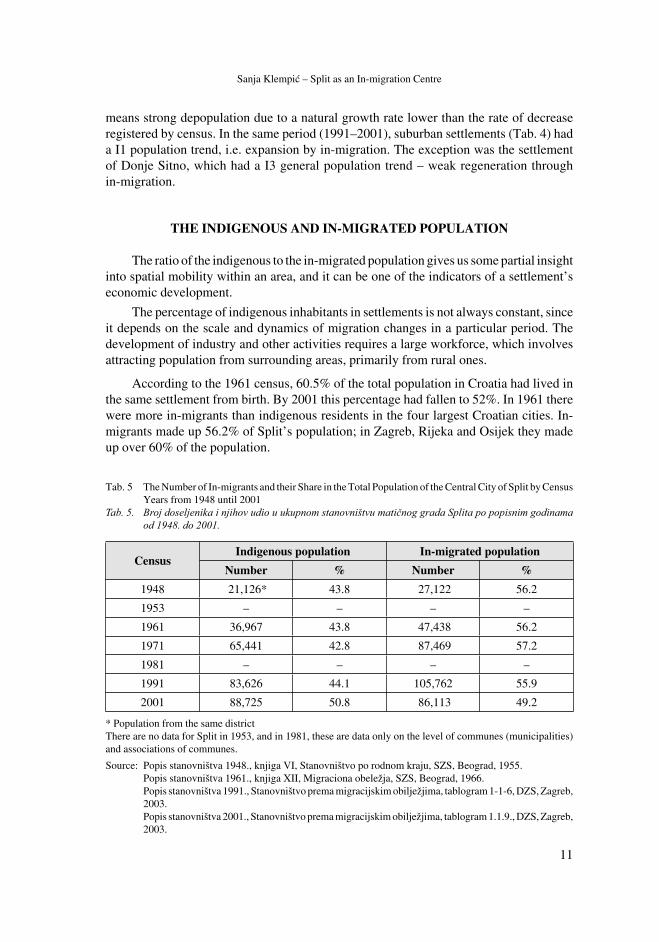
According to the 1961 census, 60.5% of the total population in Croatia had lived in the same settlement from birth. By 2001 this percentage had fallen to 52%. In 1961 there were more in-migrants than indigenous residents in the four largest Croatian cities. In-migrants made up 56.2% of Split’s population; in Zagreb, Rijeka and Osijek they made up over 60% of the population.
Tab. 5 The Number of In-migrants and their Share in the Total Population of the Central City of Split by Census Years from 1948 until 2001
Tab. 5. Broj doseljenika i njihov udio u ukupnom stanovništvu matičnog grada Splita po popisnim godinama
od 1948. do 2001.
CensusIndigenous population In-migrated population
Number % Number %
1948 21,126* 43.8 27,122 56.2
1953 – – – –
1961 36,967 43.8 47,438 56.2
1971 65,441 42.8 87,469 57.2
1981 – – – –
1991 83,626 44.1 105,762 55.9
2001 88,725 50.8 86,113 49.2
* Population from the same districtThere are no data for Split in 1953, and in 1981, these are data only on the level of communes (municipalities) and associations of communes.
Source: Popis stanovništva 1948., knjiga VI, Stanovništvo po rodnom kraju, SZS, Beograd, 1955. Popis stanovništva 1961., knjiga XII, Migraciona obeležja, SZS, Beograd, 1966. Popis stanovništva 1991., Stanovništvo prema migracijskim obilježjima, tablogram 1-1-6, DZS, Zagreb,
2003. Popis stanovništva 2001., Stanovništvo prema migracijskim obilježjima, tablogram 1.1.9., DZS, Zagreb,
2003.
12
Hrvatski geografski glasnik 66/1 (2004.)
After the Second World War migration was intense in Croatia. Cities in the process of industrialisation became pronounced in-migration areas, in which the number of in-migrants grew rapidly. I. Nejašmić (1988) notes that in the period 1948–1981 the urban population increased 4.15% annually and total population only 0.66%, which leads to the conclusion that Croatia was an area in which rural-urban migration represented the principal factor of urbanisation.
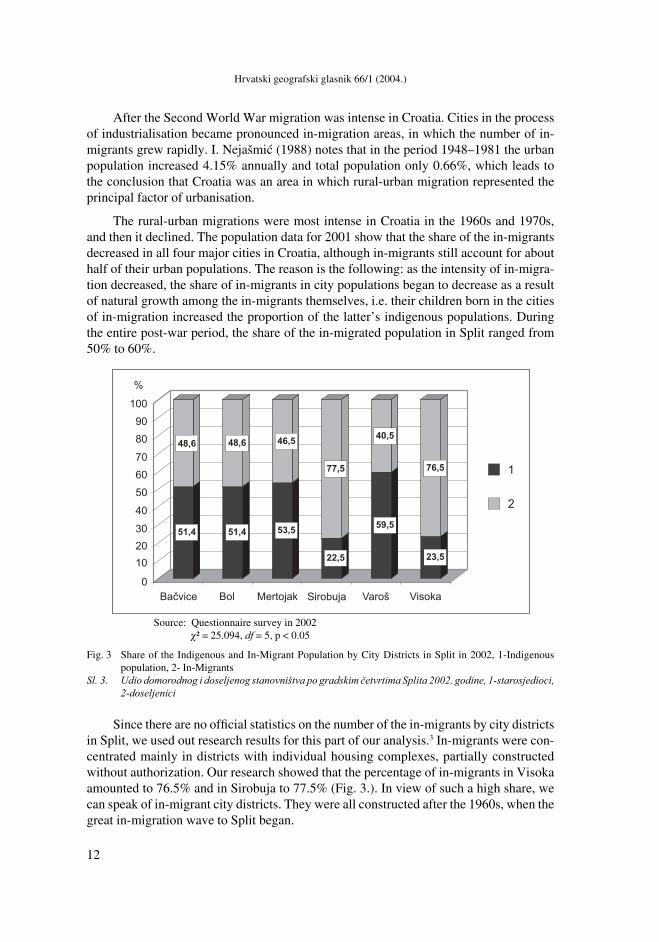
The rural-urban migrations were most intense in Croatia in the 1960s and 1970s, and then it declined. The population data for 2001 show that the share of the in-migrants decreased in all four major cities in Croatia, although in-migrants still account for about half of their urban populations. The reason is the following: as the intensity of in-migra-tion decreased, the share of in-migrants in city populations began to decrease as a result of natural growth among the in-migrants themselves, i.e. their children born in the cities of in-migration increased the proportion of the latter’s indigenous populations. During the entire post-war period, the share of the in-migrated population in Split ranged from 50% to 60%.
Since there are no offi cial statistics on the number of the in-migrants by city districts in Split, we used out research results for this part of our analysis.3 In-migrants were con-centrated mainly in districts with individual housing complexes, partially constructed without authorization. Our research showed that the percentage of in-migrants in Visoka amounted to 76.5% and in Sirobuja to 77.5% (Fig. 3.). In view of such a high share, we can speak of in-migrant city districts. They were all constructed after the 1960s, when the great in-migration wave to Split began.
Source: Questionnaire survey in 2002χ² = 25.094, df = 5, p < 0.05
Fig. 3 Share of the Indigenous and In-Migrant Population by City Districts in Split in 2002, 1-Indigenous population, 2- In-Migrants
Sl. 3. Udio domorodnog i doseljenog stanovništva po gradskim četvrtima Splita 2002. godine, 1-starosjedioci,
2-doseljenici
13
Sanja Klempić – Split as an In-migration Centre
As to the indigenous populations in the selected city districts, we can note that they consist mainly of younger generations, which shows that there is a marked spatial concen-tration of in-migrants in particular parts of the city. In-migrants are largely concentrated in the districts of individual housing construction, which have been partly built without authorization – Visoka, Brda, Mejaši, Dragovode, Neslanovac, Sirobuja, Šine. At the beginning, almost all homes in these districts were built without authorization, but with time they were legalised. The proportion of in-migrants in housing units built between the two wars, in collective housing settlements built in the 1960s and in Split 3 were approx-imately equal. The relatively largest indigenous population was registered in the district of Varoš, Split’s historical core.
In reply to the question: “Are there any districts in Split where people from your home area live?” – 50% of the respondents answered affi rmatively and indicated Visoka, Šine, Sirobuja, Brda and Mejaši as such districts.
Due to a great number of in-migrants in a relatively short period the integration of the indigenous population and the newcomers has not yet been achieved. The frequent concentration of in-migrants in given districts intensifi es separation and increased the ruralization of the city. The problem of city ruralization does not involve only the grow-ing numbers of in-migrants in urban settlements, but also many effects brought on by the transfer of numerous population traits, habits and “life styles” into cities (V. Puljiz 1977; O. Čaldarović 1987).
IN-MIGRATION PERIODS
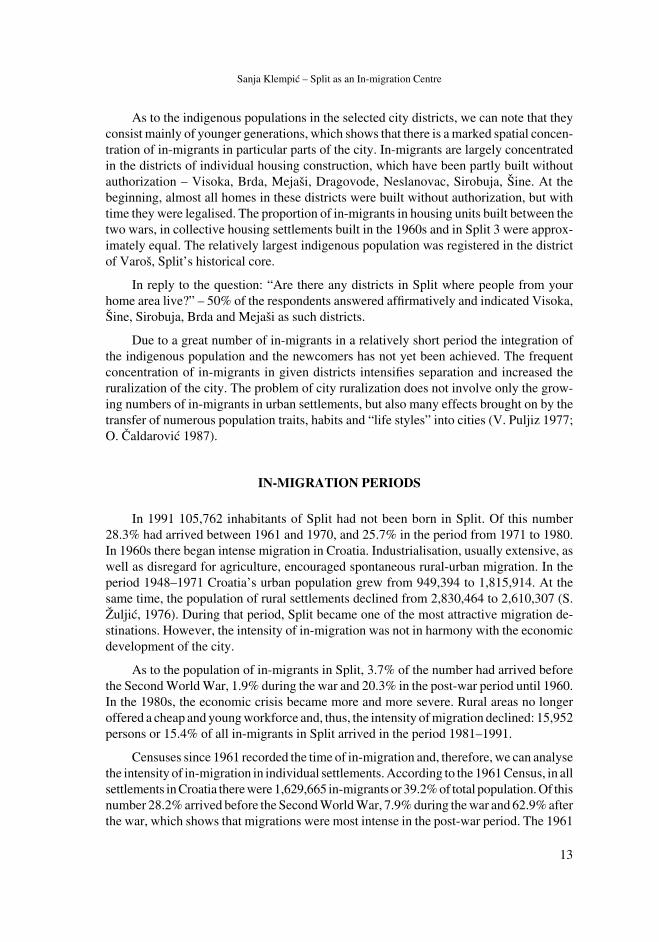
In 1991 105,762 inhabitants of Split had not been born in Split. Of this number 28.3% had arrived between 1961 and 1970, and 25.7% in the period from 1971 to 1980. In 1960s there began intense migration in Croatia. Industrialisation, usually extensive, as well as disregard for agriculture, encouraged spontaneous rural-urban migration. In the period 1948–1971 Croatia’s urban population grew from 949,394 to 1,815,914. At the same time, the population of rural settlements declined from 2,830,464 to 2,610,307 (S. Žuljić, 1976). During that period, Split became one of the most attractive migration de-stinations. However, the intensity of in-migration was not in harmony with the economic development of the city.
As to the population of in-migrants in Split, 3.7% of the number had arrived before the Second World War, 1.9% during the war and 20.3% in the post-war period until 1960. In the 1980s, the economic crisis became more and more severe. Rural areas no longer offered a cheap and young workforce and, thus, the intensity of migration declined: 15,952 persons or 15.4% of all in-migrants in Split arrived in the period 1981–1991.
Censuses since 1961 recorded the time of in-migration and, therefore, we can analyse the intensity of in-migration in individual settlements. According to the 1961 Census, in all settlements in Croatia there were 1,629,665 in-migrants or 39.2% of total population. Of this number 28.2% arrived before the Second World War, 7.9% during the war and 62.9% after the war, which shows that migrations were most intense in the post-war period. The 1961
14
Hrvatski geografski glasnik 66/1 (2004.)
Census recorded that 21.7% of Split’s in-migrant population arrived in the city before the Second World War and 6.6% during the war; 69.4% per cent of in-migrants arrived in the period from 1946 to 1961. This shows that the intensity of migration changed over time.
In 1991, 2,274,371 or 47.5% of Croatia’s population was living in places outside they places of birth. Of this number, 416,772 or 18.4% had arrived from former republics of ex-Yugoslavia. Migration had been most intense in Croatia in the 1970s and 1980s, yet it had been strong in the entire post-war period. Among macro-regional centres, Zagreb experienced the most intensive migration in the pre-war period. At that time it was already the dominant centre in Croatia.
The strongest in-migration to Split occurred between 1961 and 1971, when 29,953 persons arrived in the city, and also in the period 1971–1980, when 27,142 persons or 25.7% arrived (Tab. 6.). In these two periods, Split received more in-migrants than the average in Croatian average, but also more than the average of other macro-regional centres, Zagreb, Rijeka and Osijek, which experienced their most intensive in-migration between the periods 1946–1960 and 1961–1970. Since 1981 the intensity of migration to the four largest Croatian cities has been falling. In this period, 15,952 persons or 15.1% of all in-migrants came to Split, 13% to Zagreb, 12.4% to Rijeka, and only 8.3% to Osijek.
After the Second World War, a rapid deagrarisation process began, which was much more intense than deruralisation.4 Agriculture, as a basic economic activity in rural areas, lost its importance. Out-migration of people from the Dalmatian islands started much earlier than the migrations from Zagora, the Dalmatian Hinterland. The former developed towards the end of the 19th and in the early part of the 20th century. Its main cause was the crisis in wine growing, which had been the islands’ economic base. The trade agreement between Germany, Italy and Austria-Hungary, i.e. the socalled “wine clause”, accepted on December
Tab. 6 The In-Migrant Population according to Period of Arrival in Split, Zagreb, Rijeka, Osijek and Croatia in 1991
Tab. 6. Doseljeno stanovništvo prema razdobljima doseljenja u Split, Zagreb, Rijeku, Osijek i Hrvatsku 1991.
godine
Period
of Arrival
Split Zagreb Rijeka Osijek Croatia
Number % Number % Number % Number % Number %
Total 105,762 100 366,327 100 93,076 100 56,851 100 2,274,371 1001940and before 3,933 3.7 29,150 8.0 2,162 2.3 2,768 4.9 116,228 5.1
1941–1945 1,996 1.9 15,867 4.3 1,507 1.6 2,595 4.6 61,013 2.7
1946–1960 21,480 20.3 94,385 25.8 30,444 32.7 17,624 31.0 470,053 20.7
1961–1970 29,953 28.3 90,587 24.7 22,977 24.7 14,619 25.7 470,413 20.7
1971–1980 27,142 25.7 71,934 19.6 18,942 20.4 10,032 17.6 491,215 21.6
1981–1991 15,952 15.1 49,166 13.4 11,519 12.4 4,722 8.3 497,801 21.9
Unknown 5,306 5.0 15,238 4.2 5,525 5.9 4,491 7.9 167,648 7.3
Source: Popis stanovništva 1991., Stanovništvo prema migracijskim obilježjima, tablogram 1-1-6, DZS, Zagreb, 2003.
15
Sanja Klempić – Split as an In-migration Centre
13th 1891, enabled the favourable sale of Italian wines on the Austro-Hungarian market, which had a negative effect on Dalmatia’s economy. The market prices of the Dalmatian wines declined, production was neglected and the islanders’ living standard decreased. The situation became even worse after the arrival of Phylloxera in 1894. In that period, most islanders emigrated overseas, and only a small part transferred to Split.5
Between the two wars, the overseas migration of islanders continued, but a larger part transferred to Split during that period, due to the restrictive immigration policy of the United States at that time. The attractiveness of Split lay in the fact that it had become Dalmatia’s administrative centre and had developed its functions as a port. The city was becoming the most important and largest city on the Croatian coast. Migration from the islands to Split continued after the Second World War, but the age-sex structure of the islands had already been undermined and, consequently, the proportion of young people, the most mobile part of the population, declined, and thus the intensity of migration decreased.
After the Second World War, rural-urban migration was intensive. The Dalmatian Hinterland, i.e. Zagora, was the most important out-migration area in this period. It was characterised by very active population biodynamics and also by economic underdevelop-ment. As opposed to the islands, whose vital capacities had become exhausted comparatively rapidly, the above-average vital characteristics of Zagora’s population were preserved until the 1970s. By that time, the region experienced demographic destabilisation, largely due to the infl uence of out-migration. This destabilisation was primarily visible in depopulation processes (I. Lajić 1992,159).
Zagora is clearly a karst region, with an extensive and poly-cultural economy and a traditional labour surplus, as a result of vigorous population biodynamics over a relatively long period. There was not any signifi cant out-migration from Zagora until after the Second World War. People in that region survived in the closed circle of an inherited agricultural-cattle economy, from which they could not escape. Confi ned by tradition and a strict family division of labour in remote villages, it was diffi cult for them to decide to migrate (M. Friganović, 1974: 50). Until the Second World War, Zagora was a closed autarkic region. However, the post-war socio-economic changes brought about deagrarisation, followed by a quick exodus. Part of the population came to Split for schooling, and then established itself in the city. The intensity of in-migration was not in accord with the city’s economic development, and such a large number of in-migrants caused a series of problems in it. Unemployment and the housing crisis were the most important ones.
For many years, Zagora has been biologically the most active region of Dalmatia, but by migration to the city, its population has acquired urban patterns of family structures and birth rates. Abrupt migration from the region to the city brought only short-term benefi ts to the city’s demographic structure and to its development. Rapid adaptation of the rural migrants to urban life conditions reduced their natural growth and the number of their household members in the city, and due to ensuing disorders in the Zagora’s population and age structure, there was a slight increase of in-migration of older age groups to the city (I. Šimunović 1986,225).
Part of Zagora’s population emigrated and found temporary employment in West European countries. According to the 1971 census, 50,000 persons from Dalmatia were
16
Hrvatski geografski glasnik 66/1 (2004.)
temporarily employed abroad: 30,000 or 60% had come from Zagora (8,800 of them were from Imotska Krajina) (M. Friganović 1974). On returning from abroad, part of the migrants, originally from Split’s gravitational area, transferred to Split, because it seemed to them the most perspective centre in the region.
During the 1980s, in-migration decreased due to the on-going economic crisis and unemployment, and also because there was less and less young population who could transfer from out-migration areas. The Croatian War of Independence completely disrupted all demographic processes, and the migration ones, as well. Split became a refuge for a great number of expellees, and later for the refugees from Bosnia and Herzegovina, The infl ow of economic migrants declined in this period. Simultaneously, the city lost many residents with the departure of the members of the JNA and due to migration from the city core to its suburbs.
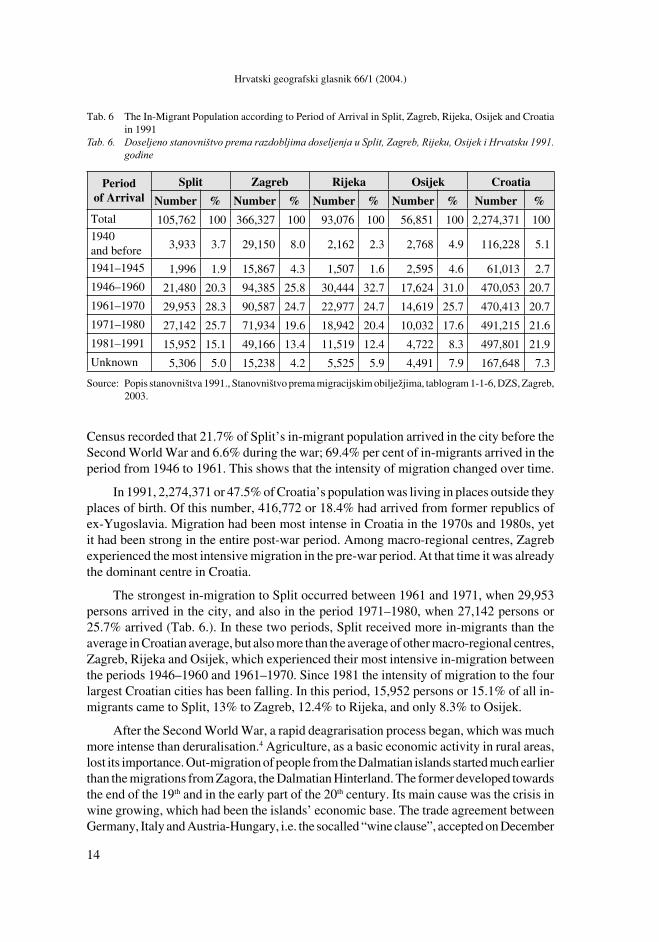
Regarding the intensity of in-migration to Split, six periods can be identifi ed. The 1991 census found that 5.6% of the in-migrants had arrived in the period prior to 1944. According to our research results, 2.3% of in-migrants came during this period, and most of them took up residence in Bačvice, a district built mainly between the two world wars.
Today, the population that migrated to the city in the period 1944–1960 is concentrated mostly in the area of Varoš, somewhat less in Bačvice and Bol. The most intensive period of in-migration to Split was between 1961 and 1970. The economic development of the city intensively attracted the region’s population. The 1991 Census registered 28.3% of
Source: Questionnaire survey in 2002 χ² = 52.679, df = 25. p < 0.05
Fig. 4 In-Migrant Population in Split, by City Districts in 2002Sl. 4. Doseljeno stanovništvo u Split prema gradskim četvrtima stanovanja 2002. godine
17
Sanja Klempić – Split as an In-migration Centre
the in-migrants and our research 27.1% from that period. In-migrants from that period live mainly in individual housing settlements, such as Visoka, and in collective settlements, e.g. Mertojak. In the period 1971–1980, 25.7% of Split’s total non-indigenous population arrived in the city. As much as a third of all in-migrants living today in Visoka and Sirobuja arrived in that period. In the period 1981–1990, the intensity of in-migration decreased. A quarter of Sirobuja’s residents settled in Split permanently during that period. There was a free area for individual housing construction, mostly uncontrolled, and subtenant rents were lower than in all other city districts.
AREAS OF ORIGIN OF THE IN-MIGRANTS
One of the most important aspects of migration is distance, which can be seen as a spatial barrier, and thus, as distance between two areas grows, the intensity of migration between them declines. However, transportation and communications links infl uence the distance-migration relationship. More intensive migration processes can take place between areas separated by greater distances, if these areas are connected by better transportation and communications routes. Information fl ows also have am impact on the correlation between distance and the intensity of migration. In regions with large towns distance is less important, because such towns produce and emit more information about themselves and there is a greater possibility that this information will attract people from over a greater distance (P. Shaw 1975; M. Oliveira-Roca 1980; P.E. Ogden 1984).
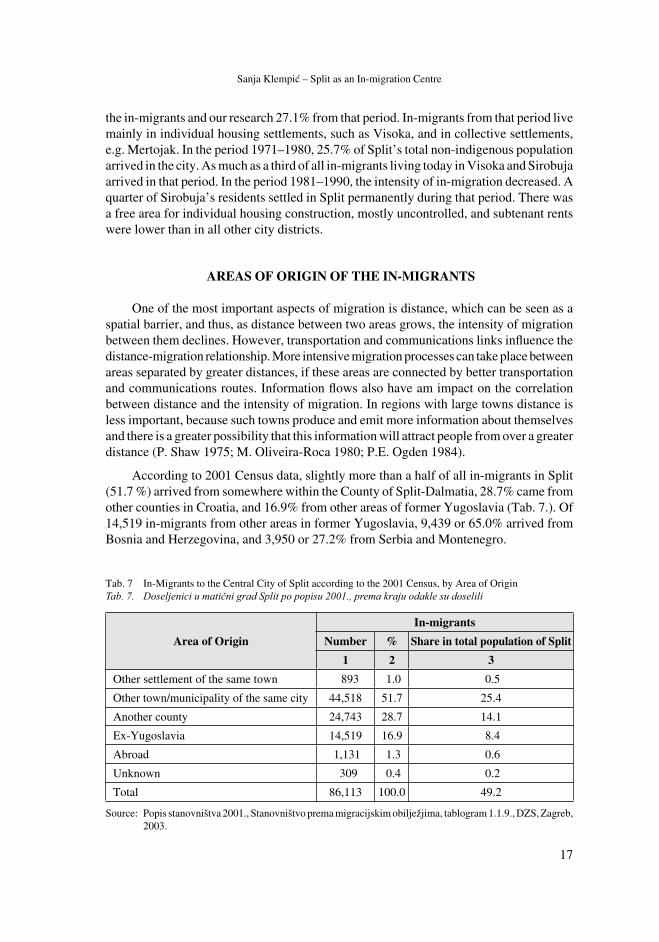
According to 2001 Census data, slightly more than a half of all in-migrants in Split (51.7 %) arrived from somewhere within the County of Split-Dalmatia, 28.7% came from other counties in Croatia, and 16.9% from other areas of former Yugoslavia (Tab. 7.). Of 14,519 in-migrants from other areas in former Yugoslavia, 9,439 or 65.0% arrived from Bosnia and Herzegovina, and 3,950 or 27.2% from Serbia and Montenegro.
Tab. 7 In-Migrants to the Central City of Split according to the 2001 Census, by Area of OriginTab. 7. Doseljenici u matični grad Split po popisu 2001., prema kraju odakle su doselili
Area of Origin
In-migrants
Number % Share in total population of Split
1 2 3
Other settlement of the same town 893 1.0 0.5
Other town/municipality of the same city 44,518 51.7 25.4
Another county 24,743 28.7 14.1
Ex-Yugoslavia 14,519 16.9 8.4
Abroad 1,131 1.3 0.6
Unknown 309 0.4 0.2
Total 86,113 100.0 49.2
Source: Popis stanovništva 2001., Stanovništvo prema migracijskim obilježjima, tablogram 1.1.9., DZS, Zagreb, 2003.
18
Hrvatski geografski glasnik 66/1 (2004.)
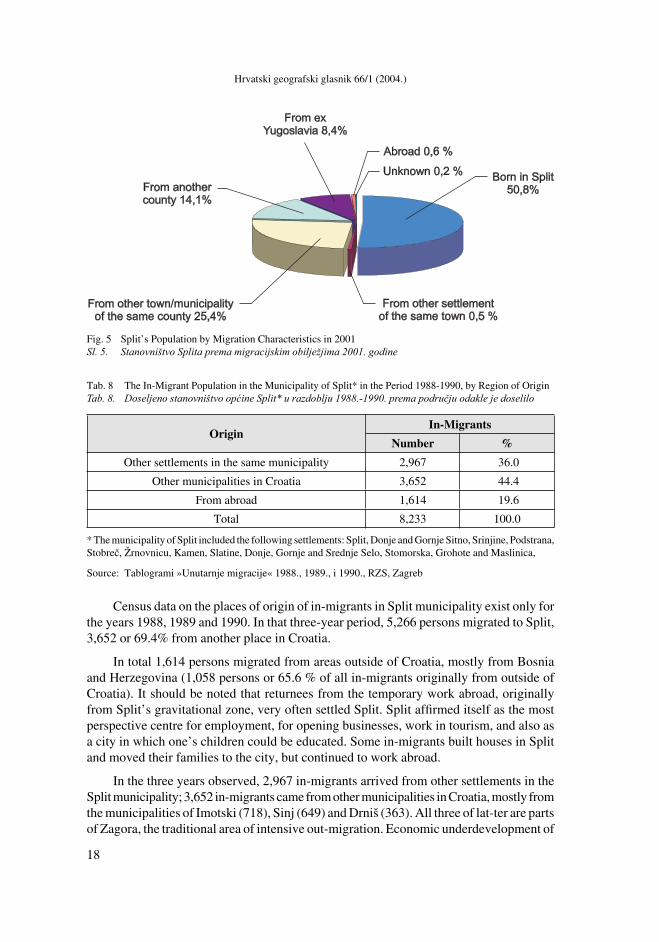
Census data on the places of origin of in-migrants in Split municipality exist only for the years 1988, 1989 and 1990. In that three-year period, 5,266 persons migrated to Split, 3,652 or 69.4% from another place in Croatia.
In total 1,614 persons migrated from areas outside of Croatia, mostly from Bosnia and Herzegovina (1,058 persons or 65.6 % of all in-migrants originally from outside of Croatia). It should be noted that returnees from the temporary work abroad, originally from Split’s gravitational zone, very often settled Split. Split affi rmed itself as the most perspective centre for employment, for opening businesses, work in tourism, and also as a city in which one’s children could be educated. Some in-migrants built houses in Split and moved their families to the city, but continued to work abroad.
In the three years observed, 2,967 in-migrants arrived from other settlements in the Split municipality; 3,652 in-migrants came from other municipalities in Croatia, mostly from the municipalities of Imotski (718), Sinj (649) and Drniš (363). All three of lat-ter are parts of Zagora, the traditional area of intensive out-migration. Economic underdevelopment of
Tab. 8 The In-Migrant Population in the Municipality of Split* in the Period 1988-1990, by Region of OriginTab. 8. Doseljeno stanovništvo općine Split* u razdoblju 1988.-1990. prema području odakle je doselilo
OriginIn-Migrants
Number %
Other settlements in the same municipality 2,967 36.0
Other municipalities in Croatia 3,652 44.4
From abroad 1,614 19.6
Total 8,233 100.0
* The municipality of Split included the following settlements: Split, Donje and Gornje Sitno, Srinjine, Podstrana, Stobreč, Žrnovnicu, Kamen, Slatine, Donje, Gornje and Srednje Selo, Stomorska, Grohote and Maslinica,
Source: Tablogrami »Unutarnje migracije« 1988., 1989., i 1990., RZS, Zagreb
Fig. 5 Split’s Population by Migration Characteristics in 2001Sl. 5. Stanovništvo Splita prema migracijskim obilježjima 2001. godine
19
Sanja Klempić – Split as an In-migration Centre
the region stimulated out-migration. After the municipalities in Zagora, two municipalities within the Split agglomeration produced the largest number of in-migrants: Omiš (293) and Trogir (147), followed by other coastal towns and by the central Dalmatian islands (Brač, Korčula, Hvar i Vis). This confi rms the thesis that the intensity of migration falls as distance from the centre increases.
Analysis of census data and our research results have led us to the conclusion that migration to Split originates from several large areas. The fi rst one is the Dalmatian
Hinterland, i. e. Zagora, which gave Split most of its in-migrants in the post-war period. Out-migration from this area began much later than that from the islands, Dalmatian Zagora is a region with a traditional way of life, which did not have good transport and communication links with larger centres for a long time. However, rapid migration started in the 1950s, primarily caused by dynamic economic and urban growth in the adjacent coastal region of Split (K. Derado 1980,61). In the period 1953–1961, population growth in Zagora was 15,487. Registered natural growth was 44,427 in the same period. Hence, the difference was the result of out-migration (-28,943 inhabitants, which meant that 65% of the natural increase was lost) (M. Friganović, 1974). The agrarian reform and collectivisation nearly destroyed agriculture, where as industrial development by-passed this region. In the period 1961–1971, Zagora lost all its natural increase and 2% of its population in 1961 (M. Friganović 1974,52).
As early as the end of the 19th century, the second region, the Central Dalmatian Islands
became one of Croatia’s out-migration regions. The migration of island populations began considerably earlier than migration from other parts of Dalmatia, primarily due to the wine growing crisis, which was one of the main economic branches on the islands. Economic conditions on the islands made the population migrate (I. Lajić 1992). The islanders were, certainly, among the oldest migrants to Split. The intensity of their migrations declined in the post-war period, primarily due to the decline in the islands’ biodynamics, as a result of prolonged out-migration. In the inter-census period 1953–1961, the islands registered a population fall of -5,161 and natural growth of 4,972, which meant that net migration had been -10,133. In the period 1961–1969, the natural growth rate in Zagora fell by 49%, and on the islands even by 125% (M. Friganović 1974).
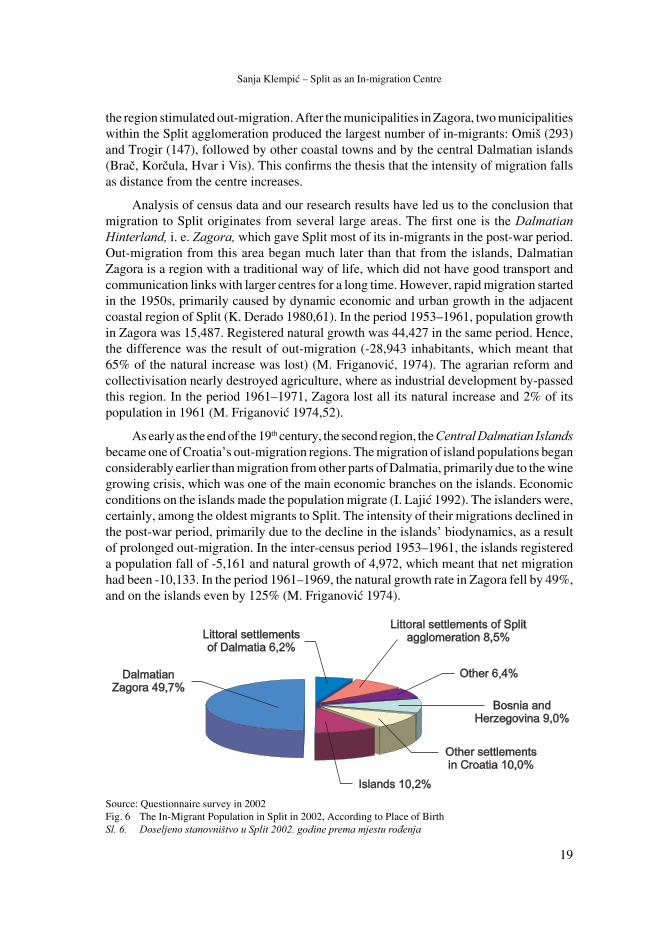
Source: Questionnaire survey in 2002Fig. 6 The In-Migrant Population in Split in 2002, According to Place of BirthSl. 6. Doseljeno stanovništvo u Split 2002. godine prema mjestu rođenja
20
Hrvatski geografski glasnik 66/1 (2004.)
Out-migration from the islands had a negative refl ex on the population’s age-sex stru-cture: the proportion of the elderly constantly grew and that of the young declined. Soon there was no one to migrate from the islands. In 1953 the average age on the Dalmatian island was 33.2 years; the age coeffi cient amounted to 15.2%, and the ageing index to 0.425. In 1981 the average age was 40.7 years, the age coeffi cient was 25.5% and ageing index 1.057 (I. Lajić 1992). Furthermore, in the last ten years or so, the attractiveness of Split for the island population has declined, due to the overall economic crisis in Croatia, which also affected Split. There are few opportunities to fi nd employment in the city, while – on the other hand – island tourism has recovered in recent years.
The Split agglomeration area – Trogir, Kaštela, Solin and Omiš – also gave many migrants to Split during the post-war period. This region was followed by other coastal set-
tlements in Dalmatia. The remaining regions of Croatia participated less in the process.
The relatively numerous immigrants from Bosnia and Herzegovina is concentrated chiefl y in towns, due to possible employment. As Bosnia and Herzegovina has always lagged behind Croatia in economic terms, and migration always takes place from undeveloped areas to developed ones, it is clear that the population from Bosnia and Herzegovina has moved to Croatia, mainly in search of employment.
Immigrants from abroad, besides typical “foreigners” (foreign nationals who have immigrated because of marriage and similar) also include returnees-retired persons.
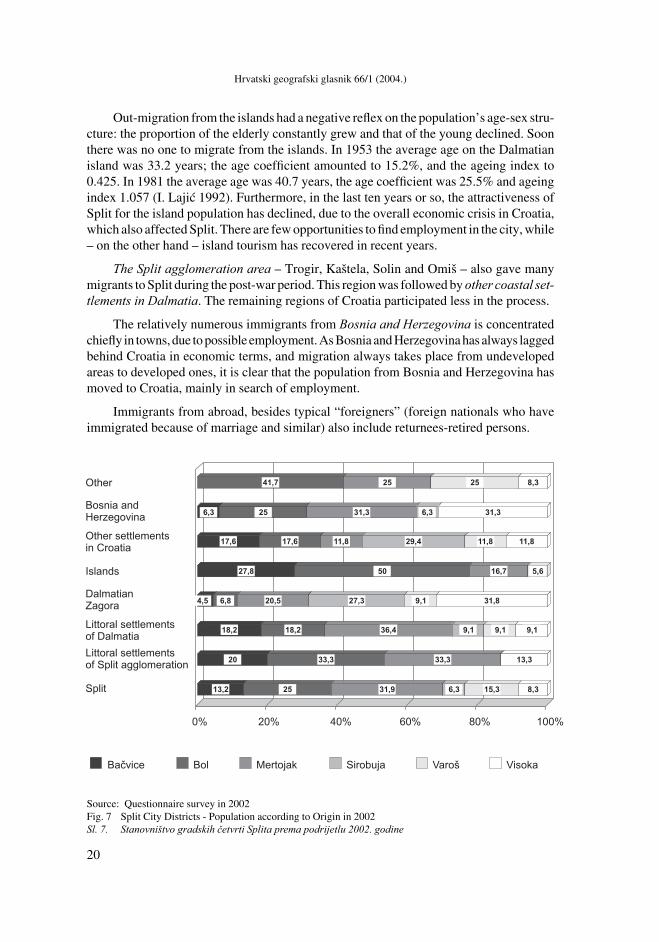
Source: Questionnaire survey in 2002Fig. 7 Split City Districts - Population according to Origin in 2002Sl. 7. Stanovništvo gradskih četvrti Splita prema podrijetlu 2002. godine
2121
Sanja Klempić – Split as an In-migration Centre
Our research confi rmed a signifi cant correlation between the birthplace of respondents and the city district in which they live. Most in-migrants from Zagora live today in Visoka, Sirobuja and Mertojak. They prefer individual housing areas, with a small private plot of land (i.e. a vegetable plot). This enables them to continue, to some extent, their previous rural way of life. Persons originating from the Split agglomeration are concentrated in Bol and Mertojak, and a third of those from Dalmatian coastal settlements reside in Mertojak. Islanders can be found mostly in Bol; migrants from Bosnia and Herzegovina in Visoka, Bol and Mertojak (Fig. 7).
PULL AND PUSH FACTORS IN IN-MIGRATION
The city is an attractive environment. Its attraction is economic and psychological, based on the city’s advantages, but derives from opposition to the rural area’s poverty (J. Beaujeu-Garnier; G. Chabot 1971). As Split developed, the desire of people in adjacent areas to in-migrate grew stronger. Besides economic reasons for transfer, most in-migrants also have psychological ones. The city presents itself as a promising environment. Part of the rural population imagines the city as a place of easier living with many advantages and wants to escape from the rural area – an environment, which is perceived as confi ning.
In the case of Split, the pull factor is the city’s size, which attracts people, primarily from Dalmatia, by its multiple functions (economic, educational, political, administrative, cultural and similar). Push factors in their areas of origin include: underrated agriculture, defi cient infrastructure and poor transport and communications links to the central city (especially from the islands and Zagora), a lack of social contents, no possibilities for further education or fi nding an adequate employment, etc.
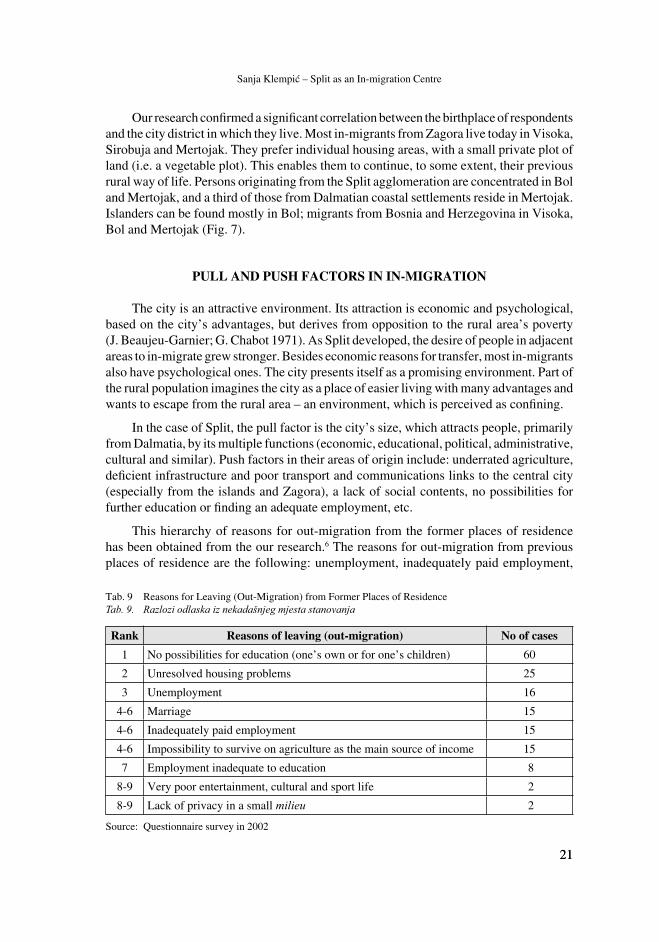
This hierarchy of reasons for out-migration from the former places of residence has been obtained from the our research.6 The reasons for out-migration from previous places of residence are the following: unemployment, inadequately paid employment,
Tab. 9 Reasons for Leaving (Out-Migration) from Former Places of ResidenceTab. 9. Razlozi odlaska iz nekadašnjeg mjesta stanovanja
Rank Reasons of leaving (out-migration) No of cases
1 No possibilities for education (one’s own or for one’s children) 60
2 Unresolved housing problems 25
3 Unemployment 16
4-6 Marriage 15
4-6 Inadequately paid employment 15
4-6 Impossibility to survive on agriculture as the main source of income 15
7 Employment inadequate to education 8
8-9 Very poor entertainment, cultural and sport life 2
8-9 Lack of privacy in a small milieu 2
Source: Questionnaire survey in 2002
22
Hrvatski geografski glasnik 66/1 (2004.)
employment inadequate to education, unresolved housing problems, no possibilities of education (one’s own or for one’s children), the impossibility to survive on agriculture as the main source of income, very poor entertainment, cultural and sport life, marriage and the lack of privacy in a small milieu.
Our research results showed that the most important reason for discontent and for the decision to migration from former places of residence was the impossibility to rece-ive education (Tab. 9.). This is understandable, since most of the respondents migrated from rural settlements, where education is limited. The second most important reason for migration was unresolved housing. Lack of money for building a house or buying a fl at in the former place of residence is also one of the reasons, why respondents chose to migrate. The city (i.e. Split) was perceived as a place, where it is much easier to resolve the housing problem, since state fi rms ensured fl ats for their employees. Important reasons are also unemployment and inadequately paid employment, as well as the impossibility of survival from agriculture. On the basis of all the above-mentioned we can conclude that educational and economic reasons were the key reasons for decisions to migrate from the previous place of residence.
Tab. 10 Reasons for choosing Split as the Place of In-MigrationTab. 10 Razlozi izbora Splita kao mjesta doseljenja
Rank Reasons for in-migration No of cases
1 One’s own education 40
2 Possibility of resolving a housing problem 38
3 In-migration with parents 35
4 Possibility of fi nding any employment 28
5Possibility of fi nding employment “in one’s profession” or better paid employment
23
6 Desire to live in the city 19
7 Education of one’s children 16
8 Desire to live by the sea 13
9 Richer cultural, entertainment and sport programs in the city 3
Source: Questionnaire survey in 2002
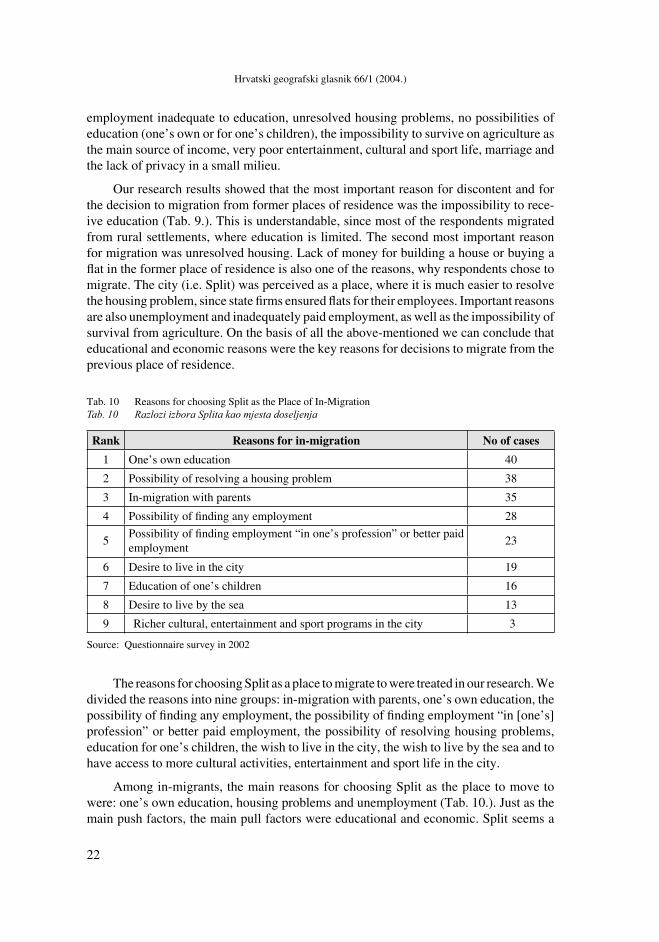
The reasons for choosing Split as a place to migrate to were treated in our research. We divided the reasons into nine groups: in-migration with parents, one’s own education, the possibility of fi nding any employment, the possibility of fi nding employment “in [one’s] profession” or better paid employment, the possibility of resolving housing problems, education for one’s children, the wish to live in the city, the wish to live by the sea and to have access to more cultural activities, entertainment and sport life in the city.
Among in-migrants, the main reasons for choosing Split as the place to move to were: one’s own education, housing problems and unemployment (Tab. 10.). Just as the main push factors, the main pull factors were educational and economic. Split seems a
23
Sanja Klempić – Split as an In-migration Centre
pro-mising environment, in which respondents believe that it is possible to resolve most of their existential problems.
Today Split is loosing its attraction. The reasons are: a very high unemployment rate, absence of the former public housing programme (no possibility of resolving housing problems) and also social factors – crime, the drug problem and a city milieu not suited to upbringing children.
One fi fth of all in-migrants (38) was employed in Split or had ensured employment in the city before arriving at the decision to defi nitively migrate to it.
In total 155 respondents answered the question whether they considered Split as their permanent place of residence when they arrived. Some that did not answer that question (22 or 12.4%) migrated to Split as little children with their parents and did not think about it. As many as 115 respondents or 65% considered Split their permanent place of residence.
A total of 152 respondents, i.e. 85.9%, do not think that they have made a mistake in regard to migration to Split; 25 (14.1%) of them thought that they have made a mistake, and the reasons they mentioned were: unfulfi lled fi nancial expec-ta-tions, a sense of not belonging, etc.
CONCLUSION
After the Second World War, Split experienced intensive population growth. In-migration had the leading role in the increase of the city’s population, whereas the role of the natural growth was secondary. Inter-census changes show that the most intensive population growth occurred in the inter-census period 1961–1971. The reasons can be found in industrialisation and in the development of tertiary activities, re-qui-ring workforce and thus attracting the population from adjacent areas.
Net migration to the city agglomeration in the period 1961–1971 amounted to 39,846 persons and this accounted for a part of total population growth. Although the number of in-migrants was slightly smaller in the 1970s, in-migration continued to be intense. In the most recent inter-census period 1991–2001, net migration in Split was negative, primarily due to the departure of the former Yugoslav (JNA) military persons and their families. At the same time, there was a population out-fl ow from the central city to the suburbs. During the same period, suburban settlements continued to register growth mostly through in-migration.
All post-war censuses have shown that slightly more than a half of the population were in-migrants. The most recent census registered that the indigenous population made up 50.8%. This was the fi rst time in the last fi fty years that a census registered more indi-genous than in-migrated inhabitants in Split. Strong inmigration over the last fi fty years reinforced the city’s demographic vigour, but it had a negative refl ex on the change of spirit and mentality of Split’s inhabitants.
24
Hrvatski geografski glasnik 66/1 (2004.)
Our research, on the basis of our questionnaire, confi rmed our hypothesis that areas of unregulated housing construction developed mostly under the infl uence of in-migra-tion. Namely, in-migrants mainly inhabited districts of individual housing, the majority of which were built without authorization. An example of such in-migrant district, in regard respondents’ place of birth, was Sirobuja. Besides Sirobuja, there are some other in-migrant districts in Split’s city core: Visoka, Mejaši, Dragovode, Brda, Šine and others. Our research also affi rmed that in-migrants concentrate within the city according to their places of origin. Most in-migrants from the same region live in specifi c districts, and so we can speak of a certain spatial form of segregation. Two thirds of the respondents in the selected in-migrant districts have relatives in the same districts. For example, in the district Visoka, most residents are from Dalmatian Zagora. Such groupings of in-migrants in particular districts have intensifi ed the separation of settlements from the urban way of life and have provoked the phenomenon of urban ruralization. Namely, in-migrants from rural settlements try to maintain their old ways of life, not accepting urban rules of beha-viour. The city does not succeed in assimilating its new citizens, but rather they change the city’s way of life. Based on numerous new traits, Split has become a typical example of city subjected to ruralization. The third hypothesis affi rmed by our fi eldwork pertains to a type of migration, i.e. to chain migration to Split. In-migrants, mainly satisfi ed with their life and the possibilities offered to them in Split, spread information to their relatives and friends in the home area and “draw” them to the city.
Our research identifi ed several regions from which in-migration fl ows to Split derive. The fi rst region is Dalmatian Zagora, which gave most of the in-migrants to Split in the post-war period. Vigorous biodynamics and economic underdevelopment characterized Zagora in the whole post-war period. The central Dalmatian islands make up the second region. Out-migration from the islands began by the end of the 19th century. It was cau-sed by the crisis in wine growing. The intensity of migration from the islands declined in the post-war period primarily due to reduction of the islands’ biodynamics, as a result of prolonged out-migration. Settlements of the Split agglomeration – Trogir, Kaštela, Solin and Omiš make up the third region of origin of migrants to Split. Afterwards follow coastal settlements in Dalmatia, Bosnia and Herzegovina and then other areas in Croatia and places abroad.
In the early 1980s, in-migration started to decrease because of the economic crisis in Split, but also because of less and less young people that could migrate from the out-mi-gration regions. Earlier intensive out-migration had negative refl exes on the demographic features of the islands and Zagora, both of which experienced depopulation. The basic demographic trait of these populations is that they are growing old, which results in a reduction of their migration potential.
The basic push factors for leaving former places of residence have been fi rstly of an economic nature: unemployment, inadequately paid employment, etc., followed by educational reasons: no possibilities of educating oneself or one’s children, and then housing problems. Respondents emphasized the possibility of getting a fl at from their fi rm as one of Split’s pull factors. Other push factors were mostly of an economic or an educational nature.
25
Sanja Klempić – Split as an In-migration Centre
NOTES
1. The questionnaire was prepared in accord with the research aims. It contained 65 questions mostly of the closed type. The questionnaire survey was carried out on the basis of a random sampling of the population older than 19. Territorial stratifi cation of the sample was based on the division of Split into city districts. As it proved impossible to conduct the survey in all 27 city districts, we grouped them into six groups according to their common features. The fi rst group consisted of the historical core, i.e. the district built prior to the First World War – Grad (City), Varoš and Lučac-Manuš. The second group included the districts constructed mainly between the world wars – Meje and Bačvice. The third group was represented by districts created in the 1960s through planned collective housing construction – Bol, Špi-nut, Gripe, Lovret, Blatine-Škrape, Lokve and Plokite. The fourth group of districts entered mainly into the category of individual housing construction – Visoka, Brda, Kman. The fi fth group covered collective settlements built in the 1970s and 1980s within the concept of Split 3 – Mertojak, Trstenik, Split 3, Pujanke, Kocunar, Sućidar, Ravne Njive and Žnjan. The sixth group of districts was chiefl y characterised by unauthorized individual housing construction – Sirobuja, Šine, Neslanovac and Mejaši. For the research purposes, six representative city districts were singled out by random selection and the questionnaire was carried out in them: Varoš, as an example of a district formed before the First World War, Bačvice – constructed chiefl y between two wars, Bol as an example of the plan-ned construction of collective fl ats in the 1960s, Visoka – an individual construction settlement, Mertojak, one of the residential units of Split 3, and Sirobuja, an the example of unauthorized construction. All in all 321 persons responded to the questionnaire within the territory of Split. The number of respondents was determined proportionally to the population size in each district in relation to the total population of Split. Thus, 37 persons responded in Varoš, as well as in Bačvice, 70 in Bol, 51 in Visoka, 86 in Mertojak and 40 in Sirobuja
2. The indigenous population comprises all persons born in Split and living there from their birth. We excluded persons born in Split (the closest maternity hospital), whose mothers did not reside in Split at the time of their birth.
3. Once, other districts were also in-migration districts, but with time and due to the in-migrants’ birth rate, they lost such characteristics.
4. In the period 1953–1981, the rate of decrease of the rural population amounted to – 4.2%, that of active farmers to – 5.6% and that of the total rural population to – 0.9%; the number of rural economic homesteads declined only for – 0.6%t (J. Defi lippis, 1993).
5. In regard to emigration, Dalmatia, especially the islands, is a major emigration region in Croatia. In the period 1880–1910, 58,000 persons or 13% of the 1880 population migrated from Dalmatia. From 1918 to 1938, another 30,000 persons migrated from Dalmatia. Dalmatian out-migration was directed towards the United States, Argentina, Chile and Australia (M. Friganović, 1974).
6. Only those who migrated to Split answered the question on migration from their previous place of residence, so the total number of respondents was 177.
REFERENCES
Beaujeu-Garnier J., Chabot G., 1971: Urban Geography, Longman
Čaldarović O., 1987: Suvremeno društvo i urbanizacija, Biblioteka Suvremena misao, Školska knjiga, Zagreb
Defi lippis J., 1993: Obiteljska gospodarstva Hrvatske, AGM, Zagreb
Derado K., 1980: Suvremeni procesi povezivanja zagorskog pojasa s primorjem, posebno Splitom, Spomen-zbornik proslave obljetnice GDH 1947–1977, GDH, Zagreb, 61–69
26
Hrvatski geografski glasnik 66/1 (2004.)
Friganović M., 1972: Dnevne i tjedne migracije radnika u Split, Urbanistički zavod Dalmacije, Split
Friganović M., 1974: Splitsko priobalje sa Zagorom, u: Geografi ja SRH, knjiga 6, Južno Hrvatsko primorje, Geografski institut PMF-a, Školska knjiga, Zagreb, 39–148
Friganović M., 1990: Demogeografi ja – stanovništvo svijeta, Školska knjiga, Zagreb
Lajić I., 1992: Stanovništvo dalmatinskih otoka, IMIN, Consilium, Zagreb
Nejašmić I., 1988: Uloga i značenje preseljavanja u suvremenom populacijskom razvoju gradova SRH, Geo-grafski glasnik, 50, 45–53
Nejašmić I., 1995: Split – suvremene demografske značajke, Geografski horizont, 2, Zagreb, 66–78
Ogden P. E., 1984: Migration and geographical change, Cambridge University Press, Cambridge
Oliveira-Roca M., 1980: Tipovi i struktura unutrašnjih migracija u SRH, Rasprave o migracijama, 61, Centar za istraživanje migracija, Zagreb
Puljiz V., 1977: Eksodus poljoprivrednika, Biblioteka Sociologije sela, Centar za sociologiju sela, grada i prostora IDIS-a Sveučilišta u Zagrebu, Zagreb
Shaw P. R., 1975: Migration Theory and Fact – A Review of Current Literature, Regional Science Institute, Bibliography Series, No, 5, Philadelphia
Šimunović I., 1986: Grad u regiji, Pogledi, Split
Vresk M., 1986: Centri rada i gravitacijska područja zaposlenih u Hrvatskoj, Radovi 21, 13–22
Vresk M., 1996: Urbanizacija i polarizirani razvoj Hrvatske, Zbornik radova l. hrvatskog geografskog kongresa, Zagreb, 66–73
Vresk M., 1998: Satelitizacija Splitske aglomeracije, Geografski glasnik, 60, 31–48
Žuljić S., 1976: Rast gradskog stanovništva i proces urbanizacije u SRH, u: Centralna naselja i gradovi SRH, Geografski institut PMF-a, Školska knjiga, Zagreb, 33–56
SAŽETAK
Split kao imigracijsko središte
Sanja Klempić
Rad se bavi problematikom demografskog razvoja Splita, s težištem na ulozi dose-ljavanja. Poslijeratna industrijalizacija presudno je utjecala kako na gospodarski, tako i na demografski razvoj grada. Ona je privukla veliki broj doseljenika s obližnjih otoka, Zagore, priobalja i drugih dijelova Dalmacije.
Predmet istraživanja je prostor koji obuhvaća naselje Split u skladu s Odlukom Grad-skog vijeća Grada Splita objavljenoj u Službenom glasniku Splita od 10. srpnja 2002. godine. Ovom odlukom naselje Split podijeljeno je na 27 gradskih četvrti i to: Bačvice, Blatine-Škrape, Bol, Brda, Grad, Gripe, Kman, Kocunar, Lokve, Lovret, Lučac-Manuš, Mejaši, Meje, Mertojak, Neslanovac, Plokite, Pujanke, Ravne Njive, Sirobuja, Split 3, Sućidar, Šine, Špinut, Trstenik, Varoš, Visoka i Žnjan.
27
Sanja Klempić – Split as an In-migration Centre
U razdoblju nakon Drugoga svjetskog rata dolazi do izražaja privlačna snaga Splita koji razvija privredne i neprivredne funkcije i učvršćuje ulogu regionalnog centra Dalma-cije. Gradi se novo brodogradilište, osnivaju se industrijske i građevinske fi rme, razvija se turizam i trgovina. Intenzivan porast broja stanovnika rezultat je prirodnog priraštaja, ali i jakog doseljavanja. Privredni razvoj grada potaknuo je intenzivne migracije stanovništva s otoka i iz neposrednog zaleđa. U razdoblju nakon Dugoga svjetskog rata najveći prosječni godišnji porast zabilježen je u međupopisnom razdoblju 1961-1971. od čak 4,5%, a slijede razdoblja 1948-1953. (3,82%), 1953-1961. (3,56%), 1971-1981. (3,17%) i 1981-1991. (1,12%). Početkom šezdesetih godina Split je doživio udvostručenje broja stanovnika, za koje mu je trebalo manje od 25 godina. To se može objasniti naglom industrijalizacijom, pa u svezi s tim i velikim valom doseljavanja stanovništva. Već oko 1978. zabilježeno je drugo udvostručenje broja stanovnika u poslijeratnom razdoblju. Nakon 1981. slijedi sporiji porast broja stanovnika, zbog smanjenog nataliteta i slabljenja doseljavanja.
Mehanička komponenta imala je ključno značenje u porastu broja stanovnika grada. Neto migracijski saldo za šire gradsko područje u razdoblju 1961-1971. iznosi 39.846 stanovnika i sudjelovao je s 74,7% u ukupnoj promjeni broja stanovnika. Uzroke nala-zimo u industrijalizaciji i razvoju tercijarnih djelatnosti koje stvaraju potrebu za radnom snagom, i time privlače stanovništvo iz okolice. Iako je u razdoblju 1970-ih godina broj doseljenika nešto manji (neto migracijski saldo 30.421) i dalje je useljavanje intenzivno. U posljednjem međupopisnom razdoblju, 1991-2001. neto migracijski saldo naselja Split bio je negativan, i to prvenstveno zbog odlaska ofi cira JNA i njihovih obitelji, ali i zbog preseljavanja stanovništva iz matičnog grada u okolicu. U istom razdoblju prigradska naselja i dalje bilježe porast, najvećim dijelom uvjetovan imigracijom.
Intenzivno useljavanje u posljednjih pedeset godina ojačalo je vitalnu snagu stano-vništva, međutim, negativno se odrazilo na promjenu duha i mentaliteta. Osim toga ubrzalo je fi zionomsko-morfološke promjene, ali i do krajnjih granica opteretilo komunalnu infra-strukturu. Takav intenzitet imigracije nije bio u skladu s ekonomskim razvojem grada, pa se javlja nezaposlenost i stambena kriza. Svi poslijeratni popisi stanovništva pokazali su da je nešto više od pola stanovnika bilo doseljeno. Zadnjim popisom je utvrđeno 50,8% domorodnog stanovništva. To je prvi put u zadnjih pedeset godina da je popisom utvrđeno više rođenih Splićana nego doseljenih.
U radu su izneseni i rezultati istraživanja provedenog u Splitu 2002. godine. Ono je potvrdilo postavljenu hipotezu da četvrti nekontrolirane izgradnje uglavnom nastaju pod utjecajem doseljavanja. Naime doseljenici se uglavnom nastanjuju u četvrtima individualne izgradnje, od kojih je većina bespravno izgrađena. Primjer takve doseljeničke četvrti, s obzirom na strukturu ispitanika prema mjestu njihova rođenja, jest Sirobuja (77,5% ispi-tanika su doseljenici u Split). Uz Sirobuju, doseljeničke četvrti unutar grada su i Visoka, Mejaši, Dragovode, Brda, Šine i neka druga. Uglavnom su izgrađene nakon 1960-ih kada započinje veliki val imigracije u grad. Istraživanje je također potvrdilo grupiranje doselje-nika unutar Splita prema mjestu porijekla. U pojedinim četvrtima živi većina stanovnika doseljenih iz istoga kraja tako da možemo govoriti o svojevrsnoj prostornoj segregaciji. Dvije trećine ispitanika u odabranim doseljeničkim četvrtima ima rodbinu u istoj četvrti u kojoj živi. Primjerice, u četvrti Visoka većina je stanovnika iz Dalmatinske zagore. Takvo grupiranje doseljenika po pojedinim četvrtima potencira svojevrsno izdvajanje naselja
28
Hrvatski geografski glasnik 66/1 (2004.)
Sanja Klempić, MS, assistant,Institute for Migration and Ethnic Studies,Trg Stjepana Radića 3, 10 000 Zagreb, Hrvatska/Croatia,e-mail: [email protected]
iz cjeline gradskog načina života i izaziva pojavu ruralizacije grada. Naime, doseljenici iz ruralnih naselja pokušavaju zadržati stari način života, ne prihvaćajući urbana pravila ponašanja. Grad ne uspijeva asimilirati svoje nove građane, već oni mijenjaju način života grada. Split po mnogim svojim karakteristikama predstavlja tipičan primjer ruralizacije grada. Treća hipoteza koju smo potvrdili terenskim istraživanjem je ona o vrsti migra-cije, tj. lančanoj migraciji u grad Split. Doseljenici, u većini zadovoljni svojim životom i mogućnostima koje im Split pruža, služe kao izvor informacija rodbini i prijateljima u zavičaju i “dovlače” ih u grad.
Istraživanjem je utvrđeno nekoliko područja iz kojih su dolazile imigracijske struje u Split. Prvo područje je Dalmatinska Zagora koja je u poslijeratnom razdoblju Splitu dala najviše doseljenika. Živa biodinamika i gospodarsko zaostajanje obilježja su Zagore u cijelom poslijeratnom razdoblju. Iseljavanje iz ovog područja počelo je znatno kasnije nego s otoka. Zagora je prostor tradicionalnog načina života, dugi niz godina prometno izoliran od većih centara. Međutim, 1950-ih počinje naglo iseljavanje, izazvano prvenstveno privrednim i urbanim rastom susjednog priobalja Splita. Drugo područje čine srednjodal-matinski otoci, s kojih je iseljavanje počelo već krajem 19. stoljeća uzrokovano propašću vinogradarstva-glavne gospodarske grane otoka. Intenzitet ovih migracija u poslijeratnom razdoblju slabi prvenstveno zbog oslabljene biodinamike otoka uzrokovane dugotrajnom emigracijom. Treće područje čine naselja Splitske aglomeracije - Trogir, Kaštela, Solin i Omiš. Slijede ih obalna mjesta Dalmacije, Bosna i Hercegovina, te ostala mjesta u Hr-vatskoj i inozemstvu.
Imigracije početkom 1980-ih počinju slabiti zbog gospodarske krize i nemogućnosti zapošljavanja, ali i sve manje mladog stanovništva koje bi moglo iseliti iz emigracijskih područja. Dotadašnje intenzivno iseljavanje negativno se odrazilo na demografska obilježja otoka i Zagore, koji depopuliraju. Temeljno demografsko obilježje je starenje stanovništva, što rezultira nedostatkom potencijalnog migracijskog stanovništva.
Osnovni potisni čimbenici za odlazak iz nekadašnjeg mjesta stanovanja bili su većinom ekonomske prirode: nezaposlenost, slabo plaćen posao i sl., zatim obrazovne: nemogućnost vlastitog školovanja i školovanja djece, potom i stambeni razlozi. Kao jedan od privlačnih čimbenika Splita ispitanici ističu mogućnost dobivanja stana od poduzeća. Ostali privlačni čimbenici su uglavnom ekonomski ili obrazovni.
Danas Split gubi na privlačnosti. Primjerice, vrlo visoka stopa nezaposlenosti, nepo-stojanje nekadašnje društvene stanogradnje (nemogućnost rješavanja stambenog pitanja), ali i socijalni čimbenici – kriminal, problem droge i grad kao problematična sredina za odgoj djece.
Received (Primljeno): 2003 - 11 - 14Accepted (Prihvaćeno): 2004 - 6 - 14


