Embed Size (px)
Citation preview
SPOILAGE CHARACTERISTICS OF GROUND BEEF WITH
ADDED LACTIC ACID BACTERIA AT ABUSIVE AND
REFRIGERATED TEMPERATURES PACKAGED
IN MODIFIED ATMOSPHERE AND
TRADITIONAL PACKAGING
by
AMY RENEA HOYLE, B.S.
A THESIS
IN
FOOD TECHNOLOGY
Submitted to the Graduate Faculty of Texas Tech University in
Partial Fulfillment of the Requirements for
the Degree of
MASTER OF SCIENCE
Approved
Mindy Malynn Brashears Chairperson of the Committee
Leslie Dawn Thompson
J. Chance Brooks
Accepted
John Borrelli Dean of the Graduate School
May, 2005
ACKNOWLEDGEMENTS
I thank Dr. Mindy Brashears for allowing me the opportunity to pursue my
Master of Science degree under her advisement at Texas Tech University. In
addition, I thank Dr. Chance Brooks and Dr. Leslie Thompson for serving on my
committee. I appreciate the committee’s guidance and support over the course
of my studies.
I thank the early morning crew of Deidrea Harris, Wendy Palmore, Dale
Woerner, Jennifer Leheska, Brian King, Michael Jaks, and Ryan Swain for their
assistance with making and packaging patties. I also thank Alejandro Echeverry
and Loree Branham for their assistance in the microbiology lab until very late in
the evenings. I extend a very special thank you to Deidrea, Alejandro and Loree
for making the early mornings and late nights more enjoyable with their company
and their much appreciated help. A huge thank you to Wendy Palmore and Dale
Woerner for running TBA assays. I greatly appreciate everyone who served as
panelists for both the trained and consumer sensory panels.
On a personal note, I thank my parents, Greg and Sheryl Hoyle for
providing me with the opportunity to continue my education and for their patience
and support throughout my college career. In addition, I also appreciate Mrs.
DeAnn Campbell and Ms. Karen Dillsaver for sparking my interest in science and
for challenging me to learn more through difficult science fair projects.
ii
TABLE OF CONTENTS
ACKNOWLEDGEMENTS.............................................................................ii
LIST OF TABLES .........................................................................................vi
LIST OF FIGURES .......................................................................................x
ABSTRACT ..................................................................................................xi
CHAPTER
I. INTRODUCTION ....................................................................................1
II. LITERATURE REVIEW ..........................................................................5
Food-Borne Illnesses.........................................................................6
Escherichia coli O157:H7 Associated Illnesses ......................6
Salmonella spp. Associated Illnesses .....................................10
Spoilage of Ground Beef....................................................................11
Modified Atmosphere Packaging .......................................................15
MAP Packaging in Meat..........................................................18
Rosemary Extract as Antioxidant.......................................................19
Lactic Acid Bacteria ...........................................................................21
Weak Acid Production.............................................................24
Hydrogen Peroxide Production ...............................................25
Bacteriocins ............................................................................26
Reduction of Food-Borne Pathogens ......................................28
Approval of Ingredients in Meats .......................................................31
iii
Masking Normal Spoilage Indicators.......................................33
III. MATERIALS AND METHODS................................................................36
Patty Preparation ...............................................................................36
Traditional Packaging Replications .........................................37
Modified Atmosphere Packaging Replications ........................38
Sensory Analysis ...............................................................................39
Microbial Analysis ..............................................................................41
Thiobarbituric Acid Assay ..................................................................42
Statistical Analysis .............................................................................44
IV. RESULTS..............................................................................................47
Traditional Packaging Displayed at Refrigeration Temperature.........47
Microbial Populations ..............................................................47
Trained Color and Odor Panels...............................................49
Consumer Color and Odor Panels ..........................................51
Hunter L*a*b* values...............................................................52
Thiobarbituric Acid Assay........................................................53
Traditional Packaging Displayed at Abusive Temperature.................54
Microbial Populations ..............................................................54
Trained Color and Odor Panels...............................................56
Consumer Color and Odor Panels ..........................................58
Hunter L*a*b* values...............................................................59
Thiobarbituric Acid Assay........................................................60
iv
Modified Atmosphere Packaging Displayed at Refrigeration Temperature ............................................60
Microbial Populations ..............................................................60
Trained Color and Odor Panels...............................................62
Consumer Color and Odor Panels ..........................................64
Hunter L*a*b* values...............................................................65
Thiobarbituric Acid Assay........................................................65
Modified Atmosphere Packaging Displayed at Abusive Temperature ..................................66
Microbial Populations ..............................................................66
Trained Color and Odor Panels...............................................68
Consumer Color and Odor Panels ..........................................71
Hunter L*a*b* values...............................................................72
Thiobarbituric Acid Assay........................................................73
V. DISCUSSION .....................................................................................111
REFERENCES CITED .................................................................................115
APPENDICES
A. SENSORY EVALUATION FORMS ..............................................125
B. MALONALDEHYDE STANDARD CURVE ...................................130
C. P VALUE TABLES .......................................................................132
v
LIST OF TABLES
3.1 Organisms isolated, incubation temperature and time.......................46
4.1 Aerobic plate counts (log cfu/g) enumerated from ground beef patties in traditional packaging displayed at 0°C............75 4.2 Bacteria counts (log cfu/g) enumerated from ground beef patties in traditional packaging displayed at 0°C............76 4.3 Trained panelist scores for color and odor of ground beef patties traditionally packaged and displayed at 0°C...........................77 4.4 Percent frequency of characterization of off-odors from uninoculated ground beef patties traditionally packaged and displayed at 0°C...........................78 4.5 Percent frequency of characterization of off-odors from LAB-inoculated ground beef patties traditionally packaged and displayed at 0°C...........................79 4.6 Consumer panelist scores for color and odor of ground beef patties traditionally packaged and displayed at 0°C...................80 4.7 Hunter L*a*b* values of ground beef patties traditionally packaged and displayed at 0°C .........................................................81 4.8 Thiobarbituric acid (mg/kg) values for traditionally packaged ground beef patties displayed at 0°C .................................................82 4.9 Bacteria counts (log cfu/g) enumerated from ground beef patties in traditional packaging and displayed at 10°C...............83 4.10 Lactic acid bacteria counts (log cfu/g) enumerated from ground beef patties in traditional packaging displayed at 10°C..........84 4.11 Trained panelist scores for color and odor of ground beef patties traditionally packaged and displayed at 10°C.........................85 4.12 Percent frequency of characterization of off-odors from uninoculated ground beef patties traditionally packaged and displayed at 10°C.........................86
vi
4.13 Percent frequency of characterization of off-odors from LAB-inoculated ground beef patties traditionally packaged and displayed at 10°C.........................87 4.14 Consumer panelist scores for color and odor of ground beef patties traditionally packaged and displayed at 10°C.........................88 4.15 Hunter L*a*b* values of ground beef patties traditionally packaged and displayed at 10°C .......................................................89 4.16 Thiobarbituric acid (mg/kg) values for traditionally packaged ground beef patties displayed at 10°C ...............................................90 4.17 Bacteria counts (log cfu/g) enumerated from ground beef patties packaged in modified atmosphere and displayed at 0°C........91 4.18 Trained panelist scores for ground beef patties packaged in modified atmosphere and displayed at 0°C....................................92 4.19 Percent frequency of characterization of off-odors from uninoculated ground beef patties without resin packaged in modified atmosphere and displayed at 0°C ...................93 4.20 Percent frequency of characterization of off-odors from uninoculated ground beef patties with resin packaged in modified atmosphere and displayed at 0°C ...................94 4.21 Percent frequency of characterization of off-odors from LAB-inoculated ground beef patties without resin packaged in modified atmosphere and displayed at 0°C ...................95 4.22 Percent frequency of characterization of off-odors from LAB-inoculated ground beef patties with resin packaged in modified atmosphere and displayed at 0°C ...................96 4.23 Consumer panelists scores for ground beef patties pacakged in a modified atmosphere and displayed at 0°C ................97 4.24 Hunter L*a*b* values for ground beef patties packaged in modified atmosphere and displayed at 0°C .......................................98 4.25 Thiobarbituric acid (mg/kg) values for ground beef patties with or without lactic acid bacteria packaged in modified atmosphere and displayed at 0°C....................................99
vii
4.26 Bacteria (log cfu/g) enumerated from ground beef patties packaged in modified atmosphere and displayed at 10°C........................................................................100
4.27 Lactic acid bacteria counts (log cfu/g) for ground beef patties packaged in a modified atmosphere and displayed at 10°C ..............101 4.28 Trained panelists scores for ground beef patties packaged in modified atmosphere and displayed at 10°C .....................................102 4.29 Trained panelist responses for immediate off-odor present in ground beef patties packaged in modified atmosphere and displayed at 10°C........................................................................103 4.30 Percent frequency of characterization of off-odors from uninoculated ground beef patties without resin packaged in modified atmosphere and displayed at 10°C .................104 4.31 Percent frequency of characterization of off-odors from uninoculated ground beef patties with resin packaged in modified atmosphere and displayed at 10°C .................105 4.32 Percent frequency of characterization of off-odors from LAB-inoculated ground beef patties without resin packaged in modified atmosphere and displayed at 10°C .................106 4.33 Percent frequency of characterization of off-odors from LAB-inoculated ground beef patties with resin packaged in modified atmosphere and displayed at 10°C .................107 4.34 Consumer panelists scores for ground beef patties packaged in modified atmosphere and displayed at 10°C .................108 4.35 Hunter L*a*b* values for ground beef patties packaged in modified atmosphere and displayed at 10°C..................................109 4.36 Thiobarbituric acid (mg/kg) values for ground beef patties packaged in modified atmosphere and displayed at 10°C .................110 B.1 Concentration for malonaldehyde standard curve .............................131 C.1 P values for statistical analyses of data for traditionally
packaged ground beef displayed at 0°C ............................................133
viii
C.2 P values for statistical analyses of data for traditionally packaged ground beef displayed at 10°C ..........................................134
C.3 P values for statistical analyses of data for ground beef
packaged in modified atmosphere and displayed at 0°C ...................135 C.4 P values for statistical analyses of data for ground beef
packaged in modified atmosphere and displayed at 10°C .................136
ix
LIST OF FIGURES
A.1 Trained Panel Color Evaluation Form................................................126
A.2 Trained Panel Odor Evaluation Form.................................................127
A.3 Consumer Panel Color Evaluation Form............................................128
A.4 Consumer Panel Odor Evaluation Form ............................................129
x
ABSTRACT
Lactic acid bacteria (LAB) can reduce Escherichia coli O157:H7 and
Salmonella spp. in ground beef during storage. Two packaging studies
evaluated if LAB masked changes typically associated with the spoilage of
ground beef displayed under refrigerated (0°C) or abusive (10°C) temperatures.
Packaging consisted of traditional (foam trays wrapped with permeable film) and
MAP packaging (80% O2 and 20% CO2). To mimic industry practice, one-half of
MAP samples contained 1000 ppm added rosemary oleoresin. Microbial and
sensory analyses were conducted to determine spoilage endpoints. At 0°C,
traditionally packaged LAB samples had significantly lower yeast and mold (YM)
counts than controls throughout display. Among traditional packages, there were
no significant differences in coliform, Brochothrix thermosphacta, and
Pseudomonas spp. counts between LAB treatments. At abusive display
temperatures, there were no significant differences in coliform, YM, B.
thermosphacta, and Pseudomonas spp. counts between traditionally packaged
LAB treatments. At 0°C and 10°C, total plate counts and LAB populations in both
traditional and MAP packaged LAB inoculated samples were significantly higher
than the control. In MAP packaging, no significant differences existed between
LAB treatments for YM, coliform, B. thermosphacta, and Pseudomonas spp. No
significant differences in trained or consumer sensory color and odor scores
existed between LAB and controls for traditional and MAP packaging indicating
xi
spoilage was not masked. Therefore, LAB can be added to ground beef as an
antimicrobial agent in traditional and MAP packaing. In addition, LAB may slow
lipid oxidation in traditionally packaged ground beef.
xii
CHAPTER I
INTRODUCTION
The Center for Disease Control (CDC) estimates that there are 76 million
cases of food-borne illnesses each year. In addition, approximately 325,000
hospitalizations and 5,000 deaths also occur in the United States as a result of
infected food (Mead et al., 1999). The resulting cost to the industry was
estimated at $6.9 billion in 2002 by the USDA Economic Research Service
(2000). Consumer concerns about food safety have increased over the past
several years, largely due to large outbreaks associated with a variety of food
products. In 1993, undercooked hamburgers from Jack-in-the-Box restaurants
were implicated in an Escherichia coli O157:H7 outbreak that caused over 700
illnesses and 4 deaths (CDC, 1993). Raw ground beef was also implicated in an
outbreak of Salmonella that resulted in 107 confirmed and 51 probable cases of
food-borne illnesses (CDC, 1995).
While pathogens are of large concern to consumers, other factors
including cost and quality are important as well. Spoilage characteristics that are
typically associated with quality of meats include color, odor, and texture. These
characteristics can be affected by many different factors including storage
conditions such as temperature, length of storage, and exposure to light. The
storage conditions also affect the growth of microorganisms typically found on
meat such as Pseudomonas, Lactobacillus, Alteromonas, Acinetobacter,
1
Aeromonas, Moraxella, Enterobacter, Microbacterium, and Brochothrix
thermosphacta (Gill, 1986; Lambert et al., 1991; Gill and Newton, 1977). The
growth of these bacteria affects the quality factors such as color and odor that
consumers use to determine if meat is spoiled.
Ground beef is a processed meat product. Once the animal has been
slaughtered, the meat is fabricated into wholesale or retail cuts. Trim and other
cuts of meat are then further processed and ground. This increases the surface
area of the meat which allows the increased adherence and growth of the
bacteria. The color of ground beef is affected not only by microbial growth, but
also by chemical reactions such as lipid oxidation. Lipid oxidation is one of the
major causes of food spoilage and results in off-flavors and odors including those
characterized as rancid (Nawar, 1996). Oxidative rancidity of meat occurs due to
the degradative reactions of fats in the raw product (Sanchez-Escalante et al.,
2001) and results in a loss of quality, texture, and nutritional value of the meat.
By adding synthetic antioxidants such as butylated hydroxyanisole (BHA) or
butylated hydroxytoluene (BHT), meat processors can reduce lipid oxidation.
However, in recent years, there has been an increased concern regarding the
safety and healthfulness of such synthetic compounds so the focus has shifted to
adding natural antioxidants such as rosemary or sage. Rosemary oleoresin has
been found to have comparable antioxidant properties to that of a BHT/BHA/citric
acid mix (Barbut et al., 1985). In addition, researchers have found rosemary to
have an antimicrobial effect against some bacteria such as psychrotrophs, and
2
Staphylococcus aureus (Del Campo et al., 2000; Elgayyar et al., 2001; Sanchez-
Escalante et al., 2001; Sanchez-Escalante et al., 2003; Djenane et al., 2003).
LAB are generally recognized as safe and have been shown to reduce
pathogens in ground beef (Brashears et al., 2005). In addition, LAB are used in
different food products such as yogurt, sausages, other fermented foods, dairy
products, and milk (Stiles, 1996). They can create a competitive environment
through several different mechanisms including production of hydrogen peroxide,
bacteriocins, and weak acids such as acetic and lactic acid. The antagonistic
action of the LAB takes place when they compete with other bacteria for a
common niche; when an extracellular agent is produced; or the environment is
modified to inhibit the growth of the other microorganism (Aguirre and Collins,
1993).
Modified atmosphere packaging (MAP) is commonly used in industry to
promote an acceptable product. MAP typically alters the package environment
using oxygen and carbon dioxide, which can be conducive to the growth of
aerobic microorganisms (O’Connor-Shaw and Reyes, 2000; Farber, 1991). In
addition, antioxidants are sometimes added to the product being packaged. As
society becomes more health conscious, the focus has shifted to natural
antioxidants which include rosemary, sage, and other herbs and spices (Elgayyar
et al., 2001; Stoick et al., 1991; Sanchez-Escalante et al., 2003). These natural
ingredients have also been shown to have an effect on the microbial population
of the ground beef packaged.
3
Because E. coli O157:H7 is considered an adulterant in raw ground beef,
the reduction of the pathogen is an important concern in the beef industry.
Presently, there are few effective interventions for ground beef that processors
can implement. Previous research conducted at Texas Tech University has
shown that LAB reduced food-borne pathogens such as E. coli O157:H7 and
Salmonella spp. (Smith et al., 2005). In addition, this research also found LAB to
have no significant effect on sensory properties when cooked patties were
evaluated by trained or consumer panelists. However, for LAB to be approved
for use in ground beef products by the Food and Drug Administration (FDA) and
subsequently by the FSIS/USDA, a study needs to be conducted to determine if
the addition of LAB would in any way result in the product becoming adulterated
or misbranded which includes making the ground beef look better or of greater
value than untreated products and the normal spoilage indicators are not masked
(FSIS, 2003).
Therefore, the scope of this project was to examine the effect of LAB on
the normal microflora present in ground beef as well as sensory factors such as
color stability, odor, and oxidative rancidity susceptibility when the ground beef
was packaged in traditional retail packaging or modified atmosphere packaging
under refrigerated and abusive display temperatures.
4
CHAPTER II
LITERATURE REVIEW
Beef is America’s number one selling protein, and ground beef makes up
50% of all retail beef purchased (NCBA, 2002). The American Meat Institute
(AMI, 2003) reported that in 2001, per capita beef consumption was 30.0
kilograms, while 12.56 kilograms of that was hamburger. Ground beef is a
popular food item that is used in a variety of dishes. National Cattlemen’s Beef
Association (NCBA) states that in 2002, the average household purchased
ground beef on an average of 1.8 times a month. That same year, consumers
paid on average, $1.71 per pound for ground beef (AMI, 2003). Hamburgers are
the second most popular beef dish and account for 72% of beef served in
restaurants in 2001. Because ground beef is such a popular meat product, it is
important to consumers that the product they purchase is safe.
Ground beef is handled extensively throughout the production process
and the potential for contamination of the meat is high. Kang and others (2001)
lists a variety of reasons for this: raw material used, number of steps required for
production, and increase of surface area due to reduction in particle size. In
addition, while antimicrobial treatments applied to the carcass are effective in
reducing the number of microorganisms including pathogens, recontamination
can occur due to contact with equipment and employees at other steps in the
process (Kang et al., 2001; Kang et al., 2002; Dormedy et al., 2000). The meat
5
surface is the most common initial point of contamination so the internal meat
product is essentially free of microorganisms (Dickson, 1992). However, when
the trim and meat product is ground, contamination of the rest of the meat is
highly likely because the internal meat is exposed to the surface contaminants.
Currently, there are few interventions available for use by ground beef producers
because the methods are less effective at cold temperatures; cause sensory
changes in the product (Smith et al., 2005); or are not approved for use in ground
beef or trim by regulatory agencies.
Food-Borne Illnesses
The CDC estimates that each year food-borne diseases are responsible
for approximately 76 million illnesses, 325,000 hospitalizations, and 5,000 deaths
in the United States (Mead et al., 1999). In addition, approximately 73,000 E. coli
O157:H7 related cases and 61 deaths occur every year, while over 1.4 million
cases of illness and 580 deaths are caused by Salmonella spp. (Mead et al.,
1999). Salmonella spp. was the number three cause of food-borne illness and
the number one cause of food-borne deaths in 1999, while E. coli O157:H7 was
the fifth most common cause of food-borne deaths.
Escherichia coli O157:H7 Associated Illnesses
Escherichia coli O157:H7 has been implicated in several foodborne
outbreaks including outbreaks associated with ground beef, apple cider, and raw
6
milk (Meng et al., 1994). Escherichia coli O157:H7 was first recognized as an
emerging pathogen when two separate outbreaks occurred in 1982 (Riley et al.,
1983; Griffin and Tauxe, 1991), whereas the most notable outbreak occurred in
1993 where over 700 confirmed infections and four deaths were contributed to
the consumption of undercooked ground beef (Wachsmuth et al., 1997).
Persons affected by E. coli O157:H7 experience a variety of symptoms
including hemorrhagic colitis (HC), hemolytic uremic syndrome (HUS), and
thrombotic thrombocytopenic purpura (TTP). Hemorrhagic colitis can be
characterized by bloody diarrhea, severe abdominal cramping, and little or no
fever (Griffin and Tauxe, 1991; CDC, 1993; Buchanan and Doyle, 1997). In
addition, Riley and others (1983) stated patients had evidence of colonic mucosal
edema, erosin, and hemorrhaging. Initial symptoms of HC usually occur 24-48
hours after consumption of contaminated foods and start with non-bloody
diarrhea. Symptoms continue to increase in severity over the following 24-48
hours and continue for several days (Buchanan and Doyle, 1997).
Escherichia coli O157:H7 is a major cause of HUS, which is a leading
cause of acute renal failure in children (Doyle, 1991). Two to seven percent of
patients infected with E. coli O157:H7 will develop HUS related complications.
HUS is characterized by microangiopathic hemolytic anemia (intravascular
destruction of red blood cells), thrombocytopenia (depressed platelet counts),
renal failure, lack of urine formation, swelling (edema), and central nervous
system manifestations (Boyce et al., 1995; Buchanan and Doyle, 1997). Onset
7
of HUS usually occurs approximately one week after the appearance of
gastrointestinal symptoms and additional symptoms may include seizures, coma,
stroke, colonic perforation, pancreatitis and hypertension. Generally, young
children and the elderly are more prone to contracting HUS and those affected
may require dialysis and blood transfusions (Doyle, 1991; Buchanan and Doyle,
1997). TTP is similar to HUS, but central nervous system damage including
seizures, strokes, and development of blood clots in the brain is more significant
and less renal failure is observed. TTP typically affects adults while HUS
patients are mainly children under the age of 10.
In 1982, an unusual gastrointestinal illness was associated with outbreaks
in Oregon and Michigan. At least 47 people were affected, but no deaths or
complications occurred in any of the cases (Riley et al., 1983). In Oregon, 19
(73%) of 25 people and in Michigan, 14 (67%) of 21 people were hospitalized.
The age of all cases ranged from 4 to 76 years of age and the illness lasted from
2 to 9 days for those affected (Riley et al., 1983). Patients were surveyed and
the outbreak was associated with eating sandwiches containing common
ingredients (beef patty, rehydrated onions, and pickles) from the same restaurant
chain. Riley and others (1983) hypothesized that the ground beef patties were
contaminated with E. coli O157:H7 before leaving the plant and the pathogen
survived the cooking process at the restaurants. The original source of
contamination is unknown.
8
Between December 1992 and February 1993, a multistate outbreak of E.
coli O157:H7 associated with contaminated ground beef consumed from the
same restaurant chain occurred. More than 700 cases were confirmed in
Washington, Idaho, California, and Nevada and four deaths occurred (CDC,
1993). Affected patients ranged in age from 4 months to 88 years and 56
patients developed HUS. Bell and others (1994) imitated restaurant cooking
processes and found that 10 (63%) of the 16 patties cooked had an internal
temperature less than 60°C which was the recommended temperature at the
time under the Food and Drug Administration (FDA) model food service code.
On January 18th, the health department in Washington announced publicly that
the chain’s hamburgers were the vehicle of transmission and the restaurant
voluntarily initiated a recall of all hamburger meat from its restaurants in
Washington. Due to the recall, approximately 90% (around 255,000 patties) of
the hamburgers were recovered in Washington. Those patties accounted for
43% of all patties produced on November 19, 1992 and 62% of that day’s
production that had been sent to Washington (Bell et al., 1994). All contaminated
patties were produced by one processor in California, which received beef from
five U.S. slaughter plants and one in Canada. The patty processing plant mixed
and ground the beef from multiple sources then shipped a large amount of frozen
patties to the restaurant chain’s central warehouse, which further distributed the
patties to individual restaurants (Wachsmuth et al., 1997; McClure, 2000; Bell et
al., 1994). Because Washington state had recognized E. coli O157:H7 as a
9
notifiable disease, approximately 800 cases were potentially prevented when the
meat was recalled.
Salmonella spp. Associated Illnesses
According to the CDC (2004), approximately 1.4 million cases of
salmonellosis occur each year with approximately 500 of those resulting in death.
Salmonellosis is caused by bacteria belonging to the Salmonella genus and is
typically transmitted through contaminated food, water, or contact with infected
animals. Typical symptoms such as fever, abdominal cramps, diarrhea, and
sometimes progression to sepsis begin to appear approximately 12 to 72 hours
after consumption of contaminated food. Affected patients usually do not require
treatment and the illness usually lasts 4 to 7 days (CDC, 2004). Young children,
the elderly, and those with compromised immune systems are more likely to
develop complications. While eggs are commonly associated with Salmonella
outbreaks, ground beef is also a vehicle of transmission. However, the USDA
Pathogen Reduction/Hazard Analysis and Critical Control Points (PR/HACCP)
inspection system for meat and poultry plants has reduced Salmonella
prevalence in raw ground beef from 7.5% in 1998 to 2.8% in 2001 (CDC, 2002).
In 1999, an outbreak of Salmonella Typhimurium occurred in Dodge
County, Wisconsin, where 107 confirmed and 51 probable cases were identified,
and 17 (16%) of these were hospitalized (CDC, 1995). The age range of those
infected was 2 to 90 years of age and symptoms included diarrhea (98%),
10
abdominal cramps (88%), chills (77%), body aches (71%), fever (65%), nausea
(60%), and bloody stools (43%). When investigating the outbreak, 40 case-
patients were randomly selected from the 107 confirmed cases. After
questioning the case-patients, it was determined that 35 (88%) had eaten raw
ground beef during December 22 to January 4 and 34 (97%) of the 35 had
purchased the ground beef from the same butcher shop. While consumption of
raw ground beef was implicated, improper cleaning and sanitization of the meat
grinder contributed in the ongoing contamination of the ground beef.
More recently, between January and April of 2002, a multistate outbreak
of Salmonella Newport occurred (CDC, 2002). Forty-five total cases were
identified from five states: New York, Michigan, Pennsylvania, Ohio, and
Connecticut with persons from 2 to 81 years of age affected. Symptoms
experienced include diarrhea (100%), abdominal pain (91%), fever (78%), blood-
tinged stools (52%), vomiting (48%), and 17 people (37%) were hospitalized.
One death occurred due to the development of sepsis in a patient with leukemia.
When questioned, 22 (67%) of the patients had consumed ground beef 3 days
prior to onset of symptoms. Ground beef was listed as the probable transmission
vehicle, although the specific source of the ground beef was not determined.
Spoilage of Ground Beef
Many factors including storage temperature, atmospheric oxygen, light,
meat constituents, microorganisms, and endogenous enzymes are important in
11
maintaining a quality meat product over an extended period of time (Lambert et
al., 1991). Spoilage is a subjective measurement and includes changes in color,
texture, odor, taste, and microbial counts. Gill (1986) defined meat spoilage as
“any single symptom or group of symptoms of overt microbial activity, manifested
by changes in meat odor, flavor, or appearance.” In addition, several scientists
have recognized that microbial growth is the most important factor in controlling
the spoilage of meat (Lambert et al., 1991; Nassos et al., 1983; Jay 1996) and
bacterial numbers of 107 and 108 per cm2 cause noticeable changes in off-odor
and slime, respectively (Ayers, 1960). Meat spoilage is typically a surface
phenomenon. Because ground meat is comminuted and the tissue integrity is
disrupted, bacteria can be spread throughout the ground beef (Gill, 1986).
Microorganisms are typically found on beef carcasses and the microbial
load of the meat is directly related to good manufacturing practices, hide
removal, evisceration, and subsequent processing into final retail product
(Nottingham, 1982). In the case of ground beef, the production process includes
more extensive handling at the processing plant. It is important to remember that
the initial microbial population of the meat is directly related to the ending
spoilage bacteria population. The fastest growing bacteria under storage
conditions will be the predominating spoilage microorganism and relative growth
rates of the microorganisms is dependent upon storage conditions (Lambert et
al., 1991). Predominant spoilage organisms of ground beef must be able to grow
at temperatures less than 5°C due to refrigeration practices in developed
12
countries (Gill, 1986). A variety of substances produced by bacteria growing on
ground beef have been defined as contributors to odor changes throughout
storage. These substances include H2S and organic sulfides, other volatile
organic compounds like amines, esters, and acetoin (Gill, 1986), and lactic acid
production also contributes to spoilage-related odors such as “acid/sour” (Nassos
et al., 1985).
Most spoilage bacteria found in meat are gram-negative and include
aerobic and facultative anaerobic psychrotrophic strains, although some gram-
positive bacteria can also be found in high numbers. Spoilage organisms
typically found in meat consists of several species including Pseudomonas,
Lactobacillus, Brochothrix, Alteromonas, Acinetobacter, Aeromonas, Moraxella,
Enterobacter, and Microbacterium (Gill, 1986; Lambert et al., 1991; Gill and
Newton, 1977). Only those organisms isolated in the present study will be further
discussed.
Pseudomonads are one of the most common saprophytic organisms
found in meat. They can grow at a very fast rate and therefore can outcompete
other microorganisms present to dominate the aerobic spoilage flora (Gill and
Newton, 1977). These gram-negative, strict aerobes use glucose as their
primary substrate. Once the glucose present in the meat system has been totally
consumed by the bacteria, amino acids are utilized and malodorous compounds
such as sulfides, esters, acids, and others are formed as by-products (Miller et
al., 1973a,b; Thomas and McMeekin, 1981; Pittard et al., 1982). This group of
13
bacteria is also responsible for slime production on meat stored at temperatures
as low as 10ºC (Ayers, 1960). Pierson and others (1970) found a rapid increase
in the population of fluorescent pseudomonads throughout a 15-day storage
period.
Brochothrix thermosphacta is a gram-positive facultative anaerobe that is
of great importance in the spoilage of meat stored under vacuum package
conditions (Gill, 1986). This bacterium uses glucose as the substantial
component from meat for growth (Grau, 1979). As spoilage occurs, a sickly
sweet off-odor is formed. Dainty and Hibbard (1980) attributed the off-odor to the
production of odiferous compounds produced as a result of glucose metabolism.
Because the bacteria are facultative, acetic acid and acetoin are the major by-
products of aerobic glucose metabolism, while anaerobic metabolism’s major
product is lactic acid (Gill, 1986). Gill (1986) recognized that B. thermosphacta
should have a low spoilage potential under strictly anaerobic conditions because
the spoilage potential lies in the ability of the bacteria to produce odiferous
compounds. These compounds are produced by B. thermosphacta only during
aerobic metabolism. In a study conducted in 1977, Gill and Newton attributed a
long lag phase, nutrient competition, and inhibition similar to that observed at chill
temperatures to the inability to detect B. thermosphacta in natural anaerobic flora
at 20°C.
Lactobacillus species make-up a small portion of the initial microflora
present in meat. However, the bacteria become dominant throughout storage
14
that includes a reduced O2 tension environment (Lambert et al., 1991). Lactic
acid bacteria are anaerobic, aerotolerant organisms that use glucose and
arginine as substrates for growth. Off-odors associated with spoilage caused by
lactic acid bacteria have been classified as “dairy” or “cheesy” (Dainty, 1981).
Newton and Gill (1978) concluded that LAB can reach a cell density high enough
to inhibit the metabolism of competing species such as B. thermosphacta and
Enterobacter. Mechanisms and modes of inhibition will be discussed in greater
detail later in this review. In addition, by creating an environment that is
conducive to a Lactobacillus dominated microflora, shelf life of chilled ground
beef can be extended.
Enterobacteriaceae is a large group of facultative anaerobic organisms.
Generally, the bacteria are found in intestinal tracts of humans and animals.
Enterobacteriaceae utilize glucose and glucose-6-phosphate as substrates and
some strains produce sulfides and malodorous amines as by-products (Gill,
1986; Lambert et al., 1991). This group of organisms has a high spoilage
potential when conditions favor their growth.
Modified Atmosphere Packaging
Modified atmosphere packaging (MAP) is defined as packaging that
encloses a food in an atmosphere with a different composition than that of air,
which consists of approximately 0.03% CO2, 0.93% argon, 20.95% O2, and
78.09% N2 (O’Connor-Shaw and Reyes, 2000). MAP can include packaging
15
methods such as vacuum packaging, passive MAP, gas-flush MAP, and MAP by
active packaging. It is used for a variety of food products including fruits and
vegetables, as well as meat. In the case of vegetables, MAP is used to slow
degradation processes such as respiration; however, in meat, the packaging is
used to inhibit microbial growth (O’Connor-Shaw and Reyes, 2000).
Three gases are mainly used in MAP packaging: carbon dioxide, oxygen,
and nitrogen. Carbon dioxide is very important because it has both bacteriostatic
and fungistatic properties (Sivertsvik et al., 2002). CO2 is also water- and lipid-
soluble and can dissolve into food products (O’Connor-Shaw and Reyes, 2000).
However, the inhibitory effects of the gas on microorganisms is dependent on
other factors including temperature, acidity, growth medium used, partial
pressure of CO2, concentration of the gas, and the volume of headspace gas
(Farber, 1991). Scientists have identified four different mechanisms by which
CO2 inactivates microorganisms: (1) alteration of cell membrane function
including effects on nutrient uptake and absorption; (2) direct inhibition of
enzymes or decrease in the rate of enzyme reactions; (3) penetration of bacterial
membranes, leading to intracellular pH changes; and (4) direct changes in the
physico-chemical properties of proteins (Farber, 1991; Dixon and Kell, 1989;
Daniels et al., 1985; Parkin and Brown, 1982). Nitrogen is an inert gas and
typically used as a filler gas. In addition, displacement of O2 by N2 has been
shown to delay oxidative rancidity and inhibit the growth of aerobic
microorganisms (Farber, 1991). Oxygen is also used in selected product MAP
16
packaging to prevent anaerobic respiration, but there is a wide range of
sensitivity of anaerobic bacteria to the gas (Farber, 1991; Sivertsvik et al., 2002).
The use of O2 in some MAP packed products is a concern due to the increase
potential for aerobic microbial growth and oxidative rancidity.
The concept of modified atmosphere packaging has been around for
many decades. Pasteur and Joubert found that CO2 could kill Bacillus anthracis
in 1877 (Valley, 1928). In the 1930s, beef carcass shelf life was doubled by
transporting the meat in atmospheres containing CO2 (Sivertsvik et al., 2002.).
However, in the past few decades, MAP has become more widely used in the
storage and distribution of foods. MAP has several advantages. It can increase
shelf life by 50 to 400%, reducing distribution costs due to centralized packaging,
fewer deliveries, and longer shipping distances (O’Connor-Shaw and Reyes,
2000; Farber, 1991; Sivertsvik et al., 2002). Other advantages include a higher
quality product; extended shelf life without the addition of preservatives for a
“natural” product, improved presentation, and odorless and convenient packages.
While there are many advantages to MAP packaging, there are also
disadvantages such as different products requiring different atmospheres. The
recommended environment for fruits and vegetables is typically 0-10% CO2 and
1-5% O2, while the recommended environment for soft bakery products such as
cakes and muffins is 0-100% CO2 and 20-100% N2 (O’Connor-Shaw and Reyes,
2000). Other disadvantages include added costs; the need for specialized
17
equipment and related training costs; necessary temperature regulation; and loss
of benefits once the package is opened (Farber, 1991; Sivertsvik et al., 2002).
MAP Packaging in Meat
One major advantage of MAP packaging is the increase in shelf life of
meat products. Myoglobin is a protein made of a complex of globin and heme
which is responsible for meat color. Meat tissue contains deoxymyoglobin, which
is purple-red in color. Once the deoxymyoglobin is exposed to oxygen, it is
converted in to oxymyglobin and the color of the meat becomes cherry red. As
oxidation occurs over time, oxymyoglobin is converted into metmyoglobin.
Metmyoglobin causes the brown color in meat that is unacceptable to
consumers. By exposing meat to a high oxygen environment through MAP
packaging, the cherry red color lasts longer and shelf life is increased.
O’Connor-Shaw and Reyes (2000) recognized four different MAP package
concepts for meat products depending on the target market and its shelf-life
requirements: (1) vacuum packaging, (2) vacuum skin-packaging, (3) high-O2
packaging, and (4) high-CO2 packaging. High-O2 packaging is commonly used
because the atmosphere is conducive to oxymyoglobin formation which makes
the product more appealing to the consumer. When high-O2 packaging is used,
CO2 is also present in the environment at a level 20% (Farber, 1991; Jayasingh
et al., 2002). The CO2 inhibits aerobic bacteria such as Pseudomonas,
Moraxella, and Acinetobacter species. At the same time, Lactobacillus spp. and
18
B. thermosphacta can grow in anaerobic environments. Lactic acid bacteria
become the dominant microorganism in meat under high-O2 MAP environments
(Newton and Gill, 1978; Pierson et al., 1970).
The safety of using MAP for packaging meat products has been
questioned. The relationship between spoilage and pathogenicity is a large
concern and has been documented by several authors (Hintlian and Hotchkiss,
1986; Sivertsvik et al., 2002; Farber, 1991; O’Connor-Reyes and Shaw, 2000).
MAP atmospheres may inhibit organisms that typically are indicators of spoilage
to consumers; however, growth of pathogens may be promoted. Certain controls
need to be in place to help ensure the safety of the meat product packaged in
MAP environments. The storage temperature of the product needs to be
controlled since the environment is conducive to aerobic microbial growth if the
temperature reaches the organism’s optimum growth temperature. Also, the
product should be handled with care and cross-contamination needs to be
prevented (Sivertsvik et al., 2002).
Rosemary Extract as Antioxidant
Lipid oxidation is one of the major causes of food spoilage and results in
off-flavors and odors including those characterized as rancid (Nawar, 1996). In
addition, oxidation also results in a loss of quality, texture, and nutritional value of
the meat. Oxidative rancidity of meat occurs due to the degradative reactions of
fats in the raw product (Sanchez-Escalante et al., 2001). Roozen (1987)
19
identified this mechanism as the peroxidation of unsaturated fatty acids and color
deterioration is influenced by factors such as high temperatures, lighting,
bacterial growth, and O2 tension. Metmyoglobin is formed and meat becomes
brown when oxymyoglobin is oxidized. In the case of ground beef, the whole
meat is ground increasing surface area exposed to air and contamination
(Sanchez-Escalante et al., 2001). This leads to quicker conversion of
oxymyoglobin to metmyoglobin. Ho and others (1995) stated that heme
pigments are strong oxidizing catalysts when brought into contact with lipids in
meat.
Antioxidants have been found to slow and inhibit lipid oxidation. Butylated
hydroxytoluene (BHT) and butylated hydroxyanisole (BHA) are synthetic
antioxidants that have been used in processing. However, BHA has been shown
to cause lesion formations in rats while BHT may cause internal and external
haemorrhaging at high doses (McCarthy et al., 2001). BHT/BHA have been
shown to convert certain ingested materials into toxic substances and
carcinogens (Farag et al., 1989). Due to these recent concerns related to health
risks, the focus has shifted to the use of natural antioxidants. Examples of
natural antioxidants include chemicals found in plants such as sage, rosemary,
borage, oregano, parsley, and others (Elgayyar et al., 2001; Stoick et al., 1991;
Sanchez-Escalante et al., 2003).
McCarthy and others (2001) noted that antioxidant properties of spices
such as rosemary and sage are related to their phenolic contents. Rosemary
20
oleoresin is composed of several compounds such as rosmanol, carnosol,
rosmaridiphenol, and rosmariquinone (Houlihan and Ho, 1985). When compared
to a commercial BHA/BHT/citric acid mix, rosemary oleoresin was found to have
comparable antioxidant properties (Barbut et al., 1985). In addition, the authors
also determined that volatile aroma compounds were present in turkey sausage
without antioxidants while those same compounds were not present in the patties
with antioxidants added. Sanchez-Escalante and others (2001) saw a significant
inhibition of TBARS formation when rosemary was added to ground beef patties
compared to the patties without rosemary.
Del Campo and others (2000) noted that gram-positive bacteria were
more sensitive to the rosemary extract than gram-negative. In addition, they also
found that the inhibitory effect was enhanced at low temperatures although the
bactericidal effect disappeared. Other researchers have found that sage, cumin,
and rosemary oils had little or no effect against gram-negative bacteria (Farag et
al., 1989). Several authors indicate that rosemary oil and extract can moderately
or strongly inhibit a wide range of organisms including psychrotrophs, S. aureus,
and Pseudomonas aeruginosa (Elgayyar et al., 2001; Sanchez-Escalante et al.,
2001; Sanchez-Escalante et al., 2003; Djenane et al., 2003).
Lactic Acid Bacteria
Elie Metchnikoff first popularized the probiotic concept at the turn of the
20th century by proposing that normal, healthy gastrointestinal microflora in
21
humans and animals could provide resistance against “putrefactive” intestinal
pathogens (Klaenhammer, 2001). He isolated a Lactobacillus culture from
fermented milk after recognizing that Bulgarians were living long healthy lives.
Numerous health benefits associated with LAB have been studied as well as the
concept of microbial antagonism of the LAB toward food-borne pathogens. LAB
have GRAS (generally recognized as safe) status (Brashears et al., 2005).
LAB are generally defined as a group of gram-positive rods or cocci that
are usually non-motile. In addition, LAB are non-spore formers which ferment
carbohydrates into lactic acid as the major end-product. They are catalase-
negative, microaerophilic, acid tolerant, and cytochrome free (Brashears et al.,
2005; Aguirre and Collins, 1993; Axelsson, 1998; Somkuti, 2000). LAB can be
differentiated by two main sugar fermentation pathways. If metabolism proceeds
through glycolysis (Embden-Meyerhof pathway) and the end product is almost
exclusively lactic acid, then the bacteria is said to be homofermenative.
However, if metabolism proceeds through the 6-
phosphogluconate/phosphoketolate pathway and the end products include
significant amounts of carbon dioxide, acetate, ethanol, and lactic acid, then the
bacteria is said to be heterofermentative (Axelsson, 1998; Somkuti, 2000). LAB
are generally associated with nutrient rich habitats because they have complex
nutritional requirements such as carbohydrates, amino acids, peptides, nucleic
acid derivatives, fatty acids, salts, and vitamins for their growth (Hardie et al.,
1986).
22
Because of their ability to grow under a wide variety of environmental
conditions, they are found in milk, dairy products, fermented foods such as
sausages and yogurt, rotting vegetable material, silage, and mucosal surfaces of
man and animals. The LAB play an important role in food fermentations causing
the characteristic flavor changes and exercising a preservative effect on the
fermented product (Stiles, 1996). Industrial-scale production of fermented dairy
foods represents to most refined and best-controlled uses of LAB in modern food
production (Somkuti, 2000). Holzapfel and others (1995) estimated that 25% of
the European diet and 60% of the diet in many developing countries consists of
fermented foods.
In addition, researchers have examined the use of LAB as
biopreservatives in foods because they are suitable as antagonistic
microorganisms and are capable of inhibiting other foodborne bacteria by a
variety of means (Aguirre and Collins, 1993). The bacteria can create an
antagonistic environment through production of organic acids, hydrogen
peroxide, and/or bacteriocins. Microbial antagonism has been recognized for
several decades and refers to the inhibition of undesired or pathogenic
microorganisms, caused by competition for nutrients; the production of
antimicrobial metabolites (Gombas, 1989; Holzapfel et al., 1995; Hugas, 1998;
Hurst, 1973; Jay, 1996; Stiles, 1996); or other mechanisms depending on varying
conditions where the LAB are used. Antagonism between two different species
or genera of microorganisms takes place when they compete for a common
23
niche, or one of the microorganisms may produce an antagonistic extracellular
agent or modify the environment such that the other is inhibited (Hugas, 1998;
Lindgren and Dobrogosz, 1990; Vandenbergh, 1993).
Weak Acid Production
Traditionally, LAB inhibition of food-borne pathogens has been associated
with the reduction of pH through carbohydrate fermentation into organic acids
such as acetic or lactic acid. Lactic acid is the characteristic fermentation
product of LAB and can reduce pH to a level where putrefactive, pathogenic, and
toxinogenic bacteria will be either inhibited or destroyed (Holzapfel et al., 1995).
However, while lactic acid is commonly associated with inhibition by LAB, acetic
acid is a stronger inhibitor due to its higher dissociation constant (pKa = 4.75;
lactic acid pKa = 3.08) at a given molar concentration and pH (Brashears et al.,
2005; Eklund, 1983; Holzapfel et al., 1995; Ouwehand, 1998). Acetic acid has a
wide range of inhibitory activity including yeasts, molds, and bacteria (Blom and
Mortvedt, 1991).
Weak organic acids are known to have strong antimicrobial activity
because the acids can exist in a pH-dependent equilibrium between the
undissociated and dissociated state (Eklund, 1983). The dissociated acids have
been observed to inhibit microbial growth although it had been previously
assumed that the undissociated molecule was the toxic form of a weak acid. In a
study conducted in 1983, Eklund found that dissociated sorbic acid had an
24
antimicrobial effect against E. coli, Staphylococcus aureus, and Bacillus cereus.
The effect was at least one order in magnitude less than that for undissociated
acid, but became appreciable with increasing pH.
Hydrogen Peroxide Production
Because LAB lack heme, they can not utilize the cytochrome system for
terminal oxidation to protect themselves against oxygen toxicity. Therefore, lactic
acid bacteria produce hydrogen peroxide in the presence of oxygen through the
action of flavoprotein-containing oxidases, NADH oxidases, and superoxide
dismutase (Ouwehand, 1998). Hydrogen peroxide accumulates because
systems breaking down the substance are less active than the systems
producing it. Other microorganisms are then inhibited or killed by the hydrogen
peroxide formed by the LAB (Brashears et al., 2005). Juven and Pierson (1996)
noted that cytotoxicity related to hydrogen peroxide was due to its ability as an
intermediate in oxygen reduction to make more reactive and cytotoxic oxygen
species like the hydroxyl radical (HO·). The hydroxyl radical is a strong oxidant
and can initiate oxidation which can cause damage to nucleic acids, proteins,
and lipids. In addition, others (Dahiya and Speck, 1968; Condon, 1987;
Whittenbury, 1964) have also stated that hydrogen peroxide has a strong
oxidizing effect on the cell and is an effective antimicrobial.
Pathogenic bacteria such as E. coli O157:H7, Salmonella spp., and
Staphylococcus aureus can be inhibited by the production of hydrogen peroxide
25
by lactic acid bacteria. In 1968, Dahiya and Speck found that lactobacilli, which
were isolated from yogurt, were able to produce hydrogen peroxide even at low
pH and refrigeration temperatures, and the hydrogen peroxide accumulation
inhibited the growth of S. aureus. The authors also determined that hydrogen
peroxide formation was dependent upon temperature and the pH of the food
product. Escherichia coli O157:H7 growth was reduced by adding LAB to raw
chicken meat (Brashears et al., 1998). In addition, inhibition of both E. coli
O157:H7 and Salmonella spp. due to hydrogen peroxide produced by LAB were
observed on beef carcasses and in ground beef (Senne and Gilliland, 2003;
Smith et al., 2005). While hydrogen peroxide has been shown to have an
inhibitory effect on microbial growth, researchers are still uncertain of the specific
mechanism by which the substance is produced.
Bacteriocins
Bacteriocins are proteinaceous compounds that kill or inhibit species that
are closely related to the producer bacterium (Nettles and Barefoot, 1993;
Klaenhammer, 1988). Bacteriocins produced by LAB can be divided into
different classes in respect to mode and spectrum of action, genetic origin,
molecular size, and biochemical properties. Klaenhammer (1993) defined four
classes of LAB bacteriocins although the fourth class is not widely accepted:
class I: lantibiotics; class II: small, heat-stable non-lantibiotics; class III: large,
heat-labile bacteriocins; and class IV: complex bacteriocins.
26
Class I lantibiotics are typically composed of small (< 5 kDa), unusual
amino acids such as lanthionine, β-methyl-lanthionines, and dehydrated
residues. They are heat stable and have a medium to broad antibacterial
spectrum of activity. Cell membrane pores are created and the membrane
potential is reduced. Interference with the destination cell’s energy supply and
inhibition of cell wall repair as well as a net influx of water causes an increase in
osomotic pressure and cell lysis (Sahl et al., 1995) In addition, they are
bactericidal to gram-positive bacteria and examples include nisin and lacticin 481
(Klaenhammer, 1993; Holzapfel et al., 1995).
Class II bacteriocins are membrane active, small (< 10 kDa) peptides that
do not contain lanthionine. These bacteriocins are also heat-stable and have a
medium to broad spectrum of antibacterial activity. They form pores and disrupt
the cell membrane. The sizes of pores formed are dependent upon
concentration of bacteriocins present (Venema et al., 1993) and the proton motor
force becomes disrupted (Bruno and Montville, 1993). Other modes of action
include inhibition of DNA, RNA, and protein synthesis as well as inhibition of
precursor transport and essential small molecules leaking from the cell (Venema
et al., 1993). Examples of bacteriocins included in class II include pediocin AcH,
sakacin A, and leucocin UAL 187 (Holzapfel et al., 1995).
Class III protein bacteriocins are large (> 30 kDa), heat-labile, non-
lanthionine containing proteins. These bacteriocins have a narrow range of
antibacterial activity and include helveticin J and cascicin 80 (Holzapfel et al.,
27
1995; Klaenhammer, 1993). In addition, Klaenhammer (1993) noted that these
bacteriocins have only been found in Lactobacillus. While the mechanisms of
action and biochemical properties of this class still need to be investigated,
conformational changes and complex structures are likely to affect the
antibacterial properties of the protein bacteriocins.
The classification of class IV bacteriocins must be approached with
caution. While scientists have found that lipid and carbohydrate moieties may be
necessary for activity (Ouwehand, 1998), the moieties must not be associated
with contaminating materials (Klaenhammer, 1993). Examples of this class
include lactocin 27 and leuconocin S (Ouwehand, 1998). As with class III
bacteriocins, the biochemical properties and mechanisms of action still need to
be thoroughly investigated. Caution also must be used because some scientists
have noted that bacteriocins included in this class may be improperly classified
due to incomplete purification (Venema et al., 1995).
Specific antibacterial factors of bacteriocins including inactivation by
product specific proteases, inducible resistance, limited spectrum of activity, little
or no influence on gram-negative bacteria, and unspecific binding to food
ingredients have limited their use in food products (Holzapfel et al., 1995).
Reduction of Food-Borne Pathogens
LAB have been shown to have an antimicrobial effect against food-borne
pathogens such as E. coli O157:H7, Salmonella spp., and Listeria
28
monocytogenes. The addition of LAB to ground beef to inhibit E. coli O157:H7
and Salmonella spp. at refrigeration temperatures was examined in a recent
study (Smith et al., 2005). Several LAB strains were screened to determine if
they could eliminate the pathogens at refrigeration temperatures while not
growing themselves. These strains selected could then be added to ground beef
without detrimental effects on the meat leading to premature spoilage. The
selected strains had been used in a previous study where L. monocytogenes
growth was inhibited in cold cuts and frankfurters (Amezquita and Brashears,
2000). The authors conducted a sensory panel with non-pathogen inoculated
products and determined that the LAB used had no noticeable effect on sensory
properties over a 56 day period.
Amezquita and Brashears (2000) isolated, screened, and identified strains
of LAB that had antimicrobial activity against L. monocytogenes at refrigeration
temperatures. Those strains were then used at an inoculation level of
approximately 107 cfu/mL in two different formulations of frankfurters and one
formulation of cooked ham for antagonistic action against the pathogen. The
authors found significant (P < 0.05) growth inhibition of L. monocytogenes in
each meat product tested by an added cocktail of LAB strains previously
selected. The reduction of the pathogen was 3.0 log cycles in the frankfurters
and a significantly large difference in the growth of L. monocytogenes in cooked
ham. In addition, the authors inoculated frankfurters with LAB only (strain D3; no
pathogen was added) at an inoculation level of approximately 107 cfu/mL to
29
determine the effect on sensory properties. In this study, the triangle test was
utilized and panelists were asked to determine which sample was different. No
significant differences were detected between frankfurters inoculated with LAB
and those not inoculated. No other obvious signs of spoilage were observed for
frankfurters in the package (Amezquita and Brashears, 2000).
Smith and others (2005) selected four strains of LAB for analysis of
pathogen reduction. The initial experiment showed a significant reduction of both
E. coil O157:H7 and Salmonella spp. in trypticase soy broth by the individual
cultures (107 cfu/mL) in separate studies. Those individual cultures were then
added at a 107 cfu/g separately to ground beef where the authors observed a 1.5
log reduction in E. coli O157:H7 populations and a 2.0 log reduction in
Salmonella spp. after 8-12 days of storage.
A combined cocktail of all 4 cultures was added to ground beef at a higher
inoculation level (108 cfu/g of meat) and for a shorter storage period of 5 days
(Smith et al., 2005). The combined cultures exhibited a significantly larger
antagonistic effect against E. coli O157:H7 than that of the individual cultures. In
addition, there was a 3 log reduction in the E. coli O157:H7 population after 5
days of storage at refrigeration temperatures. When examining the effects of the
combined LAB cocktail against Salmonella spp., Smith and others (2005) noted a
3 log reduction in Salmonella spp. after 3 days of storage and the pathogen was
not detectable after 5 days of storage by using either pre-enrichment or direct
30
plate methods. This reduction was also significantly greater than that of the
individual cultures.
Sensory evaluation of non-pathogen inoculated meat was also performed.
The authors conducted sensory evaluation at 3 days of storage to represent the
realistic shelf-life of ground beef. Panelists were asked to evaluate cooked
patties after storage of the raw product at 4ºC for either 6 hours or 3 days. No
significant differences were found in the mean correct responses between
controls or treatment patties when panelists were asked to correctly identify the
odd or different sample within a storage period or between storage periods
(Smith et al., 2005). Therefore, the LAB strains selected in the study could
potentially be used in ground beef as an antimicrobial agent upon approval from
regulatory agencies as a food additive.
Approval of Ingredients in Meat
For a potential additive to be approved by regulatory agencies, the
additive must be determined to be safe and suitable for use in a meat product.
The Food and Drug Administration (FDA) is the agency responsible for
determining the safety and the conditions for use of the potential additive. In
addition, the FDA also has the authority to determine the wholeness and
accurate labeling of food as granted by the Federal Food, Drug and Cosmetic
Act. The United States Department of Agriculture Food Safety and Inspection
Service (USDA-FSIS) has the responsibility of determining if the potential
31
additives are suitable for use in meat and poultry products as well as the
authority to regulate meat and poultry processing establishments and
determining wholesomeness and accurate labeling of meat and poultry products
as granted under the guidelines of the Federal Meat Inspection Act (FMIA) and
the Poultry Products Inspection Act (PPIA) (FSIS, 2000). Recently, the FSIS
published a Memorandum of Understanding (MOU) that stated the guidelines
that are used for the approval of food ingredients and sources of radiation for use
in meat and poultry products.
This memo was created for the following circumstances: (1) when a party
requests Federal approval of a food ingredient or source of radiation that
specifies use in or on a meat or poultry product; (2) when a party requests
Federal approval of a food ingredient or source of radiation that is intended for
use in or on food generally, but does not specify whether it is intended for use in
or on a meat and poultry product; (3) when a party requests a suitability
determination regarding the use of a food ingredient or source of radiation in or
on a meat or poultry product; and (4) when a party inquires about the use of a
food ingredient or source or radiation used in or on a meat or poultry product
(FSIS, 2000) and outlines the procedure that the agencies will follow when a
petition is submitted to either agency. In addition, for joint approval of ingredients
or sources of radiation, the FDA will determine the safety of the substance while
the FSIS will determine the suitability of the ingredient in meat or poultry products
(FSIS, 2003). Suitability of an ingredient is determined by the “effectiveness of
32
the substance in performing the intended technical purpose of use, at the lowest
level necessary, and the assurance that the conditions of use will not result in an
adulterated product or one that misleads consumers” (FSIS, 2003).
GRAS ingredients are those that the scientific community agrees on their
safety, and which have a history of use in foods or are derived from foods (21
CFR 170.30). GRAS substances that are petitioned for use in meat or poultry
products are still required to undergo scrutiny by FSIS. Scientific data must be
presented on the suitability of the ingredient for each meat or poultry product in
which the ingredient may be used, and the new ingredient can not result in a
misbranded or adulterated food and can not mask normal spoilage indicators.
FSIS can then permit the use of the ingredient under proposed use conditions as
long as standards and requirements are met (FSIS, 2003).
Masking Normal Spoilage Indicators
Normal spoilage indicators include sensory properties such as color, odor,
and texture. Carpenter and others (2001) found that consumer preference for
beef color was sufficient to influence their likelihood to purchase the meat, but
was not enough to bias taste scores. In addition, they determined that consumer
eating satisfaction after the meat had been taken home was dependent on other
quality attributes of tenderness, juiciness, and flavor. Color significantly (P <
0.001) influenced appearance scores with scores decreasing in the order of red >
purple > brown. It has also been noted that consumers will make a no-purchase
33
decision for beef when brown metmyglobin make up 30 to 40% of total surface
pigments of ground beef (Greene et al., 1971).
Microbial populations can be an indicator of spoilage with off-odors
becoming apparent when bacterial numbers reach approximately 107 cells/g of
meat (Ayers, 1955; Sutherland et al., 1975). However, the length of time it takes
to get an accurate number of bacteria present in the meat as well as
disagreements about the correlation between bacteria counts and organoleptic
properties of meat make it difficult to assess future shelf life of the meat (Nassos
et al., 1983). In addition, there are discrepancies in the amount of bacteria
present before the meat is considered spoiled. Microbial populations must reach
approximately 108/g for raw beef to have a tackiness when touched (Jay, 1964),
while others have recognized that for proteolytic changes in raw beef to occur,
bacterial numbers must be greater than 3.2 x 10⁹/cm2 (Danity et al., 1975).
Lipid oxidation produces off-odors and off-colors typically associated with
spoiled product. Lipid oxidation results in the conversion from oxymyglobin to
metmyoglobin resulting in a brown meat color. TBA analysis can measure the
amount of oxidation that has occurred. In addition, researchers have found that
the TBA test can serve as an indicator of oxidized odor or color in meat when
those sensory attributes are judged by a trained sensory panel (Greene and
Cumuze, 1981; Turner et al., 1954; Younathan and Watts, 1959). Greene and
Cumuze (1981) noted a TBA value of 0.6 to 2.0 mg TBA reacting substances/kg
tissue when the panelists first detected a difference in intensity of oxidized flavor.
34
This number was similar to the 0.5 to 1.0 TBA values that were correlated to
rancid odor detection by a trained panel in another study (Tarladgis et al., 1960).
However, some variability in TBA values can be expected as a result in variability
in laboratories and procedures.
Therefore, the object of this study was to determine color stability, odor,
oxidative rancidity susceptibility, and microbial loads when LAB were added to
ground beef packaged in traditional retail packaging or modified atmosphere
packaging then displayed at refrigeration and abusive temperatures.
35
CHAPTER III
MATERIALS AND METHODS
Patty Preparation The spoilage characteristics of ground beef were evaluated by inoculating
ground beef with a combination of lactic acid bacteria (LAB) or sterile distilled
water (control). Samples were stored in retail display cases with a light intensity
of approximately 1900 lux and collected at the following times during display
based on display case temperature; for patties displayed at 0°C: at time patties
were put in case (0 h), 24 h, 48 h, 72 h, and 84 h; for patties displayed at 10°C:
at time patties were put in case (0 h), 12 h, 24 h, and 36 h. The patty preparation
was conducted in the Texas Tech University Meat Science Laboratory under
simulated industry conditions. A total of 209.1 kg of coarse-grind ground beef
was obtained from a commercial beef-packing facility over a 6 week long period.
For each replication of traditional overwrap packaging (n=3) and modified
atmosphere packaging (n=3), 34.85 kg of ground beef were processed. A
cocktail of 4 strains of lactic acid bacteria consisting of Lactobacillus acidophilus
NP 51 (isolated from cattle), Lactobacillus crispatus NP 35 (isolated from cattle),
Pediococcus acidilactici (isolated from cooked ham on grocery store shelf), and
Lactococcus lactic spp. Lactis (isolated from alfalfa sprouts) was provided by
Culture Systems, Inc. (Mishawaka, IN) for use in this study at an inoculation level
of 109 cfu/g meat.
36
Traditional Packaging Replications
For overwrap replications containing LAB, 17.42 kg ground beef was
mixed thoroughly for 1 min in a Hollymatic GMG model 180A mixer (Hollymatic,
Park Forrest, IL), then 500 mL of a 109 cfu LAB/g solution suspended in sterile
distilled water was added to the ground beef, the mixer direction was reversed,
and the ground beef was mixed for 1 min. Using a 0.32 cm fine grind plate, the
meat was passed through a three-phase Biro meat grinder (Model 346, Ft. Smith,
AR). Patties weighing 145.2 g were formed using a Super-model 54 Hollymatic
patty machine (Hollymatic, Park Forrest, IL) and 2 patties were packaged on a
foam tray (Cryovac, Duncan, SC). Trays were overwrapped with a
polyvinylchloride (PVC) film and the packages were sealed using a Heat Sealing
(Heat Sealing Equipment Co., Cleveland, OH) overwrap machine. The
remaining 17.42 kg of ground beef was processed as above, except 500 mL of
sterile distilled water only was added to serve as the control. A total of 40 patties
(20 packages) were prepared for each treatment resulting in 80 patties per
replication. Equipment was cleaned thoroughly between treatments and rinsed
with 180°C water.
The LAB inoculated packages were randomly identified and assigned to
either a 0°C- or 10°C-Hussmann coffin-style retail display case (Model M1,
Hussmann Corporation, Bridgeton, MO) for display. Controls were randomly
assigned in the same manner. The display cases were equipped with lights
(Sylvania, 40 W, Gro-Lux, Model A858) and ceiling lights (Phillips 34 W, Watt-
37
Saver, Model G) with an intensity of approximately 1900 lux. Packages in the
0°C-display case were displayed for up to 36 h while the packages in the 10°C
were displayed up to 84 h under continuous lighting.
MAP Replications
For each replication (n = 3), 34.85 kg of ground beef was divided into four,
8.71 kg treatments: (1) control; (2) control + rosemary oleoresin; (3) LAB only;
and (4) LAB + rosemary oleoresin. Control and LAB only treatment groups were
prepared in the same manner to the traditional overwrap replications, but using
250 mL of sterile water. Rosemary oleoresin was added to the control +
rosemary and LAB + rosemary treatment groups at a level of 0.01% (w/w; 1000
ppm), 9 g of Herbalox Type HT-W rosemary oleoresin (Kalsec, Inc; Kalamazoo,
MI) per 8.71 kg ground beef at the same time as the water or LAB solution was
added. The treatment groups were then processed in the same manner as the
other treatment groups. Once the patties were formed, 2 patties were placed in
Cryovac #10 plastic lidded tray. (Cryovac; Duncan, SC). The G. Mondini S.p.a.
Model CV/VG-S gas flush, tray sealing machine (G. Mondini; Brescia, Italy) was
used to seal the LID 1050 film (Cryovac) with an oxygen transmission rate of less
than 20.0 cc (24 h, m2 at 40°F and 100% RH) onto the trays. Packages were
flushed with a targeted of 80% O2 and 20% CO2. Headspace was analyzed on
random packages during processing. Packages in each treatment group were
38
randomly identified and assigned to either display case. A total of 40 packages
per replication were prepared (n = 10 packages per treatment group).
Sensory Analysis
The scope of the project included examination of spoilage characteristics
by sensory analyses. Both trained and consumer panelists were utilized to
detect differences in color and odor of the treated ground beef. A portion of the
panelists were trained for color evaluation by an experienced meat scientist. Six
to eight trained panelists scored the patties for ground meat color (1 = very bright
red; 5 = very dark red or brown) as well as surface discoloration (1 = no
discoloration; 2 = slight, 1-10%; 3 = small, 11-20%; 4 = moderate, 21-60%; 5 =
severe discoloration, 61-100%) as outlined by the AMSA color guidelines (AMSA,
1991). The untrained visual panelists served as the consumer panel. Untrained
panelists were asked to determine if the meat had good color (1 = very strongly
agree; 7 = very strongly disagree) and how likely they were to purchase (1 =
definitely would purchase; 5 = definitely would not purchase) the package
(AMSA, 1991). The patties evaluated for color through this display period were
36 h-samples at 10°C and 84 h at 0ºC. The packages were identified by a
randomly assigned number.
Odor panels were also conducted on packages (n = 4 traditional
packages/treatment; n = 2 MAP packages/treatment) removed from the cases at
each sampling interval. The packages were opened in a random order and the
39
panelists were allowed to smell the patties. The sensory evaluation forms were
adapted from Oklahoma State University Meat Laboratory’s odor evaluation
methods (Payne et al., 2002). The trained panel had received training from an
experienced meat scientist prior to participation. They were asked to determine if
an immediate off odor was present (1 = no off-odor; 5 = extreme off-odor) and to
characterize the off odor if present (1 = rancid; 2 = arid; 3 = sweet; 4 = sour; 5 =
acid; and 6 = putrid). Consumer panelists were asked if the meat in the package
smelled fresh (1 = very strongly agree; 7 = very strongly disagree) and how likely
they were to consume the meat (1 = definitely would consume; 5 = definitely
would not consume) based upon the odor.
Commission Internationale de I’Eclairage (CIE) L* (luminance or muscle
lightness), a* (redness or muscle redness), b* (yellowness or muscle yellowness)
were taken on the patty not used for microbial analysis from each package
opened at the sampling interval. Each patty was evaluated using the MiniScan
XE Plus (Hunter Associaiton Laboratory, Incorporated; Reston, VA). The
MiniScan was standardized using a white tile and black tile prior to taking
measurements on the patties. Two readings from randomly selected locations
were taken from each patty and averaged to determine the L*, a*, and b* values
of the patty at the sampling interval. These values were used to determine
objective color differences among treatments.
40
Microbial Analysis
After sensory and odor panels were conducted at each sample interval,
one-half of the patties were transported to the Texas Tech University Food
Microbiology Laboratory for microbial analysis while the remaining patties were
frozen at -80°C for TBA analysis. In the traditional overwrap replications, 2.5 g of
4 patties representing 1 treatment were combined (10 g total) in a sterlie filtered
homogenizer bag (Model no. 6469, 3M, St. Paul, MN) and 99 mL of buffered
peptone water (Oxoid, Basingstoke, Hampshire, England) was added. In the
MAP replications, 5 g of 2 patties representing 1 treatment were combined (10 g)
in a sterile filtered homogenizer bag and processed as the traditional replications.
The bag and contents were placed into a laboratory blend stomacher (Model
400, Seward Medical, London UK) and processed at normal speed for 60
seconds. Serial dilutions were made and 3 mL of each dilution was placed into
separate spiral-plater sampling cups. Samples were automatically plated using
the Spiral Biotech Autoplate® (Spiral Biotech, Norwood, MA) and 50 µL of the
appropriate dilution was expelled onto two plates of each media. The following
media were used to isolate and enumerate microorganisms present: Trypticase
Soy Agar (Difco, Sparks, MD), Pseudomonas F Agar (Difco), YM Agar (Difco),
Violet Red Bile Agar (Difco), Lactobacilli MRS Agar (Difco), and STAA Agar with
supplement SR151E (Oxoid). The organisms isolated and enumerated on each
media as well as incubation time and temperatures are listed in Table 3.1.
41
After the samples were plated, the duplicate plates were incubated at the
appropriate temperatures for each media as seen in Table 3.1. Plates were
counted using the Spiral Biotech Q Count (Version 2.0, Spiral Biotech, Norwood,
MA). Pseudomonas F plates were examined under short wavelength ultraviolet
light (254 nm) and only those colonies exhibiting a greenish-yellow fluorescent
pigment were counted.
Thiobarbituric Acid (TBA) Assay
TBA assays were performed on the remaining one-half of the patties in the
Texas Tech University Animal and Food Sciences Nutrition Laboratory to
measure the amount of oxidation that occurred using a modified version of the
TBA analysis described by Buege and Aust (1978). TCA/TBA stock solution was
made by adding 20 mM thiobarbituric acid (TBA; MP Biomedicals; Aurora, OH)
and 15% (w/v) trichloroacetic acid (TCA; Sigma-Aldrich; St. Louis, MO) to
distilled water (DW) in a volumetric flask. BHA stock solution was made by
dissolving 10% butylated hydroxyanisole (BHA; Sigma-Aldrich; St. Louis, MO)
into 90% ethanol (Acros; New Jersey). TEP stock solution was prepared by
adding 0.5 mL of 1*10-3 M 1, 1, 3, 3-tetra-ethoxypropane (Sigma-Aldrich) into
499.5 mL distilled water. The resulting solution was then diluted at a ratio of
1:2.96 (TEP solution:DW) with distilled water to create a stock solution of TEP.
42
Standard curves were made each day of analysis by diluting the working
stock solution of TEP (1:2.96 TEP:DW) at the ratios in Table B.1 to make 1 mL of
solution.
Two tubes of each ratio were made, 2 mL of TBA/TCA stock solution was
added to each tube and the tubes were vortexed until the solutions were mixed
well. The solutions were heated for 15 min in a boiling water bath, then cooled
for 10 min by placing in an ice bath and the solutions were vortexed again.
Optical density was read after the sample was placed into an open 13 x 100 mm
Pyrex culture medium tube (Corning, Inc; Corning, NY) using a Beckman DU640
Spectrophotometer (Beckman Instruments, Inc.; Fullerton, CA) at a wavelength
of 531 nm and a standard curve was constructed.
For sample analysis, 10 g of frozen patty were removed and placed in a
connicle with 30 mL of DW. The solution was homogenized in a blender for 2
min. After the samples were homogenized, they were frozen at -80ºC in a
freezer (Environmental Equipment; Cincinnati, OH). The solutions were thawed
slightly and 4 mL of the homogenate were combined with 8 mL of the TCA/TBA
stock solution and 200 µL BHA stock solution. The tubes were vortexed
thoroughly and then heated for 15 min in a boiling water bath. The samples were
cooled for 10 min, vortexed thoroughly again, and centrifuged for 10 min at 3000
RPM using a Marathon 21000R centrifuge (Fisher Scientific; Pittsburg, PA). The
absorbance of the supernatant was read at 531 nm against a blank containing all
43
reagents, but no sample. All sample analysis was performed in duplicate for
each patty.
The optical densities were converted to nmol/g by using the formula
[(Optical Denisty + b (y-intercept))/m (slope)]*3. These values were then
converted to the TBA value (mg aldehyde/kg meat) by using the formula
[(nmol/g)*72]/1000. Once all optical densities had been converted to TBA
numbers, the two densities for each patty were averaged. The coefficient
variance was calculated and if the CV was greater than 10%, the samples were
processed again.
Statistical Analysis
All experiments were performed in triplicate for each of the packaging
types and the averages of the samples were calculated then used for statistical
analysis. Once microbial counts were determined, the cfu/mL was transformed
into log10 units.
The Mixed Model of the Statistical Analysis System (SAS; SAS Institute,
Inc., Cary NC) was used to evaluate the effect of treatments on microbial loads,
sensory evaluation, and lipid oxidation with replication as a random effect. The
dependent variables in this model were the characteristics evaluated which
included the population of bacteria (log transformed), panelist responses for each
trait observed; Hunter L*, a*, and b* values; and TBA values. Independent
variables included treatment, presence of resin, and sampling time.
44
Treatment*replication was a repeated measure and different treatments
and time were the fixed effects in the model. Characterization of off-odors were
calculated using PROC FREQ of SAS.
Significant main effects and interactions were analyzed using the least
squares means method. Least squares means were separated using the pdiff
statement. All tests were conducted with a significance level of 0.05 (P < 0.05).
45
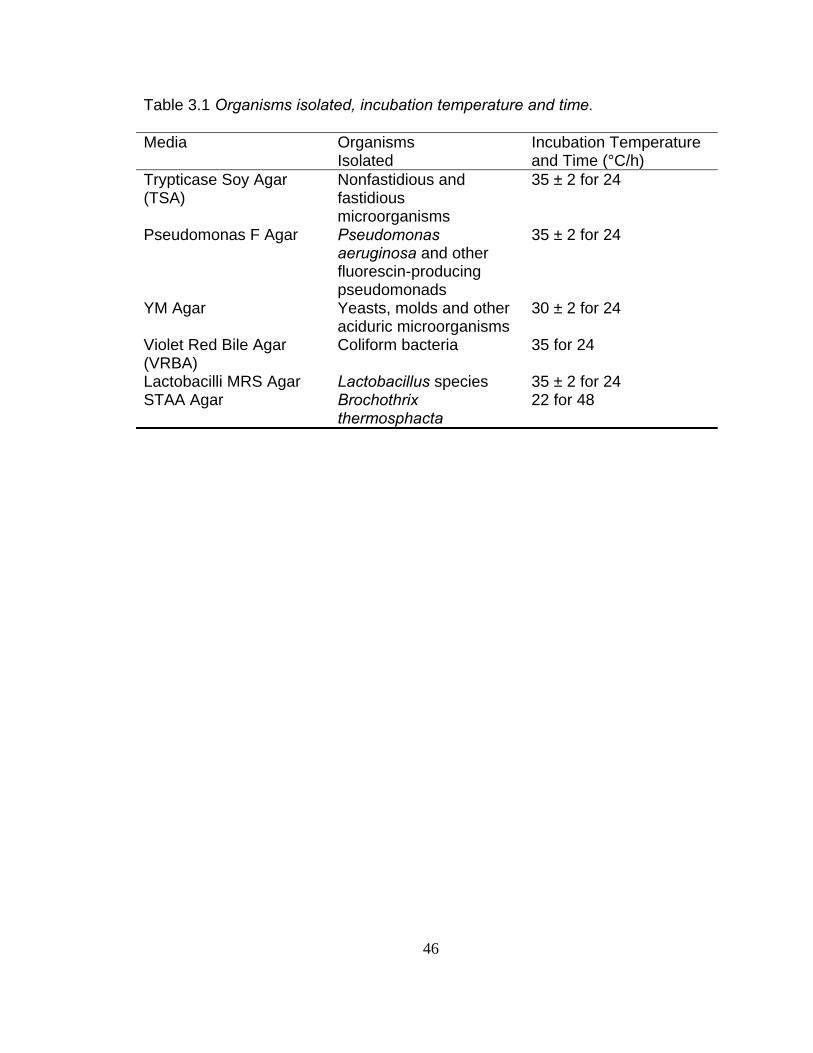
Table 3.1 Organisms isolated, incubation temperature and time.
Media Organisms Isolated
Incubation Temperature and Time (°C/h)
Trypticase Soy Agar (TSA)
Nonfastidious and fastidious microorganisms
35 ± 2 for 24
Pseudomonas F Agar Pseudomonas aeruginosa and other fluorescin-producing pseudomonads
35 ± 2 for 24
YM Agar Yeasts, molds and other aciduric microorganisms
30 ± 2 for 24
Violet Red Bile Agar (VRBA)
Coliform bacteria 35 for 24
Lactobacilli MRS Agar Lactobacillus species 35 ± 2 for 24 STAA Agar Brochothrix
thermosphacta 22 for 48
46
CHAPTER IV
RESULTS
Traditional Packaging Displayed at Refrigeration Temperature
Ground beef patties displayed at refrigeration temperature (0°C) for up to
84 h were analyzed to determine the microbial load of selected organisms (see
Table 3.1), oxidative rancidity, subjective and objective color scores, and
subjective odor scores.
Microbial Populations
A composite sample of 10 g (2.5 g from 4 separate ground beef patties)
for each treatment was plated using serial dilutions onto duplicate plates for each
media. The plates were counted and averaged to determine microbial
populations. The counts were then converted into log10 cfu/g. A summary of
microbial results can be found in Tables 4.1 and 4.2. Other microbial results can
be found in Appendix C.
Trypticase soy agar (TSA) was used to determine aerobic plate counts
(APC) for control and LAB-inoculated samples (Table 4.1). There was a
significant (P < 0.05) interaction between treatment and time. Total aerobic
counts for uninoculated samples ranged from 4.00 to 5.74 log cfu/g, with a
statistically significant increase at 72 h (P < 0.05) for non-treated samples as
compared to 0, 24, and 48 h. At 0, 24, and 48 h, LAB inoculated samples had
47
significantly higher populations of total aerobic organisms when compared to the
uninoculated samples. However, after 72 h, the populations were similar. This
was to be expected because the LAB would be counted as part of the aerobic
plate count (APC). Over time, the APC population did not increase significantly
for LAB-inoculated samples with a range from 5.61 log cfu/g at 0 h to 6.14 log
cfu/g at 84 h. After 72 and 84 h, the total counts were similar between treated
and non-treated samples indicating that the LAB inhibited some of the naturally
occurring aerobic organisms.
MRS agar was used to recover LAB from the samples. Initially, there was
a significant (P < 0.05) difference in microbial loads for uninoculated and
inoculated samples (Table 4.2). However, this was expected because LAB was
added at an inoculation level of approximately 109 cfu/g of meat so these
differences were not a concern, but expected. There were no increases during
display in the LAB populations of samples treated with LAB which indicates that
the LAB did not grow in the product at refrigeration temperatures. However,
there were significant increases in LAB populations in the non-treated samples
over time (data not shown). The initial populations were at 3.37 cfu/g, with
significant increases to 4.60 cfu/g and 5.17 cfu/g, after 72 and 84 h respectively.
All though the initial populations of LAB were higher, after 84 h, the LAB
populations were similar with no statistical differences between treated and non-
treated samples.
48
YM agar was used to recover yeasts and molds from the samples.
Treated and control samples did not differ significantly in YM populations (Table
4.2). However, there was a significant (P < 0.05) increase of yeasts and molds
over time in both treatments (data not shown).
In both treated and untreated samples, there was a significant increase in
B. thermosphacta in ground beef samples during display (data not shown).
Treatment LSM estimates were not significant, so there was no difference due to
treatment (Table 4.2).
Coliforms significantly (P < 0.05) increased over time in both treatments
(data not shown), but there were no differences between the two treatments
(Table 4.2).
There were no differences between treated and non-treated samples in
the number of Pseudomonas aeruginosa and other fluorescin-producing
pseudomonads (Table 4.2). Additionally, there were no significant increases in
the populations of pseudomonads over time (data not shown).
Trained Color and Odor Panel
Trained color panelists were asked to evaluate the lean color of ground
beef samples and the percent discoloration for each patty. As noted in Table 4.3,
no significant differences were found in panelist responses for each trait
evaluated between treatments. For lean color of the ground beef, the LSM for
uninoculated and inoculated samples were 3.02 and 2.84, respectively. There
49
was a significant increase (P < 0.05) in panelist responses over time for lean
color which ranged from 1.7 at 0 h to 4.3 at 84 h (1 = no discoloration; 4 =
moderately dark red to brown; data not shown). Percent discoloration of the
ground beef patties also increased significantly (P < 0.05) over time with panelist
scores ranging from 1.0 at 0 h to 4.0 at 84 h (1 = no discoloration; 4 = moderate,
21-60%; data not shown). The differences in responses from panelists over time
are expected as the myoglobin is converted to metmyoglobin due to exposure to
oxygen and light.
As the packages were opened for odor analysis at each sampling interval,
trained panelists were asked to determine the presence of an immediate off-odor
and if an off-odor was present, they were asked to characterize the odor. Four
different packages from each treatment group were opened for each sampling
period and no package was used more than once in odor analysis. No significant
differences were found in panelist responses to immediate off-odor or off-odor
characterization between uninoculated and LAB-inoculated ground beef patties
(Table 4.3). As with the color evaluation, significant differences (P < 0.05) were
found in question responses over time (data not shown). The immediate off-odor
responses ranged from 1.03 at 0 h to 2.99 at 84 h (1 = no off-odor; 3 = small off-
odor; data not shown).
Characterizations of off-odors can be seen in Tables 4.4 and 4.5.
Uninoculated ground beef patties at time 0 were characterized as not having an
off-odor present. After 72 h, 21.11% of the patties were characterized as having
50
no off-odor, 43.33% were rancid, and 21.11% were characterized as sour. After
84 h of display, only 9.21% of the uninoculated ground beef patties had no off-
odor present as compared to the 40.79% characterized as rancid and 35.53%
characterized as sour.
One hundred percent (100%) of the LAB-inoculated ground beef patties
were characterized as having no off-odor at the initial sampling time. As display
progressed, 38.20% of the patties did not have an off-odor present after 72 h.
Aditionally, 35.96% were rancid and 12.36% of the patties were classified as
acid. After 84 h, 14.47% of the patties were characterized as having no off-odor,
while 43.42% of the patties were called rancid and 32.89% of the patties were
classified as sour. The differences over time are expected as chemical changes
occur in meat as a result of degradative enzymes and chemical reactions as well
as microbial growth.
Consumer Color and Odor Panel
No significant differences were found in consumer color panelist
responses between treatments for either question (Table 4.6). However, the
panelist response LSMs to the color of the meat was significantly (P < 0.05)
different over time (1.60 at 0 h, 5.41 at 84 h; 1 = very strongly agree, 5 = slightly
disagree; data not shown). In addition, the panelists were also significantly (P <
0.05) less likely to purchase the package over time with a score of 4.15 at 84 h in
display case (4 = probably would not purchase; data not shown). As explained
51
earlier, these differences over time were expected as a result in natural changes
in meat color that occur after extended exposure to the atmosphere and light.
No significant differences were found between treatments when consumer
odor panelists responses were analyzed for each question (Table 4.6). Over
time, a significant (P < 0.05) reduction in the freshness of smell as indicated by
the consumer panel was observed (data not shown). After 84 h in the display
case, the LSM was 5.41 for the freshness of ground beef odor (5 = slightly
disagree; 6 = strongly disagree). In addition, consumers were significantly less
likely to consume the ground beef after 84 h of display then 0 h (4.01 and 1.20,
respectively; 4 = probably would not consume, 1 = definitely would consume;
data not shown). These changes in odor and the consumer’s likelihood to
consume the ground beef were expected as the ground beef was exposed to air
and light.
Hunter L*a*b* Values
Objective color scores were taken using the MiniScan XE Plus (Hunter
Association Laboratory, Incorporated; Reston, VA) to obtain L* (luminance or
muscle lightness), a* (redness or muscle redness), and b* (yellowness or muscle
yellowness) values for a patty from each package opened at a sampling interval.
L* measures muscle lightness (luminance) and no significant differences were
found between treatments (Table 4.7) or over time (data not shown). However,
a* scores for muscle redness were significantly higher for LAB-inoculated
52
samples as compared to uninoculated ground beef, 16.09 and 15.12,
respectively. In addition, there was a significant (P < 0.05) decrease in scores
from 0 h to 84 h, 23.57 and 10.18, respectively (data not shown). As
oxymyglobin is converted to metmyglobin, the scores would be expected to
decrease. LAB-inoculated patties (19.44) also had a significantly (P < 0.05)
higher b* value (muscle yellowness) than uninoculated patties (18.91). A
significant (P < 0.05) decrease in scores was also observed over time, 23.12 at 0
h to 16.57 at 84 h (data not shown).
While there were significant (P < 0.05) differences between treatments for
Hunter a* and b* values, no significant differences were found between the
treatments by consumer and trained color panelists. Therefore, although
statistically significant, these changes were undetected by the human eye and
can not be used as an indication of color changes.
Thiobarbituric Acid (TBA) Assay
TBA assays were performed on each treatment group. LAB inoculated
samples had a significantly (P < 0.05) lower TBA value than the uninoculated
samples (Table 4.8). This would indicate that LAB inoculated samples
underwent lipid oxidation at a slower rate than those without the bacteria. As
oxidation occurs, the amount of aldehyde produced as a by-product increases.
The TBA assay measures the amount of aldehyde produced as milligrams of
malonaldehyde per kilogram of meat so the higher the TBA value, the larger
53
amount of malonaldehyde recovered from the sample. In addition, there was a
significant (P < 0.05) increase in TBA values over time (data not shown). The
values ranged from 1.36 mg malonaldehyde/g meat at 0 h to 3.04 mg
malonaldehyde/g meat at 84 h. This is expected as lipid oxidation occurs over
time as the meat is exposed to oxygen.
Traditional Packages Displayed at Abusive Temperature
Ground beef patties displayed at abusive temperature (10°C) for up to 36
h were analyzed to determine the microbial load of selected organisms, oxidative
rancidity, subjective and objective color scores, and subjective odor scores.
Microbial Populations
Serial dilutions were made from a composite (10 g) of 4 ground beef
patties (2.5 g) for each treatment group then plated on several media for isolation
and enumeration of specific bacteria (see Table 3.1). Microbial results can be
found in Tables 4.9 and 4.10. LAB-inoculated samples had a significantly (P <
0.05) higher population of total aerobic bacteria than the uninoculated controls at
0 and 12 h, which would be expected because the LAB was added at an
inoculation level of approximately 109 cfu/g of meat. However, after 24 and 36 h,
there were no differences between treated and control samples indicating that
the LAB inhibited total aerobic organisms. In addition, a significant (P < 0.05)
increase in aerobic plate counts was found over time in control samples after 24
54
and 36 h (data not shown). Treated samples did not exhibit significant increases
compared to the control until 36 h at abusive temperatures (data not shown).
The bacteria were present in an environment conducive to growth over time.
This is a concern in ground beef which has been temperature abused prior to or
after the consumer has purchased the product. Consumers can temperature
abuse the meat by leaving the product in the car or on the kitchen counter for an
extended period of time.
There was a significant (P < 0.05) interaction between treatment and time
for the LAB counts (Table 4.10). The uninoculated samples increased by
approximately 3 log cfu/g after 36 h; however, LAB-treated samples showed no
significant increase in growth and even though these samples were inoculated
with high populations of LAB, there were no differences between controls and
treated samples after 36 h.
No significant differences were found between treatments and controls for
yeast and mold counts (Table 4.9), but a significant (P < 0.05) increase of
approximately 3.3 log cfu/mL was observed over time in both treatments
indicating that LAB do not inhibit these organisms (data not shown).
There were no significant differences in B. thermosphacta between
treatments (Table 4.9). Over time, the number of bacteria increased by
approximately 1.5 log cycles in both treated and control samples (data not
shown).
55
There was a significant (P < 0.05) increase of almost 3.0 log cfu/mL in
coliforms over the display period (data not shown), but no significant differences
were found between treatments at any sampling point (Table 4.9)
Fluorescent pseudomonads including P. aeurginosa exhibited no
significant differences between treatments (Table 4.9) and there was not a
significant increase over time in the number of bacteria present (data not shown).
Trained Color and Odor Panels
Trained color panelists were asked to evaluate the lean color of ground
beef samples and the percent discoloration for each patty. Lean color as well as
percent discoloration responses were not significantly different between
treatments (see Table 4.11), but a significant (P < 0.05) difference in responses
was found over time (data not shown). At time 0, the LSM was 2.02, while at
time 36, the LSM was 4.34 (2 = bright red; 4 = moderately dark red or brown). In
addition, panelists found a significant (P < 0.05) difference in percent
discoloration over time with a range of 1.01 at 0 h to 4.59 at 36 h (1 = no
discoloration; 4 = moderate, 21-60%; 5 = severe, 61-100%; data not shown).
These significant differences which were found over time are expected to occur
as the meat is exposed to air and light and as oxymyglobin is converted to
metmyglobin.
As samples were opened, panelists were asked to determine the
presence of an immediate off-odor and to characterize the off-odor if it was
56
present. It is important to note that once a sample was opened, the sample was
further analyzed and not returned to the display case. Trained odor panelists did
not find a significant difference between treatments for immediate off-odor (Table
4.11). But significant (P < 0.05) differences were found over time for immediate
off-odor (data not shown). Immediate off-odor scores increased from 1.01 at 0 h
to 2.87 at 36 h (1 = no immediate off-odor; 2 = slight off-odor; 3 = small off-odor).
As the meat is exposed to continuous light and the atmosphere, chemical and
biological reactions occur that produce off-odors which range in strength and
characterization.
Trained panelists characterized the off-odors of the ground beef patties at
each sampling interval (Tables 4.12 and 4.13). Uninoculated ground beef patties
were characterized as having no off-odor present at time 0. As display
progressed, more distinct off-odors were present. After 24 h, 26.47% were
classified with no off-odor present, while a majority (41.18%) of the patties was
considered sour by trained panelists. At the end of the display period, 54.17% of
the uninoculated ground beef patties were classified as rancid by panelists and
21.88% were considered sour. Results for LAB-inoculated ground beef patties
were similar to the uninoculated ground beef patties. While 100% of the LAB-
inoculated patties did not have an off-odor present at time 0, only 28.95% still
had no off-odor after 24 h of display. At that sampling interval, 26.32% of the
patties were considered rancid and 36.84% of the patties were called sour. After
36 h, a majority (51.04%) of the patties was characterized as rancid, 18.75%
57
were sour, and 12.50% were acid. When comparing frequencies for LAB-
inoculated and uninoculated ground beef patties, the percentages were similar
throughout display indicating that the addition of LAB did not mask odors typically
associated with a spoiled product.
Consumer Color and Odor Panels
Consumers were asked to determine if the meat in the package looked
fresh and based on the color of the meat, to indicate the likelihood of purchasing
that package. Analysis of results found no significant differences for responses
between treatments for either question (see Table 4.14). However, over the
storage period, the panelists determined the color of the meat to significantly (P <
0.05) lose freshness (1.95 at 0 h, 5.83 at 36 h; 1 = very strongly agree, 2 =
strongly agree, 5 = slightly disagree, 6 = strongly disagree; data not shown). In
addition, consumers were significantly (P < 0.05) less likely to purchase the meat
at 36 h (4.43) than at 0 h (1.64; data not shown).
Consumer panelists evaluated the freshness of the odor of the ground
beef patties and were asked how likely they were to consume those patties
based on the odor (see Table 4.14). No significant differences were found
between treatments for either question. Significant (P < 0.05) differences were
found over time when panelists were asked to evaluate the freshness of odor.
The scores increased throughout the storage period from 1.74 at 0 h to 5.44 at
36 h (1 = very strongly agree; 5 = slightly disagree; 6 = strongly disagree; data
58
not shown). In addition, consumers were significantly less likely to consume the
ground beef patties throughout the storage period (1.30 at 0 h, 4.14 at 36 h; 1 =
very strongly agree, 2 = strongly agree, 4 = no opinion, 5 = slightly disagree; data
not shown). Odors typically associated with a spoiled product are by-products of
lipid oxidation. Lipid oxidation more readily occurs in meat with continuous
exposure to light and air and it has been suggested that oxymyglobin may serve
as an oxidation catalyst.
Hunter L*a*b* Values
Hunter L*, a*, and b* values were all measured using the MiniScan XE
Plus (see Table 4.15). L* values for ground beef patties displayed at 10°C were
not significantly different between treatments. Over time, the L* values
decreased significantly (P < 0.05) from 48.06 at 0 h to 46.84 at 36 h (data not
shown). Muscle redness was measured with the a* value which was not
significantly different between treatments. But the values significantly (P < 0.05)
decreased over time from 23.57 at 0 h to 9.67 at 36 h (data not shown). The b*
values were not significant between treatments, but did decrease significantly (P
< 0.05) over time (data not shown). The b* value was 23.12 at 0 h and dropped
to 16.64 at 36 h. The scores reflect both color panel evaluations that patty color
deteriorated as display times progressed.
59
Thiobarbituric Acid (TBA) Assay
TBA assays are used to measure lipid oxidation of meats. LAB inoculated
ground beef patties (2.24) had a significantly (P < 0.05) lower TBA score than
uninoculated ground beef (2.54, see Table 4.16) which would imply that the
addition of LAB could slow the onset of oxidative rancidity. In addition, TBA
scores significantly (P < 0.05) increased over time from 1.36 at 0 h to 3.32 at 36
h (data not shown). Because malonaldehyde is a by-product of lipid oxidation,
the TBA values would be expected to increase during display since the
concentration of malonaldehyde increases as lipid oxidation takes place over
time.
Modified Atmosphere Packaging Displayed at Refrigerated Temperature
Ground beef patties from each treatment group: (1) uninoculated without
added oleoresin; (2) uninoculated with added oleoresin; (3) LAB inoculated
without added oleoresin; and (4) LAB inoculated with added oleoresin were
packaged in an 80% O2 and 20% CO2 atmosphere then displayed at 0°C for up
to 84 h.
Microbial Populations
Microbial data can be found in Table 4.17. Significant differences (P <
0.05) were found between treatments for aerobic plate counts. Uninoculated
ground beef patties without resin had significantly higher counts than
60
uninoculated ground beef patties with resin. LAB-inoculated ground beef without
resin had significantly higher total aerobic plate counts than those LAB-
inoculated ground beef with resin. In addition, those uninoculated ground beef
patties with and without added oleoresin had significantly lower counts than the
LAB-inoculated ground beef with and without added oleoresin. Because the
ground beef was inoculated, these results were not of large concern. No
significant differences in total aerobic plate counts were found over time (data not
shown).
Lactic acid bacteria counts were determined by plating on MRS agar
(Table 4.17). Ground beef inoculated with LAB with and without rosemary
oleoresin had significantly (P < 0.05) higher counts than uninoculated ground
beef with and without oleoresin. However, there were no significant differences
between LAB-inoculated ground beef with resin and LAB-inoculated ground beef
without resin. Uninoculated ground beef patties without oleoresin had
significantly lower lactic acid bacteria counts than uninoculated ground beef
patties with oleoresin. No significant differences in lactic acid bacteria counts
were found over time for any treatments (data not shown).
No significant differences in yeast and mold counts were found between
treatments (Table 4.17). However, significant differences were found in yeast
and mold counts throughout the display period (data not shown). At 48 and 72 h,
counts were significantly (P < 0.05) higher as compared to 0 and 24 h. In
61
addition, the yeast and mold counts were significantly (P < 0.05) lower at 84 h
than at 72 h.
Brochothrix thermosphacta counts of uninoculated ground beef patties
without resin were significantly higher than uninoculated ground beef patties with
resin and LAB-inoculated ground beef patties without resin (Table 4.17). LAB-
inoculated ground beef patties with resin and uninoculated ground beef patties
without resin did not have significantly different counts. Throughout the display
period, B. thermosphacta counts increased significantly (P < 0.05; data not
shown). At 48 h and 72 h, the counts were significantly higher than at time 0.
No significant differences were found in coliform counts between
treatments (Table 4.17); however, significant increases (P < 0.05) occurred
throughout display (data not shown). After 72 h, the coliform counts were
significantly higher as compared to time 0.
Fluorescin producing pseudomonad counts did not significantly differ
between treatments (Table 4.17) and no significant increases occurred
throughout display (data not shown).
Trained Color and Odor Panels
Trained panelist responses for lean color did not significantly differ
between treatments for ground beef patties displayed at refrigeration
temperatures (Table 4.18). However, trained panelist responses significantly (P
62
< 0.05) increased at each sampling interval (data not shown). The scores ranked
from very bright red to slightly red or brown.
Panelists were also asked to determine percent discoloration of the
ground beef patties. Treatments were not significantly different (Table 4.18).
However, throughout the display period, the ground beef patty surface
discoloration significantly increased (data not shown). Percent discoloration
scores were significantly greater at 48 h, 72 h, and 84 h as compared to time 0.
The scores ranged from no discoloration at time 0 to slight discoloration, 1-10%
at 84 h.
Immediate off-odors of ground beef patties did not significantly differ
between treatments (Table 4.18). However, throughout display, the immediate
off-odor became more distinct (data not shown).
Trained panelists characterized the off-odor scores at each sampling
interval (Tables 4.19 – 4.22). At 0 h, 100% of the patties for each treatment were
characterized as having no off-odor. However, as the display period progressed,
uninoculated ground beef patties without resin were characterized as rancid
(20% at 84 h), arid (6.67% at 84 h), sweet (3.33% at 84 h) sour (36.67% at 84 h),
and acid (10% at 84 h). Uninoculated ground beef patties with resin were
characterized at 84 h as no off-odor (40%), rancid (10%), arid (3.33%), sweet
(16.67%), sour (23.33%), and acid (6.67%). At 84 h, LAB-inoculated ground beef
patties without resin were characterized as no off-odor (13.33%), rancid (40%),
arid (3.33%), sweet (3.33%), and sour (40%). LAB-inoculated ground beef with
63
resin were characterized at 84 h as no off-odor (46.67%), rancid (10%), sweet
(13.33%), sour (26.67%), and acid (3.33%). A large portion of the LAB-
inoculated ground beef patties with resin were characterized as not having an off-
odor present as compared to the ground beef patties without resin where a
majority of the patties were either characterized as rancid or sour.
Consumer Color and Odor Panels
No significant differences were found between treatments for consumer
responses for lean color of ground beef and purchase intent based upon ground
beef patty color (Table 4.23). However, significant (P < 0.05) differences were
found throughout display (data not shown). At 0 and 12 h, consumers indicated
the meat in the packages looked fresh and they would purchase the ground beef
if it was available in the retail store. As the display period progressed, the meat
color significantly decreased and became less desirable. After 84 h, the
consumer responses indicated they may or may not purchase the ground beef
patties if available in a retail store.
Consumer panelist responses to questions concerning the freshness of
odor of the ground beef as well as the consumer’s likelihood for consumption did
not significantly differ between treatments (Table 4.23). The freshness of odor of
the ground beef significantly (P < 0.05) increased over time which indicates that
the patties did not smell as fresh after 84 h of display as compared to 0 h (data
not shown). Based on the odor of the ground beef, consumers were asked to
64
indicate the likelihood they would consume the ground beef. The scores
significantly increased (P < 0.05) throughout the display period (data not shown).
After 84 h hours, the consumers indicated they may or may not consume the
ground beef.
Hunter L* a* b* Values
Hunter L*, a*, and b* values did not significantly differ between treatment
groups (Table 4.24). However, significant (P < 0.05) decreases in values did
occur throughout display (data not shown). L* values decreased significantly at
24 h and 72 h as compared to 0 h. Hunter a* values also decreased significantly
at each sampling interval. Hunter b* values decreased significantly at 24 h, 48 h,
and 72 h when compared to 0 h. The decrease in scores indicates that the color
of the meat transitioned from bright cherry red toward brown during display.
These results agree with the trained and consumer panelists responses.
However, since there were no differences between treatments for either panelist
responses and Hunter L*, a*, and b* values, the spoilage of color indicator was
not masked by the addition of lactic acid bacteria in the presence or absence of
added rosemary oleoresin.
Thiobarbituric Acid Assays
Significant (P < 0.05) differences did occur between treatments for TBA
values (Table 4.25). Treatment groups with resin had significantly (P < 0.05)
65
lower values than those treatment groups without resin despite the addition of
lactic acid bacteria. Significant increases did occur in TBA values throughout the
display period at time 48 and 84 h as compared to time 0 (data not shown). The
differences over time were expected because lipid oxidation occurs naturally as
the meat is exposed to oxygen and light. In addition, rosemary oleoresin has
been previously noted as a natural antioxidant. Therefore, lipid oxidation would
be slowed with the addition of rosemary to ground beef.
Modified Atmosphere Packaging Displayed at Abusive Temperature
Ground beef patties from each treatment group: (1) uninoculated without
added oleoresin; (2) uninoculated with added oleoresin; (3) LAB inoculated
without added oleoresin; and (4) LAB inoculated with added oleoresin were
packaged in an 80% O2 and 20% CO2 atmosphere then displayed at 0°C for up
to 84 h.
Microbial Populations
Microbial results can be seen in Tables 4.26 and 4.27. Total aerobic plate
counts for uninoculated ground beef patties with and without added rosemary
oleoresin were significantly (P < 0.05) lower than LAB-inoculated ground beef
patties with or without added rosemary oleoresin (Table 4.26). This was
expected because the lactic acid bacteria was added at an inoculation level of
66
109 cfu/g of meat. Additionally, significant (P < 0.05) increases in aerobic
microbial counts occurred at 24 and 36 h as compared to 0 h (data not shown).
A significant (P < 0.05) interaction occurred between treatment and time
for lactic acid bacteria populations of ground beef patties (Table 4.27). Lactic
acid bacteria counts for uninoculated ground beef patties without rosemary
oleoresin increased significantly (P < 0.05) at 12 and 24 h. Uninoculated ground
beef patties with rosemary oleoresin lactic acid bacteria populations also
increased significantly (P < 0.05) throughout display at 36 h as compared to 0 h.
In addition, a significant (P < 0.05) increase occurred between 12 h and 24 h for
uninoculated ground beef with resin. When LAB was added to ground beef in the
presence or absence of resin, lactic acid bacteria populations did not increase
significantly throughout display. Therefore, because the population remained
statistically consistent, LAB growth cannot be a contributor to changes in normal
spoilage characteristics such as odor and color changes. At each sampling
interval, LAB-inoculated ground beef patties had significantly (P < 0.05) higher
populations of lactic acid bacteria than uninoculated ground beef patties despite
the addition of resin. This is not of concern because those samples with the
higher LAB populations had been previously inoculated with the bacteria isolated
on MRS.
Yeast and mold populations were not significantly different between
treatment groups (Table 4.26). However, a significant (P < 0.05) increase in
populations did occur at 24 h as compared to 0 h (data not shown).
67
No significant differences were found between treatment groups for
populations of B. thermosphacta (Table 4.26). The populations were significantly
(P < 0.05) higher at 12, 24, and 36 h as compared to time 0 (data not shown).
Coliform counts increased significantly (P < 0.05) throughout display (data
not shown). At 24 and 36 h, more coliforms were isolated as compared to 0 h.
However, no significant differences were found between any treatment groups
(Table 4.26)
Fluorescin producing pseudomonads were isolated on Pseudomonas F
agar. The populations of these microorganisms were not significantly different
between treatments (Table 4.26) and no significant differences occurred
throughout the display period (data not shown).
Trained Color and Odor Panels
Trained panelists analyzed lean color and no significant differences were
found in responses for this trait between treatments (Table 4.28). However, over
time, a significant (P < 0.05) increase was observed at each sampling interval
(data not shown). Panelist responses ranged from very bright cherry red at time
0 to slightly dark red or brown after 36 h. When evaluating color, percent
discoloration was also analyzed. No significant differences were found between
treatments for panelist responses for percent discoloration (Table 4.28). After 36
h of display, panelist responses were significantly (P < 0.05) higher as compared
68
to the other sampling intervals (data not shown). Slight discoloration (1-10%) of
ground beef patties was observed at 36 h.
Odor of ground beef patties was also analyzed by trained panelists
throughout display and a significant interaction occurred between treatment and
time (Table 4.29). For uninoculated ground beef patties without added oleoresin,
significant (P < 0.05) increases in response scores occurred at each sampling
interval. The scores ranged from no off-odor present at time 0 to slight off-odor
present after 36 h of display. A significant (P < 0.05) increase in panelist
response scores occurred at 24 h for uninoculated ground beef patties with
added resin, while significant (P < 0.05) increases in response scores for LAB-
inoculated ground beef patties without resin were observed at 12 and 24 h.
Ground beef patties with added rosemary resin had significantly (P < 0.05)
panelist response scores after 24 h as compared to time 0. The scores for all
treatments ranged from no off-odor to slight off-odor during display.
At time 0, panelist scores for immediate off-odor were not significantly
different for treatments applied to the ground beef. After 24 h of display,
uninoculated and inoculated ground beef patties with added rosemary oleoresin
had significantly (P < 0.05) lower scores than the uninoculated and LAB-
inoculated ground beef without added resin. This trend continued throughout the
remainder of the display period. Rosemary oleoresin slows lipid oxidation, which
produces unpleasant odors. Therefore, the treatment groups with added
69
oleoresin would be expected to have lower immediate off-odor scores as
compared to the treatment groups without added oleoresin.
In addition to measuring the immediate off-odor present, the trained
panelists were asked to characterize the off-odor (Tables 4.30 – 4.33). At time 0,
100% of the uninoculated ground beef patties without resin were characterized
as having no off-odor. After 12 h of display, panelists characterized most of the
patties as rancid (14%), sour (16%), and having no off-odor (58%). As display
progressed, the percent of uninoculated ground beef patties without resin
characterized as rancid and sour increased to 22.73% and 43.18%, respectively
after 36 h. One hundred percent of the uninoculated ground beef patties with
added resin were characterized as having no off-odor at 0 h. After 12 h, 80% of
the patties were characterized as having no off-odor, while after 36 h, 63.64%
were characterized as having no off-odor, 13.64% were rancid, and 13.64% were
sweet. When compared to uninoculated ground beef patties without resin, a
larger percentage of those patties with added resin had no off-odor. Therefore,
the addition of rosemary oleoresin slowed lipid oxidation and the production of
unacceptable off-odors.
LAB-inoculated ground beef patties without added rosemary oleoresin
were classified as having no off-odor at time 0. Throughout display, as the odors
became more prominent, the characterizations differed. After 36 h, only 29.55%
of the patties were classified as having no off-odor, 15.91% of the patties were
considered rancid by the panelists, while 36.36% of the patties were considered
70
sour. Initially, all of the LAB-inoculated ground beef patties with added rosemary
oleoresin were also classified as having no off-odor. After 36 h, only 56.82% of
the patties were characterized as not having an off-odor, while 11.36% were
characterized as rancid, 11.36% were sweet, and 18.18% of the patties were
sour. As compared to the LAB-inoculated ground beef patties without added
rosemary oleoresin, a larger percentage of the LAB-inoculated ground beef
patties with rosemary oleoresin were characterized as not having an off-odor at
the end of the display period. This indicated that the addition of the oleoresin
slowed the on-set of undesirable odors through the inhibition of lipid oxidation.
Consumer Color and Odor Panels
Significant (P < 0.05) differences were found between treatments in
consumer panelist response scores for lean ground beef color (Table 4.34).
LAB-inoculated ground beef without added oleoresin had significantly (P < 0.05)
higher scores than the treatment groups with added oleoresin. Over time, the
scores increased significantly (P < 0.05; data not shown). At time 0, the scores
were significantly (P < 0.05) lower than the scores after 24 and 36 h of display.
Based on the responses for the lean ground beef color, the consumers indicated
how likely they were to purchase the package of ground beef if it had been
available in the retail stores. The consumer scores were not significantly
different between treatments (Table 4.34). However, over time, the consumers
71
were significantly (P < 0.05) less likely to purchase the ground beef patties (data
not shown).
Significant (P < 0.05) differences between treatments were also found in
consumer panelists responses for odor freshness (Table 4.34). The treatment
groups with added oleoresin had significantly (P < 0.05) lower scores than the
uninoculated ground beef patties without added resin. However, response
scores for the LAB-inoculated treatment groups were not significantly different.
Over time, the scores for freshness of odor significantly (P < 0.05) increased after
24 and 36 h of display (data not shown). As the display period progressed,
consumers found the odor to less fresh than at the initial sampling interval. No
significant differences were found between treatments in response scores for the
likelihood of consumption based on the odor of the meat (Table 4.34). However,
scores significantly (P < 0.05) increased as the display period progressed (data
not shown). At each sampling interval, the scores were significantly (P < 0.05)
higher when compared to time 0 as well as the previous sampling interval.
Consumers were less likely to consume the product after 36 h of display.
Hunter L*a*b* values
Hunter L*, a*, and b* values were taken at each sampling interval. No
significant differences were found in L* values for any treatment group displayed
at abusive temperatures (Table 4.35). However, the L* values decreased
significantly (P < 0.05) after 12 and 24 h as compared to 0 h (data not shown).
72
Significant (P < 0.05) differences were observed in a* values between
treatments. The treatment groups with added oleoresin had significantly (P <
0.05) higher values than the uninoculated ground beef patties without added
resin. This indicated that the addition of rosemary oleoresin slows lipid oxidation
and the conversion of oxymyglobin to metmyglobin. No significant differences
were found between LAB-inoculated treatment groups. Over time, a* values
significantly (P < 0.05) decreased during display as expected due to the
continued exposure to oxygen and light (data not shown). Significant (P < 0.05)
differences were also found in b* values between treatments. The uninoculated
ground beef patties without resin had significantly (P < 0.05) lower scores than
the treatment groups with added resin. However, the LAB-inoculated ground
beef patties with and without added rosemary oleoresin did not differ significantly.
By adding rosemary oleoresin, the deterioration of ground beef color was slowed.
Hunter b* scores also significantly (P < 0.05) decreased at each sampling interval
(data not shown).
Thiobarbituric Acid (TBA) Assays
A significant (P < 0.05) interaction occurred between treatment and time
for TBA values (Table 4.36). TBA values for uninoculated ground beef patties
without rosemary oleoresin significantly (P < 0.05) increased after 12 and 24 h of
display. No significant differences were found in TBA values for uninoculated
ground beef with added oleoresin. LAB-inoculated ground beef patties without
73
rosemary oleoresin TBA values significantly (P < 0.05) increased during display.
After 12 and 24 h of display, the TBA values were significantly (P < 0.05) higher
when compared to time 0. No significant differences were found in TBA values
for LAB-inoculated ground beef patties with added resin during display.
Initially, TBA values did not significantly differ between treatments. After
12 h of display, the treatment groups with added oleoresin had significantly (P <
0.05) lower TBA values than the treatment groups without resin. Additionally, the
TBA values for LAB-inoculated ground beef patties without oleoresin were
significantly (P < 0.05) lower than the TBA values for uninoculated ground beef
patties without oleoresin. However, that observation was short-lived. The
treatment groups without added oleoresin had significantly (P < 0.05) higher TBA
values than those treatment groups with added resin after 24 and 36 h of display.
These results indicate that the addition of rosemary oleoresin slowed lipid
oxidation as the display period progressed despite the addition of LAB.
74
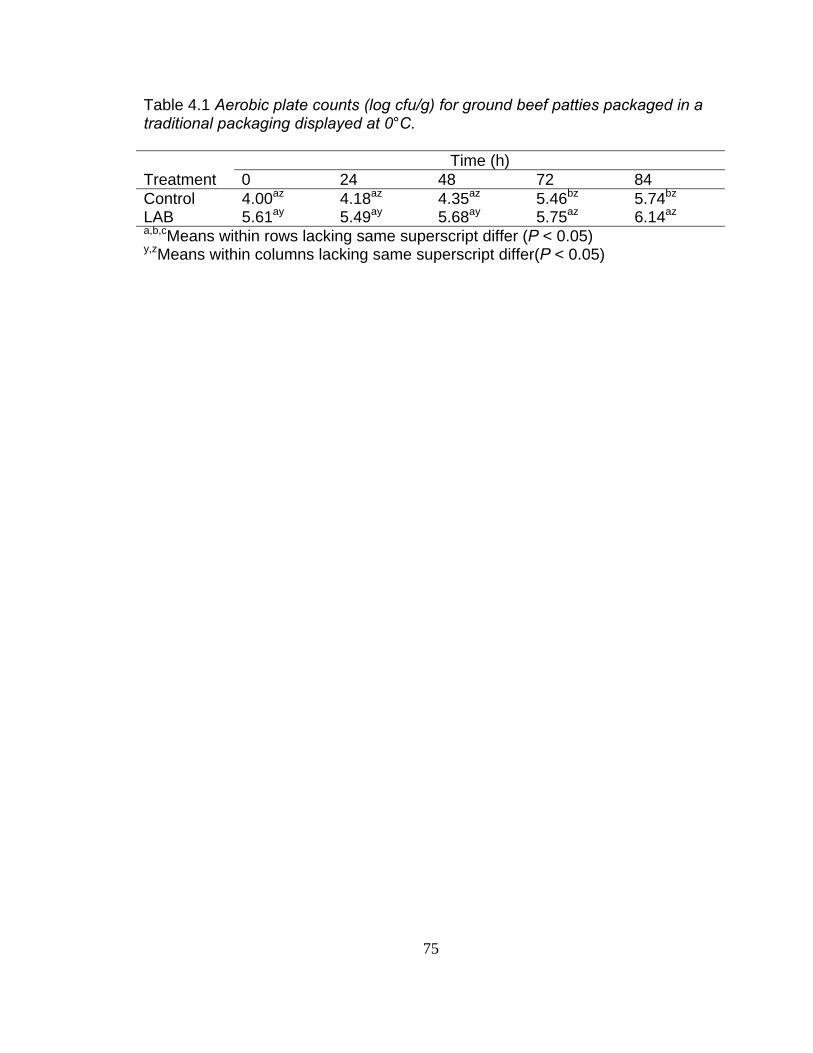
Table 4.1 Aerobic plate counts (log cfu/g) for ground beef patties packaged in a traditional packaging displayed at 0°C.
Time (h) Treatment 0 24 48 72 84 Control 4.00az 4.18az 4.35az 5.46bz 5.74bz
LAB 5.61ay 5.49ay 5.68ay 5.75az 6.14az
a,b,cMeans within rows lacking same superscript differ (P < 0.05) y,zMeans within columns lacking same superscript differ(P < 0.05)
75
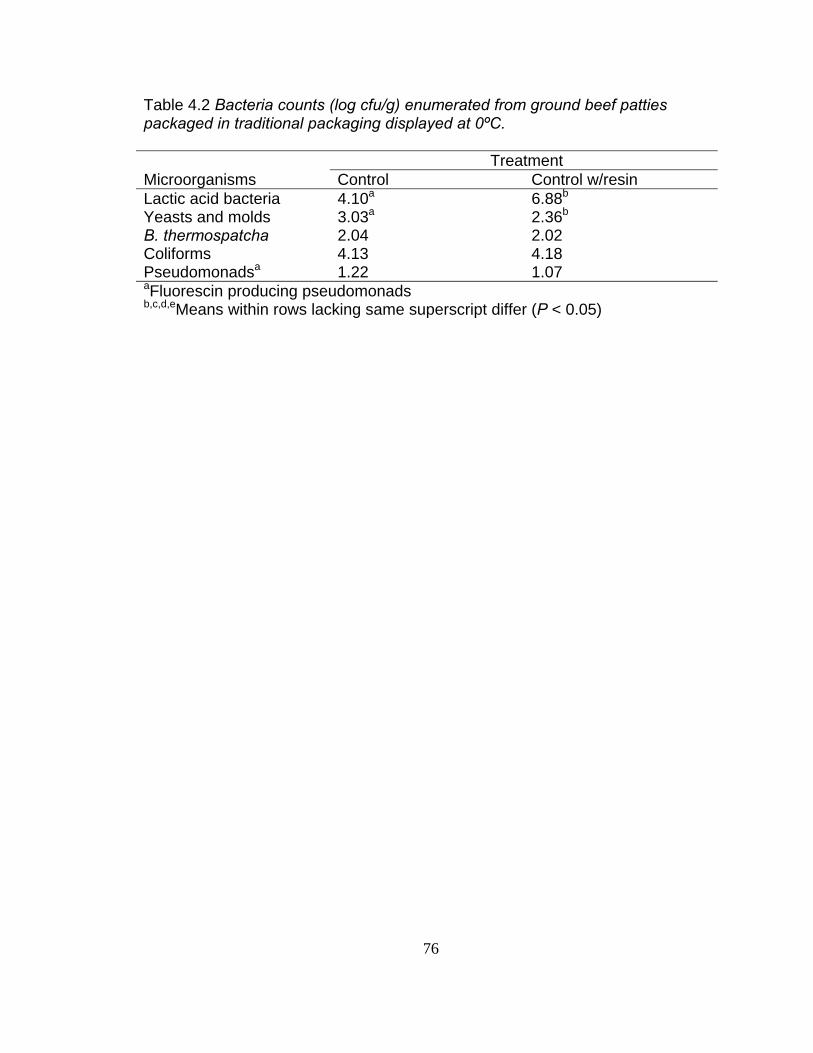
Table 4.2 Bacteria counts (log cfu/g) enumerated from ground beef patties packaged in traditional packaging displayed at 0ºC. Treatment Microorganisms Control Control w/resin Lactic acid bacteria 4.10a 6.88b
Yeasts and molds 3.03a 2.36b
B. thermospatcha 2.04 2.02 Coliforms 4.13 4.18 Pseudomonadsa 1.22 1.07 aFluorescin producing pseudomonads b,c,d,eMeans within rows lacking same superscript differ (P < 0.05)
76
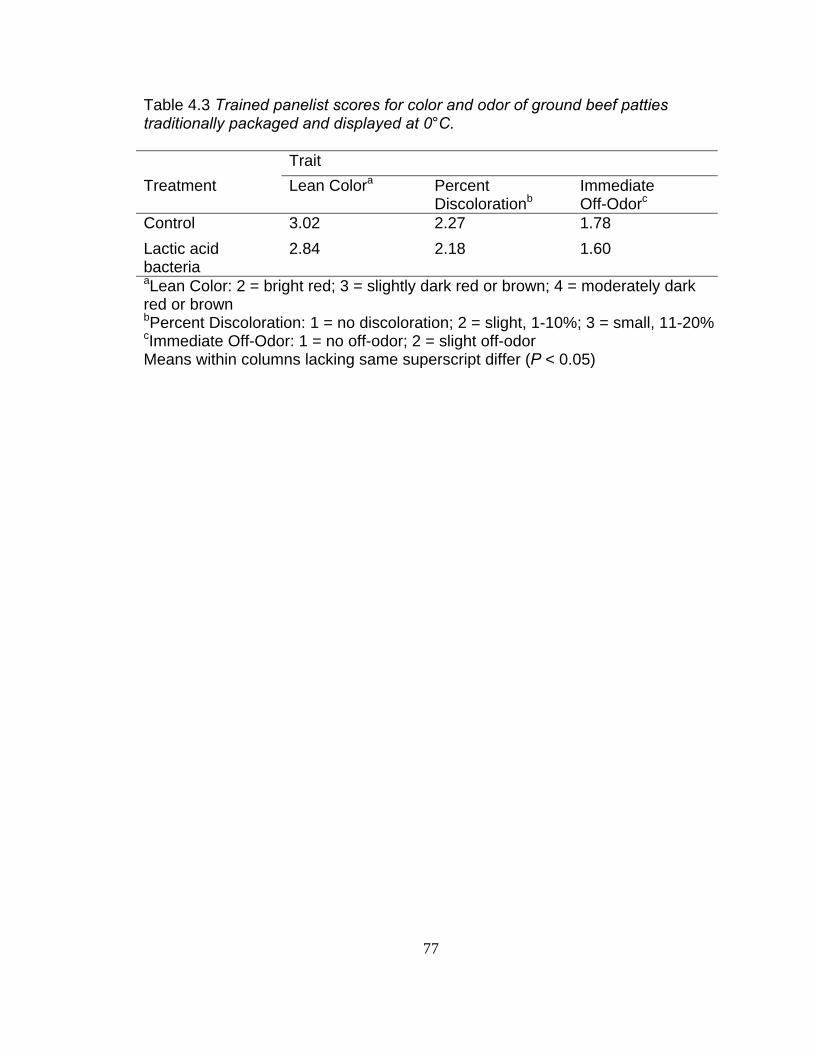
Table 4.3 Trained panelist scores for color and odor of ground beef patties traditionally packaged and displayed at 0°C. Trait Treatment Lean Colora Percent
DiscolorationbImmediate Off-Odorc
Control 3.02 2.27 1.78 Lactic acid bacteria
2.84 2.18 1.60
aLean Color: 2 = bright red; 3 = slightly dark red or brown; 4 = moderately dark red or brown bPercent Discoloration: 1 = no discoloration; 2 = slight, 1-10%; 3 = small, 11-20% cImmediate Off-Odor: 1 = no off-odor; 2 = slight off-odor Means within columns lacking same superscript differ (P < 0.05)
77
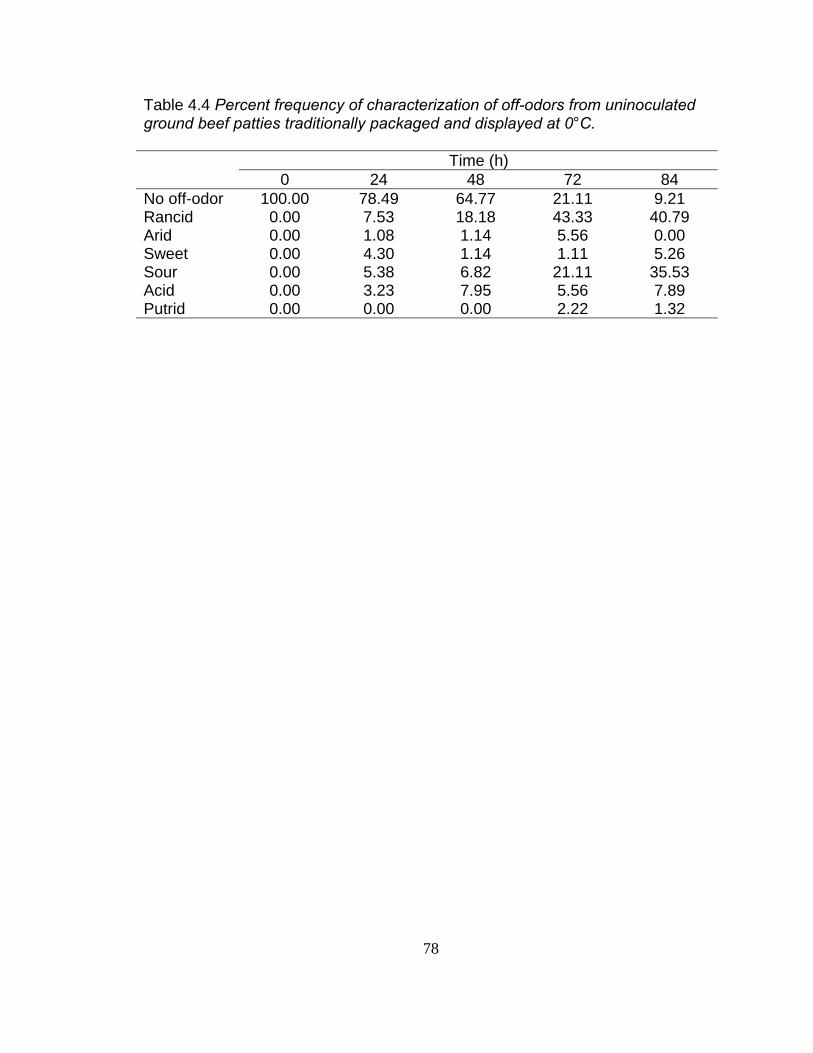
Table 4.4 Percent frequency of characterization of off-odors from uninoculated ground beef patties traditionally packaged and displayed at 0°C. Time (h) 0 24 48 72 84 No off-odor 100.00 78.49 64.77 21.11 9.21 Rancid 0.00 7.53 18.18 43.33 40.79 Arid 0.00 1.08 1.14 5.56 0.00 Sweet 0.00 4.30 1.14 1.11 5.26 Sour 0.00 5.38 6.82 21.11 35.53 Acid 0.00 3.23 7.95 5.56 7.89 Putrid 0.00 0.00 0.00 2.22 1.32
78
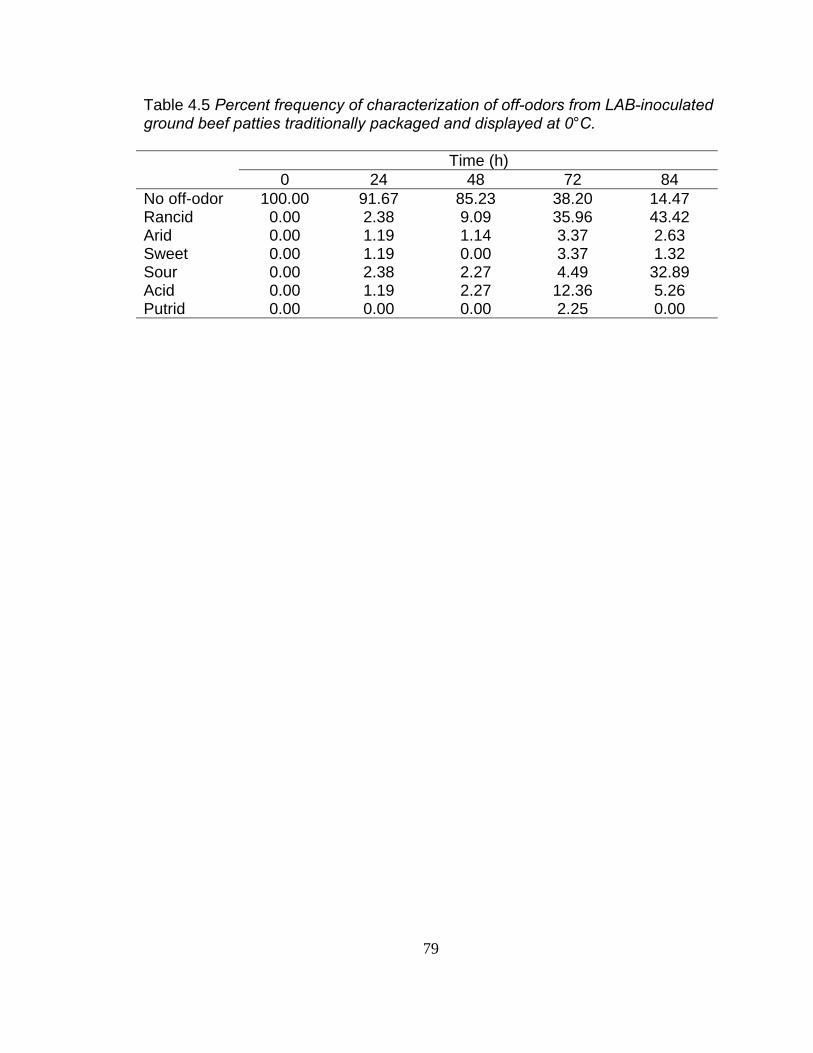
Table 4.5 Percent frequency of characterization of off-odors from LAB-inoculated ground beef patties traditionally packaged and displayed at 0°C. Time (h) 0 24 48 72 84 No off-odor 100.00 91.67 85.23 38.20 14.47 Rancid 0.00 2.38 9.09 35.96 43.42 Arid 0.00 1.19 1.14 3.37 2.63 Sweet 0.00 1.19 0.00 3.37 1.32 Sour 0.00 2.38 2.27 4.49 32.89 Acid 0.00 1.19 2.27 12.36 5.26 Putrid 0.00 0.00 0.00 2.25 0.00
79
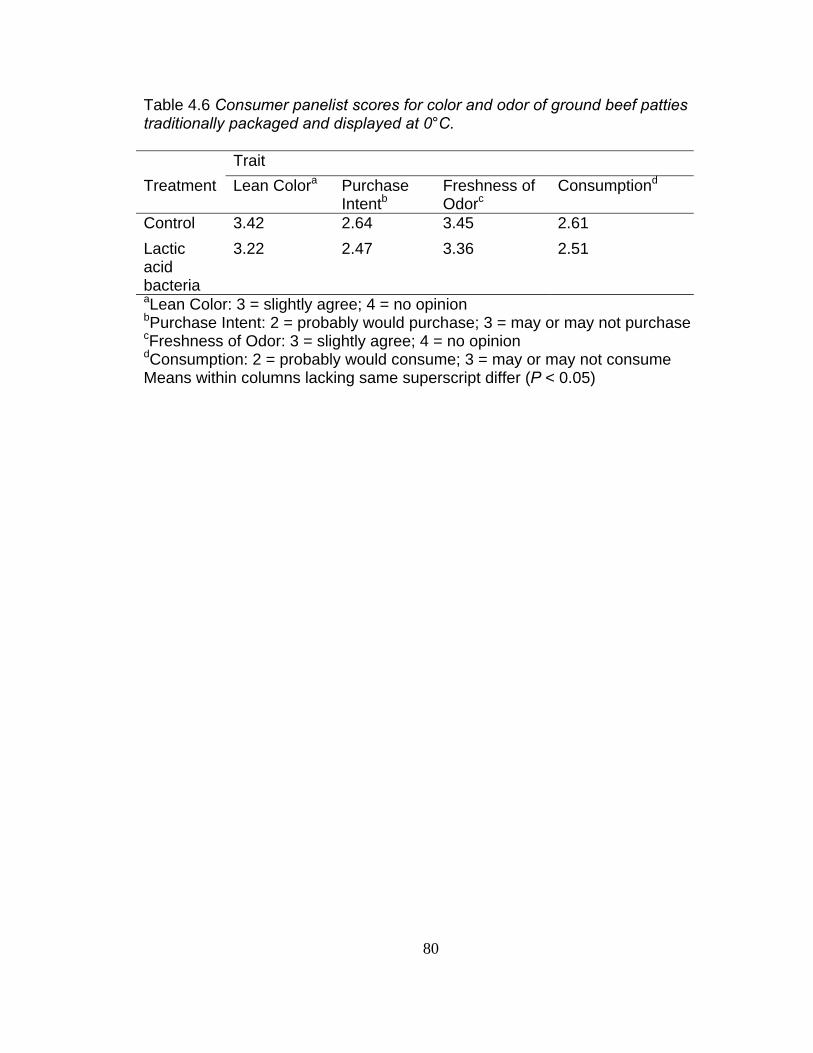
Table 4.6 Consumer panelist scores for color and odor of ground beef patties traditionally packaged and displayed at 0°C. Trait Treatment Lean Colora Purchase
IntentbFreshness of Odorc
Consumptiond
Control 3.42 2.64 3.45 2.61 Lactic acid bacteria
3.22 2.47 3.36 2.51
aLean Color: 3 = slightly agree; 4 = no opinion bPurchase Intent: 2 = probably would purchase; 3 = may or may not purchase cFreshness of Odor: 3 = slightly agree; 4 = no opinion dConsumption: 2 = probably would consume; 3 = may or may not consume Means within columns lacking same superscript differ (P < 0.05)
80
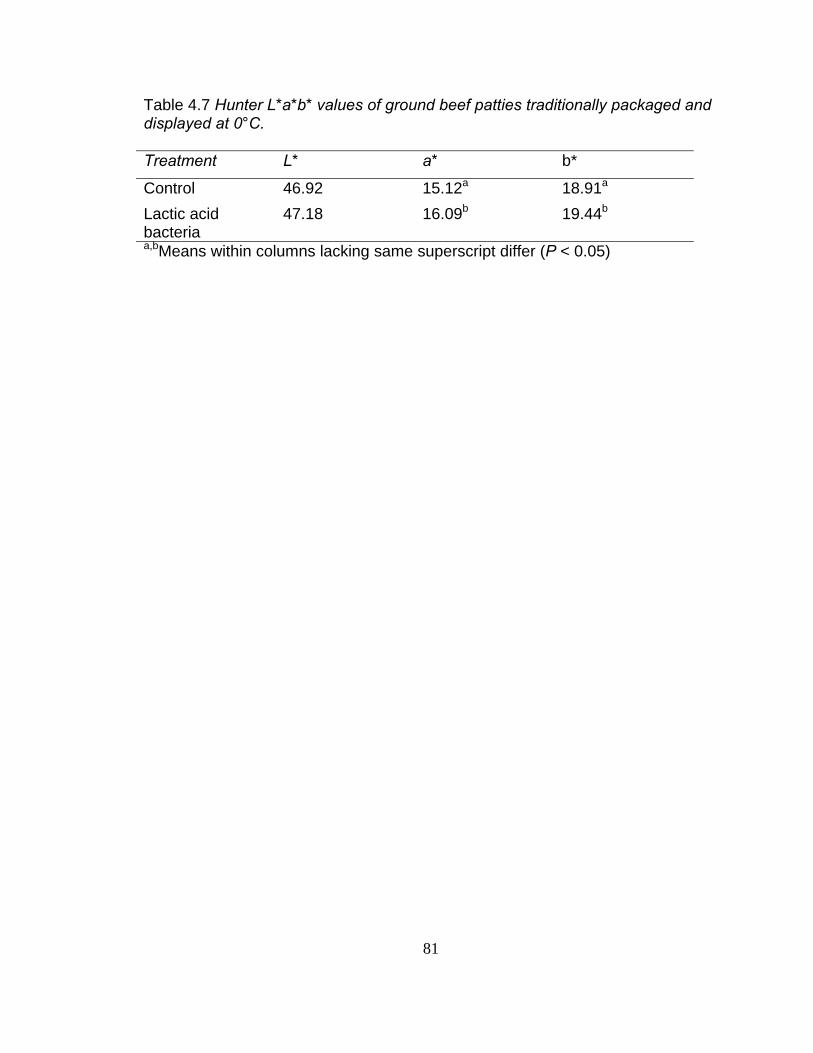
Table 4.7 Hunter L*a*b* values of ground beef patties traditionally packaged and displayed at 0°C. Treatment L* a* b*
Control 46.92 15.12a 18.91a
Lactic acid bacteria
47.18 16.09b 19.44b
a,bMeans within columns lacking same superscript differ (P < 0.05)
81
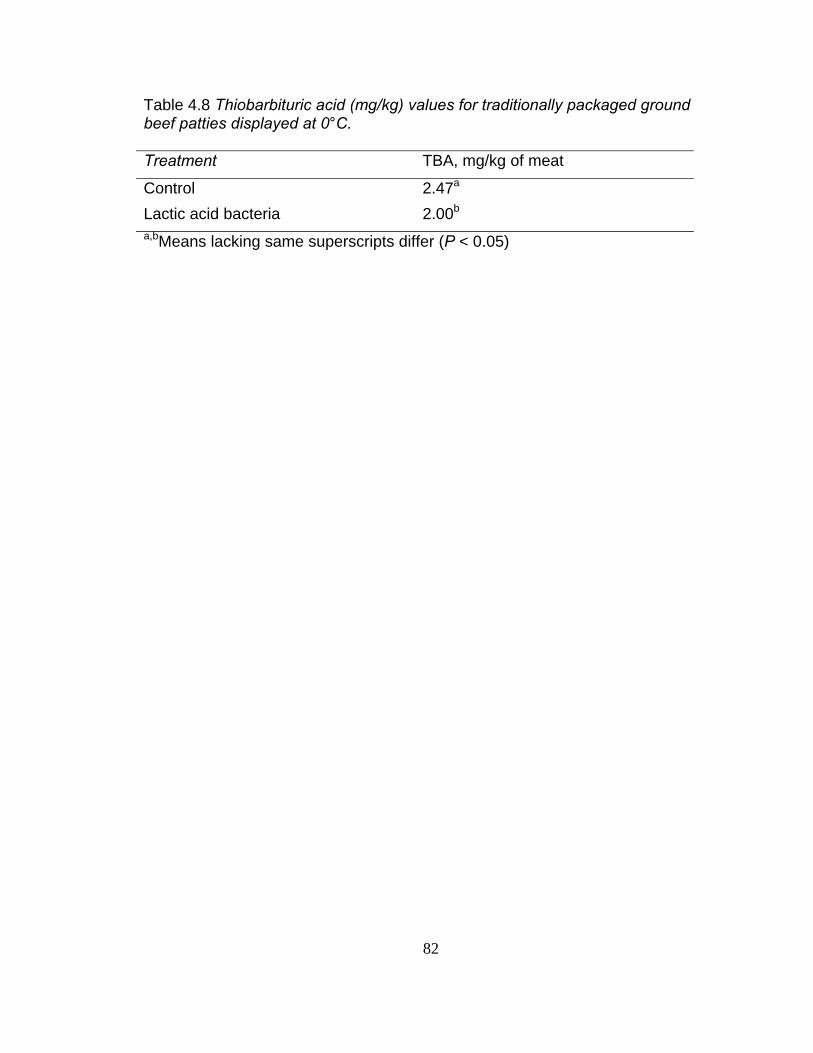
Table 4.8 Thiobarbituric acid (mg/kg) values for traditionally packaged ground beef patties displayed at 0°C. Treatment TBA, mg/kg of meat
Control 2.47a
Lactic acid bacteria 2.00b
a,bMeans lacking same superscripts differ (P < 0.05)
82
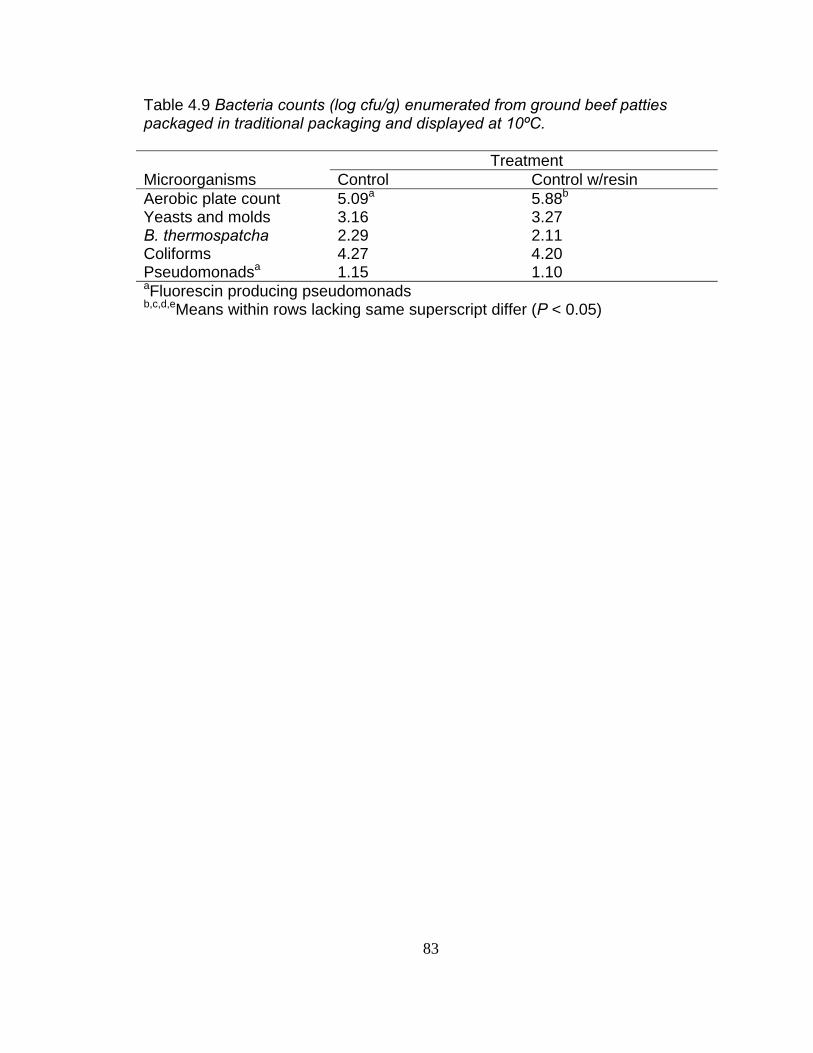
Table 4.9 Bacteria counts (log cfu/g) enumerated from ground beef patties packaged in traditional packaging and displayed at 10ºC. Treatment Microorganisms Control Control w/resin Aerobic plate count 5.09a 5.88b
Yeasts and molds 3.16 3.27 B. thermospatcha 2.29 2.11 Coliforms 4.27 4.20 Pseudomonadsa 1.15 1.10 aFluorescin producing pseudomonads b,c,d,eMeans within rows lacking same superscript differ (P < 0.05)
83
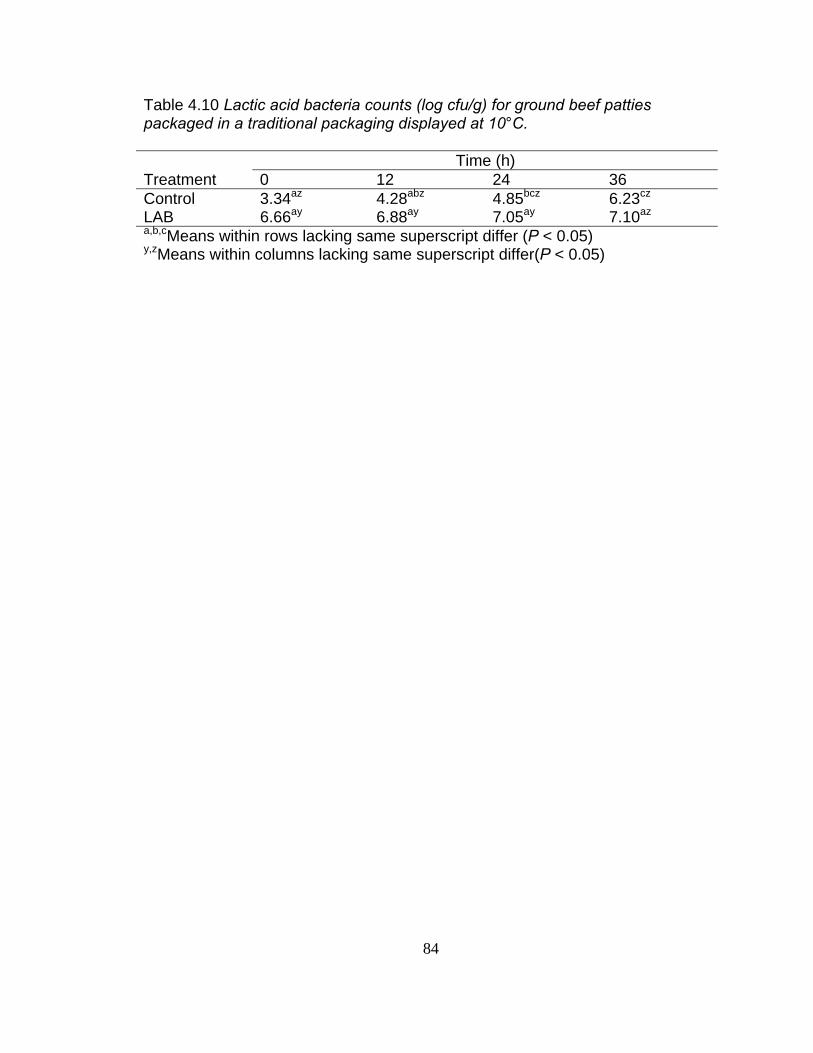
Table 4.10 Lactic acid bacteria counts (log cfu/g) for ground beef patties packaged in a traditional packaging displayed at 10°C.
Time (h) Treatment 0 12 24 36 Control 3.34az 4.28abz 4.85bcz 6.23cz
LAB 6.66ay 6.88ay 7.05ay 7.10az
a,b,cMeans within rows lacking same superscript differ (P < 0.05) y,zMeans within columns lacking same superscript differ(P < 0.05)
84
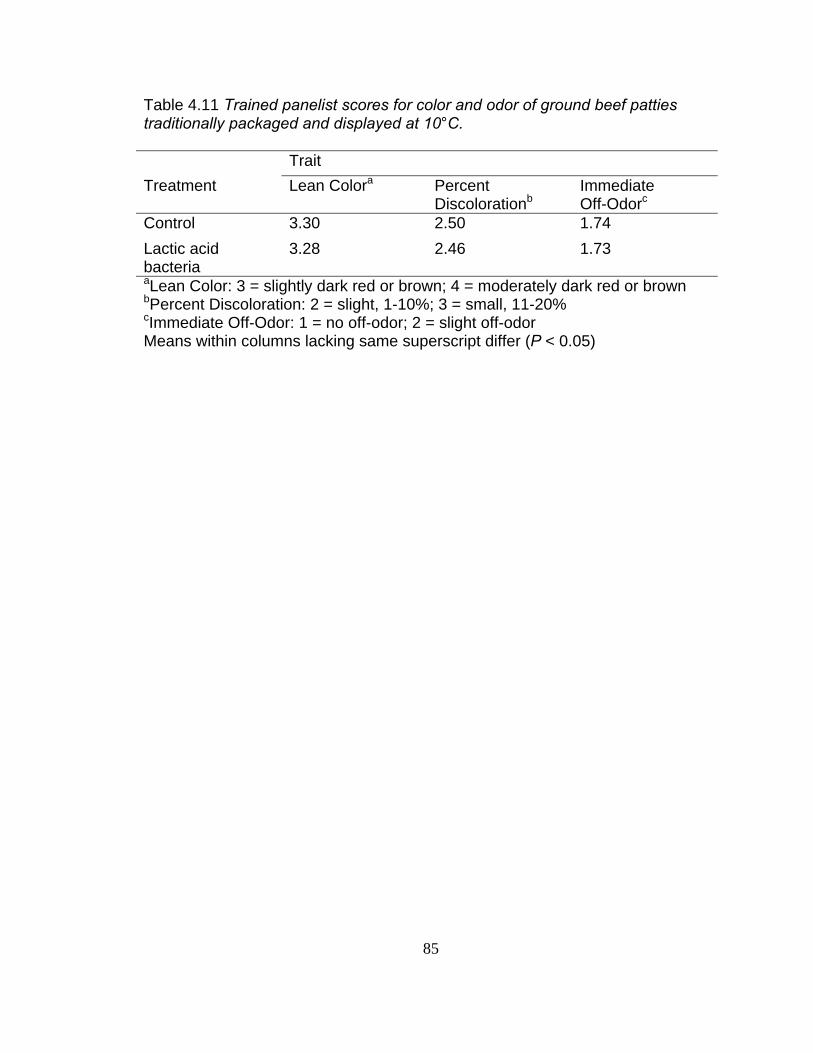
Table 4.11 Trained panelist scores for color and odor of ground beef patties traditionally packaged and displayed at 10°C. Trait Treatment Lean Colora Percent
DiscolorationbImmediate Off-Odorc
Control 3.30 2.50 1.74 Lactic acid bacteria
3.28 2.46 1.73
aLean Color: 3 = slightly dark red or brown; 4 = moderately dark red or brown bPercent Discoloration: 2 = slight, 1-10%; 3 = small, 11-20% cImmediate Off-Odor: 1 = no off-odor; 2 = slight off-odor Means within columns lacking same superscript differ (P < 0.05)
85
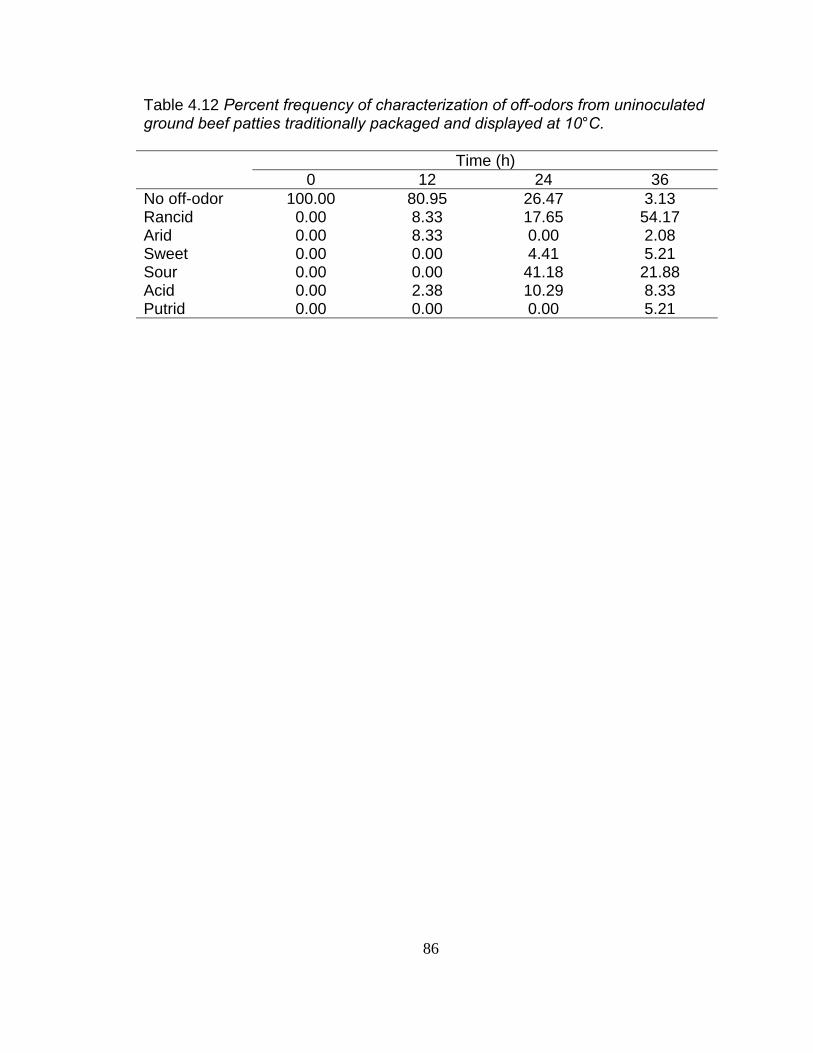
Table 4.12 Percent frequency of characterization of off-odors from uninoculated ground beef patties traditionally packaged and displayed at 10°C. Time (h) 0 12 24 36 No off-odor 100.00 80.95 26.47 3.13 Rancid 0.00 8.33 17.65 54.17 Arid 0.00 8.33 0.00 2.08 Sweet 0.00 0.00 4.41 5.21 Sour 0.00 0.00 41.18 21.88 Acid 0.00 2.38 10.29 8.33 Putrid 0.00 0.00 0.00 5.21
86
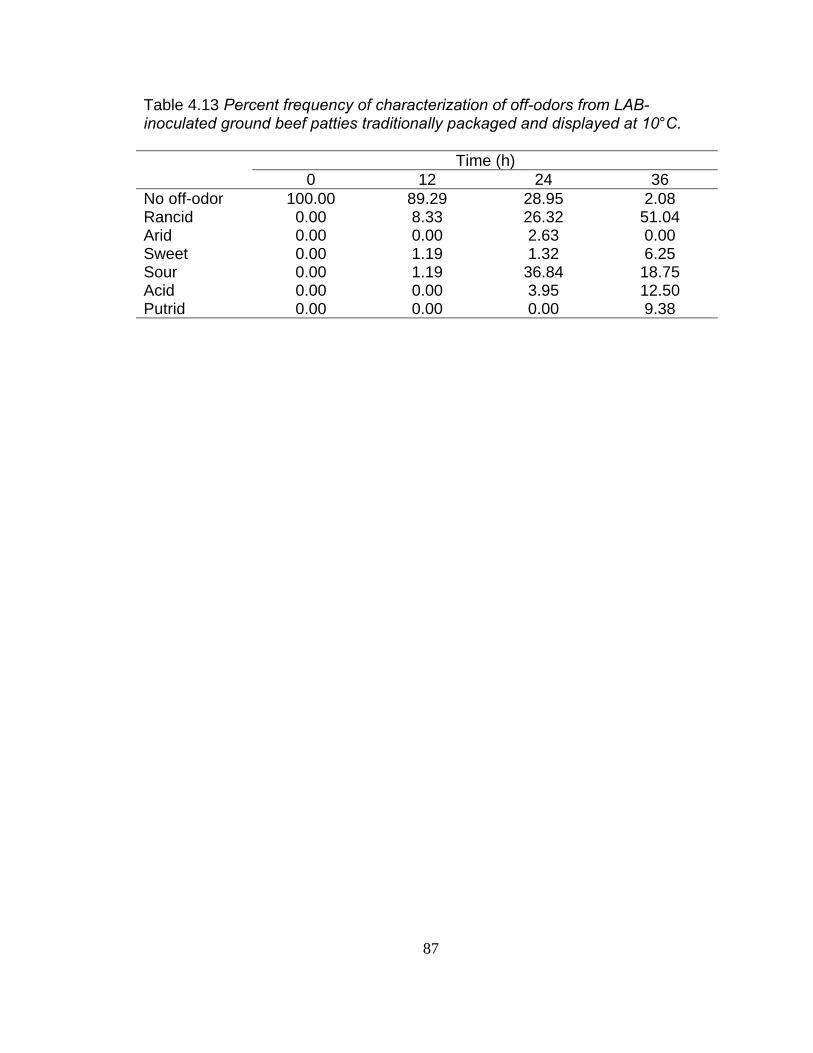
Table 4.13 Percent frequency of characterization of off-odors from LAB-inoculated ground beef patties traditionally packaged and displayed at 10°C. Time (h) 0 12 24 36 No off-odor 100.00 89.29 28.95 2.08 Rancid 0.00 8.33 26.32 51.04 Arid 0.00 0.00 2.63 0.00 Sweet 0.00 1.19 1.32 6.25 Sour 0.00 1.19 36.84 18.75 Acid 0.00 0.00 3.95 12.50 Putrid 0.00 0.00 0.00 9.38
87
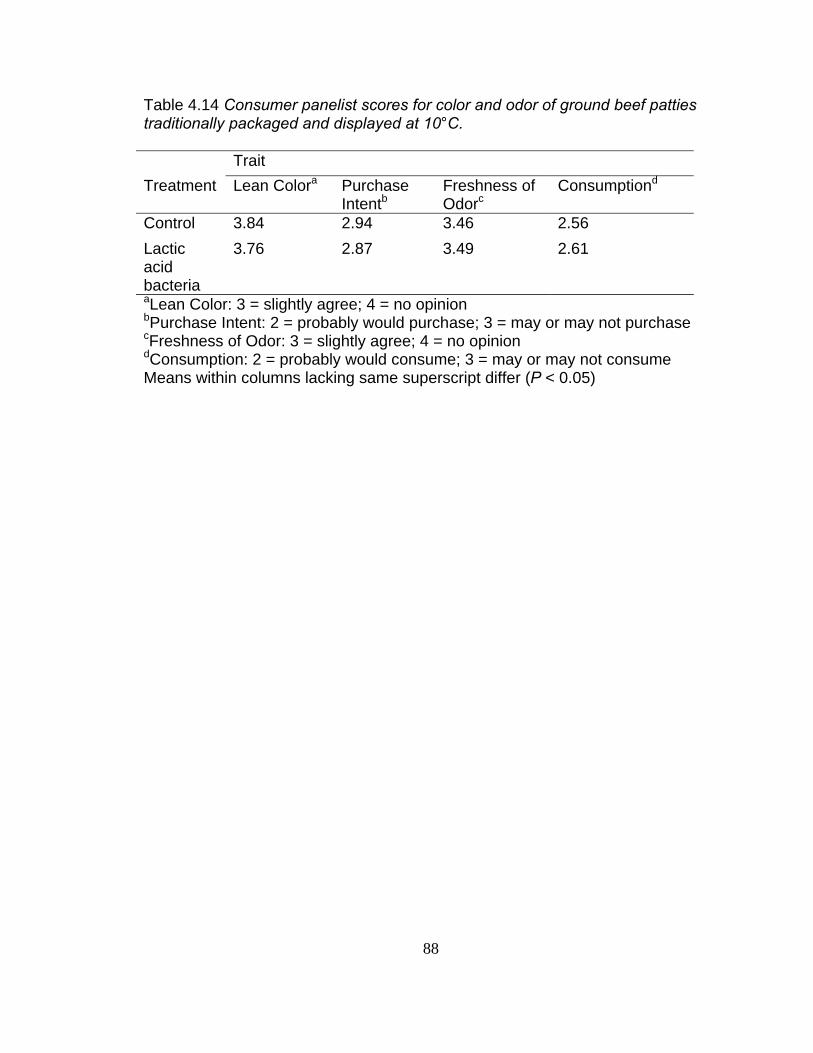
Table 4.14 Consumer panelist scores for color and odor of ground beef patties traditionally packaged and displayed at 10°C. Trait Treatment Lean Colora Purchase
IntentbFreshness of Odorc
Consumptiond
Control 3.84 2.94 3.46 2.56 Lactic acid bacteria
3.76 2.87 3.49 2.61
aLean Color: 3 = slightly agree; 4 = no opinion bPurchase Intent: 2 = probably would purchase; 3 = may or may not purchase cFreshness of Odor: 3 = slightly agree; 4 = no opinion dConsumption: 2 = probably would consume; 3 = may or may not consume Means within columns lacking same superscript differ (P < 0.05)
88
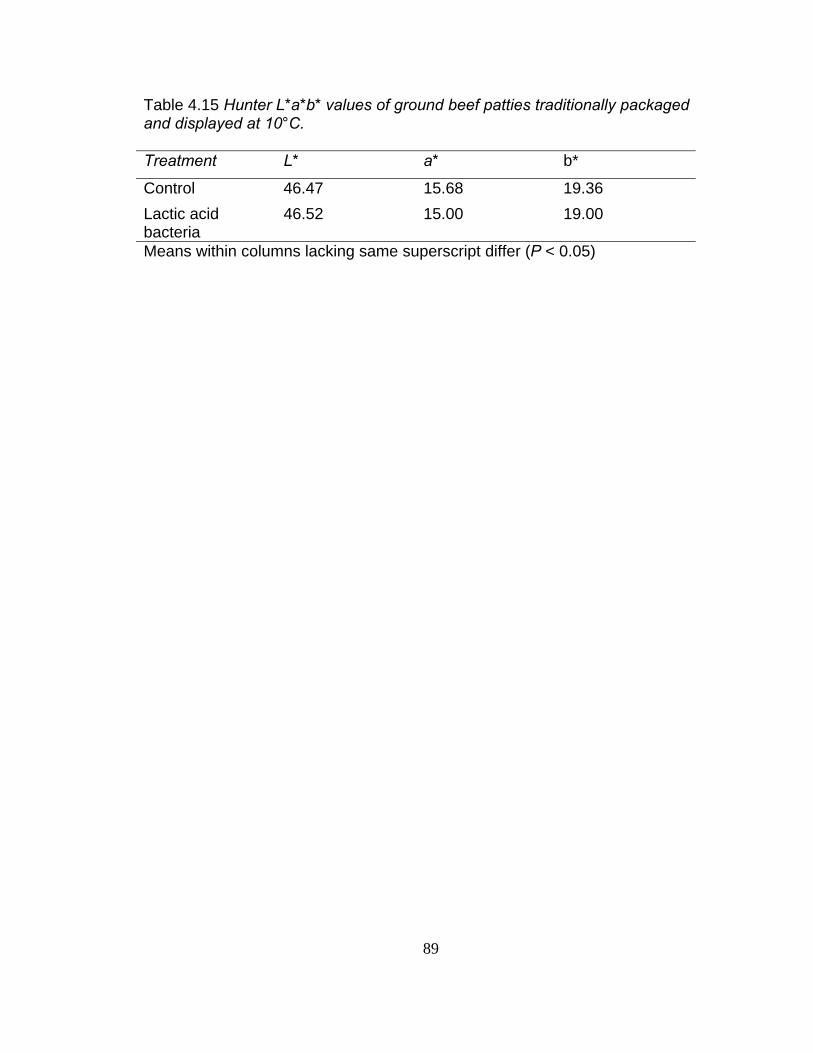
Table 4.15 Hunter L*a*b* values of ground beef patties traditionally packaged and displayed at 10°C. Treatment L* a* b*
Control 46.47 15.68 19.36 Lactic acid bacteria
46.52 15.00 19.00
Means within columns lacking same superscript differ (P < 0.05)
89

Table 4.16 Thiobarbituric acid (mg/kg) values for traditionally packaged ground beef patties displayed at 10°C. Treatment TBA, mg/kg meat
Control 2.54a
Lactic acid bacteria 2.24b
a,bMeans lacking same superscript differ (P < 0.05)
90
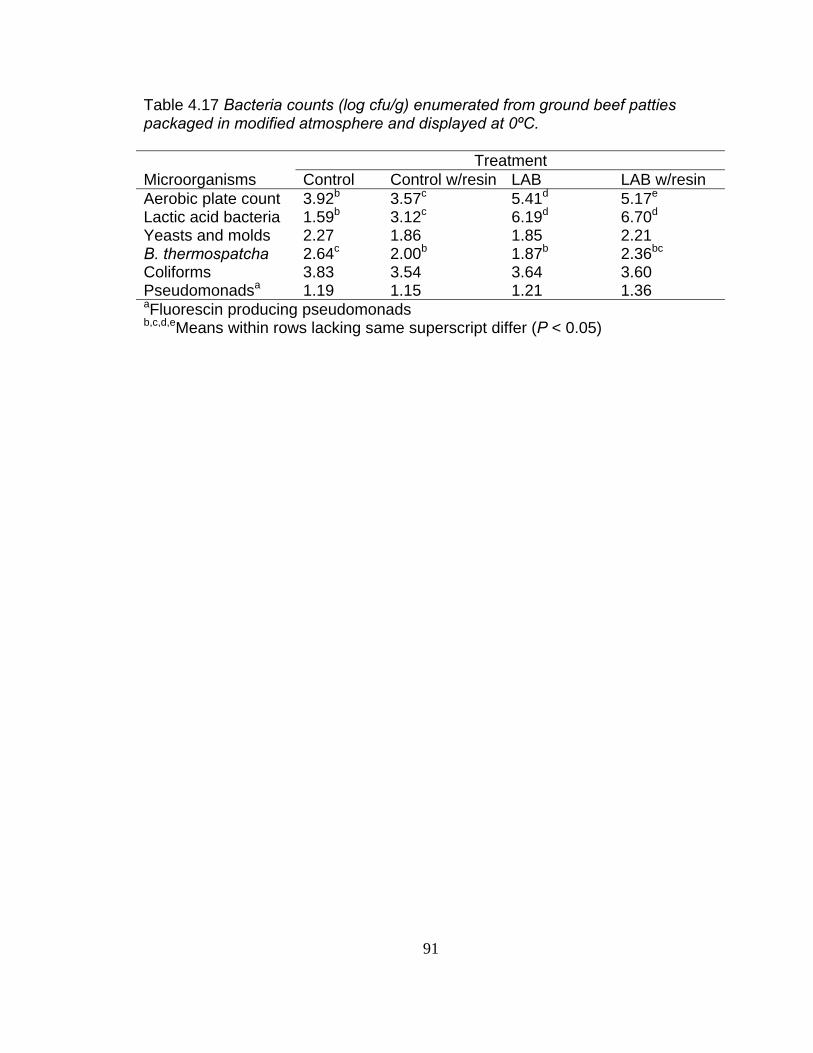
Table 4.17 Bacteria counts (log cfu/g) enumerated from ground beef patties packaged in modified atmosphere and displayed at 0ºC. Treatment Microorganisms Control Control w/resin LAB LAB w/resin Aerobic plate count 3.92b 3.57c 5.41d 5.17e
Lactic acid bacteria 1.59b 3.12c 6.19d 6.70d
Yeasts and molds 2.27 1.86 1.85 2.21 B. thermospatcha 2.64c 2.00b 1.87b 2.36bc
Coliforms 3.83 3.54 3.64 3.60 Pseudomonadsa 1.19 1.15 1.21 1.36 aFluorescin producing pseudomonads b,c,d,eMeans within rows lacking same superscript differ (P < 0.05)
91
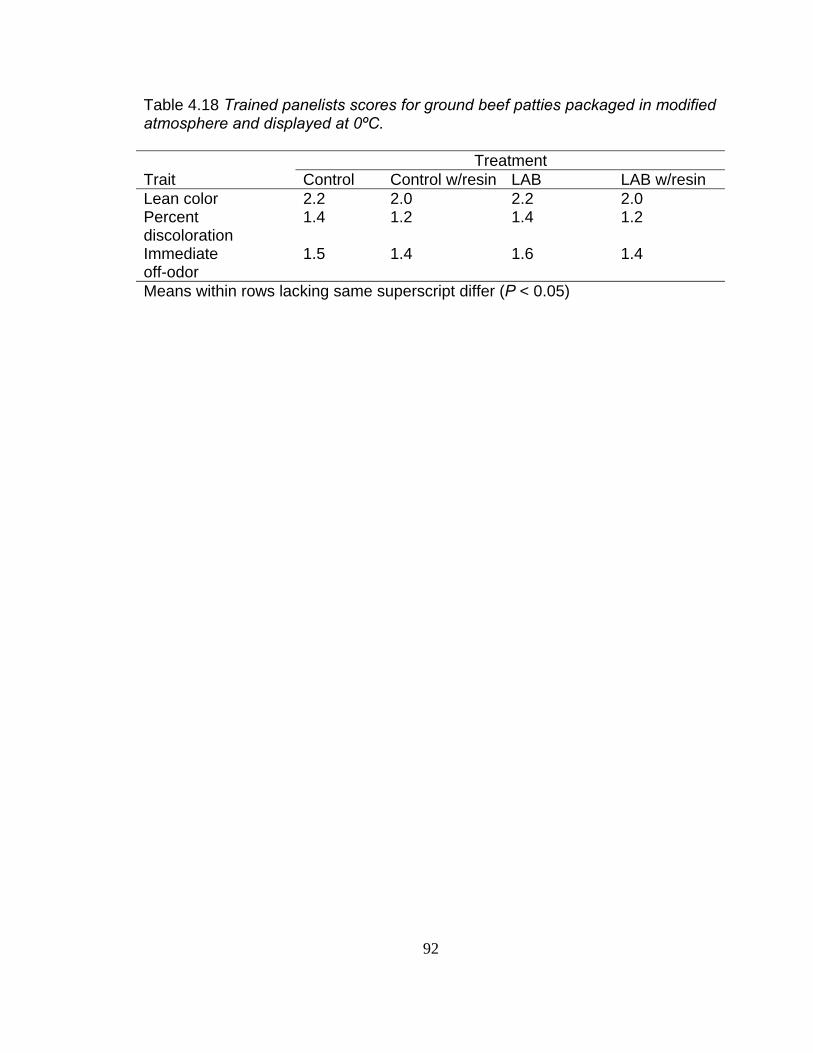
Table 4.18 Trained panelists scores for ground beef patties packaged in modified atmosphere and displayed at 0ºC. Treatment Trait Control Control w/resin LAB LAB w/resin Lean color 2.2 2.0 2.2 2.0 Percent discoloration
1.4 1.2 1.4 1.2
Immediate off-odor
1.5 1.4 1.6 1.4
Means within rows lacking same superscript differ (P < 0.05)
92
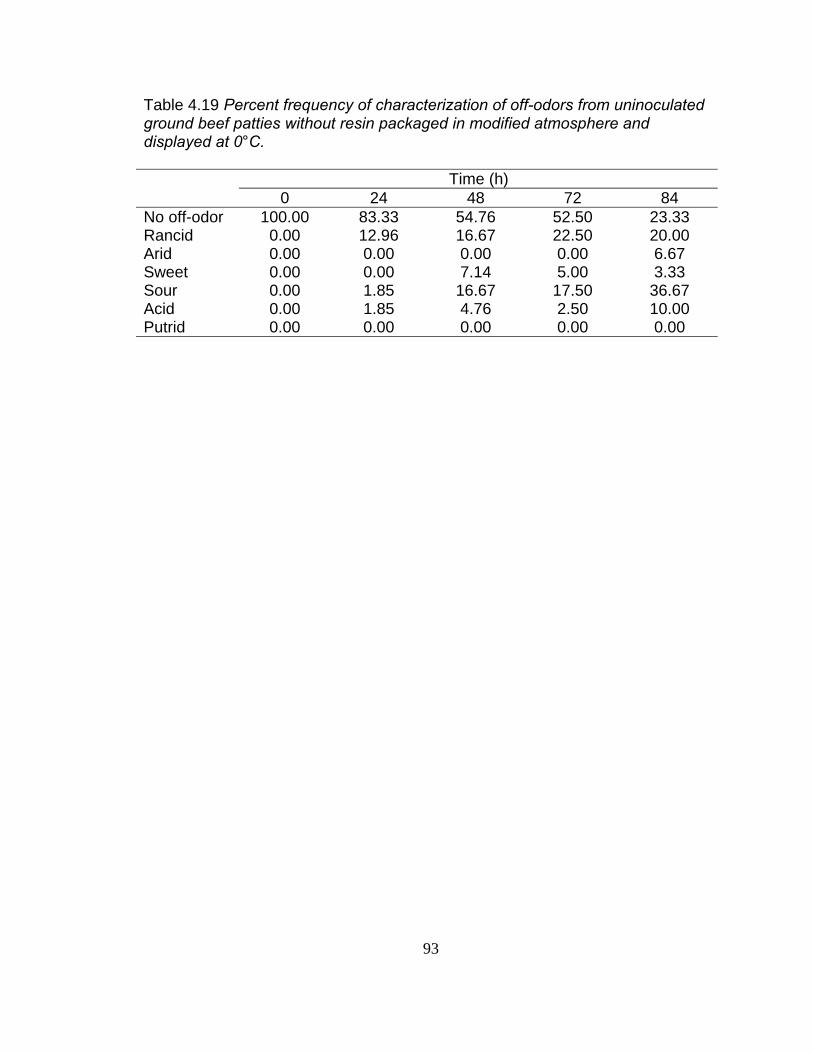
Table 4.19 Percent frequency of characterization of off-odors from uninoculated ground beef patties without resin packaged in modified atmosphere and displayed at 0°C. Time (h) 0 24 48 72 84 No off-odor 100.00 83.33 54.76 52.50 23.33 Rancid 0.00 12.96 16.67 22.50 20.00 Arid 0.00 0.00 0.00 0.00 6.67 Sweet 0.00 0.00 7.14 5.00 3.33 Sour 0.00 1.85 16.67 17.50 36.67 Acid 0.00 1.85 4.76 2.50 10.00 Putrid 0.00 0.00 0.00 0.00 0.00
93
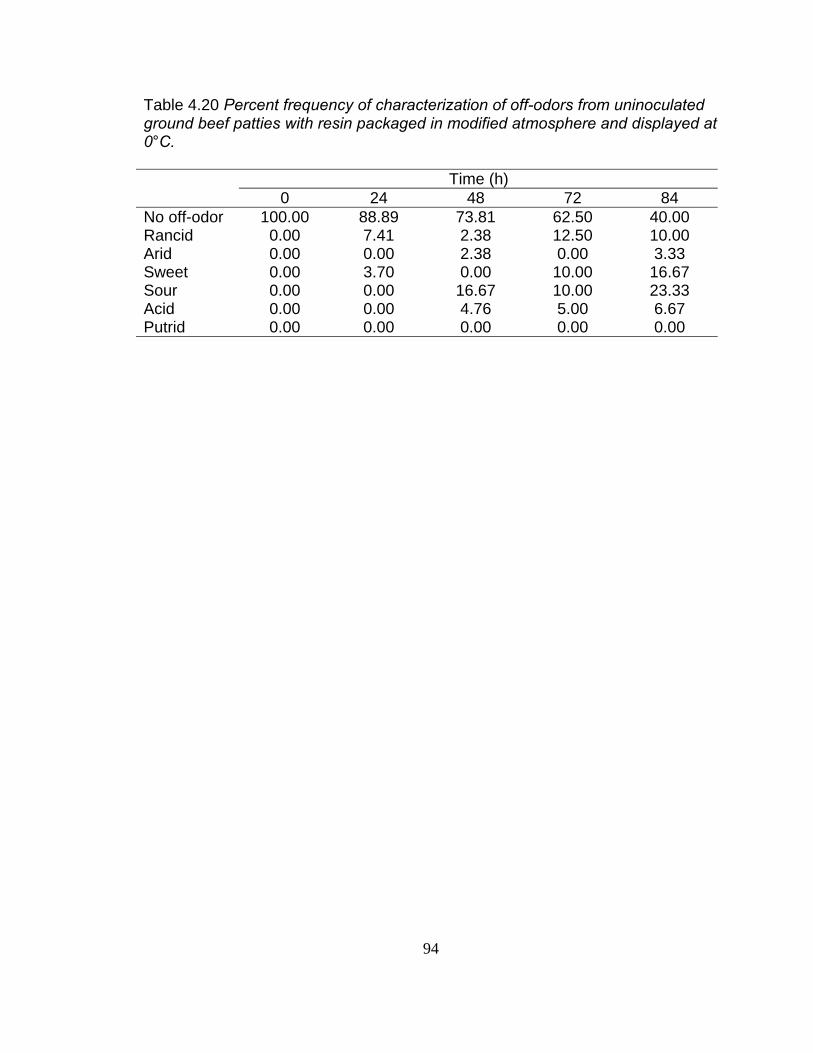
Table 4.20 Percent frequency of characterization of off-odors from uninoculated ground beef patties with resin packaged in modified atmosphere and displayed at 0°C. Time (h) 0 24 48 72 84 No off-odor 100.00 88.89 73.81 62.50 40.00 Rancid 0.00 7.41 2.38 12.50 10.00 Arid 0.00 0.00 2.38 0.00 3.33 Sweet 0.00 3.70 0.00 10.00 16.67 Sour 0.00 0.00 16.67 10.00 23.33 Acid 0.00 0.00 4.76 5.00 6.67 Putrid 0.00 0.00 0.00 0.00 0.00
94
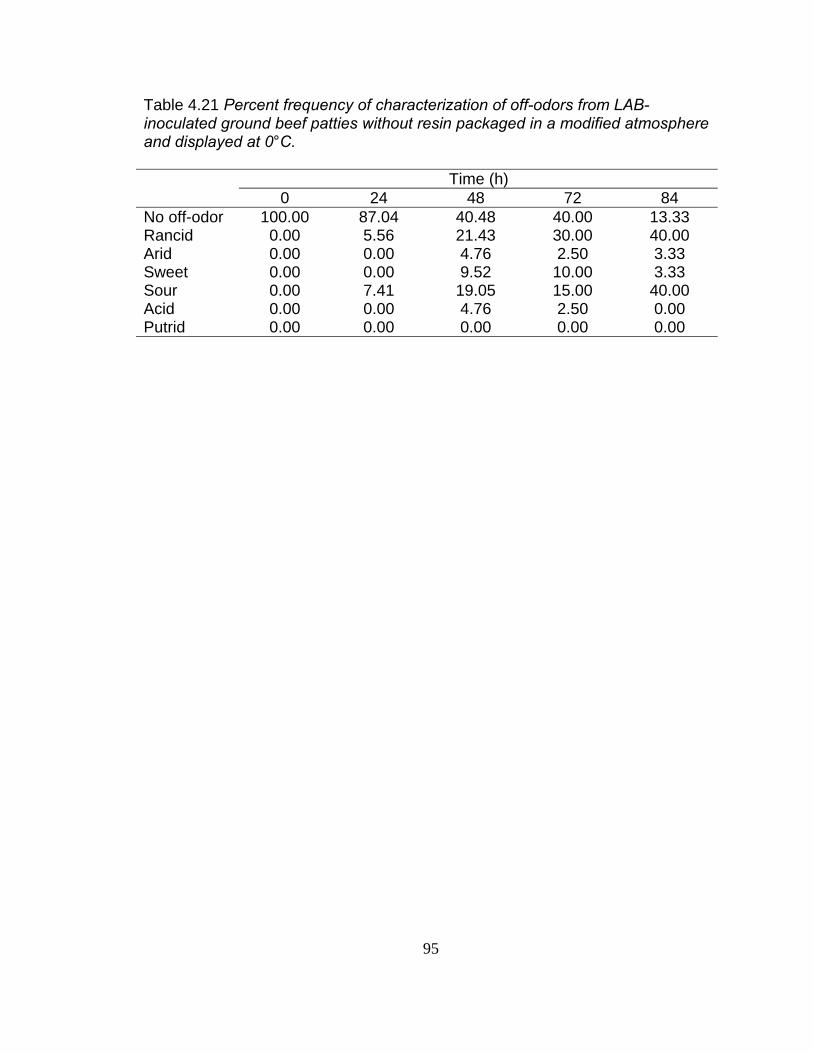
Table 4.21 Percent frequency of characterization of off-odors from LAB-inoculated ground beef patties without resin packaged in a modified atmosphere and displayed at 0°C. Time (h) 0 24 48 72 84 No off-odor 100.00 87.04 40.48 40.00 13.33 Rancid 0.00 5.56 21.43 30.00 40.00 Arid 0.00 0.00 4.76 2.50 3.33 Sweet 0.00 0.00 9.52 10.00 3.33 Sour 0.00 7.41 19.05 15.00 40.00 Acid 0.00 0.00 4.76 2.50 0.00 Putrid 0.00 0.00 0.00 0.00 0.00
95
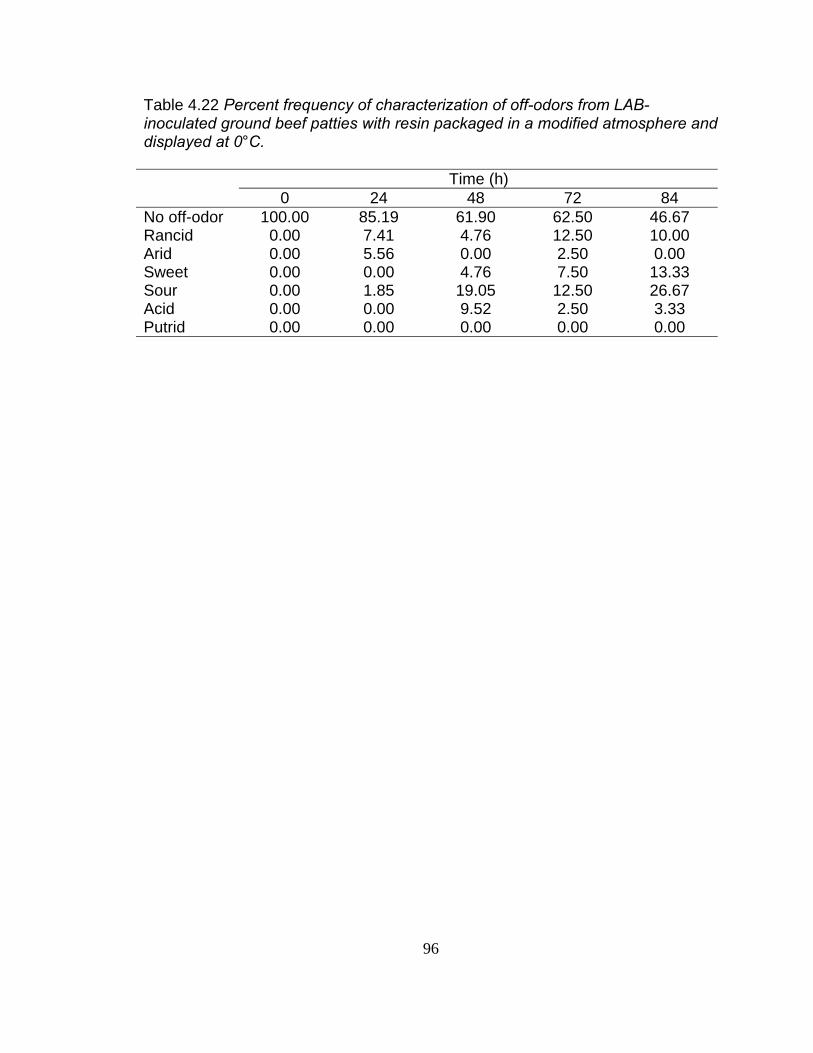
Table 4.22 Percent frequency of characterization of off-odors from LAB-inoculated ground beef patties with resin packaged in a modified atmosphere and displayed at 0°C. Time (h) 0 24 48 72 84 No off-odor 100.00 85.19 61.90 62.50 46.67 Rancid 0.00 7.41 4.76 12.50 10.00 Arid 0.00 5.56 0.00 2.50 0.00 Sweet 0.00 0.00 4.76 7.50 13.33 Sour 0.00 1.85 19.05 12.50 26.67 Acid 0.00 0.00 9.52 2.50 3.33 Putrid 0.00 0.00 0.00 0.00 0.00
96
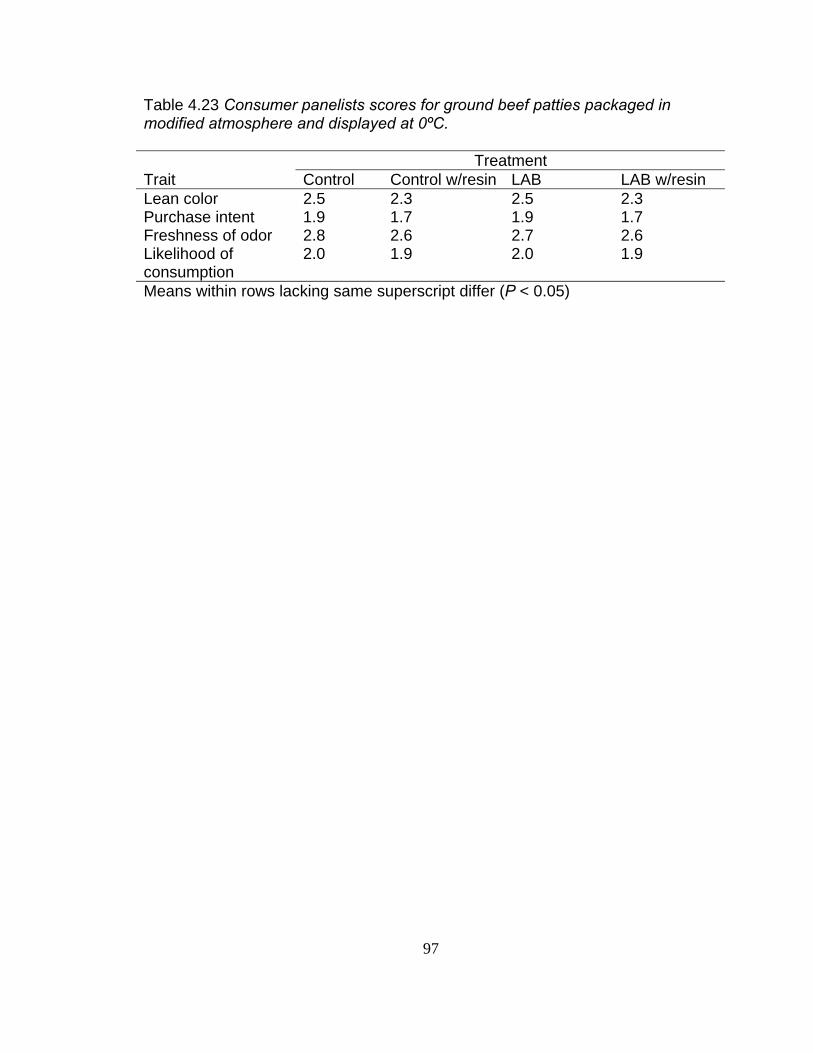
Table 4.23 Consumer panelists scores for ground beef patties packaged in modified atmosphere and displayed at 0ºC. Treatment Trait Control Control w/resin LAB LAB w/resin Lean color 2.5 2.3 2.5 2.3 Purchase intent 1.9 1.7 1.9 1.7 Freshness of odor 2.8 2.6 2.7 2.6 Likelihood of consumption
2.0 1.9 2.0 1.9
Means within rows lacking same superscript differ (P < 0.05)
97
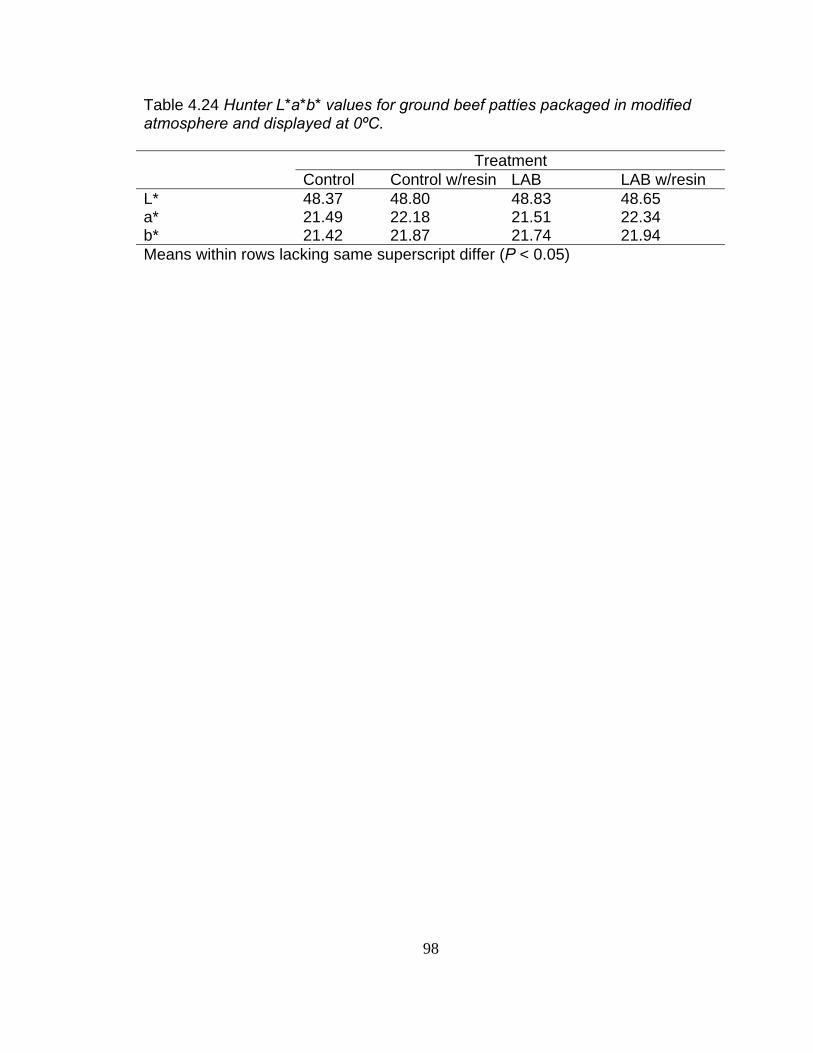
Table 4.24 Hunter L*a*b* values for ground beef patties packaged in modified atmosphere and displayed at 0ºC. Treatment Control Control w/resin LAB LAB w/resin L* 48.37 48.80 48.83 48.65 a* 21.49 22.18 21.51 22.34 b* 21.42 21.87 21.74 21.94 Means within rows lacking same superscript differ (P < 0.05)
98
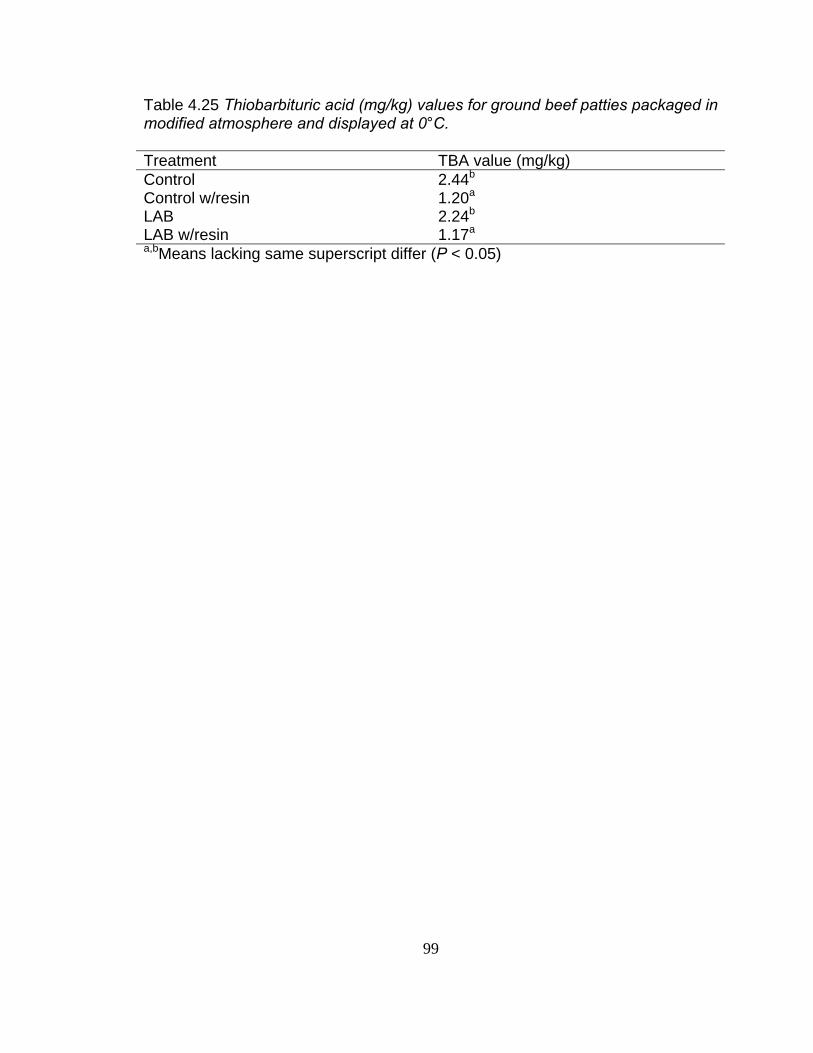
Table 4.25 Thiobarbituric acid (mg/kg) values for ground beef patties packaged in modified atmosphere and displayed at 0°C. Treatment TBA value (mg/kg) Control 2.44b
Control w/resin 1.20a
LAB 2.24b
LAB w/resin 1.17a
a,bMeans lacking same superscript differ (P < 0.05)
99
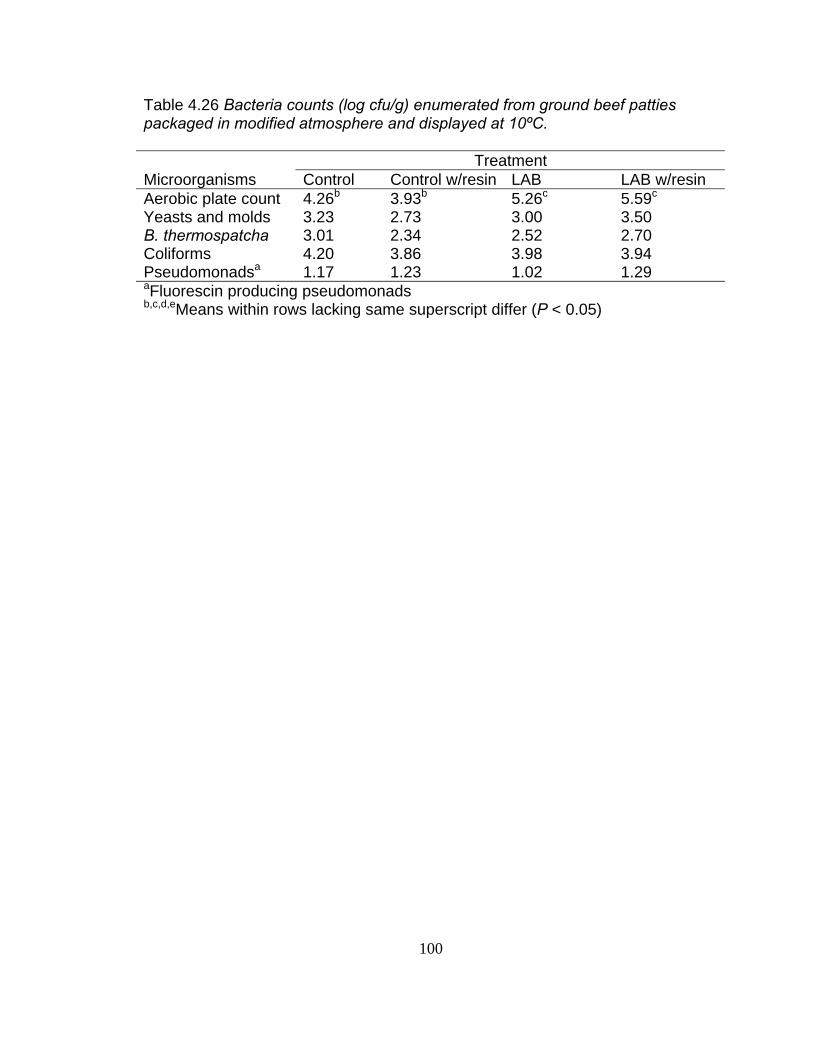
Table 4.26 Bacteria counts (log cfu/g) enumerated from ground beef patties packaged in modified atmosphere and displayed at 10ºC. Treatment Microorganisms Control Control w/resin LAB LAB w/resin Aerobic plate count 4.26b 3.93b 5.26c 5.59c
Yeasts and molds 3.23 2.73 3.00 3.50 B. thermospatcha 3.01 2.34 2.52 2.70 Coliforms 4.20 3.86 3.98 3.94 Pseudomonadsa 1.17 1.23 1.02 1.29 aFluorescin producing pseudomonads b,c,d,eMeans within rows lacking same superscript differ (P < 0.05)
100
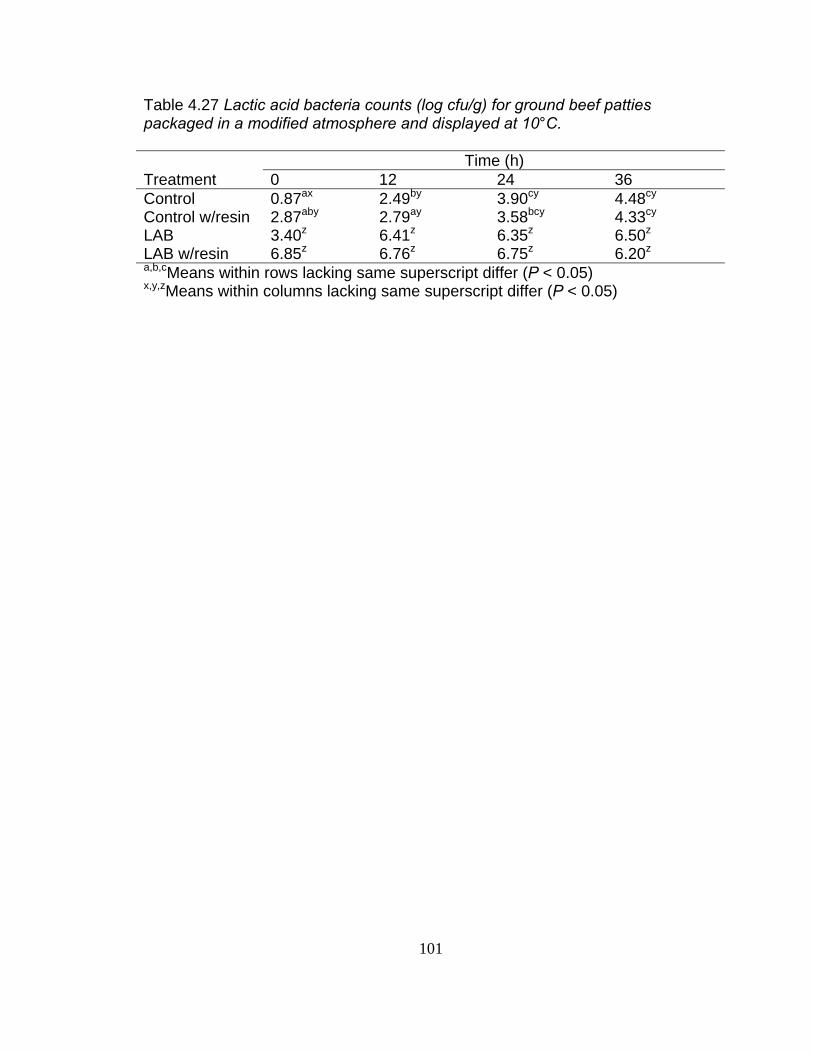
Table 4.27 Lactic acid bacteria counts (log cfu/g) for ground beef patties packaged in a modified atmosphere and displayed at 10°C. Time (h) Treatment 0 12 24 36 Control 0.87ax 2.49by 3.90cy 4.48cy
Control w/resin 2.87aby 2.79ay 3.58bcy 4.33cy
LAB 3.40z 6.41z 6.35z 6.50z
LAB w/resin 6.85z 6.76z 6.75z 6.20z
a,b,cMeans within rows lacking same superscript differ (P < 0.05) x,y,zMeans within columns lacking same superscript differ (P < 0.05)
101
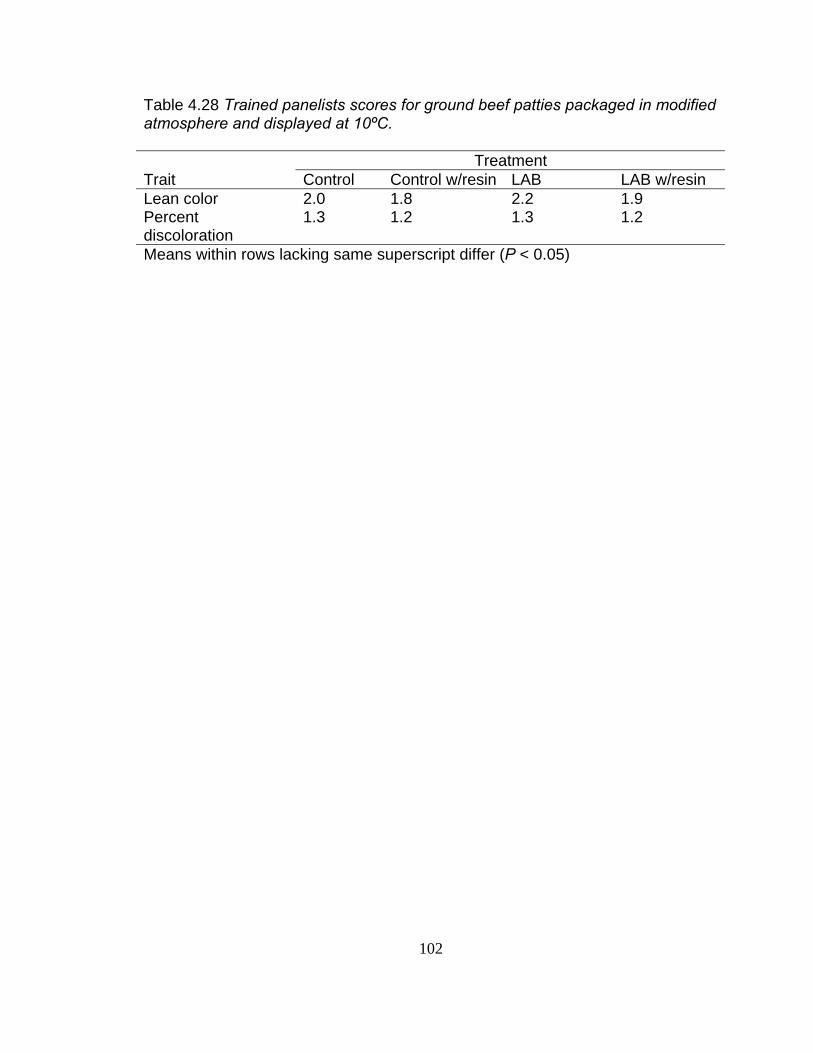
Table 4.28 Trained panelists scores for ground beef patties packaged in modified atmosphere and displayed at 10ºC. Treatment Trait Control Control w/resin LAB LAB w/resin Lean color 2.0 1.8 2.2 1.9 Percent discoloration
1.3 1.2 1.3 1.2
Means within rows lacking same superscript differ (P < 0.05)
102
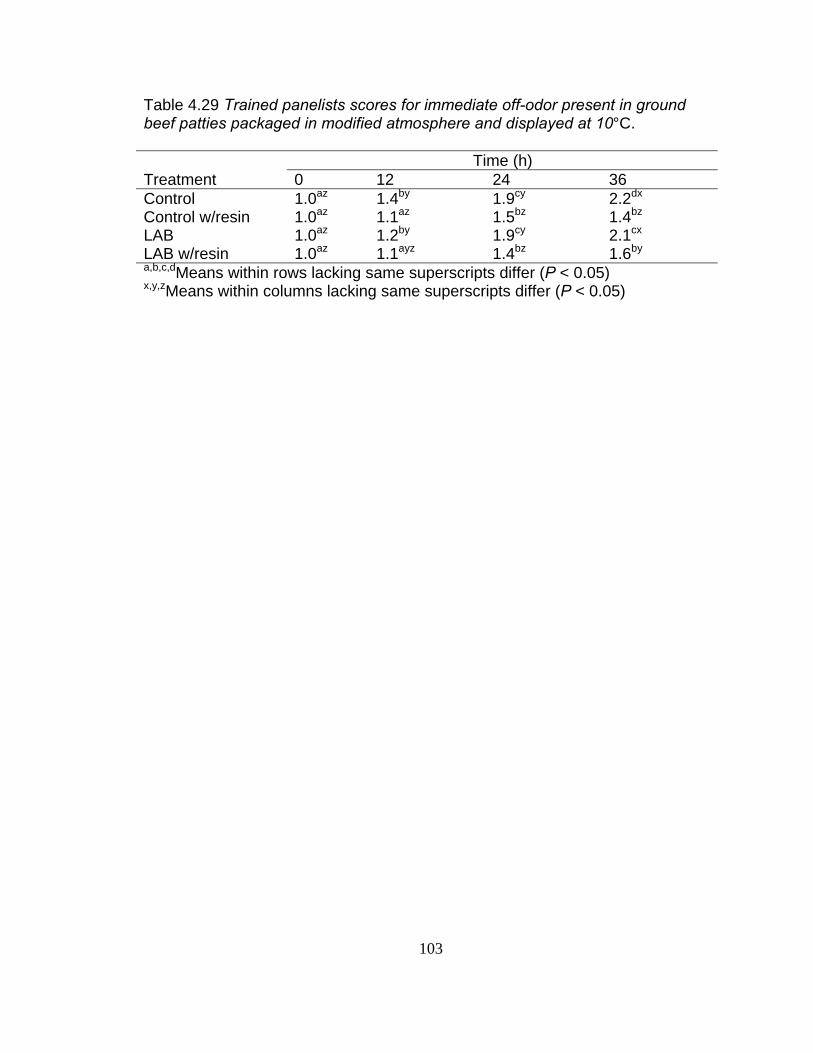
Table 4.29 Trained panelists scores for immediate off-odor present in ground beef patties packaged in modified atmosphere and displayed at 10°C. Time (h) Treatment 0 12 24 36 Control 1.0az 1.4by 1.9cy 2.2dx
Control w/resin 1.0az 1.1az 1.5bz 1.4bz
LAB 1.0az 1.2by 1.9cy 2.1cx
LAB w/resin 1.0az 1.1ayz 1.4bz 1.6by
a,b,c,dMeans within rows lacking same superscripts differ (P < 0.05) x,y,zMeans within columns lacking same superscripts differ (P < 0.05)
103
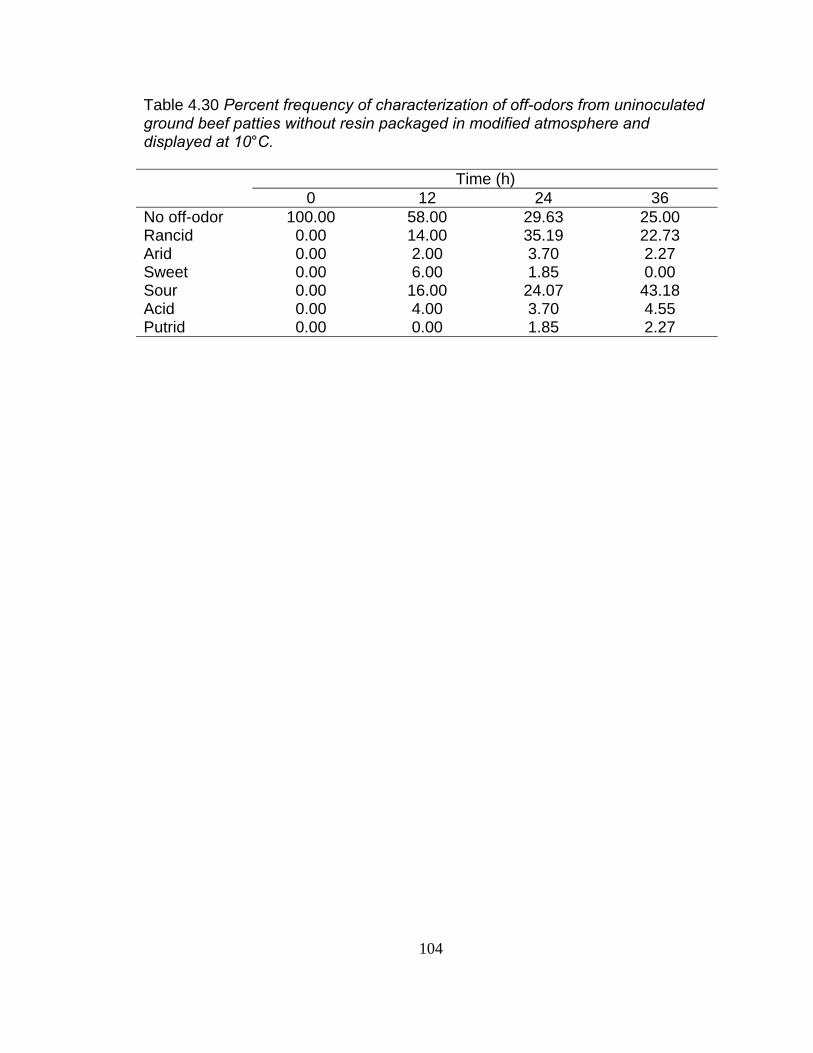
Table 4.30 Percent frequency of characterization of off-odors from uninoculated ground beef patties without resin packaged in modified atmosphere and displayed at 10°C. Time (h) 0 12 24 36 No off-odor 100.00 58.00 29.63 25.00 Rancid 0.00 14.00 35.19 22.73 Arid 0.00 2.00 3.70 2.27 Sweet 0.00 6.00 1.85 0.00 Sour 0.00 16.00 24.07 43.18 Acid 0.00 4.00 3.70 4.55 Putrid 0.00 0.00 1.85 2.27
104
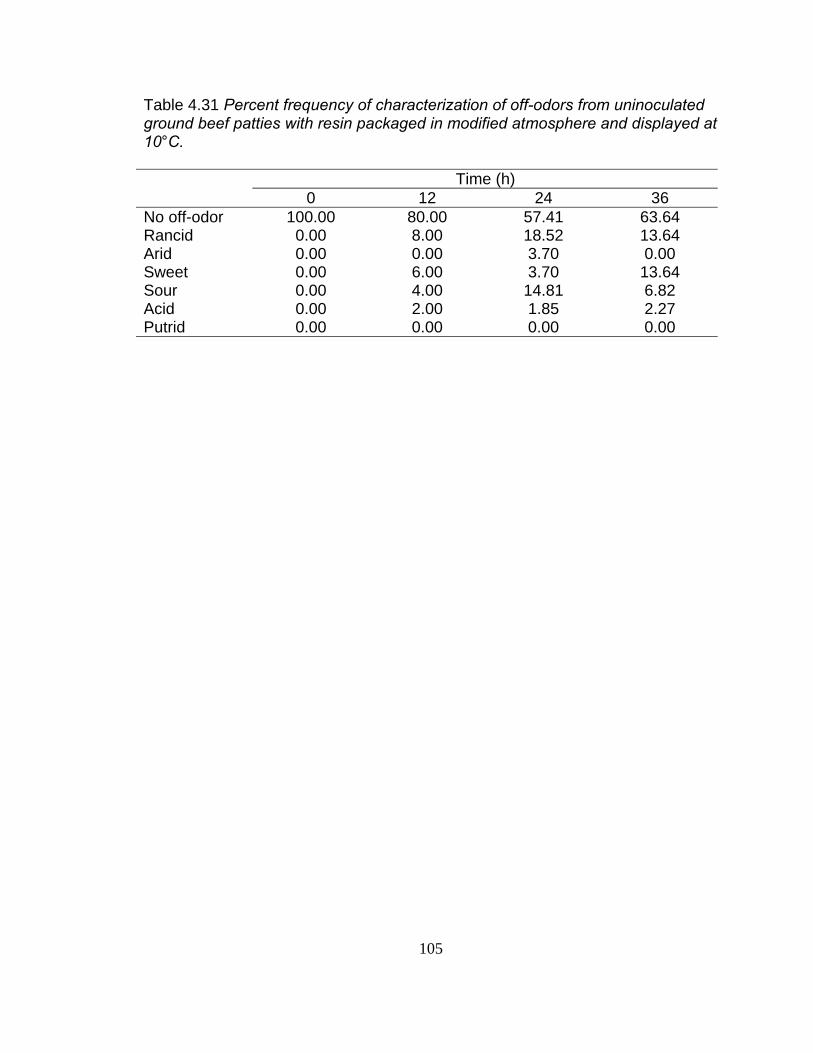
Table 4.31 Percent frequency of characterization of off-odors from uninoculated ground beef patties with resin packaged in modified atmosphere and displayed at 10°C. Time (h) 0 12 24 36 No off-odor 100.00 80.00 57.41 63.64 Rancid 0.00 8.00 18.52 13.64 Arid 0.00 0.00 3.70 0.00 Sweet 0.00 6.00 3.70 13.64 Sour 0.00 4.00 14.81 6.82 Acid 0.00 2.00 1.85 2.27 Putrid 0.00 0.00 0.00 0.00
105
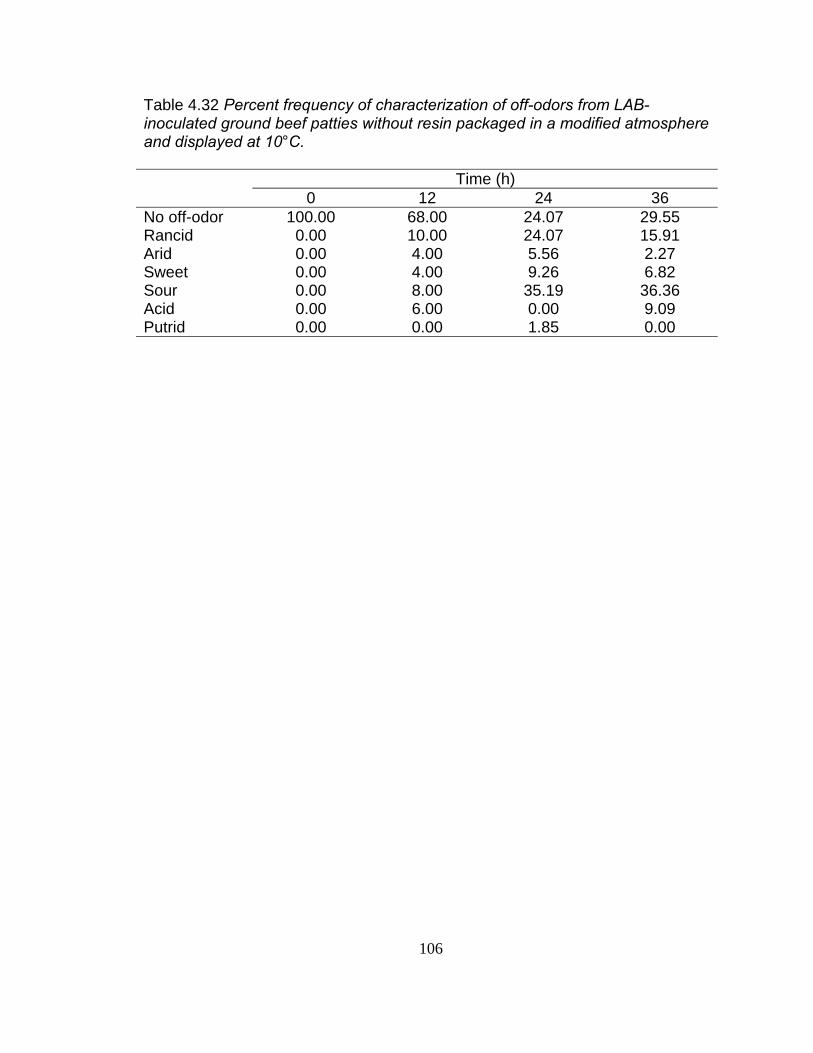
Table 4.32 Percent frequency of characterization of off-odors from LAB-inoculated ground beef patties without resin packaged in a modified atmosphere and displayed at 10°C. Time (h) 0 12 24 36 No off-odor 100.00 68.00 24.07 29.55 Rancid 0.00 10.00 24.07 15.91 Arid 0.00 4.00 5.56 2.27 Sweet 0.00 4.00 9.26 6.82 Sour 0.00 8.00 35.19 36.36 Acid 0.00 6.00 0.00 9.09 Putrid 0.00 0.00 1.85 0.00
106
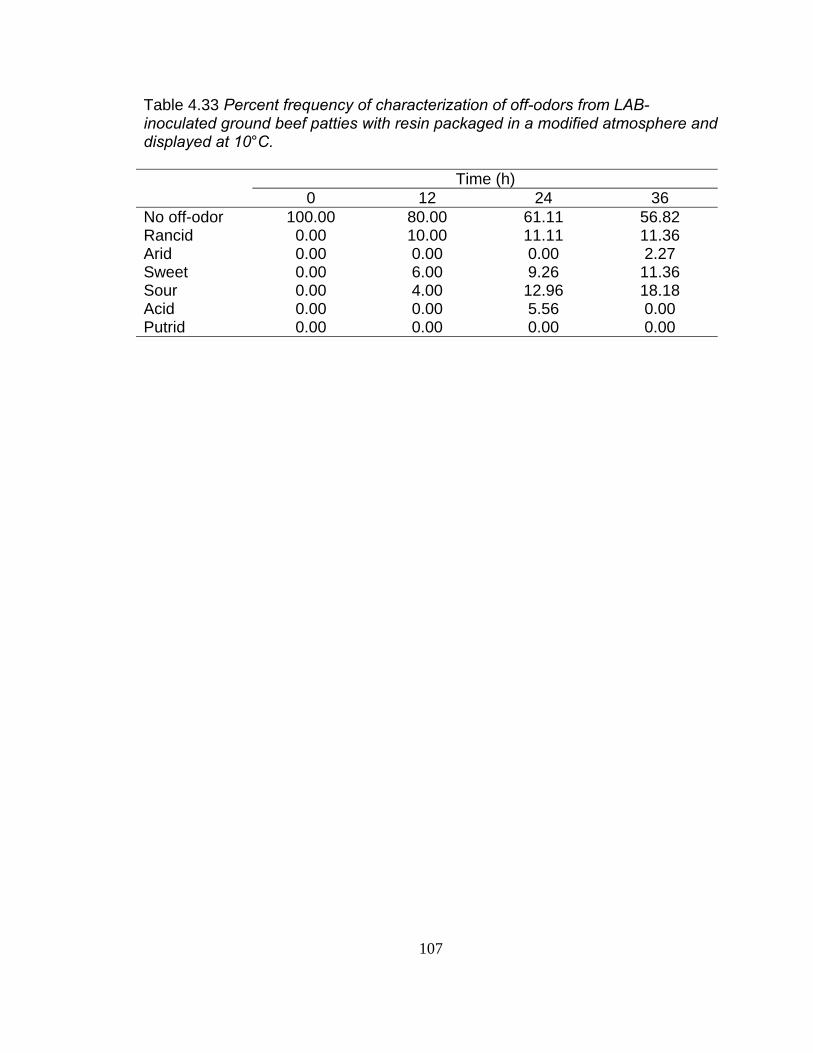
Table 4.33 Percent frequency of characterization of off-odors from LAB-inoculated ground beef patties with resin packaged in a modified atmosphere and displayed at 10°C. Time (h) 0 12 24 36 No off-odor 100.00 80.00 61.11 56.82 Rancid 0.00 10.00 11.11 11.36 Arid 0.00 0.00 0.00 2.27 Sweet 0.00 6.00 9.26 11.36 Sour 0.00 4.00 12.96 18.18 Acid 0.00 0.00 5.56 0.00 Putrid 0.00 0.00 0.00 0.00
107

Table 4.34 Consumer panelists scores for ground beef patties packaged in modified atmosphere and displayed at 10ºC. Treatment Trait Control Control w/resin LAB LAB w/resin Lean color 2.1ab 1.9a 2.2b 1.9a
Purchase intent 1.6 1.5 1.7 1.4 Freshness of odor 2.4a 2.1c 2.4ab 2.2bc
Likelihood of consumption
1.8 1.6 1.8 1.6
a,b,cMeans within rows lacking same superscript differ (P < 0.05)
108
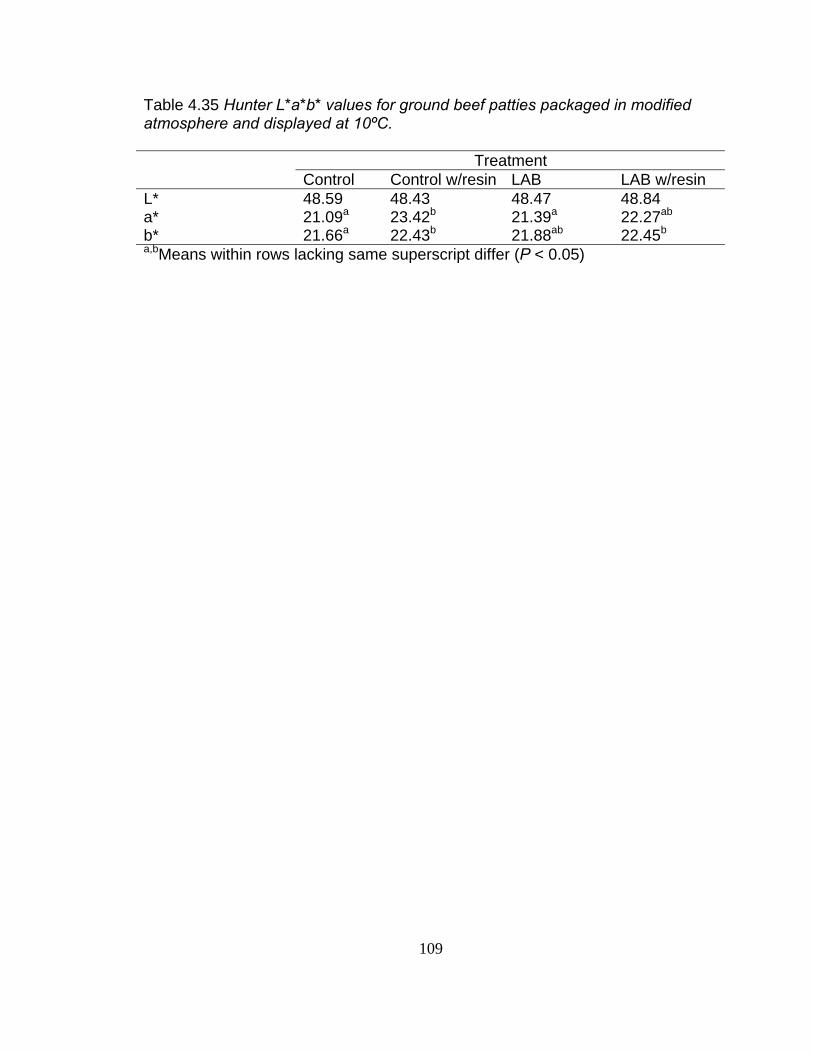
Table 4.35 Hunter L*a*b* values for ground beef patties packaged in modified atmosphere and displayed at 10ºC. Treatment Control Control w/resin LAB LAB w/resin L* 48.59 48.43 48.47 48.84 a* 21.09a 23.42b 21.39a 22.27ab
b* 21.66a 22.43b 21.88ab 22.45b
a,bMeans within rows lacking same superscript differ (P < 0.05)
109
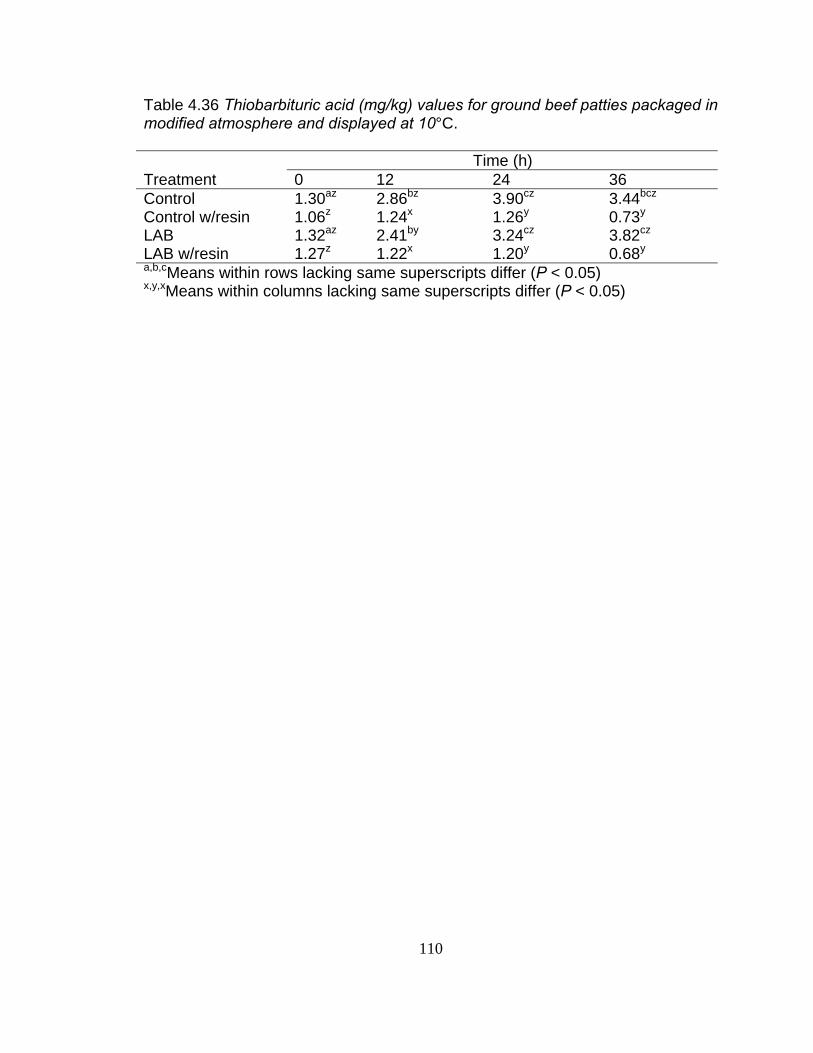
Table 4.36 Thiobarbituric acid (mg/kg) values for ground beef patties packaged in modified atmosphere and displayed at 10°C. Time (h) Treatment 0 12 24 36 Control 1.30az 2.86bz 3.90cz 3.44bcz
Control w/resin 1.06z 1.24x 1.26y 0.73y
LAB 1.32az 2.41by 3.24cz 3.82cz
LAB w/resin 1.27z 1.22x 1.20y 0.68y
a,b,cMeans within rows lacking same superscripts differ (P < 0.05) x,y,xMeans within columns lacking same superscripts differ (P < 0.05)
110
CHAPTER V
DISCUSSION
It is important for proposed food additives to not mask factors consumers
would typically associate with a spoiled product. If spoilage is masked, then
consumers might consume a product that would normally be discarded. Those
factors include changes in color, odor, texture, and overall appearance. Previous
research conducted in our laboratory has shown that the addition of certain
strains of LAB to ground beef does inhibit the growth of E. coli O157:H7 and
Salmonella spp. (Smith et al., 2005). Additionally, preliminary research (data not
shown) was conducted to determine the minimum LAB inoculation level needed
to inhibit E. coli O157:H7 and Salmonella spp. growth in ground beef. The
inoculation level of 109 cfu/g of meat was determined to be the minimum level
and was used in this study to determine the effects of LAB on spoilage
characteristics of color, odor, oxidative rancidity, and the naturally occurring
microflora. Lower doses did not significantly inhibit food-borne pathogens.
Both the microbiological and sensory results throughout the study
demonstrated that LAB did not have a detrimental effect on spoilage
characteristics. While there were some significant differences in the population
of microorganisms for certain portions of the study, those differences were
present in the total aerobic plate counts and the lactic acid bacteria. Because the
patties were inoculated by adding 109 cfu/g of meat, those differences would be
111
expected and do not indicate that spoilage was occurring. While there were a
few microbiological differences detected, sensory panels were conducted to
detect spoilage characteristics of color and odor that a consumer would typically
associate with a spoiled product. Analysis of both trained and consumer panels
revealed no significant differences between samples with added LAB and those
without. If spoilage was masked, then the panels would have selected the LAB-
inoculated samples as having a longer shelf-life and would not have detected
spoilage in the product at the same intervals as in the non-inoculated product. In
addition to sensory panels, objective color measurements were used. The
differences detected in the Hunter L*a*b* values while statistically significant,
were not detected by the human eye and therefore, those color changes were
very small. TBA assays were performed on samples to measure the amount of
lipid oxidation that occurred. The addition of LAB appeared to slow lipid
oxidation in traditionally packaged ground beef, but not enough to be detected by
the consumer.
Rosemary oleoresin was added to one-half of the ground beef packaged
in the modified atmosphere. Rosemary oleoresin did not have a significant effect
on microorganisms isolated and enumerated including lactic acid bacteria,
coliforms, pseudomonads, yeasts and molds, and B. thermosphacta. Because
oleoresin is typically added to ground beef in modified atmosphere packaging, it
was important to determine the interaction of LAB with the oleoresin. The
112
addition of the oleoresin did not appear to have an impact on the effects of the
LAB on spoilage characteristics or microbiological properties of the ground beef.
Trained and consumer color panels as well as Hunter L*a*b* values show
that the addition of the oleoresin likely slowed the conversion of oxymyglobin to
metmyglobin. This allows the meat to retain color and extends shelf life.
Additionally, odor panels also indicate that the ground beef containing rosemary
oleoresin had a fresher smell further into the display period. TBA assays show
that the addition of rosemary slows the lipid oxidation process. This is in
agreement with several researchers who also found that lipid oxidation was
inhibited by the addition of the natural antioxidant (Sanchez-Escalante et al.,
2001; Ho et al., 1995; Barbut et al., 1985). However, again, the oleoresin did not
have an impact on LAB properties in the product.
Lactic acid bacteria can be added to ground beef as a processing
intervention without masking spoilage characteristics such as color and odor.
The strains used in this study will not grow significantly at refrigeration
temperatures, but can still produce agents that inhibit growth of pathogens such
as E. coli O157:H7 and Salmonella spp. (Smith et al., 2005). While the total
aerobic plate counts and the LAB counts in the traditional packaging were
significantly different at the beginning of the study, they were similar between the
treated and non-treated samples at the end of the study indicating that the LAB
inhibit total aerobic bacteria and that the LAB added to the product do not grow
while the naturally present LAB do grow.
113
The addition of rosemary oleoresin slows lipid oxidation and the
conversion of oxymyglobin to metmyglobin. Therefore, this natural antioxidant
can increase display periods. Rosemary oleoresin may also inhibit the growth of
coliforms in ground beef packaged in a modified atmosphere when subjected to
temperature abuse conditions. This is a phenomenon that warrants further
investigation.
Lactic acid bacteria are GRAS approved by the FDA for certain food
products (Brashears et al., 2005). They are commonly used in fermented dairy
and meat products. Lactobacillus acidophilus is added to sweet acidophilus milk
and to yogurt after the fermentation process for the microorganism’s health
benefits. This research illustrates that the lowest level of LAB was added to
prevent pathogen growth and that level of bacteria did not result in a misbranded
or adulterated product as required by FSIS because spoilage characteristics
were not masked (FSIS, 2003). The data will be submitted to both FDA and
FSIS to gain approval for the addition of LAB to ground beef products.
114
REFERENCES CITED
21 C.F.R. §170.30. Aguirre, M. and M.D. Collins. 1993. A review: lactic acid bacteria and human
clinical infection. J. Appl. Bacteriol. 75:95-107. Amezquita, A. and M.M. Brashears. 2002. Competitive inhibition of Listeria
monocytogenes in ready-to-eat meat products by lactic acid bacteria. J. Food Prot. 65:316-325.
AMI. 2003. Fact sheet: overview of U.S. meat and poultry production and
consumption. Available at: http://www.meatami.com/content/presscenter/factsheets_Infokits/FactSheetMeatProductionandConsumption.pdf. Accessed on 7 January 2005.
AMSA. 1991. Guidelines for Meat Color Evaluation. 44th Reciprocal Meat
Conference. National Live Stock and Meat Board. Chicago, IL. Axelsson, L. 1998. Lactic acid bacteria: classification and physiology. In Lactic
acid bacteria: microbiology and functional aspects, 2nd ed (Salminen, S. and A. von Wright, editors). pp. 3-72. Marcel Dekker, Inc.: New York.
Ayers, J.C. 1955. Microbial implications in the handling, slaughtering and
dressing of meat animals. Adv. In Food Res. 6:109-161. Ayres, J.C. 1960. Temperature relationships and some other characteristics of
the microbial flora developing on refrigerated beef. Food Res. 25:1-18. Barbut, S., D.B. Josephson, and A.J. Maurer. 1985. Antioxidant properties of
rosemary oleoresin in turkey sausage. J. Food Sci. 50:1356-1359,1363. Bell, B.P., M. Goldoft, P.M. Griffin, M.A. Davis, D.C. Gordon, P.I. Tarr, C.A.
Bartleson, J.H. Lewis, T.J. Barrett, J.G. Wells, R. Baron, and J. Kobayashi. 1994. A multistate outbreak of Escherichia coli O157:H7-associated bloody diarrhea and hemolytic uremic syndrome from hamburgers. JAMA. 272:1349-1353.
Blom, H. and C. Mortvedt. 1991. Anti-microbial substances produced by food
associated micro-organisms. T. Biochem. Soc. 19:694-698. Boyce, T.G., D.L. Swerdlow, and P.M. Griffin. 1995. Escherichia coli O157:H7
and the hemolytic-uremic syndrome. N. Engl. J. Med. 333:364-368.
115
Brashears, M.M., A. Amezquita, and D. Jaroni. Lactic acid bacteria and their uses in animal feeding to improve food safety. In Food and Nutrition Reviews to be published in Spring 2005.
Brashears, M.M., S.S. Reilly, and S.E. Gilliland. 1998. Antagonistic action of
cells of Lactobacillus lactis toward Escherichia coli O157:H7 on refrigerated raw chicken meat. J. Food Prot. 61:166-170.
Bruno, M.E.C. and T.J. Montville. 1993. Common mechanism of bacteriocins
from lactic acid bacteria. Appl. Environ. Microbiol. 59:3003-3010. Buchanan, R.L. and M.P. Doyle. 1997. Foodborne disease significance of
Escherichia coli O157:H7 and other enterohemorrhagic E. coli. Food Technol. 51:69-76.
Buege, J.A. and S.D. Aust. 1978. Microsomal lipid peroxidation. Methods
Enzymol. 52:302-310. Carpenter, C.E., D.P. Cornforth, and D. Whittier. 2001. Consumer preferences
for beef color and packaging did not affect eating satisfaction. Meat Sci. 57:359-363.
CDC. 1993. Update: multistate outbreak of Escherichia coli O157:H7 infections
from hamburgers – western United States, 1992-1993. MMWR. 42:258-263.
CDC. 1995. Outbreak of Salmonella serotype Typhimurium infection associated
with eating raw ground beef – Wisconsin, 1994. MMWR. 44:905-909. CDC. 2002. Outbreak of multidrug-resistant Salmonella Newport – United
States, January-April 2002. MMWR. 51:545-8. CDC. 2004. Salmonellosis. Available at:
http://www.cdc.gov/ncidod/dbmd/diseaseinfo/salmonellosis_g.htm. Accessed 20 January 2005.
Condon, S. 1987. Responses of lactic acid bacteria to oxygen. FEMS
Microbiol. Rev. 46:269-280. Dahiya R.S. and M.L. Speck. 1968. Hydrogen peroxide formation by lactobacilli
and its effect on Staphylococcus aureus. J. Dairy Sci. 51:1569-1572.
116
Dainty, R.H. 1981. Volatile fatty acids detected in vacuum-packaged beef during storage at chill temperatures. Proc. 27th European Mtg. Meat Res. Workers, Vienna. pp. 688.
Dainty, R.H. and C.M. Hibbard. 1980. Aerobic metabolism of Brochothrix
thermosphacta growing on meat surfaces and in laboratory media. J. Appl. Bacteriol. 48:387-396.
Dainty, R.H., B.G. Shaw, K.A. DeBoer and E.S.J. Scheps. 1975. Protein
changes caused by bacterial growth on beef. J. Appl. Bacteriol. 39:73-81. Daniels, J.A., R. Krishnamurthi, and S.S.H. Rizvi. 1985. A review of effects of
carbon dioxide on microbial growth and food quality. J. Food Prot. 48:532-537.
Del Campo, J., M.J. Amiot, and C. Nguyen-The. 2000. Antimicrobial effect of
rosemary extracts. J. Food Prot. 63:1359-1368. Dickson, J.S. 1992. Acetic acid action on beef tissue surfaces contaminated
with Salmonella typhimurium. J. Food Sci. 57:297-301. Dixon, N.M. and D.B. Kell. 1989. The inhibition of CO2 of the growth and
metabolism of micro-organisms. J. Appl. Bact. 67:109-136. Djenane, D., A. Sanchez-Escalante, J.A. Baltran, and P. Roncales. 2003.
Extension of the shelf life of beef steaks packaged in a modified atmosphere by treatment with rosemary and displayed under UV-free lighting. Meat Sci. 64:417-426.
Dormedy, E.S., M.M. Brashears, C.N. Cutter, and D.E. Burson. 2000. Validation
of acid washes as critical control points in hazard analysis and critical control point systems. J. Food Prot. 63:1676-1680.
Doyle, M.P. 1991. Escherichia coli O157:H7 and its significance in foods. Int. J.
Food Microbiol. 12:289-302. Eklund, T. 1983. The antimicrobial effect of dissociated and undissociated
sorbic acid at different pH levels. J. Appl. Bacteriol. 54:383-389. Elgayyar, M., F.A. Draughon, D.A. Golden, and J.R. Mount. 2001. Antimicrobial
activity of essential oils from plants against selected pathogenic and saprophytic microorganisms. J. Food Prot. 64:1019-1024.
117
ERS. 2000. Estimated annual cost of five foodborne pathogens total $6.9 billion. Economic Research Service, United States Department of Agriculture. Food Safety 23:3(i).
Farag, R.S., Z.Y. Daw, F.M. Hewedi, and G.S.A. El-Baroty. 1989. Antimicrobial
activity of some Egyptian spice essential oils. J. Food Prot. 52:665-667. Farber, J.M. 1991. Microbiological aspects of modified-atmosphere packaging
technology – a review. J. Food Prot. 54:58-70. FSIS. 2000. Memorandum of Understanding between the Food Safety and
Inspection Service United States Department of Agriculture and the Food and Drug Administration, United States Department of Health and Human Services. Available at: http://www.fsis.usda.gov/OPPDE/larc/Ingredients/MOU.htm. Accessed 6 October 2004.
FSIS. 2003. Guidance on the procedures for joint Food Safety and Inspection
Service (FSIS) and the Food and Drug Administration (FDA) approval of ingredients and sources of radiation used in the production of meat and poultry products. Available at: http://www.fsis.usda.gov/OPPDE/rdad/FRPubs/00-022N/ApprovalofIngredients.htm. Accessed 6 October 2004.
Gill, C.O. 1986. The control of microbial spoilage in fresh meats. In Advances
in Meat Research Vol. 2, Meat and Poultry Microbiology. pp. 49-88. (A.M. Pearson and T.R. Dutson, editors). AVI Publishing Company Inc.: Westport, Conn.
Gill, C.O. and K.G. Newton. 1977. The development of aerobic spoilage flora on
meat stored at chill temperatures. J. Appl. Bact. 43:189-195. Gombas, D.E. 1989. Biological competition as a preserving mechanism. J.
Food Saf. 10:107-117. Grau, F.H. 1979. Nutritional requirements of Microbacterium thermosphacta.
Appl. Environ. Microbiol. 38:818-820. Greene, B.E. and T.H. Cumuze. 1981. Relationship between TBA numbers and
inexperienced panelists’ assessments of oxidized flavor in cooked beef. J. Food Sci. 47:52-54, 58.
Greene, B.E., I. Hsin, and M.W. Zipser. 1971. Retardation of oxidative color
changes in raw ground beef. J. Food Sci. 36:940-942.
118
Griffin, P.M. and R.V. Tauxe. 1991. The epidemiology of infections caused by Escherichia coli O157:H7, other enterohemorrhagic E. coli, and the associated hemolytic uremic syndrome. Epidemiol. Rev. 13:60-98.
Hardie, J.M., E.I. Garvie, O. Kandler, and N. Weiss. 1986. Gram-positive cocci.
In Bergey’s Manual of Systematic Bacteriology (P.H.A. Sneath, N.S. Mair, M.E. Sharpe, and J.G. Holt, editors). pp. 1043-1209. Williams and Wilkins: MD.
Hintlian, C.B. and J.H. Hotchkiss. 1986. The safety of modified atmosphere
packaging: a review. Food Tech. 40:70-76. Holzapfel, W.H., R. Geisen, and U. Schillinger. 1995. A review paper: biological
preservation of foods with reference to protective cultures, bacteriocins and food-grade enzymes. Int. J. Food Microbiol. 24:343-362.
Ho, C.P., D.L. Huffman, D.D. Bradford, W.R. Egbert, W.B. Mikel and W.R. Jones.
1995. Storage stability of vacuum packaged frozen pork sausage containing soy protein concentrate, carrageenan or antioxidants. J. Food Sci. 60:257-261.
Houlihan, C.M. and C. Ho. 1985. Natural antioxidants. In Flavor Chemistry of
Fats and Oils (D.B. Min and T.H. Smouse, editors). pp. 139. American Oil Chemists’ Society: Champaign, IL.
Hugas, M. 1998. Bacteriocinogenic lactic acid bacteria for the biopreservation of
meat and meat products. Meat Sci. 49:S139-150. Hurst, A. 1973. Microbial antagonism in foods. Can. Inst. Food Sci. Technol.
6:80-90. Jay, J.M. 1964. Beef microbial quality determined by extract release volume
(ERV). Food Technol. 18:1637-1641. Jay, J.M. 1996. Microorganisms in fresh ground meats: the relative safety of
products with low versus high numbers. Meat Sci. 43:S59-S66. Jayasingh, P., D.P. Cornforth, C.P. Brennand, C.E. Carpenter, and D. Whittier.
2002. Sensory evaluation of ground beef stored in high-oxygen modified atmosphere packaging. J. Food Sci. 67:3493-3496.
Juven, B.J. and M.D. Pierson. 1996. Antibacterial effects of hydrogen peroxide
and methods for its detection and quantification. J. Food Prot. 59:1233-1241.
119
Kang, D-H, T.M. Arthur, and G.R. Siragusa. 2002. Gas formation in ground beef chubs due to Hafnia alvei is reduced by multiple applications of antimicrobial interventions to artificially inoculated beef trim stock. J. Food Prot. 65:1651-1655.
Kang, D-H., M. Koohmaraie, and G.R. Siragusa. 2001. Application of multiple
antimicrobial interventions for microbial decontamination of commercial beef trim. J. Food Prot. 64:168-171.
Klaenhammer, T.R. 1988. Bacteriocins of lactic acid bacteria. Biochimie.
70:337-349. Klaenhammer, T.R. 1993. Genetics of bacteriocins produced by lactic acid
bacteria. FEMS Microbiol. Rev. 12:39-86. Klaenhammer, T.R. 2001. Probiotics and Prebiotics. In Food Microbiology:
Fundamentals and Frontiers, 2nd ed. (M.P. Doyle, L.R. Beuchat, and T.J. Montville, editors). pp. 797-811. ASM Press: Washington, D.C.
Lambert, A.D., J.P. Smith, and K.L. Dodds. 1991. Shelf life extension and
microbiological safety of fresh meat – a review. Food Microbiol. 8:267-297.
Lindgren, P.E. and W.J. Dobrogosz. 1990. Antagonistic activities of lactic acid
bacteria in food and feed fermentations. FEMS Microbiol. Rev. 87:149-163.
McCarthy, T.L., J.P. Kerry, J.F. Kerry, P.B. Lynch, and D.J. Buckley. 2001.
Evaluation of the antioxidant potential of natural food/plant extracts as compared with synthetic antioxidants and vitamin E in raw and cooked pork patties. Meat Sci. 57:45-52.
McClure, P. 2000. The impact of E. coli O157 on the food industry. World J.
Microbiol. Biotechnol. 16:749-755. Mead, P.S., L. Slutsker, V. Dietz, L.F. McCraig, J.S. Bresee, C. Shapiro, P.M.
Griffin, and R.V. Tauxe. 1999. Food-related illness and death in the United States. Emerg. Infect. Dis. 5:607-625.
Meng, J., M.P. Doyle, T. Zhao, and S. Zhao. 1994. Detection and control of
Escherichia coli O157:H7 in foods. Trends Food Sci and Technol. 5:179-185.
120
Miller, A., III, R.A. Scanlan, J.S. Lee, and L.M. Libbey. 1973A. Volatile compounds produced in sterile fish muscle (Sebastes melanops) by Pseudomonas putrefaciens, Pseudomonas fluorescens, and Achromobacter species. Appl. Microbiol. 26:18-21.
Miller, A., III, R.A. Scanlan, J.S. Lee, L.M. Libbey, and M.E. Morgan. 1973B.
Volatile compounds produced in sterile fish muscle (Sebastes melanops) by Pseudomonas perolens. Appl. Microbiol. 25:257-261.
Nassos, P.S., A.D. King, Jr., and A.E. Stafford. 1985. Lactic acid concentration
and microbial spoilage in anaerobically and aerobically stored ground beef. J. Food Sci. 50:710-712,715.
Nassos, P.S., A.D. King, Jr., and A.E. Stafford. 1983. Relationship between
lactic acid concentration and bacterial spoilage in ground beef. Appl. Environ. Microbiol. 46:894-900.
Nawar, W.W. 1996. Lipids. In Food Chemistry, 3rd Ed (O.R. Fennema, editor).
pp. 254-288. Marcel Dekker, Inc.: New York. NCBA. 2002. Beef Bytes. Available at: http://ww.beef.org/documents/beef
bytes complete.pdf. Accessed on 7 January 2005. Nettles, C.G. and S.F. Barefoot. 1993. Biochemical and genetic characteristics
of bacteriocins of food-associated lactic acid bacteria. J. Food Prot. 56:338-356.
Newton, K.G. and C.O. Gill. 1978. The development of the anaerobic spoilage
flora of meat stored at chill temperatures. J. Appl. Bact. 44:91-95. Nottingham, P.M. 1982. Microbiology of meat carcasses. In Meat Microbiology
(M.H. Brown, editor). pp. 13-65. Applied Science Publishers: London. O’Connor-Shaw, R.E. and V.G. Reyes. 2000. Use of modified-atmosphere
packaging. In Encyclopedia of Food Microbiology (R.K. Robinson, C.A. Batt, and P.D. Patel, editors). pp. 410-416. Academic Press: San Diego.
Ouwehand, A.C. 1998. Antimicrobial components of lactic acid bacteria. In
Lactic acid bacteria: Microbiology and Functional Aspects, 2nd ed (Salminen, S. and A. von Wright, editors). pp. 139-159. Marcel Dekker, Inc.: New York.
121
Parkin, K.L. and W.D. Brown. 1982. Preservation of seafood with modified atmospheres. In Chemistry and Biochemistry of Marine Food Products. (R.E. Martin, G.J. Flick, C.E. Hebard, and D.R. Ward, editors). pp. 453-465. AVI Publishing: Westport, CT.
Payne, K.R., J.C. Brooks, J.B. Morgan and F.K. Ray. 2002. The effect of fresh
and frozen storage on palatability, oxidative rancidity, and color of modified atmosphere packaged beef steaks. In Animal Science Research Report. Oklahoma State University: Stillwater, OK.
Pierson, M.D., D.L. Collins-Thompson, and Z.J. Ordal. 1970. Microbiological,
sensory, and pigment changes of aerobically and anaerobically packaged beef. Food Technol. 24:129-133.
Pittard, B.T., L.R. Freeman, D.W. Later, and M.L. Lee. 1982. Idenification of
volatile organic compounds produced by fluorescent pseudomonads on chicken breast meat. Appl. Environ. Microbiol. 43:1504-1506.
Riley, L.W., R.S. Remis, S.D. Helgerson, H.B. McGee, J.G. Wells, B.R. Davis,
R.J. Hebert, E.S. Olcott, L.M. Johnson, N.T. Hargrett, P.A. Blake, and M.L. Cohen. 1983. Hemorrhagic colitis associated with a rare Escherichia coli serotype. N. Engl. J. Med. 308:681-685.
Roozen, J.P. 1987. Effects of types I, II, and III antioxidants on phospholipid
oxidation in a meat model for warmed over flavor. Food Chem. 24:167-185.
Sahl, H.G., R.W. Jack, and G. Bierbaum. 1995. Biosynthesis and biological
activities of lantibiotics with unique post-transcriptional modifications. Eur. J. Biochem. 230:827-853.
Sanchez-Escalante, A., D. Djenane, G. Torrescano, J.A. Beltran, and P.
Roncales. 2001. The effects of ascorbic acid, taurine, carnosine and rosemary powder on colour and lipid stability of beef patties packaged in modified atmosphere. Meat Sci. 58:421-429.
Sanchez-Escalante, A., D. Djenane, G. Torrescano, J.A. Beltran, and P.
Roncales. 2003. Antioxidant action of borage, rosemary, oregano, and ascorbic acid in beef patties packaged in modified atmosphere. J. Food Sci. 68:339-344.
Senne, M.M. and S.E. Gilliland. 2003. Antagonistic action of cells of
Lactobacillus delbrueckii subsp. lactis against pathogenic and spoilage microorganisms in fresh meat systems. J. Food Prot. 66:418-425.
122
Sivertsvik, M., J.T. Rosnes, and H. Bergslien. 2002. Modified atmosphere packaging. In Minimal Processing Technologies in the Food Industry. (T. Ohlsson and N. Bengtsson, editors). pp. 61-86. CRC Press: Boston.
Smith, L., J.E. Mann, K. Harris, M.F. Miller, and M.M. Brashears. 2005.
Reduction of E. coli O157:H7 and Salmonella spp. in ground beef using lactic acid bacteria and the impact on sensory properties. J. Food Prot. (In Press.)
Somkuti, G.A. 2000. Lactic acid bacteria. In Encyclopedia of Food Microbiology
(J. Lederberg, editor). pp. 1-8. Academic Press: New York. Stiles, M.E. 1996. Biopreservation by lactic acid bacteria. A.v. Leeuwenhoek.
70:331-345. Stoick, S.M., J.I. Gray, A.M. Booren, and D.J. Buckley. 1991. Oxidative stability
of restructured beef steaks processed with oleoresin rosemary, tertiary butylhydroquinone, and sodium tripolyphosphate. J. Food Sci. 56:597-600.
Sutherland, J.P., J.T. Patterson, and J.G. Murray. 1975. Changes in the
microbiology of vaccum-packaged beef. J. Appl. Bacteriol. 39:227-237. Tarladgis, B.G., B.M. Watts, M.T. Younathan, and L. Dugan. 1960. A distillation
method for the quantitative determination of malonaldehyde in rancid foods. J. Amer. Oil Chem. Soc. 37:44-48.
Thomas, C.J. and T.A. McMeekin. 1981. Production of off odours by isolates
from poultry skins with particular references to volatile surfaces. J. Appl. Bacteriol. 51:529-534.
Turner, E.W., W.D. Paynter, E.J. Montie, M.W. Bessert, G.M. Struck, and F.C.
Olson. 1954. Use of the 2-thiobarbituric acid reagent to measure rancidity in frozen pork. Food Technol. 8:326-330.
Valley, G. 1928. The effect of carbon dioxide on bacteria. Quart. Rev. of Biol.
3:209-224. Vandenbergh, P.A. 1993. Lactic acid bacteria, their metabolic products and
interference with microbial growth. FEMS Microbiol. Rev. 12:221-238.
123
Venema, K., T. Abee, A.J. Haandrikman, K.J. Leenhouts, J. Kok, W.N. Konings, and G. Venema. 1993. Mode of action of lactococcin B, a thiol-activated bacteriocin from Lactobacillus lactis. Appl. Environ. Microbiol. 59:1041-1048.
Wachsmuth, I.K., P.H. Sparling, T.J. Barrett, and M.E. Potter. 1997.
Enterohemorrhagic Escherichia coli in the United States. FEMS Immunol. Med. Microbiol. 18:233-239.
Whittenbury, R. 1964. Hydrogen peroxide formation and catalase activity in the
lactic acid bacteria. J. Gen. Microbiol. 35:13-20. Younathan, M.T. and B.M. Watts. 1959. Relationship of meat pigments to lipid
oxidation. Food Res. 24:728-734.
124
APPENDIX A
SENSORY EVALUATION FORMS
125
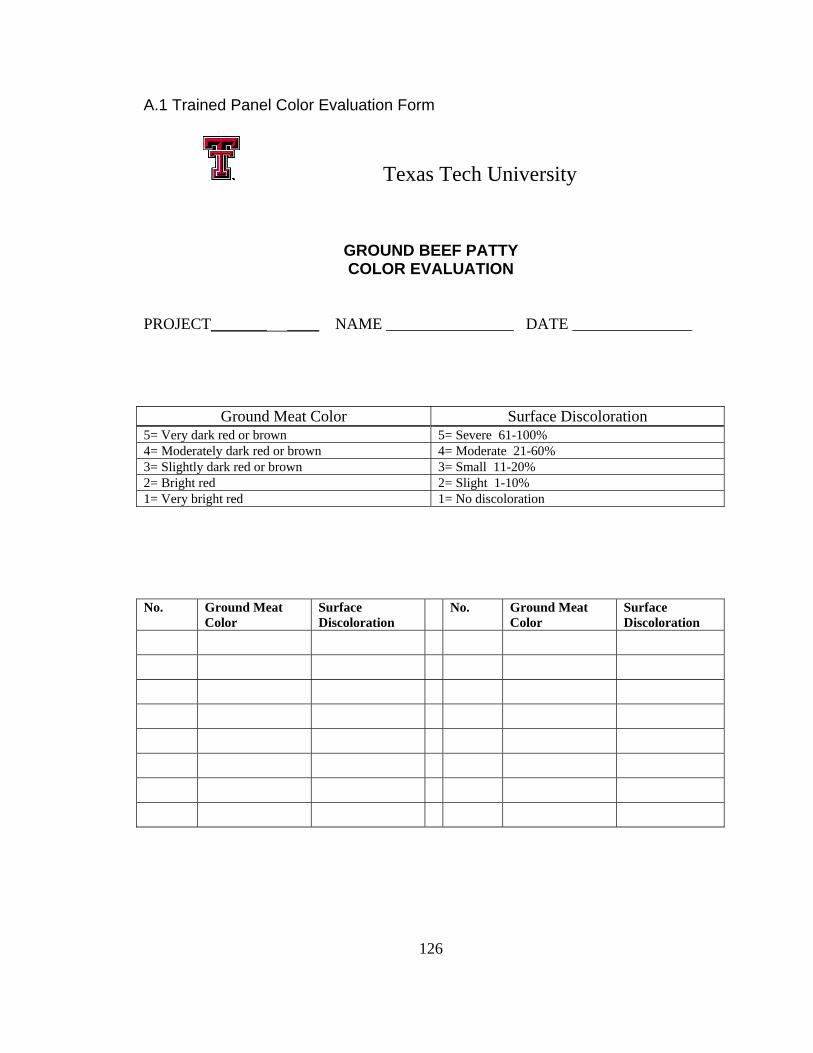
A.1 Trained Panel Color Evaluation Form
Texas Tech University
GROUND BEEF PATTY COLOR EVALUATION
PROJECT_______ ____ NAME ________________ DATE _______________
Ground Meat Color Surface Discoloration 5= Very dark red or brown 5= Severe 61-100% 4= Moderately dark red or brown 4= Moderate 21-60% 3= Slightly dark red or brown 3= Small 11-20% 2= Bright red 2= Slight 1-10% 1= Very bright red 1= No discoloration No. Ground Meat
Color Surface Discoloration
No. Ground Meat Color
Surface Discoloration
126
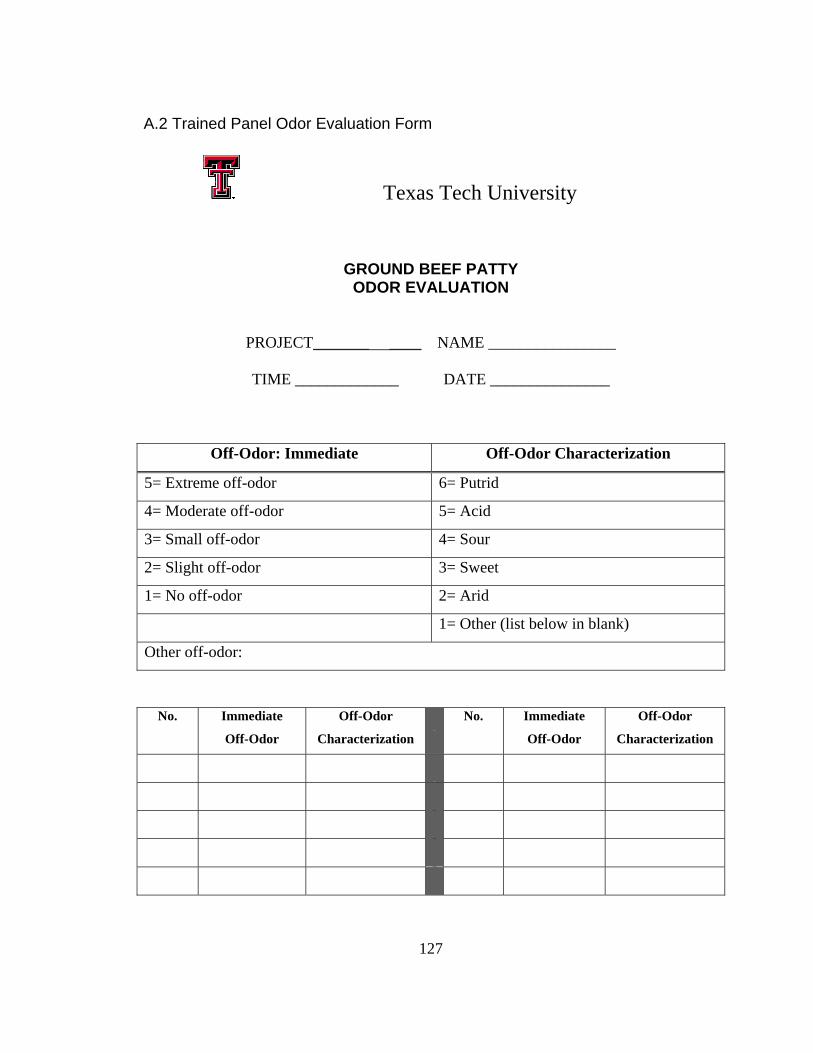
A.2 Trained Panel Odor Evaluation Form
Texas Tech University
GROUND BEEF PATTY ODOR EVALUATION
PROJECT_______ ____ NAME ________________
TIME _____________ DATE _______________
Off-Odor: Immediate Off-Odor Characterization
5= Extreme off-odor 6= Putrid
4= Moderate off-odor 5= Acid
3= Small off-odor 4= Sour
2= Slight off-odor 3= Sweet
1= No off-odor 2= Arid
1= Other (list below in blank)
Other off-odor:
No. Immediate
Off-Odor
Off-Odor
Characterization
No. Immediate
Off-Odor
Off-Odor
Characterization
127
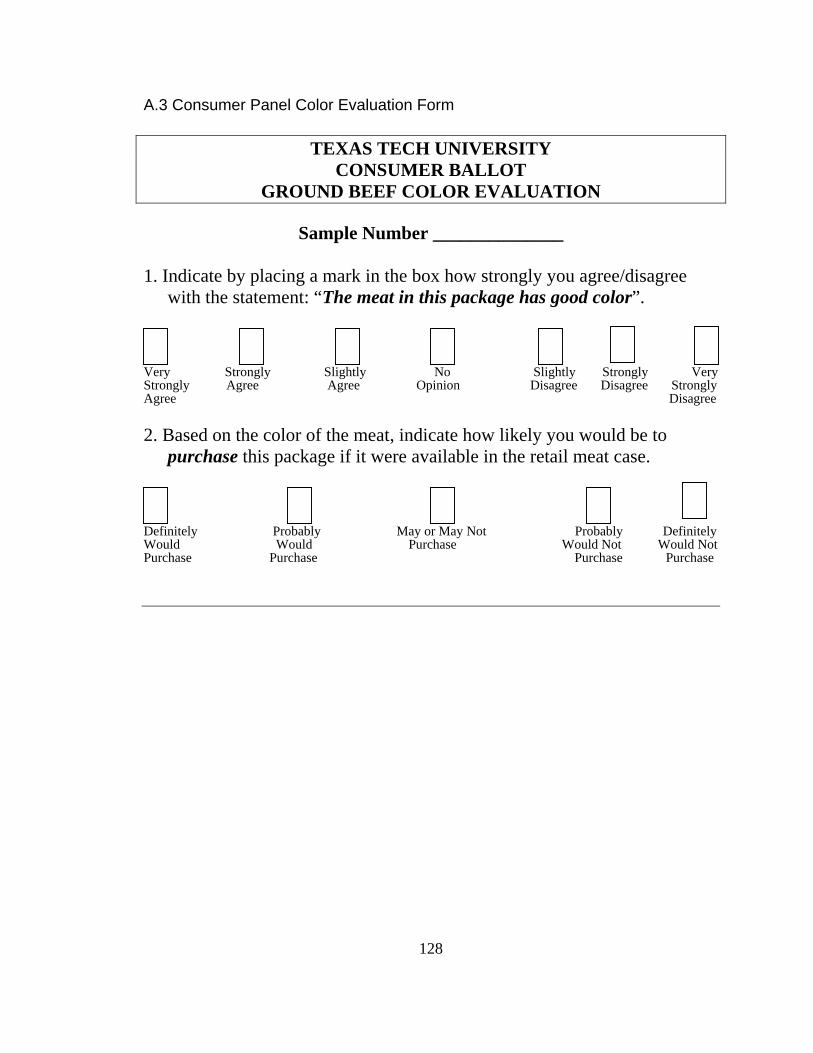
A.3 Consumer Panel Color Evaluation Form
TEXAS TECH UNIVERSITY CONSUMER BALLOT
GROUND BEEF COLOR EVALUATION
Sample Number ______________ 1. Indicate by placing a mark in the box how strongly you agree/disagree
with the statement: “The meat in this package has good color”. Very Strongly Slightly No Slightly Strongly Very Strongly Agree Agree Opinion Disagree Disagree Strongly Agree Disagree 2. Based on the color of the meat, indicate how likely you would be to
purchase this package if it were available in the retail meat case. Definitely Probably May or May Not Probably Definitely Would Would Purchase Would Not Would Not Purchase Purchase Purchase Purchase
128
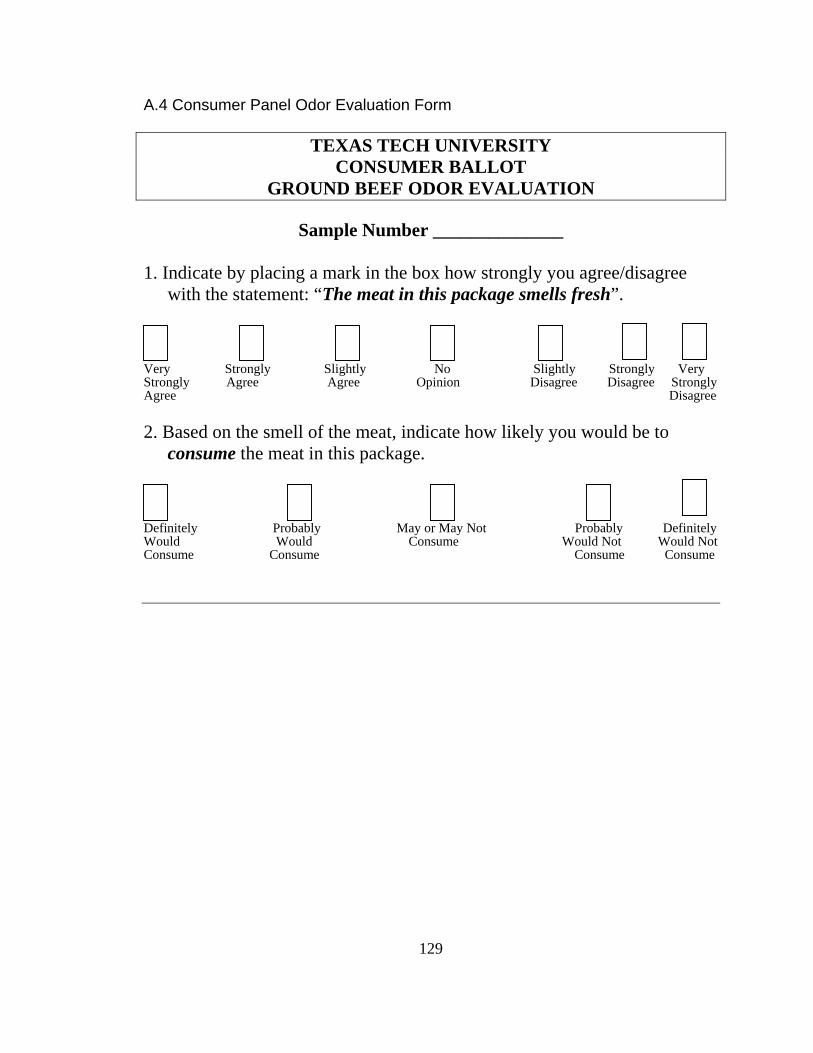
A.4 Consumer Panel Odor Evaluation Form
TEXAS TECH UNIVERSITY CONSUMER BALLOT
GROUND BEEF ODOR EVALUATION
Sample Number ______________ 1. Indicate by placing a mark in the box how strongly you agree/disagree
with the statement: “The meat in this package smells fresh”. Very Strongly Slightly No Slightly Strongly Very Strongly Agree Agree Opinion Disagree Disagree Strongly Agree Disagree 2. Based on the smell of the meat, indicate how likely you would be to
consume the meat in this package. Definitely Probably May or May Not Probably Definitely Would Would Consume Would Not Would Not Consume Consume Consume Consume
129
APPENDIX B
MALONALDEHYDE STANDARD CURVE
130
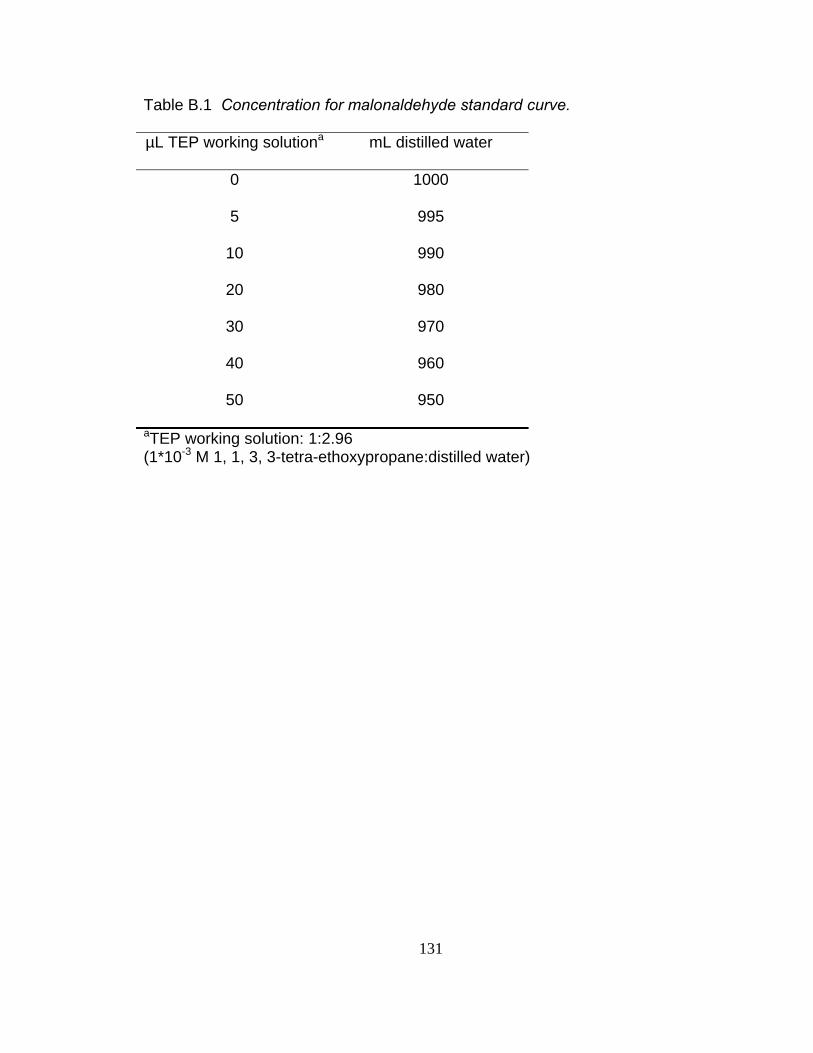
Table B.1 Concentration for malonaldehyde standard curve.
µL TEP working solutiona mL distilled water
0 1000
5 995
10 990
20 980
30 970
40 960
50 950
aTEP working solution: 1:2.96 (1*10-3 M 1, 1, 3, 3-tetra-ethoxypropane:distilled water)
131

APPENDIX C
P VALUE TABLES
132
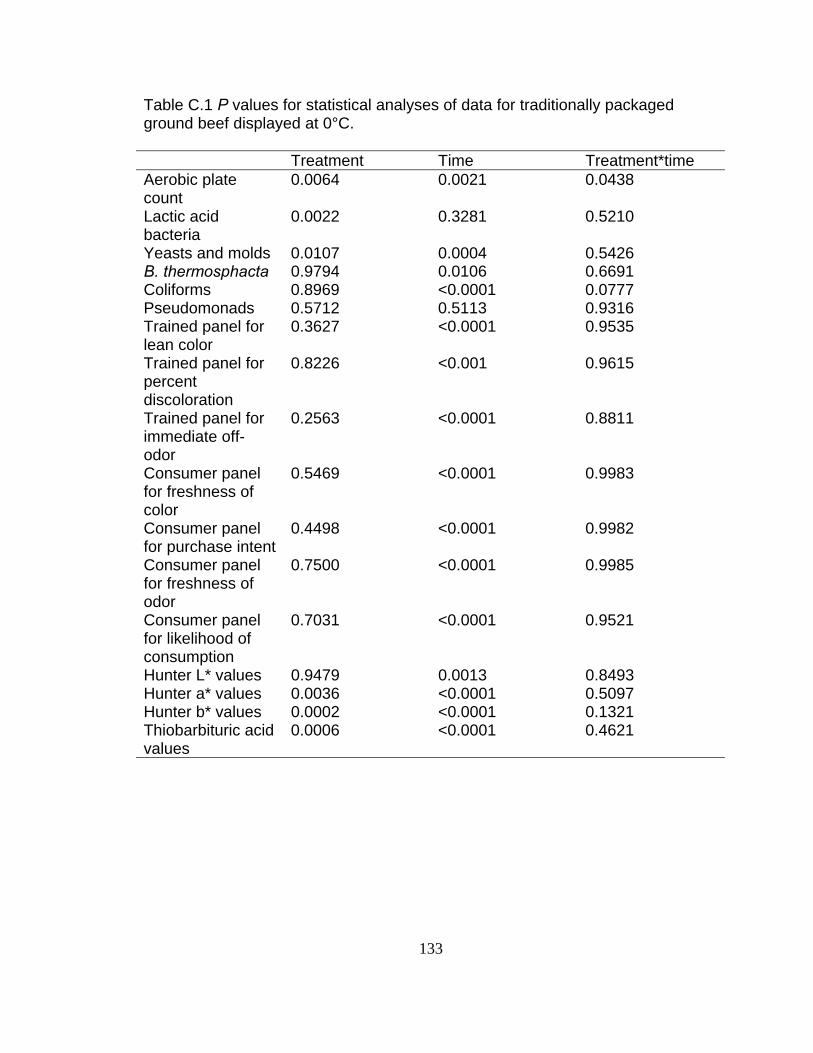
Table C.1 P values for statistical analyses of data for traditionally packaged ground beef displayed at 0°C. Treatment Time Treatment*time Aerobic plate count
0.0064 0.0021 0.0438
Lactic acid bacteria
0.0022 0.3281 0.5210
Yeasts and molds 0.0107 0.0004 0.5426 B. thermosphacta 0.9794 0.0106 0.6691 Coliforms 0.8969 <0.0001 0.0777 Pseudomonads 0.5712 0.5113 0.9316 Trained panel for lean color
0.3627 <0.0001 0.9535
Trained panel for percent discoloration
0.8226 <0.001 0.9615
Trained panel for immediate off-odor
0.2563 <0.0001 0.8811
Consumer panel for freshness of color
0.5469 <0.0001 0.9983
Consumer panel for purchase intent
0.4498 <0.0001 0.9982
Consumer panel for freshness of odor
0.7500 <0.0001 0.9985
Consumer panel for likelihood of consumption
0.7031 <0.0001 0.9521
Hunter L* values 0.9479 0.0013 0.8493 Hunter a* values 0.0036 <0.0001 0.5097 Hunter b* values 0.0002 <0.0001 0.1321 Thiobarbituric acid values
0.0006 <0.0001 0.4621
133
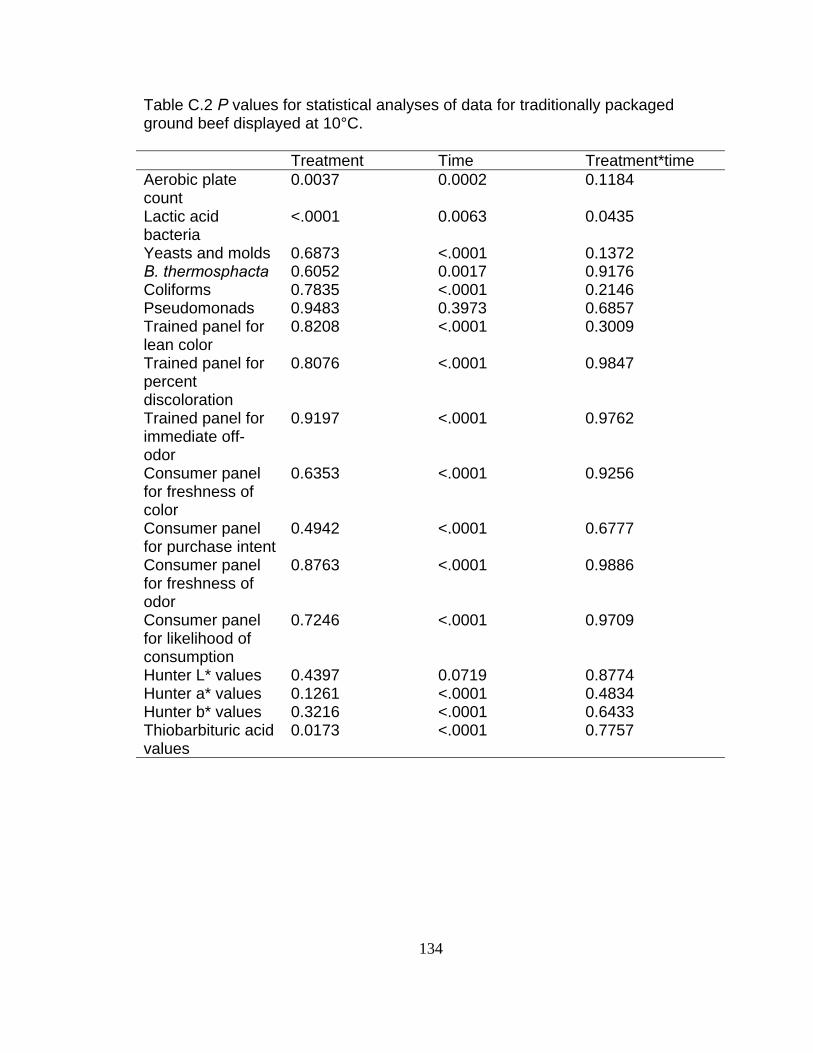
Table C.2 P values for statistical analyses of data for traditionally packaged ground beef displayed at 10°C. Treatment Time Treatment*time Aerobic plate count
0.0037 0.0002 0.1184
Lactic acid bacteria
<.0001 0.0063 0.0435
Yeasts and molds 0.6873 <.0001 0.1372 B. thermosphacta 0.6052 0.0017 0.9176 Coliforms 0.7835 <.0001 0.2146 Pseudomonads 0.9483 0.3973 0.6857 Trained panel for lean color
0.8208 <.0001 0.3009
Trained panel for percent discoloration
0.8076 <.0001 0.9847
Trained panel for immediate off-odor
0.9197 <.0001 0.9762
Consumer panel for freshness of color
0.6353 <.0001 0.9256
Consumer panel for purchase intent
0.4942 <.0001 0.6777
Consumer panel for freshness of odor
0.8763 <.0001 0.9886
Consumer panel for likelihood of consumption
0.7246 <.0001 0.9709
Hunter L* values 0.4397 0.0719 0.8774 Hunter a* values 0.1261 <.0001 0.4834 Hunter b* values 0.3216 <.0001 0.6433 Thiobarbituric acid values
0.0173 <.0001 0.7757
134

Table C.3 P values for statistical analyses of data for ground beef packaged in modified atmosphere and displayed at 0°C. Treatment Time Treatment*time Aerobic plate count
<.0001 0.7320 0.3273
Lactic acid bacteria
<.0001 0.2942 0.7927
Yeasts and molds 0.5582 0.0005 0.4845 B. thermosphacta 0.0236 <.0001 0.2710 Coliforms 0.5140 0.0004 0.8095 Pseudomonads 0.9355 0.9167 0.7493 Trained panel for lean color
0.2923 <.0001 0.8477
Trained panel for percent discoloration
0.7975 <.0001 0.6898
Trained panel for immediate off-odor
0.1707 <.0001 0.9878
Consumer panel for freshness of color
0.6389 <.0001 0.9693
Consumer panel for purchase intent
0.6425 <.0001 0.9975
Consumer panel for freshness of odor
0.7687 <.0001 0.9189
Consumer panel for likelihood of consumption
0.4002 <.0001 0.7883
Hunter L* values 0.3534 <.0001 0.6872 Hunter a* values 0.7102 <.0001 0.3801 Hunter b* values 0.7598 <.0001 0.4363 Thiobarbituric acid values
<.0001 <.0001 0.0614
135
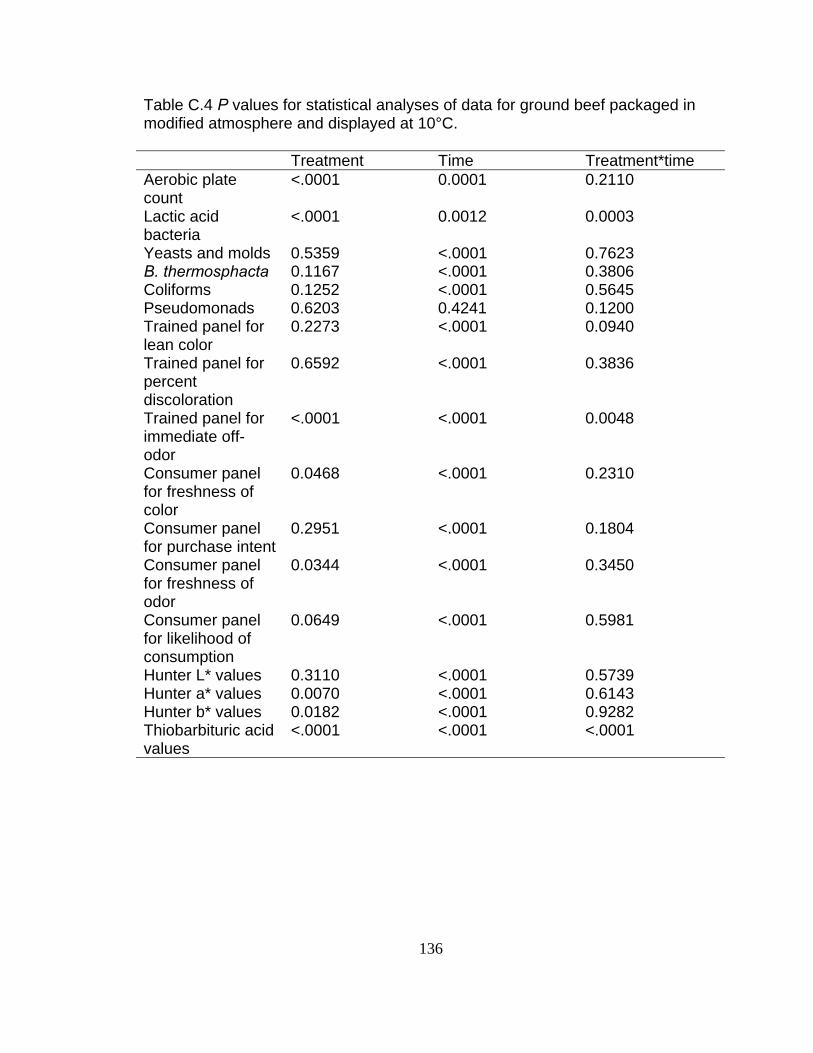
Table C.4 P values for statistical analyses of data for ground beef packaged in modified atmosphere and displayed at 10°C. Treatment Time Treatment*time Aerobic plate count
<.0001 0.0001 0.2110
Lactic acid bacteria
<.0001 0.0012 0.0003
Yeasts and molds 0.5359 <.0001 0.7623 B. thermosphacta 0.1167 <.0001 0.3806 Coliforms 0.1252 <.0001 0.5645 Pseudomonads 0.6203 0.4241 0.1200 Trained panel for lean color
0.2273 <.0001 0.0940
Trained panel for percent discoloration
0.6592 <.0001 0.3836
Trained panel for immediate off-odor
<.0001 <.0001 0.0048
Consumer panel for freshness of color
0.0468 <.0001 0.2310
Consumer panel for purchase intent
0.2951 <.0001 0.1804
Consumer panel for freshness of odor
0.0344 <.0001 0.3450
Consumer panel for likelihood of consumption
0.0649 <.0001 0.5981
Hunter L* values 0.3110 <.0001 0.5739 Hunter a* values 0.0070 <.0001 0.6143 Hunter b* values 0.0182 <.0001 0.9282 Thiobarbituric acid values
<.0001 <.0001 <.0001
136
PERMISSION TO COPY
In presenting this thesis in partial fulfillment of the requirements for a master’s
degree at Texas Tech University or Texas Tech University Health Sciences Center, I
agree that the Library and my major department shall make it freely available for
research purposes. Permission to copy this thesis for scholarly purposes may be granted
by the Director of the Library or my major professor. It is understood that any copying
or publication of this thesis for financial gain shall not be allowed without my further
written permission and that any user may be liable for copyright infringement.
Agree (Permission is granted.)
Amy Hoyle 4-4-2005 Student Signature Date Disagree (Permission is not granted.) _______________________________________________ _________________ Student Signature Date


