Embed Size (px)
Citation preview
HAL Id: tel-01413382https://pastel.archives-ouvertes.fr/tel-01413382
Submitted on 9 Dec 2016
HAL is a multi-disciplinary open accessarchive for the deposit and dissemination of sci-entific research documents, whether they are pub-lished or not. The documents may come fromteaching and research institutions in France orabroad, or from public or private research centers.
L’archive ouverte pluridisciplinaire HAL, estdestinée au dépôt et à la diffusion de documentsscientifiques de niveau recherche, publiés ou non,émanant des établissements d’enseignement et derecherche français ou étrangers, des laboratoirespublics ou privés.
Spoofing and disguise variations in face recognitionNeslihan Kose
To cite this version:Neslihan Kose. Spoofing and disguise variations in face recognition. Image Processing [eess.IV].Télécom ParisTech, 2014. English. �NNT : 2014ENST0020�. �tel-01413382�
2014-ENST-0020
EDITE - ED 130
Doctorat ParisTech
T H È S E
pour obtenir le grade de docteur délivré par
TELECOM ParisTech
Spécialité « Signal et Images »
présentée et soutenue publiquement par
Neslihan KÖSEle 14 Avril 2014
Spoofing and Disguise Variations
in Face Recognition
Directeur de thèse : Jean-Luc DUGELAY
JuryM. Marc ANTONINI, Directeur de Recherche, Laboratoire I3S 2000, CNRS Rapporteur
M. Abdenour HADID, Professeur, Université d’Oulu Rapporteur
M. Mohamed DAOUDI, Professeur, Telecom Lille 1 Examinateur
Mme. Özgül SALOR DURNA, Assoc. Professeur, Université de Gazi Examinateur
M. Kieron MESSER, Doctorant, Digital Barriers Examinateur
TELECOM ParisTechécole de l’Institut Télécom - membre de ParisTech
Spoofing and Disguise Variations in FaceRecognition
Neslihan Köse
A doctoral dissertation submitted to:
TELECOM ParisTech
in partial fulfillment of the requirements for the degree of:
DOCTOR OF PHILOSOPHY
Major subject: Biometrics, Image Processing
Approved by the following examining committee:
Supervisor: Prof. Jean-Luc DugelayPresident of the jury: Prof. Mohamed DaoudiReviewer: Prof. Marc AntoniniReviewer: Prof. Abdenour HadidExaminer: Assoc. Prof. Özgül Salor DurnaExaminer: Dr. Kieron Messer

Abstract
Human recognition has become an important topic as the need and investments
for security applications grow continuously. Biometrics enable reliable and efficient
identity management systems by using physical and behavioral characteristics of the
subjects that are permanent, universal and easy to access. This is why, the topic of
biometrics attracts higher attention today.
Numerous biometric systems exist which utilize various human characteristics. A-
mong all biometrics traits, face recognition is advantageous in terms of accessibility
and reliability. It allows identification at relatively high distances for unaware sub-
jects that do not have to cooperate.
In this dissertation, two challenges in face recognition are analyzed. The first one is
face spoofing. Initially, spoofing in face recognition is explained together with the
countermeasure techniques that are proposed for the protection of face recognition
systems against spoofing attacks. The second challenge explored in this thesis is
disguise variations. In the second part of the thesis, the impact of disguise varia-
tions on face recognition is analyzed and the proposed techniques that are robust
to these variations are explained.
In a spoofing attempt, a person tries to masquerade as another person and thereby,
tries to gain access to a recognition system. Since face data can be acquired easily
in a contactless manner, spoofing is a real threat for face recognition systems.
In this dissertation, initially, a countermeasure technique is proposed for the de-
tection of photograph attacks, which was our preliminary study that helps to gain
insight into the topic of face spoofing.
Then 3D mask attacks to face recognition systems are investigated. Compared to 2D
spoofing attacks such as photograph and video, 3D mask attacks to face recognition
systems is a considerably new subject. In this thesis, we evaluate how vulnerable
the existing 3D and 2D face recognition systems are to spoofing mask attacks. The
results of this study show that existing recognition systems are not robust against
mask attacks and hence countermeasures have to be developed to mitigate their
impact.
Next, we analyze several characteristics of masks and real samples such as texture,
reflectance and smoothness, and propose four countermeasure techniques for the de-
tection of 3D mask attacks. All these countermeasures provide significant detection
accuracies alone. However we observed that fusion of these countermeasures further
improves the results.

ii Abstract
The second challenge in face recognition explored in this thesis is disguise varia-
tions. In the next part of this thesis, the disguise variations which are due to facial
alterations, facial makeup and facial accessories (occlusions) are explored.
Modifications on the facial surface can be achieved in countless different ways such
as applying plastic surgery, prosthetic makeup and latex appliances. In our study
regarding facial alterations, a simulated nose alteration database was prepared using
FRGC v1.0, then the impact of nose alteration was evaluated on both 2D and 3D
face recognition.
Next, we propose a block based face recognition approach, which mitigates the im-
pact of facial alterations on face recognition. Although this technique is applied for
nose alterations in our study, it can be applied for any types of surgical operations
on face.
Facial makeup is another type of disguise variations. In order to analyze the impact
of facial makeup on face recognition, we prepared a facial cosmetics database, which
includes many samples annotated as non-makeup, slight makeup and heavy makeup.
The impact of makeup on face recognition was analyzed in detail and we observed
that especially makeup for eye region takes an important role in face recognition.
Finally, in order to establish the connections between the Kinect sensor and face
recognition, we present the first publicly available face database based on the Kinect
sensor for face recognition. The database consists of different data modalities and
multiple facial variations. We conduct benchmark evaluations on the proposed
database using standard face recognition methods. The performance gain is demon-
strated by integrating the depth data with the RGB data via score-level fusion.
We also compare the Kinect images with the traditional high quality 3D scans (of
the FRGC database), which demonstrates the imperative needs of the proposed
database for face recognition.

Abstract iii


Acknowledgments
First of all, I would like to present my special thanks to my supervisor Prof. Jean-Luc
Dugelay for his guidance, understanding and support throughout the development
of this thesis. Next, I would like to thank all of my colleagues for their friendship
and collaboration.
I am also grateful to the members of the examining committee of this dissertation
for their precious time and for their constructive comments.
My warmest thanks are to my family in Turkey who supported and motivated me
with their never ending sacrifice, support, understanding and love throughout this
demanding study. I always feel very lucky to have such a wonderful family.
Finally, I would like to express my deepest gratitude to my dear husband Aykut for
his love, support and understanding. He has always been with me. I am thankful
to him for sharing this entire amazing journey with me.

Contents
Abstract . . . . . . . . . . . . . . . . . . . . . . . . . . . . . . . . . . . . . i
Acknowledgments . . . . . . . . . . . . . . . . . . . . . . . . . . . . . . . . v
Contents . . . . . . . . . . . . . . . . . . . . . . . . . . . . . . . . . . . . . v
List of Figures . . . . . . . . . . . . . . . . . . . . . . . . . . . . . . . . . xi
List of Tables . . . . . . . . . . . . . . . . . . . . . . . . . . . . . . . . . . xv
List of Publications . . . . . . . . . . . . . . . . . . . . . . . . . . . . . . . xvii
1 Introduction 1
1.1 Motivation . . . . . . . . . . . . . . . . . . . . . . . . . . . . . . . . . 1
1.2 Original Contributions . . . . . . . . . . . . . . . . . . . . . . . . . . 3
1.3 Outline . . . . . . . . . . . . . . . . . . . . . . . . . . . . . . . . . . 4
2 Face Spoofing and Disguise Variations 7
2.1 Introduction . . . . . . . . . . . . . . . . . . . . . . . . . . . . . . . . 7
2.1.1 Biometrics . . . . . . . . . . . . . . . . . . . . . . . . . . . . . 7
2.1.2 Face Recognition . . . . . . . . . . . . . . . . . . . . . . . . . 8
2.2 Spoofing in Face Recognition . . . . . . . . . . . . . . . . . . . . . . 10
2.2.1 2D Spoofing Attacks and Countermeasures . . . . . . . . . . 10
2.2.2 3D Spoofing Attacks and Countermeasures . . . . . . . . . . 12
2.3 Disguise Variations in Face Recognition . . . . . . . . . . . . . . . . 15
2.3.1 Facial Alterations and Countermeasures . . . . . . . . . . . . 15
2.3.2 Facial Makeup and Countermeasures . . . . . . . . . . . . . . 17
2.3.3 Facial Accessories (Occlusions) and Countermeasures . . . . . 18
2.4 Conclusions . . . . . . . . . . . . . . . . . . . . . . . . . . . . . . . . 20
3 Countermeasure Technique Against Photograph Attacks 21
3.1 Introduction . . . . . . . . . . . . . . . . . . . . . . . . . . . . . . . . 21
3.2 The Photograph Database . . . . . . . . . . . . . . . . . . . . . . . . 22
3.3 The Proposed Approach . . . . . . . . . . . . . . . . . . . . . . . . . 23
3.3.1 Pre-Processing . . . . . . . . . . . . . . . . . . . . . . . . . . 23
3.3.2 Feature Extraction . . . . . . . . . . . . . . . . . . . . . . . . 24
3.4 Experiments and Analysis . . . . . . . . . . . . . . . . . . . . . . . . 28
3.4.1 Test 1: Results under Illumination Change . . . . . . . . . . . 28
3.4.2 Test 2: Effect of DoG Filtering in the Proposed Approach . . 30
3.5 Conclusion . . . . . . . . . . . . . . . . . . . . . . . . . . . . . . . . . 31
4 Impact of Mask Spoofing on Face Recognition 33
4.1 Introduction . . . . . . . . . . . . . . . . . . . . . . . . . . . . . . . . 33
4.2 The Mask Database . . . . . . . . . . . . . . . . . . . . . . . . . . . 34
4.3 The Selected Face Recognition Systems . . . . . . . . . . . . . . . . 36
4.3.1 Pre-Processing . . . . . . . . . . . . . . . . . . . . . . . . . . 36
viii Contents
4.3.2 Face Recognition Systems . . . . . . . . . . . . . . . . . . . . 37
4.4 Experiments and Analysis . . . . . . . . . . . . . . . . . . . . . . . . 39
4.5 Conclusions . . . . . . . . . . . . . . . . . . . . . . . . . . . . . . . . 41
5 Countermeasure Techniques Against Mask Attacks 43
5.1 Introduction . . . . . . . . . . . . . . . . . . . . . . . . . . . . . . . . 43
5.2 Countermeasure Techniques Against Mask Attacks . . . . . . . . . . 45
5.2.1 Techniques used Inside the Proposed Countermeasures . . . . 45
5.2.2 The Proposed Countermeasures . . . . . . . . . . . . . . . . . 50
5.3 Experiments and Analysis . . . . . . . . . . . . . . . . . . . . . . . . 52
5.3.1 Stand-Alone Classification Performances of the Countermea-
sures . . . . . . . . . . . . . . . . . . . . . . . . . . . . . . . . 53
5.3.2 Integration of the Countermeasure to 3D Face Recognition
System . . . . . . . . . . . . . . . . . . . . . . . . . . . . . . . 56
5.4 Conclusions . . . . . . . . . . . . . . . . . . . . . . . . . . . . . . . . 58
6 Impact of Nose Alterations on Face Recognition 61
6.1 Introduction . . . . . . . . . . . . . . . . . . . . . . . . . . . . . . . . 61
6.2 Simulating Nose Alterations . . . . . . . . . . . . . . . . . . . . . . . 63
6.3 Experiments and Analysis . . . . . . . . . . . . . . . . . . . . . . . . 65
6.3.1 Impact on 2D Face Recognition . . . . . . . . . . . . . . . . . 66
6.3.2 Impact on 3D Face Recognition . . . . . . . . . . . . . . . . . 68
6.4 Conclusion . . . . . . . . . . . . . . . . . . . . . . . . . . . . . . . . . 69
7 Face Recognition Robust to Nose Alterations 73
7.1 Introduction . . . . . . . . . . . . . . . . . . . . . . . . . . . . . . . . 73
7.2 Block Based Face Recognition Approach Robust to Nose Alterations 74
7.3 Experiments and Analysis . . . . . . . . . . . . . . . . . . . . . . . . 78
7.3.1 Evaluation on 2D Face Recognition . . . . . . . . . . . . . . 79
7.3.2 Evaluation on 3D Face Recognition . . . . . . . . . . . . . . . 81
7.4 Conclusion . . . . . . . . . . . . . . . . . . . . . . . . . . . . . . . . . 82
8 Facial Cosmetics Database and Impact Analysis on Face Recogni-
tion 85
8.1 Introduction . . . . . . . . . . . . . . . . . . . . . . . . . . . . . . . . 85
8.2 Facial Cosmetics Database . . . . . . . . . . . . . . . . . . . . . . . . 87
8.2.1 Specification of the Database . . . . . . . . . . . . . . . . . . 87
8.2.2 Acquisition of Images . . . . . . . . . . . . . . . . . . . . . . 87
8.2.3 Structure of the Database . . . . . . . . . . . . . . . . . . . . 88
8.3 Facial Cosmetics . . . . . . . . . . . . . . . . . . . . . . . . . . . . . 89
8.3.1 Specification of Facial Cosmetics . . . . . . . . . . . . . . . . 89
8.3.2 Classification of Applied Facial Cosmetics . . . . . . . . . . . 90
8.4 Evaluation and Results . . . . . . . . . . . . . . . . . . . . . . . . . . 92
8.4.1 Test Setup . . . . . . . . . . . . . . . . . . . . . . . . . . . . . 92
Contents ix
8.4.2 Evaluation Results . . . . . . . . . . . . . . . . . . . . . . . . 92
8.5 Conclusion . . . . . . . . . . . . . . . . . . . . . . . . . . . . . . . . . 96
9 Kinect Face Database and Impact Analysis on Face Recognition 97
9.1 Introduction . . . . . . . . . . . . . . . . . . . . . . . . . . . . . . . . 97
9.2 Review of 3D Face Databases . . . . . . . . . . . . . . . . . . . . . . 98
9.3 The Kinect Face Database . . . . . . . . . . . . . . . . . . . . . . . . 100
9.3.1 Database Structure . . . . . . . . . . . . . . . . . . . . . . . . 101
9.3.2 Acquisition Environment . . . . . . . . . . . . . . . . . . . . . 103
9.3.3 Acquisition Process . . . . . . . . . . . . . . . . . . . . . . . . 103
9.3.4 Post-Processing . . . . . . . . . . . . . . . . . . . . . . . . . . 106
9.3.5 Potential database usages in addition to face recognition . . . 109
9.4 Benchmark Evaluations . . . . . . . . . . . . . . . . . . . . . . . . . 110
9.4.1 Baseline Techniques and Settings . . . . . . . . . . . . . . . . 110
9.4.2 Pre-processing . . . . . . . . . . . . . . . . . . . . . . . . . . 111
9.4.3 Evaluation Protocol . . . . . . . . . . . . . . . . . . . . . . . 111
9.4.4 Evaluation Results . . . . . . . . . . . . . . . . . . . . . . . . 112
9.4.5 Fusion of RGB and Depth Face Data . . . . . . . . . . . . . . 116
9.5 Data Quality Assessment of KinectFaceDB and FRGC . . . . . . . . 117
9.6 Conclusion . . . . . . . . . . . . . . . . . . . . . . . . . . . . . . . . . 119
10 Conclusions and Future Perspectives 121
10.1 Summary . . . . . . . . . . . . . . . . . . . . . . . . . . . . . . . . . 121
10.2 Future Work . . . . . . . . . . . . . . . . . . . . . . . . . . . . . . . 123
Résumé Etendu en Français . . . . . . . . . . . . . . . . . . . . . . . . . . 125
11 Résumé Etendu en Français 125
Bibliography 147

List of Figures
2.1 An example photograph attack for spoofing purposes. Figure is taken
from [64]. . . . . . . . . . . . . . . . . . . . . . . . . . . . . . . . . . 11
2.2 Masks obtained from ThatsMyFace.com. The picture is taken from [41]. 14
2.3 Example for (a) lip augmentation, (b) Otoplasty or ear surgery, (c)
liposubmental chin implant and liposuction of chin/neck, and (d) face
resurfacing. The pictures are taken from [127]. . . . . . . . . . . . . . 16
2.4 Reference Image and Makeup Serie Images. . . . . . . . . . . . . . . 18
2.5 Example of images for occlusion from the AR Face Database [91]. . . 19
3.1 Each column contains samples from session 1, session 2 and session
3. In each row, the left pair is from a live human and the right
from a photo. It contains various changes (e.g., sex, illumination,
with/without glasses). Figure is taken from [131]. . . . . . . . . . . . 22
3.2 Circular representations of selections (P = 8, R = 1) and (P = 12,
R = 1.5). Figure is taken from [52]. . . . . . . . . . . . . . . . . . . . 25
3.3 Different photo-attacks are shown from column (1) to column (5): (1)
move the photo horizontally, vertically, back and front; (2) rotate the
photo in depth along the vertical axis; (3) the same as (2) but along
the horizontal axis; (4) bend the photo inward and outward along
the vertical axis; (5) the same as (4) but along the horizontal axis.
Figure is taken from [131]. . . . . . . . . . . . . . . . . . . . . . . . . 26
3.4 Comparison of detection rates using SLR, SNLR, SVM as classifiers
and LTVp, LTVu, LTVfused, DoG and HF as input features. This
figure is taken from [131]. . . . . . . . . . . . . . . . . . . . . . . . . 29
4.1 (upper row) Example samples for paper and fabric masks, (lower row)
Masks in the upper row which are worn on the face. The pictures are
taken from [132]. . . . . . . . . . . . . . . . . . . . . . . . . . . . . . 35
4.2 Example from the mask database which is created by MORPHO.
From left to right (upper row) The real face, the cropped texture
image, the 3D scan after preprocessing, the cropped depth map esti-
mated from the raw 3D scan (lower row) same images for the corre-
sponding mask attack. . . . . . . . . . . . . . . . . . . . . . . . . . . 36
4.3 The feature extraction scheme and an illustration on a sample model:
(a) The subject’s face with and without texture (b) generic model
before and after alignment (c) generic model after warping with and
without texture. This figure is taken from [39]. . . . . . . . . . . . . 38
4.4 The DET Curves of the 3D and 2D face baseline biometric system
with/without mask attacks, respectively. . . . . . . . . . . . . . . . . 40
xii List of Figures
5.1 Example from the mask database which is created by [98] (a) The real
face with texture, the reflectance image and the illumination image of
the real face (b) Same images associated with the mask of the same
person. . . . . . . . . . . . . . . . . . . . . . . . . . . . . . . . . . . . 49
5.2 The flowchart of the proposed countermeasures. . . . . . . . . . . . . 51
5.3 The Classification Performances of the Countermeasures. . . . . . . . 54
5.4 The DET Curves of the 3D face baseline biometric system when in-
tegrating the countermeasure. . . . . . . . . . . . . . . . . . . . . . . 58
6.1 Examples of nose alterations with before (upper row) and after (lower
row) photos: (a) plastic surgery [133] (b) latex appliance [120] (c)
makeup using wax [19] . . . . . . . . . . . . . . . . . . . . . . . . . . 62
6.2 Examples of facial hair, expression and makeup variations on the
facial images between before (upper row) and after (lower row) plastic
surgery procedure . . . . . . . . . . . . . . . . . . . . . . . . . . . . . 63
6.3 From left to right: (a) Nose region with landmark points, color map,
depth map and profile view for the target model (b) Same images
for the source model (c) Two models superimposed before and af-
ter alignment, resulting mesh after warping and profile view for the
synthesized model . . . . . . . . . . . . . . . . . . . . . . . . . . . . 65
6.4 Verification rates for all 2D FR algorithms by Experiment 1 (left) and
Experiment 2 (right). . . . . . . . . . . . . . . . . . . . . . . . . . . . 68
6.5 Verification rates for all 3D FR algorithms by Experiment 1 (left) and
Experiment 2 (right). . . . . . . . . . . . . . . . . . . . . . . . . . . . 69
6.6 Two examples of nose alterations with and without textures (upper
row: originals lower row: altered). . . . . . . . . . . . . . . . . . . . . 70
7.1 (a) Texture image divided into 36 blocks (b) Depth map divided into
36 blocks. (c) Image showing the ordering of blocks (BI represents
Block I). . . . . . . . . . . . . . . . . . . . . . . . . . . . . . . . . . . 75
7.2 Dissimilarity Results obtained for original vs. original comparison
between Image 1 and Image 2 and original vs. synthetic comparison
between Image 1 and Image 3. . . . . . . . . . . . . . . . . . . . . . . 76
7.3 An example showing the identification rates computed at each of 36
successive computations using depth maps. . . . . . . . . . . . . . . 77
8.1 Impact of Facial Cosmetics on the Perception of a Face. This figure
is taken from [138]. . . . . . . . . . . . . . . . . . . . . . . . . . . . . 86
8.2 Reference Image and Makeup Series Images in their Original Form . 87
8.3 Reference Image and Makeup Series Images in their Rotated and
Cropped Form . . . . . . . . . . . . . . . . . . . . . . . . . . . . . . 88
8.4 Makeup Classification Rules Depending on Steps . . . . . . . . . . . 89
8.5 IDR when Reference Images are selected from No Makeup Images . . 93
List of Figures xiii
8.6 IDR when Reference Images are selected from Intermediate Makeup
Images . . . . . . . . . . . . . . . . . . . . . . . . . . . . . . . . . . . 95
9.1 Demographics of KinectFaceDB validation partition by: (a) gender,
(b) age, and (c) ethnicity. . . . . . . . . . . . . . . . . . . . . . . . . 101
9.2 Illustration of different facial variations acquired in our database: (a)
neutral face; (b) smiling; (c) mouth open; (d) strong illumination;
(e) occlusion by sunglasses; (f) occlusion by hand; (g) occlusion by
paper; (h) right face profile and (i) left face profile. (Upper: the RGB
images. Lower: the depth maps aligned with above RGB images.) . . 102
9.3 Procedure to record the video sequence: the head movement of a
participant follows the path (1 → 2 → 3 → 4 → 5 → 6). The head
yaw is first performed which follows the procedure (approximately):
0◦ → +90◦ → −90◦ → 0◦; then the head pitch is performed as:
0◦ → +45◦ → −45◦ → 0◦. . . . . . . . . . . . . . . . . . . . . . . . . 102
9.4 Illustration of the RGB-D alignment: the depth map (left) is aligned
with the RGB image (right) captured by the Kinect at the same time. 106
9.5 Illustration of color mapping on 3D points cloud of a given face: from
left to right views. . . . . . . . . . . . . . . . . . . . . . . . . . . . . 107
9.6 Cropped and smoothed 3D face captured by the Kinect (upper row)
and Minolta (lower row) of the same person, frontal view (left column)
and side view (right column). The 3D face from Minolta keeps more
details (wrinkles, eyelids etc.). . . . . . . . . . . . . . . . . . . . . . . 108
9.7 The 6 facial anchor points: 1. left eye center, 2. right eye center, 3.
nose-tip, 4. left mouth corner, 5. right mouth corner and 6. chin. . . 108
9.8 An example of a 3D face model generated using a video of cooperative
head movement (images taken from [56]). . . . . . . . . . . . . . . . 110
9.9 The ROC curves of 2D and 2.5D based face recognition using PCA
for different facial variations. . . . . . . . . . . . . . . . . . . . . . . 112
11.1 Chaque colonne contient des échantillons de la session 1, session 2 et
session 3 de la base de données NUAA [131]. Dans chaque rangée, la
paire gauche est d’un humain vivant et la paire droite d’une photo.
Il contient diverses modifications (par exemple, le genre, l’éclairage,
avec/sans lunettes). Illustration extraite de [131]. . . . . . . . . . . . 129
11.2 L’exemple de la base de données masque qui est créé par MORPHO.
De gauche à droite (rangée du haut) Le vrai visage, l’image de texture
recadrée, l’acquisition 3D aprés prétraitement, la carte centrée de
profondeur estimée à partir de l’acquisition brute 3D (rangée du bas)
les mêmes images avec l’attaque du masque correspondante. . . . . . 131
11.3 L’organigramme des contre-mesures proposées. . . . . . . . . . . . . 133
11.4 Les performances de classification des contre-mesures. . . . . . . . . 134
xiv List of Figures
11.5 De gauche à droite: (a) la région du nez avec des points de repére,
carte des couleurs, carte de profondeur et de profil pour le modéle
cible (b) Les mêmes images pour le modéle de source (c) Deux modèles
superposés avant et après l’alignement, le maillage résultant après
déformation et vue de profil pour le modèle synthétisé. . . . . . . . . 136
11.6 Les taux de vérification pour tous les algorithmes 2D pour l’expérience
1 (à gauche) et l’expérience 2 (à droite). . . . . . . . . . . . . . . . . 137
11.7 Les taux de vérification pour tous les algorithmes 3D pour l’expérience
1 (à gauche) et l’expérience 2 (à droite). . . . . . . . . . . . . . . . . 137
11.8 Les résultats de dissemblances obtenus par comparaison originale vs.
originale entre Image 1 et Image 2, et par comparaison originale vs.
synthétique entre Image 1 et Image 3. . . . . . . . . . . . . . . . . . 139
11.9 L’exemple de la base de données de visage maquillés pour une image
de référence et de série d’images dans leur forme originale. . . . . . . 140
11.10Les taux d’identification (Les images de référence sont choisies parmi
les images sans maquillage). . . . . . . . . . . . . . . . . . . . . . . . 142
11.11L’illustration des différentes variations du visage incluses dans notre
base de données: (a) le visage neutre; (b) le sourire; (c) la bouche
ouverte; (d) un fort éclairage; (e) l’occultations par des lunettes de
soleil; (f) l’occultations à la main; (g) l’occultations par papier; (h)
le profil de la face droite et (i) le profil de la face gauche. (Supérieur:
les images RGB. Inférieures: Des cartes de profondeur alignés avec
des images RGB ci-dessus)) . . . . . . . . . . . . . . . . . . . . . . . 144

List of Tables
3.1 Number of Images in the NUAA Database for Train and Test Sets . 23
3.2 Proposed Approach Results Using All LBPV Patterns . . . . . . . . 28
3.3 Proposed Approach Results Using only Uniform LBPV Patterns . . 28
3.4 Proposed Approach Results with DoG Filtering and without DoG
Filtering as Pre-Processing Step . . . . . . . . . . . . . . . . . . . . . 30
4.1 Number of Images in the Mask Database for Train and Test Sets . . 36
4.2 EER, Verification Rate at 0.001 FAR and Rank-1 Identification Rate
(IR) for the 3D and 2D baseline systems using the Mask Database
(MD) and the FRGC Database. . . . . . . . . . . . . . . . . . . . . . 41
5.1 AUC, EER and Accuracy Results Using the Four Countermeasures . 53
5.2 AUC, EER and Accuracy Results for the Fusion Scenarios of the
Proposed Countermeasures . . . . . . . . . . . . . . . . . . . . . . . 55
6.1 Rank-1 identification accuracies for 2D FR algorithms for Experiment
1, 2 and 3 . . . . . . . . . . . . . . . . . . . . . . . . . . . . . . . . . 67
6.2 Verification rates at 0.001 FAR for 2D FR algorithms for Experiment
1, 2 and 3 . . . . . . . . . . . . . . . . . . . . . . . . . . . . . . . . . 67
6.3 Rank-1 identification accuracies for 3D FR algorithms for Experiment
1, 2 and 3 . . . . . . . . . . . . . . . . . . . . . . . . . . . . . . . . . 69
6.4 Verification rates at 0.001 FAR for 3D FR algorithms for Experiment
1, 2 and 3 . . . . . . . . . . . . . . . . . . . . . . . . . . . . . . . . . 69
7.1 Rank-1 identification accuracies obtained for three cases using the
same data of the example in Figure 7.3. . . . . . . . . . . . . . . . . 78
7.2 Rank-1 identification accuracies for 2D FR algorithms for Experiment
2 on Real Plastic Surgery Database (P. A is proposed approach, H.A
is holistic approach). . . . . . . . . . . . . . . . . . . . . . . . . . . . 80
7.3 Rank-1 identification accuracies for 2D FR using two approaches for
Experiment 1 and 2 . . . . . . . . . . . . . . . . . . . . . . . . . . . 81
7.4 Verification rates at 0.001 FAR for 2D FR using two approaches for
Experiment 1 and 2 . . . . . . . . . . . . . . . . . . . . . . . . . . . 81
7.5 Rank-1 identification accuracies for 3D FR using two approaches for
Experiment 1 and 2 . . . . . . . . . . . . . . . . . . . . . . . . . . . 82
7.6 Verification rates at 0.001 FAR for 3D FR using two approaches for
Experiment 1 and 2 . . . . . . . . . . . . . . . . . . . . . . . . . . . 82
8.1 Eight Makeup Steps . . . . . . . . . . . . . . . . . . . . . . . . . . . 90
8.2 Categories of the Impact of Facial Cosmetics . . . . . . . . . . . . . . 91

xvi List of Tables
9.1 Summary of Off-the-Shelf 3D Face Databases. . . . . . . . . . . . . . 99
9.2 Rank-1 Identification Rate for 2D Face Recognition. . . . . . . . . . 113
9.3 Verification Rate (FAR = 0.001) for 2D Face Recognition. . . . . . . 113
9.4 Rank-1 Identification Rate for 2.5D Face Recognition. . . . . . . . . 114
9.5 Verification Rate (FAR = 0.001) for 2.5D Face Recognition. . . . . . 115
9.6 Rank-1 Identification Rate for 3D Face Recognition. . . . . . . . . . 115
9.7 Verification Rate (FAR = 0.001) for 3D Face Recognition. . . . . . . 116
9.8 Fusion of RGB and Depth for Face Recognition Rank-1 Identification
Rate. . . . . . . . . . . . . . . . . . . . . . . . . . . . . . . . . . . . . 117
9.9 Fusion of RGB and Depth for Face Recognition Verification Rate
(FAR = 0.001). . . . . . . . . . . . . . . . . . . . . . . . . . . . . . . 117
9.10 KinectFaceDB vs. FRGC . . . . . . . . . . . . . . . . . . . . . . . . 118

List of Publications
Book Chapter
• Kose Neslihan, Dugelay Jean-Luc, Vatsa Mayank, Singh Richa, "Recognizing
Face Images With Disguise Variations", Face Recognition in Adverse Condi-
tions, IGI Press; 2014.
• Velardo Carmelo, Dugelay Jean-Luc, Daniel Lionel, Dantcheva Antitza, Er-
dogmus Nesli, Kose Neslihan, Min Rui, Zhao Xuran, "Introduction to Biom-
etry", Multimedia Image and Video Processing, CRC Press; 2012; ISBN:978-
1439830864.
Journal
• Kose Neslihan, Dugelay Jean-Luc, "Mask Spoofing in Face Recognition and
Countermeasures", submitted to Image and Vision Computing Journal - El-
sevier, under second round review.
• Min Rui, Kose Neslihan, Dugelay Jean-Luc, "KinectFaceDB: a Kinect Face
Database for Face Recognition", accepted for IEEE Transactions on Systems,
Man, and Cybernetics: Systems.
• Dugelay Jean-Luc, Erdogmus Nesli, Kose Neslihan, "3D face recognition:
Where we are", IEEE COMSOC MMTC E-Letter, vol. 6, no 11, pp. 14-
16, November 2011.
Conference
• Kose Neslihan, Dugelay Jean-Luc, "Shape and Texture Based Countermeasure
to Protect Face Recognition Systems Against Mask Attacks", IEEE Computer
Society Workshop on Biometrics, CVPR Workshop on Biometrics 2013, June
23-28 2013, Portland, USA.
• Kose Neslihan, Dugelay Jean-Luc, "Reflectance Analysis Based Countermea-
sure Technique to Detect Face Mask Attacks", IEEE International Conference
on Digital Signal Processing, DSP 2013, July 1-3 2013, Santorini, Greece.
• Kose Neslihan, Dugelay Jean-Luc, "Countermeasure for the Protection of Face
Recognition Systems Against Mask Attacks", IEEE International Conference
on Automatic Face and Gesture Recognition, FG 2013, April 22-26 2013,
Shanghai, China. (Received Best Student Paper Honorable Mention
Award)
• Kose Neslihan, Dugelay Jean-Luc, "On The Vulnerability of Face Recogni-
tion Systems to Spoofing Mask Attacks", IEEE International Conference on
Acoustics, Speech, and Signal Processing, ICASSP 2013, May 26-31 2013,
Vancouver, Canada.

xviii List of Publications
• Eckert Marie-Lena, Kose Neslihan, Dugelay Jean-Luc, "Facial Cosmetics Data-
base and Impact Analysis on Automatic Face Recognition", IEEE Interna-
tional Workshop on Multimedia Signal Processing, MMSP 2013, Sep 30 - Oct
2 2013, Sardinia, Italy.
• Kose Neslihan, Erdogmus Nesli, Dugelay Jean-Luc, "Block Based Face Recog-
nition Approach Robust to Nose Alterations", IEEE International Conference
on Biometrics: Theory, Applications and Systems, BTAS 2012, Sep 23-27
2012, Washington DC.
• Erdogmus Nesli, Kose Neslihan, Dugelay Jean-Luc, "Impact Analysis of Nose
Alterations on 2D and 3D Face Recognition", IEEE International Workshop
on Multimedia Signal Processing, MMSP 2012, Sep 17-19 2012, Canada.
• Kose Neslihan, Dugelay Jean-Luc, "Classification of Captured and Recaptured
Images to Detect Photograph Spoofing", International Conference on Infor-
matics, Electronics & Vision, ICIEV 2012, May 18-19 2012, Dhaka, Bangladesh.
Chapter 1
Introduction
1.1 Motivation
Biometrics aim to measure and analyze biological data such as fingerprints, eye
retinas, irises, DNA, facial patterns, voice patterns and hand measurements, for
authentication purposes.
Due to the increasing need and investments for security applications, authentication
by biometric verification is becoming increasingly common in corporate and public
security systems. The reason is that biometrics enable reliable and efficient identity
management systems by using physical and behavioral characteristics of the sub-
jects that are permanent, universal and easy to access.
For a long time, passwords have been utilized for user authentication. However,
since users are required to remember more, longer, and changing passwords, the
need for more convenient and secure solution to user authentication increases. The
motivation to improve the security systems based on single or multiple biometric
traits rather than passwords comes from this fact.
Each biometric has their own advantages and disadvantages. For example, finger-
print is the most wide-spread biometric from a commercial point of view [3], however
it requires strong user collaboration. Similarly, iris recognition is very accurate, how-
ever it highly depends on the image quality and also requires active participation of
the subjects.
Face recognition is advantageous in terms of both accessibility and reliability. It
allows identification at relatively high distances for unaware subjects that do not
have to cooperate.
Despite the fact that face recognition has been investigated extensively, it still suffers
from variations due to various factors in real-world scenarios such as illumination,
pose, expression, occlusion and age. Since the three-dimensional (3D) face evades
pose and illumination problems, 3D face recognition became very popular.
In this thesis, two challenges in face recognition are analyzed, which are spoofing and
disguise variations. Although these challenges affect the performances of both 2D
and 3D face recognition systems significantly, the studies on these topics are limited.
2 Chapter 1. Introduction
In a spoofing attempt, a person tries to masquerade as another person and thereby,
tries to gain access to a recognition system. Since face data can be acquired easily in
a contactless manner, spoofing is a real threat for face recognition systems. Due to
the limited number of studies on this topic, today spoofing (including anti-spoofing)
is a very popular topic for researchers in face recognition domain.
The most common spoofing attacks to face recognition systems are achieved by using
photographs and videos due to their convenience and low cost. It has been shown
that face recognition systems are vulnerable to photograph and video attacks. Aim
is to develop non-intrusive countermeasures without extra devices and human in-
volvement which can be integrated into existing face recognition systems to protect
them against spoofing attacks.
Compared to 2D spoofing attacks such as photograph and video, 3D mask attacks
to face recognition systems is a considerably new subject. The main reason for the
delay in mask spoofing studies is due to the unavailability of public mask databases.
The preparation of a mask attacks database is much more difficult and expensive
than the preparation of photograph or video attacks databases. Initially, to prepare
a high quality mask, a 3D scanner is necessary to obtain the 3D model of the target
person, which are generally high-cost devices. The procedure continues with manu-
facturing of the masks which is also an expensive procedure.
In this dissertation, the main motivation is to develop countermeasure techniques in
order to protect face recognition systems against spoofing attacks. For this purpose,
we investigated both 2D and 3D face spoofing.
We first analyzed 2D spoofing attacks, which can be performed by using photographs
or videos. We proposed a new countermeasure technique in [72] for the detection
of photograph attacks. This study was our preliminary study that helps to gain
insight into the topic of face spoofing.
After our analysis on 2D attacks, we investigated 3D mask attacks. There are still
only a few number of studies regarding 3D mask spoofing in face recognition. Ini-
tially, we show how vulnerable the existing 3D and 2D face recognition systems are
to spoofing mask attacks. The results of this study show that existing recognition
systems are not robust against mask attacks and countermeasures have to be devel-
oped to mitigate the impact of these attacks.
Next, we analyzed several characteristics of masks and real face samples such as tex-
ture, reflectance and smoothness, and developed several countermeasure techniques.
We also integrated the countermeasure providing the best performance to the se-
lected 3D face recognition system in order to show the performance improvement
with the countermeasure.
1.2. Original Contributions 3
Disguise accessories can be used to alter the appearance of an individual, to im-
personate another person, or to hide one’s identity. Although face recognition with
disguise variations is a major challenge, the research studies on this topic are lim-
ited. The motivation to analyze disguise variations in face recognition comes from
this fact. In this dissertation, variations due to facial alterations, facial makeup and
facial accessories are investigated.
Since plastic surgery becomes more advanced and affordable, it introduces new chal-
lenges for face recognition systems. There is no publicly available 3D plastic surgery
database. Therefore, in order to analyze the impact of facial alterations on both 2D
and 3D face recognition, we prepared a 2D+3D simulated nose alteration database,
in which nose of each sample is replaced with another randomly chosen one. In our
study, we demonstrated the decrease in recognition performances for both modal-
ities, especially for 3D, in the existance of nose alterations. This is why, next, we
proposed a block based face recognition approach, which mitigates the impact of
facial alterations on face recognition.
Facial makeup changes the perceived appearance of a face and therefore have an
impact on face recognition. Since makeup does not change 3D shape characteristics
of a face, it has mainly an impact on 2D face recognition. In order to evaluate
their impact in detail, we present a facial cosmetics database, which includes many
samples annotated as non-makeup, slight makeup and heavy makeup.
Finally, in order to establish the connections between the Kinect sensor and face
recognition, we present a Kinect face database, which is the first publicly available
face database collected by Kinect sensor. Although being very cheap compared to
the high-quality scanners, significant recognition performances can be achieved with
the use of Kinect sensor. Benchmark evaluations were conducted on the proposed
database for several variations including occlusions, expression and illumination.
1.2 Original Contributions
The original contributions of this thesis can be summarized in eight classes: the
impact analysis of mask spoofing on existing face recognition systems, several coun-
termeasures to detect mask and photograph attacks, a simulated nose alteration
database, an approach robust to facial alterations, an extensive facial cosmetics
database, an extensive Kinect Face Database, and several benchmark evaluations to
show the performances of techniques using Kinect data.
Spoofing is a real threat for existing face recognition systems. Up to now, several
countermeasures have been developed in order to protect face recognition systems
against spoofing attacks. However, these countermeasures have been developed
4 Chapter 1. Introduction
mainly against photograph and video attacks.
One of the main contributions of this study is that 3D mask spoofing in face recog-
nition is analyzed in detail. To the best of our knowledge, the impact of 3D
mask attacks on both 2D and 3D face recognition systems was first analyzed in
our study [74].
Then, we analyzed several characteristics of masks and real samples and developed
countermeasures based on texture, reflectance and smoothness characteristics. In
our study [73], it was the first time 3D data was utilized to detect 3D mask at-
tacks. Each of these proposed countermeasures is novel and also is still one of the
few studies which exists in the literature for the detection of 3D mask attacks. All
the countermeasures proposed against mask attacks in this dissertation provide sig-
nificant detection accuracies alone, however we also observed that almost perfect
detection accuracy can be reached by the fusion of these countermeasures.
Disguise variations is another major challenge in face recognition. Although several
challenges in face recognition have been explored extensively, there are still limited
studies on variations due to facial alterations, facial makeup and occlusions.
For facial alteration analysis, since there is no publicly available 3D plastic surgery
database, in order to simulate facial alterations, we prepared a 2D+3D nose alter-
ations database, which enables to analyze the impact of facial alterations on both
2D and 3D face recognition.
Next, a block based face recognition approach is proposed in this study, which can be
applied for any facial surgical operations, to increase the recognition performances.
For facial makeup analysis, a publicly available facial cosmetics database is pre-
sented and the impact of facial makeup on face recognition is demonstrated and
analyzed in detail.
Finally, the first publicly available Kinect Face Database is presented. Benchmark
evaluations are conducted and the performance gain is demonstrated by integrating
the depth data with the RGB data via score-level fusion. We also compare the
Kinect images with the traditional high quality 3D scans (of the FRGC database)
in the context of face biometrics, which demonstrates the imperative needs of the
proposed database for face recognition.
1.3 Outline
The outline of the dissertation is as follows:
• In Chapter 2, we provide an introduction to face spoofing and disguise varia-

1.3. Outline 5
tions, reviewing the state-of-the-art for the relevant work.
• In Chapter 3, our countermeasure technique, which is utilized to protect face
recognition systems against photograph attacks, is presented.
• In Chapter 4, the impact of mask spoofing on both 2D and 3D face recognition
is evaluated.
• In Chapter 5, our countermeasure techniques, which are utilized to protect
face recognition systems against 3D mask attacks, are presented.
• In Chapter 6, the impact of facial alterations (particularly nose alteration) on
both 2D and 3D face recognition is analyzed.
• In Chapter 7, a block based face recognition approach, which is robust to facial
alterations, is proposed.
• In Chapter 8, we initially present a facial cosmetics database. Then we analyze
the impact of facial cosmetics on face recognition.
• In Chapter 9, a Kinect Face Database, which includes different modalities
and several variations, is presented. We conduct benchmark evaluations using
standard face recognition methods, and demonstrate the performance gain by
integrating the depth data with the RGB data via score-level fusion.
• In Chapter 10, the conclusions and future perspectives are provided.

Chapter 2
Face Spoofing and Disguise
Variations
2.1 Introduction
Human recognition has become an important topic as the need and investments
for security applications grow continuously. Biometrics enable reliable and efficient
identity management systems by using physical and behavioral characteristics of the
subjects that are permanent, universal and easy to access. This is why, the topic of
biometrics attracts higher attention today.
In this section, we initially explain how a biometrics system works and then we give
a brief information on face recognition.
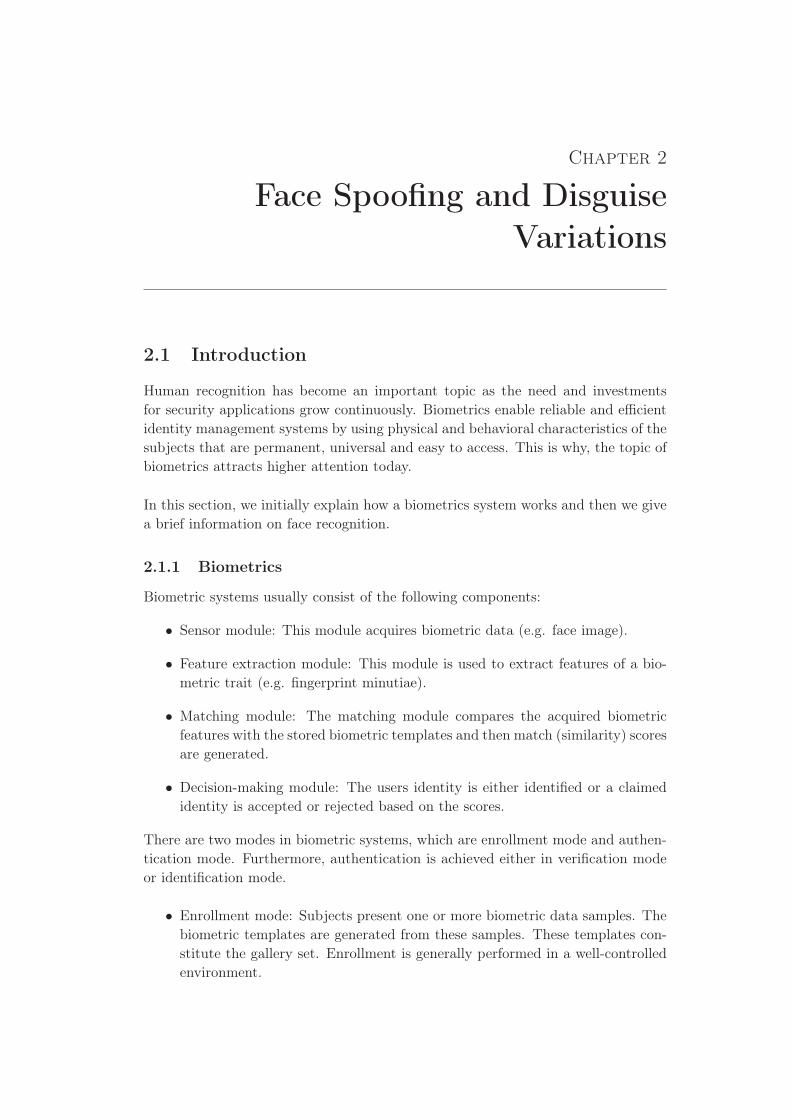
2.1.1 Biometrics
Biometric systems usually consist of the following components:
• Sensor module: This module acquires biometric data (e.g. face image).
• Feature extraction module: This module is used to extract features of a bio-
metric trait (e.g. fingerprint minutiae).
• Matching module: The matching module compares the acquired biometric
features with the stored biometric templates and then match (similarity) scores
are generated.
• Decision-making module: The users identity is either identified or a claimed
identity is accepted or rejected based on the scores.
There are two modes in biometric systems, which are enrollment mode and authen-
tication mode. Furthermore, authentication is achieved either in verification mode
or identification mode.
• Enrollment mode: Subjects present one or more biometric data samples. The
biometric templates are generated from these samples. These templates con-
stitute the gallery set. Enrollment is generally performed in a well-controlled
environment.
8 Chapter 2. Face Spoofing and Disguise Variations
• Authentication mode: Biometric data of user is acquired and used by the
system either for verification or identification purposes. The biometric data
captured for recognition is a probe sample. In verification mode, the probe
sample is matched with the claimed template for validation, and it either
accepts or rejects the identity claim. Verification is one-to-one matching. On
the other hand, in identification mode, all biometric references in the gallery
are examined and the one with the best match-score denotes the class of the
input. Identification is one-to-many matching.
In verification mode, if the match score is above some threshold, the identity claim
is accepted. Otherwise, it is rejected. There are four outcomes of this setting which
are:
1. True accept: The person is genuine and the claim is verified.
2. True reject: The person is impostor and the claim is not verified.
3. False accept: The person is impostor and the claim is verified.
4. False reject: The person is genuine and the claim is not verified.
In order to show the verification performances of recognition systems, generally Re-
ceiver Operating Characteristic (ROC) curve is utilized, which represents the prob-
ability of true acceptance versus probability of false acceptance. In this thesis, we
report the verification performances not only using ROC curves. In some cases, we
also show verification performances using Detection Error Trade-Off (DET) curve,
which is a variant of ROC curve. The primary difference is that y-axis is the false
rejection rate instead of true acceptance rate in DET curve. Finally, in this study,
we also use the term Equal Error Rates (EER) to show verification performances.
EER is the value where False Acceptance Rate (FAR) and False Rejection Rate
(FRR) are equal.
In identification, rank phenomenon is introduced. In this thesis, the rank-1 identi-
fication is utilized to show the identification performances. In rank-1 identification,
a probe is identified as the first ID in the list of subjects sorted in decreasing order
of computed similarity scores.
2.1.2 Face Recognition
Face recognition [144] is the least intrusive biometric technique from the acquisition
point of view. It has been applied to a wide range of commercial and law enforce-
ment applications. In comparison to other popular biometric characteristics (such
as fingerprint [60] and iris [35]), face recognition (for either identification or verifi-
cation) requires less user cooperation and thus can be integrated in many advanced
conditions (notably in video surveillance).
2.1. Introduction 9
In face recognition systems, first face is detected and segmented from the back-
ground. Next, several landmarks are annotated, which are used in normalization
of the face. Then feature extraction is applied and authentication is done either in
verification or identification mode.
Although literature works (salient contributions such as Eigenface [12], Fisher-
face [12] and Local Binary Patterns (LBP) [4]) reports highly accurate results on well
controlled datasets, the introduction of new face databases (for example, The Facial
Recognition Technology (FERET) [108], Face Recognition Vendor Test (FRVT) [14]
and Face Recognition Grand Challenge (FRGC) [107] by National Institute of Stan-
dards and Technology (NIST)) challenges the standard techniques by providing dif-
ferent variations (expressions, illuminations, poses etc.), large number of subjects, as
well as new data modalities (2D, 3D, video etc.). As a consequence, the proposition
of those databases greatly stimulates the development of more robust and reliable
face recognition methods.
Recent surveys [3,18] have suggested that face recognition exploiting 3D shape cues
(either in the format of 3D curvature description or 2.5D depth feature) demon-
strates the superiority over typical intensity image based methods. For instance, 3D
shape information is invariant to illumination variations. It supplies complemen-
tary information with respect to 2D textures and viewpoint variations are readily
addressed by rigid surface registrations [13, 24]. However, because most of the lit-
erature works report their results on the face database with high quality 3D data
(e.g. 3D faces in FRGC, which are obtained by a digital laser scanner [122], with
depth resolution of 0.1 mm within the typical sensing range), there is an unbalanced
matching between the 2D and 3D data in terms of both efficiency and accuracy. With
respect to efficiency, the acquisition of a high resolution RGB image normally takes
< 0.05s, whereas the laser scanning of a face depth map consumes 9s in average [107]
(and hence with high user cooperation, which is conflicting with the non-cooperative
property of face recognition). Regarding accuracy, the measurement of an object
with 10 cm depth along the z axis needs 10 bits representation, whereas all intensity
information are represented by 8 bits. Due to the above imbalance, it is not per-
fectly fair to compare 2D and 3D face recognition using such data, and it impedes
the use of 3D and multi-modal (2D+3D) face recognition in practical scenarios.
Fortunately, the Kinect sensor reduces above problems by providing both 2D and 3D
information simultaneously at interactive rates, where the practical 3D and 2D+3D
face recognition systems are feasible for real-time and online processing [95]. Even
though the overall sensing quality of the Kinect is known better than the sensors
using stereo vision or ToF, it is still much inferior than the laser scanning quality
which is usually considered in 3D face recognition researches.
As 3D sensing technologies advance and the acquisition devices become more ac-
curate and less expensive, the utilization of 3D face recognition and range data
10 Chapter 2. Face Spoofing and Disguise Variations
together with color data broadens.
In this thesis, the aim is not to propose new face recognition techniques. On con-
trary, we analyze how the performances of 2D and 3D face recognition systems are
affected by spoofing attacks and disguise variations and then we propose counter-
measure techniques to mitigate their impact on face recognition.
Security reflects how vulnerable the biometric system is to attacks like spoofing or
tampering biometric data. Despite the fact that face recognition has been investi-
gated extensively, spoofing is a major challenge for face recognition systems. In this
chapter, first, we briefly describe what face spoofing is. A survey of the literature
on spoofing in face recognition including the impact analysis and countermeasures
is presented.
Disguise variations is another major challenge in face recognition. This is why, in
the second part, we describe disguise variations and then a survey of the litera-
ture on disguise variations in face recognition including the impact analysis and
countermeasures is presented.
2.2 Spoofing in Face Recognition
In a spoofing attempt, a person tries to masquerade as another person and thereby,
tries to gain access to a recognition system. Since face data can be acquired easily
in a contactless manner, spoofing is a real threat for face recognition systems.
There are several types of spoofing attacks such as photograph, video or mask at-
tacks. Due to its 3D face shape characteristics, the detection of 3D mask attacks
appears to be more challenging compared to the detection of 2D attacks such as
photograph and video attacks. In this section, spoofing in face recognition is an-
alyzed in two groups as 2D spoofing attacks and countermeasures and 3D spoofing
attacks and countermeasures.
2.2.1 2D Spoofing Attacks and Countermeasures
The most common spoofing attacks to face recognition systems are achieved by
using photographs and videos due to their convenience and low cost. It has been
shown that face recognition systems are vulnerable to photograph and video at-
tacks. For instance, in the study of Määtta et al. [87], it is stated that the Windows
XP and Vista laptops of Lenovo, Asus and Toshiba can be spoofed easily. These
laptops authenticate users by scanning their faces. According to [87], at Black Hat
2009 conference, the Security and Vulnerability Research Team of the University of
Hanoi demonstrated how to easily spoof the systems "Lenovo’s Veriface III", "Asus’
SmartLogon V1.0.0005", and "Toshiba’s Face Recognition 2.0.2.32" using fake facial
images of the user. In [87], it is also claimed that this vulnerability is now listed
2.2. Spoofing in Face Recognition 11
in the National Vulnerability Database of the National Institute of Standards and
Technology (NIST) in the US. This simple example demonstrates that countermea-
sure techniques have to be developed to enhance the security and robustness of face
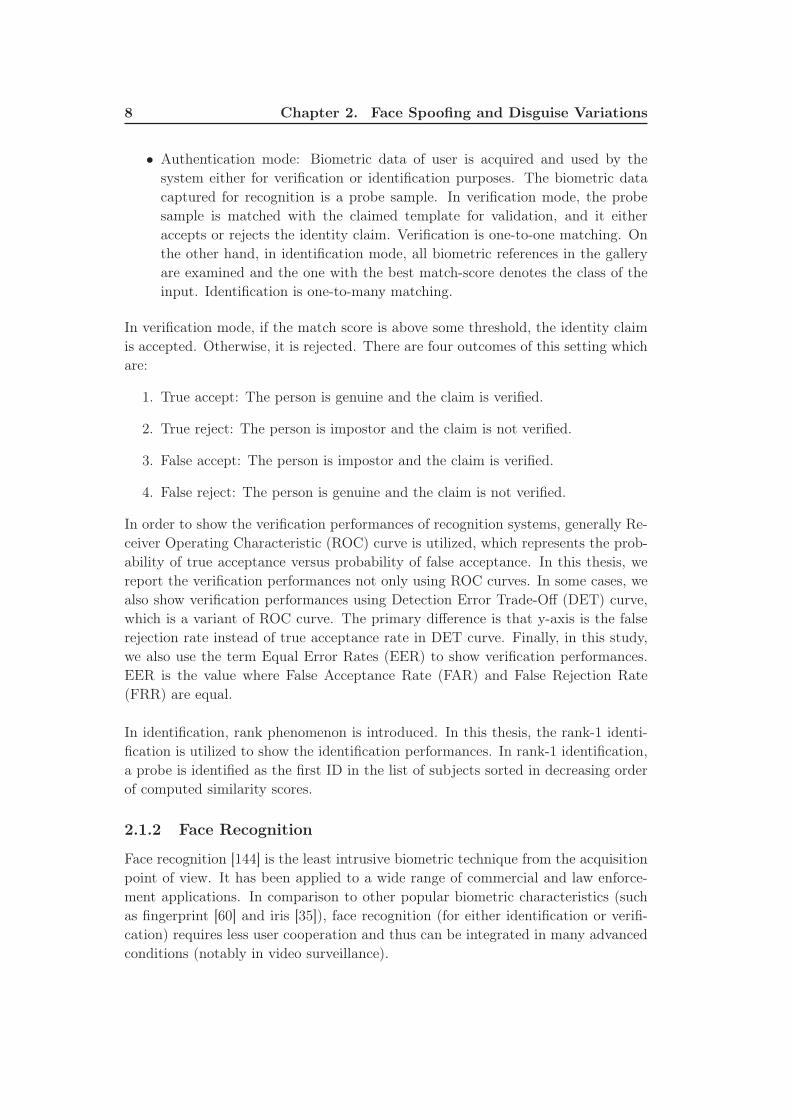
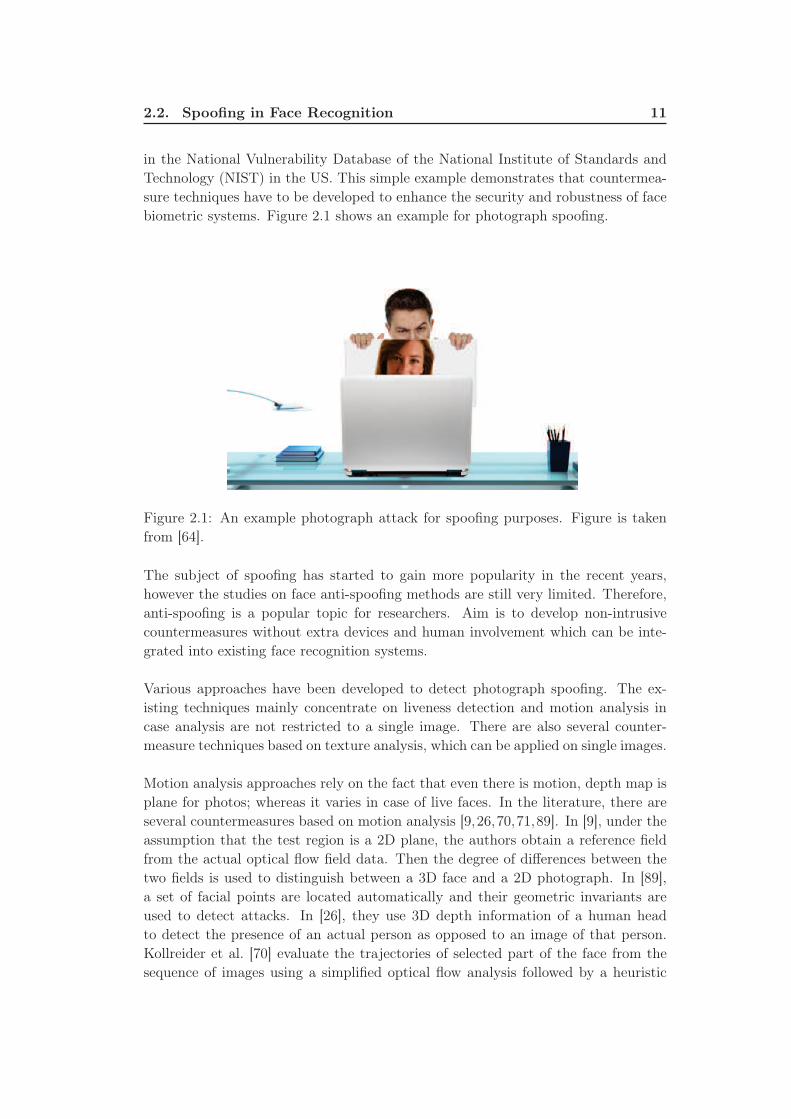
biometric systems. Figure 2.1 shows an example for photograph spoofing.
Figure 2.1: An example photograph attack for spoofing purposes. Figure is taken
from [64].
The subject of spoofing has started to gain more popularity in the recent years,
however the studies on face anti-spoofing methods are still very limited. Therefore,
anti-spoofing is a popular topic for researchers. Aim is to develop non-intrusive
countermeasures without extra devices and human involvement which can be inte-
grated into existing face recognition systems.
Various approaches have been developed to detect photograph spoofing. The ex-
isting techniques mainly concentrate on liveness detection and motion analysis in
case analysis are not restricted to a single image. There are also several counter-
measure techniques based on texture analysis, which can be applied on single images.
Motion analysis approaches rely on the fact that even there is motion, depth map is
plane for photos; whereas it varies in case of live faces. In the literature, there are
several countermeasures based on motion analysis [9,26,70,71,89]. In [9], under the
assumption that the test region is a 2D plane, the authors obtain a reference field
from the actual optical flow field data. Then the degree of differences between the
two fields is used to distinguish between a 3D face and a 2D photograph. In [89],
a set of facial points are located automatically and their geometric invariants are
used to detect attacks. In [26], they use 3D depth information of a human head
to detect the presence of an actual person as opposed to an image of that person.
Kollreider et al. [70] evaluate the trajectories of selected part of the face from the
sequence of images using a simplified optical flow analysis followed by a heuristic
12 Chapter 2. Face Spoofing and Disguise Variations
classifier. In the other study of Kollreider et al. [71], they fuse these scores with
liveness properties such as eye-blinks or mouth movements.
Countermeasures based on liveness detection examine movements such as eye-blinking
[105] or lip movements [25]. However, since liveness is detected by recognizing spon-
taneous eye-blinks or lip movements, again analysis require several images among
time.
There are also several texture analysis based countermeasure techniques, which can
be applied on single images. For instance, spoofing can be detected by analyzing
the frequency spectrum of a live face [82, 131]. In [82], it is assumed that the high
frequency components of photos are less than those of live face images. However,
this method gives good results when photo images have low definition and small
size as stated in [131]. In [8], images are examined to find printing artifacts. In the
studies of Määtta et al. [87, 88], micro-texture details and texture and local shape
details of real faces and face prints are analyzed, respectively, and very satisfactory
performances are reported for the detection of face print attacks using the publicly
available NUAA Database [33].
In the study of Chakka et al. [22], the results of a competition on countermeasures
to 2D facial spoofing attacks are reported. This study provides a comparative study
of different techniques using the same protocols and data. For the competition, they
used the publicly available PRINT-ATTACK biometric (face) database [34]. The
database consists of 200 videos of real accesses and 200 videos of attack attempts
of 50 different identities. The motivation behind this competition is to compare the
performance of different state-of-the-art algorithms on the same database using a
unique evaluation method. Six different teams from universities around the world
have participated in the contest. Two teams, IDIAP and UOULU proposed texture
analysis based countermeasures and obtained zero percent Equal Error Rate (EER)
on development set and zero percent Half Total Error Rate (HTER) on test set.
This leads to the conclusion that, the attack videos in PRINT-ATTACK database
mainly consist of detectable texture patterns. Most of the algorithms involved in
this competition are able to clearly separate spoof attempts from real accesses. The
results suggest the investigation of more complex attacks.
2.2.2 3D Spoofing Attacks and Countermeasures
Compared to 2D spoofing attacks such as photograph and video, 3D mask attacks
to face recognition systems is a considerably new subject. The main reason for the
delay in mask spoofing studies is due to the unavailability of public mask databases.
The preparation of a mask attacks database is much more difficult and expensive
than the preparation of photograph or video attacks databases. Initially, to prepare
a high quality mask, a 3D scanner is necessary to obtain the 3D model of the target
person, which are generally high-cost devices. The procedure continues with manu-
2.2. Spoofing in Face Recognition 13
facturing of the masks which is also an expensive procedure.
When 3D masks are introduced as attacks, some of the countermeasures proposed
for the detection of 2D spoofing attacks are no more applicable. The study of Koll-
reider et al. [71] shows that a face recognition system relying on eye blinking and lip
movements can be defeated by using photographic masks wrapped over face with
eyes and mouth regions cut out. Also, since motion based countermeasures depend
on different movements of 2D and 3D surfaces, they are not applicable when masks
are used instead of photos or videos. It appears that the detection of 3D mask
attacks is more challenging compared to the detection of 2D facial attacks.
If a 3D mask is not able to spoof a recognition system, it is not a successful attack,
and there is no need to develop a countermeasure against it. Therefore, initially the
spoofing performances of the masks have to be analyzed. Unfortunately, there are
only two studies in the literature which evaluates the spoofing performances of 3D
mask attacks. In our study [74], we analyzed how well the spoofing performances of
the masks used in our studies are. To the best of our knowledge, the spoofing per-
formances of mask attacks on both 2D and 3D face recognition were first analyzed in
our study [74] using the mask database which was prepared within the context of the
European Union (EU) research project TABULA RASA [111]. The mask database
used in our study [74] includes both 2D and 3D data hence we were able to evaluate
the impact of mask attacks on both 2D and 3D face recognition. Since this database
consists of very high-quality masks, they have almost perfect spoofing performances
especially in 3D. After our study which examines spoofing performances of 3D mask
attacks [74], very recently a new study is published by Erdogmus et al. [41], which
presents the 3D Mask Attack Database (3DMAD). 3DMAD was recorded with a
low-cost depth camera (Microsoft Kinect sensor). In [41], they also analyzed the
spoofing performances of 3D mask attacks using 3DMAD database however only
for 2D face recognition, which is the main limitation of the study. The reported
results in [41] demonstrate that facial masks can pose a serious threat to 2D face
recognition systems.
The spoofing performances of 3D mask attacks are very dependent to the technique
used for manufacturing of masks. The masks in 3DMAD are prepared by the com-
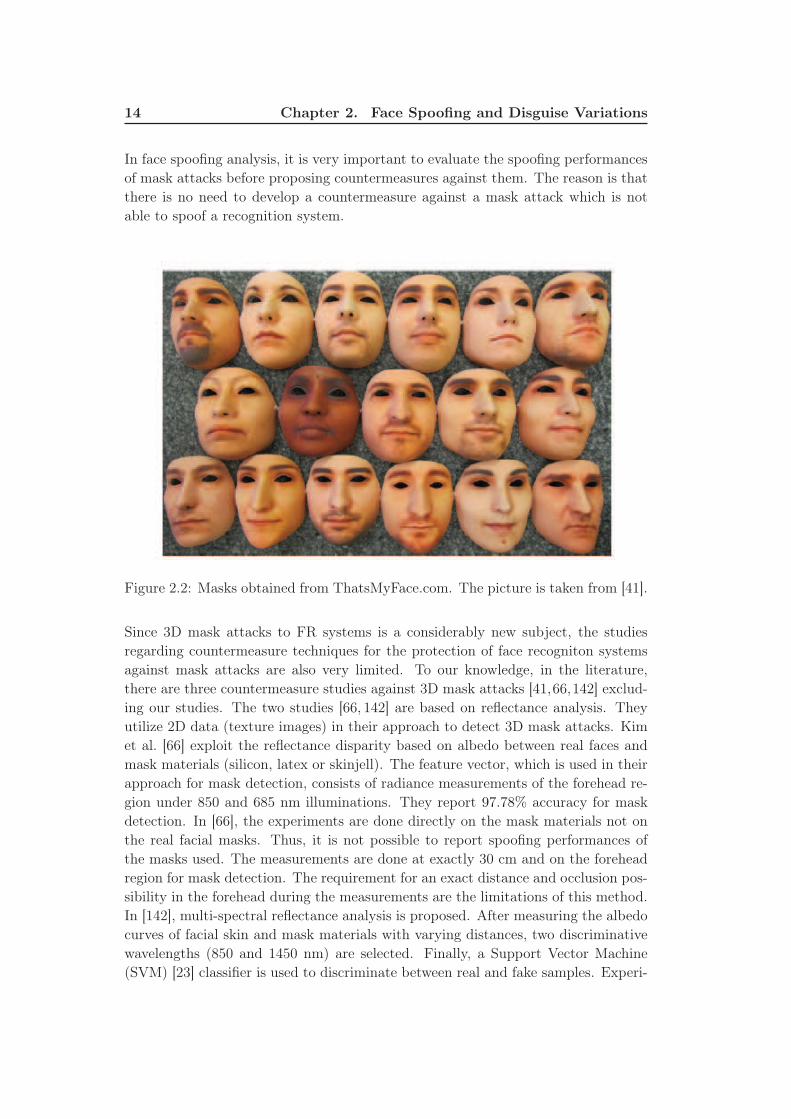
pany "Thats My Face" [132] which provides colored masks (Figure 2.2). Masks are
manufactured by utilizing one frontal and one profile picture of the target person.
The advantage of this service over the others is the possibility of creating a 3D
mask only by providing these two facial images instead of providing the 3D model.
However, since these masks are not prepared based on the 3D models of the target
faces, they do not show exact 3D face shape characteristic of their target faces. This
is why, spoofing performances of these masks are expected to be lower, especially in
3D, compared to spoofing performances of the high-quality masks which are manu-
factured by utilizing the exact 3D models of their target faces.
14 Chapter 2. Face Spoofing and Disguise Variations
In face spoofing analysis, it is very important to evaluate the spoofing performances
of mask attacks before proposing countermeasures against them. The reason is that
there is no need to develop a countermeasure against a mask attack which is not
able to spoof a recognition system.
Figure 2.2: Masks obtained from ThatsMyFace.com. The picture is taken from [41].
Since 3D mask attacks to FR systems is a considerably new subject, the studies
regarding countermeasure techniques for the protection of face recogniton systems
against mask attacks are also very limited. To our knowledge, in the literature,
there are three countermeasure studies against 3D mask attacks [41,66,142] exclud-
ing our studies. The two studies [66, 142] are based on reflectance analysis. They
utilize 2D data (texture images) in their approach to detect 3D mask attacks. Kim
et al. [66] exploit the reflectance disparity based on albedo between real faces and
mask materials (silicon, latex or skinjell). The feature vector, which is used in their
approach for mask detection, consists of radiance measurements of the forehead re-
gion under 850 and 685 nm illuminations. They report 97.78% accuracy for mask
detection. In [66], the experiments are done directly on the mask materials not on
the real facial masks. Thus, it is not possible to report spoofing performances of
the masks used. The measurements are done at exactly 30 cm and on the forehead
region for mask detection. The requirement for an exact distance and occlusion pos-
sibility in the forehead during the measurements are the limitations of this method.
In [142], multi-spectral reflectance analysis is proposed. After measuring the albedo
curves of facial skin and mask materials with varying distances, two discriminative
wavelengths (850 and 1450 nm) are selected. Finally, a Support Vector Machine
(SVM) [23] classifier is used to discriminate between real and fake samples. Experi-
2.3. Disguise Variations in Face Recognition 15
ments are conducted on a database of 20 masks from different materials (4 plastic, 6
silica gel, 4 paper pulp, 4 plaster and 2 sponge). The results show that this method
can achieve 89.18% accuracy. The superiorities of [142] compared to [66] are the
elimination of range limitation and the usage of real facial masks. However, spoof-
ing performances of the masks are still not reported. In the very recent study [41],
an analysis on LBP-based countermeasures using color and depth images obtained
from Kinect is explained. In [41], HTER values are found to be 0.95% and 1.27%
for color and range images, respectively, by applying LDA classification of block-
based extracted uniform LBP features. The limitation of [41] is that the spoofing
performances of mask attacks are only analyzed in 2D face recognition. Hence it is
not possible to learn the spoofing performances of the masks used (shown in Figure
2.2) in 3D face recognition from their study.
In order to contribute this compelling research problem and fill the missing portions
of the existing studies, we have proposed several countermeasure techniques against
3D mask attacks in [73], [76], [75] and [77], which will be explained in Chapter 5.
2.3 Disguise Variations in Face Recognition
In recent face recognition studies, under normal changes in constrained environment,
the performance of existing face recognition systems is greatly enhanced. However,
in most real world applications, there can be several problems such as using images
of low quality or non-cooperative users or temporal variations and dissimilarities in
facial characteristics that are created using disguise accessories.
In the second part of this thesis, we focus on recognizing face images with disguise
variations. Although face recognition with disguise variations is a major challenge,
the research studies on this topic are limited. In this section, several disguise varia-
tions are described and a survey of the literature on disguise variations and robust
techniques against these variations are presented. We investigated mainly three
types of disguise variations which are variations due to facial alterations, facial
makeup and finally occlusions (facial accessories).
2.3.1 Facial Alterations and Countermeasures
Plastic surgery is considered to be a relatively new challenge in face recognition when
compared to pose, expression or illumination variations. With the increasing num-
ber of people resorting to plastic surgery for correction of feature defects, cosmetic
reasons or even law evasion, it becomes of interest for the biometric community to
investigate and prevent the impact of facial alterations on recognition performances.
Yet, very few studies exist which address this problem.
To the best of our knowledge, the impact of facial alterations, specifically due to
plastic surgeries, on face recognition was first analyzed in [126] where the effect of
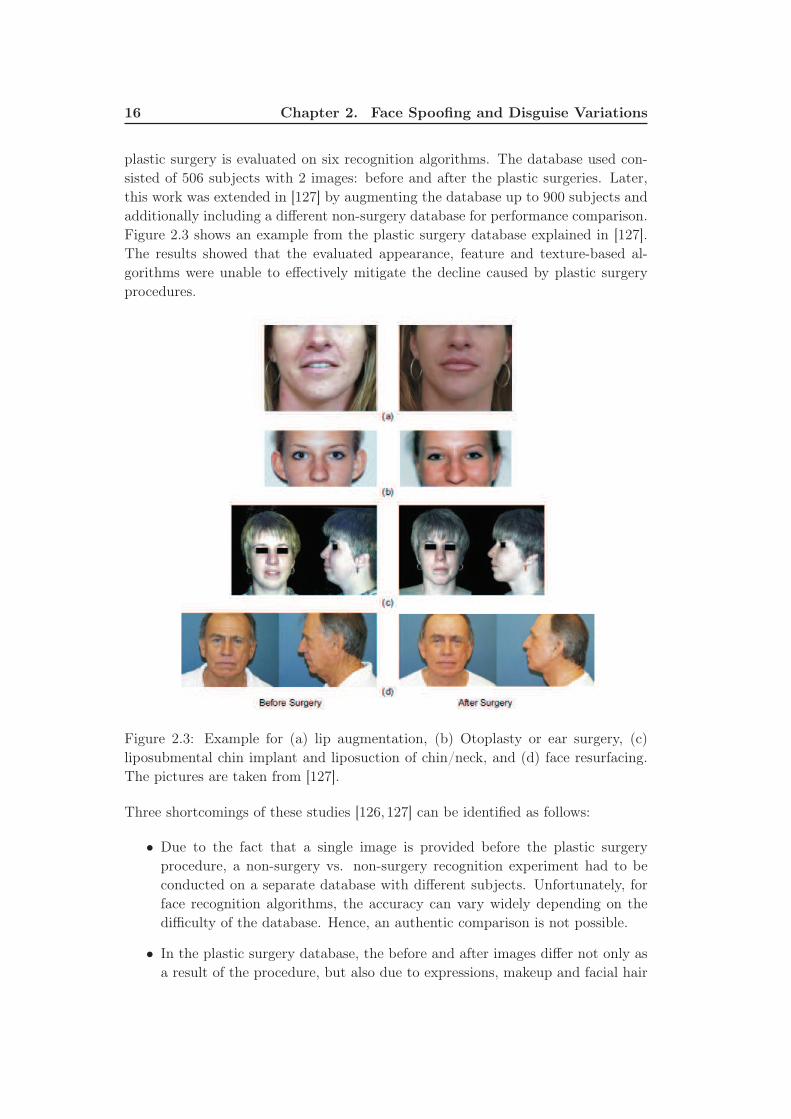
16 Chapter 2. Face Spoofing and Disguise Variations
plastic surgery is evaluated on six recognition algorithms. The database used con-
sisted of 506 subjects with 2 images: before and after the plastic surgeries. Later,
this work was extended in [127] by augmenting the database up to 900 subjects and
additionally including a different non-surgery database for performance comparison.
Figure 2.3 shows an example from the plastic surgery database explained in [127].
The results showed that the evaluated appearance, feature and texture-based al-
gorithms were unable to effectively mitigate the decline caused by plastic surgery
procedures.
Figure 2.3: Example for (a) lip augmentation, (b) Otoplasty or ear surgery, (c)
liposubmental chin implant and liposuction of chin/neck, and (d) face resurfacing.
The pictures are taken from [127].
Three shortcomings of these studies [126,127] can be identified as follows:
• Due to the fact that a single image is provided before the plastic surgery
procedure, a non-surgery vs. non-surgery recognition experiment had to be
conducted on a separate database with different subjects. Unfortunately, for
face recognition algorithms, the accuracy can vary widely depending on the
difficulty of the database. Hence, an authentic comparison is not possible.
• In the plastic surgery database, the before and after images differ not only as
a result of the procedure, but also due to expressions, makeup and facial hair
2.3. Disguise Variations in Face Recognition 17
variations. This leads to an additional decrease in the performances which
clouds the true measurement of the plastic surgery effect.
• Since this is an image database, the analyses are restricted to 2D. However, 3D
face recognition gains a rising popularity as it offers superiority over to its 2D
counterpart by being intrinsically robust against illumination and pose varia-
tions. For this reason, the impact of the facial alterations on 3D algorithms
should also be investigated.
In our study [40], these limitations are eliminated by creating a synthetic database
using FRGC v1.0 [107] for which nose regions are randomly exchanged between sub-
jects. In this way, a 2D+3D database is obtained for nose alterations and since the
conditions and the subjects are identical for the original and the simulated databases,
measuring the exact impact of the applied changes is possible. This study will be
explained in Chapter 6 in detail.
Since there is only one publicly available plastic surgery database, similar to the
lack of studies on impact analysis of facial alterations, the studies which propose
robust techniques to facial alterations are also very limited.
In [15], an evolutionary granular approach is proposed for matching a post-surgery
face image with a pre-surgery face image and 15% improvement in identification
performance is reported. Furthermore, two new methods, FARO and FACE, based
on fractals and a localized version of correlation index, respectively, are implemented
in [90] which claims that the performance of these two algorithms compare favorably
against standard face recognition methods such as PCA and LDA in case of plastic
surgery changes. Singh et al. adopted the near set theory to classify facial images
that have previously undergone some feature modifications in [125]. Finally, in [78],
we proposed a block-based face recognition approach, which mitigates the impacts
of facial alterations on face recognition. The details of this approach are explained in
Chapter 7. It provides significant recognition performances both in 2D and 3D face
recognition in the existance of facial alterations using the simulated nose alteration
database presented in our previous study [40].
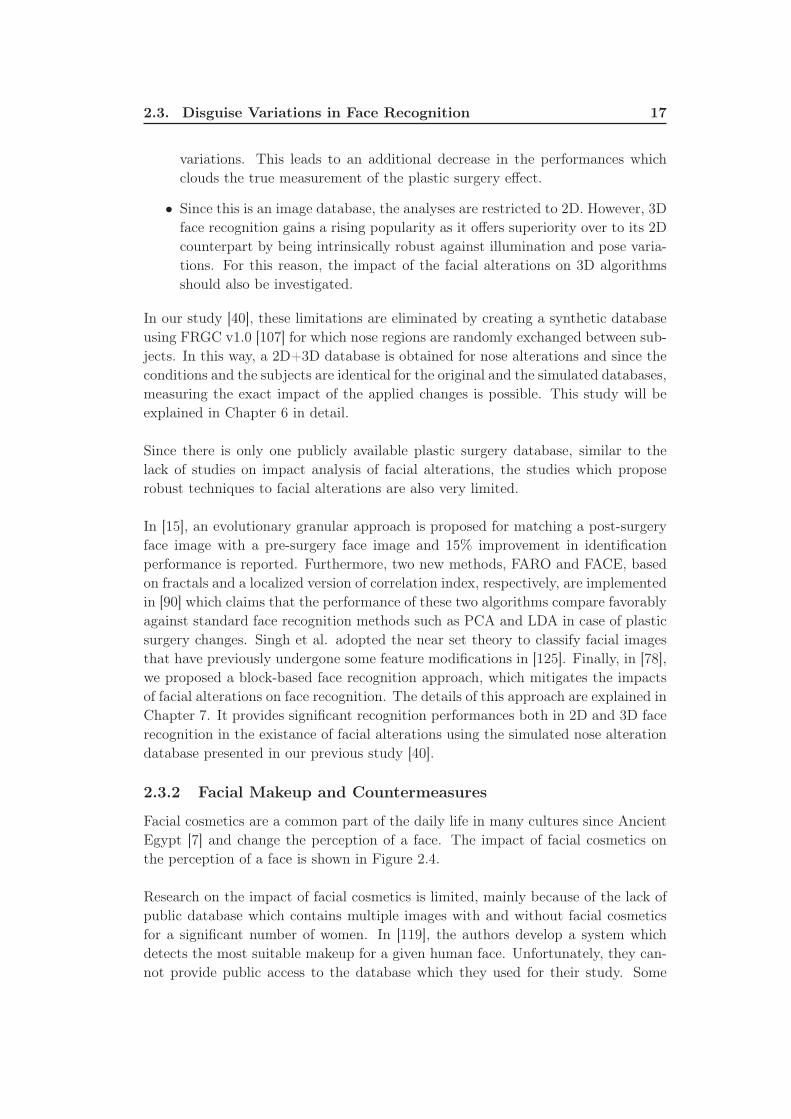
2.3.2 Facial Makeup and Countermeasures
Facial cosmetics are a common part of the daily life in many cultures since Ancient
Egypt [7] and change the perception of a face. The impact of facial cosmetics on
the perception of a face is shown in Figure 2.4.
Research on the impact of facial cosmetics is limited, mainly because of the lack of
public database which contains multiple images with and without facial cosmetics
for a significant number of women. In [119], the authors develop a system which
detects the most suitable makeup for a given human face. Unfortunately, they can-
not provide public access to the database which they used for their study. Some
18 Chapter 2. Face Spoofing and Disguise Variations
databases (e.g. [114], [42]) provide images with facial cosmetics but there are no cor-
responding images without facial cosmetics hence these databases are inappropriate
for the evaluation of face recognition.
Figure 2.4: Reference Image and Makeup Serie Images.
One rare investigation of the facial cosmetics challenge in face recognition can be
found in [29]. The authors state that facial cosmetics have an impact on the per-
formances of face recognition systems. They mention about the need for a better
understanding of the altering effects of facial cosmetics and the development of ro-
bust algorithms. Since the database used in their study is not publicly available, the
obtained results are not reproducible. Also, the amount of applied facial cosmetics
and the cosmetics’ application area are not evaluated in detail.
In our study [37], we contribute to studies related to facial cosmetics by providing
a suitable database as well as an objective classification of facial cosmetics. The
database contains multiple images with and without facial cosmetics for each person
and provides detailed information about the application area and amount of applied
cosmetics for each image. In this study, preliminary tests concerning the impact of
facial cosmetics on face recognition are conducted and we observed that especially
makeup for eye region takes an important role in face recognition. The details of
this study is explained in Chapter 8.
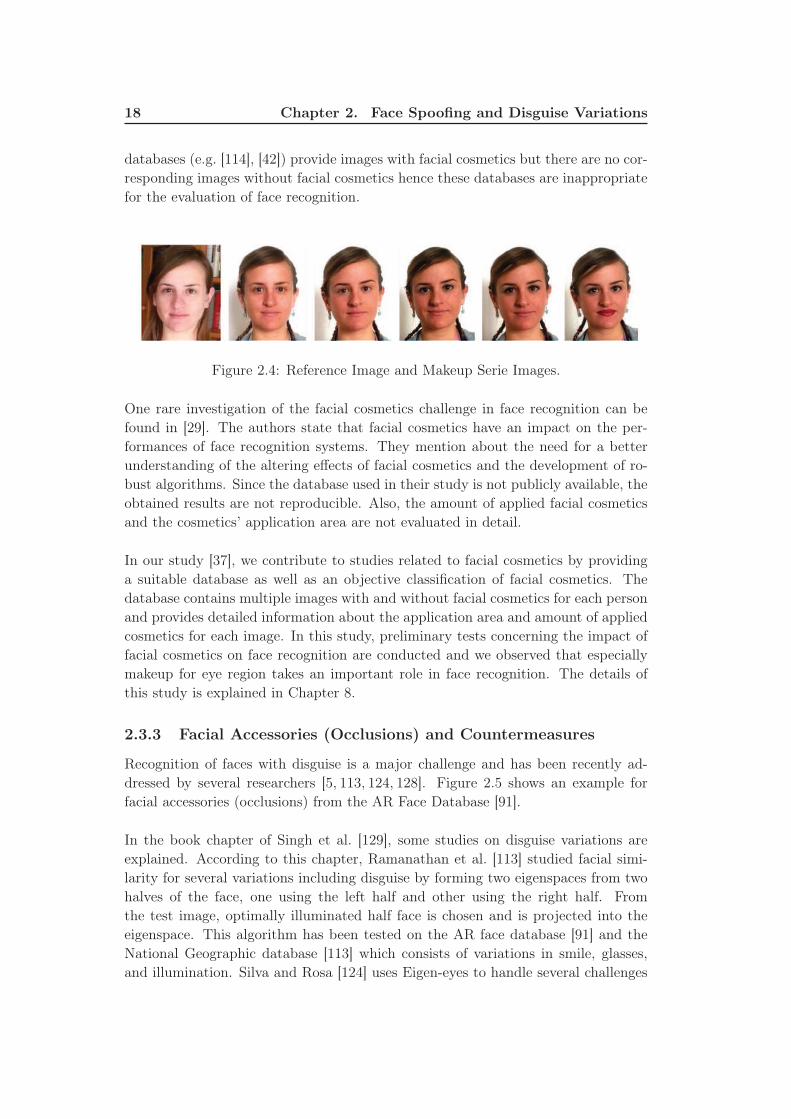
2.3.3 Facial Accessories (Occlusions) and Countermeasures
Recognition of faces with disguise is a major challenge and has been recently ad-
dressed by several researchers [5, 113, 124, 128]. Figure 2.5 shows an example for
facial accessories (occlusions) from the AR Face Database [91].
In the book chapter of Singh et al. [129], some studies on disguise variations are
explained. According to this chapter, Ramanathan et al. [113] studied facial simi-
larity for several variations including disguise by forming two eigenspaces from two
halves of the face, one using the left half and other using the right half. From
the test image, optimally illuminated half face is chosen and is projected into the
eigenspace. This algorithm has been tested on the AR face database [91] and the
National Geographic database [113] which consists of variations in smile, glasses,
and illumination. Silva and Rosa [124] uses Eigen-eyes to handle several challenges
2.3. Disguise Variations in Face Recognition 19
Figure 2.5: Example of images for occlusion from the AR Face Database [91].
of face recognition including disguise. Using the Yale face database [48], the al-
gorithm was able to achieve an accuracy of around 87.5%. The advantage of the
algorithm is that alterations in facial features excluding the eye region do not affect
the accuracy. Pamudurthy et al. [104] proposed a face recognition algorithm which
uses dynamic features obtained from skin correlation and the features are matched
using nearest neighbor classifier. On a database of 10 individuals, authors reported
that this approach gives accurate results. Alexander and Smith [5] used PCA based
algorithm with Mahalanobis angle as the distance metric. The results show an ac-
curacy of 45.8% on the AR database.
The limitation of these algorithms is that the performance degrades when important
regions such as the eye and mouth are covered. Moreover, in [128], it is stated that
the AR and Yale databases do not contain many images with disguise and there-
fore are not ideal for validating algorithms under comprehensive disguise scenarios.
In [128], the impact of disguise variations is evaluated on several face recognition
techniques using one database.
Since the existing databases do not contain many images with disguise, we present
the first publicly available face database based on the Kinect sensor for face recogni-
tion, which is explained in Chapter 9. The database consists of different data modal-
ities and multiple facial variations. The proposed database consists of 936 shots of
well-aligned 2D, 2.5D and 3D face data and 104 video sequences from 52 individuals
taken by the Kinect sensor. It contains 9 different facial variations within 2 different
sessions. We carefully selected 9 types of facial variations in both sessions: neutral
face, smiling, mouth open, strong illumination, occlusion by sunglasses, occlusion
by hand, occlusion by paper, right face profile and left face profile. We conduct
benchmark evaluations on the proposed database using a number of baseline face
recognition methods. Specifically, we report the results (of identification/verifica-
tion) of Eigenface [12], LBP [4], SIFT [85], and LGBP [140] for the 2D and 2.5D
20 Chapter 2. Face Spoofing and Disguise Variations
based face recognition, and conduct both the rigid method (i.e., ICP) [93] and the
non-rigid method (i.e., TPS) [39] for 3D based face recognition. Score-level fusion
of the RGB and depth data is also conducted, which demonstrates significantly im-
proved results. The proposed KinectFaceDB are compared with a widely used high
quality 3D face database (i.e., the FRGC database), in order to show the effects of
3D data quality in the context of face biometrics.
In 2D and 2.5D face recognition, we observed that the partial occlusions (i.e., sun-
glasses, hand on face, and paper on face) are very challenging to all tested methods,
especially in the verification mode. Nevertheless, LGBP based method is more ro-
bust to partial occlusions in comparison to the other methods, and gives the best
overall performances. This result conforms to the findings in [140], where the au-
thors suggested that the multi-resolution/multi-orientation based Gabor decompo-
sition and the local patch based representation of LGBP can enhance the robustness
in presence of partial occlusions.
In the same study, we also observed that the TPS based method generates better
recognition results in most cases than the ICP based method. This is because the
non-linear alignment acted by TPS can partially handle the facial expression prob-
lem to some extent (which conforms to the results in [39]). Nevertheless, none of
these methods can handle the partial occlusion problem. For faces occluded by hand
and paper, the large surface distortions completely mislead the face registration.
Experimental results suggest that the performances of existing algorithms are not
sufficient enough against disguise variations. Thus, face recognition with disguise
variations is still a major challenge and more robust techniques against occlusions
have to be developed to mitigate its impact on face recognition.
2.4 Conclusions
In this chapter, we started with a short introduction to general biometrics and
face recognition. Next, we presented an in-depth description for the current state
of the topic "spoofing in face recognition", which is analyzed in two parts as 2D
face spoofing and 3D face spoofing. Then, we explored the state-of-the-art for
"disguise variations in face recognition". Since in this thesis the variations due to
facial alterations, facial makeup and facial accessories (occlusions) are analyzed, we
presented an in-depth description for the current state of these variations.
Chapter 3
Countermeasure Technique
Against Photograph Attacks
In this chapter, a new face anti-spoofing approach, which is based on analysis of
contrast and texture characteristics of captured and recaptured images, is proposed
to detect photograph spoofing. Since photo image is a recaptured image, it may
show quite different contrast and texture characteristics when compared to a real
face image. Rotation invariant local binary pattern variance (LBPV) method is
selected to be used in this study for feature extraction. The approach is tested on
the publicly available NUAA photo-impostor database, which is constructed under
illumination and place change. The results show that the approach is competitive
with other existing methods tested on the same database. The technique is robust
to illumination change, non-intrusive and simple.
3.1 Introduction
There are several types of spoofing attacks such as photograph, video or mask at-
tacks. Due to 3D face shape characteristics of masks, the 3D face shape analysis,
which is very beneficial for the detection of photograph and video attacks, is no
more applicable in the existance of 3D mask attacks. Before examining 3D mask
spoofing and countermeasures, which are explained in the next chapters, we first
analyzed photograph attacks in our study [72]. This preliminary study helped us to
gain an insight on the topic of face spoofing and countermeasures.
Various approaches have been developed to detect photograph spoofing. A good
survey of approaches against photograph spoof can be found in Section 2.2.1. The
existing techniques mainly concentrate on liveness detection and motion analysis in
case analysis are not restricted to a single image. There are also several counter-
measure techniques based on texture analysis, which can be applied on single images.
In this chapter, an approach, which is based on contrast and texture analysis of
captured and recaptured images, is proposed to detect photograph spoofing. Each
face anti-spoofing technique differs from each other in terms of the need for data
quality, additional hardware, and user collaboration. In our approach, a rotation in-
variant Local Binary Patterns Variance (LBPV) [52] based method is used to detect
photograph spoofing. This method relies on a single image. Only a generic webcam
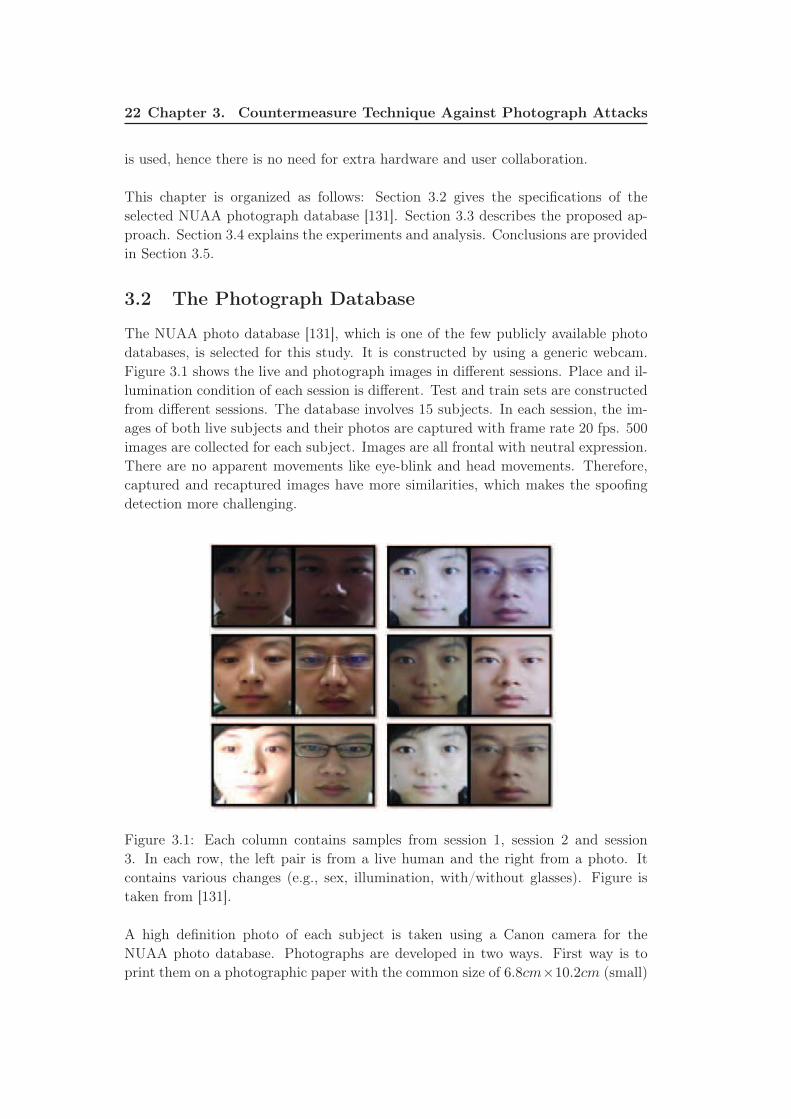
22 Chapter 3. Countermeasure Technique Against Photograph Attacks
is used, hence there is no need for extra hardware and user collaboration.
This chapter is organized as follows: Section 3.2 gives the specifications of the
selected NUAA photograph database [131]. Section 3.3 describes the proposed ap-
proach. Section 3.4 explains the experiments and analysis. Conclusions are provided
in Section 3.5.
3.2 The Photograph Database
The NUAA photo database [131], which is one of the few publicly available photo
databases, is selected for this study. It is constructed by using a generic webcam.
Figure 3.1 shows the live and photograph images in different sessions. Place and il-
lumination condition of each session is different. Test and train sets are constructed
from different sessions. The database involves 15 subjects. In each session, the im-
ages of both live subjects and their photos are captured with frame rate 20 fps. 500
images are collected for each subject. Images are all frontal with neutral expression.
There are no apparent movements like eye-blink and head movements. Therefore,
captured and recaptured images have more similarities, which makes the spoofing
detection more challenging.
Figure 3.1: Each column contains samples from session 1, session 2 and session
3. In each row, the left pair is from a live human and the right from a photo. It
contains various changes (e.g., sex, illumination, with/without glasses). Figure is
taken from [131].
A high definition photo of each subject is taken using a Canon camera for the
NUAA photo database. Photographs are developed in two ways. First way is to
print them on a photographic paper with the common size of 6.8cm×10.2cm (small)
3.3. The Proposed Approach 23
and 8.9cm× 12.7cm (bigger). Second way is to print them on a 70g A4 paper using
a usual color HP printer. To make an exact comparison with the existing methods
in [131], the same database is selected, and experiments are done with the same
train-test set partitioning.
Table 3.1 gives statistics of the number of images involved in the NUAA database for
each train and test sets. Since each set contains images from different sessions, there
is no overlapping between test and train set images. In the NUAA database [33], 6
subjects out of 9 subjects do not appear in the train set for live human case, and 6
subjects out of 15 subjects do not appear in the train set for photo case. This shows
that in our study, the subject appeared in the test set may not be appeared in the
train set, which makes the detection of photograph spoofing more challenging.
Table 3.1: Number of Images in the NUAA Database for Train and Test Sets
Session 1 Session 2 Session 3 Total
Train Set
Client 889 854 0 1743
Impostor 855 893 0 1748
Test Set
Client 0 0 3362 3362
Impostor 0 0 5761 5761
3.3 The Proposed Approach
In this study, the problem is simply a classification problem with two classes. First
class is the real image class, which are in fact captured images, and second class is
the class of photograph images of real faces. Since the image of a photo is an image
of a real face which passes through the camera system twice and the printing system
once, it is in fact a recaptured image, which has lower image quality compared to a
real face image taken under same imaging conditions.
The proposed countermeasure relies on different contrast and texture characteristics
of captured images and recaptured images to detect photograph spoofing. In the
proposed approach, initially a Difference of Gaussian (DoG) filter is used to obtain a
special frequency band which gives considerable information to discriminate between
real and photo images. Then, features are extracted from DoG filtered image by
applying LBPV method.
3.3.1 Pre-Processing
Recaptured image has less sharpness (lower image quality) when compared to a
captured image; therefore recaptured image contains less high frequency compo-
nents [82, 131]. This fact can be observed by analyzing the 2D Fourier spectra of a
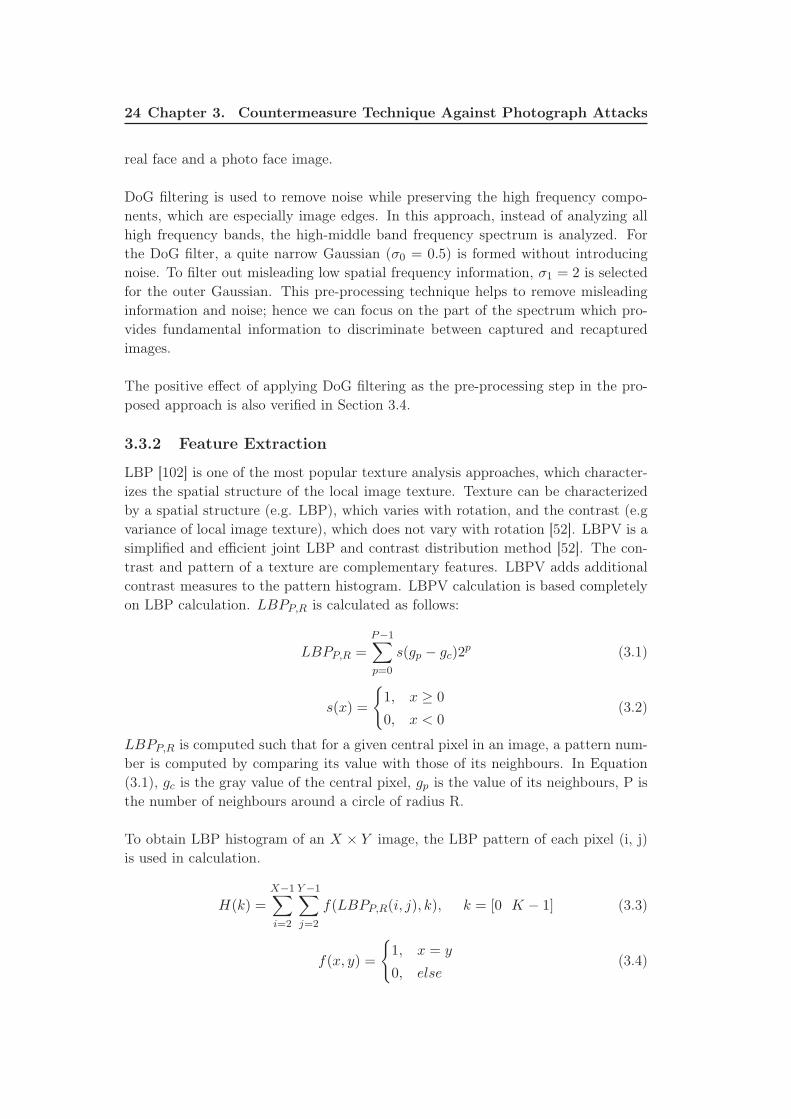
24 Chapter 3. Countermeasure Technique Against Photograph Attacks
real face and a photo face image.
DoG filtering is used to remove noise while preserving the high frequency compo-
nents, which are especially image edges. In this approach, instead of analyzing all
high frequency bands, the high-middle band frequency spectrum is analyzed. For
the DoG filter, a quite narrow Gaussian (σ0 = 0.5) is formed without introducing
noise. To filter out misleading low spatial frequency information, σ1 = 2 is selected
for the outer Gaussian. This pre-processing technique helps to remove misleading
information and noise; hence we can focus on the part of the spectrum which pro-
vides fundamental information to discriminate between captured and recaptured
images.
The positive effect of applying DoG filtering as the pre-processing step in the pro-
posed approach is also verified in Section 3.4.
3.3.2 Feature Extraction
LBP [102] is one of the most popular texture analysis approaches, which character-
izes the spatial structure of the local image texture. Texture can be characterized
by a spatial structure (e.g. LBP), which varies with rotation, and the contrast (e.g
variance of local image texture), which does not vary with rotation [52]. LBPV is a
simplified and efficient joint LBP and contrast distribution method [52]. The con-
trast and pattern of a texture are complementary features. LBPV adds additional
contrast measures to the pattern histogram. LBPV calculation is based completely
on LBP calculation. LBPP,R is calculated as follows:
LBPP,R =P−1∑
p=0
s(gp − gc)2p (3.1)
s(x) =
{
1, x ≥ 0
0, x < 0(3.2)
LBPP,R is computed such that for a given central pixel in an image, a pattern num-
ber is computed by comparing its value with those of its neighbours. In Equation
(3.1), gc is the gray value of the central pixel, gp is the value of its neighbours, P is
the number of neighbours around a circle of radius R.
To obtain LBP histogram of an X × Y image, the LBP pattern of each pixel (i, j)
is used in calculation.
H(k) =X−1∑
i=2
Y−1∑
j=2
f(LBPP,R(i, j), k), k = [0 K − 1] (3.3)
f(x, y) =
{
1, x = y
0, else(3.4)
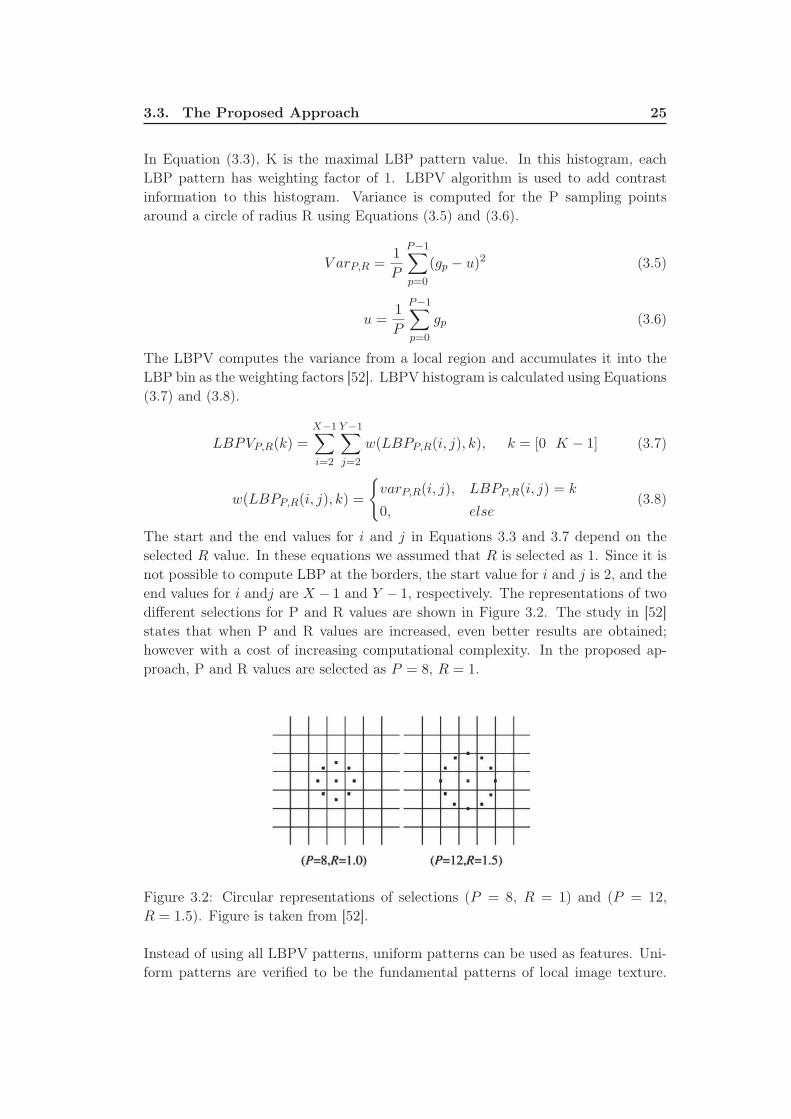
3.3. The Proposed Approach 25
In Equation (3.3), K is the maximal LBP pattern value. In this histogram, each
LBP pattern has weighting factor of 1. LBPV algorithm is used to add contrast
information to this histogram. Variance is computed for the P sampling points
around a circle of radius R using Equations (3.5) and (3.6).
V arP,R =1
P
P−1∑
p=0
(gp − u)2 (3.5)
u =1
P
P−1∑
p=0
gp (3.6)
The LBPV computes the variance from a local region and accumulates it into the
LBP bin as the weighting factors [52]. LBPV histogram is calculated using Equations
(3.7) and (3.8).
LBPVP,R(k) =X−1∑
i=2
Y−1∑
j=2
w(LBPP,R(i, j), k), k = [0 K − 1] (3.7)
w(LBPP,R(i, j), k) =
{
varP,R(i, j), LBPP,R(i, j) = k
0, else(3.8)
The start and the end values for i and j in Equations 3.3 and 3.7 depend on the
selected R value. In these equations we assumed that R is selected as 1. Since it is
not possible to compute LBP at the borders, the start value for i and j is 2, and the
end values for i andj are X − 1 and Y − 1, respectively. The representations of two
different selections for P and R values are shown in Figure 3.2. The study in [52]
states that when P and R values are increased, even better results are obtained;
however with a cost of increasing computational complexity. In the proposed ap-
proach, P and R values are selected as P = 8, R = 1.
Figure 3.2: Circular representations of selections (P = 8, R = 1) and (P = 12,
R = 1.5). Figure is taken from [52].
Instead of using all LBPV patterns, uniform patterns can be used as features. Uni-
form patterns are verified to be the fundamental patterns of local image texture.
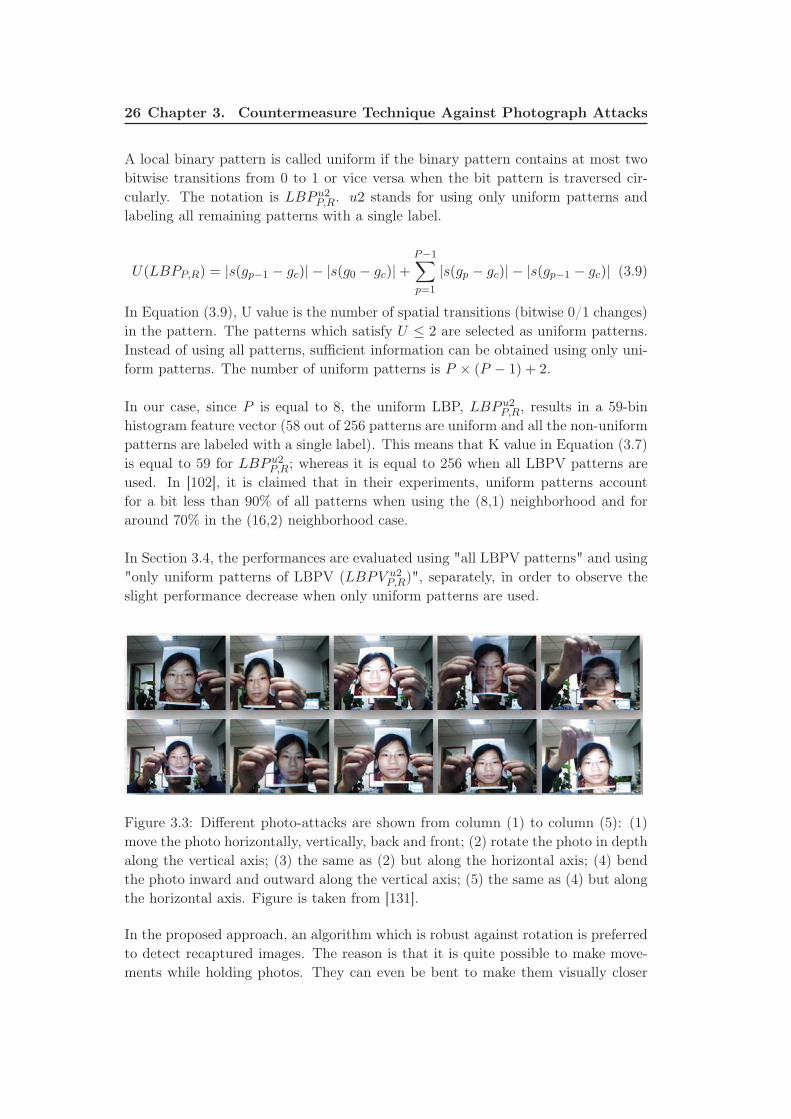
26 Chapter 3. Countermeasure Technique Against Photograph Attacks
A local binary pattern is called uniform if the binary pattern contains at most two
bitwise transitions from 0 to 1 or vice versa when the bit pattern is traversed cir-
cularly. The notation is LBP u2P,R. u2 stands for using only uniform patterns and
labeling all remaining patterns with a single label.
U(LBPP,R) = |s(gp−1 − gc)| − |s(g0 − gc)|+P−1∑
p=1
|s(gp − gc)| − |s(gp−1 − gc)| (3.9)
In Equation (3.9), U value is the number of spatial transitions (bitwise 0/1 changes)
in the pattern. The patterns which satisfy U ≤ 2 are selected as uniform patterns.
Instead of using all patterns, sufficient information can be obtained using only uni-
form patterns. The number of uniform patterns is P × (P − 1) + 2.
In our case, since P is equal to 8, the uniform LBP, LBP u2P,R, results in a 59-bin
histogram feature vector (58 out of 256 patterns are uniform and all the non-uniform
patterns are labeled with a single label). This means that K value in Equation (3.7)
is equal to 59 for LBP u2P,R; whereas it is equal to 256 when all LBPV patterns are
used. In [102], it is claimed that in their experiments, uniform patterns account
for a bit less than 90% of all patterns when using the (8,1) neighborhood and for
around 70% in the (16,2) neighborhood case.
In Section 3.4, the performances are evaluated using "all LBPV patterns" and using
"only uniform patterns of LBPV (LBPV u2P,R)", separately, in order to observe the
slight performance decrease when only uniform patterns are used.
Figure 3.3: Different photo-attacks are shown from column (1) to column (5): (1)
move the photo horizontally, vertically, back and front; (2) rotate the photo in depth
along the vertical axis; (3) the same as (2) but along the horizontal axis; (4) bend
the photo inward and outward along the vertical axis; (5) the same as (4) but along
the horizontal axis. Figure is taken from [131].
In the proposed approach, an algorithm which is robust against rotation is preferred
to detect recaptured images. The reason is that it is quite possible to make move-
ments while holding photos. They can even be bent to make them visually closer
3.3. The Proposed Approach 27
to a 3D face or to move horizontally or vertically to act like a live face. Figure 3.3
shows illustration of some types of photo-attacks.
There are both local and global rotation invariant algorithms in texture classifi-
cation. In the proposed approach, a hybrid method, which is based on globally
rotation invariant matching with locally variant LBPV texture features [52], is used
to extract features for classification. Thereby, both global spatial information and
local texture information are preserved in classification.
In our study, the global matching is implemented using exhaustive search scheme [52]
to find the minimal distance in all candidate orientations, which is a simple method.
The LBPV histogram is reorganized and represented by a rotation variant histogram
Hrv, and a rotation invariant histogram Hri. Then for two texture images, the
matching distance is calculated as shown in Equation (3.10).
DES(HS , HM ) = Dri(HriS , Hri
M ) +Dmin(HrvS , Hrv
M )
Dri(HriS , Hri
M ) = D(HriS , Hri
M )
Dmin(HrvS , Hrv
M ) = min(D(HrvS , Hrv
M (j))), j = 0, 1, . . . , 7
HrvM (j) = [hM
mod(0−j,8), hMmod(1−j,8), . . . , h
Mmod(7−j,8)]
(3.10)
In Equation (3.10), D(X,Y ) represents chi-square distance defined in Equation
(3.11). HS is the test sample image and HM is the model image histograms. Hrv(j)
is the new matrix which is obtained by shifting j columns of original Hrv matrix.
From Equation (3.10), it is clear that distance between two histograms is composed
of two parts. Dri(HriS , Hri
M ) is derived from rotation invariant part and the other one
Dmin(HrvS , Hrv
M ) is obtained by searching minimal distance within rotation variant
part. Matching by exhaustive search is explained in [52,69] in more details.
In the proposed approach, chi-square distance is selected to be used as the dissimilar-
ity metric. Chi-square distance between sample and model histograms is computed
as:
D(S,M) =N∑
i=1
(Si −Mi)2
Si +Mi
(3.11)
where N is the number of bins, and Si and Mi are the values of the sample and
model histograms at the nth bin, respectively.
For each test image, matching by exhaustive search (Equation 3.10) is applied using
chi-square distance metric (Equation 3.11), and distances from each test sample to
all samples (xi) in the client and impostor model sets are computed. Then, quadratic
means of distances are computed for client and impostor model sets, consecutively,
using Equation (3.12). In Equation (3.12), N is the number of images in the model
set and xi is the distance between test sample and model sample.
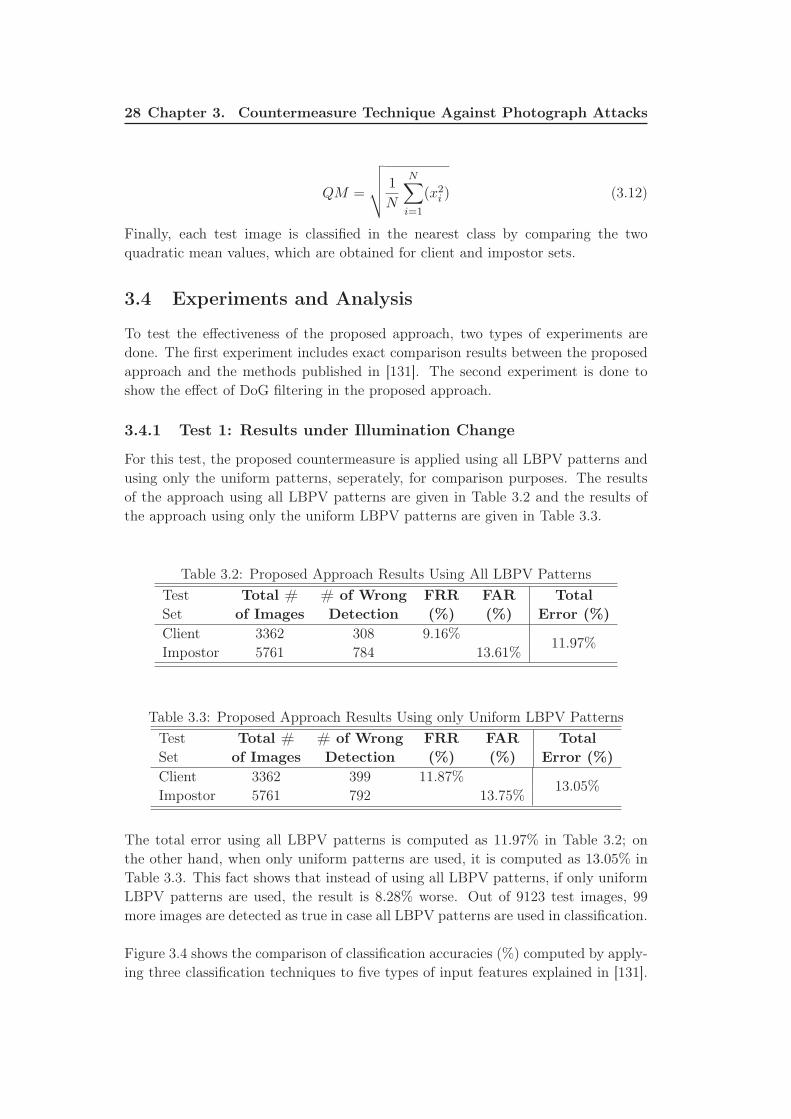
28 Chapter 3. Countermeasure Technique Against Photograph Attacks
QM =
√
√
√
√
1
N
N∑
i=1
(x2i ) (3.12)
Finally, each test image is classified in the nearest class by comparing the two
quadratic mean values, which are obtained for client and impostor sets.
3.4 Experiments and Analysis
To test the effectiveness of the proposed approach, two types of experiments are
done. The first experiment includes exact comparison results between the proposed
approach and the methods published in [131]. The second experiment is done to
show the effect of DoG filtering in the proposed approach.
3.4.1 Test 1: Results under Illumination Change
For this test, the proposed countermeasure is applied using all LBPV patterns and
using only the uniform patterns, seperately, for comparison purposes. The results
of the approach using all LBPV patterns are given in Table 3.2 and the results of
the approach using only the uniform LBPV patterns are given in Table 3.3.
Table 3.2: Proposed Approach Results Using All LBPV Patterns
Test Total # # of Wrong FRR FAR Total
Set of Images Detection (%) (%) Error (%)
Client 3362 308 9.16%11.97%
Impostor 5761 784 13.61%
Table 3.3: Proposed Approach Results Using only Uniform LBPV Patterns
Test Total # # of Wrong FRR FAR Total
Set of Images Detection (%) (%) Error (%)
Client 3362 399 11.87%13.05%
Impostor 5761 792 13.75%
The total error using all LBPV patterns is computed as 11.97% in Table 3.2; on
the other hand, when only uniform patterns are used, it is computed as 13.05% in
Table 3.3. This fact shows that instead of using all LBPV patterns, if only uniform
LBPV patterns are used, the result is 8.28% worse. Out of 9123 test images, 99
more images are detected as true in case all LBPV patterns are used in classification.
Figure 3.4 shows the comparison of classification accuracies (%) computed by apply-
ing three classification techniques to five types of input features explained in [131].
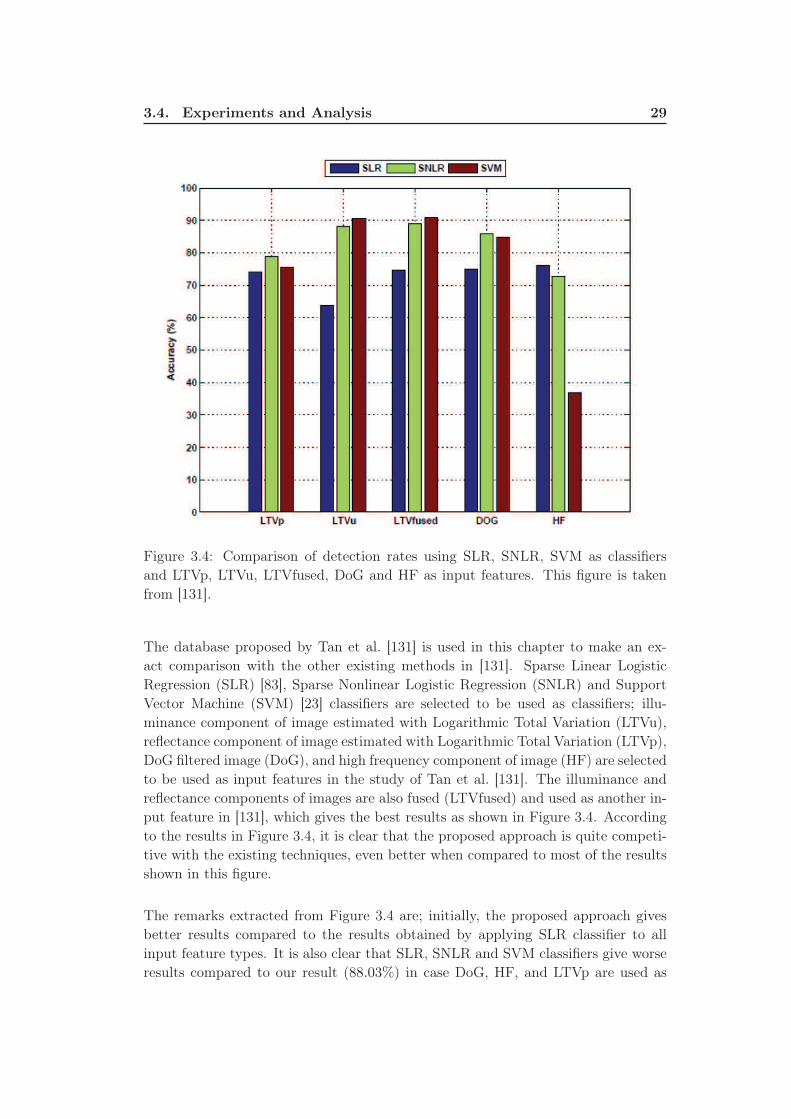
3.4. Experiments and Analysis 29
Figure 3.4: Comparison of detection rates using SLR, SNLR, SVM as classifiers
and LTVp, LTVu, LTVfused, DoG and HF as input features. This figure is taken
from [131].
The database proposed by Tan et al. [131] is used in this chapter to make an ex-
act comparison with the other existing methods in [131]. Sparse Linear Logistic
Regression (SLR) [83], Sparse Nonlinear Logistic Regression (SNLR) and Support
Vector Machine (SVM) [23] classifiers are selected to be used as classifiers; illu-
minance component of image estimated with Logarithmic Total Variation (LTVu),
reflectance component of image estimated with Logarithmic Total Variation (LTVp),
DoG filtered image (DoG), and high frequency component of image (HF) are selected
to be used as input features in the study of Tan et al. [131]. The illuminance and
reflectance components of images are also fused (LTVfused) and used as another in-
put feature in [131], which gives the best results as shown in Figure 3.4. According
to the results in Figure 3.4, it is clear that the proposed approach is quite competi-
tive with the existing techniques, even better when compared to most of the results
shown in this figure.
The remarks extracted from Figure 3.4 are; initially, the proposed approach gives
better results compared to the results obtained by applying SLR classifier to all
input feature types. It is also clear that SLR, SNLR and SVM classifiers give worse
results compared to our result (88.03%) in case DoG, HF, and LTVp are used as
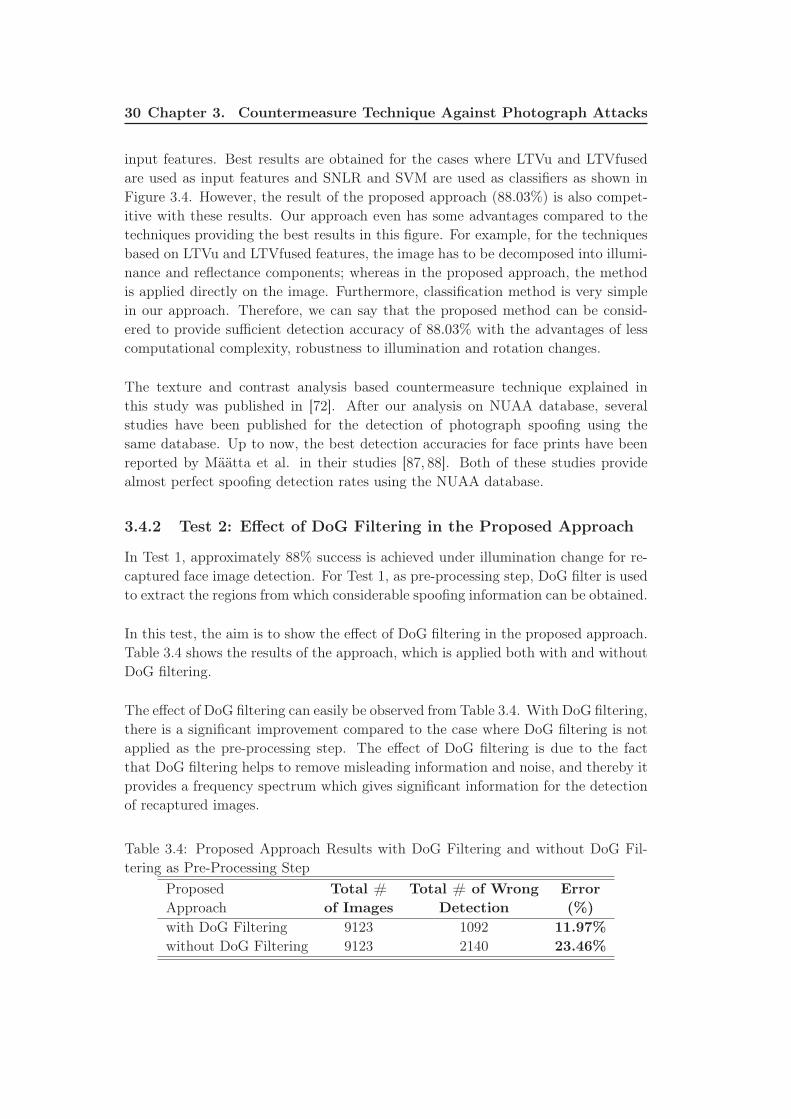
30 Chapter 3. Countermeasure Technique Against Photograph Attacks
input features. Best results are obtained for the cases where LTVu and LTVfused
are used as input features and SNLR and SVM are used as classifiers as shown in
Figure 3.4. However, the result of the proposed approach (88.03%) is also compet-
itive with these results. Our approach even has some advantages compared to the
techniques providing the best results in this figure. For example, for the techniques
based on LTVu and LTVfused features, the image has to be decomposed into illumi-
nance and reflectance components; whereas in the proposed approach, the method
is applied directly on the image. Furthermore, classification method is very simple
in our approach. Therefore, we can say that the proposed method can be consid-
ered to provide sufficient detection accuracy of 88.03% with the advantages of less
computational complexity, robustness to illumination and rotation changes.
The texture and contrast analysis based countermeasure technique explained in
this study was published in [72]. After our analysis on NUAA database, several
studies have been published for the detection of photograph spoofing using the
same database. Up to now, the best detection accuracies for face prints have been
reported by Määtta et al. in their studies [87, 88]. Both of these studies provide
almost perfect spoofing detection rates using the NUAA database.
3.4.2 Test 2: Effect of DoG Filtering in the Proposed Approach
In Test 1, approximately 88% success is achieved under illumination change for re-
captured face image detection. For Test 1, as pre-processing step, DoG filter is used
to extract the regions from which considerable spoofing information can be obtained.
In this test, the aim is to show the effect of DoG filtering in the proposed approach.
Table 3.4 shows the results of the approach, which is applied both with and without
DoG filtering.
The effect of DoG filtering can easily be observed from Table 3.4. With DoG filtering,
there is a significant improvement compared to the case where DoG filtering is not
applied as the pre-processing step. The effect of DoG filtering is due to the fact
that DoG filtering helps to remove misleading information and noise, and thereby it
provides a frequency spectrum which gives significant information for the detection
of recaptured images.
Table 3.4: Proposed Approach Results with DoG Filtering and without DoG Fil-
tering as Pre-Processing Step
Proposed Total # Total # of Wrong Error
Approach of Images Detection (%)
with DoG Filtering 9123 1092 11.97%
without DoG Filtering 9123 2140 23.46%
3.5. Conclusion 31
3.5 Conclusion
In this chapter, a recaptured image detection method, which is based on the analysis
of different contrast and texture characteristics of captured and recaptured images,
is proposed.
The proposed approach gives quite satisfactory results when compared to the results
reported in [131], which use the same NUAA database in their experiments. The ap-
proach is simple and there is no need for user collaboration, which are its advantages.
There have been several studies on countermeasure techniques for the detection of
photograph attacks. Compared to 2D spoofing attacks such as photograph and
video, 3D mask attacks to face recognition systems is a considerably new subject.
Even the impact of 3D mask attacks on existing recognition systems had not been
analyzed before our study [74].
In the next chapter, we show how vulnerable the existing 2D and 3D face recognition
systems are to spoofing mask attacks. Then, in Chapter 5, the countermeasures,
which we have proposed up to now for the detection of 3D mask attacks, are ex-
plained.

Chapter 4
Impact of Mask Spoofing on Face
Recognition
There are several types of spoofing attacks to face recognition systems such as
photograph, video or mask attacks. To the best of our knowledge, the impact of mask
spoofing on face recognition has been first analyzed in our study [74]. The reason
for this delay is mainly due to the unavailability of public mask attacks databases.
In this study, we use a 2D+3D mask database which was prepared for the research
project TABULA RASA [111]. This chapter provides new results by demonstrating
the impact of mask attacks on 2D and 3D face recognition systems. The results show
that face recognition systems are vulnerable to mask attacks, thus countermeasures
have to be developed to reduce the impact of mask attacks on face recognition. The
results also show that 2D texture analysis provides more information than 3D face
shape analysis in order to develop countermeasure techniques against high-quality
mask attacks.
4.1 Introduction
The most common spoofing attacks to face recognition systems are achieved by
using photographs and videos due to their convenience and low cost. It has been
shown that face recognition systems are vulnerable to photograph and video attacks.
Therefore, several countermeasures have been developed for the protection of face
recognition systems against these 2D spoofing attacks.
Compared to 2D spoofing attacks, 3D mask attacks to face recognition systems is a
considerably new subject. The main reason for the delay in mask spoofing studies
is due to the unavailability of public mask databases. The preparation of a mask
attacks database is much more difficult and expensive than the preparation of pho-
tograph or video attacks databases. Initially, to prepare a high quality mask, a 3D
scanner is necessary to obtain the 3D model of the target person, which are generally
high-cost devices. The procedure continues with manufacturing of the masks which
is also an expensive procedure.
If a 3D mask is not able to spoof a recognition system, it is not a successful attack,
and there is no need to develop a countermeasure against it. Therefore, in [74],
we analyzed how well the spoofing performances of the masks used in our studies
are. To the best of our knowledge, the spoofing performances of mask attacks on
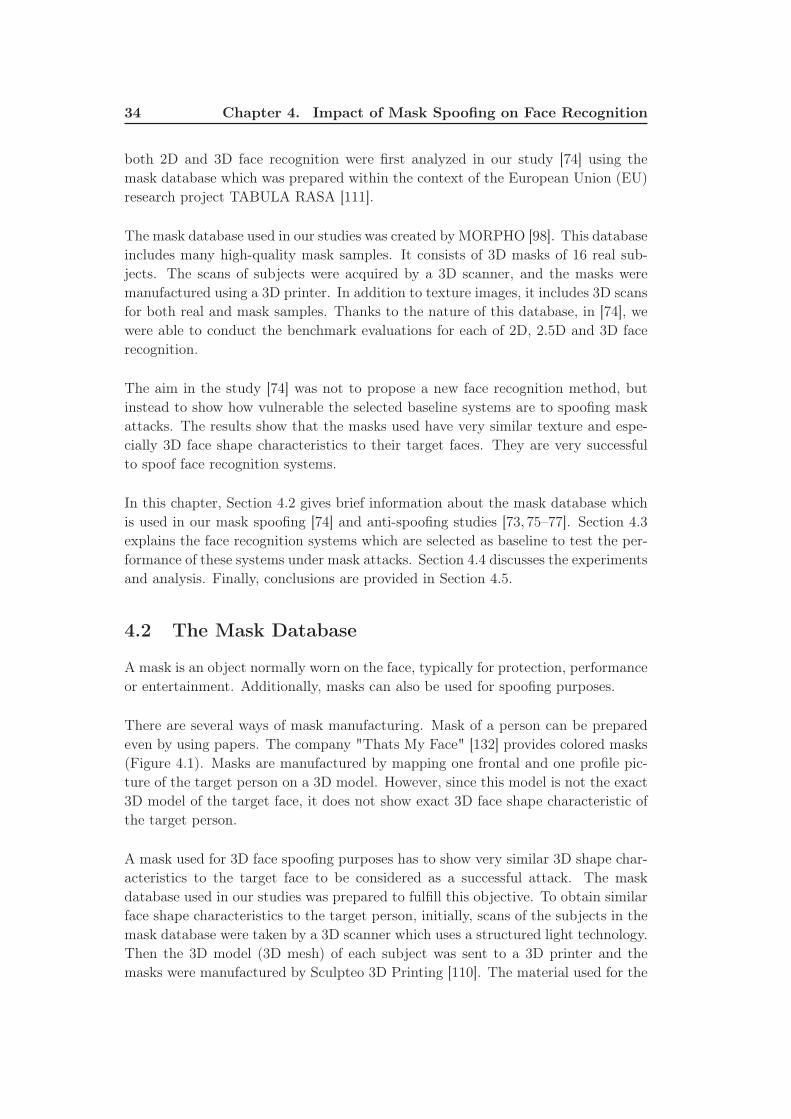
34 Chapter 4. Impact of Mask Spoofing on Face Recognition
both 2D and 3D face recognition were first analyzed in our study [74] using the
mask database which was prepared within the context of the European Union (EU)
research project TABULA RASA [111].
The mask database used in our studies was created by MORPHO [98]. This database
includes many high-quality mask samples. It consists of 3D masks of 16 real sub-
jects. The scans of subjects were acquired by a 3D scanner, and the masks were
manufactured using a 3D printer. In addition to texture images, it includes 3D scans
for both real and mask samples. Thanks to the nature of this database, in [74], we
were able to conduct the benchmark evaluations for each of 2D, 2.5D and 3D face
recognition.
The aim in the study [74] was not to propose a new face recognition method, but
instead to show how vulnerable the selected baseline systems are to spoofing mask
attacks. The results show that the masks used have very similar texture and espe-
cially 3D face shape characteristics to their target faces. They are very successful
to spoof face recognition systems.
In this chapter, Section 4.2 gives brief information about the mask database which
is used in our mask spoofing [74] and anti-spoofing studies [73, 75–77]. Section 4.3
explains the face recognition systems which are selected as baseline to test the per-
formance of these systems under mask attacks. Section 4.4 discusses the experiments
and analysis. Finally, conclusions are provided in Section 4.5.
4.2 The Mask Database
A mask is an object normally worn on the face, typically for protection, performance
or entertainment. Additionally, masks can also be used for spoofing purposes.
There are several ways of mask manufacturing. Mask of a person can be prepared
even by using papers. The company "Thats My Face" [132] provides colored masks
(Figure 4.1). Masks are manufactured by mapping one frontal and one profile pic-
ture of the target person on a 3D model. However, since this model is not the exact
3D model of the target face, it does not show exact 3D face shape characteristic of
the target person.
A mask used for 3D face spoofing purposes has to show very similar 3D shape char-
acteristics to the target face to be considered as a successful attack. The mask
database used in our studies was prepared to fulfill this objective. To obtain similar
face shape characteristics to the target person, initially, scans of the subjects in the
mask database were taken by a 3D scanner which uses a structured light technology.
Then the 3D model (3D mesh) of each subject was sent to a 3D printer and the
masks were manufactured by Sculpteo 3D Printing [110]. The material used for the
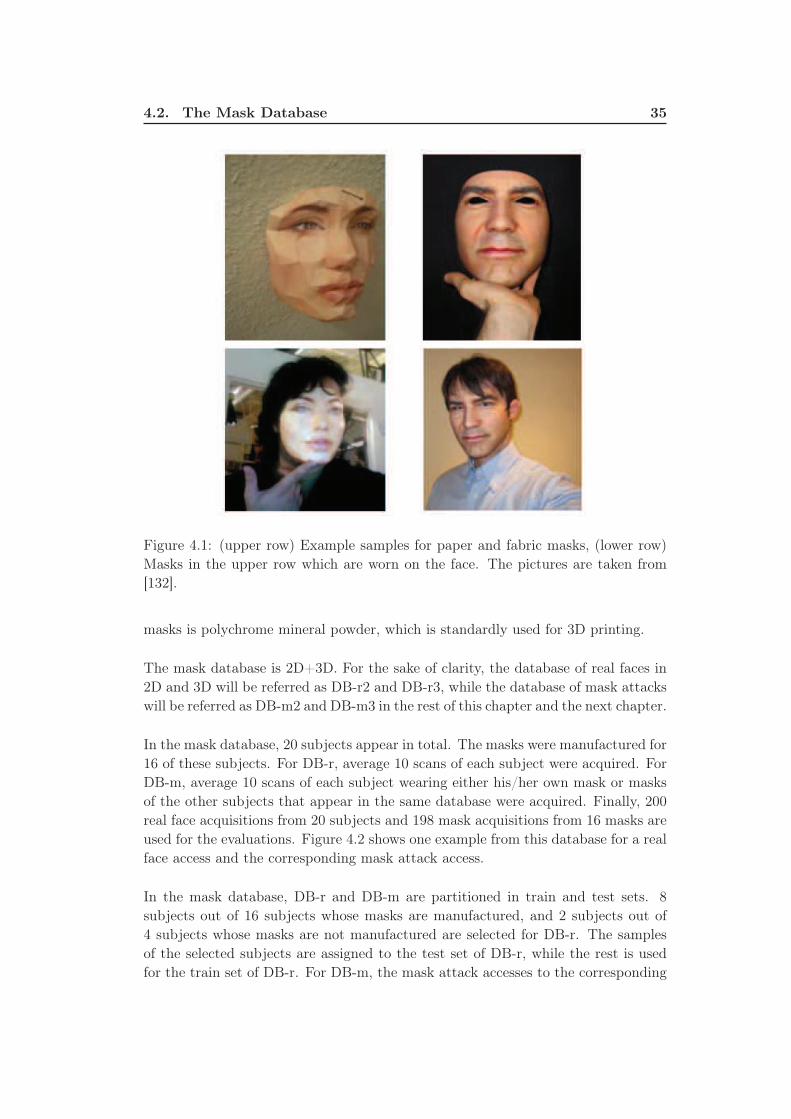
4.2. The Mask Database 35
Figure 4.1: (upper row) Example samples for paper and fabric masks, (lower row)
Masks in the upper row which are worn on the face. The pictures are taken from
[132].
masks is polychrome mineral powder, which is standardly used for 3D printing.
The mask database is 2D+3D. For the sake of clarity, the database of real faces in
2D and 3D will be referred as DB-r2 and DB-r3, while the database of mask attacks
will be referred as DB-m2 and DB-m3 in the rest of this chapter and the next chapter.
In the mask database, 20 subjects appear in total. The masks were manufactured for
16 of these subjects. For DB-r, average 10 scans of each subject were acquired. For
DB-m, average 10 scans of each subject wearing either his/her own mask or masks
of the other subjects that appear in the same database were acquired. Finally, 200
real face acquisitions from 20 subjects and 198 mask acquisitions from 16 masks are
used for the evaluations. Figure 4.2 shows one example from this database for a real
face access and the corresponding mask attack access.
In the mask database, DB-r and DB-m are partitioned in train and test sets. 8
subjects out of 16 subjects whose masks are manufactured, and 2 subjects out of
4 subjects whose masks are not manufactured are selected for DB-r. The samples
of the selected subjects are assigned to the test set of DB-r, while the rest is used
for the train set of DB-r. For DB-m, the mask attack accesses to the corresponding
36 Chapter 4. Impact of Mask Spoofing on Face Recognition
Figure 4.2: Example from the mask database which is created by MORPHO. From
left to right (upper row) The real face, the cropped texture image, the 3D scan after
preprocessing, the cropped depth map estimated from the raw 3D scan (lower row)
same images for the corresponding mask attack.
identities in the test set of DB-r are involved in the test set of DB-m, while the
rest is used for the train set of DB-m. There is no overlap between the train and
test sets, which makes the spoofing detection (explained in the next chapter) more
challenging. Finally, there are 100 samples in each of the client (real accesses) test
and train sets, and 99 samples in each of the impostor (mask attack accesses) test
and train sets as shown in Table 4.1.
Table 4.1: Number of Images in the Mask Database for Train and Test Sets
Train Set Test Set
Client 100 100
Impostor 99 99
4.3 The Selected Face Recognition Systems
In this section, initially, we explain the pre-processing applied for the selected 3D
and 2D face recognition techniques. Next, we give the details about these recognition
techniques.
4.3.1 Pre-Processing
Both the selected 3D and 2D face recognition systems need pre-processing. The
pre-processing applied for each selected system is explained below.
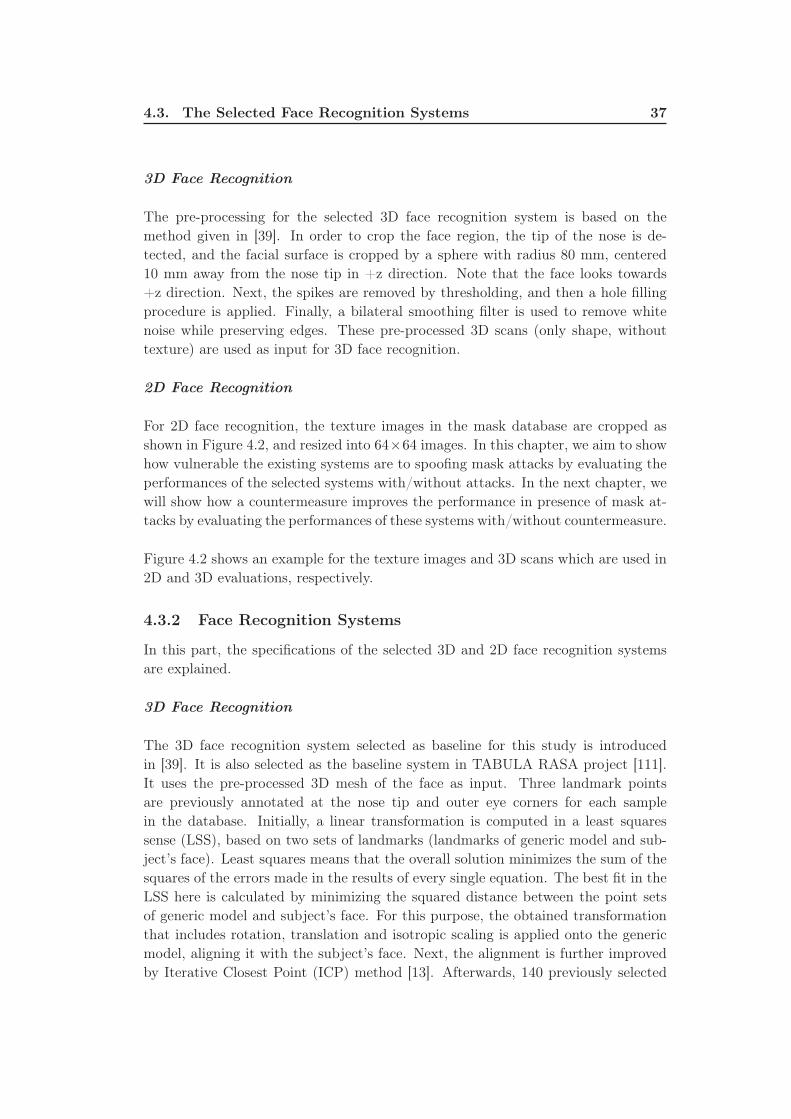
4.3. The Selected Face Recognition Systems 37
3D Face Recognition
The pre-processing for the selected 3D face recognition system is based on the
method given in [39]. In order to crop the face region, the tip of the nose is de-
tected, and the facial surface is cropped by a sphere with radius 80 mm, centered
10 mm away from the nose tip in +z direction. Note that the face looks towards
+z direction. Next, the spikes are removed by thresholding, and then a hole filling
procedure is applied. Finally, a bilateral smoothing filter is used to remove white
noise while preserving edges. These pre-processed 3D scans (only shape, without
texture) are used as input for 3D face recognition.
2D Face Recognition
For 2D face recognition, the texture images in the mask database are cropped as
shown in Figure 4.2, and resized into 64×64 images. In this chapter, we aim to show
how vulnerable the existing systems are to spoofing mask attacks by evaluating the
performances of the selected systems with/without attacks. In the next chapter, we
will show how a countermeasure improves the performance in presence of mask at-
tacks by evaluating the performances of these systems with/without countermeasure.
Figure 4.2 shows an example for the texture images and 3D scans which are used in
2D and 3D evaluations, respectively.
4.3.2 Face Recognition Systems
In this part, the specifications of the selected 3D and 2D face recognition systems
are explained.
3D Face Recognition
The 3D face recognition system selected as baseline for this study is introduced
in [39]. It is also selected as the baseline system in TABULA RASA project [111].
It uses the pre-processed 3D mesh of the face as input. Three landmark points
are previously annotated at the nose tip and outer eye corners for each sample
in the database. Initially, a linear transformation is computed in a least squares
sense (LSS), based on two sets of landmarks (landmarks of generic model and sub-
ject’s face). Least squares means that the overall solution minimizes the sum of the
squares of the errors made in the results of every single equation. The best fit in the
LSS here is calculated by minimizing the squared distance between the point sets
of generic model and subject’s face. For this purpose, the obtained transformation
that includes rotation, translation and isotropic scaling is applied onto the generic
model, aligning it with the subject’s face. Next, the alignment is further improved
by Iterative Closest Point (ICP) method [13]. Afterwards, 140 previously selected
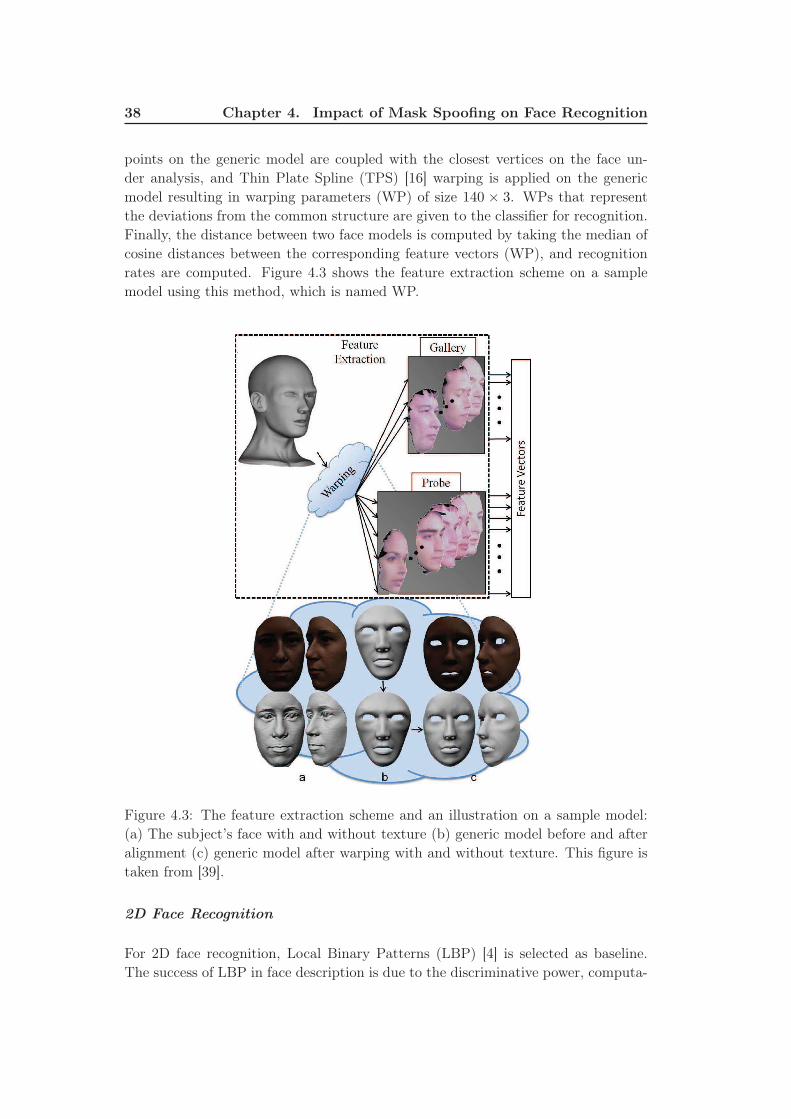
38 Chapter 4. Impact of Mask Spoofing on Face Recognition
points on the generic model are coupled with the closest vertices on the face un-
der analysis, and Thin Plate Spline (TPS) [16] warping is applied on the generic
model resulting in warping parameters (WP) of size 140 × 3. WPs that represent
the deviations from the common structure are given to the classifier for recognition.
Finally, the distance between two face models is computed by taking the median of
cosine distances between the corresponding feature vectors (WP), and recognition
rates are computed. Figure 4.3 shows the feature extraction scheme on a sample
model using this method, which is named WP.
Figure 4.3: The feature extraction scheme and an illustration on a sample model:
(a) The subject’s face with and without texture (b) generic model before and after
alignment (c) generic model after warping with and without texture. This figure is
taken from [39].
2D Face Recognition
For 2D face recognition, Local Binary Patterns (LBP) [4] is selected as baseline.
The success of LBP in face description is due to the discriminative power, computa-
4.4. Experiments and Analysis 39
tional simplicity of the operator, and its robustness to monotonic gray scale changes
caused by, for example, illumination variations. The use of histograms as features
also makes the LBP approach robust to face misalignment and pose variations to
some extent. For 2D face recognition, we use the operator LBP u28,2 on 8× 8 blocks.
The computation of LBPP,R is explained in Equations (3.1) and (3.2) in the previ-
ous chapter.
Uniform patterns are verified to be the fundamental patterns of local image texture.
A local binary pattern is called uniform if the binary pattern contains at most two
bitwise transitions from 0 to 1 or vice versa when the bit pattern is traversed cir-
cularly. The notation is LBP u2P,R. u2 stands for using only uniform patterns and
labeling all remaining patterns with a single label.
As explained in the previous chapter, in Equation (3.9), U value is the number of
spatial transitions (bitwise 0/1 changes) in the pattern. The patterns which satisfy
U ≤ 2 are selected as uniform patterns. Instead of using all patterns, sufficient in-
formation can be obtained by using only uniform patterns. The number of uniform
patterns is P × (P − 1) + 2. So in our case; LBP u2P,R results in a 59 features (59-bin
histogram) from each image block, which corresponds to 3776 (i.e. 59× 8× 8) fea-
tures for each image.
Finally, the similarity between each image pair is computed with chi-square distance
metric as recommended for LBP based algorithms in various studies [33, 52, 143].
Performances are evaluated using the similarity scores between image pairs. Equa-
tion (3.11) shows how chi-square distance between sample and model histograms is
computed.
4.4 Experiments and Analysis
In this part, the evaluations are done for 2 modes. The first mode is the baseline
mode: a standard biometric system with no spoofing and no countermeasure. The
baseline performance is evaluated using DB-r. Performance is evaluated by verifica-
tion all vs. all. Access from every identity in DB-r is tested against all other models
in DB-r. The performance is measured by observing the rate of users rejected when
authenticating against their own template (False Rejection Rate - FRR) and by the
rate of users accepted when authenticating against someone else’s template (False
Acceptance Rate - FAR). The second mode is the evaluation of face recognition
systems under mask attacks (baseline under attacks in Figure 4.4). Both DB-r and
DB-m are used. When spoofing attacks are applied, performance is expected to de-
grade. In this mode, the FAR corresponds to the rate of attacks that are accepted by
the system when spoofed. The FRR corresponds to the rate of real-access attempts
that are incorrectly dismissed by the system as attacks.
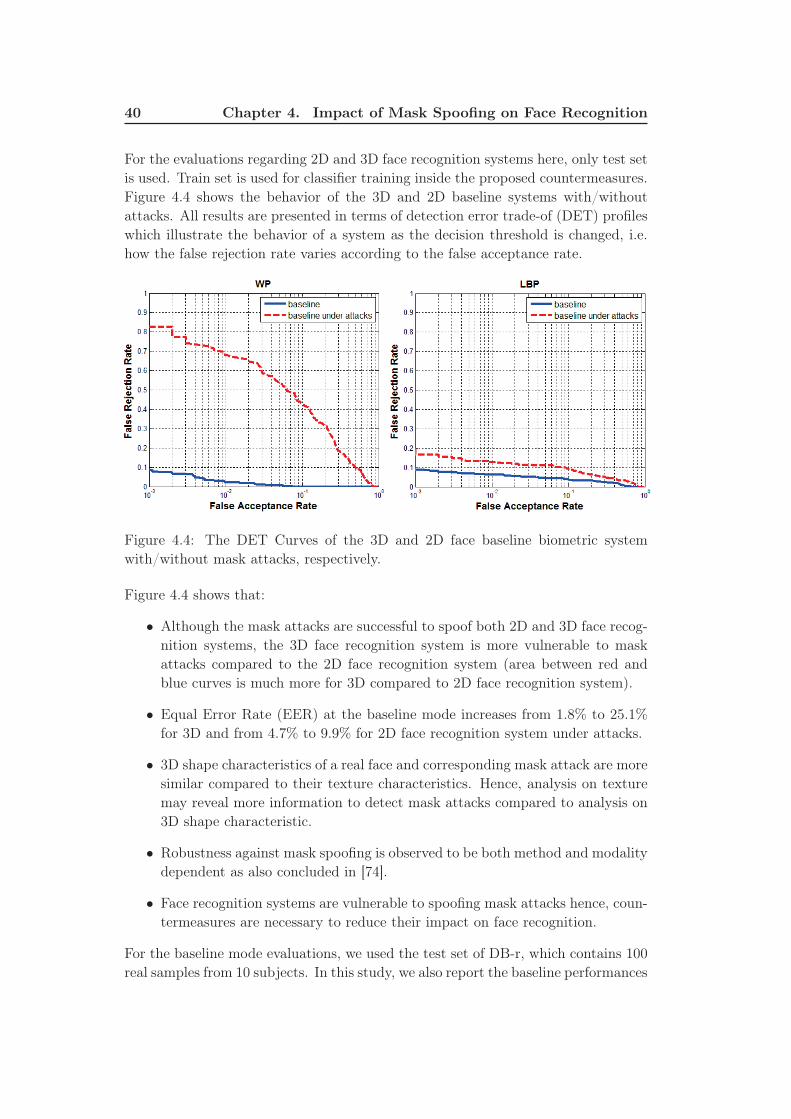
40 Chapter 4. Impact of Mask Spoofing on Face Recognition
For the evaluations regarding 2D and 3D face recognition systems here, only test set
is used. Train set is used for classifier training inside the proposed countermeasures.
Figure 4.4 shows the behavior of the 3D and 2D baseline systems with/without
attacks. All results are presented in terms of detection error trade-of (DET) profiles
which illustrate the behavior of a system as the decision threshold is changed, i.e.
how the false rejection rate varies according to the false acceptance rate.
Figure 4.4: The DET Curves of the 3D and 2D face baseline biometric system
with/without mask attacks, respectively.
Figure 4.4 shows that:
• Although the mask attacks are successful to spoof both 2D and 3D face recog-
nition systems, the 3D face recognition system is more vulnerable to mask
attacks compared to the 2D face recognition system (area between red and
blue curves is much more for 3D compared to 2D face recognition system).
• Equal Error Rate (EER) at the baseline mode increases from 1.8% to 25.1%
for 3D and from 4.7% to 9.9% for 2D face recognition system under attacks.
• 3D shape characteristics of a real face and corresponding mask attack are more
similar compared to their texture characteristics. Hence, analysis on texture
may reveal more information to detect mask attacks compared to analysis on
3D shape characteristic.
• Robustness against mask spoofing is observed to be both method and modality
dependent as also concluded in [74].
• Face recognition systems are vulnerable to spoofing mask attacks hence, coun-
termeasures are necessary to reduce their impact on face recognition.
For the baseline mode evaluations, we used the test set of DB-r, which contains 100
real samples from 10 subjects. In this study, we also report the baseline performances
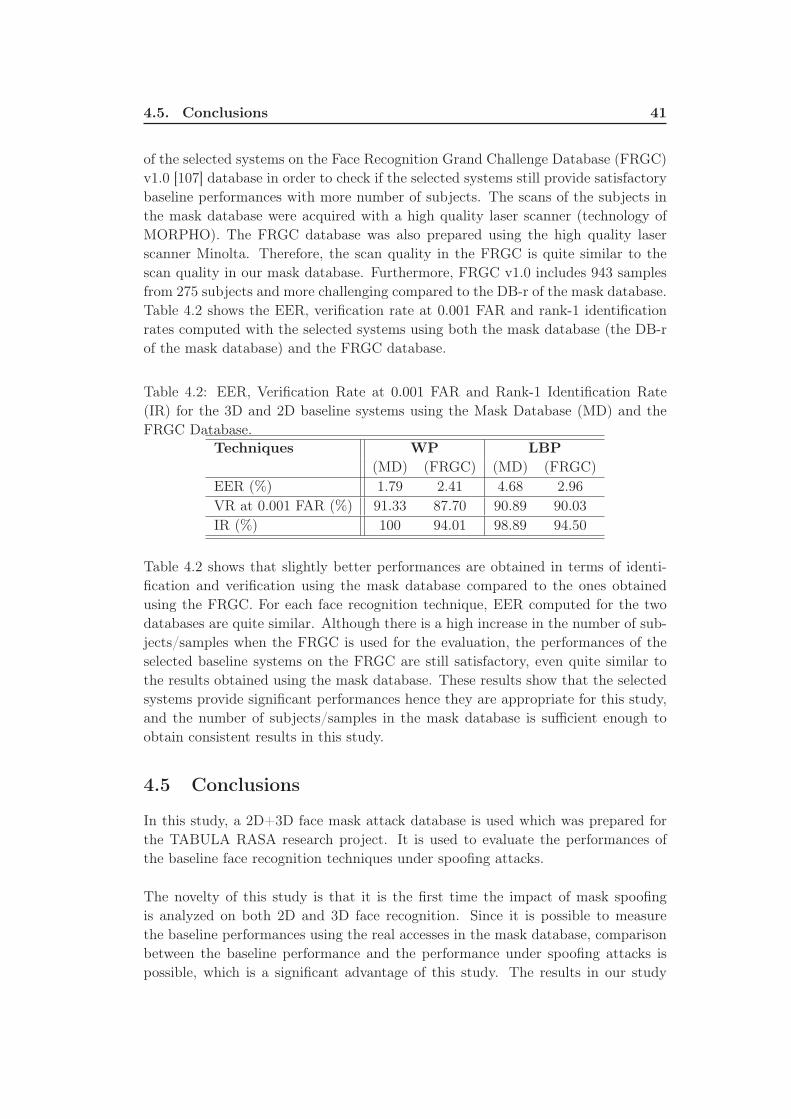
4.5. Conclusions 41
of the selected systems on the Face Recognition Grand Challenge Database (FRGC)
v1.0 [107] database in order to check if the selected systems still provide satisfactory
baseline performances with more number of subjects. The scans of the subjects in
the mask database were acquired with a high quality laser scanner (technology of
MORPHO). The FRGC database was also prepared using the high quality laser
scanner Minolta. Therefore, the scan quality in the FRGC is quite similar to the
scan quality in our mask database. Furthermore, FRGC v1.0 includes 943 samples
from 275 subjects and more challenging compared to the DB-r of the mask database.
Table 4.2 shows the EER, verification rate at 0.001 FAR and rank-1 identification
rates computed with the selected systems using both the mask database (the DB-r
of the mask database) and the FRGC database.
Table 4.2: EER, Verification Rate at 0.001 FAR and Rank-1 Identification Rate
(IR) for the 3D and 2D baseline systems using the Mask Database (MD) and the
FRGC Database.
Techniques WP LBP
(MD) (FRGC) (MD) (FRGC)
EER (%) 1.79 2.41 4.68 2.96
VR at 0.001 FAR (%) 91.33 87.70 90.89 90.03
IR (%) 100 94.01 98.89 94.50
Table 4.2 shows that slightly better performances are obtained in terms of identi-
fication and verification using the mask database compared to the ones obtained
using the FRGC. For each face recognition technique, EER computed for the two
databases are quite similar. Although there is a high increase in the number of sub-
jects/samples when the FRGC is used for the evaluation, the performances of the
selected baseline systems on the FRGC are still satisfactory, even quite similar to
the results obtained using the mask database. These results show that the selected
systems provide significant performances hence they are appropriate for this study,
and the number of subjects/samples in the mask database is sufficient enough to
obtain consistent results in this study.
4.5 Conclusions
In this study, a 2D+3D face mask attack database is used which was prepared for
the TABULA RASA research project. It is used to evaluate the performances of
the baseline face recognition techniques under spoofing attacks.
The novelty of this study is that it is the first time the impact of mask spoofing
is analyzed on both 2D and 3D face recognition. Since it is possible to measure
the baseline performances using the real accesses in the mask database, comparison
between the baseline performance and the performance under spoofing attacks is
possible, which is a significant advantage of this study. The results in our study
42 Chapter 4. Impact of Mask Spoofing on Face Recognition
show that the face recognition systems are vulnerable to spoofing mask attacks.
Robustness against mask spoofing is observed to be both method and modality de-
pendent. The systems which are based on 3D face shape analysis is observed to be
the most vulnerable systems to the mask attacks in case the masks used are prepared
by using the 3D model of their target faces. Therefore, we can say that 2D face
recognition systems are observed to be more robust against mask spoofing compared
to 3D face recognition systems when high-quality masks are used for spoofing pur-
poses. Since standard techniques are vulnerable to mask attacks, robust algorithms
are necessary to mitigate the effects of spoofing on face recognition. In this study,
we observe that analysis on texture may reveal more information to detect mask
attacks compared to analysis on 3D face shape characteristic.
In the next chapter, initially, our countermeasure techniques, which are proposed to
detect 3D mask attacks, are explained. Then, the countermeasure, which provides
the best performance in mask face detection, is integrated to the selected 3D face
recognition system in order to observe the positive impact of the countermeasure in
recognition performances.
Chapter 5
Countermeasure Techniques
Against Mask Attacks
There are several types of spoofing attacks to face recognition systems such as pho-
tograph, video or mask attacks. Recent studies show that face recognition systems
are vulnerable to these attacks. In this chapter, countermeasure techniques are
proposed to protect face recognition systems against mask attacks. The novel coun-
termeasure techniques, which are based on the analysis on different shape, texture
and reflectance characteristics of the real faces and the mask faces, are proposed
to detect mask spoofing. In this chapter, the countermeasures are developed using
both the 2D data (texture images) and the 3D data (3D scans) available in the
mask database. The results show that each of the proposed countermeasures are
succesful to detect mask spoofing and the fusion of these countermeasures further
improves the results compared to using a single countermeasure. Due to the lack of
publicly available mask database, studies on mask spoofing are limited. This chap-
ter provides state-of-the art results by proposing novel countermeasures to protect
face recognition systems against the attacks.
5.1 Introduction
The most common spoofing attacks are photograph and video attacks due to their
convenience and low cost. Based on the observations that 2D face recognition (FR)
systems are vulnerable to these attacks, researchers started to work on countermea-
sures to reduce their impact on recognition performances.
Proposed countermeasures against photo and video attacks are mainly based on
liveness detection, motion analysis and texture analysis, which are explained in Sec-
tion 2.2.1 in detail.
When 3D masks are introduced as attacks, some of these countermeasures proposed
against 2D attacks are no more applicable. The study of Kollreider et al. [71] shows
that a face recognition system relying on eye blinking and lip movements can be de-
feated by using photographic masks wrapped over face with eyes and mouth regions
cut out. Also, since motion based countermeasures depend on different movements
of 2D and 3D surfaces, they are not applicable when masks are used instead of pho-
tos or videos. It appears that the detection of 3D mask attacks is more challenging
44 Chapter 5. Countermeasure Techniques Against Mask Attacks
compared to the detection of 2D facial attacks.
3D mask attacks to FR systems is a considerably new subject. The main reason
for the delay in mask spoofing studies is due to the unavailability of public mask
databases. To our knowledge, in the literature, there are two countermeasure studies
against 3D mask attacks [66,142] excluding our studies. These two studies are based
on reflectance analysis. They utilize 2D data (texture images) in their approach to
detect 3D mask attacks. These two techniques are explained in Section 2.2.2 with
their strengths and limitations in detail. In order to contribute this compelling re-
search problem and fill the missing portions of the existing studies, we have proposed
several countermeasure techniques against 3D mask attacks in [73], [76], [75] and [77].
The spoofing performances of the masks used and the countermeasure which uses
3D data (3D scan) instead of 2D data (texture image) as input to detect mask
spoofing were first analyzed in our previous studies [73, 74], respectively, using the
mask database which was prepared within the context of the European Union (EU)
research project TABULA RASA [111]. The mask database used in our previous
studies [73–77] was created by MORPHO [98]. The specifications of this database
is given in the previous chapter in Section 4.2.
In Chapter 4, we analyzed how well the spoofing performances of the masks used in
our studies are. The results of this study show that the masks used have very simi-
lar texture and especially 3D face shape characteristics to their target faces. They
are very successful to spoof face recognition systems. In [73], we proposed to apply
micro-texture analysis on both texture and depth images, and obtained 88.12% and
86% accuracy, respectively, for the classification of mask and real faces. The nov-
elty of this work is that it was the first time 3D data was utilized to discriminate
mask and real samples. In our next study [76], which is the continuation of [73],
we applied fusion for the information extracted from both the texture and depth
images, and obtained a higher classification accuracy of 93.5%. In addition to the
increase in performance, it was the first time the performances of face recognition
systems were analyzed with/without mask attacks and with/without the proposed
countermeasure integrated to the recognition systems in [76]. By this way, it is pos-
sible to observe the positive impact of countermeasure on recognition performances
in presence of mask attacks. In [75], we proposed a countermeasure based on re-
flectance analysis using the texture images in the same database. We obtained 94%
classification accuracy in [75]. In [73], micro-texture analysis is applied on texture
images, whereas in [77], we apply micro-texture analysis also on reflectance compo-
nents of texture images as a new countermeasure. We observe that higher accuracy
(95.98%) is obtained using reflectance component instead of texture image (original
image) itself. This proves that reflectance image provides more appropriate infor-
mation than original image to discriminate mask and real samples. In [77], we also
analyzed fusion scenarios and obtained a classification accuracy of 98.99%, which
was the best score we have obtained so far.
5.2. Countermeasure Techniques Against Mask Attacks 45
In this chapter, we provide an overview on our spoofing detection approaches which
were introduced in the studies [73], [76] and [75] for the detection of mask attacks.
In [77], we extended the works explained in these studies with some improvements,
additional analysis, comparisons of performances of diverse countermeasures using
the same protocol, and with a detailed analysis of the fusion scenarios. In this
chapter, we explain this extended study, in which 98.99% classification accuracy is
reported. This accuracy is the best accuracy that have been reported in the litera-
ture for mask spoofing detection up to now. Also, we integrate the countermeasure
with the best performance to the selected 3D FR system in order to show the posi-
tive impact of the countermeasure on the systems under mask attacks, directly.
In the previous chapter, a brief information is given on the mask database used in our
studies. Also, in Section 4.3, the selected 2D and 3D FR systems are presented, and
then the impact of mask spoofing on these systems is evaluated. The results of the
study explained in Chapter 4 show that countermeasures are necessary to mitigate
the impact of spoofing mask attacks on the performances of the face recognition
systems. In this chapter, we will explain our countermeasure techniques proposed
for the detection of the mask attacks in order to protect face recognition systems
against mask spoofing.
5.2 Countermeasure Techniques Against Mask Attacks
In this part, Section 5.2.1 gives brief information about the techniques that were
used to develop the proposed countermeasures. Section 5.2.2 explains each of the
proposed countermeasures.
5.2.1 Techniques used Inside the Proposed Countermeasures
Mask attack is a 3D attack that can be used to spoof both 2D and 3D FR systems.
Most of the existing 3D scanners do not provide only 3D scan, they also capture
texture image. Figure 4.2 shows an example for the two outputs of a scanner. Thus,
when there is only one camera for 2D and one scanner for 3D FR system, a coun-
termeasure which uses texture images as input can be used to protect both 2D and
3D FR systems if texture images are provided as default output of a scanner. In
the present study, we propose four countermeasures against 3D mask attacks, which
use either the depth maps or texture images as input (Figure 5.2).
In this section, we first explain the pre-processing applied for the proposed coun-
termeasures. Then, we give a detailed information about the techniques that were
used to develop the proposed countermeasures.
46 Chapter 5. Countermeasure Techniques Against Mask Attacks
5.2.1.1 Pre-Processing for the Countermeasures
There are slight alignment differences between faces in the mask database. For the
countermeasures, initially, all 3D faces in DB-r3 and DB-m3 are aligned to a generic
face using LSS alignment, which makes the alignment of all faces identical.
In this study, we want to benefit from the information that the mask surface is
smoother than the real face surface to detect mask attacks. Therefore, the depth
maps are estimated from the raw aligned 3D scans. Next, 2D cropping is applied to
extract face region from both the texture images and depth maps. Then all images
are resized into 64× 64 grayscale image.
In [77], we improved our cropping code compared to the ones used in our previous
studies. The final version of the texture images and depth maps used for the coun-
termeasures proposed in this study are shown in the second and fourth columns of
Figure 4.2, respectively.
5.2.1.2 The Variational Retinex Algorithm
For the countermeasures proposed in this study, the image is decomposed into re-
flectance and illumination components using the variational retinex algorithm ex-
plained in the studies [6, 67].
In this part, we first give information about minimizing energy functions. Then, we
explain the variational retinex algorithm [6,67].
Minimizing Energy Functions
The concept of minimizing the energy of a given system is used in image processing.
Minimizing energy functions often includes solving partial differential equations,
more specifically, Euler-Lagrange differential equations.
In the Euler-Lagrange problem, we usually have a continuous real-valued function
y = f(x) with continuous derivative y′ = df/dx. Considering x, y, and y′ as three
independent variables, a new function g(x, y, y′) is defined. Using this function, the
energy function is defined as: E =∫
g(x, y, y′)dx. The energy function E has a
minimal value if Euler-Lagrange equation:
∂g
∂y−
∂
∂x
(
∂g
∂y′
)
= 0 (5.1)
is satisfied. The left hand side of this equation is denoted as ∇E. Here f is in-
troduced as a function of one independent variable x, the same concept is applied
when f is a function of n independent variables: x1, x2, . . . , xn. In particular, when
u = f(x, y), function of two independent variables x and y, Euler- Lagrange equation
becomes:
5.2. Countermeasure Techniques Against Mask Attacks 47
∇E =∂g
∂u−
∂
∂x
(
∂g
∂ux
)
−∂
∂y
(
∂g
∂uy
)
= 0 (5.2)
The variational retinex algorithm is developed by defining and minimizing an energy
function.
The Variational Retinex Algorithm
An image can be considered as a two dimensional function S(x, y), where (x, y)
denotes a pixel on the image. The value of the function S = S(x, y) represents the
intensity of the light at the pixel (x, y). As stated in [6], the intensity S may be
characterized by two components which are;
• the amount of source illumination falling on the object, the illumination com-
ponent L(x, y).
• the amount of illumination reflected by the object, the reflectance component
R(x, y).
S(x, y) is computed using the illumination and reflectance components as shown in
Equation (5.3).
S(x, y) = L(x, y)×R(x, y) (5.3)
In [6], it is stated that if images are assumed to be composed of illumination and
reflectance components, generating the retinex effect means being able to separate
one component from another. A first step taken by most algorithms in such sort
of problems is the conversion to the logarithmic domain by s = log(S), l = log(L),
and r = log(R). In the logarithmic domain, the relation between these three images
becomes: s = l + r.
In [67], Kimmel et al. make the following assumptions:
1. The logarithmic illumination l varies spatially smoothly.
2. The logarithmic reflectance r consists of constant or smooth parts and discon-
tinuous jump parts.
3. l is greater than or equal to the logarithmic intensity s (l ≥ s).
4. l is close to s (i.e. l does not deviate far away from s).
Based on the assumptions listed above, in the studies [6, 67], the energy function is
defined as follows:
E(l) =
∫
(|∇l|2 + α(l − s)2 + β|∇(l − s)|2)dxdy (5.4)
where α and β are positive constants. Since S is the given image, s here is constant.
In this equation;
48 Chapter 5. Countermeasure Techniques Against Mask Attacks
• The first penalty term (|∇l|2) forces spatial smoothness on l.
• The second penalty term (l − s)2 forces a proximity between l and s. The
difference between these images is exactly r, which means that the norm of r
should be small. Simultaneously, it forces the solution l to be l ≥ s. In [67],
it is stated that in practice this term should be weak enough not to attract l
down too much towards s. This is why the parameter α should be very small.
• The third term forces r to be spatially smooth. In [67], it is stated that the
parameter β should be a very small value to preserve the discontinuous jumps
of r. Note that spatially smooth r contradicts spatially smooth l since r+l = s.
However in practice adding this penalty term kicks in mainly on sharp edges
and handles situations where the illumination is not smooth (as well as cases
of direct light sources and specularities).
The integrand of this energy function is:
g(l, lx, ly) = |∇l|2 + α(l − s)2 + β|∇(l − s)|2
= (l2x + l2y) + α(l − s)2 + β((lx − sx)2 + (ly − sy)
2)(5.5)
Euler-Lagrange equation becomes:
∇E =∂g
∂l−
∂
∂x
(
∂g
∂lx
)
−∂g
∂y
(
∂g
∂ly
)
= 2α(l − s)−∂
∂x(2lx + 2β(lx − sx))−
∂
∂y(2ly + 2β(ly − sy))
= 2α(l − s)− 2lxx − 2β(lxx − sxx)− 2lyy − 2β(lyy − syy)
= 2 [α(l − s)−∆l − β∆(l − s)]
= 0
(5.6)
which means α(l − s)−∆l − β∆(l − s) = 0. In [6], to solve this equation, the idea
of the steepest descent is applied with an auxiliary variable t:
dl
dt= −∇E = ∆l + β∆(l − s)− α(l − s) (5.7)
To find a local minimum of a function using steepest descent, one takes steps pro-
portional to the negative of the gradient of the function at the current point. In our
evaluation, l is computed via steepest descent as follows:
ln = ln−1 − dt · ∇E (5.8)
Finally, projecting onto the constraint l ≥ s is done by ln = max(ln, s).
In our experiments, the values 0.0001 and 0.1 are used for α and β, respectively, as
suggested in [6, 67]. The initial value of l (l0) is taken as s. The step size dt and
the total number of iterations are selected as 0.05 and 5000, respectively. After the
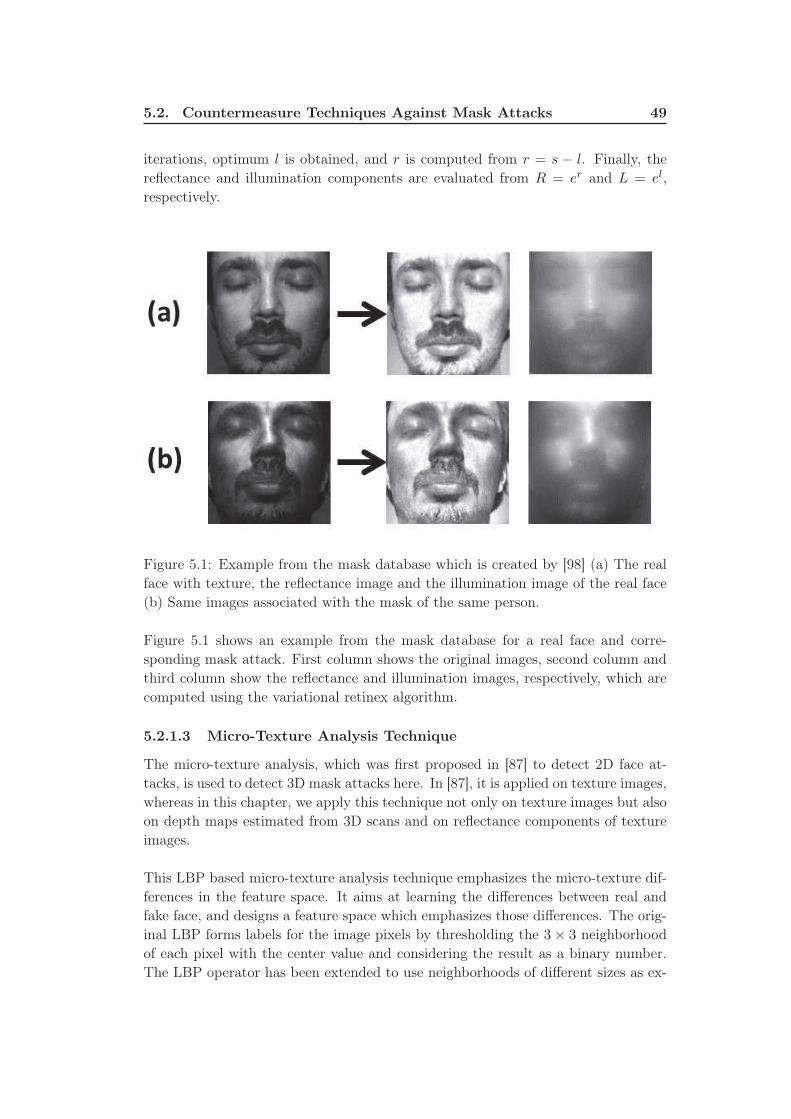
5.2. Countermeasure Techniques Against Mask Attacks 49
iterations, optimum l is obtained, and r is computed from r = s − l. Finally, the
reflectance and illumination components are evaluated from R = er and L = el,
respectively.
Figure 5.1: Example from the mask database which is created by [98] (a) The real
face with texture, the reflectance image and the illumination image of the real face
(b) Same images associated with the mask of the same person.
Figure 5.1 shows an example from the mask database for a real face and corre-
sponding mask attack. First column shows the original images, second column and
third column show the reflectance and illumination images, respectively, which are
computed using the variational retinex algorithm.
5.2.1.3 Micro-Texture Analysis Technique
The micro-texture analysis, which was first proposed in [87] to detect 2D face at-
tacks, is used to detect 3D mask attacks here. In [87], it is applied on texture images,
whereas in this chapter, we apply this technique not only on texture images but also
on depth maps estimated from 3D scans and on reflectance components of texture
images.
This LBP based micro-texture analysis technique emphasizes the micro-texture dif-
ferences in the feature space. It aims at learning the differences between real and
fake face, and designs a feature space which emphasizes those differences. The orig-
inal LBP forms labels for the image pixels by thresholding the 3× 3 neighborhood
of each pixel with the center value and considering the result as a binary number.
The LBP operator has been extended to use neighborhoods of different sizes as ex-
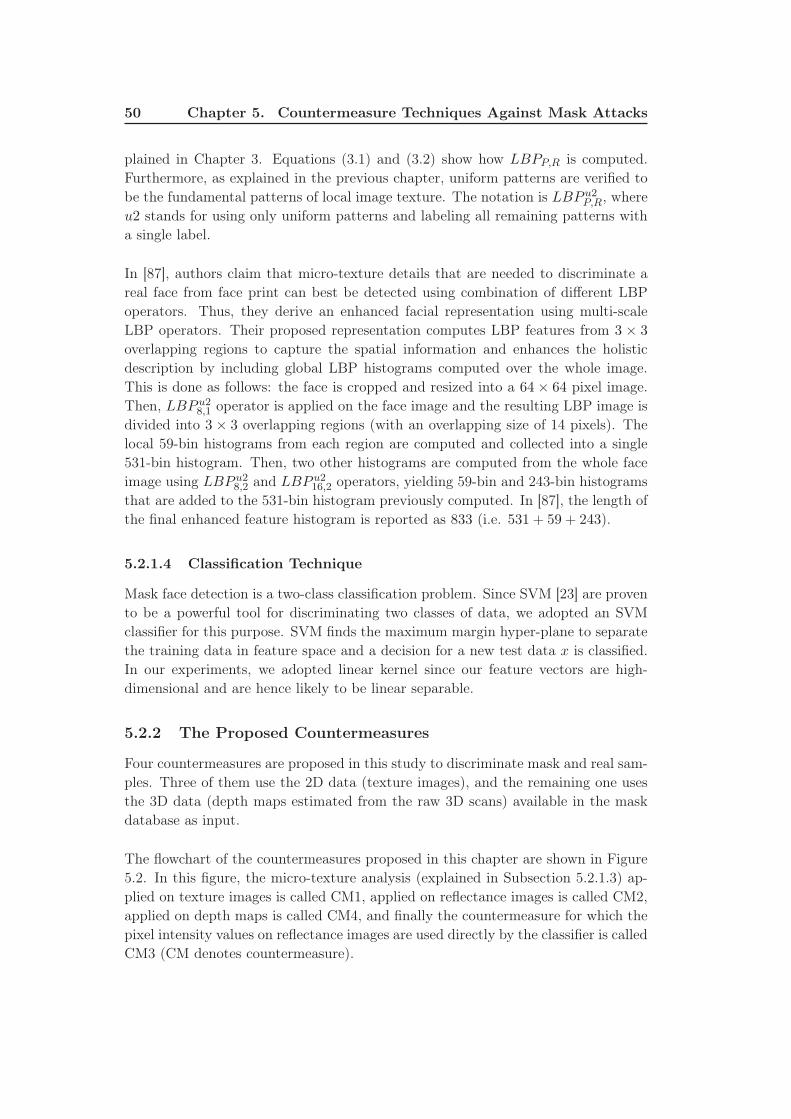
50 Chapter 5. Countermeasure Techniques Against Mask Attacks
plained in Chapter 3. Equations (3.1) and (3.2) show how LBPP,R is computed.
Furthermore, as explained in the previous chapter, uniform patterns are verified to
be the fundamental patterns of local image texture. The notation is LBP u2P,R, where
u2 stands for using only uniform patterns and labeling all remaining patterns with
a single label.
In [87], authors claim that micro-texture details that are needed to discriminate a
real face from face print can best be detected using combination of different LBP
operators. Thus, they derive an enhanced facial representation using multi-scale
LBP operators. Their proposed representation computes LBP features from 3 × 3
overlapping regions to capture the spatial information and enhances the holistic
description by including global LBP histograms computed over the whole image.
This is done as follows: the face is cropped and resized into a 64× 64 pixel image.
Then, LBP u28,1 operator is applied on the face image and the resulting LBP image is
divided into 3 × 3 overlapping regions (with an overlapping size of 14 pixels). The
local 59-bin histograms from each region are computed and collected into a single
531-bin histogram. Then, two other histograms are computed from the whole face
image using LBP u28,2 and LBP u2
16,2 operators, yielding 59-bin and 243-bin histograms
that are added to the 531-bin histogram previously computed. In [87], the length of
the final enhanced feature histogram is reported as 833 (i.e. 531 + 59 + 243).
5.2.1.4 Classification Technique
Mask face detection is a two-class classification problem. Since SVM [23] are proven
to be a powerful tool for discriminating two classes of data, we adopted an SVM
classifier for this purpose. SVM finds the maximum margin hyper-plane to separate
the training data in feature space and a decision for a new test data x is classified.
In our experiments, we adopted linear kernel since our feature vectors are high-
dimensional and are hence likely to be linear separable.
5.2.2 The Proposed Countermeasures
Four countermeasures are proposed in this study to discriminate mask and real sam-
ples. Three of them use the 2D data (texture images), and the remaining one uses
the 3D data (depth maps estimated from the raw 3D scans) available in the mask
database as input.
The flowchart of the countermeasures proposed in this chapter are shown in Figure
5.2. In this figure, the micro-texture analysis (explained in Subsection 5.2.1.3) ap-
plied on texture images is called CM1, applied on reflectance images is called CM2,
applied on depth maps is called CM4, and finally the countermeasure for which the
pixel intensity values on reflectance images are used directly by the classifier is called
CM3 (CM denotes countermeasure).
5.2. Countermeasure Techniques Against Mask Attacks 51
Figure 5.2: The flowchart of the proposed countermeasures.
CM1 and CM4 are first introduced in our study [73], and CM3 is first introduced
in our study [75]. In the present study, we provide an overview on our spoofing
detection approaches introduced in the studies [73, 75]. We extend the works ex-
plained in these studies with some improvements (e.g. better cropping, usage of
non-normalized images instead of normalized images), additional analysis, compar-
isons of performances of diverse countermeasures using the same protocol, and with
a detailed analysis of the fusion scenarios. Also, CM2 is first introduced in our re-
cent study [77]. It is a new countermeasure providing very satisfactory accuracy to
classify mask and real faces. The results of CM2 show that reflectance component of
an image provides more appropriate information than original image itself for mask
detection. From the fusion results, we also observed that it provides complementary
information on mask detection.
5.2.2.1 CM1: Micro-Texture Analysis on Texture Images
Captured image from mask may visually look very similar to the image captured
from live face (e.g. the texture images in the second column of Figure 4.2). A
close look at the differences between faces in DB-r2 and DB-m2 reveals that their
surface properties are different. For mask manufacturing 3D printers are used, hence
they may contain printing quality defects that can be detected with micro-texture
patterns. For CM1, micro-texture analysis is applied on texture images, and the
feature histogram of length 833 is obtained. Finally, linear SVM classifier is applied
to detect mask and real faces.
52 Chapter 5. Countermeasure Techniques Against Mask Attacks
5.2.2.2 CM2: Micro-Texture Analysis on Reflectance Images
For CM2, initially, the illumination and reflectance components (Figure 5.2) of the
texture images are obtained using the variational retinex algorithm introduced in
Subsection 5.2.1.2. Then, micro-texture analysis is applied on reflectance compo-
nents of texture images rather than texture images itself. The reason of this analysis
on reflectance images is that a close look at the differences between the reflectance
images of the real and mask faces reveals that the texture characteristics on their re-
flectance components are also different. The feature vectors of length 833, which are
obtained by applying micro-texture analysis on reflectance images, are used as input
by linear SVM classifier. This feature vector gives information from the reflectance
image in the image texture level.
5.2.2.3 CM3: Pixel Intensity Analysis on Reflectance Images
Our observations on the reflectance components of mask and real faces reveal that
reflectance characteristics of mask and real face samples are different especially at
some specific regions of the face (eyelashes, eyebrows and moustache). Based on
these observations, in this study, we use the intensity values on reflectance com-
ponent of each image as input for linear SVM classifier. Since the intensity values
on reflectance images are between 0 and 1 (R(x, y) ∈ [0, 1]), we stretched it to the
interval [0, 255] by multiplying R with 255. The reflectance component, which is
in the size of 64 × 64 pixel image, is reshaped as [1 4096] (64 × ×64 = 4096). The
resultant vector is the feature vector providing information in the pixel intensity
level. Finally, linear SVM classifier is applied to detect real and mask faces.
5.2.2.4 CM4: Micro-Texture Analysis on Depth Maps
The 3D shape of high quality mask is also very similar to the 3D shape of corre-
sponding real face (e.g. the 3D scans in the third column of Figure 4.2). Our analysis
on DB-r3 and DB-m3 show that the mask scan is smoother than the real face scan.
Especially the parts of the face with facial hair are quite different. Since there is
no real facial hair (e.g. mustache, eyebrow) on the masks, the 3D scan of mask is
smoother in these parts compared to the real face scan. When high quality scanners
are used for acquisition, although there is a decrease in the number of holes, it is still
possible to observe some holes on the scan especially at the parts of the face with
facial hair. Thus, in our study, micro-texture analysis is also applied on the depth
maps which are estimated from the raw 3D scans, and the other feature histogram
of length 833 is obtained. Finally, linear SVM classifier is applied to detect real and
mask faces.
5.3 Experiments and Analysis
Section 5.3 shows the experiments and results of all the proposed countermeasures
together with the fusion scenarios for comparison purposes. We first show the stand-
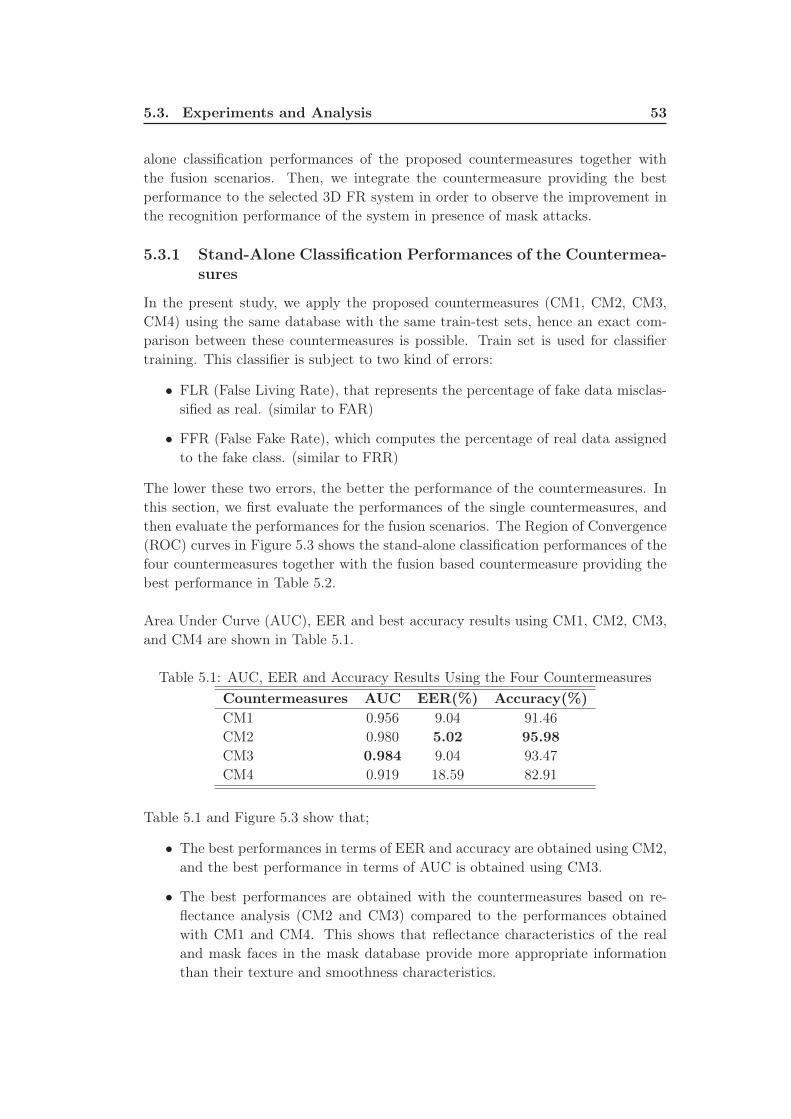
5.3. Experiments and Analysis 53
alone classification performances of the proposed countermeasures together with
the fusion scenarios. Then, we integrate the countermeasure providing the best
performance to the selected 3D FR system in order to observe the improvement in
the recognition performance of the system in presence of mask attacks.
5.3.1 Stand-Alone Classification Performances of the Countermea-sures
In the present study, we apply the proposed countermeasures (CM1, CM2, CM3,
CM4) using the same database with the same train-test sets, hence an exact com-
parison between these countermeasures is possible. Train set is used for classifier
training. This classifier is subject to two kind of errors:
• FLR (False Living Rate), that represents the percentage of fake data misclas-
sified as real. (similar to FAR)
• FFR (False Fake Rate), which computes the percentage of real data assigned
to the fake class. (similar to FRR)
The lower these two errors, the better the performance of the countermeasures. In
this section, we first evaluate the performances of the single countermeasures, and
then evaluate the performances for the fusion scenarios. The Region of Convergence
(ROC) curves in Figure 5.3 shows the stand-alone classification performances of the
four countermeasures together with the fusion based countermeasure providing the
best performance in Table 5.2.
Area Under Curve (AUC), EER and best accuracy results using CM1, CM2, CM3,
and CM4 are shown in Table 5.1.
Table 5.1: AUC, EER and Accuracy Results Using the Four Countermeasures
Countermeasures AUC EER(%) Accuracy(%)
CM1 0.956 9.04 91.46
CM2 0.980 5.02 95.98
CM3 0.984 9.04 93.47
CM4 0.919 18.59 82.91
Table 5.1 and Figure 5.3 show that;
• The best performances in terms of EER and accuracy are obtained using CM2,
and the best performance in terms of AUC is obtained using CM3.
• The best performances are obtained with the countermeasures based on re-
flectance analysis (CM2 and CM3) compared to the performances obtained
with CM1 and CM4. This shows that reflectance characteristics of the real
and mask faces in the mask database provide more appropriate information
than their texture and smoothness characteristics.
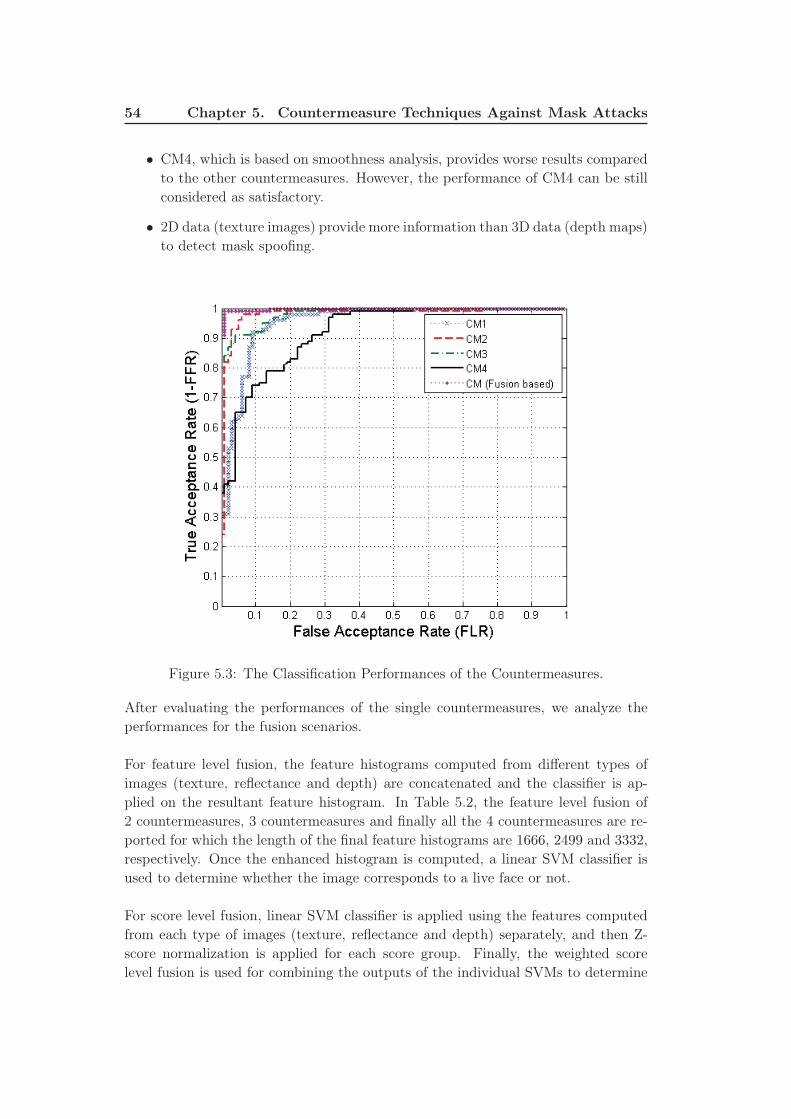
54 Chapter 5. Countermeasure Techniques Against Mask Attacks
• CM4, which is based on smoothness analysis, provides worse results compared
to the other countermeasures. However, the performance of CM4 can be still
considered as satisfactory.
• 2D data (texture images) provide more information than 3D data (depth maps)
to detect mask spoofing.
Figure 5.3: The Classification Performances of the Countermeasures.
After evaluating the performances of the single countermeasures, we analyze the
performances for the fusion scenarios.
For feature level fusion, the feature histograms computed from different types of
images (texture, reflectance and depth) are concatenated and the classifier is ap-
plied on the resultant feature histogram. In Table 5.2, the feature level fusion of
2 countermeasures, 3 countermeasures and finally all the 4 countermeasures are re-
ported for which the length of the final feature histograms are 1666, 2499 and 3332,
respectively. Once the enhanced histogram is computed, a linear SVM classifier is
used to determine whether the image corresponds to a live face or not.
For score level fusion, linear SVM classifier is applied using the features computed
from each type of images (texture, reflectance and depth) separately, and then Z-
score normalization is applied for each score group. Finally, the weighted score
level fusion is used for combining the outputs of the individual SVMs to determine
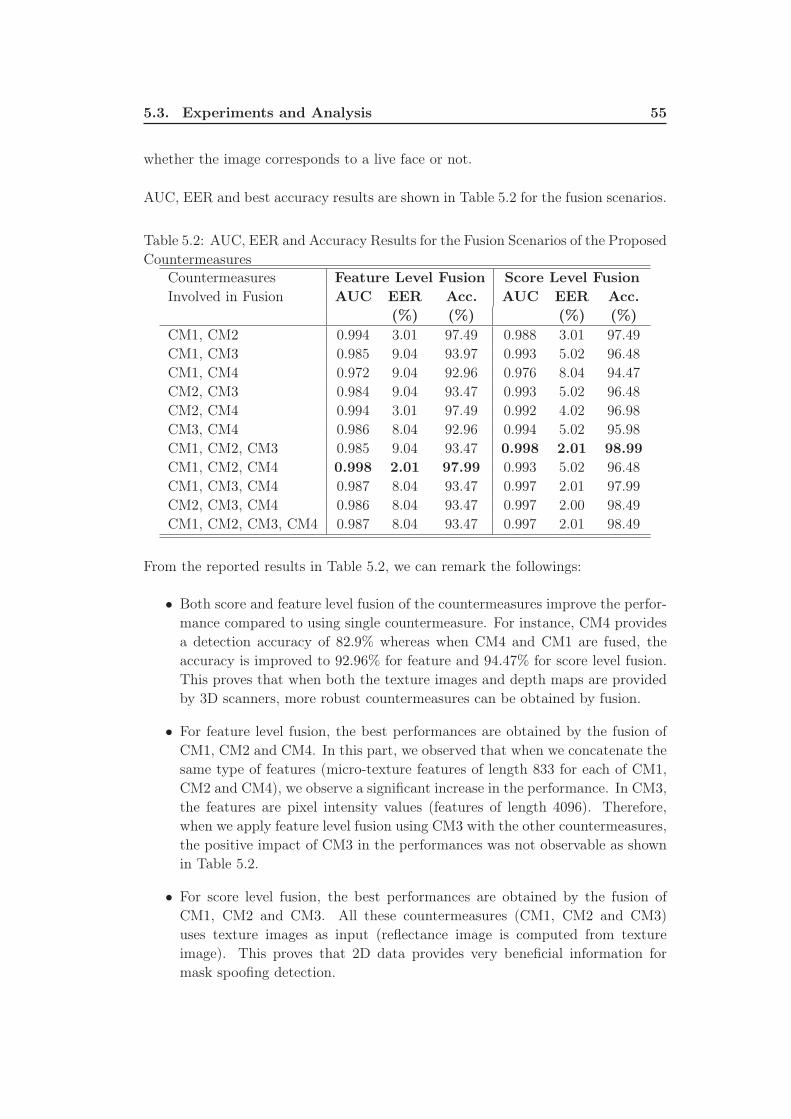
5.3. Experiments and Analysis 55
whether the image corresponds to a live face or not.
AUC, EER and best accuracy results are shown in Table 5.2 for the fusion scenarios.
Table 5.2: AUC, EER and Accuracy Results for the Fusion Scenarios of the Proposed
Countermeasures
Countermeasures Feature Level Fusion Score Level Fusion
Involved in Fusion AUC EER Acc. AUC EER Acc.
(%) (%) (%) (%)
CM1, CM2 0.994 3.01 97.49 0.988 3.01 97.49
CM1, CM3 0.985 9.04 93.97 0.993 5.02 96.48
CM1, CM4 0.972 9.04 92.96 0.976 8.04 94.47
CM2, CM3 0.984 9.04 93.47 0.993 5.02 96.48
CM2, CM4 0.994 3.01 97.49 0.992 4.02 96.98
CM3, CM4 0.986 8.04 92.96 0.994 5.02 95.98
CM1, CM2, CM3 0.985 9.04 93.47 0.998 2.01 98.99
CM1, CM2, CM4 0.998 2.01 97.99 0.993 5.02 96.48
CM1, CM3, CM4 0.987 8.04 93.47 0.997 2.01 97.99
CM2, CM3, CM4 0.986 8.04 93.47 0.997 2.00 98.49
CM1, CM2, CM3, CM4 0.987 8.04 93.47 0.997 2.01 98.49
From the reported results in Table 5.2, we can remark the followings:
• Both score and feature level fusion of the countermeasures improve the perfor-
mance compared to using single countermeasure. For instance, CM4 provides
a detection accuracy of 82.9% whereas when CM4 and CM1 are fused, the
accuracy is improved to 92.96% for feature and 94.47% for score level fusion.
This proves that when both the texture images and depth maps are provided
by 3D scanners, more robust countermeasures can be obtained by fusion.
• For feature level fusion, the best performances are obtained by the fusion of
CM1, CM2 and CM4. In this part, we observed that when we concatenate the
same type of features (micro-texture features of length 833 for each of CM1,
CM2 and CM4), we observe a significant increase in the performance. In CM3,
the features are pixel intensity values (features of length 4096). Therefore,
when we apply feature level fusion using CM3 with the other countermeasures,
the positive impact of CM3 in the performances was not observable as shown
in Table 5.2.
• For score level fusion, the best performances are obtained by the fusion of
CM1, CM2 and CM3. All these countermeasures (CM1, CM2 and CM3)
uses texture images as input (reflectance image is computed from texture
image). This proves that 2D data provides very beneficial information for
mask spoofing detection.
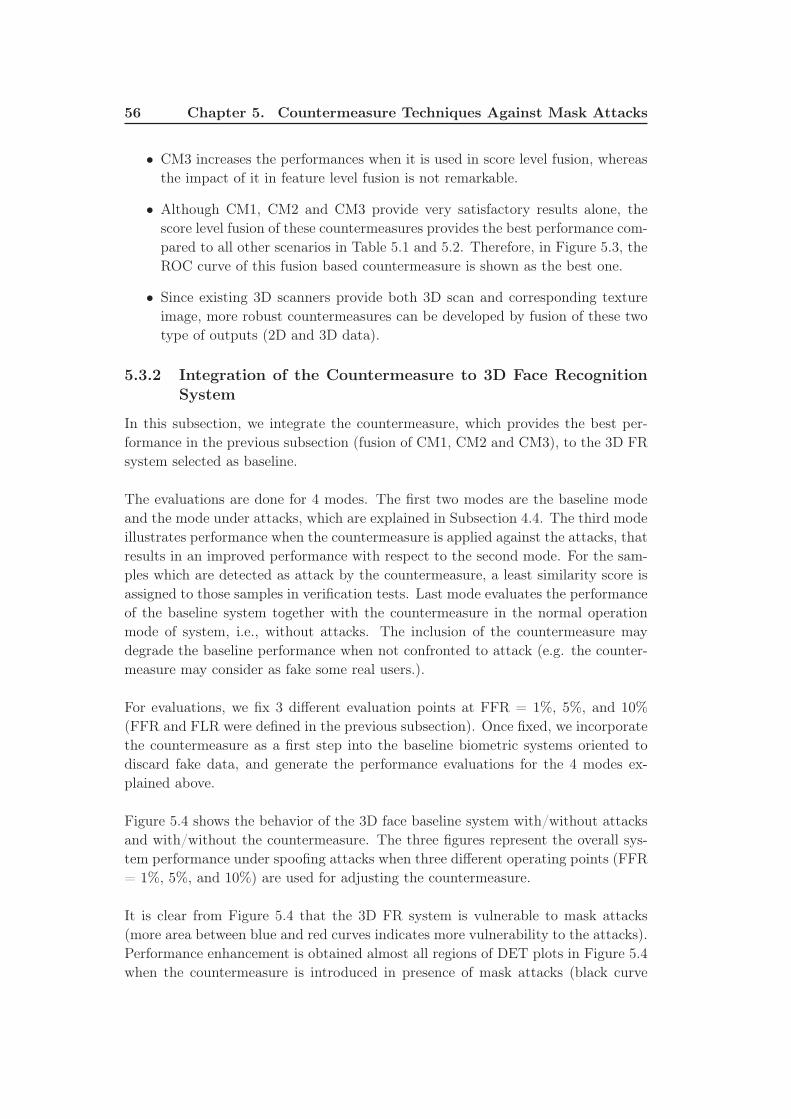
56 Chapter 5. Countermeasure Techniques Against Mask Attacks
• CM3 increases the performances when it is used in score level fusion, whereas
the impact of it in feature level fusion is not remarkable.
• Although CM1, CM2 and CM3 provide very satisfactory results alone, the
score level fusion of these countermeasures provides the best performance com-
pared to all other scenarios in Table 5.1 and 5.2. Therefore, in Figure 5.3, the
ROC curve of this fusion based countermeasure is shown as the best one.
• Since existing 3D scanners provide both 3D scan and corresponding texture
image, more robust countermeasures can be developed by fusion of these two
type of outputs (2D and 3D data).
5.3.2 Integration of the Countermeasure to 3D Face RecognitionSystem
In this subsection, we integrate the countermeasure, which provides the best per-
formance in the previous subsection (fusion of CM1, CM2 and CM3), to the 3D FR
system selected as baseline.
The evaluations are done for 4 modes. The first two modes are the baseline mode
and the mode under attacks, which are explained in Subsection 4.4. The third mode
illustrates performance when the countermeasure is applied against the attacks, that
results in an improved performance with respect to the second mode. For the sam-
ples which are detected as attack by the countermeasure, a least similarity score is
assigned to those samples in verification tests. Last mode evaluates the performance
of the baseline system together with the countermeasure in the normal operation
mode of system, i.e., without attacks. The inclusion of the countermeasure may
degrade the baseline performance when not confronted to attack (e.g. the counter-
measure may consider as fake some real users.).
For evaluations, we fix 3 different evaluation points at FFR = 1%, 5%, and 10%
(FFR and FLR were defined in the previous subsection). Once fixed, we incorporate
the countermeasure as a first step into the baseline biometric systems oriented to
discard fake data, and generate the performance evaluations for the 4 modes ex-
plained above.
Figure 5.4 shows the behavior of the 3D face baseline system with/without attacks
and with/without the countermeasure. The three figures represent the overall sys-
tem performance under spoofing attacks when three different operating points (FFR
= 1%, 5%, and 10%) are used for adjusting the countermeasure.
It is clear from Figure 5.4 that the 3D FR system is vulnerable to mask attacks
(more area between blue and red curves indicates more vulnerability to the attacks).
Performance enhancement is obtained almost all regions of DET plots in Figure 5.4
when the countermeasure is introduced in presence of mask attacks (black curve
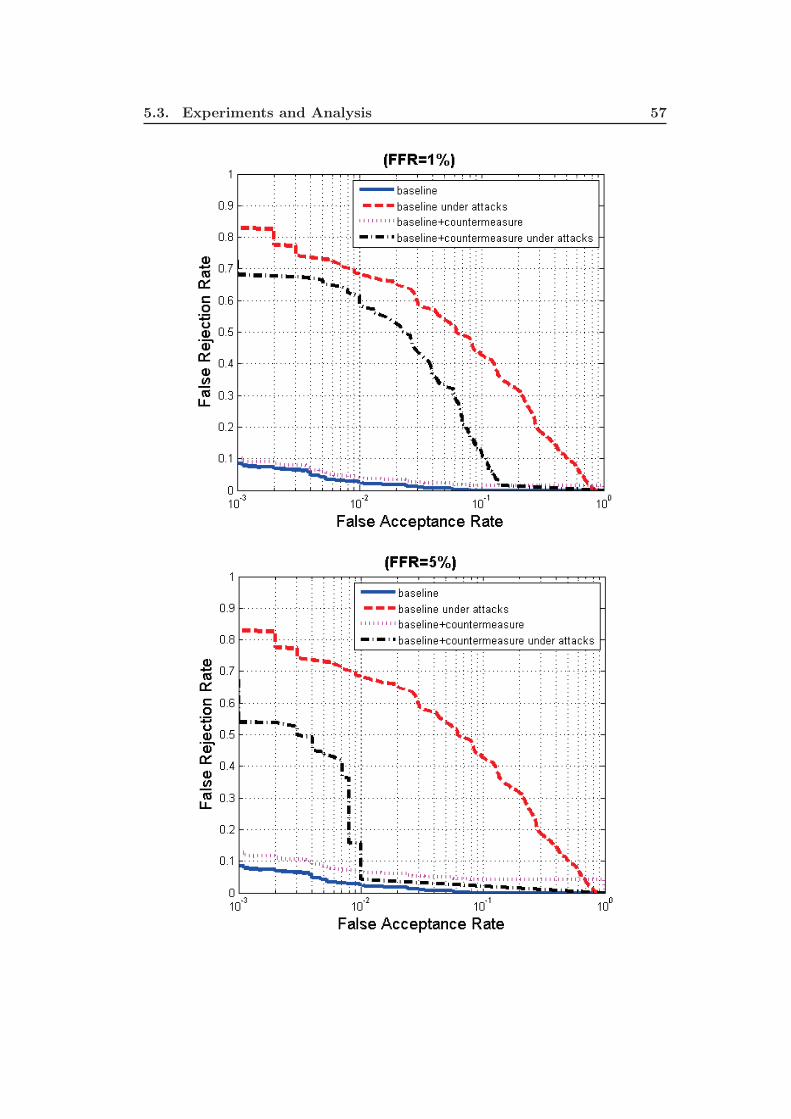
5.3. Experiments and Analysis 57
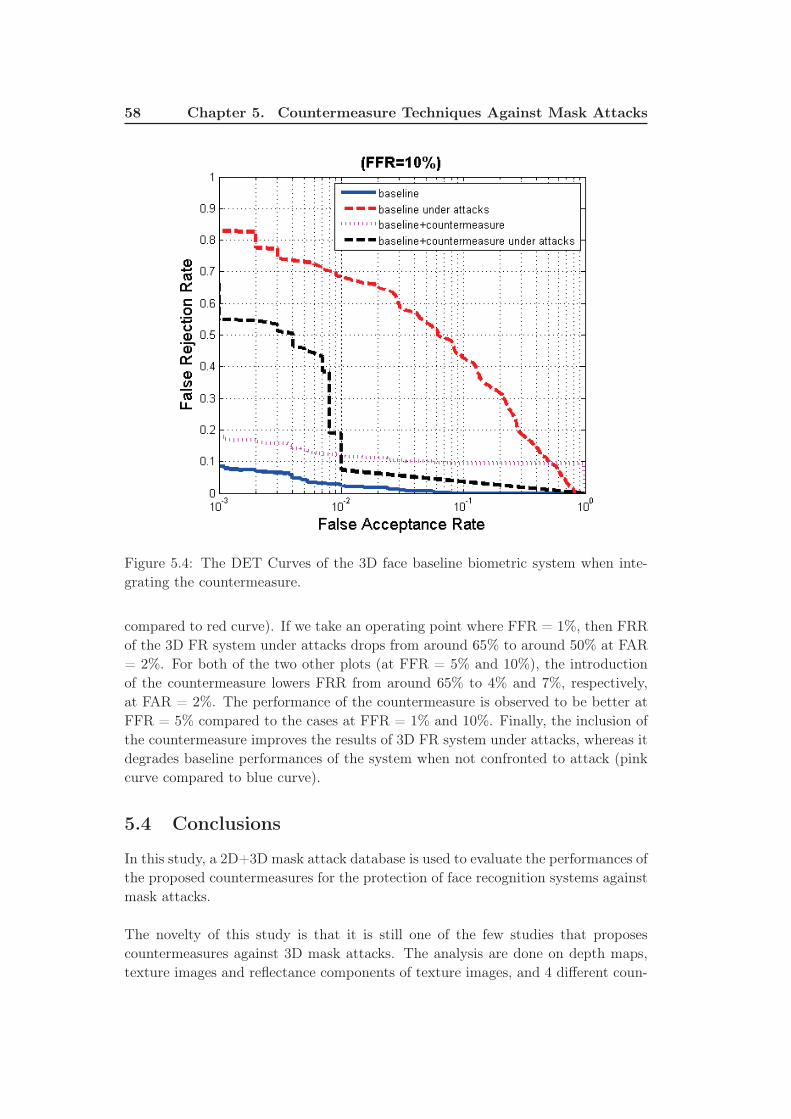
58 Chapter 5. Countermeasure Techniques Against Mask Attacks
Figure 5.4: The DET Curves of the 3D face baseline biometric system when inte-
grating the countermeasure.
compared to red curve). If we take an operating point where FFR = 1%, then FRR
of the 3D FR system under attacks drops from around 65% to around 50% at FAR
= 2%. For both of the two other plots (at FFR = 5% and 10%), the introduction
of the countermeasure lowers FRR from around 65% to 4% and 7%, respectively,
at FAR = 2%. The performance of the countermeasure is observed to be better at
FFR = 5% compared to the cases at FFR = 1% and 10%. Finally, the inclusion of
the countermeasure improves the results of 3D FR system under attacks, whereas it
degrades baseline performances of the system when not confronted to attack (pink
curve compared to blue curve).
5.4 Conclusions
In this study, a 2D+3D mask attack database is used to evaluate the performances of
the proposed countermeasures for the protection of face recognition systems against
mask attacks.
The novelty of this study is that it is still one of the few studies that proposes
countermeasures against 3D mask attacks. The analysis are done on depth maps,
texture images and reflectance components of texture images, and 4 different coun-
5.4. Conclusions 59
termeasures are proposed. Three of the proposed countermeasures use 2D data
(texture images), and the remaining one uses 3D data (depth images) as input.
These countermeasures can be used to protect both 2D and 3D FR systems against
mask attacks. The results of this study show that analysis on reflectance images
provide the best results compared to analysis on texture and depth images. All of
the 4 countermeasures provide satisfactory information hence can be used as inde-
pendent sources to discriminate masks from real faces. However with the fusion of
these countermeasures, we observe a significant improvement in the performances.
For instance, in this chapter, a classification accuracy of 99% (almost perfect accu-
racy) is achieved for real face vs. mask face by fusion.
Up to now, we have analyzed several characteristics of real and mask faces, and
obtained almost perfect results on this mask database. The limitation of our study
is that we were able to test the performances of the proposed countermeasures using
the masks made from one type of material, which is polychrome mineral powder.
When masks made from different materials are used, we may obtain different perfor-
mance accuracy. Our future works are first to test the performances of the proposed
countermeasures using masks made from different materials in order to observe if
we can still obtain satisfactory results, and then to propose new countermeasures
for more challenging mask databases with higher number of subjects as soon as
available.

Chapter 6
Impact of Nose Alterations on
Face Recognition
Numerous major challenges in face recognition, such as pose, illumination, expres-
sion and aging, have been investigated extensively. All those variations modify the
texture and/or the shape of the face in a similar manner for different individuals.
However, studies on alterations applied on face via plastic surgery or prosthetic
make-up which can be in countless different ways and amounts, are still very lim-
ited. In this chapter, we analyze how such changes on nose region affect the face
recognition performances of several key techniques. For this purpose, a simulated
face database is prepared using FRGC v1.0 in which nose in each sample is re-
placed with another randomly chosen one. Since this is a 3D database, the impact
analysis is not limited to only 2D, which is one of the novelties of this study. Perfor-
mance comparisons of three 2D and four 3D algorithms are provided. In addition,
differently from previous works, baseline results for the original database are also
reported. Hence, the impact which is purely due to the applied nose alterations
can be measured. The experimental results indicate that with the introduction of
alterations both modalities lose precision, especially 3D.
6.1 Introduction
Plastic surgery is considered to be a relatively new challenge in face recognition when
compared to pose, expression or illumination variations. With the increasing num-
ber of people resorting to plastic surgery for correction of feature defects, cosmetic
reasons or even law evasion, it becomes of interest for the biometric community to
investigate and prevent the impact of facial alterations on recognition performances.
Yet, very few studies exist which address this problem.
In this chapter, we focus on the nose modifications and analyze their effects on suc-
cess rates of different face recognition methods. In the next chapter, we propose
a new approach robust to nose alterations. According to the statistics published
by The American Society for Aesthetic Plastic Surgery in 2010 [46], nose reshaping
(rhinoplasty) is the second most common surgical procedure on face after cosmetic
eyelid surgery (blepharoplasty).
On the other hand, plastic surgery is just one of many ways to change the appearance
of the nose. For example, latex/silicone-based prosthetic appliances can be simply
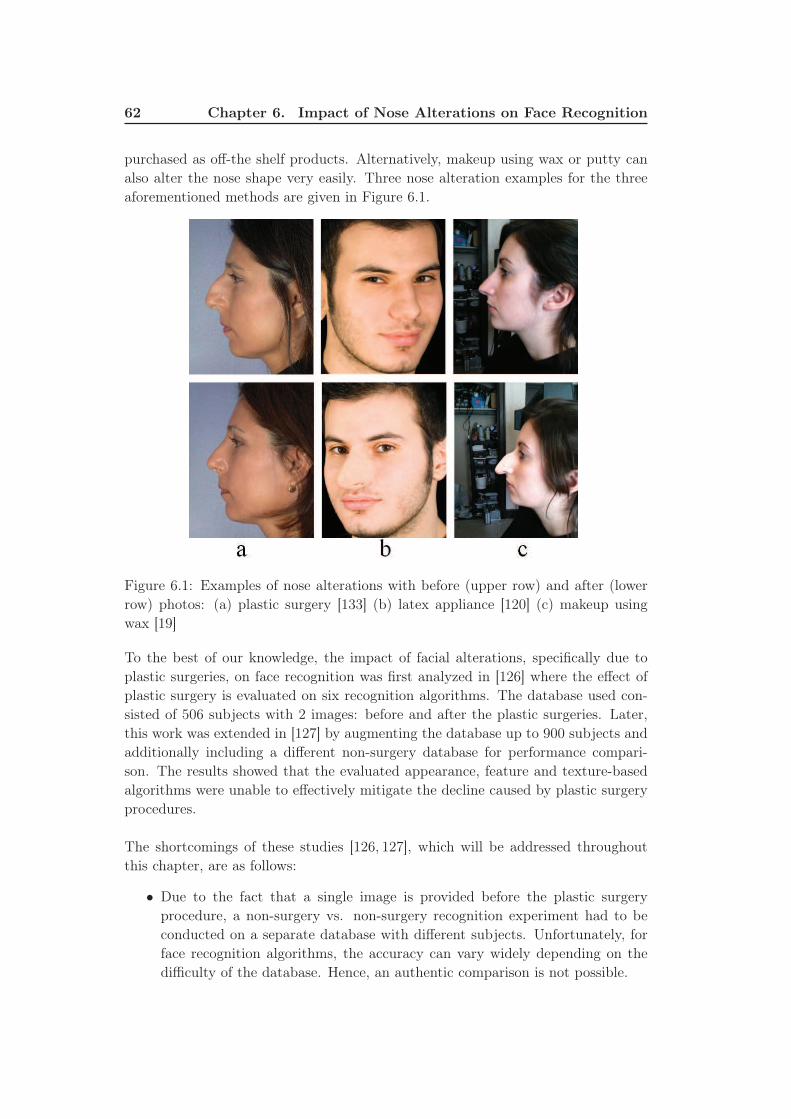
62 Chapter 6. Impact of Nose Alterations on Face Recognition
purchased as off-the shelf products. Alternatively, makeup using wax or putty can
also alter the nose shape very easily. Three nose alteration examples for the three
aforementioned methods are given in Figure 6.1.
Figure 6.1: Examples of nose alterations with before (upper row) and after (lower
row) photos: (a) plastic surgery [133] (b) latex appliance [120] (c) makeup using
wax [19]
To the best of our knowledge, the impact of facial alterations, specifically due to
plastic surgeries, on face recognition was first analyzed in [126] where the effect of
plastic surgery is evaluated on six recognition algorithms. The database used con-
sisted of 506 subjects with 2 images: before and after the plastic surgeries. Later,
this work was extended in [127] by augmenting the database up to 900 subjects and
additionally including a different non-surgery database for performance compari-
son. The results showed that the evaluated appearance, feature and texture-based
algorithms were unable to effectively mitigate the decline caused by plastic surgery
procedures.
The shortcomings of these studies [126, 127], which will be addressed throughout
this chapter, are as follows:
• Due to the fact that a single image is provided before the plastic surgery
procedure, a non-surgery vs. non-surgery recognition experiment had to be
conducted on a separate database with different subjects. Unfortunately, for
face recognition algorithms, the accuracy can vary widely depending on the
difficulty of the database. Hence, an authentic comparison is not possible.
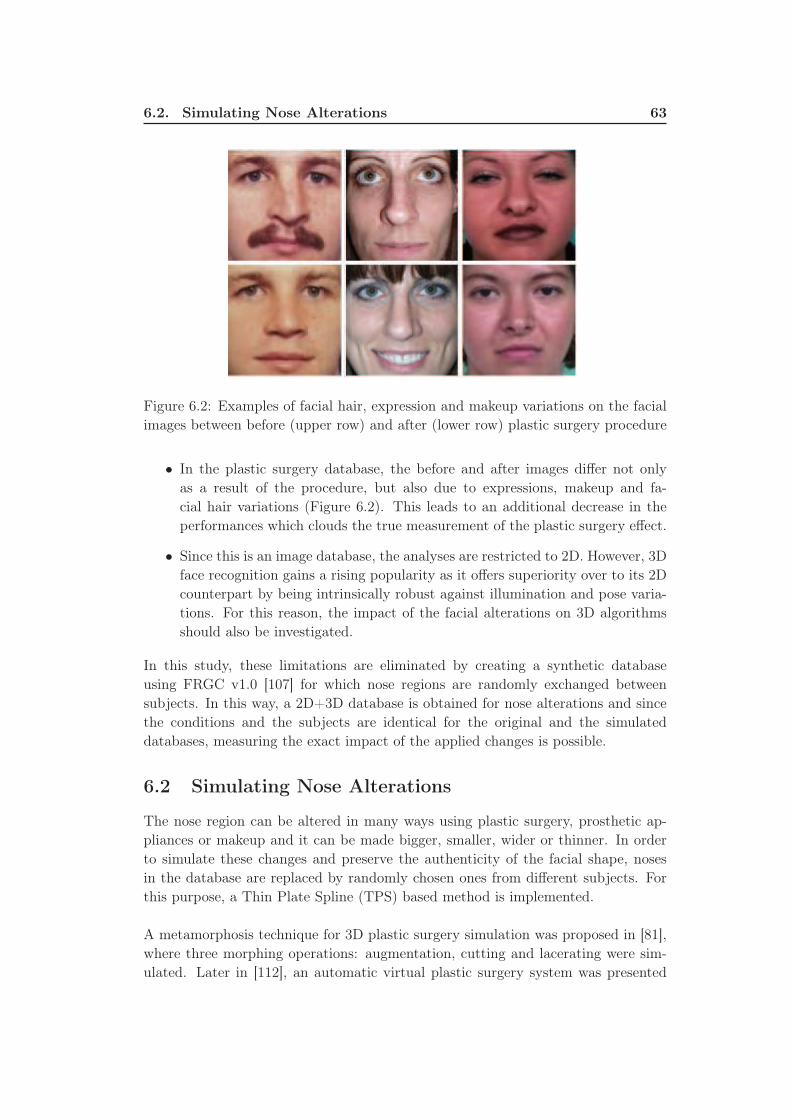
6.2. Simulating Nose Alterations 63
Figure 6.2: Examples of facial hair, expression and makeup variations on the facial
images between before (upper row) and after (lower row) plastic surgery procedure
• In the plastic surgery database, the before and after images differ not only
as a result of the procedure, but also due to expressions, makeup and fa-
cial hair variations (Figure 6.2). This leads to an additional decrease in the
performances which clouds the true measurement of the plastic surgery effect.
• Since this is an image database, the analyses are restricted to 2D. However, 3D
face recognition gains a rising popularity as it offers superiority over to its 2D
counterpart by being intrinsically robust against illumination and pose varia-
tions. For this reason, the impact of the facial alterations on 3D algorithms
should also be investigated.
In this study, these limitations are eliminated by creating a synthetic database
using FRGC v1.0 [107] for which nose regions are randomly exchanged between
subjects. In this way, a 2D+3D database is obtained for nose alterations and since
the conditions and the subjects are identical for the original and the simulated
databases, measuring the exact impact of the applied changes is possible.
6.2 Simulating Nose Alterations
The nose region can be altered in many ways using plastic surgery, prosthetic ap-
pliances or makeup and it can be made bigger, smaller, wider or thinner. In order
to simulate these changes and preserve the authenticity of the facial shape, noses
in the database are replaced by randomly chosen ones from different subjects. For
this purpose, a Thin Plate Spline (TPS) based method is implemented.
A metamorphosis technique for 3D plastic surgery simulation was proposed in [81],
where three morphing operations: augmentation, cutting and lacerating were sim-
ulated. Later in [112], an automatic virtual plastic surgery system was presented
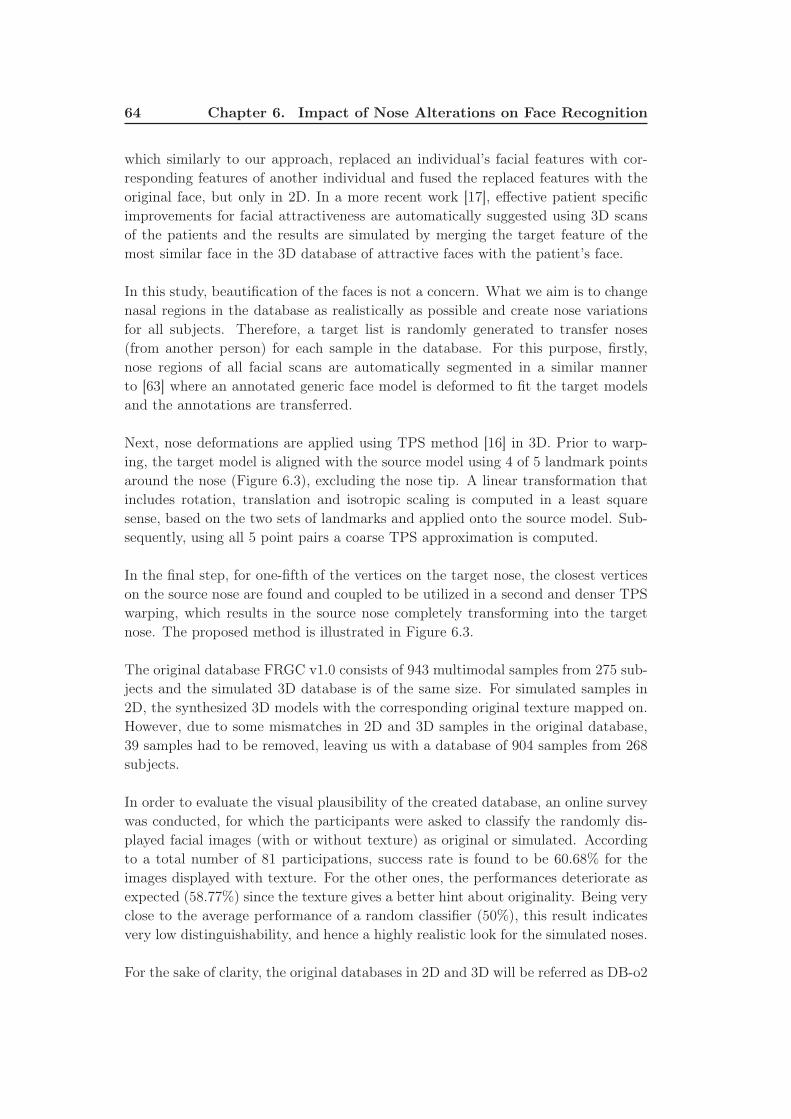
64 Chapter 6. Impact of Nose Alterations on Face Recognition
which similarly to our approach, replaced an individual’s facial features with cor-
responding features of another individual and fused the replaced features with the
original face, but only in 2D. In a more recent work [17], effective patient specific
improvements for facial attractiveness are automatically suggested using 3D scans
of the patients and the results are simulated by merging the target feature of the
most similar face in the 3D database of attractive faces with the patient’s face.
In this study, beautification of the faces is not a concern. What we aim is to change
nasal regions in the database as realistically as possible and create nose variations
for all subjects. Therefore, a target list is randomly generated to transfer noses
(from another person) for each sample in the database. For this purpose, firstly,
nose regions of all facial scans are automatically segmented in a similar manner
to [63] where an annotated generic face model is deformed to fit the target models
and the annotations are transferred.
Next, nose deformations are applied using TPS method [16] in 3D. Prior to warp-
ing, the target model is aligned with the source model using 4 of 5 landmark points
around the nose (Figure 6.3), excluding the nose tip. A linear transformation that
includes rotation, translation and isotropic scaling is computed in a least square
sense, based on the two sets of landmarks and applied onto the source model. Sub-
sequently, using all 5 point pairs a coarse TPS approximation is computed.
In the final step, for one-fifth of the vertices on the target nose, the closest vertices
on the source nose are found and coupled to be utilized in a second and denser TPS
warping, which results in the source nose completely transforming into the target
nose. The proposed method is illustrated in Figure 6.3.
The original database FRGC v1.0 consists of 943 multimodal samples from 275 sub-
jects and the simulated 3D database is of the same size. For simulated samples in
2D, the synthesized 3D models with the corresponding original texture mapped on.
However, due to some mismatches in 2D and 3D samples in the original database,
39 samples had to be removed, leaving us with a database of 904 samples from 268
subjects.
In order to evaluate the visual plausibility of the created database, an online survey
was conducted, for which the participants were asked to classify the randomly dis-
played facial images (with or without texture) as original or simulated. According
to a total number of 81 participations, success rate is found to be 60.68% for the
images displayed with texture. For the other ones, the performances deteriorate as
expected (58.77%) since the texture gives a better hint about originality. Being very
close to the average performance of a random classifier (50%), this result indicates
very low distinguishability, and hence a highly realistic look for the simulated noses.
For the sake of clarity, the original databases in 2D and 3D will be referred as DB-o2
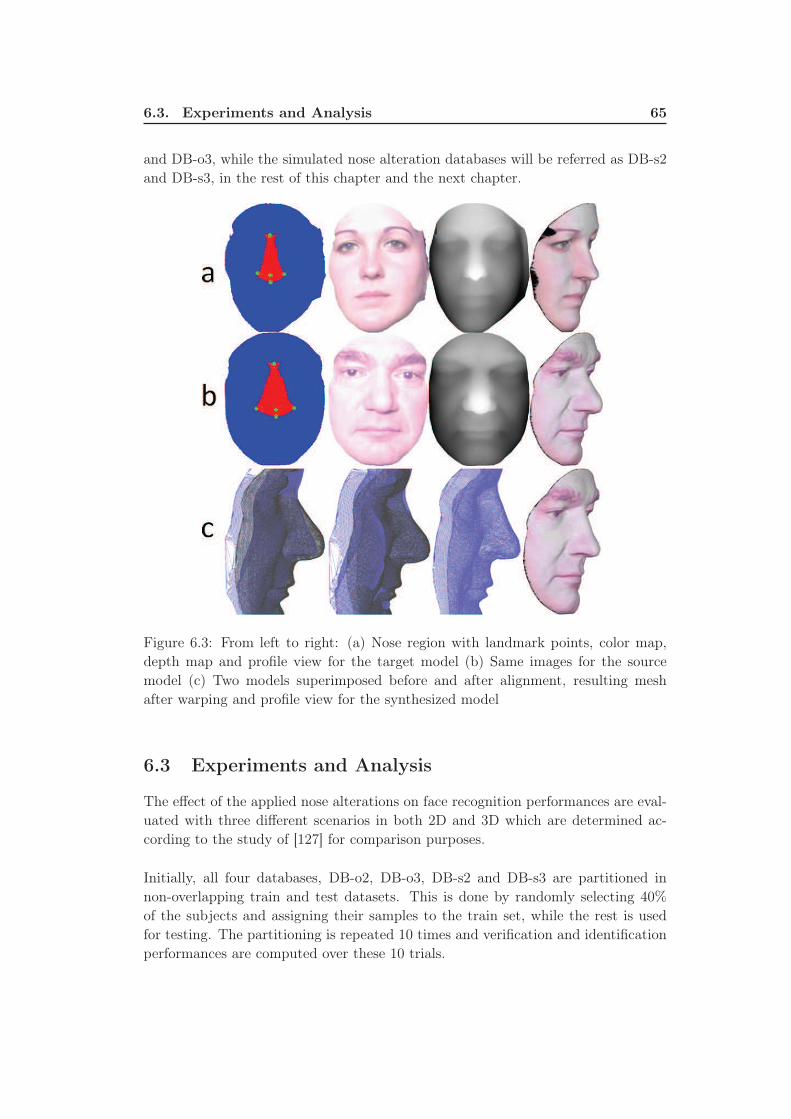
6.3. Experiments and Analysis 65
and DB-o3, while the simulated nose alteration databases will be referred as DB-s2
and DB-s3, in the rest of this chapter and the next chapter.
Figure 6.3: From left to right: (a) Nose region with landmark points, color map,
depth map and profile view for the target model (b) Same images for the source
model (c) Two models superimposed before and after alignment, resulting mesh
after warping and profile view for the synthesized model
6.3 Experiments and Analysis
The effect of the applied nose alterations on face recognition performances are eval-
uated with three different scenarios in both 2D and 3D which are determined ac-
cording to the study of [127] for comparison purposes.
Initially, all four databases, DB-o2, DB-o3, DB-s2 and DB-s3 are partitioned in
non-overlapping train and test datasets. This is done by randomly selecting 40%
of the subjects and assigning their samples to the train set, while the rest is used
for testing. The partitioning is repeated 10 times and verification and identification
performances are computed over these 10 trials.
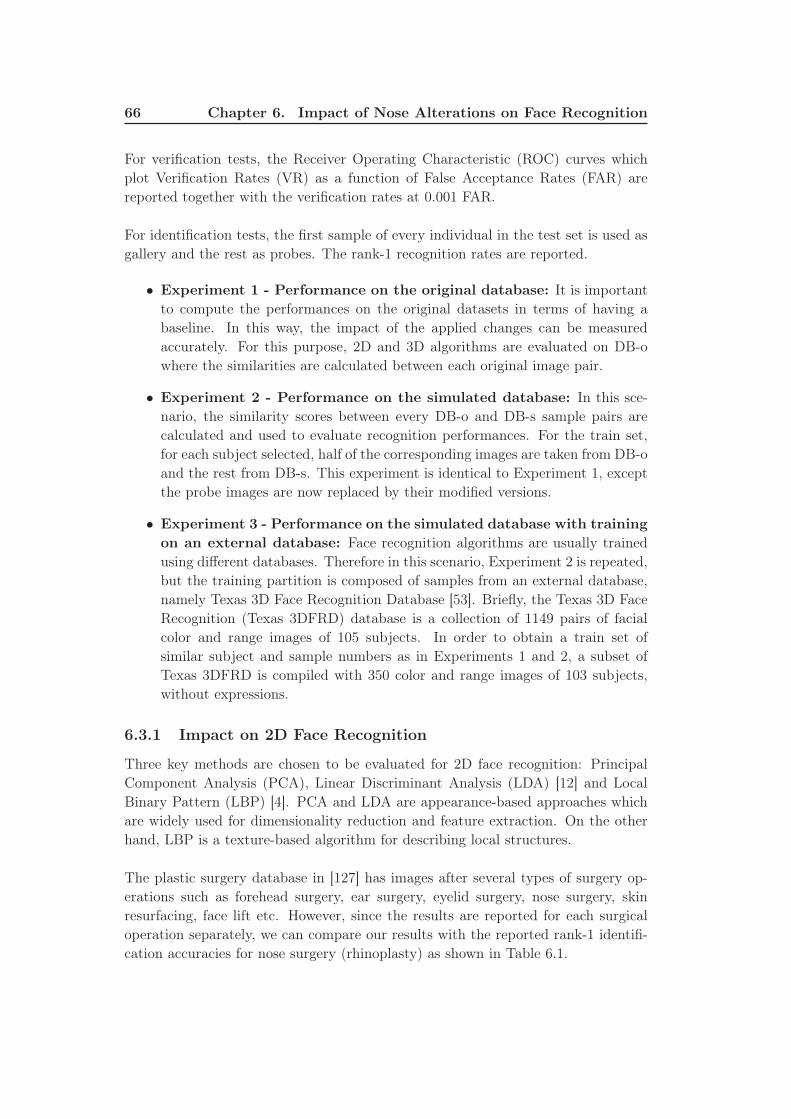
66 Chapter 6. Impact of Nose Alterations on Face Recognition
For verification tests, the Receiver Operating Characteristic (ROC) curves which
plot Verification Rates (VR) as a function of False Acceptance Rates (FAR) are
reported together with the verification rates at 0.001 FAR.
For identification tests, the first sample of every individual in the test set is used as
gallery and the rest as probes. The rank-1 recognition rates are reported.
• Experiment 1 - Performance on the original database: It is important
to compute the performances on the original datasets in terms of having a
baseline. In this way, the impact of the applied changes can be measured
accurately. For this purpose, 2D and 3D algorithms are evaluated on DB-o
where the similarities are calculated between each original image pair.
• Experiment 2 - Performance on the simulated database: In this sce-
nario, the similarity scores between every DB-o and DB-s sample pairs are
calculated and used to evaluate recognition performances. For the train set,
for each subject selected, half of the corresponding images are taken from DB-o
and the rest from DB-s. This experiment is identical to Experiment 1, except
the probe images are now replaced by their modified versions.
• Experiment 3 - Performance on the simulated database with training
on an external database: Face recognition algorithms are usually trained
using different databases. Therefore in this scenario, Experiment 2 is repeated,
but the training partition is composed of samples from an external database,
namely Texas 3D Face Recognition Database [53]. Briefly, the Texas 3D Face
Recognition (Texas 3DFRD) database is a collection of 1149 pairs of facial
color and range images of 105 subjects. In order to obtain a train set of
similar subject and sample numbers as in Experiments 1 and 2, a subset of
Texas 3DFRD is compiled with 350 color and range images of 103 subjects,
without expressions.
6.3.1 Impact on 2D Face Recognition
Three key methods are chosen to be evaluated for 2D face recognition: Principal
Component Analysis (PCA), Linear Discriminant Analysis (LDA) [12] and Local
Binary Pattern (LBP) [4]. PCA and LDA are appearance-based approaches which
are widely used for dimensionality reduction and feature extraction. On the other
hand, LBP is a texture-based algorithm for describing local structures.
The plastic surgery database in [127] has images after several types of surgery op-
erations such as forehead surgery, ear surgery, eyelid surgery, nose surgery, skin
resurfacing, face lift etc. However, since the results are reported for each surgical
operation separately, we can compare our results with the reported rank-1 identifi-
cation accuracies for nose surgery (rhinoplasty) as shown in Table 6.1.
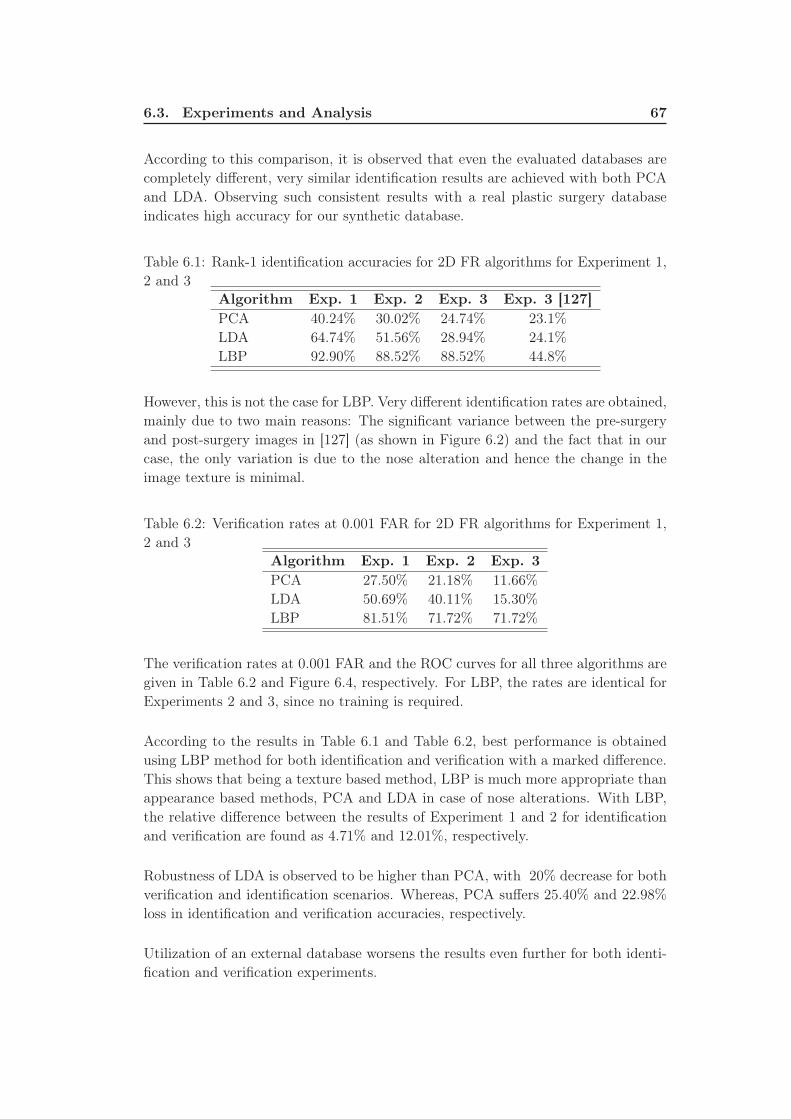
6.3. Experiments and Analysis 67
According to this comparison, it is observed that even the evaluated databases are
completely different, very similar identification results are achieved with both PCA
and LDA. Observing such consistent results with a real plastic surgery database
indicates high accuracy for our synthetic database.
Table 6.1: Rank-1 identification accuracies for 2D FR algorithms for Experiment 1,
2 and 3
Algorithm Exp. 1 Exp. 2 Exp. 3 Exp. 3 [127]
PCA 40.24% 30.02% 24.74% 23.1%
LDA 64.74% 51.56% 28.94% 24.1%
LBP 92.90% 88.52% 88.52% 44.8%
However, this is not the case for LBP. Very different identification rates are obtained,
mainly due to two main reasons: The significant variance between the pre-surgery
and post-surgery images in [127] (as shown in Figure 6.2) and the fact that in our
case, the only variation is due to the nose alteration and hence the change in the
image texture is minimal.
Table 6.2: Verification rates at 0.001 FAR for 2D FR algorithms for Experiment 1,
2 and 3
Algorithm Exp. 1 Exp. 2 Exp. 3
PCA 27.50% 21.18% 11.66%
LDA 50.69% 40.11% 15.30%
LBP 81.51% 71.72% 71.72%
The verification rates at 0.001 FAR and the ROC curves for all three algorithms are
given in Table 6.2 and Figure 6.4, respectively. For LBP, the rates are identical for
Experiments 2 and 3, since no training is required.
According to the results in Table 6.1 and Table 6.2, best performance is obtained
using LBP method for both identification and verification with a marked difference.
This shows that being a texture based method, LBP is much more appropriate than
appearance based methods, PCA and LDA in case of nose alterations. With LBP,
the relative difference between the results of Experiment 1 and 2 for identification
and verification are found as 4.71% and 12.01%, respectively.
Robustness of LDA is observed to be higher than PCA, with 20% decrease for both
verification and identification scenarios. Whereas, PCA suffers 25.40% and 22.98%
loss in identification and verification accuracies, respectively.
Utilization of an external database worsens the results even further for both identi-
fication and verification experiments.
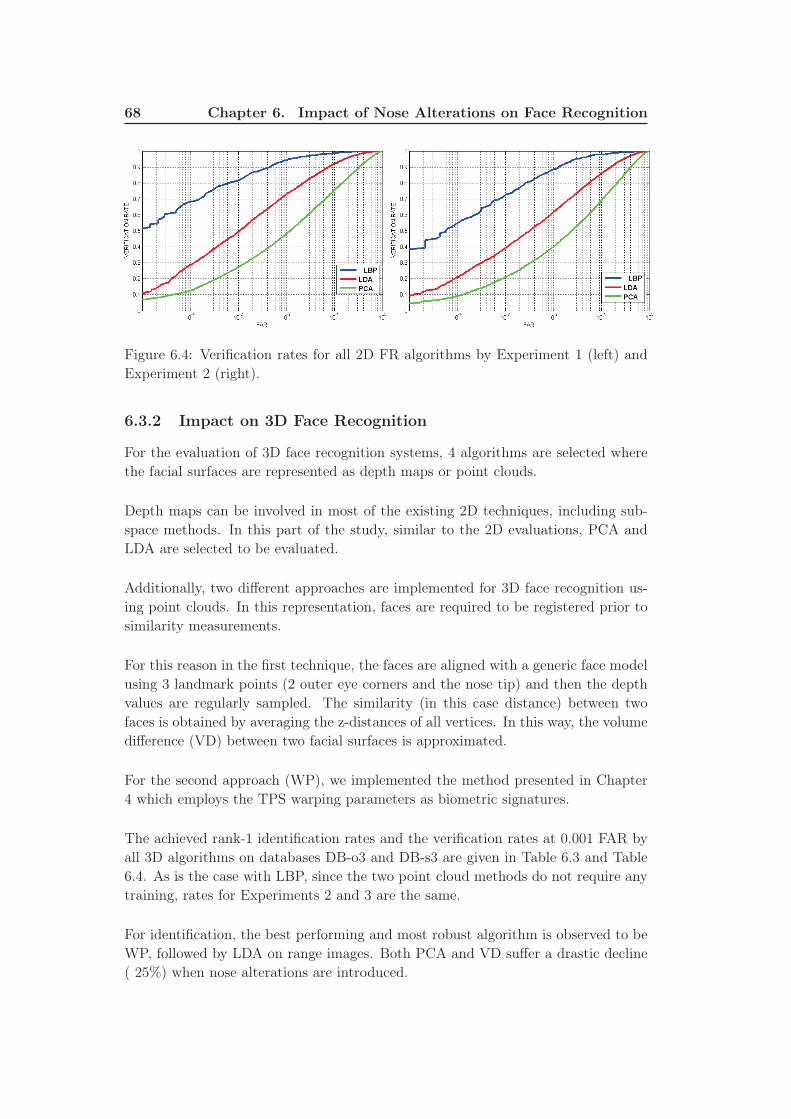
68 Chapter 6. Impact of Nose Alterations on Face Recognition
Figure 6.4: Verification rates for all 2D FR algorithms by Experiment 1 (left) and
Experiment 2 (right).
6.3.2 Impact on 3D Face Recognition
For the evaluation of 3D face recognition systems, 4 algorithms are selected where
the facial surfaces are represented as depth maps or point clouds.
Depth maps can be involved in most of the existing 2D techniques, including sub-
space methods. In this part of the study, similar to the 2D evaluations, PCA and
LDA are selected to be evaluated.
Additionally, two different approaches are implemented for 3D face recognition us-
ing point clouds. In this representation, faces are required to be registered prior to
similarity measurements.
For this reason in the first technique, the faces are aligned with a generic face model
using 3 landmark points (2 outer eye corners and the nose tip) and then the depth
values are regularly sampled. The similarity (in this case distance) between two
faces is obtained by averaging the z-distances of all vertices. In this way, the volume
difference (VD) between two facial surfaces is approximated.
For the second approach (WP), we implemented the method presented in Chapter
4 which employs the TPS warping parameters as biometric signatures.
The achieved rank-1 identification rates and the verification rates at 0.001 FAR by
all 3D algorithms on databases DB-o3 and DB-s3 are given in Table 6.3 and Table
6.4. As is the case with LBP, since the two point cloud methods do not require any
training, rates for Experiments 2 and 3 are the same.
For identification, the best performing and most robust algorithm is observed to be
WP, followed by LDA on range images. Both PCA and VD suffer a drastic decline
( 25%) when nose alterations are introduced.
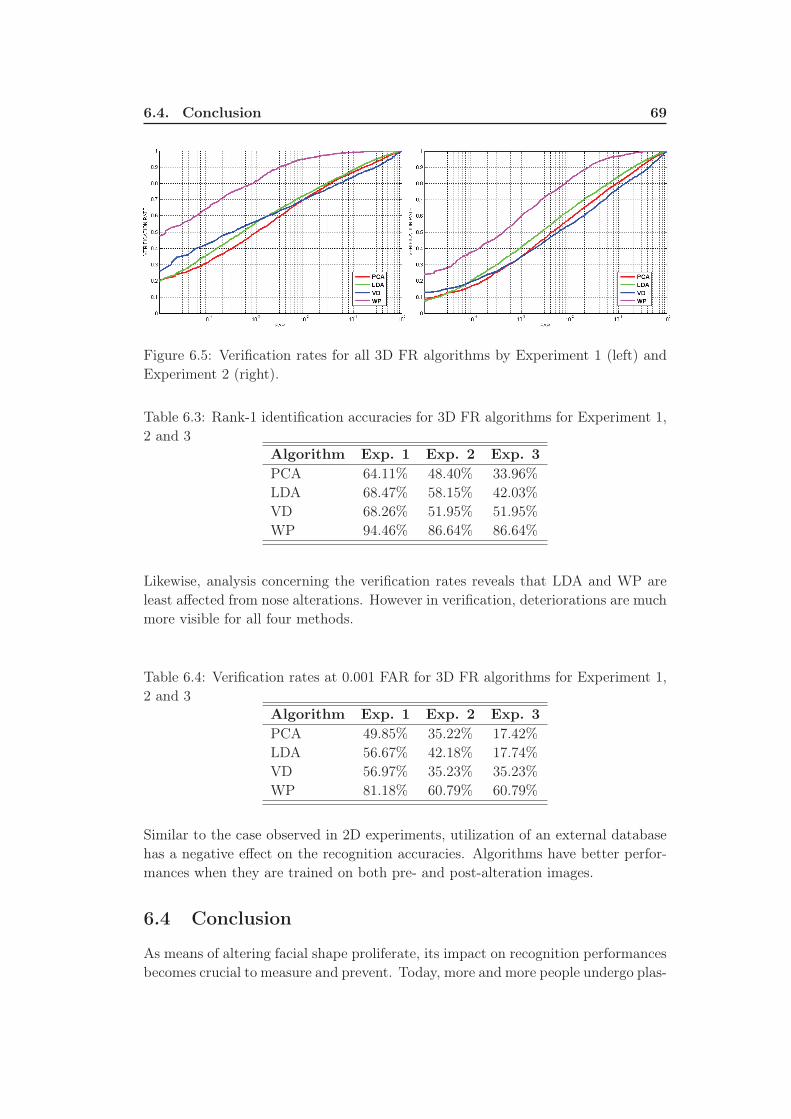
6.4. Conclusion 69
Figure 6.5: Verification rates for all 3D FR algorithms by Experiment 1 (left) and
Experiment 2 (right).
Table 6.3: Rank-1 identification accuracies for 3D FR algorithms for Experiment 1,
2 and 3
Algorithm Exp. 1 Exp. 2 Exp. 3
PCA 64.11% 48.40% 33.96%
LDA 68.47% 58.15% 42.03%
VD 68.26% 51.95% 51.95%
WP 94.46% 86.64% 86.64%
Likewise, analysis concerning the verification rates reveals that LDA and WP are
least affected from nose alterations. However in verification, deteriorations are much
more visible for all four methods.
Table 6.4: Verification rates at 0.001 FAR for 3D FR algorithms for Experiment 1,
2 and 3
Algorithm Exp. 1 Exp. 2 Exp. 3
PCA 49.85% 35.22% 17.42%
LDA 56.67% 42.18% 17.74%
VD 56.97% 35.23% 35.23%
WP 81.18% 60.79% 60.79%
Similar to the case observed in 2D experiments, utilization of an external database
has a negative effect on the recognition accuracies. Algorithms have better perfor-
mances when they are trained on both pre- and post-alteration images.
6.4 Conclusion
As means of altering facial shape proliferate, its impact on recognition performances
becomes crucial to measure and prevent. Today, more and more people undergo plas-
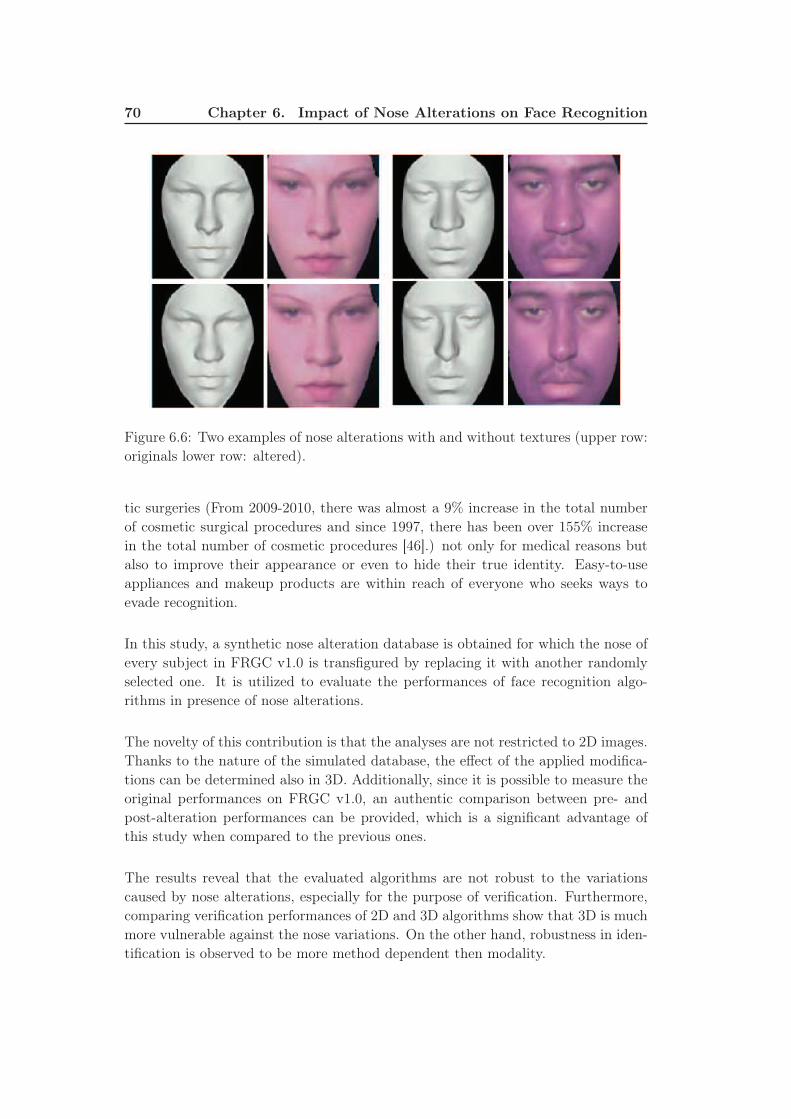
70 Chapter 6. Impact of Nose Alterations on Face Recognition
Figure 6.6: Two examples of nose alterations with and without textures (upper row:
originals lower row: altered).
tic surgeries (From 2009-2010, there was almost a 9% increase in the total number
of cosmetic surgical procedures and since 1997, there has been over 155% increase
in the total number of cosmetic procedures [46].) not only for medical reasons but
also to improve their appearance or even to hide their true identity. Easy-to-use
appliances and makeup products are within reach of everyone who seeks ways to
evade recognition.
In this study, a synthetic nose alteration database is obtained for which the nose of
every subject in FRGC v1.0 is transfigured by replacing it with another randomly
selected one. It is utilized to evaluate the performances of face recognition algo-
rithms in presence of nose alterations.
The novelty of this contribution is that the analyses are not restricted to 2D images.
Thanks to the nature of the simulated database, the effect of the applied modifica-
tions can be determined also in 3D. Additionally, since it is possible to measure the
original performances on FRGC v1.0, an authentic comparison between pre- and
post-alteration performances can be provided, which is a significant advantage of
this study when compared to the previous ones.
The results reveal that the evaluated algorithms are not robust to the variations
caused by nose alterations, especially for the purpose of verification. Furthermore,
comparing verification performances of 2D and 3D algorithms show that 3D is much
more vulnerable against the nose variations. On the other hand, robustness in iden-
tification is observed to be more method dependent then modality.

6.4. Conclusion 71
Robust face recognition algorithms are necessary to mitigate the effects of facial
modifications. In the next chapter, we propose a block based face recognition ap-
proach robust to nose alterations. Our future research direction is to develop such
face recognition methods robust to facial alterations. Additionally, we would like to
measure the efficiency of nose alterations for face spoofing purposes.

Chapter 7
Face Recognition Robust to Nose
Alterations
Face recognition robust to alterations applied on face via plastic surgery or prosthetic
make-up can be still considered as a new topic. In this chapter, a block based face
analysis approach is proposed which provides a fairly good recognition performance
together with the advantage of robustness to such kind of alterations. For this study,
a simulated nose alteration face database is used which is prepared using FRGC v1.0.
Since this is a 3D database, the approach can be tested both in 2D and 3D, which is
one of the contributions of this study. Furthermore, differently from previous works,
baseline results for the original database are reported. The impact which is purely
due to the applied nose alterations is measured using both the proposed approach
and the standard techniques which are based on holistic description for comparison.
The results indicate that although both 2D and 3D modalities lose precision due
to alterations, the proposed approach is superior in terms of both the recognition
performance and robustness to alterations compared to standard techniques.
7.1 Introduction
The number of people resorting to plastic surgery for correction of feature defects
or cosmetic reasons has been increased a lot in recent years. Therefore researchers
started to work on preventing the impact of facial alterations on recognition. How-
ever, there are only a few studies which are proposed to prevent the impact of facial
alterations on face recognition.
An evolutionary granular approach is proposed in [15] for matching a post-surgery
face image with a pre-surgery face image and 15% improvement in identification
performance is reported. Furthermore, two new methods, FARO and FACE, based
on fractals and a localized version of correlation index, respectively, are implemented
in [90] which claims that the performance of these two algorithms compare favorably
against standard face recognition methods such as PCA and LDA in case of plastic
surgery changes. Singh et al. adopted the near set theory to classify facial images
that have previously undergone some feature modifications in [125].
To the best of our knowledge, the impact of plastic surgeries on face recognition was
first analysed by Singh et al. in [126,127] where the effect of plastic surgery is evalu-
ated on several recognition algorithms. In the previous chapter, the shortcomings in
74 Chapter 7. Face Recognition Robust to Nose Alterations
the studies [126,127] are explained. In our previous study [40] (explained in Chapter
6), these limitations are eliminated by creating a synthetic database using FRGC
v1.0 for which nose regions are exchanged between subjects in the same database.
In this way, a 2D+3D database is obtained for nose alterations and since the con-
ditions and the subjects are identical for the original and the simulated databases,
measuring the exact impact of nose alterations is possible.
Our previous study [40] focuses on the nose modifications and analyze their effects
on success rates of several face recognition methods both in 2D and 3D face recog-
nition using the simulated nose alteration database.
In this chapter, we focus on developing a new approach which reduces the impact of
nose alterations on recognition performances. The proposed approach is based on
local description. Principal Component Analysis (PCA) [12], Linear Discriminant
Analysis (LDA) [12] and Local Binary Pattern (LBP) [4] are standard techniques
in face recognition. These techniques are applied generally over the whole image to
extract image features as in the studies [40,126,127]. In this study, these techniques
are applied over image blocks to extract block features. Dissimilarity between an
image pair is computed using the dissimilarities which are previously computed for
each block pair of these images in the most optimum way to maximize the recogni-
tion performances. This study aims to reduce the performance decrease caused by
nose alterations.
The rest of the chapter is organized as follows: Section 7.2 describes the proposed
approach. Section 7.3 gives the experimental results to show the effect of nose
alterations in 2D and 3D face recognition. In this section, the results are reported
using both the proposed approach and the standard techniques which are based on
holistic description for comparison purposes. Finally, the conclusions are provided
in Section 7.4.
7.2 Block Based Face Recognition Approach Robust to
Nose Alterations
The proposed approach analyzes images by dividing them according to a regular
square grid. Initially, cropping of all texture and range images (depth maps) in
DB-o and DB-s is done. Then, all cropped images are resized with the parameter
[300 300] since in our case, all these images in both DB-o and DB-s have pixel size
more than [300 300]. After resizing, they are divided into 36 blocks each of which
has size [50 50] (Figure 7.1). These parameters should be adjusted according to the
image sizes in the selected databases.
In our study, the techniques PCA, LDA, and LBP are used only to extract features
of the image blocks. For each image pair, using these extracted features, dissim-
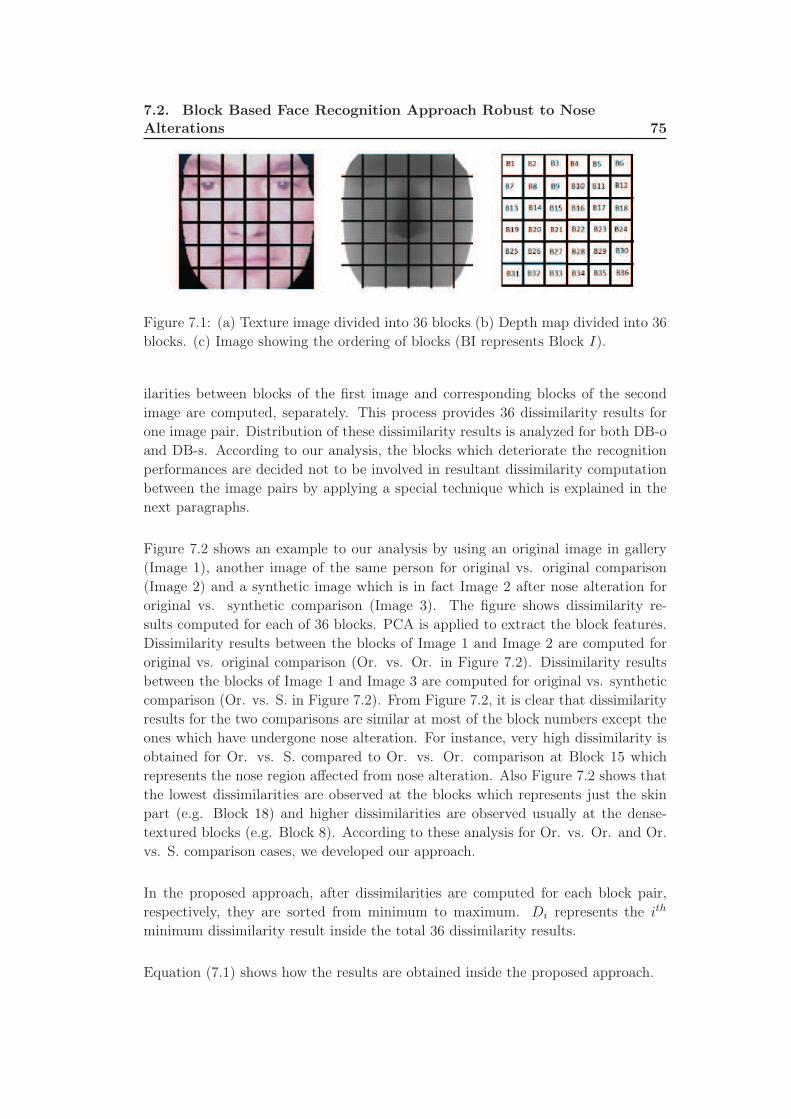
7.2. Block Based Face Recognition Approach Robust to NoseAlterations 75
Figure 7.1: (a) Texture image divided into 36 blocks (b) Depth map divided into 36
blocks. (c) Image showing the ordering of blocks (BI represents Block I).
ilarities between blocks of the first image and corresponding blocks of the second
image are computed, separately. This process provides 36 dissimilarity results for
one image pair. Distribution of these dissimilarity results is analyzed for both DB-o
and DB-s. According to our analysis, the blocks which deteriorate the recognition
performances are decided not to be involved in resultant dissimilarity computation
between the image pairs by applying a special technique which is explained in the
next paragraphs.
Figure 7.2 shows an example to our analysis by using an original image in gallery
(Image 1), another image of the same person for original vs. original comparison
(Image 2) and a synthetic image which is in fact Image 2 after nose alteration for
original vs. synthetic comparison (Image 3). The figure shows dissimilarity re-
sults computed for each of 36 blocks. PCA is applied to extract the block features.
Dissimilarity results between the blocks of Image 1 and Image 2 are computed for
original vs. original comparison (Or. vs. Or. in Figure 7.2). Dissimilarity results
between the blocks of Image 1 and Image 3 are computed for original vs. synthetic
comparison (Or. vs. S. in Figure 7.2). From Figure 7.2, it is clear that dissimilarity
results for the two comparisons are similar at most of the block numbers except the
ones which have undergone nose alteration. For instance, very high dissimilarity is
obtained for Or. vs. S. compared to Or. vs. Or. comparison at Block 15 which
represents the nose region affected from nose alteration. Also Figure 7.2 shows that
the lowest dissimilarities are observed at the blocks which represents just the skin
part (e.g. Block 18) and higher dissimilarities are observed usually at the dense-
textured blocks (e.g. Block 8). According to these analysis for Or. vs. Or. and Or.
vs. S. comparison cases, we developed our approach.
In the proposed approach, after dissimilarities are computed for each block pair,
respectively, they are sorted from minimum to maximum. Di represents the ith
minimum dissimilarity result inside the total 36 dissimilarity results.
Equation (7.1) shows how the results are obtained inside the proposed approach.
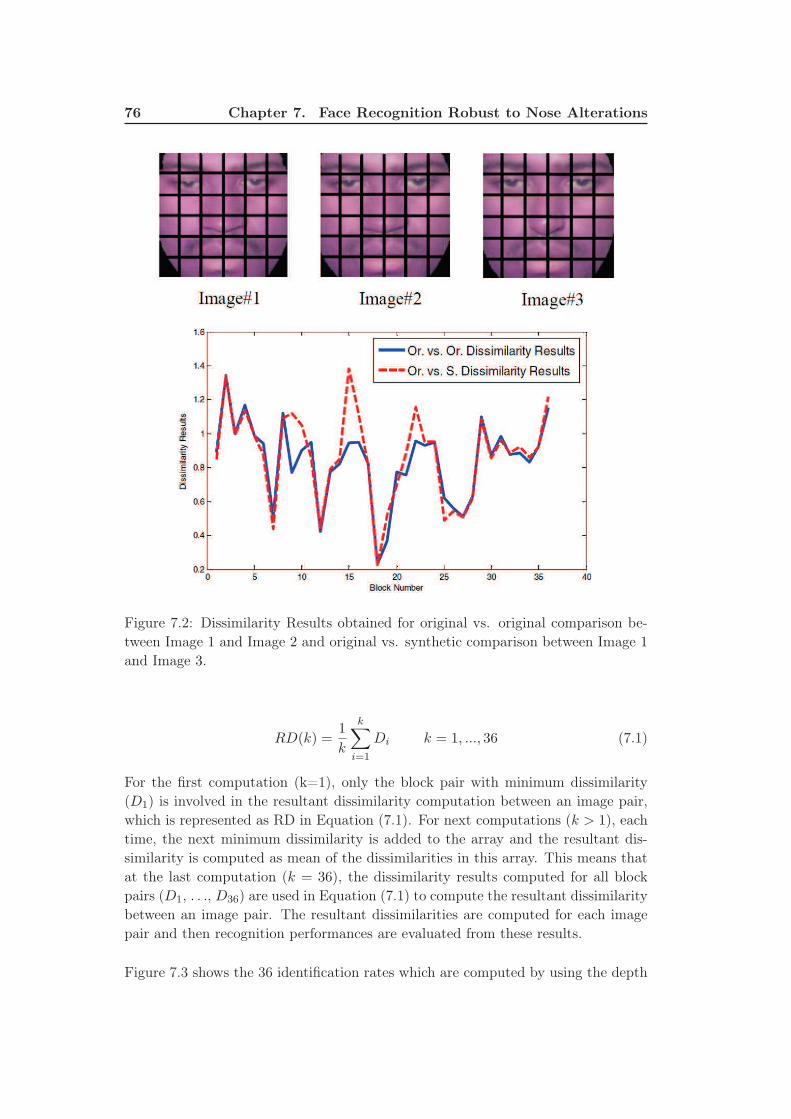
76 Chapter 7. Face Recognition Robust to Nose Alterations
Figure 7.2: Dissimilarity Results obtained for original vs. original comparison be-
tween Image 1 and Image 2 and original vs. synthetic comparison between Image 1
and Image 3.
RD(k) =1
k
k∑
i=1
Di k = 1, ..., 36 (7.1)
For the first computation (k=1), only the block pair with minimum dissimilarity
(D1) is involved in the resultant dissimilarity computation between an image pair,
which is represented as RD in Equation (7.1). For next computations (k > 1), each
time, the next minimum dissimilarity is added to the array and the resultant dis-
similarity is computed as mean of the dissimilarities in this array. This means that
at the last computation (k = 36), the dissimilarity results computed for all block
pairs (D1, . . ., D36) are used in Equation (7.1) to compute the resultant dissimilarity
between an image pair. The resultant dissimilarities are computed for each image
pair and then recognition performances are evaluated from these results.
Figure 7.3 shows the 36 identification rates which are computed by using the depth
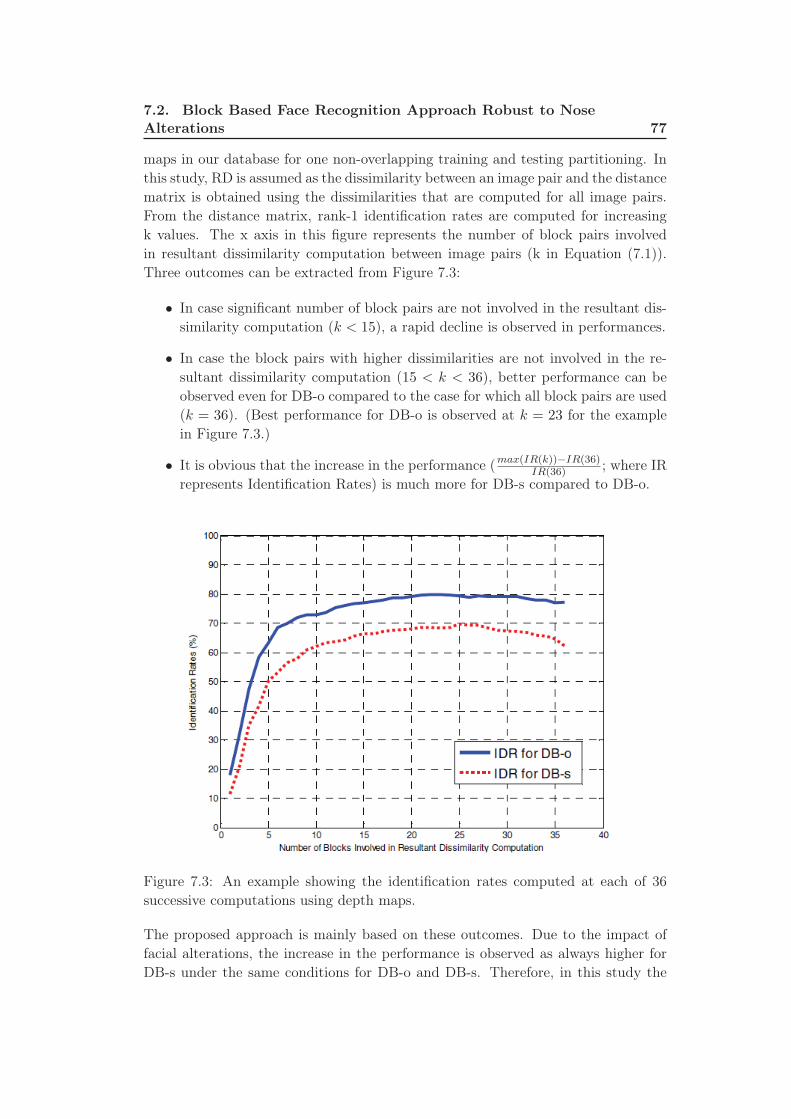
7.2. Block Based Face Recognition Approach Robust to NoseAlterations 77
maps in our database for one non-overlapping training and testing partitioning. In
this study, RD is assumed as the dissimilarity between an image pair and the distance
matrix is obtained using the dissimilarities that are computed for all image pairs.
From the distance matrix, rank-1 identification rates are computed for increasing
k values. The x axis in this figure represents the number of block pairs involved
in resultant dissimilarity computation between image pairs (k in Equation (7.1)).
Three outcomes can be extracted from Figure 7.3:
• In case significant number of block pairs are not involved in the resultant dis-
similarity computation (k < 15), a rapid decline is observed in performances.
• In case the block pairs with higher dissimilarities are not involved in the re-
sultant dissimilarity computation (15 < k < 36), better performance can be
observed even for DB-o compared to the case for which all block pairs are used
(k = 36). (Best performance for DB-o is observed at k = 23 for the example
in Figure 7.3.)
• It is obvious that the increase in the performance (max(IR(k))−IR(36)IR(36) ; where IR
represents Identification Rates) is much more for DB-s compared to DB-o.
Figure 7.3: An example showing the identification rates computed at each of 36
successive computations using depth maps.
The proposed approach is mainly based on these outcomes. Due to the impact of
facial alterations, the increase in the performance is observed as always higher for
DB-s under the same conditions for DB-o and DB-s. Therefore, in this study the
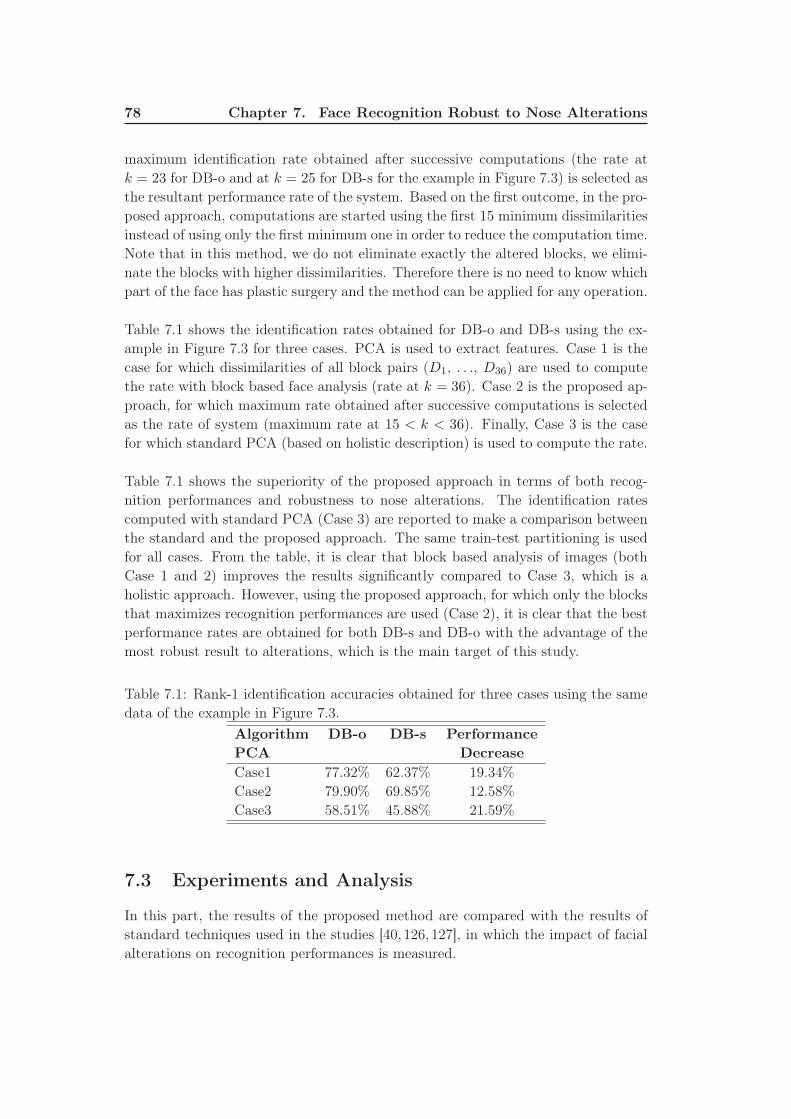
78 Chapter 7. Face Recognition Robust to Nose Alterations
maximum identification rate obtained after successive computations (the rate at
k = 23 for DB-o and at k = 25 for DB-s for the example in Figure 7.3) is selected as
the resultant performance rate of the system. Based on the first outcome, in the pro-
posed approach, computations are started using the first 15 minimum dissimilarities
instead of using only the first minimum one in order to reduce the computation time.
Note that in this method, we do not eliminate exactly the altered blocks, we elimi-
nate the blocks with higher dissimilarities. Therefore there is no need to know which
part of the face has plastic surgery and the method can be applied for any operation.
Table 7.1 shows the identification rates obtained for DB-o and DB-s using the ex-
ample in Figure 7.3 for three cases. PCA is used to extract features. Case 1 is the
case for which dissimilarities of all block pairs (D1, . . ., D36) are used to compute
the rate with block based face analysis (rate at k = 36). Case 2 is the proposed ap-
proach, for which maximum rate obtained after successive computations is selected
as the rate of system (maximum rate at 15 < k < 36). Finally, Case 3 is the case
for which standard PCA (based on holistic description) is used to compute the rate.
Table 7.1 shows the superiority of the proposed approach in terms of both recog-
nition performances and robustness to nose alterations. The identification rates
computed with standard PCA (Case 3) are reported to make a comparison between
the standard and the proposed approach. The same train-test partitioning is used
for all cases. From the table, it is clear that block based analysis of images (both
Case 1 and 2) improves the results significantly compared to Case 3, which is a
holistic approach. However, using the proposed approach, for which only the blocks
that maximizes recognition performances are used (Case 2), it is clear that the best
performance rates are obtained for both DB-s and DB-o with the advantage of the
most robust result to alterations, which is the main target of this study.
Table 7.1: Rank-1 identification accuracies obtained for three cases using the same
data of the example in Figure 7.3.
Algorithm DB-o DB-s Performance
PCA Decrease
Case1 77.32% 62.37% 19.34%
Case2 79.90% 69.85% 12.58%
Case3 58.51% 45.88% 21.59%
7.3 Experiments and Analysis
In this part, the results of the proposed method are compared with the results of
standard techniques used in the studies [40, 126, 127], in which the impact of facial
alterations on recognition performances is measured.
7.3. Experiments and Analysis 79
Initially, all four databases, DB-o2, DB-o3, DB-s2 and DB-s3 are partitioned in
non-overlapping train and test datasets. This is done by randomly selecting 40% of
the subjects and assigning their samples to the train set, while the rest is used for
testing, similarly to the studies in [40, 127]. The partitioning is repeated 10 times
and verification and identification rates are computed over these 10 trials.
For verification tests, the verification rates at 0.001 FAR are reported. For identifi-
cation tests, the first sample of each individual in the test set is used as gallery and
the rest as probes. The rank-1 recognition rates are reported.
The effect of the applied nose alterations on face recognition performances is evalu-
ated with two different scenarios in both 2D and 3D which are determined according
to the study of Singh et al. [127] for comparison.
• Experiment 1 - Performance on the original database: It is important
to compute performances on the original datasets in terms of having a baseline.
In this way, the impact of the applied changes can be measured accurately.
For this purpose, 2D and 3D algorithms are evaluated on DB-o where the
dissimilarities are calculated between each original image pair.
• Experiment 2 - Performance on the simulated database: In this sce-
nario, the similarity scores between every DB-o and DB-s sample pairs are
calculated and used to evaluate recognition performances. For the train set,
for each subject selected, half of the corresponding images are taken from DB-o
and the rest from DB-s. This experiment is identical to Experiment 1, except
the probe images are now replaced by their modified versions.
Results of Experiment 1 and 2 are reported using both the proposed approach and
the holistic approach, in which the key techniques (PCA, LDA, LBP) are applied
over the whole image which are resized as [50 50]. This selection of the resizing
parameter for the holistic approach in this study is based on the following reason:
• The key techniques are applied on plastic surgery database in [127] and results
that are close to the reported results in [127] are obtained with this resizing
parameter.
7.3.1 Evaluation on 2D Face Recognition
In this part, three key methods, PCA, LDA, and LBP, are applied over the image
blocks for the proposed approach; whereas they are applied over the whole image
for the holistic approach, which is in fact the approach generally used for standard
techniques. PCA and LDA are appearance based approaches. LBP is a texture
based algorithm for describing local structures.
The plastic surgery database in [127] has images after several types of surgery op-
erations such as forehead surgery, ear surgery, eyelid surgery, nose surgery, face lift
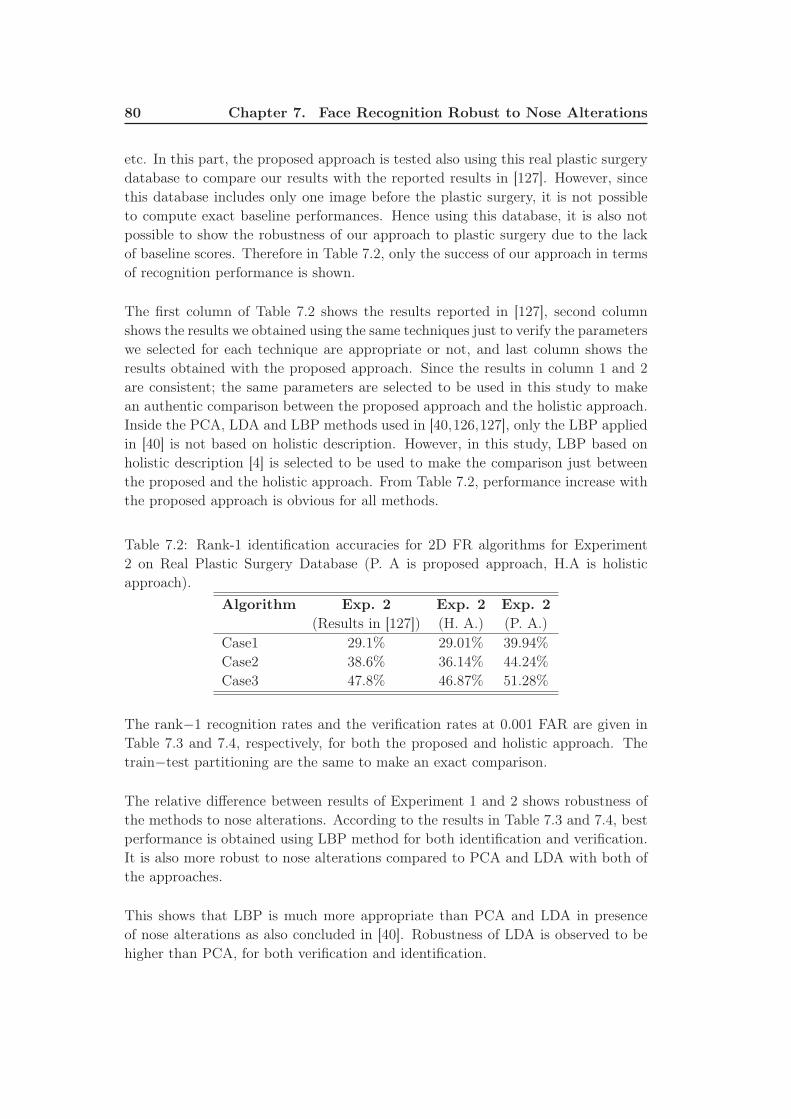
80 Chapter 7. Face Recognition Robust to Nose Alterations
etc. In this part, the proposed approach is tested also using this real plastic surgery
database to compare our results with the reported results in [127]. However, since
this database includes only one image before the plastic surgery, it is not possible
to compute exact baseline performances. Hence using this database, it is also not
possible to show the robustness of our approach to plastic surgery due to the lack
of baseline scores. Therefore in Table 7.2, only the success of our approach in terms
of recognition performance is shown.
The first column of Table 7.2 shows the results reported in [127], second column
shows the results we obtained using the same techniques just to verify the parameters
we selected for each technique are appropriate or not, and last column shows the
results obtained with the proposed approach. Since the results in column 1 and 2
are consistent; the same parameters are selected to be used in this study to make
an authentic comparison between the proposed approach and the holistic approach.
Inside the PCA, LDA and LBP methods used in [40,126,127], only the LBP applied
in [40] is not based on holistic description. However, in this study, LBP based on
holistic description [4] is selected to be used to make the comparison just between
the proposed and the holistic approach. From Table 7.2, performance increase with
the proposed approach is obvious for all methods.
Table 7.2: Rank-1 identification accuracies for 2D FR algorithms for Experiment
2 on Real Plastic Surgery Database (P. A is proposed approach, H.A is holistic
approach).
Algorithm Exp. 2 Exp. 2 Exp. 2
(Results in [127]) (H. A.) (P. A.)
Case1 29.1% 29.01% 39.94%
Case2 38.6% 36.14% 44.24%
Case3 47.8% 46.87% 51.28%
The rank−1 recognition rates and the verification rates at 0.001 FAR are given in
Table 7.3 and 7.4, respectively, for both the proposed and holistic approach. The
train−test partitioning are the same to make an exact comparison.
The relative difference between results of Experiment 1 and 2 shows robustness of
the methods to nose alterations. According to the results in Table 7.3 and 7.4, best
performance is obtained using LBP method for both identification and verification.
It is also more robust to nose alterations compared to PCA and LDA with both of
the approaches.
This shows that LBP is much more appropriate than PCA and LDA in presence
of nose alterations as also concluded in [40]. Robustness of LDA is observed to be
higher than PCA, for both verification and identification.
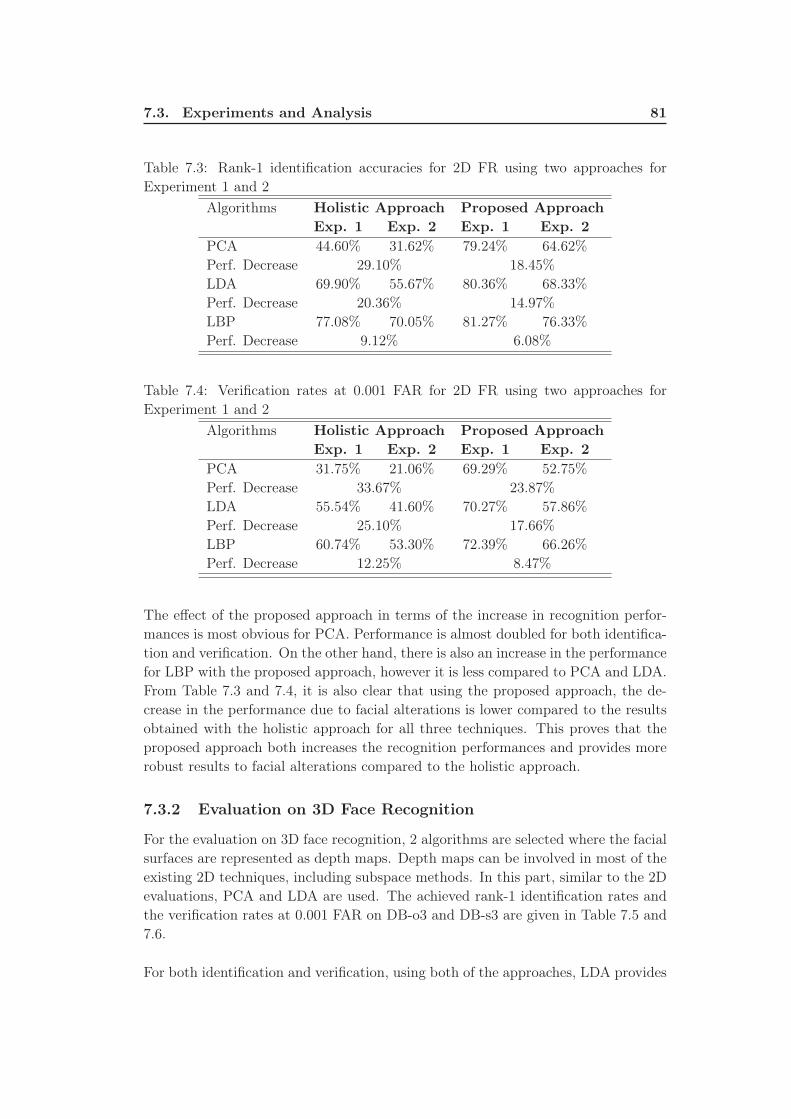
7.3. Experiments and Analysis 81
Table 7.3: Rank-1 identification accuracies for 2D FR using two approaches for
Experiment 1 and 2
Algorithms Holistic Approach Proposed Approach
Exp. 1 Exp. 2 Exp. 1 Exp. 2
PCA 44.60% 31.62% 79.24% 64.62%
Perf. Decrease 29.10% 18.45%
LDA 69.90% 55.67% 80.36% 68.33%
Perf. Decrease 20.36% 14.97%
LBP 77.08% 70.05% 81.27% 76.33%
Perf. Decrease 9.12% 6.08%
Table 7.4: Verification rates at 0.001 FAR for 2D FR using two approaches for
Experiment 1 and 2
Algorithms Holistic Approach Proposed Approach
Exp. 1 Exp. 2 Exp. 1 Exp. 2
PCA 31.75% 21.06% 69.29% 52.75%
Perf. Decrease 33.67% 23.87%
LDA 55.54% 41.60% 70.27% 57.86%
Perf. Decrease 25.10% 17.66%
LBP 60.74% 53.30% 72.39% 66.26%
Perf. Decrease 12.25% 8.47%
The effect of the proposed approach in terms of the increase in recognition perfor-
mances is most obvious for PCA. Performance is almost doubled for both identifica-
tion and verification. On the other hand, there is also an increase in the performance
for LBP with the proposed approach, however it is less compared to PCA and LDA.
From Table 7.3 and 7.4, it is also clear that using the proposed approach, the de-
crease in the performance due to facial alterations is lower compared to the results
obtained with the holistic approach for all three techniques. This proves that the
proposed approach both increases the recognition performances and provides more
robust results to facial alterations compared to the holistic approach.
7.3.2 Evaluation on 3D Face Recognition
For the evaluation on 3D face recognition, 2 algorithms are selected where the facial
surfaces are represented as depth maps. Depth maps can be involved in most of the
existing 2D techniques, including subspace methods. In this part, similar to the 2D
evaluations, PCA and LDA are used. The achieved rank-1 identification rates and
the verification rates at 0.001 FAR on DB-o3 and DB-s3 are given in Table 7.5 and
7.6.
For both identification and verification, using both of the approaches, LDA provides
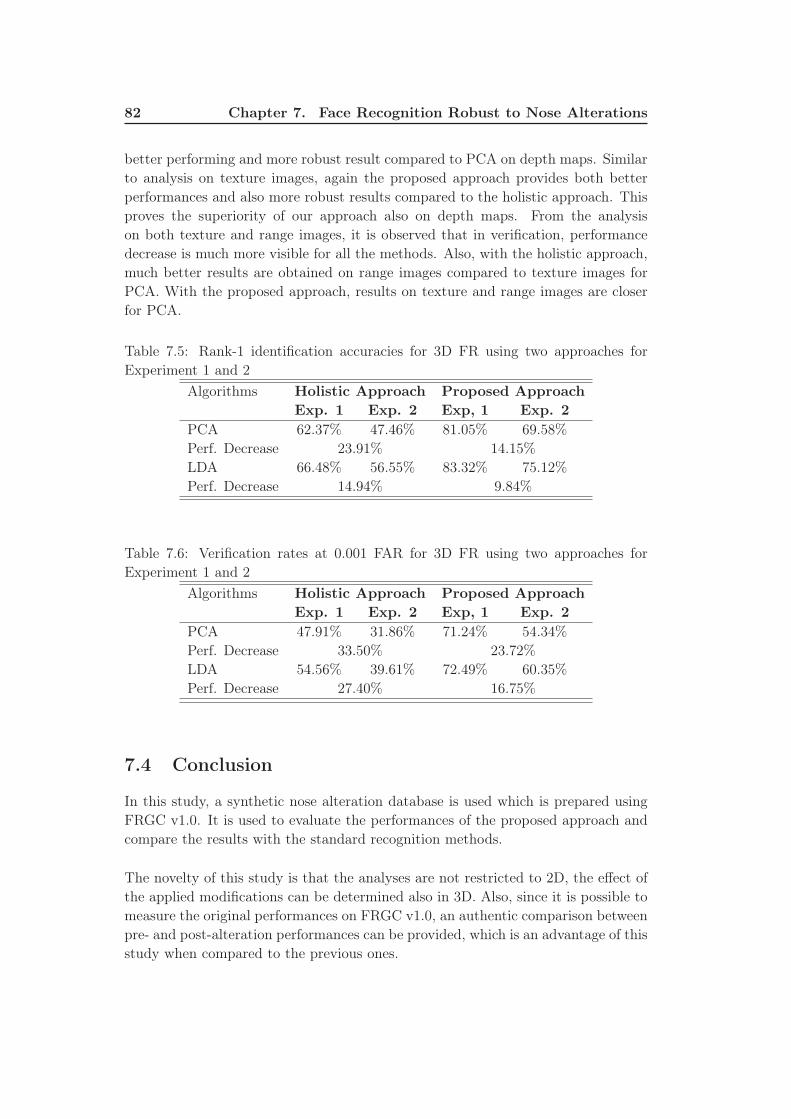
82 Chapter 7. Face Recognition Robust to Nose Alterations
better performing and more robust result compared to PCA on depth maps. Similar
to analysis on texture images, again the proposed approach provides both better
performances and also more robust results compared to the holistic approach. This
proves the superiority of our approach also on depth maps. From the analysis
on both texture and range images, it is observed that in verification, performance
decrease is much more visible for all the methods. Also, with the holistic approach,
much better results are obtained on range images compared to texture images for
PCA. With the proposed approach, results on texture and range images are closer
for PCA.
Table 7.5: Rank-1 identification accuracies for 3D FR using two approaches for
Experiment 1 and 2
Algorithms Holistic Approach Proposed Approach
Exp. 1 Exp. 2 Exp, 1 Exp. 2
PCA 62.37% 47.46% 81.05% 69.58%
Perf. Decrease 23.91% 14.15%
LDA 66.48% 56.55% 83.32% 75.12%
Perf. Decrease 14.94% 9.84%
Table 7.6: Verification rates at 0.001 FAR for 3D FR using two approaches for
Experiment 1 and 2
Algorithms Holistic Approach Proposed Approach
Exp. 1 Exp. 2 Exp, 1 Exp. 2
PCA 47.91% 31.86% 71.24% 54.34%
Perf. Decrease 33.50% 23.72%
LDA 54.56% 39.61% 72.49% 60.35%
Perf. Decrease 27.40% 16.75%
7.4 Conclusion
In this study, a synthetic nose alteration database is used which is prepared using
FRGC v1.0. It is used to evaluate the performances of the proposed approach and
compare the results with the standard recognition methods.
The novelty of this study is that the analyses are not restricted to 2D, the effect of
the applied modifications can be determined also in 3D. Also, since it is possible to
measure the original performances on FRGC v1.0, an authentic comparison between
pre- and post-alteration performances can be provided, which is an advantage of this
study when compared to the previous ones.

7.4. Conclusion 83
The results in [40,126,127] show that the standard recognition methods are not ro-
bust to the variations caused by nose alterations, especially for the verification case.
Robustness to nose alterations is also observed to be method dependent. Robust
algorithms are necessary to mitigate the effects of facial alterations. Therefore, in
this chapter, a new approach is proposed which provides more robust results com-
pared to the standard methods. It is simply a block based face analysis method, for
which only the blocks of images that maximize recognition performance are used in
dissimilarity computation between image pairs by applying a special technique.
Our future research direction is to propose novel countermeasure techniques, which
mitigate the impact of facial alteration on recognition performances.

Chapter 8
Facial Cosmetics Database and
Impact Analysis on Face
Recognition
Facial cosmetics, also called makeup, change the perceived appearance of a face and
therefore have an impact on automatic face recognition. In this chapter, to evaluate
their impact in detail, the face as a whole and its most significant makeup application
areas as skin, eyes and mouth are investigated separately. After specifying makeup
application, a makeup categorization approach is developed in order to classify the
applied products according to their effect on human perception. To evaluate the
impact of facial cosmetics, a database of multiple images with and without makeup
for each person is built.
8.1 Introduction
Facial cosmetics are a common part of the daily life in many cultures since Ancient
Egypt [7] and change the perception of a face. The impact of facial cosmetics on
the perception of a face is shown in Figure 8.1.
Research on the impact of facial cosmetics is limited, mainly because of the lack of
public database which contains multiple images with and without facial cosmetics
for a significant number of women. In [119], the authors develop a system which
detects the most suitable makeup for a given human face. Unfortunately, they can-
not provide public access to the database which they used for their study. Some
databases (e.g. [114], [42]) provide images with facial cosmetics but there are no cor-
responding images without facial cosmetics hence these databases are inappropriate
for the evaluation of face recognition.
In facial cosmetics studies, it is inevitable to know what the ordinarily used facial
cosmetics are, where they are applied and which effect they cause. So far, no ex-
haustive specification exists.
Facial cosmetics can be applied in different ways. In order to evaluate the impact
of facial cosmetics, an objective categorization approach beyond subjective opinions
and preferences is needed.
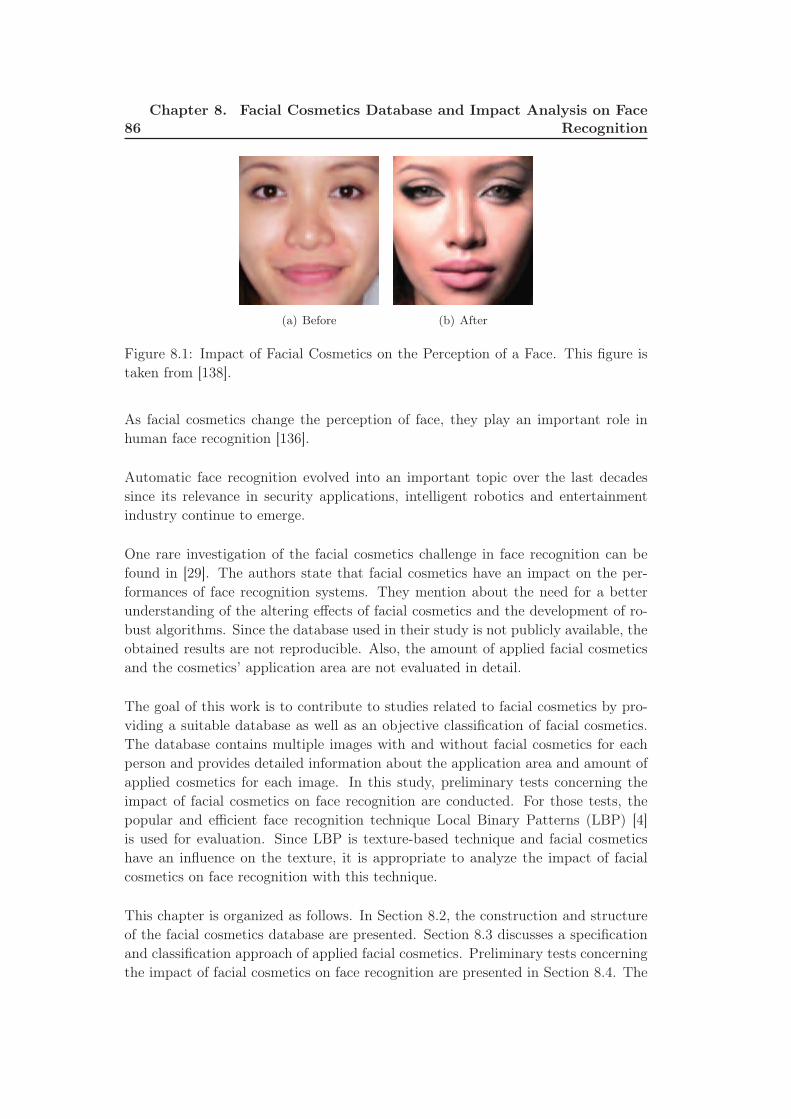
86Chapter 8. Facial Cosmetics Database and Impact Analysis on Face
Recognition
(a) Before (b) After
Figure 8.1: Impact of Facial Cosmetics on the Perception of a Face. This figure is
taken from [138].
As facial cosmetics change the perception of face, they play an important role in
human face recognition [136].
Automatic face recognition evolved into an important topic over the last decades
since its relevance in security applications, intelligent robotics and entertainment
industry continue to emerge.
One rare investigation of the facial cosmetics challenge in face recognition can be
found in [29]. The authors state that facial cosmetics have an impact on the per-
formances of face recognition systems. They mention about the need for a better
understanding of the altering effects of facial cosmetics and the development of ro-
bust algorithms. Since the database used in their study is not publicly available, the
obtained results are not reproducible. Also, the amount of applied facial cosmetics
and the cosmetics’ application area are not evaluated in detail.
The goal of this work is to contribute to studies related to facial cosmetics by pro-
viding a suitable database as well as an objective classification of facial cosmetics.
The database contains multiple images with and without facial cosmetics for each
person and provides detailed information about the application area and amount of
applied cosmetics for each image. In this study, preliminary tests concerning the
impact of facial cosmetics on face recognition are conducted. For those tests, the
popular and efficient face recognition technique Local Binary Patterns (LBP) [4]
is used for evaluation. Since LBP is texture-based technique and facial cosmetics
have an influence on the texture, it is appropriate to analyze the impact of facial
cosmetics on face recognition with this technique.
This chapter is organized as follows. In Section 8.2, the construction and structure
of the facial cosmetics database are presented. Section 8.3 discusses a specification
and classification approach of applied facial cosmetics. Preliminary tests concerning
the impact of facial cosmetics on face recognition are presented in Section 8.4. The
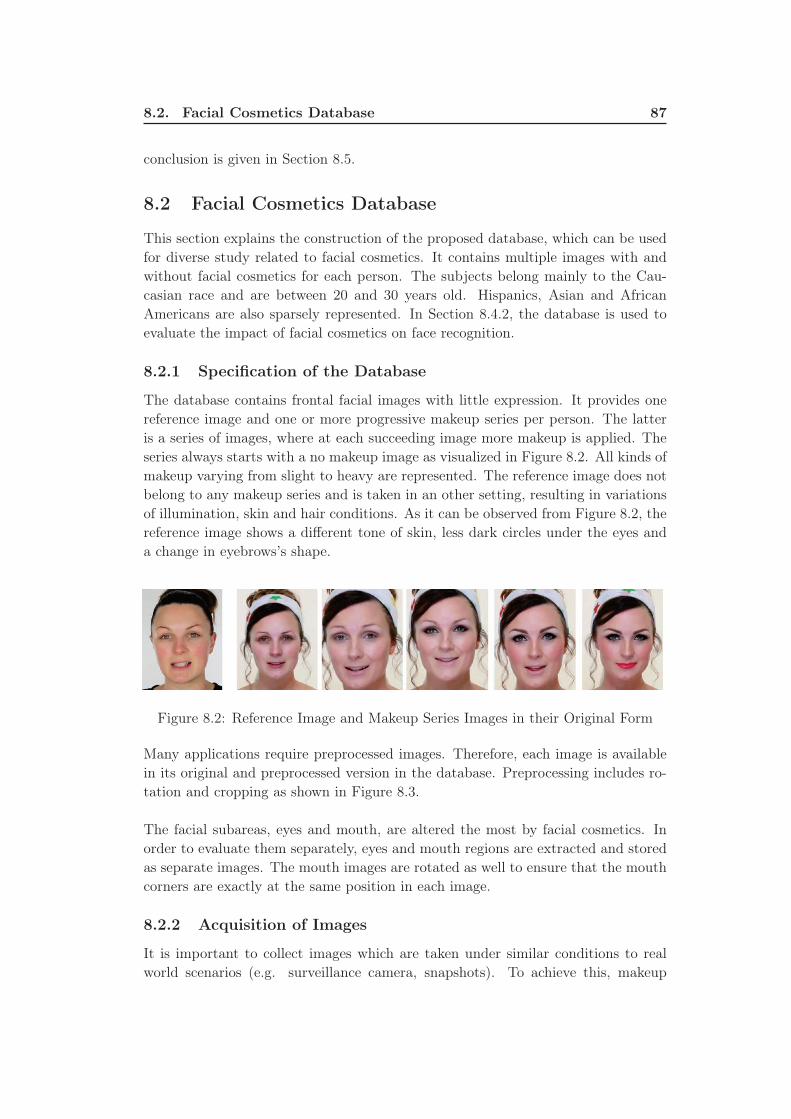
8.2. Facial Cosmetics Database 87
conclusion is given in Section 8.5.
8.2 Facial Cosmetics Database
This section explains the construction of the proposed database, which can be used
for diverse study related to facial cosmetics. It contains multiple images with and
without facial cosmetics for each person. The subjects belong mainly to the Cau-
casian race and are between 20 and 30 years old. Hispanics, Asian and African
Americans are also sparsely represented. In Section 8.4.2, the database is used to
evaluate the impact of facial cosmetics on face recognition.
8.2.1 Specification of the Database
The database contains frontal facial images with little expression. It provides one
reference image and one or more progressive makeup series per person. The latter
is a series of images, where at each succeeding image more makeup is applied. The
series always starts with a no makeup image as visualized in Figure 8.2. All kinds of
makeup varying from slight to heavy are represented. The reference image does not
belong to any makeup series and is taken in an other setting, resulting in variations
of illumination, skin and hair conditions. As it can be observed from Figure 8.2, the
reference image shows a different tone of skin, less dark circles under the eyes and
a change in eyebrows’s shape.
Figure 8.2: Reference Image and Makeup Series Images in their Original Form
Many applications require preprocessed images. Therefore, each image is available
in its original and preprocessed version in the database. Preprocessing includes ro-
tation and cropping as shown in Figure 8.3.
The facial subareas, eyes and mouth, are altered the most by facial cosmetics. In
order to evaluate them separately, eyes and mouth regions are extracted and stored
as separate images. The mouth images are rotated as well to ensure that the mouth
corners are exactly at the same position in each image.
8.2.2 Acquisition of Images
It is important to collect images which are taken under similar conditions to real
world scenarios (e.g. surveillance camera, snapshots). To achieve this, makeup
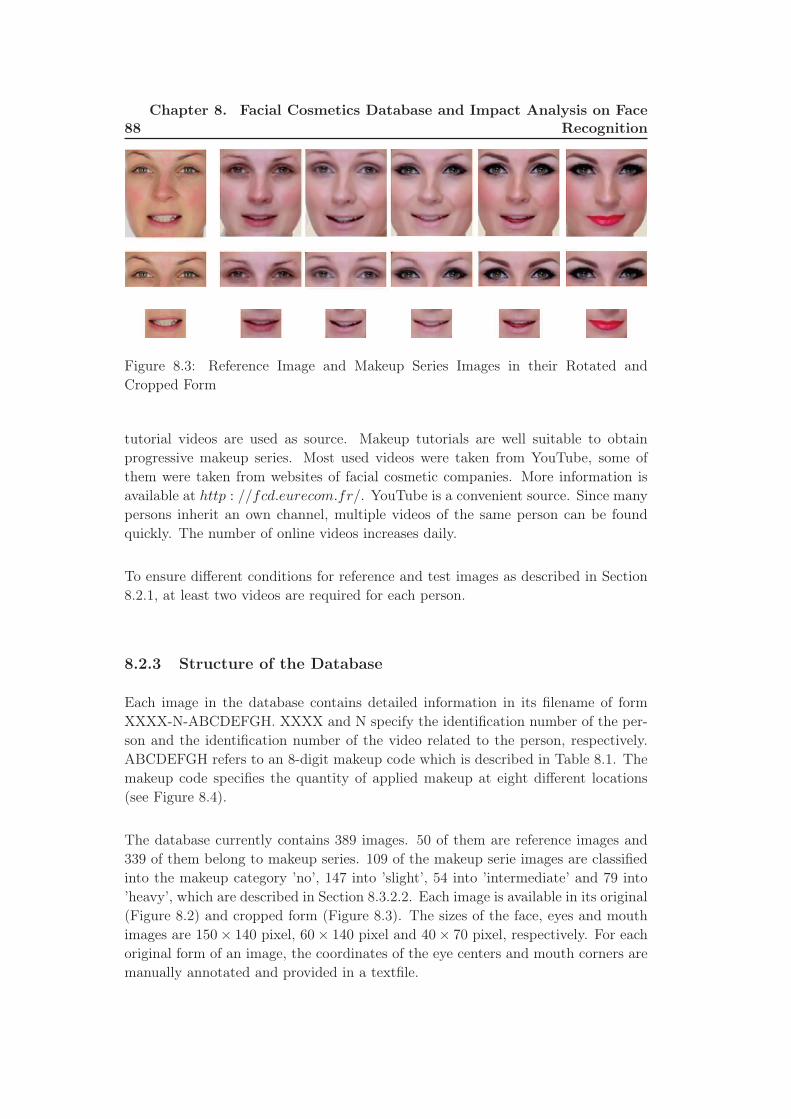
88Chapter 8. Facial Cosmetics Database and Impact Analysis on Face
Recognition
Figure 8.3: Reference Image and Makeup Series Images in their Rotated and
Cropped Form
tutorial videos are used as source. Makeup tutorials are well suitable to obtain
progressive makeup series. Most used videos were taken from YouTube, some of
them were taken from websites of facial cosmetic companies. More information is
available at http : //fcd.eurecom.fr/. YouTube is a convenient source. Since many
persons inherit an own channel, multiple videos of the same person can be found
quickly. The number of online videos increases daily.
To ensure different conditions for reference and test images as described in Section
8.2.1, at least two videos are required for each person.
8.2.3 Structure of the Database
Each image in the database contains detailed information in its filename of form
XXXX-N-ABCDEFGH. XXXX and N specify the identification number of the per-
son and the identification number of the video related to the person, respectively.
ABCDEFGH refers to an 8-digit makeup code which is described in Table 8.1. The
makeup code specifies the quantity of applied makeup at eight different locations
(see Figure 8.4).
The database currently contains 389 images. 50 of them are reference images and
339 of them belong to makeup series. 109 of the makeup serie images are classified
into the makeup category ’no’, 147 into ’slight’, 54 into ’intermediate’ and 79 into
’heavy’, which are described in Section 8.3.2.2. Each image is available in its original
(Figure 8.2) and cropped form (Figure 8.3). The sizes of the face, eyes and mouth
images are 150× 140 pixel, 60× 140 pixel and 40× 70 pixel, respectively. For each
original form of an image, the coordinates of the eye centers and mouth corners are
manually annotated and provided in a textfile.
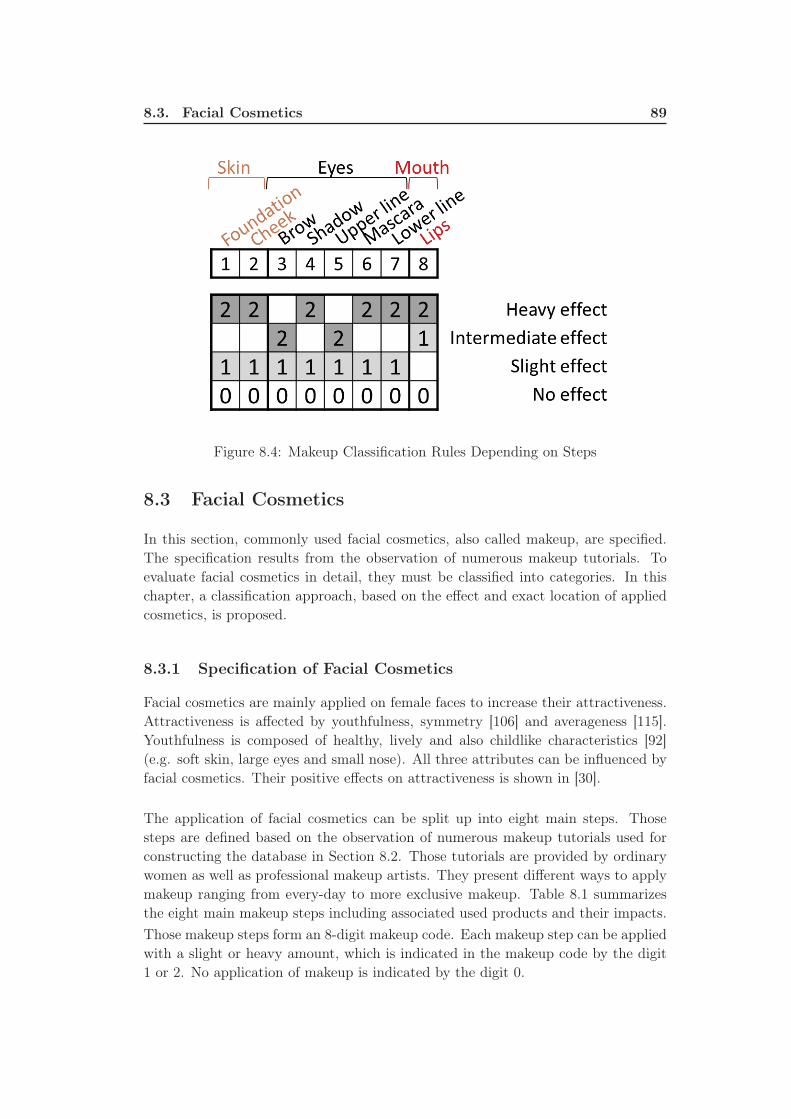
8.3. Facial Cosmetics 89
Figure 8.4: Makeup Classification Rules Depending on Steps
8.3 Facial Cosmetics
In this section, commonly used facial cosmetics, also called makeup, are specified.
The specification results from the observation of numerous makeup tutorials. To
evaluate facial cosmetics in detail, they must be classified into categories. In this
chapter, a classification approach, based on the effect and exact location of applied
cosmetics, is proposed.
8.3.1 Specification of Facial Cosmetics
Facial cosmetics are mainly applied on female faces to increase their attractiveness.
Attractiveness is affected by youthfulness, symmetry [106] and averageness [115].
Youthfulness is composed of healthy, lively and also childlike characteristics [92]
(e.g. soft skin, large eyes and small nose). All three attributes can be influenced by
facial cosmetics. Their positive effects on attractiveness is shown in [30].
The application of facial cosmetics can be split up into eight main steps. Those
steps are defined based on the observation of numerous makeup tutorials used for
constructing the database in Section 8.2. Those tutorials are provided by ordinary
women as well as professional makeup artists. They present different ways to apply
makeup ranging from every-day to more exclusive makeup. Table 8.1 summarizes
the eight main makeup steps including associated used products and their impacts.
Those makeup steps form an 8-digit makeup code. Each makeup step can be applied
with a slight or heavy amount, which is indicated in the makeup code by the digit
1 or 2. No application of makeup is indicated by the digit 0.
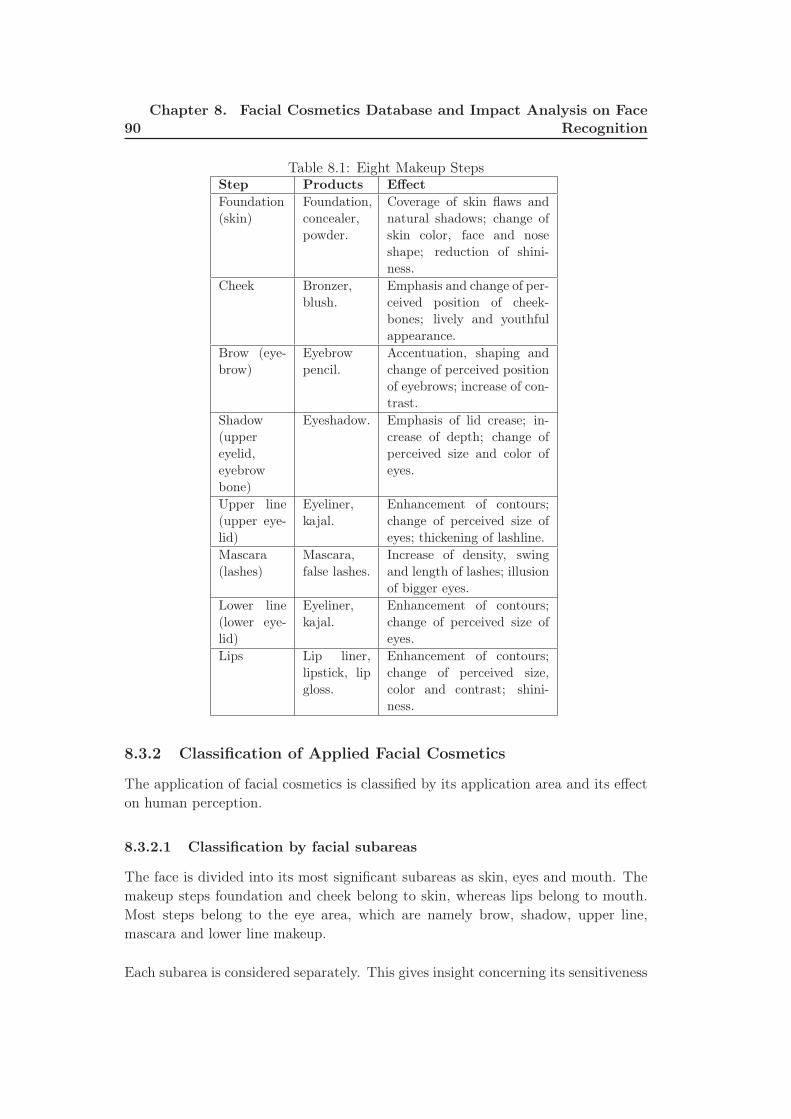
90Chapter 8. Facial Cosmetics Database and Impact Analysis on Face
Recognition
Table 8.1: Eight Makeup StepsStep Products Effect
Foundation
(skin)
Foundation,
concealer,
powder.
Coverage of skin flaws and
natural shadows; change of
skin color, face and nose
shape; reduction of shini-
ness.
Cheek Bronzer,
blush.
Emphasis and change of per-
ceived position of cheek-
bones; lively and youthful
appearance.
Brow (eye-
brow)
Eyebrow
pencil.
Accentuation, shaping and
change of perceived position
of eyebrows; increase of con-
trast.
Shadow
(upper
eyelid,
eyebrow
bone)
Eyeshadow. Emphasis of lid crease; in-
crease of depth; change of
perceived size and color of
eyes.
Upper line
(upper eye-
lid)
Eyeliner,
kajal.
Enhancement of contours;
change of perceived size of
eyes; thickening of lashline.
Mascara
(lashes)
Mascara,
false lashes.
Increase of density, swing
and length of lashes; illusion
of bigger eyes.
Lower line
(lower eye-
lid)
Eyeliner,
kajal.
Enhancement of contours;
change of perceived size of
eyes.
Lips Lip liner,
lipstick, lip
gloss.
Enhancement of contours;
change of perceived size,
color and contrast; shini-
ness.
8.3.2 Classification of Applied Facial Cosmetics
The application of facial cosmetics is classified by its application area and its effect
on human perception.
8.3.2.1 Classification by facial subareas
The face is divided into its most significant subareas as skin, eyes and mouth. The
makeup steps foundation and cheek belong to skin, whereas lips belong to mouth.
Most steps belong to the eye area, which are namely brow, shadow, upper line,
mascara and lower line makeup.
Each subarea is considered separately. This gives insight concerning its sensitiveness
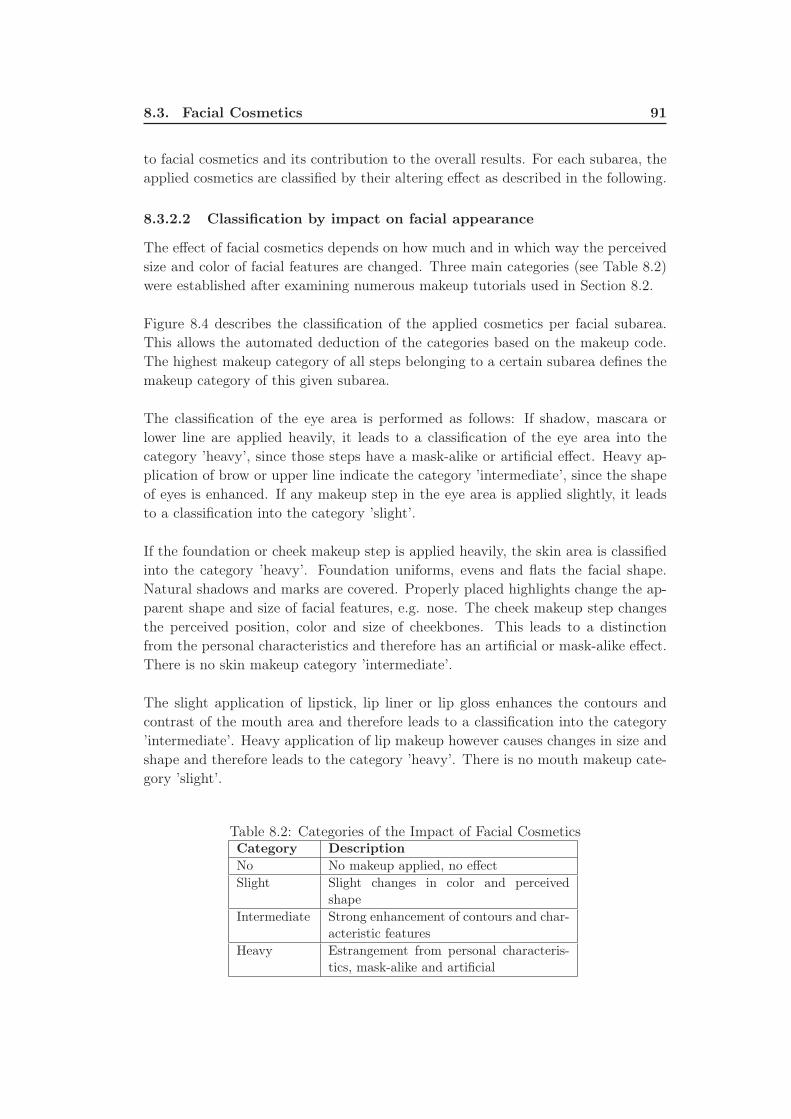
8.3. Facial Cosmetics 91
to facial cosmetics and its contribution to the overall results. For each subarea, the
applied cosmetics are classified by their altering effect as described in the following.
8.3.2.2 Classification by impact on facial appearance
The effect of facial cosmetics depends on how much and in which way the perceived
size and color of facial features are changed. Three main categories (see Table 8.2)
were established after examining numerous makeup tutorials used in Section 8.2.
Figure 8.4 describes the classification of the applied cosmetics per facial subarea.
This allows the automated deduction of the categories based on the makeup code.
The highest makeup category of all steps belonging to a certain subarea defines the
makeup category of this given subarea.
The classification of the eye area is performed as follows: If shadow, mascara or
lower line are applied heavily, it leads to a classification of the eye area into the
category ’heavy’, since those steps have a mask-alike or artificial effect. Heavy ap-
plication of brow or upper line indicate the category ’intermediate’, since the shape
of eyes is enhanced. If any makeup step in the eye area is applied slightly, it leads
to a classification into the category ’slight’.
If the foundation or cheek makeup step is applied heavily, the skin area is classified
into the category ’heavy’. Foundation uniforms, evens and flats the facial shape.
Natural shadows and marks are covered. Properly placed highlights change the ap-
parent shape and size of facial features, e.g. nose. The cheek makeup step changes
the perceived position, color and size of cheekbones. This leads to a distinction
from the personal characteristics and therefore has an artificial or mask-alike effect.
There is no skin makeup category ’intermediate’.
The slight application of lipstick, lip liner or lip gloss enhances the contours and
contrast of the mouth area and therefore leads to a classification into the category
’intermediate’. Heavy application of lip makeup however causes changes in size and
shape and therefore leads to the category ’heavy’. There is no mouth makeup cate-
gory ’slight’.
Table 8.2: Categories of the Impact of Facial CosmeticsCategory Description
No No makeup applied, no effect
Slight Slight changes in color and perceived
shape
Intermediate Strong enhancement of contours and char-
acteristic features
Heavy Estrangement from personal characteris-
tics, mask-alike and artificial
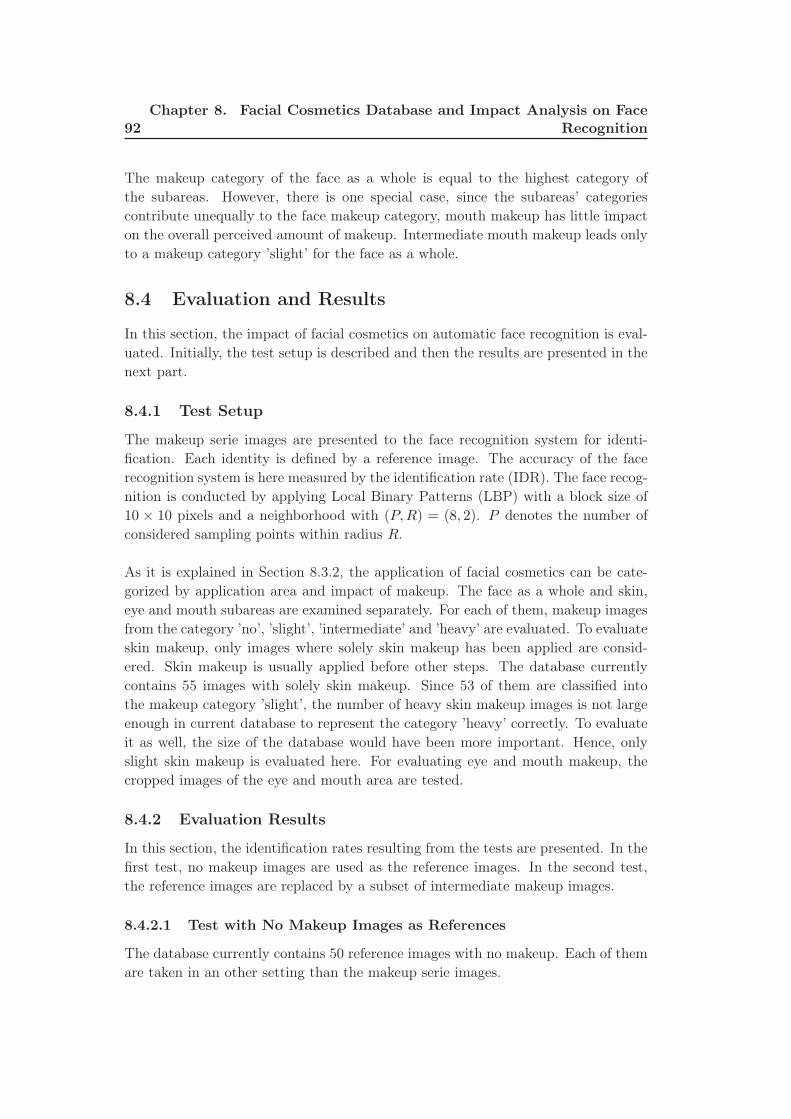
92Chapter 8. Facial Cosmetics Database and Impact Analysis on Face
Recognition
The makeup category of the face as a whole is equal to the highest category of
the subareas. However, there is one special case, since the subareas’ categories
contribute unequally to the face makeup category, mouth makeup has little impact
on the overall perceived amount of makeup. Intermediate mouth makeup leads only
to a makeup category ’slight’ for the face as a whole.
8.4 Evaluation and Results
In this section, the impact of facial cosmetics on automatic face recognition is eval-
uated. Initially, the test setup is described and then the results are presented in the
next part.
8.4.1 Test Setup
The makeup serie images are presented to the face recognition system for identi-
fication. Each identity is defined by a reference image. The accuracy of the face
recognition system is here measured by the identification rate (IDR). The face recog-
nition is conducted by applying Local Binary Patterns (LBP) with a block size of
10 × 10 pixels and a neighborhood with (P,R) = (8, 2). P denotes the number of
considered sampling points within radius R.
As it is explained in Section 8.3.2, the application of facial cosmetics can be cate-
gorized by application area and impact of makeup. The face as a whole and skin,
eye and mouth subareas are examined separately. For each of them, makeup images
from the category ’no’, ’slight’, ’intermediate’ and ’heavy’ are evaluated. To evaluate
skin makeup, only images where solely skin makeup has been applied are consid-
ered. Skin makeup is usually applied before other steps. The database currently
contains 55 images with solely skin makeup. Since 53 of them are classified into
the makeup category ’slight’, the number of heavy skin makeup images is not large
enough in current database to represent the category ’heavy’ correctly. To evaluate
it as well, the size of the database would have been more important. Hence, only
slight skin makeup is evaluated here. For evaluating eye and mouth makeup, the
cropped images of the eye and mouth area are tested.
8.4.2 Evaluation Results
In this section, the identification rates resulting from the tests are presented. In the
first test, no makeup images are used as the reference images. In the second test,
the reference images are replaced by a subset of intermediate makeup images.
8.4.2.1 Test with No Makeup Images as References
The database currently contains 50 reference images with no makeup. Each of them
are taken in an other setting than the makeup serie images.
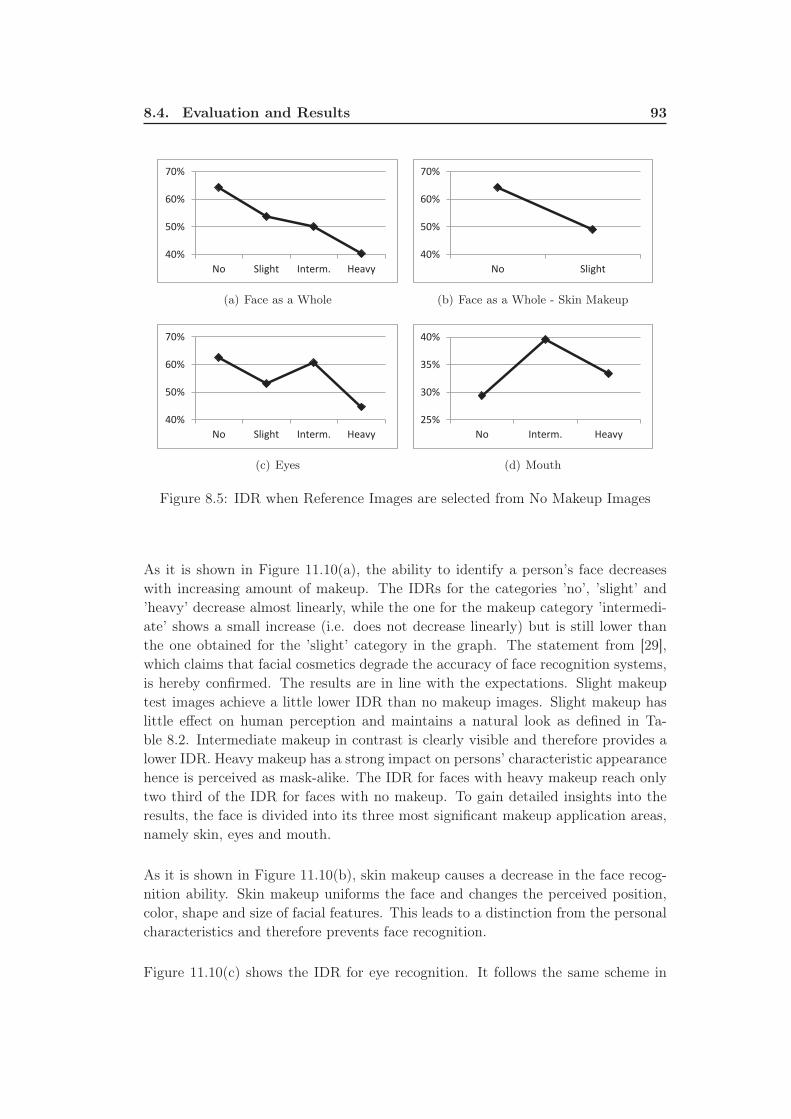
8.4. Evaluation and Results 93
40%
50%
60%
70%
No Slight Interm. Heavy
(a) Face as a Whole
40%
50%
60%
70%
No Slight
(b) Face as a Whole - Skin Makeup
40%
50%
60%
70%
No Slight Interm. Heavy
(c) Eyes
25%
30%
35%
40%
No Interm. Heavy
(d) Mouth
Figure 8.5: IDR when Reference Images are selected from No Makeup Images
As it is shown in Figure 11.10(a), the ability to identify a person’s face decreases
with increasing amount of makeup. The IDRs for the categories ’no’, ’slight’ and
’heavy’ decrease almost linearly, while the one for the makeup category ’intermedi-
ate’ shows a small increase (i.e. does not decrease linearly) but is still lower than
the one obtained for the ’slight’ category in the graph. The statement from [29],
which claims that facial cosmetics degrade the accuracy of face recognition systems,
is hereby confirmed. The results are in line with the expectations. Slight makeup
test images achieve a little lower IDR than no makeup images. Slight makeup has
little effect on human perception and maintains a natural look as defined in Ta-
ble 8.2. Intermediate makeup in contrast is clearly visible and therefore provides a
lower IDR. Heavy makeup has a strong impact on persons’ characteristic appearance
hence is perceived as mask-alike. The IDR for faces with heavy makeup reach only
two third of the IDR for faces with no makeup. To gain detailed insights into the
results, the face is divided into its three most significant makeup application areas,
namely skin, eyes and mouth.
As it is shown in Figure 11.10(b), skin makeup causes a decrease in the face recog-
nition ability. Skin makeup uniforms the face and changes the perceived position,
color, shape and size of facial features. This leads to a distinction from the personal
characteristics and therefore prevents face recognition.
Figure 11.10(c) shows the IDR for eye recognition. It follows the same scheme in
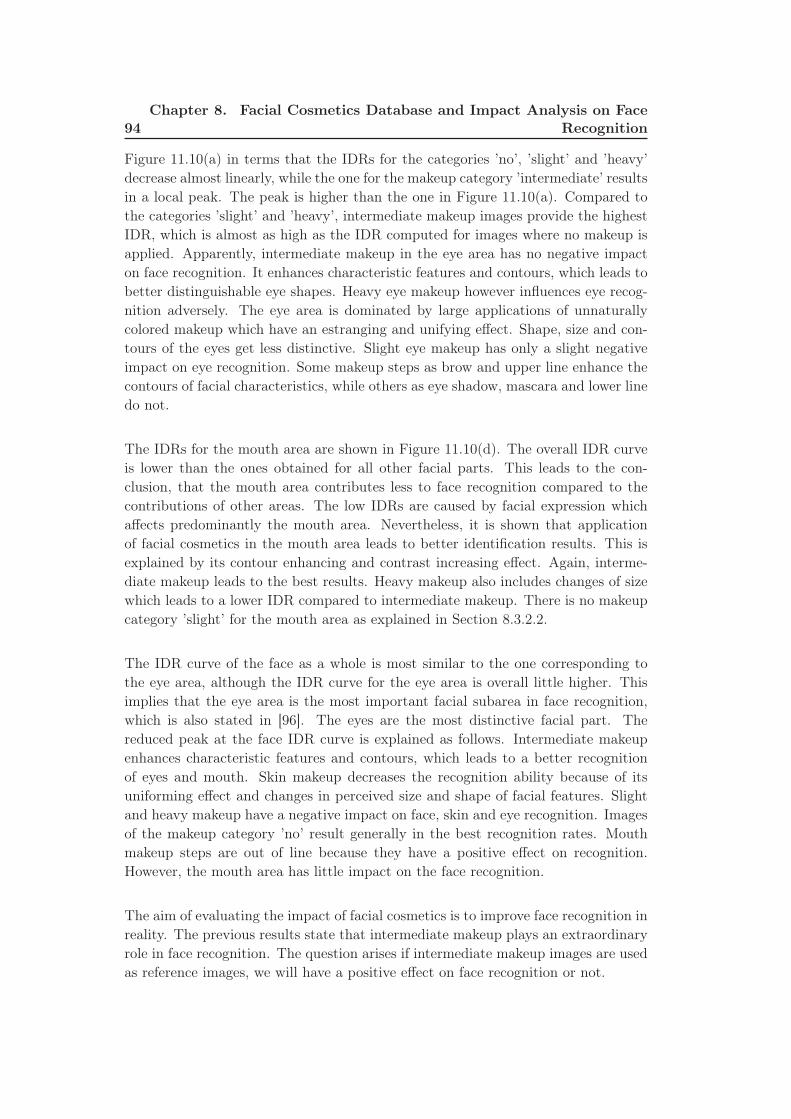
94Chapter 8. Facial Cosmetics Database and Impact Analysis on Face
Recognition
Figure 11.10(a) in terms that the IDRs for the categories ’no’, ’slight’ and ’heavy’
decrease almost linearly, while the one for the makeup category ’intermediate’ results
in a local peak. The peak is higher than the one in Figure 11.10(a). Compared to
the categories ’slight’ and ’heavy’, intermediate makeup images provide the highest
IDR, which is almost as high as the IDR computed for images where no makeup is
applied. Apparently, intermediate makeup in the eye area has no negative impact
on face recognition. It enhances characteristic features and contours, which leads to
better distinguishable eye shapes. Heavy eye makeup however influences eye recog-
nition adversely. The eye area is dominated by large applications of unnaturally
colored makeup which have an estranging and unifying effect. Shape, size and con-
tours of the eyes get less distinctive. Slight eye makeup has only a slight negative
impact on eye recognition. Some makeup steps as brow and upper line enhance the
contours of facial characteristics, while others as eye shadow, mascara and lower line
do not.
The IDRs for the mouth area are shown in Figure 11.10(d). The overall IDR curve
is lower than the ones obtained for all other facial parts. This leads to the con-
clusion, that the mouth area contributes less to face recognition compared to the
contributions of other areas. The low IDRs are caused by facial expression which
affects predominantly the mouth area. Nevertheless, it is shown that application
of facial cosmetics in the mouth area leads to better identification results. This is
explained by its contour enhancing and contrast increasing effect. Again, interme-
diate makeup leads to the best results. Heavy makeup also includes changes of size
which leads to a lower IDR compared to intermediate makeup. There is no makeup
category ’slight’ for the mouth area as explained in Section 8.3.2.2.
The IDR curve of the face as a whole is most similar to the one corresponding to
the eye area, although the IDR curve for the eye area is overall little higher. This
implies that the eye area is the most important facial subarea in face recognition,
which is also stated in [96]. The eyes are the most distinctive facial part. The
reduced peak at the face IDR curve is explained as follows. Intermediate makeup
enhances characteristic features and contours, which leads to a better recognition
of eyes and mouth. Skin makeup decreases the recognition ability because of its
uniforming effect and changes in perceived size and shape of facial features. Slight
and heavy makeup have a negative impact on face, skin and eye recognition. Images
of the makeup category ’no’ result generally in the best recognition rates. Mouth
makeup steps are out of line because they have a positive effect on recognition.
However, the mouth area has little impact on the face recognition.
The aim of evaluating the impact of facial cosmetics is to improve face recognition in
reality. The previous results state that intermediate makeup plays an extraordinary
role in face recognition. The question arises if intermediate makeup images are used
as reference images, we will have a positive effect on face recognition or not.
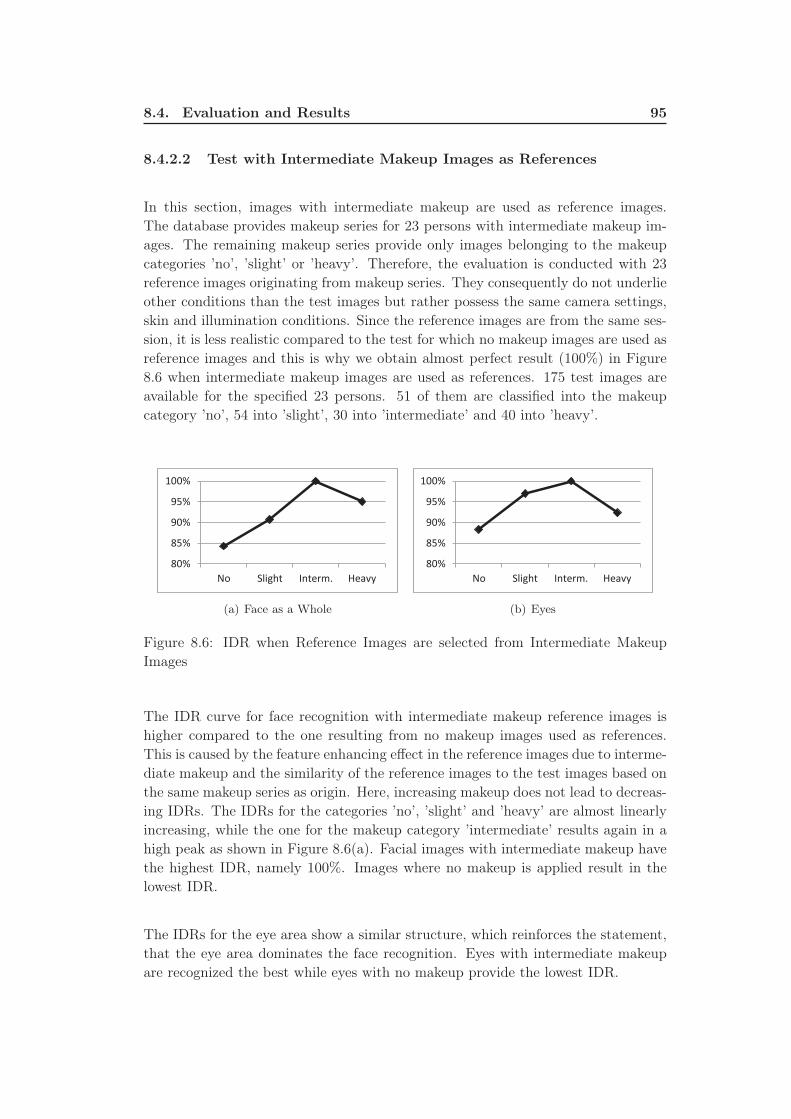
8.4. Evaluation and Results 95
8.4.2.2 Test with Intermediate Makeup Images as References
In this section, images with intermediate makeup are used as reference images.
The database provides makeup series for 23 persons with intermediate makeup im-
ages. The remaining makeup series provide only images belonging to the makeup
categories ’no’, ’slight’ or ’heavy’. Therefore, the evaluation is conducted with 23
reference images originating from makeup series. They consequently do not underlie
other conditions than the test images but rather possess the same camera settings,
skin and illumination conditions. Since the reference images are from the same ses-
sion, it is less realistic compared to the test for which no makeup images are used as
reference images and this is why we obtain almost perfect result (100%) in Figure
8.6 when intermediate makeup images are used as references. 175 test images are
available for the specified 23 persons. 51 of them are classified into the makeup
category ’no’, 54 into ’slight’, 30 into ’intermediate’ and 40 into ’heavy’.
80%
85%
90%
95%
100%
No Slight Interm. Heavy
(a) Face as a Whole
80%
85%
90%
95%
100%
No Slight Interm. Heavy
(b) Eyes
Figure 8.6: IDR when Reference Images are selected from Intermediate Makeup
Images
The IDR curve for face recognition with intermediate makeup reference images is
higher compared to the one resulting from no makeup images used as references.
This is caused by the feature enhancing effect in the reference images due to interme-
diate makeup and the similarity of the reference images to the test images based on
the same makeup series as origin. Here, increasing makeup does not lead to decreas-
ing IDRs. The IDRs for the categories ’no’, ’slight’ and ’heavy’ are almost linearly
increasing, while the one for the makeup category ’intermediate’ results again in a
high peak as shown in Figure 8.6(a). Facial images with intermediate makeup have
the highest IDR, namely 100%. Images where no makeup is applied result in the
lowest IDR.
The IDRs for the eye area show a similar structure, which reinforces the statement,
that the eye area dominates the face recognition. Eyes with intermediate makeup
are recognized the best while eyes with no makeup provide the lowest IDR.
96Chapter 8. Facial Cosmetics Database and Impact Analysis on Face
Recognition
8.5 Conclusion
Facial cosmetics are commonly and daily used in many cultures and may alter the
perception of facial features.
In order to propose a study on the impact of facial cosmetics on face recognition, a
database is built, which is publicly available. Also, the categorization of the most
common facial cosmetics and an objective classification approach are developed.
This database is used for preliminary evaluation of the impact of facial cosmetics on
face recognition. If the reference images do not include any make-up, facial cosmet-
ics do have a negative impact on face recognition. Surprisingly, the application of
facial cosmetics in the reference images can help to obtain better identification rate.
Facial cosmetics create intraclass variations. If they are only applied at one of the
image sets, they obviously lead to a decrease of the accuracy of face recognition sys-
tems. In [121], it is underlined that intraclass variations between reference and test
images greatly affect the accuracy of face recognition systems. In both cases, the
eye subarea plays a major role in face recognition while the mouth area is not pivotal.
Both the makeup categorization approach and the established database are suitable
for face recognition and related application areas, e.g. beauty evaluation, computer-
suggested makeup or automated makeup detection. Based on the provided images
and detailed information about the application area and amount of applied makeup,
algorithms can be trained to recognize different kinds of makeup. If makeup is
detected, facial subareas can be weighted differently to improve face recognition
results as similarly performed in [96] for facial occlusions. To obtain more stable
and detailed results, the size of the database can be increased. The definition of the
makeup category ’slight’ requires further refinement.
Chapter 9
Kinect Face Database and Impact
Analysis on Face Recognition
The recent success of emerging RGB-D cameras such as the Kinect sensor depicts
a broad prospect of 3-dimensional data based computer applications. However, due
to the lack of standard testing database, it is difficult to evaluate how much the face
recognition technology may benefit from this up-to-date imaging method. In order
to establish the connections between the Kinect sensor and face recognition, in this
chapter, we present the first publicly available face database (KinectFaceDB) based
on the Kinect sensor for face recognition. The database consists of different data
modalities (well-aligned and processed 2D, 2.5D, 3D and video based face data)
and multiple facial variations. We conduct benchmark evaluations on the proposed
database using standard face recognition methods, and demonstrate the performance
gain by integrating the depth data with the RGB data via score-level fusion. We
also compare the Kinect images (of the KinectFaceDB) with the traditional high
quality 3D scans (of the FRGC database) in the context of face biometrics, which
demonstrates the imperative needs of the proposed database for face recognition.
9.1 Introduction
Recently, the emerging RGB-D cameras such as the Kinect sensor [68] have been
successfully applied to many 3D based applications. Thanks to its efficiency, low-
cost, ease of RGB-D mapping and multiple-modalities, the Kinect sensor has re-
ceived vast amounts of attentions from different research communities [141] not
only in computer vision [1], but also in computer graphics [55,59], augmented real-
ity (AR) [38], human-computer-interaction (HCI) [62], instrument measurement [65]
and robotics [43]. For the biometrics community, directly inheriting from the power
of body parts segmentation and tracking using the Kinect [123], a number of works
has been presented for gait recognition [47,109,130] and body anthropometric anal-
ysis [11,100,137]. However, the adoption of this powerful new sensor for face recog-
nition has been mostly overlooked. The reason is due to the lack of standard testing
dataset that limits the deployment of new algorithms and applications in this very
dynamic research domain. Therefore, it is of great importance to provide a stan-
dard database for researchers to design and experiment 3D and multi-modal (i.e.
2D+3D) based face recognition using the Kinect data, so as to establish the con-
nection between the Kinect and face recognition research.
98Chapter 9. Kinect Face Database and Impact Analysis on Face
Recognition
In this chapter, a standard database (i.e., the KinectFaceDB) is presented to evaluate
face recognition algorithms based on the Kinect. The proposed database consists of
936 shots of well-aligned 2D, 2.5D and 3D face data and 104 video sequences from
52 individuals taken by the Kinect sensor. It contains 9 different facial variations
(including different facial expressions, illuminations, occlusions, and poses) within
2 different sessions. We conduct benchmark evaluations on the proposed database
using a number of baseline face recognition methods. Specifically, we report the
results (of identification/verification) of Eigenface [12], LBP [4], SIFT [85], and
LGBP [140] for the 2D and 2.5D based face recognition, and conduct both the
rigid method (i.e., ICP) [93] and the non-rigid method (i.e., TPS) [39] for 3D based
face recognition. Score-level fusion of the RGB and depth data is also conducted,
which demonstrates significantly improved results. The proposed KinectFaceDB
are compared with a widely used high quality 3D face database (i.e., the FRGC
database), in order to show the effects of 3D data quality in the context of face
biometrics. In addition to its applications in face recognition, we also show in
this chapter that the proposed database can be applied to many other tasks (e.g.,
facial demographic analysis and 3D face modelling). The main contributions of this
chapter can be summarized as follows:
• A complete multi-modal (i.e., well-aligned and processed 2D, 2.5D, 3D, and
video based face data) face database based on the Kinect is built and thor-
oughly described.
• Extensive experiments are conducted for the benchmark evaluations of 2D,
2.5D, and 3D based recognition using standard face recognition methods.
• Face recognition results on both the KinectFaceDB and the FRGC are com-
pared following the same protocol, which demonstrate the data quality differ-
ences between the Kinect sensor and the laser scanner in the context of face
biometrics.
• State-of-the-arts of existing 3D face databases are reviewed and discussed.
The rest of this chapter is structured as follows. In Section 9.2, we review the 3D
face databases in the literature. Details of the proposed database are described in
Section 9.3. In Section 9.4, experiments for benchmark evaluations and fusion are
explained. The comparative results of experiments on KinectFaceDB and FRGC
are reported in Section 9.5. Finally the conclusion is given in Section 9.6.
9.2 Review of 3D Face Databases
This section provides a review of publicly available 3D face databases. (A list of more
generic face databases can be found at [114].) In biometrics research, face databases
serve as the standard platform for comparative evaluations of face recognition algo-
rithms [49], and therefore are important for the development of robust and reliable
face recognition systems. Toward this goal, a large number of face databases have
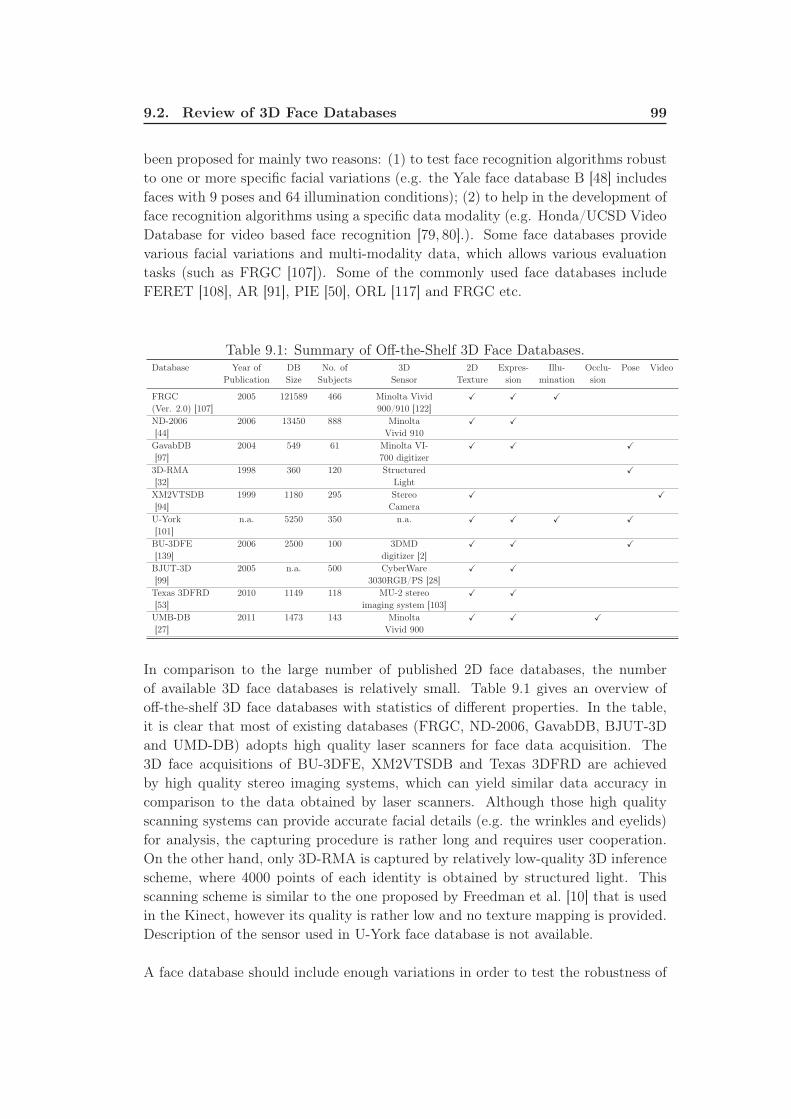
9.2. Review of 3D Face Databases 99
been proposed for mainly two reasons: (1) to test face recognition algorithms robust
to one or more specific facial variations (e.g. the Yale face database B [48] includes
faces with 9 poses and 64 illumination conditions); (2) to help in the development of
face recognition algorithms using a specific data modality (e.g. Honda/UCSD Video
Database for video based face recognition [79, 80].). Some face databases provide
various facial variations and multi-modality data, which allows various evaluation
tasks (such as FRGC [107]). Some of the commonly used face databases include
FERET [108], AR [91], PIE [50], ORL [117] and FRGC etc.
Table 9.1: Summary of Off-the-Shelf 3D Face Databases.Database Year of DB No. of 3D 2D Expres- Illu- Occlu- Pose Video
Publication Size Subjects Sensor Texture sion mination sion
FRGC 2005 121589 466 Minolta Vivid X X X
(Ver. 2.0) [107] 900/910 [122]
ND-2006 2006 13450 888 Minolta X X
[44] Vivid 910
GavabDB 2004 549 61 Minolta VI- X X X
[97] 700 digitizer
3D-RMA 1998 360 120 Structured X
[32] Light
XM2VTSDB 1999 1180 295 Stereo X X
[94] Camera
U-York n.a. 5250 350 n.a. X X X X
[101]
BU-3DFE 2006 2500 100 3DMD X X X
[139] digitizer [2]
BJUT-3D 2005 n.a. 500 CyberWare X X
[99] 3030RGB/PS [28]
Texas 3DFRD 2010 1149 118 MU-2 stereo X X
[53] imaging system [103]
UMB-DB 2011 1473 143 Minolta X X X
[27] Vivid 900
In comparison to the large number of published 2D face databases, the number
of available 3D face databases is relatively small. Table 9.1 gives an overview of
off-the-shelf 3D face databases with statistics of different properties. In the table,
it is clear that most of existing databases (FRGC, ND-2006, GavabDB, BJUT-3D
and UMD-DB) adopts high quality laser scanners for face data acquisition. The
3D face acquisitions of BU-3DFE, XM2VTSDB and Texas 3DFRD are achieved
by high quality stereo imaging systems, which can yield similar data accuracy in
comparison to the data obtained by laser scanners. Although those high quality
scanning systems can provide accurate facial details (e.g. the wrinkles and eyelids)
for analysis, the capturing procedure is rather long and requires user cooperation.
On the other hand, only 3D-RMA is captured by relatively low-quality 3D inference
scheme, where 4000 points of each identity is obtained by structured light. This
scanning scheme is similar to the one proposed by Freedman et al. [10] that is used
in the Kinect, however its quality is rather low and no texture mapping is provided.
Description of the sensor used in U-York face database is not available.
A face database should include enough variations in order to test the robustness of
100Chapter 9. Kinect Face Database and Impact Analysis on Face
Recognition
face recognition algorithms. Facial variations such as facial expressions, illumina-
tions, partial occlusions and pose variations are normally considered in typical face
databases (e.g. [91, 107]). However, because 3D structures are the complementary
information with respect to 2D textures, 2D and 3D face recognition techniques
have different capabilities in treating different facial variations. For example, 2D
face recognition methods [4, 12] are usually more robust to facial expression vari-
ations than 3D face recognition methods; on the other hand, 3D face recognition
algorithms [18, 93] are known to be invariant to illumination changes. Therefore,
the variations in a 3D face database shall be carefully selected. Because facial ex-
pression is a major challenge in 3D face recognition, almost all 3D face databases
include this variation (except 3D-RMA). The second commonly used variation in
3D face databases are different poses. The pose variation can demonstrate how 3D
face recognition algorithms can address a difficult problem in 2D recognition via the
alignment of two 3D surfaces by rigid transformation usually performed by Iterative
Closest Points method (ICP) [13,24]). In FRGC and U-York, different illumination
conditions are also considered, even if illumination usually does not affect 3D face
recognition. In addition to the commonly considered variations, partial occlusion
is a very challenging problem for both 2D and 3D face recognition but only few
databases contain occluded faces [27, 91, 118]. Recently, the UMB-DB [27] is pro-
posed for the evaluation of 3D face recognition under occluded conditions.
Almost all 3D face databases are also multi-modal in the sense that 2D texture
images are also provided (except for 3D-RMA). For the databases using stereo vision
technologies (BU-3DFE, XM2VTSDB and Texas 3DFRD), 3D structure is inferred
from two or more RGB cameras, thus the 2D/3D texture mapping is straightforward.
However, for the databases based on laser scanners, the 2D texture images are
usually taken by an external RGB camera. Therefore the 2D texture and 3D data
are by default not aligned. The alignment can be achieved using additional facial
landmarks and warping algorithms such as Thin Plate Spline (TPS) method [36].
It should be noted that only one database (XM2VTSDB) in our review provides
also video data, and the video sequence is only for 2D texture sequences. This is
because the off-the-shelf 3D scanners are not able to provide 2.5D depth map or 3D
point cloud in real time. For this reason, almost all 3D face recognition studies are
restricted to still 3D faces.
9.3 The Kinect Face Database
The Kinect Face Database is a multi-modal face database (with well aligned 2D,
2.5D, 3D and video data) based on the Kinect sensor. In this section, the database
structure and the acquisition environment are described in part 9.3.1 and part 9.3.2,
respectively; then the details of how to obtain the multi-modal data and how to
achieve the alignment of different data modalities are presented in part 9.3.3; post-
processing including noise removal and facial landmarking are then introduced in
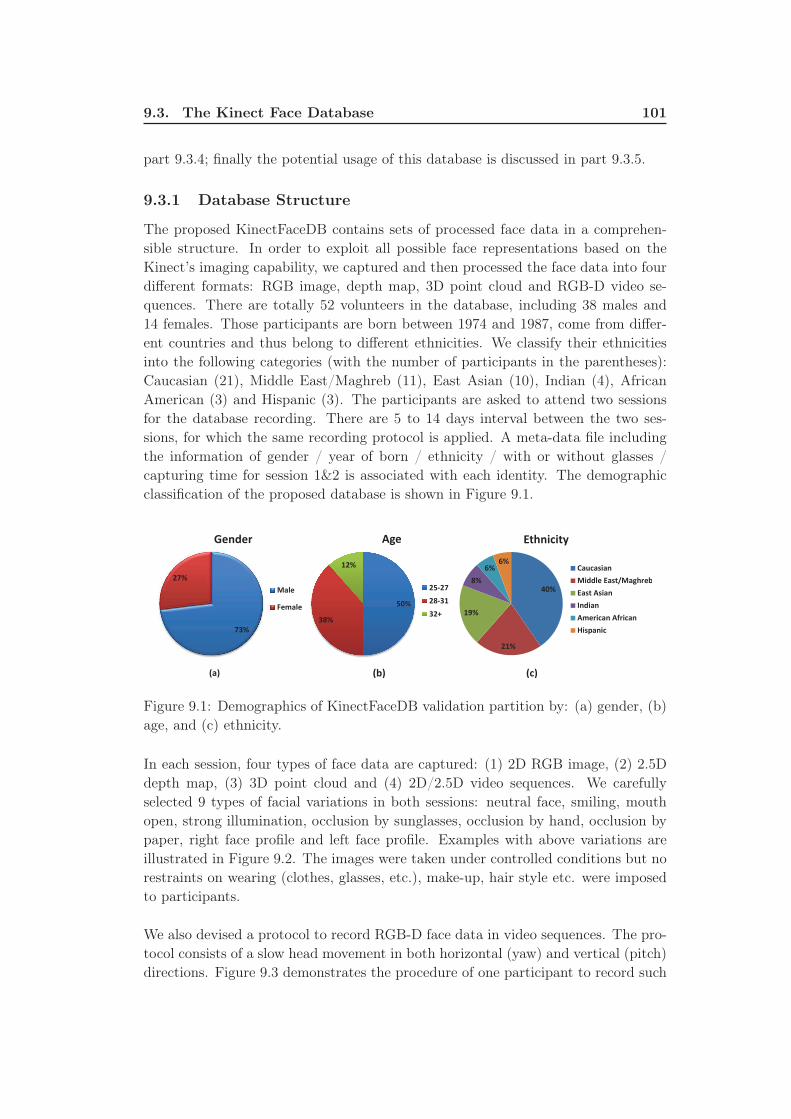
9.3. The Kinect Face Database 101
part 9.3.4; finally the potential usage of this database is discussed in part 9.3.5.
9.3.1 Database Structure
The proposed KinectFaceDB contains sets of processed face data in a comprehen-
sible structure. In order to exploit all possible face representations based on the
Kinect’s imaging capability, we captured and then processed the face data into four
different formats: RGB image, depth map, 3D point cloud and RGB-D video se-
quences. There are totally 52 volunteers in the database, including 38 males and
14 females. Those participants are born between 1974 and 1987, come from differ-
ent countries and thus belong to different ethnicities. We classify their ethnicities
into the following categories (with the number of participants in the parentheses):
Caucasian (21), Middle East/Maghreb (11), East Asian (10), Indian (4), African
American (3) and Hispanic (3). The participants are asked to attend two sessions
for the database recording. There are 5 to 14 days interval between the two ses-
sions, for which the same recording protocol is applied. A meta-data file including
the information of gender / year of born / ethnicity / with or without glasses /
capturing time for session 1&2 is associated with each identity. The demographic
classification of the proposed database is shown in Figure 9.1.
���
���
�����
���
����� ���
���
���
���
�����
�����
���
���
���
���
��
����
���������
�!��"���
�����#��"�$����%
��"�#�"���
&�����
�������#�'����
(�")����
*�+ *%+ *�+
Figure 9.1: Demographics of KinectFaceDB validation partition by: (a) gender, (b)
age, and (c) ethnicity.
In each session, four types of face data are captured: (1) 2D RGB image, (2) 2.5D
depth map, (3) 3D point cloud and (4) 2D/2.5D video sequences. We carefully
selected 9 types of facial variations in both sessions: neutral face, smiling, mouth
open, strong illumination, occlusion by sunglasses, occlusion by hand, occlusion by
paper, right face profile and left face profile. Examples with above variations are
illustrated in Figure 9.2. The images were taken under controlled conditions but no
restraints on wearing (clothes, glasses, etc.), make-up, hair style etc. were imposed
to participants.
We also devised a protocol to record RGB-D face data in video sequences. The pro-
tocol consists of a slow head movement in both horizontal (yaw) and vertical (pitch)
directions. Figure 9.3 demonstrates the procedure of one participant to record such
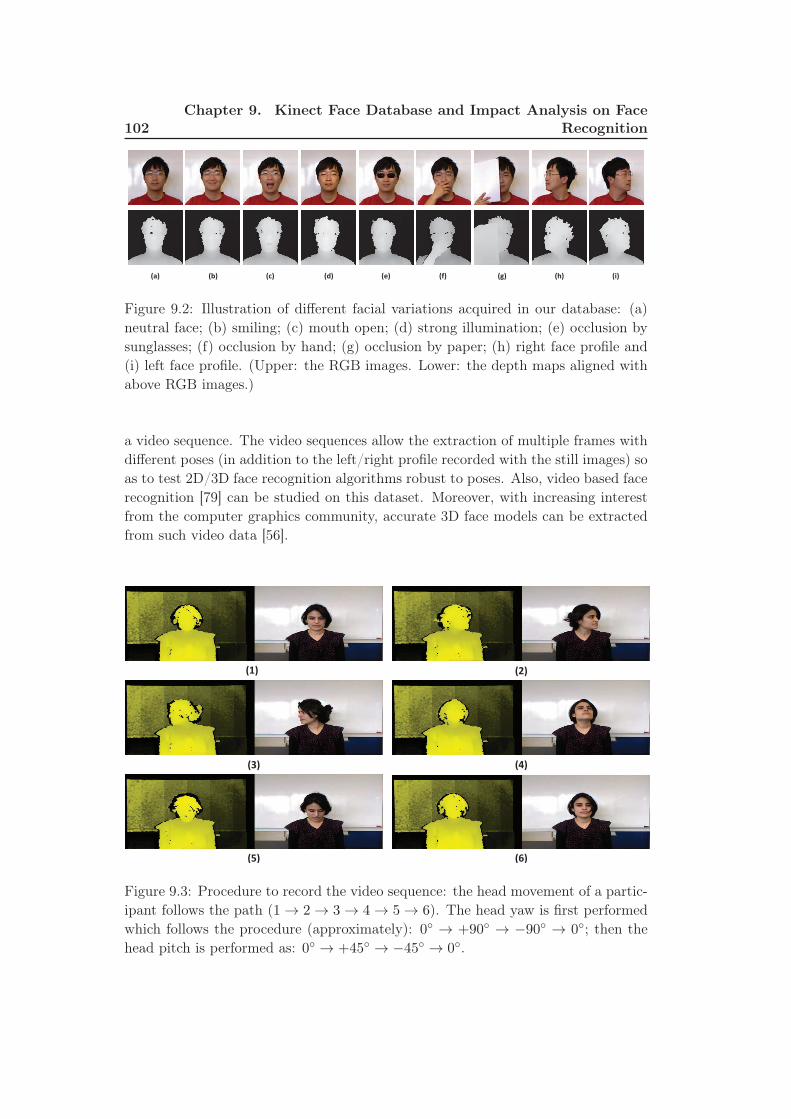
102Chapter 9. Kinect Face Database and Impact Analysis on Face
Recognition
(a) (b) (c) (d) (e) (f) (g) (h) (i)
Figure 9.2: Illustration of different facial variations acquired in our database: (a)
neutral face; (b) smiling; (c) mouth open; (d) strong illumination; (e) occlusion by
sunglasses; (f) occlusion by hand; (g) occlusion by paper; (h) right face profile and
(i) left face profile. (Upper: the RGB images. Lower: the depth maps aligned with
above RGB images.)
a video sequence. The video sequences allow the extraction of multiple frames with
different poses (in addition to the left/right profile recorded with the still images) so
as to test 2D/3D face recognition algorithms robust to poses. Also, video based face
recognition [79] can be studied on this dataset. Moreover, with increasing interest
from the computer graphics community, accurate 3D face models can be extracted
from such video data [56].
(1) (2)
(3) (4)
(5) (6)
Figure 9.3: Procedure to record the video sequence: the head movement of a partic-
ipant follows the path (1→ 2→ 3→ 4→ 5→ 6). The head yaw is first performed
which follows the procedure (approximately): 0◦ → +90◦ → −90◦ → 0◦; then the
head pitch is performed as: 0◦ → +45◦ → −45◦ → 0◦.
9.3. The Kinect Face Database 103
9.3.2 Acquisition Environment
A controlled indoor environment (nature light source at daytime, with normal in-
door LED diffusions) is set up for the database capturing. A Kinect is mounted
and stabilized (where its lens are in parallel to ground floor by adjusting its tilt)
on top of a laptop. The participants were asked to sit in front of the Kinect sensor
at a distance (ranging from 0.7m− 0.9m) and to follow the pre-defined acquisition
protocol (in compliance with the database structure described in Section 9.3.1). A
white board is placed behind the participants with the distance to the Kinect at
1.25m, so as to produce a simple and easily filtered background. A LED lamp is set
in front of the participants to produce strong illumination variation. Three pairs
of sunglasses and a white paper are used to produce the occlusion variations. A
human operator is required to sit in front of the laptop (in the opposite position of
the participants) to monitor and control the acquisition process.
We developed a tool (based on OpenNI [51]) to facilitate the database capturing.
The tool automatically captures, processes and organizes faces of participants ac-
cording to the pre-defined database structure. Since we focus on the face region,
we crop the captured RGB image and depth map into a pre-defined ROI (with res-
olution of 256 × 256). The pre-cropping scheme ensures the captured faces have a
simple/uniform background (the white board only, and therefore easy to segment);
also, it minimizes the differences between the RGB image and Depth map after the
alignment (see Section 9.3.3.3). The details of the acquisition process are presented
in the next section.
9.3.3 Acquisition Process
Microsoft Kinect was primarily designed for multimedia entertainment purposes,
where it requires an integration of different sensing/display/processing functionali-
ties (for the data source ranging from video/audio to depth) for the targeted ambient
intelligence. Since our goal focuses on the building of a face database consisting of
RGB-D and 3D face data, in this section, we summarize the imaging procedure of
the Kinect, how we can obtain the 3D data, as well as the alignment of RGB and
depth images so as to obtain the final output (still RGB-D image, 3D point cloud
and video face data) in our database.
9.3.3.1 RGB and Depth Imaging from the Kinect
The Kinect sensor includes 3 main components for RGB-D data capturing: an in-
frared (IR) laser emitter, a RGB camera and an IR camera. The RGB camera
captures RGB images IRGB directly, whereas the laser emitter and IR camera act
together as an active depth sensor to retrieve the distance information from the
scene.
104Chapter 9. Kinect Face Database and Impact Analysis on Face
Recognition
Freedman et al. introduced the triangulation process of the Kinect for the depth
measurement based on the IR laser emitter and the IR camera in [10]. In the system,
a pattern of spots (created by transillumination through a raster) are projected
to the world scene by the IR laser emitter and the reflection of such pattern is
captured by the IR camera. The captured pattern is then compared with a reference
pattern (a pre-captured plane at a known distance) so as to produce a disparity map
IDisparity of the spots displacement d. From the obtained disparity map IDisparity,
it is straightforward to deduce a depth map via simple triangulation process. A
simplified model to describe such triangulation is suggested in [65]:
z−1world = (m
f × b)× d
′
+ (Z−10 +n
f × b) (9.1)
where zworld is the distance between the Kinect and the real-world location (namely
the depth, in the unit of mm); d′ is the normalized disparity value by normalizing
the raw disparity value d between 0 and 2047, thus d = m ∗ d′ + n where m and n
are the de-normalization parameters; b and f are the base length and focal length,
respectively; and Z0 is the distance between the Kinect and the pre-defined refer-
ence pattern. The calibration parameters including b, f and Z0 are estimated and
provided by the device vendor (Microsoft).
With above procedures, the Kinect outputs a RGB image (where IRGB(x, y) =
{vR, vG, vB}, and vR, vG, vB refer to the values of R, G, B channels at image location
(x, y)) and a depth map (where IDepth(x, y) = zworld and zworld indicates the depth
value at image location (x, y)) simultaneously, with the resolution of 640× 480. On
top of the obtained RGB and depth images, the 3D face data and aligned RGB-D
face data can be generated with later processes.
9.3.3.2 Converting to 3D Face Data
For the use of 3D face recognition, world 3D coordinates (according to a reference
origin) of a given face are required. Thanks to the embodiment of the Kinect,
the calculation of 3D points representing the surface of a face is straightforward.
Knowing the depth map IDepth(x, y) = zworld, the 3D coordinates of each point
(xworld, yworld, zworld) (in the unit of {mm, mm, mm}) can be calculated from its
image coordinates (x, y) as below:
xworld = −zworld
f(x− x0 + δx) (9.2)
and
yworld = −zworld
f(y − y0 + δy) (9.3)
where x0 and y0 are the principal point of the image coordinates, and δx and δy
represent the corrections for lens distortions. Those parameters are easily accessible
9.3. The Kinect Face Database 105
from the device outputs.
Based on above projections, the 3D coordinates (a 3D point cloud) of each pre-
cropped face depth image are computed and stored as ‘.obj’ files in our database.
Those files can be used for general 3D face recognition purposes and also be used
to evaluate the 3D data quality of the Kinect in the context of biometrics in later
experiments.
9.3.3.3 Alignment of RGB and Depth for Face Data
For face recognition based on both the RGB and depth images, establishing the
correspondences between the RGB values and the depth/3D values at the same
location on a face is an essential step. For example, designing a RGB-D descriptor
which can summarize features from both the RGB and depth values jointly for each
pixel might potentially reveal important facial characteristics. However, due to the
intrinsic architecture of the Kinect sensor (where the RGB and depth images are
sampled separately from two different cameras with a displacement between them),
the RGB image and the depth map captured by the Kinect are not well aligned.
Therefore, we further project the depth value from the IR camera plane to the RGB
camera plane. From the depth map, we have already estimated the corresponding
3D coordinate (xworld, yworld, zworld) of each pixel using the method presented in
Section 9.3.3.2, then the projection from the 3D coordinates to the 2D RGB camera
plane can be achieved by using the traditional Tsai’s camera model [135]. First, the
3D coordinates based on the IR camera is transformed to the 3D coordinate system
defined by the RGB camera using affine transformation:
xworld′
yworld′
zworld′
1
=
[
R T
0 0 0 1
]
xworld
yworld
zworld
1
(9.4)
where R ∈ R3×3 is the rotation matrix and T ∈ R
3×1 is the translation vector.
Then the 3D coordinates based on the RGB camera can be mapped to the ideally
undistorted RGB camera plane as:
xRGB
yRGB
1
= fRGB/zworld′
xworld′
yworld′
zworld′
(9.5)
based on the focal length fRGB of the RGB camera. Finally, the true location
(xRGB′, yRGB′) of a 3D point in the RGB camera plane is recovered by correcting
the distortions and mapping to the RGB image origin:
xRGB′
yRGB′
1
= V D
xRGB
yRGB
1
(9.6)
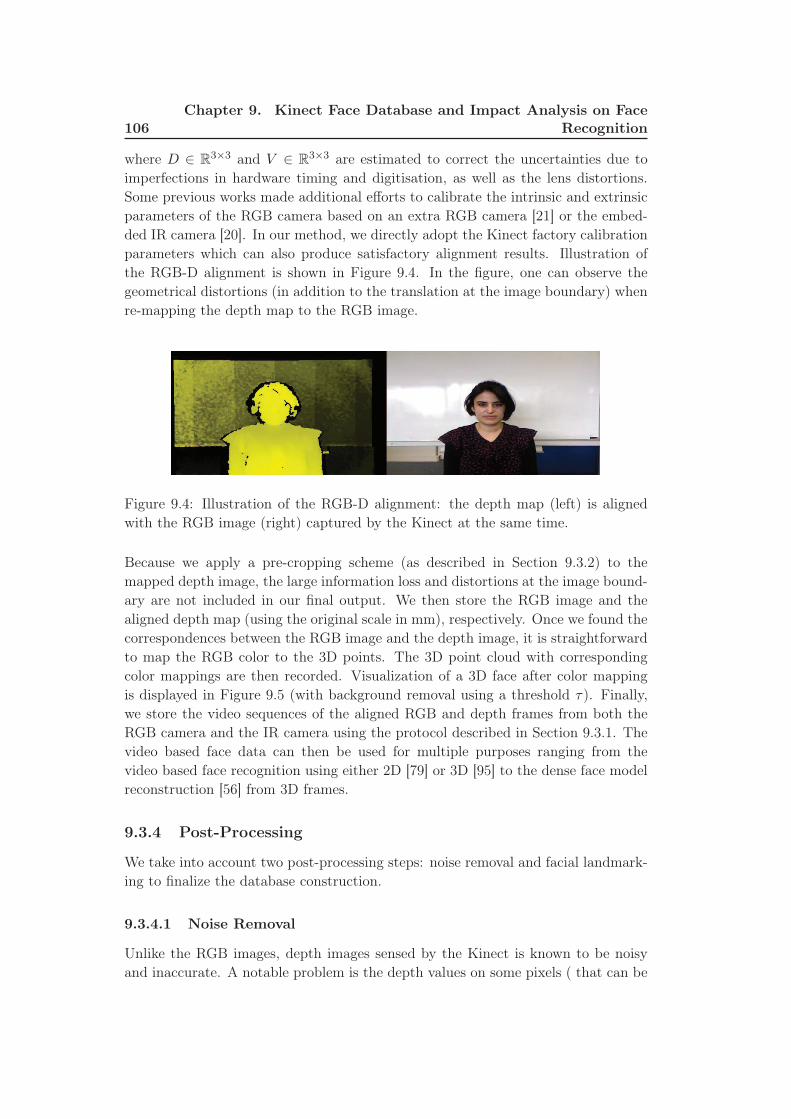
106Chapter 9. Kinect Face Database and Impact Analysis on Face
Recognition
where D ∈ R3×3 and V ∈ R
3×3 are estimated to correct the uncertainties due to
imperfections in hardware timing and digitisation, as well as the lens distortions.
Some previous works made additional efforts to calibrate the intrinsic and extrinsic
parameters of the RGB camera based on an extra RGB camera [21] or the embed-
ded IR camera [20]. In our method, we directly adopt the Kinect factory calibration
parameters which can also produce satisfactory alignment results. Illustration of
the RGB-D alignment is shown in Figure 9.4. In the figure, one can observe the
geometrical distortions (in addition to the translation at the image boundary) when
re-mapping the depth map to the RGB image.
Figure 9.4: Illustration of the RGB-D alignment: the depth map (left) is aligned
with the RGB image (right) captured by the Kinect at the same time.
Because we apply a pre-cropping scheme (as described in Section 9.3.2) to the
mapped depth image, the large information loss and distortions at the image bound-
ary are not included in our final output. We then store the RGB image and the
aligned depth map (using the original scale in mm), respectively. Once we found the
correspondences between the RGB image and the depth image, it is straightforward
to map the RGB color to the 3D points. The 3D point cloud with corresponding
color mappings are then recorded. Visualization of a 3D face after color mapping
is displayed in Figure 9.5 (with background removal using a threshold τ). Finally,
we store the video sequences of the aligned RGB and depth frames from both the
RGB camera and the IR camera using the protocol described in Section 9.3.1. The
video based face data can then be used for multiple purposes ranging from the
video based face recognition using either 2D [79] or 3D [95] to the dense face model
reconstruction [56] from 3D frames.
9.3.4 Post-Processing
We take into account two post-processing steps: noise removal and facial landmark-
ing to finalize the database construction.
9.3.4.1 Noise Removal
Unlike the RGB images, depth images sensed by the Kinect is known to be noisy
and inaccurate. A notable problem is the depth values on some pixels ( that can be
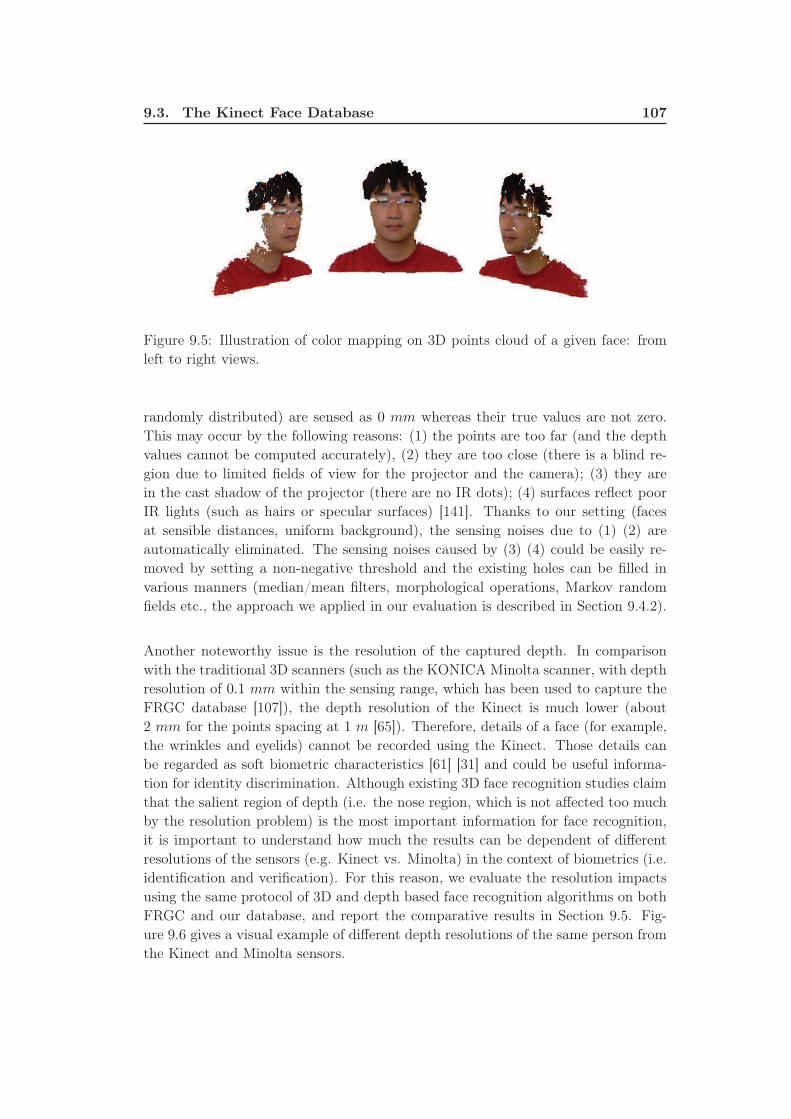
9.3. The Kinect Face Database 107
Figure 9.5: Illustration of color mapping on 3D points cloud of a given face: from
left to right views.
randomly distributed) are sensed as 0 mm whereas their true values are not zero.
This may occur by the following reasons: (1) the points are too far (and the depth
values cannot be computed accurately), (2) they are too close (there is a blind re-
gion due to limited fields of view for the projector and the camera); (3) they are
in the cast shadow of the projector (there are no IR dots); (4) surfaces reflect poor
IR lights (such as hairs or specular surfaces) [141]. Thanks to our setting (faces
at sensible distances, uniform background), the sensing noises due to (1) (2) are
automatically eliminated. The sensing noises caused by (3) (4) could be easily re-
moved by setting a non-negative threshold and the existing holes can be filled in
various manners (median/mean filters, morphological operations, Markov random
fields etc., the approach we applied in our evaluation is described in Section 9.4.2).
Another noteworthy issue is the resolution of the captured depth. In comparison
with the traditional 3D scanners (such as the KONICA Minolta scanner, with depth
resolution of 0.1 mm within the sensing range, which has been used to capture the
FRGC database [107]), the depth resolution of the Kinect is much lower (about
2 mm for the points spacing at 1 m [65]). Therefore, details of a face (for example,
the wrinkles and eyelids) cannot be recorded using the Kinect. Those details can
be regarded as soft biometric characteristics [61] [31] and could be useful informa-
tion for identity discrimination. Although existing 3D face recognition studies claim
that the salient region of depth (i.e. the nose region, which is not affected too much
by the resolution problem) is the most important information for face recognition,
it is important to understand how much the results can be dependent of different
resolutions of the sensors (e.g. Kinect vs. Minolta) in the context of biometrics (i.e.
identification and verification). For this reason, we evaluate the resolution impacts
using the same protocol of 3D and depth based face recognition algorithms on both
FRGC and our database, and report the comparative results in Section 9.5. Fig-
ure 9.6 gives a visual example of different depth resolutions of the same person from
the Kinect and Minolta sensors.
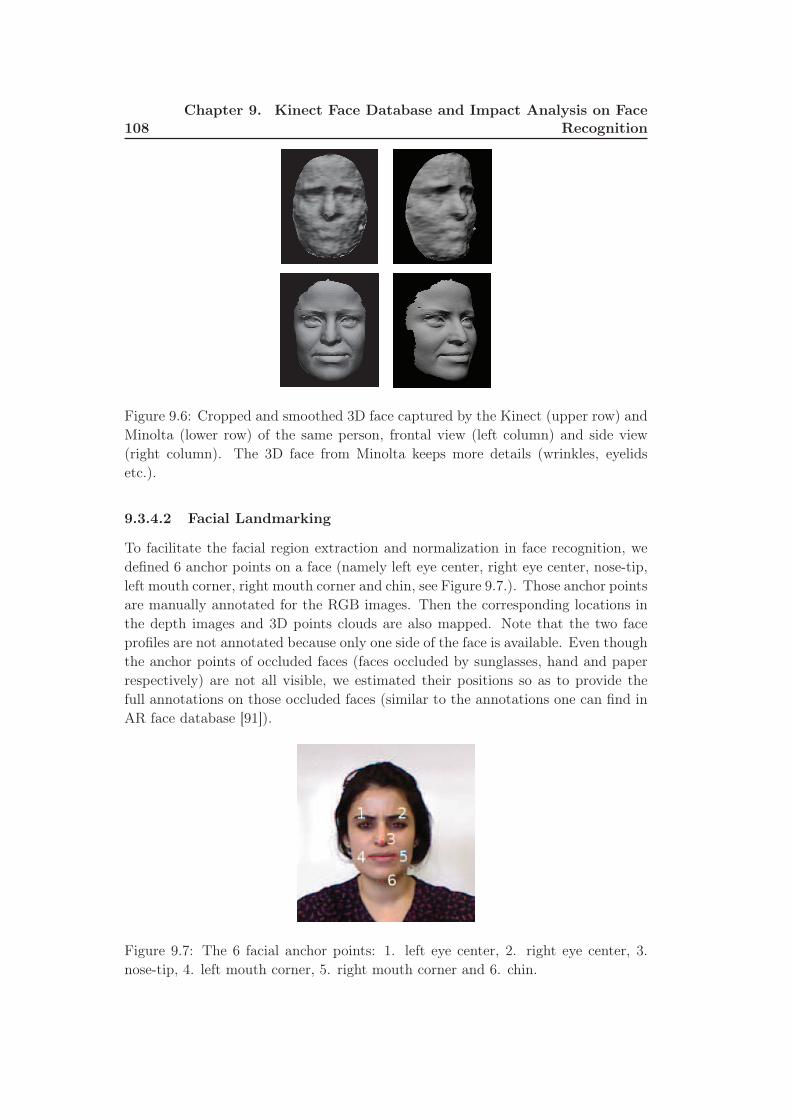
108Chapter 9. Kinect Face Database and Impact Analysis on Face
Recognition
Figure 9.6: Cropped and smoothed 3D face captured by the Kinect (upper row) and
Minolta (lower row) of the same person, frontal view (left column) and side view
(right column). The 3D face from Minolta keeps more details (wrinkles, eyelids
etc.).
9.3.4.2 Facial Landmarking
To facilitate the facial region extraction and normalization in face recognition, we
defined 6 anchor points on a face (namely left eye center, right eye center, nose-tip,
left mouth corner, right mouth corner and chin, see Figure 9.7.). Those anchor points
are manually annotated for the RGB images. Then the corresponding locations in
the depth images and 3D points clouds are also mapped. Note that the two face
profiles are not annotated because only one side of the face is available. Even though
the anchor points of occluded faces (faces occluded by sunglasses, hand and paper
respectively) are not all visible, we estimated their positions so as to provide the
full annotations on those occluded faces (similar to the annotations one can find in
AR face database [91]).
Figure 9.7: The 6 facial anchor points: 1. left eye center, 2. right eye center, 3.
nose-tip, 4. left mouth corner, 5. right mouth corner and 6. chin.
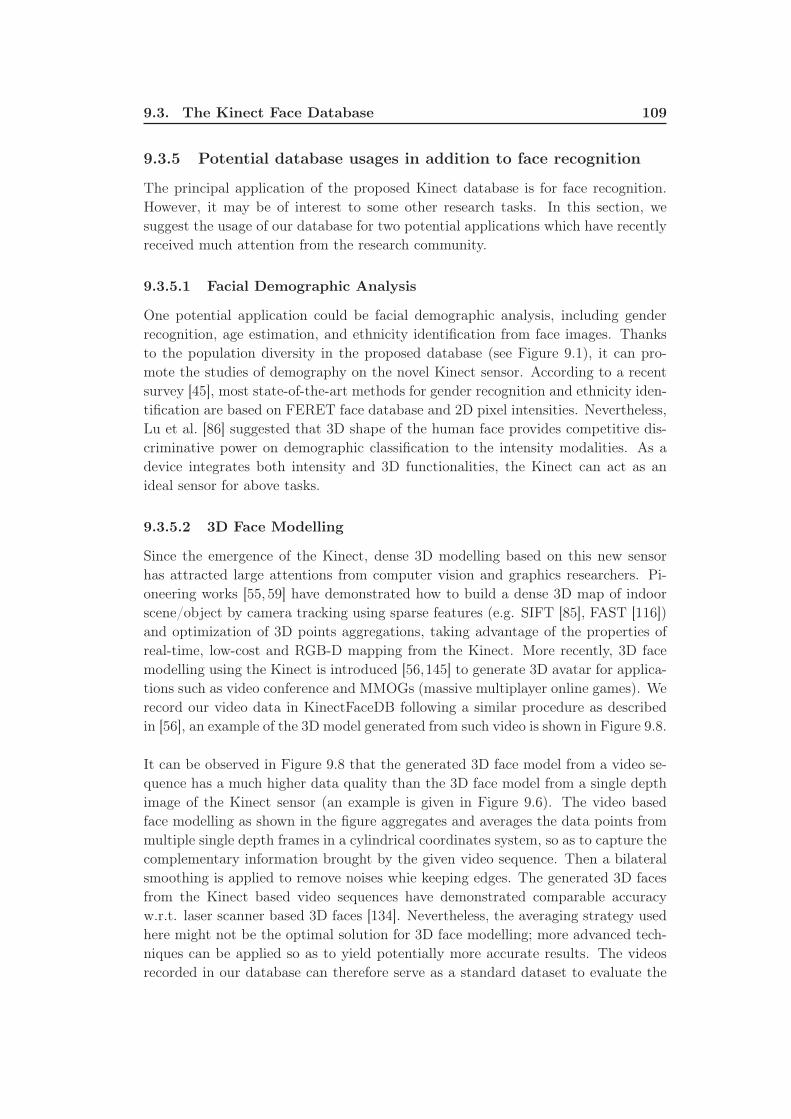
9.3. The Kinect Face Database 109
9.3.5 Potential database usages in addition to face recognition
The principal application of the proposed Kinect database is for face recognition.
However, it may be of interest to some other research tasks. In this section, we
suggest the usage of our database for two potential applications which have recently
received much attention from the research community.
9.3.5.1 Facial Demographic Analysis
One potential application could be facial demographic analysis, including gender
recognition, age estimation, and ethnicity identification from face images. Thanks
to the population diversity in the proposed database (see Figure 9.1), it can pro-
mote the studies of demography on the novel Kinect sensor. According to a recent
survey [45], most state-of-the-art methods for gender recognition and ethnicity iden-
tification are based on FERET face database and 2D pixel intensities. Nevertheless,
Lu et al. [86] suggested that 3D shape of the human face provides competitive dis-
criminative power on demographic classification to the intensity modalities. As a
device integrates both intensity and 3D functionalities, the Kinect can act as an
ideal sensor for above tasks.
9.3.5.2 3D Face Modelling
Since the emergence of the Kinect, dense 3D modelling based on this new sensor
has attracted large attentions from computer vision and graphics researchers. Pi-
oneering works [55, 59] have demonstrated how to build a dense 3D map of indoor
scene/object by camera tracking using sparse features (e.g. SIFT [85], FAST [116])
and optimization of 3D points aggregations, taking advantage of the properties of
real-time, low-cost and RGB-D mapping from the Kinect. More recently, 3D face
modelling using the Kinect is introduced [56,145] to generate 3D avatar for applica-
tions such as video conference and MMOGs (massive multiplayer online games). We
record our video data in KinectFaceDB following a similar procedure as described
in [56], an example of the 3D model generated from such video is shown in Figure 9.8.
It can be observed in Figure 9.8 that the generated 3D face model from a video se-
quence has a much higher data quality than the 3D face model from a single depth
image of the Kinect sensor (an example is given in Figure 9.6). The video based
face modelling as shown in the figure aggregates and averages the data points from
multiple single depth frames in a cylindrical coordinates system, so as to capture the
complementary information brought by the given video sequence. Then a bilateral
smoothing is applied to remove noises whie keeping edges. The generated 3D faces
from the Kinect based video sequences have demonstrated comparable accuracy
w.r.t. laser scanner based 3D faces [134]. Nevertheless, the averaging strategy used
here might not be the optimal solution for 3D face modelling; more advanced tech-
niques can be applied so as to yield potentially more accurate results. The videos
recorded in our database can therefore serve as a standard dataset to evaluate the
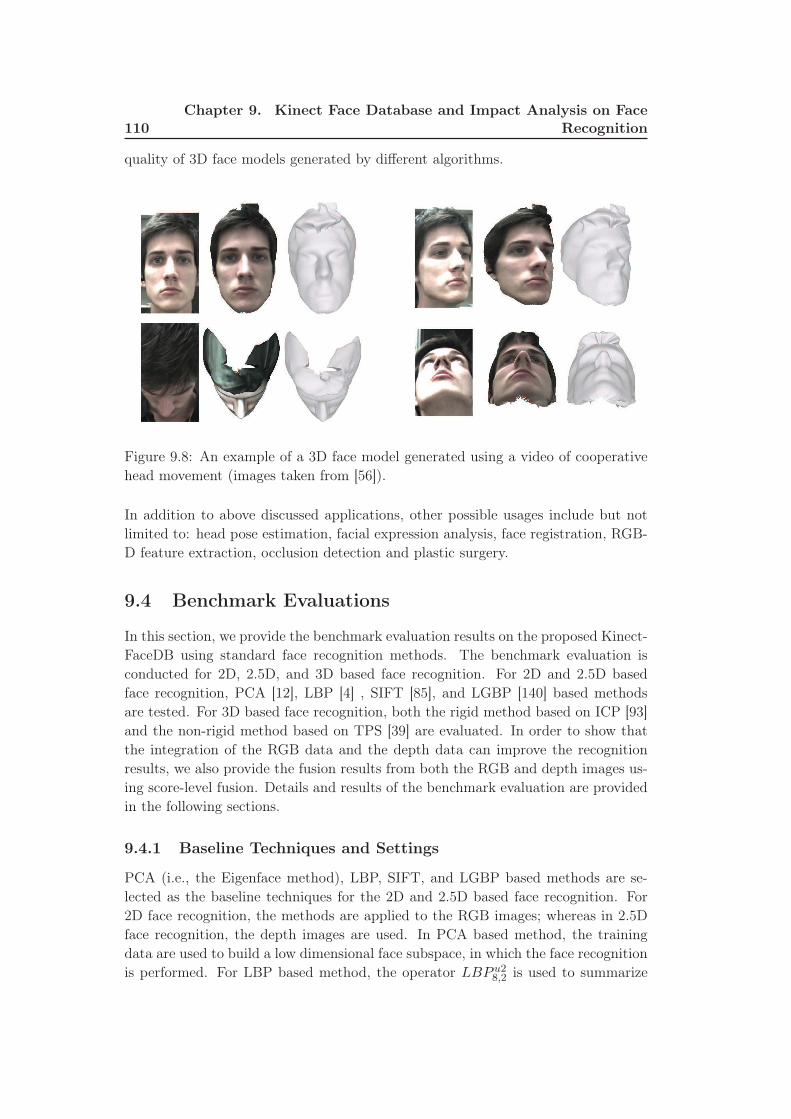
110Chapter 9. Kinect Face Database and Impact Analysis on Face
Recognition
quality of 3D face models generated by different algorithms.
Figure 9.8: An example of a 3D face model generated using a video of cooperative
head movement (images taken from [56]).
In addition to above discussed applications, other possible usages include but not
limited to: head pose estimation, facial expression analysis, face registration, RGB-
D feature extraction, occlusion detection and plastic surgery.
9.4 Benchmark Evaluations
In this section, we provide the benchmark evaluation results on the proposed Kinect-
FaceDB using standard face recognition methods. The benchmark evaluation is
conducted for 2D, 2.5D, and 3D based face recognition. For 2D and 2.5D based
face recognition, PCA [12], LBP [4] , SIFT [85], and LGBP [140] based methods
are tested. For 3D based face recognition, both the rigid method based on ICP [93]
and the non-rigid method based on TPS [39] are evaluated. In order to show that
the integration of the RGB data and the depth data can improve the recognition
results, we also provide the fusion results from both the RGB and depth images us-
ing score-level fusion. Details and results of the benchmark evaluation are provided
in the following sections.
9.4.1 Baseline Techniques and Settings
PCA (i.e., the Eigenface method), LBP, SIFT, and LGBP based methods are se-
lected as the baseline techniques for the 2D and 2.5D based face recognition. For
2D face recognition, the methods are applied to the RGB images; whereas in 2.5D
face recognition, the depth images are used. In PCA based method, the training
data are used to build a low dimensional face subspace, in which the face recognition
is performed. For LBP based method, the operator LBP u28,2 is used to summarize
9.4. Benchmark Evaluations 111
features on 8× 8 blocks. SIFT based method extracts the key points from all train-
ing and testing images, for which the similarity measure is achieved by key points
matching. In LGBP based method, the Gabor features are firstly computed, and
then the LBP operator is applied to extract features on the Gabor filtered images.
The fusion of RGB and depth images are achieved by directly extending the baseline
techniques to use multiple modalities via score-level fusion.
Two representative 3D face alignment techniques (i.e., the ICP based rigid registra-
tion [13], [24] and the TPS based non-rigid registration [36]) are used in 3D face
recognition. In the ICP based method [93] , the volume difference based on Eu-
clidean distance between two 3D meshes are computed as the dissimilarity measure
in face recognition after the rigid alignment by ICP. For TPS based method, we
tested the method proposed in [39] (which is the baseline method in the European
project Tabula Rasa (EU FP7) [111]), that computes the warping parameters (WPs)
based on the non-rigid TPS alignment after the rigid ICP-registration. The final
face representation of the TPS based method thus can be regarded as the deviations
of a 3D face from a common geometric structure. Distances between the WPs of
the probe face and the pre-calculated WPs of the gallery faces are computed for
identification/verification by taking the mean cosine distance.
9.4.2 Pre-processing
Because the RGB data and the depth data in our KinectFaceDB are already aligned,
given the facial landmarks, face cropping and normalization can be easily accom-
plished. Using the eye coordinates, we cropped, normalized, and down-sampled the
2D and 2.5D faces into 96× 96 dimensions.
The 3D face cropping is achieved by preserving the vertices in a sphere with the
radius of 100mm, which are centred at 20mm away from the nose tip in the +z
direction. Afterwards, spikes are removed by thresholding and a hole filling proce-
dure is applied (the holes and spikes are interpolated linearly to form a complete
mesh, the values to fill holes and spikes are estimated by taking the mean of valid
pixels in the neighbourhood of a 5 × 5 patch). Finally, a bilateral smoothing filter
is employed to remove the white noises while preserving the edges (the example of
pre-processed 3D face from the Kinect can be found in Figure 9.6).
9.4.3 Evaluation Protocol
We consider both the identification and verification modes in the benchmark eval-
uation. In both modes, we use the neutral faces from session 1 as the gallery face.
Recognition results of each variation (except for the left/right profiles, since sophis-
ticated face alignment is needed in both the 2D and 2.5D based recognition under
large pose variations) from both session 1 and session 2 are calculated. Then the
overall identification/verification rates are reported for all tested facial variations in
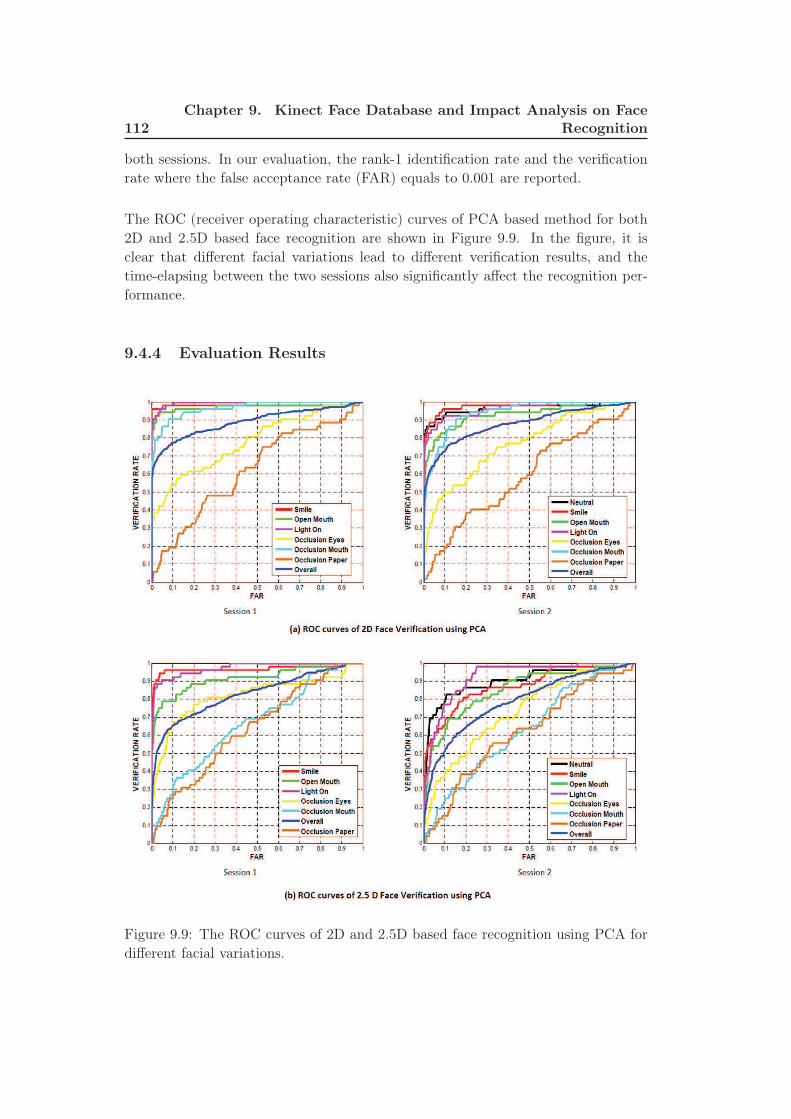
112Chapter 9. Kinect Face Database and Impact Analysis on Face
Recognition
both sessions. In our evaluation, the rank-1 identification rate and the verification
rate where the false acceptance rate (FAR) equals to 0.001 are reported.
The ROC (receiver operating characteristic) curves of PCA based method for both
2D and 2.5D based face recognition are shown in Figure 9.9. In the figure, it is
clear that different facial variations lead to different verification results, and the
time-elapsing between the two sessions also significantly affect the recognition per-
formance.
9.4.4 Evaluation Results
Figure 9.9: The ROC curves of 2D and 2.5D based face recognition using PCA for
different facial variations.
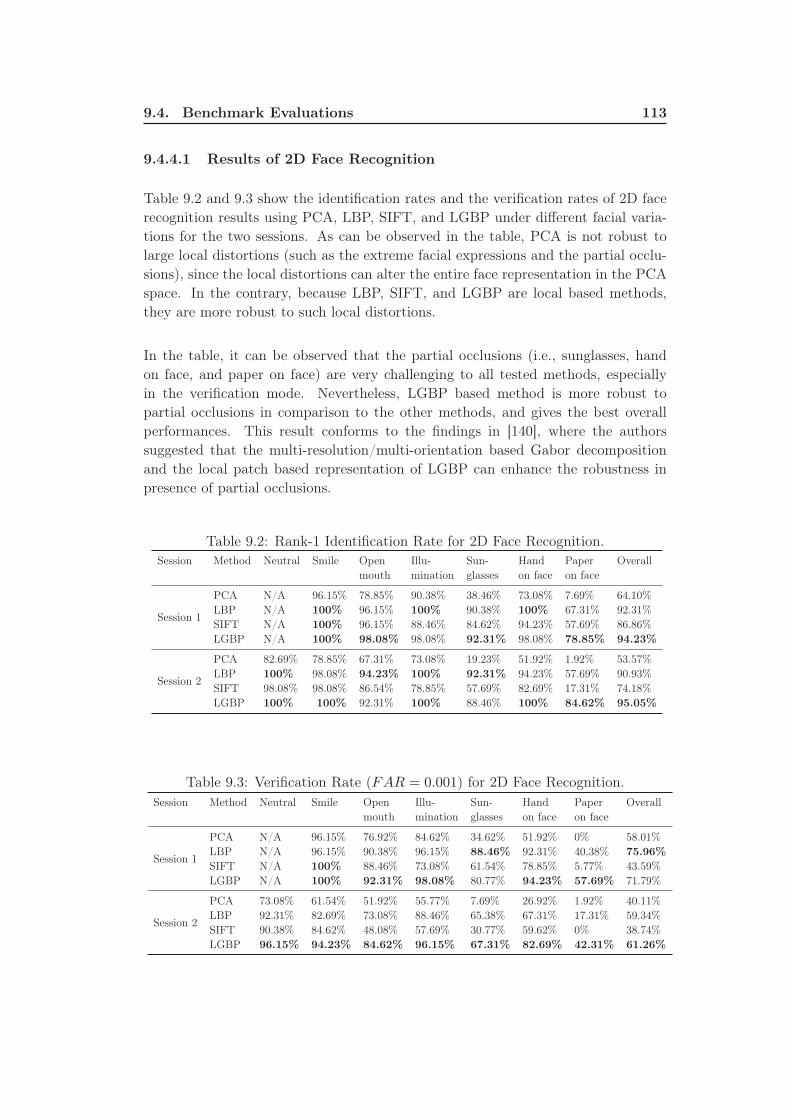
9.4. Benchmark Evaluations 113
9.4.4.1 Results of 2D Face Recognition
Table 9.2 and 9.3 show the identification rates and the verification rates of 2D face
recognition results using PCA, LBP, SIFT, and LGBP under different facial varia-
tions for the two sessions. As can be observed in the table, PCA is not robust to
large local distortions (such as the extreme facial expressions and the partial occlu-
sions), since the local distortions can alter the entire face representation in the PCA
space. In the contrary, because LBP, SIFT, and LGBP are local based methods,
they are more robust to such local distortions.
In the table, it can be observed that the partial occlusions (i.e., sunglasses, hand
on face, and paper on face) are very challenging to all tested methods, especially
in the verification mode. Nevertheless, LGBP based method is more robust to
partial occlusions in comparison to the other methods, and gives the best overall
performances. This result conforms to the findings in [140], where the authors
suggested that the multi-resolution/multi-orientation based Gabor decomposition
and the local patch based representation of LGBP can enhance the robustness in
presence of partial occlusions.
Table 9.2: Rank-1 Identification Rate for 2D Face Recognition.
Session Method Neutral Smile Open Illu- Sun- Hand Paper Overall
mouth mination glasses on face on face
Session 1
PCA N/A 96.15% 78.85% 90.38% 38.46% 73.08% 7.69% 64.10%
LBP N/A 100% 96.15% 100% 90.38% 100% 67.31% 92.31%
SIFT N/A 100% 96.15% 88.46% 84.62% 94.23% 57.69% 86.86%
LGBP N/A 100% 98.08% 98.08% 92.31% 98.08% 78.85% 94.23%
Session 2
PCA 82.69% 78.85% 67.31% 73.08% 19.23% 51.92% 1.92% 53.57%
LBP 100% 98.08% 94.23% 100% 92.31% 94.23% 57.69% 90.93%
SIFT 98.08% 98.08% 86.54% 78.85% 57.69% 82.69% 17.31% 74.18%
LGBP 100% 100% 92.31% 100% 88.46% 100% 84.62% 95.05%
Table 9.3: Verification Rate (FAR = 0.001) for 2D Face Recognition.
Session Method Neutral Smile Open Illu- Sun- Hand Paper Overall
mouth mination glasses on face on face
Session 1
PCA N/A 96.15% 76.92% 84.62% 34.62% 51.92% 0% 58.01%
LBP N/A 96.15% 90.38% 96.15% 88.46% 92.31% 40.38% 75.96%
SIFT N/A 100% 88.46% 73.08% 61.54% 78.85% 5.77% 43.59%
LGBP N/A 100% 92.31% 98.08% 80.77% 94.23% 57.69% 71.79%
Session 2
PCA 73.08% 61.54% 51.92% 55.77% 7.69% 26.92% 1.92% 40.11%
LBP 92.31% 82.69% 73.08% 88.46% 65.38% 67.31% 17.31% 59.34%
SIFT 90.38% 84.62% 48.08% 57.69% 30.77% 59.62% 0% 38.74%
LGBP 96.15% 94.23% 84.62% 96.15% 67.31% 82.69% 42.31% 61.26%
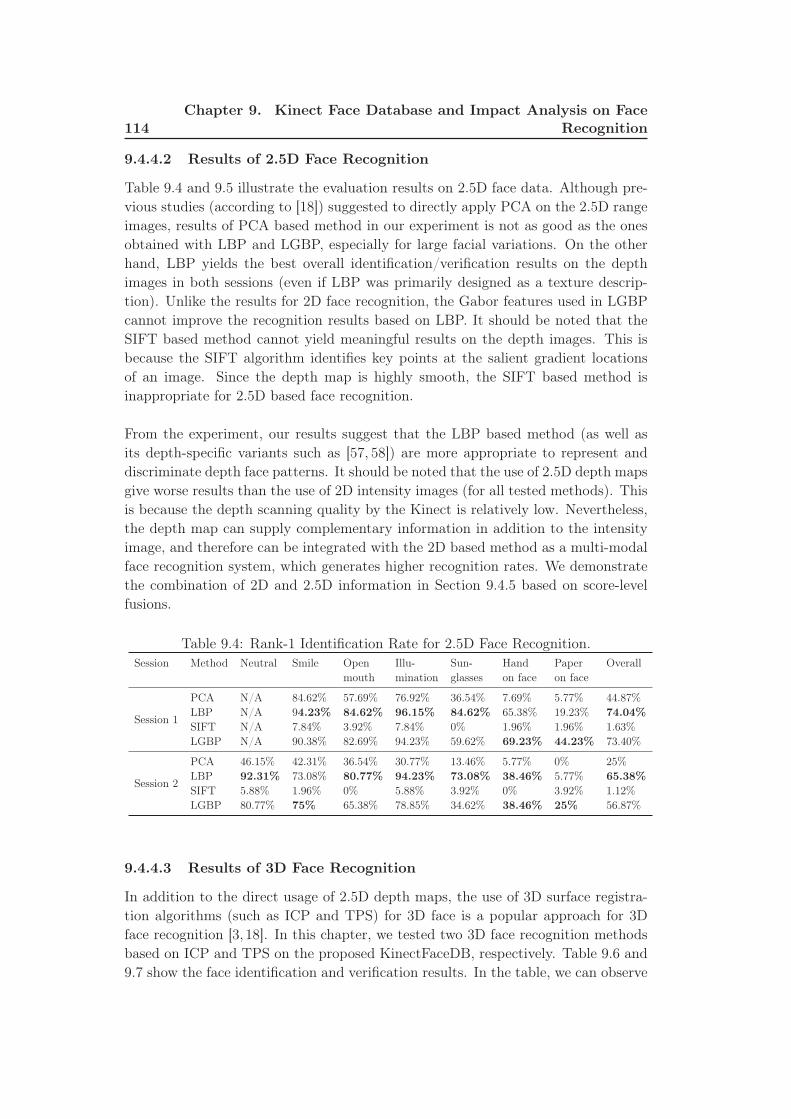
114Chapter 9. Kinect Face Database and Impact Analysis on Face
Recognition
9.4.4.2 Results of 2.5D Face Recognition
Table 9.4 and 9.5 illustrate the evaluation results on 2.5D face data. Although pre-
vious studies (according to [18]) suggested to directly apply PCA on the 2.5D range
images, results of PCA based method in our experiment is not as good as the ones
obtained with LBP and LGBP, especially for large facial variations. On the other
hand, LBP yields the best overall identification/verification results on the depth
images in both sessions (even if LBP was primarily designed as a texture descrip-
tion). Unlike the results for 2D face recognition, the Gabor features used in LGBP
cannot improve the recognition results based on LBP. It should be noted that the
SIFT based method cannot yield meaningful results on the depth images. This is
because the SIFT algorithm identifies key points at the salient gradient locations
of an image. Since the depth map is highly smooth, the SIFT based method is
inappropriate for 2.5D based face recognition.
From the experiment, our results suggest that the LBP based method (as well as
its depth-specific variants such as [57, 58]) are more appropriate to represent and
discriminate depth face patterns. It should be noted that the use of 2.5D depth maps
give worse results than the use of 2D intensity images (for all tested methods). This
is because the depth scanning quality by the Kinect is relatively low. Nevertheless,
the depth map can supply complementary information in addition to the intensity
image, and therefore can be integrated with the 2D based method as a multi-modal
face recognition system, which generates higher recognition rates. We demonstrate
the combination of 2D and 2.5D information in Section 9.4.5 based on score-level
fusions.
Table 9.4: Rank-1 Identification Rate for 2.5D Face Recognition.
Session Method Neutral Smile Open Illu- Sun- Hand Paper Overall
mouth mination glasses on face on face
Session 1
PCA N/A 84.62% 57.69% 76.92% 36.54% 7.69% 5.77% 44.87%
LBP N/A 94.23% 84.62% 96.15% 84.62% 65.38% 19.23% 74.04%
SIFT N/A 7.84% 3.92% 7.84% 0% 1.96% 1.96% 1.63%
LGBP N/A 90.38% 82.69% 94.23% 59.62% 69.23% 44.23% 73.40%
Session 2
PCA 46.15% 42.31% 36.54% 30.77% 13.46% 5.77% 0% 25%
LBP 92.31% 73.08% 80.77% 94.23% 73.08% 38.46% 5.77% 65.38%
SIFT 5.88% 1.96% 0% 5.88% 3.92% 0% 3.92% 1.12%
LGBP 80.77% 75% 65.38% 78.85% 34.62% 38.46% 25% 56.87%
9.4.4.3 Results of 3D Face Recognition
In addition to the direct usage of 2.5D depth maps, the use of 3D surface registra-
tion algorithms (such as ICP and TPS) for 3D face is a popular approach for 3D
face recognition [3, 18]. In this chapter, we tested two 3D face recognition methods
based on ICP and TPS on the proposed KinectFaceDB, respectively. Table 9.6 and
9.7 show the face identification and verification results. In the table, we can observe
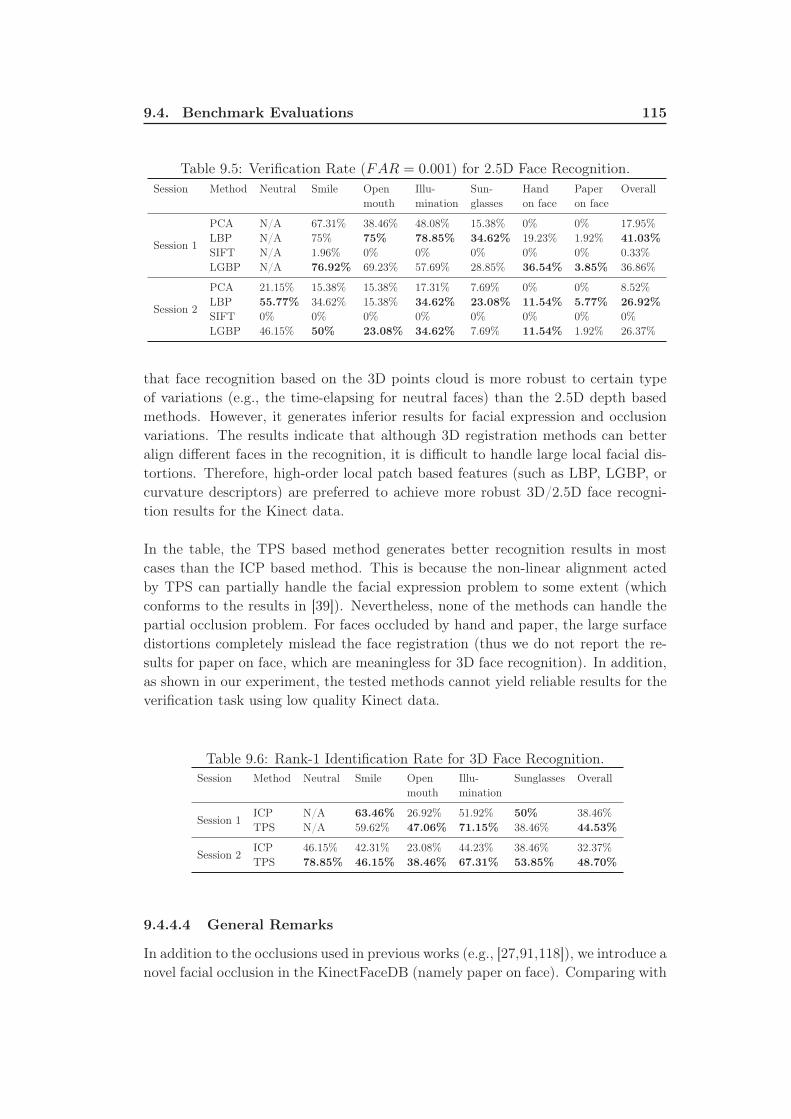
9.4. Benchmark Evaluations 115
Table 9.5: Verification Rate (FAR = 0.001) for 2.5D Face Recognition.
Session Method Neutral Smile Open Illu- Sun- Hand Paper Overall
mouth mination glasses on face on face
Session 1
PCA N/A 67.31% 38.46% 48.08% 15.38% 0% 0% 17.95%
LBP N/A 75% 75% 78.85% 34.62% 19.23% 1.92% 41.03%
SIFT N/A 1.96% 0% 0% 0% 0% 0% 0.33%
LGBP N/A 76.92% 69.23% 57.69% 28.85% 36.54% 3.85% 36.86%
Session 2
PCA 21.15% 15.38% 15.38% 17.31% 7.69% 0% 0% 8.52%
LBP 55.77% 34.62% 15.38% 34.62% 23.08% 11.54% 5.77% 26.92%
SIFT 0% 0% 0% 0% 0% 0% 0% 0%
LGBP 46.15% 50% 23.08% 34.62% 7.69% 11.54% 1.92% 26.37%
that face recognition based on the 3D points cloud is more robust to certain type
of variations (e.g., the time-elapsing for neutral faces) than the 2.5D depth based
methods. However, it generates inferior results for facial expression and occlusion
variations. The results indicate that although 3D registration methods can better
align different faces in the recognition, it is difficult to handle large local facial dis-
tortions. Therefore, high-order local patch based features (such as LBP, LGBP, or
curvature descriptors) are preferred to achieve more robust 3D/2.5D face recogni-
tion results for the Kinect data.
In the table, the TPS based method generates better recognition results in most
cases than the ICP based method. This is because the non-linear alignment acted
by TPS can partially handle the facial expression problem to some extent (which
conforms to the results in [39]). Nevertheless, none of the methods can handle the
partial occlusion problem. For faces occluded by hand and paper, the large surface
distortions completely mislead the face registration (thus we do not report the re-
sults for paper on face, which are meaningless for 3D face recognition). In addition,
as shown in our experiment, the tested methods cannot yield reliable results for the
verification task using low quality Kinect data.
Table 9.6: Rank-1 Identification Rate for 3D Face Recognition.
Session Method Neutral Smile Open Illu- Sunglasses Overall
mouth mination
Session 1ICP N/A 63.46% 26.92% 51.92% 50% 38.46%
TPS N/A 59.62% 47.06% 71.15% 38.46% 44.53%
Session 2ICP 46.15% 42.31% 23.08% 44.23% 38.46% 32.37%
TPS 78.85% 46.15% 38.46% 67.31% 53.85% 48.70%
9.4.4.4 General Remarks
In addition to the occlusions used in previous works (e.g., [27,91,118]), we introduce a
novel facial occlusion in the KinectFaceDB (namely paper on face). Comparing with
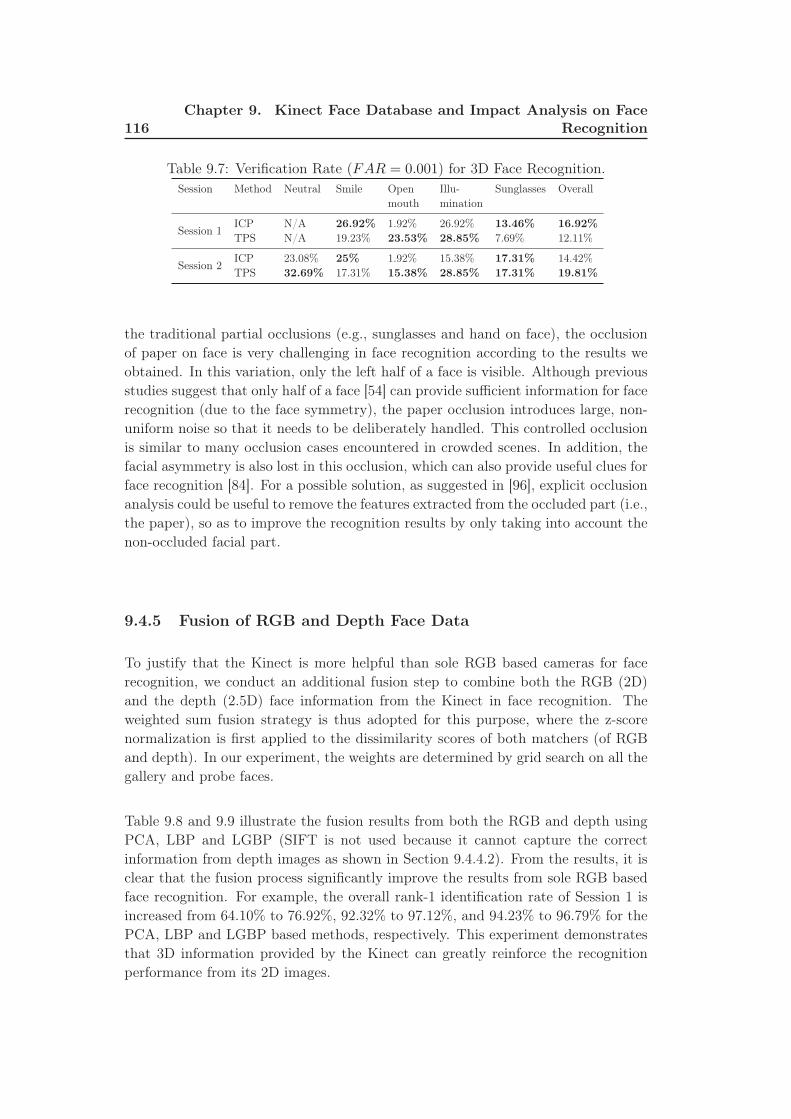
116Chapter 9. Kinect Face Database and Impact Analysis on Face
Recognition
Table 9.7: Verification Rate (FAR = 0.001) for 3D Face Recognition.
Session Method Neutral Smile Open Illu- Sunglasses Overall
mouth mination
Session 1ICP N/A 26.92% 1.92% 26.92% 13.46% 16.92%
TPS N/A 19.23% 23.53% 28.85% 7.69% 12.11%
Session 2ICP 23.08% 25% 1.92% 15.38% 17.31% 14.42%
TPS 32.69% 17.31% 15.38% 28.85% 17.31% 19.81%
the traditional partial occlusions (e.g., sunglasses and hand on face), the occlusion
of paper on face is very challenging in face recognition according to the results we
obtained. In this variation, only the left half of a face is visible. Although previous
studies suggest that only half of a face [54] can provide sufficient information for face
recognition (due to the face symmetry), the paper occlusion introduces large, non-
uniform noise so that it needs to be deliberately handled. This controlled occlusion
is similar to many occlusion cases encountered in crowded scenes. In addition, the
facial asymmetry is also lost in this occlusion, which can also provide useful clues for
face recognition [84]. For a possible solution, as suggested in [96], explicit occlusion
analysis could be useful to remove the features extracted from the occluded part (i.e.,
the paper), so as to improve the recognition results by only taking into account the
non-occluded facial part.
9.4.5 Fusion of RGB and Depth Face Data
To justify that the Kinect is more helpful than sole RGB based cameras for face
recognition, we conduct an additional fusion step to combine both the RGB (2D)
and the depth (2.5D) face information from the Kinect in face recognition. The
weighted sum fusion strategy is thus adopted for this purpose, where the z-score
normalization is first applied to the dissimilarity scores of both matchers (of RGB
and depth). In our experiment, the weights are determined by grid search on all the
gallery and probe faces.
Table 9.8 and 9.9 illustrate the fusion results from both the RGB and depth using
PCA, LBP and LGBP (SIFT is not used because it cannot capture the correct
information from depth images as shown in Section 9.4.4.2). From the results, it is
clear that the fusion process significantly improve the results from sole RGB based
face recognition. For example, the overall rank-1 identification rate of Session 1 is
increased from 64.10% to 76.92%, 92.32% to 97.12%, and 94.23% to 96.79% for the
PCA, LBP and LGBP based methods, respectively. This experiment demonstrates
that 3D information provided by the Kinect can greatly reinforce the recognition
performance from its 2D images.
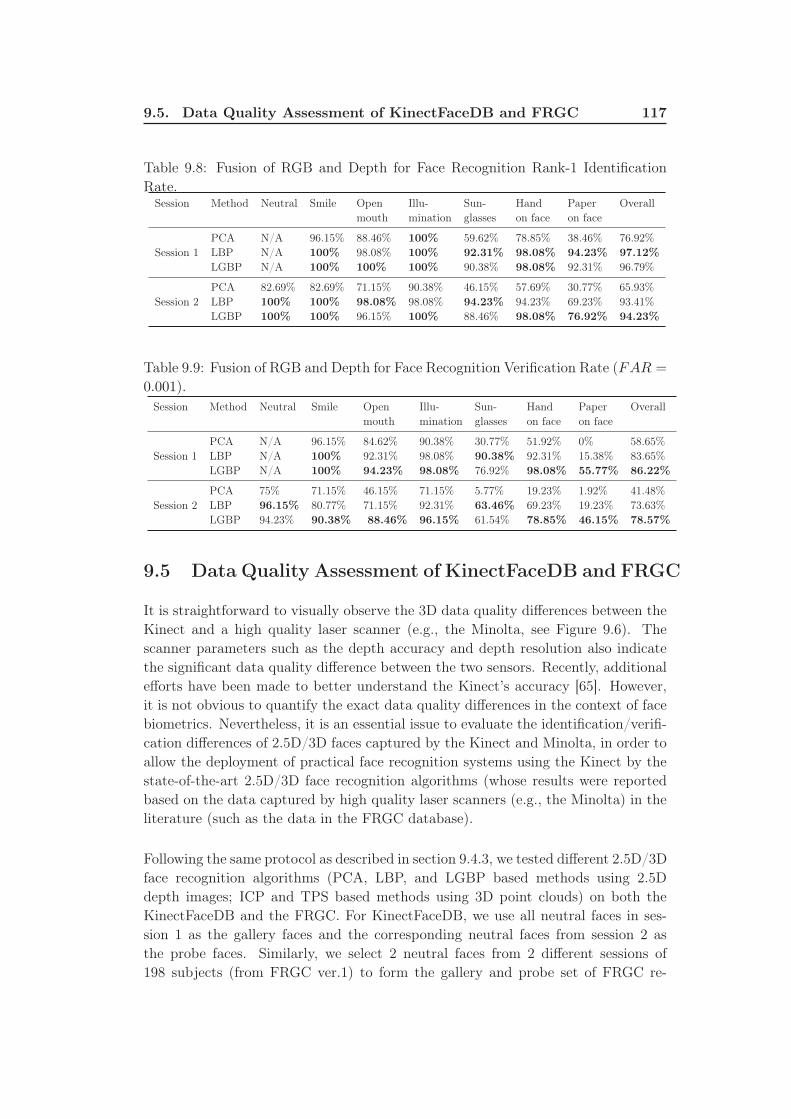
9.5. Data Quality Assessment of KinectFaceDB and FRGC 117
Table 9.8: Fusion of RGB and Depth for Face Recognition Rank-1 Identification
Rate.Session Method Neutral Smile Open Illu- Sun- Hand Paper Overall
mouth mination glasses on face on face
Session 1
PCA N/A 96.15% 88.46% 100% 59.62% 78.85% 38.46% 76.92%
LBP N/A 100% 98.08% 100% 92.31% 98.08% 94.23% 97.12%
LGBP N/A 100% 100% 100% 90.38% 98.08% 92.31% 96.79%
Session 2
PCA 82.69% 82.69% 71.15% 90.38% 46.15% 57.69% 30.77% 65.93%
LBP 100% 100% 98.08% 98.08% 94.23% 94.23% 69.23% 93.41%
LGBP 100% 100% 96.15% 100% 88.46% 98.08% 76.92% 94.23%
Table 9.9: Fusion of RGB and Depth for Face Recognition Verification Rate (FAR =
0.001).
Session Method Neutral Smile Open Illu- Sun- Hand Paper Overall
mouth mination glasses on face on face
Session 1
PCA N/A 96.15% 84.62% 90.38% 30.77% 51.92% 0% 58.65%
LBP N/A 100% 92.31% 98.08% 90.38% 92.31% 15.38% 83.65%
LGBP N/A 100% 94.23% 98.08% 76.92% 98.08% 55.77% 86.22%
Session 2
PCA 75% 71.15% 46.15% 71.15% 5.77% 19.23% 1.92% 41.48%
LBP 96.15% 80.77% 71.15% 92.31% 63.46% 69.23% 19.23% 73.63%
LGBP 94.23% 90.38% 88.46% 96.15% 61.54% 78.85% 46.15% 78.57%
9.5 Data Quality Assessment of KinectFaceDB and FRGC
It is straightforward to visually observe the 3D data quality differences between the
Kinect and a high quality laser scanner (e.g., the Minolta, see Figure 9.6). The
scanner parameters such as the depth accuracy and depth resolution also indicate
the significant data quality difference between the two sensors. Recently, additional
efforts have been made to better understand the Kinect’s accuracy [65]. However,
it is not obvious to quantify the exact data quality differences in the context of face
biometrics. Nevertheless, it is an essential issue to evaluate the identification/verifi-
cation differences of 2.5D/3D faces captured by the Kinect and Minolta, in order to
allow the deployment of practical face recognition systems using the Kinect by the
state-of-the-art 2.5D/3D face recognition algorithms (whose results were reported
based on the data captured by high quality laser scanners (e.g., the Minolta) in the
literature (such as the data in the FRGC database).
Following the same protocol as described in section 9.4.3, we tested different 2.5D/3D
face recognition algorithms (PCA, LBP, and LGBP based methods using 2.5D
depth images; ICP and TPS based methods using 3D point clouds) on both the
KinectFaceDB and the FRGC. For KinectFaceDB, we use all neutral faces in ses-
sion 1 as the gallery faces and the corresponding neutral faces from session 2 as
the probe faces. Similarly, we select 2 neutral faces from 2 different sessions of
198 subjects (from FRGC ver.1) to form the gallery and probe set of FRGC re-
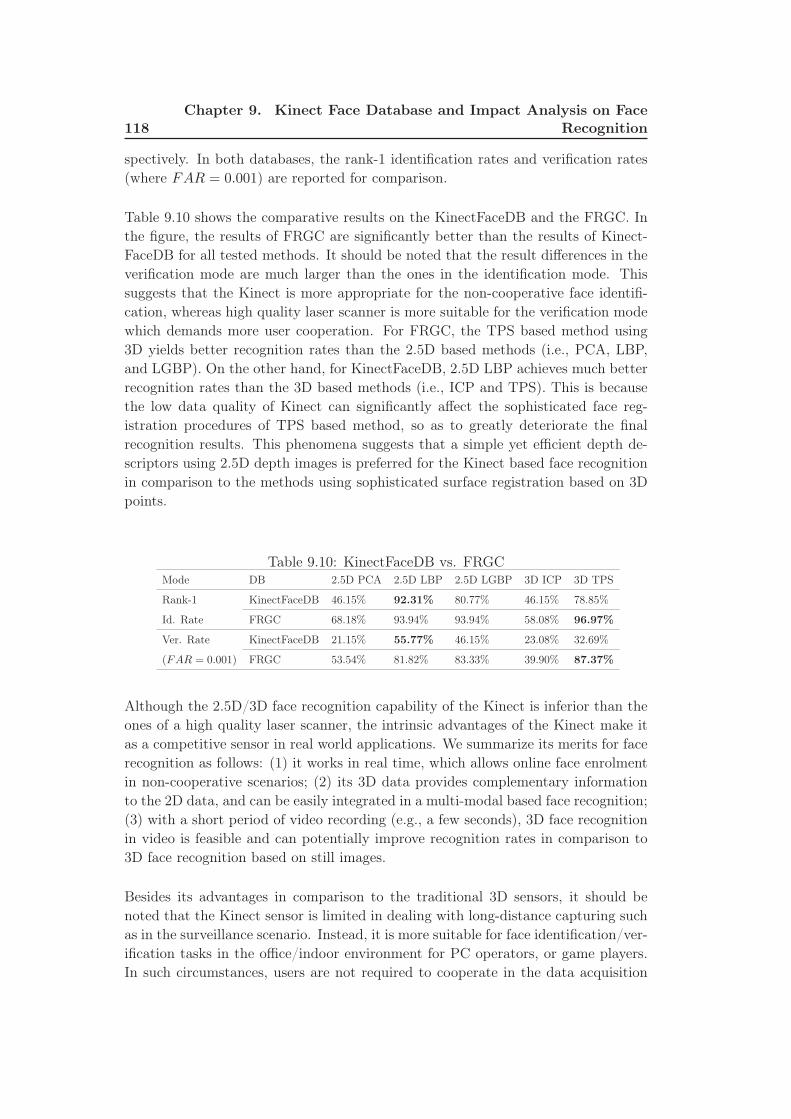
118Chapter 9. Kinect Face Database and Impact Analysis on Face
Recognition
spectively. In both databases, the rank-1 identification rates and verification rates
(where FAR = 0.001) are reported for comparison.
Table 9.10 shows the comparative results on the KinectFaceDB and the FRGC. In
the figure, the results of FRGC are significantly better than the results of Kinect-
FaceDB for all tested methods. It should be noted that the result differences in the
verification mode are much larger than the ones in the identification mode. This
suggests that the Kinect is more appropriate for the non-cooperative face identifi-
cation, whereas high quality laser scanner is more suitable for the verification mode
which demands more user cooperation. For FRGC, the TPS based method using
3D yields better recognition rates than the 2.5D based methods (i.e., PCA, LBP,
and LGBP). On the other hand, for KinectFaceDB, 2.5D LBP achieves much better
recognition rates than the 3D based methods (i.e., ICP and TPS). This is because
the low data quality of Kinect can significantly affect the sophisticated face reg-
istration procedures of TPS based method, so as to greatly deteriorate the final
recognition results. This phenomena suggests that a simple yet efficient depth de-
scriptors using 2.5D depth images is preferred for the Kinect based face recognition
in comparison to the methods using sophisticated surface registration based on 3D
points.
Table 9.10: KinectFaceDB vs. FRGCMode DB 2.5D PCA 2.5D LBP 2.5D LGBP 3D ICP 3D TPS
Rank-1 KinectFaceDB 46.15% 92.31% 80.77% 46.15% 78.85%
Id. Rate FRGC 68.18% 93.94% 93.94% 58.08% 96.97%
Ver. Rate KinectFaceDB 21.15% 55.77% 46.15% 23.08% 32.69%
(FAR = 0.001) FRGC 53.54% 81.82% 83.33% 39.90% 87.37%
Although the 2.5D/3D face recognition capability of the Kinect is inferior than the
ones of a high quality laser scanner, the intrinsic advantages of the Kinect make it
as a competitive sensor in real world applications. We summarize its merits for face
recognition as follows: (1) it works in real time, which allows online face enrolment
in non-cooperative scenarios; (2) its 3D data provides complementary information
to the 2D data, and can be easily integrated in a multi-modal based face recognition;
(3) with a short period of video recording (e.g., a few seconds), 3D face recognition
in video is feasible and can potentially improve recognition rates in comparison to
3D face recognition based on still images.
Besides its advantages in comparison to the traditional 3D sensors, it should be
noted that the Kinect sensor is limited in dealing with long-distance capturing such
as in the surveillance scenario. Instead, it is more suitable for face identification/ver-
ification tasks in the office/indoor environment for PC operators, or game players.
In such circumstances, users are not required to cooperate in the data acquisition
9.6. Conclusion 119
procedure. On the other hand, traditional 3D laser scanners (which cannot handle
long-distance capturing too) require the user to cooperate in the capturing proce-
dure for several seconds.
With the increasing interests on the Kinect sensor, we suggest that newly devel-
oped 2.5D/3D or 2D+3D face recognition algorithms should not only be tested
on databases with high quality scans (such as the FRGC database), but also on
the more challenging KinectFaceDB, so as to make their methods more robust and
reliable in more practical scenarios.
9.6 Conclusion
In this chapter, we presented a complete multi-modal (including well-aligned 2D,
2.5D, 3D and video based face data) face database based on the Kinect sensor.
The database structure and acquisition environment are carefully described. The
processes of how to obtain the well aligned and processed 2D, 2.5D, 3D and video
face data are thoroughly introduced. We highlight the advantages of the proposed
KinectFaceDB (as well as the Kinect based face recognition) via the review of exist-
ing 3D face databases and extensive experimental evaluations. In addition, multiple
potential applications of the proposed KinectFaceDB are also discussed. Standard
face recognition techniques (including PCA, LBP, SIFT, LGBP, ICP, and TPS) are
applied on different data modalities (including 2D, 2.5D, and 3D based face data),
and score-level fusion is conducted to demonstrate the performance gain from the in-
tegration of depth and RGB. Quantitative comparison (in the context of biometrics)
of the proposed KinectFaceDB and the state-of-the-art FRGC database is provided,
which can guide the deployment of existing algorithms and the development of new
face recognition methods toward more practical systems.
To conclude, the proposed KinectFaceDB supplies a standard medium to fill the
gap between traditional face recognition and the emerging Kinect technology. As a
future work, it is necessary to revisit the literature on 3D and 2D+3D face recog-
nition algorithms (which were mostly elaborated with high quality 3D face data)
using the proposed KinectFaceDB for achieving reliable, robust and more practical
face recognition system using the Kinect. The design of new algorithms and new
facial descriptors for the low-quality 3D data is another important topic to inves-
tigate. In addition, 3D face recognition using video data is a new prospect, where
more evaluations will be conducted using the video data from the Kinect in the fu-
ture. Finally, how to efficiently combine (e.g., via fusion, co-training) different data
modalities (RGB, depth and 3D) so as to maximize the exploitation of the Kinect
for face recognition should also be studied.

Chapter 10
Conclusions and Future
Perspectives
10.1 Summary
Although face recognition has been investigated extensively, it still suffers from vari-
ations due to various factors in real-world scenarios. Each day, 3D sensing technolo-
gies advance and the acquisition devices become more accurate and less expensive.
3D face recognition evades illumination and pose problems, however there are still
challenges such as spoofing attacks or disguise variations which affect the perfor-
mances of both 2D and 3D face recognition.
In this thesis, we have investigated spoofing attacks and disguise variations in face
recognition and proposed countermeasure techniques for the protection of face recog-
nition systems against these challenges.
In the first part of the thesis, we have explored the topic of spoofing in face recog-
nition. Spoofing is a very new topic for researchers in face biometrics domain.
Therefore studies on this topic are limited.
It has been shown that face recognition systems are vulnerable to photograph and
video attacks. This is why, countermeasure techniques are necessary to mitigate the
impact of spoofing on face recognition. In Chapter 3, we proposed a countermea-
sure technique, which is based on texture and contrast analysis, for the detection of
photograph attacks.
Compared to 2D spoofing attacks such as photograph and video, 3D mask attacks
to face recognition systems is a considerably new subject. The main reason for the
delay in mask spoofing studies is due to the unavailability of public mask databases.
In Chapter 4, we analyzed the impact of mask attacks on both 2D and 3D face
recognition in detail. For our studies, we used the mask database which is prepared
by MORPHO [98] within the context of the European Union (EU) research project
TABULA RASA [111]. This database includes many high-quality mask samples. In
addition to texture images, it includes 3D scans for both real and mask samples.
Thanks to the nature of this database, we were able to conduct the benchmark
evaluations for both 2D and 3D face recognition. The results show that existing
systems are vulnerable to spoofing attacks. Especially the performance of 3D face
122 Chapter 10. Conclusions and Future Perspectives
recognition systems deteriorate considerably when high quality masks are used for
spoofing purposes.
In Chapter 5, we analyzed several characteristics of masks and real faces such as
texture, reflectance and smoothness characteristics. We developed four different
countermeasure techniques for the detection of mask attacks. All these counter-
measures provide significant detection accuracies alone. However we observed that
fusion of these countermeasures further improves the results. We obtained 99% clas-
sification accuracy for masks and real samples by fusion in this study.
Second challenge for face recognition systems explored in this study is disguise vari-
ations. There are several types of disguise variations such as variations due to facial
cosmetics, plastic surgery, facial alterations, beard, moustache, hair style, aging and
wrinkles. The impact of each of these disguise variations on face recognition sys-
tems is different. In this study, we have explored variations due to facial alterations,
occlusions and facial cosmetics.
In Chapter 6, we show the impact of facial alterations on face recognition. For this
purpose, we prepared a simulated nose alteration database using FRGC v1.0. Then
we evaluated the impact of facial alteration on both 2D and 3D face recognition
and observed that although the performances of both modalities deteriorate, the
performance decrease is more for 3D compared to 2D face recognition.
In Chapter 7, we proposed a new block based face recognition approach which
increases the performance significantly in the existence of nose alterations. The ad-
vantage of this approach is that it can be used for all types of alterations applied on
face. Today, more and more people undergo plastic surgeries not only for medical
reasons but also to improve their appearance or even to hide their true identity. In
order to increase recognition performance in the existance of plastic surgery opera-
tions on face, this proposed block based approach is very beneficial.
Makeup products are within reach of everyone who seeks ways to evade recogni-
tion or for beauty purposes. This is why, in Chapter 8, we analyzed the impact of
makeup on face recognition. For this purpose, we prepared an extensive makeup
database. The impact of makeup on face recognition is analyzed in detail. The
results show that existing recognition systems are vulnerable to facial makeup and
especially makeup on eye region affects recognition performance significantly.
Finally, in the last chapter, in order to establish the connections between the Kinect
sensor and face recognition, the first publicly available face database based on the
Kinect sensor for face recognition is presented. The database consists of differ-
ent data modalities and multiple facial variations such as occlusions, expression,
illumination. We conduct benchmark evaluations on the proposed database using
standard face recognition methods, and demonstrate the performance gain by inte-
10.2. Future Work 123
grating the depth data with the RGB data via score-level fusion. We also compare
the Kinect images with the traditional high quality 3D scans (of the FRGC database)
in the context of face biometrics, which demonstrates the imperative needs of the
proposed database for face recognition.
10.2 Future Work
To start with, spoofing is a very new topic in face recognition domain hence the
number of studies regarding spoofing (including anti-spoofing) is still very limited.
In this thesis, we proposed several countermeasures for the detection of 3D mask
attacks and obtained almost perfect classification accuracy of 99%. The limitation
of our study is that we were able to test the performances of the proposed coun-
termeasures using the masks made from one type of material, which is polychrome
mineral powder. When masks made from different materials are used, we may obtain
different performance accuracies. Our future works are initially, to test the perfor-
mances of the proposed countermeasures using masks made from different materials
in order to observe if we can still obtain satisfactory results, and then to propose
new countermeasures for more challenging mask databases with higher number of
subjects as soon as available.
For our study regarding facial alterations, due to the lack of publicly available 3D
plastic surgery databases, we prepared a simulated nose alteration database in order
to observe the impact of plastic surgery operations on face recognition. As a future
work, our aim is to test the proposed block based face recognition approach, which
was tested for nose alteration in Chapter 7, on a real 3D plastic surgery database.
Furthermore, in our studies, we were able to test the performance of the block based
face recognition approach only in the existance of nose alterations. Our future work
is to test the performance of this technique in the existance of other facial alter-
ations in order to demonstrate that our approach is beneficial for all types of plastic
surgery operations. Although, the proposed approach is robust and provides sig-
nificant recognition performances in the existance of facial alterations, as a future
work, our aim is to propose more robust techniques against facial alterations.
3D face recognition techniques are robust to facial makeup since makeup does not
change the 3D shape. However, our analysis show that facial makeup has a sig-
nificant impact on 2D face recognition performance. Up to now, there have been
studies on the impact analysis of makeup on face recognition, however techniques
which mitigate this impact have not been explored. Our future works are to detect
facial makeup and investigate robust techniques against facial makeup.
Finally, in the last chapter, benchmark evaluations are conducted on the proposed
Kinect face database. As a future work, we want to use this Kinect face database to
develop robust techniques against occlusions. We also plan to use this database for

124 Chapter 10. Conclusions and Future Perspectives
other tests such as gender recognition, the computation of higher quality 3D scans
from video data available in this database.
Chapter 11
Résumé Etendu en Français
1. Introduction
Motivation
La reconnaissance des humains est devenue un sujet important puisque les besoins
et les investissements pour les applications de sécurité augmentent continuellement.
La biométrie permet de définir des systèmes fiable et efficace de gestion de l’identité
à l’aide de l’utilisation de caractéristiques physiques et comportementales des sujets
qui sont permanents, universels et facile d’accès. C’est pourquoi, le thème de la
biométrie attire davantage d’attention de nos jours.
Chaque biométrie a ses propres avantages et inconvénients. Par exemple, la biométrie
d’empreintes digitales est la plus répandue, mais elle requiert une collaboration forte
de l’utilisateur. De même, la reconnaissance de l’iris est très précise, mais elle dépend
fortement de la qualité de l’image et également requiert la participation active des
sujets.
La reconnaissance faciale est avantageuse en termes d’accessibilité et de fiabilité.
Elle permet l’identification pour les sujets non informés qui n’ont pas à coopérer.
Bien que la reconnaissance faciale a été examinée intensivement, elle souffre encore
de variations en raison de divers facteurs dans les scénarios du monde réel.
Dans cette thèse, deux défis en reconnaissance faciale sont analysés à savoir le leur-
rage et le camouflage. Bien que ces défis affectent les performances des systèmes de
la reconnaissance faciale 2D et 3D, les études sur ces sujets sont limitées.
Lors d’une tentative du leurrage, une personne tente de se faire passer pour une autre
personne et par ce moyen, tente d’accéder à un système de reconnaissance. Puisque
les données de visage peuvent être acquis facilement sans contact, le leurrage est une
menace réelle pour les systèmes de reconnaissance faciale. En raison du nombre lim-
ité d’études sur ce sujet, de nos jours, le leurrage (y compris l’anti-leurrage) est un
sujet très populaire pour les chercheurs dans le domaine de la reconnaissance faciale.
Il a été démontré que les systèmes de reconnaissance faciale sont vulnérables à des
attaques de photographie et vidéo. L’objectif est de développer des contremesures
126 Chapter 11. Résumé Etendu en Français
nonintrusives sans dispositifs supplémentaires et sans l’intervention humaine qui
peuvent être intégrés dans les systèmes de reconnaissance faciale existants afin de
les protéger contre les attaques de leurrage.
Par rapport à des attaques du leurrage 2D comme la photographie et la vidéo, les
attaques des systèmes de la reconnaissance faciale à l’aide de masques 3D est un su-
jet nouveau. La principale raison du retard dans les études du leurrage avec masque
est dû à l’indisponibilité des bases de données publiques. La préparation d’une base
de donées de masques est beaucoup plus difficile et plus coûteuse que la prépara-
tion de bases de données de photographies ou vidéo. Initialement, pour préparer
un masque de haute qualité, un scanner 3D est nécessaire pour obtenir le modèle
3D de la personne cible, qui est généralement des dispositifs coûteux. La procédure
se poursuit avec la fabrication des masques qui est également une proédure coûteuse.
Dans cette thèse, la motivation principale est de développer des techniques de contre-
mesures afin de protéger les systèmes de reconnaissance faciale contre les attaques
de leurrage. Pour cette raison, nous avons examiné le leurrage faciale 2D et 3D.
Nous avons d’abord analysé les attaques de leurrage 2D, qui peuvent être réalisées
en utilisant des photographies ou des vidéos. Nous avons proposé une nouvelle
technique de contre-mesure [72] pour la détection des attaques avec photographies.
Cette étude a été notre étude préliminaire dans le domaine du leurrage faciale.
Ensuite, nous avons examiné les attaques avec masque 3D. Nous avons montré les
vulnérabilités des systèmes de reconnaissance faciale 3D et 2D à des attaques avec
masque. Les résultats de cette étude montrent que les systémes de reconnaissance
existants ne sont pas robustes contre les attaques avec masque, et les contre-mesures
doivent être développés pour atténuer l’impact de ces attaques.
Pour cette raison, nous avons analysé plusieurs caractéristiques des masques et des
échantillons du visage réels comme la texture, la reflectance et la continuité, et
nous avons développé plusieurs techniques de contre-mesures. Nous avons égale-
ment intégré la contre-mesure offrant la meilleure performance dans le système de
reconnaissance faciale 3D retenu afin de montrer l’amélioration de la performance
avec la contre-mesure.
Les accessoires de camouflage peuvent être utilisés pour modifier l’apparence d’un
individu, à se faire passer pour une autre personne, ou à cacher son identité. Bien
que la reconnaissance faciale avec des variations de camouflage est un défi majeur,
les études sur ce sujet sont limitées. Dans cette thèse, des variations dues à des
altérations faciale, à du maquillage et à des accessoires faciale sont examinées.
Depuis que la chirurgie plastique est devenue plus avancée et abordable, elle présente
de nouveaux défis pour les systèmes de reconnaissance faciale. Il n’y a pas de base
127
de données en chirurgie plastique 3D accessible au public. Pour cette raison, nous
avons préparé une base de données de modification de nez (2D+3D) simulé, dans
lequel le nez de chaque personne est remplacé par un autre choisi au hasard. Dans
notre étude, nous avons démontré la chute des performances en reconnaissance pour
les deux modalités, en particulier pour la 3D, en présence d’altérations du nez. C’est
pourquoi, ensuite, nous avons proposé une approche en reconnaissance faciale, qui
réduit l’impact des modifications faciale en reconnaissance faciale.
Le maquillage faciale change l’apparence perçue d’un visage peut donc avoir un
impact en reconnaissance faciale. Méme si le maquillage ne change pas les carac-
téristiques de la forme 3D d’un visage, il a un impact sur la reconnaissance faciale 2D.
Afin d’évaluer l’impact en détail, nous présentons une base de données en maquil-
lage, qui comprend de nombreux échantillons annotés comme le non-maquillage, le
maquillage léger et le maquillage appuyé.
Enfin, dans cette thèse, nous présentons une base de données Kinect, qui est la pre-
miére base de données du visage publique acquise par le caméra Kinect. Le capteur
Kinect est moins chere par rapport aux scanners de haute qualité, et offre des per-
formances en reconnaissance significatifs. L’évaluations de référence ont été menées
sur la base de données proposée pour plusieurs variantes comme les occultations,
l’expression et l’éclairage.
Contributions Originales
Les contributions originales de cette thèse peuvent être résumées en huit points:
l’analyse d’impact du leurrage avec masque sur les systèmes existants en reconnais-
sance faciale, plusieurs contre-mesures pour détecter les attaques avec masque et
photographie, une base de données de modification simulée de nez, une approche
robuste de modifications du visage, une vaste base de données du visage des maquil-
lés, une vaste base de données du visage Kinect, et plusieurs évaluations de référence
pour montrer les performances des techniques en utilisant les données Kinect.
Plan
Le plan de la thèse est la suivant:
• Dans le chapitre 2, nous donnons une introduction au leurrage et aux variations
de camouflage et examinons l’état de l’art pour les travaux pertinents.
• Dans le chapitre 3, notre technique de contre-mesure, qui est utilisée pour
protéger les systèmes en reconnaissance faciale contre les attaques avec pho-
tographie, est présentée.
• Dans le chapitre 4, l’impact du leurrage avec masque en reconnaissance faciale
2D et 3D est évaluée.
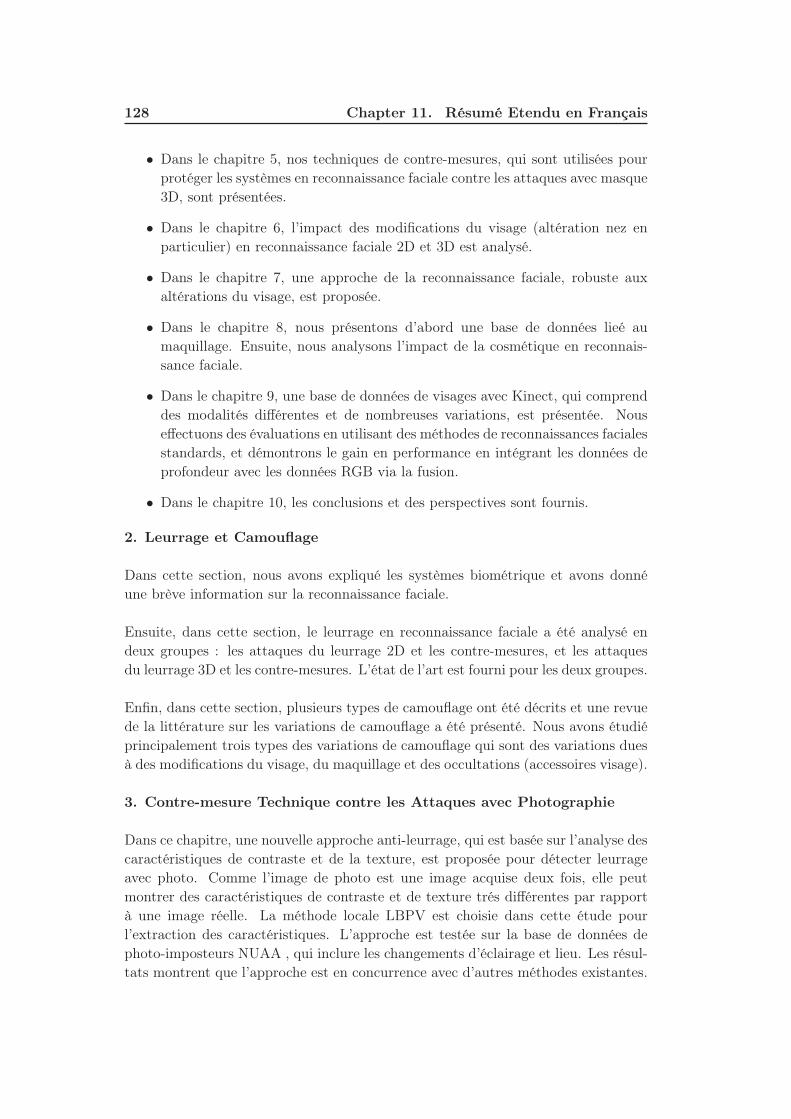
128 Chapter 11. Résumé Etendu en Français
• Dans le chapitre 5, nos techniques de contre-mesures, qui sont utilisées pour
protéger les systèmes en reconnaissance faciale contre les attaques avec masque
3D, sont présentées.
• Dans le chapitre 6, l’impact des modifications du visage (altération nez en
particulier) en reconnaissance faciale 2D et 3D est analysé.
• Dans le chapitre 7, une approche de la reconnaissance faciale, robuste aux
altérations du visage, est proposée.
• Dans le chapitre 8, nous présentons d’abord une base de données lieé au
maquillage. Ensuite, nous analysons l’impact de la cosmétique en reconnais-
sance faciale.
• Dans le chapitre 9, une base de données de visages avec Kinect, qui comprend
des modalités différentes et de nombreuses variations, est présentée. Nous
effectuons des évaluations en utilisant des méthodes de reconnaissances faciales
standards, et démontrons le gain en performance en intégrant les données de
profondeur avec les données RGB via la fusion.
• Dans le chapitre 10, les conclusions et des perspectives sont fournis.
2. Leurrage et Camouflage
Dans cette section, nous avons expliqué les systèmes biométrique et avons donné
une brève information sur la reconnaissance faciale.
Ensuite, dans cette section, le leurrage en reconnaissance faciale a été analysé en
deux groupes : les attaques du leurrage 2D et les contre-mesures, et les attaques
du leurrage 3D et les contre-mesures. L’état de l’art est fourni pour les deux groupes.
Enfin, dans cette section, plusieurs types de camouflage ont été décrits et une revue
de la littérature sur les variations de camouflage a été présenté. Nous avons étudié
principalement trois types des variations de camouflage qui sont des variations dues
à des modifications du visage, du maquillage et des occultations (accessoires visage).
3. Contre-mesure Technique contre les Attaques avec Photographie
Dans ce chapitre, une nouvelle approche anti-leurrage, qui est basée sur l’analyse des
caractéristiques de contraste et de la texture, est proposée pour détecter leurrage
avec photo. Comme l’image de photo est une image acquise deux fois, elle peut
montrer des caractéristiques de contraste et de texture trés différentes par rapport
à une image réelle. La méthode locale LBPV est choisie dans cette étude pour
l’extraction des caractéristiques. L’approche est testée sur la base de données de
photo-imposteurs NUAA , qui inclure les changements d’éclairage et lieu. Les résul-
tats montrent que l’approche est en concurrence avec d’autres méthodes existantes.
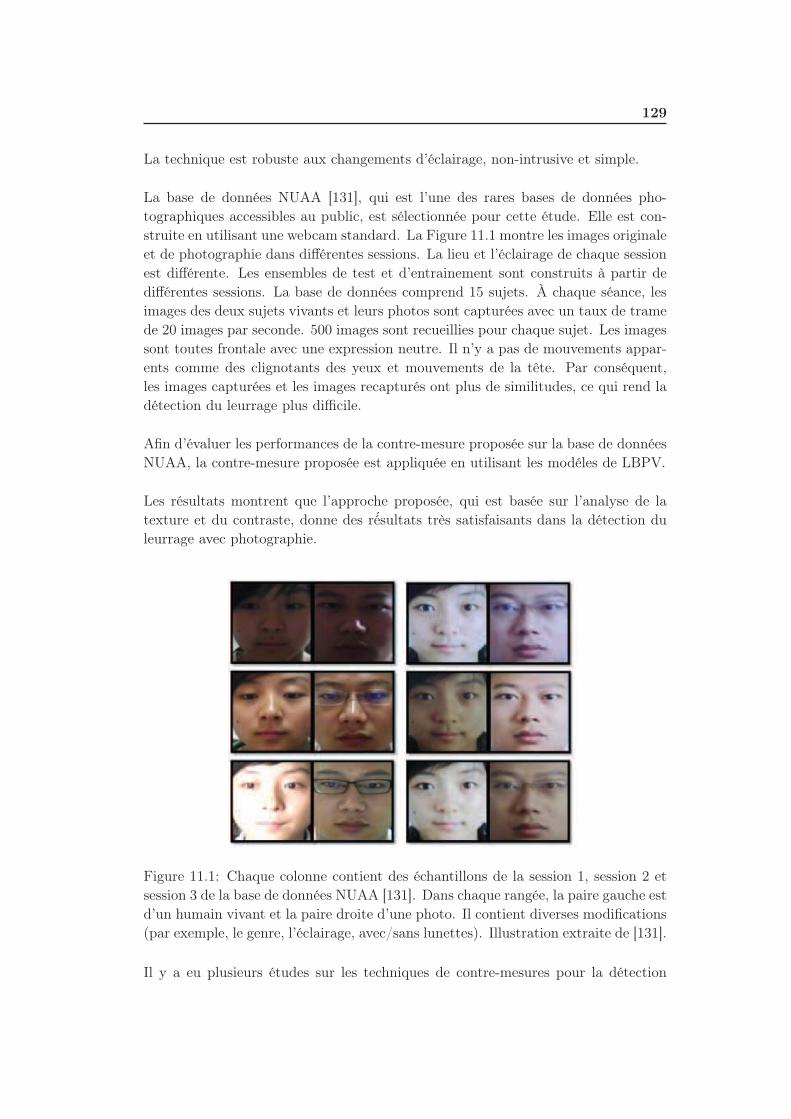
129
La technique est robuste aux changements d’éclairage, non-intrusive et simple.
La base de données NUAA [131], qui est l’une des rares bases de données pho-
tographiques accessibles au public, est sélectionnée pour cette étude. Elle est con-
struite en utilisant une webcam standard. La Figure 11.1 montre les images originale
et de photographie dans différentes sessions. La lieu et l’éclairage de chaque sessionest différente. Les ensembles de test et d’entrainement sont construits à partir dedifférentes sessions. La base de données comprend 15 sujets. À chaque séance, lesimages des deux sujets vivants et leurs photos sont capturées avec un taux de tramede 20 images par seconde. 500 images sont recueillies pour chaque sujet. Les imagessont toutes frontale avec une expression neutre. Il n’y a pas de mouvements appar-ents comme des clignotants des yeux et mouvements de la tête. Par conséquent,les images capturées et les images recapturés ont plus de similitudes, ce qui rend ladétection du leurrage plus difficile.
Afin d’évaluer les performances de la contre-mesure proposée sur la base de donnéesNUAA, la contre-mesure proposée est appliquée en utilisant les modéles de LBPV.
Les résultats montrent que l’approche proposée, qui est basée sur l’analyse de latexture et du contraste, donne des ré́sultats très satisfaisants dans la détection duleurrage avec photographie.
Figure 11.1: Chaque colonne contient des échantillons de la session 1, session 2 etsession 3 de la base de données NUAA [131]. Dans chaque rangée, la paire gauche estd’un humain vivant et la paire droite d’une photo. Il contient diverses modifications(par exemple, le genre, l’éclairage, avec/sans lunettes). Illustration extraite de [131].
Il y a eu plusieurs études sur les techniques de contre-mesures pour la détection
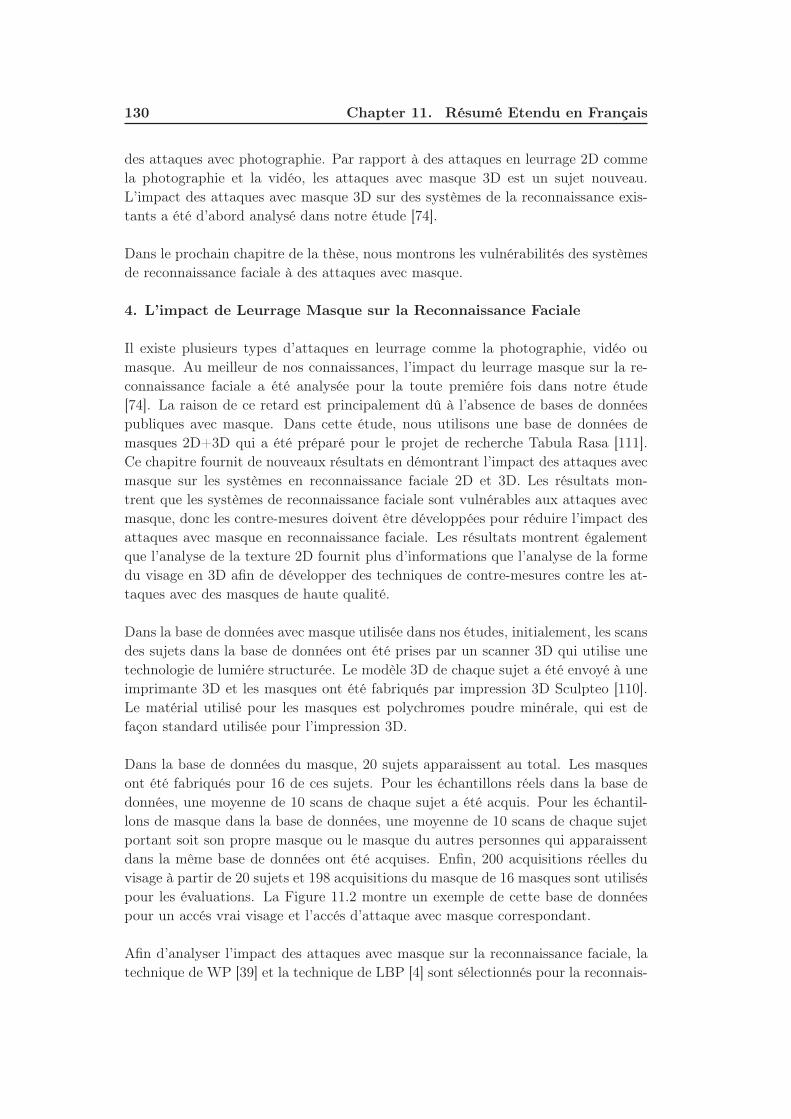
130 Chapter 11. Résumé Etendu en Français
des attaques avec photographie. Par rapport à des attaques en leurrage 2D comme
la photographie et la vidéo, les attaques avec masque 3D est un sujet nouveau.
L’impact des attaques avec masque 3D sur des systèmes de la reconnaissance exis-
tants a été d’abord analysé dans notre étude [74].
Dans le prochain chapitre de la thèse, nous montrons les vulnérabilités des systèmes
de reconnaissance faciale à des attaques avec masque.
4. L’impact de Leurrage Masque sur la Reconnaissance Faciale
Il existe plusieurs types d’attaques en leurrage comme la photographie, vidéo ou
masque. Au meilleur de nos connaissances, l’impact du leurrage masque sur la re-
connaissance faciale a été analysée pour la toute premiére fois dans notre étude
[74]. La raison de ce retard est principalement dû à l’absence de bases de données
publiques avec masque. Dans cette étude, nous utilisons une base de données de
masques 2D+3D qui a été préparé pour le projet de recherche Tabula Rasa [111].
Ce chapitre fournit de nouveaux résultats en démontrant l’impact des attaques avec
masque sur les systèmes en reconnaissance faciale 2D et 3D. Les résultats mon-
trent que les systèmes de reconnaissance faciale sont vulnérables aux attaques avec
masque, donc les contre-mesures doivent être développées pour réduire l’impact des
attaques avec masque en reconnaissance faciale. Les résultats montrent également
que l’analyse de la texture 2D fournit plus d’informations que l’analyse de la forme
du visage en 3D afin de développer des techniques de contre-mesures contre les at-
taques avec des masques de haute qualité.
Dans la base de données avec masque utilisée dans nos études, initialement, les scans
des sujets dans la base de données ont été prises par un scanner 3D qui utilise une
technologie de lumiére structurée. Le modèle 3D de chaque sujet a été envoyé à une
imprimante 3D et les masques ont été fabriqués par impression 3D Sculpteo [110].
Le matérial utilisé pour les masques est polychromes poudre minérale, qui est de
façon standard utilisée pour l’impression 3D.
Dans la base de données du masque, 20 sujets apparaissent au total. Les masques
ont été fabriqués pour 16 de ces sujets. Pour les échantillons réels dans la base de
données, une moyenne de 10 scans de chaque sujet a été acquis. Pour les échantil-
lons de masque dans la base de données, une moyenne de 10 scans de chaque sujet
portant soit son propre masque ou le masque du autres personnes qui apparaissent
dans la même base de données ont été acquises. Enfin, 200 acquisitions réelles du
visage à partir de 20 sujets et 198 acquisitions du masque de 16 masques sont utilisés
pour les évaluations. La Figure 11.2 montre un exemple de cette base de données
pour un accés vrai visage et l’accés d’attaque avec masque correspondant.
Afin d’analyser l’impact des attaques avec masque sur la reconnaissance faciale, la
technique de WP [39] et la technique de LBP [4] sont sélectionnés pour la reconnais-
131
Figure 11.2: L’exemple de la base de données masque qui est créé par MORPHO.De gauche à droite (rangée du haut) Le vrai visage, l’image de texture recadrée,
l’acquisition 3D aprés prétraitement, la carte centrée de profondeur estimée à partir
de l’acquisition brute 3D (rangée du bas) les mêmes images avec l’attaque du masque
correspondante.
sance faciale 3D et 2D, respectivement. L’analyse d’impact en notre étude montre
que:
• Bien que les attaques avec masque ont réussi à leurrer les systémes de recon-
naissance faciale 2D et 3D, le systéme de la reconnaissance faciale 3D est plus
vulnérable à cette attaque par rapport au systéme de reconnaissance faciale
2D.
• Les taux d’erreur égal (EER) du mode de base augmente de 1.8% à 25.1%
pour le systéme de la reconnaissance faciale 3D et de 4.7% à 9.9% pour le
systéme de reconnaissance faciale 2D sous les attaques.
• Les caractéristiques de forme 3D d’un visage réel et l’attaque avec masque cor-
respondant sont plus similaires par rapport à leurs caractéristiques de texture.
Par conséquent, l’analyse de la texture peut révéler plus d’informations pour
détecter les attaques avec masque par rapport à l’analyse de caractéristiques
de forme 3D.
• La robustesse contre leurrage avec masque est observée pour dépendu à la fois
de la méthode et de la modalité.
• Les systémes en reconnaissance faciale sont vulnérables aux attaques de leur-
rage avec masque donc, les contre-mesures sont nécessaires pour réduire leur
impact sur la reconnaissance faciale.
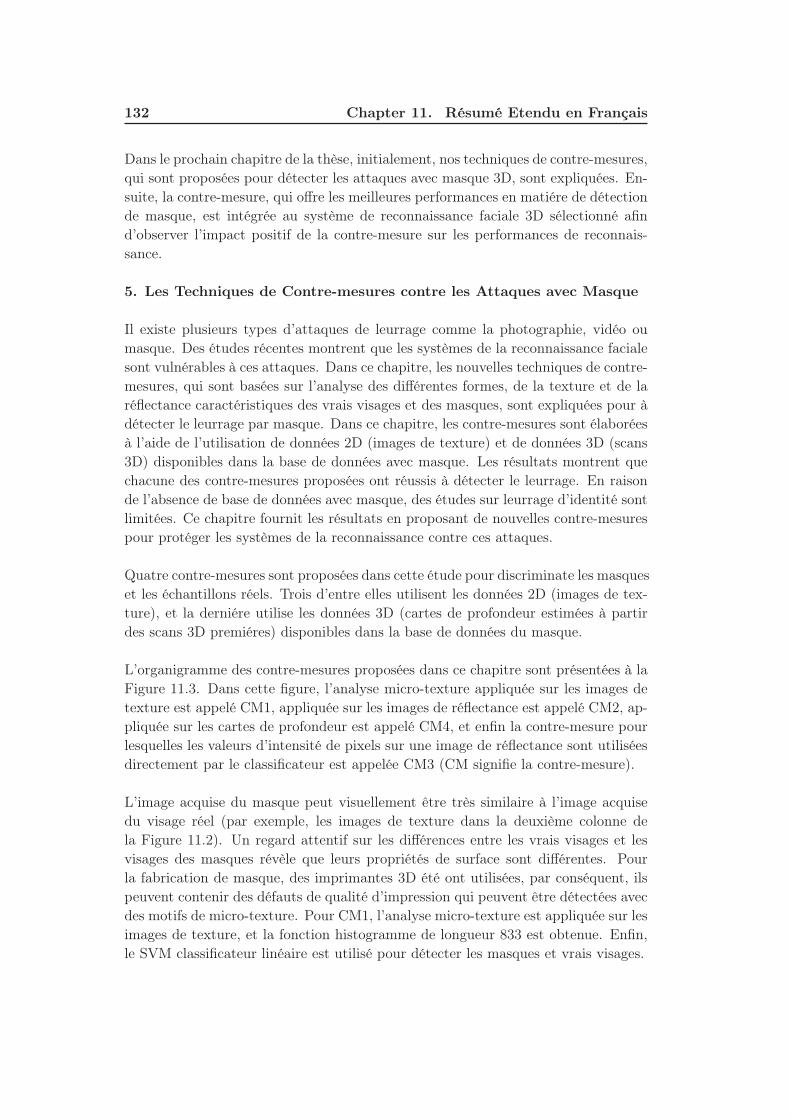
132 Chapter 11. Résumé Etendu en Français
Dans le prochain chapitre de la thèse, initialement, nos techniques de contre-mesures,
qui sont proposées pour détecter les attaques avec masque 3D, sont expliquées. En-
suite, la contre-mesure, qui offre les meilleures performances en matiére de détection
de masque, est intégrée au système de reconnaissance faciale 3D sélectionné afin
d’observer l’impact positif de la contre-mesure sur les performances de reconnais-
sance.
5. Les Techniques de Contre-mesures contre les Attaques avec Masque
Il existe plusieurs types d’attaques de leurrage comme la photographie, vidéo ou
masque. Des études récentes montrent que les systèmes de la reconnaissance faciale
sont vulnérables à ces attaques. Dans ce chapitre, les nouvelles techniques de contre-
mesures, qui sont basées sur l’analyse des différentes formes, de la texture et de la
réflectance caractéristiques des vrais visages et des masques, sont expliquées pour à
détecter le leurrage par masque. Dans ce chapitre, les contre-mesures sont élaborées
à l’aide de l’utilisation de données 2D (images de texture) et de données 3D (scans
3D) disponibles dans la base de données avec masque. Les résultats montrent que
chacune des contre-mesures proposées ont réussis à détecter le leurrage. En raison
de l’absence de base de données avec masque, des études sur leurrage d’identité sont
limitées. Ce chapitre fournit les résultats en proposant de nouvelles contre-mesures
pour protéger les systèmes de la reconnaissance contre ces attaques.
Quatre contre-mesures sont proposées dans cette étude pour discriminate les masques
et les échantillons réels. Trois d’entre elles utilisent les données 2D (images de tex-
ture), et la derniére utilise les données 3D (cartes de profondeur estimées à partir
des scans 3D premiéres) disponibles dans la base de données du masque.
L’organigramme des contre-mesures proposées dans ce chapitre sont présentées à la
Figure 11.3. Dans cette figure, l’analyse micro-texture appliquée sur les images de
texture est appelé CM1, appliquée sur les images de réflectance est appelé CM2, ap-
pliquée sur les cartes de profondeur est appelé CM4, et enfin la contre-mesure pour
lesquelles les valeurs d’intensité de pixels sur une image de réflectance sont utilisées
directement par le classificateur est appelée CM3 (CM signifie la contre-mesure).
L’image acquise du masque peut visuellement être très similaire à l’image acquise
du visage réel (par exemple, les images de texture dans la deuxième colonne de
la Figure 11.2). Un regard attentif sur les différences entre les vrais visages et les
visages des masques révèle que leurs propriétés de surface sont différentes. Pour
la fabrication de masque, des imprimantes 3D été ont utilisées, par conséquent, ils
peuvent contenir des défauts de qualité d’impression qui peuvent être détectées avec
des motifs de micro-texture. Pour CM1, l’analyse micro-texture est appliquée sur les
images de texture, et la fonction histogramme de longueur 833 est obtenue. Enfin,
le SVM classificateur linéaire est utilisé pour détecter les masques et vrais visages.
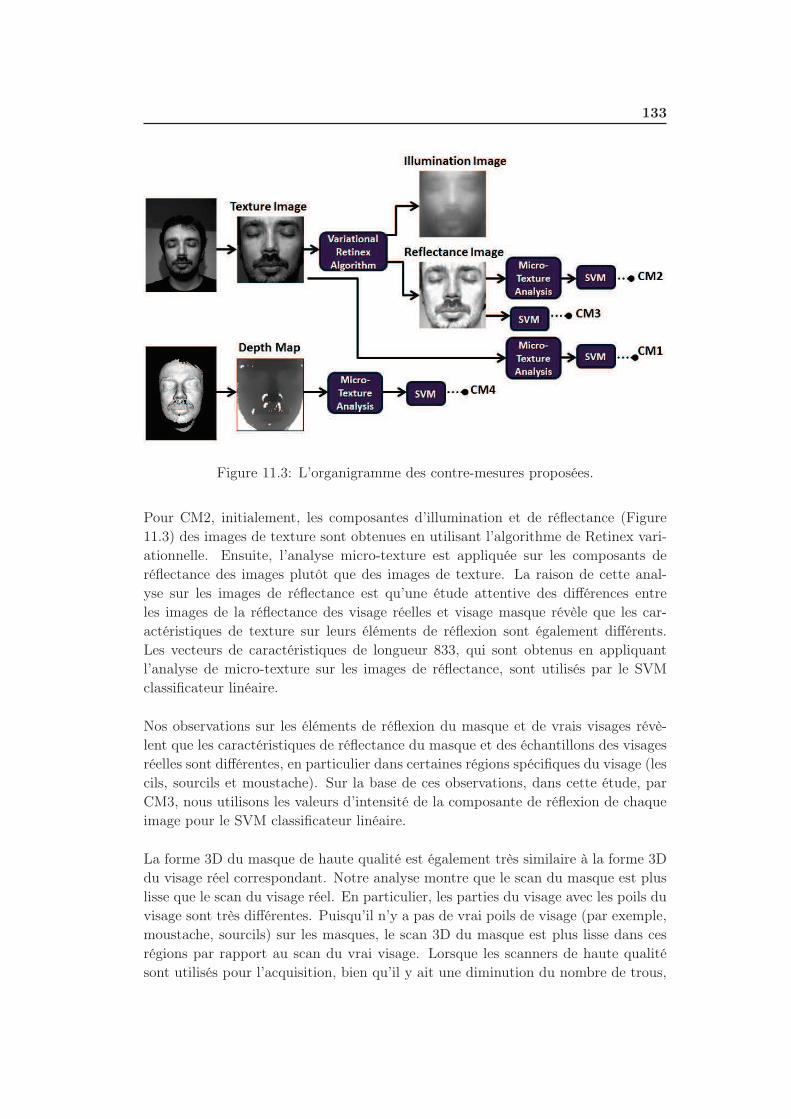
133
Figure 11.3: L’organigramme des contre-mesures proposées.
Pour CM2, initialement, les composantes d’illumination et de réflectance (Figure
11.3) des images de texture sont obtenues en utilisant l’algorithme de Retinex vari-
ationnelle. Ensuite, l’analyse micro-texture est appliquée sur les composants de
réflectance des images plutôt que des images de texture. La raison de cette anal-
yse sur les images de réflectance est qu’une étude attentive des différences entre
les images de la réflectance des visage réelles et visage masque révèle que les car-
actéristiques de texture sur leurs éléments de réflexion sont également différents.
Les vecteurs de caractéristiques de longueur 833, qui sont obtenus en appliquant
l’analyse de micro-texture sur les images de réflectance, sont utilisés par le SVM
classificateur linéaire.
Nos observations sur les éléments de réflexion du masque et de vrais visages révè-
lent que les caractéristiques de réflectance du masque et des échantillons des visages
réelles sont différentes, en particulier dans certaines régions spécifiques du visage (les
cils, sourcils et moustache). Sur la base de ces observations, dans cette étude, par
CM3, nous utilisons les valeurs d’intensité de la composante de réflexion de chaque
image pour le SVM classificateur linéaire.
La forme 3D du masque de haute qualité est également très similaire à la forme 3D
du visage réel correspondant. Notre analyse montre que le scan du masque est plus
lisse que le scan du visage réel. En particulier, les parties du visage avec les poils du
visage sont très différentes. Puisqu’il n’y a pas de vrai poils de visage (par exemple,
moustache, sourcils) sur les masques, le scan 3D du masque est plus lisse dans ces
régions par rapport au scan du vrai visage. Lorsque les scanners de haute qualité
sont utilisés pour l’acquisition, bien qu’il y ait une diminution du nombre de trous,
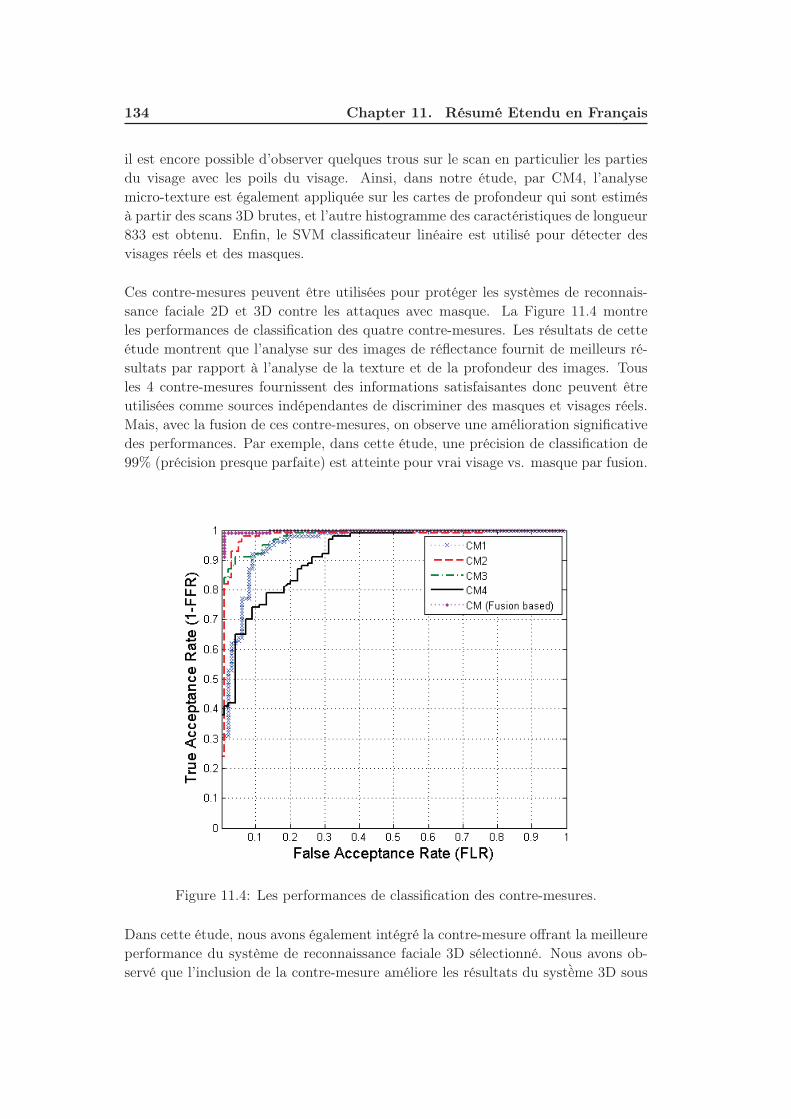
134 Chapter 11. Résumé Etendu en Français
il est encore possible d’observer quelques trous sur le scan en particulier les parties
du visage avec les poils du visage. Ainsi, dans notre étude, par CM4, l’analyse
micro-texture est également appliquée sur les cartes de profondeur qui sont estimés
à partir des scans 3D brutes, et l’autre histogramme des caractéristiques de longueur
833 est obtenu. Enfin, le SVM classificateur linéaire est utilisé pour détecter des
visages réels et des masques.
Ces contre-mesures peuvent être utilisées pour protéger les systèmes de reconnais-
sance faciale 2D et 3D contre les attaques avec masque. La Figure 11.4 montre
les performances de classification des quatre contre-mesures. Les résultats de cette
étude montrent que l’analyse sur des images de réflectance fournit de meilleurs ré-
sultats par rapport à l’analyse de la texture et de la profondeur des images. Tous
les 4 contre-mesures fournissent des informations satisfaisantes donc peuvent être
utilisées comme sources indépendantes de discriminer des masques et visages réels.
Mais, avec la fusion de ces contre-mesures, on observe une amélioration significative
des performances. Par exemple, dans cette étude, une précision de classification de
99% (précision presque parfaite) est atteinte pour vrai visage vs. masque par fusion.
Figure 11.4: Les performances de classification des contre-mesures.
Dans cette étude, nous avons également intégré la contre-mesure offrant la meilleureperformance du système de reconnaissance faciale 3D sélectionné. Nous avons ob-
servé que l’inclusion de la contre-mesure améliore les résultats du systè̀me 3D sous
135
attaques, alors qu’il dégrade les performances de base du système lorsqu’il n’est pas
confronté à une attaque.
6. L’impact des Retouches sur le Nez en Reconnaissance Faciale
Des nombreux défis majeurs en reconnaissance faciale, comme la pose, l’éclairage,l’expression et le vieillissement, ont été étudiés intensivement. Toutes ces variationsmodifient la texture et/ou la forme du visage d’une manière similaire pour les dif-
férents individus. Mais, les études sur les modifications appliquées sur le visage par
la chirurgie plastique ou maquillage important dans diverses quantités et dans di-
verses formes, sont encore très limitées. Dans cette thèse, nous analysons comment
ces changements sur la région du nez affectent les performances en reconnaissance
faciale de plusieurs techniques clés. À cet effet, une base de données simulée estpréparée en utilisant FRGC v1.0 dans lequel le nez de chaque personne est remplacépar un autre choisi au hasard. Puisque c’est une base de données 3D, l’analysede l’impact ne se limite pas seulement avec 2D, qui est l’une des originalités de laprésente étude. Les comparaisons des performances de trois algorithmes 2D et dequatre algorithmes 3D sont fournis. En outre, différemment des travaux précédents,des résultats de référence pour la base de données d’origine sont également évaluées.Par conséquent, l’impact qui est uniquement lié aux altérations du nez peut êtremesurée. Les résultats expérimentaux indiquent qú avec l’introduction de modifica-tions, les deux modalités perdent de précision, en particulier 3D.
Pour les tests de vérification, le Receiver Operating Characteristic (ROC) des courbesqui représentent les taux de vérification (VR) en fonction des taux de fauses accep-tations (FAR) sont présentés avec les taux de vérification à 0.001 FAR.
Pour les tests d’identification, le premier échantillon de chaque individu dans l’ensemblede test est utilisé comme galerie et le reste en tant que test. Les taux de reconnais-sance rang-1 sont évaluées.
Expérience 1 - Performance sur la base de données originale : Il est important decalculer les performances sur les ensembles de données originales pour avoir une basede référence. Par ce moyen, l’impact des modifications appliquées peut être mesuréavec précision. À cet effet, les algorithmes 2D et 3D sont évalués sur DB-o ou lessimilitudes sont calculées entre chaque paire d’image d’origine.
Expérience 2 - Performance sur la base de données simulé : Dans ce scénario, lesscores de similarité entre chaque paire DB-o et DB-s sont calculés et utilisés pourévaluer les performances de la reconnaissance. Pour l’ensemble d’entrainment, pourchaque sujet sélectionné, la moitié des images correspondantes sont prises à partirde DB-o et le reste de DB-s. Cette expérience est identique à l’expérience 1, saufles images de test sont maintenant remplacées par leurs versions modifiées.
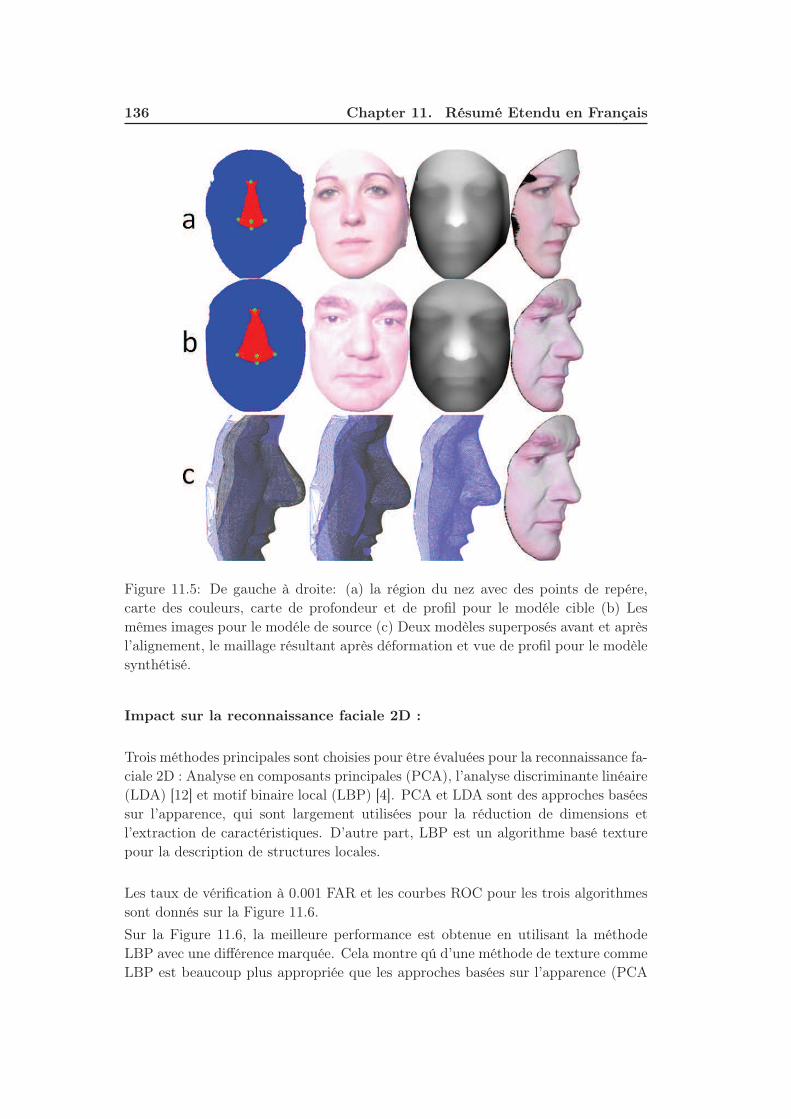
136 Chapter 11. Résumé Etendu en Français
Figure 11.5: De gauche à droite: (a) la région du nez avec des points de repére,
carte des couleurs, carte de profondeur et de profil pour le modéle cible (b) Les
mêmes images pour le modéle de source (c) Deux modèles superposés avant et après
l’alignement, le maillage résultant après déformation et vue de profil pour le modèle
synthétisé.
Impact sur la reconnaissance faciale 2D :
Trois méthodes principales sont choisies pour être évaluées pour la reconnaissance fa-
ciale 2D : Analyse en composants principales (PCA), l’analyse discriminante linéaire
(LDA) [12] et motif binaire local (LBP) [4]. PCA et LDA sont des approches basées
sur l’apparence, qui sont largement utilisées pour la réduction de dimensions et
l’extraction de caractéristiques. D’autre part, LBP est un algorithme basé texture
pour la description de structures locales.
Les taux de vérification à 0.001 FAR et les courbes ROC pour les trois algorithmes
sont donnés sur la Figure 11.6.
Sur la Figure 11.6, la meilleure performance est obtenue en utilisant la méthode
LBP avec une différence marquée. Cela montre qú d’une méthode de texture comme
LBP est beaucoup plus appropriée que les approches basées sur l’apparence (PCA
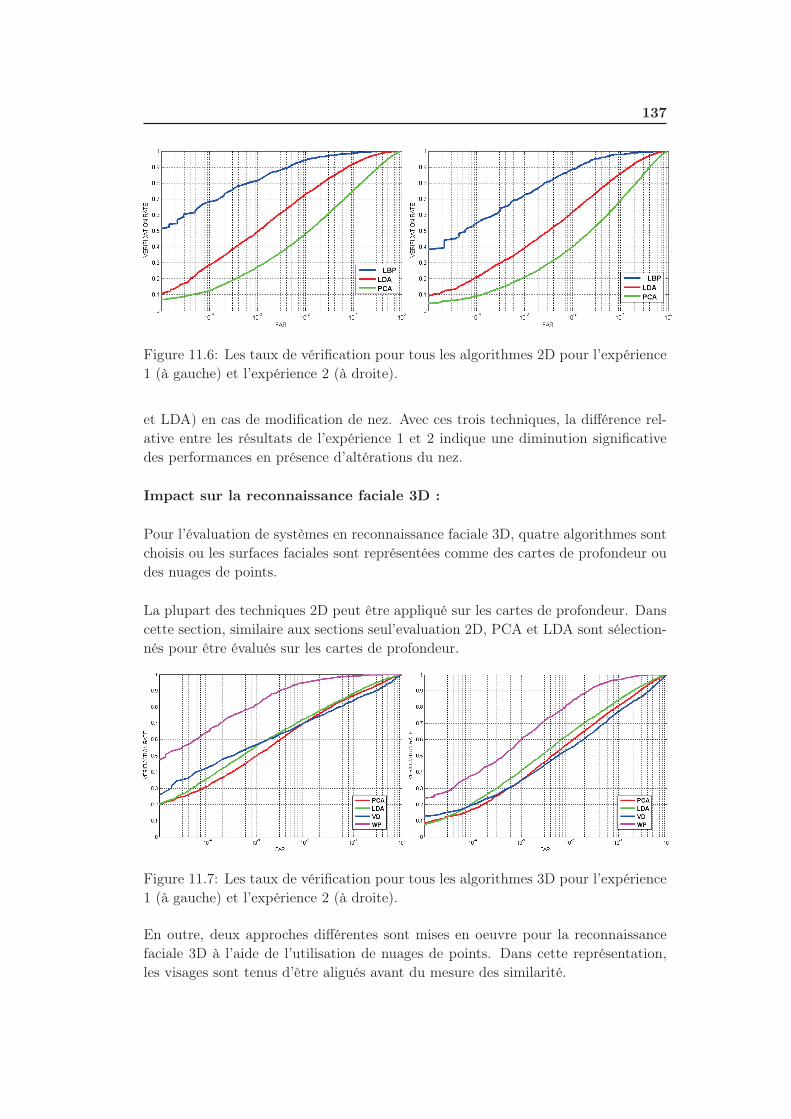
137
Figure 11.6: Les taux de vérification pour tous les algorithmes 2D pour l’expérience
1 (à gauche) et l’expérience 2 (à droite).
et LDA) en cas de modification de nez. Avec ces trois techniques, la différence rel-
ative entre les résultats de l’expérience 1 et 2 indique une diminution significative
des performances en présence d’altérations du nez.
Impact sur la reconnaissance faciale 3D :
Pour l’évaluation de systèmes en reconnaissance faciale 3D, quatre algorithmes sont
choisis ou les surfaces faciales sont représentées comme des cartes de profondeur ou
des nuages de points.
La plupart des techniques 2D peut être appliqué sur les cartes de profondeur. Dans
cette section, similaire aux sections seul’evaluation 2D, PCA et LDA sont sélection-
nés pour être évalués sur les cartes de profondeur.
Figure 11.7: Les taux de vérification pour tous les algorithmes 3D pour l’expérience
1 (à gauche) et l’expérience 2 (à droite).
En outre, deux approches différentes sont mises en oeuvre pour la reconnaissance
faciale 3D à l’aide de l’utilisation de nuages de points. Dans cette représentation,
les visages sont tenus d’être aligués avant du mesure des similarité.
138 Chapter 11. Résumé Etendu en Français
Pour cette raison, dans la première technique, les visages sont alignés avec un mod-
èle de visage générique à l’aide de l’utilisation trois points caractéristiques (deux
coins des yeux extérieurs et la pointe du nez) et ensuite les valeurs de profondeur
sont régulièrement échantillonnées. La similarité entre les deux visages est obtenu
en calculant la moyenne des distances z de tous les sommets. De cette façon, la
différence de volume (VD) est approximée entre les deux surfaces faciales.
Pour la deuxième approche (WP), nous avons implanté la méthode présentée dans
[39] et expliqué dans le chapitre 4, qui utilise les paramètres de déformation TPS.
La Figure 11.7 montre que avec les quatre techniques, la différence relative entre les
résultats de l’expérience 1 et 2 indique une diminution significative des performances
en présence d’altérations du nez. Les meilleures performances sont obtenues avec la
technique de WP.
La nouveauté de cette étude est que les analyses ne sont pas limités à des images
2D. L’effet des modifications apportées peut également être déterminé en 3D. Et en
outre, puisqu’il est possible de mesurer les performances initiales sur FRGC v1.0,
une comparaison authentique entre les pré- et post-altération des performances peu-
vent être fournit, ce qui est un avantage significatif de cette étude par rapport aux
précédentes.
Les résultats révèlent que les algorithmes évalués ne sont pas robustes aux variations
causées par des altérations au niveau du nez. En outre, la comparaison des perfor-
mances de vérification des algorithmes 2D et 3D montrent que le 3D est beaucoup
plus vulnérable contre les variations du nez par rapport à 2D.
Des algorithmes de reconnaissance faciale robustes sont nécessaire pour atténuer
les effets de modifications faciales. Dans le prochain chapitre, nous proposons une
approche de reconnaissance faciale robuste à des modifications du nez.
7. Reconnaissance Faciale Robuste à Nez Altération
La reconnaissance faciale robuste aux modifications appliquées sur le visage par la
chirurgie plastique ou le maquillage peut encore être considéré comme un sujet nou-
veau. Dans cette étude, une approche est proposée qui prévoit une assez bonne
performance de la reconnaissance, avec l’avantage de la robustesse à ce genre de
retouches. Pour cette étude, une base de données de visages avec modification du
nez est simulée est préparée en utilisant FRGC v1.0. C’est une base de données 3D,
donc l’approche peut être testée à la fois en 2D et en 3D, qui est l’une des contribu-
tions de cette étude. En outre, différemment des précédents travaux, des résultats de
référence pour la base de données d’origine sont donnés. L’impact qui est purement
lié aux modifications du nez est mesuré en utilisant les deux l’approches proposées
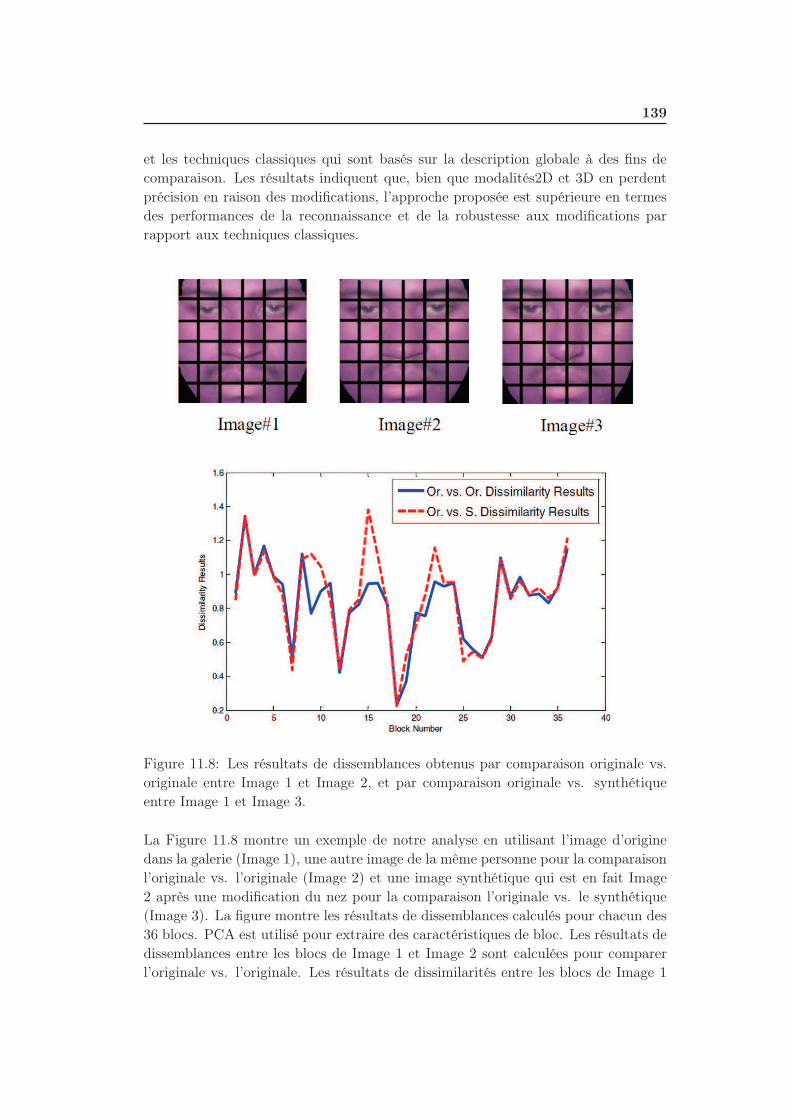
139
et les techniques classiques qui sont basés sur la description globale à des fins de
comparaison. Les résultats indiquent que, bien que modalités2D et 3D en perdent
précision en raison des modifications, l’approche proposée est supérieure en termes
des performances de la reconnaissance et de la robustesse aux modifications par
rapport aux techniques classiques.
Figure 11.8: Les résultats de dissemblances obtenus par comparaison originale vs.
originale entre Image 1 et Image 2, et par comparaison originale vs. synthétique
entre Image 1 et Image 3.
La Figure 11.8 montre un exemple de notre analyse en utilisant l’image d’origine
dans la galerie (Image 1), une autre image de la même personne pour la comparaison
l’originale vs. l’originale (Image 2) et une image synthétique qui est en fait Image
2 après une modification du nez pour la comparaison l’originale vs. le synthétique
(Image 3). La figure montre les résultats de dissemblances calculés pour chacun des
36 blocs. PCA est utilisé pour extraire des caractéristiques de bloc. Les résultats de
dissemblances entre les blocs de Image 1 et Image 2 sont calculées pour comparer
l’originale vs. l’originale. Les résultats de dissimilarités entre les blocs de Image 1
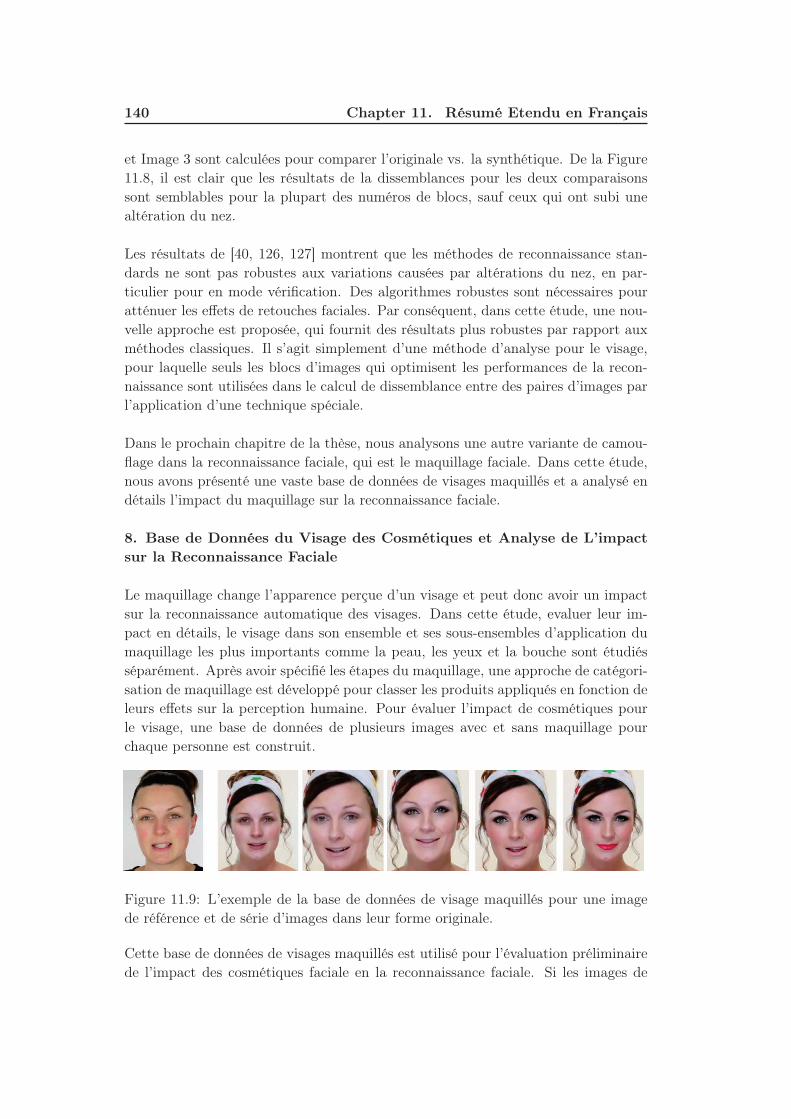
140 Chapter 11. Résumé Etendu en Français
et Image 3 sont calculées pour comparer l’originale vs. la synthétique. De la Figure
11.8, il est clair que les résultats de la dissemblances pour les deux comparaisons
sont semblables pour la plupart des numéros de blocs, sauf ceux qui ont subi une
altération du nez.
Les résultats de [40, 126, 127] montrent que les méthodes de reconnaissance stan-
dards ne sont pas robustes aux variations causées par altérations du nez, en par-
ticulier pour en mode vérification. Des algorithmes robustes sont nécessaires pour
atténuer les effets de retouches faciales. Par conséquent, dans cette étude, une nou-velle approche est proposée, qui fournit des résultats plus robustes par rapport auxméthodes classiques. Il s’agit simplement d’une méthode d’analyse pour le visage,pour laquelle seuls les blocs d’images qui optimisent les performances de la recon-naissance sont utilisées dans le calcul de dissemblance entre des paires d’images parl’application d’une technique spéciale.
Dans le prochain chapitre de la thèse, nous analysons une autre variante de camou-flage dans la reconnaissance faciale, qui est le maquillage faciale. Dans cette étude,nous avons présenté une vaste base de données de visages maquillés et a analysé endétails l’impact du maquillage sur la reconnaissance faciale.
8. Base de Données du Visage des Cosmétiques et Analyse de L’impact
sur la Reconnaissance Faciale
Le maquillage change l’apparence perçue d’un visage et peut donc avoir un impactsur la reconnaissance automatique des visages. Dans cette étude, evaluer leur im-pact en détails, le visage dans son ensemble et ses sous-ensembles d’application dumaquillage les plus importants comme la peau, les yeux et la bouche sont étudiésséparément. Après avoir spécifié les étapes du maquillage, une approche de catégori-sation de maquillage est développé pour classer les produits appliqués en fonction deleurs effets sur la perception humaine. Pour évaluer l’impact de cosmétiques pourle visage, une base de données de plusieurs images avec et sans maquillage pourchaque personne est construit.
Figure 11.9: L’exemple de la base de données de visage maquillés pour une imagede référence et de série d’images dans leur forme originale.
Cette base de données de visages maquillés est utilisé pour l’évaluation préliminairede l’impact des cosmétiques faciale en la reconnaissance faciale. Si les images de
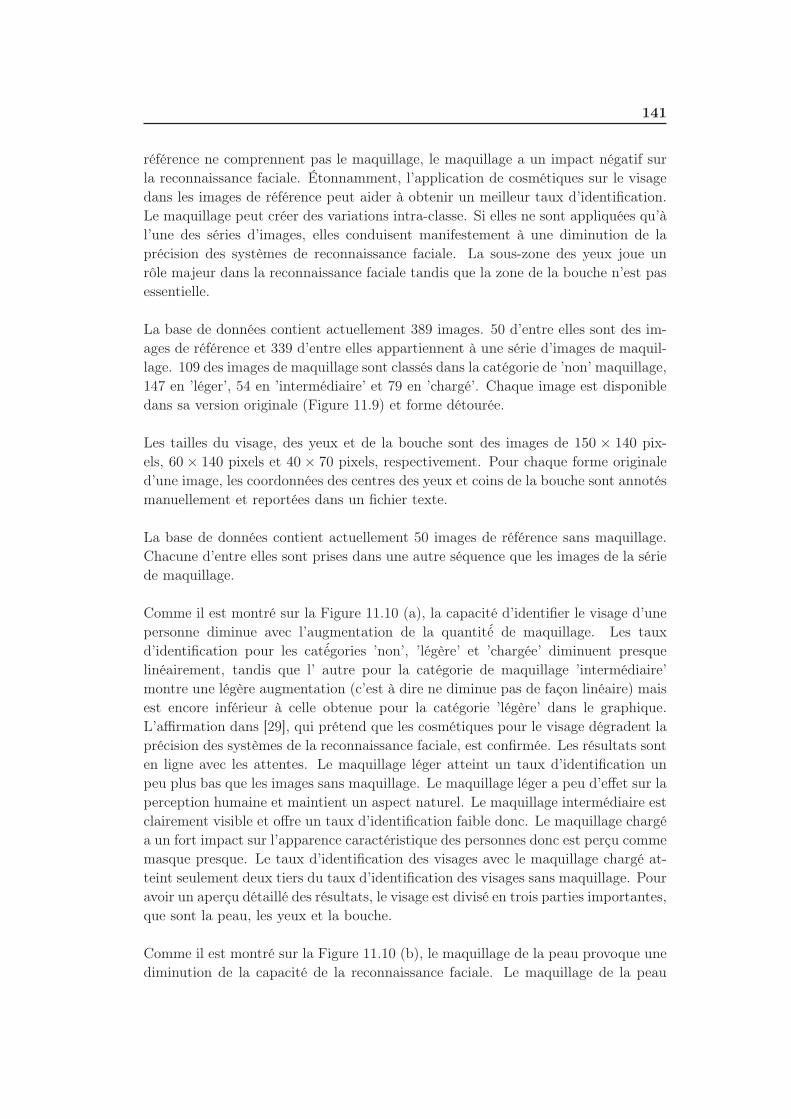
141
référence ne comprennent pas le maquillage, le maquillage a un impact négatif sur
la reconnaissance faciale. Étonnamment, l’application de cosmétiques sur le visagedans les images de référence peut aider à obtenir un meilleur taux d’identification.Le maquillage peut créer des variations intra-classe. Si elles ne sont appliquées qu’àl’une des séries d’images, elles conduisent manifestement à une diminution de laprécision des systèmes de reconnaissance faciale. La sous-zone des yeux joue unrôle majeur dans la reconnaissance faciale tandis que la zone de la bouche n’est pasessentielle.
La base de données contient actuellement 389 images. 50 d’entre elles sont des im-ages de référence et 339 d’entre elles appartiennent à une série d’images de maquil-lage. 109 des images de maquillage sont classés dans la catégorie de ’non’ maquillage,147 en ’léger’, 54 en ’intermédiaire’ et 79 en ’chargé’. Chaque image est disponibledans sa version originale (Figure 11.9) et forme détourée.
Les tailles du visage, des yeux et de la bouche sont des images de 150 × 140 pix-els, 60 × 140 pixels et 40 × 70 pixels, respectivement. Pour chaque forme originaled’une image, les coordonnées des centres des yeux et coins de la bouche sont annotésmanuellement et reportées dans un fichier texte.
La base de données contient actuellement 50 images de référence sans maquillage.Chacune d’entre elles sont prises dans une autre séquence que les images de la sériede maquillage.
Comme il est montré sur la Figure 11.10 (a), la capacité d’identifier le visage d’unepersonne diminue avec l’augmentation de la quantité́ de maquillage. Les tauxd’identification pour les caté́gories ’non’, ’légère’ et ’chargée’ diminuent presquelinéairement, tandis que l’ autre pour la catégorie de maquillage ’intermédiaire’montre une légère augmentation (c’est à dire ne diminue pas de façon linéaire) mais
est encore inférieur à celle obtenue pour la catégorie ’légère’ dans le graphique.
L’affirmation dans [29], qui prétend que les cosmétiques pour le visage dégradent la
précision des systèmes de la reconnaissance faciale, est confirmée. Les résultats sont
en ligne avec les attentes. Le maquillage léger atteint un taux d’identification un
peu plus bas que les images sans maquillage. Le maquillage léger a peu d’effet sur la
perception humaine et maintient un aspect naturel. Le maquillage intermédiaire est
clairement visible et offre un taux d’identification faible donc. Le maquillage chargé
a un fort impact sur l’apparence caractéristique des personnes donc est perçu comme
masque presque. Le taux d’identification des visages avec le maquillage chargé at-
teint seulement deux tiers du taux d’identification des visages sans maquillage. Pour
avoir un aperçu détaillé des résultats, le visage est divisé en trois parties importantes,
que sont la peau, les yeux et la bouche.
Comme il est montré sur la Figure 11.10 (b), le maquillage de la peau provoque une
diminution de la capacité de la reconnaissance faciale. Le maquillage de la peau
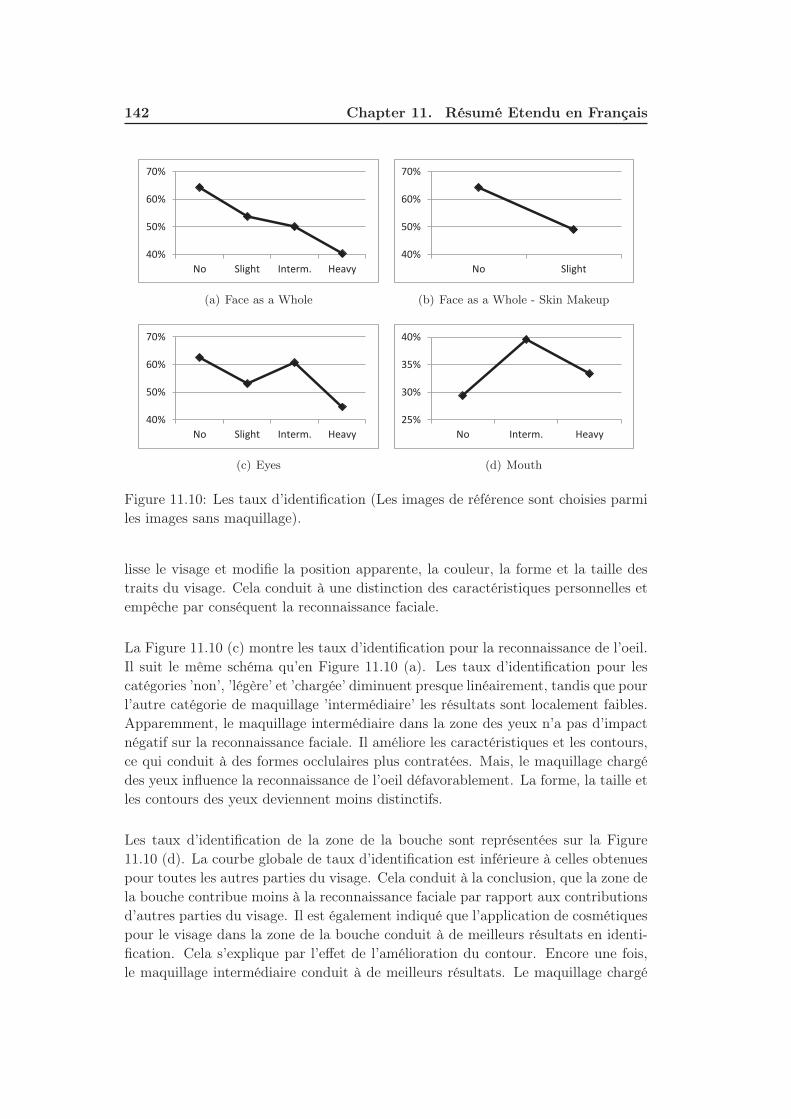
142 Chapter 11. Résumé Etendu en Français
40%
50%
60%
70%
No Slight Interm. Heavy
(a) Face as a Whole
40%
50%
60%
70%
No Slight
(b) Face as a Whole - Skin Makeup
40%
50%
60%
70%
No Slight Interm. Heavy
(c) Eyes
25%
30%
35%
40%
No Interm. Heavy
(d) Mouth
Figure 11.10: Les taux d’identification (Les images de référence sont choisies parmi
les images sans maquillage).
lisse le visage et modifie la position apparente, la couleur, la forme et la taille des
traits du visage. Cela conduit à une distinction des caractéristiques personnelles et
empêche par conséquent la reconnaissance faciale.
La Figure 11.10 (c) montre les taux d’identification pour la reconnaissance de l’oeil.
Il suit le même schéma qu’en Figure 11.10 (a). Les taux d’identification pour les
catégories ’non’, ’légère’ et ’chargée’ diminuent presque linéairement, tandis que pour
l’autre catégorie de maquillage ’intermédiaire’ les résultats sont localement faibles.
Apparemment, le maquillage intermédiaire dans la zone des yeux n’a pas d’impact
négatif sur la reconnaissance faciale. Il améliore les caractéristiques et les contours,
ce qui conduit à des formes occlulaires plus contratées. Mais, le maquillage chargé
des yeux influence la reconnaissance de l’oeil défavorablement. La forme, la taille et
les contours des yeux deviennent moins distinctifs.
Les taux d’identification de la zone de la bouche sont représentées sur la Figure
11.10 (d). La courbe globale de taux d’identification est inférieure à celles obtenues
pour toutes les autres parties du visage. Cela conduit à la conclusion, que la zone de
la bouche contribue moins à la reconnaissance faciale par rapport aux contributions
d’autres parties du visage. Il est également indiqué que l’application de cosmétiques
pour le visage dans la zone de la bouche conduit à de meilleurs résultats en identi-
fication. Cela s’explique par l’effet de l’amélioration du contour. Encore une fois,
le maquillage intermédiaire conduit à de meilleurs résultats. Le maquillage chargé
143
comprend également des modifications de taille ce qui conduit à un taux plus faible
d’identification par rapport à maquillage intermédiaire.
Dans cette étude, nous utilisons ensuite des images avec le maquillage intermédiaire
comme images de référence. La base de données fournit des séries de maquillage
pour 23 personnes avec des images de maquillage intermédiaires. Les séries de
maquillage restants fournissent des images appartenant aux catégories de maquil-
lage ’non’, ’légère’ ou ’chargée’. Par conséquent, l’évaluation est réalisée avec 23
images de référence provenant des vidéo de maquillage. Ils possèdent les mêmes
réglages du matériel d’acquisition, de la peau et des conditions d’éclairage avec les
images de test. Puisque les images de référence sont issues d’une même session, il
est peu réaliste par rapport à l’essai pour lequel les images sans maquillage sont
utilisées comme images de référence. C’est pourquoi nous obtenons résultat presque
parfait (100%) lorsque des images de maquillage intermédiaires sont utilisés comme
références.
9. Base Kinect de Données de Visage et Analyse de L’impact en Recon-
naissance Faciale
Le succès récent de nouvelles caméras RGB-D comme le capteur Kinect représente
une large perspective des applications informatiques. Toutefois, en raison de l’absence
de base de données de test standard, il est difficile d’évaluer l’apport de la technologie
en reconnaissance faciale. Afin d’établir les connexions entre le capteur Kinect et la
reconnaissance de visage, dans cette étude, nous présentons la première base de don-
nées accessible au public de visage (KinectFaceDB) basée sur le capteur Kinect pour
la reconnaissance faciale. La base de données se compose de différentes modalités
de données (données de visage 2D, 2.5D, 3D et vidéo bien alignées et transformées)
et de multiples variations du visage. Nous effectuons des évaluations de référence
sur la base de données proposée en utilisant des méthodes de reconnaissance faciale
standards, et démontrons le gain de performance en intégrant les données de pro-
fondeur avec les données RGB via la fusion. Nous comparons également les images
Kinect (du KinectFaceDB) avec les scans 3D de haute qualité traditionnels (de la
base de données FRGC) dans le contexte de la biométrie du visage, ce qui démontre
que le besoin impératif d’une telle base de données en la reconnaissance faciale.
10. Conclusions et Perspectives d’Avenir
Résumé
Dans cette thèse, nous avons étudié les attaques de leurrage et de camouflage en re-
connaissance faciale et proposé des techniques de contre-mesures pour la protection
des systèmes en reconnaissance faciale contre ces défis.
Il a été démontré que les systèmes de reconnaissance faciale sont vulnérables à des at-
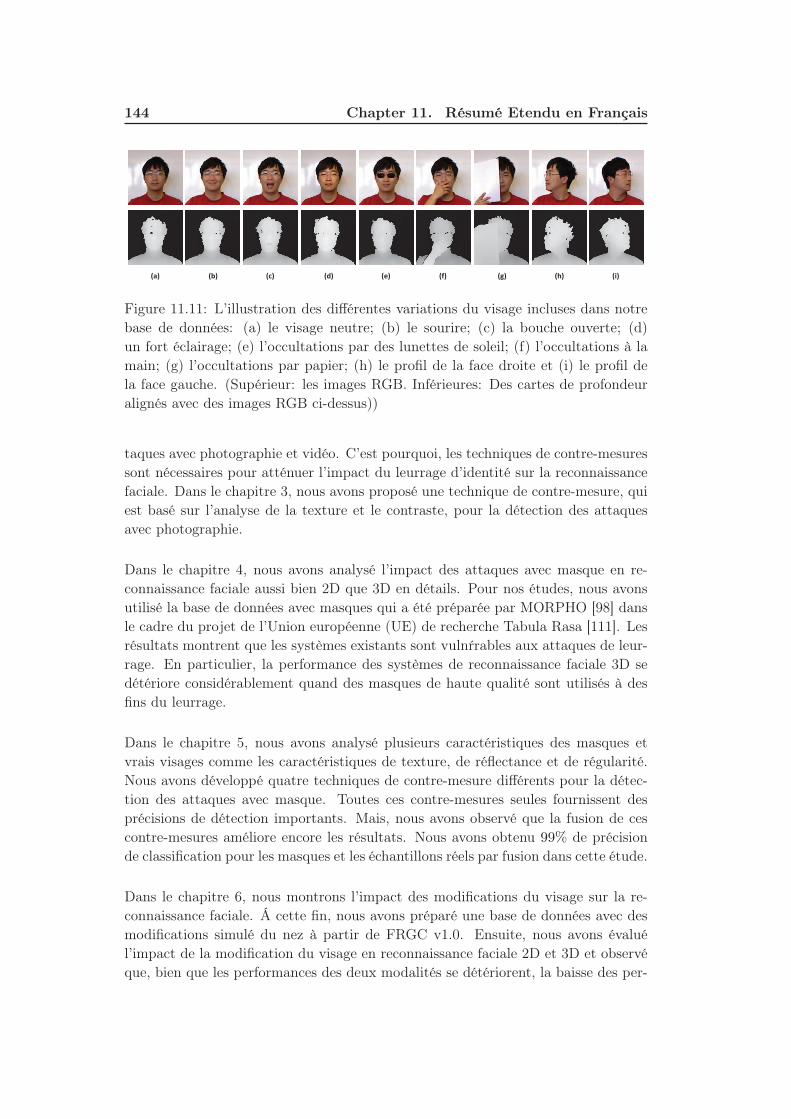
144 Chapter 11. Résumé Etendu en Français
(a) (b) (c) (d) (e) (f) (g) (h) (i)
Figure 11.11: L’illustration des différentes variations du visage incluses dans notrebase de données: (a) le visage neutre; (b) le sourire; (c) la bouche ouverte; (d)un fort éclairage; (e) l’occultations par des lunettes de soleil; (f) l’occultations à lamain; (g) l’occultations par papier; (h) le profil de la face droite et (i) le profil dela face gauche. (Supérieur: les images RGB. Inférieures: Des cartes de profondeuralignés avec des images RGB ci-dessus))
taques avec photographie et vidéo. C’est pourquoi, les techniques de contre-mesuressont nécessaires pour atténuer l’impact du leurrage d’identité sur la reconnaissancefaciale. Dans le chapitre 3, nous avons proposé une technique de contre-mesure, quiest basé sur l’analyse de la texture et le contraste, pour la détection des attaquesavec photographie.
Dans le chapitre 4, nous avons analysé l’impact des attaques avec masque en re-connaissance faciale aussi bien 2D que 3D en détails. Pour nos études, nous avonsutilisé la base de données avec masques qui a été préparée par MORPHO [98] dansle cadre du projet de l’Union européenne (UE) de recherche Tabula Rasa [111]. Lesrésultats montrent que les systèmes existants sont vulnŕrables aux attaques de leur-rage. En particulier, la performance des systèmes de reconnaissance faciale 3D sedétériore considérablement quand des masques de haute qualité sont utilisés à desfins du leurrage.
Dans le chapitre 5, nous avons analysé plusieurs caractéristiques des masques etvrais visages comme les caractéristiques de texture, de réflectance et de régularité.Nous avons développé quatre techniques de contre-mesure différents pour la détec-tion des attaques avec masque. Toutes ces contre-mesures seules fournissent desprécisions de détection importants. Mais, nous avons observé que la fusion de cescontre-mesures améliore encore les résultats. Nous avons obtenu 99% de précisionde classification pour les masques et les échantillons réels par fusion dans cette étude.
Dans le chapitre 6, nous montrons l’impact des modifications du visage sur la re-connaissance faciale. Á cette fin, nous avons préparé une base de données avec desmodifications simulé du nez à partir de FRGC v1.0. Ensuite, nous avons évaluél’impact de la modification du visage en reconnaissance faciale 2D et 3D et observéque, bien que les performances des deux modalités se détériorent, la baisse des per-
145
formances est plus pour la 3D que la 2D.
Dans le chapitre 7, nous avons proposé une nouvelle approche de reconnaissance fa-
ciale qui augmente les performances de manière significative en présence d’altérations
du nez. L’avantage de cette approche est qu’elle peut être utilisée pour tous les types
d’altérations appliquées sur le visage.
Dans le chapitre 8, nous avons analysé l’impact du maquillage en reconnaissance
faciale. Á cette fin, nous avons préparé une base de données riche en maquillage.L’impact du maquillage sur la reconnaissance faciale est analysé en détail. Les ré-sultats montrent que les systémes de reconnaissance existants sont vulnérables aumaquillage facial et en particulier le maquillage au viveau de la région des yeuxaffecte de maniére significative les performances de reconnaissance.
Enfin, dans le dernier chapitre, la premiére base de données, accessible au public,de visages basée sur le capteur Kinect est présenté. La base de données se composede différentes modalités et de multiples variations du visage comme les occultations,expression, éclairage. Nous effectuons des évaluations de référence sur la base dedonnées proposée en utilisant des méthodes standards en reconnaissance du visage, et de démontrons le gain de performance en intégrant les données de profondeuravec les données RGB via la fusion. Nous comparons également les images Kinectavec les scans 3D de haute qualité traditionnels (de la base de données FRGC) dansle contexte de la biométrie du visage, ce qui démontre le besoin impératifs de le basedu données proposée pour la reconnaissance faciale.
Perspectives d’Avenir
Nos futurs travaux sur le leurrage consisteront à tester les performances des contre-mesures proposées en utilisant des masques fabriqués à partir de différents matéri-aux afin d’observer si nous pouvons encore obtenir des résultats satisfaisants, et deproposer de nouvelles contre-mesures pour les bases de données avec masque plusdifficiles dès que disponible.
Pour notre étude sur les modifications du visage, notre objectif est de tester lesperformances de la technique proposée pour les modifications du nez à l’existenced’autres altérations du visage afin de démontrer que notre approche est bénéfiquepour tous les types d’opérations de chirurgie plastique.
Pour notre étude sur le maquillage facial, nos futurs travaux consisteront à détecterle maquillage facial et à étudier des techniques robustes contre le maquillage facial.
Enfin, comme un travail futur, nous voulons utiliser la base de données de vis-age Kinect pour développer des techniques robustes contre les occultations. Nousprévoyons également d’utiliser cette base de données pour d’autres tests comme la

146 Chapter 11. Résumé Etendu en Français
reconnaissance du genre, construction de modéle 3D de qualité à partir des données
vidéo disponibles dans cette base de données.
Bibliography
[1] Special issue on computer vision for rgb-d sensors: Kinect and its applications.
IEEE Transactions on Systems, Man, and Cybernetics, Part B: Cybernetics,
42(4):1295 –1296, 2012. 97
[2] 3dMD. http : //www.3dmd.com/. 99
[3] A. F. Abate, M. Nappi, D. Riccio, and G. Sabatino. 2d and 3d face recognition:
A survey. Pattern Recogn. Lett., 28(14):1885–1906, 2007. 1, 9, 114
[4] T. Ahonen, A. Hadid, and M. Pietikainen. Face description with local binary
patterns: Application to face recognition. IEEE Transactions on Pattern
Analysis and Machine Intelligence, 28(12):2037 –2041, 2006. 9, 19, 38, 66, 74,
80, 86, 98, 100, 110
[5] J. Alexander and J. Smith. Engineering privacy in public: Confounding face
recognition, privacy enhancing technologies. International Workshop on Pri-
vacy Enhancing Technologies, pages 88–106, 2003. 18, 19
[6] N. Almoussa. Variational retinex and shadow removal. Technical Report, The
Mathematics Department, UCLA, 2008. 46, 47, 48
[7] M. Angeloglou. A History of Make-up. Macmillan, 1970. 17, 85
[8] J. Bai, T.-T. Ng, X. Gao, and Y.-Q. Shi. Is physics-based liveness detection
truly possible with a single image? IEEE International Symposium on Circuits
and Systems, pages 3425–3428, 2010. 12
[9] W. Bao, H. Li, N. Li, and et al. A liveness detection method for face recognition
based on optical flow field. Int. Conf. on Image Analysis and Signal Processing
(IASP), pages 233–236, 2009. 11
[10] F. Barak, S. Alexander, M. Meir, and A. Yoel. Depth mapping using projected
patterns. US Patent : 20100118123, 2010. 99, 104
[11] I. B. Barbosa, M. Cristani, A. D. Bue, L. Bazzani, and V. Murino. Re-
identification with rgb-d sensors. ECCV Workshops (1), 7583:433–442, 2012.
97
[12] P. N. Bellhumer, J. Hespanha, and D. Kriegman. Eigenfaces vs. fisherfaces:
Recognition using class specific linear projection. IEEE Transactions on Pat-
tern Analysis and Machine Intelligence, 17(7):711–720, 1997. 9, 19, 66, 74,
98, 100, 110
[13] P. J. Besl and N. D. McKay. A method for registration of 3-d shapes. IEEE
Trans. Pattern Anal. Mach. Intell., 14(2):239–256, 1992. 9, 37, 100, 111
148 Bibliography
[14] J. R. Beveridge, G. H. Givens, P. J. Phillips, B. A. Draper, D. S. Bolme,
and Y. M. Lui. Frvt 2006: Quo vadis face quality. Image Vision Comput.,
28(5):732–743, 2010. 9
[15] H. S. Bhatt, S. Bharadwaj, R. Singh, M. Vatsa, and A. Noore. Evolutionary
granular approach for recognizing faces altered due to plastic surgery. IEEE
International Conference on Automatic Face & Gesture Recognition and Work-
shops, pages 720–725, 2011. 17, 73
[16] F. L. Bookstein. Principal warps: Thin-plate splines and decomposition of
deformations. IEEE Trans. Pattern Analysis and Machine Intelligence, pages
567–585, 1989. 38, 64
[17] A. Bottino, M. De Simone, and A. Laurentini. A computer-aided technique
for planning plastic surgery based on 3d face scans: preliminary results. Pro-
ceedings of Int. Conf. on 3D Body Scanning Technologies, 2010. 64
[18] K. W. Bowyer, K. Chang, and P. Flynn. A survey of approaches and challenges
in 3d and multi-modal 3d+2d face recognition. Comput. Vis. Image Underst.,
101(1):1–15, 2006. 9, 100, 114
[19] Smile by Webshots. http : //good− times.webshots.com. xii, 62
[20] C. Herrera C., J. Kannala, and J. Heikkilä. Accurate and practical calibration
of a depth and color camera pair. 6855:437–445, 2011. 106
[21] D. Herrera C., J. Kannala, and J. Heikkilä. Joint depth and color camera
calibration with distortion correction. IEEE Transactions on Pattern Analysis
and Machine Intelligence, 34(10):2058 –2064, 2012. 106
[22] M.-M. Chakka, A. Anjos, S. Marcel, and et al. Competition on counter mea-
sures to 2-d facial spoofing attacks. IEEE IAPR Int. Joint Conference on
Biometrics (IJCB), pages 1–6, 2011. 12
[23] C.-C. Chang and C.-J. Lin. Libsvm : a library for support vector machines.
ACM Transactions on Intelligent Systems and Technology, pages 2:27:1–27:27,
2011. 14, 29, 50
[24] Y. Chen and G. Medioni. Object modelling by registration of multiple range
images. Image Vision Comput., 10(3):145–155, 1992. 9, 100, 111
[25] G. Chetty and M. Wagner. Multi-level liveness verification for face-voice bio-
metric authentication. Biometrics Symposium: Special Session on Research
at the Biometric Consortium Conference, pages 1–6, 2006. 12
[26] T. Choudhury, B. Clarkson, T. Jebara, and A. Pentland. Multimodal per-
son recognition using unconstrained audio and video. Proc. of International
Conference on Audio-Visual Biometric Person Authentication, pages 176–181,
1999. 11
Bibliography 149
[27] A. Colombo, C. Cusano, and R. Schettini. Umb-db: A database of partially
occluded 3d faces. pages 2113–2119, 2011. 99, 100, 115
[28] Cyberware. http : //www.cyberware.com/. 99
[29] A. Dantcheva, C. Chen, and A. Ross. Can facial cosmetics affect the matching
accuracy of face recognition systems? IEEE International Conference on
Biometrics: Theory, Applications and System (BTAS), 2012. 18, 86, 93
[30] A. Dantcheva and J.-L. Dugelay. Female facial aesthetics based on soft bio-
metrics and photo-quality. IEEE International Conference for Multimedia and
Expo (ICME), 2011. 89
[31] A. Dantcheva, C. Velardo, A. D’Angelo, and J.-L.Dugelay. Bag of soft bio-
metrics for person identification. Multimedia Tools Appl., 51(2):739–777, 2011.
107
[32] 3D RMA Database. http : //www.sic.rma.ac.be/ ∼
beumier/DB/3drma.html. 99
[33] NUAA Photograph Impostor Database. http :
//parnec.nuaa.edu.cn/xtan/data/NuaaImposterdb.html. 12, 23, 39
[34] Print Attack Database. http : //www.idiap.ch/dataset/printattack, 2011. 12
[35] J. Daugman. How iris recognition works. IEEE Transactions on Circuits and
Systems for Video Technology, 14(1):21–30, 2004. 8
[36] J. Duchon. Splines minimizing rotation-invariant semi-norms in sobolev
spaces. In Constructive Theory of Functions of Several Variables, volume
571 of Lecture Notes in Mathematics, pages 85–100. 1977. 100, 111
[37] M.-L. Eckert, N. Kose, and J.-L. Dugelay. Facial cosmetics database and
impact analysis on automatic face recognition. IEEE International Workshop
on Multimedia Signal Processing (MMSP), pages 434–439, 2013. 18
[38] Mark Elendt, editor. International Conference on Computer Graphics and
Interactive Techniques, SIGGRAPH 2011, Vancouver, BC, Canada, August
7-11, 2011, Talks Proceedings. ACM, 2011. 97
[39] N. Erdogmus and J.-L. Dugelay. On discriminative properties of tps warping
parameters for 3d face recognition. IEEE Int. Conf. on Informatics, Electron-
ics and Vision (ICIEV), pages 225–230, 2012. xi, 20, 37, 38, 98, 110, 111,
115
[40] N. Erdogmus, N. Kose, and J.-L. Dugelay. Impact analysis of nose alterations
on 2d and 3d face recognition. IEEE Int. Workshop on Multimedia Signal
Processing 2012 (MMSP), pages 354–359, 2012. 17, 74, 78, 79, 80, 83
150 Bibliography
[41] N. Erdogmus and S. Marcel. Spoofing in 2d face recognition with 3d masks and
anti-spoofing with kinect. International Conference on Biometrics: Theory,
Applications and Systems (BTAS), pages 1–6, 2013. xi, 13, 14, 15
[42] Face-Place. http : //tarrlab.cnbc.cmu.edu/face− place. 18, 85
[43] M. F. Fallon, H. Johannsson, and J. J. Leonard. Efficient scene simulation
for robust monte carlo localization using an rgb-d camera. pages 1663–1670,
2012. 97
[44] T. C. Faltemier, K. W. Bowyer, and P. J. Flynn. Using a multi-instance
enrollment representation to improve 3d face recognition. IEEE International
Conference on Biometrics: Theory, Applications, and Systems (BTAS), pages
1–6, 2007. 99
[45] G. Farinella and J.-L. Dugelay. Demographic classification: Do gender and
ethnicity affect each other? IEEE/IAPR International Conference on Infor-
matics, Electronics & Vision (ICIEV), 2012. 109
[46] The American Society for Aesthetic Plastic Surgery. http :
//www.surgery.org/sites/default/files/Stats2010.pdf , 2010. 61, 70
[47] M. Gabel, E. Renshaw, A. Schuster, and R. Gilad-Bachrach. Full body gait
analysis with kinect. Annual International Conference of the IEEE Engineer-
ing in Medicine and Biology Society (EMBC), 2012. 97
[48] A. S. Georghiades, P. N. Belhumeur, and D. J. Kriegman. From few to many:
Illumination cone models for face recognition under variable lighting and pose.
IEEE Trans. Pattern Anal. Mach. Intelligence, 23(6):643–660, 2001. 19, 99
[49] R. Gross. Face databases. In Handbook of Face Recognition. Springer, New
York, 2005. 98
[50] R. Gross, I. Matthews, J. Cohn, T. Kanade, and S. Baker. Multi-pie. IEEE
International Conference on Automatic Face Gesture Recognition (FG), pages
1–8, 2008. 99
[51] OpenNI User Guide. http : //www.openni.org/documentation, 2010. 103
[52] Z. Guo, L. Zhang, and D. Zhang. Rotation invariant texture classification
using lbp variance (lbpv) with global matching. Elsevier Pattern Recognition,
pages 706–719, 2010. xi, 21, 24, 25, 27, 39
[53] S. Gupta, K. R. Castleman, M. K. Markey, and A. C. Bovik. Texas 3d face
recognition database. IEEE Southwest Symposium on Image Analysis Inter-
pretation (SSIAI), pages 97 –100, 2010. 66, 99
Bibliography 151
[54] J. Harguess and J. K. Aggarwal. A case for the average-half-face in 2d and 3d
for face recognition. IEEE Computer Society Conference on Computer Vision
and Pattern Recognition Workshops (CVPR Workshops), pages 7 –12, 2009.
116
[55] P. Henry, M. Krainin, E. Herbst, X. Ren, and D. Fox. Rgb-d mapping: Using
kinect-style depth cameras for dense 3d modeling of indoor environments. I.
J. Robotic Res., 31(5):647–663, 2012. 97, 109
[56] M. Hernandez, J. Choi, and G. Medioni. Laser scan quality 3-d face modeling
using a low-cost depth camera. Proceedings of the European Signal Processing
Conference, pages 1995–1999, 2012. xiii, 102, 106, 109, 110
[57] Y. Huang, Y. Wang, and T. Tan. Combining statistics of geometrical and
correlative features for 3d face recognition. Proc. of BMVC, pages 90.1–90.10,
2006. 114
[58] T. Huynh, R. Min, and J.-L. Dugelay. An efficient LBP-based descriptor for
facial depth images applied to gender recognition using RGB-D face data.
ACCV Workshop on Computer Vision with Local Binary Pattern Variants,
2012. 114
[59] S. Izadi, D. Kim, O. Hilliges, D. Molyneaux, R. A. Newcombe, P. Kohli,
J. Shotton, S. Hodges, D. Freeman, A. J. Davison, and A. W. Fitzgibbon.
Kinectfusion: real-time 3d reconstruction and interaction using a moving
depth camera. pages 559–568, 2011. 97, 109
[60] A. Jain, H. Lin, and R. Bolle. On-line fingerprint verification. IEEE Trans-
actions on Pattern Analysis and Machine Intelligence, 19(4):302 –314, 1997.
8
[61] A. K. Jain, S. C. Dass, and K. Nandakumar. Soft biometric traits for personal
recognition systems. In Biometric Authentication, volume 3072 of Lecture
Notes in Computer Science, pages 731–738. 2004. 107
[62] R. Johnson, K. O’Hara, A. Sellen, C. Cousins, and A. Criminisi. Exploring
the potential for touchless interaction in image-guided interventional radiol-
ogy. Proceedings of the SIGCHI Conference on Human Factors in Computing
Systems, pages 3323–3332, 2011. 97
[63] I. A. Kakadiaris, G. Passalis, G. Toderici, M. N. Murtuza, L. Yunliang,
N. Karampatziakis, and T. T. Theoharis. Three-dimensional face recogni-
tion in the presence of facial expressions: An annotated deformable model
approach. IEEE Trans. on Pattern Analysis and Machine Intelligence, pages
640–649, 2007. 64
[64] KeyLemon. https : //www.keylemon.com/keylemonfacesdk − liveliness −
detection/, 2013. xi, 11
152 Bibliography
[65] K. Khoshelham and S. O. Elberink. Accuracy and resolution of kinect depth
data for indoor mapping applications. Sensors, 12(2):1437–1454, 2012. 97,
104, 107, 117
[66] Y. Kim, J. Na, S. Yoon, and J. Yi. Masked fake face detection using radiance
measurements. Journal of the Optical Society of America A, pages 760–766,
2009. 14, 15, 44
[67] R. Kimmel, M. Elad, D. Shaked, R. Keshet, and I. Sobel. A variational
framework for retinex. International Journal of Computer Vision, pages 7–23,
2003. 46, 47, 48
[68] Microsoft Kinect. http : //www.xbox.com/en− US/KINECT . 97
[69] N. G. Kingsbury. Rotation-invariant local feature matching with complex
wavelets. Proc. of European Signal Processing Conference (EUSIPCO), pages
4–8, 2006. 27
[70] K. Kollreider, H. Fronthaler, and J. Bigun. Evaluating liveness by face im-
ages and the structure tensor. IEEE Workshop on Automatic Identification
Advanced Technologies, pages 75–80, 2005. 11
[71] K. Kollreider, H. Fronthaler, and J. Bigun. Verifying liveness by multiple
experts in face biometrics. IEEE Computer Society Conference on Computer
Vision and Pattern Recognition Workshops, pages 1–6, 2008. 11, 12, 13, 43
[72] N. Kose and J.-L. Dugelay. Classification of captured and recaptured images
to detect photograph spoofing. IEEE Int. Conf. on Informatics, Electronics
and Vision (ICIEV), pages 1027–1032, 2012. 2, 21, 30
[73] N. Kose and J.-L. Dugelay. Countermeasure for the protection of face recogni-
tion systems against mask attacks. IEEE Automatic Face and Gesture Recog-
nition (FG), pages 1–6, 2013. 4, 15, 34, 44, 45, 51
[74] N. Kose and J.-L. Dugelay. On the vulnerability of face recognition systems
to spoofing mask attacks. IEEE Int. Conf. on Acoustics, Speech, and Signal
Processing (ICASSP), pages 2357–2361, 2013. 4, 13, 31, 33, 34, 40, 44
[75] N. Kose and J.-L. Dugelay. Reflectance analysis based countermeasure tech-
nique to detect face mask attacks. Int. Conf. on Digital Signal Processing
(DSP), pages 1–6, 2013. 15, 34, 44, 45, 51
[76] N. Kose and J.-L. Dugelay. Shape and texture based countermeasure to pro-
tect face recognition systems against mask attacks. IEEE Computer Vision
and Pattern Recognition Workshop, on Biometrics (CVPRW), pages 111–116,
2013. 15, 34, 44, 45
Bibliography 153
[77] N. Kose and J.-L. Dugelay. Mask spoofing on face recognition and countermea-
sures. Elsevier - Image and Vision Computing Journal, under review, 2014.
15, 34, 44, 45, 46, 51
[78] N. Kose, N. Erdogmus, and J.-L. Dugelay. Block based face recognition ap-
proach robust to nose alterations. IEEE International Conference on Biomet-
rics: Theory, Applications and Systems (BTAS), pages 121–126, 2012. 17
[79] K.-C. Lee, J. Ho, M.-H. Yang, and D. Kriegman. Video-based face recognition
using probabilistic appearance manifolds. Proceedings of the IEEE computer
society conference on Computer vision and pattern recognition, pages 313–320,
2003. 99, 102, 106
[80] K.-C. Lee, J. Ho, M.-H. Yang, and D. Kriegman. Visual tracking and recogni-
tion using probabilistic appearance manifolds. Comput. Vis. Image Underst.,
99(3):303–331, 2005. 99
[81] T.-Y. Lee, Y.-N. Sun, Y.-C. Lin, L. Lin, and C. Lee. Three-dimensional facial
model reconstruction and plastic surgery simulation. IEEE Transactions on
Information Technology in Biomedicine, pages 214–220, 1999. 63
[82] J. Li, Y. Wang, T. Tan, and et al. Live face detection based on the analysis
of fourier spectra. Proceedings of the SPIE, pages 296–303, 2004. 12, 23
[83] J. Liu, J. Chen, and J. Ye. Large-scale sparse logistic regression. ACM
SIGKDD International Conference On Knowledge Discovery and Data Min-
ing, 2009. 29
[84] Y. Liu, R. L. Weaver, K. Schmidt, N. Serban, and J. Cohn. Facial asymmetry:
A new biometric. 2001. 116
[85] D. G. Lowe. Distinctive image features from scale-invariant keypoints. Int. J.
Comput. Vision, 60(2):91–110, 2004. 19, 98, 109, 110
[86] X. Lu, H. Chen, and A. K. Jain. Multimodal facial gender and ethnicity
identification. pages 554–561, 2006. 109
[87] J. Määtta, A. Hadid, and M. Pietikainen. Face spoofing detection from sin-
gle images using micro-texture analysis. Proc. of IEEE Int. Joint Conf. on
Biometrics (IJCB), pages 1–7, 2011. 10, 12, 30, 49, 50
[88] J. Määtta, A. Hadid, and M. Pietikainen. Face spoofing detection from single
images using texture and local shape analysis. IET Biometrics, pages 3–10,
2012. 12, 30
[89] M. De Marsico, M. Nappi, D. Riccio, and J.-L. Dugelay. Moving face spoofing
detection via 3d projective invariants. IAPR Int. Conf. on Biometrics, pages
73–78, 2012. 11
154 Bibliography
[90] M. De Marsico, M. Nappi, D. Riccio, and H. Wechsler. Robust face recognition
after plastic surgery using local region analysis. Lecture Notes in Computer
Science - Image Analysis and Recognition, pages 191–200, 2011. 17, 73
[91] A. M. Martinez and R. Benavente. The ar face database. CVC Technical
Report, (24), 1998. xi, 18, 19, 99, 100, 108, 115
[92] L. Z. McArthur and K. Apatow. Impressions of baby-faced adults. Social
Cognition, 2(4):315–342, 1984. 89
[93] G. Medioni and R. Waupotitsch. Face modeling and recognition in 3-d. pages
232–, 2003. 20, 98, 100, 110, 111
[94] K. Messer, J. Matas, J. Kittler, and K. Jonsson. Xm2vtsdb: The extended
m2vts database. International Conference on Audio and Video-based Biomet-
ric Person Authentication, pages 72–77, 1999. 99
[95] R. Min, J. Choi, G. Medioni, and J.-L. Dugelay. Real-time 3D face identifica-
tion from a depth camera. International Conference on Pattern Recognition
(ICPR), pages 1739–1742, 2012. 9, 106
[96] R. Min, A. Hadid, and J.-L. Dugelay. Improving the recognition of faces oc-
cluded by facial accessories. IEEE Conference on Automatic Face and Gesture
Recognition (FG), pages 442–447, 2011. 94, 96, 116
[97] A. B. Moreno and A. Sánchez. Gavabdb: a 3d face database. Workshop on
Biometrics on the Internet, pages 77–85, 2004. 99
[98] MORPHO. http : //www.morpho.com/, 2010. xii, 34, 44, 49, 121
[99] Multimedia and Intelligent Software Technology Beijing Municipal Key Lab-
oratory. The bjut-3d large-scale chinese face database. Technical Report. 99
[100] B. C. Munsell, A. Temlyakov, C. Qu, and S. Wang. Person identification using
full-body motion and anthropometric biometrics from kinect videos. ECCV
Workshops (3), 7585:91–100, 2012. 97
[101] University of York Database. http : //www − users.cs.york.ac.uk/ ∼
nep/research/3Dface/tomh/3DFaceDatabase.html. 99
[102] T. Ojala, M. Pietikainen, and T. Maenpaa. Multiresolution gray-scale and ro-
tation invariant texture classification with local binary patterns. IEEE Trans-
actions on Pattern Analysis and Machine Intelligence, pages 971–987, 2002.
24, 26
[103] G. P. Otto and T. K. W. Chau. ‘region-growing’ algorithm for matching of
terrain images. Image Vision Comput., 7(2):83–94, 1989. 99
Bibliography 155
[104] S. Pamudurthy, E. Guan, K. Mueller, and M. Rafailovich. Dynamic approach
for face recognition using digital image skin correlation. Audio and Video
based Biometric Person Authentication, pages 1010–1018, 2005. 19
[105] G. Pan, L. Sun, Z. Wu, and S. Lao. Eyeblink-based antispoofing in face
recognition from a generic webcamera. IEEE Int. Conf. on Computer Vision
(ICCV), pages 1–8, 2007. 12
[106] D. I. Perrett, D. M. Burt, I. S. P. Voak, K. J. Lee, D. A. Rowland, and R. Ed-
wards. Symmetry and human facial attractiveness. Evolution and Human
Behavior, 20:295–307, 1999. 89
[107] P. J. Phillips, P. J. Flynn, T. Scruggs, K. W. Bowyer, J. Chang, K. Hoff-
man, J. Marques, J. Min, and W. Worek. Overview of the face recognition
grand challenge. IEEE Computer Society Conference on Computer Vision and
Pattern Recognition (CVPR), 1:947–954, 2005. 9, 17, 41, 63, 99, 100, 107
[108] P. J. Phillips, H. Moon, P. Rauss, and S. A. Rizvi. The feret evaluation
methodology for face-recognition algorithms. Proceedings of Conference on
Computer Vision and Pattern Recognition (CVPR), pages 137–143, 1997. 9,
99
[109] J. Preis, M. Kessel, M. Werner, and C. Linnhoff-Popien. Gait recognition with
kinect. Proceedings of the First Workshop on Kinect in Pervasive Computing,
2012. 97
[110] Sculpteo 3D Printing. http : //www.sculpteo.com/en/, 2009. 34
[111] TABULA RASA Project. http : //www.tabularasa − euproject.org/, 2010.
13, 33, 34, 37, 44, 111, 121
[112] S. A. Rabi and P. Aarabi. Face fusion: An automatic method for virtual
plastic surgery. International Conference on Information Fusion, pages 1–7,
2006. 63
[113] N. Ramanathan, A. Chowdhury, and R. Chellappa. Facial similarity across
age, disguise, illumination and pose. International Conference on Image Pro-
cessing, pages 1999–2002, 2004. 18
[114] Face recognition homepage. http : //www.face− rec.org/databases. 18, 85,
98
[115] G. Rhodes, A. Sumich, and G. Byatt. Are average facial configurations attrac-
tive only because of their symmetry? Psychological Science, 10:52–58, 1999.
89
[116] E. Rosten and T. Drummond. Machine learning for high-speed corner detec-
tion. pages 430–443, 2006. 109
156 Bibliography
[117] F. S. Samaria and A. C. Harter. Parameterisation of a stochastic model for
human face identification. Proceedings of the IEEE Workshop on Applications
of Computer Vision, pages 138 –142, 1994. 99
[118] A. Savran, N. Alyüz, H. Dibeklioğlu, O. Çeliktutan, B. Gökberk, B. Sankur,
and L. Akarun. Biometrics and identity management. Bosphorus Database
for 3D Face Analysis, pages 47–56, 2008. 100, 115
[119] K. Scherbaum, T. Ritschel, M. Hullin, T. Thormählen, V. Blanz, and H.-P.
Seidel. Computer-suggested facial makeup. Comp. Graph. Forum (Proc. of
Eurographics 2011), 30(2), 2011. 17, 85
[120] Cinema Secrets. http : //www.cinemasecrets.com. xii, 62
[121] H. Sellahewa and S. A. Jassim. Image-quality-based adaptive face recogni-
tion. IEEE Transactions on Instrumentation and Measurement, 59(4):805–
813, 2010. 96
[122] Minolta Sensor. http : //www.konicaminolta.com/. 9, 99
[123] J. Shotton, A. Fitzgibbon, M. Cook, T. Sharp, M. Finocchio, R. Moore,
A. Kipman, and A. Blake. Real-time human pose recognition in parts from
single depth images. Proceedings of the IEEE Conference on Computer Vision
and Pattern Recognition, pages 1297–1304, 2011. 97
[124] P. Silva and A.-S. Rosa. Face recognition based on eigeneyes. Pattern Recog-
nition and Image Analysis, pages 335–338, 2003. 18
[125] K. R. Singh, R. S. Khedgaonkar, and S. P. Gawande. A new approach to
local plastic surgery face recognition using near sets. International Journal
of Engineering Science and Technology, NCICT Special Issue, pages 71–75,
2011. 17, 73
[126] R. Singh and M. Vatsa. Effect of plastic surgery on face recognition: A pre-
liminary study. IEEE Computer Society Conference on Computer Vision and
Pattern Recognition Workshops, pages 72–77, 2009. 15, 16, 62, 73, 74, 78, 80,
83
[127] R. Singh, M. Vatsa, H. S. Bhatt, S. Bharadwaj, A. Noore, and S. S. Nooreyez-
dan. Plastic surgery: A new dimension to face recognition. IEEE Transactions
on Information Forensics and Security, pages 441–448, 2010. xi, 16, 62, 65,
66, 67, 73, 74, 78, 79, 80, 83
[128] R. Singh, M. Vatsa, and A. Noore. Face recognition with disguise and single
gallery images. Image and Vision Computing, pages 245–257, 2008. 18, 19
[129] R. Singh, M. Vatsa, and A. Noore. Recognizing face images with disguise
variations. Recent Advances in Face Recognition, pages 149–160, 2008. 18
Bibliography 157
[130] E. Stone and M. Skubic. Evaluation of an inexpensive depth camera for in-
home gait assessment. J. Ambient Intell. Smart Environ., 3(4):349–361, 2011.
97
[131] X. Tan, Y. Li, J. Liu, and L. Jiang. Face liveness detection from a single image
with sparse low rank bilinear discriminative model. Proc. of the European
conference on Computer vision, pages 504–517, 2010. xi, xiii, 12, 22, 23, 26,
28, 29, 31, 129
[132] ThatsMyFace. http : //www.thatsmyface.com/Products/products.html. xi,
13, 34, 35
[133] Behind the Knife: A Guide to Plastic Surgery. http : //behind−the−knife−
cosmetic− surgery.blogspot.com. xii, 62
[134] C. Tomasi and R. Manduchi. Bilateral filtering for gray and color images.
International Conference on Computer Vision, pages 839–846, 1998. 109
[135] R. Tsai. An efficient and accurate camera calibration technique for 3d machine
vision. Computer Vision and Pattern Recognition, 1986. 105
[136] S. Ueda and T. Koyama. Influence of make-up on facial recognition. Percep-
tion, 39(2):260–264, 2010. 86
[137] C. Velardo and J.-L. Dugelay. Real time extraction of body soft biometric from
3d videos. Proceedings of the ACM international conference on Multimedia,
pages 781–782, 2011. 97
[138] videoyoutube. http : //www.youtube.com/watch?v = rNQ2oDEyV Nw. xii,
86
[139] L. Yin, X. Wei, Y. Sun, J. Wang, and M. J. Rosato. A 3d facial expres-
sion database for facial behavior research. IEEE International Conference on
Automatic Face and Gesture Recognition, pages 211–216, 2006. 99
[140] W. Zhang, S. Shan, W. Gao, X. Chen, and H. Zhang. Local gabor binary
pattern histogram sequence (lgbphs): a novel non-statistical model for face
representation and recognition. IEEE International Conference on Computer
Vision (ICCV), 1:786–791, 2005. 19, 20, 98, 110, 113
[141] Z. Zhang. Microsoft kinect sensor and its effect. IEEE MultiMedia, 19(2):4
–10, 2012. 97, 107
[142] Z. Zhang, D. Yi, and et.al. Face liveness detection by learning multispectral
reflectance distributions. IEEE Automatic Face and Gesture Recognition (FG),
pages 436–441, 2011. 14, 15, 44
[143] J. Zhao, H. Wang, H. Ren, and S.-C. Kee. Lbp discriminant analysis for face
verification. Proc. of IEEE Computer Society Conference on Computer Vision
and Pattern Recognition (CVPRW), pages 167–173, 2005. 39

158 Bibliography
[144] W. Zhao, R. Chellappa, P. J. Phillips, and A. Rosenfeld. Face recognition: A
literature survey. ACM Comput. Surv., 35(4):399–458, 2003. 8
[145] M. Zollhöfer, M. Martinek, G. Greiner, M. Stamminger, and J. Sübmuth.
Automatic reconstruction of personalized avatars from 3d face scans. Comput.
Animat. Virtual Worlds, 22(2-3):195–202, 2011. 109


![[pastel-00005733, v1] Techniques d'ingénierie de trafic](https://img.pdfslide.net/doc/110x75/633409ec4e43a4bcd80d0c26/pastel-00005733-v1-techniques-dingenierie-de-trafic-.jpg)


