Embed Size (px)
Citation preview
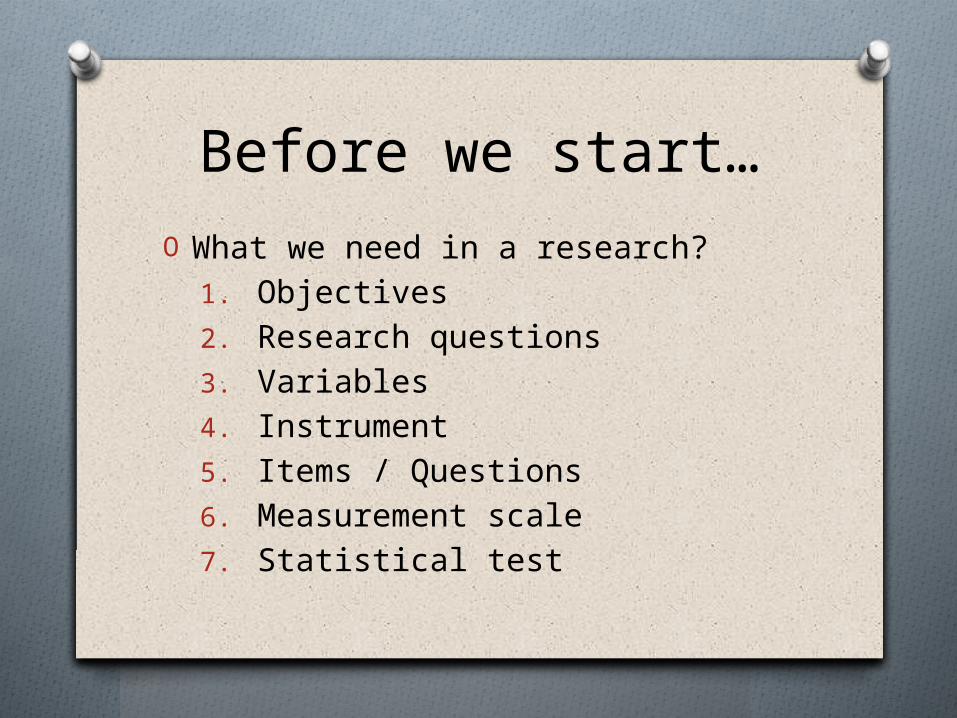
Before we start…O What we need in a research?
1. Objectives2. Research questions3. Variables 4. Instrument5. Items / Questions 6. Measurement scale7. Statistical test
Objectives / Research question
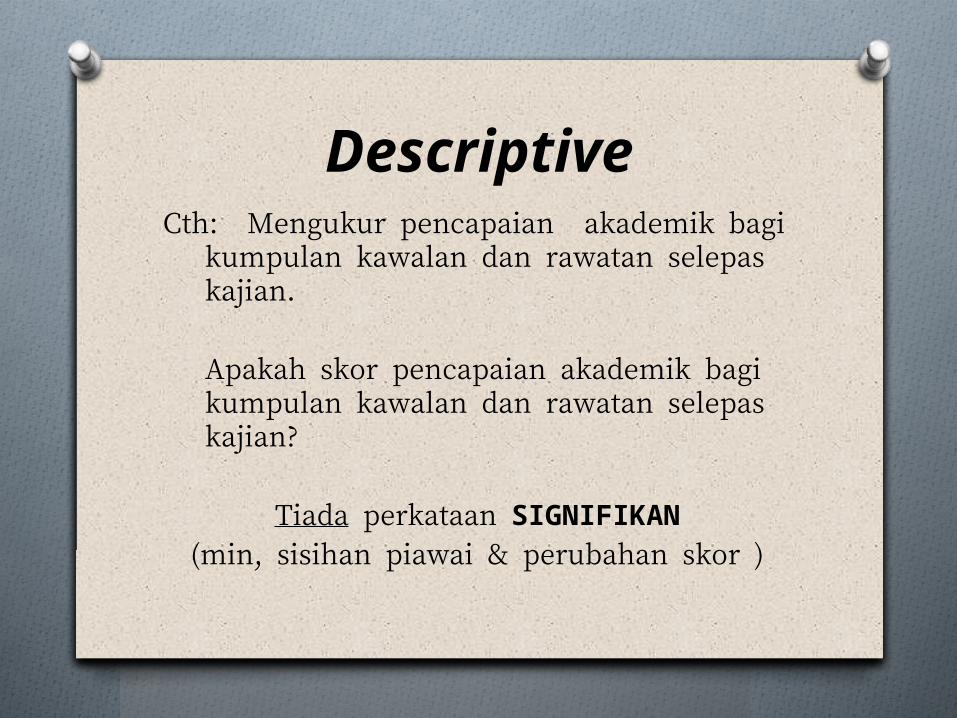
DescriptiveCth: Mengukur pencapaian akademik bagi
kumpulan kawalan dan rawatan selepas kajian.
Apakah skor pencapaian akademik bagi kumpulan kawalan dan rawatan selepas kajian?
Tiada perkataan SIGNIFIKAN(min, sisihan piawai & perubahan skor )
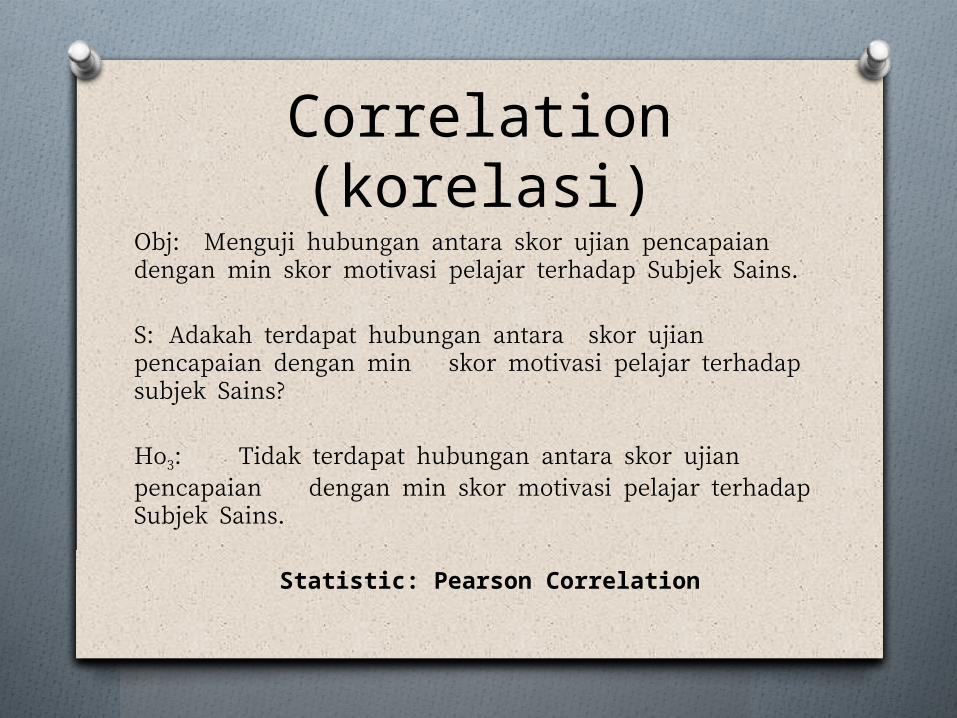
Correlation (korelasi)
Obj: Menguji hubungan antara skor ujian pencapaian dengan min skor motivasi pelajar terhadap Subjek Sains.
S: Adakah terdapat hubungan antara skor ujian pencapaian dengan min skor motivasi pelajar terhadap subjek Sains?
Ho3: Tidak terdapat hubungan antara skor ujian pencapaian dengan min skor motivasi pelajar terhadap Subjek Sains.
Statistic: Pearson Correlation
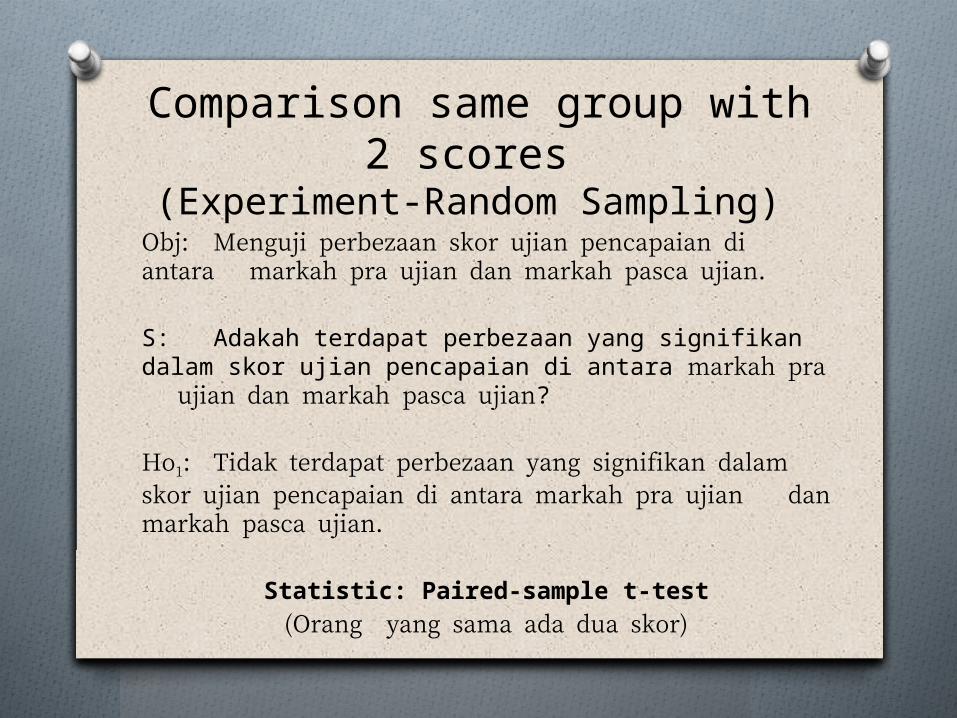
Comparison same group with 2 scores
(Experiment-Random Sampling) Obj: Menguji perbezaan skor ujian pencapaian di antara markah pra ujian dan markah pasca ujian.
S: Adakah terdapat perbezaan yang signifikan dalam skor ujian pencapaian di antara markah pra
ujian dan markah pasca ujian?
Ho1: Tidak terdapat perbezaan yang signifikan dalam skor ujian pencapaian di antara markah pra ujian dan markah pasca ujian.
Statistic: Paired-sample t-test(Orang yang sama ada dua skor)
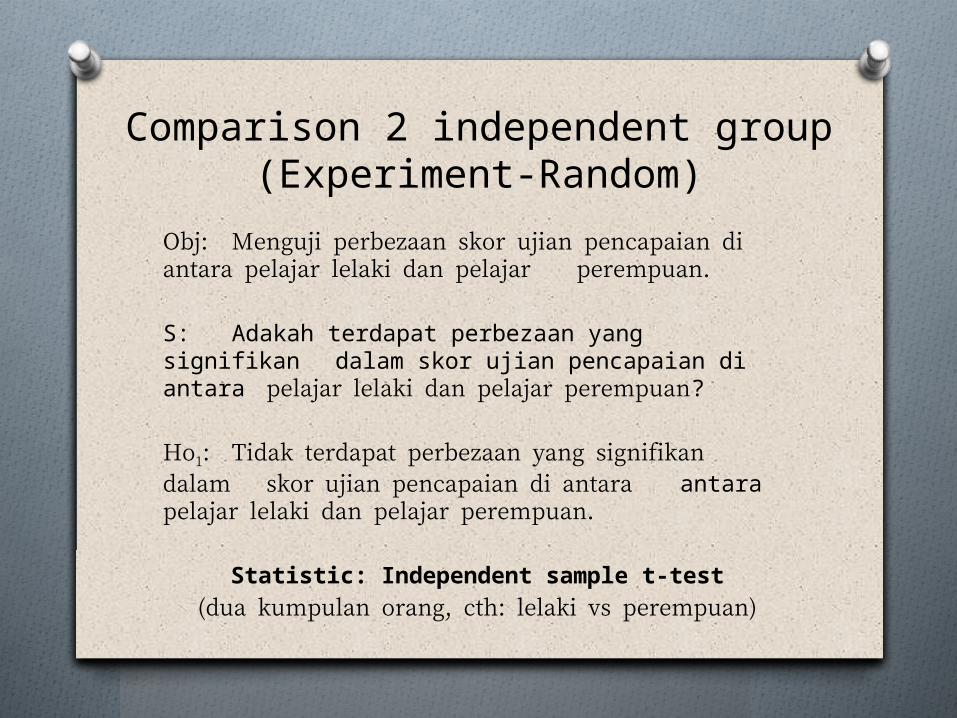
Comparison 2 independent group(Experiment-Random)
Obj: Menguji perbezaan skor ujian pencapaian di antara pelajar lelaki dan pelajar perempuan.
S: Adakah terdapat perbezaan yang signifikan dalam skor ujian pencapaian di antara pelajar lelaki dan pelajar perempuan?
Ho1: Tidak terdapat perbezaan yang signifikan dalam skor ujian pencapaian di antara antara pelajar lelaki dan pelajar perempuan.
Statistic: Independent sample t-test(dua kumpulan orang, cth: lelaki vs perempuan)
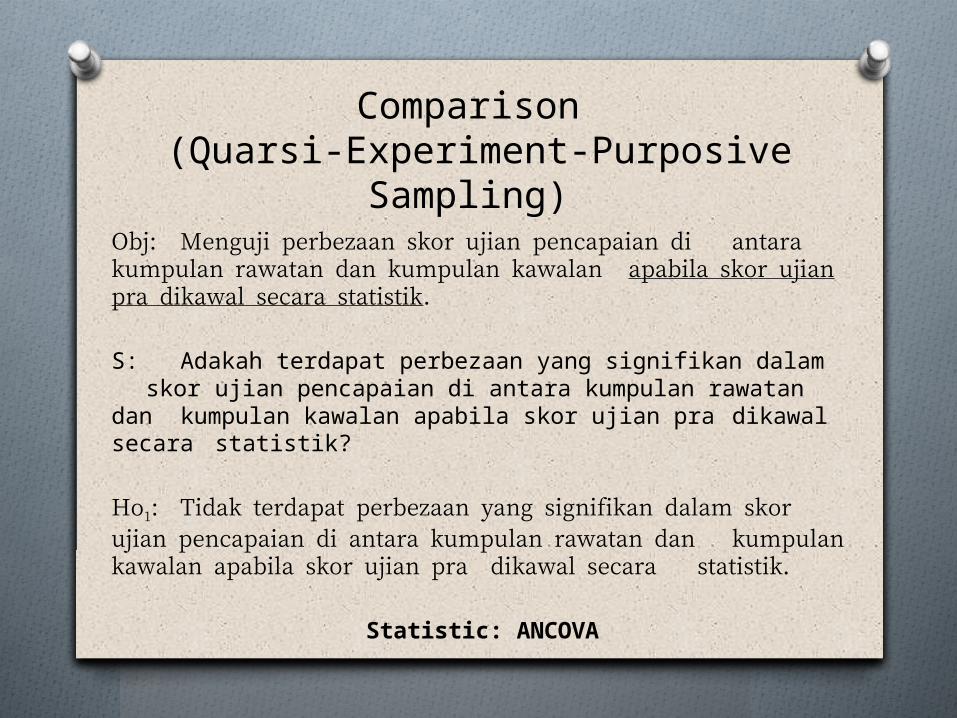
Comparison (Quarsi-Experiment-Purposive
Sampling) Obj: Menguji perbezaan skor ujian pencapaian di antara kumpulan rawatan dan kumpulan kawalan apabila skor ujian pra dikawal secara statistik.
S: Adakah terdapat perbezaan yang signifikan dalam skor ujian pencapaian di antara kumpulan rawatan
dan kumpulan kawalan apabila skor ujian pra dikawal secara statistik?
Ho1: Tidak terdapat perbezaan yang signifikan dalam skor ujian pencapaian di antara kumpulan rawatan dan kumpulan kawalan apabila skor ujian pra dikawal secara statistik.
Statistic: ANCOVA
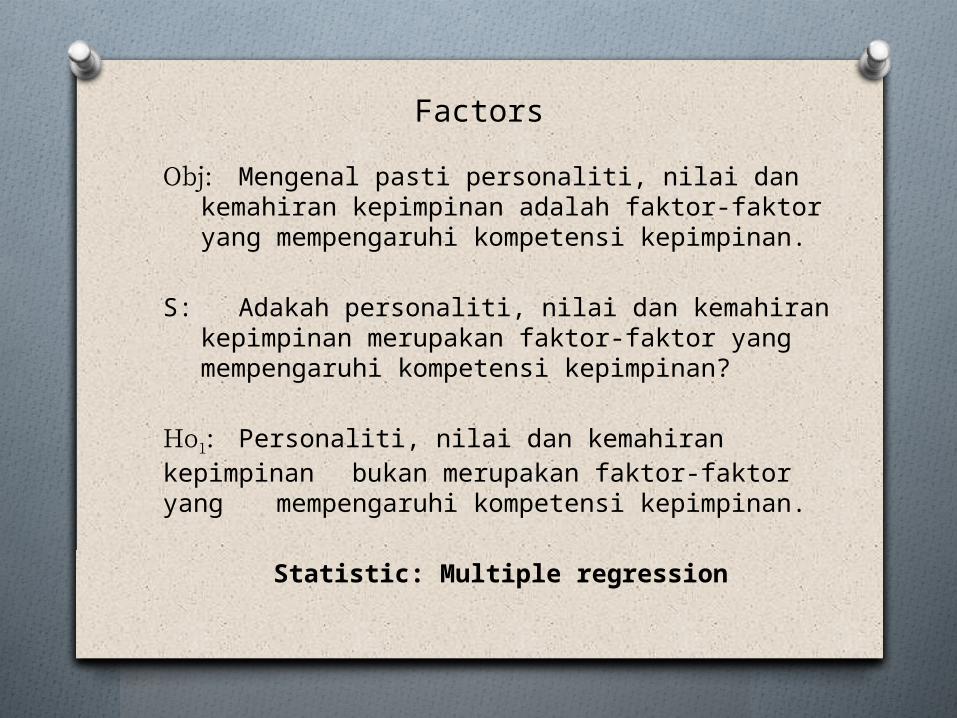
Factors
Obj: Mengenal pasti personaliti, nilai dan kemahiran kepimpinan adalah faktor-faktor yang mempengaruhi kompetensi kepimpinan.
S: Adakah personaliti, nilai dan kemahiran kepimpinan merupakan faktor-faktor yang mempengaruhi kompetensi kepimpinan?
Ho1: Personaliti, nilai dan kemahiran kepimpinan bukan merupakan faktor-faktor yang mempengaruhi kompetensi kepimpinan.
Statistic: Multiple regression
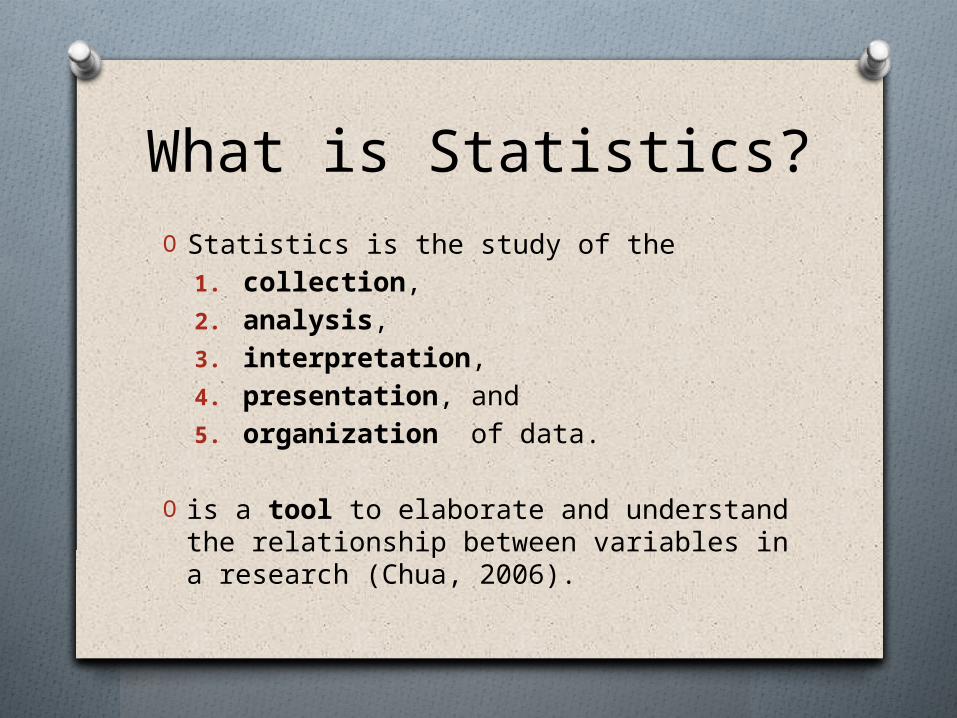
What is Statistics?O Statistics is the study of the
1. collection, 2. analysis, 3. interpretation, 4. presentation, and 5. organization of data.
O is a tool to elaborate and understand the relationship between variables in a research (Chua, 2006).
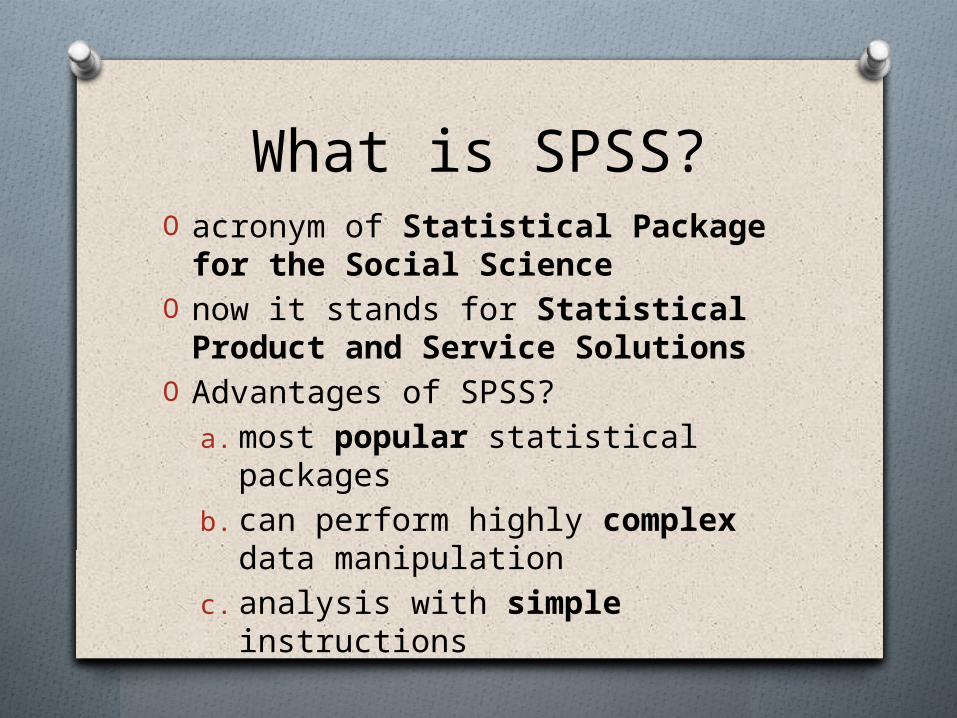
What is SPSS?O acronym of Statistical Package for the Social Science
O now it stands for Statistical Product and Service Solutions
O Advantages of SPSS?a. most popular statistical
packages b. can perform highly complex
data manipulation c. analysis with simple
instructions
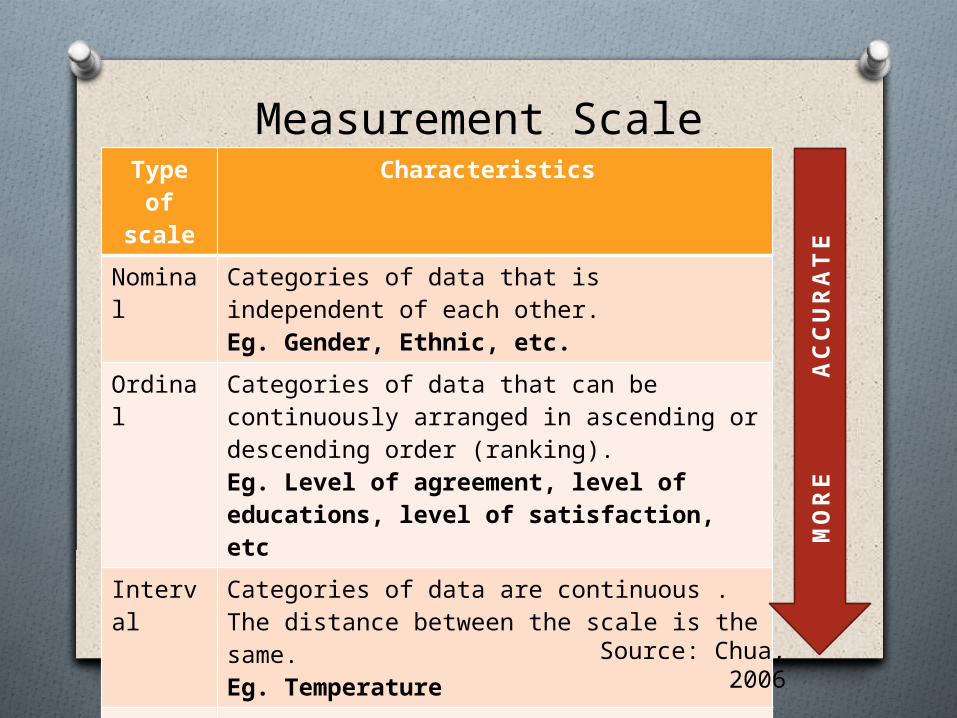
Measurement ScaleType of
scale
Characteristics
Nominal
Categories of data that is independent of each other.Eg. Gender, Ethnic, etc.
Ordinal
Categories of data that can be continuously arranged in ascending or descending order (ranking).Eg. Level of agreement, level of educations, level of satisfaction, etc
Interval
Categories of data are continuous .The distance between the scale is the same.Eg. Temperature
Ratio Categories of data are continuous .The distance between the scale is the same.True zero.Eg. Length, Weight, IQ, Marks
MORE
ACC
URAT
E
Source: Chua, 2006
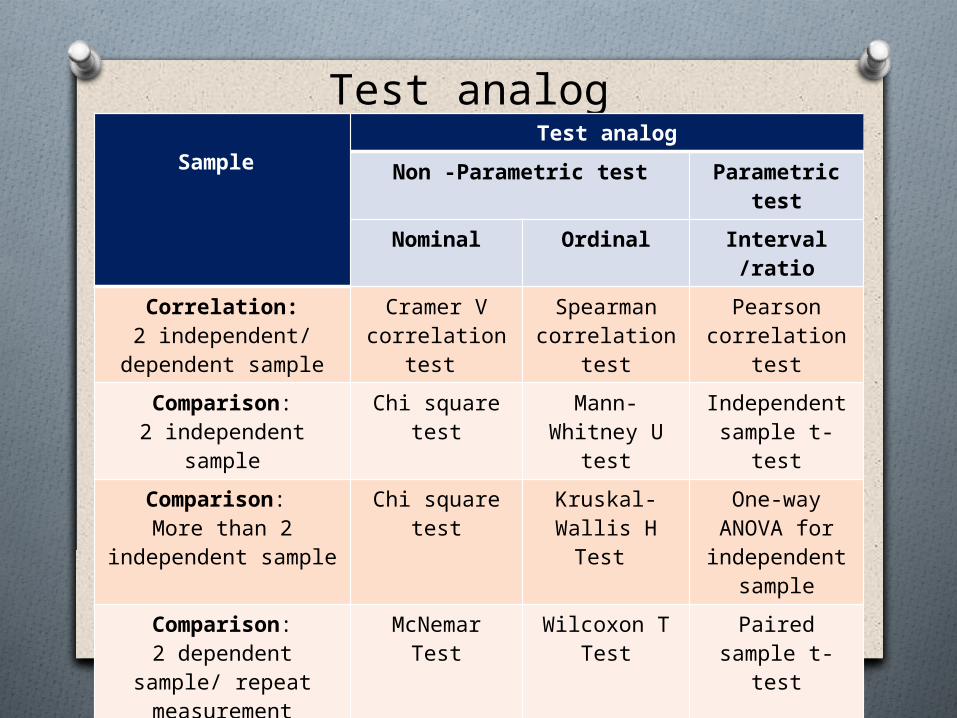
Test analog Sample
Test analogNon -Parametric test Parametric
testNominal Ordinal Interval
/ratioCorrelation:2 independent/
dependent sample
Cramer V correlation
test
Spearman correlation
test
Pearson correlation
testComparison:
2 independent sample
Chi square test
Mann-Whitney U
test
Independent sample t-
testComparison: More than 2
independent sample
Chi square test
Kruskal-Wallis H Test
One-way ANOVA for
independent sample
Comparison:2 dependent
sample/ repeat measurement
McNemar Test
Wilcoxon T Test
Paired sample t-
test
Comparison:More than 2
dependent sample / repeat measurement
Cochran Test
Friedman Test
One Way ANOVA for repeat
measurement
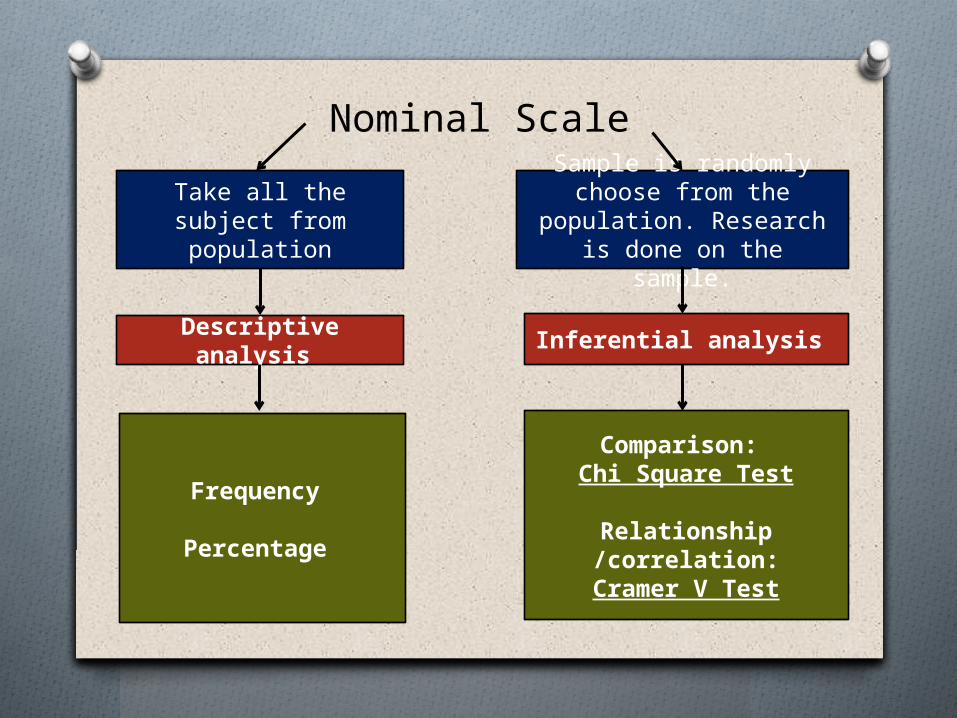
Nominal ScaleTake all the subject from population
Sample is randomly choose from the
population. Research is done on the
sample.Descriptive analysis Inferential analysis
Frequency
Percentage
Comparison: Chi Square Test
Relationship /correlation:Cramer V Test
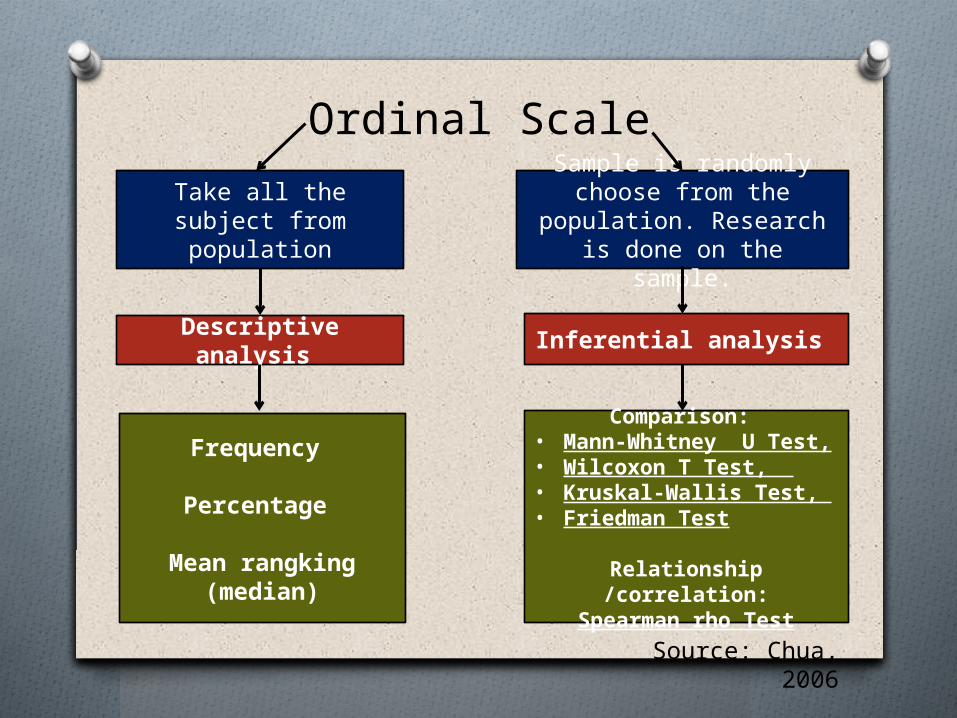
Ordinal ScaleTake all the subject from population
Sample is randomly choose from the
population. Research is done on the
sample.Descriptive analysis Inferential analysis
Frequency
Percentage
Mean rangking (median)
Comparison: • Mann-Whitney U Test,• Wilcoxon T Test, • Kruskal-Wallis Test, • Friedman Test
Relationship /correlation:
Spearman rho TestSource: Chua,
2006
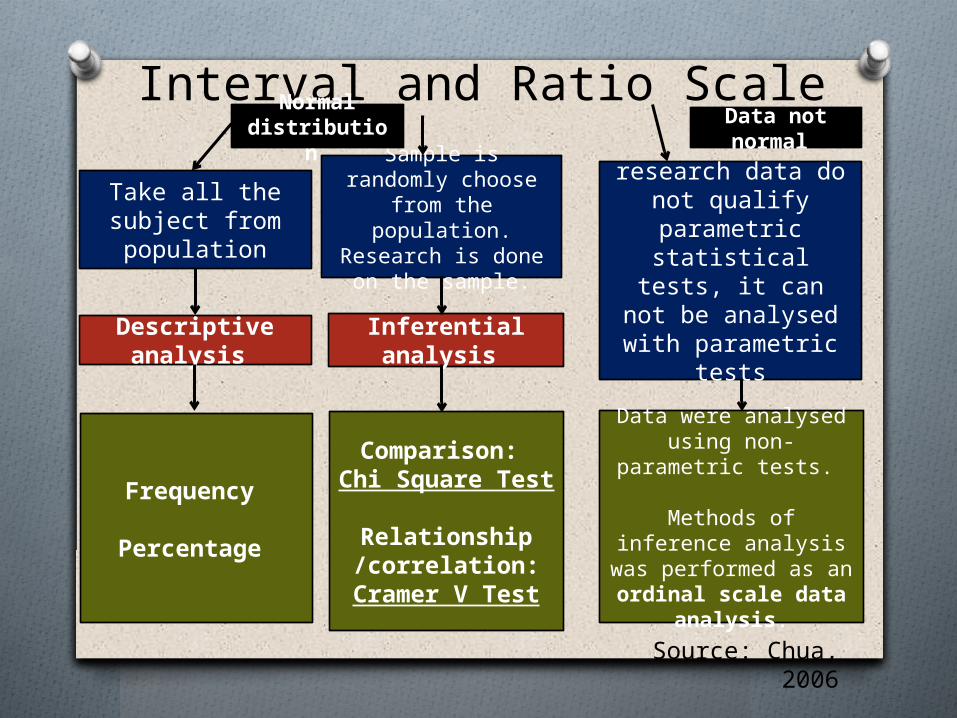
Interval and Ratio Scale
Take all the subject from population
Descriptive analysis
Frequency
Percentage
Sample is randomly choose
from the population.
Research is done on the sample.
Inferential analysis
Comparison: Chi Square Test
Relationship /correlation:Cramer V Test
research data do not qualify parametric statistical tests, it can not be analysed with parametric
testsData were analysed
using non-parametric tests.
Methods of inference analysis was performed as an ordinal scale data
analysis.
Normal distributio
n Data not normal
Source: Chua, 2006
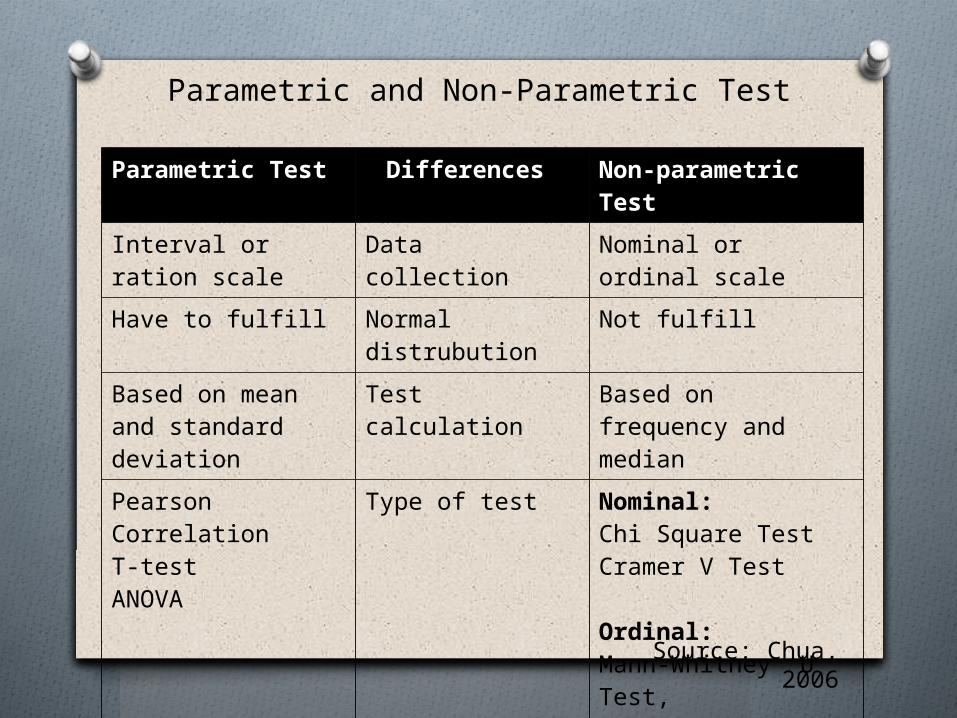
Parametric and Non-Parametric Test
Parametric Test Differences Non-parametric Test
Interval or ration scale
Data collection
Nominal or ordinal scale
Have to fulfill Normal distrubution
Not fulfill
Based on mean and standard deviation
Test calculation
Based on frequency and median
Pearson CorrelationT-testANOVA
Type of test Nominal: Chi Square TestCramer V Test
Ordinal:Mann-Whitney U Test,Wilcoxon T Test, Kruskal-Wallis Test, Friedman TestSpearman rho Test
Source: Chua, 2006
TYPE OF STATISTICSO Statistik DeskriptifO Statistik Inferensi
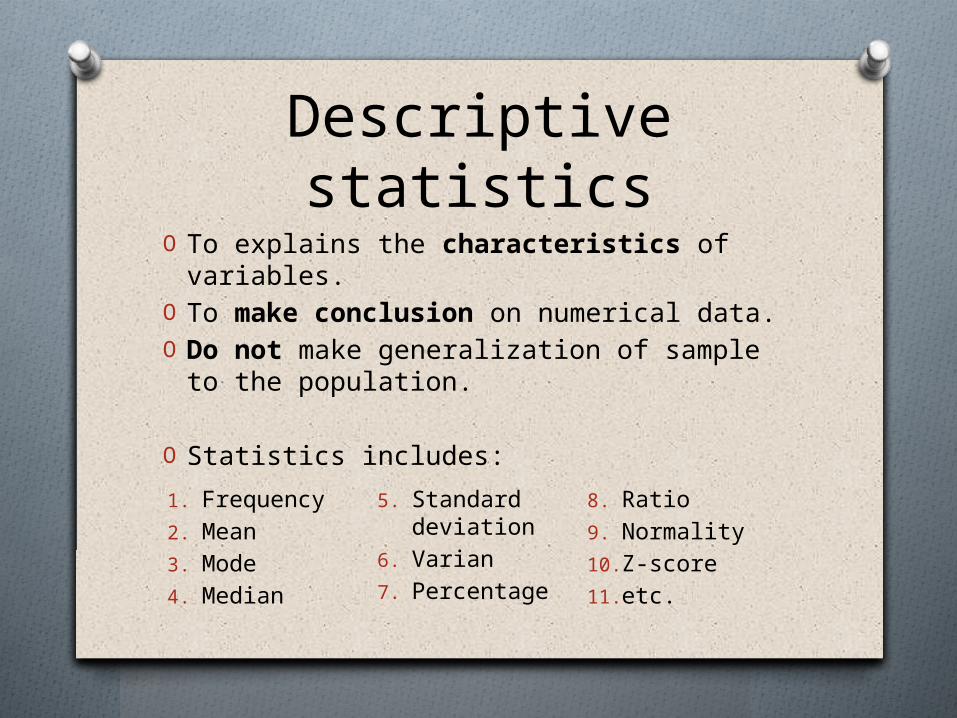
Descriptive statistics
O To explains the characteristics of variables.
O To make conclusion on numerical data.O Do not make generalization of sample to the population.
O Statistics includes:1. Frequency2. Mean3. Mode4. Median
5. Standard deviation
6. Varian7. Percentage
8. Ratio9. Normality10.Z-score11.etc.
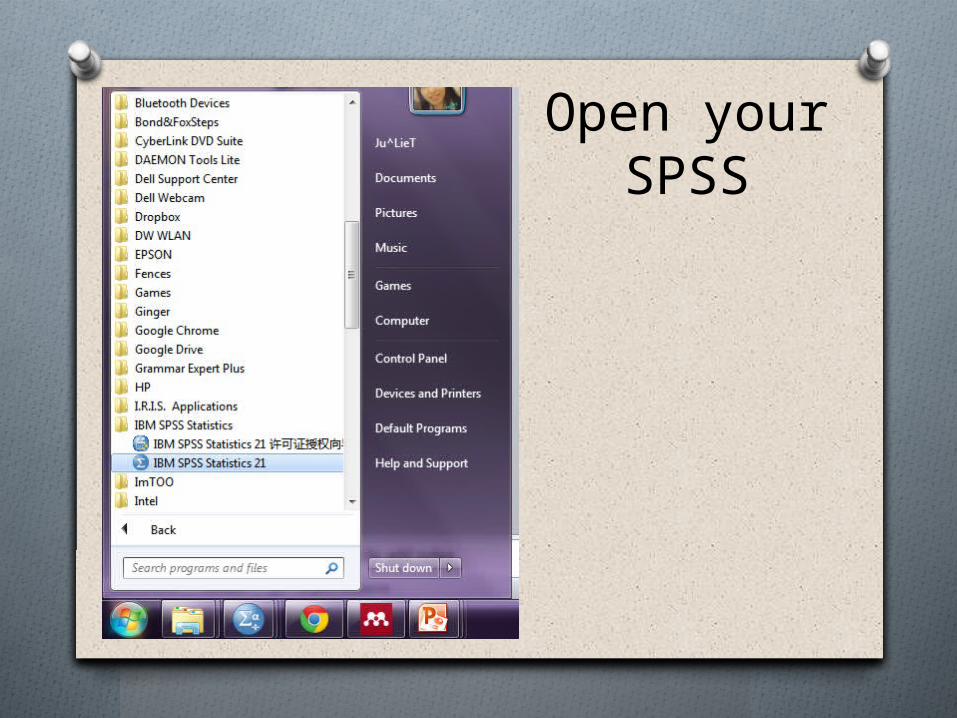
Open your SPSS
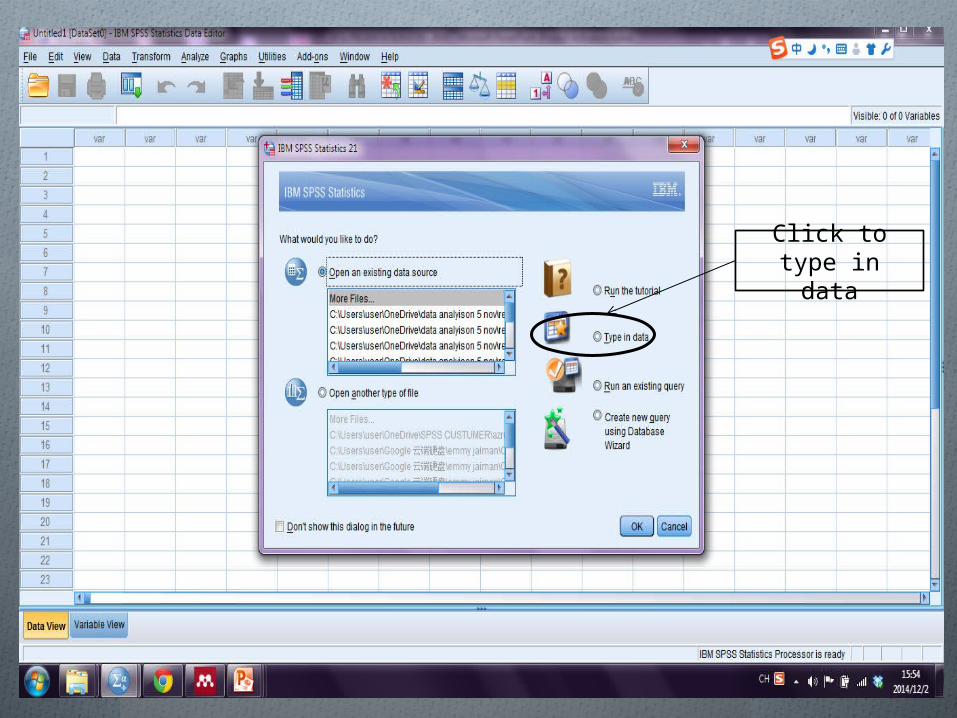
Click to type in data
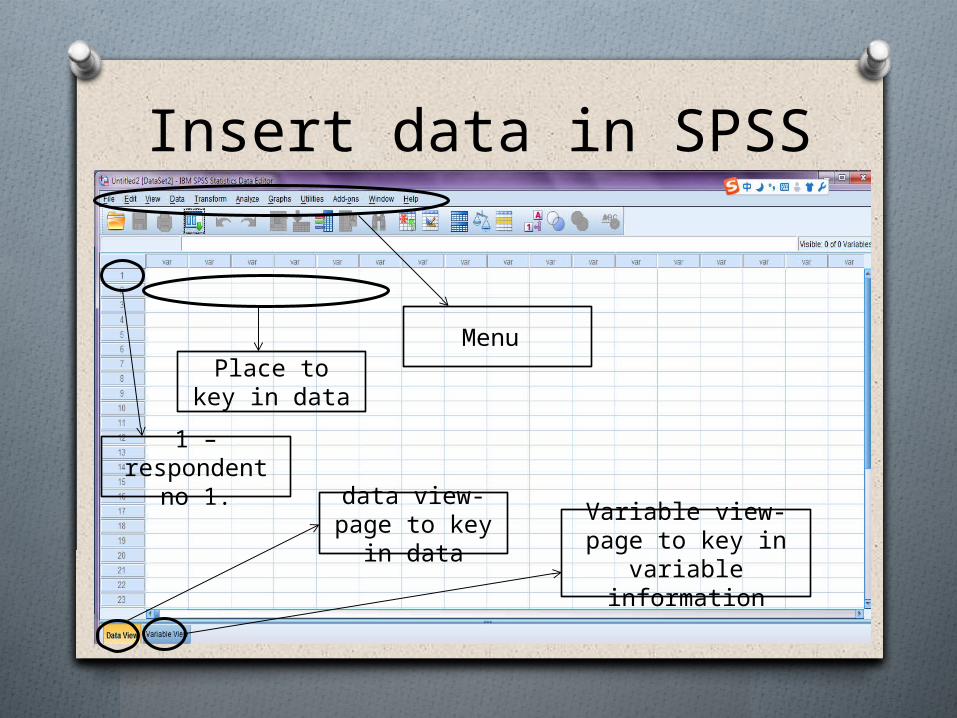
Insert data in SPSS
Menu Place to
key in data1 –
respondent no 1. data view-
page to key in data
Variable view- page to key in
variable information
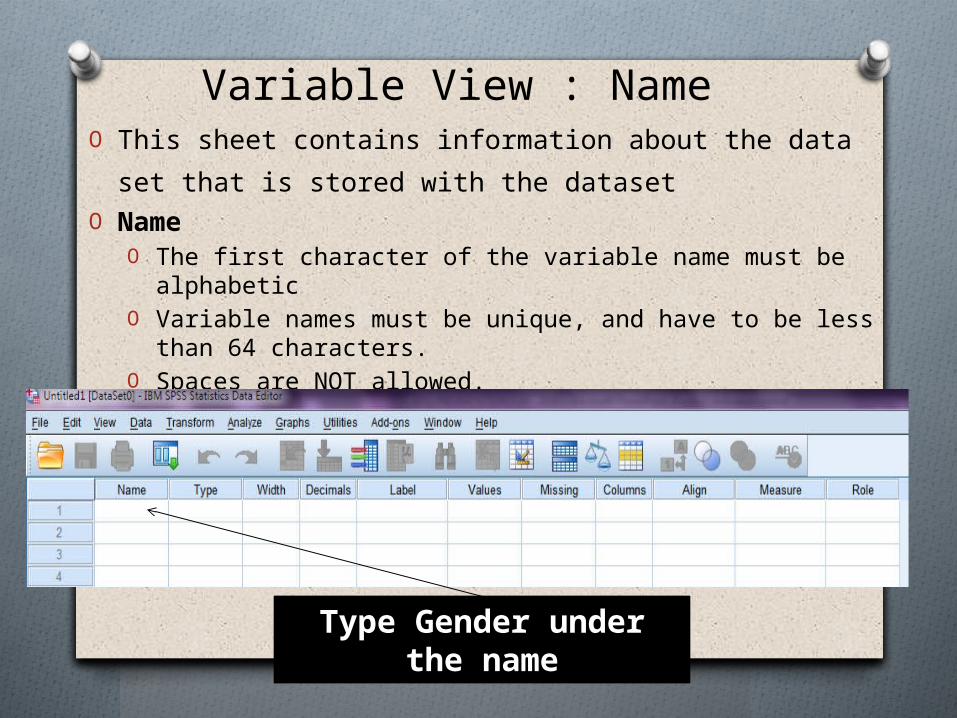
Variable View : NameO This sheet contains information about the data set that is stored with the dataset
O NameO The first character of the variable name must be alphabetic
O Variable names must be unique, and have to be less than 64 characters.
O Spaces are NOT allowed.
Type Gender under the name
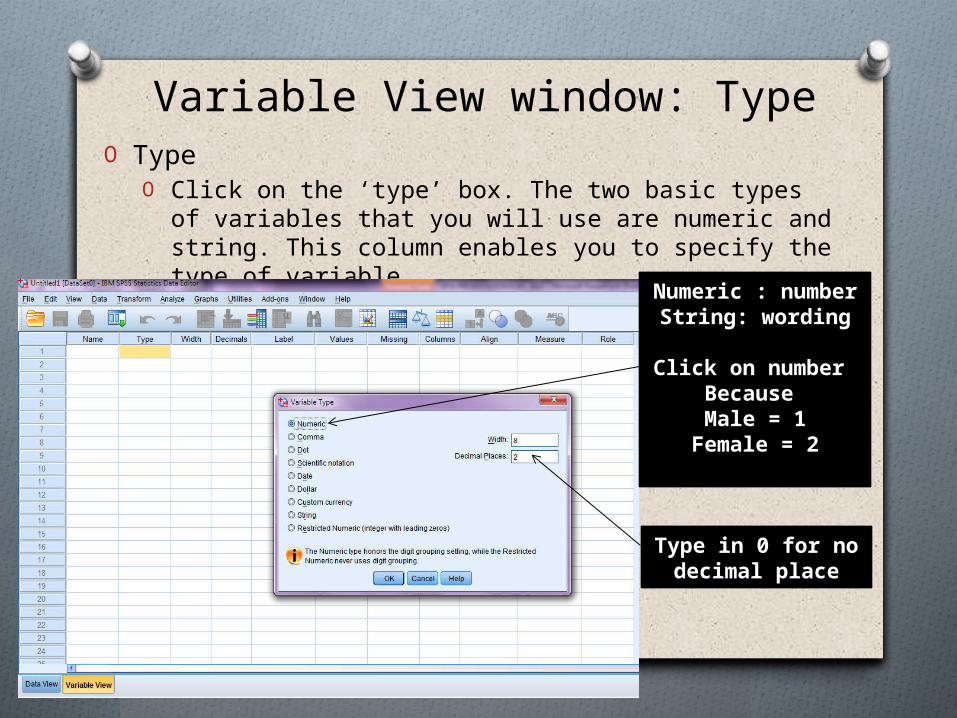
Variable View window: TypeO Type
O Click on the ‘type’ box. The two basic types of variables that you will use are numeric and string. This column enables you to specify the type of variable. Numeric : number
String: wording
Click on number Because Male = 1
Female = 2
Type in 0 for no decimal place
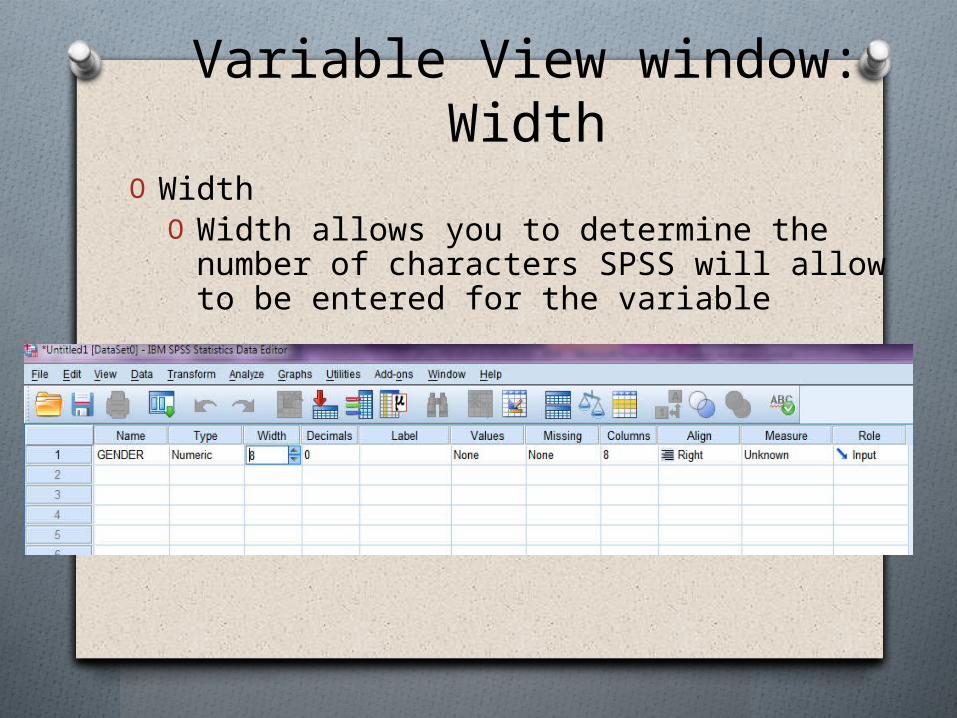
Variable View window: Width
O WidthO Width allows you to determine the number of characters SPSS will allow to be entered for the variable
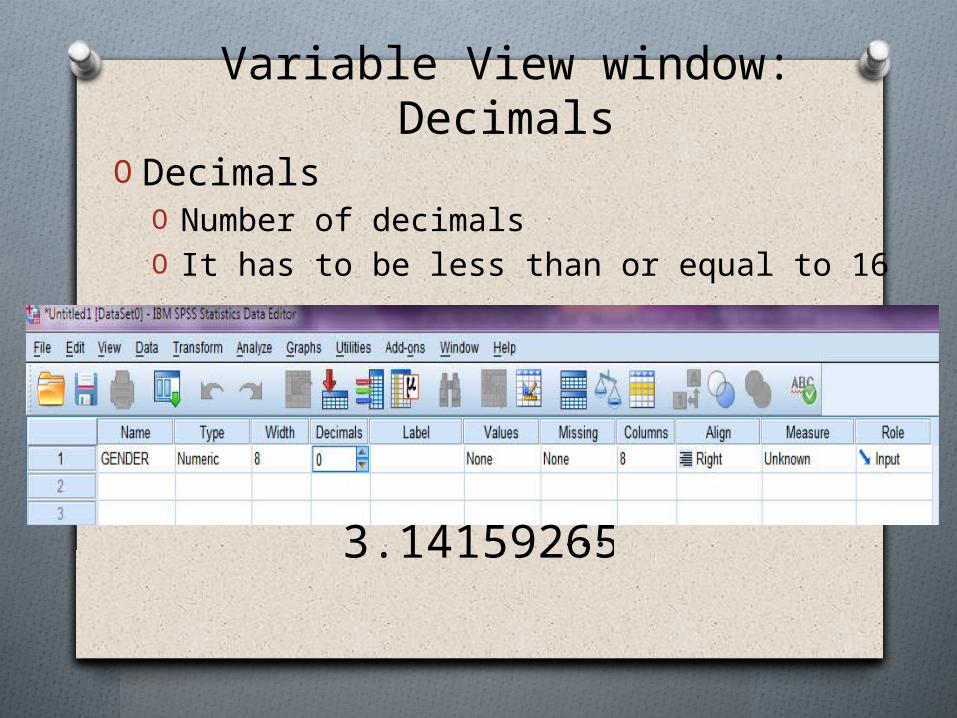
Variable View window: Decimals
O DecimalsO Number of decimalsO It has to be less than or equal to 16
3.14159265
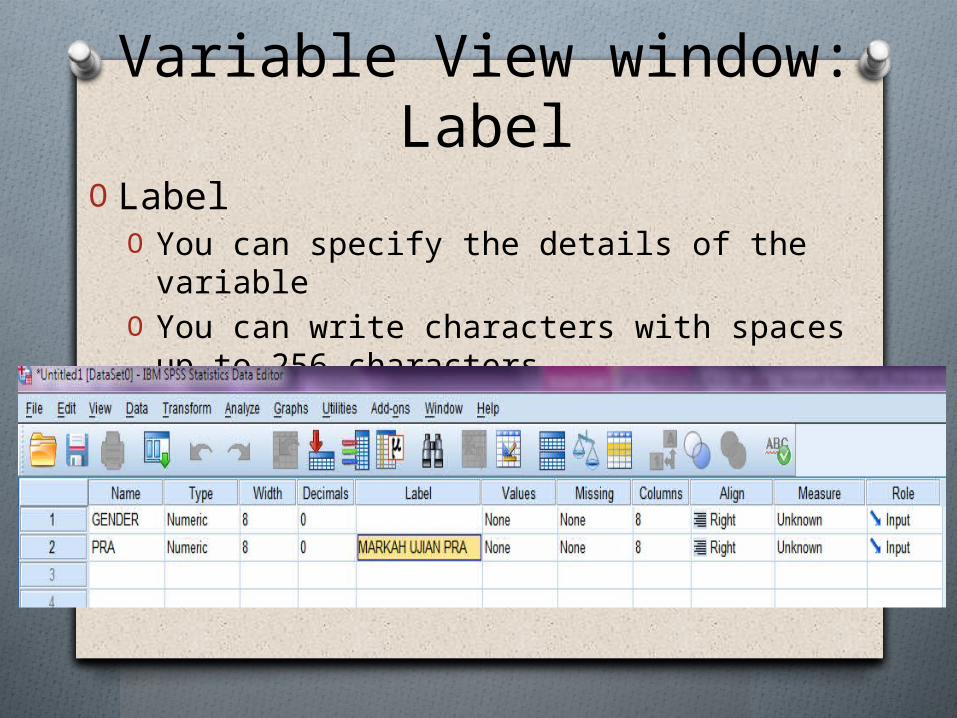
Variable View window: Label
O LabelO You can specify the details of the variable
O You can write characters with spaces up to 256 characters
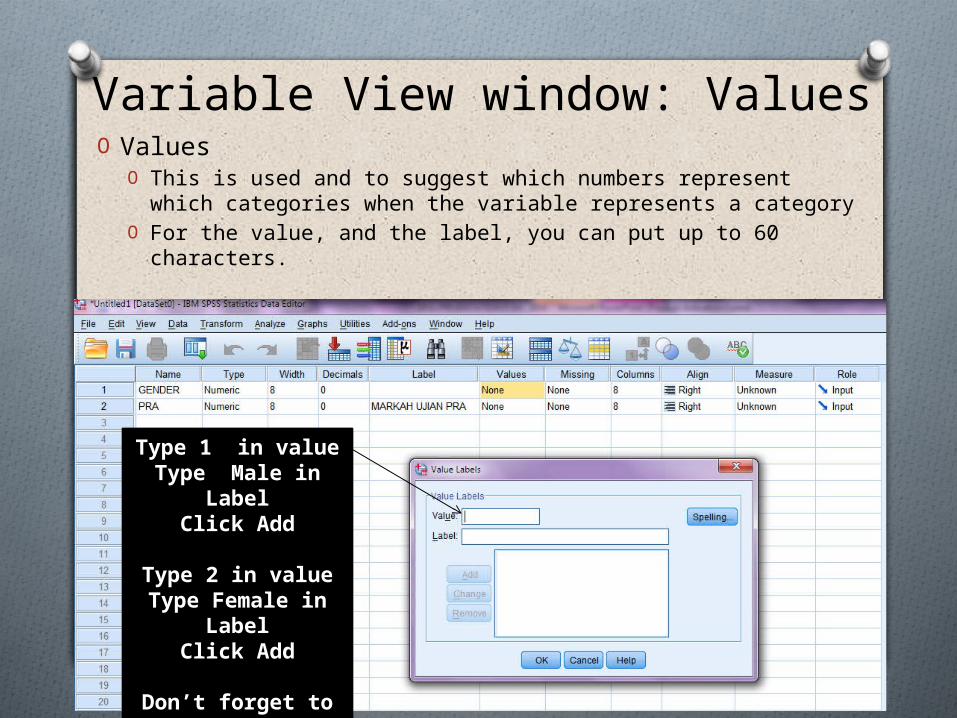
Variable View window: ValuesO Values
O This is used and to suggest which numbers represent which categories when the variable represents a category
O For the value, and the label, you can put up to 60 characters.
Type 1 in valueType Male in
LabelClick Add
Type 2 in valueType Female in
LabelClick Add
Don’t forget to clickOK
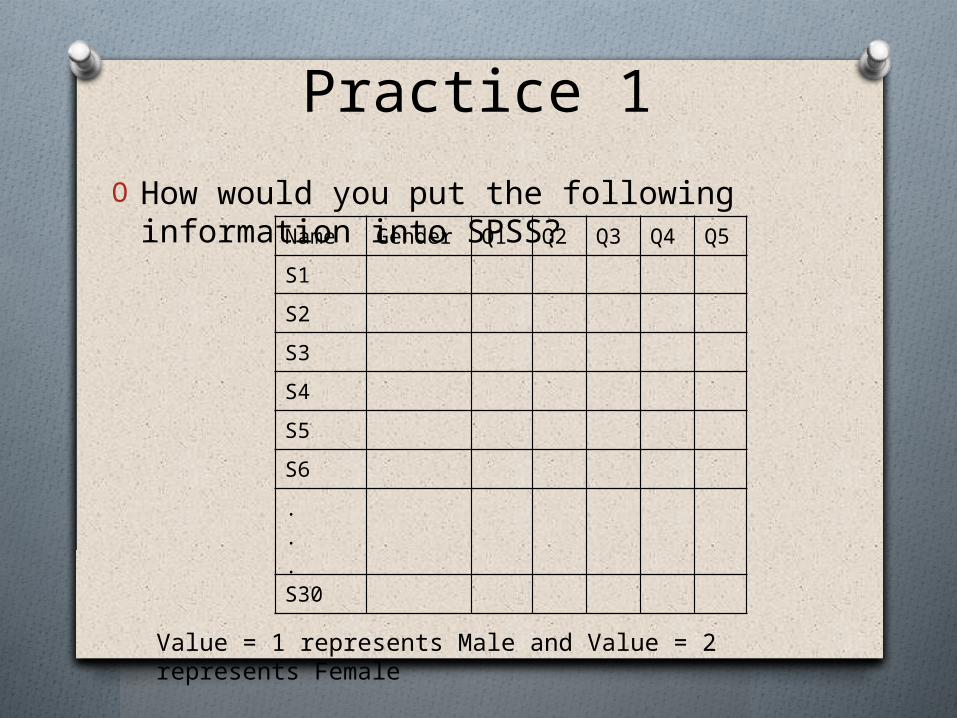
Practice 1O How would you put the following information into SPSS?
Value = 1 represents Male and Value = 2 represents Female
Name Gender Q1 Q2 Q3 Q4 Q5S1 S2S3S4S5S6...S30
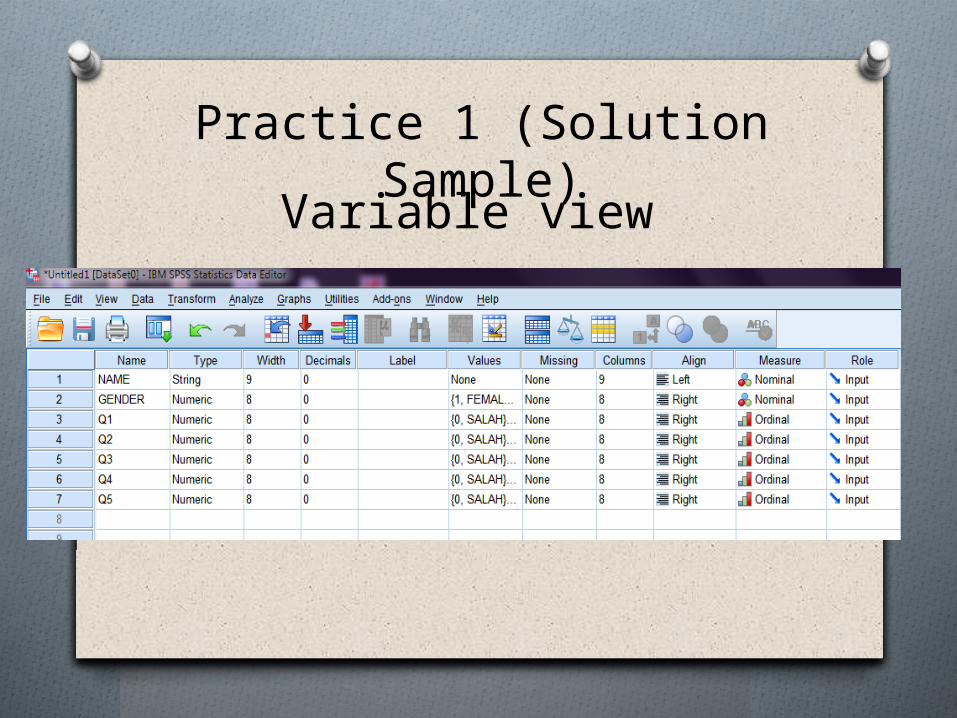
Practice 1 (Solution Sample)Variable view
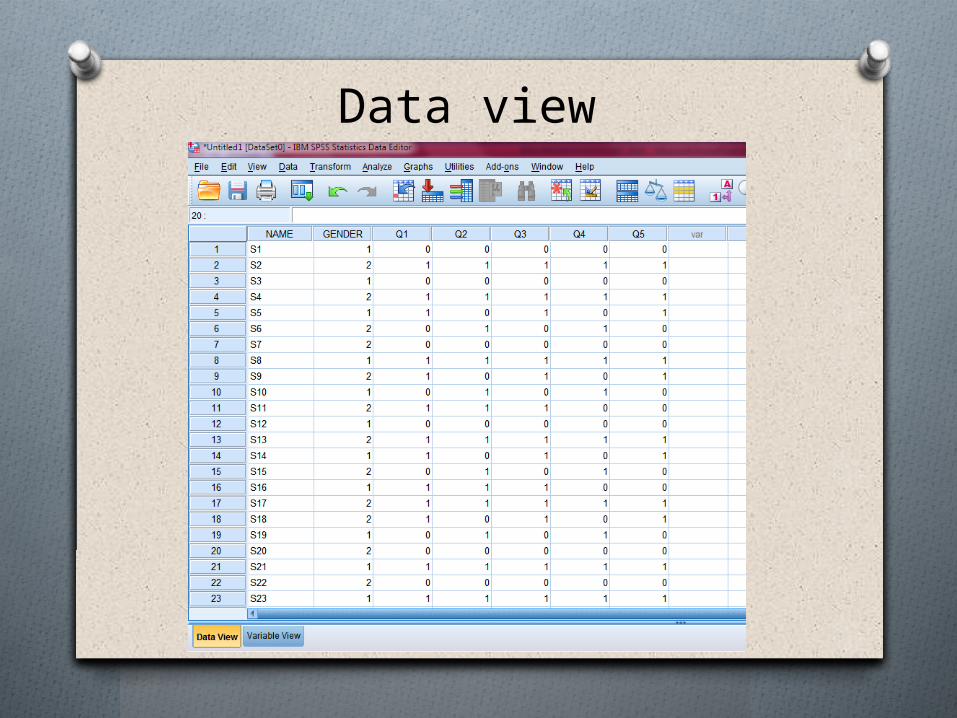
Data view
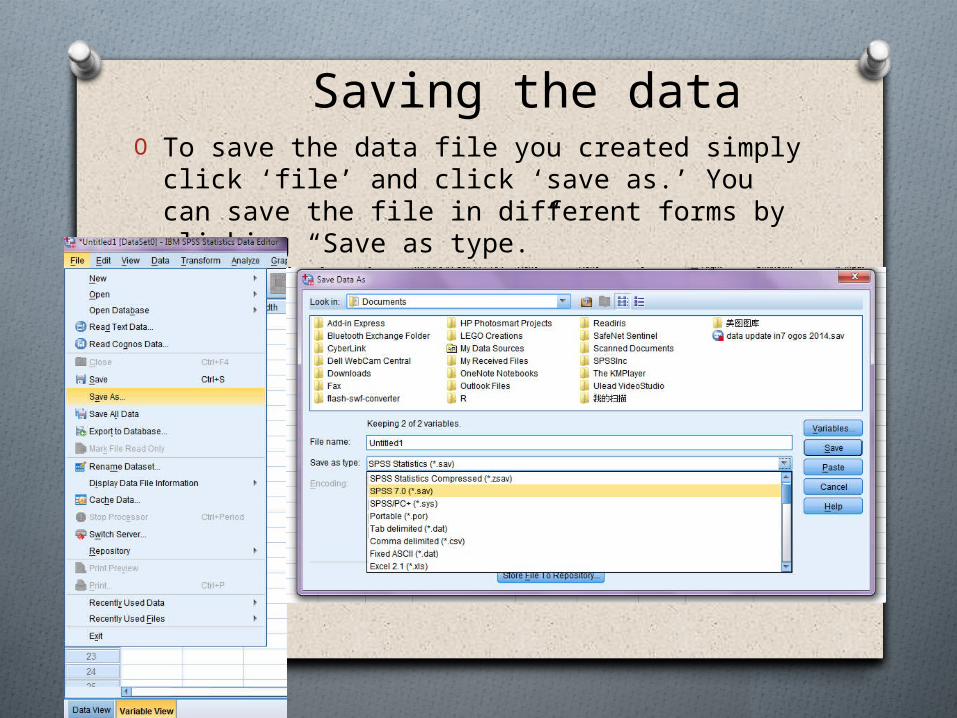
Saving the dataO To save the data file you created simply click ‘file’ and click ‘save as.’ You can save the file in different forms by clicking “Save as type.”
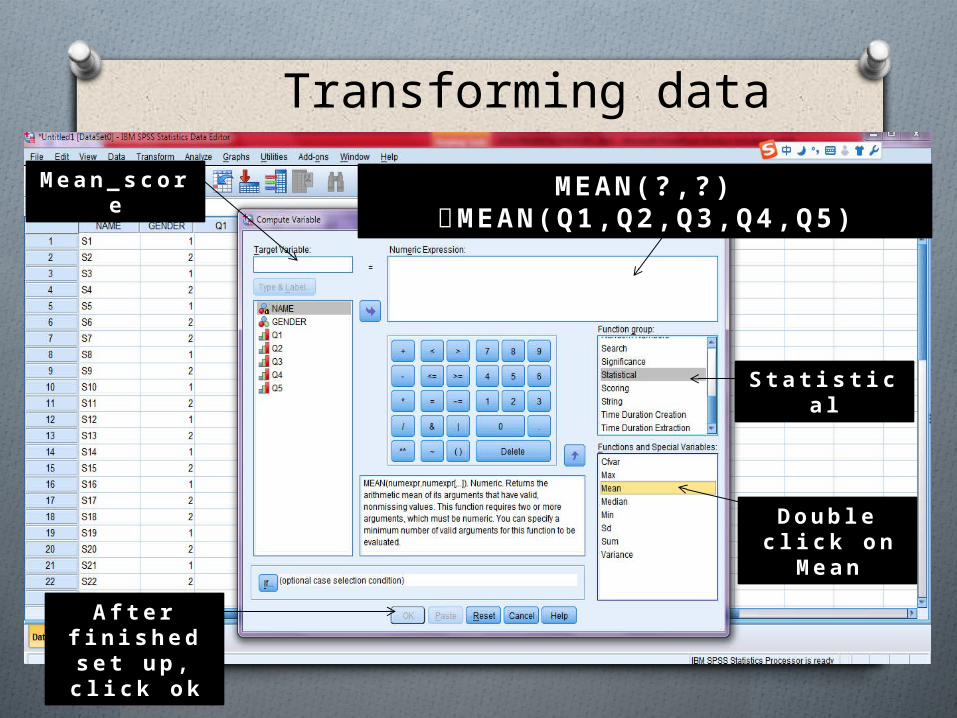
Transforming dataM e a n _ s c o r
e
S t a t i s t i ca l
D o u b le c l i c k o n
M e a n
MEAN(?,?) MEAN(Q1,Q2,Q3,Q4,Q5)
A f t e r f i n i s h e d s e t u p , c l i c k o k
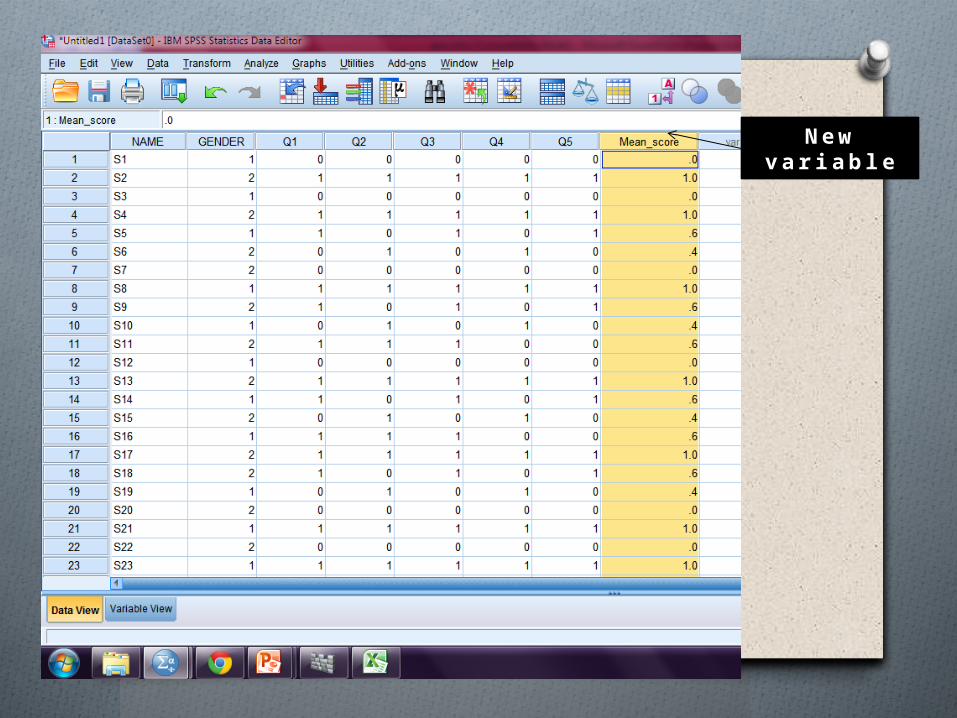
N ew v a r i a b l e
Relax!
Descriptive Analysis
FrequenciesDescriptives
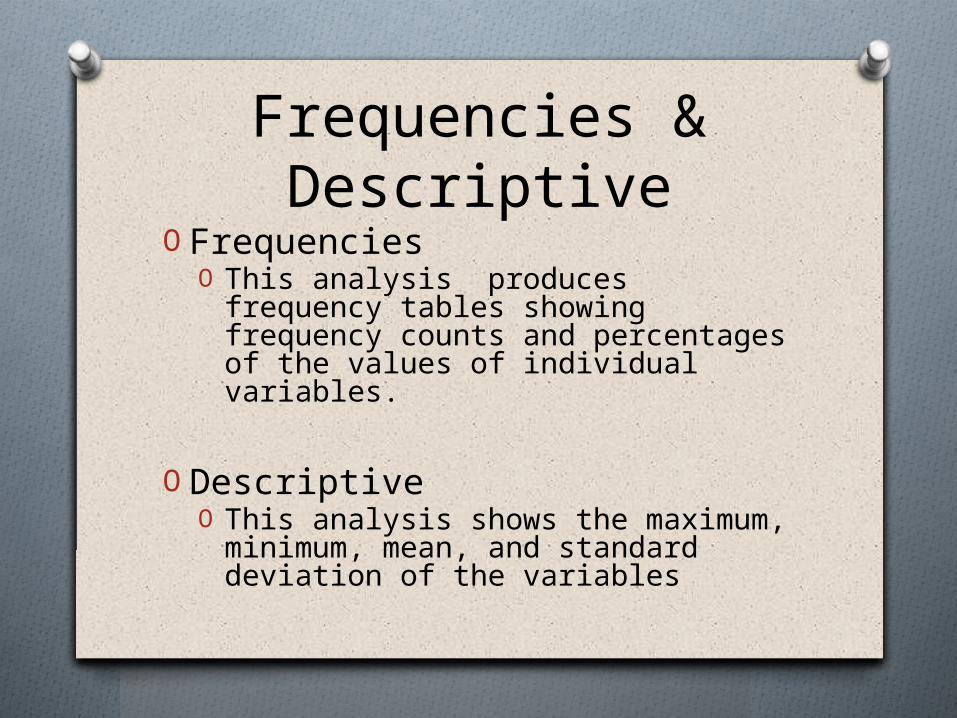
Frequencies & Descriptive
O FrequenciesO This analysis produces frequency tables showing frequency counts and percentages of the values of individual variables.
O DescriptiveO This analysis shows the maximum, minimum, mean, and standard deviation of the variables

Frequencies
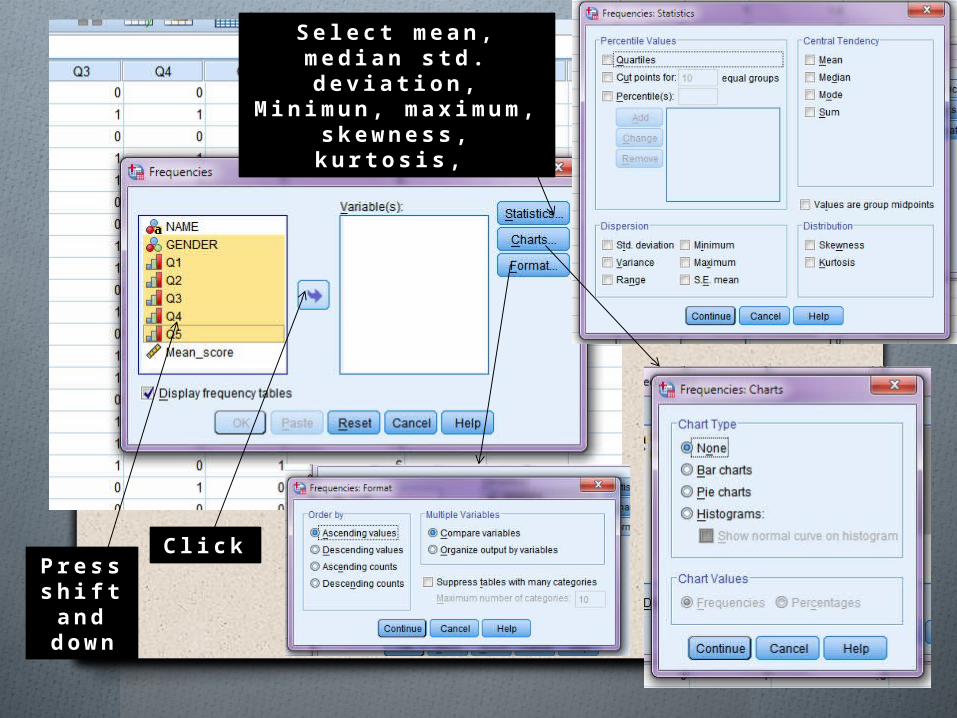
P re s s s hi f t a n d d ow n
C l i c k
S e l e c t m e a n , m e d i a n s t d . d e v i a t i o n ,
M i n i m u n , m a x i mu m , s k e w n e s s , k u r t o s i s ,
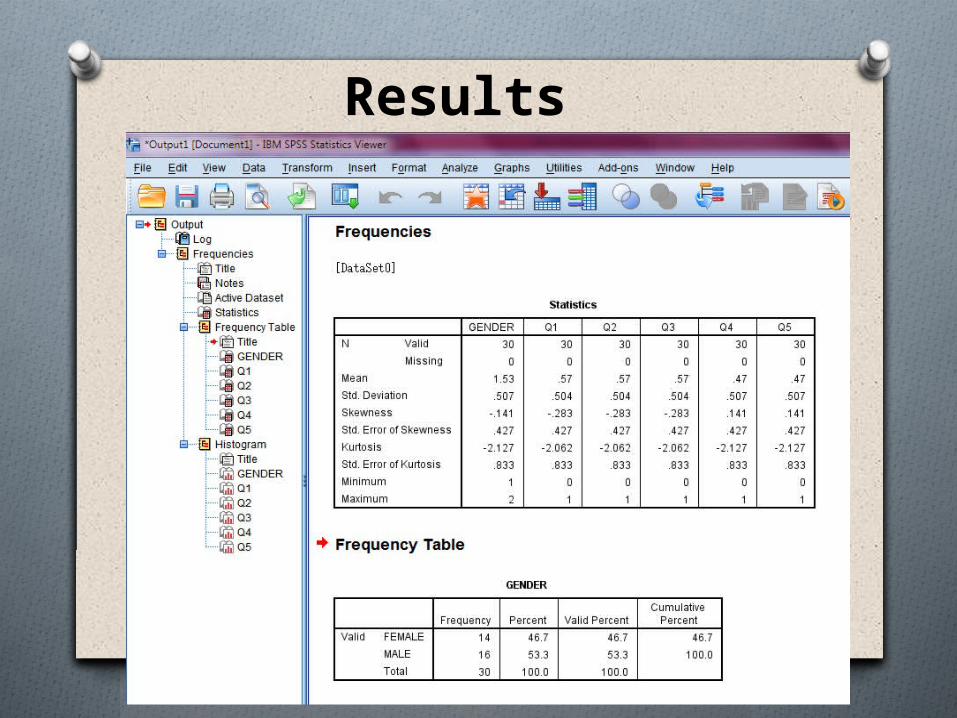
Results
Need charging the brain?
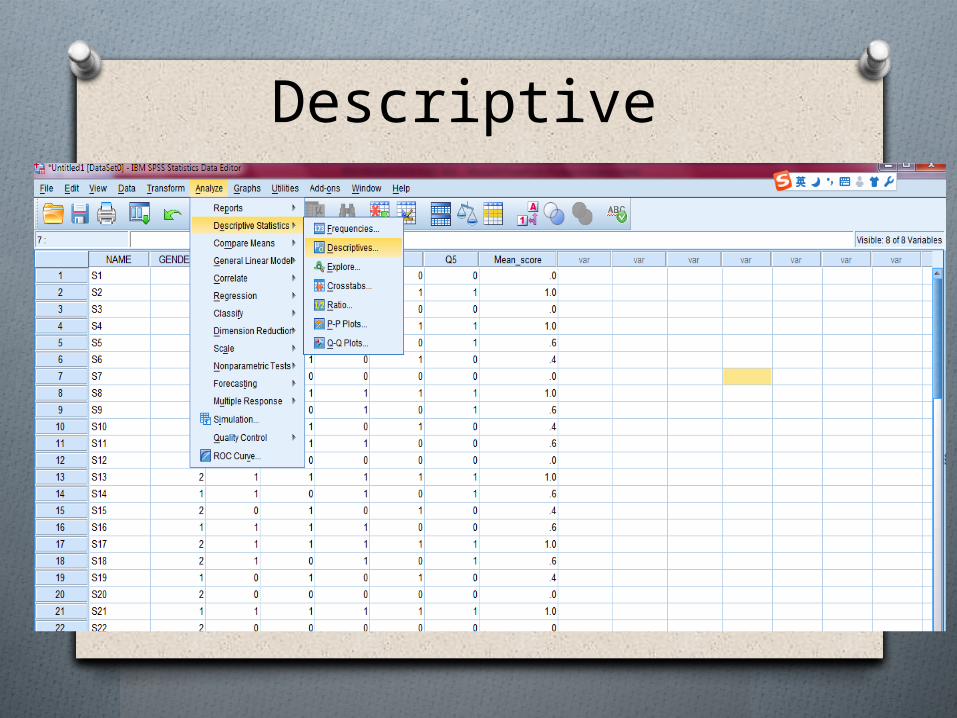
Descriptive
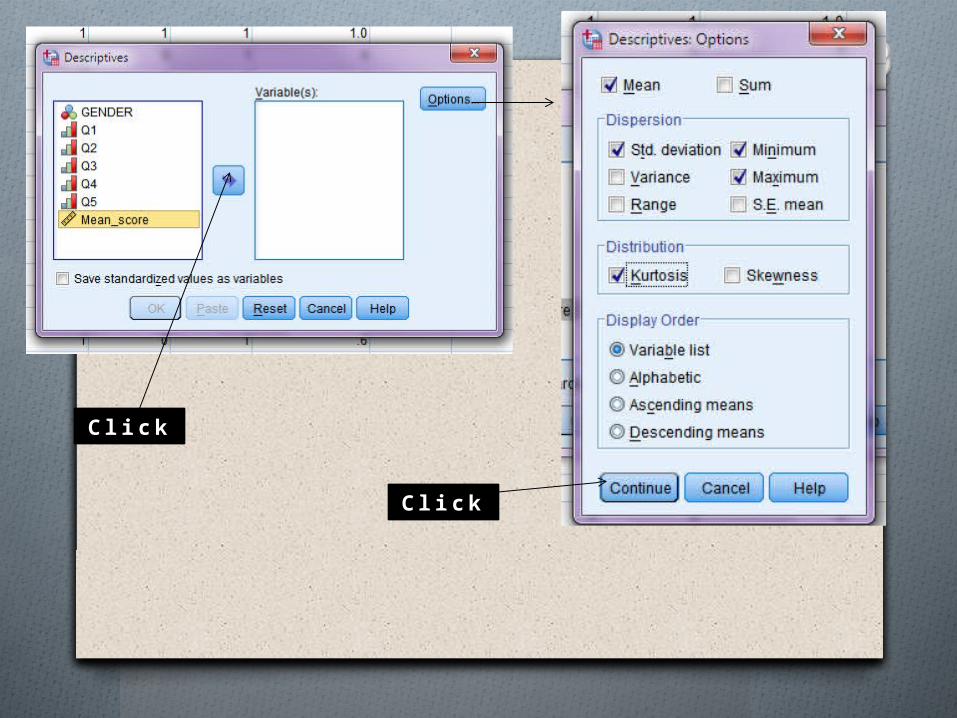
C l i c k
C l i c k
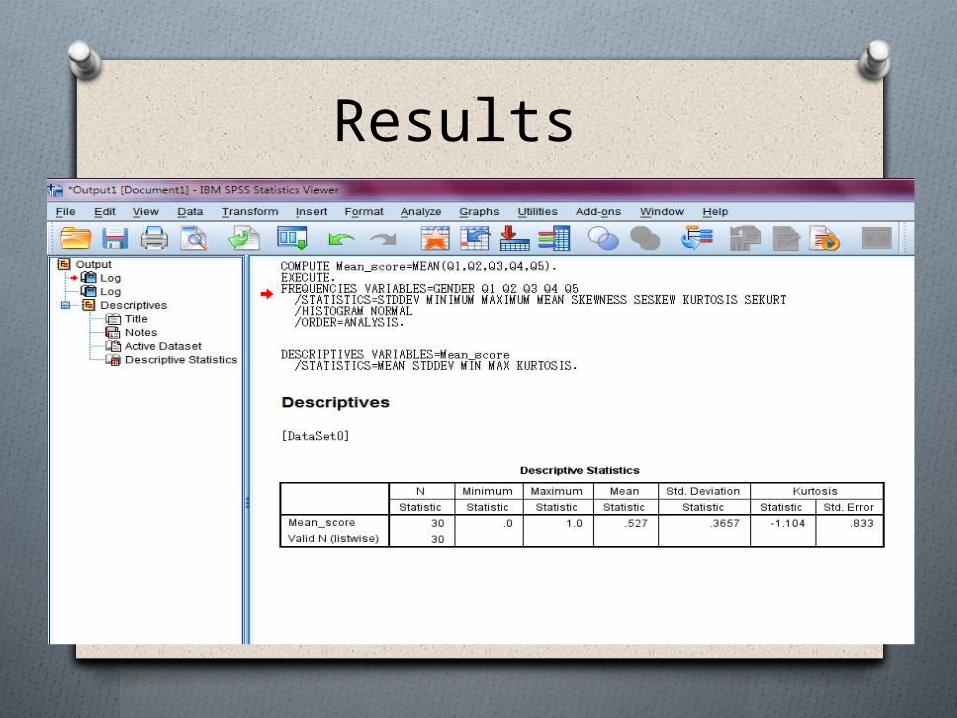
Results
Be careful with the statistical assumptions before analysis…
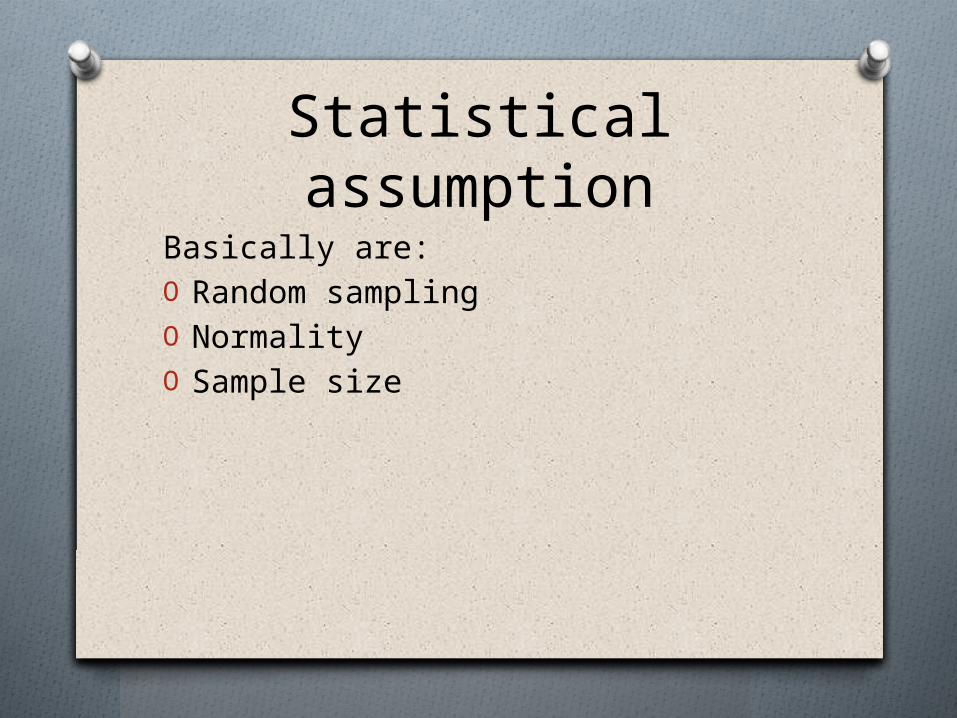
Statistical assumption
Basically are:O Random samplingO Normality O Sample size
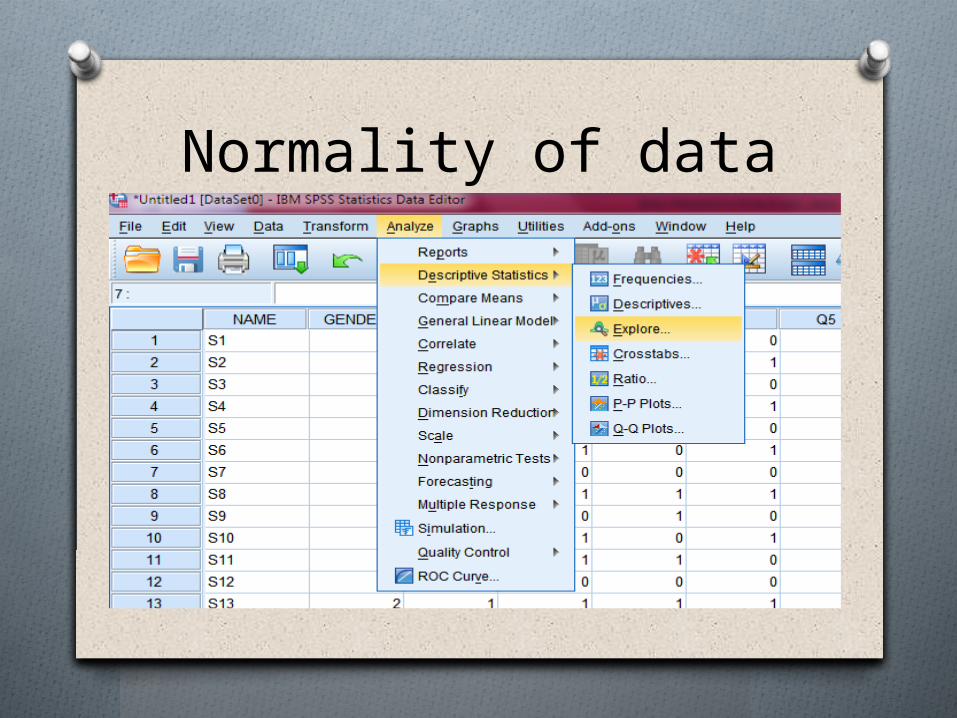
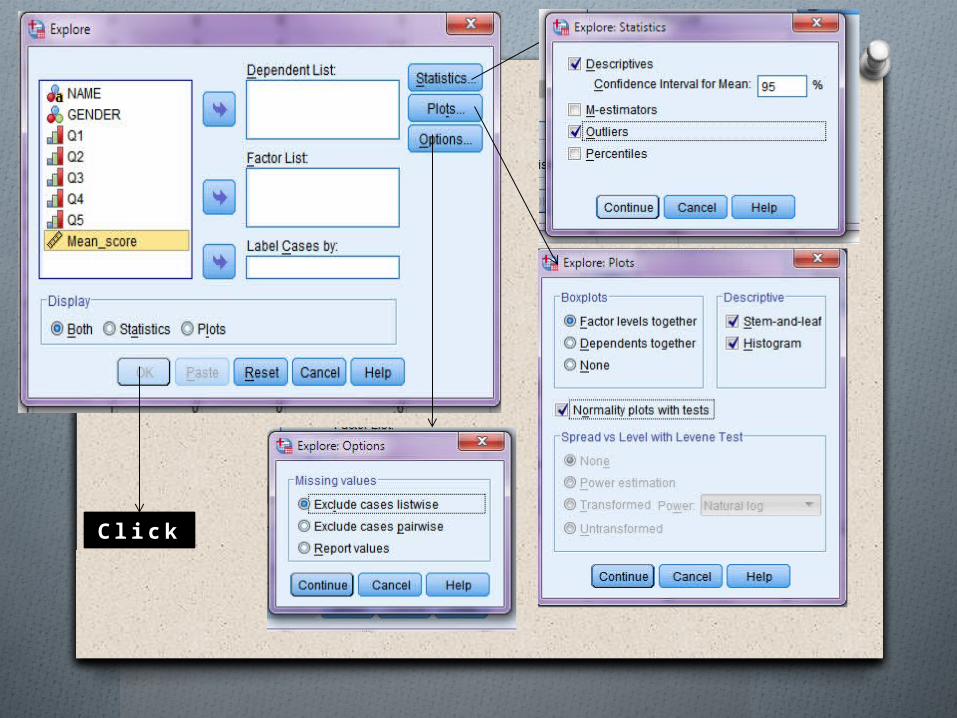
Normality of data
C l i c k
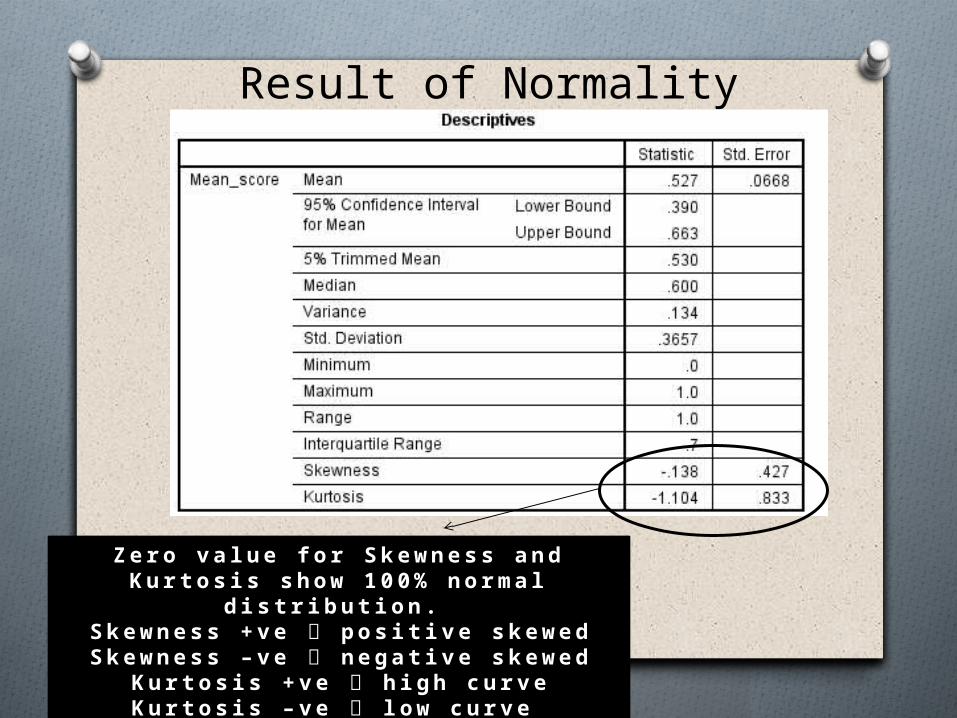
Result of Normality
Z e r o v a l u e f o r S k e w n e s s a n d K u r t o s i s s h o w 1 0 0% n o r m a l
d i s t r i b ut i o n . S k e w n e s s + v e po s i t i v e s k e w e dS k e w n e s s – v e ne g a t i v e s k e w e d
K u r t o s i s + v e h i g h c u r v eK u r t o s i s – v e l o w c u r v e
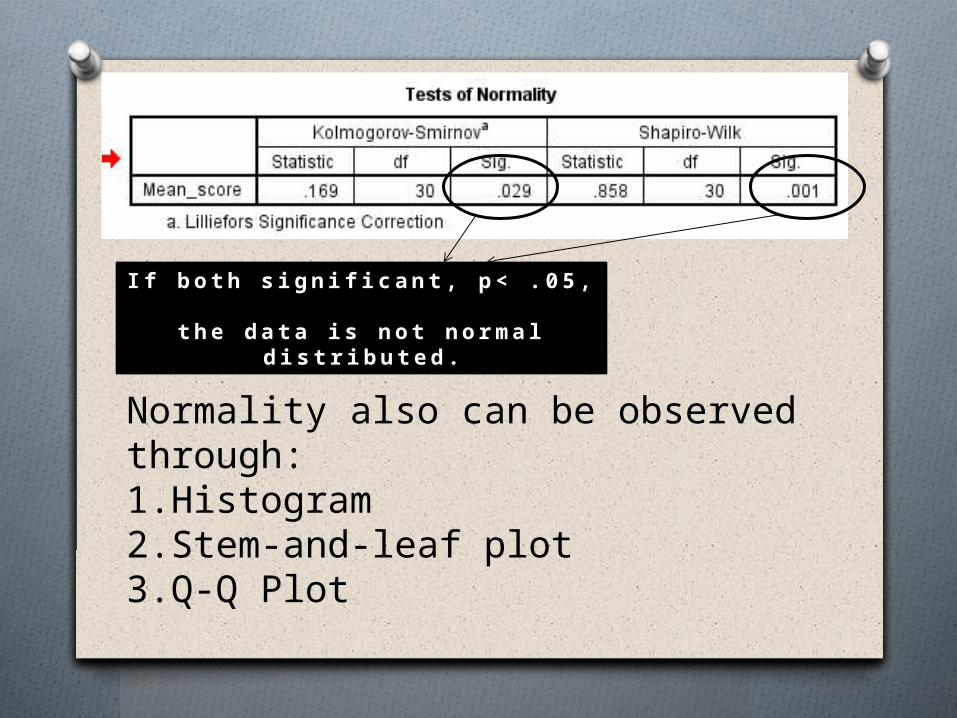
I f b o t h s i g n i f i c an t , p < . 0 5 ,
t h e d a t a i s n ot n o r m a l d i s t ri b u t e d .
Normality also can be observed through:1.Histogram2.Stem-and-leaf plot3.Q-Q Plot
Think about it!
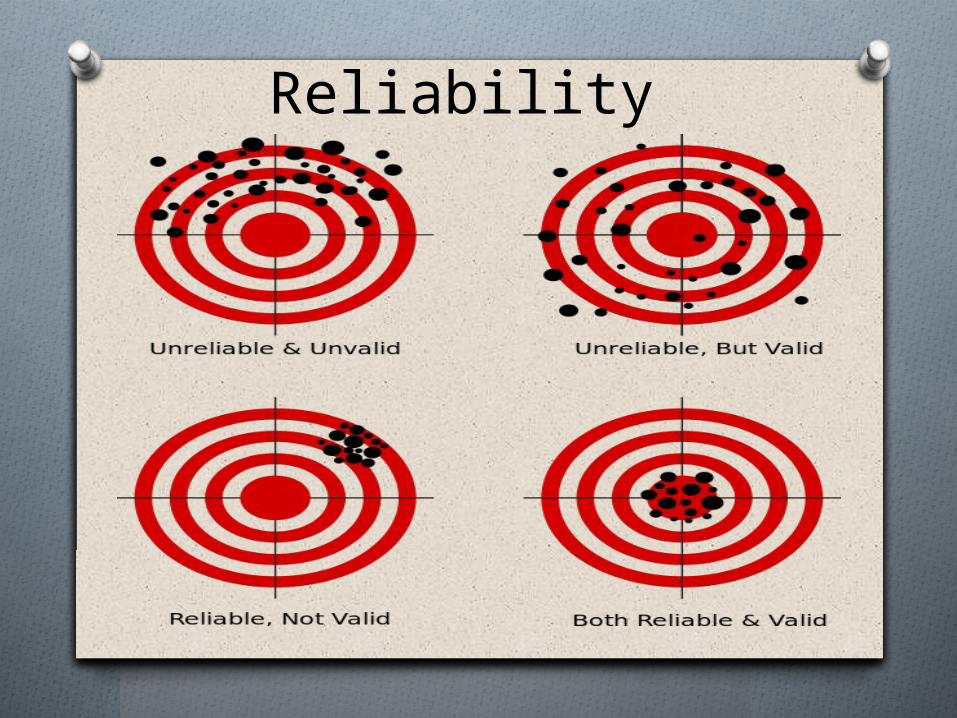
Reliability
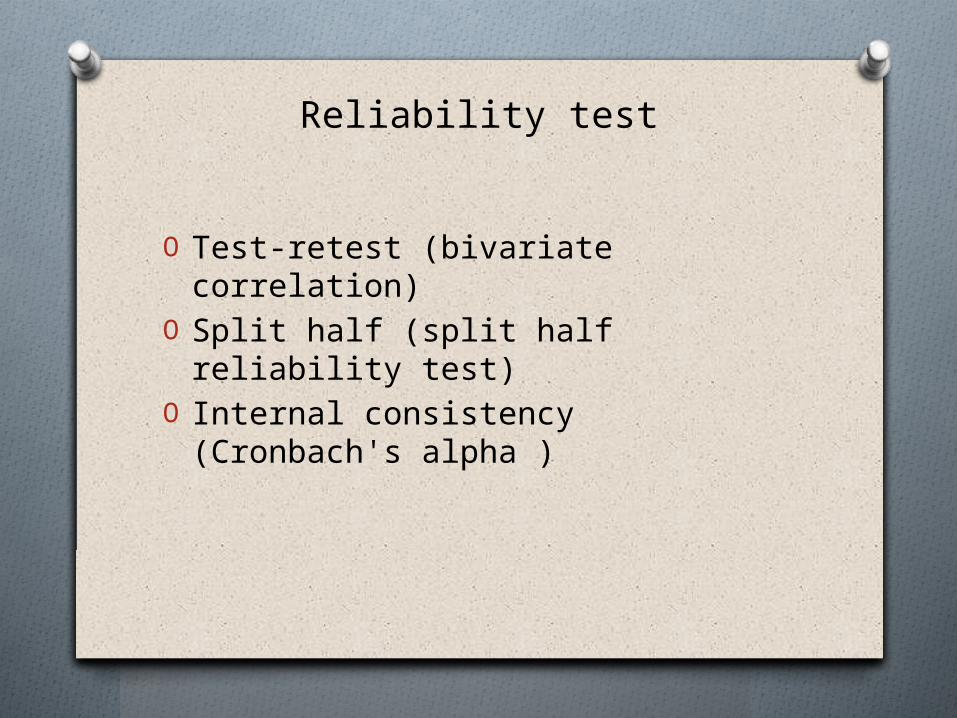
Reliability test
O Test-retest (bivariate correlation)
O Split half (split half reliability test)
O Internal consistency (Cronbach's alpha )
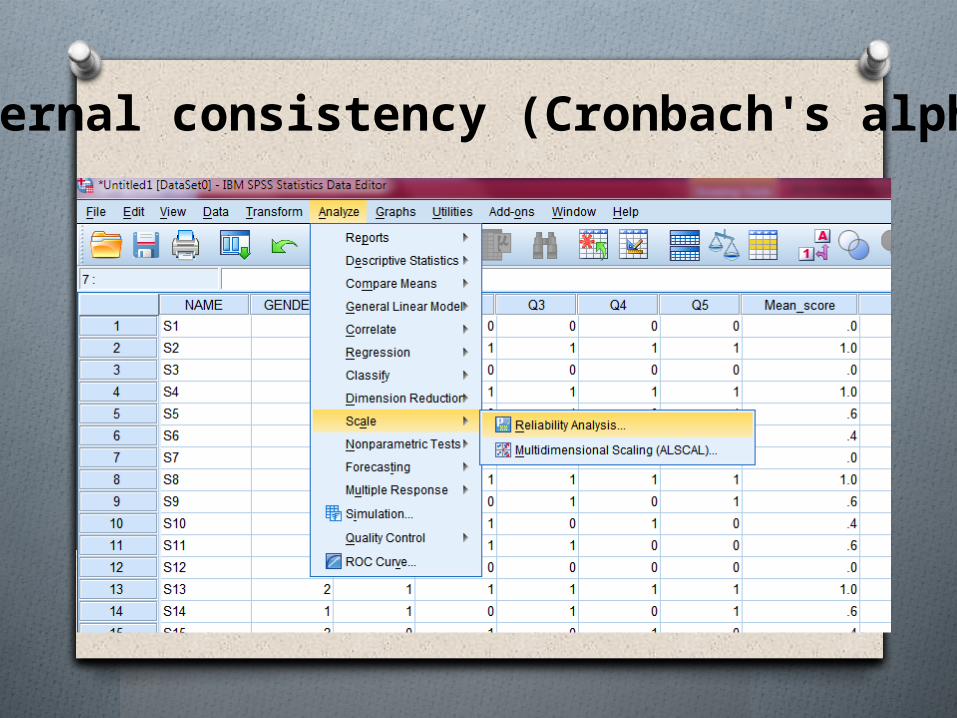
Internal consistency (Cronbach's alpha )
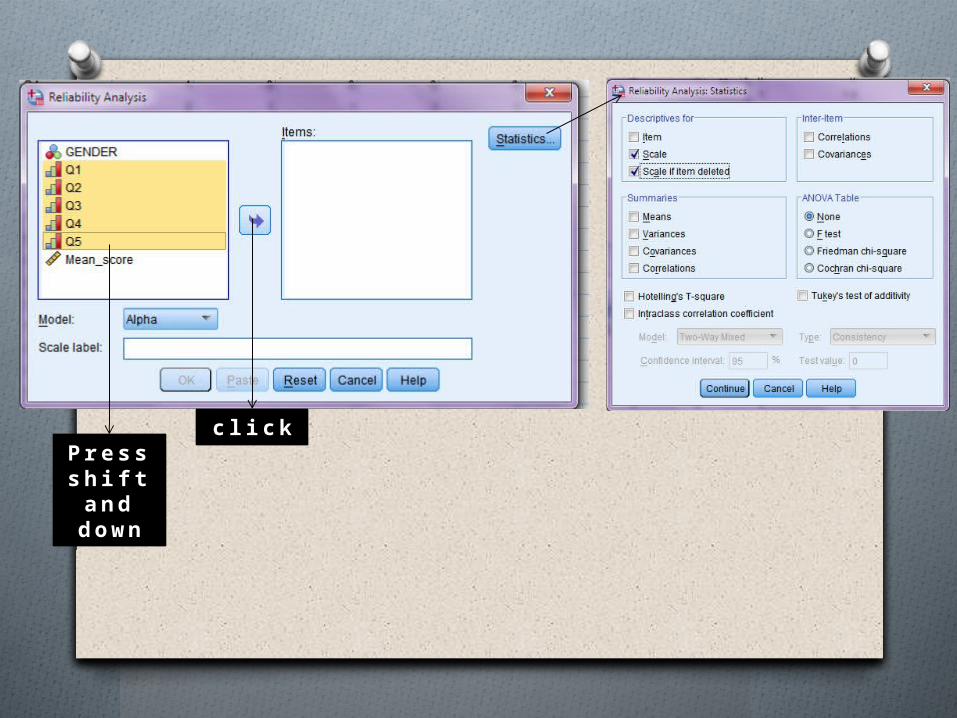
P r e s s s h i f t a n d d o w n
c l i c k
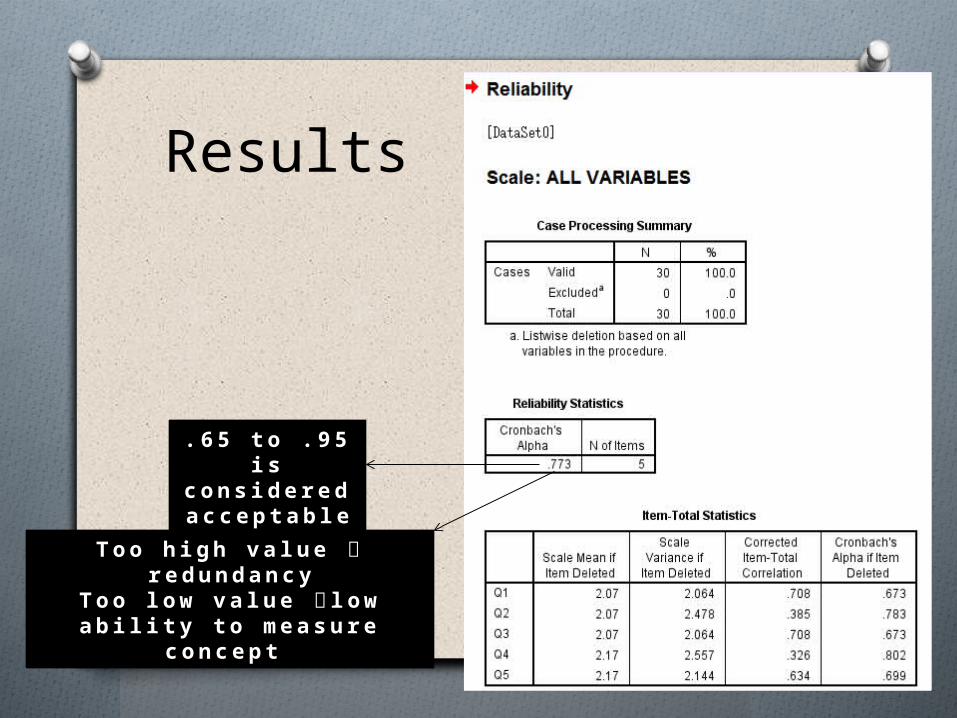
Results
. 6 5 t o .9 5 i s
c o n s i d e re d a c c e p t a bl e
T o o h i g h v a l u e r e d u n d a n c y
T o o l o w v a l u e l ow a b i l i t y t o m e a s u re
c o n c e p t
THE ENDTHANKS YOU FOR ATTENTION
SEE YOU NEXT TIME