Embed Size (px)
Citation preview
SSANGYONG MOTOR COMPANYAND ITS SUBSIDIARIES
CONSOLIDATED FINANCIAL STATEMENTSAS OF AND FOR THE YEARS ENDEDDECEMBER 31, 2015 AND 2014
ATTACHMENT: INDEPENDENT AUDITORS’ REPORT
SSANGYONG MOTOR COMPANY AND ITS SUBSIDIARIES
Independent Auditors’ Report
English Translation of Independent Auditors’ Report Originally Issued in Korean on March 8, 2016.
To the Shareholders and Board of Directors of Ssangyong Motor Company:
Report on the Consolidated Financial Statements We have audited the accompanying consolidated financial statements of Ssangyong Motor Company (the “Company”) and its subsidiaries, which comprise the consolidated statements of financial position as of December 31, 2015 and 2014, and the related consolidated statements of comprehensive income, consolidated statements of changes in shareholders’ equity and consolidated statements of cash flows, all expressed in Korean won, for the years ended December 31, 2015 and 2014, and a summary of significant accounting policies and other explanatory information.
Management’s Responsibility for the Consolidated Financial Statements Management is responsible for the preparation and fair presentation of these consolidated financial statements in accordance with Korean International Financial Reporting Standards (“K-IFRS”) and for such internal control as management determines is necessary to enable the preparation of consolidated financial statements that are free from material misstatement, whether due to fraud or error.
Auditors’ Responsibility Our responsibility is to express an audit opinion on these consolidated financial statements based on our audits. We conducted our audits in accordance with Korean Standards on Auditing (“KSAs”). Those standards require that we comply with ethical requirements and plan and perform the audits to obtain reasonable assurance about whether the consolidated financial statements are free from material misstatement. An audit involves performing procedures to obtain audit evidence about the amounts and disclosures in the consolidated financial statements. The procedures selected depend on the auditor’s judgment, including the assessment of the risks of material misstatement of the consolidated financial statements, whether due to fraud or error. In making those risk assessments, the auditor considers internal control relevant to the entity’s preparation and fair presentation of the consolidated financial statements in order to design audit procedures that are appropriate in the circumstances, but not for the purpose of expressing an opinion on the effectiveness of the entity’s internal control. An audit also includes evaluating the appropriateness of accounting policies used and the reasonableness of accounting estimates made by management, as well as evaluating the overall presentation of the consolidated financial statements. We believe that the audit evidence we have obtained is sufficient and appropriate to provide a basis for our audit opinion.
Opinion In our opinion, the consolidated financial statements present fairly, in all material respects, the financial position of the Company and its subsidiaries as of December 31, 2015 and 2014, and their financial performance and their cash flows for the years ended December 31, 2015 and 2014, in accordance with K-IFRS.
Deloitte Anjin LLC������������� ����������������������������������������� ��!��"�
#�$�%&��'�(� � � �����")$�%&��'�(� �*�� *�+++����,--"�,�.����
/��,--��0�1�-������������0�/��,--�#��.2�#�2�"-1��3,�,-���"�4!���,5"-�.���"���,�,-��6����"�"-�'7/##38(��,-1�-+�����0���6��0,��1��"��-2,����"-��-,-,1��/##3�"��".2��0�,-1���6��0,��1�"����"����1�"�"-�"��,���-�-,-,1�� � �/##3�'"�1���0����-��"1�7/��,--����6"�8(���1��-����5,��1�5,.1�-��.�,-1�� � �9�"1�1�+++����,--�.��:��:"6��-�0���"������-",����1.�,�-,���0�/##3�"��,-1���6��0,��1�� � � �� ��;�6���0�/��,--�#��.2�#�2�"-1��3,�,-�
Others Our audits also comprehended the translation of Korean won amounts into Indian rupee amounts and, in our opinion, such translation has been made in conformity with the basis in Note 2. Such Indian rupee amounts are presented solely for the convenience of readers.
March 8, 2016
Notice to ReadersThis report is effective as of March 8, 2016, the auditors’ report date. Certain subsequent events or circumstances may have occurred between the auditors’ report date and the time the auditors’ report is read. Such events or circumstances could significantly affect the consolidated financial statements and may result in modifications to the auditors’ report.
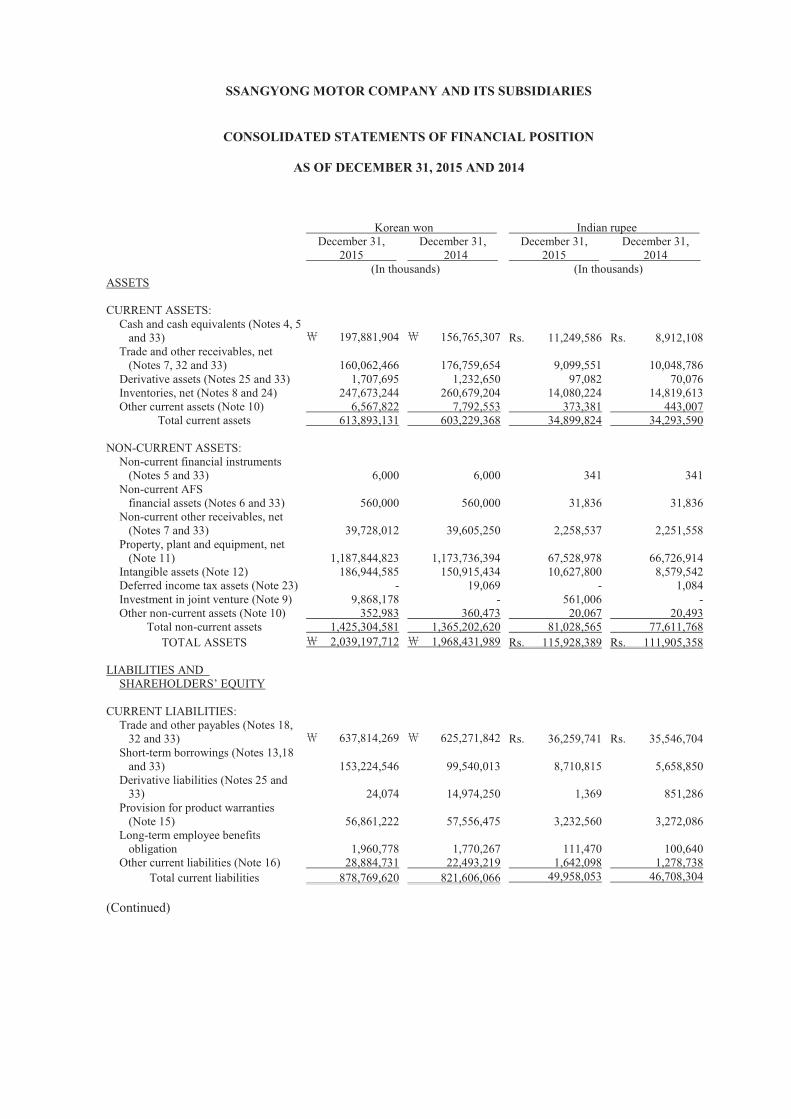
SSANGYONG MOTOR COMPANY AND ITS SUBSIDIARIES
CONSOLIDATED STATEMENTS OF FINANCIAL POSITION
AS OF DECEMBER 31, 2015 AND 2014
Korean won Indian rupee
December 31, 2015
December 31, 2014
December 31, 2015
December 31, 2014
(In thousands) (In thousands) ASSETS
CURRENT ASSETS: Cash and cash equivalents (Notes 4, 5 and 33) 197,881,904 156,765,307 Rs. 11,249,586 Rs. 8,912,108 Trade and other receivables, net (Notes 7, 32 and 33) 160,062,466 176,759,654 9,099,551 10,048,786 Derivative assets (Notes 25 and 33) 1,707,695 1,232,650 97,082 70,076 Inventories, net (Notes 8 and 24) 247,673,244 260,679,204 14,080,224 14,819,613 Other current assets (Note 10) 6,567,822 7,792,553 373,381 443,007
Total current assets 613,893,131 603,229,368 34,899,824 34,293,590
NON-CURRENT ASSETS: Non-current financial instruments (Notes 5 and 33) 6,000 6,000 341 341 Non-current AFS financial assets (Notes 6 and 33) 560,000 560,000 31,836 31,836 Non-current other receivables, net (Notes 7 and 33) 39,728,012 39,605,250 2,258,537 2,251,558 Property, plant and equipment, net (Note 11) 1,187,844,823 1,173,736,394 67,528,978 66,726,914 Intangible assets (Note 12) 186,944,585 150,915,434 10,627,800 8,579,542 Deferred income tax assets (Note 23) - 19,069 - 1,084 Investment in joint venture (Note 9) 9,868,178 - 561,006 - Other non-current assets (Note 10) 352,983 360,473 20,067 20,493
Total non-current assets 1,425,304,581 1,365,202,620 81,028,565 77,611,768 TOTAL ASSETS 2,039,197,712 1,968,431,989 Rs. 115,928,389 Rs. 111,905,358
LIABILITIES AND SHAREHOLDERS’ EQUITY
CURRENT LIABILITIES: Trade and other payables (Notes 18, 32 and 33) 637,814,269 625,271,842 Rs. 36,259,741 Rs. 35,546,704 Short-term borrowings (Notes 13,18 and 33) 153,224,546 99,540,013 8,710,815 5,658,850 Derivative liabilities (Notes 25 and 33) 24,074 14,974,250 1,369 851,286 Provision for product warranties (Note 15) 56,861,222 57,556,475 3,232,560 3,272,086 Long-term employee benefits obligation 1,960,778 1,770,267 111,470 100,640 Other current liabilities (Note 16) 28,884,731 22,493,219 1,642,098 1,278,738
Total current liabilities 878,769,620 821,606,066 49,958,053 46,708,304 (Continued)
SSANGYONG MOTOR COMPANY AND ITS SUBSIDIARIES
CONSOLIDATED STATEMENTS OF FINANCIAL POSITION (CONTINUED)
AS OF DECEMBER 31, 2015 AND 2014
Korean won Indian rupee December 31, 2015
December 31, 2014
December 31, 2015
December 31, 2014
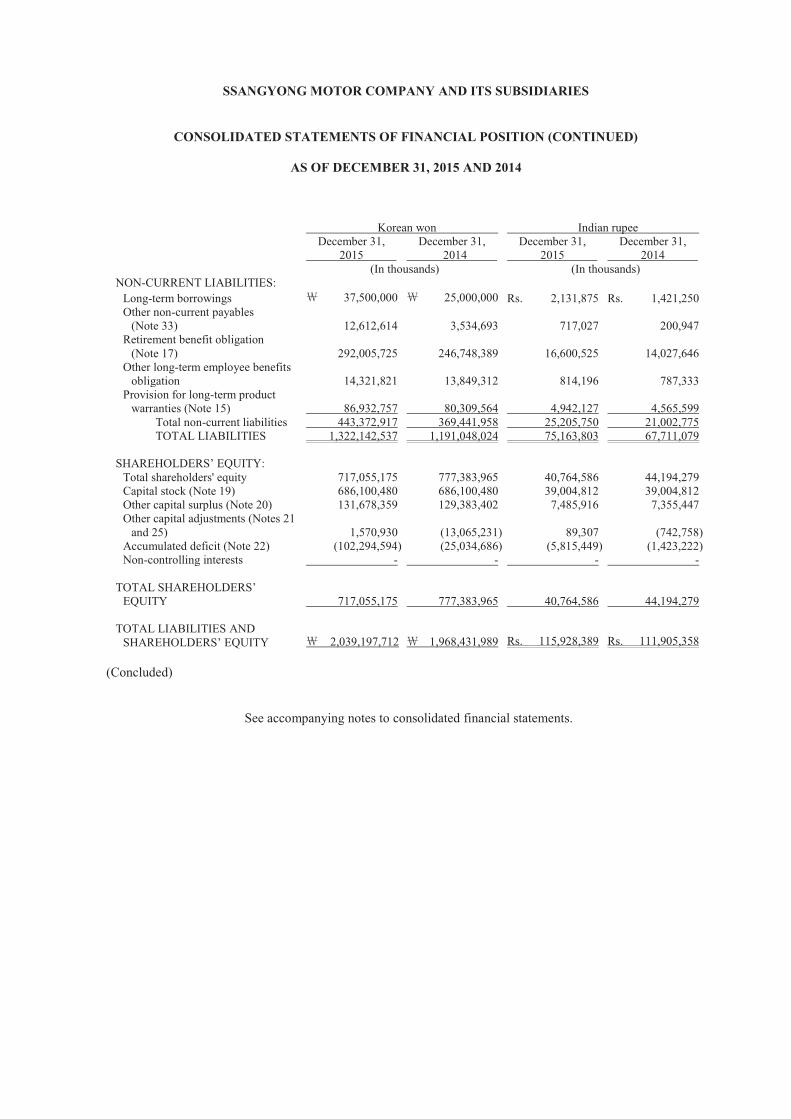
(In thousands) (In thousands) NON-CURRENT LIABILITIES: Long-term borrowings 37,500,000 25,000,000 Rs. 2,131,875 Rs. 1,421,250 Other non-current payables (Note 33) 12,612,614 3,534,693 717,027 200,947 Retirement benefit obligation (Note 17) 292,005,725 246,748,389 16,600,525 14,027,646 Other long-term employee benefits obligation 14,321,821 13,849,312 814,196 787,333 Provision for long-term product warranties (Note 15) 86,932,757 80,309,564 4,942,127 4,565,599 Total non-current liabilities 443,372,917 369,441,958 25,205,750 21,002,775 TOTAL LIABILITIES 1,322,142,537 1,191,048,024 75,163,803 67,711,079
SHAREHOLDERS’ EQUITY: Total shareholders' equity 717,055,175 777,383,965 40,764,586 44,194,279 Capital stock (Note 19) 686,100,480 686,100,480 39,004,812 39,004,812 Other capital surplus (Note 20) 131,678,359 129,383,402 7,485,916 7,355,447 Other capital adjustments (Notes 21 and 25) 1,570,930 (13,065,231) 89,307 (742,758) Accumulated deficit (Note 22) (102,294,594) (25,034,686) (5,815,449) (1,423,222) Non-controlling interests - - - - TOTAL SHAREHOLDERS’ EQUITY 717,055,175 777,383,965 40,764,586 44,194,279
TOTAL LIABILITIES AND SHAREHOLDERS’ EQUITY 2,039,197,712 1,968,431,989 Rs. 115,928,389 Rs. 111,905,358
(Concluded)
See accompanying notes to consolidated financial statements.
SSANGYONG MOTOR COMPANY AND ITS SUBSIDIARIES
CONSOLIDATED STATEMENTS OF COMPREHENSIVE INCOME
FOR THE YEARS ENDED DECEMBER 31, 2015 AND 2014
Korean won Indian rupeeYear ended
December 31, 2015Year ended
December 31, 2014Year ended
December 31, 2015Year ended
December 31, 2014(In thousands) (In thousands)
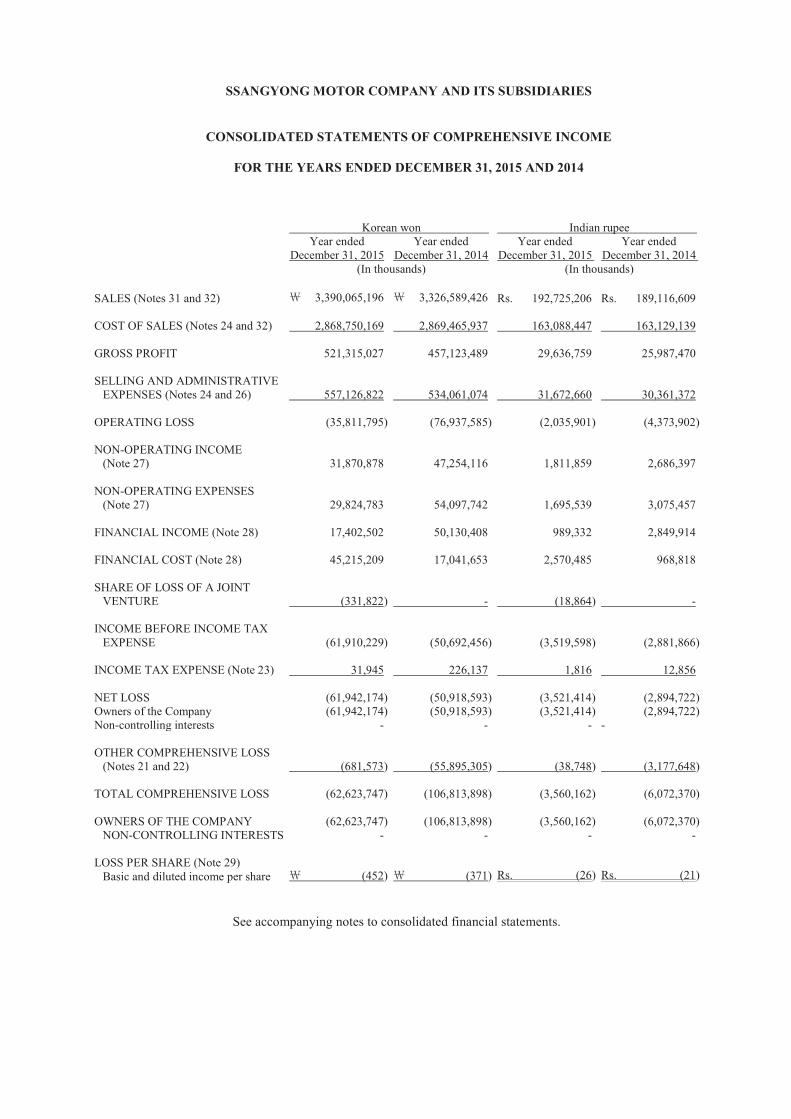
SALES (Notes 31 and 32) 3,390,065,196 3,326,589,426 Rs. 192,725,206 Rs. 189,116,609
COST OF SALES (Notes 24 and 32) 2,868,750,169 2,869,465,937 163,088,447 163,129,139
GROSS PROFIT 521,315,027 457,123,489 29,636,759 25,987,470
SELLING AND ADMINISTRATIVE EXPENSES (Notes 24 and 26) 557,126,822 534,061,074 31,672,660 30,361,372
OPERATING LOSS (35,811,795) (76,937,585) (2,035,901) (4,373,902)
NON-OPERATING INCOME(Note 27) 31,870,878 47,254,116 1,811,859 2,686,397
NON-OPERATING EXPENSES(Note 27) 29,824,783 54,097,742 1,695,539 3,075,457
FINANCIAL INCOME (Note 28) 17,402,502 50,130,408 989,332 2,849,914
FINANCIAL COST (Note 28) 45,215,209 17,041,653 2,570,485 968,818
SHARE OF LOSS OF A JOINTVENTURE (331,822) - (18,864) -
INCOME BEFORE INCOME TAXEXPENSE (61,910,229) (50,692,456) (3,519,598) (2,881,866)
INCOME TAX EXPENSE (Note 23) 31,945 226,137 1,816 12,856
NET LOSS (61,942,174) (50,918,593) (3,521,414) (2,894,722)Owners of the Company (61,942,174) (50,918,593) (3,521,414) (2,894,722)Non-controlling interests - - - -
OTHER COMPREHENSIVE LOSS(Notes 21 and 22) (681,573) (55,895,305) (38,748) (3,177,648)
TOTAL COMPREHENSIVE LOSS (62,623,747) (106,813,898) (3,560,162) (6,072,370)
OWNERS OF THE COMPANY (62,623,747) (106,813,898) (3,560,162) (6,072,370)NON-CONTROLLING INTERESTS - - - -
LOSS PER SHARE (Note 29)Basic and diluted income per share (452) (371) Rs. (26) Rs. (21)
See accompanying notes to consolidated financial statements.
SSA
NG
YO
NG
MO
TO
R C
OM
PAN
Y A
ND
ITS
SUB
SID
IAR
IES
C
ON
SOL
IDA
TE
D S
TA
TE
ME
NT
S O
F C
HA
NG
ES
IN S
HA
RE
HO
LD
ER
S’ E
QU
ITY
FOR
TH
E Y
EA
RS
EN
DE
D D
EC
EM
BE
R 3
1, 2
015
AN
D 2
014
K
orea
n w
on in
thou
sand
s
O
ther
cap
ital s
urpl
us
C
apita
l sto
ck
Pai
d-in
cap
ital
in
exc
ess o
f
par
Gai
n on
cap
ital
re
duct
ion
D
ebt t
o be
s
wap
ped
for
eq
uity
T
reas
ury
stoc
k
Gai
n on
disp
osal
of
trea
sury
stoc
k O
ther
cap
ital
su
rplu
s O
ther
cap
ital
Adj
ustm
ents
Ret
aine
d
earn
ings
(
accu
mul
ated
de
ficit)
Tota
l
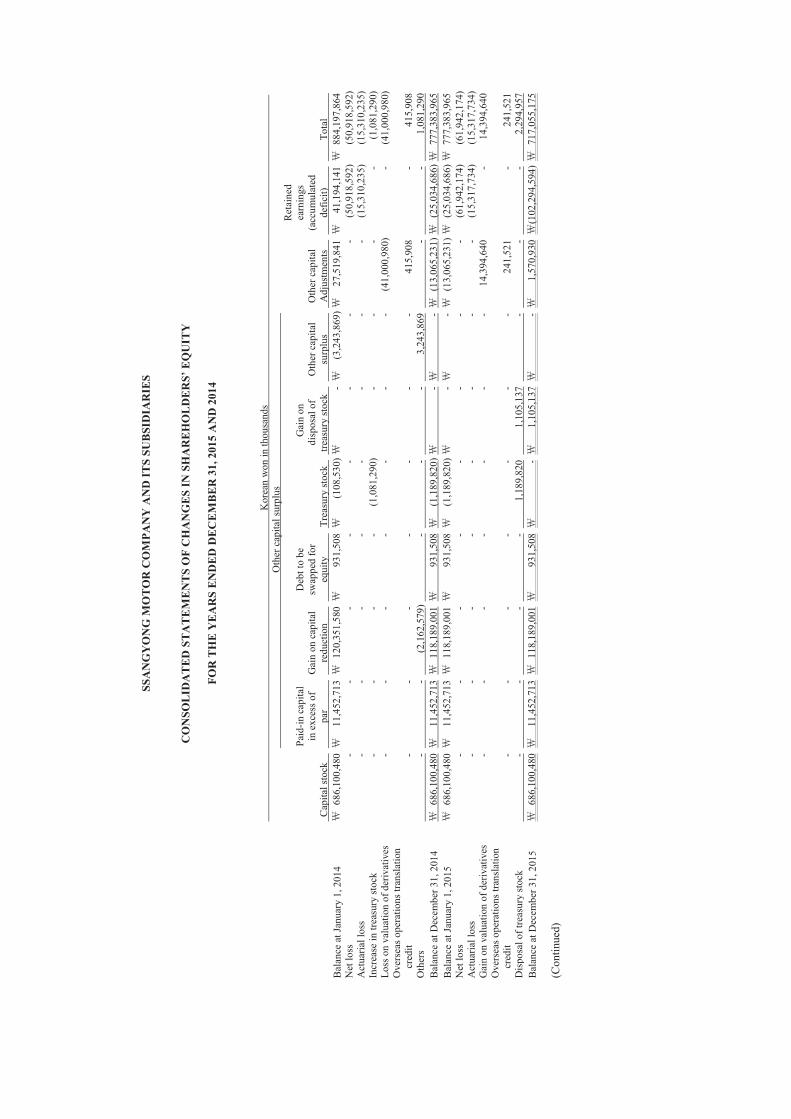
Bal
ance
at J
anua
ry 1
, 201
4
686
,100
,480
11,4
52,7
13
120
,351
,580
931,
508
(1
08,5
30)
-
(3
,243
,869
)
27,5
19,8
41
41
,194
,141
8
84,1
97,8
64
Net
loss
-
- -
- -
- -
- (5
0,91
8,59
2)
(50,
918,
592)
A
ctua
rial l
oss
- -
- -
- -
- -
(15,
310,
235)
(1
5,31
0,23
5)
Incr
ease
in tr
easu
ry st
ock
- -
- -
(1,0
81,2
90)
- -
- -
(1,0
81,2
90)
Loss
on
valu
atio
n of
der
ivat
ives
-
- -
- -
- -
(41,
000,
980)
-
(41,
000,
980)
O
vers
eas o
pera
tions
tran
slat
ion
cr
edit
-
-
-
-
-
-
-
41
5,90
8
-
415,
908
Oth
ers
-
-
(2
,162
,579
) -
-
-
3,
243,
869
-
-
1,
081,
290
Bal
ance
at D
ecem
ber 3
1, 2
014
686
,100
,480
11,4
52,7
13
118
,189
,001
931,
508
(1
,189
,820
)
-
- (
13,0
65,2
31)
(25
,034
,686
) 7
77,3
83,9
65
Bal
ance
at J
anua
ry 1
, 201
5 6
86,1
00,4
80
11
,452
,713
1
18,1
89,0
01
93
1,50
8
(1,1
89,8
20)
-
-
(13
,065
,231
) (
25,0
34,6
86)
777
,383
,965
N
et lo
ss
- -
- -
- -
- -
(61,
942,
174)
(6
1,94
2,17
4)
Act
uaria
l los
s -
- -
- -
- -
- (1
5,31
7,73
4)
(15,
317,
734)
G
ain
on v
alua
tion
of d
eriv
ativ
es
- -
- -
- -
- 14
,394
,640
-
14,3
94,6
40
Ove
rsea
s ope
ratio
ns tr
ansl
atio
n
cred
it -
- -
- -
- -
241,
521
- 24
1,52
1 D
ispo
sal o
f tre
asur
y st
ock
-
-
-
-
1,
189,
820
1,
105,
137
-
-
-
2,
294,
957
Bal
ance
at D
ecem
ber 3
1, 2
015
686
,100
,480
11,4
52,7
13
118
,189
,001
931,
508
-
1,
105,
137
-
1,
570,
930
(102
,294
,594
) 7
17,0
55,1
75
(Con
tinue
d)
SS
AN
GY
ON
G M
OT
OR
CO
MPA
NY
AN
D IT
S SU
BSI
DIA
RIE
S
CO
NSO
LID
AT
ED
ST
AT
EM
EN
TS
OF
CH
AN
GE
S IN
SH
AR
EH
OL
DE
RS’
EQ
UIT
Y (C
ON
TIN
UE
D)
FO
R T
HE
YE
AR
S E
ND
ED
DE
CE
MB
ER
31,
201
5 A
ND
201
4
In
dian
rupe
e in
thou
sand
s
O
ther
cap
ital s
urpl
us
C
apita
l sto
ck
Paid
-in c
apita
l i
n ex
cess
of
par
Gai
n on
cap
ital
re
duct
ion
D
ebt t
o be
s
wap
ped
for
eq
uity
T
reas
ury
stoc
k
Gai
n on
di
spos
al o
f tr
easu
ry st
ock
Oth
er c
apita
l
surp
lus
Oth
er c
apita
l a
djus
tmen
ts
R
etai
ned
ea
rnin
gs
(acc
umul
ated
de
ficit)
Tota
l
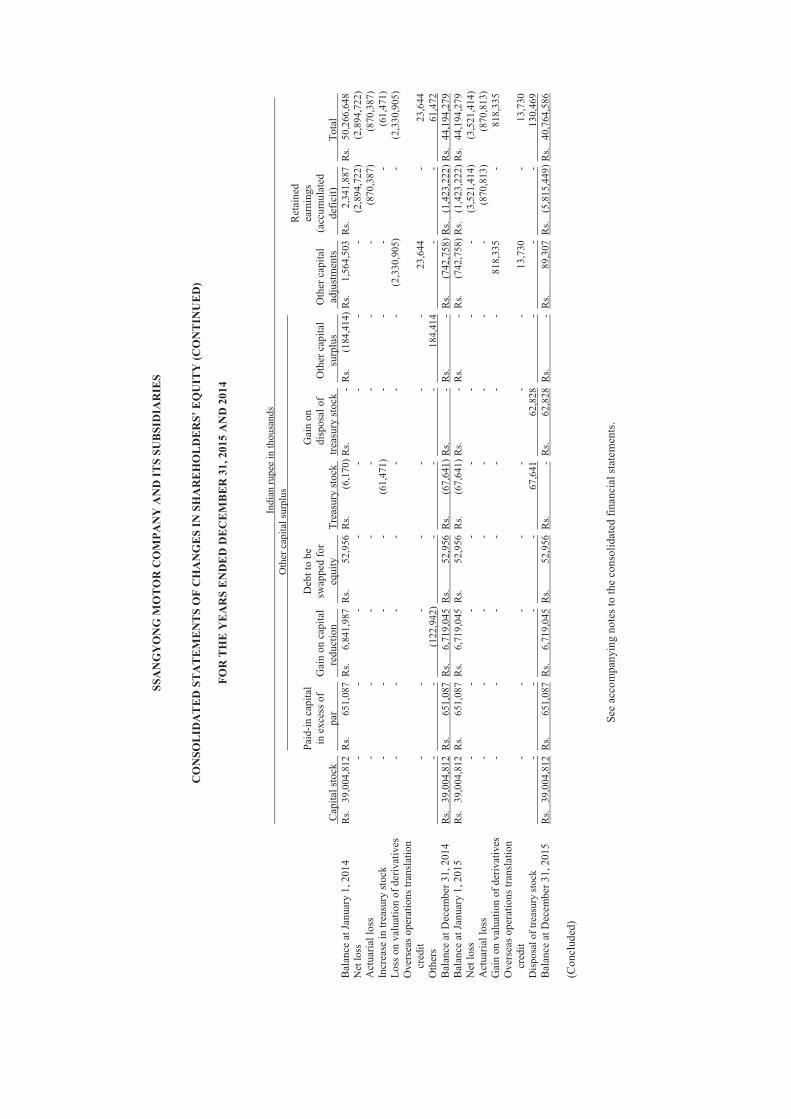
Bal
ance
at J
anua
ry 1
, 201
4
Rs.
39,0
04,8
12 R
s. 65
1,08
7 R
s. 6,
841,
987
Rs.
52,9
56 R
s.
(6,1
70) R
s. -
Rs.
(1
84,4
14) R
s. 1,
564,
503
Rs.
2,34
1,88
7 R
s. 50
,266
,648
N
et lo
ss
- -
- -
- -
- -
(2,8
94,7
22)
(2,8
94,7
22)
Act
uaria
l los
s -
- -
- -
- -
- (8
70,3
87)
(870
,387
) In
crea
se in
trea
sury
stoc
k -
- -
- (6
1,47
1)
- -
- -
(61,
471)
Lo
ss o
n va
luat
ion
of d
eriv
ativ
es
- -
- -
- -
- (2
,330
,905
) -
(2,3
30,9
05)
Ove
rsea
s ope
ratio
ns tr
ansl
atio
n
cred
it
-
-
-
-
-
-
-
23,6
44
-
23,6
44
Oth
ers
-
-
(1
22,9
42)
-
-
-
184,
414
-
-
61
,472
B
alan
ce a
t Dec
embe
r 31,
201
4 R
s. 39
,004
,812
Rs.
651,
087
Rs.
6,71
9,04
5 R
s. 52
,956
Rs.
(6
7,64
1) R
s. -
Rs.
-
Rs.
(7
42,7
58) R
s. (1
,423
,222
) Rs.
44,1
94,2
79
Bal
ance
at J
anua
ry 1
, 201
5 R
s. 39
,004
,812
Rs.
651,
087
Rs.
6,71
9,04
5 R
s. 52
,956
Rs.
(6
7,64
1) R
s. -
Rs.
-
Rs.
(7
42,7
58) R
s. (1
,423
,222
) Rs.
44,1
94,2
79
Net
loss
-
- -
- -
- -
- (3
,521
,414
) (3
,521
,414
) A
ctua
rial l
oss
- -
- -
- -
- -
(870
,813
) (8
70,8
13)
Gai
n on
val
uatio
n of
der
ivat
ives
-
- -
- -
- -
818,
335
- 81
8,33
5 O
vers
eas o
pera
tions
tran
slat
ion
cr
edit
- -
- -
- -
- 13
,730
-
13,7
30
Dis
posa
l of t
reas
ury
stoc
k
-
-
-
-
67,6
41
62,8
28
-
-
-
130,
469
Bal
ance
at D
ecem
ber 3
1, 2
015
Rs.
39,0
04,8
12 R
s. 65
1,08
7 R
s. 6,
719,
045
Rs.
52,9
56 R
s. -
Rs.
62,8
28 R
s. -
Rs.
89
,307
Rs.
(5,
815,
449)
Rs.
40,7
64,5
86
(Con
clud
ed)
Se
e ac
com
pany
ing
note
s to
the
cons
olid
ated
fina
ncia
l sta
tem
ents
.
SSANGYONG MOTOR COMPANY AND ITS SUBSIDIARIES
CONSOLIDATED STATEMENTS OF CASH FLOWS
FOR THE YEARS ENDED DECEMBER 31, 2015 AND 2014
Korean won Indian rupeeYear ended
December 31,2015
Year endedDecember 31,
2014
Year endedDecember31,
2015
Year endedDecember 31,
2014(In thousands) (In thousands)
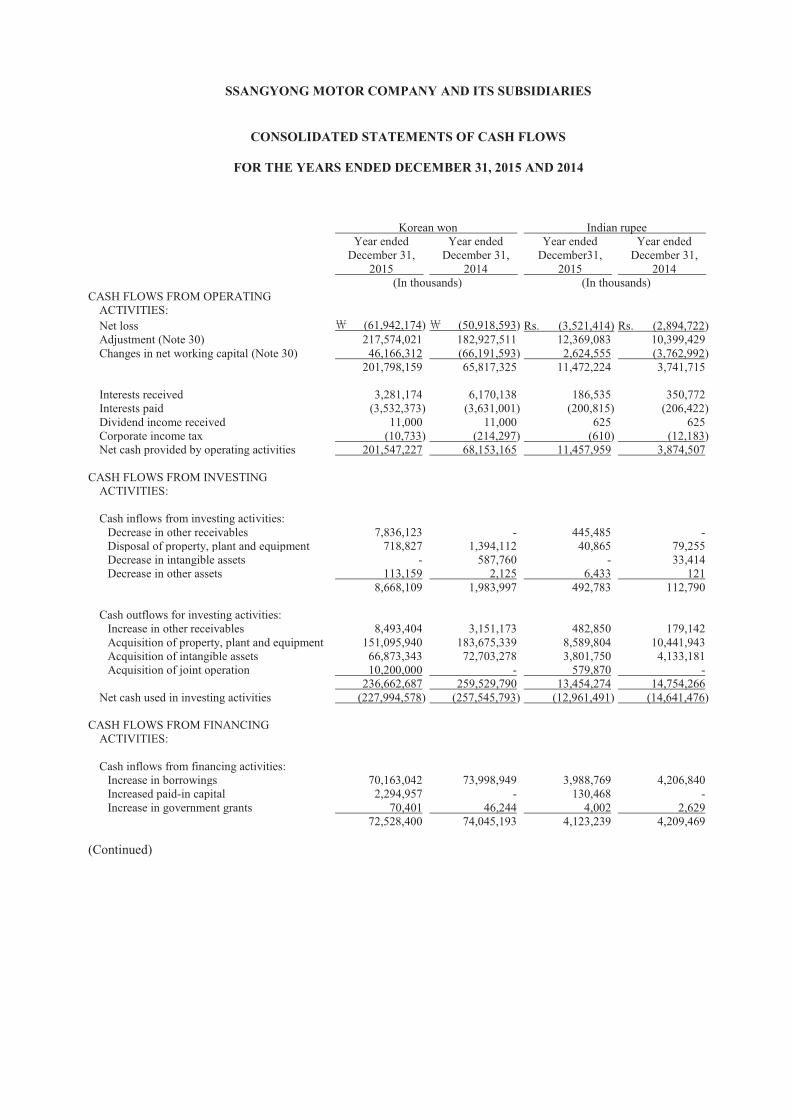
CASH FLOWS FROM OPERATING ACTIVITIES:Net loss (61,942,174) (50,918,593) Rs. (3,521,414) Rs. (2,894,722)Adjustment (Note 30) 217,574,021 182,927,511 12,369,083 10,399,429Changes in net working capital (Note 30) 46,166,312 (66,191,593) 2,624,555 (3,762,992)
201,798,159 65,817,325 11,472,224 3,741,715
Interests received 3,281,174 6,170,138 186,535 350,772Interests paid (3,532,373) (3,631,001) (200,815) (206,422)Dividend income received 11,000 11,000 625 625Corporate income tax (10,733) (214,297) (610) (12,183)Net cash provided by operating activities 201,547,227 68,153,165 11,457,959 3,874,507
CASH FLOWS FROM INVESTING ACTIVITIES:
Cash inflows from investing activities:Decrease in other receivables 7,836,123 - 445,485 -Disposal of property, plant and equipment 718,827 1,394,112 40,865 79,255Decrease in intangible assets - 587,760 - 33,414Decrease in other assets 113,159 2,125 6,433 121
8,668,109 1,983,997 492,783 112,790
Cash outflows for investing activities:Increase in other receivables 8,493,404 3,151,173 482,850 179,142Acquisition of property, plant and equipment 151,095,940 183,675,339 8,589,804 10,441,943Acquisition of intangible assets 66,873,343 72,703,278 3,801,750 4,133,181Acquisition of joint operation 10,200,000 - 579,870 -
236,662,687 259,529,790 13,454,274 14,754,266Net cash used in investing activities (227,994,578) (257,545,793) (12,961,491) (14,641,476)
CASH FLOWS FROM FINANCING ACTIVITIES:
Cash inflows from financing activities:Increase in borrowings 70,163,042 73,998,949 3,988,769 4,206,840Increased paid-in capital 2,294,957 - 130,468 -Increase in government grants 70,401 46,244 4,002 2,629
72,528,400 74,045,193 4,123,239 4,209,469
(Continued)
SSANGYONG MOTOR COMPANY AND ITS SUBSIDIARIES
CONSOLIDATED STATEMENTS OF CASH FLOWS (CONTINUED)
FOR THE YEARS ENDED DECEMBER 31, 2015 AND 2014
Korean won Indian rupeeYear ended
December 31,2015
Year endedDecember 31,
2014
Year endedDecember 31,
2015
Year endedDecember 31,
2014(In thousands) (In thousands)
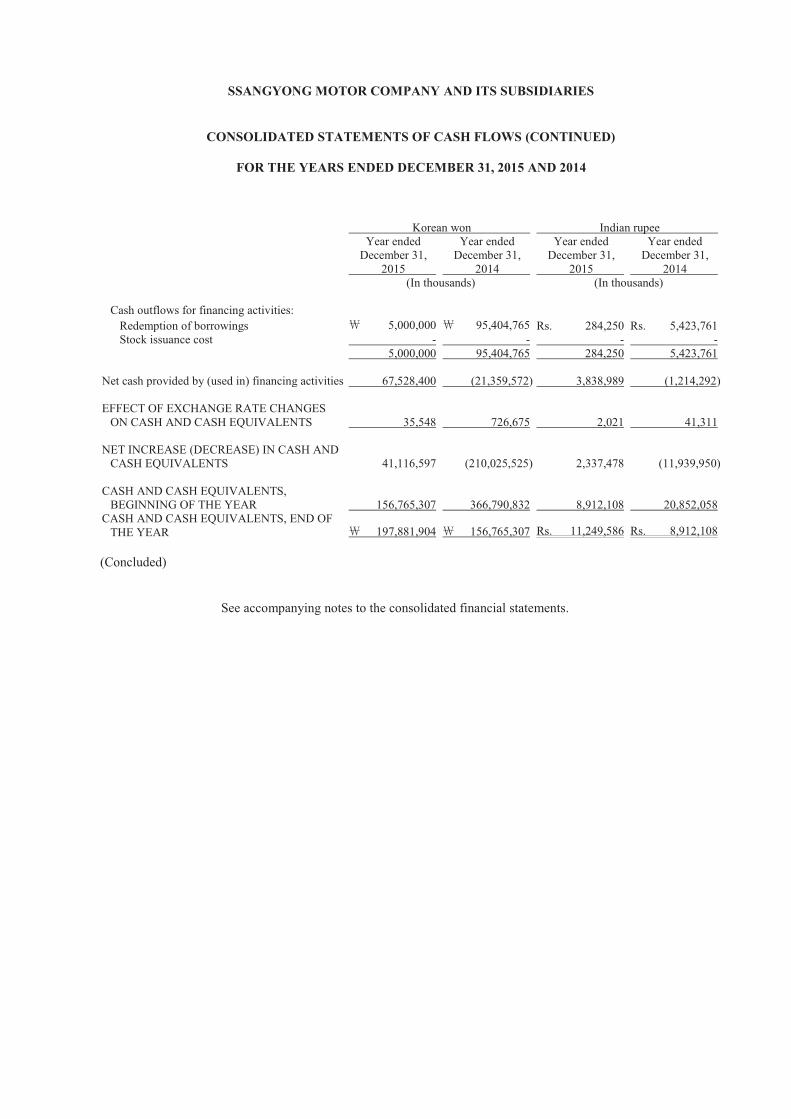
Cash outflows for financing activities:Redemption of borrowings 5,000,000 95,404,765 Rs. 284,250 Rs. 5,423,761Stock issuance cost - - - -
5,000,000 95,404,765 284,250 5,423,761
Net cash provided by (used in) financing activities 67,528,400 (21,359,572) 3,838,989 (1,214,292)
EFFECT OF EXCHANGE RATE CHANGES ON CASH AND CASH EQUIVALENTS 35,548 726,675 2,021 41,311
NET INCREASE (DECREASE) IN CASH AND CASH EQUIVALENTS 41,116,597 (210,025,525) 2,337,478 (11,939,950)
CASH AND CASH EQUIVALENTS, BEGINNING OF THE YEAR 156,765,307 366,790,832 8,912,108 20,852,058
CASH AND CASH EQUIVALENTS, END OFTHE YEAR 197,881,904 156,765,307 Rs. 11,249,586 Rs. 8,912,108
(Concluded)
See accompanying notes to the consolidated financial statements.
SSANGYONG MOTOR COMPANY AND ITS SUBSIDIARIES
NOTES TO CONSOLIDATED FINANCIAL STATEMENTS
AS OF AND FOR THE YEAR ENDED DECEMBER 31, 2015 AND 2014
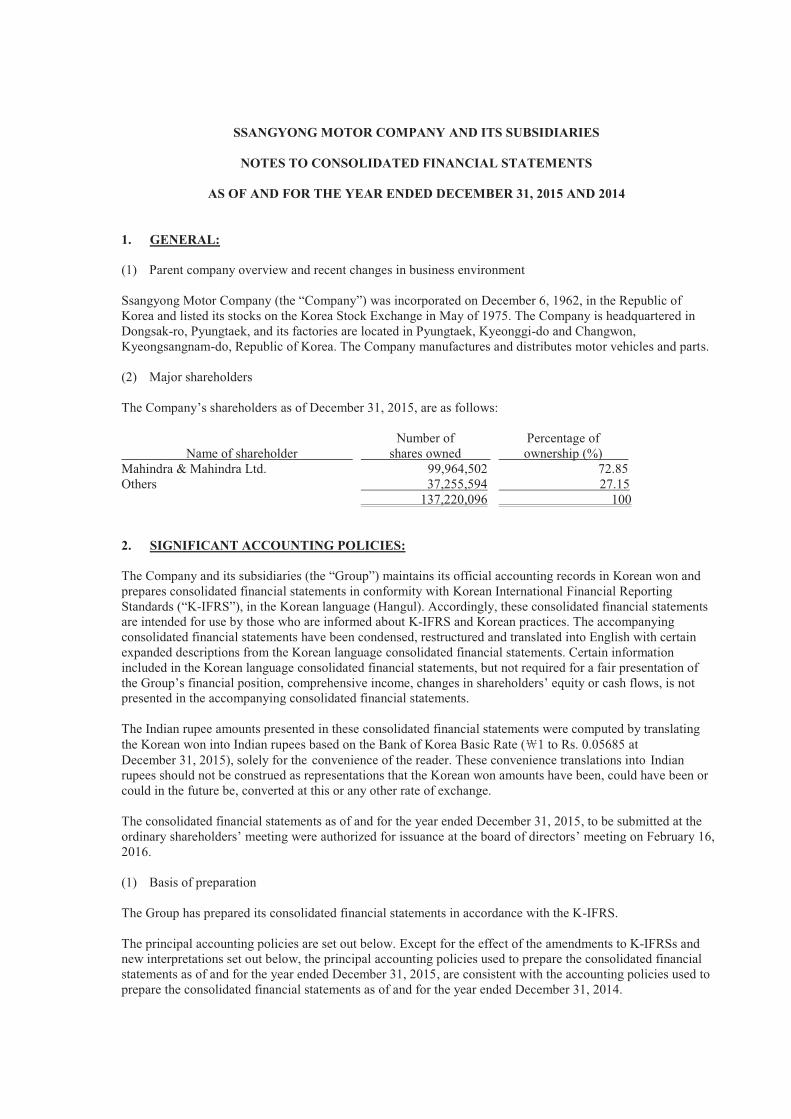
1. GENERAL: (1) Parent company overview and recent changes in business environment Ssangyong Motor Company (the “Company”) was incorporated on December 6, 1962, in the Republic of Korea and listed its stocks on the Korea Stock Exchange in May of 1975. The Company is headquartered in Dongsak-ro, Pyungtaek, and its factories are located in Pyungtaek, Kyeonggi-do and Changwon, Kyeongsangnam-do, Republic of Korea. The Company manufactures and distributes motor vehicles and parts. (2) Major shareholders The Company’s shareholders as of December 31, 2015, are as follows:
Name of shareholder Number of shares owned
Percentage of ownership (%)
Mahindra & Mahindra Ltd. 99,964,502 72.85 Others 37,255,594 27.15 137,220,096 100 2. SIGNIFICANT ACCOUNTING POLICIES: The Company and its subsidiaries (the “Group”) maintains its official accounting records in Korean won and prepares consolidated financial statements in conformity with Korean International Financial Reporting Standards (“K-IFRS”), in the Korean language (Hangul). Accordingly, these consolidated financial statements are intended for use by those who are informed about K-IFRS and Korean practices. The accompanying consolidated financial statements have been condensed, restructured and translated into English with certain expanded descriptions from the Korean language consolidated financial statements. Certain information included in the Korean language consolidated financial statements, but not required for a fair presentation of the Group’s financial position, comprehensive income, changes in shareholders’ equity or cash flows, is not presented in the accompanying consolidated financial statements. The Indian rupee amounts presented in these consolidated financial statements were computed by translating the Korean won into Indian rupees based on the Bank of Korea Basic Rate ( 1 to Rs. 0.05685 at December 31, 2015), solely for the convenience of the reader. These convenience translations into Indian rupees should not be construed as representations that the Korean won amounts have been, could have been or could in the future be, converted at this or any other rate of exchange. The consolidated financial statements as of and for the year ended December 31, 2015, to be submitted at the ordinary shareholders’ meeting were authorized for issuance at the board of directors’ meeting on February 16, 2016. (1) Basis of preparation The Group has prepared its consolidated financial statements in accordance with the K-IFRS. The principal accounting policies are set out below. Except for the effect of the amendments to K-IFRSs and new interpretations set out below, the principal accounting policies used to prepare the consolidated financial statements as of and for the year ended December 31, 2015, are consistent with the accounting policies used to prepare the consolidated financial statements as of and for the year ended December 31, 2014.
- 2 -
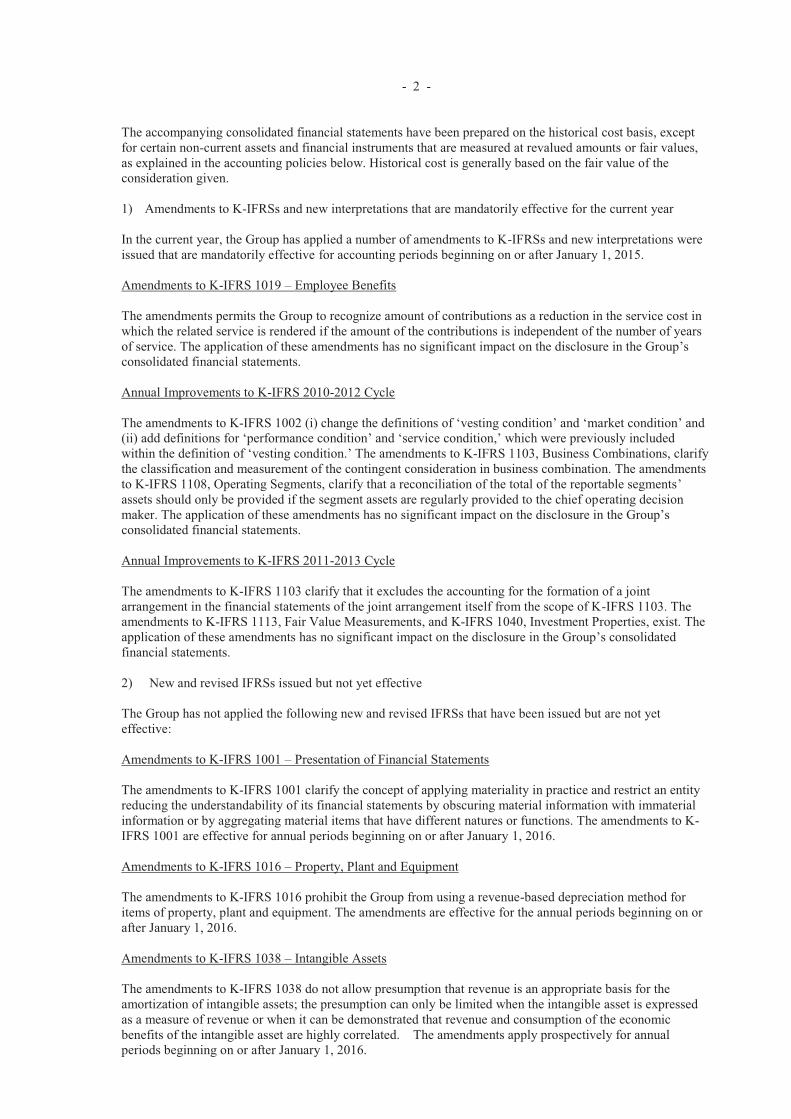
The accompanying consolidated financial statements have been prepared on the historical cost basis, except for certain non-current assets and financial instruments that are measured at revalued amounts or fair values, as explained in the accounting policies below. Historical cost is generally based on the fair value of the consideration given. 1) Amendments to K-IFRSs and new interpretations that are mandatorily effective for the current year In the current year, the Group has applied a number of amendments to K-IFRSs and new interpretations were issued that are mandatorily effective for accounting periods beginning on or after January 1, 2015. Amendments to K-IFRS 1019 – Employee Benefits The amendments permits the Group to recognize amount of contributions as a reduction in the service cost in which the related service is rendered if the amount of the contributions is independent of the number of years of service. The application of these amendments has no significant impact on the disclosure in the Group’s consolidated financial statements. Annual Improvements to K-IFRS 2010-2012 Cycle The amendments to K-IFRS 1002 (i) change the definitions of ‘vesting condition’ and ‘market condition’ and (ii) add definitions for ‘performance condition’ and ‘service condition,’ which were previously included within the definition of ‘vesting condition.’ The amendments to K-IFRS 1103, Business Combinations, clarify the classification and measurement of the contingent consideration in business combination. The amendments to K-IFRS 1108, Operating Segments, clarify that a reconciliation of the total of the reportable segments’ assets should only be provided if the segment assets are regularly provided to the chief operating decision maker. The application of these amendments has no significant impact on the disclosure in the Group’s consolidated financial statements. Annual Improvements to K-IFRS 2011-2013 Cycle The amendments to K-IFRS 1103 clarify that it excludes the accounting for the formation of a joint arrangement in the financial statements of the joint arrangement itself from the scope of K-IFRS 1103. The amendments to K-IFRS 1113, Fair Value Measurements, and K-IFRS 1040, Investment Properties, exist. The application of these amendments has no significant impact on the disclosure in the Group’s consolidated financial statements. 2) New and revised IFRSs issued but not yet effective The Group has not applied the following new and revised IFRSs that have been issued but are not yet effective: Amendments to K-IFRS 1001 – Presentation of Financial Statements The amendments to K-IFRS 1001 clarify the concept of applying materiality in practice and restrict an entity reducing the understandability of its financial statements by obscuring material information with immaterial information or by aggregating material items that have different natures or functions. The amendments to K-IFRS 1001 are effective for annual periods beginning on or after January 1, 2016. Amendments to K-IFRS 1016 – Property, Plant and Equipment The amendments to K-IFRS 1016 prohibit the Group from using a revenue-based depreciation method for items of property, plant and equipment. The amendments are effective for the annual periods beginning on or after January 1, 2016. Amendments to K-IFRS 1038 – Intangible Assets The amendments to K-IFRS 1038 do not allow presumption that revenue is an appropriate basis for the amortization of intangible assets; the presumption can only be limited when the intangible asset is expressed as a measure of revenue or when it can be demonstrated that revenue and consumption of the economic benefits of the intangible asset are highly correlated. The amendments apply prospectively for annual periods beginning on or after January 1, 2016.
- 3 -
Amendments to K-IFRS 1110 – Consolidated Financial Statements, K-IFRS 1112 – Disclosure of Interests in Other Entities and K-IFRS 1028 – Investment in Associates The amendments clarify that on applying the equity method of accounting to an associate or a joint venture that is an investment entity, an investor may retain the fair value measurements that the associate or joint venture used for its subsidiaries. The amendments are effective for annual periods beginning on or after January 1, 2016. Amendments to K-IFRS 1111 – Accounting for Acquisitions of Interests in Joint Operations The amendments to K-IFRS 1111 provide guidance on how to account for the acquisition of a joint operation that constitutes a business as defined in K-IFRS 1103. A joint operator is also required to disclose the relevant information required by K-IFRS 1103 and other standards for business combinations. The amendments to K-IFRS 1111 are effective for the annual periods beginning on or after January 1, 2016. Amendments to K-IFRS 1109 – Financial Instruments The amendments to K-IFRS 1109 contain the requirements for the classification and measurement of financial assets and financial liabilities based on a business model, whose objective is achieved both by collecting contractual cash flows and selling financial assets, and the contractual terms that give rise on specified dates to cash flows; impairment methodology based on the expected credit losses; broadened types of instruments that qualify as hedging instruments; the types of risk components of non-financial items that are eligible for hedge accounting; and the change of the hedge effectiveness test. The amendments are effective for annual periods beginning on or after January 1, 2018. Amendments to K-IFRS 1115 – Revenue from Contracts with Customers The core principle under K-IFRS 1115 is that an entity should recognize revenue to depict the transfer of promised goods or services to customers in an amount that reflects the consideration to which the entity expects to be entitled in exchange for those goods or services. The amendments introduce a five-step approach to revenue recognition and measurement: 1) Identify the contract with a customer, 2) Identify the performance obligations in the contract, 3) Determine the transaction price, 4) Allocate the transaction price to the performance obligations in the contract and 5) Recognize revenue when (or as) the entity satisfies a performance obligation. This standard will supersede K-IFRS 1011, Construction Contracts; K-IFRS 1018, Revenue; K-IFRS 2113, Customer Loyalty Programmes; K-IFRS 2115, Agreements for the Construction of Real Estate; K-IFRS 2118, Transfers of Assets from Customers; and K-IFRS 2031, Revenue-Barter Transactions Involving Advertising Services. The amendments are effective for annual periods beginning on or after January 1, 2018. Annual Improvements to K-IFRS 2012-2014 cycle The annual improvements include amendments to a number of K-IFRSs. The amendments introduce specific guidance in K-IFRS 1105, Non-current Assets Held for Sale and Discontinued Operations, when an entity reclassifies an asset (or disposal group) from held for sale to held for distribution to owners (or vice versa); such a change is considered as a continuation of the original plan of disposal, not as a change to a plan of sale. Other amendments in the annual improvements include K-IFRS 1107, Financial Instruments: Disclosures; K-IFRS 1019, Employee Benefits; and K-IFRS 1034, Interim Financial Reporting. The application of these amendments has no significant impact on the disclosure in the Group’s consolidated financial statements. (2) Basis of consolidation The consolidated financial statements incorporate the financial statements of the Group and the entities (including structured entities) controlled by the Group (and its subsidiaries). Control is achieved when the Group 1) has the power over the investee; 2) is exposed, or has rights, to variable returns from its involvement with the investee; and 3) has the ability to use its power to affect its returns. The Group reassesses whether or not it controls an investee if facts and circumstances indicate that there are changes to one or more of the three elements of control listed above.
- 4 -
When the Group has less than a majority of the voting rights of an investee, it has power over the investee when the voting rights are sufficient to give it the practical ability to direct the relevant activities of the investee unilaterally. The Group considers all relevant facts and circumstances in assessing whether or not the Group's voting rights in an investee are sufficient to give it power, including:
the size of the Group's holding of voting rights relative to the size and dispersion of holdings of the other vote holders; potential voting rights held by the Group, other vote holders or other parties; rights arising from other contractual arrangements; and any additional facts and circumstances that indicate that the Group has, or does not have, the current ability to direct the relevant activities at the time that decisions need to be made, including voting patterns at previous shareholders' meetings.
Income and expenses of subsidiaries acquired or disposed of during the year are included in the consolidated statements of comprehensive income from the date the Group gains control to the date when the Group ceases to control the subsidiary. Profit or loss and each component of other comprehensive income are attributed to the owners of the Group and to the non-controlling interests. Total comprehensive income of subsidiaries is attributed to the owners of the Group and to the non-controlling interests even if this results in the non-controlling interests having a deficit balance. When necessary, adjustments are made to the financial statements of subsidiaries to bring their accounting policies in line with the Group’s accounting policies. All intragroup transactions and related assets and liabilities, income and expenses are eliminated in full on consolidation Changes in the Group’s ownership interests in subsidiaries that do not result in the Group losing control over the subsidiaries are accounted for as equity transactions. The carrying amounts of the Group’s interests and the non-controlling interests are adjusted to reflect the changes in their relative interests in the subsidiaries. Any difference between the amount by which the non-controlling interests are adjusted and the fair value of the consideration paid or received is recognized directly in equity and attributed to the owners of the Group. When the Group loses control of a subsidiary, a gain or loss on disposal is calculated as the difference between (i) the aggregate of the fair value of the consideration received and the fair value of any retained interest and (ii) the previous carrying amount of the assets (including goodwill) and liabilities of the subsidiary and any non-controlling interests. When assets of the subsidiary are carried at revalued amounts or fair values and the related cumulative gain or loss has been recognized in other comprehensive income and accumulated in equity, the amounts previously recognized in other comprehensive income and accumulated in equity are accounted for as if the Group had directly disposed of the relevant assets (i.e., reclassified to profit or loss or transferred directly to retained earnings). The fair value of any investment retained in the former subsidiary at the date when control is lost is recognized as the fair value on initial recognition for subsequent accounting under K-IFRS 1039, Financial Instruments: Recognition and Measurement, or, when applicable, the cost on initial recognition of an investment in an associate or a joint venture. (3) Investments in associates and joint ventures An associate is an entity over which the Group has significant influence. Significant influence is the power to participate in the financial and operating policy decisions of the investee but is not control or joint control over those policies. A joint venture is a joint arrangement whereby the parties that have joint control of the arrangement have rights to the net assets of the joint arrangement. Joint control is the contractually agreed sharing of control of an arrangement, which exists only when decisions about the relevant activities require unanimous consent of the parties sharing control.
- 5 -
The results and assets and liabilities of associates or joint ventures are incorporated in these consolidated financial statements using the equity method of accounting, except when the investment is classified as held for sale; in which case, it is accounted for in accordance with K-IFRS 1105, Non-current Assets Held for Sale and Discontinued Operations. Under the equity method, an investment in an associate or a joint venture is initially recognized in the consolidated statements of financial position at cost and adjusted thereafter to recognize the Group's share of the profit or loss and other comprehensive income of the associate or joint venture. When the Group's share of losses of an associate or a joint venture exceeds the Group's interest in that associate or joint venture (which includes any long-term interests that, in substance, form part of the Group's net investment in the associate or joint venture), the Group discontinues recognizing its share of further losses. Additional losses are recognized only to the extent that the Group has incurred legal or constructive obligations or made payments on behalf of the associate or joint venture. Any excess of the cost of acquisition over the Group's share of the net fair value of the identifiable assets, liabilities and contingent liabilities of an associate or a joint venture recognized at the date of acquisition is recognized as goodwill, which is included within the carrying amount of the investment. Any excess of the Group’s share of the net fair value of the identifiable assets, liabilities and contingent liabilities over the cost of acquisition, after reassessment, is recognized immediately in profit or loss. Upon disposal of an associate or a joint venture that results in the Group losing significant influence over that associate or joint venture, any retained investment is measured at fair value at that date and the fair value is regarded as its fair value on initial recognition as a financial asset in accordance with K-IFRS 1039. The difference between the previous carrying amount of the associate or joint venture attributable to the retained interest and its fair value is included in the determination of the gain or loss on disposal of the associate or joint venture. In addition, the Group accounts for all amounts previously recognized in other comprehensive income in relation to that associate or joint venture on the same basis it would be required if that associate or joint venture had directly disposed of the related assets or liabilities. Therefore, if a gain or loss previously recognized in other comprehensive income by that associate or joint venture would be reclassified to profit or loss on the disposal of the related assets or liabilities, the Group reclassifies the gain or loss from equity to profit or loss (as reclassification adjustment) when it loses significant influence over that associate or joint venture. When the Group reduces its ownership interest in an associate or a joint venture but continues to use the equity method, it reclassifies to profit or loss the proportion of the gain or loss that had previously been recognized in other comprehensive income relating to that reduction in ownership interest if that gain or loss would be reclassified to profit or loss on the disposal of the related assets or liabilities. In addition, the Group applies K-IFRS 5, Non-current Assets Held for Sale and Discontinued Operations, to a portion of investment in an associate or a joint venture that meets the criteria to be classified as held for sale. The requirements of K-IFRS 1039 are applied to determine whether it is necessary to recognize any impairment loss with respect to the Group’s investment in an associate or a joint venture. When necessary, the entire carrying amount of the investment (including goodwill) is tested for impairment in accordance with K-IFRS 1036, Impairment of Assets, by comparing its recoverable amount (higher of value in use or fair value, less costs to sell) with its carrying amount, and any impairment loss recognized forms part of the carrying amount of the investment. Any reversal of that impairment loss is recognized in accordance with K-IFRS 1036 to the extent that the recoverable amount of the investment subsequently increases. The Group continues to use the equity method when an investment in an associate becomes an investment in a joint venture or an investment in a joint venture becomes an investment in an associate. There is no remeasurement to fair value upon such changes in ownership interests. When a group entity transacts with an associate or a joint venture of the Group, profits and losses resulting from the transactions with the associate or joint venture are recognized in the Group's consolidated financial statements only to the extent of interests in the associate or joint venture that are not related to the Group. (4) Revenue recognition Revenue is measured at the fair value of the consideration received or receivable. Revenue is reduced for estimated customer returns, rebates and other similar allowances. The Group recognizes revenue when the amount of revenue can be reliably measured; when it is probable that future economic benefits will flow to the entity; and when specific criteria have been met for each of the Group’s activities, as described below.
- 6 -
1) Sale of goods Revenue from the sale of goods is recognized when the Group has transferred the significant risks and rewards of ownership of the goods to the buyer. 2) Rendering of services Revenue from a contract to provide services is recognized by reference to the stage of completion of the contract. Depending on the nature of the transaction, the Group determines the stage of completion by reference to surveys of work performed, services performed to date as a percentage of total services to be performed or the proportion that costs incurred to date bear the estimated total costs of the transaction, as applicable. 3) Dividend and interest income Dividend income from investments is recognized when the shareholders’ right to receive payment has been established (provided that it is probable that the economic benefits will flow to the Group and the amount of income can be measured reliably). Interest income from a financial asset is recognized when it is probable that the economic benefits will flow to the Group and the amount of income can be measured reliably. Interest income is accrued on a timely basis, by reference to the principal outstanding and at the effective interest rate applicable, which is the rate that exactly discounts estimated future cash receipts through the expected life of the financial asset to that asset’s net carrying amount on initial recognition (5) Foreign currencies The individual financial statements of each Group entity are presented in the currency of the primary economic environment in which the entity operates (its functional currency). For the purpose of the consolidated financial statements, the results and financial position of each Group entity are expressed in Korean won, which is the functional currency of the entity and the presentation currency for the consolidated financial statements. In preparing the financial statements of the individual entities, transactions in currencies other than the entity’s functional currency (foreign currencies) are recognized at the rates of exchange prevailing at the dates of the transactions. At the end of each reporting period, monetary items denominated in foreign currencies are retranslated at the rates prevailing at that date. Non-monetary items carried at fair value that are denominated in foreign currencies are retranslated at the rates prevailing at the date when the fair value was determined. Non-monetary items that are measured in terms of historical cost in a foreign currency are not retranslated. Exchange differences are recognized in profit or loss in the period in which they arise, except for:
exchange differences on foreign currency borrowings relating to assets under construction for future productive use, which are included in the cost of those assets when they are regarded as an adjustment to interest costs on those foreign currency borrowings; exchange differences on transactions entered into in order to hedge certain foreign currency risks (see Note 2 (25) below for hedging accounting policies); and exchange differences on monetary items receivable from or payable to a foreign operation for which settlement is neither planned nor likely to occur (therefore forming part of the net investment in the foreign operation) are recognized initially in other comprehensive income and reclassified from equity to profit or loss on disposal or partial disposal of the net investment.
For the purpose of presenting consolidated financial statements, the assets and liabilities of the Group’s foreign operations are expressed in Korean won using exchange rates prevailing at the end of the reporting period. Income and expense items are translated at the average exchange rates for the period, unless exchange rates fluctuated significantly during that period; in which case, the exchange rates at the dates of the transactions are used. Exchange differences arising, if any, are recognized in other comprehensive income and accumulated in equity (attributed to non-controlling interests as appropriate).
- 7 -
On the disposal of a foreign operation (i.e., a disposal of the Group’s entire interest in a foreign operation, or a disposal involving loss of control over a subsidiary that includes a foreign operation, or partial disposal of an interest in a joint arrangement or an associate that includes a foreign operation whose retained interest becomes a financial asset), all of the accumulated exchange differences in respect of that operation attributable to the owners of the Group are reclassified to profit or loss. Any exchange differences that have previously been attributed to non-controlling interests are derecognized, but they are not reclassified to profit or loss. In the case of a partial disposal (i.e., no loss of control) of a subsidiary that includes a foreign operation, the proportionate share of accumulated exchange differences are reattributed to non-controlling interests in equity and are not recognized in profit or loss. For all other partial disposals (i.e., partial disposals of associates or joint arrangements that do not result in the Group losing significant influence or joint control), the proportionate share of the accumulated exchange differences is reclassified to profit or loss. Goodwill and fair value adjustments arising on the acquisition of a foreign operation are treated as assets and liabilities of the foreign operation and translated at the closing rate. Exchange differences arising are recognized in other comprehensive income. (6) Financial instruments Financial assets and financial liabilities are recognized when an entity becomes a party to the contractual provisions of the instruments. Financial assets and financial liabilities are initially measured at fair value. Transaction costs that are directly attributable to the acquisition or issue of financial assets and financial liabilities are added to or deducted from the fair value of the financial assets or financial liabilities, as appropriate, on initial recognition. Transaction costs directly attributable to the acquisition of financial assets or financial liabilities at fair value through profit or loss (“FVTPL”) are recognized immediately in profit or loss. All regular way purchases or sales of financial assets are recognized and derecognized on a trade-date basis. Regular way purchases or sales are purchases or sales of financial assets that require delivery of assets within the time frame established by regulation or convention in the marketplace. Financial assets are classified into the following specified categories: ‘financial assets at FVTPL,’ ‘held-to-maturity investments,’ ‘available-for-sale (“AFS”) financial assets’ and ‘loans and receivables.’ The classification depends on the nature and purpose of the financial assets and is determined at the time of initial recognition. 1) Effective interest method The effective interest method is a method of calculating the amortized cost of a debt instrument and allocating interest income over the relevant period. The effective interest rate is the rate that exactly discounts estimated future cash receipts (including all fees and points paid or received that form an integral part of the effective interest rate, transaction costs and other premiums or discounts) through the expected life of the debt instrument, or (where appropriate) a shorter period, to the net carrying amount on initial recognition. Income is recognized on an effective interest basis for debt instruments other than those financial assets classified as at FVTPL. 2) Financial assets at FVTPL Financial assets are classified as at FVTPL when a financial asset is a contingent consideration that may be paid by an acquirer as part of business combination to which K-IFRS 1103 applies. A financial asset is classified as held for trading if:
it has been acquired principally for the purpose of selling in the near term; or on initial recognition, it is part of a portfolio of identified financial instruments that the Group manages together and has a recent actual pattern of short-term profit-taking; or it is a derivative that is not designated and effective as a hedging instrument.
- 8 -
A financial asset other than a financial asset held for trading or contingent consideration that may be paid by an acquirer as part of a business combination may be designated as at FVTPL upon initial recognition if:
such designation eliminates or significantly reduces a measurement or recognition inconsistency that would otherwise arise; the financial asset forms part of a group of financial assets or financial liabilities, or both, which is managed, and its performance is evaluated on a fair value basis, in accordance with the Group's documented risk management or investment strategy, and information about the grouping is provided internally on that basis; or it forms part of a contract containing one or more embedded derivatives, and K-IFRS 1039 permits the entire combined contract (asset or liability) to be designated as at FVTPL.
Financial assets at FVTPL are stated at fair value, with any gains or losses arising on remeasurement recognized in profit or loss. The net gain or loss recognized in profit or loss incorporates any dividend or interest earned on the financial asset and is included in the ‘other gains and losses’ line item in the consolidated statements of comprehensive income. 3) Held-to-maturity investments Non-derivative financial assets with fixed or determinable payments and fixed maturity dates that the Group has the positive intent and ability to hold to maturity are classified as held-to-maturity investments. Held-to-maturity investments are measured at amortized cost using the effective interest method, less any impairment, with revenue recognized on an effective yield basis. 4) AFS financial assets AFS financial assets are non-derivatives that are either designated as AFS or are not classified as (a) loans and receivables, (b) held-to-maturity investments or (c) financial assets at FVTPL. They are subsequently measured at fair value at the end of each reporting period. Changes in the carrying amount of AFS monetary financial assets relating to changes in foreign currency rates (see below), interest income calculated using the effective interest method and dividends on AFS equity investments are recognized in profit or loss. Other changes in the carrying amount of AFS financial assets are recognized in other comprehensive income. When the investment is disposed of or is determined to be impaired, the cumulative gain or loss previously accumulated in other comprehensive income is reclassified to profit or loss. Dividends on AFS equity instruments are recognized in profit or loss when the Group’s right to receive the dividends is established. The fair value of AFS monetary financial assets denominated in a foreign currency is determined in that foreign currency and translated at the spot rate prevailing at the end of the reporting period. The foreign exchange gains and losses that are recognized in profit or loss are determined based on the amortized cost of the monetary asset. Other foreign exchange gains and losses are recognized in other comprehensive income. AFS equity investments that do not have a quoted market price in an active market and whose fair value cannot be reliably measured and derivatives that are linked to and must be settled by delivery of such unquoted equity investments are measured at cost less any identified impairment losses at the end of each reporting period. 5) Loans and receivables Trade receivables, loans and other receivables that have fixed or determinable payments and are not quoted in an active market are classified as ‘loans and receivables.’ Loans and receivables are measured at amortized cost using the effective interest method, less any impairment. Interest income is recognized by applying the effective interest rate, except for short-term receivables, when the effect of discounting is immaterial.
- 9 -
6) Impairment of financial assets Financial assets, other than those at FVTPL, are assessed for indicators of impairment at the end of each reporting period. Financial assets are considered to be impaired when there is objective evidence that, as a result of one or more events that occurred after the initial recognition of the financial asset, the estimated future cash flows of the investment have been affected. For AFS equity investments, a significant or prolonged decline in the fair value of the security below its cost is considered to be objective evidence of impairment. For all other financial assets, objective evidence of impairment includes:
significant financial difficulty of the issuer or counterparty; default or delinquency in interest or principal payments; probability that the borrower will enter bankruptcy or financial re-organization; or disappearance of an active market for that financial asset because of financial difficulties.
For certain categories of financial assets, such as trade receivables, assets that are assessed not to be impaired individually are, in addition, assessed for impairment on a collective basis. Objective evidence of impairment for a portfolio of receivables could include the Group’s past experience of collecting payments, an increase in the number of delayed payments in the portfolio past the average credit period as well as observable changes in national or local economic conditions that correlate with default on receivables. For financial assets carried at amortized cost, the amount of the impairment loss recognized is the difference between the asset’s carrying amount and the present value of estimated future cash flows, discounted at the financial asset’s original effective interest rate. For financial assets that are carried at cost, the amount of the impairment loss recognized is the difference between the asset’s carrying amount and the present value of estimated future cash flows, discounted at the current market rate of return for a similar financial asset. Such impairment loss will not be reversed in subsequent periods. The carrying amount of the financial asset is reduced by the impairment loss directly for all financial assets with the exception of trade receivables, where the carrying amount is reduced through the use of an allowance account. When a trade receivable is considered uncollectible, it is written off against the allowance account. Subsequent recoveries of amounts previously written off are credited against the allowance account. Changes in the carrying amount of the allowance account are recognized in profit or loss. When an AFS financial asset is considered to be impaired, cumulative gains or losses previously recognized in other comprehensive income are reclassified to profit or loss in the period. For financial assets measured at amortized cost, if, in a subsequent period, the amount of the impairment loss decreases and the decrease can be related objectively to an event occurring after the impairment was recognized, the previously recognized impairment loss is reversed through profit or loss to the extent that the carrying amount of the investment at the date the impairment is reversed does not exceed what the amortized cost would have been had the impairment not been recognized. In respect of AFS equity securities, impairment losses previously recognized in profit or loss are not reversed through profit or loss. Any increase in fair value subsequent to an impairment loss is recognized in other comprehensive income. In respect of AFS debt securities, impairment losses are subsequently reversed through profit or loss if an increase in the fair value of the investment can be objectively related to an event occurring after the recognition of the impairment loss.
- 10 -
7) Derecognition of financial assets The Group derecognizes a financial asset only when the contractual rights to the cash flows from the asset expire or when it transfers the financial asset and substantially all the risks and rewards of ownership of the asset to another entity. If the Group neither transfers nor retains substantially all the risks and rewards of ownership and continues to control the transferred asset, it recognizes its retained interest in the asset and an associated liability for amounts it may have to pay. If the Group retains substantially all the risks and rewards of ownership of a transferred financial asset, it continues to recognize the financial asset and also recognizes a collateralized borrowing for the proceeds received. On derecognition of a financial asset in its entirety, the difference between the asset’s carrying amount and the sum of the consideration received and receivable and the cumulated gain or loss that had been recognized in other comprehensive income and accumulated in equity is recognized in profit or loss. On derecognition of a financial asset other than in its entirety (e.g., when the Group retains an option to repurchase part of a transferred asset or retains a residual interest and such a retained interest indicates that the transferor has neither transferred nor retained substantially all the risks and rewards of ownership and has retained control of the transferred asset), the Group allocates the previous carrying amount of the financial asset between the part it continues to recognize under continuing involvement and the part it no longer recognizes on the basis of the relative fair value of those parts on the date of the transfer. The difference between the carrying amount allocated to the part that is no longer recognized and the sum of the consideration received for the part that is no longer recognized and any cumulative gain or loss allocated to it that had been recognized in other comprehensive income is recognized in profit or loss. A cumulative gain or loss that had been recognized in other comprehensive income is allocated between the part that continues to be recognized and the part that is no longer recognized on the basis of the relative fair value of those parts. (7) Financial liabilities and equity instruments 1) Classification as debt or equity Debt and equity instruments are classified either as financial liabilities or as equity in accordance with the substance of the contractual arrangement and the definitions of a financial liability and an equity instrument. 2) Equity instruments An equity instrument is any contract that evidences a residual interest in the assets of an entity after deducting all of its liabilities. Equity instruments issued by the Group are recognized as the proceeds received, net of direct issue costs. Repurchase of the Group’s own equity instruments is recognized and deducted directly in equity. No gain or loss is recognized in profit or loss on the purchase, sale, issue or cancellation of the Group’s own equity instruments. 3) Financial liabilities Financial liabilities are recognized when the Group becomes a party to the contractual provisions of the instruments. Financial liabilities are initially measured at fair value. Transaction costs that are directly attributable to the issue of financial liabilities are deducted from the fair value of the financial liabilities on initial recognition. Transaction costs directly attributable to acquisition of financial liabilities at FVTPL are recognized immediately in profit or loss. Financial liabilities are classified as either financial liabilities at FVTPL or other financial liabilities. 4) Financial liabilities at FVTPL Financial liabilities are classified as at FVTPL when a financial liability is a contingent consideration that may be paid by an acquirer as part of a business combination to which K-IFRS 1103 applies, when it is held for trading or when it is designated as at FVTPL.
- 11 -
A financial liability is classified as held for trading if:
it has been acquired principally for the purpose of repurchasing it in the near term; on initial recognition, it is part of a portfolio of identified financial instruments that the Group manages together and has a recent actual pattern of short-term profit-taking; or it is a derivative that is not designated and effective as a hedging instrument.
A financial liability other than a financial liability held for trading or a contingent consideration that may be paid by an acquirer as part of a business combination may be designated as at FVTPL upon initial recognition if:
such designation eliminates or significantly reduces a measurement or recognition inconsistency that would otherwise arise; the financial liability forms part of a group of financial assets or financial liabilities, or both, which is managed, and its performance is evaluated on a fair value basis, in accordance with the Group's documented risk management or investment strategy, and information about the grouping is provided internally on that basis; or it forms part of a contract containing one or more embedded derivatives, and K-IFRS 1039 permits the entire combined contract (asset or liability) to be designated as at FVTPL.
Financial liabilities at FVTPL are stated at fair value, with any gains or losses arising on remeasurement recognized in profit or loss. The net gain or loss is recognized in other gains and losses line item in the consolidated statements of comprehensive income. 5) Other financial liabilities Other financial liabilities are subsequently measured at amortized cost using the effective interest method, with interest expense recognized on an effective yield basis. The effective interest method is a method of calculating the amortized cost of a financial liability and allocating interest expense over the relevant period. The effective interest rate is the rate that exactly discounts estimated future cash payments, including all fees and points paid or received (that form an integral part of the effective interest rate), transaction costs and other premiums or discounts through the expected life of the financial liability, or (where appropriate) a shorter period, to the net carrying amount on initial recognition. 6) Derecognition of financial liabilities The Group derecognizes financial liabilities when the Group’s obligations are discharged, canceled, or expired. The difference between the carrying amount of the financial liability derecognized and the consideration paid and payable is recognized in profit or loss. (8) Derivative financial instruments The Group enters into a variety of derivative financial instruments to manage its exposure to interest rate and foreign exchange rate risks, including foreign exchange forward contracts, interest rate swaps and cross-currency swaps. Derivatives are initially recognized at fair value at the date the derivative contract is entered into and are subsequently remeasured to their fair value at the end of each reporting period. The resulting gain or loss is recognized in profit or loss immediately, unless the derivative is designated and effective as a hedging instrument; in such case, the timing of the recognition in profit or loss depends on the nature of the hedge relationship. A derivative with a positive fair value is recognized as a financial asset, and a derivative with a negative fair value is recognized as a financial liability. A derivative is presented as a non-current asset or a non-current liability if the remaining maturity of the instrument is more than 12 months and it is not expected to be realized or settled within 12 months. Other derivatives are presented as current assets or current liabilities.
- 12 -
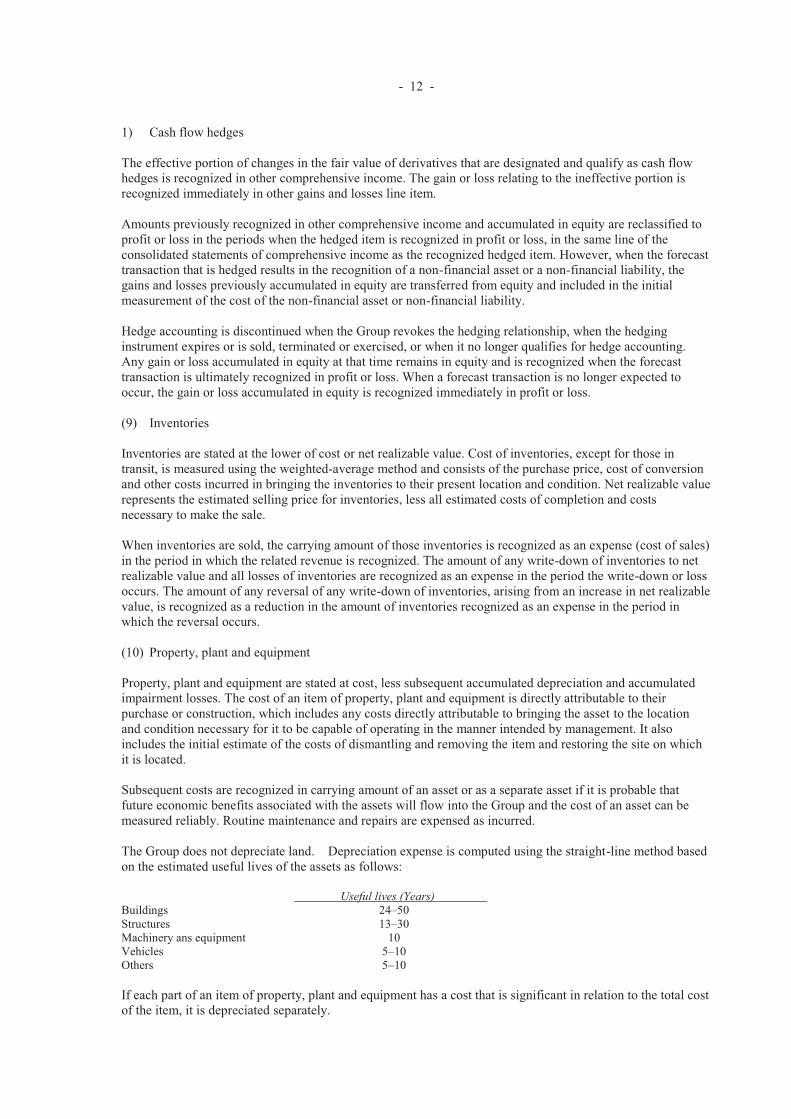
1) Cash flow hedges The effective portion of changes in the fair value of derivatives that are designated and qualify as cash flow hedges is recognized in other comprehensive income. The gain or loss relating to the ineffective portion is recognized immediately in other gains and losses line item. Amounts previously recognized in other comprehensive income and accumulated in equity are reclassified to profit or loss in the periods when the hedged item is recognized in profit or loss, in the same line of the consolidated statements of comprehensive income as the recognized hedged item. However, when the forecast transaction that is hedged results in the recognition of a non-financial asset or a non-financial liability, the gains and losses previously accumulated in equity are transferred from equity and included in the initial measurement of the cost of the non-financial asset or non-financial liability. Hedge accounting is discontinued when the Group revokes the hedging relationship, when the hedging instrument expires or is sold, terminated or exercised, or when it no longer qualifies for hedge accounting. Any gain or loss accumulated in equity at that time remains in equity and is recognized when the forecast transaction is ultimately recognized in profit or loss. When a forecast transaction is no longer expected to occur, the gain or loss accumulated in equity is recognized immediately in profit or loss. (9) Inventories Inventories are stated at the lower of cost or net realizable value. Cost of inventories, except for those in transit, is measured using the weighted-average method and consists of the purchase price, cost of conversion and other costs incurred in bringing the inventories to their present location and condition. Net realizable value represents the estimated selling price for inventories, less all estimated costs of completion and costs necessary to make the sale. When inventories are sold, the carrying amount of those inventories is recognized as an expense (cost of sales) in the period in which the related revenue is recognized. The amount of any write-down of inventories to net realizable value and all losses of inventories are recognized as an expense in the period the write-down or loss occurs. The amount of any reversal of any write-down of inventories, arising from an increase in net realizable value, is recognized as a reduction in the amount of inventories recognized as an expense in the period in which the reversal occurs. (10) Property, plant and equipment Property, plant and equipment are stated at cost, less subsequent accumulated depreciation and accumulated impairment losses. The cost of an item of property, plant and equipment is directly attributable to their purchase or construction, which includes any costs directly attributable to bringing the asset to the location and condition necessary for it to be capable of operating in the manner intended by management. It also includes the initial estimate of the costs of dismantling and removing the item and restoring the site on which it is located. Subsequent costs are recognized in carrying amount of an asset or as a separate asset if it is probable that future economic benefits associated with the assets will flow into the Group and the cost of an asset can be measured reliably. Routine maintenance and repairs are expensed as incurred. The Group does not depreciate land. Depreciation expense is computed using the straight-line method based on the estimated useful lives of the assets as follows: Useful lives (Years) Buildings 24–50 Structures 13–30 Machinery ans equipment 10 Vehicles 5–10 Others 5–10 If each part of an item of property, plant and equipment has a cost that is significant in relation to the total cost of the item, it is depreciated separately.
- 13 -
The Group reviews the depreciation method, the estimated useful lives and residual values of property, plant and equipment at the end of each annual reporting period. If expectations differ from previous estimates, the changes are accounted for as a change in an accounting estimate. An item of property, plant and equipment is derecognized upon disposal or when no future economic benefits are expected to arise from the continued use of the asset. Any gain or loss arising on derecognition of the property (calculated as the difference between the net disposal proceeds and the carrying amount of the asset) is included in profit or loss in the period in which the property is derecognized. (11) Intangible assets 1) Intangible assets acquired separately Intangible assets with finite useful lives that are acquired separately are carried at cost, less accumulated amortization and accumulated impairment losses. Amortization of intangible assets is recognized on a straight-line basis over their estimated useful lives. The estimated useful life and amortization method are reviewed at the end of each reporting period, with the effect of any changes in estimate being accounted for on a prospective basis. Intangible assets with indefinite useful lives that are acquired separately are carried at cost, less accumulated impairment losses. 2) Internally generated intangible assets - research and development (“R&D”) expenditure Expenditure on research activities is recognized as an expense in the period in which it is incurred. Expenditure arising from development (or from the development phase of an internal project) is recognized as an intangible asset if, and only if, the development project is designed to produce new or substantially improved products, and the Group can demonstrate the technical and economical feasibility and measure reliably the resources attributable to the intangible asset during its development. The amount initially recognized for internally generated intangible assets is the sum of the expenditure incurred from the date when the intangible asset first meets the recognition criteria. Where no internally generated intangible asset can be recognized, development expenditure is recognized in profit or loss in the period in which it is incurred. Subsequent to initial recognition, internally generated intangible assets are reported at cost, less accumulated amortization and accumulated impairment losses, on the same basis as intangible assets that are acquired separately. 3) Derecognition of intangible assets An intangible asset is derecognized on disposal or when no future economic benefits are expected from its use or disposal. Gains or losses arising from derecognition of an intangible asset, measured as the difference between the net disposal proceeds and the carrying amount of the asset, are recognized in profit or loss when the asset is derecognized. (12) Impairment of property, plant and equipment At the end of each reporting period, the Company reviews the carrying amounts of its tangible and intangible assets to determine whether there is any indication that those assets have suffered an impairment loss. If any such indication exists, the recoverable amount of the asset is estimated in order to determine the extent of the impairment loss (if any). Where it is not possible to estimate the recoverable amount of an individual asset, the Company estimates the recoverable amount of the cash-generating unit to which the asset belongs. Where a reasonable and consistent basis of allocation can be identified, corporate assets are also allocated to individual cash-generating units; otherwise, they are allocated to the smallest group of cash-generating units for which a reasonable and consistent allocation basis can be identified.
- 14 -
Intangible assets with indefinite useful lives and intangible assets not yet available for use are tested for impairment at least annually and whenever there is an indication that the asset may be impaired. Recoverable amount is the higher of fair value, less costs to sell, or value in use. In assessing value in use, the estimated future cash flows are discounted to their present value using a pretax discount rate that reflects current market assessments of the time value of money and the risks specific to the asset for which the estimates of future cash flows have not been adjusted. If the recoverable amount of an asset (or a cash-generating unit) is estimated to be less than its carrying amount, the carrying amount of the asset (or the cash-generating unit) is reduced to its recoverable amount. An impairment loss is recognized immediately in profit or loss, unless the relevant asset is carried at a revalued amount, in which case the impairment loss is treated as a revaluation decrease. (13) Retirement benefit costs and termination benefits For defined benefit retirement benefit plans, the cost of providing benefits is determined using the projected unit credit method, with actuarial valuations being carried out at the end of each reporting period. Remeasurement, comprising actuarial gains and losses, the effect of the changes to the asset ceiling (if applicable) and the return on plan assets (excluding interest), is reflected immediately in the consolidated statements of financial position with a charge or credit recognized in other comprehensive income in the period in which it occurs. Remeasurement recognized in other comprehensive income is reflected immediately in retained earnings and will not be reclassified to profit or loss. Past service cost is recognized in profit or loss in the period of a plan amendment. Net interest is calculated by applying the discount rate at the beginning of the period to the net defined benefit liability or asset. Defined benefit costs are composed of service cost (including current service cost and past service cost, as well as gains and losses on curtailments and settlements), net interest expense (income) and remeasurement. The Group presents the service cost and net interest expense (income) components in profit or loss and the remeasurement component in other comprehensive income. Curtailment gains and losses are accounted for as past service costs. The retirement benefit obligation recognized in the consolidated statements of financial position represents the actual deficit or surplus in the Group’s defined benefit plans. Any surplus resulting from this calculation is limited to the present value of any economic benefits available in the form of refunds from the plans or reductions in future contributions to the plans. A liability for a termination benefit is recognized at the earlier of when the entity can no longer withdraw the offer of the termination benefit or when the entity recognizes any related restructuring costs. Discretionary contributions made by employees or third parties reduce service cost upon payment of these contributions to the plan. When the formal terms of the plans specify that there will be contributions from employees or third parties, the accounting depends on whether the contributions are linked to service as follows: If the contributions are not linked to services (e.g., contributions are required to reduce a deficit arising from losses on plan assets or from actuarial losses), they are reflected in the remeasurement of the net defined benefit liability (asset). If contributions are linked to services, they reduce service costs. For the amount of contribution that is dependent on the number of years of service, the entity reduces service cost by attributing the contributions to periods of service using the attribution method required by K-IFRS 1019 paragraph 70 for the gross benefits. For the amount of contribution that is independent of the number of years of service, the entity reduces service cost in the period in which the related service is rendered. (14) Provisions Provisions are recognized when the Group has a present obligation (legal or constructive) as a result of a past event, it is probable that the Group will be required to settle the obligation and a reliable estimate can be made of the amount of the obligation.
- 15 -
The amount recognized as a provision is the best estimate of the consideration required to settle the present obligation at the end of the reporting period, taking into account the risks and uncertainties surrounding the obligation. When a provision is measured using the cash flows estimated to settle the present obligation, its carrying amount is the present value of those cash flows (where the effect of the time value of money is material). The discount rate used is a pretax rate that reflects current market assessments of the time value of money and the risks specific to the liability. Where discounting is used, the increase in the provision due to the passage is recognized in profit or loss as borrowing cost. When some or all of the economic benefits required to settle a provision are expected to be recovered from a third party, a receivable is recognized as an asset if it is virtually certain that reimbursement will be received and the amount of the receivable can be measured reliably. At the end of each reporting period, the remaining provision balance is reviewed and assessed to determine if the current best estimate is being recognized. If the existence of an obligation to transfer economic benefit is no longer probable, the related provision is reversed during the period. (15) Leases Leases are classified as finance leases whenever the terms of the lease transfer substantially all the risks and rewards of ownership to the lessee. All other leases are classified as operating leases. 1) The Group as lessor Amounts due from lessees under finance leases are recognized as receivables at the amount of the Group’s net investment in the leases. Finance lease income is allocated to accounting periods so as to reflect a constant periodic rate of return on the Group’s net investment outstanding in respect of the leases. Rental income from operating leases is recognized on a straight-line basis over the term of the relevant lease. Initial direct costs incurred in negotiating and arranging an operating lease are added to the carrying amount of the leased asset and recognized on a straight-line basis over the lease term. 2) The Group as lessee Assets held under finance leases are initially recognized as assets of the Group at their fair value at the inception of the lease or, if lower, at the present value of the minimum lease payments. The corresponding liability to the lessor is included in the consolidated statements of financial position as a finance lease obligation. Lease payments are apportioned between finance expenses and reduction of the lease obligation so as to achieve a constant rate of interest on the remaining balance of the liability. Finance expenses are recognized immediately in profit or loss, unless they are directly attributable to qualifying assets, in which case they are capitalized in accordance with the Group’s general policy on borrowing costs (see Note 2 (12)). Contingent rentals are recognized as expenses in the periods in which they are incurred. Operating lease payments are recognized as an expense on a straight-line basis over the lease term, except where another systematic basis is more representative of the time pattern in which economic benefits from the leased asset are consumed. Contingent rentals arising under operating leases are recognized as an expense in the period in which they are incurred. In the event that lease incentives are received to enter into operating leases, such incentives are recognized as a liability. The aggregate benefit of incentives is recognized as a reduction of rental expense on a straight-line basis, except where another systematic basis is more representative of the time pattern in which economic benefits from the leased asset are consumed. (16) Borrowing costs Borrowing costs directly attributable to the acquisition, construction or production of qualifying assets, which are assets that necessarily take a substantial period of time to get ready for their intended use or sale, are added to the cost of those assets until such time when the assets are substantially ready for their intended use or sale.
- 16 -
Investment income earned on the temporary investment of specific borrowings pending their expenditure on qualifying assets is deducted from the borrowing costs eligible for capitalization. All other borrowing costs are recognized in profit or loss in the period in which they are incurred. (17) Government grants Government grants are not recognized until there is reasonable assurance that the Group will comply with the conditions attached to them and that the grants will be received. The benefit of a government loan at a below-market rate of interest is treated as a government grant, measured as the difference between proceeds received and the fair value of the loan based on prevailing market interest rates. Government grants related to assets are presented in the consolidated statements of financial position by deducting the grant from the carrying amount of the asset. The related grant is recognized in profit or loss over the life of a depreciable asset as a reduced depreciation expense. Government grants related to income are recognized in profit or loss on a systematic basis over the periods in which the Group recognizes as expenses the related costs for which the grants are intended to compensate. Government grants that are receivable as compensation for expenses or losses already incurred or for the purpose of giving immediate financial support to the Group with no future related costs are recognized in profit or loss in the period in which they become receivable (18) Taxation Income tax expense represents the sum of the tax currently payable and deferred tax. 1) Current tax The tax currently payable is based on taxable profit for the year. Taxable profit differs from profit as reported in the consolidated statements of comprehensive income because of items of income or expense that are taxable or deductible in other years and items that are never taxable or deductible. The Group’s liability for current tax is calculated using tax rates that have been enacted or substantively enacted by the end of the reporting period. 2) Deferred tax Deferred tax is recognized on temporary differences between the carrying amounts of assets and liabilities in the consolidated financial statements and the corresponding tax bases used in the computation of taxable profit. Deferred tax liabilities are generally recognized for all taxable temporary differences. Deferred tax assets are generally recognized for all deductible temporary differences to the extent it is probable that taxable profits will be available against which those deductible temporary differences can be utilized. Such deferred tax assets and liabilities are not recognized if the temporary difference arises from goodwill or from the initial recognition (other than in a business combination) of other assets and liabilities in a transaction that affects neither the taxable profit nor the accounting profit. Deferred tax liabilities are recognized for taxable temporary differences associated with investments in subsidiaries and associates and interests in joint ventures, except where the Group is able to control the reversal of the temporary difference and it is probable that the temporary difference will not reverse in the foreseeable future. Deferred tax assets arising from deductible temporary differences associated with such investments and interests are only recognized to the extent it is probable that there will be sufficient taxable profits against which the benefits of the temporary differences can be utilized and they are expected to reverse in the foreseeable future. The carrying amount of deferred tax assets is reviewed at the end of each reporting period and reduced to the extent it is no longer probable that sufficient taxable profits will be available to allow all or part of the asset to be recovered.
- 17 -
Deferred tax assets and liabilities are measured at the tax rates that are expected to apply in the period in which the liability is settled or the asset is realized based on tax rates (and tax laws) that have been enacted or substantively enacted by the end of the reporting period. The measurement of deferred tax liabilities and assets reflects the tax consequences that would follow from the manner in which the Group expects to recover or settle the carrying amount of its assets and liabilities at the end of the reporting period. Deferred tax assets and liabilities are offset if, and only if, the Group has a legally enforceable right to set off current tax assets against current tax liabilities and the deferred tax assets and liabilities relate to income taxes levied by the same taxation authority on either the same taxable entity or different taxable entities, which intend either to settle current tax liabilities and assets on a net basis or to realize the assets and settle the liabilities simultaneously, in each future period in which significant amounts of deferred tax liabilities or assets are expected to be settled or recovered. For the purpose of measuring deferred tax liabilities and deferred tax assets for investment properties that are measured using the fair value model, the carrying amounts of such properties are presumed to be recovered entirely through sale, unless the presumption is rebutted. The presumption is rebutted when the investment property is depreciable and is held within a business model whose objective is to consume substantially all of the economic benefits embodied in the investment properties over time, rather than through sale. 3) Current and deferred taxes for the year Current and deferred taxes are recognized in profit or loss, except when they relate to items that are recognized in other comprehensive income or directly in equity; in which case, the current and deferred taxes are also recognized in other comprehensive income or directly in equity. Where current tax or deferred tax arises from the initial accounting for a business combination, the tax effect is included in the accounting for the business combination. (19) Fair value Fair value is the price that would be received to sell an asset or paid to transfer a liability in an orderly transaction between market participants at the measurement date, regardless of whether that price is directly observable or estimated using another valuation technique. In estimating the fair value of an asset or a liability, the Group takes into account the characteristics of the asset or liability if market participants would take those characteristics into account when pricing the asset or liability at the measurement date. Fair value for measurement and/or disclosure purposes in these consolidated financial statements is determined on such a basis, except for share-based payment transactions that are within the scope of K-IFRS 1102, Share-Based Payment; leasing transactions that are within the scope of K-IFRS 1017, Leases; and measurements that have some similarities to fair value but are not fair value, such as net realizable value in K-IFRS 1002, Inventories, or value in use in K-IFRS 1036. In addition, for financial reporting purposes, fair value measurements are categorized into Level 1, 2 or 3, based on the degree to which the inputs to the fair value measurements are observable and the significance of the inputs to the fair value measurement in its entirety, which are described as follows:
Level 1 inputs are quoted prices (unadjusted) in active markets for identical assets or liabilities that the entity can access at the measurement date; Level 2 inputs are inputs, other than quoted prices included within Level 1, that are observable for the asset or liability, either directly or indirectly; and Level 3 inputs are unobservable inputs for the asset or liability.
(20) Segment information Segment information is presented in the same format as the reporting material presented to the Group’s management. The Group’s management is liable for the assessment of the resources to be allocated to the business segments and the performance results of the business segments.
- 18 -
(21) Accounting treatment related to the emission rights (cap and trade) scheme The Group classifies the emission rights as intangible assets. Emission rights allowances that the government allocated free of charge are measured at nil, and emission rights allowances that are purchased are measured at cost, which the Group paid to purchase the allowances. If emission rights that the government allocated free of charge are sufficient to settle the emission rights allowances allotted for vintage year, the emission liabilities are measured at nil. However, for the emission liabilities that exceed the allowances allocated free of charge, the shortfall is measured at best estimate at the end of the reporting period. 3. CRITICAL ACCOUNTING ESTIMATES AND ASSUMPTIONS: In the application of the Company’s accounting policies, which are described in Note 2, management is required to make judgments, estimates and assumptions about the carrying amounts of assets and liabilities that are not readily apparent from other sources. The estimates and associated assumptions are based on historical experience and other factors that are considered to be relevant. Actual results may differ from these estimates. The estimates and underlying assumptions are reviewed on an ongoing basis. Revisions to accounting estimates are recognized in the period in which the estimate is revised if the revision affects only that period or in the period of the revision and future periods if the revision affects both current and future periods. The following are the key assumptions concerning the future and other key sources of estimation uncertainty at the end of the reporting period that have a significant risk of causing a material adjustment to the carrying amounts of assets and liabilities within the next financial year: (1) Provision for product warranties The Group provides warranties for its products at recognition of sale and establishes a provision for product warranties at the end of each reporting period based on the best estimate of the expenses necessary to provide present and future warranty obligations. (2) Retirement benefit obligation The retirement benefit obligation recognized in the consolidated statements of financial position represents the present value of the defined benefit obligation, as adjusted for unrecognized actuarial gains and losses and unrecognized past service cost and as reduced by the fair value of plan assets. For defined benefit retirement benefit plans, the cost of providing benefits is determined using the projected unit credit method, with actuarial valuations being carried out at the end of each reporting period. The present value of defined benefit obligations is expressed in a currency in which retirement benefits will be paid and is calculated by discounting expected future cash outflows with the interest rate of high-quality corporate bonds whose maturity is similar to the payment date of retirement benefit obligations. Other significant assumptions related to defined benefit obligation are partly based on the current market situation. 4. CASH AND CASH EQUIVALENTS: Cash and cash equivalents include cash on hand and in banks and highly liquid short-term financial instruments that may be easily converted into cash and whose risk of value fluctuation is not material.
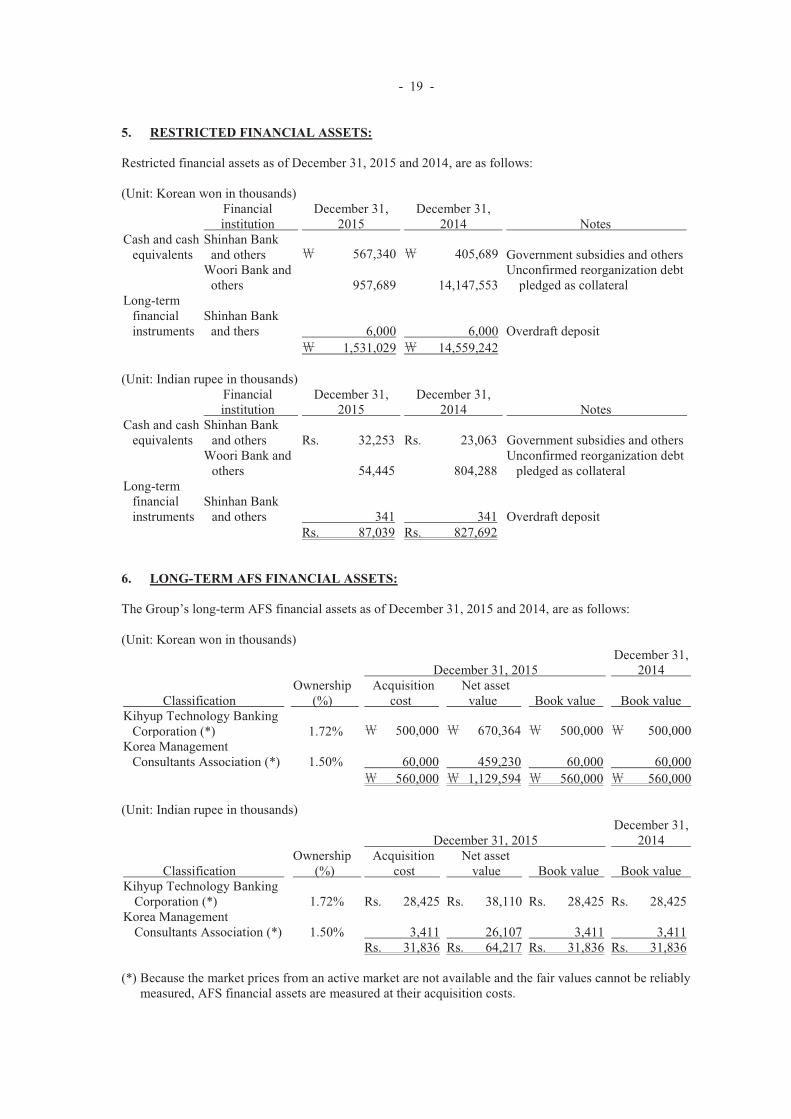
- 19 -
5. RESTRICTED FINANCIAL ASSETS: Restricted financial assets as of December 31, 2015 and 2014, are as follows: (Unit: Korean won in thousands)
Financial institution
December 31, 2015
December 31, 2014 Notes
Cash and cash equivalents
Shinhan Bank and others 567,340 405,689 Government subsidies and others Woori Bank and others 957,689 14,147,553
Unconfirmed reorganization debt pledged as collateral
Long-term financial instruments
Shinhan Bank and thers 6,000 6,000 Overdraft deposit
1,531,029 14,559,242 (Unit: Indian rupee in thousands)
Financial institution
December 31, 2015
December 31, 2014 Notes
Cash and cash equivalents
Shinhan Bank and others
Rs. 32,253
Rs. 23,063 Government subsidies and others
Woori Bank and others 54,445 804,288
Unconfirmed reorganization debt pledged as collateral
Long-term financial instruments
Shinhan Bank and others 341 341 Overdraft deposit
Rs. 87,039 Rs. 827,692 6. LONG-TERM AFS FINANCIAL ASSETS: The Group’s long-term AFS financial assets as of December 31, 2015 and 2014, are as follows: (Unit: Korean won in thousands)
December 31, 2015 December 31, 2014
Classification Ownership (%)
Acquisition cost
Net asset value Book value Book value
Kihyup Technology Banking Corporation (*) 1.72% 500,000 670,364 500,000 500,000 Korea Management Consultants Association (*) 1.50% 60,000 459,230 60,000 60,000
560,000 1,129,594 560,000 560,000 (Unit: Indian rupee in thousands)
December 31, 2015 December 31, 2014
Classification Ownership (%)
Acquisition cost
Net asset value Book value Book value
Kihyup Technology Banking Corporation (*) 1.72% Rs. 28,425 Rs. 38,110 Rs. 28,425 Rs. 28,425 Korea Management Consultants Association (*) 1.50% 3,411 26,107 3,411 3,411
Rs. 31,836 Rs. 64,217 Rs. 31,836 Rs. 31,836 (*) Because the market prices from an active market are not available and the fair values cannot be reliably
measured, AFS financial assets are measured at their acquisition costs.
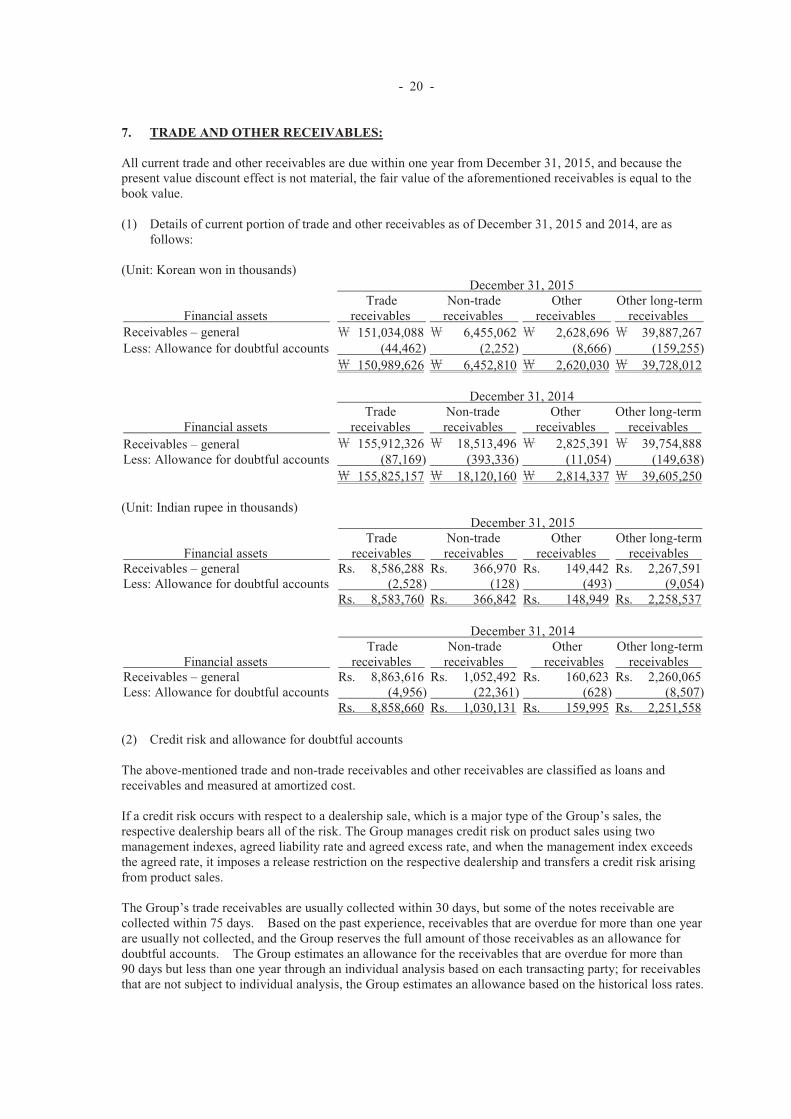
- 20 -
7. TRADE AND OTHER RECEIVABLES: All current trade and other receivables are due within one year from December 31, 2015, and because the present value discount effect is not material, the fair value of the aforementioned receivables is equal to the book value. (1) Details of current portion of trade and other receivables as of December 31, 2015 and 2014, are as
follows: (Unit: Korean won in thousands)
Financial assets
December 31, 2015 Trade
receivables Non-trade
receivables Other
receivables Other long-term receivables
Receivables – general 151,034,088 6,455,062 2,628,696 39,887,267 Less: Allowance for doubtful accounts (44,462) (2,252) (8,666) (159,255)
150,989,626 6,452,810 2,620,030 39,728,012
Financial assets
December 31, 2014 Trade receivables
Non-trade receivables
Other receivables
Other long-term receivables
Receivables – general 155,912,326 18,513,496 2,825,391 39,754,888 Less: Allowance for doubtful accounts (87,169) (393,336) (11,054) (149,638)
155,825,157 18,120,160 2,814,337 39,605,250 (Unit: Indian rupee in thousands)
December 31, 2015
Financial assets Trade receivables
Non-trade receivables
Other receivables
Other long-term receivables
Receivables – general Rs. 8,586,288 Rs. 366,970 Rs. 149,442 Rs. 2,267,591 Less: Allowance for doubtful accounts (2,528) (128) (493) (9,054)
Rs. 8,583,760 Rs. 366,842 Rs. 148,949 Rs. 2,258,537
December 31, 2014
Financial assets Trade
receivables Non-trade
receivables Other
receivables Other long-term receivables
Receivables – general Rs. 8,863,616 Rs. 1,052,492 Rs. 160,623 Rs. 2,260,065 Less: Allowance for doubtful accounts (4,956) (22,361) (628) (8,507)
Rs. 8,858,660 Rs. 1,030,131 Rs. 159,995 Rs. 2,251,558 (2) Credit risk and allowance for doubtful accounts The above-mentioned trade and non-trade receivables and other receivables are classified as loans and receivables and measured at amortized cost. If a credit risk occurs with respect to a dealership sale, which is a major type of the Group’s sales, the respective dealership bears all of the risk. The Group manages credit risk on product sales using two management indexes, agreed liability rate and agreed excess rate, and when the management index exceeds the agreed rate, it imposes a release restriction on the respective dealership and transfers a credit risk arising from product sales. The Group’s trade receivables are usually collected within 30 days, but some of the notes receivable are collected within 75 days. Based on the past experience, receivables that are overdue for more than one year are usually not collected, and the Group reserves the full amount of those receivables as an allowance for doubtful accounts. The Group estimates an allowance for the receivables that are overdue for more than 90 days but less than one year through an individual analysis based on each transacting party; for receivables that are not subject to individual analysis, the Group estimates an allowance based on the historical loss rates.
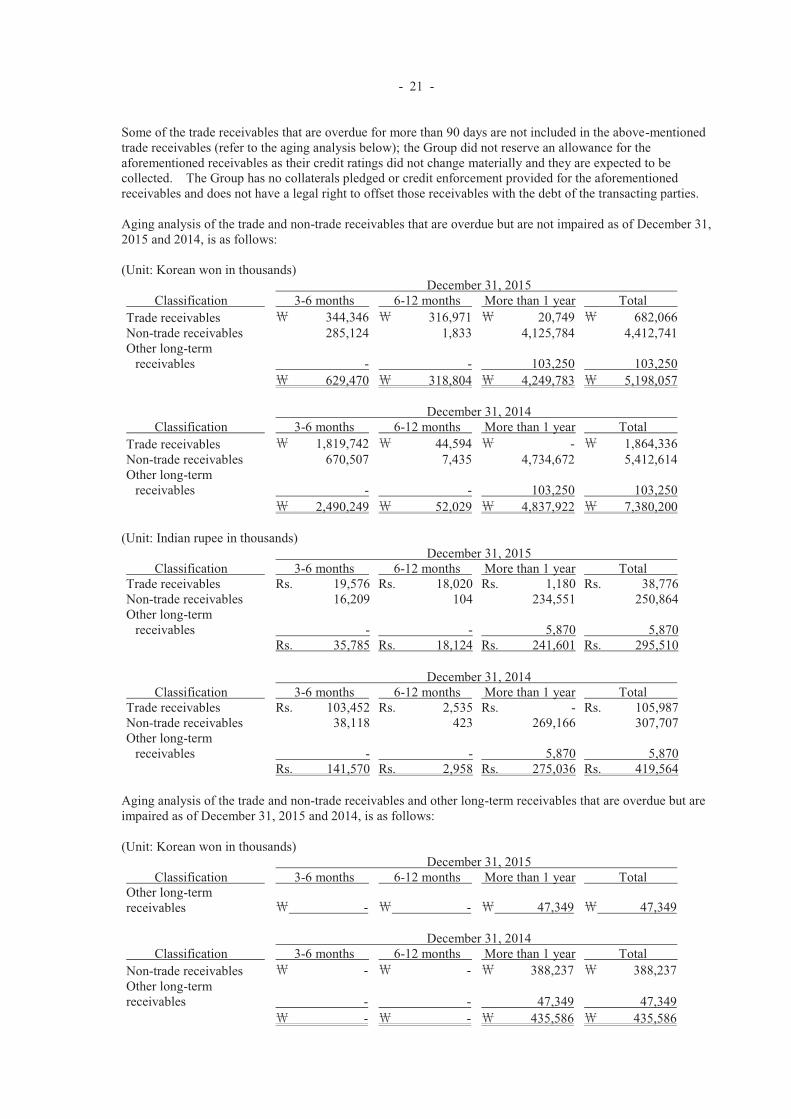
- 21 -
Some of the trade receivables that are overdue for more than 90 days are not included in the above-mentioned trade receivables (refer to the aging analysis below); the Group did not reserve an allowance for the aforementioned receivables as their credit ratings did not change materially and they are expected to be collected. The Group has no collaterals pledged or credit enforcement provided for the aforementioned receivables and does not have a legal right to offset those receivables with the debt of the transacting parties. Aging analysis of the trade and non-trade receivables that are overdue but are not impaired as of December 31, 2015 and 2014, is as follows: (Unit: Korean won in thousands)
December 31, 2015 Classification 3-6 months 6-12 months More than 1 year Total Trade receivables 344,346 316,971 20,749 682,066 Non-trade receivables 285,124 1,833 4,125,784 4,412,741 Other long-term receivables - - 103,250 103,250
629,470 318,804 4,249,783 5,198,057
December 31, 2014 Classification 3-6 months 6-12 months More than 1 year Total Trade receivables 1,819,742 44,594 - 1,864,336 Non-trade receivables 670,507 7,435 4,734,672 5,412,614 Other long-term receivables - - 103,250 103,250
2,490,249 52,029 4,837,922 7,380,200 (Unit: Indian rupee in thousands)
December 31, 2015 Classification 3-6 months 6-12 months More than 1 year Total Trade receivables Rs. 19,576 Rs. 18,020 Rs. 1,180 Rs. 38,776 Non-trade receivables 16,209 104 234,551 250,864 Other long-term receivables - - 5,870 5,870
Rs. 35,785 Rs. 18,124 Rs. 241,601 Rs. 295,510
December 31, 2014 Classification 3-6 months 6-12 months More than 1 year Total Trade receivables Rs. 103,452 Rs. 2,535 Rs. - Rs. 105,987 Non-trade receivables 38,118 423 269,166 307,707 Other long-term receivables - - 5,870 5,870
Rs. 141,570 Rs. 2,958 Rs. 275,036 Rs. 419,564 Aging analysis of the trade and non-trade receivables and other long-term receivables that are overdue but are impaired as of December 31, 2015 and 2014, is as follows: (Unit: Korean won in thousands)
December 31, 2015 Classification 3-6 months 6-12 months More than 1 year Total Other long-term receivables - - 47,349 47,349
December 31, 2014
Classification 3-6 months 6-12 months More than 1 year Total Non-trade receivables - - 388,237 388,237 Other long-term receivables - - 47,349 47,349 - - 435,586 435,586
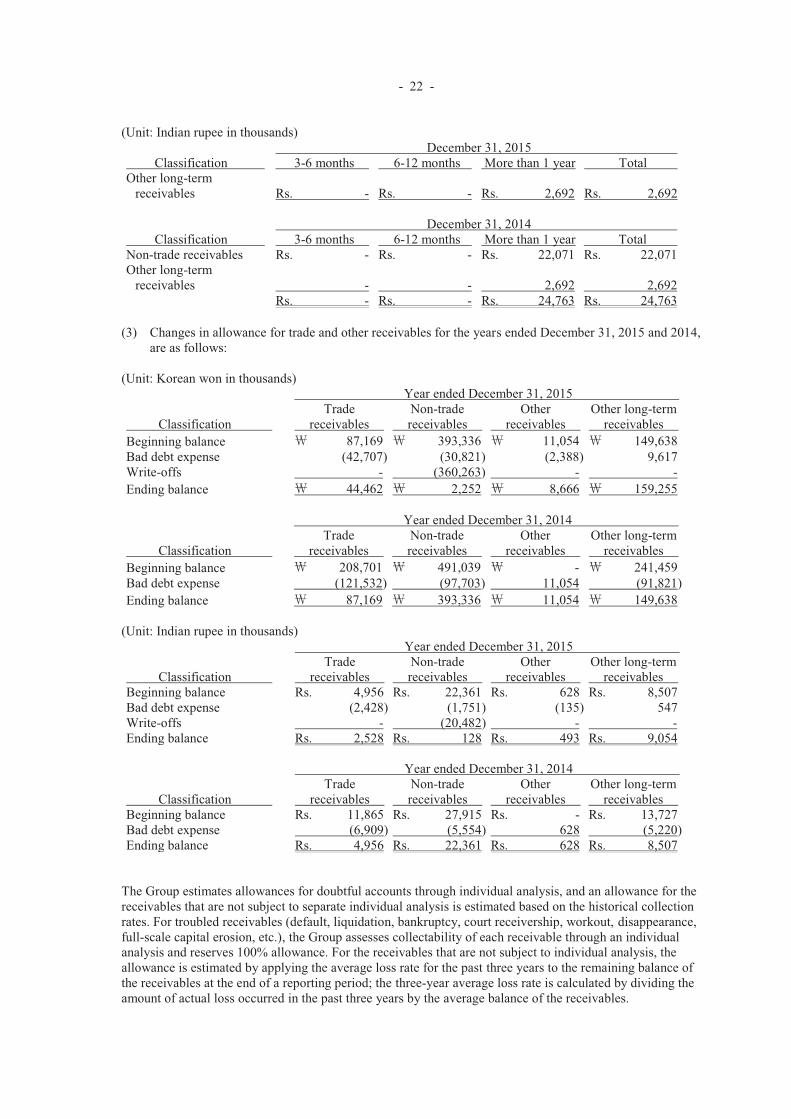
- 22 -
(Unit: Indian rupee in thousands) December 31, 2015
Classification 3-6 months 6-12 months More than 1 year Total Other long-term receivables Rs. - Rs. - Rs. 2,692 Rs. 2,692
December 31, 2014
Classification 3-6 months 6-12 months More than 1 year Total Non-trade receivables Rs. - Rs. - Rs. 22,071 Rs. 22,071 Other long-term receivables - - 2,692 2,692
Rs. - Rs. - Rs. 24,763 Rs. 24,763 (3) Changes in allowance for trade and other receivables for the years ended December 31, 2015 and 2014,
are as follows: (Unit: Korean won in thousands)
Year ended December 31, 2015
Classification Trade receivables
Non-trade receivables
Other receivables
Other long-term receivables
Beginning balance 87,169 393,336 11,054 149,638 Bad debt expense (42,707) (30,821) (2,388) 9,617 Write-offs - (360,263) - - Ending balance 44,462 2,252 8,666 159,255
Year ended December 31, 2014
Classification Trade receivables
Non-trade receivables
Other receivables
Other long-term receivables
Beginning balance 208,701 491,039 - 241,459 Bad debt expense (121,532) (97,703) 11,054 (91,821) Ending balance 87,169 393,336 11,054 149,638
(Unit: Indian rupee in thousands)
Year ended December 31, 2015
Classification Trade receivables
Non-trade receivables
Other receivables
Other long-term receivables
Beginning balance Rs. 4,956 Rs. 22,361 Rs. 628 Rs. 8,507 Bad debt expense (2,428) (1,751) (135) 547 Write-offs - (20,482) - - Ending balance Rs. 2,528 Rs. 128 Rs. 493 Rs. 9,054
Year ended December 31, 2014
Classification Trade receivables
Non-trade receivables
Other receivables
Other long-term receivables
Beginning balance Rs. 11,865 Rs. 27,915 Rs. - Rs. 13,727 Bad debt expense (6,909) (5,554) 628 (5,220) Ending balance Rs. 4,956 Rs. 22,361 Rs. 628 Rs. 8,507
The Group estimates allowances for doubtful accounts through individual analysis, and an allowance for the receivables that are not subject to separate individual analysis is estimated based on the historical collection rates. For troubled receivables (default, liquidation, bankruptcy, court receivership, workout, disappearance, full-scale capital erosion, etc.), the Group assesses collectability of each receivable through an individual analysis and reserves 100% allowance. For the receivables that are not subject to individual analysis, the allowance is estimated by applying the average loss rate for the past three years to the remaining balance of the receivables at the end of a reporting period; the three-year average loss rate is calculated by dividing the amount of actual loss occurred in the past three years by the average balance of the receivables.
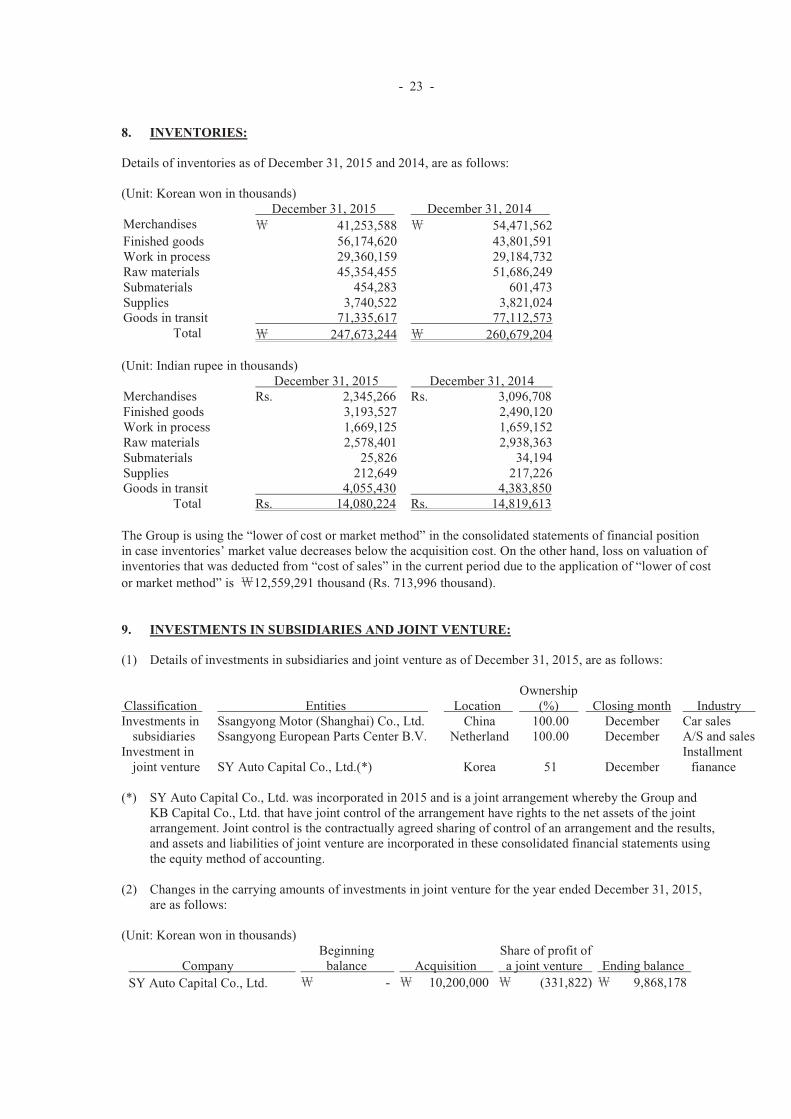
- 23 -
8. INVENTORIES: Details of inventories as of December 31, 2015 and 2014, are as follows: (Unit: Korean won in thousands)
December 31, 2015 December 31, 2014 Merchandises 41,253,588 54,471,562 Finished goods 56,174,620 43,801,591 Work in process 29,360,159 29,184,732 Raw materials 45,354,455 51,686,249 Submaterials 454,283 601,473 Supplies 3,740,522 3,821,024 Goods in transit 71,335,617 77,112,573
Total 247,673,244 260,679,204 (Unit: Indian rupee in thousands)
December 31, 2015 December 31, 2014 Merchandises Rs. 2,345,266 Rs. 3,096,708 Finished goods 3,193,527 2,490,120 Work in process 1,669,125 1,659,152 Raw materials 2,578,401 2,938,363 Submaterials 25,826 34,194 Supplies 212,649 217,226 Goods in transit 4,055,430 4,383,850
Total Rs. 14,080,224 Rs. 14,819,613 The Group is using the “lower of cost or market method” in the consolidated statements of financial position in case inventories’ market value decreases below the acquisition cost. On the other hand, loss on valuation of inventories that was deducted from “cost of sales” in the current period due to the application of “lower of cost or market method” is 12,559,291 thousand (Rs. 713,996 thousand). 9. INVESTMENTS IN SUBSIDIARIES AND JOINT VENTURE: (1) Details of investments in subsidiaries and joint venture as of December 31, 2015, are as follows:
Classification Entities Location Ownership (%) Closing month Industry
Investments in subsidiaries
Ssangyong Motor (Shanghai) Co., Ltd. China 100.00 December Car sales Ssangyong European Parts Center B.V. Netherland 100.00 December A/S and sales
Investment in joint venture
SY Auto Capital Co., Ltd.(*) Korea 51 December
Installment fianance
(*) SY Auto Capital Co., Ltd. was incorporated in 2015 and is a joint arrangement whereby the Group and
KB Capital Co., Ltd. that have joint control of the arrangement have rights to the net assets of the joint arrangement. Joint control is the contractually agreed sharing of control of an arrangement and the results, and assets and liabilities of joint venture are incorporated in these consolidated financial statements using the equity method of accounting.
(2) Changes in the carrying amounts of investments in joint venture for the year ended December 31, 2015,
are as follows:
(Unit: Korean won in thousands)
Company Beginning balance Acquisition
Share of profit of a joint venture Ending balance
SY Auto Capital Co., Ltd. - 10,200,000 (331,822) 9,868,178
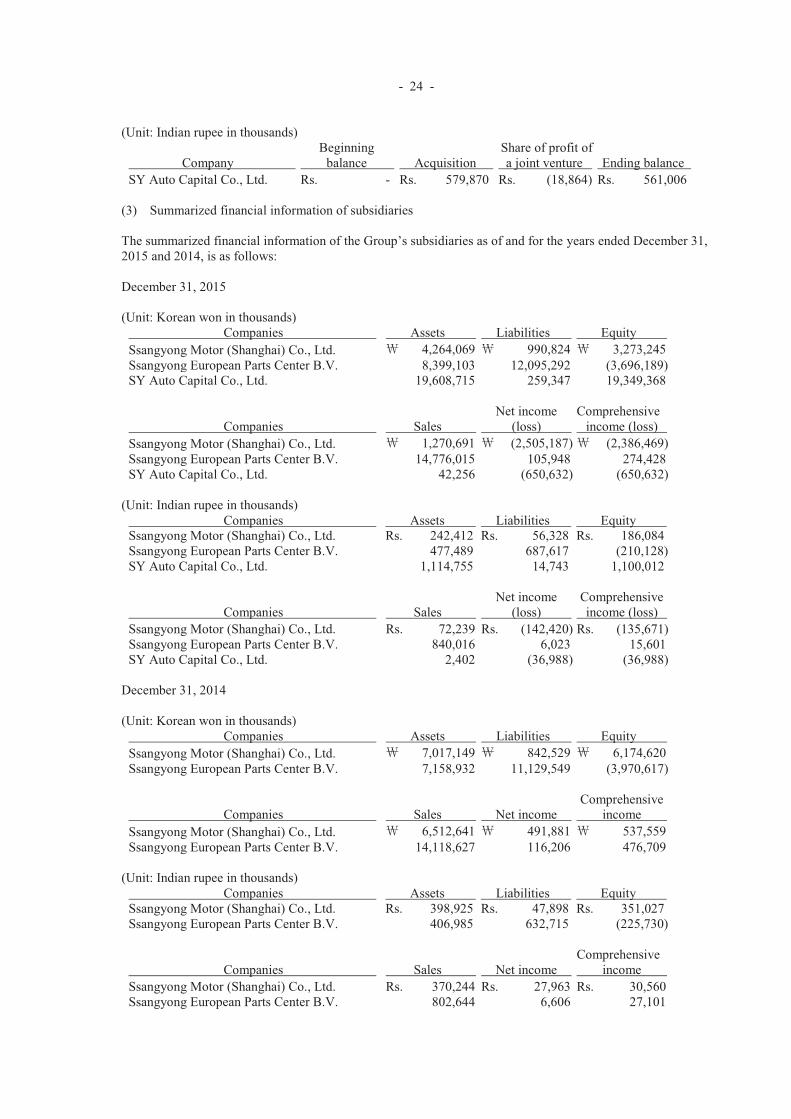
- 24 -
(Unit: Indian rupee in thousands)
Company Beginning balance Acquisition
Share of profit of a joint venture Ending balance
SY Auto Capital Co., Ltd. Rs. - Rs. 579,870 Rs. (18,864) Rs. 561,006
(3) Summarized financial information of subsidiaries The summarized financial information of the Group’s subsidiaries as of and for the years ended December 31, 2015 and 2014, is as follows: December 31, 2015 (Unit: Korean won in thousands)
Companies Assets Liabilities Equity Ssangyong Motor (Shanghai) Co., Ltd. 4,264,069 990,824 3,273,245 Ssangyong European Parts Center B.V. 8,399,103 12,095,292 (3,696,189) SY Auto Capital Co., Ltd. 19,608,715 259,347 19,349,368
Companies Sales Net income (loss)
Comprehensive income (loss)
Ssangyong Motor (Shanghai) Co., Ltd. 1,270,691 (2,505,187) (2,386,469) Ssangyong European Parts Center B.V. 14,776,015 105,948 274,428 SY Auto Capital Co., Ltd. 42,256 (650,632) (650,632)
(Unit: Indian rupee in thousands)
Companies Assets Liabilities Equity Ssangyong Motor (Shanghai) Co., Ltd. Rs. 242,412 Rs. 56,328 Rs. 186,084 Ssangyong European Parts Center B.V. 477,489 687,617 (210,128) SY Auto Capital Co., Ltd. 1,114,755 14,743 1,100,012
Companies Sales Net income (loss)
Comprehensive income (loss)
Ssangyong Motor (Shanghai) Co., Ltd. Rs. 72,239 Rs. (142,420) Rs. (135,671) Ssangyong European Parts Center B.V. 840,016 6,023 15,601 SY Auto Capital Co., Ltd. 2,402 (36,988) (36,988)
December 31, 2014 (Unit: Korean won in thousands)
Companies Assets Liabilities Equity Ssangyong Motor (Shanghai) Co., Ltd. 7,017,149 842,529 6,174,620 Ssangyong European Parts Center B.V. 7,158,932 11,129,549 (3,970,617)
Companies Sales Net income Comprehensive income
Ssangyong Motor (Shanghai) Co., Ltd. 6,512,641 491,881 537,559 Ssangyong European Parts Center B.V. 14,118,627 116,206 476,709
(Unit: Indian rupee in thousands)
Companies Assets Liabilities Equity Ssangyong Motor (Shanghai) Co., Ltd. Rs. 398,925 Rs. 47,898 Rs. 351,027 Ssangyong European Parts Center B.V. 406,985 632,715 (225,730)
Companies Sales Net income Comprehensive income
Ssangyong Motor (Shanghai) Co., Ltd. Rs. 370,244 Rs. 27,963 Rs. 30,560 Ssangyong European Parts Center B.V. 802,644 6,606 27,101
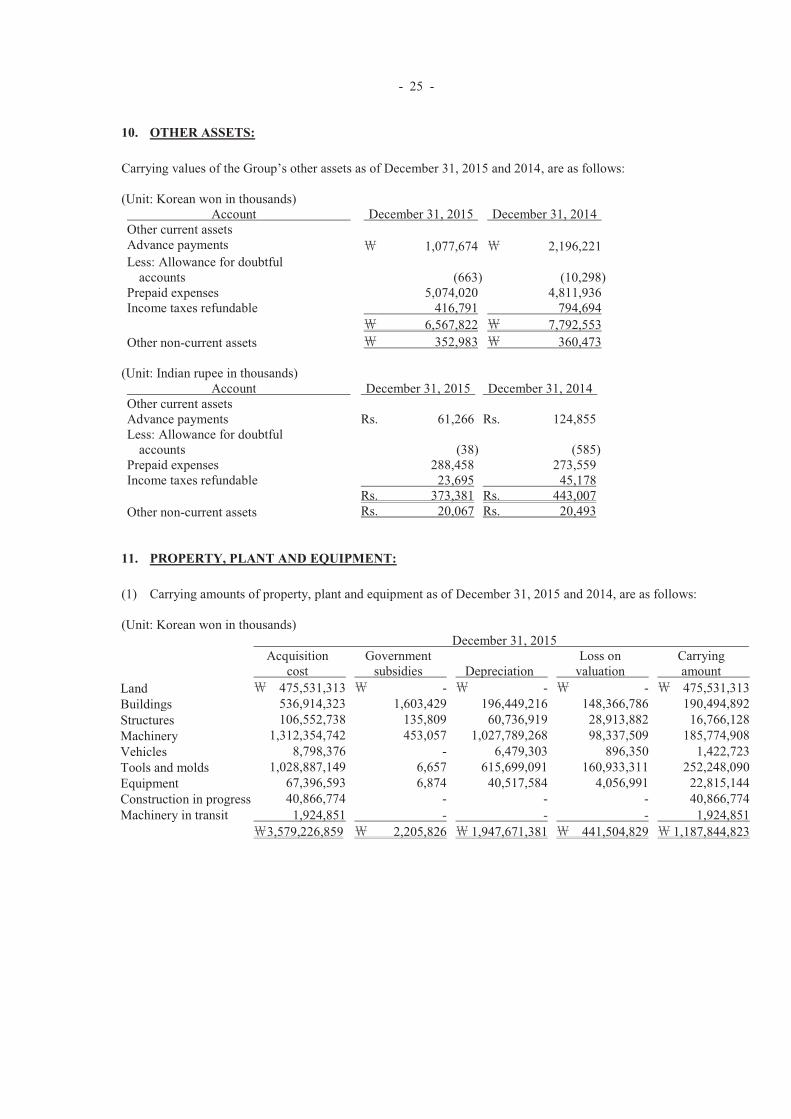
- 25 -
10. OTHER ASSETS:
Carrying values of the Group’s other assets as of December 31, 2015 and 2014, are as follows: (Unit: Korean won in thousands) Account December 31, 2015 December 31, 2014 Other current assets Advance payments 1,077,674 2,196,221 Less: Allowance for doubtful accounts (663) (10,298) Prepaid expenses 5,074,020 4,811,936 Income taxes refundable 416,791 794,694 6,567,822 7,792,553 Other non-current assets 352,983 360,473
(Unit: Indian rupee in thousands) Account December 31, 2015 December 31, 2014 Other current assets Advance payments Rs. 61,266 Rs. 124,855 Less: Allowance for doubtful accounts (38) (585) Prepaid expenses 288,458 273,559 Income taxes refundable 23,695 45,178 Rs. 373,381 Rs. 443,007 Other non-current assets Rs. 20,067 Rs. 20,493
11. PROPERTY, PLANT AND EQUIPMENT:
(1) Carrying amounts of property, plant and equipment as of December 31, 2015 and 2014, are as follows: (Unit: Korean won in thousands)
December 31, 2015
Acquisition cost
Government subsidies Depreciation
Loss on valuation
Carrying amount
Land 475,531,313 - - - 475,531,313 Buildings 536,914,323 1,603,429 196,449,216 148,366,786 190,494,892 Structures 106,552,738 135,809 60,736,919 28,913,882 16,766,128 Machinery 1,312,354,742 453,057 1,027,789,268 98,337,509 185,774,908 Vehicles 8,798,376 - 6,479,303 896,350 1,422,723 Tools and molds 1,028,887,149 6,657 615,699,091 160,933,311 252,248,090 Equipment 67,396,593 6,874 40,517,584 4,056,991 22,815,144 Construction in progress 40,866,774 - - - 40,866,774 Machinery in transit 1,924,851 - - - 1,924,851
3,579,226,859 2,205,826 1,947,671,381 441,504,829 1,187,844,823
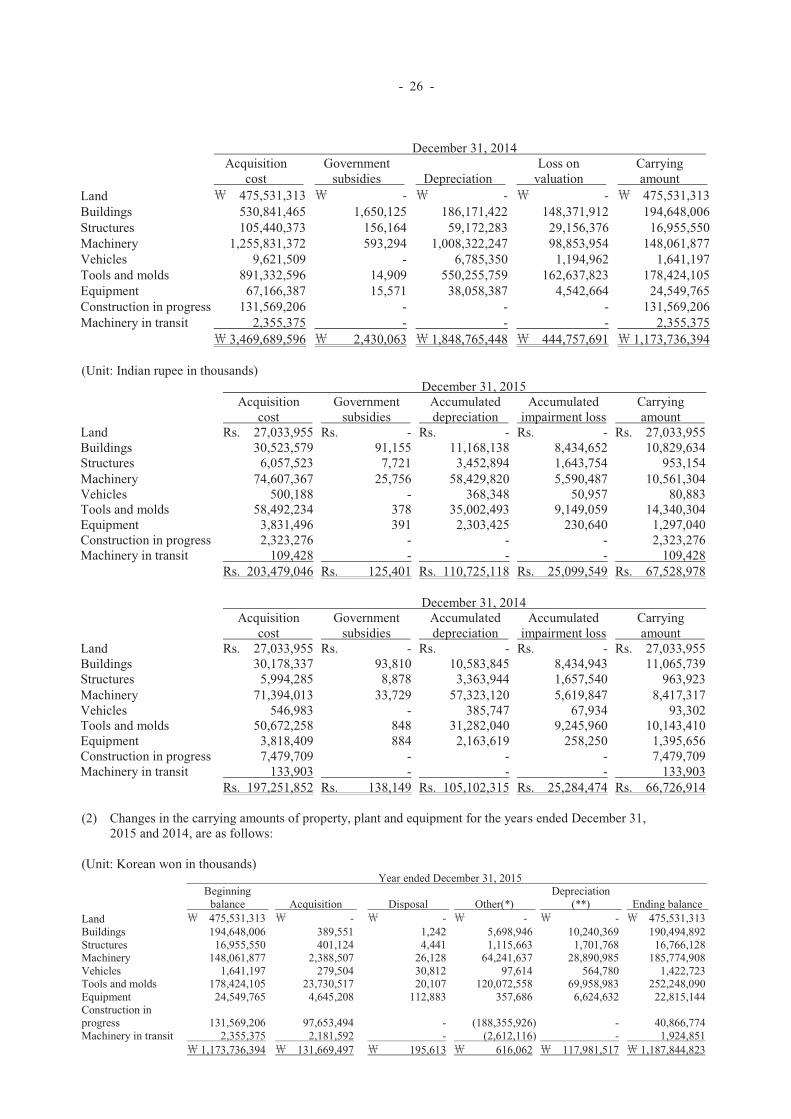
- 26 -
December 31, 2014Acquisition
costGovernment
subsidies DepreciationLoss on
valuationCarryingamount
Land 475,531,313 - - - 475,531,313Buildings 530,841,465 1,650,125 186,171,422 148,371,912 194,648,006Structures 105,440,373 156,164 59,172,283 29,156,376 16,955,550Machinery 1,255,831,372 593,294 1,008,322,247 98,853,954 148,061,877Vehicles 9,621,509 - 6,785,350 1,194,962 1,641,197Tools and molds 891,332,596 14,909 550,255,759 162,637,823 178,424,105Equipment 67,166,387 15,571 38,058,387 4,542,664 24,549,765Construction in progress 131,569,206 - - - 131,569,206Machinery in transit 2,355,375 - - - 2,355,375
3,469,689,596 2,430,063 1,848,765,448 444,757,691 1,173,736,394
(Unit: Indian rupee in thousands) December 31, 2015
Acquisitioncost
Governmentsubsidies
Accumulateddepreciation
Accumulatedimpairment loss
Carryingamount
Land Rs. 27,033,955 Rs. - Rs. - Rs. - Rs. 27,033,955Buildings 30,523,579 91,155 11,168,138 8,434,652 10,829,634Structures 6,057,523 7,721 3,452,894 1,643,754 953,154Machinery 74,607,367 25,756 58,429,820 5,590,487 10,561,304Vehicles 500,188 - 368,348 50,957 80,883Tools and molds 58,492,234 378 35,002,493 9,149,059 14,340,304Equipment 3,831,496 391 2,303,425 230,640 1,297,040Construction in progress 2,323,276 - - - 2,323,276Machinery in transit 109,428 - - - 109,428
Rs. 203,479,046 Rs. 125,401 Rs. 110,725,118 Rs. 25,099,549 Rs. 67,528,978
December 31, 2014Acquisition
costGovernment
subsidiesAccumulateddepreciation
Accumulatedimpairment loss
Carryingamount
Land Rs. 27,033,955 Rs. - Rs. - Rs. - Rs. 27,033,955Buildings 30,178,337 93,810 10,583,845 8,434,943 11,065,739Structures 5,994,285 8,878 3,363,944 1,657,540 963,923Machinery 71,394,013 33,729 57,323,120 5,619,847 8,417,317Vehicles 546,983 - 385,747 67,934 93,302Tools and molds 50,672,258 848 31,282,040 9,245,960 10,143,410Equipment 3,818,409 884 2,163,619 258,250 1,395,656Construction in progress 7,479,709 - - - 7,479,709Machinery in transit 133,903 - - - 133,903
Rs. 197,251,852 Rs. 138,149 Rs. 105,102,315 Rs. 25,284,474 Rs. 66,726,914
(2) Changes in the carrying amounts of property, plant and equipment for the years ended December 31,2015 and 2014, are as follows:
(Unit: Korean won in thousands) Year ended December 31, 2015
Beginningbalance Acquisition Disposal Other(*)
Depreciation(**) Ending balance
Land 475,531,313 - - - - 475,531,313Buildings 194,648,006 389,551 1,242 5,698,946 10,240,369 190,494,892Structures 16,955,550 401,124 4,441 1,115,663 1,701,768 16,766,128Machinery 148,061,877 2,388,507 26,128 64,241,637 28,890,985 185,774,908Vehicles 1,641,197 279,504 30,812 97,614 564,780 1,422,723Tools and molds 178,424,105 23,730,517 20,107 120,072,558 69,958,983 252,248,090Equipment 24,549,765 4,645,208 112,883 357,686 6,624,632 22,815,144Construction in progress 131,569,206 97,653,494 - (188,355,926) - 40,866,774Machinery in transit 2,355,375 2,181,592 - (2,612,116) - 1,924,851
1,173,736,394 131,669,497 195,613 616,062 117,981,517 1,187,844,823
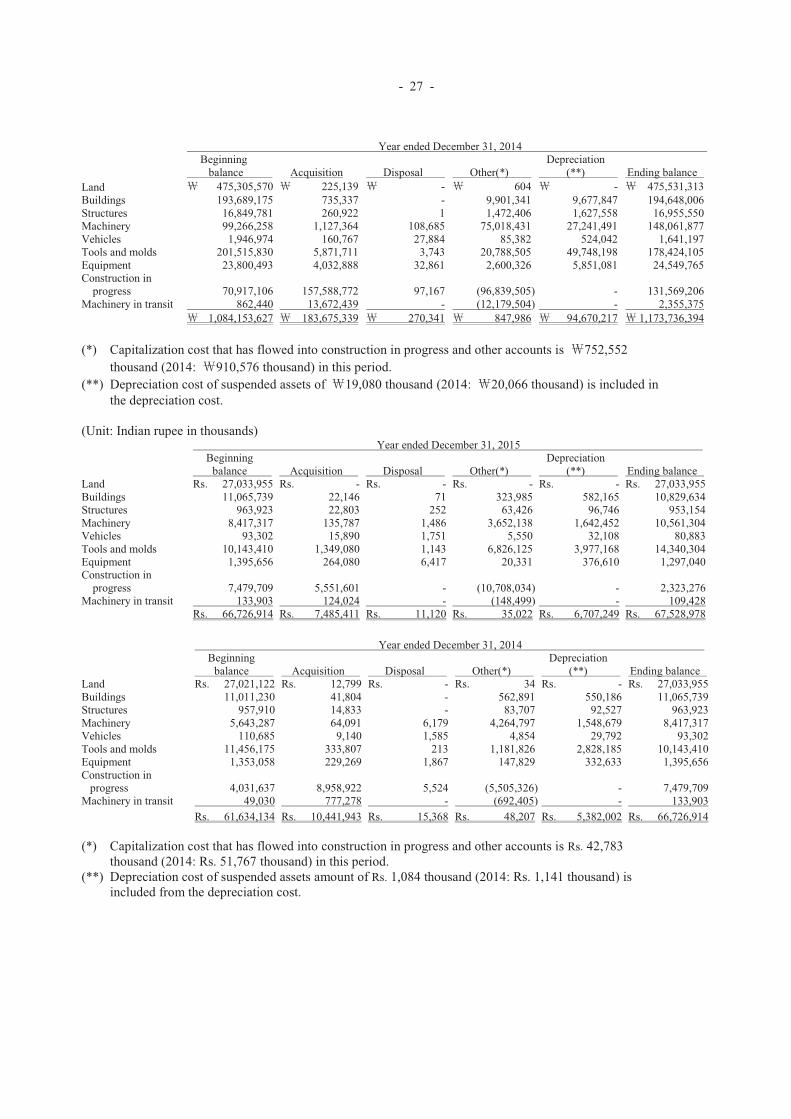
- 27 -
Year ended December 31, 2014Beginning
balance Acquisition Disposal Other(*)Depreciation
(**) Ending balanceLand 475,305,570 225,139 - 604 - 475,531,313Buildings 193,689,175 735,337 - 9,901,341 9,677,847 194,648,006Structures 16,849,781 260,922 1 1,472,406 1,627,558 16,955,550Machinery 99,266,258 1,127,364 108,685 75,018,431 27,241,491 148,061,877Vehicles 1,946,974 160,767 27,884 85,382 524,042 1,641,197Tools and molds 201,515,830 5,871,711 3,743 20,788,505 49,748,198 178,424,105Equipment 23,800,493 4,032,888 32,861 2,600,326 5,851,081 24,549,765Construction in
progress 70,917,106 157,588,772 97,167 (96,839,505) - 131,569,206Machinery in transit 862,440 13,672,439 - (12,179,504) - 2,355,375
1,084,153,627 183,675,339 270,341 847,986 94,670,217 1,173,736,394
(*) Capitalization cost that has flowed into construction in progress and other accounts is 752,552thousand (2014: 910,576 thousand) in this period.
(**) Depreciation cost of suspended assets of 19,080 thousand (2014: 20,066 thousand) is included inthe depreciation cost.
(Unit: Indian rupee in thousands) Year ended December 31, 2015
Beginningbalance Acquisition Disposal Other(*)
Depreciation(**) Ending balance
Land Rs. 27,033,955 Rs. - Rs. - Rs. - Rs. - Rs. 27,033,955Buildings 11,065,739 22,146 71 323,985 582,165 10,829,634Structures 963,923 22,803 252 63,426 96,746 953,154Machinery 8,417,317 135,787 1,486 3,652,138 1,642,452 10,561,304Vehicles 93,302 15,890 1,751 5,550 32,108 80,883Tools and molds 10,143,410 1,349,080 1,143 6,826,125 3,977,168 14,340,304Equipment 1,395,656 264,080 6,417 20,331 376,610 1,297,040Construction in
progress 7,479,709 5,551,601 - (10,708,034) - 2,323,276Machinery in transit 133,903 124,024 - (148,499) - 109,428
Rs. 66,726,914 Rs. 7,485,411 Rs. 11,120 Rs. 35,022 Rs. 6,707,249 Rs. 67,528,978
Year ended December 31, 2014Beginning
balance Acquisition Disposal Other(*)Depreciation
(**) Ending balanceLand Rs. 27,021,122 Rs. 12,799 Rs. - Rs. 34 Rs. - Rs. 27,033,955Buildings 11,011,230 41,804 - 562,891 550,186 11,065,739Structures 957,910 14,833 - 83,707 92,527 963,923Machinery 5,643,287 64,091 6,179 4,264,797 1,548,679 8,417,317Vehicles 110,685 9,140 1,585 4,854 29,792 93,302Tools and molds 11,456,175 333,807 213 1,181,826 2,828,185 10,143,410Equipment 1,353,058 229,269 1,867 147,829 332,633 1,395,656Construction in
progress 4,031,637 8,958,922 5,524 (5,505,326) - 7,479,709Machinery in transit 49,030 777,278 - (692,405) - 133,903
Rs. 61,634,134 Rs. 10,441,943 Rs. 15,368 Rs. 48,207 Rs. 5,382,002 Rs. 66,726,914
(*) Capitalization cost that has flowed into construction in progress and other accounts is Rs. 42,783 thousand (2014: Rs. 51,767 thousand) in this period.
(**) Depreciation cost of suspended assets amount of Rs. 1,084 thousand (2014: Rs. 1,141 thousand) is included from the depreciation cost.
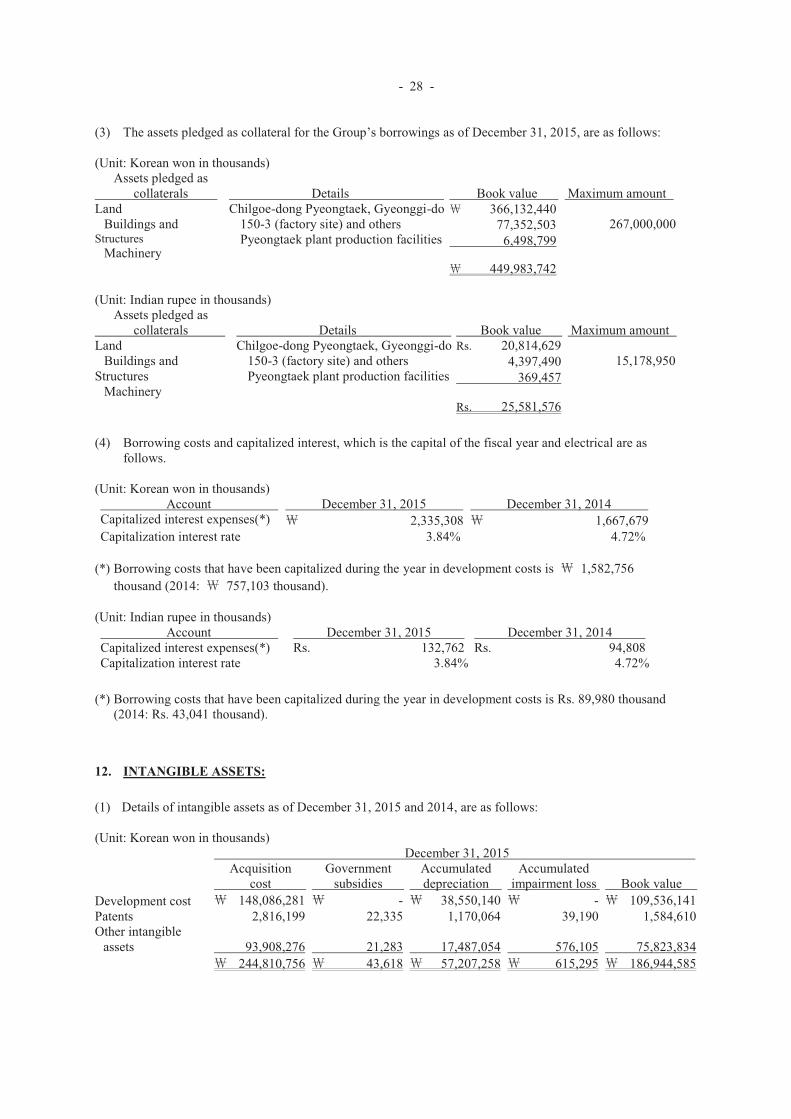
- 28 -
(3) The assets pledged as collateral for the Group’s borrowings as of December 31, 2015, are as follows:
(Unit: Korean won in thousands) Assets pledged as
collaterals Details Book value Maximum amountLand
Buildings andStructures
Machinery
Chilgoe-dong Pyeongtaek, Gyeonggi-do150-3 (factory site) and othersPyeongtaek plant production facilities
366,132,440267,000,00077,352,503
6,498,799
449,983,742
(Unit: Indian rupee in thousands) Assets pledged as
collaterals Details Book value Maximum amountLand
Buildings andStructures
Machinery
Chilgoe-dong Pyeongtaek, Gyeonggi-do150-3 (factory site) and othersPyeongtaek plant production facilities
Rs. 20,814,62915,178,9504,397,490
369,457
Rs. 25,581,576
(4) Borrowing costs and capitalized interest, which is the capital of the fiscal year and electrical are as follows.
(Unit: Korean won in thousands) Account December 31, 2015 December 31, 2014
Capitalized interest expenses(*) 2,335,308 1,667,679Capitalization interest rate 3.84% 4.72%
(*) Borrowing costs that have been capitalized during the year in development costs is 1,582,756thousand (2014: 757,103 thousand).
(Unit: Indian rupee in thousands) Account December 31, 2015 December 31, 2014
Capitalized interest expenses(*) Rs. 132,762 Rs. 94,808Capitalization interest rate 3.84% 4.72%
(*) Borrowing costs that have been capitalized during the year in development costs is Rs. 89,980 thousand (2014: Rs. 43,041 thousand).
12. INTANGIBLE ASSETS:
(1) Details of intangible assets as of December 31, 2015 and 2014, are as follows:
(Unit: Korean won in thousands) December 31, 2015
Acquisitioncost
Governmentsubsidies
Accumulateddepreciation
Accumulatedimpairment loss Book value
Development cost 148,086,281 - 38,550,140 - 109,536,141Patents 2,816,199 22,335 1,170,064 39,190 1,584,610Other intangible
assets 93,908,276 21,283 17,487,054 576,105 75,823,834244,810,756 43,618 57,207,258 615,295 186,944,585
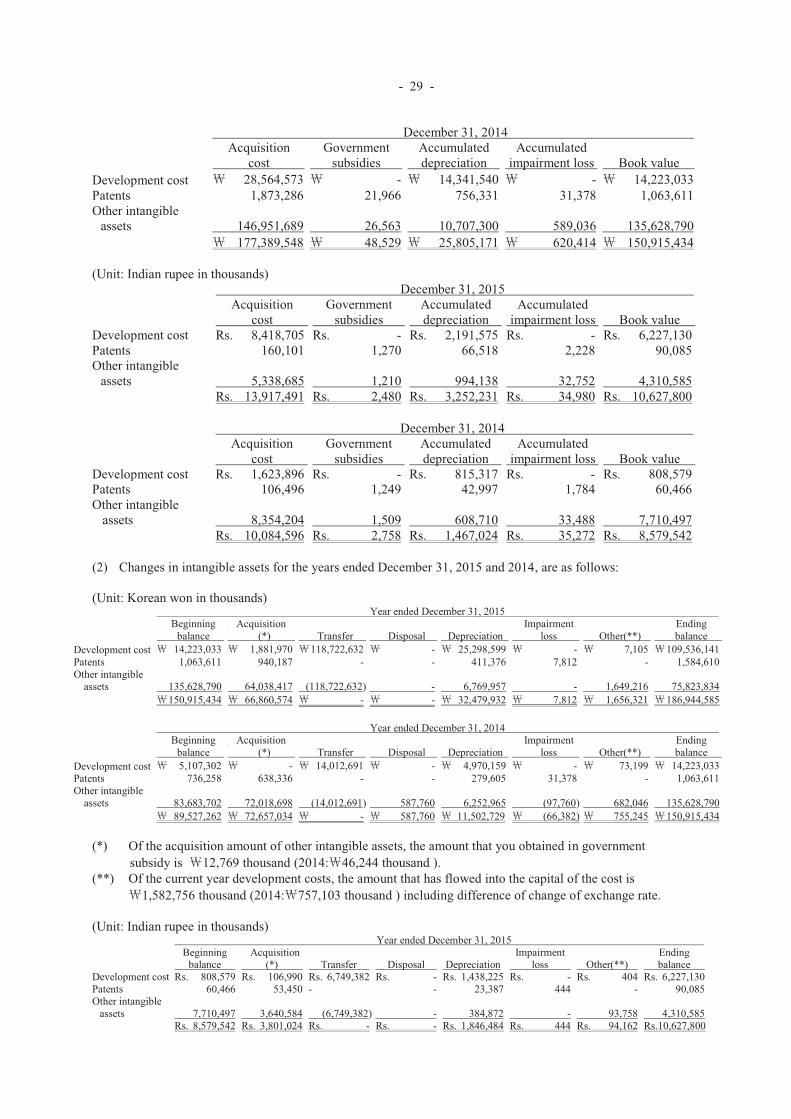
- 29 -
December 31, 2014Acquisition
costGovernment
subsidiesAccumulateddepreciation
Accumulatedimpairment loss Book value
Development cost 28,564,573 - 14,341,540 - 14,223,033Patents 1,873,286 21,966 756,331 31,378 1,063,611Other intangible
assets 146,951,689 26,563 10,707,300 589,036 135,628,790177,389,548 48,529 25,805,171 620,414 150,915,434
(Unit: Indian rupee in thousands) December 31, 2015
Acquisitioncost
Governmentsubsidies
Accumulateddepreciation
Accumulatedimpairment loss Book value
Development cost Rs. 8,418,705 Rs. - Rs. 2,191,575 Rs. - Rs. 6,227,130Patents 160,101 1,270 66,518 2,228 90,085Other intangible
assets 5,338,685 1,210 994,138 32,752 4,310,585Rs. 13,917,491 Rs. 2,480 Rs. 3,252,231 Rs. 34,980 Rs. 10,627,800
December 31, 2014Acquisition
costGovernment
subsidiesAccumulateddepreciation
Accumulatedimpairment loss Book value
Development cost Rs. 1,623,896 Rs. - Rs. 815,317 Rs. - Rs. 808,579Patents 106,496 1,249 42,997 1,784 60,466Other intangible
assets 8,354,204 1,509 608,710 33,488 7,710,497Rs. 10,084,596 Rs. 2,758 Rs. 1,467,024 Rs. 35,272 Rs. 8,579,542
(2) Changes in intangible assets for the years ended December 31, 2015 and 2014, are as follows:
(Unit: Korean won in thousands) Year ended December 31, 2015
Beginning balance
Acquisition(*) Transfer Disposal Depreciation
Impairmentloss Other(**)
Ending balance
Development cost 14,223,033 1,881,970 118,722,632 - 25,298,599 - 7,105 109,536,141Patents 1,063,611 940,187 - - 411,376 7,812 - 1,584,610Other intangible
assets 135,628,790 64,038,417 (118,722,632) - 6,769,957 - 1,649,216 75,823,834150,915,434 66,860,574 - - 32,479,932 7,812 1,656,321 186,944,585
Year ended December 31, 2014Beginning
balanceAcquisition
(*) Transfer Disposal DepreciationImpairment
loss Other(**)Ending balance
Development cost 5,107,302 - 14,012,691 - 4,970,159 - 73,199 14,223,033Patents 736,258 638,336 - - 279,605 31,378 - 1,063,611Other intangible
assets 83,683,702 72,018,698 (14,012,691) 587,760 6,252,965 (97,760) 682,046 135,628,79089,527,262 72,657,034 - 587,760 11,502,729 (66,382) 755,245 150,915,434
(*) Of the acquisition amount of other intangible assets, the amount that you obtained in government subsidy is 12,769 thousand (2014: 46,244 thousand ).
(**) Of the current year development costs, the amount that has flowed into the capital of the cost is 1,582,756 thousand (2014: 757,103 thousand ) including difference of change of exchange rate.
(Unit: Indian rupee in thousands) Year ended December 31, 2015
Beginningbalance
Acquisition(*) Transfer Disposal Depreciation
Impairmentloss Other(**)
Endingbalance
Development cost Rs. 808,579 Rs. 106,990 Rs. 6,749,382 Rs. - Rs. 1,438,225 Rs. - Rs. 404 Rs. 6,227,130Patents 60,466 53,450 - - 23,387 444 - 90,085Other intangible
assets 7,710,497 3,640,584 (6,749,382) - 384,872 - 93,758 4,310,585Rs. 8,579,542 Rs. 3,801,024 Rs. - Rs. - Rs. 1,846,484 Rs. 444 Rs. 94,162 Rs.10,627,800
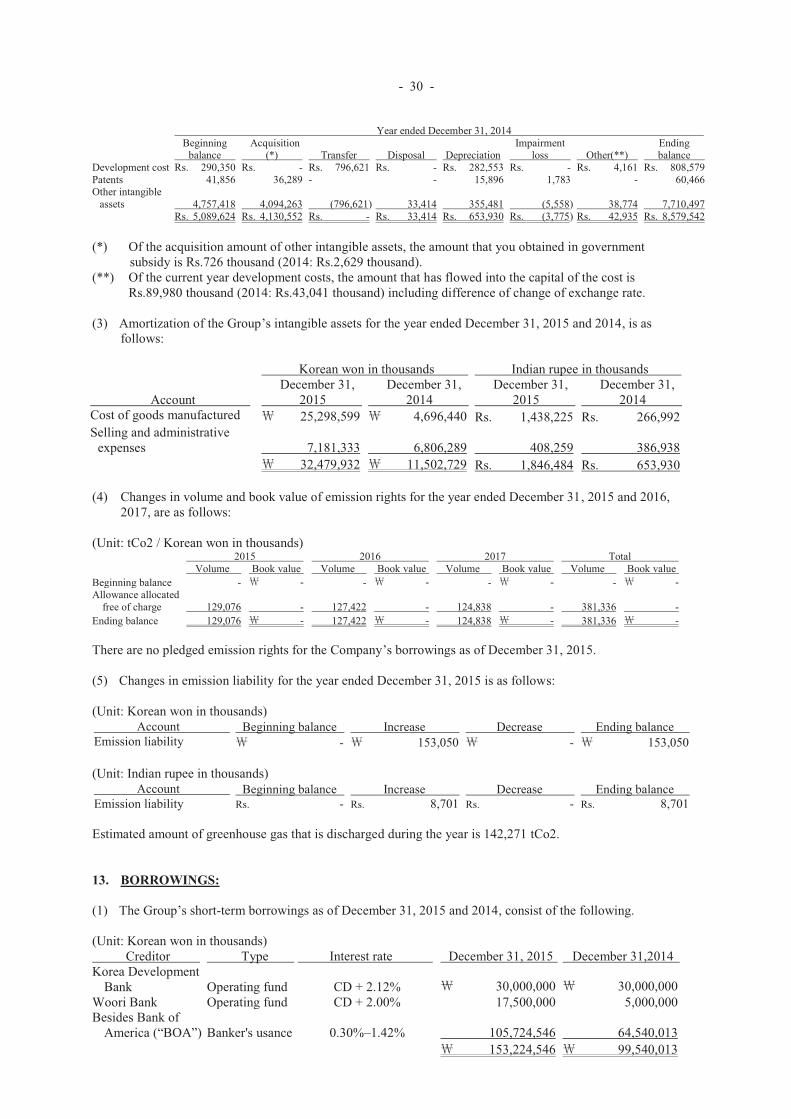
- 30 -
Year ended December 31, 2014Beginning
balanceAcquisition
(*) Transfer Disposal DepreciationImpairment
loss Other(**)Endingbalance
Development cost Rs. 290,350 Rs. - Rs. 796,621 Rs. - Rs. 282,553 Rs. - Rs. 4,161 Rs. 808,579Patents 41,856 36,289 - - 15,896 1,783 - 60,466Other intangible
assets 4,757,418 4,094,263 (796,621) 33,414 355,481 (5,558) 38,774 7,710,497Rs. 5,089,624 Rs. 4,130,552 Rs. - Rs. 33,414 Rs. 653,930 Rs. (3,775) Rs. 42,935 Rs. 8,579,542
(*) Of the acquisition amount of other intangible assets, the amount that you obtained in government subsidy is Rs.726 thousand (2014: Rs.2,629 thousand).
(**) Of the current year development costs, the amount that has flowed into the capital of the cost is Rs.89,980 thousand (2014: Rs.43,041 thousand) including difference of change of exchange rate.
(3) Amortization of the Group’s intangible assets for the year ended December 31, 2015 and 2014, is as follows:
Korean won in thousands Indian rupee in thousands
AccountDecember 31,
2015December 31,
2014December 31,
2015December 31,
2014Cost of goods manufactured 25,298,599 4,696,440 Rs. 1,438,225 Rs. 266,992Selling and administrative
expenses 7,181,333 6,806,289 408,259 386,93832,479,932 11,502,729 Rs. 1,846,484 Rs. 653,930
(4) Changes in volume and book value of emission rights for the year ended December 31, 2015 and 2016, 2017, are as follows:
(Unit: tCo2 / Korean won in thousands)2015 2016 2017 Total
Volume Book value Volume Book value Volume Book value Volume Book valueBeginning balance - - - - - - - -Allowance allocated
free of charge 129,076 - 127,422 - 124,838 - 381,336 -Ending balance 129,076 - 127,422 - 124,838 - 381,336 -
There are no pledged emission rights for the Company’s borrowings as of December 31, 2015.
(5) Changes in emission liability for the year ended December 31, 2015 is as follows:
(Unit: Korean won in thousands)Account Beginning balance Increase Decrease Ending balance
Emission liability - 153,050 - 153,050
(Unit: Indian rupee in thousands) Account Beginning balance Increase Decrease Ending balance
Emission liability Rs. - Rs. 8,701 Rs. - Rs. 8,701
Estimated amount of greenhouse gas that is discharged during the year is 142,271 tCo2.
13. BORROWINGS:
(1) The Group’s short-term borrowings as of December 31, 2015 and 2014, consist of the following.
(Unit: Korean won in thousands) Creditor Type Interest rate December 31, 2015 December 31,2014
Korea Development Bank Operating fund CD + 2.12% 30,000,000 30,000,000
Woori Bank Operating fund CD + 2.00% 17,500,000 5,000,000Besides Bank of
America (“BOA”) Banker's usance 0.30%–1.42% 105,724,546 64,540,013153,224,546 99,540,013
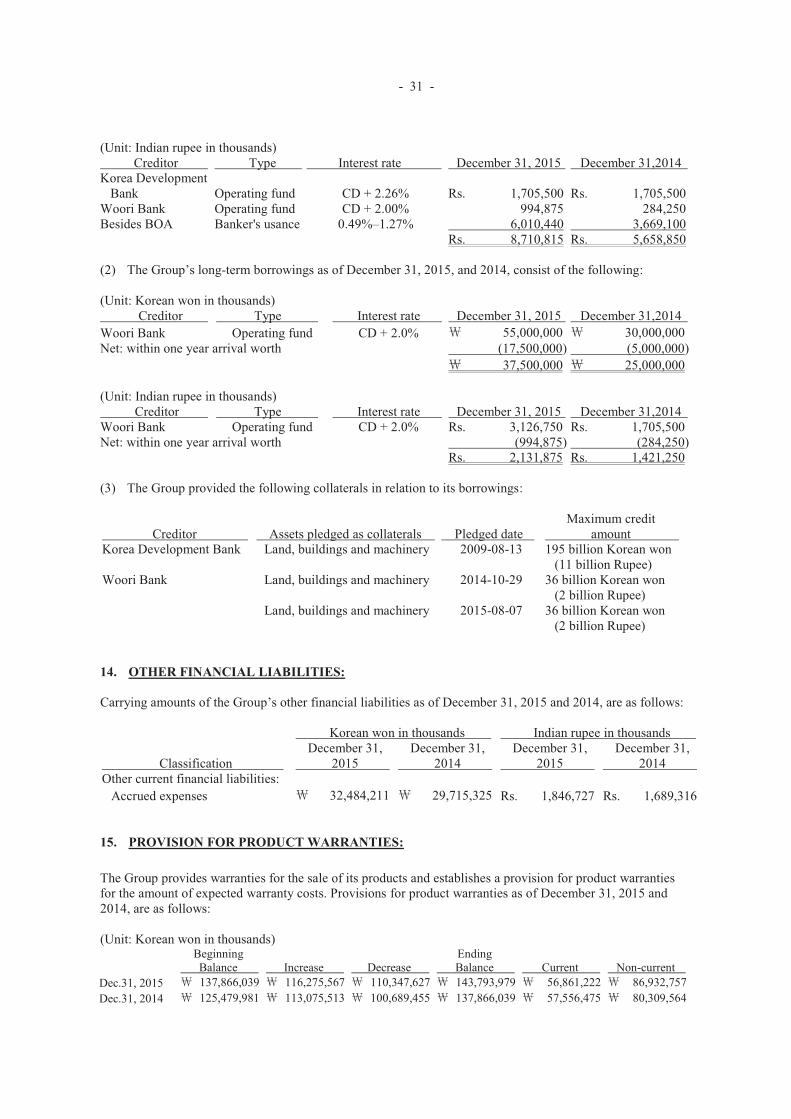
- 31 -
(Unit: Indian rupee in thousands) Creditor Type Interest rate December 31, 2015 December 31,2014
Korea Development Bank Operating fund CD + 2.26% Rs. 1,705,500 Rs. 1,705,500
Woori Bank Operating fund CD + 2.00% 994,875 284,250Besides BOA Banker's usance 0.49%–1.27% 6,010,440 3,669,100
Rs. 8,710,815 Rs. 5,658,850
(2) The Group’s long-term borrowings as of December 31, 2015, and 2014, consist of the following:
(Unit: Korean won in thousands) Creditor Type Interest rate December 31, 2015 December 31,2014
Woori Bank Operating fund CD + 2.0% 55,000,000 30,000,000Net: within one year arrival worth (17,500,000) (5,000,000)
37,500,000 25,000,000
(Unit: Indian rupee in thousands) Creditor Type Interest rate December 31, 2015 December 31,2014
Woori Bank Operating fund CD + 2.0% Rs. 3,126,750 Rs. 1,705,500Net: within one year arrival worth (994,875) (284,250)
Rs. 2,131,875 Rs. 1,421,250
(3) The Group provided the following collaterals in relation to its borrowings:
Creditor Assets pledged as collaterals Pledged dateMaximum credit
amountKorea Development Bank Land, buildings and machinery 2009-08-13 195 billion Korean won
(11 billion Rupee)Woori Bank Land, buildings and machinery 2014-10-29 36 billion Korean won
(2 billion Rupee)Land, buildings and machinery 2015-08-07 36 billion Korean won
(2 billion Rupee)
14. OTHER FINANCIAL LIABILITIES:
Carrying amounts of the Group’s other financial liabilities as of December 31, 2015 and 2014, are as follows:
Korean won in thousands Indian rupee in thousands
ClassificationDecember 31,
2015December 31,
2014December 31,
2015December 31,
2014Other current financial liabilities:
Accrued expenses 32,484,211 29,715,325 Rs. 1,846,727 Rs. 1,689,316
15. PROVISION FOR PRODUCT WARRANTIES:
The Group provides warranties for the sale of its products and establishes a provision for product warranties for the amount of expected warranty costs. Provisions for product warranties as of December 31, 2015 and 2014, are as follows:
(Unit: Korean won in thousands) BeginningBalance Increase Decrease
EndingBalance Current Non-current
Dec.31, 2015 137,866,039 116,275,567 110,347,627 143,793,979 56,861,222 86,932,757Dec.31, 2014 125,479,981 113,075,513 100,689,455 137,866,039 57,556,475 80,309,564
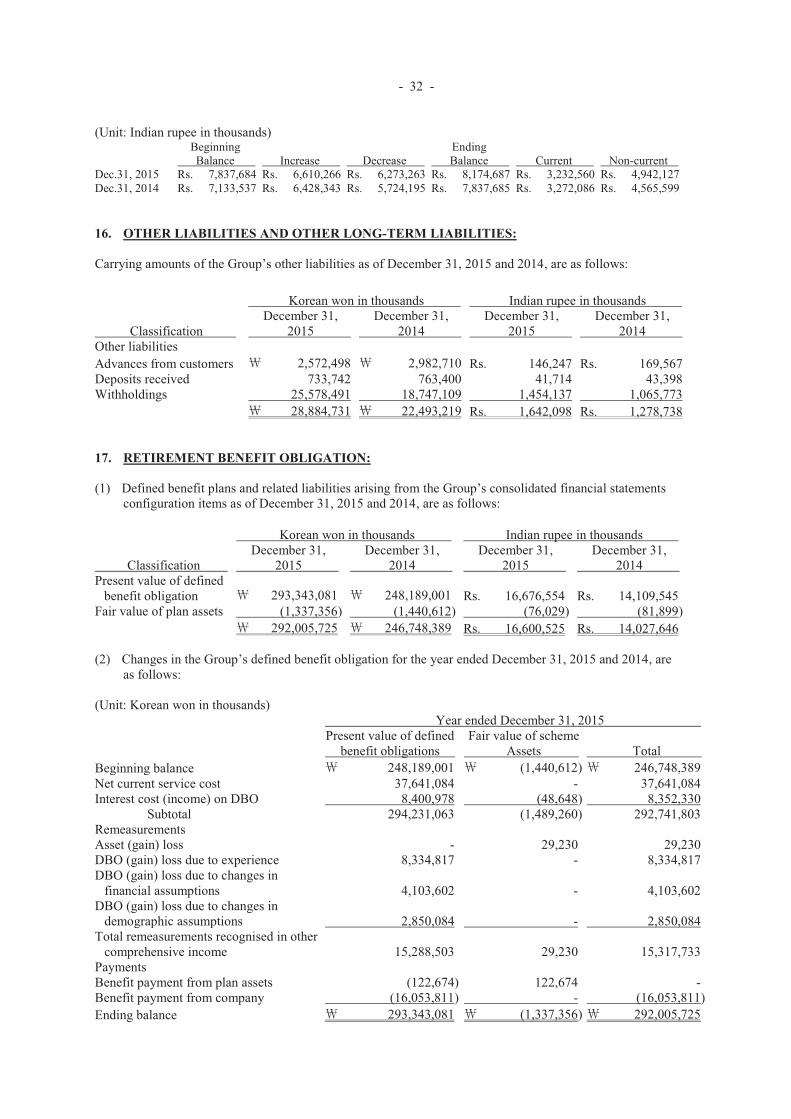
- 32 -
(Unit: Indian rupee in thousands) BeginningBalance Increase Decrease
EndingBalance Current Non-current
Dec.31, 2015 Rs. 7,837,684 Rs. 6,610,266 Rs. 6,273,263 Rs. 8,174,687 Rs. 3,232,560 Rs. 4,942,127Dec.31, 2014 Rs. 7,133,537 Rs. 6,428,343 Rs. 5,724,195 Rs. 7,837,685 Rs. 3,272,086 Rs. 4,565,599
16. OTHER LIABILITIES AND OTHER LONG-TERM LIABILITIES:
Carrying amounts of the Group’s other liabilities as of December 31, 2015 and 2014, are as follows:
Korean won in thousands Indian rupee in thousands
ClassificationDecember 31,
2015December 31,
2014December 31,
2015December 31,
2014Other liabilitiesAdvances from customers 2,572,498 2,982,710 Rs. 146,247 Rs. 169,567Deposits received 733,742 763,400 41,714 43,398Withholdings 25,578,491 18,747,109 1,454,137 1,065,773
28,884,731 22,493,219 Rs. 1,642,098 Rs. 1,278,738
17. RETIREMENT BENEFIT OBLIGATION:
(1) Defined benefit plans and related liabilities arising from the Group’s consolidated financial statements configuration items as of December 31, 2015 and 2014, are as follows:
Korean won in thousands Indian rupee in thousands
ClassificationDecember 31,
2015December 31,
2014December 31,
2015December 31,
2014Present value of defined
benefit obligation 293,343,081 248,189,001 Rs. 16,676,554 Rs. 14,109,545Fair value of plan assets (1,337,356) (1,440,612) (76,029) (81,899)
292,005,725 246,748,389 Rs. 16,600,525 Rs. 14,027,646
(2) Changes in the Group’s defined benefit obligation for the year ended December 31, 2015 and 2014, are as follows:
(Unit: Korean won in thousands) Year ended December 31, 2015
Present value of definedbenefit obligations
Fair value of schemeAssets Total
Beginning balance 248,189,001 (1,440,612) 246,748,389Net current service cost 37,641,084 - 37,641,084Interest cost (income) on DBO 8,400,978 (48,648) 8,352,330
Subtotal 294,231,063 (1,489,260) 292,741,803RemeasurementsAsset (gain) loss - 29,230 29,230DBO (gain) loss due to experience 8,334,817 - 8,334,817DBO (gain) loss due to changes in
financial assumptions 4,103,602 - 4,103,602DBO (gain) loss due to changes in
demographic assumptions 2,850,084 - 2,850,084Total remeasurements recognised in other
comprehensive income 15,288,503 29,230 15,317,733PaymentsBenefit payment from plan assets (122,674) 122,674 -Benefit payment from company (16,053,811) - (16,053,811)Ending balance 293,343,081 (1,337,356) 292,005,725
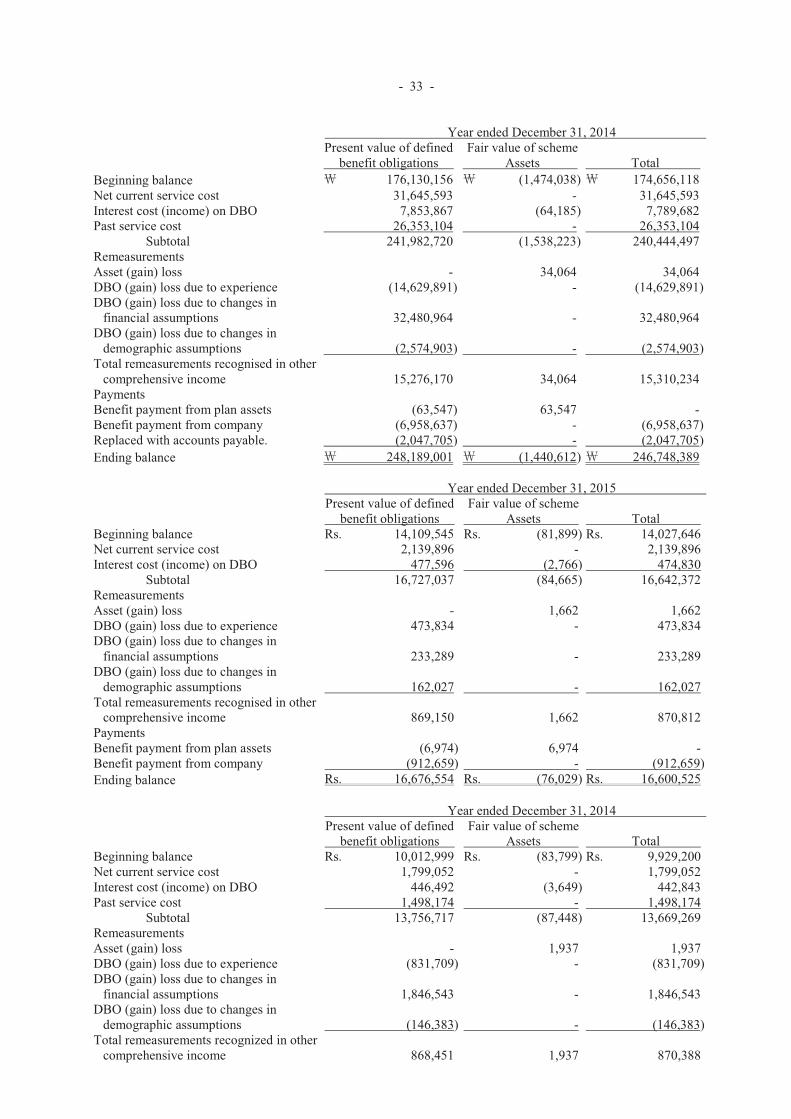
- 33 -
Year ended December 31, 2014Present value of defined
benefit obligationsFair value of scheme
Assets TotalBeginning balance 176,130,156 (1,474,038) 174,656,118Net current service cost 31,645,593 - 31,645,593Interest cost (income) on DBO 7,853,867 (64,185) 7,789,682Past service cost 26,353,104 - 26,353,104
Subtotal 241,982,720 (1,538,223) 240,444,497RemeasurementsAsset (gain) loss - 34,064 34,064DBO (gain) loss due to experience (14,629,891) - (14,629,891)DBO (gain) loss due to changes in
financial assumptions 32,480,964 - 32,480,964DBO (gain) loss due to changes in
demographic assumptions (2,574,903) - (2,574,903)Total remeasurements recognised in other
comprehensive income 15,276,170 34,064 15,310,234PaymentsBenefit payment from plan assets (63,547) 63,547 -Benefit payment from company (6,958,637) - (6,958,637)Replaced with accounts payable. (2,047,705) - (2,047,705)Ending balance 248,189,001 (1,440,612) 246,748,389
Year ended December 31, 2015Present value of defined
benefit obligationsFair value of scheme
Assets TotalBeginning balance Rs. 14,109,545 Rs. (81,899) Rs. 14,027,646Net current service cost 2,139,896 - 2,139,896Interest cost (income) on DBO 477,596 (2,766) 474,830
Subtotal 16,727,037 (84,665) 16,642,372RemeasurementsAsset (gain) loss - 1,662 1,662DBO (gain) loss due to experience 473,834 - 473,834DBO (gain) loss due to changes in
financial assumptions 233,289 - 233,289DBO (gain) loss due to changes in
demographic assumptions 162,027 - 162,027Total remeasurements recognised in other
comprehensive income 869,150 1,662 870,812PaymentsBenefit payment from plan assets (6,974) 6,974 -Benefit payment from company (912,659) - (912,659)Ending balance Rs. 16,676,554 Rs. (76,029) Rs. 16,600,525
Year ended December 31, 2014Present value of defined
benefit obligationsFair value of scheme
Assets TotalBeginning balance Rs. 10,012,999 Rs. (83,799) Rs. 9,929,200Net current service cost 1,799,052 - 1,799,052Interest cost (income) on DBO 446,492 (3,649) 442,843Past service cost 1,498,174 - 1,498,174
Subtotal 13,756,717 (87,448) 13,669,269RemeasurementsAsset (gain) loss - 1,937 1,937DBO (gain) loss due to experience (831,709) - (831,709)DBO (gain) loss due to changes in
financial assumptions 1,846,543 - 1,846,543DBO (gain) loss due to changes in
demographic assumptions (146,383) - (146,383)Total remeasurements recognized in other
comprehensive income 868,451 1,937 870,388
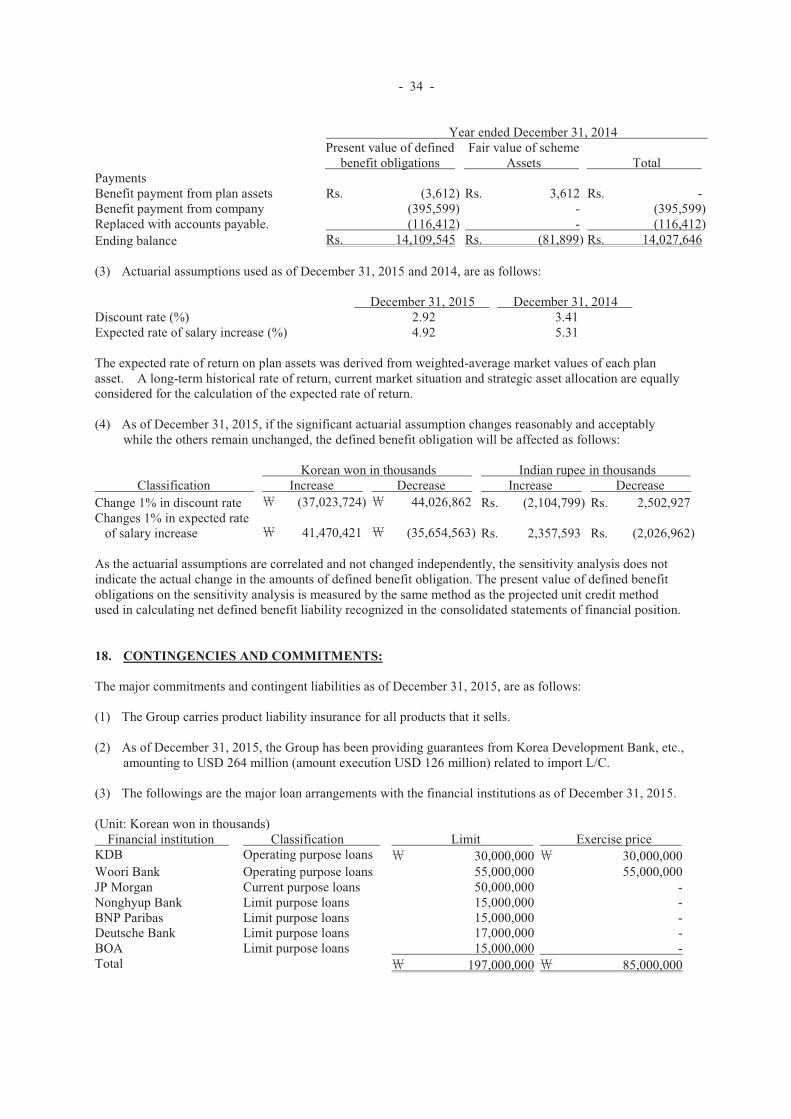
- 34 -
Year ended December 31, 2014Present value of defined
benefit obligationsFair value of scheme
Assets TotalPaymentsBenefit payment from plan assets Rs. (3,612) Rs. 3,612 Rs. -Benefit payment from company (395,599) - (395,599)Replaced with accounts payable. (116,412) - (116,412)Ending balance Rs. 14,109,545 Rs. (81,899) Rs. 14,027,646
(3) Actuarial assumptions used as of December 31, 2015 and 2014, are as follows:
December 31, 2015 December 31, 2014Discount rate (%) 2.92 3.41Expected rate of salary increase (%) 4.92 5.31
The expected rate of return on plan assets was derived from weighted-average market values of each plan asset. A long-term historical rate of return, current market situation and strategic asset allocation are equally considered for the calculation of the expected rate of return.
(4) As of December 31, 2015, if the significant actuarial assumption changes reasonably and acceptably while the others remain unchanged, the defined benefit obligation will be affected as follows:
Korean won in thousands Indian rupee in thousandsClassification Increase Decrease Increase Decrease
Change 1% in discount rate (37,023,724) 44,026,862 Rs. (2,104,799) Rs. 2,502,927Changes 1% in expected rate
of salary increase 41,470,421 (35,654,563) Rs. 2,357,593 Rs. (2,026,962)
As the actuarial assumptions are correlated and not changed independently, the sensitivity analysis does not indicate the actual change in the amounts of defined benefit obligation. The present value of defined benefit obligations on the sensitivity analysis is measured by the same method as the projected unit credit method used in calculating net defined benefit liability recognized in the consolidated statements of financial position.
18. CONTINGENCIES AND COMMITMENTS:
The major commitments and contingent liabilities as of December 31, 2015, are as follows:
(1) The Group carries product liability insurance for all products that it sells.
(2) As of December 31, 2015, the Group has been providing guarantees from Korea Development Bank, etc., amounting to USD 264 million (amount execution USD 126 million) related to import L/C.
(3) The followings are the major loan arrangements with the financial institutions as of December 31, 2015.
(Unit: Korean won in thousands) Financial institution Classification Limit Exercise price
KDB Operating purpose loans 30,000,000 30,000,000Woori Bank Operating purpose loans 55,000,000 55,000,000JP Morgan Current purpose loans 50,000,000 -Nonghyup Bank Limit purpose loans 15,000,000 -BNP Paribas Limit purpose loans 15,000,000 -Deutsche Bank Limit purpose loans 17,000,000 -BOA Limit purpose loans 15,000,000 -Total 197,000,000 85,000,000
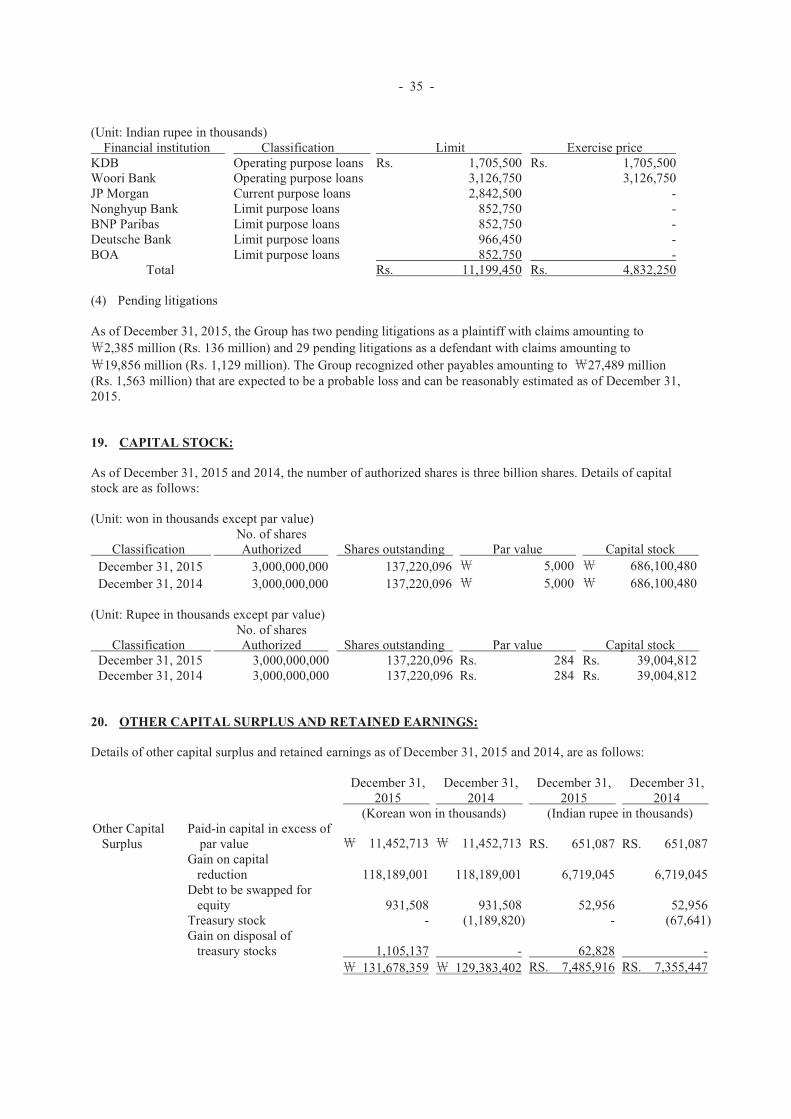
- 35 -
(Unit: Indian rupee in thousands) Financial institution Classification Limit Exercise price
KDB Operating purpose loans Rs. 1,705,500 Rs. 1,705,500Woori Bank Operating purpose loans 3,126,750 3,126,750JP Morgan Current purpose loans 2,842,500 -Nonghyup Bank Limit purpose loans 852,750 -BNP Paribas Limit purpose loans 852,750 -Deutsche Bank Limit purpose loans 966,450 -BOA Limit purpose loans 852,750 -
Total Rs. 11,199,450 Rs. 4,832,250
(4) Pending litigations
As of December 31, 2015, the Group has two pending litigations as a plaintiff with claims amounting to 2,385 million (Rs. 136 million) and 29 pending litigations as a defendant with claims amounting to 19,856 million (Rs. 1,129 million). The Group recognized other payables amounting to 27,489 million
(Rs. 1,563 million) that are expected to be a probable loss and can be reasonably estimated as of December 31, 2015.
19. CAPITAL STOCK:
As of December 31, 2015 and 2014, the number of authorized shares is three billion shares. Details of capital stock are as follows:
(Unit: won in thousands except par value)
ClassificationNo. of shares Authorized Shares outstanding Par value Capital stock
December 31, 2015 3,000,000,000 137,220,096 5,000 686,100,480December 31, 2014 3,000,000,000 137,220,096 5,000 686,100,480
(Unit: Rupee in thousands except par value)
ClassificationNo. of shares Authorized Shares outstanding Par value Capital stock
December 31, 2015 3,000,000,000 137,220,096 Rs. 284 Rs. 39,004,812December 31, 2014 3,000,000,000 137,220,096 Rs. 284 Rs. 39,004,812
20. OTHER CAPITAL SURPLUS AND RETAINED EARNINGS:
Details of other capital surplus and retained earnings as of December 31, 2015 and 2014, are as follows:
December 31,2015
December 31,2014
December 31,2015
December 31,2014
(Korean won in thousands) (Indian rupee in thousands)Other Capital
SurplusPaid-in capital in excess of
par value 11,452,713 11,452,713 RS. 651,087 RS. 651,087Gain on capital
reduction 118,189,001 118,189,001 6,719,045 6,719,045Debt to be swapped for
equity 931,508 931,508 52,956 52,956Treasury stock - (1,189,820) - (67,641)Gain on disposal of
treasury stocks 1,105,137 - 62,828 -131,678,359 129,383,402 RS. 7,485,916 RS. 7,355,447
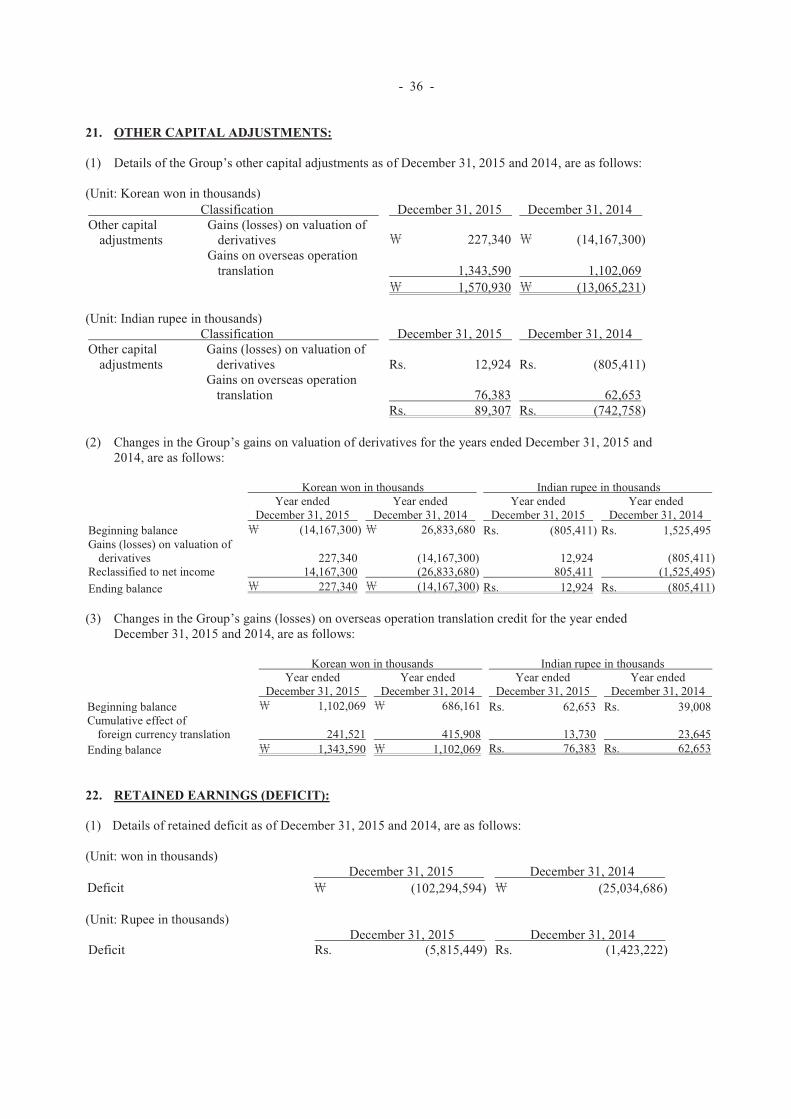
- 36 -
21. OTHER CAPITAL ADJUSTMENTS:
(1) Details of the Group’s other capital adjustments as of December 31, 2015 and 2014, are as follows:
(Unit: Korean won in thousands) Classification December 31, 2015 December 31, 2014
Other capitaladjustments
Gains (losses) on valuation ofderivatives 227,340 (14,167,300)
Gains on overseas operation translation 1,343,590 1,102,069
1,570,930 (13,065,231)
(Unit: Indian rupee in thousands) Classification December 31, 2015 December 31, 2014
Other capital adjustments
Gains (losses) on valuation ofderivatives Rs. 12,924 Rs. (805,411)
Gains on overseas operation translation 76,383 62,653
Rs. 89,307 Rs. (742,758)
(2) Changes in the Group’s gains on valuation of derivatives for the years ended December 31, 2015 and 2014, are as follows:
Korean won in thousands Indian rupee in thousandsYear ended
December 31, 2015Year ended
December 31, 2014Year ended
December 31, 2015Year ended
December 31, 2014Beginning balance (14,167,300) 26,833,680 Rs. (805,411) Rs. 1,525,495Gains (losses) on valuation of
derivatives 227,340 (14,167,300) 12,924 (805,411)Reclassified to net income 14,167,300 (26,833,680) 805,411 (1,525,495)Ending balance 227,340 (14,167,300) Rs. 12,924 Rs. (805,411)
(3) Changes in the Group’s gains (losses) on overseas operation translation credit for the year ended December 31, 2015 and 2014, are as follows:
Korean won in thousands Indian rupee in thousandsYear ended
December 31, 2015Year ended
December 31, 2014Year ended
December 31, 2015Year ended
December 31, 2014Beginning balance 1,102,069 686,161 Rs. 62,653 Rs. 39,008Cumulative effect of
foreign currency translation 241,521 415,908 13,730 23,645Ending balance 1,343,590 1,102,069 Rs. 76,383 Rs. 62,653
22. RETAINED EARNINGS (DEFICIT):
(1) Details of retained deficit as of December 31, 2015 and 2014, are as follows:
(Unit: won in thousands) December 31, 2015 December 31, 2014
Deficit (102,294,594) (25,034,686)
(Unit: Rupee in thousands) December 31, 2015 December 31, 2014
Deficit Rs. (5,815,449) Rs. (1,423,222)
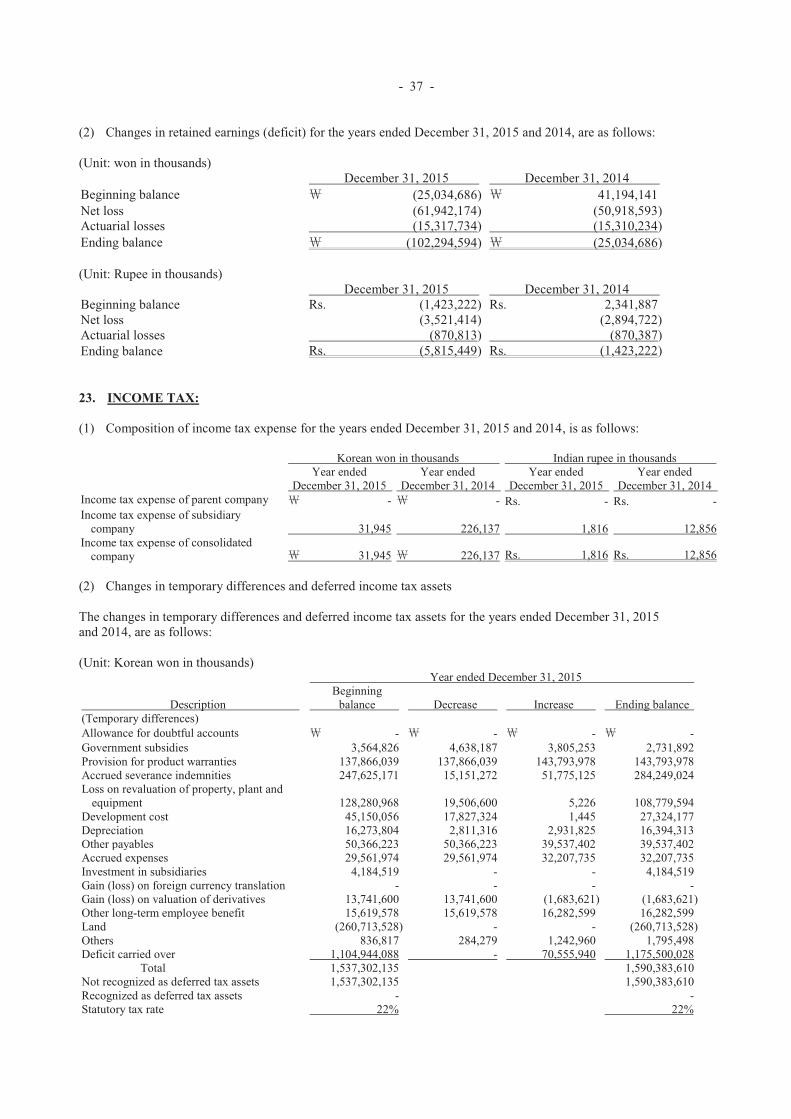
- 37 -
(2) Changes in retained earnings (deficit) for the years ended December 31, 2015 and 2014, are as follows:
(Unit: won in thousands) December 31, 2015 December 31, 2014
Beginning balance (25,034,686) 41,194,141Net loss (61,942,174) (50,918,593)Actuarial losses (15,317,734) (15,310,234)Ending balance (102,294,594) (25,034,686)
(Unit: Rupee in thousands) December 31, 2015 December 31, 2014
Beginning balance Rs. (1,423,222) Rs. 2,341,887Net loss (3,521,414) (2,894,722)Actuarial losses (870,813) (870,387)Ending balance Rs. (5,815,449) Rs. (1,423,222)
23. INCOME TAX:
(1) Composition of income tax expense for the years ended December 31, 2015 and 2014, is as follows:
Korean won in thousands Indian rupee in thousandsYear ended
December 31, 2015Year ended
December 31, 2014Year ended
December 31, 2015Year ended
December 31, 2014Income tax expense of parent company - - Rs. - Rs. -Income tax expense of subsidiary
company 31,945 226,137 1,816 12,856Income tax expense of consolidated
company 31,945 226,137 Rs. 1,816 Rs. 12,856
(2) Changes in temporary differences and deferred income tax assets
The changes in temporary differences and deferred income tax assets for the years ended December 31, 2015and 2014, are as follows:
(Unit: Korean won in thousands) Year ended December 31, 2015
DescriptionBeginning
balance Decrease Increase Ending balance(Temporary differences)Allowance for doubtful accounts - - - -Government subsidies 3,564,826 4,638,187 3,805,253 2,731,892Provision for product warranties 137,866,039 137,866,039 143,793,978 143,793,978Accrued severance indemnities 247,625,171 15,151,272 51,775,125 284,249,024Loss on revaluation of property, plant and
equipment 128,280,968 19,506,600 5,226 108,779,594Development cost 45,150,056 17,827,324 1,445 27,324,177Depreciation 16,273,804 2,811,316 2,931,825 16,394,313Other payables 50,366,223 50,366,223 39,537,402 39,537,402Accrued expenses 29,561,974 29,561,974 32,207,735 32,207,735Investment in subsidiaries 4,184,519 - - 4,184,519Gain (loss) on foreign currency translation - - - -Gain (loss) on valuation of derivatives 13,741,600 13,741,600 (1,683,621) (1,683,621)Other long-term employee benefit 15,619,578 15,619,578 16,282,599 16,282,599Land (260,713,528) - - (260,713,528)Others 836,817 284,279 1,242,960 1,795,498Deficit carried over 1,104,944,088 - 70,555,940 1,175,500,028
Total 1,537,302,135 1,590,383,610Not recognized as deferred tax assets 1,537,302,135 1,590,383,610Recognized as deferred tax assets - -Statutory tax rate 22% 22%
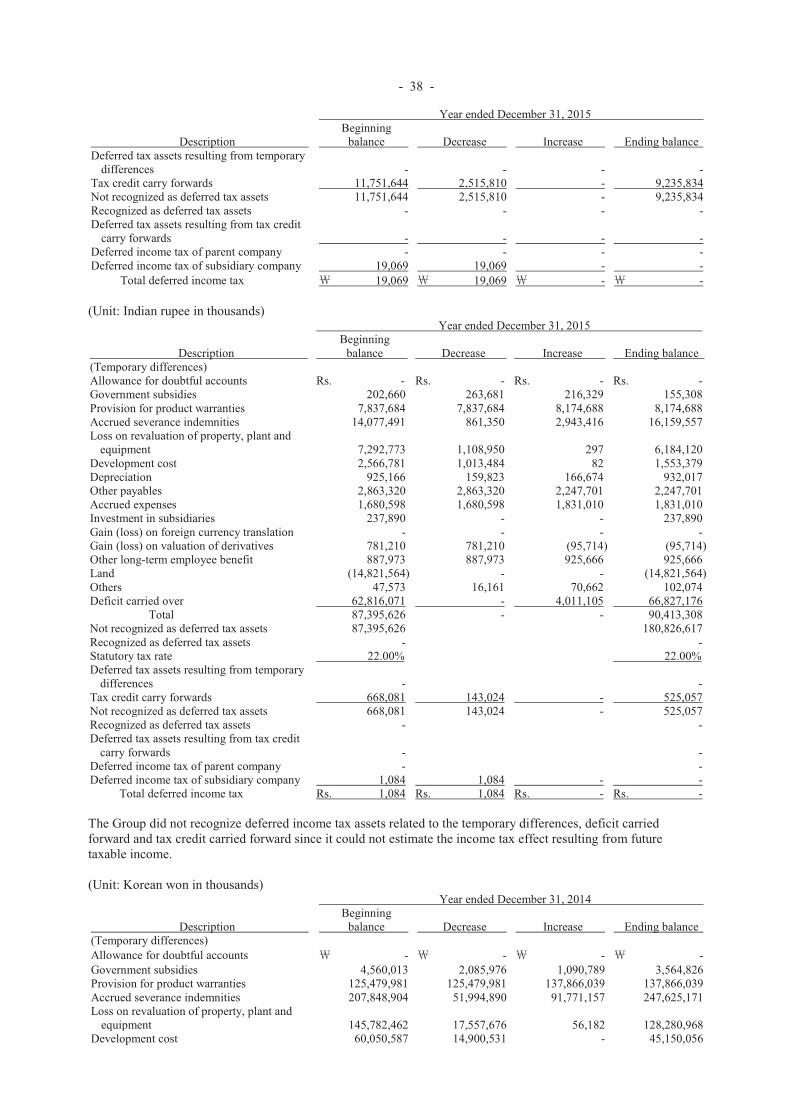
- 38 -
Year ended December 31, 2015
DescriptionBeginning
balance Decrease Increase Ending balanceDeferred tax assets resulting from temporary
differences - - - -Tax credit carry forwards 11,751,644 2,515,810 - 9,235,834Not recognized as deferred tax assets 11,751,644 2,515,810 - 9,235,834Recognized as deferred tax assets - - - -Deferred tax assets resulting from tax credit
carry forwards - - - -Deferred income tax of parent company - - - -Deferred income tax of subsidiary company 19,069 19,069 - -
Total deferred income tax 19,069 19,069 - -
(Unit: Indian rupee in thousands) Year ended December 31, 2015
DescriptionBeginning
balance Decrease Increase Ending balance(Temporary differences)Allowance for doubtful accounts Rs. - Rs. - Rs. - Rs. -Government subsidies 202,660 263,681 216,329 155,308Provision for product warranties 7,837,684 7,837,684 8,174,688 8,174,688Accrued severance indemnities 14,077,491 861,350 2,943,416 16,159,557Loss on revaluation of property, plant and
equipment 7,292,773 1,108,950 297 6,184,120Development cost 2,566,781 1,013,484 82 1,553,379Depreciation 925,166 159,823 166,674 932,017Other payables 2,863,320 2,863,320 2,247,701 2,247,701Accrued expenses 1,680,598 1,680,598 1,831,010 1,831,010Investment in subsidiaries 237,890 - - 237,890Gain (loss) on foreign currency translation - - - -Gain (loss) on valuation of derivatives 781,210 781,210 (95,714) (95,714)Other long-term employee benefit 887,973 887,973 925,666 925,666Land (14,821,564) - - (14,821,564)Others 47,573 16,161 70,662 102,074Deficit carried over 62,816,071 - 4,011,105 66,827,176
Total 87,395,626 - - 90,413,308Not recognized as deferred tax assets 87,395,626 180,826,617Recognized as deferred tax assets - -Statutory tax rate 22.00% 22.00%Deferred tax assets resulting from temporary
differences - -Tax credit carry forwards 668,081 143,024 - 525,057Not recognized as deferred tax assets 668,081 143,024 - 525,057Recognized as deferred tax assets - -Deferred tax assets resulting from tax credit
carry forwards - -Deferred income tax of parent company - -Deferred income tax of subsidiary company 1,084 1,084 - -
Total deferred income tax Rs. 1,084 Rs. 1,084 Rs. - Rs. -
The Group did not recognize deferred income tax assets related to the temporary differences, deficit carried forward and tax credit carried forward since it could not estimate the income tax effect resulting from future taxable income.
(Unit: Korean won in thousands) Year ended December 31, 2014
DescriptionBeginning
balance Decrease Increase Ending balance(Temporary differences)Allowance for doubtful accounts - - - -Government subsidies 4,560,013 2,085,976 1,090,789 3,564,826Provision for product warranties 125,479,981 125,479,981 137,866,039 137,866,039Accrued severance indemnities 207,848,904 51,994,890 91,771,157 247,625,171Loss on revaluation of property, plant and
equipment 145,782,462 17,557,676 56,182 128,280,968Development cost 60,050,587 14,900,531 - 45,150,056
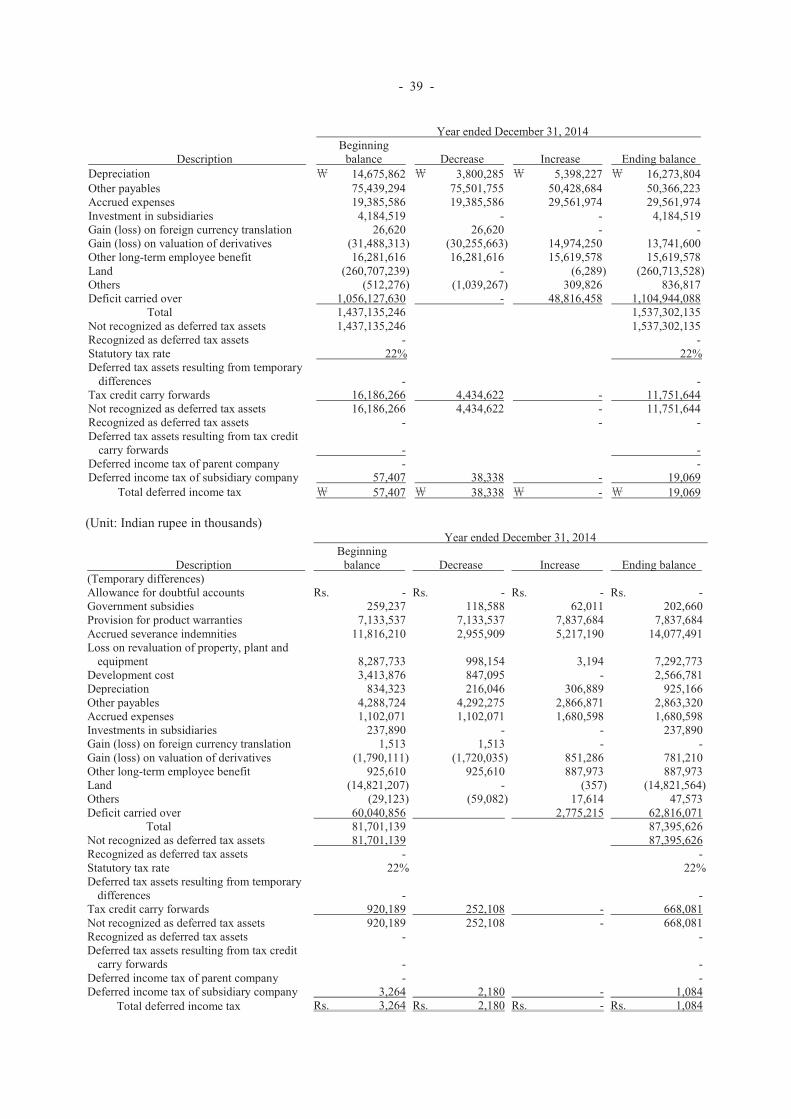
- 39 -
Year ended December 31, 2014
DescriptionBeginning
balance Decrease Increase Ending balanceDepreciation 14,675,862 3,800,285 5,398,227 16,273,804Other payables 75,439,294 75,501,755 50,428,684 50,366,223Accrued expenses 19,385,586 19,385,586 29,561,974 29,561,974Investment in subsidiaries 4,184,519 - - 4,184,519Gain (loss) on foreign currency translation 26,620 26,620 - -Gain (loss) on valuation of derivatives (31,488,313) (30,255,663) 14,974,250 13,741,600Other long-term employee benefit 16,281,616 16,281,616 15,619,578 15,619,578Land (260,707,239) - (6,289) (260,713,528)Others (512,276) (1,039,267) 309,826 836,817Deficit carried over 1,056,127,630 - 48,816,458 1,104,944,088
Total 1,437,135,246 1,537,302,135Not recognized as deferred tax assets 1,437,135,246 1,537,302,135Recognized as deferred tax assets - -Statutory tax rate 22% 22%Deferred tax assets resulting from temporary
differences - -Tax credit carry forwards 16,186,266 4,434,622 - 11,751,644Not recognized as deferred tax assets 16,186,266 4,434,622 - 11,751,644Recognized as deferred tax assets - - -Deferred tax assets resulting from tax credit
carry forwards - -Deferred income tax of parent company - -Deferred income tax of subsidiary company 57,407 38,338 - 19,069
Total deferred income tax 57,407 38,338 - 19,069
(Unit: Indian rupee in thousands) Year ended December 31, 2014
DescriptionBeginning
balance Decrease Increase Ending balance(Temporary differences)Allowance for doubtful accounts Rs. - Rs. - Rs. - Rs. -Government subsidies 259,237 118,588 62,011 202,660Provision for product warranties 7,133,537 7,133,537 7,837,684 7,837,684Accrued severance indemnities 11,816,210 2,955,909 5,217,190 14,077,491Loss on revaluation of property, plant and
equipment 8,287,733 998,154 3,194 7,292,773Development cost 3,413,876 847,095 - 2,566,781Depreciation 834,323 216,046 306,889 925,166Other payables 4,288,724 4,292,275 2,866,871 2,863,320Accrued expenses 1,102,071 1,102,071 1,680,598 1,680,598Investments in subsidiaries 237,890 - - 237,890Gain (loss) on foreign currency translation 1,513 1,513 - -Gain (loss) on valuation of derivatives (1,790,111) (1,720,035) 851,286 781,210Other long-term employee benefit 925,610 925,610 887,973 887,973Land (14,821,207) - (357) (14,821,564)Others (29,123) (59,082) 17,614 47,573Deficit carried over 60,040,856 2,775,215 62,816,071
Total 81,701,139 87,395,626Not recognized as deferred tax assets 81,701,139 87,395,626Recognized as deferred tax assets - -Statutory tax rate 22% 22%Deferred tax assets resulting from temporary
differences - -Tax credit carry forwards 920,189 252,108 - 668,081Not recognized as deferred tax assets 920,189 252,108 - 668,081Recognized as deferred tax assets - -Deferred tax assets resulting from tax credit
carry forwards - -Deferred income tax of parent company - -Deferred income tax of subsidiary company 3,264 2,180 - 1,084
Total deferred income tax Rs. 3,264 Rs. 2,180 Rs. - Rs. 1,084
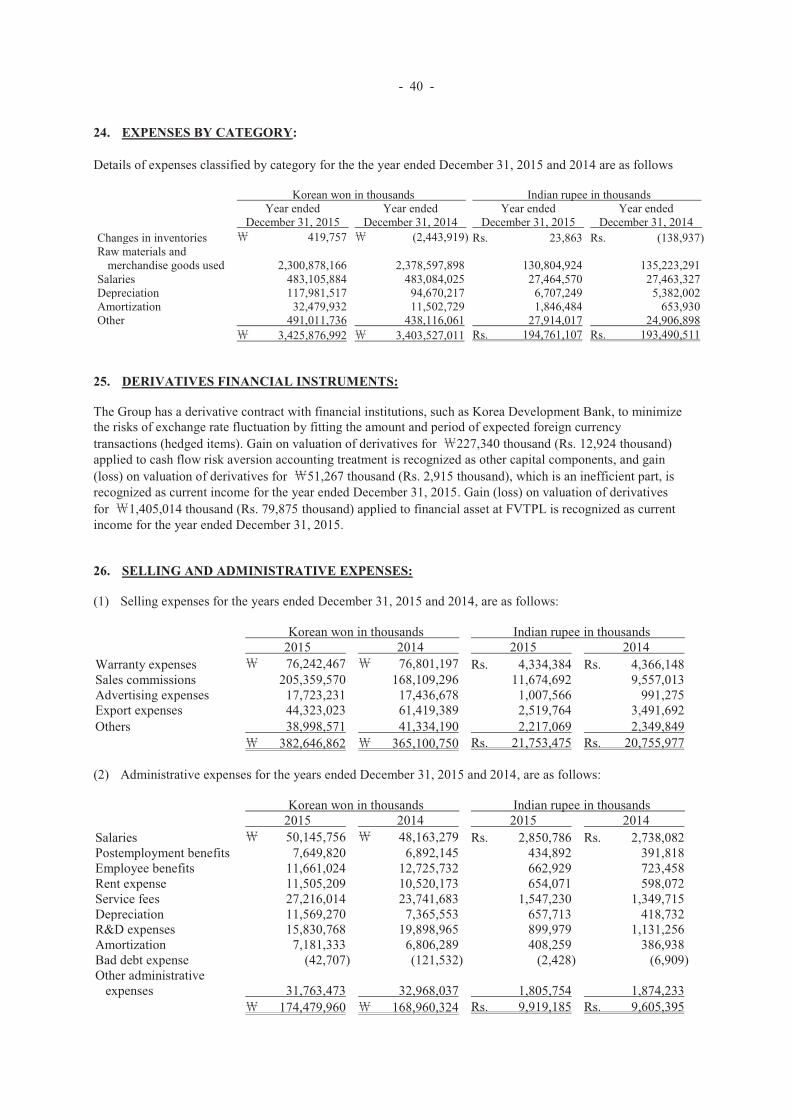
- 40 -
24. EXPENSES BY CATEGORY:
Details of expenses classified by category for the the year ended December 31, 2015 and 2014 are as follows
Korean won in thousands Indian rupee in thousandsYear ended
December 31, 2015Year ended
December 31, 2014Year ended
December 31, 2015Year ended
December 31, 2014Changes in inventories 419,757 (2,443,919) Rs. 23,863 Rs. (138,937)Raw materials and
merchandise goods used 2,300,878,166 2,378,597,898 130,804,924 135,223,291Salaries 483,105,884 483,084,025 27,464,570 27,463,327Depreciation 117,981,517 94,670,217 6,707,249 5,382,002Amortization 32,479,932 11,502,729 1,846,484 653,930Other 491,011,736 438,116,061 27,914,017 24,906,898
3,425,876,992 3,403,527,011 Rs. 194,761,107 Rs. 193,490,511
25. DERIVATIVES FINANCIAL INSTRUMENTS:
The Group has a derivative contract with financial institutions, such as Korea Development Bank, to minimize the risks of exchange rate fluctuation by fitting the amount and period of expected foreign currency transactions (hedged items). Gain on valuation of derivatives for 227,340 thousand (Rs. 12,924 thousand) applied to cash flow risk aversion accounting treatment is recognized as other capital components, and gain(loss) on valuation of derivatives for 51,267 thousand (Rs. 2,915 thousand), which is an inefficient part, is recognized as current income for the year ended December 31, 2015. Gain (loss) on valuation of derivatives for 1,405,014 thousand (Rs. 79,875 thousand) applied to financial asset at FVTPL is recognized as current income for the year ended December 31, 2015.
26. SELLING AND ADMINISTRATIVE EXPENSES:
(1) Selling expenses for the years ended December 31, 2015 and 2014, are as follows:
Korean won in thousands Indian rupee in thousands2015 2014 2015 2014
Warranty expenses 76,242,467 76,801,197 Rs. 4,334,384 Rs. 4,366,148Sales commissions 205,359,570 168,109,296 11,674,692 9,557,013Advertising expenses 17,723,231 17,436,678 1,007,566 991,275Export expenses 44,323,023 61,419,389 2,519,764 3,491,692Others 38,998,571 41,334,190 2,217,069 2,349,849
382,646,862 365,100,750 Rs. 21,753,475 Rs. 20,755,977
(2) Administrative expenses for the years ended December 31, 2015 and 2014, are as follows:
Korean won in thousands Indian rupee in thousands2015 2014 2015 2014
Salaries 50,145,756 48,163,279 Rs. 2,850,786 Rs. 2,738,082Postemployment benefits 7,649,820 6,892,145 434,892 391,818Employee benefits 11,661,024 12,725,732 662,929 723,458Rent expense 11,505,209 10,520,173 654,071 598,072Service fees 27,216,014 23,741,683 1,547,230 1,349,715Depreciation 11,569,270 7,365,553 657,713 418,732R&D expenses 15,830,768 19,898,965 899,979 1,131,256Amortization 7,181,333 6,806,289 408,259 386,938Bad debt expense (42,707) (121,532) (2,428) (6,909)Other administrative
expenses 31,763,473 32,968,037 1,805,754 1,874,233174,479,960 168,960,324 Rs. 9,919,185 Rs. 9,605,395
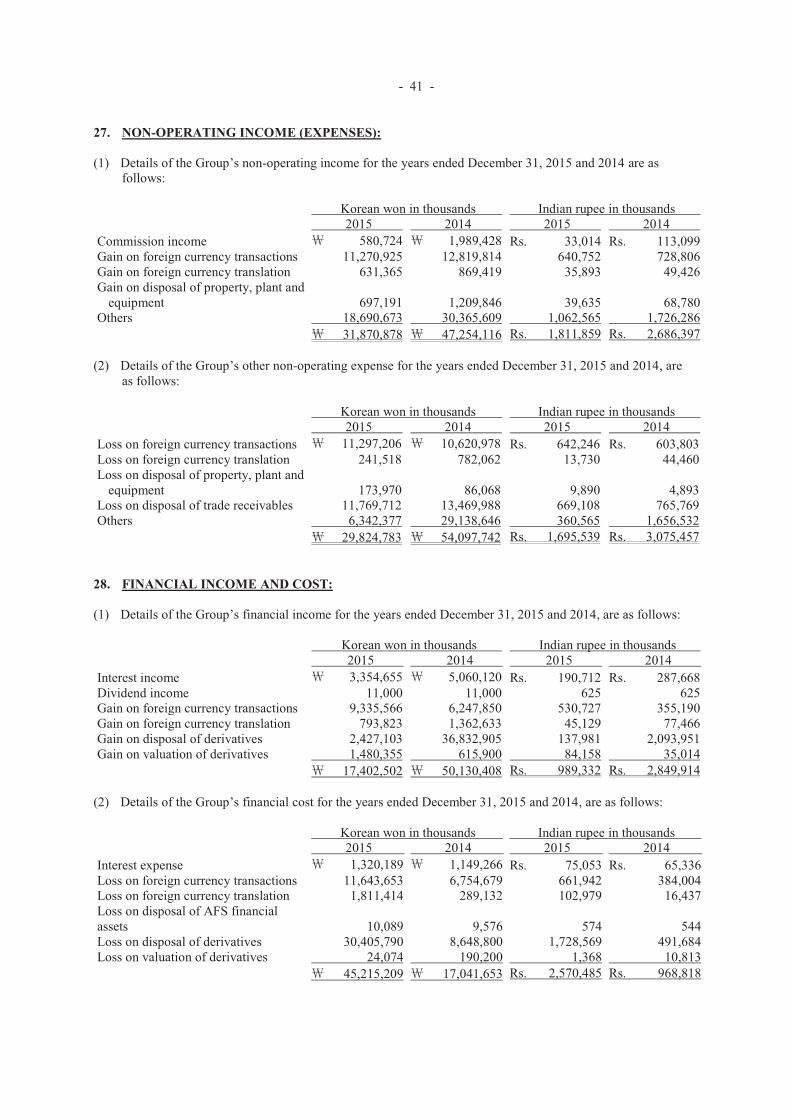
- 41 -
27. NON-OPERATING INCOME (EXPENSES):
(1) Details of the Group’s non-operating income for the years ended December 31, 2015 and 2014 are as follows:
Korean won in thousands Indian rupee in thousands2015 2014 2015 2014
Commission income 580,724 1,989,428 Rs. 33,014 Rs. 113,099Gain on foreign currency transactions 11,270,925 12,819,814 640,752 728,806Gain on foreign currency translation 631,365 869,419 35,893 49,426Gain on disposal of property, plant and
equipment 697,191 1,209,846 39,635 68,780Others 18,690,673 30,365,609 1,062,565 1,726,286
31,870,878 47,254,116 Rs. 1,811,859 Rs. 2,686,397
(2) Details of the Group’s other non-operating expense for the years ended December 31, 2015 and 2014, are as follows:
Korean won in thousands Indian rupee in thousands2015 2014 2015 2014
Loss on foreign currency transactions 11,297,206 10,620,978 Rs. 642,246 Rs. 603,803Loss on foreign currency translation 241,518 782,062 13,730 44,460Loss on disposal of property, plant and
equipment 173,970 86,068 9,890 4,893Loss on disposal of trade receivables 11,769,712 13,469,988 669,108 765,769Others 6,342,377 29,138,646 360,565 1,656,532
29,824,783 54,097,742 Rs. 1,695,539 Rs. 3,075,457
28. FINANCIAL INCOME AND COST:
(1) Details of the Group’s financial income for the years ended December 31, 2015 and 2014, are as follows:
Korean won in thousands Indian rupee in thousands2015 2014 2015 2014
Interest income 3,354,655 5,060,120 Rs. 190,712 Rs. 287,668Dividend income 11,000 11,000 625 625Gain on foreign currency transactions 9,335,566 6,247,850 530,727 355,190Gain on foreign currency translation 793,823 1,362,633 45,129 77,466Gain on disposal of derivatives 2,427,103 36,832,905 137,981 2,093,951Gain on valuation of derivatives 1,480,355 615,900 84,158 35,014
17,402,502 50,130,408 Rs. 989,332 Rs. 2,849,914
(2) Details of the Group’s financial cost for the years ended December 31, 2015 and 2014, are as follows:
Korean won in thousands Indian rupee in thousands2015 2014 2015 2014
Interest expense 1,320,189 1,149,266 Rs. 75,053 Rs. 65,336Loss on foreign currency transactions 11,643,653 6,754,679 661,942 384,004Loss on foreign currency translation 1,811,414 289,132 102,979 16,437Loss on disposal of AFS financial assets 10,089 9,576 574 544Loss on disposal of derivatives 30,405,790 8,648,800 1,728,569 491,684Loss on valuation of derivatives 24,074 190,200 1,368 10,813
45,215,209 17,041,653 Rs. 2,570,485 Rs. 968,818
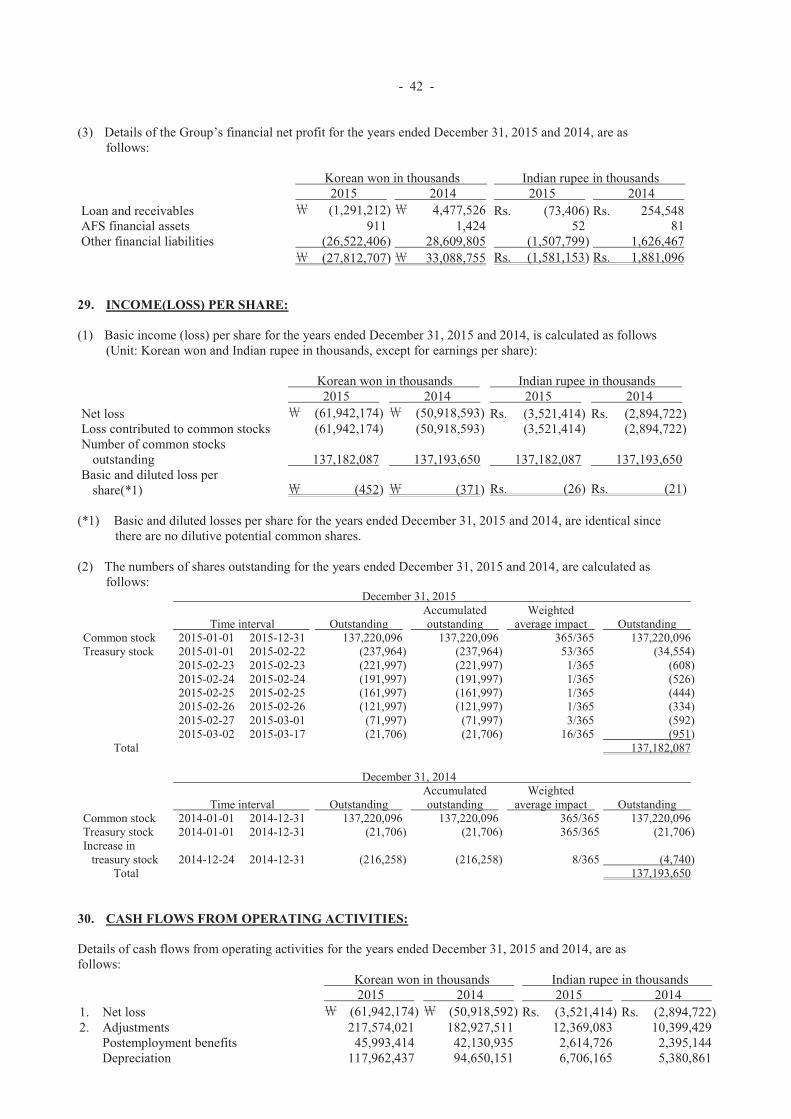
- 42 -
(3) Details of the Group’s financial net profit for the years ended December 31, 2015 and 2014, are as follows:
Korean won in thousands Indian rupee in thousands2015 2014 2015 2014
Loan and receivables (1,291,212) 4,477,526 Rs. (73,406) Rs. 254,548AFS financial assets 911 1,424 52 81Other financial liabilities (26,522,406) 28,609,805 (1,507,799) 1,626,467
(27,812,707) 33,088,755 Rs. (1,581,153) Rs. 1,881,096
29. INCOME(LOSS) PER SHARE:
(1) Basic income (loss) per share for the years ended December 31, 2015 and 2014, is calculated as follows (Unit: Korean won and Indian rupee in thousands, except for earnings per share):
Korean won in thousands Indian rupee in thousands2015 2014 2015 2014
Net loss (61,942,174) (50,918,593) Rs. (3,521,414) Rs. (2,894,722)Loss contributed to common stocks (61,942,174) (50,918,593) (3,521,414) (2,894,722)Number of common stocks
outstanding 137,182,087 137,193,650 137,182,087 137,193,650Basic and diluted loss per
share(*1) (452) (371) Rs. (26) Rs. (21)
(*1) Basic and diluted losses per share for the years ended December 31, 2015 and 2014, are identical since there are no dilutive potential common shares.
(2) The numbers of shares outstanding for the years ended December 31, 2015 and 2014, are calculated as follows:
December 31, 2015
Time interval OutstandingAccumulatedoutstanding
Weightedaverage impact Outstanding
Common stock 2015-01-01 2015-12-31 137,220,096 137,220,096 365/365 137,220,096Treasury stock 2015-01-01 2015-02-22 (237,964) (237,964) 53/365 (34,554)
2015-02-23 2015-02-23 (221,997) (221,997) 1/365 (608)2015-02-24 2015-02-24 (191,997) (191,997) 1/365 (526)2015-02-25 2015-02-25 (161,997) (161,997) 1/365 (444)2015-02-26 2015-02-26 (121,997) (121,997) 1/365 (334)2015-02-27 2015-03-01 (71,997) (71,997) 3/365 (592)2015-03-02 2015-03-17 (21,706) (21,706) 16/365 (951)
Total 137,182,087
December 31, 2014
Time interval OutstandingAccumulatedoutstanding
Weightedaverage impact Outstanding
Common stock 2014-01-01 2014-12-31 137,220,096 137,220,096 365/365 137,220,096Treasury stock 2014-01-01 2014-12-31 (21,706) (21,706) 365/365 (21,706)Increase in
treasury stock 2014-12-24 2014-12-31 (216,258) (216,258) 8/365 (4,740)Total 137,193,650
30. CASH FLOWS FROM OPERATING ACTIVITIES:
Details of cash flows from operating activities for the years ended December 31, 2015 and 2014, are as follows:
Korean won in thousands Indian rupee in thousands2015 2014 2015 2014
1. Net loss (61,942,174) (50,918,592) Rs. (3,521,414) Rs. (2,894,722)2. Adjustments 217,574,021 182,927,511 12,369,083 10,399,429
Postemployment benefits 45,993,414 42,130,935 2,614,726 2,395,144Depreciation 117,962,437 94,650,151 6,706,165 5,380,861
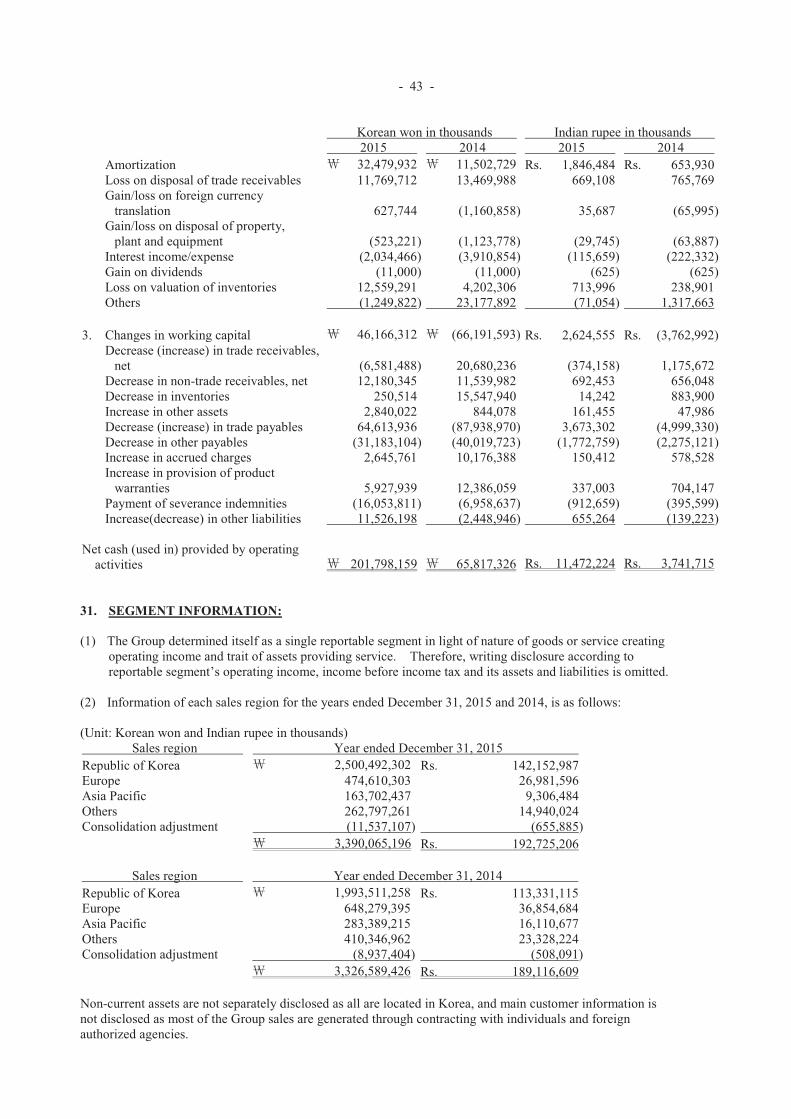
- 43 -
Korean won in thousands Indian rupee in thousands2015 2014 2015 2014
Amortization 32,479,932 11,502,729 Rs. 1,846,484 Rs. 653,930Loss on disposal of trade receivables 11,769,712 13,469,988 669,108 765,769Gain/loss on foreign currency
translation 627,744 (1,160,858) 35,687 (65,995)Gain/loss on disposal of property,
plant and equipment (523,221) (1,123,778) (29,745) (63,887)Interest income/expense (2,034,466) (3,910,854) (115,659) (222,332)Gain on dividends (11,000) (11,000) (625) (625)Loss on valuation of inventories 12,559,291 4,202,306 713,996 238,901Others (1,249,822) 23,177,892 (71,054) 1,317,663
3. Changes in working capital 46,166,312 (66,191,593) Rs. 2,624,555 Rs. (3,762,992)Decrease (increase) in trade receivables,
net (6,581,488) 20,680,236 (374,158) 1,175,672Decrease in non-trade receivables, net 12,180,345 11,539,982 692,453 656,048Decrease in inventories 250,514 15,547,940 14,242 883,900Increase in other assets 2,840,022 844,078 161,455 47,986Decrease (increase) in trade payables 64,613,936 (87,938,970) 3,673,302 (4,999,330)Decrease in other payables (31,183,104) (40,019,723) (1,772,759) (2,275,121)Increase in accrued charges 2,645,761 10,176,388 150,412 578,528Increase in provision of product
warranties 5,927,939 12,386,059 337,003 704,147Payment of severance indemnities (16,053,811) (6,958,637) (912,659) (395,599)Increase(decrease) in other liabilities 11,526,198 (2,448,946) 655,264 (139,223)
Net cash (used in) provided by operating activities 201,798,159 65,817,326 Rs. 11,472,224 Rs. 3,741,715
31. SEGMENT INFORMATION:
(1) The Group determined itself as a single reportable segment in light of nature of goods or service creating operating income and trait of assets providing service. Therefore, writing disclosure according to reportable segment’s operating income, income before income tax and its assets and liabilities is omitted.
(2) Information of each sales region for the years ended December 31, 2015 and 2014, is as follows:
(Unit: Korean won and Indian rupee in thousands) Sales region Year ended December 31, 2015
Republic of Korea 2,500,492,302 Rs. 142,152,987Europe 474,610,303 26,981,596Asia Pacific 163,702,437 9,306,484Others 262,797,261 14,940,024Consolidation adjustment (11,537,107) (655,885)
3,390,065,196 Rs. 192,725,206
Sales region Year ended December 31, 2014Republic of Korea 1,993,511,258 Rs. 113,331,115Europe 648,279,395 36,854,684Asia Pacific 283,389,215 16,110,677Others 410,346,962 23,328,224Consolidation adjustment (8,937,404) (508,091)
3,326,589,426 Rs. 189,116,609
Non-current assets are not separately disclosed as all are located in Korea, and main customer information is not disclosed as most of the Group sales are generated through contracting with individuals and foreign authorized agencies.
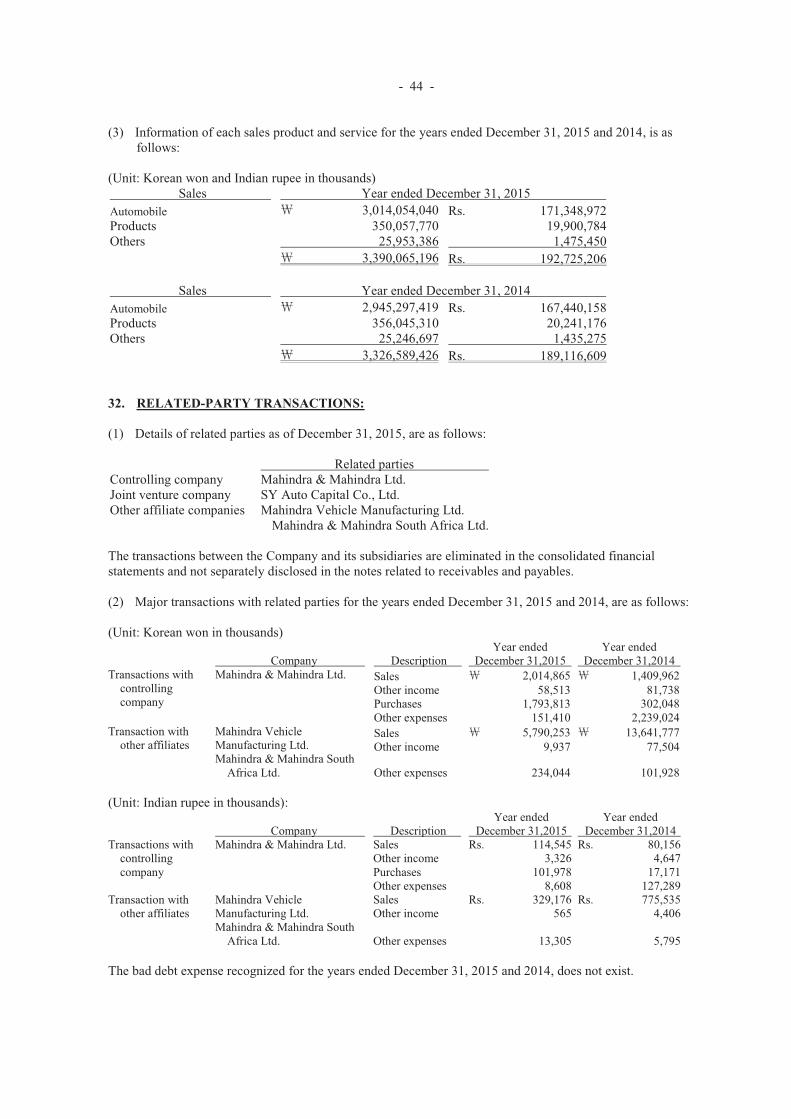
- 44 -
(3) Information of each sales product and service for the years ended December 31, 2015 and 2014, is as follows:
(Unit: Korean won and Indian rupee in thousands) Sales Year ended December 31, 2015
Automobile 3,014,054,040 Rs. 171,348,972Products 350,057,770 19,900,784Others 25,953,386 1,475,450
3,390,065,196 Rs. 192,725,206
Sales Year ended December 31, 2014Automobile 2,945,297,419 Rs. 167,440,158Products 356,045,310 20,241,176Others 25,246,697 1,435,275
3,326,589,426 Rs. 189,116,609
32. RELATED-PARTY TRANSACTIONS:
(1) Details of related parties as of December 31, 2015, are as follows:
Related partiesControlling company Mahindra & Mahindra Ltd.Joint venture company SY Auto Capital Co., Ltd.Other affiliate companies Mahindra Vehicle Manufacturing Ltd.
Mahindra & Mahindra South Africa Ltd.
The transactions between the Company and its subsidiaries are eliminated in the consolidated financial statements and not separately disclosed in the notes related to receivables and payables.
(2) Major transactions with related parties for the years ended December 31, 2015 and 2014, are as follows:
(Unit: Korean won in thousands)
Company DescriptionYear ended
December 31,2015Year ended
December 31,2014Transactions with
controllingcompany
Mahindra & Mahindra Ltd. Sales 2,014,865 1,409,962Other income 58,513 81,738Purchases 1,793,813 302,048Other expenses 151,410 2,239,024
Transaction withother affiliates
Mahindra Vehicle Manufacturing Ltd.Mahindra & Mahindra South
Africa Ltd.
Sales 5,790,253 13,641,777Other income 9,937 77,504
Other expenses 234,044 101,928
(Unit: Indian rupee in thousands):
Company DescriptionYear ended
December 31,2015Year ended
December 31,2014Transactions with
controllingcompany
Mahindra & Mahindra Ltd. Sales Rs. 114,545 Rs. 80,156Other income 3,326 4,647Purchases 101,978 17,171Other expenses 8,608 127,289
Transaction withother affiliates
Mahindra Vehicle Manufacturing Ltd.Mahindra & Mahindra South
Africa Ltd.
Sales Rs. 329,176 Rs. 775,535Other income 565 4,406
Other expenses 13,305 5,795
The bad debt expense recognized for the years ended December 31, 2015 and 2014, does not exist.
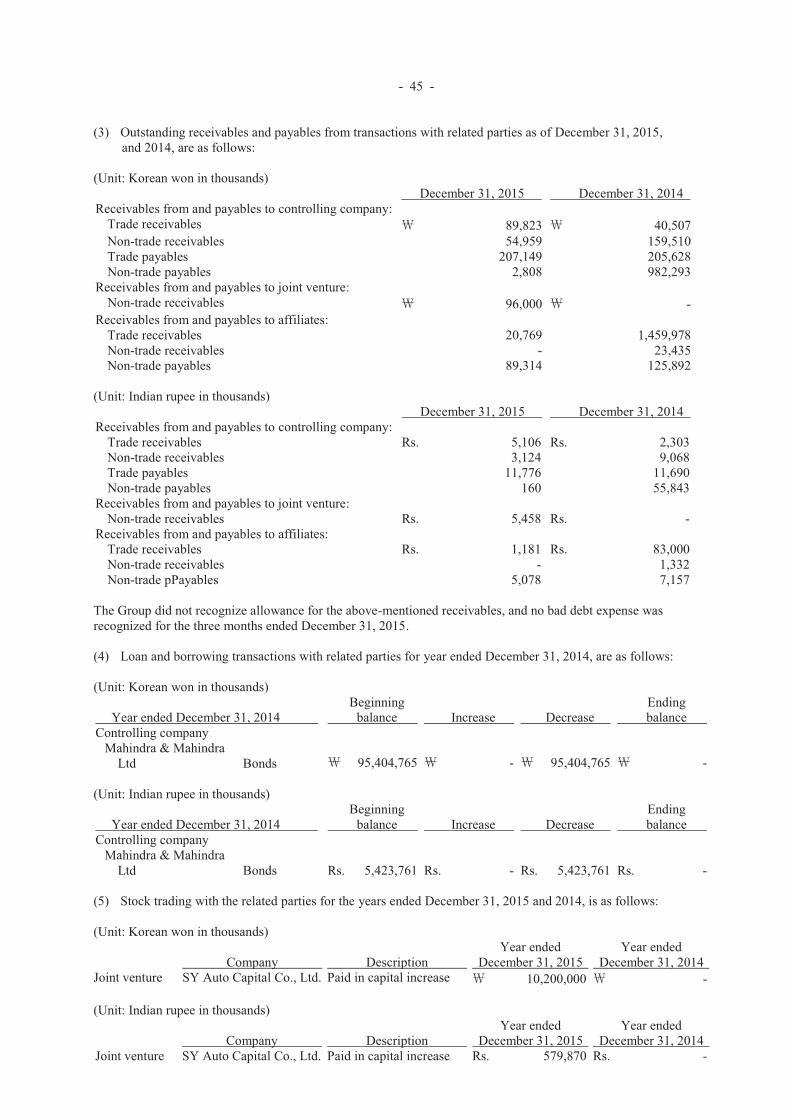
- 45 -
(3) Outstanding receivables and payables from transactions with related parties as of December 31, 2015,and 2014, are as follows:
(Unit: Korean won in thousands) December 31, 2015 December 31, 2014
Receivables from and payables to controlling company:Trade receivables 89,823 40,507Non-trade receivables 54,959 159,510Trade payables 207,149 205,628Non-trade payables 2,808 982,293
Receivables from and payables to joint venture:Non-trade receivables 96,000 -
Receivables from and payables to affiliates:Trade receivables 20,769 1,459,978Non-trade receivables - 23,435Non-trade payables 89,314 125,892
(Unit: Indian rupee in thousands) December 31, 2015 December 31, 2014
Receivables from and payables to controlling company:Trade receivables Rs. 5,106 Rs. 2,303Non-trade receivables 3,124 9,068Trade payables 11,776 11,690Non-trade payables 160 55,843
Receivables from and payables to joint venture:Non-trade receivables Rs. 5,458 Rs. -
Receivables from and payables to affiliates:Trade receivables Rs. 1,181 Rs. 83,000Non-trade receivables - 1,332Non-trade pPayables 5,078 7,157
The Group did not recognize allowance for the above-mentioned receivables, and no bad debt expense was recognized for the three months ended December 31, 2015.
(4) Loan and borrowing transactions with related parties for year ended December 31, 2014, are as follows:
(Unit: Korean won in thousands)
Year ended December 31, 2014Beginning
balance Increase DecreaseEndingbalance
Controlling companyMahindra & Mahindra
Ltd Bonds 95,404,765 - 95,404,765 -
(Unit: Indian rupee in thousands)
Year ended December 31, 2014Beginning
balance Increase DecreaseEndingbalance
Controlling companyMahindra & Mahindra
Ltd Bonds Rs. 5,423,761 Rs. - Rs. 5,423,761 Rs. -
(5) Stock trading with the related parties for the years ended December 31, 2015 and 2014, is as follows:
(Unit: Korean won in thousands)
Company DescriptionYear ended
December 31, 2015Year ended
December 31, 2014Joint venture SY Auto Capital Co., Ltd. Paid in capital increase 10,200,000 -
(Unit: Indian rupee in thousands)
Company DescriptionYear ended
December 31, 2015Year ended
December 31, 2014Joint venture SY Auto Capital Co., Ltd. Paid in capital increase Rs. 579,870 Rs. -
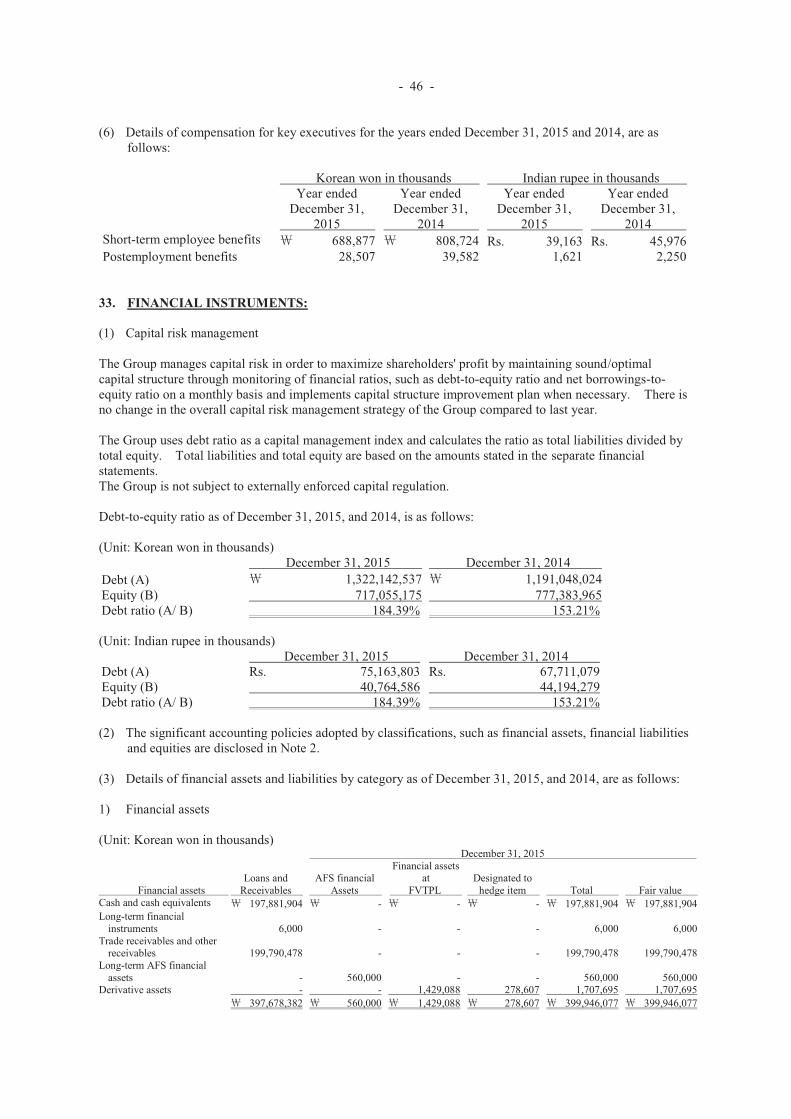
- 46 -
(6) Details of compensation for key executives for the years ended December 31, 2015 and 2014, are as follows:
Korean won in thousands Indian rupee in thousandsYear ended
December 31, 2015
Year ended December 31,
2014
Year ended December 31,
2015
Year ended December 31,
2014Short-term employee benefits 688,877 808,724 Rs. 39,163 Rs. 45,976Postemployment benefits 28,507 39,582 1,621 2,250
33. FINANCIAL INSTRUMENTS:
(1) Capital risk management
The Group manages capital risk in order to maximize shareholders' profit by maintaining sound/optimal capital structure through monitoring of financial ratios, such as debt-to-equity ratio and net borrowings-to-equity ratio on a monthly basis and implements capital structure improvement plan when necessary. There is no change in the overall capital risk management strategy of the Group compared to last year.
The Group uses debt ratio as a capital management index and calculates the ratio as total liabilities divided by total equity. Total liabilities and total equity are based on the amounts stated in the separate financial statements. The Group is not subject to externally enforced capital regulation.
Debt-to-equity ratio as of December 31, 2015, and 2014, is as follows:
(Unit: Korean won in thousands) December 31, 2015 December 31, 2014
Debt (A) 1,322,142,537 1,191,048,024Equity (B) 717,055,175 777,383,965Debt ratio (A/ B) 184.39% 153.21%
(Unit: Indian rupee in thousands) December 31, 2015 December 31, 2014
Debt (A) Rs. 75,163,803 Rs. 67,711,079Equity (B) 40,764,586 44,194,279Debt ratio (A/ B) 184.39% 153.21%
(2) The significant accounting policies adopted by classifications, such as financial assets, financial liabilities and equities are disclosed in Note 2.
(3) Details of financial assets and liabilities by category as of December 31, 2015, and 2014, are as follows:
1) Financial assets
(Unit: Korean won in thousands) December 31, 2015
Financial assetsLoans and
ReceivablesAFS financial
Assets
Financial assets at
FVTPLDesignated to
hedge item Total Fair valueCash and cash equivalents 197,881,904 - - - 197,881,904 197,881,904Long-term financial
instruments 6,000 - - - 6,000 6,000Trade receivables and other
receivables 199,790,478 - - - 199,790,478 199,790,478Long-term AFS financial
assets - 560,000 - - 560,000 560,000Derivative assets - - 1,429,088 278,607 1,707,695 1,707,695
397,678,382 560,000 1,429,088 278,607 399,946,077 399,946,077
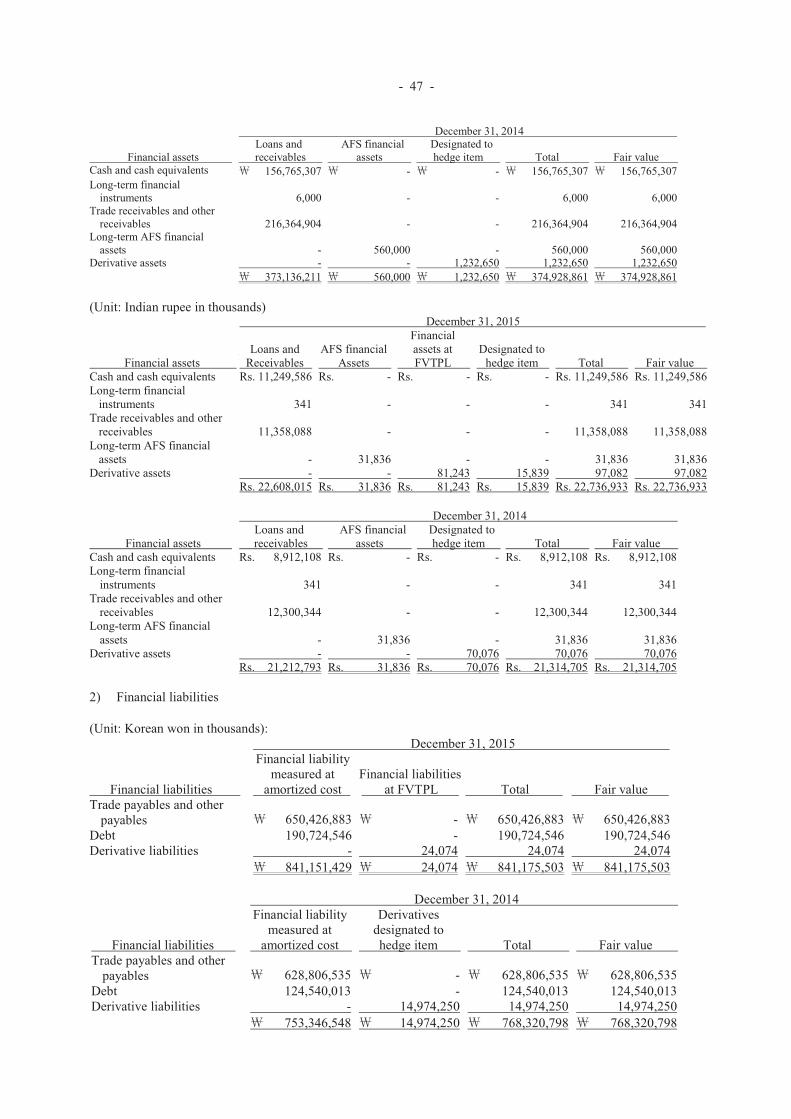
- 47 -
December 31, 2014
Financial assetsLoans andreceivables
AFS financialassets
Designated tohedge item Total Fair value
Cash and cash equivalents 156,765,307 - - 156,765,307 156,765,307Long-term financial
instruments 6,000 - - 6,000 6,000Trade receivables and other
receivables 216,364,904 - - 216,364,904 216,364,904Long-term AFS financial
assets - 560,000 - 560,000 560,000Derivative assets - - 1,232,650 1,232,650 1,232,650
373,136,211 560,000 1,232,650 374,928,861 374,928,861
(Unit: Indian rupee in thousands) December 31, 2015
Financial assetsLoans and
ReceivablesAFS financial
Assets
Financial assets atFVTPL
Designated tohedge item Total Fair value
Cash and cash equivalents Rs. 11,249,586 Rs. - Rs. - Rs. - Rs. 11,249,586 Rs. 11,249,586Long-term financial
instruments 341 - - - 341 341Trade receivables and other
receivables 11,358,088 - - - 11,358,088 11,358,088Long-term AFS financial
assets - 31,836 - - 31,836 31,836Derivative assets - - 81,243 15,839 97,082 97,082
Rs. 22,608,015 Rs. 31,836 Rs. 81,243 Rs. 15,839 Rs. 22,736,933 Rs. 22,736,933
December 31, 2014
Financial assetsLoans andreceivables
AFS financialassets
Designated tohedge item Total Fair value
Cash and cash equivalents Rs. 8,912,108 Rs. - Rs. - Rs. 8,912,108 Rs. 8,912,108Long-term financial
instruments 341 - - 341 341Trade receivables and other
receivables 12,300,344 - - 12,300,344 12,300,344Long-term AFS financial
assets - 31,836 - 31,836 31,836Derivative assets - - 70,076 70,076 70,076
Rs. 21,212,793 Rs. 31,836 Rs. 70,076 Rs. 21,314,705 Rs. 21,314,705
2) Financial liabilities
(Unit: Korean won in thousands): December 31, 2015
Financial liabilities
Financial liability measured at
amortized costFinancial liabilities
at FVTPL Total Fair valueTrade payables and other
payables 650,426,883 - 650,426,883 650,426,883Debt 190,724,546 - 190,724,546 190,724,546Derivative liabilities - 24,074 24,074 24,074
841,151,429 24,074 841,175,503 841,175,503
December 31, 2014
Financial liabilities
Financial liability measured at
amortized cost
Derivatives designated to hedge item Total Fair value
Trade payables and other payables 628,806,535 - 628,806,535 628,806,535
Debt 124,540,013 - 124,540,013 124,540,013Derivative liabilities - 14,974,250 14,974,250 14,974,250
753,346,548 14,974,250 768,320,798 768,320,798
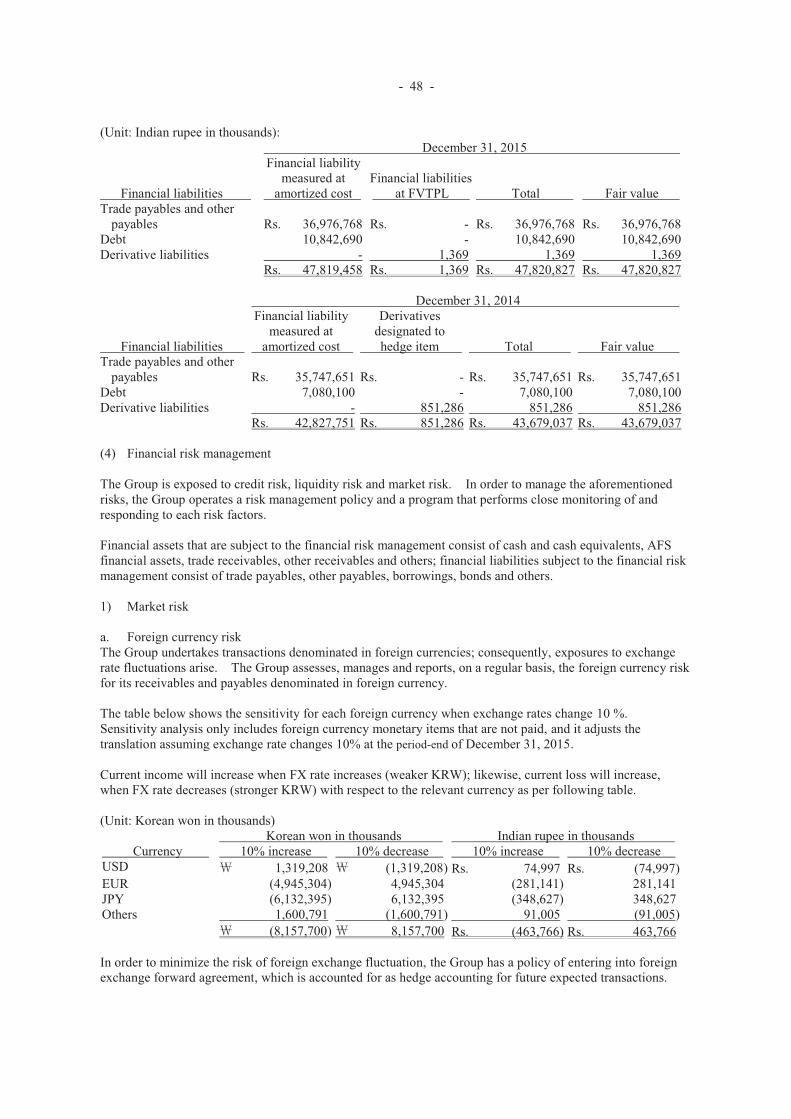
- 48 -
(Unit: Indian rupee in thousands): December 31, 2015
Financial liabilities
Financial liability measured at
amortized costFinancial liabilities
at FVTPL Total Fair valueTrade payables and other
payables Rs. 36,976,768 Rs. - Rs. 36,976,768 Rs. 36,976,768Debt 10,842,690 - 10,842,690 10,842,690Derivative liabilities - 1,369 1,369 1,369
Rs. 47,819,458 Rs. 1,369 Rs. 47,820,827 Rs. 47,820,827
December 31, 2014
Financial liabilities
Financial liability measured at
amortized cost
Derivatives designated to hedge item Total Fair value
Trade payables and other payables Rs. 35,747,651 Rs. - Rs. 35,747,651 Rs. 35,747,651
Debt 7,080,100 - 7,080,100 7,080,100Derivative liabilities - 851,286 851,286 851,286
Rs. 42,827,751 Rs. 851,286 Rs. 43,679,037 Rs. 43,679,037
(4) Financial risk management
The Group is exposed to credit risk, liquidity risk and market risk. In order to manage the aforementioned risks, the Group operates a risk management policy and a program that performs close monitoring of and responding to each risk factors.
Financial assets that are subject to the financial risk management consist of cash and cash equivalents, AFS financial assets, trade receivables, other receivables and others; financial liabilities subject to the financial risk management consist of trade payables, other payables, borrowings, bonds and others.
1) Market risk
a. Foreign currency risk The Group undertakes transactions denominated in foreign currencies; consequently, exposures to exchange rate fluctuations arise. The Group assesses, manages and reports, on a regular basis, the foreign currency risk for its receivables and payables denominated in foreign currency.
The table below shows the sensitivity for each foreign currency when exchange rates change 10 %. Sensitivity analysis only includes foreign currency monetary items that are not paid, and it adjusts the translation assuming exchange rate changes 10% at the period-end of December 31, 2015.
Current income will increase when FX rate increases (weaker KRW); likewise, current loss will increase, when FX rate decreases (stronger KRW) with respect to the relevant currency as per following table.
(Unit: Korean won in thousands) Korean won in thousands Indian rupee in thousands
Currency 10% increase 10% decrease 10% increase 10% decreaseUSD 1,319,208 (1,319,208) Rs. 74,997 Rs. (74,997)EUR (4,945,304) 4,945,304 (281,141) 281,141JPY (6,132,395) 6,132,395 (348,627) 348,627Others 1,600,791 (1,600,791) 91,005 (91,005)
(8,157,700) 8,157,700 Rs. (463,766) Rs. 463,766
In order to minimize the risk of foreign exchange fluctuation, the Group has a policy of entering into foreign exchange forward agreement, which is accounted for as hedge accounting for future expected transactions.
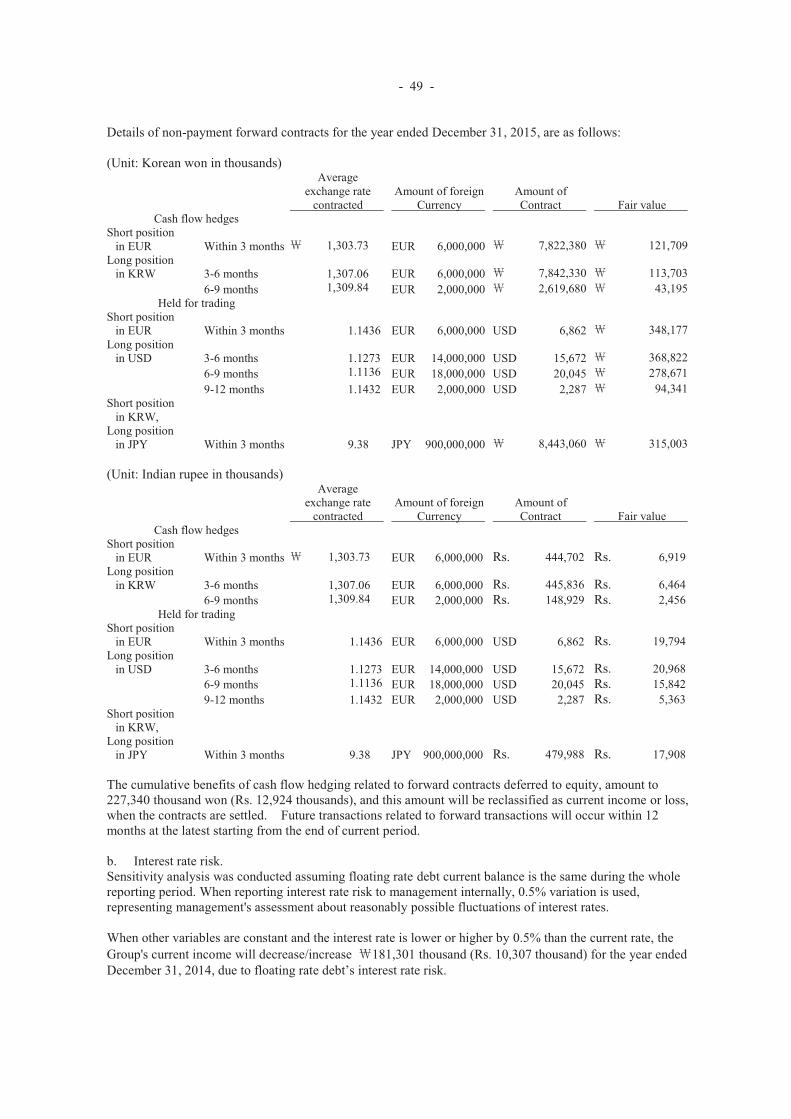
- 49 -
Details of non-payment forward contracts for the year ended December 31, 2015, are as follows:
(Unit: Korean won in thousands) Average
exchange ratecontracted
Amount of foreignCurrency
Amount ofContract Fair value
Cash flow hedgesShort position
in EUR Within 3 months 1,303.73 EUR 6,000,000 7,822,380 121,709Long position
in KRW 3-6 months 1,307.06 EUR 6,000,000 7,842,330 113,7036-9 months 1,309.84 EUR 2,000,000 2,619,680 43,195
Held for tradingShort position
in EUR Within 3 months 1.1436 EUR 6,000,000 USD 6,862 348,177Long position
in USD 3-6 months 1.1273 EUR 14,000,000 USD 15,672 368,8226-9 months 1.1136 EUR 18,000,000 USD 20,045 278,6719-12 months 1.1432 EUR 2,000,000 USD 2,287 94,341
Short position in KRW,
Long position in JPY Within 3 months 9.38 JPY 900,000,000 8,443,060 315,003
(Unit: Indian rupee in thousands) Average
exchange ratecontracted
Amount of foreignCurrency
Amount ofContract Fair value
Cash flow hedgesShort position
in EUR Within 3 months 1,303.73 EUR 6,000,000 Rs. 444,702 Rs. 6,919Long position
in KRW 3-6 months 1,307.06 EUR 6,000,000 Rs. 445,836 Rs. 6,4646-9 months 1,309.84 EUR 2,000,000 Rs. 148,929 Rs. 2,456
Held for tradingShort position
in EUR Within 3 months 1.1436 EUR 6,000,000 USD 6,862 Rs. 19,794Long position
in USD 3-6 months 1.1273 EUR 14,000,000 USD 15,672 Rs. 20,9686-9 months 1.1136 EUR 18,000,000 USD 20,045 Rs. 15,8429-12 months 1.1432 EUR 2,000,000 USD 2,287 Rs. 5,363
Short position in KRW,
Long position in JPY Within 3 months 9.38 JPY 900,000,000 Rs. 479,988 Rs. 17,908
The cumulative benefits of cash flow hedging related to forward contracts deferred to equity, amount to 227,340 thousand won (Rs. 12,924 thousands), and this amount will be reclassified as current income or loss,when the contracts are settled. Future transactions related to forward transactions will occur within 12months at the latest starting from the end of current period.
b. Interest rate risk. Sensitivity analysis was conducted assuming floating rate debt current balance is the same during the whole reporting period. When reporting interest rate risk to management internally, 0.5% variation is used, representing management's assessment about reasonably possible fluctuations of interest rates.
When other variables are constant and the interest rate is lower or higher by 0.5% than the current rate, the Group's current income will decrease/increase 181,301 thousand (Rs. 10,307 thousand) for the year ended December 31, 2014, due to floating rate debt’s interest rate risk.
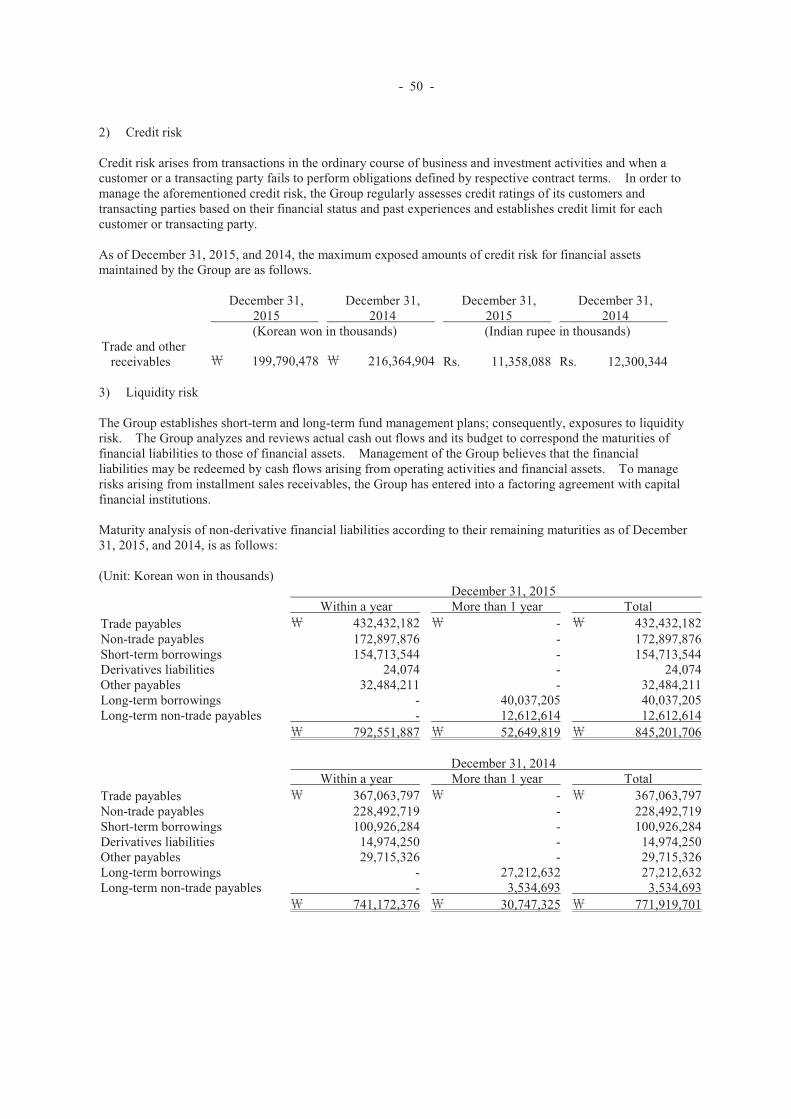
- 50 -
2) Credit risk
Credit risk arises from transactions in the ordinary course of business and investment activities and when a customer or a transacting party fails to perform obligations defined by respective contract terms. In order to manage the aforementioned credit risk, the Group regularly assesses credit ratings of its customers and transacting parties based on their financial status and past experiences and establishes credit limit for each customer or transacting party.
As of December 31, 2015, and 2014, the maximum exposed amounts of credit risk for financial assets maintained by the Group are as follows.
December 31, 2015
December 31,2014
December 31, 2015
December 31,2014
(Korean won in thousands) (Indian rupee in thousands)Trade and other
receivables 199,790,478 216,364,904 Rs. 11,358,088 Rs. 12,300,344
3) Liquidity risk
The Group establishes short-term and long-term fund management plans; consequently, exposures to liquidity risk. The Group analyzes and reviews actual cash out flows and its budget to correspond the maturities of financial liabilities to those of financial assets. Management of the Group believes that the financial liabilities may be redeemed by cash flows arising from operating activities and financial assets. To manage risks arising from installment sales receivables, the Group has entered into a factoring agreement with capital financial institutions.
Maturity analysis of non-derivative financial liabilities according to their remaining maturities as of December 31, 2015, and 2014, is as follows:
(Unit: Korean won in thousands) December 31, 2015
Within a year More than 1 year TotalTrade payables 432,432,182 - 432,432,182Non-trade payables 172,897,876 - 172,897,876Short-term borrowings 154,713,544 - 154,713,544Derivatives liabilities 24,074 - 24,074Other payables 32,484,211 - 32,484,211Long-term borrowings - 40,037,205 40,037,205Long-term non-trade payables - 12,612,614 12,612,614
792,551,887 52,649,819 845,201,706
December 31, 2014Within a year More than 1 year Total
Trade payables 367,063,797 - 367,063,797Non-trade payables 228,492,719 - 228,492,719Short-term borrowings 100,926,284 - 100,926,284Derivatives liabilities 14,974,250 - 14,974,250Other payables 29,715,326 - 29,715,326Long-term borrowings - 27,212,632 27,212,632Long-term non-trade payables - 3,534,693 3,534,693
741,172,376 30,747,325 771,919,701
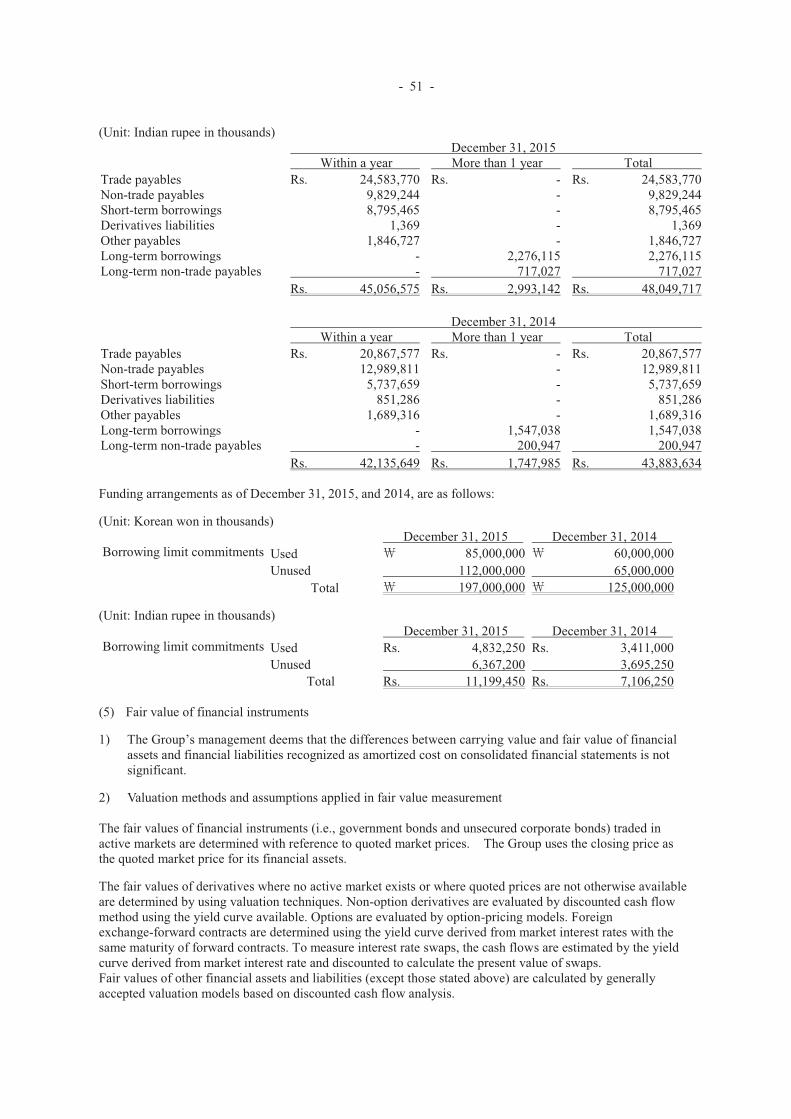
- 51 -
(Unit: Indian rupee in thousands) December 31, 2015
Within a year More than 1 year TotalTrade payables Rs. 24,583,770 Rs. - Rs. 24,583,770Non-trade payables 9,829,244 - 9,829,244Short-term borrowings 8,795,465 - 8,795,465Derivatives liabilities 1,369 - 1,369Other payables 1,846,727 - 1,846,727Long-term borrowings - 2,276,115 2,276,115Long-term non-trade payables - 717,027 717,027
Rs. 45,056,575 Rs. 2,993,142 Rs. 48,049,717
December 31, 2014Within a year More than 1 year Total
Trade payables Rs. 20,867,577 Rs. - Rs. 20,867,577Non-trade payables 12,989,811 - 12,989,811Short-term borrowings 5,737,659 - 5,737,659Derivatives liabilities 851,286 - 851,286Other payables 1,689,316 - 1,689,316Long-term borrowings - 1,547,038 1,547,038Long-term non-trade payables - 200,947 200,947
Rs. 42,135,649 Rs. 1,747,985 Rs. 43,883,634
Funding arrangements as of December 31, 2015, and 2014, are as follows:
(Unit: Korean won in thousands) December 31, 2015 December 31, 2014
Borrowing limit commitments Used 85,000,000 60,000,000Unused 112,000,000 65,000,000
Total 197,000,000 125,000,000
(Unit: Indian rupee in thousands) December 31, 2015 December 31, 2014
Borrowing limit commitments Used Rs. 4,832,250 Rs. 3,411,000Unused 6,367,200 3,695,250
Total Rs. 11,199,450 Rs. 7,106,250
(5) Fair value of financial instruments
1) The Group’s management deems that the differences between carrying value and fair value of financial assets and financial liabilities recognized as amortized cost on consolidated financial statements is not significant.
2) Valuation methods and assumptions applied in fair value measurement
The fair values of financial instruments (i.e., government bonds and unsecured corporate bonds) traded inactive markets are determined with reference to quoted market prices. The Group uses the closing price as the quoted market price for its financial assets.
The fair values of derivatives where no active market exists or where quoted prices are not otherwise available are determined by using valuation techniques. Non-option derivatives are evaluated by discounted cash flow method using the yield curve available. Options are evaluated by option-pricing models. Foreign exchange-forward contracts are determined using the yield curve derived from market interest rates with the same maturity of forward contracts. To measure interest rate swaps, the cash flows are estimated by the yield curve derived from market interest rate and discounted to calculate the present value of swaps. Fair values of other financial assets and liabilities (except those stated above) are calculated by generally accepted valuation models based on discounted cash flow analysis.
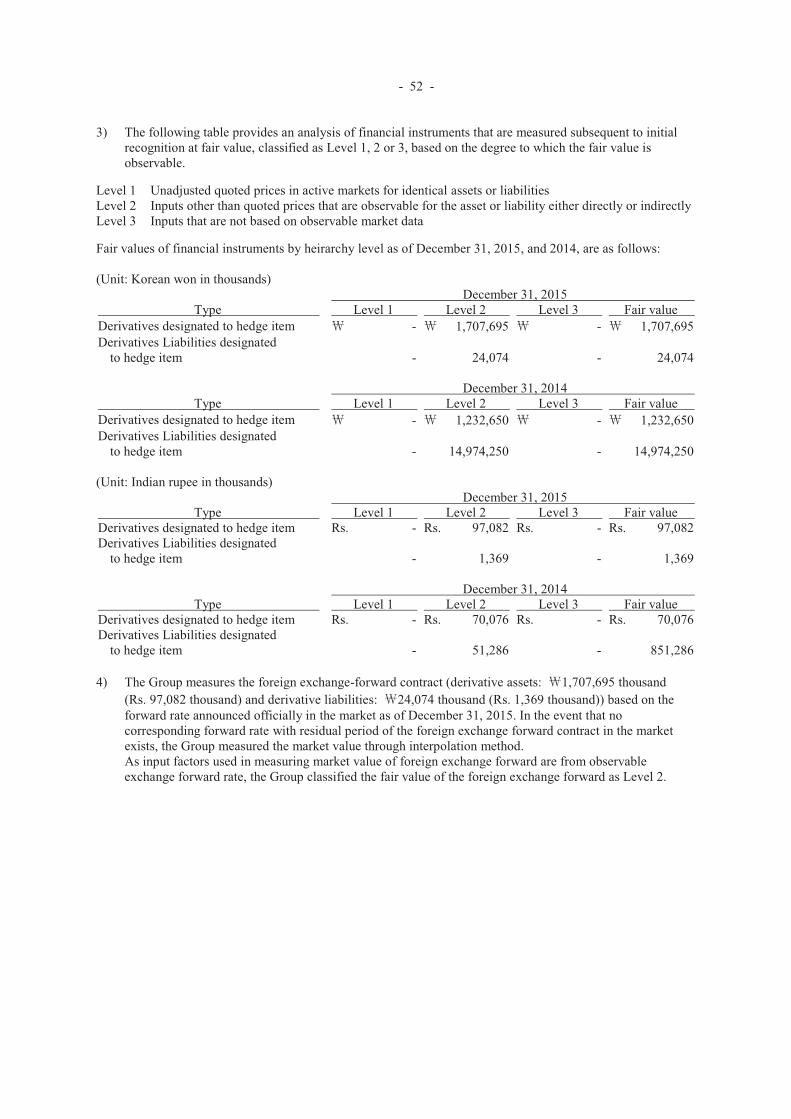
- 52 -
3) The following table provides an analysis of financial instruments that are measured subsequent to initial recognition at fair value, classified as Level 1, 2 or 3, based on the degree to which the fair value is observable.
Level 1 Unadjusted quoted prices in active markets for identical assets or liabilitiesLevel 2 Inputs other than quoted prices that are observable for the asset or liability either directly or indirectlyLevel 3 Inputs that are not based on observable market data
Fair values of financial instruments by heirarchy level as of December 31, 2015, and 2014, are as follows:
(Unit: Korean won in thousands) December 31, 2015
Type Level 1 Level 2 Level 3 Fair valueDerivatives designated to hedge item - 1,707,695 - 1,707,695Derivatives Liabilities designated
to hedge item - 24,074 - 24,074
December 31, 2014Type Level 1 Level 2 Level 3 Fair value
Derivatives designated to hedge item - 1,232,650 - 1,232,650Derivatives Liabilities designated
to hedge item - 14,974,250 - 14,974,250
(Unit: Indian rupee in thousands) December 31, 2015
Type Level 1 Level 2 Level 3 Fair valueDerivatives designated to hedge item Rs. - Rs. 97,082 Rs. - Rs. 97,082Derivatives Liabilities designated
to hedge item - 1,369 - 1,369
December 31, 2014Type Level 1 Level 2 Level 3 Fair value
Derivatives designated to hedge item Rs. - Rs. 70,076 Rs. - Rs. 70,076Derivatives Liabilities designated
to hedge item - 51,286 - 851,286
4) The Group measures the foreign exchange-forward contract (derivative assets: 1,707,695 thousand(Rs. 97,082 thousand) and derivative liabilities: 24,074 thousand (Rs. 1,369 thousand)) based on the forward rate announced officially in the market as of December 31, 2015. In the event that no corresponding forward rate with residual period of the foreign exchange forward contract in the marketexists, the Group measured the market value through interpolation method.As input factors used in measuring market value of foreign exchange forward are from observable exchange forward rate, the Group classified the fair value of the foreign exchange forward as Level 2.


