Embed Size (px)
Citation preview
A LONG TERM EVALUATION OF THE CUR\rE OF SPEESTABILITY FOLLOWING ORTHODONTIC LEVELING
IAIN WILLIAM MELDRT]M
B.Sc., D.D.S.
A dissertation submitted in partial fulfillment of the requirements for the degree of
Master of Science (lM.Sc.)
in the
Division of Orthodontics,
Department of Preventative Dental Science
Faculty of Dentistry
of the
University of Manitoba
\ilinnipeg, Manitoba
@Copyright (2004)
TIIE fINTVERSITY OF' MANITOBA
FACIILTY OF' GÌ,ADUATE STIIDIES
COPYRIGHT PERMISSION PAGE
A Long Term Evaluation of the Curve of Spee Stability Foilowing Orthodontic Leveling
BY
Iain William Meldrum
A ThesislPracticum submitted to the Faculty of Graduate Studies of The University
of Manitoba in partial fulfillment of the requirements of the degree
of
MASTER OF SCMNCE
IAIN WILLIAM MELDRUM @2004
Permission has been granted to the Library of The University of Manitoba to lend or sell copiesof this thesis/practicum, to the National Library of Canada to microfilm this thesis and to lendor sell copies of the film, and to University Microfilm Inc. to publish an abstract of thisthesis/practicum.
The author reserves other publication rights, and neither this thesis/practicum nor extensiveextracts from it may be printed or otherwise reproduced without the author's wriftenpermission.
ABSTRACT
The objectives of this study were to establish whether there is an association between pre-
treatment facial morphology and initial magnitude of the curve of Spee and to determine
whether vertical lacial morphology influences curve of Spee relapse. This retrospective
cephalometric study consisted of analyzing the records of 44 Angle Class I and II
subjects obtained from the archives of a University Graduate Orthodontic Clinic. To be
included in the study subjects had to be treated non-extraction with full fixed edgewise
appliances. Subjects required complete pre-treatment, post-treatment and minimum five
years post-retention cephalometric and plaster model records. Patients were grouped
according to vertical facial type based on five cephalometric measurements. Nine
brachycephalic, 10 dolicocephalic and 25 mesocephalic facial types were identified using
the defined parameters. Plaster study models corresponding to pre-treatment, post-
treatment and a minimum of five years post-treatment were reproducibly photographed
using a digital camera. Calibrated curve of Spee measurements were obtained for each
time point and compared statistically. No significant differences were found in pre-
treatment curve of Spee depth between male and female subjects and right and left sides.
The brachycephalic facial type demonstrated an increased initial curve of Spee depth;
however the difference was not statistically significant. The hypodivergent phenotype
was shown to exhibit a higher probability of re-establishing the initial curve of Spee
following orthodontic leveling compared to other vertical facial types. (p<0.05)
Orthodontic treatment biomechanics can successfully level the curve of Spee in all three
vertical facial types. The magnitude of the pre-treatment curve of Spee depth does not
seem to be associated with specific vertical facial pattems. Great variability exists for
111
pre-treatment curve of Spee depth in all facial types. The hypodivergent facial type
seems to demonstrate a statistically significant increase in post-treatment relapse (p<0.05)
compared to other vertical facial types; although, the clinical significance of this
association is uncerlain.
iv
ACKNOWLEDGEMENTS
My sincere thanks and appreciation to:
. My committee members, Dr. W. A. Wiltshire, Dr. C.L.B. Lavelle and Dr. A.
Baker for their invaluable advice and direction
o Dr. T. Hassard and Dr. M. Cheang for their expertise and guidance with the
statistical analysis
. My classmates, Dr. Brent Douglas and Dr. Dan Stuart for making my educational
experience a great one
o My parents for not stopping after two children
. My wife Pam and daughter Emily for ñlling my life with happiness

TITLE PAGE
COMMITTEE CERTIFICATION
ABSTRACT
ACKNOWLEDGEMENTS
CONTENTS
LIST OF FIGURES
LIST OF TABLES
CHAPTER 1
INTRODUCTIOI\
1.1 Foreword
1.2 Definitions
1.2.1
1.2.2
1.2.3
1.2.4
CONTENTS
Leveling
Curve of Spee
Y-Axis
Mandibular Plane to Sella-Nasion
Angle (MP-SN)
Palatal Plane to Mandibular Plane
Page Number
t
ii
tIl
Ív
Y-viii
ix-x
xi
VI
1.2.s
1.3
t.4
1.5
Angle (PP-MP)
1.2.6 Ratio of PFH to AFH (PFH:AFH) 6
1.2.7 Ratio of UAFH to LAFH (UAFH:LAFH) 7
Signifïcance of the Problem 9-10
Purpose of the Study 11
Null Hypotheses 12
CHAPTER 2
LITERATURE REVIEW
CHAPTER 3
MATERIALS AND METHODS
2.7 What is the curve of Spee?
2.2 Measurement of the Curve of Spee
2.3 The Correlation between Arch Length
and Curve of Spee
t4-17
t7-19
19-22
23-24
25-27
27-28
30-33
34-35
3s-36
2.4
2.4
Leveling of the Curve of Spee through Orthodontics
Curve of Spee Relapse Following
Orthodontic Treatment
2.6 Classification of Vertical Growth
3.1
3.2
Sample Selection
Curve of Spee Measurement
3.2,1 LinearMeasurement
VII
3.2.2 Area Measurement
CHAPTER 4
STATISICAL ANALYSIS
4.1 Investigator Error
4.2 Statistical AnalysÍs
CHAPTER 5
RESULTS
5.1
<.,
5.3
5.4
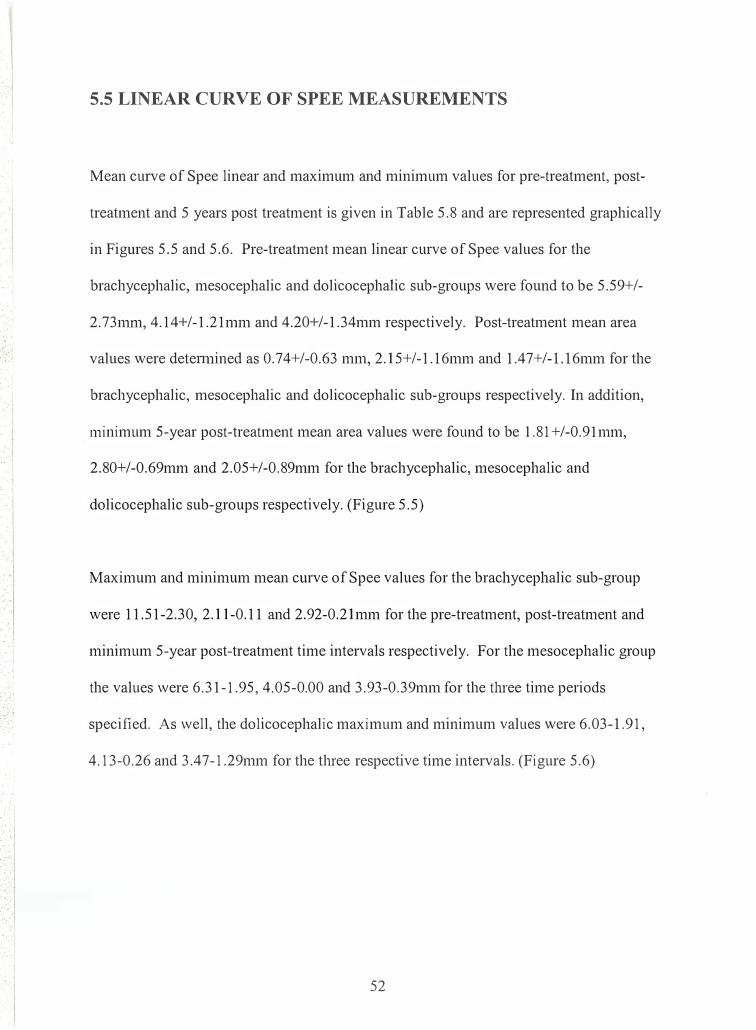
5.5
5.õ
CHAPTER 6
DISCUSSION
6.1 Overview
6.2 Curve of Spee Measurement
6.3 Sample Selection
6.4 Sex distribution
Calibration
Vertical ClassifÏcation
Comparison of curve of Spee right and left sides
Area curve of Spee measurements
Linear curve of Spee measurements
Curve of Spee changes
36-37
39
39-40
42-44
45-48
48-49
49-51
52-54
54-s8
60
60-61
62-64
64
vl11
Õ5fr.5 Comparison of Left and Right Side Curve
of Spee Measurements
Facial Type and Initial Curve of Spee Depth
Curve of Spee Relapse
Curve of Spee Relapse and Arch Perimeter
Null hypotheses deductions
6.6
6.7
6.8
6.9
65-67
67-69
70
7t
73-74
75
76-84
CHAPTER 7
STUDY LIMITATIONS AND CONCLUSIO]\S
7.1 Study Limitations
7.2 Conclusions
REFERENCES
1X
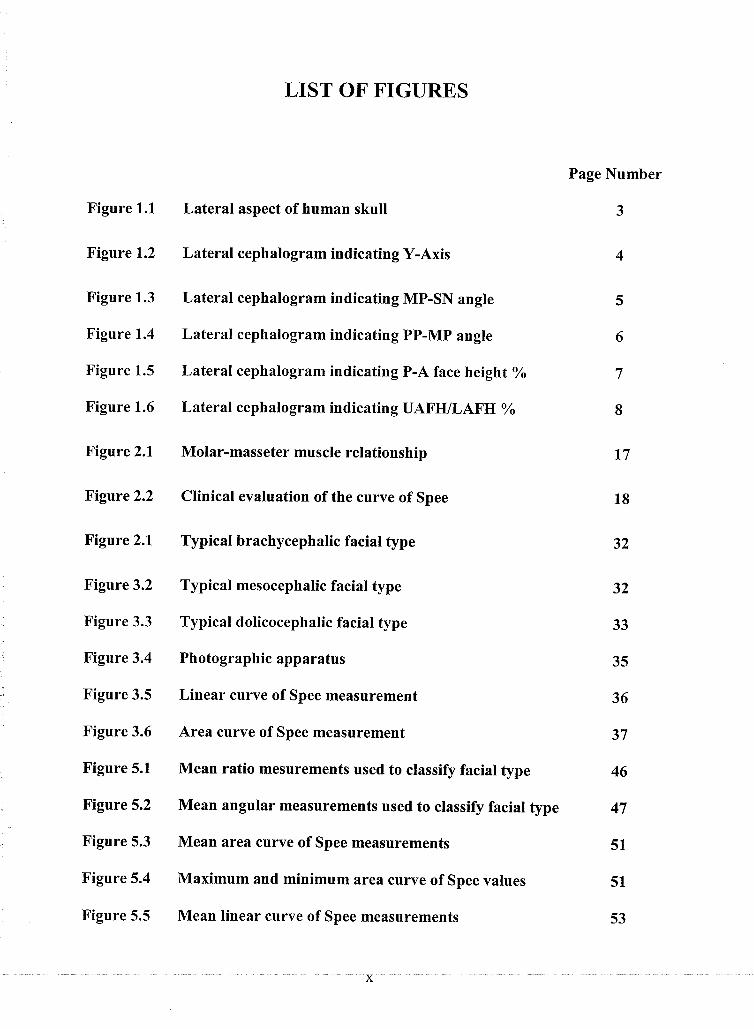
Figure 1.1
Figure 1.2
Figure 1.3
Figure 1.4
Figure 1.5
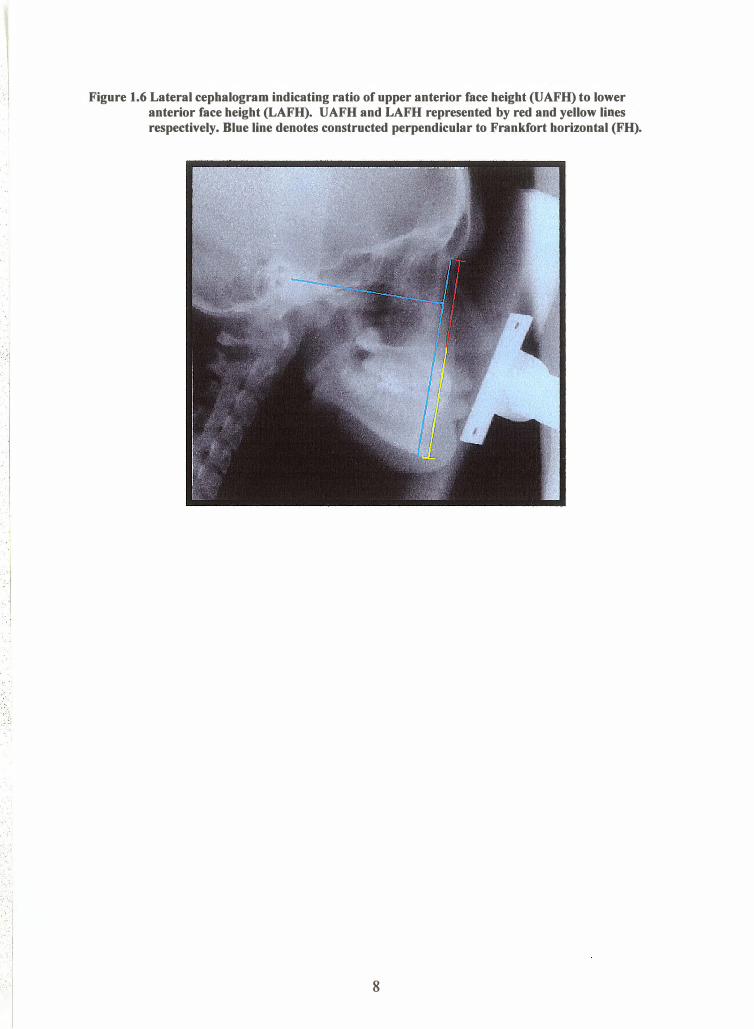
Figure 1.6
Figure 2.1
Figure 2.2
Figure 2.1
Figure 3.2
Figure 3.3
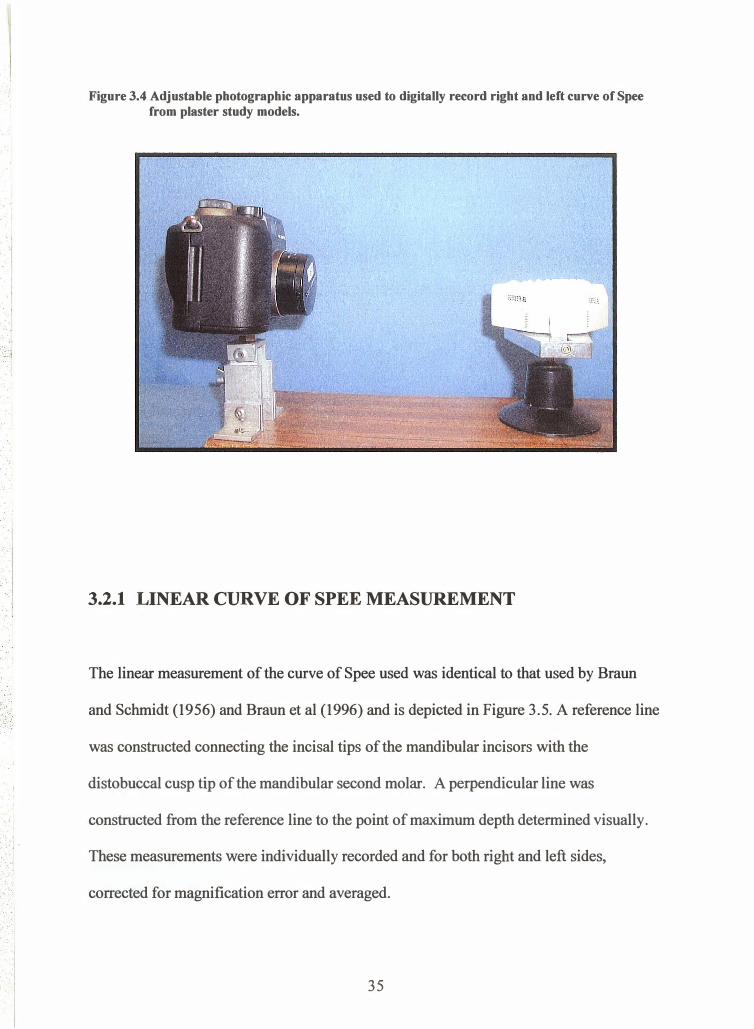
Figure 3.4
Figure 3.5
Figure 3.6
Figure 5.1
Figure 5.2
Figure 5.3
Figure 5.4
Figure 5.5
LIST OF FIGURES
Lateral aspect of human skull
Lateral cephalogram indicating Y-Axis
Lateral cephalogram indicating MP-SN angle
Lateral cephalogram indicating PP-MP angle
Lateral cephalogram indicating P-A face height Zo
Lateral cephalogram indicating UAFH/LAFIJ o/o
Molar-masseter muscle relationship
Clinical evaluation of the curve of Spee
Typical brachycephalic facial type
Typical mesocephalic facial type
Typical dolicocephalic facial type
Photographic apparatus
Linear curve of Spee measurement
Area curve of Spee measurement
Mean ratio mesurements used to classify facial type
Mean angular measurements used to classify faciat type
Mean area curve of Spee measurements
Maximum and minimum area curve of Spee values
Mean linear curve of Spee measurements
Page Number
3
4
5
6
7
I
l7
18
32
32
33
35
36
37
46
47
51
51
53
Figure 5.6
Figure 5.7
Figure 5.8
Maximum and minimum linear curve of Spee values
Mean area curve of Spee changes
Mean linear curve of Spee changes
54
55
57
XI

Table 2.1
Table 3.1
Table 3.2
Table 5.1
Table 5.2
Table 5.3
Table 5.4
Table 5.5
Table 5.6
Table 5.7
Table 5.8
Table 5.9
Table 5.10
LIST OF TABLES
Initial curve of Spee propositions
Inclusion criteria
Cephalometric values used to defTne facial pattern
Reliability test for cephalometric variables
using Dahlberg's method
Cephalometric measurement reliability
Reliability test for curve of Spee using Dahlberg's method
Mean cephalometric variables classifying facial pattern
Sex distribution, age at treatment initiation
and mean treatment time
Right and left side curve of Spee comparisons
Area curve of Spee measurements
Linear curve of Spee measurements
Mean area curve of Spee changes over time
Mean linear curve of Spee changes over time
Page Number
t4
30
33
43
44
44
46
47
49
50
53
55
50
x11

1.1
1.2
CHAPTER 1
I¡{TRODUCTION
Foreword
Definitions
1.2.1 Leveling
7.2.2 Curve of Spee
1.2.3 Y-Axis
1.2.4 Mandibular Plane to Sella-Nasion Angle (MP-SN)
1.2.5 Palatal Plane to Mandibular Plane Angel (pp-Mp)
1.2.6 Ratio of PFH to AFH (P-A Face Ht)
1.2.7 Ratio of UAFH to LAFH (UAFH/LAFH)
Significance of the Problem
Purpose of the Study
Null Hypotheses
Page Number
2
3
J
4
4-5
5-6
6-7
7-8
9-10
11
T2
1.3
t.4
1.5
CHAPTER 1
INTRODUCTIOI\
1.1 FOREWORD
Relapse of orthodontic results is a fundamental concern of all orthodontic practitioners.
Seemingly good occlusion and tooth position at the end of active orthodontic therapy
may often deteriorate toward pre-treatment arrangements. Unfortunately, in some cases
this can occur to a great extent.
Many researchers have identified various aspects involved in orthodontic therapy that
increases the likelihood of relapse. However, little attention has been paid to the possible
interaction of curve of Spee relapse and facial morphology.
One of the customary goals of orthodontic treatment is to level a deep curve of Spee. The
stability of such a goal has not been extensively studied in the literature. In addition, no
recent study has identified whether patients with different vertical facial patterns are at an
increased risk of re-establishing the curve of Spee following orthodontic leveling.
·.1
;·
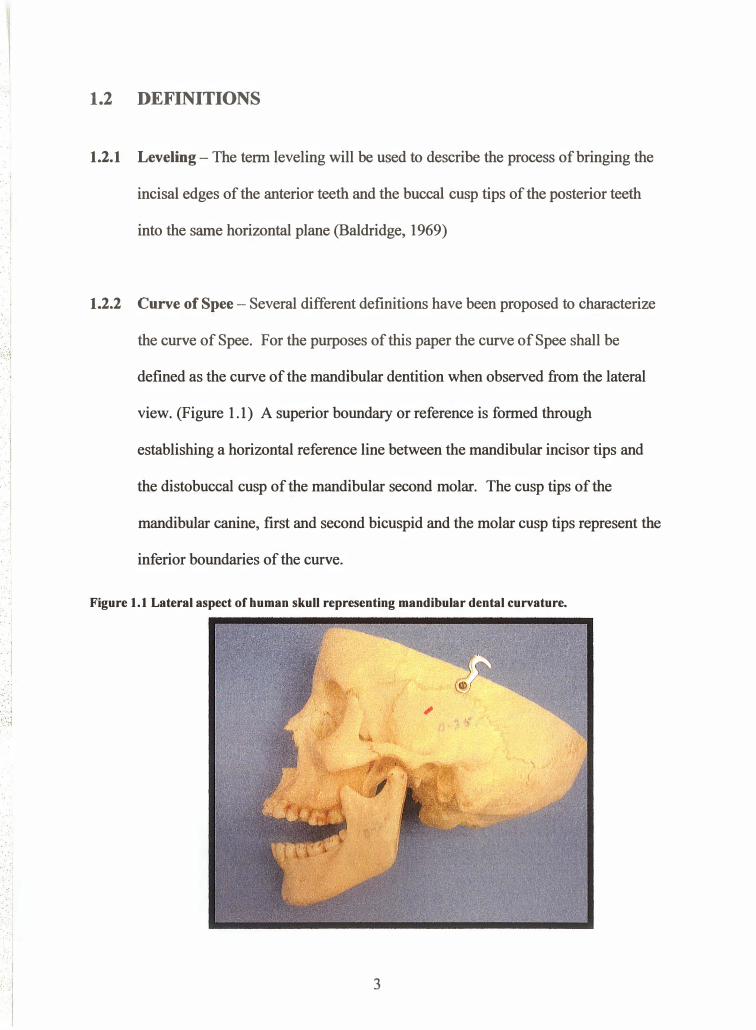
1.2 DEFINITIONS
1.2.1 Leveling- The term leveling will be used to describe the process of bringing the
incisal edges of the anterior teeth and the buccal cusp tips of the posterior teeth
into the same horizontal plane (Baldridge, 1969)
1.2.2 Curve of Spec- Several different definitions have been proposed to characterize
the curve of Spee. For the purposes of this paper the curve of Spee shall be
defined as the curve of the mandibular dentition when observed from the lateral
view. (Figure 1.1) A superior boundary or reference is formed through
establishing a horizontal reference line between the mandibular incisor tips and
the distobuccal cusp of the mandibular second molar. The cusp tips of the
mandibular canine, first and second bicuspid and the molar cusp tips represent the
inferior boundaries of the curve.
Figure 1.1 Lateral aspect of human skull representing mandibular dental curvature.
3
.··1 ·.1
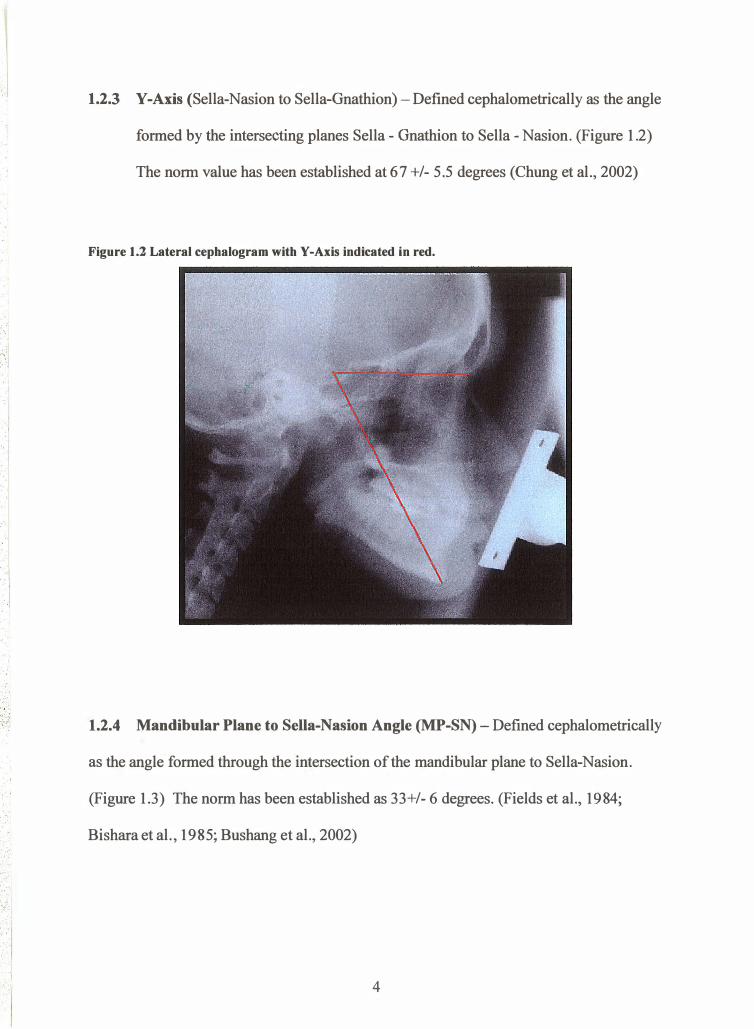
1.2.3 Y-Axis (Sella-Nasion to Sella-Gnathion)- Defined cephalometrically as the angle
formed by the intersecting planes Sella- Gnathion to Sella- Nasion. (Figure 1.2)
The norm value has been established at 67 +/- 5.5 degrees (Chung et al., 2002)
Figure 1.2 Lateral cephalogram with Y -Axis indicated in red.
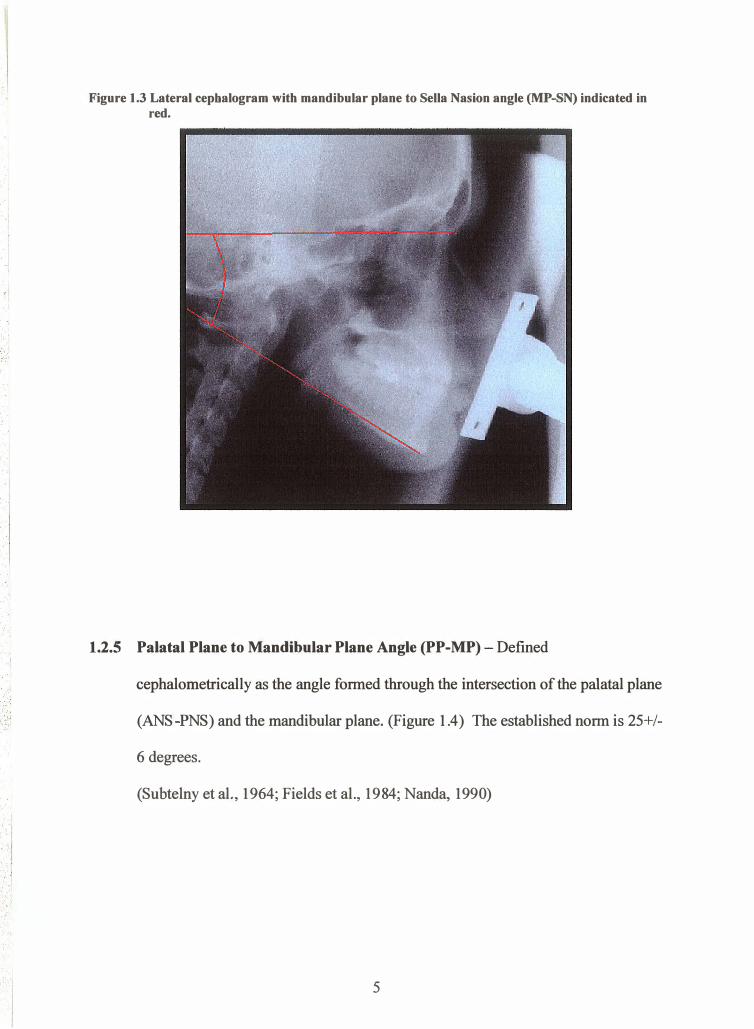
1.2.4 Mandibular Plane to Sella-Nasion Angle (MP-SN)- Defined cephalometrically
as the angle formed through the intersection of the mandibular plane to Sella-Nasion.
(Figure 1.3) The norm has been established as 33+/- 6 degrees. (Fields et al., 1984;
Bishara et al., 1985; Bushang et al., 2002)
4
· ·. ·. :;
:I ' ' ·• � .I
. . ... �\ . · . .
Figure 1.3 Lateral cepbalogram with mandibular plane to Sella Nasion angle (MP-SN) indicated in red.
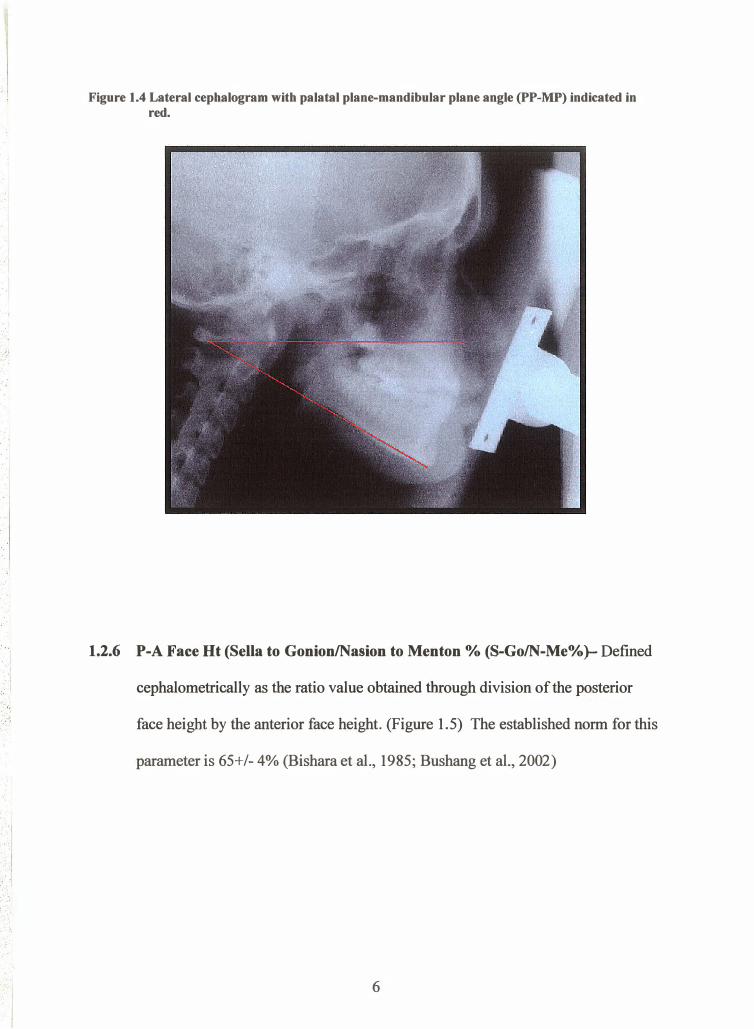
1.2.5 Palatal Plane to Mandibular Plane Angle (PP-MP)- Defined
cephalometrically as the angle formed through the intersection of the palatal plane
(ANS-PNS) and the mandibular plane. (Figure 1.4) The established norm is 25+/-
6 degrees.
(Subtelny et al., 1964; Fields et al., 1984; Nanda, 1990)
5
··, · ·:
.... \
.. I · .. .
: . . • . ·, . . · . · ·
Figure 1.4 Lateral cephalogram with palatal plane-mandibular plane angle (PP-MP) indicated in red.
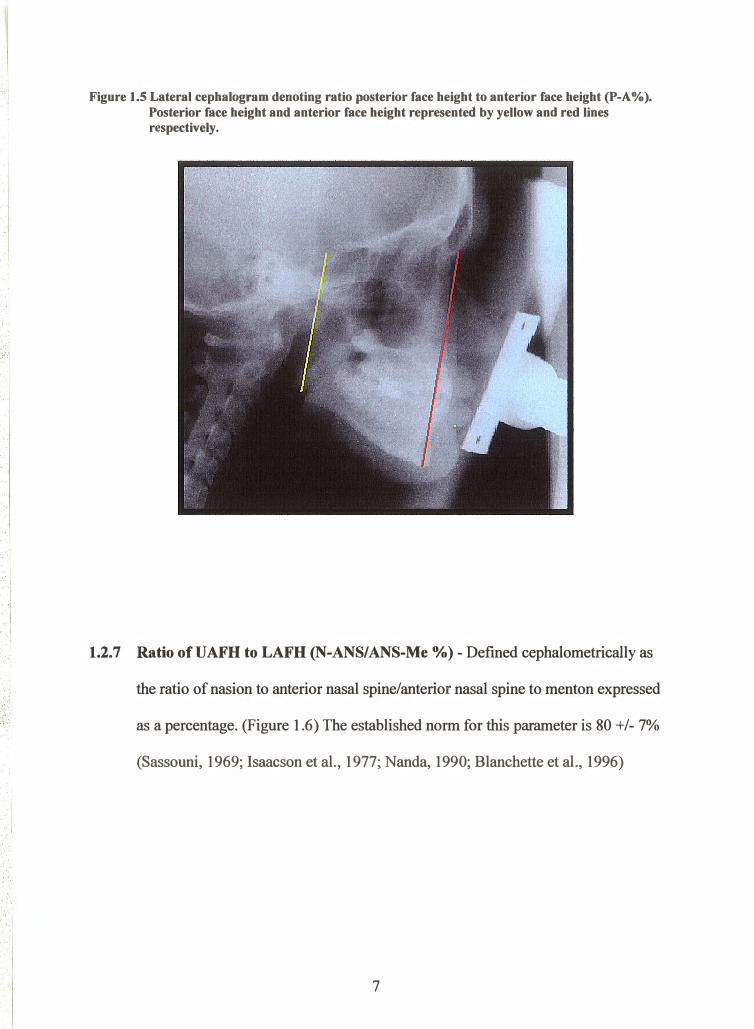
1.2.6 P-A Face Ht (Sella to Gonion/Nasion to Menton % (8-Go/N-Me%)- Defined
cephalometrically as the ratio value obtained through division of the posterior
face height by the anterior face height. (Figure 1.5) The established norm for this
parameter is 65+/- 4% (Bishara et al., 1985; Bushang et al., 2002)
6
. ·I . I
. · .. - ·
. I I , ,
.. . • ,'1 ,.: · ·1 . . I
Figure 1.5 Lateral cephalogram denoting ratio posterior face height to anterior face height (P-A%). Posterior face height and anterior face height represented by yellow and red lines respectively .
1.2.7 Ratio ofUAFH to LAFH (N-ANS/ANS-Me %) - Defined cephalometrically as
the ratio of nasion to anterior nasal spine/anterior nasal spine to menton expressed
as a percentage. (Figure 1.6) The established norm for this parameter is 80 +/- 7%
(Sassouni, 1969; Isaacson et al., 1977; Nanda, 1990; Blanchette et al., 1996)
7
. :_,·:
' . • . 'I ' '. '
•.' ': :.
!
Figure 1.6 Lateral cephalogram indicating ratio of upper anterior face height (UAFH) to lower anterior face height (LAFH). UAFH and LAFH represented by red and yellow lines respectively. Blue line denotes constructed perpendicular to Frankfort horizontal (FH) •
8
1.3 SIGNIFICANCE OF THE PROBLEM
One of, if not the most important problems facing orthodontic practitioners is post
treatment instability. Many patients are found to demonstrate a tendency to relapse in the
direction of pre-treatment values. It is self-evident why researchers have attempted to
elucidate features common to patients who experience the greatest degree of relapse.
The vast majority of relapse studies are unable to provide useful clinical predictors of
orthodontic relapse. Many of the studies evaluate relapse tendencies associated with
dental parameters such as inter-canine width, inter-molar width, arch length and tooth
dimensions and ignore the possible skeletal or soft tissue influences. (Little et al., 1988;
Kahl-Nieke et aI.,1995; Artun et al., 1996) In addition, many of the studies are
comprised of inhomogeneous samples (Kahl-Nieke et al., 1995; Artun et al., 1996) and
have post-treatment re-evaluation periods that are far too short in duration to draw
significant conclusions. (Miyazaki et al, 1997)
One of Andrews "Six Keys to Occlusion," involves a flat or slightly pronounced curve of
Spee. (Andrews,1972) It is therefore a common objective in the majority of patients to
level exaggerated curves. It is surprising that little attention has been paid to
investigating the long-term stability of such a common treatment objective.
The formation and significance of the curve of Spee in humans is largely unknown;
although, several hlpotheses have been suggested. (Wheeler, 1970; DuBrul, 1980;
DuBrul, Osborn, 1982;Barager and Osborn, 1987; Enlow, 1990; Osbom, 1993; Ash and
Ramfiord, 1995). The vast majority of these hypotheses share common themes of the
curve of Spee resulting from adaptational or morphological processes. It is therefore
possible that a patient's skeletal pattern may have an influence on the development of the
curve of Spee and more importantly to orthodontists, may influence the relapse
propensity following orthodontic leveling.
It is also generally accepted that leveling an exaggerated curve of Spee requires
additional arch length. (Baldridge,1969, Proffit, 1986, Garcia 1986, Germane et al.,
1989) It could be argued that curve of Spee relapse could either beneficially or
detrimentally affect the stability of an orthodontic result. A curve of Spee that is level at
the end of orthodontic treatment may allow for the greatest relapse accommodation.
Instead of manifesting as lower incisor crowding, arch length changes may be expressed
as deepening of the curve of Spee over time.
10
1.4 PURPOSE OF THB STUDY
The aim of the present study is the following:
1. Determine whether a relationship exists between vertical facial pattern and initial
magnitude of the curve of Spee
2. Determine the long term stability of the curve of Spee following orthodontic
leveling
3. Determine whether a reiationship exists between curve of Spee relapse and
vertical facial pattern
4. Evaluate the applicability of a novel approach to measuring the curve of Spee
11

1.5 ¡{ULL HYPOTHESES
Null Hypothesis #1 There is no relationship between initial curve of Spee depthand vertical facial pattern
Null Hypothesis #2The curve of Spee will not change when leveled throughorthodontic treatment
Null Hypothesis #3 There is no association between vertical facial pattern and re-establishment of the curve of Spee following orthodontic leveling
Null Hypothesis #4There is no difference between the measurementcharacteristics of conventional curve of Spee measurements with a novelmeasurement
T2
2.1
2.2
2.3
2.4
2.5
2.6
CHAPTER 2
LITERATURE REVIEW
What is the curve of Spee?
Measurement of the Curve of Spee
The Correlation between Arch Length and Curve of Spee
Leveling of the Curve of Spee through Orthodontics
Curve of Spee Relapse Following Orthodontic Treatment
Classification of Vertical Growth
Page Number
l4-t7
17-r9
19-22
23-24
25-26
27-28
13
CHAPTER 2
LITERATURE REVIEW
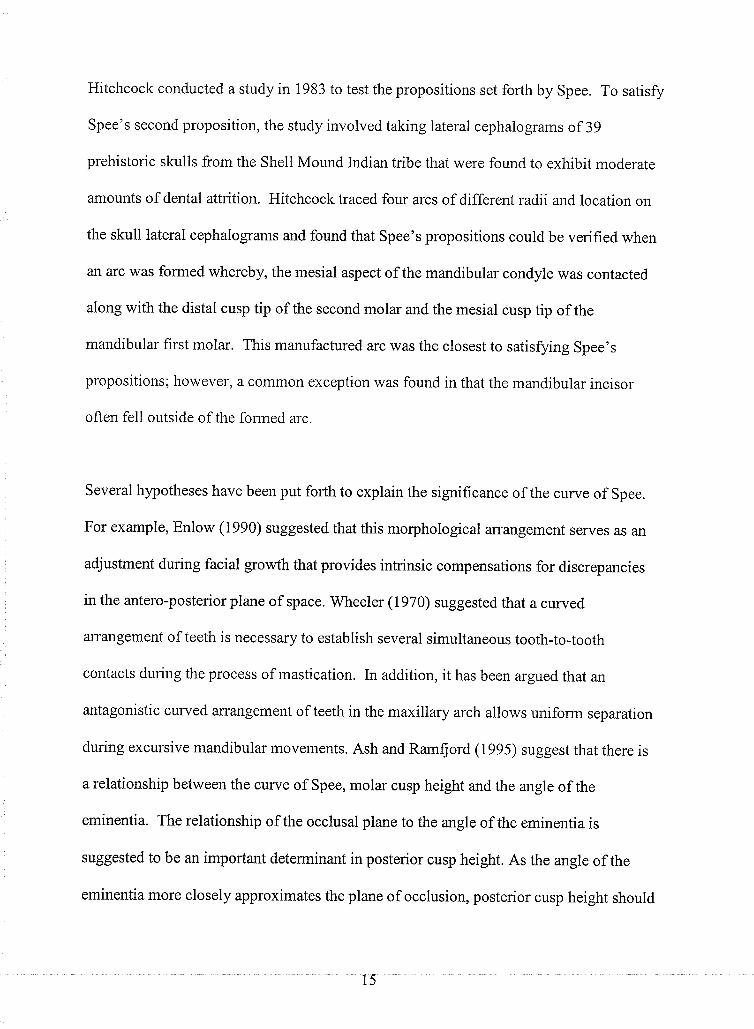
2.1 WHAT IS THE CTJRVE OF SPEE?
The curve of Spee was first described by Fendinand Graf Spee in 1890. Spee examined
skulls with abraded teeth viewed from the lateral aspect and observed that the occlusal
surfaces of the dentition are affanged in a downward convex curve. Based on his studies,
Spee introduced three propositions. (Table 2.1)
Table 2.1 Initial propositions suggested by Ferdinand Graf Spee in 1890.
Proposition when viewedfrom the profile the occlusal surfaces of the molars lie onthe arc of a circle. When this arc is extended posteriorly, the anteriorsurface of the condyle is intersected. when both sides of the dentitionare considered, a cylinder is formed. The central axis of the cylinder islocated somewhere posterior to the midorbital plane posterior to the"crista lacrimalis posterior." The radius of the cylinder wasdetermined to be approximately 6.5-7.0 cm.
Proposition 2 The curve is more readily apparent in well-worn dentitions. Althoughthe curve is demonstrable in dentitions with intact cusp tips, the cut-veis more readily discernable in dentitions subjected to heavy dentalattrition.
Proposition 3 In addition to the molars, tlte curve will intersect the occlusal surfacesof other teeth in the dentition as well as the condyle.
t4
Hitchcock conducted a study in 1983 to test the propositions set forlh by Spee. To satisfy
Spee's second proposition, the study involved taking lateral cephalograms of 39
prehistoric skulls from the Shell Mound Indian tribe that were found to exhibit moderate
amounts of dental attrition. Hitchcock traced four arcs of different radii and location on
the skull lateral cephalograms and found that Spee's propositions could be verified when
arr arc was formed whereby, the mesial aspect of the mandibular condyle was contacted
along with the distal cusp tip of the second molar and the mesial cusp tip of the
mandibular first molar. This manufactured arc was the closest to satisfying Spee's
propositions; however, a common exception was found in that the mandibular incisor
often fell outside of the formed arc.
Several hypotheses have been put forth to explain the significance of the curve of Spee.
For example, Enlow (1990) suggested that this morphological arrangement serves as an
adjustment during facial growth that provides intrinsic compensations for discrepancies
in the antero-posterior plane of space. wheeler (r970) suggested that acurved
affangement of teeth is necessary to establish several simultaneous tooth-to-tooth
contacts during the process of mastication. In addition, it has been argued that an
antagonistic curved alrangement of teeth in the maxillary arch allows uniform separation
during excursive mandibular movements. Ash and Ramfiord (1995) suggest that there is
a relationship between the curve of Spee, molar cusp height and the angle of the
eminentia. The relationship of the occlusal plane to the angle of the eminentia is
suggested to be an important determinant in posterior cusp height. As the angle of the
eminentia more closely approximates the plane of occlusion, posterior cusp height should
15
coffespondingly become reduced to eliminate to interferences during protrusive
mandibular movements. In addition, as the radius of the curve of Spee becomes smaller a
corresponding decrease in posterior cusp heights should be seen to eliminate protrusive
interferences.
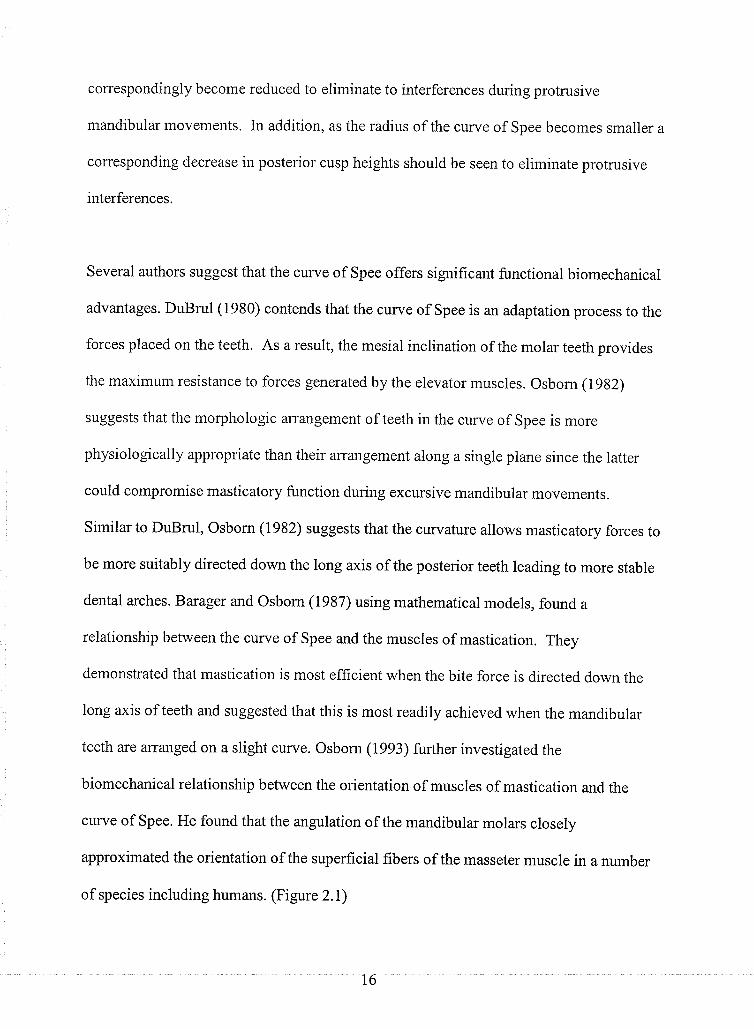
Several authors suggest that the curve of Spee offers significant functional biomechanical
advantages. DuBrul (1980) contends that the curve of Spee is an adaptation process to the
forces placed on the teeth. As a result, the mesial inclination of the molar teeth provides
the maximum resistance to forces generated by the elevator muscles. Osborn (1982)
suggests that the morphologic arrangement of teeth in the curve of Spee is more
physiologically appropriate than their arrangement along a single plane since the latter
could compromise masticatory function during excursive mandibular movements.
Similar to DuBrul, Osborn (1982) suggests that the curvature allows masticatory forces to
be more suitably directed down the long axis of the posterior teeth leading to more stable
dental arches. Barager and osborn (L987) using mathematical models, found a
relationship between the curve of Spee and the muscles of mastication. They
demonstrated that mastication is most efficient when the bite force is directed down the
long axis of teeth and suggested that this is most readily achieved when the mandibular
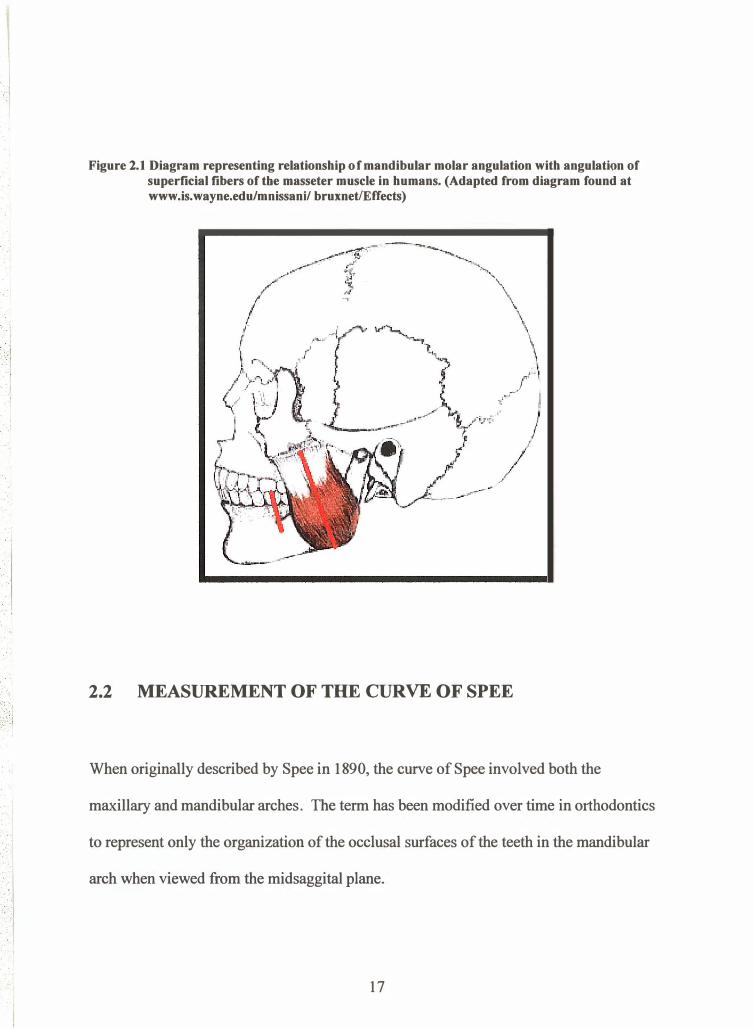
teeth are arranged on a slight curve. osborn (1993) further investigated the
biomechanical relationship between the orientation of muscles of mastication and the
curve of Spee. He found that the angulation of the mandibular molars closely
approximated the orientation of the superficial fibers of the masseter muscle in a number
of species including humans. (Figure 2.1)
t6
' ' ·,· ,·j
• . ·I
: .. ,. :· ·--�
.. ....
. ', • '
. ' . . · .
Figure 2.1 Diagt·am representing relationship of mandibular molar angulation with angulation of superficial fibers of tbe masseter muscle in humans. (Adapted from diagram found at www.is.wayne.edu/mnissanil bruxnet/Effects)
2.2 MEASUREMENT OF THE CURVE OF SPEE
When originally described by Spee in 1890, the curve of Spee involved both the
maxillary and mandibular arches. The term has been modified over time in orthodontics
to represent only the organization of the occlusal surfaces of the teeth in the mandibular
arch when viewed from the midsaggital plane .
17
. ' :··
. I
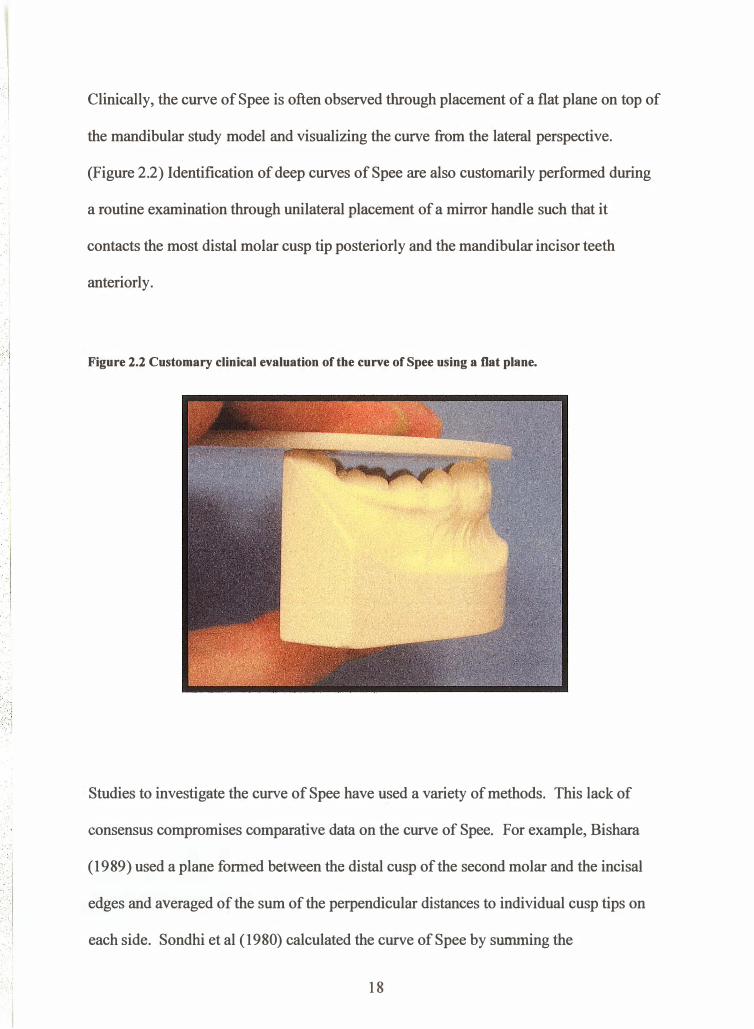
Clinically, the curve of Spee is often observed through placement of a flat plane on top of
the mandibular study model and visualizing the curve from the lateral perspective.
(Figure 2.2) Identification of deep curves of Spee are also customarily performed during
a routine examination through unilateral placement of a mirror handle such that it
contacts the most distal molar cusp tip posteriorly and the mandibular incisor teeth
anteriorly .
Figure 2.2 Customary clinical evaluation of the curve of Spee using a flat plane.
Studies to investigate the curve of Spee have used a variety of methods. This lack of
consensus compromises comparative data on the curve of Spee. For example, Bishara
(1989) used a plane formed between the distal cusp of the second molar and the incisal
edges and averaged of the sum of the perpendicular distances to individual cusp tips on
each side. Sondhi et al ( 1980) calculated the curve of Spee by summing the
18
perpendicular distances of the cusp tips to a plane formed between the lower incisors and
the f,rrst molar. Braun et al (1996) on the other hand used the sum of the maximum depth
on both sides to a plane formed between the incisal edged and the distobuccal cusp of the
second molar. De Praeter et al (2002) used a plane formed between the lower incisors
and the distobuccal cusp of the second molar and summed the perpendicular distance
befween the canine, pre-molar and molar cusp tip to the constructed reference line on
both sides.
2.3 THE CORRELATION BETWEEN ARCH LENGTH AND THE
CURVE OF SPEE
Andrews (1972) charactenzed "The Six Keys to Normal Occlusion." In this outstanding
contribution, Andrews outlined six significant characteristics observed in 120 non-
orthodontic normal occlusions. Andrews (1972) indicated that the planes of occlusion
found in normal occlusions ranged from flat to having slight curves of Spee. Andrews
argued that the arrangement of teeth that allowed the best intercuspation, from a
geometrical standpoint, was when the plane of occlusion is relatively flat. In contrast, a
deep curve of Spee would result in a more contained area for maxillary arch alignment,
making good intercuspation impossible.
19
Several investigators have studied the effect of leveling the curve of Spee on arch
circumference. It is generally accepted that leveling a deep curve of Spee results in
increase in arch perimeter; however, there is little consensus as to the amount.
Proffit and Akerman (1986), suggests that a 1 :1 relationship exists between depth of
curve of Spee and arch circumference per side. An additional 2.0 mm of arch
circumference is said to be required for each 1.0 mm of curve of Spee depth leveled.
In 1969, Baldridge examined thirty mandibular casts that showed initial exaggerated
curues of Spee. The sample was also chosen to have all of the permanent teeth except for
third molars and with good alignment of the dentition. Baldridge (1969) measured initial
arch length and depth of the curve of Spee using an adapted ligature wire and a Boley
gauge respectively. These initial arch circumference and curve of Spee measurements
were compared to those obtained from models with teeth reset in wax to eliminate the
curve and create an ideal occlusion. In addition, Baldridge (1969) eliminated other arch
circumference influences by not allowing expansion or anterior labial tipping during the
re-setting of the model teeth. From his comparisons he calculated a linear relationship
between arch circumference and leveling the curve of Spee. The relationship was found
to be Y:0.488X-0.51, where Y represents the arch length differential in millimeters and
X represents the sum of the right and left side maximum depths of curve of Spee in
millimeters.
20
Garcia (1985) also attempted to elucidate the relationship between arch circumference
and leveling the curve of Spee. Garcia (1985) examined 100 patients with complete
dentitions including the third molars, all second molars in good occlusion, absence of
occlusal attrition and absence of ectopic eruptions. Similar to Baldridge (1969), Garcia
(1985) found a linear relationship between increase in arch circumference and leveling of
a curve of Spee represented by the regression formula Y:l.34+0. 657X, where X
represents the summed total of the maximum depth in each quadrant. Garcia (1985) also
found no sexual dimorphism pertaining to the curve of Spee measurements.
Germane er. al (1992) investigated the effects of leveling the curve of Spee on arch
circumference of two different arch forms , a caTcnary curve and a Bonwill Hawley arch
form. In their study, Germane et al (L992) used inter-molar and average mesio-distal
tooth dimensions provided by Moyer's (I974) to construct a mathematical model relating
depth of curve of Spee to arch circumference. The group found that mathematically the
two arch forms behaved very differently when leveled. The Catenary arch form required
less arch length to level when compared to the Bonwill-Hawley arch form although the
results were not significant. Unlike previous investigators, the group found that the
relationship was non-linear and was consistently less than a 1:1 relationship for curves of
Spee less than 9.0mm. Curve of Spee depths of 9.0mm or 10.0mm were found to require
greater than a 1:1 relationship to level.
Braun et al (1996) examined twenty-seven casts of untreated patients to determine the
relationship between arch circumference and leveling the curve of Spee. He argued that
2l
previous studies involved a significant degree of measurement error as well as inaccurate
assumptions when determining the relationship. Braun (1996) included only casts with
fully developed dentitions and no absent teeth excluding the third molars. Casts with
ectopically erupted teeth or severe attrition were excluded. The curve of Spee was
measured bilaterally using the mandibular incisors and the distal cusp tips of the second
molars as the superior plane. The cusp tips of each cast were subsequently measured
using a precision co-ordinate machine and the three dimensional point locations recorded.
From this data arch circumferences of the 27 subjects were also calculated. Braun et al
(1996) then calculated the amount of additional arch space required to level of the curve
of Spee by comparing the three dimensional arch circumference to a constructed
horizontal planar projection arch circumference. The investigators calculated a linear
regression formula similar to Baldridge (1969) and Garcia (1985); however, the
magnitude was much smaller. The regression equation calculated from the data was
Y:0.2462X-0.1723 where Y represents the arch circumference differential in millimeters
and X the sum of the right and left side curve of Spee in millimeters. Braun et al (1996)
suggest that the arch circumference loss related to curve of Spee leveling is not as
important as previously suggested if adequate treatment mechanics are employed. He
argued that lower incisor proclination is the most important factor in arch circumference
leveling and segmental mechanics should be employed in situations where arch
circumference changes are critical.
22
2.4 LEVELING THE CURVE OF SPEE THROUGH
ORTHODO]\ITICS
The importance of leveling the curve of Spee as a treatment goal is well documented in
the orthodontic literature. (Baldridge,1969; Andrews, 1972; Germane et al., 1992;
Orthlieb, 1997) Unfortunately however, there is no consensus as to the most appropriate
and stable means of leveling a deep curve of Spee. Vertical movement of the dentition to
allow the cusp tips and incisal edges to lie on a flat plane may be accomplished in one of
several ways. According to Proffit (2000) there are three possible ways of leveling a
lower arch with an excessive curve of Spee: (1) absolute intrusion of incisors (2) relative
intrusion of incisors and (3) posterior eruption.
Absolute lower incisor intrusion involves moving the teeth inferiorly independent of the
posterior segments. Burstone (1977) suggested using a segmental arch technique to
accomplish this goal. According to Burstone (1977) apically directed forces in the range
of 12.5 grams through the center of resistance of the lower teeth are required to move the
incisor teeth inferiorly while maintaining the posterior anchorage segment.
The process of relative intrusion involves maintaining vertical incisor position while
allowing vertical dentoalveolar development of the posterior dentition. This has an
obvious limitation in that it may only be accomplished in the growing orthodontic patient.
Conversely, posterior eruption involves maintaining or limiting the vertical position of
the incisors while the posterior segments are orthodontically extruded.
23
Dake and Sinclair (1989) evaluated the long term-stability of subjects who underwent
two different overbite reduction procedures. Sixty matched Class i, deep bite low angle
non-extraction cases had curves of Spee leveled using either posterior tooth eruption as in
Tweed type mechanics utilizing reverse curve of Spee wires or through the use of utility
intrusion arches similar to those commonly used in the Bioprogressive technique.
(Ricketts, 1969) Dake and Sinclair (1989) found that both techniques were effective in
reducing overbite and that the changes remained stable after an average post-treatment
period of 4 years 6 months. The theory however that utility arches may produce absolute
intrusion was not validated. The group found that incisor intrusion measured
cephalometrically was not significantly different from the group treated with reverse
curve of Spee mechanics.
Weiland et al. (1996) evaluated the efficacy of overbite reduction in 50 adult low-angle
deep-bite malocclusions achieved through reverse curve of Spee mechanics and the
segmented arch technique recommended by Burstone (1966). The group used
cephalometrics to determine that patients with overbite reduced using the segmental arch
technique is superior when absolute intrusion of lower incisors is indicated.
Unfortunately, neither of the previously mentioned studies assessed relapse tendencies of
curve of Spee and study models were not used to identify changes.
24
2.5 CURVE OF SPEE RELAPSE F'OLLOWII\G ORTHODONTIC
TREATMENT
Numerous studies have quantified the amount and type of relapse that often occurs
following orthodontic treatment. (Fidler et a1., 1956; Little, 1975; Sinclair, 1983;
williams, 1985; Glenn et a1.,1987, Little et al., 1988, Bishara et al., l9B9; Dake et al.,
1989). These studies are often limited to changes in arch dimension, overjet, overbite
and mandibular incisor crowding. Very little research to date has been focused on the
changes in the curve of Spee following orthodontic leveling.
One of the early goals of orthodontic treatment is leveling a deep curve of Spee.
Andrews (1972) recommended that the curve of Spee be leveled as a form of over-
treatment due to the natural tendency for the curve to partially re-establish following
orthodontics. Koyama (1979) studied the relapse propensity in sixty patients treated
orthodontically with four first pre-molar extractions. He found that the curve of Spee
generally became deeper during the post-orthodontic phase. Similarly, Kim et al.1999
when examining the relapse of Class II division 2 patients found that the curve of Spee
decreased through treatment but increased significantly during the post-retention period.
Carcara et al. (2001) investigated the long-term stability of leveling the curve of Spee
using the Alexander Discipline. The sample consisted of 31 patients records selected
from the private practice of Dr. R.G. Alexander. Subjects were selected according to the
following inclusion criteria; treated non-extraction, ANB>4., a least on half cusp Class II
molar relationship, overbite of 50o/o or greater and a curve of Spee 2.0mm or greater.
25
Records consisted of pre-treatment, post-treatment and post-retention dental models with
tlre average post-retention period being 7 years 5 months after the removal of fîxed
retention. The curve of Spee was measured at all time points bilaterally using the
procedure adapted from Koyama (1979) and compared. The group found that for pre-
treatment curves of 2.0-4.0mm the curve of Spee reestablishes to a lesser extent than was
present prior to orthodontic treatment. For patients with curves of Spee of 2.0-4.0mm
where the curve of Spee was not completely leveled during orthodontic treatment, the re-
establishment of the curve of Spee increased significantly.88.9% of subjects relapsed
when the curve of Spee was incompletely leveled compared to 50o/o in the leveled
subpopulation.
Kuitert et al. (2000) investigated the changes of form and depth of the curve of Spee
during and after orthodontic treatment. The study involved 115 subjects selected based
on complete sets of records and good treatment results. Photographs of orthodontic
models taken at pre-treatment, post-treatment and post-retention were used to measure
the deepest linear dimension of the curve of Spee and compared. Kuitert et al. (2000)
found that during treatment 72%o of the deep curves were corrected to normal curves. Of
the subjects deemed to have normal curve of Spee measurements at the end of treatment,
l0o/o changed with most of these once againbecoming deep. Interestingly, of the patients
categorized as having abnormal curves at the end of treatment, 50o/o changed to a normal
curve. In addition, at post-retention, 58% of subjects with deep curves had pre-treatment
measurements in the deep or normal range. It was concluded from the study that the
original depth of the curve of Spee is not predicative for post-retention depth. Also, some
26
other factors may be responsible in terms of stability of the curve of Spee as 50o/o of the
abnormal curves improve and 25o/o of the normal curves deteriorate with time.
2.6 CLASSIF'ICATION OF VERTICAL GROWTH
Recognizing characteristics associated with various vertical growth patterns has been
attempted by both researchers and clinicians and have generated inconclusive results.
There is an obvious advantage to the orthodontic practitioner in elucidating
characteristics that allow identification of extremes of vertical facial growth. With the
development of the lateral cephalogram by Broadbent in 193 1 , orthodontics has focused
great deal of attention on cephalometric measurements that may be used to describe and
predict various facial pattems.
In a review article by Buschan g et al. (2002) on vertical facial patterning, it was
suggested that various morphologic characteristics could be associated with patients with
extreme vertical growth capacity. Buschang et al. (2002) found that increased Mp-SN
angles, increased LAFH measurements, more obtuse gonial angles, increased LAFH:
UAFH ratios, decreased posterior to anterior face heights and excessive dentoalveolar
heights were indicative of the hyper-divergent facial type. It has also been suggested
that the angulation of the mandibular plane to the anterior cranial base may be used in
identification of vertical facial growth. Schendel et al. (1976) and Opendebeeck et al.
(1978) suggest that as the mandibular piane angulation increases there is a subsequent
27

increase in vertical facial growth potential. MP-SN has also been used in combination
with other cephalometric measurements to classify patients into hyper-divergent, hypo-
divergent and normal facial types. Bishara and Jakobsen (1985) used MP-SN in addition
to ratios of posterior to anterior face height to classify patients in their longitudinal study.
Skieller and Björk (1984) through longitudinal implant studies, however, suggest that the
angulation of the mandibular plane with the anterior cranial base is not a good predictor
of future facial growth. Nanda (1990) further suggests that the inferior border of the
mandible is in a constant state of remodeling during growth and is inadequate for growth
prediction. Other investigators have found an association between increased palato-
mandibular angles (PP-MP) and the dolicocephalic facial type with associated open-bite
malocclusions. (Sassouni, 1969; Nanda, 1990) As well, some researchers use lower
anterior face height as a predictor of vertical facial growth. (Nanda, 1990; Blanchette et
a1.,1996)
Due to the complexity of growth of the craniofacial complex solitary cephalometric
measurements may not be satisfactory in identifying vertical facial types. Rather, a
constellation approach may be used to classify growth patterns outside the range of
normal.
28
CHAPTER 3
MATERIALS AND METHODS
3.1
3.2
Sample Selection
Curve of Spee Measurement
3.2.I LinearMeasurement
3.2.I Area Measurement
Page Number
30-33
34
3s-36
36-37
29
CHAPTER 3
MATERIALS AND METHODS
3.1 SAMPLE SELECTION
The sample was chosen from the archives of the University of Manitoba Graduate
Orthodontic Clinic. The archived subjects were treated by graduate students of the
department of orthodontics, under direct supervision of faculty. The records of
approximately 350 patients were searched on the basis of the inclusion criteria presented
in Table 3.1. The stringent inclusion criteria were used to identify a homogeneous
sample and minimize other possible influencing factors.
Table 3.1 Inclusion Criteria for Subjects Selected for the Study
1. Complete cephalometric and plaster model records including pre-treatment, posttreatment and minimum five years post-treatment
2. Angle Class I, Class II division 1 or 2 malocclusions3. Non-extraction orthodontic treatment4. All teeth excluding the third molars were present and fully erupted at the start of
treatment5. Non-extraction orthodontic treatment6. Non-surgical orthodontic treatment7. Treatment initiated between the ages of 12 to I7 years8. Treated with an edgewise approach
A total of 44 subjects were selected, 14 males (31.88%) and 30 females (6g.12%).
Pre-treatment lateral cephalograms for the 44 subjects were scanned by two calibrated
operators using a IIP 3400 Deskscan scanner (Hewlett-Packard Company, Palo Alto CA)
30

and subjected to cephalometric analysis using the DolphinrM treatment planning software
(Dolphin lmaging and Management Systems, Chatsworth CA).
Each operator scanned and digitized 66 lateral cephalograms corresponding to half of the
total cephalograms from pre-treatment, post-treatment and a minimum of 5-years post-
treatment time periods. Two weeks later each operator digitized 132 records comprised
of the 66 previously digitized cephalograms and 66 cephalograms digitized by the other
operator. Intra-operator and inter-operator calibration coefficients were obtained.
Using defined angular and ratio pre-treatment cephalometric values the subjects were
partitioned into three groups based on vertical facial pattern. Measurement criteria were
selected from the literature that arc commonly used to identify patients with vertical
dysplasia. (Table 3.2) (Sassouni, 1969; Schendel et al.,1976; Opendebeeck et al.,I97g;
Skieller and Björk, 1984; Bishara and Jakobsen, 1985; Nanda, L99};Blanchette et al.,
1996; Buschang et a1.,2002) The three groups identifîed were brachycephalic or
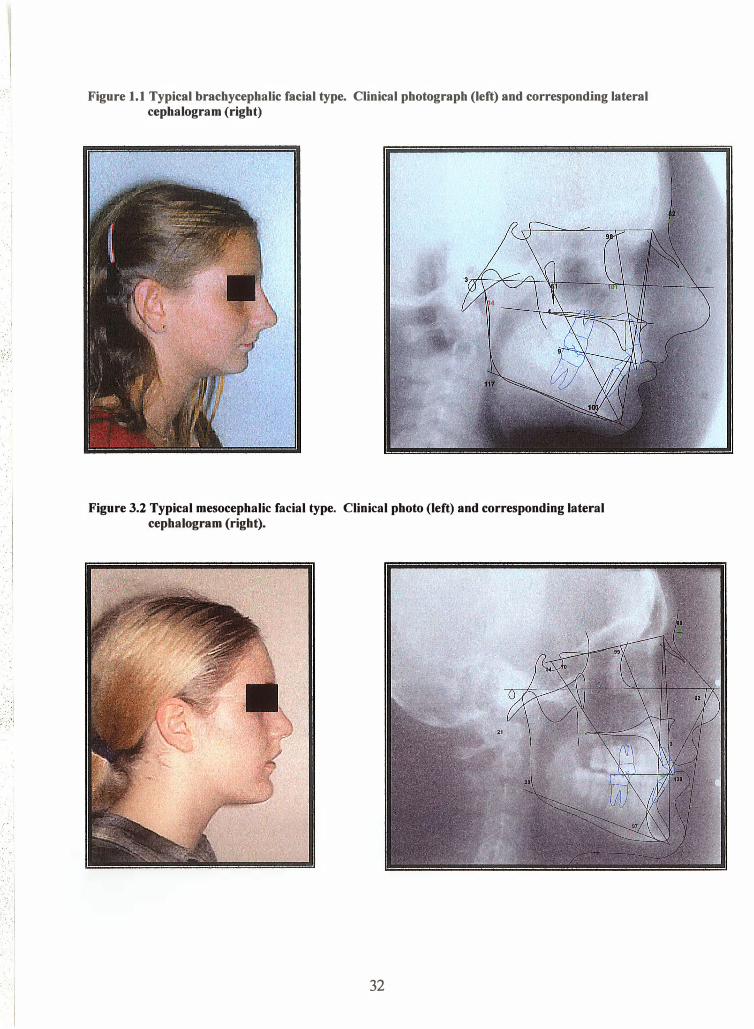
horizontal growers (Figure 3.1), mesocephalic or normal growers (Figure 3.2) and
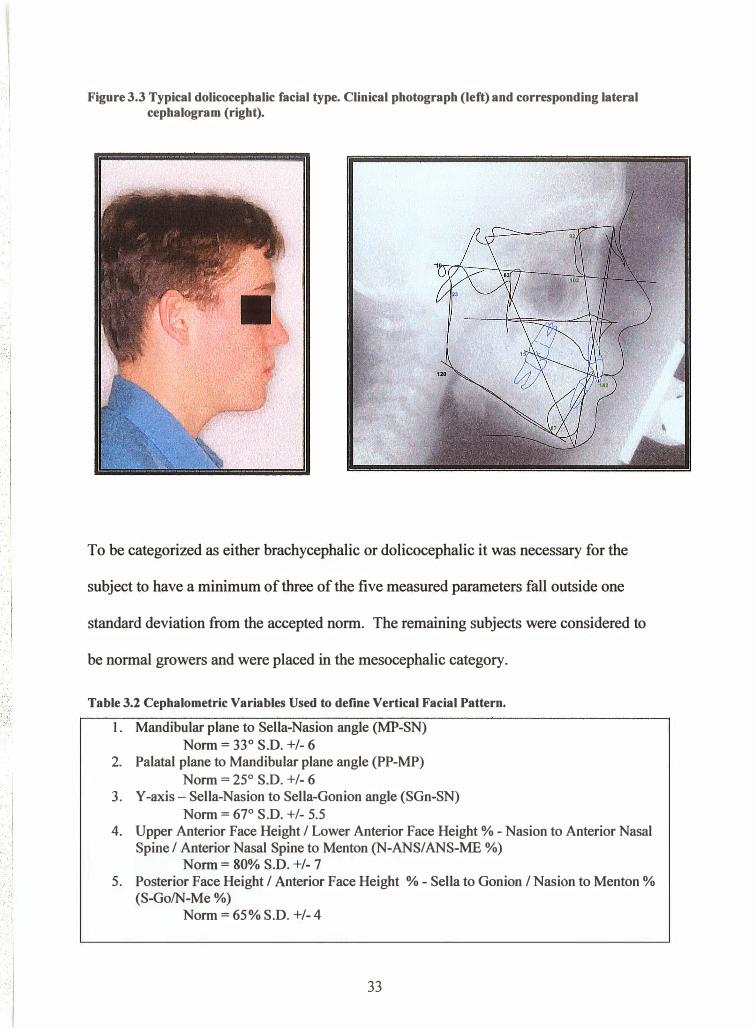
dolicocephalic or vertical growers. (Figure 3.3)
31
. · . . ·
'• '·· _,-· ., . . ··'· . · .
.. . · .· ·
:. ·.·. ·.· [
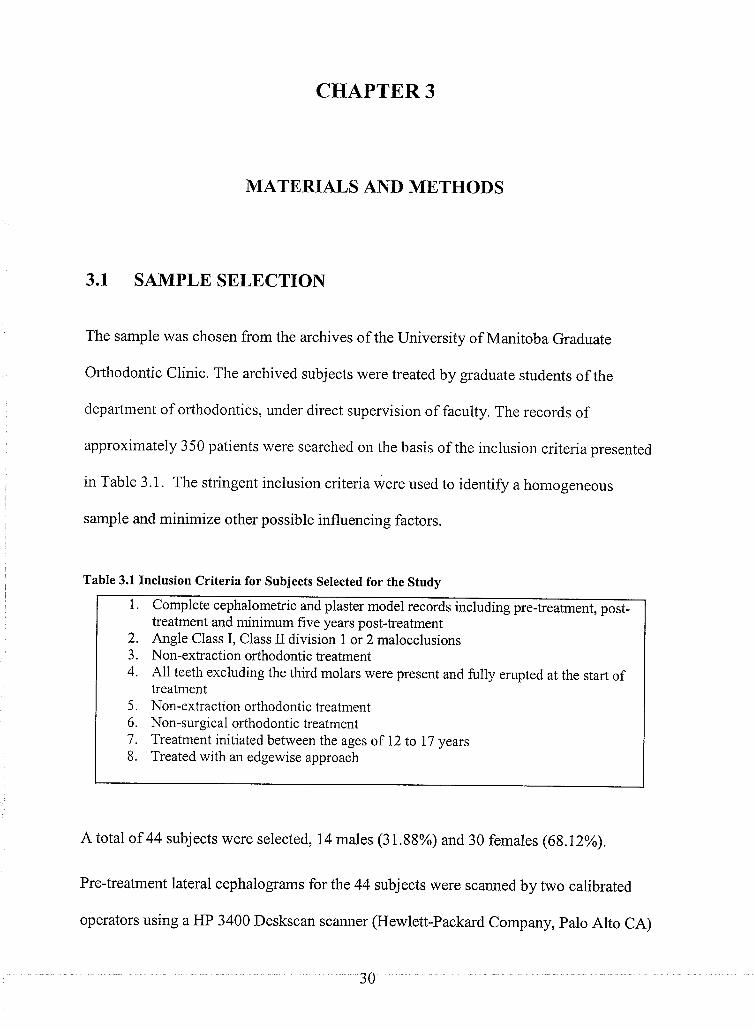
Figure 1.1 Typical brachycephalic facial type. Clinical photograph (left) and corresponding lateral cephalogram (right)
Figure 3.2 Typical mesocephalic facial type. Clinical photo (left) and corresponding lateral cephalogram (right).
32
. I . .
. .
; ··.•
Figure 3.3 Typical dolicocephalic facial type. Clinical photograph (left) and corresponding lateral cephalogram (right).
To be categorized as either brachycephalic or dolicocephalic it was necessary for the
subject to have a minimum of three of the five measured parameters fall outside one
standard deviation from the accepted norm. The remaining subjects were considered to
be normal growers and were placed in the mesocephalic category.
Table 3.2 Cephalometric Variables Used to define Vertical Facial Pattern.
1. Mandibular plane to Sella-Nasion angle (MP-SN)
Norm= 33° S.D. +1- 6 2. Palatal plane to Mandibular plane angle (PP-MP)
Norm= 25° S.D. +1- 6 3. Y-axis- Sella-Nasion to Sella-Gonion angle (SGn-SN)
Norm= 67° S.D. +1- 5.5 4. Upper Anterior Face Height I Lower Anterior Face Height % -Nasion to Anterior Nasal
Spine I Anterior Nasal Spine to Menton (N-ANSIANS-ME %) Norm = 80% S.D. +I- 7
5 . Posterior Face Height I Anterior Face Height % - Sella to Gonion I Nasion to Menton% (S-Go/N- Me %)
Norm = 65% S.D. +I-4
33
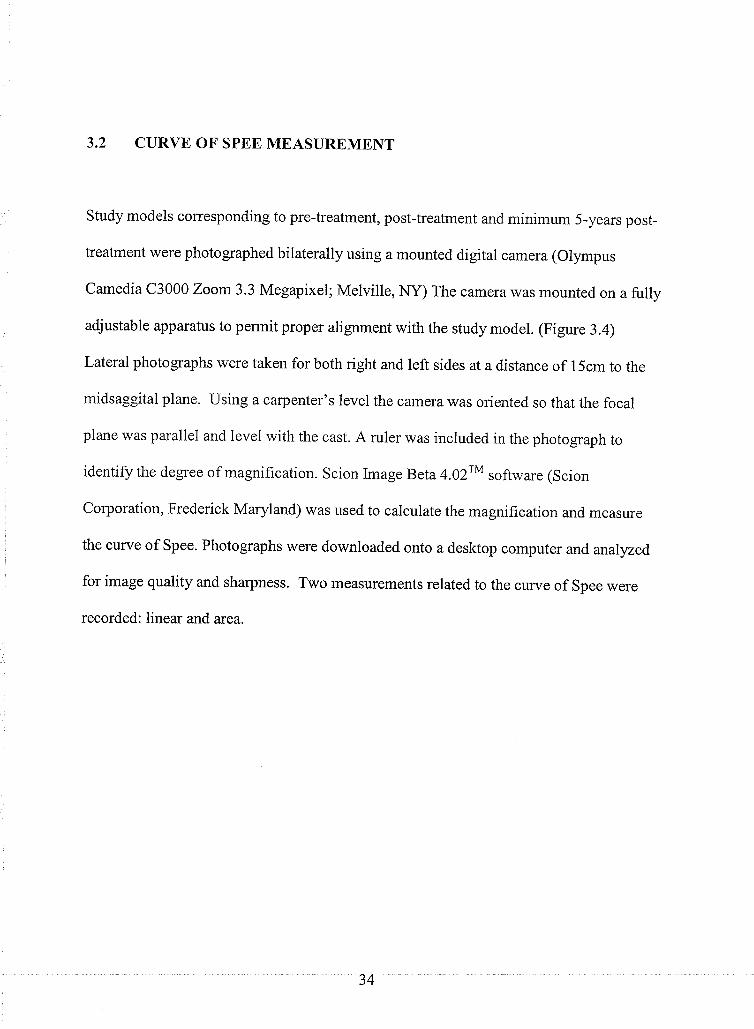
3.2 CURVE OF SPEE MEASUREMENT
Study models corresponding to pre-treatment, post-treatment and minimum 5-years post-
treatment were photographed bilaterally using a mounted digital camera (Otympus
Camedia C3000 Zoom 3.3 Megapixel; Melville, NY) The camera was mounted on a fully
adjustable apparatus to permit proper alignment with the study model. (Figure 3.4)
Lateral photographs were taken for both right and left sides at a distance of 15cm to the
midsaggital plane. Using a carpenter's level the camera was oriented so that the focal
plane was parallel and level with the cast. A ruler was included in the photograph to
identify the degree of magnification. Scion Image Beta 4.}zrM software (Scion
Corporation, Frederick Maryland) was used to calculate the magnification and measure
the curve of Spee. Photographs were downloaded onto a desktop computer and analyzed
for image quality and sharpness. Two measurements related to the curve of Spee were
recorded: linear and area.
34
. ;
. ' .
-<·J ,· I ••• : : -. � . .. 1 . . >
. : . . .... · .. .. ·I ., ·:. · . .
. . . .
Figure 3.4 Adjustable photographic apparatus used to digitally record right and left curve of Spee from plaster study models.
3.2.1 LINEAR CURVE OF SPEE MEASUREMENT
The linear measurement of the curve of Spee used was identical to that used by Braun
and Schmidt (1956) and Braun et al (1996) and is depicted in Figure 3.5. A reference line
was constructed connecting the incisal tips of the mandibular incisors with the
distobuccal cusp tip of the mandibular second molar. A perpendicular line was
constructed from the reference line to the point of maximum depth determined visually.
These measurements were individually recorded and for both right and left sides,
corrected for magnification error and averaged .
35
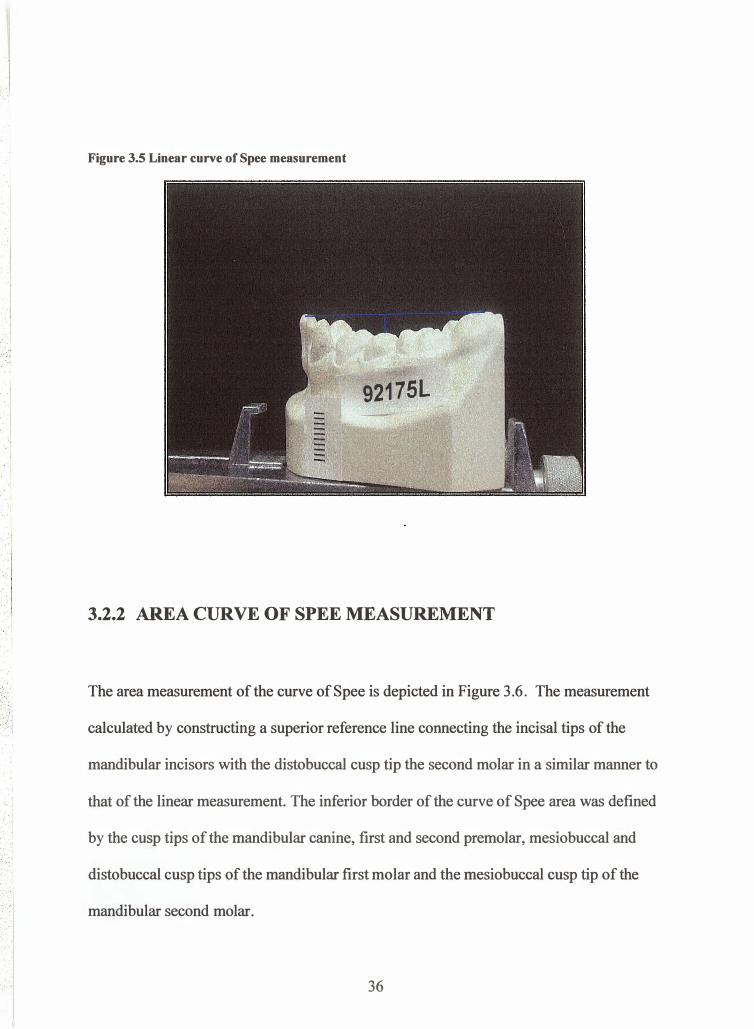
Figure 3.5 Linear curve of Spee measurement
92175L -
3.2.2 AREA CURVE OF SPEE MEASUREMENT
The area measurement of the curve of Spee is depicted in Figure 3.6. The measurement
calculated by constructing a superior reference line connecting the incisal tips of the
mandibular incisors with the distobuccal cusp tip the second molar in a similar manner to
that of the linear measurement. The inferior border of the curve of Spee area was defined
' ' by the cusp tips of the mandibular canine, first and second premolar, mesiobuccal and . . · · ·.·
distobuccal cusp tips of the mandibular first molar and the mesiobuccal cusp tip of the
mandibular second molar . . . . ·I
36
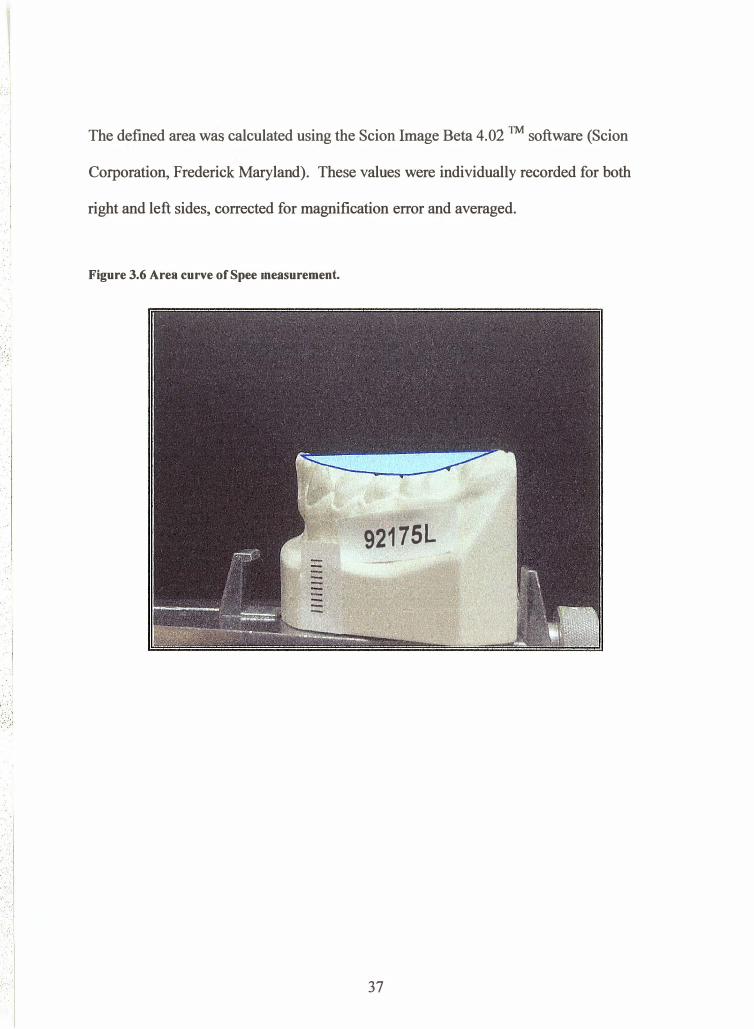
The defined area was calculated using the Scion Image Beta 4.02 TM software (Scion
Corporation, Frederick Maryland). These values were individually recorded for both
right and left sides, corrected for magnification error and averaged.
Figure 3.6 Area curve of Spee measurement •
. · . . · . .
92175L
.. I ....
.
.
·." .
·. · . . [
37

CHAPTER 4
STATISICAL AI\ALYSIS
4.r
4.2
Investigator Error
Statistical Analysis
Page Number
39
39-40
38
CHAPTER 4
STATISICAL ANALYSIS
4.I II{VESTIGATOR ERROR
The study involved 44 subjects each with three sets of complete records corresponding to
pre-treatment (T1), post-treatment (T2) and minimum 5 years post-treatment (T3). Two
calibrated operators each digitized 66 lateral cephalograms. Two weeks following the
initial digitization, each operator digitized the remaining 66 cephalograms and re-
digitized 66 of the other operator's cephalograms. The measurements were subjected to
statistical analysis to ensure intra-operator and inter-operator reliability.
A single operator performed the curve of Spee linear and area measurements. 20 percent
of the sample was re-measured and recorded two weeks following the initial
measurements to establish intra-operator reliability.
4.2 STATISTICAL ANALYSIS
Following consultation with an experienced statistician (Dr. T. Hassard), cephalometric
and curve of Spee data were entered into a Microsoft Excel spreadsheet (Microsoft Corp.,
Redmond WA) and descriptive statistics including means, standard deviations, minimum
39
and maximum values and confidence intervals were calculated for all variables at pre-
treatment, post-treatment and minimum 5-years post-treatment. Intra-group and inter-
group correlations were calculated for the measurement of the lateral cephalometric
radiographs and intra-group correlations were calculated for linear and area curve of Spee
measurements.
A paired t-test was performed to identify any differences between right and left curve of
Spee measurements. A Two-way analysis of variance (ANOVA) was performed to test
whether the initial curve of Spee at pre-treatment was statistically different among the
three facial patterns. ANOVA was also used to discern any possible gender effects or
facial pattern effects between the three time periods.
40
5.1
5.2
5.3
5.4
5.5
5.6
CHAPTER 5
RESULTS
Calibration
Vertical Classification
Comparison of curve of Spee right and left sides
Area curve of Spee measurements
Linear curve of Spee measurements
Curve of Spee changes
Page Number
42-44
45-48
48-49
49-5t
52-54
54-58
41
CHAPTER 5
RESULTS
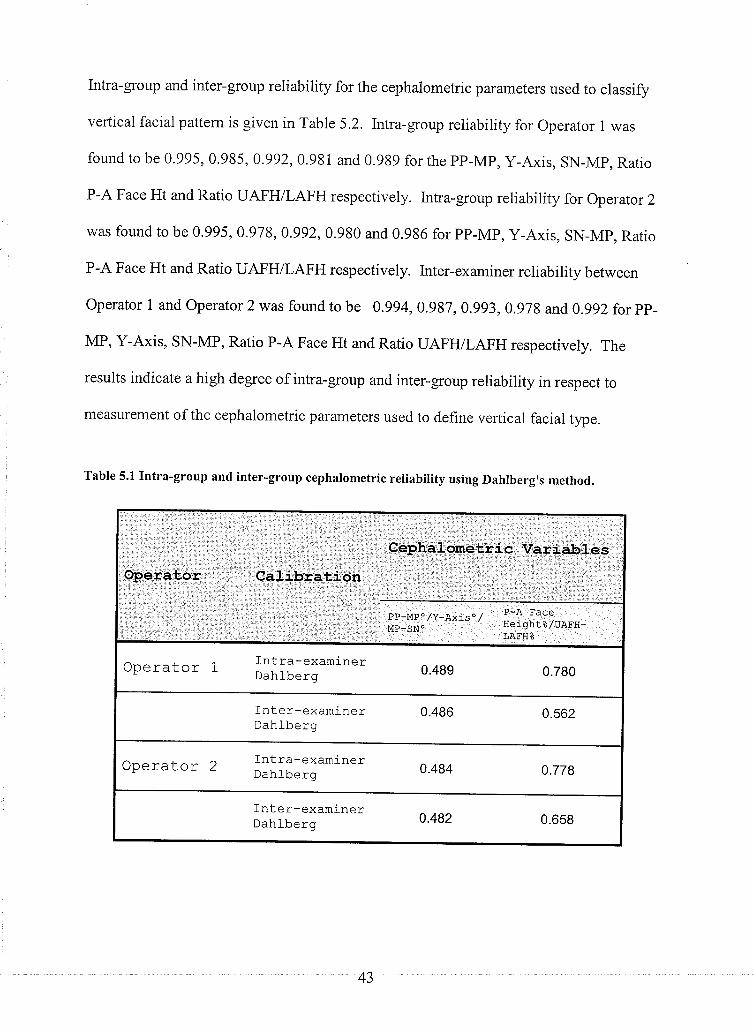
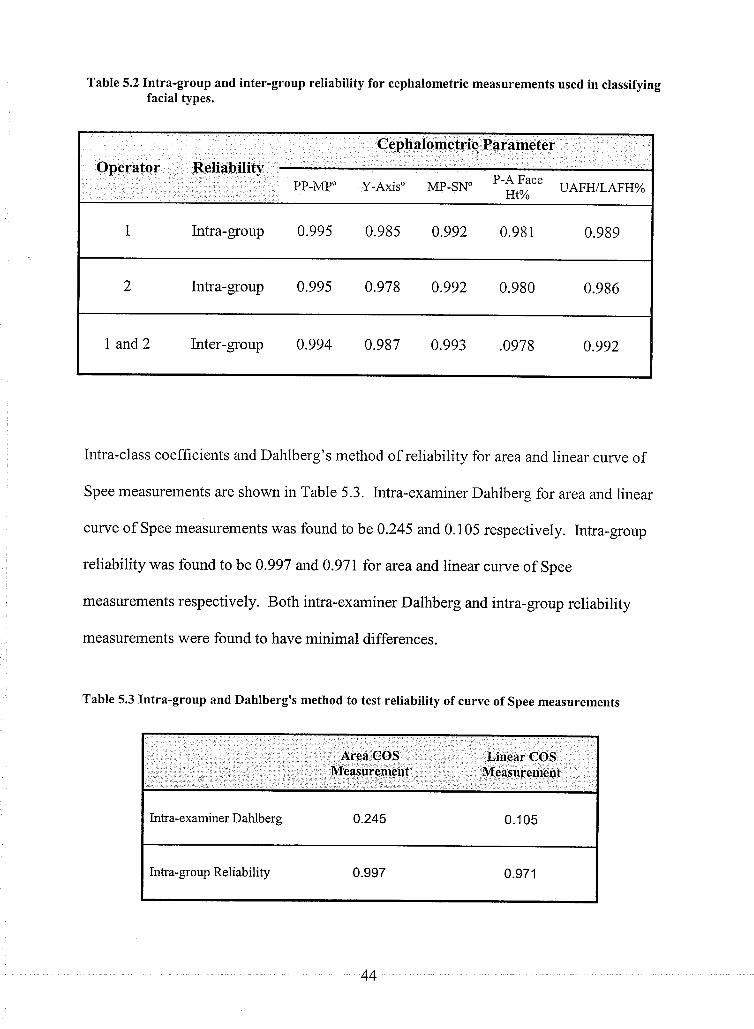
5.1 CALIBRATION
Reproducibility of measurements was assessed by statistically analyzingthe difference
between the initial measurements and measurements taken two weeks later. Intra-gïoup,
inter-group and Dahlberg's method of reliability were established for the cephalometric
variables used for classifying subjects based on vertical facial pattem. The results of the
intra-examiner and inter-examiner Dahlberg reliability test are given in Table 5.1. The
intra-examiner and inter-examiner Dahlberg for Operator 1 was found to be 0.4893 and
0.4863 for the angular measurements respectively. The intra-examiner and inter-examiner
Dahlberg for operator 2 was found to be 0.4836 and 0.4823 for the angular
measurements respectively. For ratio measurements, Operator 1 was found to have intra-
examiner and inter-examiner Dahlberg reliability scores of 0.780 and0.562 respectively.
Sirnilarly, Operator 2 was found to have scores of 0.778 and 0.658 for intra-examiner and
inter-examiner Dahlberg reliability. Intra-group and inter-group differences were found
to be well below one degree for angular measurements and one percent for ratio
measurements.
42
Intra-group and inter-group reliability for the cephalometric parameters used to classify
vertical facial pattern is given in Table 5.2. Intra-group reliability for Operator 1 was
found to be 0.995, 0.995, 0.992,0.991 and 0.ggg for the pp-Mp, y-Axis, sN-Mp, Ratio
P-A Face Ht and Ratio UAFH/LAFH respectively. lntra-group reliability for Operator 2
was found to be 0.995 ,0.978,0.992,0.980 and 0.986 for pp-Mp, y-Axis, sN-Mp, Ratio
P-A Face Ht and Ratio UAFH/LAFH respectively. Inter-examiner reliability between
Operator I and Operator 2 was found to be 0.994,0.987,0.993,0.978 and,0.992 for pp-
MP, Y-Axis, sN-MP, Ratio P-A Face Ht and Ratio UAFTVLAFH respectively. The
results indicate a high degree of intra-group and inter-group reliability in respect to
measurement of the cephalometric parameters used to define vertical facial type.
Table 5.1 Intra-group and inter-group cephalometric reliability using Dahlberg's method.
9þ.efa,tþr Cali'b'iãùion
Cgphálome,tri c Vêriabf ês,
PP-MPO/Y-AXiSO/ P-A FACE
¡¡p_.sñ.' HeightB/UAFH-LAFH*
Operator 1Intra-examinerDahlberg 0.489 0.780
Inter-examinerDahl-berg
0.486 0.562
Operator 2fntra-examinerDahlberg 0.484 0.778
fnter-examinerDahJ-berg 0.482 0.658
43
Operator ReliabilityPP-MP"
Cephalometric Parameter
y-Axis" Mp-sN. t-å,fft" uAFH/LAFH%
1 Intra-group 0.995 0.985 0.992 0.981 0.989
2 Intra-group 0.995 0.978 0.992 0.980 0.986
I and2 Inter-group 0.994 0.987 0.993 .0978 0.992
Table 5.2 Intra-group and inter-group reliability for cephalometric measurements used in classifyingfacial types.
Intra-class coefficients and Dahlberg's method of reliability for area and linear curve of
Spee measurements are shown in Table 5.3. Intra-examiner Dahlberg for area and linear
curve of Spee measurements was found to be 0.245 and 0. 1 05 respectively. lntra-group
reliability was found to be 0.997 and 0.97r for area and linear curve of Spee
measurements respectively. Both intra-examiner Dalhberg and intra-group reliability
measurements were found to have minimal differences.
Table 5.3 Intra-group and Dahlberg's method to test reliability of curve of Spee measurements
Area COS .
MeasuremèntLiùear COS
Measur:ement
lntra-examiner Dahlbers 0.245
0.997
0.105
0.971Intra-group Reliability
44
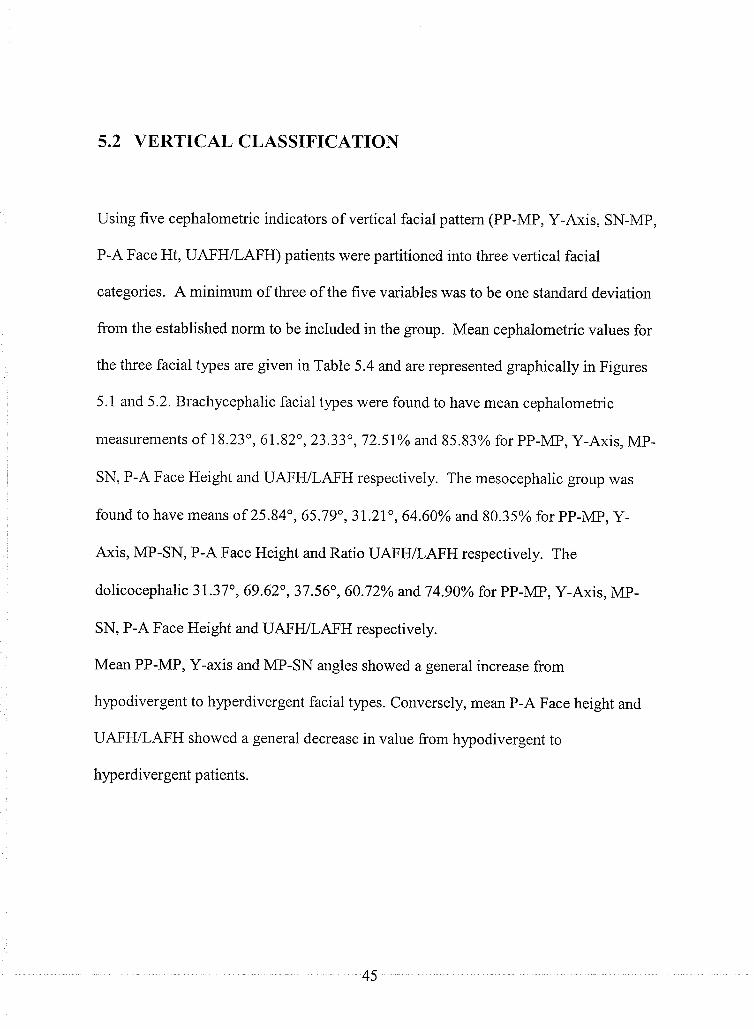
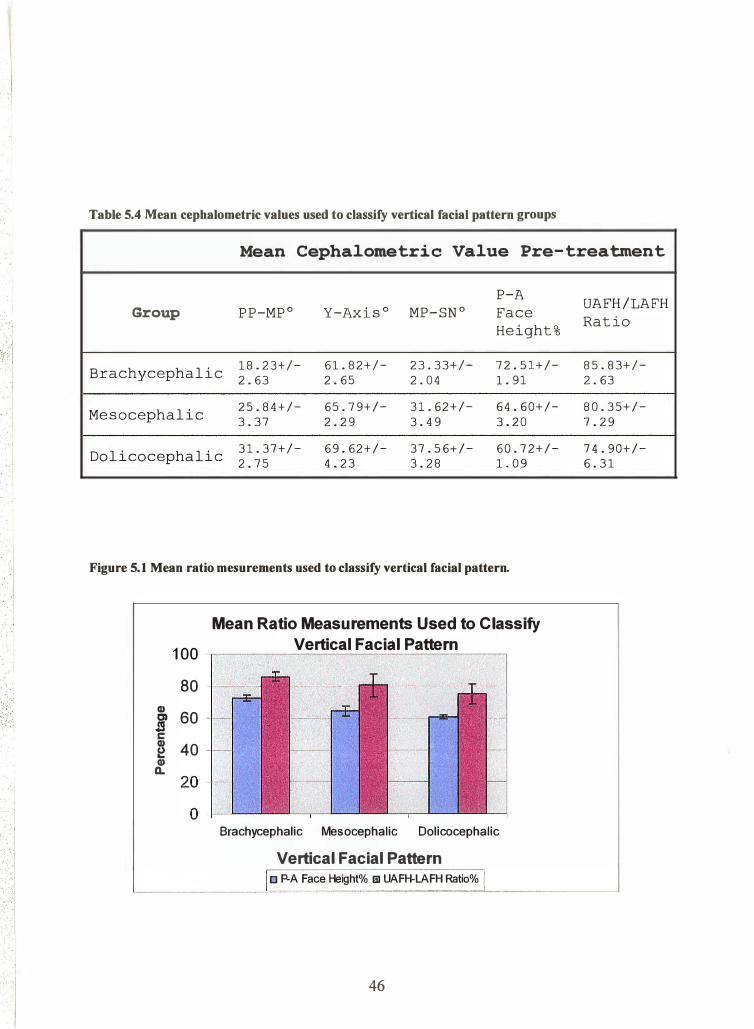
5.2 VERTICAL CLASSIFICATIOI\
Using five cephalometric indicators of vertical facial pattern (PP-MP, Y-Axis, SN-MP,
P-A Face Ht, UAFI{/LAFH) patients were partitioned into three vertical facial
categories. A minimum of three of the five variables was to be one standard deviation
from the established norrn to be included in the group. Mean cephalometric values for
the three facial types are given in Table 5.4 and are represented graphically in Figures
5. 1 and 5.2. Brachycephalic facial types were found to have mean cephalometric
measurements of 18.23",61.82o,23.33",72,5I% and 85.83% for PP-MP, Y-Axis, Mp-
SN, P-A Face Height and UAFH/LAFH respectively. The mesocephalic group was
found to have means of 25.84",65.79",31..2I",64.60% and80.35Yo for PP-MP, Y-
Axis, MP-SN, P-A Face Height and Ratio UAFIVLAFH respectively. The
dolicoceph alic 3l .37" , 69 .62" , 37 .56" , 60.72% and 7 4.90%o for PP-MP, Y-Axis, Mp-
SN, P-A Face Height and UAFIVLAFH respectively.
Mean PP-MP, Y-axis and MP-SN angles showed a general increase from
hypodivergent to hyperdivergent facial types. Conversely, mean P-A Face height and
UAFH/LAFH showed a general decrease in value from hypodivergent to
hyperdivergent patients.
45
. ·i
.· . ··.· .. 1 .... , '
Table 5.4 Mean cephalometric values used to classify vertical facial pattern groups
Mean Cephalometric Value Pre-treatment
P-A
Group PP-MP0 Y-Axis0 MP-SN° Face
Height%
Brachycephalic 18.23+/- 61.82+/- 23.33+/- 72.51+/-
2.63 2.65 2.04 1. 91
Mesocephalic 25.84+/- 65.79+/- 31.62+/- 64.60+/-
3.37 2.29 3. 49 3.20
Dolicocephalic 31.37+/- 69.62+/- 37.56+/- 60.72+/-
2.75 4.23 3.28 1. 09
Figure 5.1 Mean ratio mesurements used to classify vertical facial pattern .
Mean Ratio Measurements Used to Classify
Vertical Facic:tl Pattern 100 -,------------------,
80 -!---CD j 60 c � 40 CD a.
Brachycephalic Mesocephalic Dolicocephalic
Vertical Facial Pattern o P.A Face Height% o UAFH-LAFH Ratio%
46
UAFH/LAFH
Ratio
85.83+/-
2.63
80.35+/-
7.29
74.90+/-6.31
·I I
·I
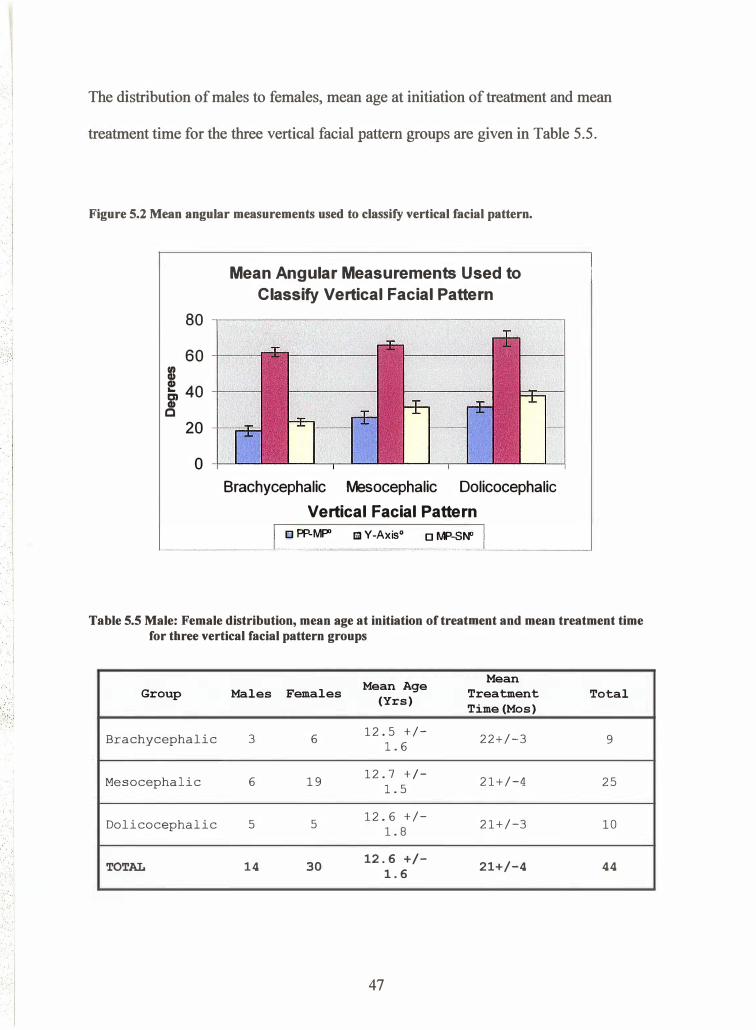
The distribution of males to females, mean age at initiation of treatment and mean
treatment time for the three vertical facial pattern groups are given in Table 5.5 .
Figure 5.2 Mean angular measurements used to classify vertical facial pattern.
80
60 1ft I! 40 � c
20
0
Mean Angular Measurements Used to
Classify Vertical Facial Pattern
Brachycephalic Mesocephalic Dolicocephalic
Vertical Facial Pattern
o PP-MflO Ei1 Y -Axis0 D MP-SN"
Table 5.5 Male: Female distribution, mean age at initiation of treatment and mean treatment time for three vertical facial pattern groups
Mean Age Mean Group Males Females Treatment Total (Yrs) Time (Mos)
Brachycephalic 3 6 12.5 +/-
22+/-3 9 1.6
Mesocephalic 6 19 12.7 +I-
21+/-4 25 1.5
Dolicocephalic 5 5 12.6 +/-
21+/-3 10 1.8
TOTAL 14 30 12.6 +/- 21+/-4 44 1.6
47
. I I
-1
.... _. � . ·. :. : .. ,
The total sample was composed of 44 subjects. Vertical facial pattem groups were
composed of 3 male and 6 female subjects in the brachyfacial group, 6 males and 19
females for the mesofacial group and 5 males and 5 females in the dolicofacial group .
Mean age at the initiation of treatment was found to be similar between the groups with
12.5+/-1.6, 12.7+/-1.5 and 12.6+/-1.6 yrs for the brachyfacial, mesofacial and
dolicofacial groups respectively. Mean treatment times were also similar between the
groups with subjects having 22+/-3, 21+/-4, 21+/-3 and 21+/-4 months of treatment for
the brachcephalic, mesocephalic and dolicocephalic facial types respectively.
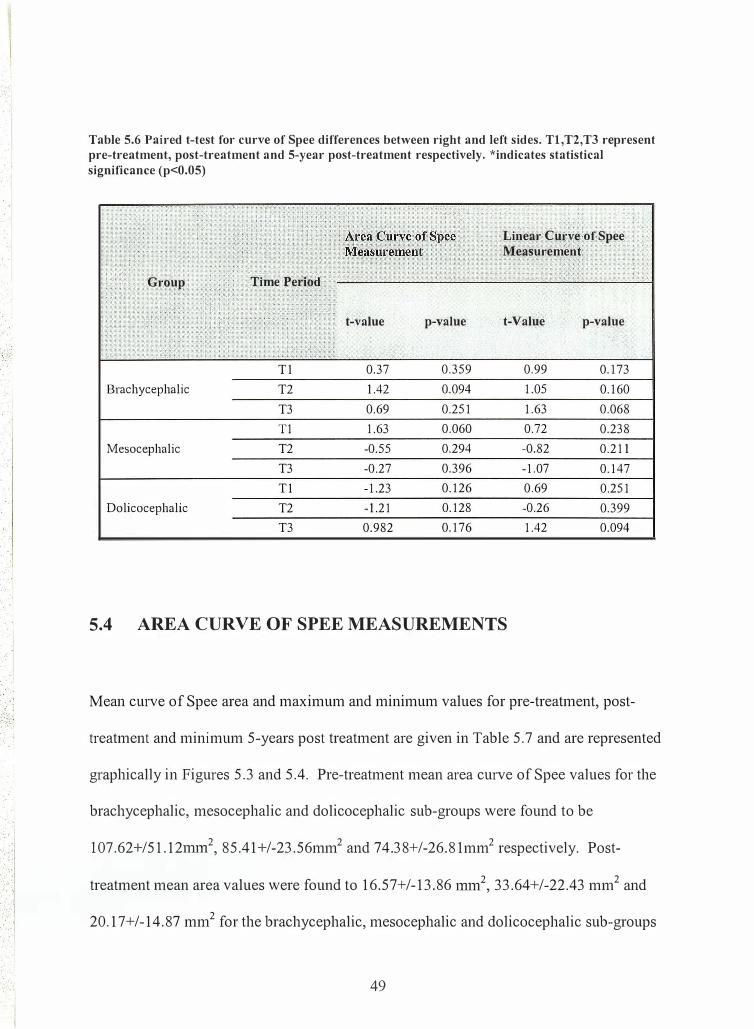
5.3 COMPARISON OF CURVE OF SPEE RIGHT AND LEFT SIDES
The linear and area curve of Spee measurements were perfonned on both the left and
right sides of the 44 subjects included in this study. The resulting 132 measurements for
each linear and area curve of Spee measurements were compared statistically using a
paired t-test. The results shown in Table 5.6 indicate that there were no significant
statistical differences (p>0.01) between the right and left measurements. The right and
left sides were therefore averaged for further statistical comparison
48
. .
:: � ......
::0 0 :.1
Table 5.6 Paired t-test for curve of Spee differences between right and left sides. Tl,T2,T3 represent pre-treatment, post-treatment and 5-year post-treatment respectively. *indicates statistical significance (p<0.05)
Linear Curve of Spee Measurement
Group Time Period
t-value p-value t-Value
Tl 0.37 0.359 0.99 Brachycephalic T2 1.42 0.094 1.05
T3 0.69 0.251 1.63 T1 1.63 0.060 0.72
Mesocephalic T2 -0.55 0.294 -0.82 T3 -0.27 0.396 -1.07 Tl -1.23 0.126 0.69
Dolicocephalic T2 -1.21 0.128 -0.26 T3 0.982 0.176 1.42
5.4 AREA CURVE OF SPEE MEASUREMENTS
p-value
0.173 0.160 0.068 0.238 0.211 0.147 0.251 0.399 0.094
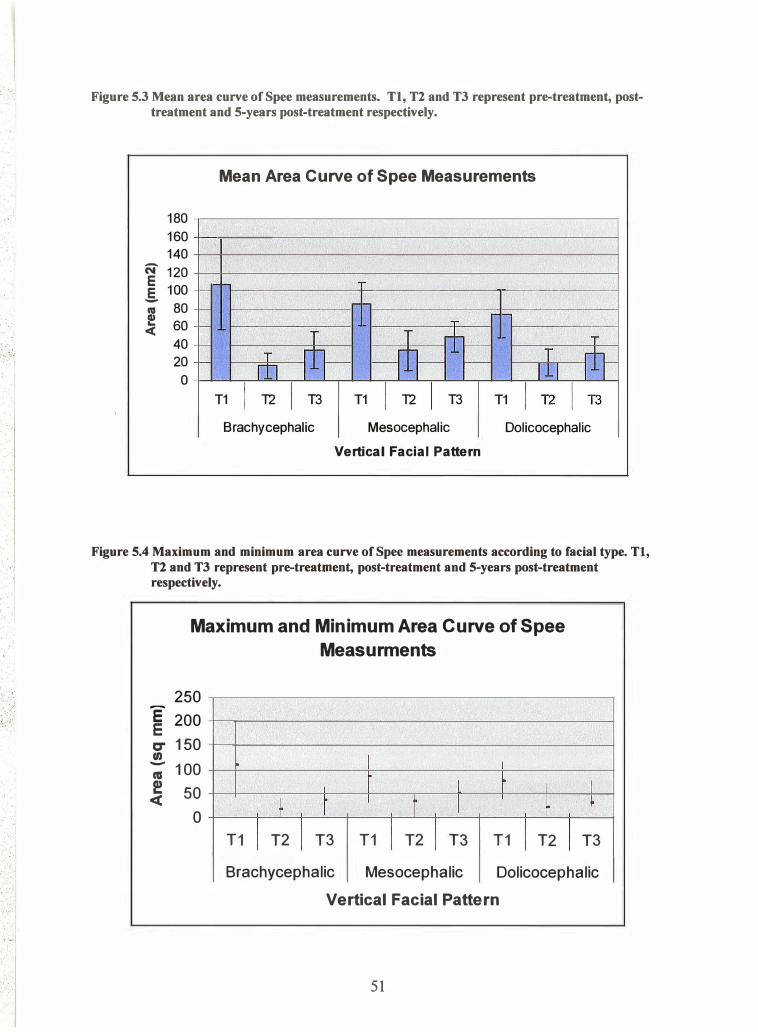
Mean curve of Spee area and maximum and minimum values for pre-treatment, post-
treatment and minimum 5-years post treatment are given in Table 5.7 and are represented
graphically in Figures 5.3 and 5.4. Pre-treatment mean area curve of Spee values for the
brachycephalic, mesocephalic and dolicocephalic sub-groups were fotmd to be
107.62+/51.12mm2, 85.41+/-23.56mm2 and 74.38+/-26.81mm2 respectively. Post-
treatment mean area values were found to 16.57+/-13.86 1mn2, 33.64+/-22.43 mm2 and
20.17+/-14.87 mm2 for the brachycephalic, mesocephalic and dolicocephalic sub-groups
49
. ..
. .
. . .
.. .
, .
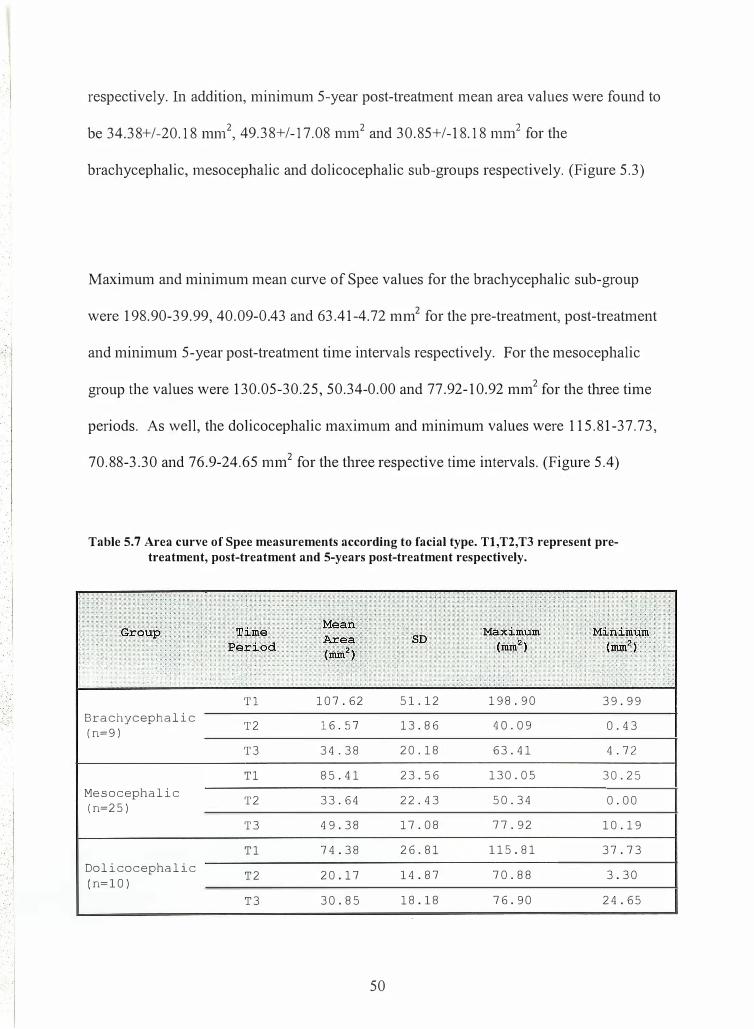
respectively. In addition, minimum 5-year post-treatment mean area values were found to
be 34.38+/-20.18 mm2, 49.38+/-17.08 mm2 and 30.85+/-18.18 mni for the
brachycephalic, mesocephalic and dolicocephalic sub-groups respectively. (Figure 5.3)
Maximum and minimum mean curve of Spee values for the brachycephalic sub-group
were 198.90-39.99, 40.09-0.43 and 63.41-4.72 mm2 for the pre-treatment, post-treatment
and minimum 5-year post-treatment time intervals respectively. For the mesocephalic
group the values were 130.05-30.25, 50.34-0.00 and 77.92-10.92 mm2 for the three time
periods. As well, the dolicocephalic maximum and minimum values were 115.81-37.73,
70.88-3.30 and 76.9-24.65 mm2 for the three respective time intervals. (Figure 5.4)
Table 5.7 Area curve of Spee measurements according to facial type. Tl,T2,T3 represent pretreatment, post-treatment and 5-years post-treatment respectively.
T1 107.62 51.12 198.90 39.99 Brachycephalic T2 16.57 13.86 40.09 0.43 (n=9)
T3 34.38 20.18 63. 41 4. 72
T1 85.41 23.56 130.05 30.25 Mesocephalic T2 33.64 22.43 50.34 0.00 (n=25)
T3 49.38 17.08 77.92 10.19
T1 74.38 26.81 115.81 37.73 Dolicocephalic T2 20.17 14.87 70.88 3.30 (n=10)
T3 30.85 18.18 76.90 24.65
50
... • ;� f
. ;-. ' . . .. ,: . .
' . . ·. � . . :� : . .. . .' . ... ... .. 1
' ._, · . .. I
�
. ' . . . . '
... . . . ' .. . • .
... '
Figure 5.3 Mean area curve of Spee measurements. Tl, T2 and T3 represent pre-treatment, posttreatment and 5-years post-treatment respectively.
Mean Area Curve of Spee Measurements
180 160 140 -N 120 E
E 100 1---m 80 ... 60 <(
40 20 0
I- 1-1-- T
I- I HJ-t:= T
1-- T ill- T 0-m llJ T1 I 12 I T3 T1 I 12 I T3 T1 1121T3
Brachycephalic Mesocephalic Dolicocephalic Vertical Facial Pattern
Figure 5.4 Maximum and minimum area curve of Spec measurements according to facial type. Tl, T2 and T3 represent pre-treatment, post-treatment and 5-years post-treatment respectively •
Maximum and Minimum Area Curve of Spee Measurments
250 E 200 E C" 150 tn - 100 lU ! 50 <(
0 T1 I
� T2 I
I t I
T3 T1 I T2
I
L r I I t
I T3 T1 I T2
I �
I T3
Brachycephalic Mesocephalic Dolicocephalic
Vertical Facial Pattern
51
· .....
I . I
5.5 LINEAR CURVE OF SPEE MEASUREMENTS
Mean curve of Spee linear and maximum and minimum values for pre-treatment, post-
treatment and 5 years post treatment is given in Table 5.8 and are represented graphically
in Figures 5.5 and 5.6. Pre-treatment mean linear curve of Spee values for the
brachycephalic, mesocephalic and dolicocephalic sub-groups were found to be 5.59+/-
2.73nm1, 4.14+/-1.2hlll1 and 4.20+/-1.34mm respectively. Post-treatment mean area
values were detennined as 0.74+/-0.63 mm, 2.15+/-1.16mm and 1.47+/-1.16mm for the
brachycephalic, mesocephalic and dolicocephalic sub-groups respectively. In addition,
minimum 5-year post-treatment mean area values were found to be 1.81 +/-0.9lnnn,
2.80+/-0.69mm and 2.05+/-0.89mm for the brachycephalic, mesocephalic and
dolicocephalic sub-groups respectively. (Figure 5.5)
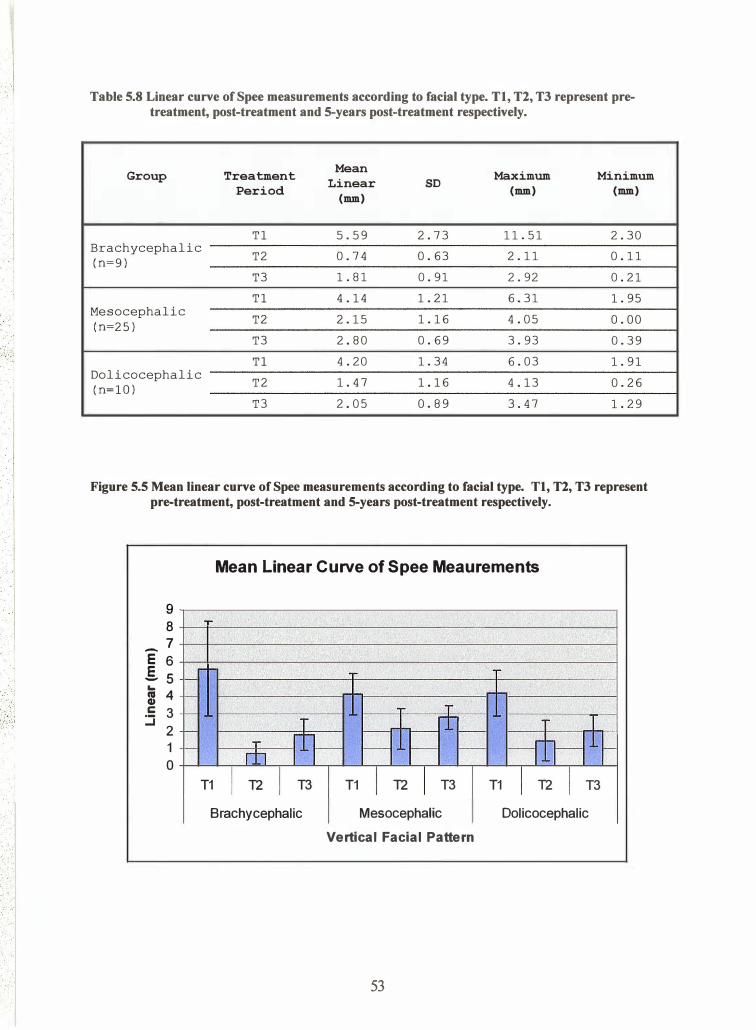
Maximum and minimum mean curve of Spee values for the brachycephalic sub-group
were 11.51-2.30, 2.11-0.11 and 2.92-0.21mm for the pre-treatment, post-treatment and
minimum 5-year post-treatment time intervals respectively. For the mesocephalic group
the values were 6.31-1.95, 4.05-0.00 and 3.93-0.39mm for the tln·ee time periods
specified. As well, the dolicocephalic maximum and minimum values were 6.03-1.91,
4.13-0.26 and 3.47-1.29mm for the tln·ee respective time intervals. (Figure 5.6)
52
I I
· .. •
.I
Table 5.8 Linear curve of Spee measurements according to facial type. Tl, T2, T3 represent pretreatment, post-treatment and 5-years post-treatment respectively.
Group Treatment Mean Maximum Minimum Linear SD Period (mm) (mm) (mm)
Tl 5.59 2.73 11.51 2.30 Brachycephalic
T2 0.74 0.63 2.11 0.11 (n=9)
T3 1. 81 0.91 2.92 0.21
Tl 4.14 1. 21 6.31 1. 95 Mesocephalic
T2 2.15 1.16 4.05 0.00 (n=25)
T3 2.80 0.69 3.93 0.39
Tl 4.20 1. 34 6.03 1. 91 Dolicocephalic
T2 1. 47 1.16 4.13 0.26 (n=lO)
T3 2.05 0.89 3.47 1. 29
Figure 5.5 Mean linear curve of Spec measurements according to facial type. Tl, T2, T3 represent pre-treatment, post-treatment and 5-years post-treatment respectively.
9 8
_7 E 6 .5..s ...
m 4 :5 3
2 1 0
-
-
-
-
-
Mean Linear Curve of Spee Meaurements
.. .. T �
T
=rt= T - l
T fil-- - --r.h--11� rtJ T1 I T2 I T3 T1 I T2 I T3 T1 I T2 I T3
Brachycephalic Mesocephalic Dolicocephalic Vertical Facial Pattern
53
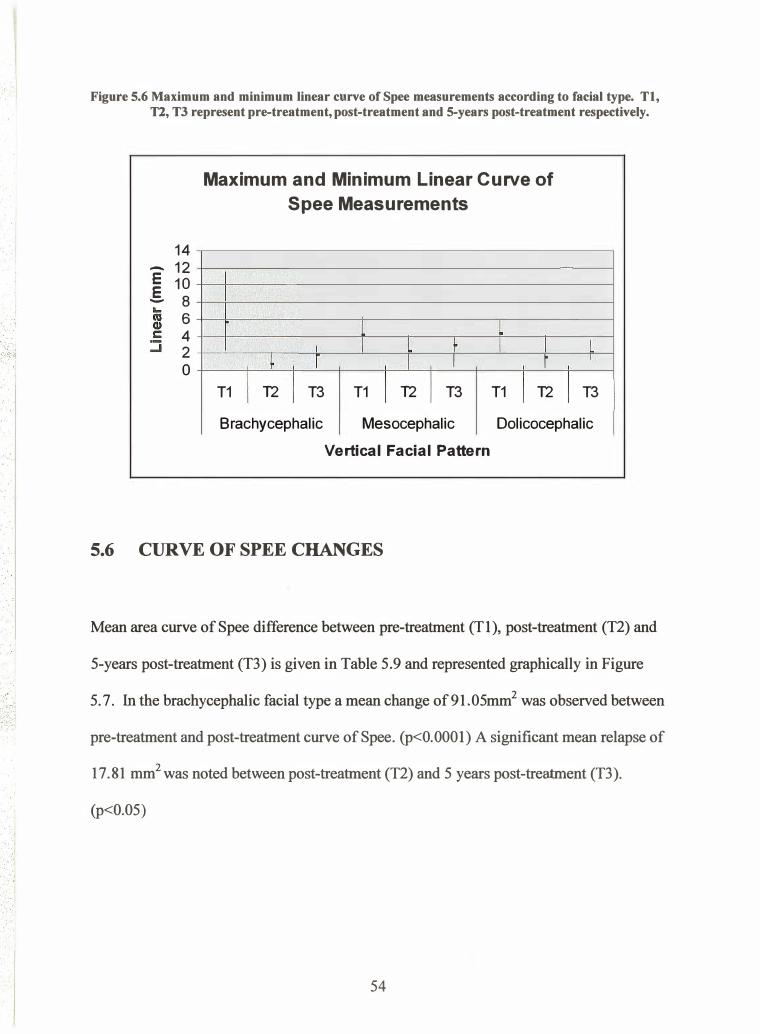
Figure 5.6 Maximum and minimum linear curve of Spee measurements according to facial type. Tl, Tl, T3 represent pre-treatment, post-treatment and 5-years post-treatment respectively.
14 - 12 E 10 .§. 8
6 4 2 0
Maximum and Minimum Linear Curve of Spee Measurements
l l I I L r I I
� r I I r T1 I T2 I T3 T1 I T2 I T3 T1 I T2
L I
I T3
Brachycephalic Mesocephalic Dolicocephalic
Vertical Facial Pattern
5.6 CURVE OF SPEE CHANGES
Mean area curve of Spee difference between pre-treatment (Tl ), post-treatment (T2 ) and
5-years post-treatment (T3) is given in Table 5. 9 and represented graphically in Figure
5.7. In the brachycephalic facial type a mean change of 91.05mm2 was observed between
pre-treatment and post-treatment curve of Spee. (p<O.OOOl) A significant mean relapse of
17.81 mm2 was noted between post-treatment (T2 ) and 5 years post-treatment (T3).
(p<0.05)
54
... : �
i . . I
... · j · .. : . · . . .. . ... . ·, ._. · : · : .-1 · •• ! •
' ' , ' I t
Table 5.9 Mean area curve of Spee changes between pre-treatment (Tl), post-treatment (T2), and 5 years post-treatment (T3)
(*-Denotes statistical significance p<0.05 **-denotes statistical significance p<O.Ol ***denotes statistical significance p<O.OOl)
Mean Standard
Group Time Interval Difference Error
P Value Area (mm2)
Time Tl---+ T2 91.05 17.45 <0.0001***
Brachycephalic Time Tl---+ T3 73.24 16.88 <0.0001 ***
(n=9) Time T2---+ T3 -17.81 4.35 0.0485*
Time Tl---+ T2 54.29 5.65 <0.001 *** Mesocephalic Time Tl---+ T3 43.61 6.22 0.0002*** (n=25)
Time T2---+T3 -10.68 2.27 0.0976
Time Tl---+ T2 51.77 8.91 <0.0001 *** Dolicocephalic
Time Tl---+ T3 36.03 2.28 <0.0001 *** (n=IO)
Time T2---+T3 -15.74 5.99 0.0819
Figure 5.7 Mean area curve of Spee changes according to facial type. Tl, T2, T3 represent pretreatment, post-treatment and 5-years post-treatment respectively.
Mean Area Curve of Spee Changes
120 100
0: 80 - -tn 60 E E 40 -ca 20 e
,____ 1- M
r± �+ -t - 1- r:t=" - 1- - 1-
<C 0 -20 Ld I.;J kJ -
-40 T1-+T2 T1-+T3 T2-+T3 T1-+T2 T1-+T3 T2-+T3 T1-+T2 T1-+T3 T2-+T3
Brachycephalic Mesocephalic Dolicocephalic
Vertical Facial Pattern
55
' .:1
. .
. I
. .. . -. ·L-�-}
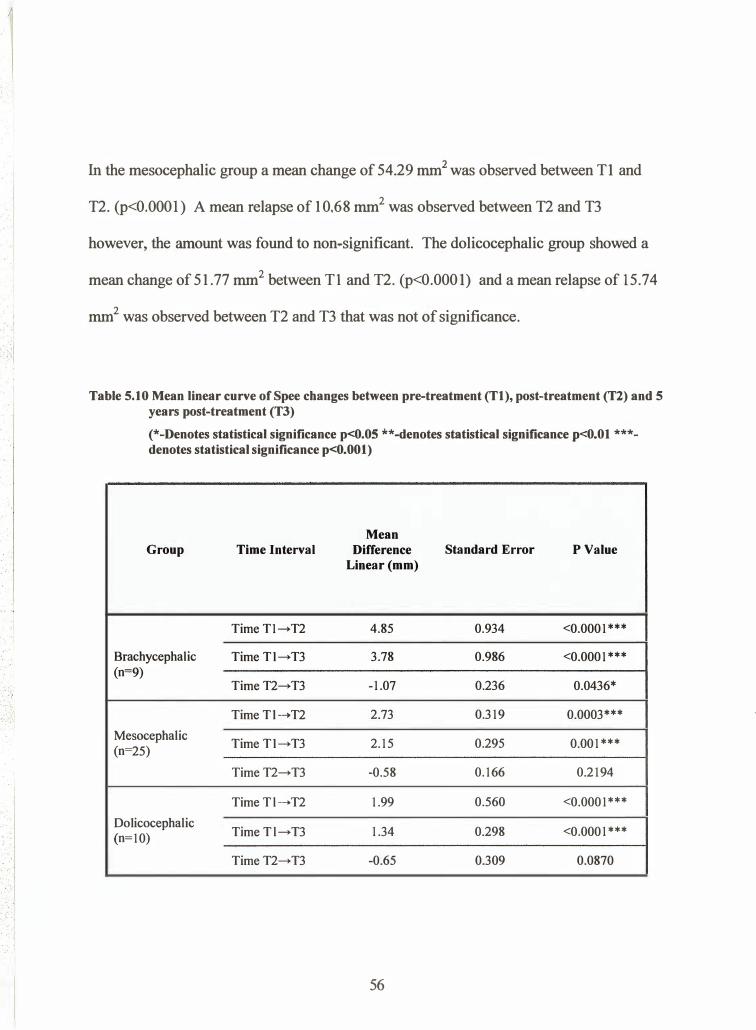
In the mesocephalic group a mean change of 54.29 mm2 was observed between Tl and
T2. (p<O.OOOI) A mean relapse of 10,68 mm2 was observed between T2 and T3
however, the amount was found to non .. significant. The dolicocephalic group showed a
mean change of 51.77 mm2 between Tl and T2. (p<O.OOOl) and a mean relapse of 15.74
mm2 was observed between T2 and T3 that was not of significance.
Table 5.10 Mean linear curve of Spee changes between pre-treatment (Tl), post-treatment (T2) and 5 years post-treatment (T3)
(*-Denotes statistical significance p<O.OS **-denotes statistical significance p<O.Ol ***· denotes statistical significance p<O.OOI)
Mean Group Time Interval Difference Standard Error P Value
Linear(mm)
TimeT1-+T2 4.85 0.934 <0.0001 ***
Brachycephalic Time Tl-+T3 3.78 0.986 <0.0001*** (n=9)
Time T2-+T3 -1.07 0.236 0.0436*
TimeTl-+T2 2.73 0.319 0.0003***
Mesocephalic Time Tl-+T3 2.15 0.295 0.001 ***
(n=25)
TimeT2-+T3 -0.58 0.166 0.2194
TimeTl-+T2 1.99 0.560 <0.0001 ***
Dolicocephalic TimeTl -+T3 1.34 0.298 <0.0001***
(n=10)
TimeT2-+T3 -0.65 0.309 0.0870
56
·'
.· .
.. · ,
,I
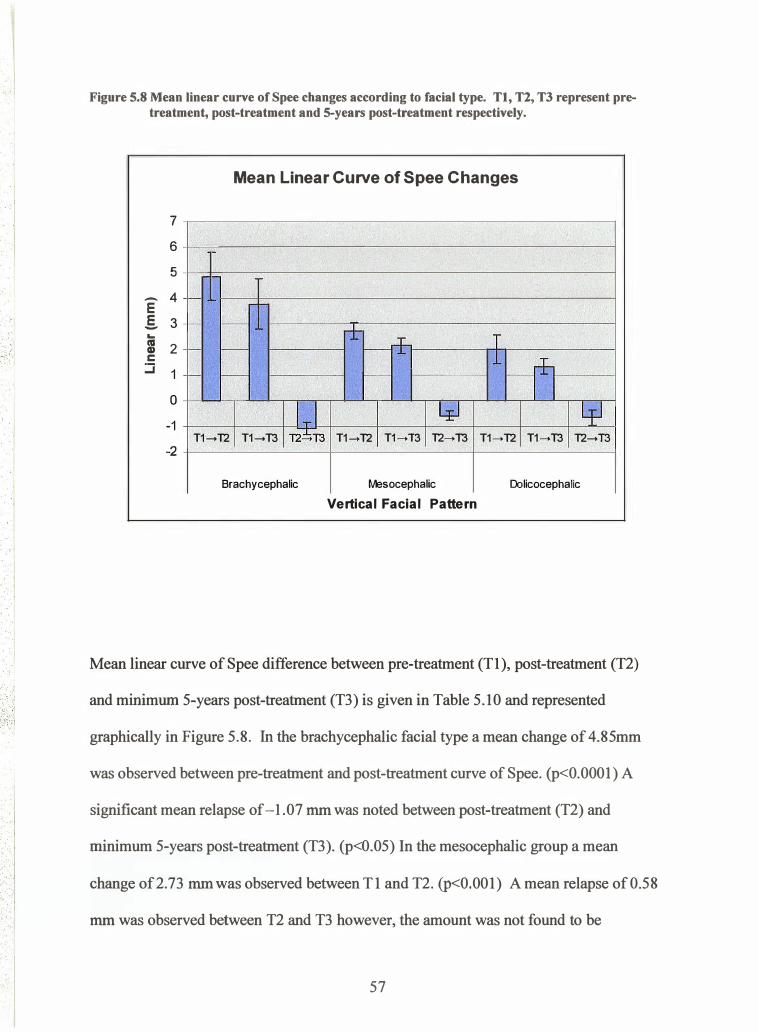
Figure 5.8 Mean linear curve of Spee changes according to facial type. Tl, T2, T3 represent pretreatment, post-treatment and 5-years post-treatment respectively.
Mean Linear Curve of Spee Changes
7 6 5
- 4 E - f-
§. 3 ... CIS 2 CD c ::::i 1
0 -1
-- --±
r--f T - - 1
r--n - - r-
IT_I ltl Lp T1-+T2 T1-+T3 T2"ET3 T1-+T2 T1-+T3 T2-+T3 T1-+T2 T1-+T3 T2-+T3
-2
Brachycephalic fv1esocephalic Dolicocephalic
Vertical Facial Pattern
Mean linear curve of Spee difference between pre-treatment (T1 ), post-treatment (T2)
and minimum 5-years post-treatment (T3) is given in Table 5. 10 and represented
graphically in Figure 5.8. In the brachycephalic facial type a mean change of 4. 85mm
was observed between pre-treatment and post-treatment curve of Spee. (p<O.OOOl) A
significant mean relapse of -1.07 mm was noted between post-treatment (T2 ) and
minimum 5-years post-treatment (T3). (p<0. 05) In the mesocephalic group a mean
change of 2.73 mm was observed between Tl and T2 . (p<O.OO l) A mean relapse of 0.58
mm was observed between T2 and T3 however, the amount was not found to be
57
statistically significant. The dolicocephalic group showed a mean change of 1.99 mm
between T1 and T2. (p<0.0001) A mean relapse of 0.65 mm was observed befween T2
and T3 that was not statistically significant.
58
6.r
6.2
6.3
6.4
6.s
6.6
6.7
6.8
6.9
CHAPTER 6
DISCUSSION
Page Number
Overview 60
Curve of Spee Measurement 60-61
Sample Seiection 62-63
Sex distribution 64
Comparison of Left and Right Side Curve of Spee Measurements 65
Facial Type and Initial Curve of Spee Depth 65-67
Curve of Spee Relapse 67 -69
Curve of Spee Relapse and Arch Perimeter 70
Null hypotheses deductions 7l
59
6.1
CHAPTER 6
DTSCUSSION
OVERVIEW
The exact significance of the curve of Spee in humans is largely unknown; although
several hypotheses have been suggested. (Wheeler, 1970; DuBrul, 1980; DuBrul, Osbom,
1982;Barager and Osborn, 1987; Enlow, 1990; Osborn, 1993; Ash and Ramfiord, 1995)
These studies suggest the formation and significance of the curve of Spee may be
attributed to morphological, biomechanical or adaptional processes. It is interesting
however, that no study has been completed previously to quantify the possible
relationships between vertical skeletal morphology and the curve of Spee. The present
study set out to investigate the association between vertical facial morphology and the
initial depth of curve of Spee and further, the amount of relapse following orthodontic
leveling.
6.2 CURVE OF SPEE MEASUREMENT
No standardized method has been developed in the literature to measure the curve of
Spee. This is intimately involved with the fact that no definitive description of the curve
of Spee has been established as related to orthodontics. Previous studies have used
lateral cephalograms (Braun and Schmidt,1956; Givins, 1970) or plaster study models
60
(Sondhi et al., 1980; Bishara, 1989; Braun et a1.,1996; De Praeter et al., 2002) to
measure the curve of Spee. Complicating this even further, several different
measurement techniques have been employed (Sondhi et al., 1980; Bishara,1989; Braun
et aL,1996; De Praeter et al., 2002).
Measurement of the curve of Spee using lateral cephalograms similar to that of Braun and
Schmidt (1956) and Givins (1970) was not performed in this study due to the inherent
difficulty in reliably establishing landmarks such as cusp tips on the cephalogram. As
well, it was felt that limitations of radiographic films such as projection errors would
decrease the reliability of the curve of Spee measurements.
In this study, the curve was reliably measured on study models using a method
established by Braun et al. (1996). This method was selected because it most closely
approximates the method most orthodontists employ clinically when establishing the
magnitude of the curve of Spee. ln clinical practice the curve of Spee is assessed by
placing a flat plane on the mandibular model that customarily contacts the incisor teeth
and the most distally placed molar. The depth is then either assessed visually from the
lateral aspect or measured bilaterally using a ruler or Boley gauge.
A novel way of measuring the curve of Spee was also introduced in the study, whereby
aîarea calculation of the curve of Spee was obtained. Previous investigations involved
measuring the curve through linear or best-fit curve measurements. It was hypothesized
that the area measurement as described in Figure 4, would eliminate possible errors due
61
to tooth malposition and would therefore more accurately reflect the character of the
curve.
6.3 SAMPLE SELECTION
This study evaluated the initial curve of Spee measurements and relapse tendencies of
patients partitioned according to vertical facial pattern. The records of approximately
350 subjects were subjected to the inclusion criteria listed in Table 2. These stringent
criteria were used to establish a population of 44 subjects that was as homogenous as
possible. Only non-extraction patients were selected to eliminate the possible effects of
extractions on the curve.
It was important for all teeth excluding the third molars to be present and fully erupted at
the start of treatment to minimizethe effects of tooth eruption on curve of Spee changes.
Obviously, as a patient enters the early permanent dentition stage from the late mixed
dentition stage, the character of the curve of Spee would change due solely to the tooth
eruption process. It was necessary to minimize these effects through selection of patients
whereby the majority of the active tooth eruptive phase was completed. (Age l}-l7Yrs)
Influences on the curve of Spee from antero-posterior displacements were minimized
through selection of only Angle Class I and Class II subjects. Orthlieb (1997) found that
the radius of the curve of Spee was smaller in Angle Class III malocclusions compared to
Class [I malocclusions. Class III malocclusions were eliminated from the study partly on
62
this basis and because of the fact that these patients represent only a small segment of the
population. Braun and Schmidt (1956) evaluated possible differences in the curve of
Spee with different Angle classifications and found that no significant differences could
be established between Angle Class I and Class II malocclusions. Contrary to this, Farella
et at.2002 found that the position of the mandibular condyle in relation to the occlusal
plane influences the COS and as the mandibular dentition moves forward the curve is less
pronounced
Records of patients a minimum of 5 years post-treatment were also required. It was felt
that a minimum period of 5 years was necessary to establish relapse potential of the
orthodontic treatment. Several authors who contend that a minimum of 5 years must
elapse before post-treatment changes can be considered to be complete share this view.
(Gianelly and Goldman,I9Tl; Sondi et al., 1980)
Five cephalometric indicators of vertical facial pattern (PP-MP, Y-Axis, SN-MP, p-A
Face Ht, UAFH/LAFH) were applied to the sample to create three separate vertical facial
pattern sub-groups. A hypo-divergent sub-group (n:9), a normal sub-group (n:24) and. a
hyper-divergent sub-group (n:10) formed the basis of the study. To be included in a
particular sub-group, a minimum of three of the five variables was to be one standard
deviation from the established norrn. Mean cephalometric values for the three facial
types are given in Table 7. MeanP-A Face Ht and UAFIVLAFH were found to decrease
from hypo-divergent to hyper-divergent facial types and mean PP-MP, Y-axis and MP-
SN angles showed a general increase from hypo-divergent to hyper-divergent facial
63
types. This is in agreement with Buschang et al. (2002) who suggests that subjects who
demonstrate increased MP-SN angles, increased LAFH measurements, increased LAFH/
UAFH ratios and decreased P-A Face Ht are likely to exhibit a hyper-divergent facial
type and would show a corresponding increase in these measurements.
6.4 SEX DISTRIBUTION
The sex distribution, mean treatment time and mean age at the initiation of treatment for
the three vertical facial sub-groups is outlined in Table 8. The data demonstrates an
overall bias toward female subjects (n:30) compared to male (n:14). The
brachycephalic sub-group was found to have a2:I ratio of female (n:6) to male (n:3)
compared to the mesocephalic sub-group that was found to have a greater than 3: 1 female
(n:19) to male (n:6) distribution. The dolicocephalic sub-group was found to be equally
distributed befween females (n:5) and males (n:5). The significance of the skewed sex
distribution is probably of little consequence. In the subjects investigated, the initial
curve of Spee measurement, post-treatment measurement and post-treatment relapse were
not found through two-way ANOVA to exhibit a gender effect. This lack of sexual
dimorphism in curve of Spee measurements is consistent with previous investigations and
is confirmed in this study. (Ferrario et al., 1992; Ferrario et a1.,1997; Orthlieb, 1997;
Farella,2002)
64
6.5 COMPARISON OF LEFT AND RTGHT SIDE CURVE OF SPEE
MEASURTMENTS
Linear and area curye of Spee measurements were performed on both the left and right
sides of the 44 subjects included in this study. The measurements for each linear and
area curve of Spee measurements were compared statistically using a paired t-test and
found to have no statistical differences between sides. (p>0.01) This is in agreement with
a previous investigation by Caracara et al. (2001) that found no differences in the
magnitude of the curve of Spee between right and left sides. However, Ferrario et al
( 1991) found when describing the curve of Spee that the right hand side of the curve of
Spee was significantly flatter compared to the left side in male subjects.
6.6 FACIAL TYPE AND INITIAL CURVE OF SPEE DEPTH
One of the main objectives of the study was to discem whether vertical facial type had an
association with initial curve of Spee value. Curve of Spee values for each of the time
periods pre-treatment (T1), post-treatment (T2) and minimum 5-years post-treatment (T3)
are presented in Tables 10 and 1i. The pre-treatment curve of Spee area measurements
presented in Table 10 were found to be larger for the brachycephalic sub-group compared
to the mesocephalic and dolicocephalic subgroups. The pre-treatment linear values
demonstrated in Table 11 showed a similar trend with the brachycephalic sub-group
65
showing the largest curve of Spee magnitude. The linear and area values were not
however found to be statistically significantly different from the two other facial types.
Farella (2002) found through regression analysis that the curve of Spee was of greater
magnitude in short faced individuals. The results of this study tend to support this
contention although they cannot be confirmed due to lack of statistical significance.
A wide degree of individual variability was observed for the three vertic al facial types at
all th¡ee time periods. (Tables 10 and 11) For example the pre-treatment area curve of
Spee measurements for the hypo-divergent facial type were found to have a mean value
oî lO7.62mm2 with a standard deviation of 51.12. The maximum and minimum values
were recorded as 198.90 and.39.99 mm2 respectively with a range of 158.91 mm2. This
wide range of individual variability in curve of Spee measurements is consistent with
previous investigations. (Carcara,200r; Farella et al., 2002; Kuitert et a1.,2002)
The curve of Spee was found to significantly decrease from pre-treatment (T1) to post-
treatment (T2) time periods in all vertical facial pattern sub-groups. (Tables 12 and,13)
The time period from Tl to T2 represents the change due to active orthodontic
intervention and resulted in a general flattening of the curve of Spee. This is not
surprising given that a relatively common objective in orthodontic treatment involves
curve of Spee reduction. (Andrews, 1972) The curve of Spee was found to be leveled to
a greater extent in the brachycephalic sub-group represented by the closer approximation
to 0 for both the linear (Table 10) and area (Table 11) measurements. The area and linear
66
values at post-treatment (T2) were not statistically significantly different for the three
verlical factal pattern sub-groups and were considered similar.
6.7 CURVE OF SPEE RELAPSE
A second major objective of the study was establishing the relapse tendency of the curves
of Spee as a function of vertical facial pattem. The changes of curve of Spee from post-
treatment (T2) to minimum 5-years post-treatment (T3) were defined as the relapse of the
curve of Spee toward pre-treatment values. The data from Tables 12 and 13 indicate a
statistically significant change toward pre-treatment values for the brachycephalic sub-
group for both area (Table 12) and linear (Table 13) measurements. (p<0.05) This is a
similar finding to that of Givins (1970) who found that low mandibular plane angle cases
showed the greatest amount of curve of Spee relapse compared to any other sub-group in
his 33 subject sample. A general relapse toward pre-treatment values is seen for all
facial types however the mesocephalic and dolicocephalic facial type changes were not
statistically significant. The results are charactenzed graphically in Figures 7 and 8.
The significance of the curve of Spee is widely known. Osborn ( 1 993) argues against the
widespread doctrine in dentistry that the three variables of articular eminence inclination,
molar cusp height and incisor overbite are not related to curve of Spee depth. It has also
been identified that most other mammals have curves of Spee, yet they do not have
incisor overbite or steep articular eminences. (Osbom 1987,Barager et al 1987) As well,
67
many cusp tips are worn flat throughout the life of an individual through a natural process
of attrition. The curve of Spee is therefore likely to serve a similar function in humans as
that of animals and is a function of skeletal morphology rather than serving an adaptive
role as part of the dentition. This study suggests an association between an increased pre-
treatment curve of Spee depth in hypo-divergent facial types similar to that of Farella
(2002); however, the values were not found to be different to a statistically significant
degree. Farella et al. (2002) found that the curve of Spee is highly variable befween
individuals and influenced only a minor extent by craniofacial morphology. The group
suggested however that the depth of the curve of Spee was influenced by the ratio
between posterior and anterior face height indicating vertical facial patterning.
Relapse of the curve of Spee has been described by several investigators as being a
normal physiologic process. (Andrews, 1972;Koyama,1979; Ash, 19g4) Some
investigators have determined that an orthodontically leveled curve of Spee is a relatively
stable procedure (Hechter, 1975:' De Praeter,2002) whereas others have noted relapse
tendencies. (Givins, 1970; Kuitert, 2000; Carcara;2001) The extent of relapse as well as
identification of possible contributing factors has not however been extensively studied.
Carcara et al. (2001) found a statistically significant change (P<.001) in the curve of Spee
following removal of retention appliances in Angle Class I and Class II cases. He found
that the curves increased from a mean of 0.1lmm post-treatment to a mean of 0.48mm
aftet a significant post-retention period. The curves of Spee in these cases were found to
relapse on average 0.37mm over a 7 year 5 month period. The results of this study are
similar to the present study although they are of differing magnitudes. For the
brachycephalic group the mean relapse was calculated as 1.07mm and 17.88mm2 for the
68
linear and area curve of Spee measurements respectively. For the mesocephalic and
dolicocephalic groups the measurements were found to be less at 0.58mm, 10.68 mm2
and 0.65mm, 15.7 4 mm2 respectively.
A possible explanation of the identified increase in curve of Spee relapse in the hypo-
divergent facial type comes from biomechanical differences associated with different
vertical facial types. It has been suggested by avariety of authors that the curve of Spee
may offer a functional biomechanical advantage in that the curve allows masticatory
forces to be directed along the long axis of the premolar and molar teeth. (DuBrul, 1980;
Osborn, 1982;Barager and Osborn 1987) Importantly, investigators have also found that
short faced individuals generate higher occlusal masticatory forces compared to long-
faced individuals. (Ringqvist,1973; Proffit et al., 1981) It is therefore likely that hypo-
divergent individuals would experience the greatest relapse of the curve of Spee toward
pre-treatment values due to the increased strength of the masticatory system
demonstrated by these individuals. To add further support to this hypothesis, Osborn
(1993) found a positive correlation between the curve of Spee and the inclination of the
masseter muscle. He found that the angulation of the mandibular molars closely
approximated the orientation of the superficial fibers of the masseter muscle. It is likely
in brachycephalic individuals who exhibit increased masticatory forces, there will be a
greater tendency for the molar teeth to realign with the musculature in an effort to regain
the biomechanical advantage.
69
6.8 CURVE OF SPEE RELAPSE AND ARCH PERIMETER
The effect of leveling the curve of Spee on arch perimeter has been well investigated. It
is generally assumed that leveling a deep curve of Spee results in an increase in arch
perimeter; although, the exact amount of the increase is currently debated.
(Baldridge,1969; Proffit and Akerman,1986; Garcia,1985; Germane ,1992; Braun et al.,
1996) Leveling the curve of Spee during the active phase of orthodontic treatment could
be recognized as a measure to minimize the amount of post-treatment lower incisor
relapse. Data from this study would indicate that hypo-divergent facial types
demonstrate the greatest capacity for adaptation as the curve of Spee re-establishes
following orthodontic treatment.
70
6.9 NULL HYPOTHESIS DEDUCTIONS
Null Hypothesis #1 There is no relationship between initial curve of Spee depth andverlical facial pattern
This statement was accepted as the pre-treatment curve of Spee measurements
were not found to be statistically significantly different among the three vertical
facial p attem sub - group s
Null Hypothesis #2 The curve of Spee will not change through the administration oforthodontic treatment
This statement was reiected as the curve of Spee was found to decrease from pre-
treatment to post-treatment stages to a statistically significant degree.
Null Hypothesis #3 Three is no association between vertical facial pattem and re-estabiishment of the curve of Spee following orthodontic leveling
This statement is ¡giglgg! for the brachycephalic sub-group that demonstrated a
statistically significant relapse toward pre-treatment values. The statement is
accepted for the mesocephalic and dolicocephalic sub-groups which failed to
demonstrate a statistically significant relapse from post-treatment values.
Null Hypothesis #4 There is no difference between the measurement characteristics ofconventional curve of Spee measurements with a novel measurement
This statement is reiected. Although similar trends are seen using linear and area
curve of Spee measurements the two methods are not inter-changeable and one
may not be substituted for the other.
71
CHAPTER 7
STTIDY LIMITATIOI{S AT''{D CONCLUSIONS
7.1
7.2
Study Limitations
Conclusions
Page Number
73
75
72
CHAPTER 7
STUDY LIMITATIONS AI\D COI\CLUSIOI\S
7.1 STUDY LIMITATIONS
It is necessary to establish possible limitations of this study to characterize the strength of
the study and provide direction for future research.
One limitation of the current study was the size of the sample. Through confirmation
with Dr. T. Hassard, a statistician at the University of Manitoba, it was decided to
increase the strength of the study by using very stringent inclusion criteria. ln addition,
the sample was further reduced due to only including subjects that had completed
orthodontics for a minimum of 5 years. As stated previously, many retention/relapse
studies have inadequate time periods to realize any significant change. Due to the
homogenous sample the current study was able to include only 44 subjects.
Because only study models were used, the study lacks understanding in respect to
stability of the curve of Spee using different arch leveling techniques. This study did not
attempt to differentiate the relapse potential when various orthodontic biomechanical
systems are employed. It is possible that the relapse potential is higher for incisor
intrusion versus premolar extrusion or vice versa. V/ith a larger sample size a future
t5
combined study model/radiographic analysis may provide insight into the relapse
potential of various techniques.
A third, and important limitation to the study was the consideration of normal growth. It
is possible and in fact likely that the curve of Spee changes as a noÍnal physiologic
process. These changes however have not been documented and it is impossible to
differentiate the effects of relapse from orthodontic treatment from those of growth. A
possible future research project could measure the changes in the curve of Spee of
various vertical facial patterns in untreated subjects to ascertain curve ofSpee changes
irrespective of orthodontic treatment. As well, a control group of untreated individuals
could be used, but this has ethical concerns whereby denying treatment to use a patient as
a control subject would be unacceptable.
A fourth and final limitation of this study deals with the difference between statistical and
clinical significance. Although a distinct difference was noted between the facial types in
respect to relapse following orthodontic leveling, the exact clinical significance of this is
not known. The magnitude of the difference between the sub-groups is small and may
not be of any importance clinically.
74
7.2 CONCLUSIONS
From the present study, the following conclusions can be drawn:
1. Orthodontic treatment biomechanics can successfully level the curve of Spee in
all three vertical facial types
2. The magnitude of the pre-treatment curve of Spee depth does not seem to be
associated with specific vertical facial patterns
3. Great variability exists for pre-treatment curve of Spee depth in all facial types
4. The hypodivergent facial type seems to demonstrate a statistically significant
increase in post-treatment relapse (p<0.05) compared to other vertical facial
types; however, the clinical significance of this association is uncertain.
75
REFERENCES
Andrews LF: The Six Keys to Normal Occlusion. Am J Orthod 1972;62:296-309
Artun J, Garo JD, Little RM. ong term stability of mandibular incisors following
successful treatment of Class II, Division 1, malocclusions. Angle Orthod 1996;66:229-
38.
Ash S, Ramfiord MM,. occlusion,4th ed. Philidelphia: wB Saundersco; 1995. p. 59-60,
80-2.
Baldridge OW: Leveling the curve of Spee: Its effect on mandibular arch length. J
Prac Ortho d 1969;3 :26-41
Barager FA, Osbom JW: Efficiency as a predictor of human jaw design in the saggital
plane. J Biomech. 1987;20:447-457
Biedenbach MA, (Spee F) Hotz M, Hitchcock HP: The gliding path of the mandible
along the skull. J Am Dent Assoc. 1980;100:670-675
Bishara SE. Jakobsen JR. Longitudinal changes in three normal facial types. Am J Orthod
1985;88:466-502
76
Bishara SE., Jakobsen J., Treder J., Stasi M.: Changes in the maxillary and mandibular
tooth size arch length relationship from early adolescence to early adulthood: a
longitudinal study. Am J Orthod Dentofac Orthop 1989;95:46-59
Bishara SE, Treder JE, Damon P: Changes in the dental arches and dentition between
25 and45 years of age. Angle Orthod 1996;66:417-422
Björk A. Prediction of mandibular growth rotation. Angle Orthod 1969;55:58 5-599.
Braun M, Schmidt W.: A Cephalometric Appraisal of the Curve of Spee in Class I and
Class II, Division I Occlusions For Males and Females. Am J Orthod 1956;42:255-278.
Braun S, Hnat W, Johnson B: The curve of Spee revisited. Am J Orthod Dentofac
Orthop 1996;110: 206-2 L 0
Burstone CJ. Deep overbite correction by intrusion. Am J Orthod 1977;72:I-22.
Burstone CJ The mechanics of the segmented arch technique. Angle Orthod 1,966;36:99-
120.
Buscha"ng PH, Sankey V/, English JD. Early treatment of hyperdivergenet open-bite
malocclusions. Seminars in Orthodonti cs 2002;8:13 0- 1 40
77
Carcara S., Presotn,8., Jureyda, O. The relationship between the curve of Spee, relapse,
and the Alexander Discipline. Seminars in Orthodontics. 2001;7:90-97
Carter GA, McNamaraJA: Longitudinal dental arch changes in adults. Am J Orthod
Dentofac Orthop 1998;114: 88-99
Chung C, Wong W. Craniofacial growth in untreated skeletal Class II subjects: a
longitudinal study. Am J Orthod Dentofacial Orthop. 2002;122:619-26.
Dahlberg G. Statistical methods for medical and biological students. London: George
Allen and Unwin Ltd.,1940;122-32.
Dake ML, Sinclair PM. A comparison of the Rickets and Tweed-type arch leveling
techniques. Am J Orthod 1989;95:72-78.
DePraeter J., Dermaut, L., Martens, G., Long-term stability of the leveling of the curve of
Spee. Am J Orthod Dentofac Orthop 2002;12l:266-72.
Dubrul EL: Sicher and Dubrul's Oral Anatomy -8th edition. Ishiyaku Euroamerica Inc.
St. Louis, USA;pp. 107-131 (1988).
78
Enlow DH. Normal variations in facial form and the anatomical basis for malocclusion.
ln:Enlow DH, ed. Facial Growth, 3'd ed. Philadelphia: WB Saunders Co; 1990 p.193-
221.
Farella, M., Michelotti,4., van Eijden, t., Mafina, R. The curve of Spee and craniofacial
morphology: a multiple regression analysis. Eur J Oral Sci2002;110:277-28I.
Ferrario, V., Sforza, C., Miana,4., Columbo, A. and Tartaglia, G. Mathematical
definition of the curve of Spee in the permanent healthy dentitions in man. Arch Oral
BioL 1992;37 :691 -694.
Ferrario V., Sforza C., Poggio C., Serrao G., Colombo A.: Three dimensional dental
arch curvature in human adolescents and adults. Am J Orthod Dentofac Orthop
1999;Il5:401-405.
Fidler BC, Artun J, Joondeph DR, et al. Long term stability of angle class II, Division I
malocclusions with successful occlusal results at the end of active treatment Am J Orthod
Dentofac Orthop 1995;107 :27 6-285
Fields H'W, Proffit WR, Nixon V/L, Phillips C, Stanek E. Facial pattern differences in
long-faced children and adults. Am J Orthod. 1984;85:217-23.
Garcia R. Leveling the curve of Spee: A new prediction formula. J Charles H. Tweed
79

Found. 1985;13:65-72.
Germane N, Staggers J, Rubenstein L, Revere J. Arch length considerations due to the
curve of Spee: A mathematical model. Am J Ortbod Dentofac Orthop I992;I02:25I-
255.
Givins E. A cephalometric analysis of the degree of change in the curve of Spee of
non-extraction orthodontic cases before and after treatment. Pac Coast Soc Ortho Bulletin
1970;45:36-37.
Glenn G, Sinclair PM, Alexander RG. Non-extraction orthodontic therapy: Post-
treatment dental and skeletal stability. Am J Orthod 1987;92:321-328.
Harris E. A longitudinal study of arch size and form in untreated adults. Am J Orthod
Dentofac Orthop 1997 ;I I I :419-427
Hechter, F. Symmetry, form and dimension of the dental arches in orthodontically treated
patients, M.S. thesis, University of Manitoba,7975.
Hitchcock H. The curve of Spee in stone age man. Am J Orthod Dentofac Orthop
1983;8a(3):250-253
80
Isaacson RJ, Zappel RJ, Worms FW, Bervis RR, Speidel TM. Effects of rotational jaw
growth on the occlusion and profile. Am J Orthod 1977;72:2767-86.
Kahl-Nieke B, Fischbach H, Schwarze C, Post-retention crowding and incisor irregularity
: a long term followup evaluation of stability and relapse. Br J Orthod 1995;22:249-57.
Kim T, Little R. Post-retention assessment of deep overbite correction in Class II div. 2
malocclusion. Angle Orthod 1999 ;69 (2): 7 5 -186
Koyama T. A comparative analysis of the curve of Spee (lateral aspect) before and after
orthodontic treatment with particular reference to overbite patients. J Nihon Univ School
D ent. 197 9 ;21 (I - 4) : 25 -3 4
Kuitert RB, Van Ginkel FC, Prahl-Anderson B. Development of the curve of Spee during
and after orthodontic treatment (abstract). Eur J Orthod2000;22:596-7.
Little RM. The inegularity index: A quantitative score of mandibular incisor teeth. Am J
Othod 197 5;68:554-563.
Little RM, Reidel RA, Artun J. An evaluation of changes in mandibular anterior
alignment from 10 to 20 years post-retention. Am J Orthod 1988;5:423-428
81
I|úiyazaki H, Motegi E, Yatabe K, Isshiki Y. Occlusal stability after extraction
orthodontic therapy in adult and adolescent patients. Am J Orthod Dentofacial Orthop
1997;Il2:530-7.
Moyers RE, van de Linden F, RioloML, McNamara JA. Standard of human occlusal
development. Ann Arbor: University of Michigan, 197 4:7 8-137 .
Nanda SK. Growth patterns of subjects with long and short faces. Am J Orthod Dentofac
Orthop 1990;98:247 -58.
Opendebeeck H, Bell WH. The short face syndrome. Am J Orthod 1978;73:499-511.
Osborn J. Orientation of the masseter muscle and the curve of Spee in relation to crushing
forces on the molar teeth of primates. Am J Phys Anthrop 1993;92:99-106.
Osbom JW. Heliocoidal plane of dental occlusion. Am J Phys Anthropol 1982; 57:273-
81.
Proffit WR, Ackerman J: Diagnosis and treatment planning in orthodontics. ln: Graber
TM, ed. Orthodontics: Current Principals and Techniques. cv Mosby. pp.64 (1986)
Proffit'WR, Fields HV/, Ackerman JL, Bailey LJ and Tulloch JF. Contemporary
Orthodontics 3'd Ed. Mosby. 2000 pp. 200-2OI
82
Ricketts RM. Bioprogressive therapy as an answer to orthodontic need. Part I. Am J
Orthod 1969 ;7 0:241 -68.
Ringqvist M. Isometric bite force and its relation to dimensions of the facial skeleton.
Acta Odontol Scand 1973;31:35-42.
Rubin R. Comment on "The Curve of Spee Revisited". Am J Orthod Dentofac Orthop
1997;111(4):30A,32A
Sassouni V. A classification of skeletal facial types. Am J Orthod 1969;55:109-123.
Schendel SA, Eisenfeld J, Bell'WH, EpkerB. The long face syrdrome:vertical maxillary
excess. Am J Orthod 1976;70:398-408.
Sicher US, Dubrul EL: Oral Anatomy..C. V. Mosby Co. (1975).
Sinclair P, Little R. Maturation of untreated normal occlusion. Am J Orthod 1983;2:114-
t23.
Skieller V, Björk A, Linde-Hanson T. Prediction of mandibular growth rotation evaluated
from a longitudinal implant sample. Am J Orthod 1984;86:359-370.
83
Sondhi, A, Cleall, J, BeGole, E. Dimensional changes in the dental arches of
orthodontically treated cases. Am J Orthod 1980;77:60-74.
Subtelny JD, Sakuda M. Openbite diagnosis and treatment. Am J Orthod 1964;50:337-
58.
Tweed C. Clinical orthodontics. St. Louis: CV Mosby Company,1966.
Weiland FJ, Bantleon HP, Droschl H. Evaluation of continuous arch and segmented arch
leveling techniques in adult patients-a clinical study. Am J Orthod Dentofacial Orthop.
1996;110:647 -52.
Willams R. Eliminating lower retention. J Clin Orthod 1985;22:342-349.
84


