Embed Size (px)
Citation preview
HAL Id: hal-02516561https://hal.archives-ouvertes.fr/hal-02516561
Submitted on 23 Mar 2020
HAL is a multi-disciplinary open accessarchive for the deposit and dissemination of sci-entific research documents, whether they are pub-lished or not. The documents may come fromteaching and research institutions in France orabroad, or from public or private research centers.
L’archive ouverte pluridisciplinaire HAL, estdestinée au dépôt et à la diffusion de documentsscientifiques de niveau recherche, publiés ou non,émanant des établissements d’enseignement et derecherche français ou étrangers, des laboratoirespublics ou privés.
Stable and metastable phases of PTCDA on epitaxialNaCl films on Ag(100)
Eric Le Moal, Mathias Müller, Oliver Bauer, Moritz Sokolowski
To cite this version:Eric Le Moal, Mathias Müller, Oliver Bauer, Moritz Sokolowski. Stable and metastable phasesof PTCDA on epitaxial NaCl films on Ag(100). Physical Review B: Condensed Matter and Ma-terials Physics (1998-2015), American Physical Society, 2010, 82 (4), pp.045301. �10.1103/Phys-RevB.82.045301�. �hal-02516561�
Stable and metastable phases of PTCDA on epitaxial NaCl films on Ag(100)
Eric Le Moal,* Mathias Müller, Oliver Bauer, and Moritz Sokolowski†
Institut für Physikalische und Theoretische Chemie, Universität Bonn, Wegelerstrasse 12, 53115 Bonn, Germany�Received 16 December 2009; revised manuscript received 21 May 2010; published 1 July 2010�
Thin films of the model molecule perylene-3,4,9,10-tetracarboxylic acid dianhydride �PTCDA� werevacuum deposited on epitaxial NaCl films on Ag�100� and investigated by spot-profile-analysis low-energyelectron diffraction �SPA-LEED�. At growth temperatures between 193 K and room temperature �RT�, the firstlayer �monolayer� exhibits a commensurate �3�2�3�2�R45° superstructure with a quadratic unit cell, which isidentical to that found for PTCDA growth on bulk NaCl crystals �Burke et al., Phys. Rev. Lett. 100, 186104�2008��. At RT, dewetting occurs and complicates the formation of multilayers. However, at low surfacetemperatures �223 K�, closed PTCDA multilayers grow. The corresponding unit cell �19.69�4� Å�12.23�3� Å� is rectangular and similar to the herringbone structure of the �102� bulk plane of PTCDA. Thisgrowth form is metastable and the surface dewets upon annealing at 300 K. Submonolayers deposited at lowtemperatures �20–100 K� are disordered; upon annealing, they transform into the �3�2�3�2�R45° structurevia a third metastable phase with a herringbone-type rectangular unit cell.
DOI: 10.1103/PhysRevB.82.045301 PACS number�s�: 68.43.Hn, 68.55.am, 68.49.Jk
I. INTRODUCTION
Thin films of �-conjugated organic molecules have at-tracted much attention for their promising applications inoptical and semiconducting devices.1 Within this context, anumber of surface-science experiments have been performedon the chemical interaction, the growth behavior, and thestructural order of �-conjugated molecules on a large varietyof surfaces.2,3 Whereas investigations on metal substrates arerather straightforward, experiments on insulators as sub-strates are much more difficult because of two problems.First, charging effects limit the use of electron-based spec-troscopies, and, second, due to the smaller molecule sub-strate interactions Vollmer-Weber-type growth is prevailing,which leads to incomplete wetting of the substrate andgrowth of small bulklike crystallites which are not wellaccessible by surface-science techniques, e.g., electron spec-troscopies. Examples for the Vollmer-Weber growthare, e.g., perylene-3,4,9,10-tetracarboxylic acid dianhydride�PTCDA� �Ref. 4� and N,N�-dimethylperylene-3,4,9,10-bis�dicarboximide� deposited on the KBr�100� surface.5
Charging effects for electrons can be avoided by usingthin epitaxial layers of insulators on semiconductors or met-als as substrates. For instance, NaCl, KCl, and KBr can bedeposited in the form of �100�-terminated layers on a numberof metals as Cu,6–12 Ag,12–18 and Au.19,20 These thin epitaxialfilms exhibit the chemical surface properties of the respectivebulk insulators, but avoid charging effects, since the elec-trons can tunnel into the conducting underlyingsubstrate.21–26 Evidently, the spectroscopy of large organicmolecules on insulator surfaces is highly interesting andcomplementary to that on metal surfaces. One reason is that,due to the weaker interactions with the substrate compared tometals substrates, the intrinsic molecular states and the inter-molecular interactions are more dominant and can be hencestudied. A second reason is the technological relevance of theorganic/insulator interface, e.g., for organic field-effecttransistors.1 So far, mostly thin alkali-halide films on metalshave been used for this purpose.27–31 For instance, nearly
unperturbed molecular orbitals were imaged successfully byscanning tunneling microscopy �STM� for pentacene,26
Fe�II�-phthalocyanine,32 and methylterrylene33 on thin NaClfilms on Cu�111�.
The growth of the model molecule PTCDA has been in-vestigated on the �100� cleavage surfaces of alkali-halidebulk crystals, namely, NaCl,34–38 KCl,35,36,38,39 and KBr�Refs. 4, 35, 38, and 40� by atomic force microscopy �AFM�,and on thin KBr films on InSb�100� by STM.30 In the presentwork, we report on the growth of PTCDA on thin epitaxialfilms of NaCl/Ag�100�, which has not been investigated sofar. We used spot-profile-analysis low-energy electron dif-fraction �SPA-LEED� �Ref. 41� which ensures that statisti-cally correct data are obtained and allows to determine struc-tural parameters with high precision.
Concerning the growth of PTCDA on NaCl�100� bulkcrystals, Burke et al.34 have recently reported the formationof PTCDA monolayer �ML� islands with a commensuratep�3�3� superstructure in the submonolayer regime. Basedon observations by noncontact AFM, the authors described adewetting transition that occurs upon completion of the firstclosed monolayer and leads to the formation of bulklikePTCDA crystallites. This dewetting transition was ascribedto instability of the p�3�3� superstructure of the monolayerwith respect to additional PTCDA layers on top of it. Fur-thermore, on the basis of molecular mechanics calculations,the authors proposed that molecules in the first interfacialmonolayer rearrange in a p�2�3� superstructure, when be-ing covered by a second layer. However, we found that atlower temperatures, this dewetting can be avoided and stablePTCDA multilayers coexist with the commensuratep�3�3� structure on the time scale of the experiments. Wefurther found that the multilayers exhibit an incommensuratestructure that is very close to that of the herringbone �HB�arrangement in PTCDA bulk crystals. We will report on thedetails of these structures, the film growth, and the thermalstability of the PTCDA films as a function of film thicknessand the substrate temperature during and subsequent to thegrowth.
PHYSICAL REVIEW B 82, 045301 �2010�
1098-0121/2010/82�4�/045301�9� ©2010 The American Physical Society045301-1
II. EXPERIMENTAL DETAILS
All experiments were carried out in a UHV chamber at abase pressure of 3�10−10 mbar. The chamber is equippedwith a SPA-LEED apparatus manufactured by OmicronNanoTechnology GmbH.41 For deposition control, a massspectrometer and a quartz microbalance were used. Thesample was mounted on a manipulator cooled by either liq-uid helium or liquid nitrogen, making a temperature range of20 K, respectively, 130–900 K accessible. All SPA-LEEDdata were typically collected at 34 eV electron energy atlow-sample currents ��1 nA� in order to avoid charging ef-fects, dissociation, or desorption of PTCDA molecules uponelectron bombardment.
The preparation of the Ag�100� surface was performed asdescribed in Ref. 42. NaCl and PTCDA were deposited bythermal evaporation from homemade Knudsen cells. TheNaCl with 99.999% purity was purchased from Sigma-Aldrich. The PTCDA was purified by several cycles of gra-dient sublimation. The NaCl was deposited from a Knudsencell at 700 K and at deposition rates of about 0.1–0.5 mono-layers per minute �ML min−1, for the exact definition of 1ML see below� on the Ag�100� surface which was held atroom temperature �RT, �300 K� or at 450 K. The NaClfilms used in the present experiment had a thickness of aboutten layers �corresponding to 29 Å�. Notably, NaCl films onAg�100� are not single crystalline but consist of domainswhich exhibit a small rotational mosaic spread of their �010�axes with respect to the �010� direction of Ag�100� substrate.This has been described recently in detail in Ref. 43.
For deposition of PTCDA, the cell temperature was about700 K, yielding deposition rates of 0.05 ML min−1. Thesample temperatures were varied from 193 K to RT, exceptfor the preparation of a disordered phase which was done at100 K. Subsequent to the PTCDA deposition and prior to theSPA-LEED measurements, the sample was cooled down to20 K by He cooling �or to 130 K by liquid nitrogen�. Sub-sequent deliberate annealing steps consisted in heating thesample at a rate of 1 K s−1, holding it at a specific tempera-ture during the annealing time, and final cooling down to20 K for further SPA-LEED measurements.
The nominal PTCDA film thickness will be given in num-bers of monolayers. Hereby one monolayer �1 ML� is de-fined as the density of molecules in the �102� plane of thebulk � phase of PTCDA �8.32�1013 cm−2�.44 The nominalthickness refers to the integral over the deposition flux thatwas measured by a mass spectrometer close to the Ag�100�sample. The calibration in number of ML was obtained fromearlier deposition experiments on the bare Ag�100� surface,where the completion of the monolayer and the growth startof the second layer could be distinguished by different LEEDpatterns and by thermal desorption spectroscopy.42 Evidently,this calibration assumes an identical and constant stickingprobability.
III. RESULTS AND DISCUSSION
A. Quadratic monolayer structure
Figure 1�a� shows a typical SPA-LEED pattern of a thinPTCDA film of about 0.7 ML thickness, grown at 223 K.
The elongated shape of the NaCl spots is due to the above-noted rotational mosaicity of the NaCl film �so-called azi-muthal mosaicity�.43 We find the NaCl and PTCDA spots toexhibit the same azimuthal broadening, which indicates thatthe PTCDA domains grow in a strict epitaxial relation withrespect to the NaCl substrate without any additional observ-able rotational spread. In the radial direction the PTCDAspots are relatively sharper. Investigations on the radial widthas a function of electron energy �not shown here� reveal thatordered PTCDA domains of about 150 Å in diameter haveformed.
Remarkably, the SPA-LEED pattern in Fig. 1�a� is rathersimilar to that of a PTCDA monolayer directly grown onAg�100�.42 In both cases, a quadratic structure and the sameselective spot extinctions are observed �see below�. OnAg�100�, the PTCDA monolayer exhibits a commensurate�4�2�4�2�R45° superstructure. On the thin NaCl films, wedetermine a commensurate �3�2�3�2�R45° superstructure.Its basis vectors b1 and b2 are defined by the following ma-trix:
�b1,b2� = � 3 3
− 3 3�a1,a2� ,
where a1 and a2 are the basis vectors of NaCl�100� surface,defining the primitive unit cell. Figure 1�b� shows the unitcell in reciprocal space. For this superstructure a quadraticunit cell with a lattice constant of 16.92 Å �at RT� is calcu-lated, which is in good agreement with the value of17.0�0.1 Å directly determined by SPA-LEED.
The observed commensurate �3�2�3�2�R45° super-structure is indeed identical to the structure noted asp�3�3� that was previously reported by Burke et al.34 forPTCDA submonolayers on the bulk NaCl�100� surface. Thetwo different notations result from different unit cells chosenfor the NaCl�100� surface: Whereas we have denominatedthe adsorbate superstructure with respect to the primitive unitcell of NaCl�100� surface, Burke et al. referred to the largercentered unit cell rotated by 45° with respect to the primitive
b1*
b2*
(b)(a)E = 34 eV
0.5Å-1
(0,0)
Q phase
FIG. 1. �a� SPA-LEED pattern of a PTCDA film with a nominalthickness of about 0.7 ML, grown on a 10-ML-thick NaCl film onAg�100� at 223 K. The electron energy was 34 eV. �b� Schematicpresentation of the LEED pattern according to the structure modelillustrated in Fig. 2�a�. The reciprocal unit vectors b1
� and b2� of the
commensurate quadratic PTCDA structure are given, as well as thecorresponding unit cell �solid line� and that of the NaCl�100� plane�dotted line�.
LE MOAL et al. PHYSICAL REVIEW B 82, 045301 �2010�
045301-2
unit cell �cf. Fig. 2�a��. Figure 2�a� shows a correspondingstructure model in real space. The systematic absences of the�n ,0� and �0,k� spots, if n and k are odd numbers, indicatethe presence of two glide planes �symmetry group p4gm�. Asfor PTCDA on Ag�100�, this in-plane symmetry is consistentwith a so-called “T-shaped” arrangement of the molecules.42
Within this model, PTCDA molecules lie flat on the NaCl
films with their main axis along the NaCl �011� and �01̄1�directions and the primitive unit cell of the superstructurecomprises two molecules perpendicularly oriented to eachother.
The adsorption sites illustrated in Fig. 2�a� were chosenon the basis of considerations on energy minimization. Thecarbonyl oxygen atoms of PTCDA carry negative partialcharges and hence presumably interact electrostatically withthe sodium cations of the substrate surface. Burke et al.34
have demonstrated by molecular mechanics and density-functional calculations that these attractive forces are respon-sible for the in-plane molecular arrangement and the orien-tation of the first PTCDA monolayer on NaCl�100�. Ananalog conclusion was drawn by Dienel et al.39 for PTCDAon KCl�100� from molecular force-field calculations. Inter-estingly, the resulting arrangement of PTCDA on NaCl�100��see Fig. 2�a�� provides equivalent adsorption sites for alleight carbonyl oxygen atoms within the unit cell. From nowon, we refer to this commensurate quadratic PTCDA struc-ture as the Q phase. Notably, this Q phase differs consider-ably from the denser herringbone packing of PTCDA that isfound in the �102� plane of bulk crystals �see Table I� �Refs.
44 and 47� and that is typical for PTCDA adsorbed onweakly interacting surfaces, e.g., Au�111�.48 The moleculardensity within the Q phase �6.99�1013 cm−2� is about 16%lower compared to that found in the �102� plane of the bulk� phase of PTCDA �8.32�1013 cm−2�. The commensurabil-ity and the lower density of the Q phase both reflect thatrather strong interactions between the PTCDA and the NaClsurface exist.
B. Herringbone structure of the multilayers
Figure 3 shows two LEED patterns of a PTCDA film ofabout 2.7 ML in nominal thickness, grown at 223 K. Thepattern in Fig. 3�a� was measured directly after growth andcooling to 20 K while that in Fig. 3�b� was recorded afteradditional annealing at 300 K for 72 h and cooling to 20 K.In addition to the Q phase, an incommensurate PTCDA su-perstructure is observed in Fig. 3�a�. It exhibits a rectangularunit cell with unit vectors �c1 and c2� parallel to those of theQ phase �b1 and b2�. As expected, there are two symmetryequivalent domains, rotated by 90° relative to each other.Hence we conclude that from the second layer onwardPTCDA nucleates with a different lateral packing on top ofthe first monolayer. The LEED spots from the Q phase inFig. 3�a� could be interpreted as stemming either from un-covered areas of the monolayer due to a partial Stranski-Krastanov growth type, or from regions where the monolayeris covered by further layers, but still exhibits the order of theQ phase and contributes to the scattered intensity due to the
[001]
[010
]
[011
]
3.99A
5.64 A
16.92 A
16
.92
A
12.23 A
19
.69
A
Q phase HB phase
(a) (b)
phase
phase
Na+
Cl-
FIG. 2. �Color online� �a� Real-space structure model for the commensurate growth of the first PTCDA monolayer on NaCl�100�. Largered spheres and small green spheres represent chlorine and sodium atoms, respectively. The main directions of the NaCl�100� plane arereferred to as �010� and �001� with respect to the axes of the bulk fcc crystal. The centered unit cell �dashed black line� and the primitive unitcell �solid black line� of NaCl�100� are indicated with their dimensions at RT �Refs. 45 and 46�. The unit cell of the commensurate quadraticPTCDA structure is marked �black line� with the dimensions defined by its relationship of commensurability with NaCl�100�. �b� Real-spacestructure model of the incommensurate herringbone PTCDA structure in multilayered PTCDA films on NaCl�100�. Its experimentallymeasured dimensions are indicated �19.69 �12.23 �. Its unit cell �solid black line� is compared to those of the �102� plane of thePTCDA bulk structure in the � �dashed-dotted blue line� and � phase �dashed red line�.
STABLE AND METASTABLE PHASES OF PTCDA ON… PHYSICAL REVIEW B 82, 045301 �2010�
045301-3
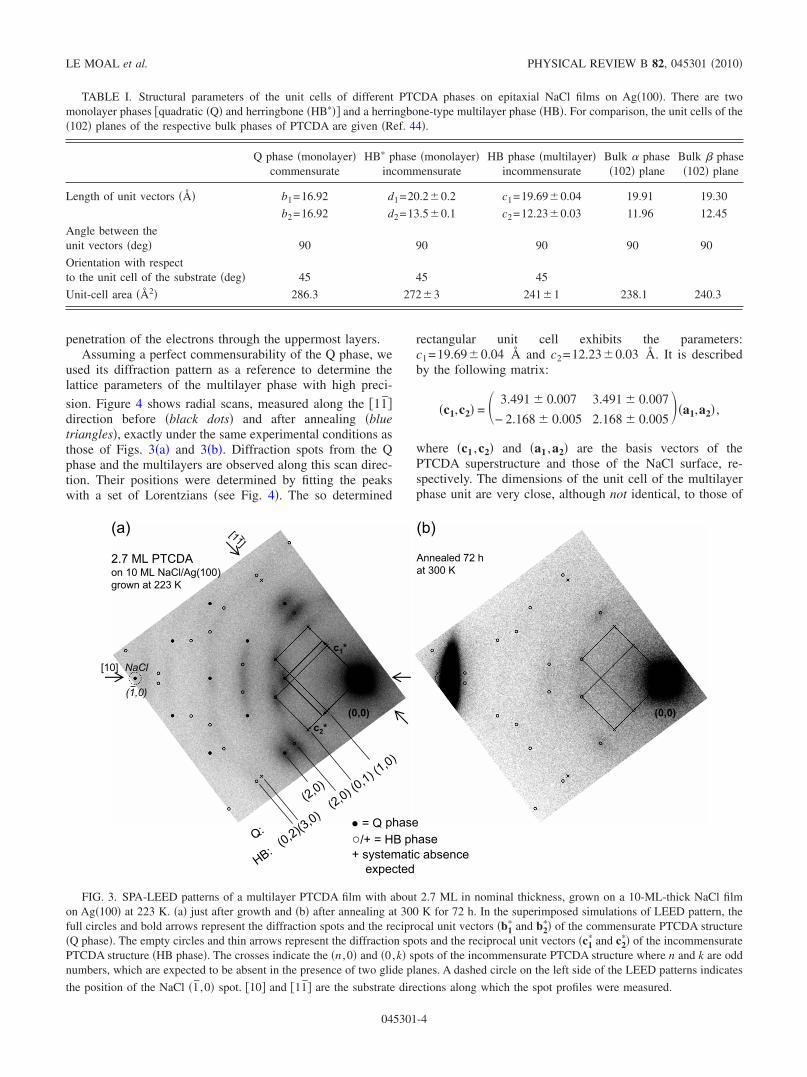
penetration of the electrons through the uppermost layers.Assuming a perfect commensurability of the Q phase, we
used its diffraction pattern as a reference to determine thelattice parameters of the multilayer phase with high preci-
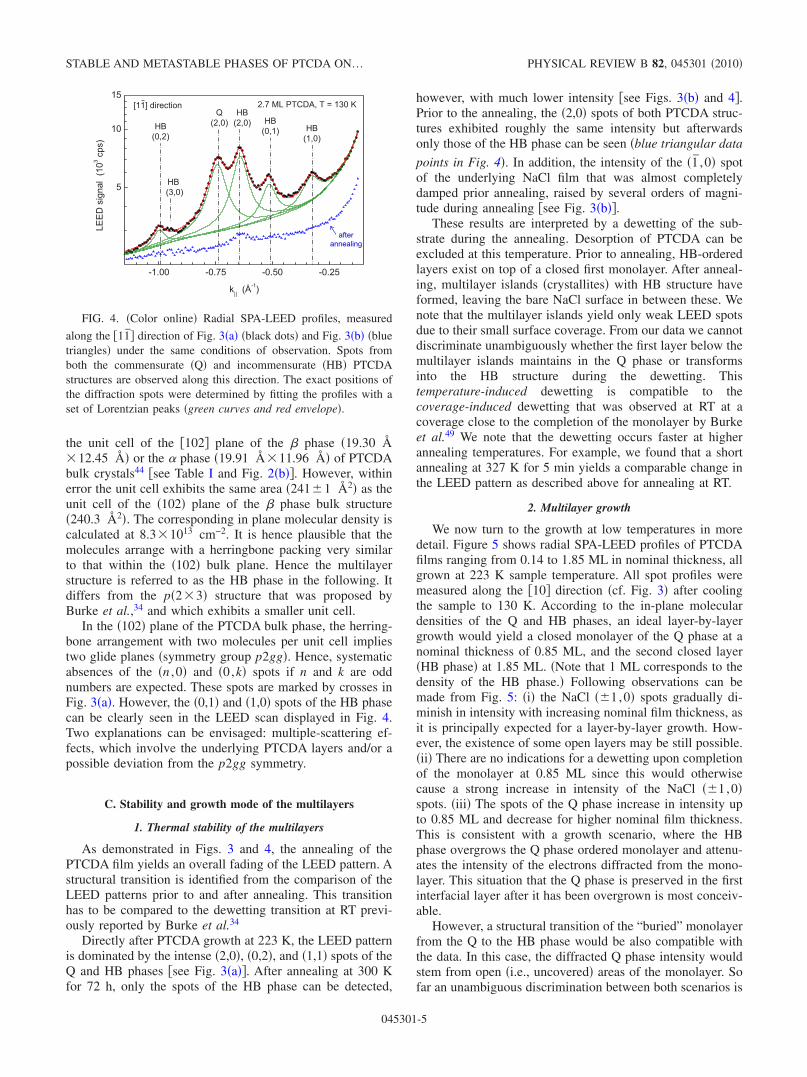
sion. Figure 4 shows radial scans, measured along the �11̄�direction before �black dots� and after annealing �bluetriangles�, exactly under the same experimental conditions asthose of Figs. 3�a� and 3�b�. Diffraction spots from the Qphase and the multilayers are observed along this scan direc-tion. Their positions were determined by fitting the peakswith a set of Lorentzians �see Fig. 4�. The so determined
rectangular unit cell exhibits the parameters:c1=19.69�0.04 Å and c2=12.23�0.03 Å. It is describedby the following matrix:
�c1,c2� = � 3.491 � 0.007 3.491 � 0.007
− 2.168 � 0.005 2.168 � 0.005�a1,a2� ,
where �c1 ,c2� and �a1 ,a2� are the basis vectors of thePTCDA superstructure and those of the NaCl surface, re-spectively. The dimensions of the unit cell of the multilayerphase unit are very close, although not identical, to those of
TABLE I. Structural parameters of the unit cells of different PTCDA phases on epitaxial NaCl films on Ag�100�. There are twomonolayer phases �quadratic �Q� and herringbone �HB��� and a herringbone-type multilayer phase �HB�. For comparison, the unit cells of the�102� planes of the respective bulk phases of PTCDA are given �Ref. 44�.
Q phase �monolayer�commensurate
HB� phase �monolayer�incommensurate
HB phase �multilayer�incommensurate
Bulk � phase�102� plane
Bulk � phase�102� plane
Length of unit vectors �� b1=16.92 d1=20.2�0.2 c1=19.69�0.04 19.91 19.30
b2=16.92 d2=13.5�0.1 c2=12.23�0.03 11.96 12.45
Angle between theunit vectors �deg� 90 90 90 90 90
Orientation with respectto the unit cell of the substrate �deg� 45 45 45
Unit-cell area �Å2� 286.3 272�3 241�1 238.1 240.3
(a)
2.7 ML PTCDAon 10 ML NaCl/Ag(100)grown at 223 K
(b)
Annealed 72 hat 300 K
c1*
c2*(0,0) (0,0)
NaCl
(1,0)
[10]
[11]
● = Q○/+ = HB+ systematic absenceexpected
Q:
(2,0)
HB:(0,2)(3,0)(2,0)(0,1)(1,0)
phasephase
FIG. 3. SPA-LEED patterns of a multilayer PTCDA film with about 2.7 ML in nominal thickness, grown on a 10-ML-thick NaCl filmon Ag�100� at 223 K. �a� just after growth and �b� after annealing at 300 K for 72 h. In the superimposed simulations of LEED pattern, thefull circles and bold arrows represent the diffraction spots and the reciprocal unit vectors �b1
� and b2�� of the commensurate PTCDA structure
�Q phase�. The empty circles and thin arrows represent the diffraction spots and the reciprocal unit vectors �c1� and c2
�� of the incommensuratePTCDA structure �HB phase�. The crosses indicate the �n ,0� and �0,k� spots of the incommensurate PTCDA structure where n and k are oddnumbers, which are expected to be absent in the presence of two glide planes. A dashed circle on the left side of the LEED patterns indicates
the position of the NaCl �1̄ ,0� spot. �10� and �11̄� are the substrate directions along which the spot profiles were measured.
LE MOAL et al. PHYSICAL REVIEW B 82, 045301 �2010�
045301-4
the unit cell of the �102� plane of the � phase �19.30 Å�12.45 Å� or the � phase �19.91 Å�11.96 Å� of PTCDAbulk crystals44 �see Table I and Fig. 2�b��. However, withinerror the unit cell exhibits the same area �241�1 Å2� as theunit cell of the �102� plane of the � phase bulk structure�240.3 Å2�. The corresponding in plane molecular density iscalculated at 8.3�1013 cm−2. It is hence plausible that themolecules arrange with a herringbone packing very similarto that within the �102� bulk plane. Hence the multilayerstructure is referred to as the HB phase in the following. Itdiffers from the p�2�3� structure that was proposed byBurke et al.,34 and which exhibits a smaller unit cell.
In the �102� plane of the PTCDA bulk phase, the herring-bone arrangement with two molecules per unit cell impliestwo glide planes �symmetry group p2gg�. Hence, systematicabsences of the �n ,0� and �0,k� spots if n and k are oddnumbers are expected. These spots are marked by crosses inFig. 3�a�. However, the �0,1� and �1,0� spots of the HB phasecan be clearly seen in the LEED scan displayed in Fig. 4.Two explanations can be envisaged: multiple-scattering ef-fects, which involve the underlying PTCDA layers and/or apossible deviation from the p2gg symmetry.
C. Stability and growth mode of the multilayers
1. Thermal stability of the multilayers
As demonstrated in Figs. 3 and 4, the annealing of thePTCDA film yields an overall fading of the LEED pattern. Astructural transition is identified from the comparison of theLEED patterns prior to and after annealing. This transitionhas to be compared to the dewetting transition at RT previ-ously reported by Burke et al.34
Directly after PTCDA growth at 223 K, the LEED patternis dominated by the intense �2,0�, �0,2�, and �1,1� spots of theQ and HB phases �see Fig. 3�a��. After annealing at 300 Kfor 72 h, only the spots of the HB phase can be detected,
however, with much lower intensity �see Figs. 3�b� and 4�.Prior to the annealing, the �2,0� spots of both PTCDA struc-tures exhibited roughly the same intensity but afterwardsonly those of the HB phase can be seen �blue triangular data
points in Fig. 4�. In addition, the intensity of the �1̄ ,0� spotof the underlying NaCl film that was almost completelydamped prior annealing, raised by several orders of magni-tude during annealing �see Fig. 3�b��.
These results are interpreted by a dewetting of the sub-strate during the annealing. Desorption of PTCDA can beexcluded at this temperature. Prior to annealing, HB-orderedlayers exist on top of a closed first monolayer. After anneal-ing, multilayer islands �crystallites� with HB structure haveformed, leaving the bare NaCl surface in between these. Wenote that the multilayer islands yield only weak LEED spotsdue to their small surface coverage. From our data we cannotdiscriminate unambiguously whether the first layer below themultilayer islands maintains in the Q phase or transformsinto the HB structure during the dewetting. Thistemperature-induced dewetting is compatible to thecoverage-induced dewetting that was observed at RT at acoverage close to the completion of the monolayer by Burkeet al.49 We note that the dewetting occurs faster at higherannealing temperatures. For example, we found that a shortannealing at 327 K for 5 min yields a comparable change inthe LEED pattern as described above for annealing at RT.
2. Multilayer growth
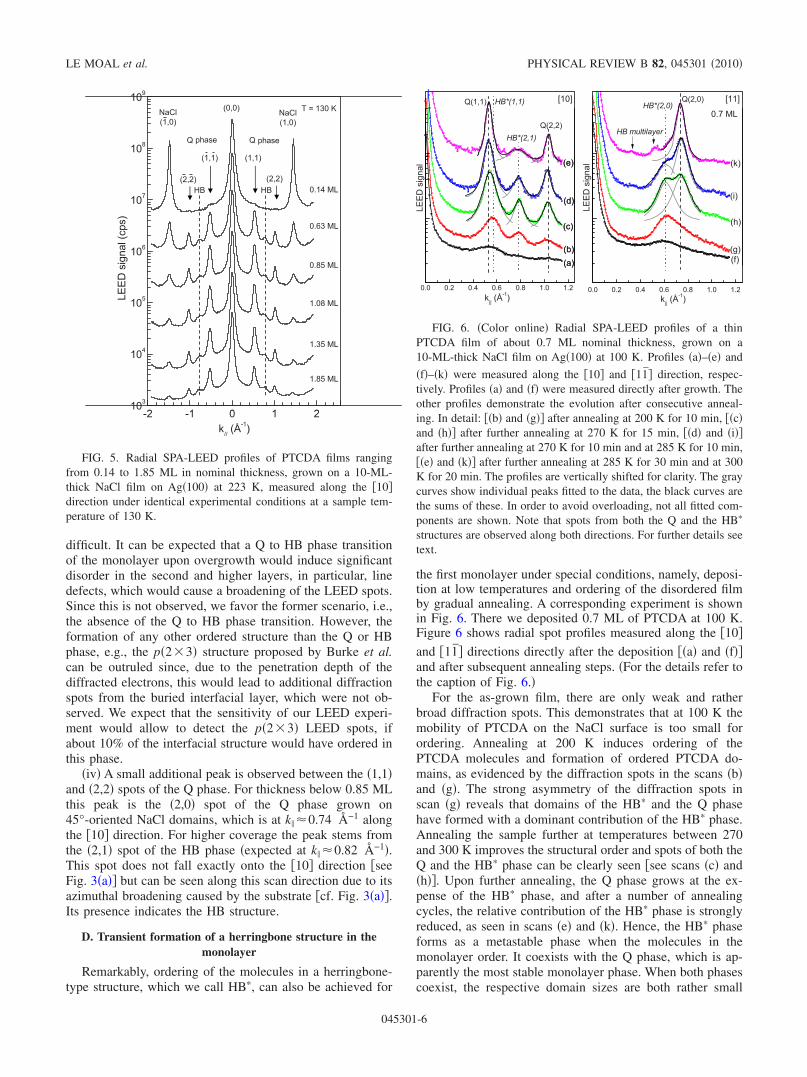
We now turn to the growth at low temperatures in moredetail. Figure 5 shows radial SPA-LEED profiles of PTCDAfilms ranging from 0.14 to 1.85 ML in nominal thickness, allgrown at 223 K sample temperature. All spot profiles weremeasured along the �10� direction �cf. Fig. 3� after coolingthe sample to 130 K. According to the in-plane moleculardensities of the Q and HB phases, an ideal layer-by-layergrowth would yield a closed monolayer of the Q phase at anominal thickness of 0.85 ML, and the second closed layer�HB phase� at 1.85 ML. �Note that 1 ML corresponds to thedensity of the HB phase.� Following observations can bemade from Fig. 5: �i� the NaCl ��1,0� spots gradually di-minish in intensity with increasing nominal film thickness, asit is principally expected for a layer-by-layer growth. How-ever, the existence of some open layers may be still possible.�ii� There are no indications for a dewetting upon completionof the monolayer at 0.85 ML since this would otherwisecause a strong increase in intensity of the NaCl ��1,0�spots. �iii� The spots of the Q phase increase in intensity upto 0.85 ML and decrease for higher nominal film thickness.This is consistent with a growth scenario, where the HBphase overgrows the Q phase ordered monolayer and attenu-ates the intensity of the electrons diffracted from the mono-layer. This situation that the Q phase is preserved in the firstinterfacial layer after it has been overgrown is most conceiv-able.
However, a structural transition of the “buried” monolayerfrom the Q to the HB phase would be also compatible withthe data. In this case, the diffracted Q phase intensity wouldstem from open �i.e., uncovered� areas of the monolayer. Sofar an unambiguous discrimination between both scenarios is
-1.00 -0.75 -0.50 -0.25
5
10
15
k|| (Å-1)
afterannealing
HB(1,0)
HB(0,1)
HB(2,0)HB
(0,2)
Q(2,0)
HB(3,0)
2.7 ML PTCDA, T = 130 K[11] directionLEEDsignal(103cps)
FIG. 4. �Color online� Radial SPA-LEED profiles, measured
along the �11̄� direction of Fig. 3�a� �black dots� and Fig. 3�b� �bluetriangles� under the same conditions of observation. Spots fromboth the commensurate �Q� and incommensurate �HB� PTCDAstructures are observed along this direction. The exact positions ofthe diffraction spots were determined by fitting the profiles with aset of Lorentzian peaks �green curves and red envelope�.
STABLE AND METASTABLE PHASES OF PTCDA ON… PHYSICAL REVIEW B 82, 045301 �2010�
045301-5
difficult. It can be expected that a Q to HB phase transitionof the monolayer upon overgrowth would induce significantdisorder in the second and higher layers, in particular, linedefects, which would cause a broadening of the LEED spots.Since this is not observed, we favor the former scenario, i.e.,the absence of the Q to HB phase transition. However, theformation of any other ordered structure than the Q or HBphase, e.g., the p�2�3� structure proposed by Burke et al.can be outruled since, due to the penetration depth of thediffracted electrons, this would lead to additional diffractionspots from the buried interfacial layer, which were not ob-served. We expect that the sensitivity of our LEED experi-ment would allow to detect the p�2�3� LEED spots, ifabout 10% of the interfacial structure would have ordered inthis phase.
�iv� A small additional peak is observed between the �1,1�and �2,2� spots of the Q phase. For thickness below 0.85 MLthis peak is the �2,0� spot of the Q phase grown on45°-oriented NaCl domains, which is at k �0.74 Å−1 alongthe �10� direction. For higher coverage the peak stems fromthe �2,1� spot of the HB phase �expected at k �0.82 Å−1�.This spot does not fall exactly onto the �10� direction �seeFig. 3�a�� but can be seen along this scan direction due to itsazimuthal broadening caused by the substrate �cf. Fig. 3�a��.Its presence indicates the HB structure.
D. Transient formation of a herringbone structure in themonolayer
Remarkably, ordering of the molecules in a herringbone-type structure, which we call HB�, can also be achieved for
the first monolayer under special conditions, namely, deposi-tion at low temperatures and ordering of the disordered filmby gradual annealing. A corresponding experiment is shownin Fig. 6. There we deposited 0.7 ML of PTCDA at 100 K.Figure 6 shows radial spot profiles measured along the �10�and �11̄� directions directly after the deposition ��a� and �f��and after subsequent annealing steps. �For the details refer tothe caption of Fig. 6.�
For the as-grown film, there are only weak and ratherbroad diffraction spots. This demonstrates that at 100 K themobility of PTCDA on the NaCl surface is too small forordering. Annealing at 200 K induces ordering of thePTCDA molecules and formation of ordered PTCDA do-mains, as evidenced by the diffraction spots in the scans �b�and �g�. The strong asymmetry of the diffraction spots inscan �g� reveals that domains of the HB� and the Q phasehave formed with a dominant contribution of the HB� phase.Annealing the sample further at temperatures between 270and 300 K improves the structural order and spots of both theQ and the HB� phase can be clearly seen �see scans �c� and�h��. Upon further annealing, the Q phase grows at the ex-pense of the HB� phase, and after a number of annealingcycles, the relative contribution of the HB� phase is stronglyreduced, as seen in scans �e� and �k�. Hence, the HB� phaseforms as a metastable phase when the molecules in themonolayer order. It coexists with the Q phase, which is ap-parently the most stable monolayer phase. When both phasescoexist, the respective domain sizes are both rather small
-2 -1 0 1 2k// (Å
-1)2 1 0 1 2
103
104
105
106
107
108
109
LEEDsignal(cps)
NaCl(1,0)
(0,0)
Q
(1,1)
(2,2)
Q
NaCl(1,0)
(2,2)
(1,1)
0.14 ML
0.63 ML
0.85 ML
1.08 ML
1.35 ML
1.85 ML
HB HB
T = 130 K
phase phase
FIG. 5. Radial SPA-LEED profiles of PTCDA films rangingfrom 0.14 to 1.85 ML in nominal thickness, grown on a 10-ML-thick NaCl film on Ag�100� at 223 K, measured along the �10�direction under identical experimental conditions at a sample tem-perature of 130 K.
k|| (Å-1)
LEED
signal
0.7 ML
k|| (Å-1)
HB multilayer
[11]Q(2,0)HB*(2,0)
Q(2,2)HB*(2,1)
HB*(1,1)
LEED
signal
Q(1,1) [10]
0.0 0.2 0.4 0.6 0.8 1.0 1.20.0 0.2 0.4 0.6 0.8 1.0 1.2
(a)(b)
(c)
(d)
(e)
(a)(b)
(c)
(d)
(e)
(f)(g)
(h)
(i)
(k)
FIG. 6. �Color online� Radial SPA-LEED profiles of a thinPTCDA film of about 0.7 ML nominal thickness, grown on a10-ML-thick NaCl film on Ag�100� at 100 K. Profiles �a�–�e� and
�f�–�k� were measured along the �10� and �11̄� direction, respec-tively. Profiles �a� and �f� were measured directly after growth. Theother profiles demonstrate the evolution after consecutive anneal-ing. In detail: ��b� and �g�� after annealing at 200 K for 10 min, ��c�and �h�� after further annealing at 270 K for 15 min, ��d� and �i��after further annealing at 270 K for 10 min and at 285 K for 10 min,��e� and �k�� after further annealing at 285 K for 30 min and at 300K for 20 min. The profiles are vertically shifted for clarity. The graycurves show individual peaks fitted to the data, the black curves arethe sums of these. In order to avoid overloading, not all fitted com-ponents are shown. Note that spots from both the Q and the HB�
structures are observed along both directions. For further details seetext.
LE MOAL et al. PHYSICAL REVIEW B 82, 045301 �2010�
045301-6
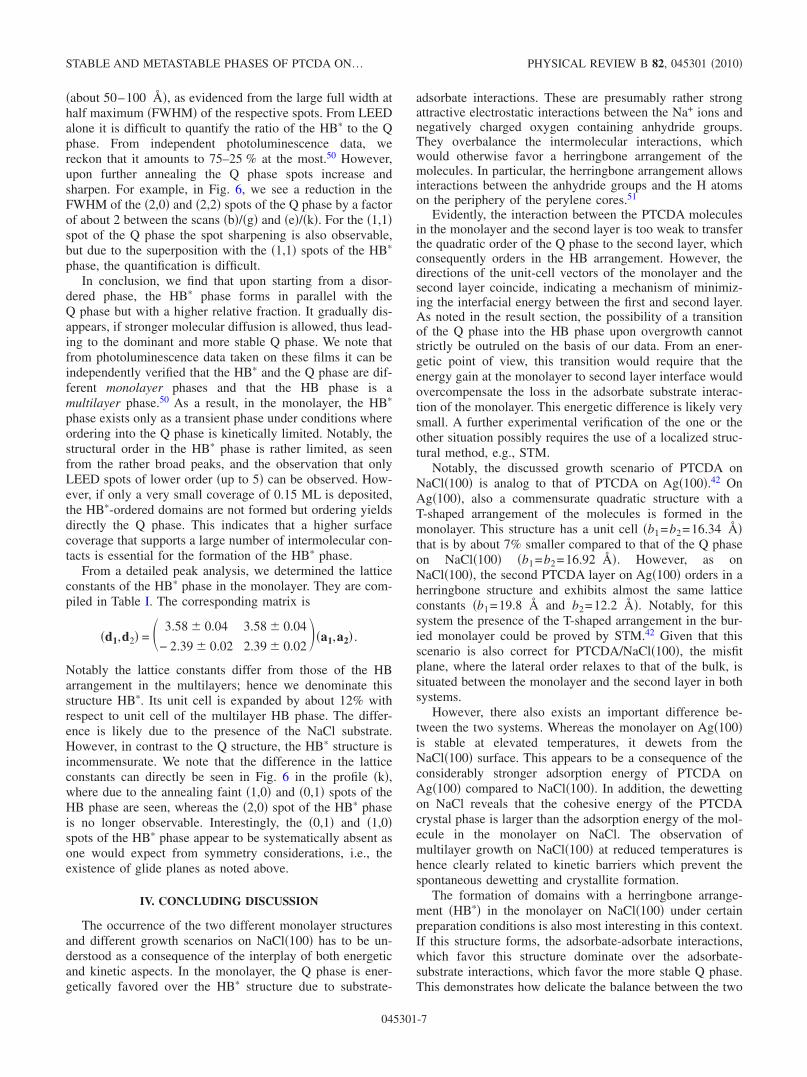
�about 50–100 Å�, as evidenced from the large full width athalf maximum �FWHM� of the respective spots. From LEEDalone it is difficult to quantify the ratio of the HB� to the Qphase. From independent photoluminescence data, wereckon that it amounts to 75–25 % at the most.50 However,upon further annealing the Q phase spots increase andsharpen. For example, in Fig. 6, we see a reduction in theFWHM of the �2,0� and �2,2� spots of the Q phase by a factorof about 2 between the scans �b�/�g� and �e�/�k�. For the �1,1�spot of the Q phase the spot sharpening is also observable,but due to the superposition with the �1,1� spots of the HB�
phase, the quantification is difficult.In conclusion, we find that upon starting from a disor-
dered phase, the HB� phase forms in parallel with theQ phase but with a higher relative fraction. It gradually dis-appears, if stronger molecular diffusion is allowed, thus lead-ing to the dominant and more stable Q phase. We note thatfrom photoluminescence data taken on these films it can beindependently verified that the HB� and the Q phase are dif-ferent monolayer phases and that the HB phase is amultilayer phase.50 As a result, in the monolayer, the HB�
phase exists only as a transient phase under conditions whereordering into the Q phase is kinetically limited. Notably, thestructural order in the HB� phase is rather limited, as seenfrom the rather broad peaks, and the observation that onlyLEED spots of lower order �up to 5� can be observed. How-ever, if only a very small coverage of 0.15 ML is deposited,the HB�-ordered domains are not formed but ordering yieldsdirectly the Q phase. This indicates that a higher surfacecoverage that supports a large number of intermolecular con-tacts is essential for the formation of the HB� phase.
From a detailed peak analysis, we determined the latticeconstants of the HB� phase in the monolayer. They are com-piled in Table I. The corresponding matrix is
�d1,d2� = � 3.58 � 0.04 3.58 � 0.04
− 2.39 � 0.02 2.39 � 0.02�a1,a2� .
Notably the lattice constants differ from those of the HBarrangement in the multilayers; hence we denominate thisstructure HB�. Its unit cell is expanded by about 12% withrespect to unit cell of the multilayer HB phase. The differ-ence is likely due to the presence of the NaCl substrate.However, in contrast to the Q structure, the HB� structure isincommensurate. We note that the difference in the latticeconstants can directly be seen in Fig. 6 in the profile �k�,where due to the annealing faint �1,0� and �0,1� spots of theHB phase are seen, whereas the �2,0� spot of the HB� phaseis no longer observable. Interestingly, the �0,1� and �1,0�spots of the HB� phase appear to be systematically absent asone would expect from symmetry considerations, i.e., theexistence of glide planes as noted above.
IV. CONCLUDING DISCUSSION
The occurrence of the two different monolayer structuresand different growth scenarios on NaCl�100� has to be un-derstood as a consequence of the interplay of both energeticand kinetic aspects. In the monolayer, the Q phase is ener-getically favored over the HB� structure due to substrate-
adsorbate interactions. These are presumably rather strongattractive electrostatic interactions between the Na+ ions andnegatively charged oxygen containing anhydride groups.They overbalance the intermolecular interactions, whichwould otherwise favor a herringbone arrangement of themolecules. In particular, the herringbone arrangement allowsinteractions between the anhydride groups and the H atomson the periphery of the perylene cores.51
Evidently, the interaction between the PTCDA moleculesin the monolayer and the second layer is too weak to transferthe quadratic order of the Q phase to the second layer, whichconsequently orders in the HB arrangement. However, thedirections of the unit-cell vectors of the monolayer and thesecond layer coincide, indicating a mechanism of minimiz-ing the interfacial energy between the first and second layer.As noted in the result section, the possibility of a transitionof the Q phase into the HB phase upon overgrowth cannotstrictly be outruled on the basis of our data. From an ener-getic point of view, this transition would require that theenergy gain at the monolayer to second layer interface wouldovercompensate the loss in the adsorbate substrate interac-tion of the monolayer. This energetic difference is likely verysmall. A further experimental verification of the one or theother situation possibly requires the use of a localized struc-tural method, e.g., STM.
Notably, the discussed growth scenario of PTCDA onNaCl�100� is analog to that of PTCDA on Ag�100�.42 OnAg�100�, also a commensurate quadratic structure with aT-shaped arrangement of the molecules is formed in themonolayer. This structure has a unit cell �b1=b2=16.34 �that is by about 7% smaller compared to that of the Q phaseon NaCl�100� �b1=b2=16.92 �. However, as onNaCl�100�, the second PTCDA layer on Ag�100� orders in aherringbone structure and exhibits almost the same latticeconstants �b1=19.8 Šand b2=12.2 �. Notably, for thissystem the presence of the T-shaped arrangement in the bur-ied monolayer could be proved by STM.42 Given that thisscenario is also correct for PTCDA/NaCl�100�, the misfitplane, where the lateral order relaxes to that of the bulk, issituated between the monolayer and the second layer in bothsystems.
However, there also exists an important difference be-tween the two systems. Whereas the monolayer on Ag�100�is stable at elevated temperatures, it dewets from theNaCl�100� surface. This appears to be a consequence of theconsiderably stronger adsorption energy of PTCDA onAg�100� compared to NaCl�100�. In addition, the dewettingon NaCl reveals that the cohesive energy of the PTCDAcrystal phase is larger than the adsorption energy of the mol-ecule in the monolayer on NaCl. The observation ofmultilayer growth on NaCl�100� at reduced temperatures ishence clearly related to kinetic barriers which prevent thespontaneous dewetting and crystallite formation.
The formation of domains with a herringbone arrange-ment �HB�� in the monolayer on NaCl�100� under certainpreparation conditions is also most interesting in this context.If this structure forms, the adsorbate-adsorbate interactions,which favor this structure dominate over the adsorbate-substrate interactions, which favor the more stable Q phase.This demonstrates how delicate the balance between the two
STABLE AND METASTABLE PHASES OF PTCDA ON… PHYSICAL REVIEW B 82, 045301 �2010�
045301-7
interactions in the monolayer is. We speculate that the for-mation of the long-range ordered Q phase requires more col-lective processes and possibly also the passing of a higheractivation barrier than it is the case for the formation of theHB� phase. Hence, starting from a disordered phase, the HB�
phase is formed predominantly, but only as a transient phase.This scenario is also supported by the fact that relativelysmall domains of the HB� phase are formed. So far, we havenot been able to prepare the HB� phase as a pure phase butonly together with some fraction of the Q phase.
We have to discuss our findings in relation with those ofBurke et al.34 on PTCDA on bulk NaCl. In general, ourresults are compatible with those of Burke et al. However,there are several points where we can amend these. First ofall, we find that the spontaneous dewetting of the monolayerphase at room temperature is a temperature-driven process,which is, however, not present at low temperatures. Further-more, Burke et al. have suggested on the basis of molecularmechanics calculations that the Q phase cannot be over-grown by a second layer but that it transforms into ap�2�3� structure �11.28 �16.92 � when being coveredby a second layer of PTCDA.34 From our data we cannotsupport the transformation of the Q phase upon further depo-sition into a p�2�3� structure. As noted, this would causeadditional �2�3� diffraction spot, which we do not observe.Notably, the p�2�3� is significantly compressed along itslong axis with respect to the bulk HB arrangement ��16%and 13% for the � and � phase, respectively�, leading to asmall unit cell �only 80% of that of the HB phase�. Thisimplies a tilted �nonplanar� arrangement of the PTCDAmolecules,34 which we consider as unfavorable, since thesystem would lose considerably interaction energy betweenthe substrate and the adsorbate. The only transformation ofthe buried monolayer, which is compatible with our data,would be that into the HB structure. Any other ordered struc-ture would lead to corresponding additional LEED spots,which were not observed.
In a further publication Burke et al.52 reported the forma-tion of a p�2�4� structure �11.28 �22.56 � withinsmall pits on an NaCl�100� surface that was treated bycharge irradiation before. This structure is well compatiblewith the space requirements of flat-lying PTCDA molecules.However, our data give no indications of the existence of thisstructure, possibly because it only forms in step-confinedpits.
PTCDA monolayers were also studied on the KCl�100��Ref. 39� and KBr�100� �Ref. 4� surface, which exhibitslightly larger lattice constants compared to NaCl�100��aNaCl=3.99 Å, aKCl=4.45 Å, and aKBr=4.67 Å �Ref. 45��.In contrast to the situation on NaCl�100�, a commensurate“brick-wall” arrangement of the molecules with a square-shaped unit cell �158.76 Å2� with one molecule per cell isformed on KCl�100�. The origin of this structure appears tobe again an electrostatic interaction between the anhydridegroups and the K+ cations of the surface, however, favoring adifferent structure compared to NaCl�100�. On KBr�100�, an
HB arrangement as in the bulk �� or � phase� is found.Possibly the lattice constant does not allow a commensuratestructure with favorable electrostatic interaction to the sub-strate, and as a consequence, the intermolecular interactionsorder the molecules into the bulk structure. In summary, allthese findings indicate a delicate balance between thesubstrate-adsorbate and the adsorbate-adsorbate interactionsfor PTCDA on different alkali-halide �100� surfaces and thatthe variations in the lattice constants and possibly also thepresence of specific surface defects, e.g., steps, decidewhether one or the other structure is energetically favored.
As noted at the beginning, thicker films of PTCDA onNaCl�100� were studied in the past by several groups36,38 andshow the presence of azimuthally aligned nanocrystallites.So far, we have not been able to understand these azimuthalorientations on the basis of the HB multilayer phase, whichwe observed. It may be hence that the orientation of thenanocrystals is strongly related to surface defects, as, forinstance, steps.
Finally, we note that the closed and highly ordered mono-layer of PTCDA on thin epitaxial NaCl constitutes an idealsystem to study the intermolecular interactions in an ex-tended two-dimensional organic film by surface-sensitiveprobes involving electrons, since charging effects, present onbulk NaCl�100�, are avoided. The presence of differently or-dered structures makes this system especially interesting, no-tably for investigating correlations between the intermolecu-lar structural order and electronic and/or optical properties ofultrathin organic films.
V. SUMMARY
In the monolayer regime, PTCDA on thin NaClfilms forms ordered domains with a commensurate�3�2�3�2�R45° superstructure and a “T-shape” in-planemolecular arrangement. At suitable low temperatures �e.g.,223 K� the commensurate monolayer can be overgrown bywell-ordered multilayers with a herringbone and hence bulk-like arrangement. At low temperatures, these multilayers arestable at the time scale of the observations. At RT, thePTCDA multilayers undergo a slow dewetting transition,which leaves most of the NaCl surface bare. Remarkably, aherribone arrangement with slightly modified lattice con-stants is observed as a transient phase for monolayers, if adisordered PTCDA film of nearly monolayer coverage grownat low temperatures �20–100 K� is ordered by annealing.
ACKNOWLEDGMENTS
We thank J. Ikonomov for discussion and help in simulat-ing LEED patterns. This project was supported by theDeutsche Forschungsgemeinschaft through the ResearchUnit 557 “Light Confinement and Control with StructuredDielectrics and Metals.” One of the authors �E.L.M.� ac-knowledges financing by the Alexander von Humboldt Foun-dation.
LE MOAL et al. PHYSICAL REVIEW B 82, 045301 �2010�
045301-8
*Present address: Institut Fresnel �CNRS UMR 6133�, CampusUniversitaire de Saint-Jérôme, 13397 Marseille Cedex 20, France.
†Corresponding author. FAX: �49 �0�228-73 2551;[email protected] H. Klauk, Organic Electronics �Wiley-VCH, Weinheim, 2006�.2 F. Rosei, M. Schunack, Y. Naitoh, P. Jiang, A. Gourdon, E. Lae-
gsgaard, I. Stensgaard, C. Joachim, and F. Besenbacher, Prog.Surf. Sci. 71, 95 �2003�.
3 G. Witte and C. Wöll, J. Mater. Res. 19, 1889 �2004�.4 T. Kunstmann, A. Schlarb, M. Fendrich, T. Wagner, R. Möller,
and R. Hoffmann, Phys. Rev. B 71, 121403 �2005�.5 M. Fendrich and T. Kunstmann, Appl. Phys. Lett. 91, 023101
�2007�.6 R. Bennewitz, V. Barwich, M. Bammerlin, C. Loppacher,
M. Guggisberg, A. Baratoff, E. Meyer, and H. J. Güntherodt,Surf. Sci. 438, 289 �1999�.
7 R. Bennewitz, A. S. Foster, L. N. Kantorovich, M. Bammerlin,C. Loppacher, S. Schär, M. Guggisberg, E. Meyer, and A. L.Shluger, Phys. Rev. B 62, 2074 �2000�.
8 T. Filleter, W. Paul, and R. Bennewitz, Phys. Rev. B 77, 035430�2008�.
9 A. Kikas, V. Kisand, T. Käämbre, R. Ruus, E. Nõmmiste,M. Hirsimäki, M. Valden, E. Kukk, H. Aksela, and S. Aksela,Surf. Sci. 584, 49 �2005�.
10 A. Riemann, S. Fölsch, and K. H. Rieder, Phys. Rev. B 72,125423 �2005�.
11 M. Kiguchi, S. Entani, K. Saiki, H. Inoue, and A. Koma, Phys.Rev. B 66, 155424 �2002�.
12 M. Kiguchi, Bull. Chem. Soc. Jpn. 80, 637 �2007�.13 K. F. Braun, D. Farias, S. Fölsch, and K. H. Rieder, Surf. Sci.
454-456, 750 �2000�.14 D. Farías, K. F. Braun, S. Fölsch, G. Meyer, and K. H. Rieder,
Surf. Sci. 470, L93 �2000�.15 M. Kiguchi, T. Goto, K. Saiki, T. Sasaki, Y. Iwasawa, and
A. Koma, Surf. Sci. 512, 97 �2002�.16 M. Pivetta, F. Patthey, M. Stengel, A. Baldereschi, and W.-D.
Schneider, Phys. Rev. B 72, 115404 �2005�.17 J. Kramer, C. Tegenkamp, and H. Pfnür, J. Phys.: Condens. Mat-
ter 15, 6473 �2003�.18 K. Aït-Mansour, M. Bielmann, O. Gröning, P. Ruffieux, R. Fasel,
and P. Gröning, Appl. Surf. Sci. 252, 6368 �2006�.19 F. Reniers, D. H. Fairbrother, S. Wu, and J. Lipkowski, Surf. Sci.
433-435, 12 �1999�.20 C. Loppacher, U. Zerweck, and L. M. Eng, Nanotechnology 15,
S9 �2004�.21 U. Barjenbruch, S. Fölsch, and M. Henzler, Surf. Sci. 211-212,
749 �1989�.22 S. Fölsch, U. Barjenbruch, and M. Henzler, Thin Solid Films
172, 123 �1989�.23 K. Glöckler, M. Sokolowski, A. Soukopp, and E. Umbach, Phys.
Rev. B 54, 7705 �1996�.24 W. Hebenstreit, J. Redinger, Z. Horozova, M. Schmid, R. Pod-
loucky, and P. Varga, Surf. Sci. 424, L321 �1999�.25 R. Bennewitz, J. Phys.: Condens. Matter 18, R417 �2006�.
26 J. Repp, G. Meyer, S. M. Stojković, A. Gourdon, andC. Joachim, Phys. Rev. Lett. 94, 026803 �2005�.
27 L. Ramoino, M. von Arx, S. Schintke, A. Baratoff, H. J.Güntherodt, and T. A. Jung, Chem. Phys. Lett. 417, 22 �2006�.
28 C. Loppacher, U. Zerweck, L. M. Eng, S. Gemming, G. Seifert,C. Olbrich, K. Morawetz, and M. Schreiber, Nanotechnology17, 1568 �2006�.
29 U. Zerweck, C. Loppacher, and L. M. Eng, Nanotechnology 17,S107 �2006�.
30 B. Such, G. Goryl, S. Godlewski, J. J. Kolodziej, and M. Szy-monski, Nanotechnology 19, 475705 �2008�.
31 T. Glatzel, L. Zimmerli, and E. Meyer, Isr. J. Chem. 48, 107�2008�.
32 A. Scarfato, Surf. Sci. 602, 677 �2008�.33 C. J. Villagomez, Surf. Sci. 603, 1526 �2009�.34 S. A. Burke, W. Ji, J. M. Mativetsky, J. M. Topple, S. Fostner,
H. J. Gao, H. Guo, and P. Grütter, Phys. Rev. Lett. 100, 186104�2008�.
35 S. A. Burke, J. M. Topple, and P. Grütter, J. Phys.: Condens.Matter 21, 423101 �2009�.
36 M. Möbus, N. Karl, and T. Kobayashi, J. Cryst. Growth 116,495 �1992�.
37 M. Möbus, M. Schreck, and N. Karl, Thin Solid Films 175, 89�1989�.
38 D. Schlettwein, A. Back, B. Schilling, T. Fritz, and N. R. Arm-strong, Chem. Mater. 10, 601 �1998�.
39 T. Dienel, S. C. Loppacher, C. B. Mannsfeld, R. Forker, andT. Fritz, Adv. Mater. 20, 959 �2008�.
40 J. M. Mativetsky, S. A. Burke, S. Fostner, and P. Grütter, Nano-technology 18, 105303 �2007�.
41 M. Horn-von Hoegen, Z. Kristallogr. 214, 591 �1999�.42 J. Ikonomov, O. Bauer, and M. Sokolowski, Surf. Sci. 602, 2061
�2008�.43 E. Le Moal, M. Müller, O. Bauer, and M. Sokolowski, Surf. Sci.
603, 2434 �2009�.44 T. Ogawa, K. Kuwamoto, S. Isoda, T. Kobayashia, and N. Karl,
Acta Crystallogr., Sect. B: Struct. Sci. 55, 123 �1999�.45 R. K. Kirby, T. A. Hahn, and B. D. Rothrock, in American In-
stitute of Physics Handbook, edited by D. E. Gray �McGraw-Hill, New York, 1972�, p. 4.119.
46 J. D. H. Donnay, W. P. Mason, and E. A. Wood, in AmericanInstitute of Physics Handbook, edited by D. E. Gray �McGraw-Hill, New York, 1972�, p. 9.1.
47 F. S. Tautz, Prog. Surf. Sci. 82, 479 �2007�.48 L. Kilian, E. Umbach, and M. Sokolowski, Surf. Sci. 600, 2633
�2006�.49 S. A. Burke, J. M. Mativetsky, R. Hoffmann, and P. Grütter,
Phys. Rev. Lett. 94, 096102 �2005�.50 M. Müller, E. Le Moal, and M. Sokolowski �unpublished�.51 A. Kraft, R. Temirov, S. K. M. Henze, S. Soubatch, M. Rohlfing,
and F. S. Tautz, Phys. Rev. B 74, 041402�R� �2006�.52 S. A. Burke, J. M. LeDue, J. M. Topple, S. Fostner, and P. Grüt-
ter, Adv. Mater. 21, 2029 �2009�.
STABLE AND METASTABLE PHASES OF PTCDA ON… PHYSICAL REVIEW B 82, 045301 �2010�
045301-9


