Embed Size (px)
Citation preview

ENVIRONMENTAL RESEARCH 57, 190--207 (1992)
Stable Isotope Labeling of Lead Compartments in Rats with Ultralow Lead Concentrations
DONALD R. SMITH, *'1 JOHN D. OSTERLOH,? SID NIEMEYER,:~ AND
A. RUSSELL FLEGAL§
*Department of Biology, University of California, Santa Cruz, California 95064; ~Department of Toxicology, University of California, San Francisco, California 94143; ~Nuclear Chemistry
Division, Lawrence Livermore National Laboratory, Livermore, California 94550; and §Institute of Marine Sciences, University of California, Santa Cruz, California 95064
Received July 30, 1991
The role of the mammalian skeleton as an endogenous lead source is unclear. This is due in part to difficulties in distinguishing mobilized skeletal lead from other endogenous and exogenous lead sources. Therefore, we have applied ultraclean stable lead isotope tech- niques to label skeletal and soft tissue lead compartments within the rat with distinguishable lead isotopic signatures. Female Wistar (defined flora) rats were fed 2°6pb-enriched drinking water ([Pb] = 110 ng/ml) and sacrificed after durations of 2, 4, 7, and 14 days. Blood, kidney, vertebra, and tibia tissues were analyzed for lead concentrations and stable isotopic compositions. The resulting isotopic ratios in soft (blood and kidney) and skeletal (vertebrae and tibia) tissues differed by -40% after 2 days exposure to the 2°6pb tracer. More than 90% of the tracer isotopic signature was contained in the soft tissues after 10 days exposure, while skeletal tissues acquired only -50% of the tracer by the end of the study. Because these animals were maintained under trace metal-clean conditions, they contained lead concentrations in whole blood (0.3-3 ng/g), kidney (11-27 ng/g dry wt), and bone (35-70 ng/g dry wt) tissues that are the lowest known reported for contemporary terrestrial mammals, and they (in bone) are comparable to levels in preindustrial mammals. The elevated con- centrations of lead in kidney (fresh weight) relative to levels in blood are consistent with the presence of specific lead-binding sites in the kidney at very low levels of exposure. © 1992 Academic Press, Inc.
INTRODUCTION
The skeleton contains the majority (>90%) of the body's lead burden, though its role as an endogenous lead source during homeostasis is unclear (Manton, 1977, 1985; Rabinowitz et al. , 1977). There is also evidence that potentially toxic quan- tities of lead are remobilized from bone in response to chelation therapy (Ham- mond et al. , 1967; Doniec et al. , 1983; Cory-Slechta et al. , 1987; Singh et al. , 1989) or endocrine-mediated changes in skeletal metabolism (Keller and Doherty, 1980a; Rosen et al. , 1980; Manton, 1985; Siblergeld et al. , 1988). Evaluating the significance of remobilized bone lead has been hampered by difficulties in distin- guishing lead derived from skeletal versus soft tissue or exogenous sources (Man- ton, 1977; Rabinowitz et al. , 1977; Cory-Slechta et al. , 1987). However, many of these difficulties can be overcome by using stable lead isotope systematics to distinguish between skeletal and soft tissues that are isotopically distinct.
1 Current address: Program in Toxicology, University of Maryland at Baltimore, Baltimore, MD
21201.
0013-9351/92 $3.00 Copyright © 1992 by Academic Press, Inc. All rights of reproduction in any form reserved.
190

STABLE ISOTOPE LABELING OF LEAD COMPARTMENTS 191
Stable lead isotope tracer methodologies have provided the most definitive measurements of lead metabolism in humans (Rabinowitz et al., 1973; Manton, 1977). The inherent precision (<0.1% RSE) and sensitivity (<1 ng sample Pb) of this technique allows the use of very low exposure levels in lead tracer studies. This technique overcomes many of the analytical (poor precision and sensitivity) and health (exposure to radioactivity) limitations encountered in studies employ- ing simple lead concentration measurements or radiolead isotopes. However, stable lead isotope studies require trace metal-clean procedures to control inci- dental sources of lead that may confound interpretation of the results (Patterson and Settle, 1976).
There is a significant need for low level lead toxicity studies in humans and laboratory organisms (U.S. EPA, 1986). This need is based on poorly defined toxicity thresholds in some lead-sensitive biologic systems (e.g., Pirkle et al., 1985; Sharp et al., 1987; Needleman and Gatsonis, 1990), and continued trends of decreasing human blood lead (PbB) levels which have paralleled decreases in atmospheric lead emissions (Annest et al., 1983; Ducoffre et al., 1990). However, low level lead studies are difficult to conduct because of the ubiquitous occur- rence of industrial lead in the environment and the prevalence of contamination during sample collection, processing, and analyses. These studies can be effec- tively conducted only by using trace metal-clean procedures and biological sys- tems that have been maintained in a low lead environment. Many studies of lead in laboratory organisms continue to focus on defining metabolic or toxic re- sponses at elevated exposures (e.g., >50 ppm Pb in drinking water or >10 mg/kg injections) (Bankowska and Hine, 1985; Cory-Slechta et al., 1987; P'an and Kennedy, 1989).
The purpose of this preliminary study was to demonstrate the applicability of ultraclean stable lead isotope techniques to label skeletal and soft tissue lead compartments within the rat with distinguishable lead isotopic signatures at low (ng/g) lead concentrations. Our ultimate objectives are to determine the role of skeletal tissue as an endogenous lead source and the effectiveness of therapeutic chelating agents in remobilizing and removing skeletal versus soft tissue lead. These objectives will be addressed in subsequent studies employing the proce- dures in this report.
METHODS
Animal s
Eight female Wistar rats (4-6 weeks old), weighing from 100 to 140 g, were used. Defined flora (DF) animals were selected because they had been reared over generations on a constant and well-characterized diet (Zeigler NIH-31) in an iso- lator environment with HEPA filtered air. These conditions led us to expect that the lead isotopic compositions of the skeletal and soft tissues were homogeneous and indistinguishable at the beginning of the experiment (this was verified later). Throughout the study, the animals were maintained in a HEPA filtered air (Class- 100) environment on their original food and water sources. Animals were individ- ually housed in plastic (polycarbonate) metabolic cages equipped with stainless steel floor grates. The stock glass/stainless steel water bottle assemblies were

192 SMITH ET AL.
replaced with low density polyethylene (LDPE) bottles fitted with glass dispenser tubes.
An excess volume of the animals' original dietary water source was collected in a preconditioned polyethylene container from the animal supplier. Similarly, a supply of Zeigler NIH-31 pelletized laboratory rat food was obtained and homog- enized using an acid-cleaned stainless steel Sorval homogenizer. Animals were given food and water ad libitum, and consumptions of both were measured daily. The principles of laboratory animal care as promulgated by the National Research Council were observed.
2°rpb Tracer and Dietary Lead Sources
2°6pb (99.66 at.% enriched) as PbCO3 was dissolved in 1 rq HNO3 and diluted to 2 liters with water obtained from the animal supplier. The spiked water was allowed to equilibrate in the primary storage container and the individual water dispensers for 2 weeks prior to beginning the experiment. This minimized lead concentration changes in the spiked water due to adsorption of lead onto the container walls during the course of the study. Prior to beginning the experiment, the individual water dispensers were emptied and refilled with 2°6pb-enriched water from the primary storage container. The mean lead concentration and isotopic compositions of three replicate samples of unspiked water, 2°6pb- enriched water, and food are listed in Table 1.
Study Design
The study was conducted over a period of 14 days to exceed the estimated half-life ( - 6 days) of lead in blood of rats (Castellino and Aloj, 1964; Aungst et al., 1981). Two animals were designated as controls (Co and C14 ) and received no 2°6pb-enriched water. The remaining six experimental animals were exposed to 2°6pb-enriched drinking water starting at t = 0 and maintained for durations of 2 days (animal E2), 4 days (animals E4a and E4b), 7 days (animals Eva and Evb), and 14 days (animal El#). Two animals were sacrificed at t = 4 days and t = 7 days to bracket the approximate half-life of lead in rat blood (Castellino and Aloj, 1964; Aungst et al., 1981) and to obtain some indication of biological variability. The subscripts on the animal designation letters denote the calender day that the animal was sacrificed relative to the beginning of the study ( "a" and " b " sub- scripts refer to replicate animals).
Tissue sampling. Blood, kidney, vertebra, and tibia tissues were collected from all animals. All dissections and tissue samplings were conducted under trace metal-clean filtered air (Class-100) conditions. Dissecting instruments (Teflon and stainless steel) were acid cleaned prior to each dissection and acid rinsed fre- quently between samplings of individual tissues to avoid cross contamination. Animals were sacrificed by exsanguination after halothane inhalation anesthesia. Blood samples (3-4 ml total) were obtained via cardiac puncture from surgically exposed hearts of anesthetized animals using 10-cc acid-cleaned polypropylene syringes fitted with weak acid-rinsed stainless steel needles (21 gauge). Two rep- licate blood samples (1-2 ml each) were deposited into separate LDPE containers and immediately frozen. Both kidneys were removed, rinsed repeatedly with

STABLE ISOTOPE L A B E L I N G OF L E A D C O M P A R T M E N T S 193
ultrapure (18 Mohm) water, placed in polypropylene jars, and immediately frozen. Lumbar vertebrae Nos. 1-5 were removed and individually separated. Under a dissecting microscope, the vertebral spines were removed and the remaining ver- tebral bodies were cleaned of all attached soft tissue down to hard bone, rinsed with ultrapure water, and immediately frozen. Similarly, both tibias were re- moved, and the long shafts were isolated, cleaned of all soft tissue, and then bisected laterally to remove the bone marrow. The cleaned bone fragments were rinsed and immediately frozen.
Analytical
Laboratory, containers, and reagents. All sample processing and analyses were conducted under trace metal-clean HEPA filtered air (Class-100) conditions. The metabolic cage assemblies (polycarbonate and stainless steel) were acid cleaned in dilute HNO3. Laboratory ware (Teflon, LDPE, and polypropylene) was acid cleaned using the procedures detailed by Patterson and Settle (1976). Reagents were double subboiling quartz distilled, and only ultrapure (18 Mohm) water was used.
Lead and calcium concentrations. The samples were transferred to Teflon vials and oven dried to a constant weight. Samples were digested for - 8 hr in 2 ml hot 16 N HNO 3, evaporated to dryness, and redissolved in 1 N HNO 3. Lead concen- trations were measured in sample aliquots by Zeeman graphite furnace atomic absorption spectrometry (AAS) (Slavin et al., 1983), except for lead levels in blood which were measured in one of the two collected sample replicates by isotope dilution mass spectrometry (IDMS) as described below. Matrix modifiers (NH4PO 4 and MgNO3) and the method of additions were used in the AAS anal- yses to minimize matrix interferences. Calcium concentrations were determined in bone samples by flame AAS using matrix modifiers. Procedural accuracy of the lead concentration measurements was quantified with concurrent analyses of Standard Reference Material (SRM) 1577a. The analytical limit of quantitation of lead by AAS was 0.2 ng/ml. Lead concentrations are reported as ng Pb/g whole blood or ng Pb/g dry tissue (kidney and bone). The mean (---SD) dry weight/wet weight ratio of kidney tissue was 0.26 (-+0.01). Vertebra and tibia lead concen- trations are also reported normalized to calcium (Pb/Ca atom ratios), since lead serves as a biologic analog to calcium and skeletal tissue lead concentrations can vary with mineral content (Gross et al., 1975; Wittmers et al., 1988; Rosen and Pounds, 1989).
Isotopic compositions. Following lead and calcium concentration determina- tions, samples were evaporated to dryness, redissolved in 1.2 N HBr, and passed through a preconditioned Teflon microcolumn loaded with AG l-X8 200-400 mesh anion-exchange resin. After flushing with 1 ml 1.2 N HBr, sample lead was eluted with 1 ml 8 N HCI. Collected eluate was evaporated to dryness, redissolved in 1.2 N HBr, and passed through a new column a second time. The final eluate was evaporated to dryness and residual organics were digested with successive treat- ments of aqua regia, HC104, and HNO3.
Lead isotopic compositions were measured by thermal ionization mass spec- trometry on a 1- to 2-ng Pb sample loaded on an outgassed rhenium filament in the

194 SMITH ET AL.
presence of silica gel and H 3 P O 4. Reported errors are +_20- of the mean (20-z). An instrument fractionation bias of 0.12 --- 0.02% was derived from concurrent cali- brations of SRM 981. Total cumulative lead blanks were 240 pg - 10%, based on the anaylses of container, reagent, and procedural blanks.
Since blood sample lead concentrations approached the limit of quantitation using AAS (0.2 ng/ml), one of the two collected sample replicates was analyzed for lead concentration by IDMS. These samples were processed using the proce- dures described above, except that a weighed mass of 2°8pb spike was added to the sample prior to the digestion and column separations. IDMS analyses of similarly prepared samples of SRM 1577a were used to verify the accuracy of the blood lead concentration measurements.
I so top ic c o m p o s i t i o n b lank correct ion. The influence of a constant blank amount and isotopic composition on the sample isotopic composition increases nonlinearly with increasing isotopic difference between the sample and the blank. Sample versus blank isotopic differences, while normally relatively small (<5%) in environmental samples, can be very large (>200%) in stable lead isotope tracer studies. Large differences result in significant blank corrections in cases in which the blank lead content is >5% of the sample lead. In those cases, the accuracy and precision of the sample and the blank lead content measurements will determine the accuracy of the true blank-corrected sample isotopic composition [assuming isotopic ratio measurement errors (20-~) are <0.05%]. Therefore, the isotopic correction of the samples for the cumulative procedural blank was carried out using the general formula
(A/B)m - ((A/B)b * X) (A/B)c = 1 - X '
where (A/B)c = blank-corrected ratio of isotopes A and B in the sample
(A/B)m = measured ratio of isotopes A and B in the sample (A/B)b = measured ratio of isotopes A and B in the blank
X = (Bb/Bm),
where B b = abundance of isotope B in the blank
B m = abundance of isotope B in the measured sample.
The propagated contribution of lead concentration and isotopic ratio measure- ment errors (Bevington, 1969) to the final isotopic composition error values were determined with the formula
( ( (o-m) 2 q- (fib * X ) 2 q'- 0-x *
ac = 1 - X '

S T A B L E I S O T O P E L A B E L I N G O F L E A D C O M P A R T M E N T S 195
where O"
O" c
0" m =
O- b =
% =
m =
b = X =
cry corrected error on corrected isotopic ratio ((A/B) c above) measured error on measured isotopic ratio measured error on blank isotopic ratio error on measurement of X term isotopic ratio of measured sample isotopic ratio of blank (same as defined above).
In this study, additional calculations were required to determine the corrected lead concentration (by IDMS) and isotopic composition of the 2°6pb-enriched blood samples because of varying blank contributions to the replicate sample aliquots. A detailed description of those calculations will appear elsewhere (Niemeyer et al., 1992).
Data Analyses
Calculated dietary lead intakes. The isotopic composition of each animal's total (food + water) dietary intake was calculated using the formula
Isotope Ratio A/B =
(A/g food * g food intake) + (A/g water * g water intake)
(B/g food * g food intake) + (B/g water * g water intake) '
where A = abundance of isotope A B = abundance of isotope B.
The calculated dietary intakes reflect the maximum 2°6pb tracer label each animal would acquire after prolonged exposure to those dietary lead sources. This cal- culation assumes equal absorption efficiency of lead in food and water.
Percentage 2°6pb tracer in tissues. The relative amounts of 2°6pb tracer con- tained in the individual tissues of each animal were determined using three isotope (i.e., 2°7pb/2°6pb versus 2°8pb/2°6pb ratios) linear regression analyses (e.g., Podosek, 1970). The isotopic compositions of the control animals' tissues and the dietary lead intake of the 2°6pb-dosed animals represent the two end-members of a two-component system. Any sample (i.e., tissue) receiving inputs solely from those two end-members will fall along a mixing line defined by the end-members, and the linear distance along that mixing line will represent the relative contribu- tion of each end-member to the tissue. The assumption that a simple two- component system exists can be tested by the fit of the tissues to the line defined by the two end-members. Therefore, the amount of tracer isotopic signature con- tained in the tissues of each animal was calculated with the formula (using 2°8pb/ 2°6pb ratios)
(208pb/ZO6pb)c - (208pb/ZO6pb)e % Tracer = (208pb/206pb)c _ (208pb/206pb)d * 100,

196 SMITH ET AL.
where (2°8pb/Z°6pb)c = isotopic ratio in control animals (2°8pb/Z°6pb)e = isotopic ratio in tissue of experimental animal (2°8pb/Z°6pb)d = isotopic ratio in calculated dietary intake.
Days of 2 ° r p b exposure (normalized). The experimental animals' exposure to the 2°6pb tracer was dependent upon the exposure duration (days) and the relative and absolute lead intake from food and 2°6pb-enriched water, which varied be- tween animals (Fig. 1). Therefore, the dosing duration (days) for each animal was normalized by a factor derived from that animal' s relative food and 2°6pb-enriched water intake compared to the mean intakes of all 2°6pb-dosed animals combined. This was calculated using the formula
(((ng Pb)w/(ng Pb)f) *(ng Pb)t)/g body wt Dosing duration (normalized) = (W/F) * T
where (ng Pb) w = (ng Pb)f = (ng Pb) t =
W =
F =
T =
total ng Pb intake from 2°6pb-enriched water total ng Pb intake from food sum total ng Pb intake from food and 2°6pb-enriched water mean ng Pb/g body wt/day intake from 2°6pb-enriched water for all experimental animals combined mean ng Pb/g body wt/day intake from food for all experimental animals combined mean sum total ng Pb/g body wt/day intake from food and 2 ° 6 p b -
enriched water for all experimental animals combined.
The corrected measure of lead dose, expressed as days (normalized), more accurately reflects the effective exposure of these animals to the 2°6pb tracer. This is based on an improvement of the best-fit curvilinear relationship between ex- posure duration and the appearance of the 2°6pb tracer in all tissues, and on a better agreement of the levels of tracer accumulated by the two replicate animals sacrificed after 4 and 7 days (experimental animals E4a , E4b and E7a , ETb , respec- tively) (Table 2). Further discussion of exposure duration will refer to the nor- malized days of 2°6pb tracer exposure.
RESU LTS
2°6pb Tracer
The added stable lead tracer altered the isotopic composition of the drinking water >55-fold, while increasing the total lead concentration < 10-fold (Table 1). This resulted in a 3-fold increase in the experimental animals' total dietary lead intake (from 8 ng Pb/g body wt/day in control animal C14 to about 25 ng Pb/g body wt/day in the experimental animals) (Fig. 1). It also produced a 7-fold change in the isotopic composition of that lead intake, which was substantial relative to the <10% natural isotopic variation of environmental lead sources. In contrast, the

STABLE ISOTOPE LABELING OF LEAD COMPARTMENTS 197
TABLE 1 LEAD CONCENTRATIONS AND ISOTOPIC COMPOSITIONS OF THE DIETARY LEAD SOURCES TO
CONTROL (No 2°6pb-ENRICHED WATER INTAKE AND 2°6pb-DoSED ANIMALS
Dietary source [Pb] a 2°8pb/z°6pb 2°7pb/2°6pb
Drinking water (control) 12 (0.3) 2.133 (0.002) 0.8869 (0.0006) Drinking water (2°6pb-enriched) 113 (2) 0.0383 (0.0038) 0.0186 (0.0015) Food 89 (6) 2.022 (0.001) 0.8221 (0.0004)
Note. Data are means of three replicate samples. Errors in parentheses are -+SD (lead concentra- tions) or -+2 ~r (isotopic compositions).
a Concentrations of lead in water are in units of ng Pb/ml; concentrations in food are in ng Pb/g dry wt.
3-fold increase in total dietary lead was small relative to the range of variation of environmental lead exposures (i.e., orders of magnitude, U.S. EPA, 1986).
Isotopic Compositions of Control Animals
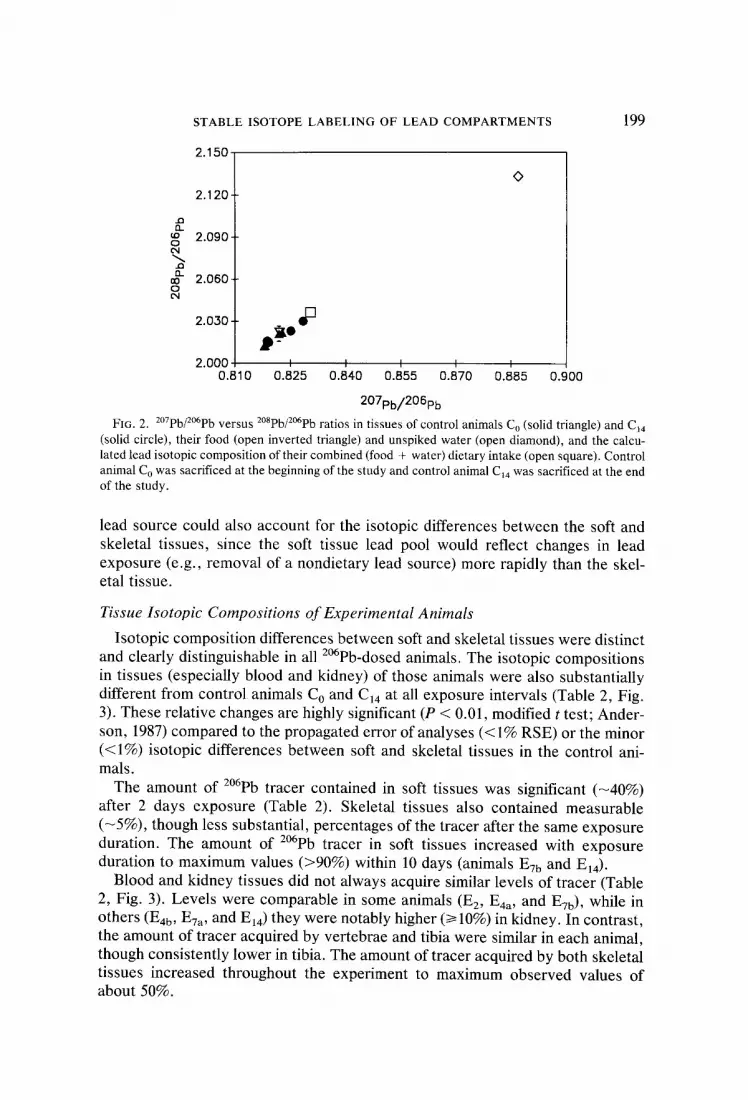
Intertissue isotopic compositions in control animal C o (prestudy) differed by <0.5%. In addition, tissue isotopic compositions of control animal C14 (poststudy) were nearly identical to those of the prestudy control. This sufficiently validated our expectation that the isotopic signatures of the skeletal and soft tissues were homogeneous and indistinguishable at the beginning of the experiment (Table 2, Fig. 2). It also demonstrates that essentially all measurable sources of lead to the study animals were quantified and controlled.
Tissue isotopic compositions of both animals agree to within <1% of the cal- culated isotopic composition of the total dietary intake (Fig. 2). This indicates that the animals derived essentially all (>99%) of their lead from measured dietary
35-
30-
~ ~ 25-
-- "0 20-
C14. E 2 E4a E4b E7a
Animal
HH E7b E14
FIG. 1. Average daily dietary lead intake (normalized per gram body weight) from food (wide crosshatch), unspiked and 2°6pb-enriched water (narrow crosshatch), and the sum total lead intake from food and water (open). Control animal C14 was exposed only to unspiked water, while experi- mental animals E2-E14 received 2°6pb-enriched water.

1 9 8 S M I T H ET AL.
T A B L E 2
LEAD CONCENTRATIONS, ISOTOPIC COMPOSITIONS, AND PERCENTAGE Z°6pb TRACER ACQUIRED IN
TISSUES OF CONTROL AND EXPERIMENTAL (Z°6pb-DoSED) RATS
Dose b [Pb] Pb/Ca % Tracer Animal a days Tissue ng/g c × 10 - s at. 2°spb/2°6pb 2°7pb/'2°6pb acquired
Control animals
Co
C14
Experimental (dosed) animals
E2
NA Blood 0.3 d 2.021 (0.006) 0.8219 (0.0018) NA Kidney 14 2.022 (0.002) 0.8227 (0.0005) NA Vertebrae 53 5.4 2.012 (0.002) 0.8179 (0.0005) NA Tibia 61 4.9 2.012 (0.002) 0.8181 (0.0005) NA
NA Blood 0.3 2.030 (0.003) 0.8284 (0.0009) NA Kidney 10 2.023 (0.002) 0.8251 (0.0008) NA Vertebrae 35 4.4 2.016 (0.002) 0.8187 (0.0004) NA Tibia 56 4.5 2.015 (0.002) 0.8191 (0.0004) NA
2.1 Blood 0.8 1.344 (0.025) 0.5469 (0.0103) 39 Kidney 22 1.356 (0.004) 0.5550 (0.0018) 38 Vertebrae 32 4.9 1.931 (0.002) 0.7843 (0.0005) 5 Tibia 72 4.3 1.934 (0.002) 0.7861 (0.0004) 5
E4a 2.1 Blood 0.6 1.308 (0.022) 0.5329 (0.0089) 44 Kidney 24 1.251 (0.003) 0.5103 (0.0012) 47 Vertebrae 65 5.7 1.900 (0.002) 0.7721 (0.0004) 7 Tibia 68 4.8 1.910 (0.002) 0.7769 (0.0004) 6
E4b 3.5 Blood 0.8 1.246 (0.036) 0.5075 (0.0146) 46 Kidney 11 1.077 (0.007) 0.4395 (0.0029) 56 Vertebrae 35 3.8 1.834 (0.002) 0.7463 (0.0006) 11 Tibia 46 4.4 1.849 (0.002) 0.7511 (0.0004) !0
Eva 5.7 Blood 1.3 0.993 (0.012) 0.4049 (0.0048) 61 Kidney 19 0.809 (0.004) 0.3315 (0.0016) 71 Vertebrae 55 5.7 1.711 (0.002) 0.6952 (0.0006) 18 Tibia 63 5.1 1.754 (0.002) 0.7138 (0.0006) 15
E7b 10.3 Blood 2.0 0.329 (0.008) 0.1364 (0.0032) 95 Kidney 27 0.297 (0.002) 0.1236 (0.0010) 97 Vertebrae 39 3.7 1.263 (0.002) 0.5141 (0.0010) 42 Tibia 37 2.7 1.334 (0.004) 0.5436 (0.0017) 38
El4 19.0 Blood 3.1 0.741 (0.010) 0.3027 (0.0041) 73 Kidney 20 0.357 (0.007) 0.1474 (0.0029) 94 Vertebrae 68 5.7 1.083 (0.002) 0.4418 (0.0009) 53 Tibia 68 5.1 1.182 (0.002) 0.4821 (0.0007) 47
Note. Isotopic composition errors in parentheses are +-2~rz. a Control (C) and experimental (E) animal letter designations correspond to individual animals (subscript -
calender day animal was sacrificed after the start of the study; 2°6pb dosing began at Day 0). b Dose days = duration of 2°6pb dosing (in days) normalized to the measured dietary lead intake per animal (see
text for calculation). NA, not applicable. c PbB's are in units of ng Pb/g whole blood. Kidney and bone concentrations are in ng Pb/g tissue dry wt. a Lead concentration not measured, though assumed to be equivalent to control animal C14.
sources. The isotopic composition of the control animals can be attributed pri- marily (>90%) to lead in the food, which is comparable to the food's fractional contribution (>85%) to the total lead intake.
The small (< 1%) but measurable differences between the tissue isotopic com- positions and the calculated isotopic composition of the total dietary intake sug- gest a slight bias toward the uptake of lead in the food, and/or an unmeasured source of lead to these animals prior to this study. The latter is supported by the isotopic compositions of the bone tissues of both control animals, which were outside the range of their dietary lead sources (Fig. 2). A previous, unmeasured
STABLE ISOTOPE LABELING OF LEAD COMPARTMENTS 199
..Q n
o ¢'4
o
2 . 1 5 0
2.120
2 . 0 9 0 ,
2.060 -
2 . 0 3 0 -
0
2 . 0 0 0 I I I [ I 0 . 8 1 0 0 . 8 2 5 0 . 8 4 0 0 . 8 5 5 0 . 8 7 0 0 . 8 8 5 0 . 9 0 0
2 0 7 p b / 2 0 6 p b
FIG. 2. 2°7pb/2°6pb versus z°8pb/2°6pb ratios in tissues of control animals Co (solid triangle) and CI4 (solid circle), their food (open inverted triangle) and unspiked water (open diamond), and the calcu- lated lead isotopic composition of their combined (food + water) dietary intake (open square). Control animal Co was sacrificed at the beginning of the study and control animal C14 was sacrificed at the end of the study.
lead source could also account for the isotopic differences between the soft and skeletal tissues, since the soft tissue lead pool would reflect changes in lead exposure (e.g., removal of a nondietary lead source) more rapidly than the skel- etal tissue.
Tissue Isotopic Compositions of Experimental Animals
Isotopic composition differences between soft and skeletal tissues were distinct and clearly distinguishable in all 2°6pb-dosed animals. The isotopic compositions in tissues (especially blood and kidney) of those animals were also substantially different from control animals Co and C14 at all exposure intervals (Table 2, Fig. 3). These relative changes are highly significant (P < 0.01, modified t test; Ander- son, 1987) compared to the propagated error of analyses (< I% RSE) or the minor (<1%) isotopic differences between soft and skeletal tissues in the control ani- mals.
The amount of 2°6pb tracer contained in soft tissues was significant (-40%) after 2 days exposure (Table 2). Skeletal tissues also contained measurable (-5%), though less substantial, percentages of the tracer after the same exposure duration. The amount of 2°6pb tracer in soft tissues increased with exposure duration to maximum values (>90%) within 10 days (animals Evb and El4 ).
Blood and kidney tissues did not always acquire similar levels of tracer (Table 2, Fig. 3). Levels were comparable in some animals (E2, E4a , and ETb), while in others (E4b , E7a , and El4 ) they were notably higher (/> 10%) in kidney. In contrast, the amount of tracer acquired by vertebrae and tibia were similar in each animal, though consistently lower in tibia. The amount of tracer acquired by both skeletal tissues increased throughout the experiment to maximum observed values of about 50%.

200 SMITH ET AL.
2.40.
2.00- E2 =o t=2d
=~ 1.6o- o eq U
1.20- r t
EL .n 0 .80 - 0 o~
0.40- []
0"0o%0 o.~5 o.;o 0.~s o.~o 0% o.9o 207pb/206pb
2.40 E4o 2.00 ~O
_o t=2d ~o ~ 1.60 o ~.~1.20 me EL o= o.8o O4
0.40 []
0"0o%0 0.~5 030 0.~5 0.;0 0% 0.90 207pb/206pb
2.40.
2.00- E4b o ~. t=4d
1.60- O ¢N
1.20. * EL ~) 0.80-
0.40- []
q
0"0g.00 0.15 0.;0 0.45 0.60 0.~75 0.90 207pb/206pb
2.40 E7o
2.00 0 ~_ t=Bd , ,
1.60 o "~ 1.20 JO EL @
o = 0 . 8 o •
0.40~ []
O.OC o.oo o.~5 o.;o 0% o.;o 0% 0.90 207pb/206pb
2.40. E7b t=10d
O 2.00 Jo
1.6o o
1.20 Jo n oo 0.80 0 0 4
0.40
0-08.00 o.~5 ' 0.3o o.~5 o . ;o ' 0.75 0 . 9 0
207pb/206pb
2.40- r -
2.00- cl 4 o .o t=19d ~EL 1.60- o "~ 1.20" vA EL o ~ 0.80 O4
0.40- Om
0"0o%0 0~5 0.;0 0.~5 0.;0 ' 0.75 0.90 207pb/206pb
FIG. 3. 2°Tpb/2°6pb versus 2°spb/2°6pb in blood (solid diamond), kidney (solid square), vertebrae (solid inverted triangle), and tibia (solid triangle) tissues of 2°6pb-dosed animals Ez-E14 (figure letters E2-EI4 correspond to experimental animals in Table 2; t, dosing duration in dose-normalized days). Also included are the isotopic compositions in control animals Co and C14 (open circles), and those of the experimental animals' calculated dietary lead intakes (open square). The calculated dietary intake represents the isotopic composition of each animal's combined food and water intake (see text for calculation).
Lead Concentrations
L e a d c o n c e n t r a t i o n s w e r e l o w e s t in b l o o d (0.3 to 3 ng/g) and h ighes t in t ib i a t i s sue (46 to 72 ng/g) (Tab le 2). In te r - and i n t r a a n i m a l va r i ab i l i t y in b o n e l ead l eve l s was r e d u c e d w h e n c o n c e n t r a t i o n s w e r e n o r m a l i z e d to c a l c ium as P b / C a a t o m ra t ios ( range = 3.8 × 10 - 8 to 5.7 x 10⁻⁸) . L e a d c o n c e n t r a t i o n s in w h o l e
b l o o d i n c r e a s e d l i nea r ly wi th e x p o s u r e d u r a t i o n ( r eg re s s ion equa t ion : y = 0.15(x) + 0.37; r = 0.995, w h e r e y = [Pb]ng/g and x = d a y s (normal ized) ) .

STABLE ISOTOPE L A B E L I N G OF L E A D C O M P A R T M E N T S 201
In contrast, there were no relationships between exposure duration and lead concentrations in kidney or bone tissues. This may reflect interanimal differences in dietary lead intake (i.e., body lead-burdens) prior to the experiment, as well as differences in the animals' ages (4-6 weeks) and body weights (100-140 g) at death.
Kinetic Analyses
The amount of 2°6pb tracer contained in kidney and bone tissues versus days of tracer exposure (normalized) was best fit mathematically to single-component exponential equations of the form
(%Pb tracer) t = (%Pb tracer)o * (1 - e((-k)(m),
where %Pb tracer = %Pb tracer contained in the tissue
t = days (dose normalized).
Since the equations describing the vertebra and tibia data were not significantly different, the data were combined as skeletal tissue and the best-fit equation was calculated. These simple best-fit models reveal a relatively short half-life of lead in kidney (-2.7 days) compared to lead in skeletal (17 days) tissue (Fig. 4). Kinetic analysis of the uptake of lead tracer in blood is not included, because the linear increase in PbB during the experiment indicates that this lead pool was not in a steady state.
100 i i i i
• 80 • \ K±dnsy
D
03 L 6 0
r~ 0 _ • •
CO 40 K D c~J
2O
0 I I I ~ o.o 4.0 8.0 12.0 16.0 20.0
0ays (no<msl2zed)
FIG. 4. Percentage 2°6pb tracer contained in t issue versus day (day normalized to lead dose/g body wt; see text). The appearance of the tracer in kidney (square) and bone [vertebrae (circle) and tibia (triangle) combined] t i s sues of the exper imenta l animals were fitted mathemat ica l ly by single- exponent ial equat ions of the form Ct = Co (1 - e((k)('))), where C = relative percentage of the tracer contained in the t issue, and t = days. Calculated equation parameters (+-SD) are kidney t issue, C = 98 (4), k = 0.257 (0.028), r = 0.998; bone t issue, C = 97 (34), k = 0.041 (0.019), r = 0.989.

202 SMITH ET AL.
DISCUSSION
Isotopic Labeling o f Lead Compartments
The contrasting residence times of lead in the soft and skeletal compartments of the rat (Castellino and Aloj, 1964; Aungst et al., 1981) resulted in isotopically distinct lead signatures within those tissues. After 2 days exposure the change in the isotopic compositions of the blood and kidney tissues of the experimental animals ( -50% relative to the controls) exceeded the precision of the isotopic measurements (<0.1% RSE) by a factor of >500-fold. This evidences the minor error inherent in stable isotope tracer techniques relative to other sources of error (e.g., biological variability).
The soft tissues contained essentially all (>90%) of the isotopic signature of the 2°6pb-enriched dietary intake after I0 days exposure (except blood of animal El4 = 73%). This indicated that there were no significant additional exogenous sources of lead to the animals during the study other than their diet. In contrast, Rabinowitz et al. (1976) observed in studies with humans that blood never ac- quired more than 40 to 60% of the dietary stable lead tracer label, even after several mean-lives of the blood lead compartment. They attributed this to inputs from uncontrolled exogenous (atmospheric) and endogenous (skeletal) sources of lead.
It is unclear from the isotopic data whether input from previously accumulated skeletal lead (i.e., the inherent isotopic label) contributed significantly to the lead in blood. This is because the rate of increase in PbB's (0.15 ng Pb/g whole blood/ day) due to exposure to the lead tracer may have masked a relatively smaller lead input to blood from the skeleton. Furthermore, the isotopic data would not reflect remobilization of surface bone lead, which is believed to be in rapid exchange with plasma lead based on calcium kinetic studies (Rowland, 1966). That bone lead component would contain an isotopic signature indistinguishable from soft tissue lead enriched in 2°6pb.
Previous studies in adult humans have indicated that the skeleton may contrib- ute measurable and possibly significant amounts of lead to blood (Rabinowitz et al., 1976; Manton, 1977, 1985; Schutz et al., 1987). However, remobilization of skeletal lead in this study may have been small because of an assumed predom- inant net influx of lead into the skeletons of these young rats (O'Flaherty, 1991). This influx would have reflected the rapid skeletal growth that occurs in 4 to 6-week-old rats, during which bone formation greatly exceeds resorption (Klein, 1981; Sontag, 1986).
There were apparent differences in the percentage 2°6pb tracer contained in blood and kidney of three of the animals (E4b , E7a, and E14) at Days (normalized) 3.5, 5.7, and 19 (Table 2). The significance of these differences is difficult to assess because of the small number of animals in this study. The differences may simply reflect interindividual variability in lead uptake and retention, or they may be an artifact of the nature of tracer introduction, which was pulsed-continuous (i.e., dietary ad libitum). The pulsed intake of isotopically distinct food ( -33% of daily dietary Pb intake) and water ( -67% of daily dietary Pb intake) would cause the isotopic composition of the rapidly equilibrating blood lead pool to oscillate

STABLE ISOTOPE L A B E L I N G OF LEAD C O M P A R T M E N T S 203
around an integrated average of the dietary intake [this might have been revealed if blood had been sampled on a shorter (e.g., hourly) time scale]. Therefore, the temporal relationship between the timing of sacrifice and of the most recent feed- ing or drinking could bias the isotopic composition of sampled blood.
The plausibility of this bias is illustrated by the small amount of ingested food (0.13, 0.18, and 0.7 g) necessary to account for the isotopic differences between blood and kidney samples of animals E4b , E7a , and El4, respectively [this assumes blood volume = 7% of body weight, and a 10% absorption efficiency of lead from food (Conrad and Barton, 1978)]. Additionally, isotopic differences between blood and kidney tissues may be due to unknown lead contamination of those blood samples. The very low lead content of blood samples (<5 ng total lead) rendered them especially susceptible to contamination, in spite of our rigorous adherence to trace metal-clean techniques. As little as 0.4 ng additional blank lead would account for the isotopic differences observed in those samples.
If differences in the percentage 2°6pb tracer acquired by blood and kidney are accurate, they suggest that recently absorbed lead may equilibrate more rapidly with the kidney than with the whole blood lead pool. Lead in whole blood is associated primarily (>98%) with red blood cells (DiSilva, 1981). Kinetic models indicate that the rate of lead exchange is slower between plasma and erythrocytes (tens of minutes) than between plasma and extracellular fluid (<minutes) (Cham- berlain, 1985; Marcus, 1985). While rates of lead exchange between plasma/ filtered preurine and renal cells are not well known, it is known that renal reab- sorption of filtered lead is extensive (Vander et al., 1977) and that the rat kidney contains high-affinity lead-binding proteins (Fowler and DuVal, 1991). Therefore, it is possible that recently absorbed lead may appear to equilibrate more rapidly with kidney tissue than with whole blood.
Kinet ics
Calculated half-lives of lead in kidney (-2.7 days) and skeletal ( -17 days) tissues are comparable with previously published studies of rodents (Keller and Doherty, 1980b; Aungst et al., 1981). The small number of animals and limited sampling duration of this study preclude deriving more detailed kinetic parameters of lead in rats. Those parameters have been determined by others (e.g., Castellino and Aloj, 1964; Aungst et al., 1981).
The similarities with previous studies are notable in light of the different lead exposure regimes used. For example, lead exposures in this study ( -3 ~g/day) were nearly two orders of magnitude lower than exposures used in previous studies (e.g., >> 125 ~g/day continuous dietary exposure of >>500 p~g/kg bolus in- jection). This suggests that there may be no dose-dependent change in lead ki- netics at low (subenvironmental) lead exposures.
It is noteworthy that the relatively rapid rates of 2°6pb tracer uptake by tibia and vertebra are nearly the same, though it is often presumed that trabecular (verte- bra) bone is more active metabolically than cortical (tibia) bone. The similar rates of lead uptake may suggest similar levels of bone metabolic activity in these animals. This could be a result of the dominance of rapid new bone formation in

204 SMITH ET AL.
these young animals, rather than steady-state turnover, in which case the uptake of lead would not be a first-order process kinetically.
Lead Concentrations
Tissue lead concentrations within the control and experimental animals are the lowest known reported for any contemporary terrestrial mammal, and they are two to four orders of magnitude lower than levels in rats treated with low doses of lead (P'an and Kennedy, 1989). Further, skeletal lead levels (as Pb/Ca atom ratios) are comparable to estimated levels in preindustrial marine mammals (Smith et al., 1990, 1992) and humans (Ericson et al., 1979; Patterson et al., 1991). Therefore, similar low lead burden animals may suffice as models of prehistoric mammals uncontaminated with industrial lead (Flegal and Smith, 1992). Those animals would be invaluable in assessing the threshold responses of known lead- sensitive biologic systems at subenvironmental exposures.
These types of studies are needed because body lead burdens commonly ob- served in contemporary humans have been associated with asymptomatic lead poisoning (Pirkle et al., 1985; Sharp et al., 1987; Needleman and Gatsonis, 1990). The pervasiveness of lead toxicity at low body burdens may still be underesti- mated, since current levels of lead in environmentally exposed humans (i.e., the control population) are believed to be 500- to 1000-fold higher than levels in their prehistoric ancestors (Ericson et al., 1979; Patterson et al., 1991). Presumably, this applies to other terrestrial mammals as well.
The elevated concentrations of lead in kidney (fresh weight basis) compared to levels in blood may be significant in light of the large amount of the cardiac output that is received by the kidney. These relative differences are similar to those observed by others using much higher lead exposures (Aungst et al., 1981; Bankowska and Hine, 1985). This is consistent with the presence of specific lead-binding sites in the kidney at very low levels of exposure.
Application o f Stable Isotope Systematics
These data are relevant to studies of bone lead metabolism in humans because they corroborate a means to identify skeletal lead and to assess its significance as an endogenous lead source. Distinguishable isotopic compositions in the meta- bolically distinct skeletal and soft tissue lead compartments may be clinically created (e.g., Rabinowitz et al., 1973) or inherently occurring (Manton, 1985; Manea-Krichten, 1991). These isotopic differences could be used to assess skel- etal lead mobilization in response to clinical therapies as well as in healthy hu- mans.
Stable isotope techniques provide a means to assess skeletal lead mobilization and removal in response to chelation therapy. Postchelation isotopic composi- tions of collected urine and tissues would reflect the relative proportion of the isotopically distinct skeletal and soft tissue end-members in those samples. This approach differs from most past studies that have assessed chelatable bone lead, because the tracer label that identifies the skeletal lead pool would be inherent to that compartment.
Finally, permutations of these stable isotope techniques could be used with

STABLE ISOTOPE LABELING OF LEAD COMPARTMENTS 205
humans to assess the absorption of lead from different dietary components that contain intrinsically distinct isotopic signatures. This would be an improvement over studies using radiolead isotopes that were extrinsically added to the diet, because there would be no exposure to radiation. Further, human nutrition stud- ies have raised concerns that differences may exist in the absorption of tracer from intrinsically versus extrinsically labeled diets (Janghorbani et at., 1982).
ACKNOWLEDGMENTS
We thank Charles Becker and Charles Ortiz for theft important contributions to this study, and Ellen O'Flaherty for her comments on the manuscript. We also thank Geoff Smith, Peter Ritson, Morris Barenfus, Patricia Buckendahl, and Lanny Keil for their contributions. This research was supported by funds from the University of California Toxic Substances Research and Teaching Pro- gram, the National Institute of Environmental Health Sciences (Grant ES04850 to J. Osterloh and C. Becket), and the Institute for Geophysics and Planetary Physics.
REFERENCES Anderson, R. L. (1987). "Practical Statistics for Analytical Chemists." Van Nostrand-Reinhold, New
York. Annest, J. L., Pirkle, J. L., Makuc, D., et al. (1983). Chronological trend in blood lead levels between
1976-1980. N. Engl. J. Med. 308, 1373-1377. Aungst, B. J., Dolce, J. A., and Fung, H.-L. (1981). The effect of dose on the disposition of lead in rats
after intravenous and oral administration. Toxicot. Appl. Pharmaeol. 61, 48-57. Bankowska, J., and Hine, C. (1985). Retention of lead in the rat. Arch. Environ. Contam. Toxicol. 14,
621-629. Bevington, P. R. (1969). "Data Reduction and Error Analysis for the Physical Sciences." McGraw-
Hill, New York. Castellino, N., and Aloj, S. (1964). Kinetics of the distribution and excretion of lead in the rat. Br. J.
Ind. Med. 21, 308--314. Chamberlain, A. C. (1985). Prediction of response of blood lead to airborne and dietary lead from
volunteer experiments with lead isotopes. Proc. R. Soc. London B 224, 14%182. Conrad, M. E., and Barton, J. C. (1978). Factors affecting the absorption and excretion of lead in the
rat. Gastroenterology 74, 731-740. Cory-Slechta, D. A., Weiss, B., and Cox, C. (1987). Mobilization and redistribution of lead over the
course of calcium disodium ethylenediamine tetraacetate chelation therapy. J. Pharmacol. Exp. Ther. 243, 804-813.
DiSilva, P. E. (1981). Determination of lead in plasma and studies of its relationship to lead in eryth- rocytes. Br. J. Ind. Med. 38, 20%217.
Doniec, J., Trojanowska, B., Trzcinka-Ochocka, M., and Garlicka, A. (1983). Effects of NazCaEDTA on lead deposits in rabbit osseous tissue. Toxieol. Lett. 19, 1-5.
Ducoffre, G., Claeys, F., and Bruaux, P. (1990). Lowering time trends of blood lead levels in Belgium since 1978. Environ. Res. 51, 25-34.
Ericson, J. E., Shirahata, H., and Patterson, C. C. (1979). Skeletal concentrations of lead in ancient Peruvians. N. Engl. J. Med. 300, 946-951.
Flegal, A. R., and Smith, D. R. (1992). Natural blood lead concentrations in humans, in press. Fowler, B. A., and DuVal, G. (1991). Effects of lead on the kidney: Roles of high-affinity lead-binding
proteins. Environ. Health. Perspect. 91, 77-80. Gross, S. B., Pfitzer, E. A., Yeager, D. W., and Kehoe, R. A. (1975). Lead in human tissues. Toxieol.
Appl. Pharmacol. 32, 638-651. Hammond, P. B., Aronson, A. L., and Otson, C. (1967). The mechanism of mobilization of lead by
ethylenediaminetetraacetate. J. Pharmaeol. Exp. Ther. 157, 196-206. Janghorbani, M., Istfan, N. W., Pagounes, J. O., Steinke, F. H., and Young, V. R. (1982). Absorp-

206 SMITH ET AL.
tion of dietary zinc in man: Comparison of intrinsic and extrinsic labels using a triple stable isotope method. Am. J. Clin. Nutr. 36, 537-545.
Keller, C. A., and Doherty, R. A. (1980a). Bone lead mobilization in lactating mice and lead transfer to suckling offspring. Toxicol. Appl. Pharmacol. 55, 220-228.
Keller, C. A., and Doherty, R. A. (1980b). Lead and calcium distributions in blood, plasma, and milk of the lactating mouse. J. Lab. Clin. Med. 95, 81-89.
Klein, L. (1981). Steady-state relationship of calcium-45 between bone and blood: Differences in growing dogs, chicks, and rats. Science 214, 190-193.
Manea-Krichten, M., Patterson, C., Miller, G., and Settle, D. (1991). Comparative increases of lead and barium with age in human tooth enamel, rib and ulna. Sci. Total. Environ. 107, 179-204.
Manton, W. I. (1977). Sources of lead in blood. Arch. Environ. Health 32, 14%159. Manton, W. I. (1985). Total contribution of airborne lead to blood lead. Br. J. Ind. Med. 42, 168-172. Marcus, A. H. (1985). Multicompartment kinetic model for lead. III. Lead in blood plasma and
erythrocytes. Environ. Res. 36, 473-489. Needleman, H. L., and Gatsonis, C. A. (1990). Low-level lead exposure and the IQ of children: A
meta analysis of modern studies. J. Am. Med. Assoc. 263, 673-678. Niemeyer, S., Smith, D. R., and Flegal., A. R. (1992). Isotopic correction of variable blank lead
content of samples containing low concentrations of lead, manuscript in preparation. O'Flaherty, E. J. (1991). Physiologically based models for bone-seeking elements. II. Kinetics of lead
disposition in rats. Toxicol. Appl. Pharmacol. 111, 313-331. P'an, A. Y. S., and Kennedy, C. (1989). Lead distribution in rats repeatedly treated with low doses of
lead acetate. Environ. Res. 48, 238-247. Patterson, C. C., and Settle, D. M. (1976). The reduction of orders of magnitude errors in lead
analyses of biological materials and natural waters by evaluating and controlling the extent and sources of industrial lead contamination introduced during sample collecting, handling, and anal- ysis. In "National Bureau of Standards Special Publication 422, Accuracy in Trace Analysis: Sampling, Sample Handling, and Analysis" (Proceedings, 7th IMR Symposium, Gathersburg, MD), pp. 321-351.
Patterson, C. C., Ericson, J., Manea-Krichten, M., and Shirahata, H. (1991). Natural skeletal levels of lead in Homo sapiens sapiens uncontaminated by technological lead. Sci. Total Environ. 107, 205-236.
Pirkle, J. L., Schwartz, J., Landis, R., and Harlan, W. R. (1985). The relationship between blood lead levels and blood pressure and its cardiovascular risk implications. Am. J. Epidemiol. 121,246-258.
Podosek, F. A. (1970). Dating of meteorites by the high-temperature release of iodine-correlated 129Xe. Geochim. Cosmochim. Acta 34, 341-365.
Rabinowitz, M. B., Wetherill, G. W., and Kopple, J. D. (1973). Lead metabolism in the normal human: Stable isotope studies. Science 182, 725-727.
Rabinowitz, M. B., WetheriU, G. W., and Kopple, J. D. (1976). Kinetic analysis of lead metabolism in healthy humans. J. Clin. Invest. 58, 260-270.
Rabinowitz, M. B., Wetherill, G. W., and Kopple, J. D. (1977). Magnitude of lead intake from res- piration by normal man. J. Lab. Clin. Med. 90, 238-248.
Rosen, J. F., Chesney, R. W., Hamstra, A., DeLuca, H., and Mahaffey, K. (1980). Reduction in 1,25-dihydroxyvitamin D in children with increased lead absorption. N. Engl. J. Med. 302, 1128- 1131.
Rosen, J. F., and Pounds, J. G. (1989). Quantitative interactions between Pb 2+ and C a 2+ homeostasis in cultured osteoclastic bone cells. Toxicol. Appl. Pharmacol. 98, 530-543.
Rowland, R. E. (1966). Exchangeable bone calcium. Clin. Orthop. 49, 233-248. Schutz, A., Skerfving, S., Mattson, S., Christoffersson, J.-O., and Ahlgren, L. (1987). Lead in ver-
tebral bone biopsies from active and retired lead workers. Arch. Environ. Health 42, 340-346. Sharp, D. S., Becket, C. E., and Smith, A. H. (1987). Chronic low-level lead exposure: Its role in the
pathogenesis of hypertension. Med. Toxicol. 2, 210-232. Silbergeld, E., Schwartz, J., and Mahaffey, K. (1988). Lead and osteoporosis: Mobilization of lead
from bone in postmenopausal women. Environ. Res. 47, 7%94. Singh, P. K., Jones, M. M., Xu, Z., Gale, G. R., Smith, A. B., and Atkins, L. M. (1989). Mobilization
of lead by esters of meso-2,3-dimercaptosuccinic acid. J. Toxicol. Environ. Health 27, 423--434.

STABLE ISOTOPE LABELING OF LEAD COMPARTMENTS 207
Slavin, W., Carnrick, G. R., Manning, D. C., and Pruszkowska, E. (1983). Recent experience with the stabilized temperature platform furnace and Zeeman background correction. At. Spectrosc. 4, 69-86.
Smith, D. R., Niemeyer, S., Estes, J., and Flegal, A. R. (1990). Stable lead isotopes evidence an- thropogenic contamination in Alaskan sea otters. Environ. Sci. Technol. 24, 1517-1521.
Smith, D. R., Niemeyer, S., and Flegal, A. R. (1992), Lead sources to California sea otters: Industrial inputs circumvent natural lead biodepletion mechanisms. Environ. Res. 57, 163-174.
Sontag, W. (1986). Quantitative measurements of periosteal and cortical-endosteal bone formation and resorption in the midshaft of female rat femur. Bone 7, 55-62.
U.S. Environmental Protection Agency (U.S. EPA) (1986). "Air Quality Criteria for Lead," EPA/ 600/8-83/028dF. U.S. EPA Environmental Criteria and Assessment Office, Research Triangle Park, NC.
Vander, A. J., Taylor, D. L., Kalitis, K., Mouw, D. R., and Victery, W. (1977). Renal handling of lead in dogs: Clearance studies. Am. J. Physiol. 233, F532-F538.
Wittmers, L. E., Jr., Wallgren, A., Alich, A., Aufderheide, A. C., and Rapp, G., Jr. (1988). Lead in bone. IV. Distribution of lead in the human skeleton. Arch. Environ. Health 43, 381-391.


