Embed Size (px)
Citation preview

The Astronomy and Astrophysics Review manuscript No.(will be inserted by the editor)
Star formation sustained by gas accretion
Jorge Sanchez Almeida ·Bruce G. Elmegreen ·Casiana Munoz-Tunon ·Debra Meloy Elmegreen
May 14, 2014
Abstract Numerical simulations predict that metal-poor gas accretion from thecosmic web fuels the formation of disk galaxies. This paper discusses how cos-mic gas accretion controls star formation, and summarizes the physical propertiesexpected for the cosmic gas accreted by galaxies. The paper also collects obser-vational evidence for gas accretion sustaining star formation. It reviews evidenceinferred from neutral and ionized hydrogen, as well as from stars. A number ofproperties characterizing large samples of star-forming galaxies can be explainedby metal-poor gas accretion, in particular, the relationship between stellar mass,metallicity, and star formation rate (the so-called fundamental metallicity rela-tionship). They are put forward and analyzed. Theory predicts gas accretion to beparticularly important at high redshift, so indications based on distant objects arereviewed, including the global star formation history of the universe, and the gasaround galaxies as inferred from absorption features in the spectra of backgroundsources.
Keywords Galaxies: evolution · Galaxies: formation · Galaxies: general ·Galaxies: high-redshift · Galaxies: star formation · large-scale structure ofUniverse
J. Sanchez AlmeidaInstituto de Astrofısica de Canarias, E-38205 La Laguna, Tenerife, SpainDepartamento de Astrofısica, Universidad de La Laguna, Tenerife, SpainE-mail: [email protected]
B. G. ElmegreenIBM Research Division, T.J. Watson Research Center, Yorktown Heights, NY 10598, USAE-mail: [email protected]
C. Munoz-TunonInstituto de Astrofısica de Canarias, E-38205 La Laguna, Tenerife, SpainDepartamento de Astrofısica, Universidad de La Laguna, Tenerife, SpainE-mail: [email protected]
D. M. ElmegreenDepartment of Physics and Astronomy, Vassar College, Poughkeepsie, NY 12604, USAE-mail: [email protected]
arX
iv:1
405.
3178
v1 [
astr
o-ph
.GA
] 1
3 M
ay 2
014

2 J. Sanchez Almeida
Fig. 1 Zoom into a simulated halo at z = 2 with halo mass Mhalo ' 1012 M� (from Schayeet al. 2010). From left to right, the images are 10, 1 and 0.1 Mpc on a side. All slices are1 Mpc thick. The color coding shows the projected gas density in logarithmic scale, with theequivalence given in the inset. Densities are referred to the mean density of the universe at thetime.
1 Introduction
Numerical simulations predict that accretion of metal-poor gas from the cosmicweb fuels the formation of disk galaxies (e.g., Dekel & Birnboim 2006, Dekelet al. 2009, Silk & Mamon 2012, Genel et al. 2012b; see also Fig. 1). The gasoriginally resides outside the virial radius of the dark matter (DM) halo that hoststhe galaxy, and by accretion over cosmic time it becomes part of the pool of baryonsthat forms new stars. This cosmological gas supply has a strong dependence onredshift and halo mass. When the gas encounters a massive halo (> 1012M�), itbecomes shock heated and requires a long time to cool and settle into the galaxydisk. For less massive haloes, cool gas streams can reach the inner halo or diskdirectly. This so-called cold-flow accretion may have an extreme impact on thedisk, or it may provide a gentle gas supply that is transported radially in the disk.Since high redshift haloes tend to be low in mass, cold-flow accretion is predictedto be the main mode of galaxy growth in early times. Ultimately, the galaxiesevolve into a quasi-stationary state (Sect. 2.1), where inflows and outflows balancethe star formation rate (SFR), a phase that still goes on for most of them.
The importance of gas infall is as clear from numerical simulations as it is ob-scure to observations. This paper gives an overview of this rapidly evolving field,emphasizing the role of metal-poor gas accretion to sustain star formation in thelocal universe. We limit ourselves to the global picture, leaving aside details aboutstar formation processes (Krumholz et al. 2012; Gnedin et al. 2014), stellar andactive galactic nucleus (AGN) feedback (Silich et al. 2010; Hopkins et al. 2013a;Trujillo-Gomez et al. 2013), secular evolution (Binney 2013; Kormendy 2013),dense cluster environments (Santini 2011; Kravtsov & Borgani 2012), and thegrowth of black holes (BH) through cosmic gas accretion (Husemann et al. 2011;Chen et al. 2013). Other recent reviews covering cosmic gas accretion from differentperspectives are in Sancisi et al. (2008), Silk & Mamon (2012), Combes (2014), Fra-ternali (2014), Conselice et al. (2013) (observationally oriented), Shlosman (2013),Benson (2010) (theoretically oriented), and Madau & Dickinson (2014) (empha-sizing the high redshift aspects).

Star formation sustained by gas accretion 3
In addition to gas accretion, galaxies also grow through mergers (e.g, Guo et al.2011; Kormendy 2013). Simulations suggest that direct accretion from the cosmicweb dominates mergers by about an order of magnitude (e.g., Wang et al. 2011;L’Huillier et al. 2012; Combes 2013; van de Voort et al. 2011). For example, theAquarius project to study galaxy formation in Λ cold dark matter (ΛCDM) haloesshows inside-out growth, with major mergers contributing less than 20 % to thetotal mass growth (Wang et al. 2011). These simulations indicate that most ofthe baryons from which visible galaxies form are accreted diffusely, rather thanthrough mergers, and only relatively rare major mergers affect galaxy structure atlater times. L’Huillier et al. (2012) use a multi-zoom simulation to quantify massassembly and find that, on average, 77 % of growth is from smooth accretion,with 23 % from mergers. In dense regions, mergers play a more prominent role,although even there gas accretion still dominates the growth in the L’Huillier et al.simulations. Groups and clusters are the primary environments in which mergersare important. Since our review paper is focused on gas accretion driving starformation (SF), we do not consider dense environments but concentrate on theevolution of galaxies in relative isolation. For the same reason, we ignore satellitegalaxies where ram pressure stripping and starvation are important.
This paper is organized as follows: Sect. 2 summarizes the expected propertiesof the cosmic gas that fuels SF. Section 2.1 puts forward a simple analytical modelthat intuitively explains how gas accretion controls SF. Section 2.2 describes thephysical properties of accreting gas in numerical simulations, with outflows dis-cussed in Sec. 2.3 and disk growth in Sect. 2.5. Section 3 reviews the evidence forgas accretion inferred from neutral (Sect. 3.1) and ionized hydrogen (Sect. 3.2).Evidence from stellar properties is included in Sect. 4. A number of observationalproperties characterizing large samples of star-forming galaxies can be explainedif the SF is driven by metal-poor gas accretion. These properties are put forwardand discussed in Sect. 5, specifically, the stellar mass-metallicity-SFR relationship(Sect. 5.1), the stellar mass-metallicity-gas mass relationship (Sect. 5.2), and thestellar mass-metallicity-size relationship (Sect. 5.3). Theory predicts gas accretionto be particularly important at high redshift. Section 6 reviews observational ev-idence for accretion at high redshift, starting with the SF history of the universe(Sect. 6.1). In addition, it treats the (secondary) role of mergers (Sect. 6.2), theevidence for gas around galaxies as inferred from absorption features in the spectraof background sources (Sect. 6.3), and the imaging of web gas through its emis-sion (Sect. 6.4). Theory predicts that most of the gas going into stars in a typicalSF episode is not recycled gas from previous star formation, but it comes fromaccretion. Section 7 collects the few measurements of the fraction of SF producedby gas accretion available so far. The review concludes by summarizing the role ofgas accretion in star formation, and indicating several open issues to be exploredin the future (Sect. 8). The acronyms and main symbols used along the text arelisted in Table 1.
2 Cosmological accretion: basics
During the expansion of the Universe, cosmological gas that falls into the potentialwell of a DM concentration eventually shocks when it meets other gas and stopsor deflects in its path (Rees & Ostriker 1977; White & Rees 1978; Binney 1977;
4 J. Sanchez Almeida
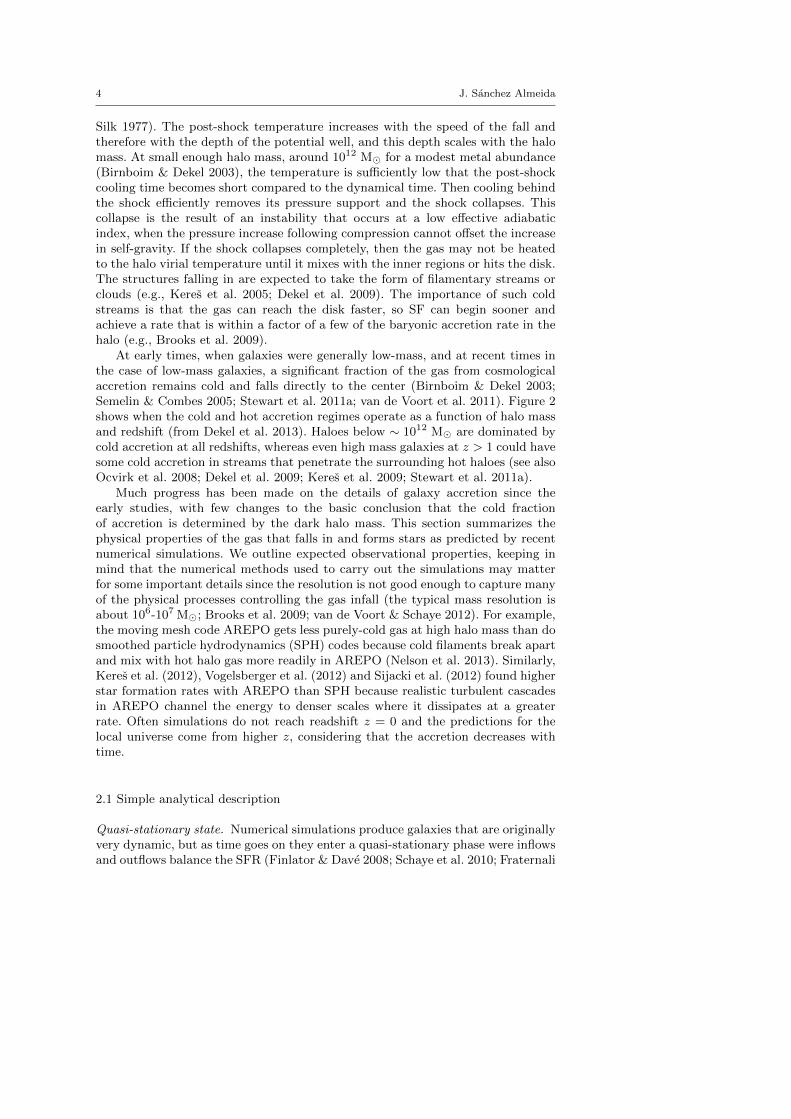
Silk 1977). The post-shock temperature increases with the speed of the fall andtherefore with the depth of the potential well, and this depth scales with the halomass. At small enough halo mass, around 1012 M� for a modest metal abundance(Birnboim & Dekel 2003), the temperature is sufficiently low that the post-shockcooling time becomes short compared to the dynamical time. Then cooling behindthe shock efficiently removes its pressure support and the shock collapses. Thiscollapse is the result of an instability that occurs at a low effective adiabaticindex, when the pressure increase following compression cannot offset the increasein self-gravity. If the shock collapses completely, then the gas may not be heatedto the halo virial temperature until it mixes with the inner regions or hits the disk.The structures falling in are expected to take the form of filamentary streams orclouds (e.g., Keres et al. 2005; Dekel et al. 2009). The importance of such coldstreams is that the gas can reach the disk faster, so SF can begin sooner andachieve a rate that is within a factor of a few of the baryonic accretion rate in thehalo (e.g., Brooks et al. 2009).
At early times, when galaxies were generally low-mass, and at recent times inthe case of low-mass galaxies, a significant fraction of the gas from cosmologicalaccretion remains cold and falls directly to the center (Birnboim & Dekel 2003;Semelin & Combes 2005; Stewart et al. 2011a; van de Voort et al. 2011). Figure 2shows when the cold and hot accretion regimes operate as a function of halo massand redshift (from Dekel et al. 2013). Haloes below ∼ 1012 M� are dominated bycold accretion at all redshifts, whereas even high mass galaxies at z > 1 could havesome cold accretion in streams that penetrate the surrounding hot haloes (see alsoOcvirk et al. 2008; Dekel et al. 2009; Keres et al. 2009; Stewart et al. 2011a).
Much progress has been made on the details of galaxy accretion since theearly studies, with few changes to the basic conclusion that the cold fractionof accretion is determined by the dark halo mass. This section summarizes thephysical properties of the gas that falls in and forms stars as predicted by recentnumerical simulations. We outline expected observational properties, keeping inmind that the numerical methods used to carry out the simulations may matterfor some important details since the resolution is not good enough to capture manyof the physical processes controlling the gas infall (the typical mass resolution isabout 106-107 M�; Brooks et al. 2009; van de Voort & Schaye 2012). For example,the moving mesh code AREPO gets less purely-cold gas at high halo mass than dosmoothed particle hydrodynamics (SPH) codes because cold filaments break apartand mix with hot halo gas more readily in AREPO (Nelson et al. 2013). Similarly,Keres et al. (2012), Vogelsberger et al. (2012) and Sijacki et al. (2012) found higherstar formation rates with AREPO than SPH because realistic turbulent cascadesin AREPO channel the energy to denser scales where it dissipates at a greaterrate. Often simulations do not reach readshift z = 0 and the predictions for thelocal universe come from higher z, considering that the accretion decreases withtime.
2.1 Simple analytical description
Quasi-stationary state. Numerical simulations produce galaxies that are originallyvery dynamic, but as time goes on they enter a quasi-stationary phase were inflowsand outflows balance the SFR (Finlator & Dave 2008; Schaye et al. 2010; Fraternali

Star formation sustained by gas accretion 5
Fig. 2 Predicted penetration of cold gas streams into the halo centre as a function of halomass and redshift. The nearly horizontal curve is the threshold mass below which the flowsare predominantly cold and above which a shock-heated medium is present. The inclined solidcurve is the upper limit for cold streams in a hot medium to be present. Above this line the gasis all shock heated shutting off the gas supply for star formation. This schematic is based onanalytic spherically-symmetric calculations by Dekel & Birnboim (2006) and has been takenfrom Dekel et al. (2013). The slanted dashed line is the critical mass in the Press-Schechterformalism, above which structures form.
& Tomassetti 2012; Dave et al. 2012; Dekel et al. 2013; Bothwell et al. 2013;Feldmann 2013; Altay et al. 2013; Forbes et al. 2014). Such equilibrium followsnaturally from the gas consumption timescale τg being shorter than the otherrelevant timescales in the problem. For example, in the local universe τg is on theorder of 1-2 Gyr whereas the timescale for gas inflow from the web is some 7-8 Gyr(e.g., Lilly et al. 2013). Under this condition the gas inflow rate determines boththe SFR and the mass of gas in the galaxy (Lilly et al. 2013). The latter is justthe gas mass needed to maintain the SFR given the gas consumption time-scale.These conclusions follow from mass conservation, and can be summarized in a fewanalytical expressions which provide insight to understand the underlying physics.
Using equations from chemical evolution models (e.g., Edmunds 1990), thevariation with time t of the gas mass available to form stars Mg is given by,
dMg
dt≡ Mg = −(1−R) SFR + Min − Mout, (1)
which considers the formation of stars (1st term on the right-hand side of the equa-tion), the gas inflow rate Min(t), and the gas outflow rate Mout(t). The symbol Rin Eq. (1) stands for the fraction of the stellar mass that returns to the interstel-lar medium (ISM) rather than being locked into stars and stellar remnants. Forsimplicity, the SFR produced by a given mass of gas is parameterized in terms ofthe star formation efficiency ε, or its inverse the gas consumption time-scale τg,
SFR = εMg =Mg
τg. (2)

6 J. Sanchez Almeida
The outflow rate is reasonably assumed to scale with the SFR,
Mout(t) = w SFR(t), (3)
with w the so-called mass-loading factor. Provided that all scaling factors R,wand τg are constant, the general solution of Eq. (1) is
SFR(t) = SFR(0) e−t/τin +
∫ t
0
Min(t′) e−(t−t′)/τin dt′/τg, (4)
τin = τg /(1−R+ w).
Under the current assumption that τg is much shorter than the other relevanttimescales, t � τin, and the source term Min(t′) only contributes to the integralin Eq. (4) when t′ ∼ t. When this stationary-state is reached, Eq. (4) becomes
SFR(t) ' (1−R+ w)−1 Min(t), (5)
showing that the SFR is set by the gas infall rate (corrected for returned fractionR and outflows w). In addition, the mass of gas is also set by the infall rate to bethe amount needed to maintain the SFR forced by the infall rate,
Mg(t) ' τg SFR(t) ' τg1−R+ w
Min(t). (6)
Equations (5) and (6) tell us that galaxies self-regulate to maintain the gas neededto produce a SFR set by the balance between inflows and outflows. We notethat Eq. (2), and so Eq. (6), is a version of the Kennicutt-Schmidt (KS) rela-tion (Schmidt 1959; Kennicutt 1998) stating that the SFR scales as a power ofthe gas mass, with power index close to one. The details of this relation are not asimportant on the scale of a whole galaxy as they are for kpc-scales, where obser-vations still have some uncertainties (see the review in Kennicutt & Evans 2012).Observations suggest that τg goes from 0.5 to 2 Gyr for galaxies in the redshiftrange between 2 and 0 (e.g., Genzel et al. 2010; Gnedin et al. 2014). Theory sug-gests that τg scales with the instantaneous Hubble time tH as τg ' 0.17 tH (Dekelet al. 2013).
In this stationary-state, a significant part of the SF relies on accreted gasbecause the gas in the disk that has been returned from previous stars (the returnedfraction R) is not massive enough to maintain the level of SF very long. Thefraction of SF that comes from gas that has never been processed by stars in thegalaxy can be determined by dividing the gas into one component of this type,Mgf , and another component that has been inside a star, Mgp,
Mg = Mgf + Mgp, (7)
where the subscripts f and p refer to fresh and processed gas, respectively. Thefresh gas follows an equation identical to Eq. (1) but without the returned fractionR, since the gas returned by stars is not fresh gas,
Mgf = Min −Mgf/τg − wMgf/τg . (8)
This equation states that all of the cosmic accretion adds to the fresh gas reservoir,which is depleted by star formation (both the locked-up mass and the returned

Star formation sustained by gas accretion 7
mass) and by winds that are proportional to the SFR. We have assumed thatwinds carry away fresh gas in proportion to its mass, because the fresh and pro-cessed components should mix before significant star formation begins in them,and then both get dragged out by mass loading in the wind. These are reasonableassumptions since the time during which the gas is able to mix before star for-mation occurs in it, on average, is the consumption time, τg, and this is generallymuch longer than the turbulent crossing time in the ISM. There could be somesituations, however, where fresh gas is not well mixed with processed gas before itgets into a star, and then the young star metallicity in those regions could be lessthan the average in the ISM. The evolution of Mgp is given by,
Mgp = R Mg/τg −Mgp/τg − wMgp/τg, (9)
showing that the only source of processed gas is the mass that has been returnedfrom star formation, while the loss of Mgp is from star formation and winds, asfor the fresh gas loss. Since Eq. (8) is formally identical to Eq. (1), it admits asolution like Eq. (5) with R = 0. Then the ratio between the SFR in fresh gas,SFRgf , and the total SFR is given by,
SFRgf
SFR' 1−R+ w
1 + w. (10)
The ratio decreases with increasing returned fraction and with decreasing outflows,but it is never small. Even for large returned fractions R = 0.5 (e.g., Edmunds2005; Leitner & Kravtsov 2011; Torrey et al. 2012) and moderate outflows w = 0.2(e.g., Zahid et al. 2012, ; see also Sect. 2.3), SFRgf/SFR is as large as 58 %. Ifw � 1 then Eq. (10) yields SFRgf ' SFR, which implies that when outflows arevery important most of the SF during a gas consumption time is due to gas fallenin over that time.
The mass in metals can be expressed using a differential equation similar toEq. (1) (e.g., Edmunds 1990). It can be formally solved as indicated above, andthe stationary-state solution gives a metallicity,
Z ' Zi + y (1−R)/(1−R+ w). (11)
The symbol y stands for the stellar yield, i.e., the mass of new metals eventuallyejected per unit mass locked into stars. Zi represents the metallicity of the infallgas, which is usually much smaller than the metallicity of the disk gas. In thiscase Eq. (11) points out that the gas metallicity is independent of mass inflowrate, SFR or mass of gas. Z just depends on stellar physics (R and y) and on theoutflows through the mass loading factor w. This holds true even when Min, SFRand the stellar mass M? vary with time, provided they do it with a timescale longerthan τg. Equation (11) implies that in a stationary state, the rate at which metalmass in the ISM is locked up into stars equals the rate at which new metal mass isejected into the ISM by stars. This is how the metal mass fraction in the ISM canstay constant in the stationary state. The ISM does not necessarily have such anequilibrium because the disk gas mass and star formation rate fluctuate in timeas a result of accretion fluctuations. Z in Eq. (11) depends on the mass loadingfactor w to compensate for the metal lost in outflows – increasing w is equivalentto decreasing the effectiveness of SF to produce metals. It is as if y were smallerwhich forces the equilibrium metallicity to be smaller as well. These results wereoriginally found by Larson (1972) in the context of the G dwarf problem discussedin Sect. 4.

8 J. Sanchez Almeida
Deviations from the stationary state. The stationary state described above repre-sents a useful idealization that has to be abandoned when the infall rate changesin a short time scale. This is expected to happen quite often in view of the clumpyand stochastic nature of the infall accretion (Sect. 2.2). Thus deviations from thestationary state are needed to understand the observed relationship between stellarmass, metallicity and SFR treated in Sect. 5.1. In addition, a young universe couldhave a relatively long gas consumption time, and then the SFR cannot keep upwith the accretion rate. Observations of this imbalance were suggested by Reddyet al. (2012) who found at z > 2 an accretion rate from the KS relation that is 2to 3 times larger than the SFR during galaxy build-up.
Average mass infall rate. Cosmological accretion drives star formation. It is pri-marily dark matter accretion carrying along baryons – intermittent but with amarked global trend. The average mass accretion rate into haloes of mass Mhalo
at redshift z may be approximated by a formula in Dekel et al. (2013; see alsoLilly et al. 2013 and Dave et al. 2012),
dMhalo
dt≈ 30 Mhalo,12
1.14(1 + z)2.5 M� yr−1, (12)
where Mhalo,12 = Mhalo/1012 M�. Approximating M1.14 by M, and integratingequation (12) over time for an Einstein-deSitter Universe (which relates time andredshift), the mass and accretion rate become (Dekel et al. 2013)
Mhalo,12 ≈ Mhalo,12,0 e−0.79(z−z0) , (13)
dMhalo
dt≈ 30 Mhalo,12,0 e
−0.79(z−z0)(1 + z)2.5. (14)
The fiducial mass Mhalo,12,0 corresponds to the mass at z = z0, which would betoday’s mass if z0 = 0. The baryonic accretion rate is approximately the darkmatter accretion rate multiplied by the cosmological baryonic mass fraction, fb.The gas accretion rate depends on the faction of these baryons that get to thestar-forming part in the center of the halo, fgal, so that,
Min = fb fgaldMhalo
dt. (15)
For the Milky Way (MW) today with Mhalo,12 = 1, z = 0, fb = 0.16, and fgal ∼ 1(e.g., Peng & Maiolino 2014), Eqs. (12) and (15) render an infall rate Min ∼5 M�yr−1.
2.2 Expected properties of accreted gas
Generally speaking, gas accretion from the cosmic web occurs in two modes, hotand cold, both taking place simultaneously in all galaxies and over cosmic time.However, the mass of the DM halo determines which one is favored, so that the lessmassive galaxies prefer the cold-flow mode (Fig. 2). The hot mode is produced bythe gas being shock heated when entering the DM halo. It reaches a temperatureT > 105K and a density between a hundred and a thousand times the mean densityof the universe (Birnboim & Dekel 2003; Keres et al. 2005). Gas at this temperature

Star formation sustained by gas accretion 9
and density exhibits a cooling time of several Gyr (e.g., Dekel & Birnboim 2006;Wiersma et al. 2009), which is long enough for the gas to be spread over the haloby the time it settles down onto the galaxy disk. The high temperature gas istoo tenuous to be observed in X-ray, and is fully ionized. Cold-flow gas, however,rapidly ends up in the center of the potential well in a free-fall timescale, whereit meets, strikes and heats the galaxy. Depending on the flux and clumpiness ofthe gas stream, it may destroy a pre-existing disk and create a new one, or justcontribute to the growth of the disk (e.g., Dekel et al. 2009). The cold-flows arepartly ionized with 104 ≤ T ≤ 105 K. The sources of ionization are mainly thermalcollisions with electrons, and photoionization due to individual galaxies and theUV background (e.g., Fumagalli et al. 2011b).
A summary of numerical model predictions is shown in Fig. 3 (from van deVoort & Schaye 2012). It describes the physical conditions of the gas being accretedby MW-size haloes (1011.5 < Mhalo < 1012.5 M�) at z= 0. The cold gas is definedto be the component that never reaches a temperature above 105.5 K (Fig. 3; topright panel). This cold component comes directly from the intergalactic medium(IGM) and is more metal poor than the hot component (Fig. 3; middle right panel)which is enriched by galactic outflows. The gas falls in pulled by gravity so that thecharacteristic velocities are similar to the Keplerian velocities in the outer parts ofdisks. The typical inflow velocity for the cold-flow goes from 50 to 100 km s−1 atz = 0 although it increases with redshift for the same halo mass (see the bottom-left panel of Fig. 3). The hot component has essentially no infall speed exceptnear the outer parts. Distances to the center of the potential are normalized tothe virial radius Rvir defined as the radius than contains a density greater than∼170 times the mean density of the universe. Rvir is typically very large comparedto the optical half-light radius of the resulting galaxies (∼ 70 times accordingto Kravtsov 2013). Note that the average densities of both the hot and coldcomponents are similar to within a factor of ∼5 and that both increase towardsthe center. Still, the accretion rate is dominated by the cold component (lowermiddle panel) because it has the greater infall speed. The temperature of the hotcomponent stays high until it finally reaches the disk, at which point it drops downto the temperature of the cold component.
The dimensions of the cold streams determine how the gas interacts with thegalaxy at the center of the gravitational well, whether it is focused onto a smallportion of the galaxy or affects the galaxy disk as a whole. Numerical simulationspredict the comic gas streams to be very broad – larger than the virial radius of adwarf galaxy. They are 0.1 Mpc across at z = 2 in the MW-like galaxy simulationsby Schaye et al. (2010), and the width increases with time, so that they are evenbroader in the nearby universe. However, these broad streams develop small-scalestructure (called substreams), which is poorly captured at the resolution of thepresent simulations. These substreams may eventually be small enough to becomedisk-galaxy size or smaller, and so they may identifiable through inhomogeneitiesproduced in the disks (e.g., Ceverino et al. 2010).
The infall rates in the center of the potential well decrease with time, from afew tens of M� yr−1 at z = 2 to a few M� yr−1 at z = 0 (e.g., Keres et al. 2005van de Voort & Schaye 2012, and also Eqs. [14] and [15]). These accretion ratesare characteristic of MW haloes; higher masses have larger infall rates and a muchsteeper decrease with time. The accretion rate is bursty since the cold-flow gasfalling in is clumpy rather than smooth (e.g., Fig. 1 in Brooks et al. 2009). As

10 J. Sanchez Almeida
Fig. 3 Properties of gas at z = 0 in MW-type haloes. The physical parameters are presentedas a function of the distance to the halo center for all the gas (black), for hot gas (red),and for cold gas (blue). Properties at z = 2 have been included for comparison (see theinset in the top left panel). Shaded regions correspond to ±1σ scatter around the median.From the top-left to the bottom-right, the different panels show the mass-weighted median gasoverdensity, temperature, maximum past temperature, pressure, entropy, metallicity, radialpeculiar velocity, mean accretion rate and mean mass fraction of hot-mode gas, respectively.The radial profiles at z = 2 follow the same trends as at z = 0, although at z = 2 the pressure,the infall velocity and the accretion rates are higher, the entropy is lower, and the hot modeaccounts for a smaller fraction of the halo mass. The distances are normalized to the virialradius Rvir, and the density ρ to the mean density of the universe 〈ρ〉. Taken from van deVoort & Schaye (2012).
we addressed in more detail in Sect. 2.1, galaxies tend to be in a slowly evolvingequilibrium state, with the predicted infall rates comparable to the SFRs. At everyradius accretion is balanced by SF, winds and radial transport of gas through thedisk (Forbes et al. 2014).
The mass in baryons in galaxy haloes can be several times larger than thestellar mass of the galaxy. In massive haloes, most of halo gas is in the hot phase(Fig. 3, bottom right panel), ionized at high temperatures. The cold gas is notuniformly distributed but covers only a small halo volume (< 10 %, Fumagalliet al. 2011b). On average, the majority of stars present in any mass halo at anyz were formed from the gas accreted in the cold mode, although the hot modecontributes typically over 10 % for Mhalo ≥ 1011 M� (van de Voort et al. 2011).At redshift zero the fraction of stellar disk mass formed from shock-heated gas isbetween 5 % and 15 % when Mhalo goes from 1011 M� to 1012 M� (Brooks et al.2009).

Star formation sustained by gas accretion 11
2.3 The importance of galactic winds
Mass outflows, also known as galactic winds, have important effects on the evo-lution of galaxies, their haloes and the IGM. Together with mass accretion, theyregulate the SFR of the galaxies, so that the larger the winds the smaller the gasavailable to form stars and, therefore, the smaller the SFR. Winds also transportthe metals produced by stars out of the galaxy disks, and so reduce the galaxymetallicity and pollute the circum-galactic medium (CGM) and the IGM. All ofthese features are present in the numerical simulations, but the underlying causecan be appreciated using the analytic model worked out in Sect. 2.1, where thestrength of the wind is parameterized in terms of the mass loading factor w. At agiven accretion rate, when w increases, the SFR decreases (Eq. [5]), the mass ofgas decreases (Eq. [6]), and the metallicity decreases (Eq. [11]).
Winds explain several central properties of galaxies. Without winds, therewould be too many metals in the disks given the nucleosynthetic yield and theobserved gas-to-star mass ratio (Sect. 5.1). Moreover, galaxies of different massestend to have different metallicities, therefore, if Eq. (11) has to describe this prop-erty, the mass loading factor w must vary with the stellar mass. Such dependence isto be expected, since galaxies of lower mass have shallower gravitational potentialsand so they lose gas more easily (see Sect. 5). Winds also affect the metallicityof the IGM, whose expected properties are put forward in Sect. 2.4 and whoseobservational properties are described in Sect. 3.2. Evidence for metal enrichmentof the CGM is analyzed in Sect. 3.1.
The impact of winds on metallicity is so important because w can be large,far in excess of unity. If w � 1, then most of the accreted gas is not used to formstars but dragged along with the mass ejected in galactic winds (SFR� Min whenw � 1 in Eq. [5]). In order to reproduce the observed mass-metallicity relationship,Dave et al. (2012) and Peeples & Shankar (2011) need w to change from 1 to 6when M? varies from 1011 to 109 M�. The same range is also found in numericalsimulations (w goes from 1 to 10 for M? between 2 · 1011 and 109 M�; Shen et al.2012). Thus low mass galaxies are extremely wasteful using the cosmological gas,most of which returns to the IGM without being processed through the stellarmachinery. In addition, the nature of the wind of low and high mass galaxies maynot be the same. The HI mass function of galaxy haloes depends on the windmodel; it was matched in a simulation by Dave et al. (2013) using momentum-driven outflows for large galaxies and energy driven outflows for small galaxies.Low velocity winds from dwarf galaxies can reach the intergalactic medium, whileeven high velocity winds from massive galaxies may not as a result of the higherhalo density that blocks them (Oppenheimer et al. 2012).
Winds do not seem to prevent cold accretion. Faucher-Giguere et al. (2011)showed from simulations that a factor of 2 increase in the mass loading factoror a factor of 2 increase in the wind speed affect most sensitively the accretionrate at the virial radius without much effect on the cold gas accretion rate to thecenter. When both the loading factor and speed increased by this factor, the coldaccretion rate did decrease for low halo masses. Powell et al. (2011) also foundthat galactic winds do not strongly affect the cold gas accretion rate.
The cycle of metals ejected by winds is complex, often involving re-accretion.Shen et al. (2012) model a galaxy at z = 3 with a 2.4 · 1011M� halo and a2.1 · 1010M� stellar disk (like the present day MW disk), and include in the model

12 J. Sanchez Almeida
satellites and nearby dwarfs. They find that 60 % of the accreted metals within3 Rvir of the galaxy come from SNe in the host itself, 28 % come from satelliteprogenitors, and 12 % from nearby dwarfs. Most metals beyond 2 Rvir are releasedvery early, at z from 5 to 8. An early release of highly ionized metals was found byFord et al. (2013) also. Low ionization metals like MgII tend to re-accrete within2 Gyr, while high ionization metals take much longer.
Strong winds appear to be important for metallicity gradients in disks. Fuet al. (2013) model analytically disk evolution with accretion, winds, and star for-mation, assuming a radial accretion in the disk plane with a velocity proportionalto radius. They find that the largest influence on the metallicity gradient is there-accreted and enriched halo gas, rather than metals mixed with the disk gas. Tomatch observations of weak metallicity gradients in galaxies with stellar massesof ∼ 1010 M�, they need 80 % of the metals produced by SNe to go into the halowhere they can return to the disk, mostly in the outer parts. Bresolin et al. (2012)also suggest that metal-enriched outflows and re-accretion to the disk might ex-plain their observation of metallicities in outer disks of two galaxies that are toolarge for the low rates of star formation there.
SNe affect accretion in another way, by providing ejecta of cool gas into thelower regions of the halo onto which the hot halo gas above it can condense.Marinacci et al. (2010) show in simulations that gas in a galactic fountain (Melioliet al. 2008) mixes with hot halo gas, and if the pressure and metallicity of the haloare high enough, the mixture cools to become HI. The total amount of capturedhalo gas can be about 20 % of the fountain gas for each event. Marasco & Fraternali(2011) and Marasco et al. (2012) model the fountain and resulting halo accretionin detail, reproducing the intermediate velocity HI clouds above the MW andobtaining an accretion rate comparable to the star formation rate of ∼ 2 M� yr−1.This may solve the problem posed by the low inflow rate in MW HVCs discussed inSect. 3.1. Marasco et al. (2012) suggest that the fountain ejection speed is around70 km s−1. Absorption lines from the warm (e.g., SiIV) component of the MW,and from about half of the hot (OVI) component are also reproduced by this model(Marasco et al. 2013), with these lines coming from fountain-mixed halo gas withina few kpc of the disk. Hobbs et al. (2013) simulate the formation of cold clumpsin fountain filaments.
2.4 Expected observational properties
Metallicity. One of the fingerprints of the cosmic web gas is its low metallicity(between 10−2 and 10−3 Z� at low redshift; see Fig. 3, central row, right panel),with a very large scatter indicating that the metals are not uniformly spread(Fumagalli et al. 2011b). Actually the question arises as to why metallicity is notzero if the gas is of cosmological origin. The answer is, partly, a small contaminationfrom the first population III stars. They provide a floor of about 10−4 Z�, abovewhich these very massive stars are no longer produced (e.g., Bromm & Larson2004), but the threshold may be even lower if the metals generated by these starsdo not reach the IGM (Muratov et al. 2013). However, the bulk of the metals isdue to outflows from galaxies that come along with the gas streams (Shen et al.2012; Brook et al. 2013). Accordingly, the metallicity of the web increases with

Star formation sustained by gas accretion 13
decreasing redshift, reaching the level of 10−2 Z� at z = 0 (see Fig. 3, and alsoOppenheimer et al. 2012).
Gas inflow. Inflow is the other distinct feature of accretion. Unfortunately, ob-servations do not easily distinguish inflows, outflows or other proper motions ofthe gas around galaxies. Doppler shifts alone do not suffice since an inflow in theforeground and an outflow in the background produce the same Doppler shift. Ad-ditional physical constraints must be invoked. For example, the gas expelled fromthe galaxy tends to escape in the direction perpendicular to the galaxy plane,therefore, motions in the plane of the galaxy favor the inflow interpretation (e.g.,Bouche et al. 2013; Combes 2014). As we discuss above, cosmic web inflows areexpected to be metal-poor so metal-rich moving gas is commonly interpreted asoutflow rather than inflow (Lehner et al. 2013; Bregman et al. 2013). A third pos-sibility is using the relative velocity as a discriminant. The inflows cannot acquirea velocity largely exceeding the Keplerian velocities (Sect. 2.2) and therefore largevelocities must be associated with outflows. The only direct way of assessing ac-cretion, however, is by observing the gas in absorption in the starlight spectrumemitted by the galaxy (e.g., Lebouteiller et al. 2013) – since the gas is in betweengalaxy and observer, redshift implies infall.
Lyα forest. One of the most consistent predictions of numerical simulations hasbeen the Lyα forest of low column density absorption lines to quasi stellar ob-jects (QSO) produced by the cosmic web (Bi et al. 1992; Hernquist et al. 1996;Schaye 2001). Simulations reproduce the distribution of column densities, equiva-lent widths and power spectra (for recent work, see Borde et al. 2014). Fumagalliet al. (2011b) work out the HI column density expected from the web consideringthe ionization balance to be controlled by thermal collisions with electrons, byphotoionization due to individual sources and the UV background, and by dustshielding from ionizing photons. They predict column densities of neutral hydro-gen NHI between 1017 and 1021 cm−2 (Fig. 4). The expected properties coincidewith those observed in Lyman limit systems (LLS; NHI > 1017 cm−2) and dampedLyman-α absorbers (DLA; NHI > 1020 cm−2), including inflows of 100 km s−1 andmetallicities between 10−2.5 and 10−1 Z� for z between 5 and 0 (e.g., Tornatoreet al. 2010; Rafelski et al. 2014). The closer to the center of the gravitational poten-tial the denser the gas, and the lower the redshift the more diffuse. In simulationsalso including radiative transfer, van de Voort & Schaye (2012) and van de Voortet al. (2012) find that at z = 2-3, most HI absorbers above 1017 cm−2 reside inhaloes, those above 1021 cm−2 are in disks, and cold flow accretion should appearas an infalling component with low metallicity. Fumagalli et al. (2011b) suggestthat cold streams from galaxies in the mass range 1010 − 1012 M� account formore than 30 % of the Lyα absorption in QSO spectra (see also Faucher-Giguere& Keres 2011).
Imaging the gas streams. Cold-flow streams contain partly ionized gas undergo-ing continuous recombination and should produce an HI emission line spectrum.Goerdt et al. (2010) work out the Lyα flux to be expected from the cold streamsthat fed galaxies at high redshift. UV background excitation, collisions with freeelectrons, and dust attenuation are included. They find that the emission is mainlydriven by collisions since the filaments are thick enough to be shielded from the

14 J. Sanchez Almeida
Fig. 4 HI column densities in the cosmic web for a number of model galaxies in cosmologicalsimulations as worked out by Fumagalli et al. (2011b). Color codes four intervals of columndensity including LLSs (in blue) to DLAs (in red). Redshift is decreasing from top to bottom,and virial mass is increasing from left to right. The dotted circles mark the virial radius. Thecold streams are very patchy, with pockets of neutral gas immersed in an ionized medium.

Star formation sustained by gas accretion 15
background. The peak surface brightness is 2 · 10−17 erg cm−2 s−1 arcsec−2 forMW-like haloes at z = 2.5. Assuming that this flux is observed through a narrowbandpass of 50 A, it corresponds to 25.5 AB mag per square arcsec. The structureshave sizes from 50 to 100 kpc, luminosities between 1043 and 1044 erg s−1, and areidentified by some authors as the observed Lyα blobs (LABs; Steidel et al. 2000;Fardal et al. 2001; Ouchi et al. 2009; Latif et al. 2011, see Sect. 6.4). Simulationsby Rosdahl & Blaizot (2012) also suggest that cold stream accretion can accountfor the Lyα emission. The cosmic web gas also emits through fluorescence of Lyαphotons produced by nearby sources (Cantalupo et al. 2012). This fluorescencehas been recently observed as we discuss in Sect. 6.4.
2.5 Accretion and disk growth
Accretion tends to favor the outer parts of galaxies with both stars from minormergers (Font et al. 2011; Lackner et al. 2012) and gas from cold streams (Roskaret al. 2010; Moran et al. 2012). Surveys of extended UV disks around both earlyand late type galaxies actually suggest on-going gas accretion and star formationin the outer parts (Lemonias et al. 2011; Moffett et al. 2012). These ideas areconsistent with cosmological numerical simulations, where disk galaxies acquiretheir spin together with their mass through cold gas accretion.
Pichon et al. (2011) carry out simulations where the disk angular momentumcomes from filaments and increases over time, building up disks from the insideout. Codis et al. (2012), Laigle et al. (2013), and Dubois et al. (2014) show fromcosmological simulations that low mass galaxies, which tend to be disklike, spin ina direction that is aligned to their accretion filaments, but high-mass spheroidalgalaxies spin perpendicular to their filaments. The difference arises because thedisks accrete gas directly from their filament and inherit its angular momentum,while the spheroids grow from the mixture of other galaxies coming in along thefilament (i.e, grow from mergers). Stewart et al. (2011b) found that cold streamsin haloes contain higher angular momentum than dark matter. The reason forthis is that the total angular momentum of the dark matter adds positive andnegative contributions from the mixing of many sub-haloes, with a net value thatis small. In contrast, gas cannot pass through itself but dissipates relative motionsand coheres into a smooth flow with the net angular momentum appearing as asystematic rotation.
So far no numerical simulation details the interaction between a cold-flowstream and a galaxy disk in the local universe. Ceverino et al. (2012) model thekind of clumpy disks observed at high redshift (Elmegreen et al. 2005, 2007b; Gen-zel et al. 2011). The advent of the gas stream changes the morphology of the diskso that it becomes more lopsided. Stars are formed immediately after gas arrivalat high rate (∼ 102 M� yr−1), but the metallicity of the resulting HII regions isnot well modeled because part of the gas forming stars was in the disk already,and also because these simulations assume an instantaneous recycling of the SNejecta. The size of the ensuing star-forming regions has to do with the gas accretionrate and the turbulence, rather than with the cross section of the gas stream thatinduces the process. The turbulence in numerical disks may (Genel et al. 2012a)or may not (Hopkins et al. 2013b) be maintained by cold-flow accretion events.Turbulence enhances mixing processes on the scale of the disk thickness, so the

16 J. Sanchez Almeida
mixing timescale for the ISM in a small radial annulus of a disk galaxy is expectedto be short – of the order of a rotational period or shorter (Tenorio-Tagle 1996;de Avillez & Mac Low 2002; Edmunds 2005; Yang & Krumholz 2012).
3 Accretion inferred from gas observations
3.1 Neutral gas observations
Pools of neutral gas. The presence of pools of neutral gas around almost all galax-ies is well known from the early days of radio astronomy (e.g., Muller & Oort 1951;Haynes et al. 1984; Dickey & Lockman 1990). The improvement in sensitivity andthe diversification of observational techniques have reinforced the original view.Roughly speaking, the HI mass scales with the SFR of the galaxies (KS law; seeSect. 2.1) and since the SFR varies systematically with the Hubble type and withM?, gas rich systems tend to have late morphological types and low stellar masses.The gas-to-star mass ratio Mg/M? varies from 0.01 to 10 when log(M?/M�) goesfrom 11.5 to 8, with the same range of variation from red early type galaxies toblue late types (Kannappan 2004; Pilyugin et al. 2004; Dave et al. 2013). Thescatter of the relationships with stellar mass and Hubble type is significant, sothat neither the mass nor the Hubble type fully determine the gas fraction of agalaxy (Kannappan 2004; Kannappan et al. 2013; Wang et al. 2011).
Sancisi et al. (2008) summarize radio observations of HI cloud complexes, tailsand filaments in and around local galaxies, suggesting ongoing minor mergers andrecent arrival of external gas. The HI image of the dwarf galaxy IZw18 in Fig. 5is particularly illustrative (from Lelli et al. 2012a). It shows large amounts of HIgas around the galaxy (Mg/M? ∼ 5) with a plume of different velocity directedtowards the galaxy where a large starburst goes on at present (Fig. 5, left panels).Although not as spectacular as in IZw18, elongated extra-planar features are quitecommon in disk galaxies (e.g., NGC925, Pisano et al. 1998, and the many otherexamples given in the review by Sancisi et al. 2008). Extra-planar gas is also foundin our own galaxy, where the existence of gas clouds falling in is long known (Oort1966; Blitz et al. 1999; van Woerden et al. 2004; Wakker et al. 2007, 2008). Someof these high velocity clouds (HVC) are part of the so-called galactic fountain,where SN ejecta return to the galaxy plane after cooling down (e.g., Tenorio-Tagle 1996; Spitoni et al. 2008). However, HVCs with low metallicities are likelyof extragalactic origin (e.g., Hernandez et al. 2013). The existence of HVCs agreequalitatively with theoretical expectations, however, they pose an observationalproblem common to many other galaxies. Their mass infall rate is estimated to be∼ 0.1-0.2 M� yr−1 which is one order of magnitude too small to maintain the MWSFR of ∼ 1-2 M� yr−1 (Sancisi et al. 2008; Fraternali 2014), and thus inconsistentwith the MW being in a stationary state sustained by HVCs (Sect. 2.1). Thisimbalance between observed SFR and observed gas accretion rate is common butnot universal (counter examples are given by, e.g., Bouche et al. 2013; Schmidtet al. 2014). Moreover, Richter (2012) has mapped HVCs in local galaxies. HisHI observations and models indicate that the gas accretion rate density of z ∼ 0galaxies is 0.022 M� yr−1 Mpc−3, which is comparable to the local universe SFRdensity (Sect. 6 and Fig. 11). He notes that most local accretion may be warmrather than cool gas, although cool infalling HVCs undoubtedly are important

Star formation sustained by gas accretion 17
Fig. 5 Figure from Lelli et al. (2012a) corresponding to IZw18. Top: integrated HI mapsat a resolution of 20 arcsec (left) and 5 arcsec (right), superimposed on a HST image (fromAloisi et al. 2007). The box in the left panel shows the area covered by the right panel. In themap at 20 arcsec resolution, NHI contours are at 0.25 (dashed), 0.5, 1, 2, 4, 8, 16 ×1020 cm−2.In the map at 5 arcsec resolution, contours are at 3 (dashed), 6, 12, 24, 48 ×1020 cm−2. Thecircles show the beam size. A and C refer to the components labeled by Davidson et al. (1989).Bottom: HI velocity fields corresponding to the HI maps on top. The velocity scale is colorcoded as given in the insets.
components of local galaxy star formation (e.g., Pisano 2014). A massive (1010 M�)hot (106 K) gas is indeed detected over a large region (100 kpc) around the MW(Gupta et al. 2012). Part of the gas supply needed to balance the MW SFR maybe due to ionized HVCs. Lehner & Howk (2011) measure the ionized HVC mass tobe ∼ 108 M� and estimate an infall time of 80-130 Myr, which gives an accretionrate of 0.8-1.4 M� yr−1, large enough to sustain the SFR in the MW. The gassupply may also come from the Magellanic stream. The MW is surrounded bya long stream of neutral and ionized gas that is leading and trailing the Largeand Small Magellanic Clouds (Wannier & Wrixon 1972; Mathewson et al. 1974).This gas presumably came from the Magellanic clouds during their interaction
18 J. Sanchez Almeida
with each other (Diaz & Bekki 2012) and is now experiencing a drag force from itsmotion in the hot MW halo gas (Mastropietro et al. 2005). Taking into account theneutral and ionized gas, the Magellanic stream contains 2 ·109 M� at a distance of55 kpc (Fox et al. 2014). If the gas in the Magellanic system survives to reach theMW disk over its inflow time of ∼ 0.5-1.5 Gyr, it will represent an average inflowrate of 4-7 M� yr−1 potentially raising the current MW SFR. Multiple signs ofan evaporative interaction with the hot halo indicate that the stream may notsurvive its journey to the disk fully intact. It will break apart by hydrodynamicinstabilities and evaporate, contributing the hot halo mass (Bland-Hawthorn et al.2007; Fox et al. 2014)
Another big piece of evidence for gas reservoirs in galaxies comes from Lyαabsorption produced by gas around galaxies that happen to be near QSO lines-of-sight. In a systematic search for such systems, Tumlinson et al. (2013) findabsorption in all star-forming galaxies, with a detection rate as large as 75 % forthe early types and 100% for late types. The sample contains all Hubble types inthe near universe (z < 0.35) with intermediate masses 9.5 ≤ log (M?/M�) ≤ 11.5,and the lines-of-sight sample impact parameters d < 150 kpc. The gas is associatedwith the galaxies (with velocities smaller than the escape velocity) and it is foundto be in a cold phase, with temperatures well below the halo virial temperatures(< 105 K). This reservoir of gas is often metal poor, indicating that it was notgenerated and ejected by the galaxies but it is of cosmic origin (Sect. 2.4). Kacprzak& Churchill (2011) examine Mg II absorption kinematics in halo gas at impactparameters from 12-90 kpc along 11 QSO sightlines towards 13 L? galaxies1 atz < 0.15 and find that thick disk rotating halo models are not sufficient to explainthe broad lines. They suggest the gas is infalling along filaments and streams.In a blind survey, Burchett et al. (2013) found C IV absorption that appearsto be associated with either of two dwarf galaxies, and concluded that the mostlikely origin for the lines is cold gas accreting onto the z ∼ 0.003 dwarf galaxy.The same kind of cold gas is also present in galaxies of lower mass and to evenlarger impact parameter. Jia Liang & Chen (2014) search for galaxy-QSO closepairs suitable for finding gas absorption systems. They find 111 independent pairsamong nearby (z ∼ 0.02) low mass galaxies (log[M?/M�] = 9.0± 0.9), with impactparameters between 30 and 500 kpc (median 250 kpc). Abundant hydrogen gas isfound beyond the dark matter halo radius Rvir and all through d ∼ 500 kpc, with amean covering fraction of ∼ 50%. No heavy elements are detected at d > 0.5 Rvir,though. The authors estimate that the metallicity of the inner halo is 0.1Z� (Chen2014, private communication), which sets an upper limit to the metallicity of theIGM at distances larger than Rvir. The above results present just a few casesamong the extensive list of evidence for neutral gas reservoirs next to galaxiesdrawn from absorption on QSO spectra – more will be given in Sect. 6.
Within the cold-flow accretion scenario, gravitationally bound HI structuresdevoid from stars are to be expected. HI filaments of this kind have been discov-ered in blind HI surveys. For example, Popping & Braun (2011a) analyze datafrom the Parkes All Sky Survey to find ten faint extra-galactic filaments thatcan correspond to extended haloes, tidal remnants, or potentially diffuse filaments
1 L? is the characteristic luminosity that separates low and high luminosities in the galaxyluminosity function by Schechter (1976). It turns out to be roughly comparable in luminosityto the MW.

Star formation sustained by gas accretion 19
tracing the neutral fraction of the cosmic web. Popping & Braun (2011b) mapthe galaxy filament connecting the Virgo cluster with the local group, finding 20new detections of neutral hydrogen with no obvious sign of stellar emission. Darkgalaxies are also found in the HI ALFALFA survey (Haynes 2007; Martinkus et al.2014). They represent some 3% of the extragalactic sources (Haynes 2008). Otherexamples exist in the recent literature (e.g., Oosterloo et al. 2013). So far it isunclear whether the small number of HI-only sources agrees with cosmologicalnumerical simulations since the predictions are not specific enough.
Environment influences gas content and recycling. An HI ALFALFA survey of365 dwarf galaxies in the Virgo Cluster revealed 12 red early-type dwarfs withthe same HI per unit mass as star-forming dwarfs (Hallenbeck et al. 2012). Themost likely interpretation is that the early type dwarfs were once stripped in thecluster are recently re-accreting gas. In a VLA HI study of counter-rotating disks,three early-type barred galaxies appear to be accreting cold gas. Several of the HIfeatures are cold gas blobs, possibly gas-rich dwarfs (Chung et al. 2012). Kreckelet al. (2011) selected voids out to d <100 Mpc based on SDSS galaxy data inorder to search for HI in regions of greatest galaxy underdensities. Among 15galaxies, 14 were detected with HI gas masses from 3.5 · 108 - 3.8 · 109M�. Whilesome of the galaxies are interacting or have companions, others appear isolatedand undisturbed, with flocculent spiral or chain morphologies. They note thatone void galaxy is a polar ring galaxy in a thin wall between voids, and may beslowly accreting gas from the cosmic web, as also for another ring galaxy in avoid (Spavone & Iodice 2013). Two dwarf galaxies with extended HI disks haveunusual kinematics that may be explained by ongoing cold flow accretion. One,the only known dwarf galaxy in the Local Void (KK 246), has an extended HI diskof ∼ 108M� and an unusually high mass-to-light ratio of 90 (Kreckel et al. 2011).
In order to characterize faint diffuse gas in local galaxies, Heald et al. (2011)have initiated the HALOGAS (Westerbork Hydrogen Accretion in LOcal GAlax-ieS) survey. Their deep HI survey is designed to search for extraplanar gas in edge-on and inclined nearby galaxies and determine the distribution and gas properties.The pilot survey of 4 galaxies tentatively suggests that galaxies with higher starformation energy form gas haloes from outflow, and that extraplanar gas is asso-ciated with a high star formation rate per unit area (Zschaechner et al. 2012). Thefull survey should also be a useful characterization of halo gas in local systems.
Morphological distortions. Very often the HI maps present non-axisymmetric dis-tortions showing that the gas is not contained in a disk or a spheroid (e.g., Baldwinet al. 1980) and so, suggesting the gas distribution to be transient. For example,spirals are known to have extended warped HI distributions, a pattern that cannotbe sustained for long. Among other explanations, gas infall has been proposed asthe origin of warped disks (e.g., Lopez-Corredoira et al. 2002; Bournaud et al.2005; Kamphuis et al. 2013). Figure 5 shows an extreme case of distorted HI mor-phology. Such extreme distortion is actually common among galaxies with largespecific SFR in the local universe – blue compact dwarf (BCD) galaxies oftenshow such complex HI topology (Ekta et al. 2006; Ekta & Chengalur 2010; Lelliet al. 2012b; Nidever et al. 2013). The survey LITTLE THINGS finds BCDs withkinematically separate components, streamers extending far beyond the opticalsize, kinematic HI axes offset from the optical axes, clouds associated with recentstarbursts, and so on (Johnson et al. 2012; Ashley et al. 2013). Many other exam-

20 J. Sanchez Almeida
ples of HI maps showing galaxies with plumes and filaments can be found in theliterature (e.g., Lopez-Sanchez et al. 2012). Morphological distortions suggestiveof gas accretion are also common in optical images and are discussed in Sect. 4.
A particularly telling deviation from axi-symmetry has been found recentlyby Kacprzak et al. (2012a). They report a bimodality in the azimuthal angledistribution of low ionization gas around galaxies as traced by MgII absorptionalong QSO lines-of-sight. The circum-galactic gas prefers to lie near the projectedgalaxy major and minor axes. The bimodality is clear in blue star-forming galaxieswhereas red passive galaxies exhibit an excess of absorption along their major axis.These results suggest the bimodality to be driven by gas accretion along the galaxymajor axis and gas outflows along the minor axis (Sect. 2.4). There is no otherclear alternative. For this interpretation to be correct, the inflow has to be highlyanisotropic, concentrated in the plane of the galaxy. This fact favors cold-flowaccretion with respect to the isotropic gas inflow to be expected from hot coronalgas cooling down (Sect. 2.2).
The lack of axi-symmetry of the gas properties in galaxy haloes is corroboratedby Zhu & Menard (2013) in their study of CaII H&K absorption lines producedby one million foreground galaxies at z ∼ 0.1 in 105 SDSS QSO spectra. Foredge-on galaxies the absorption is more concentrated along the minor axis. This isconsistent with the idea that bipolar outflows induced by star formation producethe metallic gas in the haloes. Actually, the inflows along the galaxy plane helpto channel the outflows along the poles (Tenorio-Tagle & Munoz-Tunon 1997;Tenorio-Tagle & Munoz-Tunon 1998).
Metallicity. Having low metallicity can be regarded as the main fingerprint ofcosmic web gas (Sect. 2.4) and, indeed, the neutral gas around galaxies is oftenvery metal poor. Gaseous systems observed in absorption along QSO lines-of-sightare easier to detect if they are metallic, simply because the absorption features areintrinsically stronger. In order to avoid this bias, Lehner et al. (2013) use an HIselected sample of some 30 L? galaxies with redshifts up to one. They study themetallicity of LLS (1016 < NHI < 1018.5 cm−2) with impact parameters d between10 and 150 kpc. Interestingly, they find a bimodal metallicity distribution withmetal poor and metal rich branches peaking at 0.025 and 0.5Z�, respectively.Both branches have a nearly equal number of absorbers. These two populationsfit in well with the scenario depicted in Sect. 2, with coexisting metal-rich gasoutflows from the galaxies and cosmological gas inflows. We note that the cosmicweb metallicity at z ∼ 0 predicted by numerical models is very close to the metal-poor branch observed by Lehner et al. In a complementary work, Jia Liang &Chen (2014) find that the absorbing gas next to the galaxies has metallic lines,but only hydrogen absorptions show up at distances beyond the virial radius. Thispattern is corroborated by other studies (e.g., Churchill et al. 2013).
Extremely metal poor (XMP) galaxies provide another piece of evidence forlarge amounts of cosmic gas around local star-forming galaxies. These galaxieshave a number of properties consistent with disks being assembled by accretionof gas (Elmegreen et al. 2012b; Sanchez Almeida et al. 2013, 2014). In particular,they are enshrouded by large amounts of neutral gas, so that Mg/M? is typicallyas large as 20 (Filho et al. 2013). The ratio is so large that normal stellar evolutioncannot produce enough metals for their HI gas to have the same metallicity as thatobserved in the HII regions of the galaxies, which are already extremely metal poor

Star formation sustained by gas accretion 21
because XMP galaxies are selected to have Z < 0.1Z�. Then the HI gas aroundXMPs must have a metallicity Z � 0.1Z� and so of the order of a few hundredthsof the solar value, which is the level of metallicity expected for the cosmic web inthe local universe (Sect. 2.4).
The CGM has also been studied in absorption in the stellar spectra producedby the host galaxy. Then one can unambiguously measure whether the gas goes inor out (see Sect. 2.4). Lebouteiller et al. (2013) make this observation with IZw18(Fig. 5). The HI gas pool around it has a metal abundance lower by a factorof two as compared to the HII regions, and it may even present pockets of gaswith metallicity essentially null. The HII metallicity samples the gas in the disk,which is already extremely low in this particular galaxy. Since the observed HIgas metallicity is at the level expected for the cosmic web (Sect. 2.4), and it islower than the metallicity in the disk, the HI is likely cosmic gas being accreted.Lebouteiller et al. (2009) find an even larger discrepancy between the HI and HIImetallicities of Pox 36, where the HI metallicity is around 0.03Z�.
Gas consumption timescales. As we point out above, the stellar mass is a poor pre-dictor of the gas-to-stellar mass ratio Mg/M?, however, Kannappan et al. (2013)find that Mg/M? correlates well with the stellar mass in young stars formed onlyduring the last Gyr, Mnew
? . Actually, Mg/M? was found to be close to Mnew? /M?,
which implies routine refueling of star-forming galaxies on Gyr timescales, i.e.,implies a continuous gas accretion to maintain SF. The study is based on thou-sands of objects so it portrays a general property of galaxies. This short time forexhausting the gas is very consistent with the HI consumption timescales inferredfrom the KS law (τg in Eq. [2]), of the order of 0.5-2 Gyr (Sect. 2.1). The fact thatgalaxies have been forming stars along the Hubble time (e.g., Sanchez Almeidaet al. 2012), but they consume their gas in only one Gyr, is one of the best ar-guments in favor of the need for an external gas supply to keep up with the starformation (e.g., Kennicutt 1983; Fraternali & Tomassetti 2012).
3.2 Ionized gas observations
The emission line spectra produced by HII regions surrounding the star-formingregions provide a direct means of measuring the physical conditions of the gasforming stars and, in particular, its metallicity that represents the prime diagnosticfor cosmic gas accretion (Sect. 2.4). There are a number of compelling observationsof ongoing gas accretion based on such HII-based metallicity measurements.
Metallicity inhomogeneities and inverted gradients. The secular evolution of diskgalaxies produces a regular pattern with the metallicity decreasing inside out,i.e., having a negative gradient with galactocentric distance (Vilchez et al. 1988;Edmunds & Greenhow 1995; van Zee et al. 1998; Magrini et al. 2007; Sanchez et al.2014). The timescale for gas mixing in a disk inside an annulus is fairly short, onthe order of a rotational period or a few hundred Myr (Sect. 2.5). Deviations fromnegative metallicity gradients are usually attributed to the recent arrival of cosmicgas that feeds the star formation. If the gas is accreted through the cold-flow mode(Sect. 2), it is expected to reach the disks in clumps often forming stars already(e.g., Dekel et al. 2009; Ceverino et al. 2010; Genel et al. 2012b). Alternatively,

22 J. Sanchez Almeida
Fig. 6 Top: Images of three tadpole galaxies characterized by having a bright peripheralclump on a faint tail. The images have been taken from the SDSS database (Abazajian et al.2009), and are displayed with an inverted color palette so that the background sky looks white,and the intrinsically blue galaxies appear reddish. The red line shows the orientation of thespectrograph slit used to measure metallicity variations, and the horizontal scales on the upperleft corner of the panels correspond to 5 or 10 arcsec as indicated. Bottom: Oxygen abundancevariation across the galaxies on top. The vertical solid line represents the center of rotation,whereas the vertical dotted lines indicate the location of maxima in SFR. Note the existenceof abundance variations, with the minima coinciding with the regions of largest SFRs. Thethick horizontal solid line indicates the solar metallicity. Adapted from Sanchez Almeida et al.(2013).
the external gas streams may fuel the disks with metal-poor gas, so that gas massbuilds up developing starbursts through internal gravitational instabilities (e.g.,Noguchi 1999; Elmegreen et al. 2008; Bournaud & Elmegreen 2009). In any case,the cold-flow accretion is bound to induce metal-poor starbursts.
Metallicity drops associated with intense starbursts may reflect cold-flow ac-cretion. Cresci et al. (2010) were the first to identify this pattern in high redshiftgalaxies. The same kind of metallicity drops appear in local tadpole galaxies,where the bright star-forming head of the tadpole often has lower metallicity thanthe underlying galaxy (see Fig. 6). Sanchez Almeida et al. (2013) interpret thisobservation as an episode of gas accretion onto the tadpole head. Localized metal-licity drops associated with star-forming regions have also been observed in otherobjects, including gamma ray burst host galaxies (Levesque et al. 2011; Thoneet al. 2014), BCDs (Izotov et al. 2009; Werk et al. 2010; Sanchez Almeida et al.2014) and dwarf irregular galaxies (Haurberg et al. 2013). Variations of metallicityamong HII regions located at the same galactrocentric distance are not unusualeven in large nearby spirals (Bresolin et al. 2012; Li et al. 2013); some of thesevariations could come from localized accretion events.
Secular evolution produces negative metallicity gradients, but some spiralsshow reverse gradients, where the metallicity is lowest in the inner galactic re-

Star formation sustained by gas accretion 23
gions. Examples are given by Queyrel et al. (2012), who point out that 15 % oftheir galaxies at z = 1.2 show such reverse gradients, especially those objects withthe lowest metallicities. This observation may be due to averaging out metallicitydrops in inner regions, or other artifacts caused by the limited angular resolution(e.g. Yuan et al. 2013). Alternatively, it may also be interpreted as produced byfast inflows within the disk giving gas to the central regions. Metal poor gas de-posited in the outskirts can be transported outside-in by bar instabilities or sometype of tidal interaction (Combes 2008, 2014; Elmegreen et al. 2012a). The samemechanism of gas transport is able to explain the presence of metal-poor gas inthe narrow-line region of a nearby QSO found by Husemann et al. (2011). It mayalso account for the finding by Moran et al. (2012) that 10 % of the galaxies withregular metallicities exhibit a sharp downturn in metallicity at the edge of the disk.Surprisingly, the magnitude of the outer drop is correlated with the fractional HIcontent of the galaxy. The recent stellar mass growth at the edge of the galaxies isapparently due to the accretion or radial transport of gas from beyond the stellardisk.
High metallicity of quiescent BCDs. BCDs are high surface brightness targets rel-atively easy to detect. The luminosity of these galaxies is dominated by one orseveral young starbursts. However, most if not all BCDs contain host galaxieswith old stars too (e.g., Papaderos et al. 1996; Cairos et al. 2003; Corbin et al.2006; Amorın et al. 2007). The dominant starburst is so intense that it cannotbe sustained for long, therefore, the BCDs have to be in a transient phase. Con-sequently, there must be many local galaxies in the pre or post BCD phase, i.e.,many quiescent BCDs (or, for short, QBCDs). The BCD host galaxies should showup best outside of their starburst regions. Masking out these regions, Amorın et al.(2007, 2009) were able to characterize their photometric properties. Using the typ-ical host colors and magnitudes as proxies for QBCD properties, Sanchez Almeidaet al. (2008) searched the SDSS-DR6 archive for QBCD candidates. They turnedout to be rather common: one out of three local dwarf galaxies is of this kind, andthere are some thirty of them per BCD galaxy. Their main properties, includingtheir luminosity functions, are consistent with the BCDs being QBCDs observedduring a starburst phase in a duty cycle where the quiescent phase lasts 30 timeslonger than the active phase. This interpretation presents a difficulty, though: thegas-phase metallicity of the QBCDs is systematically higher than the metallicityof the BCDs. This cannot happen in a closed-box evolution, where the precursorgalaxy always has lower metallicity than the follower, so that QBCDs could not beprecursors of BCDs. The problem naturally disappears if almost every BCD phaseis preceded by the advent of fresh metal-poor gas that triggers the star formationepisode. Moreover, such gas infall triggering explains why the stellar metallici-ties of BCDs and QBCDs agree, even though their gas-phase metallicities do not(Sanchez Almeida et al. 2009). The stars of BCDs and QBCDs are statisticallythe same because only a small fraction of galaxy stellar mass is produced in eachstarburst. Their gas differs because BCDs have just rejuvenated their ISM. Keep-ing in mind that 30 % of all local dwarfs are QBCDs, gas-infall must be a commonphenomenon. These findings are consistent with the recent results by Zhao et al.(2013).

24 J. Sanchez Almeida
Metallicity threshold. Local galaxies with ionized gas metallicity smaller than0.1Z� are rare. They are usually called extremely metal poor (XMP). The re-cent compilation by Morales-Luis et al. (2011) rendered only 140 such objects, allof them with metallicity above 0.01Z�. The existence of this threshold has beenknown for a long time since the prototypical XMP galaxy IZw 18 is close to the limit(some 0.03Z�), and its singularity was acknowledged more than 40 years ago (Sar-gent & Searle 1970). Despite repeated efforts to find galaxies more metal poor (e.g.,Terlevich et al. 1991; Izotov et al. 1999; Kunth & Ostlin 2000) the 1 % lower limitmetallicity remains today (Izotov et al. 2005; Kunth & Lebouteiller 2011). Severalexplanations have been put forward to account for this minimum metallicity: theself-enrichment of the HII region used for measuring (Kunth & Sargent 1986),the metal abundance of the proto-galactic cloud (Kunth & Lebouteiller 2011), themetallicity threshold set by the ejecta from population III stars (Audouze & Silk1995; Thuan & Izotov 2005), technical difficulties for metallicity determinationsbelow a threshold (Papaderos et al. 2008), and others. None of them seem to befully compelling. However, the accretion scenario provides a natural explanationfor this long-lasting problem. Numerical simulations predict the cosmic web gasto accumulate metals from the outflows of dwarf galaxies (Sect. 2.3). These con-tributions add up along the Hubble time so that at redshift zero the cosmic webmetallicity has to be at the few percent level (Sect. 2.4), which is precisely theobservational threshold. This is the metallicity to be expected if the SF in XMPsis driven by gas directly accreted from the cosmic web.
Nitrogen and Oxygen in green-pea (GP) galaxies. GPs are star-forming galaxieswhich receive this name because of their compactness and green color in SDSScomposite images (Cardamone et al. 2009). The color is produced by an unusuallylarge [OIII]λ5007 A emission line redshifted so as to contribute to the g-band color.They have some of the highest specific SFRs in the local Universe, able to doubletheir stellar masses in a fraction of Gyr. GPs are low metallicity outliers of themass metallicity relationship (Amorın et al. 2010, 2012a). Detailed analyses of theiremission lines reveals complex kinematical structures with several componentscoexisting in only a few kpc (Amorın et al. 2012b). Even though GPs have lowoxygen metallicity, they present an overabundance of N/O which is typical of agingstellar populations. This puzzling observation is naturally explained if GPs haverecently received a major flood of low metallicity gas (Amorın et al. 2010, 2012a).Then the mixing with metal-poor gas reduces the metallicity (i.e., O/H), but theratio between metal species (N/O) remains as in the original high metallicity ISM.The motions of a galaxy in the N/O vs O/H plane due to gas infall have beenmodeled by Koppen & Hensler (2005), who point out that large excursions requirethe infall gas mass to be larger than the gas present in the galaxy, with the infallrate exceeding the SFR. We note that GPs are not special but just extreme casesin the continuous sequence of local star-forming galaxies (e.g., Izotov et al. 2011).
4 Accretion inferred from stellar observations
Morphology metallicity relationship. There is a relationship between the morphol-ogy of the galaxy as inferred from broad-band imaging (thus tracing stars) and

Star formation sustained by gas accretion 25
Fig. 7 Stelar mass-metallicity relation for the most lopsided (the dashed lines) and the leastlopsided (the solid lines) galaxies in the sample of 2.5 · 104 nearby galaxies from SDSS studiedby Reichard et al. (2009). The three lines of each type correspond to the 25 % , 50 %, and 75 %percentiles. The most lopsided galaxies have a metallicity deficit of 0.05-0.15 dex comparedto the least lopsided galaxies of the same M?. The deficit at low mass is greater than at highmass. Oxygen abundance is used to parameterize metallicity, and M? is given in solar massunits.
the metallicity of the star-forming gas. It has several manifestations, the most con-spicuous one being the association between cometary shape and extremely metalpoor galaxies (Papaderos et al. 2008; Morales-Luis et al. 2011; Munoz-Tunon et al.2014). In a systematic search for XMP galaxies in SDSS-DR7, Morales-Luis et al.(2011) find that 75 % of them have either cometary shape or are formed by chainedknots. Likewise, from the comprehensive catalog of 140 known XMPs used byFilho et al. (2013), 80 % have cometary structure or two or multiple star-formingregions. For reference, only 0.2 % of the star-forming galaxies in the Kiso surveyare cometary (Elmegreen et al. 2012b). Even if surprising, XMPs seem to be theextreme case of a common relationship between morphology and metallicity fol-lowed by the bulk of the star-forming galaxies in the local universe. Reichard et al.(2009) measure lopsidedness in a sample of 2.5 · 104 nearby galaxies from SDSS.At a fixed mass, the more metal-poor galaxies are more lopsided – see Fig. 7.Whatever process causes lopsidedness, it is associated with low metallicity gasin the galaxies. This non-trivial observational result is naturally accommodatedwithin the gas accretion scenario (e.g., Ceverino et al. 2012, and Sect. 2). Extremelopsidedness is produced by off-center large starbursts, fed by gas accretion eitherdirectly or indirectly – directly if the gas arrives to the disk ready to form starsor indirectly if the gas is accumulated until disk instabilities trigger SF. Thus lowmetallicity and lopsidedness come together naturally. The process has to be quitecommon to be responsible for the lopsidedness in the large dataset explored byReichard et al.
Kinematical distortions. Galaxies are, to first order, axi-symmetric systems. How-ever, they frequently show kinematical distortions with respect to an axi-symmetricvelocity pattern. When the distortions are significant but the underlying axisym-metric structure remains identifiable, the best explanation is often the recent ac-cretion of a gas rich object or a gas stream onto a pre-exiting galaxy. For example,

26 J. Sanchez Almeida
Fig. 8 SDSS color images of polar ring galaxies from Combes et al. (2013). The scale bar is 10arcsec long, and the rings are indicated with small arrows to guide identification. The centralobject is usually an early-type gas poor galaxy, but the ring itself is gas rich. Some galaxieshave giant HI polar disks with very weak stellar counterpart (e.g., Moiseev et al. 2011).
polar-ring galaxies are composed of a central component (usually an early-typedisk galaxy) surrounded by an outer ring or disk made of gas, dust and stars,which orbits nearly perpendicular to the plane of the central galaxy (Whitmoreet al. 1990; see also Fig. 8). The polar ring itself is gas rich, with a gas fractioncorresponding to ∼30 % of the baryonic mass, suggesting that polar ring galaxieshave just accreted a large amount of gas (Combes et al. 2013) and new stars areformed in situ. Polar rings can be formed through galaxy interaction and merging,but most likely through accretion from cosmic filaments (e.g., Finkelman et al.2011; Pizzella et al. 2013; Blasco-Herrera et al. 2013). Kinematically distinct innerpolar gaseous disks appear common in disk early-type galaxies; their juxtaposi-tion with old stellar nuclei suggests that they may be remnants of gas accretionthat occurred prior to the main gas accretion in the galaxy (Sil’chenko & Moiseev2014; Corsini et al. 2012). Polar ring metallicities of 0.1–0.4 Z�, lower than themetallicities in the parent galaxies, are consistent with cold accretion (Spavoneet al. 2011).
Often galaxy disks show a number of kinematically distinct components likecounter-rotating bulges (Prada et al. 1996), counter-rotating disk stars (Verganiet al. 2007; Coccato et al. 2011), and SF regions kinematically decoupled fromthe rest of the galaxy (Sanchez Almeida et al. 2013; Koleva et al. 2014). Thesefeatures are expected from numerical simulations of minor mergers (e.g., Balcells& Quinn 1990; Immeli et al. 2004), however they also arise in hierarchical galaxyformation scenarios even in the absence of merging. Algorry et al. (2014) model adisk galaxy fed by two distinct filamentary structures with opposite spins. Theyproduce counter rotating stars that are not dragged along with the gas but mostlyproduced in situ. Tidal streams or little tails are also kinematically distinct com-ponents, and they turn out to be quite common in the local universe. At least 6 %of the local galaxies show distinct stream-like features, and a total of 19 % showsome sort of faint tail (e.g., Miskolczi et al. 2011; Martınez-Delgado et al. 2010).
Star formation sustained by gas accretion 27
They are thought to be leftovers of tidally disrupted gas rich satellites on theirway to reach the center of the global gravitational potential. A study by Matthewset al. (1998) indicated a correlation between optical and HI asymmetries in isolatedgalaxies, which could result from cold gas accretion.
The highly organized distribution of satellites surrounding the MW and M31has been long noticed (e.g., Lynden-Bell 1983). The best explanation seems to bethat the dwarf satellite galaxies fell into the gravitational potential along only oneor two filaments (Li & Helmi 2008; Angus et al. 2011). Using a high-resolutiondark matter simulation of the local group, Libeskind et al. (2011) concluded thatthe satellites of both MW and M31 were accreted anisotropically onto their haloes,entering the virial radius from a specific direction with respect to the large-scalestructure. These conclusions are confirmed in other simulations of M31 dwarfs(Goerdt & Burkert 2013; Sadoun et al. 2013), MW dwarfs (Nichols et al. 2011;Lovell et al. 2011), and in observations of dwarfs around NGC 3109 (Bellazziniet al. 2013).
Star formation history of dwarf galaxies. The variation of the SFR with timeis often very bursty in late type galaxies, even if they are isolated. Episodes oflarge star formation are intertwined with long quiescent phases. This result isinferred using fitting techniques on integrated galaxy spectra (e.g., Cid Fernandes2007), color-magnitude diagrams of resolved stellar populations (McQuinn et al.2010a), and statistical arguments involving active and quiescent BCDs (SanchezAlmeida et al. 2008). Convulsive SF histories fit in well the cold-flow accretionscenario. Models predict the process to be intermittent, so, if gas accretion drivesstar formation, then the SFR is expected to be bursty (Sect. 2). A number offactors conspire to make the effect more clear in dwarfs. They are actively formingstars at present, so that the bursts are young and luminous, and they provide SFhistories with good time resolution. Outflows are far more important in dwarfs,and they quench star formation forcing long inter-burst periods. Forming massivegalaxies by cold-flows requires the contribution of many discrete accretion events,therefore, statistical fluctuations in their arrival time tend to cancel, giving rise toa smooth SF history. The lower the galaxy mass the less effective the statisticalaveraging, and dwarfs tend to have a more spasmodic SFR.
Even though individual HII regions last for a few Myr (e.g., Mas-Hesse & Kunth1999; Harris et al. 2004), the SF episodes of a galaxy as a whole do not shut offwithin this timescale but they last for several hundred Myr (Dohm-Palmer et al.1998; McQuinn et al. 2010b; Hidalgo et al. 2011). This relatively long duration ofthe burst is consistent with a single gas accretion event which suddenly increasesthe gas but which requires a much longer gas consumption timescale to transformit into stars (τg ∼ 1 Gyr; Sect. 2.1).
G dwarf problem. There is a long known deficit of sub-solar metallicity G dwarfstars in the solar neighborhood (van den Bergh 1962; Schmidt 1963; Lynden-Bell1975). This so-called G dwarf problem has been amply discussed in the literature,with solutions ranging from changes in the initial mass function (IMF) to inho-mogeneous star formation (Caimmi 2008, and references therein). Among them,a continuous metal-poor gas inflow feeding star formation seems to be the pre-ferred one (Edmunds 1990, 2005). The argument dates back to Larson (1972),

28 J. Sanchez Almeida
who pointed out that star-formation maintained by metal-poor gas accretion self-regulates to produce a constant gas phase metallicity close to the stellar yield,which implies close to the solar metallicity (Sect. 2.1). Therefore the apparentdeficit of sub-solar metallicity G dwarfs is actually an excess of solar metallicityG dwarf stars formed over time out of an ISM always near equilibrium at approx-imately the solar metallicity. Interestingly, the G dwarf problem is not exclusiveto the MW but is known to happen in other galaxies as well (e.g., Worthey et al.1996). The enhanced deuterium fraction in the Galaxy is also consistent with thisscenario (e.g., Tsujimoto 2011), and chemical evolution models cannot produce theabundances observed in other stars or the abundance gradients without extensiveand continuous accretion of fresh metal-poor gas (e.g., Schonrich & Binney 2009).
5 Scaling laws as evidence for metal-poor gas accretion
A number of observational properties characterizing large samples of local star-forming galaxies can be explained if the star-formation is driven by metal poor gasaccretion. The gas infall explanation provides a simple physical unifying mecha-nism, even though often it is not the only explanation of each individual obser-vation. The very existence of general laws or trends implies that the underlyingmechanism has to be something fundamental, since it affects not just a few ob-jects but the bulk of the star-forming galaxies. Some of these general properties arediscussed elsewhere in this work, and will not be repeated here; in particular theshort gas consumption time-scale compared with the age of the stars (Sect. 3.1),the large metallicity of quiescent BCDs (Sect. 3.2), the metallicity-morphology re-lationship (Sect. 4), and the similarity between the mass in young stars and massof gas (Sect. 3.2).
5.1 The stellar mass-metallicity-SFR relationship
Galaxies are known to follow a mass-metallicity relationship, where the larger thestellar mass the higher the metallicity (e.g., Skillman et al. 1989; Tremonti et al.2004; Gallazzi et al. 2005). The relationship presents a significant scatter that hasbeen recently found to be associated with the present SFR in the galaxy (Mannucciet al. 2010; Lara-Lopez et al. 2010; Yates et al. 2012; Perez-Montero et al. 2013;Andrews & Martini 2013; Zahid et al. 2013). Specifically, for galaxies with thesame stellar mass, the metallicity decreases as the current SFR increases. This newrelationship is often referred to as the fundamental metallicity relationship (FMR,Mannucci et al. 2010), and is shown in Fig. 9. The mass-metallicity relationshipis commonly interpreted as due to variations of the star-formation efficiency withgalaxy mass, and/or to galaxy mass-dependent metal-rich outflows (e.g., Lee et al.2008; Ellison et al. 2008). The former implies that low mass galaxies produce lessstars for their gas, and so remain more metal poor, whereas the latter relies onthe metal-rich SN ejecta to be preferentially lost to the IGM by low mass galaxies.Neither of these two mechanisms, however, predict the observed dependence ofmetallicity on the SFR. The observed anti-correlation between metallicity and SFRcan be qualitatively understood if the star-formation is preferentially triggered andsustained by the inflow of metal-poor gas. The arrival of new gas simultaneously

Star formation sustained by gas accretion 29
Fig. 9 Stellar mass-metallicity-SFR relationship, or FMR, as observed by Mannucci et al.(2010). Left: oxygen abundance vs M? for galaxies with the same SFR. SFRs are color codedas indicated in the inset. Given a galaxy mass, galaxies of lower metallicity present higherSFR. Right: oxygen abundance vs SFR for galaxies of the same mass. The stellar mass iscolor coded according to the inset. Given a SFR, galaxies of lower metallicity have lower mass.The relationship tends to saturate at the high-mass end, where all galaxies have the samemetallicity independently of the mass and SFR. M? is given in M� and SFR in M� yr−1.
drops the ISM metallicity and increases the SFR. This idea was already advancedby Mannucci et al. (2010), and it seems to work also quantitatively as shown inthe next paragraphs.
Several recent numerical and analytic works explain the FMR within thisframework of gas infall forcing SF. It is important to acknowledge that such anexplanation implies a time variable infall rate, which moves the galaxy systemout of the stationary-state. Otherwise, in a gas consumption time-scale (∼1 Gyr),the galaxies reach an equilibrium characterized by a metallicity independent ofthe infall rate (see Eq. [11]). The stationary-state metallicity depends only on pa-rameters set by stellar physics and on the mass loading factor w (i.e, the ratiobetween the outflow rate and the SFR; see Eq. [3]). Since the gas has to overcomethe gravitational pull to escape, w is expected to be a strongly varying functionof galaxy mass. This dependence of w on the depth of the gravitational well (asparameterized by M?) seems to be the key ingredient giving rise to the observedmass-metallicity relationship (e.g., Garnett 2002; Finlator & Dave 2008; Peeples &Shankar 2011). Since Z ∝ M?
1/3 at low stellar mass, Dave et al. (2012) concludethat w ∝ M?
−1/3, as expected if the outflows are produced by momentum drivenwinds.
Brisbin & Harwit (2012) describe the FMR with an intrinsically bursty modelwhich is always out of equilibrium. Galaxies receive metal-poor gas parcels ofdifferent masses that are instantaneously mixed up with the existing ISM. Thisarrival dilutes the metallicity of the gas and triggers star formation, with the twoparameters set by the received gas mass and thus correlated. The authors showthat at fixed M?, the observed relationship between metallicity and SFR followsthe scaling to be expected from this model. The explanation works for most of the

30 J. Sanchez Almeida
galaxies with M? ≤ 2 · 1010 M�, and many with masses above this threshold andlarge radii.
Dayal et al. (2013) explain the FMR by forcing a secular deviation from thestationary state, so that given a M?, those systems that happen to have larger gasmasses are also those with higher SFR and lower Z. The reason why two galaxieswith same M? have different gas masses can be pinned down to their different ages,so the youngest is the one with the largest gas mass. Both inflows and outflowsare required to reproduce the observed relationship, but the outflows dominate byfar.
Lilly et al. (2013) work out a model galaxy whose main properties self-regulatedue to the short gas consumption time scale. Although more sophisticated, it isvery much in the spirit of the simple description given in Sect. 2.1. The modelgalaxy is near the stationary state, but the gas supply available to form stars isallowed to change with time. This drives the system out of the stationary state andprovides a dependence of the metallicity on the SFR and mass gas. The authorssuccessfully fit the FMR by Mannucci et al. (2010, in our Fig. 9), allowing bothw and the gas consumption time scale to vary with M?. As in the case of Dayalet al. (2013), the deviations from the stationary state are set by the galaxy age.
Yates et al. (2012) use the semi-analytical model L-Galaxies by Guo et al.(2011) to explain the FMR. Thousands of individual galaxies are taken frompurely dark-matter cosmological numerical simulations. Baryons that follow thedark-matter are added, implying that a non-stationary clumpy gas accretion drivesthe system. Mass loading factors that depend on M? are included. The model re-produces the main observational trends, including an apparent turnover of themass-metallicity relationship at very high stellar masses. Figure 10 shows the evo-lution of four prototypical model galaxies in the Z vs M? plane. It illustrates howthe FMR naturally emerges in this seemingly complex picture. There is a globalquasi-stationary drift up and to the right, as the galaxies gather mass and so de-crease their outflow losses. On top of this trend, galaxies move down and up atan almost constant stellar mass. First they move down in response to the arrivalof fresh gas, and then they quickly recover the stationary-state metallicity andmove back up. This is particularly clear in the galaxy of lowest mass in Fig. 10(log[M?/M�] = 8.55, brown line and symbols). The stationary-state metallicity isgiven by the upper envelope of the Z vs M? relationship. Obviously, the downwardexcursions are accompanied by bursts of star formation, giving rise to the observedFMR when many galaxies at different phases of the cycle are represented in theZ vs M? plane.
Forbes et al. (2013) present a simple model to understand the genesis of theFMR. The scatter arises from the intrinsic scatter in the accretion rate, but maybe substantially reduced depending on the timescale on which the accretion variescompared to the timescale on which the galaxy loses gas mass. They show thatobservational constraints on the scatter can be translated into constraints on thegalaxy-to-galaxy variation in the mass loading factor, and into the timescales andmagnitude of stochastic accretion onto star-forming galaxies. They infer remark-ably small scatter in the mass loading factor, < 0.1 dex, and that the scatter inaccretion rates is smaller than expected from numerical simulations.
The parameterization of the FMR by Mannucci et al. (2010), seems to holduntil z < 2, and then it changes substantially at higher redshift (e.g., Mannucciet al. 2010; Yabe et al. 2012; Ly et al. 2014; Troncoso et al. 2014; Cullen et al. 2014).

Star formation sustained by gas accretion 31
Fig. 10 Evolution of four model galaxies from z = 2 (open circles) to 0 (bullets) according tothe semi-analytical models by Yates et al. (2012). Galaxies of final stellar mass log(M?/M�) =8.55, 9.49, 10.91 and 11.06 are shown in brown, orange, blue and red, respectively. The fullpresent day population is shown in grey for reference. Galaxies move up and to the right asthey gather more mass and reduce their outflows. In addition, sudden metallicity drops areproduced by the arrival of cosmic gas ready to form stars.
Variations are expected if the relationship is caused by cosmic gas accretion sinceaccretion rates and IGM metallicities change over time. Thus the variation withredshift of the FMR provides a powerful diagnostic tool to evaluate the evolutionof the accreted gas along the history of the universe (Forbes et al. 2013; see alsoSect. 8).
N/O is independent of SFR at a given M?. Unlike the metallicity, the ratio be-tween the observed N and O does not seem to depend on SFR (see Perez-Monteroet al. 2013; Andrews & Martini 2013). This lack of SFR-dependence is consis-tent with the relation between metallicity and SFR being maintained by episodicmetal-poor inflows. The advent of fresh gas triggers star formation and drops themetallicity, but it does not change the pre-existing relative abundance betweenmetals.
5.2 The stellar mass-metallicity-gas mass relationship
Bothwell et al. (2013) point out that the FMR relationship between stellar mass,metallicity, and SFR described in Sect. 5.1 is just a consequence of a more funda-mental relationship where the SFR is replaced with the HI gas mass. The authorsfind the HI-based relationship cleaner, and without the saturation at high masses,where irrespectively of their SFR, all massive galaxies have the same metallicity(Fig. 9, left panel). A similar anti-correlation between HI mass excess and metal-licity has been found by Robertson et al. (2013). Hughes et al. (2013) also find theanti-correlation between metallicity and gas mass at fixed stellar mass in a volume-limited sample of 260 nearby late-type galaxies. Interestingly, the relationship is

32 J. Sanchez Almeida
nearly invariant to the environment when going from clusters to the field. Thisfinding indicates that internal evolutionary processes, rather than environmentaleffects, shape the observed relationships.
According to the theoretical models put forward to explain the FMR in Sect. 5.1,a relationship between stellar mass, metallicity, and gas mass is to be expected.Given the FMR, it follows from the KS relation which states that the gas mass setsthe SFR and vice versa (Eq. [2]). Thus the FMR and the relationship discussedin this section are just two renderings of the same underlying physical principle,namely, that galaxies are driven out the equilibrium mass-metallicity relationshipby sudden bursts in the inflow rate. These changes increase the HI mass, increasethe SFR, and decreases the metallicity of the ISM, all at once.
5.3 The mass-metallicity-size relationship
Based on some 44000 SDSS galaxies, Ellison et al. (2008) found a relation betweenM?, specific SFR, and galaxy size (as parameterized by the half-light radius).They found that at fixed M?, physically smaller galaxies are also more metal rich.The metallicity changes by 0.1 dex when the galaxy size changes by a factor of2. The authors discard biases due to the finite size of the central region used toestimate metallicities, and to the Hubble type dependence of the radius. A similarrelationship between size and metallicity was also found at z ∼ 1.4 by Yabe et al.(2012).
This non-trivial observational result is, however, a natural outcome of the gasaccretion driven SF process. In the stationary state the metallicity is mainly setby the mass loading factor (w in Eq. [11]), which changes systematically with halomass, that is to say, with the depth of the gravitational potential well from whichthe baryons have to escape. The mass-metallicity relationship is interpreted con-sidering that the halo mass scales with M? (Sect. 5.1). However, the gravitationalbinding energy also depends on the distance of the matter to the center of thegravitational well. At fixed mass, winds escape easier from larger galaxies. Thusthey are expected to have larger mass loading factors. If the mass loading fac-tor depends on mass through the escape velocity, then it depends as mass/size.A factor 2 increase in size is equivalent to a factor 2 decrease in mass, and thisscaling is consistent with the observed 0.1 dex metallicity drop when either themass decreases a factor of 2 or the effective radius increases by this amount.
6 Gas accretion and star formation at high redshift
Most of the observational evidence for gas accretion put forward so far has beenconcentrated on the low redshift universe. Theory predicts that cold gas accretionis particularly important at high redshift, when DM haloes are low mass and theaccreted cosmic gas remains cold and ready to form stars (Sect. 2). Thus thehigh redshift universe corresponds to an epoch of galaxy assembly and high SFR.Here we review observational evidence emphasizing the high redshift aspects notaddressed elsewhere in the paper. We include a section on the role of mergers, justto complement the statement made in Sect. 1 that mergers play only a subordinaterole in galaxy growth outside dense environments.

Star formation sustained by gas accretion 33
Fig. 11 SFR density (dark orange shaded region) and luminosity density (blue shaded region)in the universe over the last 13.2 Gyr. The left and right axes refer to the SFR and theluminosity, respectively. Various symbols correspond to various sources in the literature asdetailed in the paper by Bouwens et al. (2011) from which the plot was taken.
6.1 Star formation history of the universe
The star formation rate over the history of the universe has been studied sincethe mid 90s (e.g., Lilly et al. 1996; Madau et al. 1996; Steidel et al. 1999; Ouchiet al. 2004; Madau & Dickinson 2014). It requires observing faint objects at highredshift and is thus one of the primary drivers for building larger telescopes withadaptive optics and infrared sensitivity. Recent observations of the variation ofthe cosmic SFR density with redshift are summarized in Fig. 11 (from Bouwenset al. 2011). This diagram includes a candidate redshift z ≈ 10 galaxy detected ina dropout search in the Hubble Ultra Deep Field. The diagram also includes SFRdensity determinations at z ' 7 and z ' 8 from Bouwens et al., and values fromearlier studies at z < 4. Dust corrections are applied, and are already negligible byz ' 7 (Oesch et al. 2010; Bouwens et al. 2010, 2009). Note how the SFR steadilyincreases with time in the early universe until reaching a maximum at an age of2.5 Gyr (z ∼ 3 - 2).
In a complementary work, Heavens et al. (2004) analyzed the fossil record ofthe current stellar populations in nearly 105 nearby galaxies. This allowed themto reconstruct the SFR density along the age of the universe for galaxies of dif-ferent masses independently. The results are shown in Fig. 12. The inferred starformation history differs according to the (present) galaxy mass so that the largerthe stellar mass the earlier their stars were formed. High and low mass galaxieshave very different SF histories. In particular, the global SFR density is driven bythe behavior of the most massive systems (cf., Figs 11 and 12), and galaxies withM? < 3 · 1010 M� today produced their stars at constant SFR back to at leastz ∼ 3.
Both the global history (Fig. 11) and the differences among galaxies of differ-ent masses (Fig. 12) are well reproduced by cosmological numerical simulations inwhich most galaxies grow by cold-flow accretion. The agreement with the globalSF history (Fig. 11) can be attributed to DM halo growth as reflected in Eq. (12):
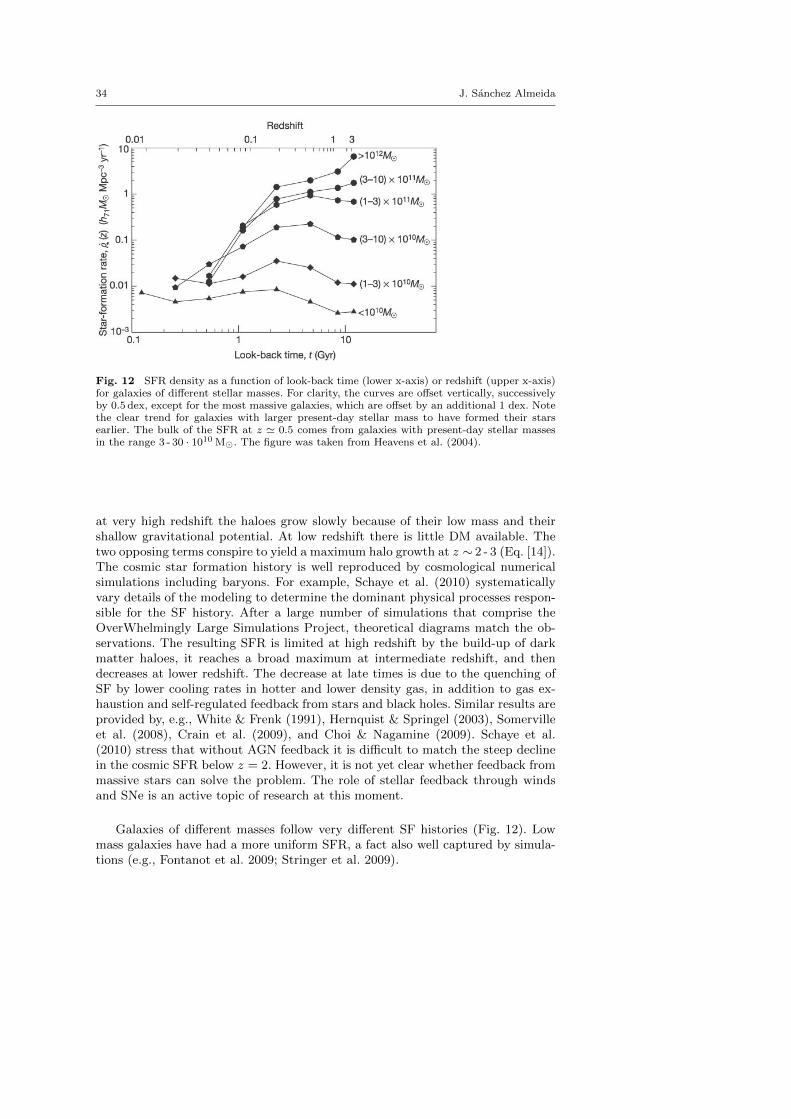
34 J. Sanchez Almeida
Fig. 12 SFR density as a function of look-back time (lower x-axis) or redshift (upper x-axis)for galaxies of different stellar masses. For clarity, the curves are offset vertically, successivelyby 0.5 dex, except for the most massive galaxies, which are offset by an additional 1 dex. Notethe clear trend for galaxies with larger present-day stellar mass to have formed their starsearlier. The bulk of the SFR at z ' 0.5 comes from galaxies with present-day stellar massesin the range 3 - 30 · 1010 M�. The figure was taken from Heavens et al. (2004).
at very high redshift the haloes grow slowly because of their low mass and theirshallow gravitational potential. At low redshift there is little DM available. Thetwo opposing terms conspire to yield a maximum halo growth at z ∼ 2 - 3 (Eq. [14]).The cosmic star formation history is well reproduced by cosmological numericalsimulations including baryons. For example, Schaye et al. (2010) systematicallyvary details of the modeling to determine the dominant physical processes respon-sible for the SF history. After a large number of simulations that comprise theOverWhelmingly Large Simulations Project, theoretical diagrams match the ob-servations. The resulting SFR is limited at high redshift by the build-up of darkmatter haloes, it reaches a broad maximum at intermediate redshift, and thendecreases at lower redshift. The decrease at late times is due to the quenching ofSF by lower cooling rates in hotter and lower density gas, in addition to gas ex-haustion and self-regulated feedback from stars and black holes. Similar results areprovided by, e.g., White & Frenk (1991), Hernquist & Springel (2003), Somervilleet al. (2008), Crain et al. (2009), and Choi & Nagamine (2009). Schaye et al.(2010) stress that without AGN feedback it is difficult to match the steep declinein the cosmic SFR below z = 2. However, it is not yet clear whether feedback frommassive stars can solve the problem. The role of stellar feedback through windsand SNe is an active topic of research at this moment.
Galaxies of different masses follow very different SF histories (Fig. 12). Lowmass galaxies have had a more uniform SFR, a fact also well captured by simula-tions (e.g., Fontanot et al. 2009; Stringer et al. 2009).

Star formation sustained by gas accretion 35
6.2 The role of mergers
Gas accretion and feedback, rather than mergers, are the primary processes re-sponsible for the evolution of the cosmic SFR density. This is clear from numericalsimulations which point out that accretion of cold gas is the dominant growthmechanism by about an order of magnitude over mergers (e.g., Wang et al. 2011;Combes 2013, see also see Sec. 1). Observations seem to favor this view too.
Galaxies at 1 < z < 3 are often clumpy disks (e.g. Glazebrook et al. 1995;Abraham et al. 1996a,b; van den Bergh et al. 1996; Cowie et al. 1995; Im et al. 1999;Elmegreen et al. 2004, 2005, 2007b, 2009; Forster Schreiber et al. 2009) with largeSFR in excess of 100 M� yr−1 (e.g., Bauer et al. 2011). If mergers were responsiblefor the enhanced star formation, observations should show double nuclei and tidalfeatures, which are indeed observed in some galaxies but not in these clumpy types(Elmegreen et al. 2007a). Unfortunately, there is no direct evidence of gas accretionin the clumpy galaxies; in one system at z=1.6, UDF 6462, the metallicity mapshows an overall value of about 0.5Z� with a central concentration and an outwarddecrease (Bournaud et al. 2008). The negative gradient is consistent with regularinside-out star formation with no excess of metal-poor gas in the inner regions.Other high-z galaxies show positive gradients, though (see Sect. 3.2 and Queyrelet al. 2012; Jones et al. 2013).
Hα emitters, detected from a flux excess in the Spitzer/IRAC 3.6-µm band,comprise more than 70 % of the galaxies with redshifts 3.8 < z < 5. Shim et al.(2013) find that the rest-frame UV to optical morphologies for half of them donot show any signs of mergers or tidal interactions. They have large Hα equivalentwidths despite their relatively old stellar population age, which suggests that Hαemitters are producing stars continuously at a constant rate, rather than throughmultiple bursts invoked by major mergers. Their continuous star formation rate,relative isolation, and number density are consistent with star formation drivenby gas infall.
Conselice et al. (2013) find that the observed merger rate alone cannot ex-plain the mass growth rate of massive galaxies (M? > 1011 M�). An additionalgas accretion of 90 M� yr−1 is needed. Such accretion would account for 36 % ofthe stellar mass growth and 58 % of the star formation in the 2 Gyr period from1.5 < z < 3. This holds for the most massive galaxies, but the need for gas ac-cretion is even more extreme for less massive galaxies. Based on HST imaging,Kaviraj et al. (2013) find that only 27 % of the star formation budget is hosted bymajor mergers. Discounting the SFR that even non-interacting galaxies have, theauthors estimate an upper limit of 15 % as the contribution of major mergers tostar formation in z ∼ 2 massive galaxies (M? > 1010 M�).
MW-like progenitors also grew by gas accretion from z = 2.5 to the present,according to van Dokkum et al. (2013). They study the mass assembly of galaxiesexpected to have present day M? ∼ 5 · 1010 M�. In marked contrast to the assem-bly history of massive ellipticals, mass growth is not limited to large radii. Themass growth takes place in a fairly uniform way, with the galaxies increasing theirmass at all radii. After z = 1 the growth in the central regions gradually stopsand the disk continues to be built up. None of these features reflect the dramaticeffects expected from major mergers.
Another indication disfavoring mergers comes from the increase of tadpole orcometary galaxies in high redshift fields. These galaxies, with a bright head on a

36 J. Sanchez Almeida
faint tail, exist in the local universe as well as at high redshift (van den Berghet al. 1996), but they are much more common at high redshift where ∼ 10 % ofthe resolved galaxies in the Hubble ultra deep field have this shape (Elmegreenet al. 2005). Local tadpoles are unusual but, surprisingly, they turn out to bevery common among extremely low metallicity dwarfs. These and other propertiesindicate that they are disk galaxies in early stages of assembly through gas accre-tion (Sects. 3.2 and 4). Low and high redshift tadpoles show a continuum in theirproperties (Elmegreen & Elmegreen 2010; Elmegreen et al. 2012b), therefore, thephysics behind them is likely to be common. High-z tadpoles may represent disksbeing formed by accretion too. Thus, the large number of tadpoles observed at highz is consistent with an increase in gas accretion to the detriment of mergers. Tad-poles are only a particular sub-set within the BCD family. The abundance of theBCD high-z counterparts, the clumpy-disk galaxies, also increases with increasingz (Elmegreen et al. 2005; Swinbank et al. 2009; Genzel et al. 2011; Wisnioski et al.2012). Therefore the arguments used for tadpoles supporting gas accretion can beextended to BCDs as well.
6.3 The cosmic web in absorption
Star formation in galaxies is self-regulated by the intimate connection betweengas mass and SFR, so that the SFR plus outflows driven by feedback tend to bal-ance the cosmic gas accretion rate (Sects. 2.1 and 2.3). These inflows and outflowscontrolling galaxy evolution show up as intervening absorption systems along thelines-of-sight to background sources, typically QSOs. They include DLAs aroundgalaxies (NHI > 1020 cm−2) as well as LLS (NHI > 1017 cm−2) and the rest ofthe Lyα forest (NHI < 1017 cm−2) (e.g., Wolfe et al. 2005; Rafelski et al. 2011;Kim et al. 2013). Numerical simulations predict Lyα column densities spanningthe range from the Lyα forest to DLAs, inflow velocities ∼ 100 km s−1, and metal-licities between 10−2.5 and 10−1 Z� (Sect. 2.4). All of these features are presentin the observed absorption systems.
DLAs are predominantly neutral gas reservoirs with metallicities that decreasewith increasing redshift. From 0 < z < 5, the relationship has a slope of -0.2 dexper unit z, a large scatter (±1 dex at a given z), and a lower limit that extends atleast to Z�/3000 (Rafelski et al. 2012, 2014; Cooke et al. 2011b). There are alsoreports of null detection at high redshift: Z < 10−4.2 Z� at z = 3.4 (Fumagalliet al. 2011a, LLS), and Z < 10−4 Z� at z = 7.1 (Simcoe et al. 2012, LLS/DLA).The α/Fe ratios of the most metal-poor DLAs are similar to those of MW halostars with metallicities below Z�/100, suggesting that DLA-like clouds may havebeen the source of gas that formed halo stars (Cooke et al. 2011a,b). A similarlyweak evolution with redshift of the metal content of the IGM had been noted byPettini et al. (2003, see also Ryan-Weber et al. 2009), who speculated that theobserved metals were created by the sources responsible for the re-ionization ofthe universe or, alternatively, by outflows from star forming galaxies at later times.
Ribaudo et al. (2011) reported an LLS at z = 0.3 with very low metallicitygas at 37 kpc from a near solar-metallicity 0.3L? star-forming galaxy. This wastaken as proof of gas infalling onto the galaxy (see the discussion in Sect. 2.4).From this and other evidence from the literature, Ribaudo et al. concluded that50 % of the LLSs have such low metallicities (a few percent Z�) and are near

Star formation sustained by gas accretion 37
(< 100 kpc) a sub-L? galaxy with solar metallicity. In a subsequent work by thisteam, also mentioned in Sect. 3.1, Lehner et al. (2013) conducted a survey of HI-selected LLSs to provide an unbiased metallicity study of the CGM at z < 1.Their main result is that the metallicity distribution of the LLS is bimodal, withone peak at low metallicity (0.025Z�) and the other at high metallicity (0.5Z�).The metal-poor gas has properties consistent with cold accretion streams, whilethe metal-rich gas likely traces winds, recycled outflows and tidally stripped gas.The behavior of the bimodal metallicity is evidence that inflows and outflows donot mix, and that outflows do not prevent inflows, in agreement with numericalsimulations (Sect. 2.3).
Multi-temperature gas in galaxy haloes has been reported too. Crighton et al.(2013) detected Lyα, deuterium, OI, and other metals in the CGM of a z = 2.5star-forming galaxy at an impact parameter of 58 kpc. Several components aredetected, one of which has low temperature (< 2 ·104 K) and metallicity (0.01Z�),which is taken as a direct detection of a high redshift cold accretion stream. TheCGM of this galaxy seems to be highly inhomogeneous. The majority of the gasis in a cool, metal-poor and predominantly neutral phase, but the majority ofthe metals are in a highly ionized phase. The multi-phase nature of the haloesis revealed in the study of a LLS at redshift ' 0.36 by Tumlinson et al. (2011).They detected high and low ionization species. The strong detected OVI seemsto arise in interface material surrounding the photoionized clouds responsible forthe low ionization absorption. A cold phase has also been found by Giavaliscoet al. (2011) in an overdensity of galaxies at z = 1.6, and by Kacprzak et al.(2012b) along the projected minor axis of a star-forming spiral galaxy at z =0.7. Low temperature is not necessarily equivalent to cold accretion. Cold gasinflow has been unambiguously observed towards 6 galaxies in the redshift range0.35 < z < 1 by Rubin et al. (2012). In this case the metallicity is supposed tobe high and so the authors infer that the material is not from the cosmic web butfrom dwarf satellites or galactic fountains.
When several lines-of-sight to QSOs are present near a galaxy, the halo gascan begin to be mapped. This is the case for two intermediate redshift galaxies,at z=0.48 and 0.78, which have multiply-lensed QSOs at projected distances of50 and 33 kpc, respectively (Chen et al. 2014). MgII absorption lines are detectedalong each of the 4 sightlines in both galaxies. A comparison of the linewidths andvelocities with that of their galaxy disks rules out a disk origin or a wind outflow.Instead, the MgII line kinematics are consistent either with infalling streams fromthe cosmic web or from tidally stripped gas.
One of the predictions of cosmic gas accretion refers to very massive galaxiesand the quenching of star formation. If a galaxy becomes too massive, the cosmicweb gas is shock-heated when entering the halo, and it takes a long time beforethe gas settles down and can be used to form new stars (Sect. 2 and Sect. 2.2).This seems to be happening in an HI absorbing complex at z = 0.7 with an impactparameter of 58 kpc from an elliptical galaxy with 1013.7 M� virial mass (Churchillet al. 2012). Ionization models suggest a cold gas structure surrounded by a hotcloud. The authors interpret the HI complex as a metal-poor filamentary structurebeing shock heated as it accretes into the halo of the galaxy.
A critically important result from cosmic Lyα absorption systems is the factthat the average neutral gas density in the universe has not changed much duringthe last 10 Gyr. From ESO UVES spectra of 122 QSOs and data from the literature,

38 J. Sanchez Almeida
Zafar et al. (2013) find a constant neutral gas mass density in the universe for 0.1 <z < 5, even though star formation varies significantly during that period (Fig. 11).At the peak SFR density (z ∼ 2), the time scale to consume all of the cosmic gasin galaxies is only 1 Gyr, therefore, the total neutral gas has to be continuouslyreplenished, partly through galaxy outflows but mostly by recombination of ionizedgas. The source of this neutral gas would be the ionized IGM that contains mostof the baryons (e.g., Fukugita & Peebles 2004).
6.4 The cosmic web in emission
The cosmic web gas is also detected in emission as Lyα blobs (LABs; Keel et al.1999; Steidel et al. 2000; Francis & McDonnell 2006; Ouchi et al. 2009). Cold-flow streams contain partly ionized gas undergoing continuous recombination andshould produce a hydrogen emission line spectrum (Sect. 2.4). Goerdt et al. (2010)determine the Lyα flux to be expected from the cold streams that fed galaxies athigh redshift. Model MW haloes at z = 2.5 have a peak Lyα surface brightnessof 2 · 10−17 erg cm−2 s−1 arcsec−2, sizes from 50 to 100 kpc, and luminosities be-tween 1043 and 1044 erg s−1. These characteristics agree with the LABs, primarilyobserved at redshifts 2 < z < 3. The number of known LABs is still not verylarge. For example, a narrow-band imaging survey with the Subaru/Suprime-Camrevealed 14 LAB candidates with a mayor axis diameter larger than 100 kpc (Mat-suda et al. 2011). Their shapes range from circular to filamentary. The LAB sampleshows a possible morphology-density relationship: filamentary LABs are in aver-age density environment while circular ones reside in both average and overdenseenvironments. Matsuda et al. point out that the more filamentary LABs may re-late to cold gas accretion and the more circular ones may relate to large scale gasoutflows.
The cosmic web gas also emits through fluorescence of Lyα photons originallyproduced by a relatively nearby source such as a powerful starburst galaxy ora luminous QSO (Cantalupo et al. 2012). Figure 13 shows the Lyα image of theUM287 nebula at z = 2.3 taken from Cantalupo et al. (2014). In the figure the neb-ula appears broadly filamentary and asymmetric, extending mostly on the easternside of QSO a up to a projected distance of about 55 arcsec or 460 kpc, which iswell beyond the virial radius of any plausibly associated dark-matter halo. There-fore the nebula traces intergalactic gas. Fluorescent Lyα photons have also beenobserved by Rauch et al. (2011) as an elongated structure at z = 3.3 with a peaksurface brightness around 10−17 erg cm−2 s−1 arcsec−2. Several of these Lyα emit-ting structures without continuum counterparts have been found by Cantalupoet al. (2012) near a hyperluminous QSO at z = 2.4.
7 Fraction of the star formation sustained by cosmic gas accretion
So far we have been citing evidence for gas accretion driving SF. The questionarises as to what is the actual contribution of this cosmic web gas to the observedSF; that is, what is the fraction of SFR in gas that has not previously been insideother stars compared to SFR in gas that has been reprocessed in the galaxy? Froma theoretical point of view, the fraction of recently accreted gas involved in star

Star formation sustained by gas accretion 39
Fig. 13 Lyα image of the UM287 nebula. The location of the radio quiet QSO UM287 islabelled with a. The colour map and the contours indicates, respectively, the Lyα surfacebrightness (upper colour scale) and the signal-to-noise ratio per square arcsec aperture (lowercolour scale). The extended emission spans a projected angular size of 55 arcsec or 460 kpc,which is well beyond the virial radius of any plausible associated dark-matter halo and thereforetraces intergalactic gas. The object marked with b is an optically faint QSO at the same redshiftz ∼ 2.3. The large distance between the two QSOs and the very broad morphology of the nebulaargue against the possibility that it originates from an interaction between the two QSO hostgalaxies. The work and the figure are from Cantalupo et al. (2014).
formation must be very high. Equation (10) shows that in a quasi-stationary statemore than half of the gas mass participating in any typical star formation eventcomes directly from cosmological infall; it is not gas ejected from previous star-formation episodes in the galaxy. Theory also tells us that the fraction dependsvery much on the galaxy tendency to lose mass through winds, so that the largerthe losses the higher the fraction of cosmological gas needed to maintain the SF.The fraction reaches 90 % for a mass loading factor w = 5 typical of a galaxywith M? ' 109 M� (see Sect. 2.3). This section collects a few estimates of thisfraction, i.e., of the percentage of star formation sustained by gas accretion. Thelist is not exhaustive but the number is limited mainly because there are only afew estimates of this parameter in the literature. In general, observations supportthe theoretical expectations, but the issue is far from settled.
Kaviraj (2014) estimate the contribution of minor mergers to the cosmic SFbudget but, in our context, minor mergers are equivalent to gas accretion events.Neither observations nor numerical simulations can easily distinguish a gas richmerger from a starless gas clump (Sect. 2). Kaviraj computes the fraction of theSFR associated with each Hubble type using a sample of 6500 SDSS-Stripe 82galaxies. He assumes that all SF in early types is due to an external gas supply,because most of their stars were formed so long ago than the debris from those stars

40 J. Sanchez Almeida
Fig. 14 Cosmic star formation budged at z < 0.07 split by morphological type. It is correctedfor Malmquist bias, therefore, they represent the SF in a fixed volume. Early-type galaxies(E/S0) account for 14 % of the SFR although they contain 50 % of the stellar mass. Takenfrom Kaviraj (2014).
render very little gas at this moment. Early types provide only 14 % of the currentSFR despite the fact that they account for 50 % of the stellar mass (Fig. 14). If twogalaxies have the same mass and the same environment, then they should havethe same cosmic gas accretion rate, independently of their Hubble type. Underthis premise, he finds that at least 21 % of the SF activity in late types is dueto accretion. Adding up the contributions from early and late types, he concludesthat at least 35 % of the star formation is due to external accretion. This figurerepresents a lower limit since it assumes that early and late types have availablesimilar gas supplies, which underestimates late type gas resources.
Conselice et al. (2013) study the mass growth of massive galaxies M? > 1011M�at 1.5 < z < 3. They estimate the evolution of stellar mass in these systems fromthe observed SFRs and the amount of stellar and gas mass added due to observedmajor and minor mergers. The measured gas mass is insufficient to maintain theinferred star formation history, and the needed additional gas mass cannot be ac-counted for by gas delivered through minor and major mergers or by recycling ofstellar ejecta. The estimates show that during this epoch, and for these massivegalaxies, 50 % of the baryonic mass assembly results from gas accretion and unre-solved mergers, 25 % is put into place through existing stars from mergers, withthe remainder of the mass in the form of gas brought in with these mergers. Asfor SF during this epoch, 66 % is the result of gas accretion.
Brisbin & Harwit (2012) model the FMR (Sect. 5.1) assuming that externalgas infall produces the observed star formation. All galaxies with M? < 2 · 1010 M�and many with masses above this threshold follow the model. They conclude thatmost of the star-forming galaxies with stellar masses M? < 2 · 1010 M�, and manywith M? > 2 · 1010 M� appear to be fed by low-metallicity gas infall.

Star formation sustained by gas accretion 41
8 What we understand, and what we do not, and pathways to followup
Numerical simulations predict that the accretion of metal-poor gas from the cosmicweb drives the growth of disk galaxies. They describe galaxies as open systemswhere gas inflows and outflows determine the gas available to form stars andtherefore the global properties of the stellar populations. Observational evidencefor gas accretion in galaxies is also numerous although indirect. The gas that fallsin or goes out is tenuous, patchy, partly ionized, multi-temperature, and largescale; therefore, it is hard to show in a single observation. A multi-wavelengthmulti-technique approach is often needed to formulate a compelling case for gasflows associated with SF. Among the many examples given in this paper, we haveselected three cases for the sake of illustration: (1) the short gas consumptiontime-scale compared to the long SF record in most galaxies (Sect. 3.1), (2) themetallicity-SFR relationship, so that at a given stellar mass, the larger the currentSFR the lower the metallicity of the gas producing stars (Sect. 5.1), and (3) thelarge amount of gas hundreds of kpc away from galaxies but with properties relatedto the closest neighboring galaxy (Sects. 3.1 and 6.3).
The global picture of the interplay between cosmic gas accretion and starformation seems to be understood at a basic level (Sect. 2). In the long term,the gas accretion rate has to balance the SFR since the gas available to formstars is consumed quickly. This balance is self-adjusted by the galaxy modifyingthe mass of gas available to form stars which, through the KS relation, sets theSFR. The details of the process remain to be worked out, though. They depend onthe coupling between physical processes that involve completely different physicalscales: from cosmic web structures to molecular clouds and AGN engines.
Many ingredients needed to complete the observational picture remain to begathered and understood. For example, the large-scale of the gas in the cosmicweb should be imaged. Emission has been detected with 10-m class telescopes inLyα at high redshift, but it may also be observable in Hα in the local universe.Using SFR as a proxy for gas accretion rate, star-forming galaxies can be usedto map the gas accretion rate in the universe, near and far. The FMR provides adiagnostic potential that has not been fully exploited yet. Assuming that it is setby cosmic gas infall triggering SF (Sect. 5.1), it allows us to measure various keyparameters in galaxy formation including mass loading factors and metallicity ofthe accreted gas. This is a venue to be explored very much in the vein of the workby Forbes et al. (2013). The neutral gas inflow rate directly observed as HVCsin the MW is one order of magnitude smaller than that required to maintain theSFR (Sect. 3.1). This poses a problem. Several possibilities have been explored(e.g., Sancisi et al. 2008; Joung et al. 2012) but the issue has not been settled yet.Details of the interaction between a cold metal-poor gas stream and a galaxy diskremain to be modeled. Predictions on how this interplay excites starbursts andtheir metallicities are needed to secure our understand of the FMR (Sect. 5.1).Outflows from dwarfs seem to be the main source of metals in the IGM. How-ever the mixing processes of these outflows with the IGM are poorly captured bynumerical simulations. The cooling of halo gas onto supernova debris in galacticfountains has also been suggested as a source of the metal-poor gas driving SF inthe MW and other galaxies (Sect. 2.3). Can this possibility be proved or disproved?Cosmic web gas might also be detected through the Sunyaev-Zeldovich effect im-

42 J. Sanchez Almeida
Table 1 List of main acronyms and symbols defined and used along the text
Acronym Expansion
AGN Active galactic nucleusBCD Blue compact dwarfBH Black holeCGM Circum galactic mediumDM Dark matterDLA Damped Lyman-α absorbersFMR Fundamental metallicity relationshipHVC High velocity cloudsIGM Intergalactic mediumISM Interstellar mediumIMF Initial mass functionKS Kennicutt-SchmidtΛCDM Λ cold dark matterLAB Lyman α blobsLLS Lyman limit systemsM? Stellar massMg Gas massMhalo Dark matter halo massMW Milky WayQBCD Quiescent blue compact dwarfQSO QuasarSF Star formationSFR Star formation rateSN, SNe Supernova, SupernovaeSPH Smoothed particle hydrodynamicsUV Ultravioletw Mass loading factorXMP Extremely metal poorz RedshiftZ Metallicity
printed on the Cosmic Microwave Background; this is a promising technique underdevelopment now (e.g., Genova-Santos et al. 2013, and references therein).
These and other future research programs will contribute to our understand-ing of cosmic accretion. They will eventually complete the picture that has beenemerging over the last few years, in which cosmic gas accretion plays a fundamentalrole in sustaining star formation in disk galaxies.
Acknowledgements Daniel Ceverino helped us in dissecting the predictions of the cosmo-logical numerical simulations, and Sects. 2.2 and 2.4 owe much to his patience. Discussionswith Claudio Dalla Vecchia were also fundamental for the development of many aspects of thework. Thanks are due to Mercedes Filho for discussions and clarifications on the HI contentof galaxies, and to Practika Dayal, Martin Harwit, and Simon Lilly for discussions on mod-eling the FMR. Fernando Atrio pointed out the work to image the cosmic web through theSunyaev-Zeldovich effect. We are grateful to Joss Bland-Hawthorn, Filippo Fraternali, JairoMendez-Abreu, and Max Pettini for comments on the manuscript. We acknowledge the inten-sive use of the NASA Astrophysics Data System (ADS), including Private Libraries.The workhas been partly funded by the Spanish MINECO, project AYA 2010-21887-C04-04 and SeveroOchoa program SEV-2011-0187. Figures 6 and 7 have been reproduced with permission of theAAS, and Figs. 5 and 8 with permission of ESO.

Star formation sustained by gas accretion 43
References
Abazajian, K. N., Adelman-McCarthy, J. K., Agueros, M. A., et al. 2009, ApJS,182, 543
Abraham, R. G., Tanvir, N. R., Santiago, B. X., et al. 1996a, MNRAS, 279, L47Abraham, R. G., van den Bergh, S., Glazebrook, K., et al. 1996b, ApJS, 107, 1Algorry, D. G., Navarro, J. F., Abadi, M. G., et al. 2014, MNRAS, 437, 3596Aloisi, A., Clementini, G., Tosi, M., et al. 2007, ApJ, 667, L151Altay, G., Theuns, T., Schaye, J., Booth, C. M., & Dalla Vecchia, C. 2013, MN-
RAS, 436, 2689Amorın, R., Aguerri, J. A. L., Munoz-Tunon, C., & Cairos, L. M. 2009, A&A, 501,
75Amorın, R., Perez-Montero, E., Vılchez, J. M., & Papaderos, P. 2012a, ApJ, 749,
185Amorın, R., Vılchez, J. M., Hagele, G. F., et al. 2012b, ApJ, 754, L22Amorın, R. O., Munoz-Tunon, C., Aguerri, J. A. L., Cairos, L. M., & Caon, N.
2007, A&A, 467, 541Amorın, R. O., Perez-Montero, E., & Vılchez, J. M. 2010, ApJ, 715, L128Andrews, B. H. & Martini, P. 2013, ApJ, 765, 140Angus, G. W., Diaferio, A., & Kroupa, P. 2011, MNRAS, 416, 1401Ashley, T., Simpson, C. E., & Elmegreen, B. G. 2013, AJ, 146, 42Audouze, J. & Silk, J. 1995, ApJ, 451, L49Balcells, M. & Quinn, P. J. 1990, ApJ, 361, 381Baldwin, J. E., Lynden-Bell, D., & Sancisi, R. 1980, MNRAS, 193, 313Bauer, A. E., Conselice, C. J., Perez-Gonzalez, P. G., et al. 2011, MNRAS, 417,
289Bellazzini, M., Oosterloo, T., Fraternali, F., & Beccari, G. 2013, A&A, 559, L11Benson, A. J. 2010, Physics Reports, 495, 33Bi, H. G., Boerner, G., & Chu, Y. 1992, A&A, 266, 1Binney, J. 1977, ApJ, 215, 483Binney, J. 2013, NewAR, 57, 29Birnboim, Y. & Dekel, A. 2003, MNRAS, 345, 349Bland-Hawthorn, J., Sutherland, R., Agertz, O., & Moore, B. 2007, ApJ, 670,
L109Blasco-Herrera, J., Fathi, K., Ostlin, G., Font, J., & Beckman, J. E. 2013, MNRAS,
435, 1958Blitz, L., Spergel, D. N., Teuben, P. J., Hartmann, D., & Burton, W. B. 1999,
ApJ, 514, 818Borde, A., Palanque-Delabrouille, N., Rossi, G., et al. 2014, ArXiv e-printsBothwell, M. S., Maiolino, R., Kennicutt, R., et al. 2013, MNRAS, 433, 1425Bouche, N., Murphy, M. T., Kacprzak, G. G., et al. 2013, Science, 341, 50Bournaud, F., Combes, F., Jog, C. J., & Puerari, I. 2005, A&A, 438, 507Bournaud, F., Daddi, E., Elmegreen, B. G., et al. 2008, A&A, 486, 741Bournaud, F. & Elmegreen, B. G. 2009, ApJ, 694, L158Bouwens, R. J., Illingworth, G. D., Franx, M., et al. 2009, ApJ, 705, 936Bouwens, R. J., Illingworth, G. D., Labbe, I., et al. 2011, Nature, 469, 504Bouwens, R. J., Illingworth, G. D., Oesch, P. A., et al. 2010, ApJ, 709, L133Bregman, J. N., Miller, E. D., Seitzer, P., Cowley, C. R., & Miller, M. J. 2013,
ApJ, 766, 57

44 J. Sanchez Almeida
Bresolin, F., Kennicutt, R. C., & Ryan-Weber, E. 2012, ApJ, 750, 122Brisbin, D. & Harwit, M. 2012, ApJ, 750, 142Bromm, V. & Larson, R. B. 2004, ARA&A, 42, 79Brook, C. B., Stinson, G., Gibson, B. K., et al. 2013, ArXiv e-printsBrooks, A. M., Governato, F., Quinn, T., Brook, C. B., & Wadsley, J. 2009, ApJ,
694, 396Burchett, J. N., Tripp, T. M., Werk, J. K., et al. 2013, ApJ, 779, L17Caimmi, R. 2008, NewA, 13, 314Cairos, L. M., Caon, N., Papaderos, P., et al. 2003, ApJ, 593, 312Cantalupo, S., Arrigoni-Battaia, F., Prochaska, J. X., Hennawi, J. F., & Madau,
P. 2014, Nature, 506, 63Cantalupo, S., Lilly, S. J., & Haehnelt, M. G. 2012, MNRAS, 425, 1992Cardamone, C., Schawinski, K., Sarzi, M., et al. 2009, MNRAS, 399, 1191Ceverino, D., Dekel, A., & Bournaud, F. 2010, MNRAS, 404, 2151Ceverino, D., Dekel, A., Mandelker, N., et al. 2012, MNRAS, 420, 3490Chen, C.-T. J., Hickox, R. C., Alberts, S., et al. 2013, ApJ, 773, 3Chen, H.-W., Gauthier, J.-R., Sharon, K., et al. 2014, MNRAS, 438, 1435Choi, J.-H. & Nagamine, K. 2009, MNRAS, 393, 1595Chung, A., Bureau, M., van Gorkom, J. H., & Koribalski, B. 2012, MNRAS, 422,
1083Churchill, C. W., Kacprzak, G. G., Steidel, C. C., et al. 2012, ApJ, 760, 68Churchill, C. W., Trujillo-Gomez, S., Nielsen, N. M., & Kacprzak, G. G. 2013,
ApJ, 779, 87Cid Fernandes, R. 2007, in IAU Symposium, Vol. 241, IAU Symposium, ed.
A. Vazdekis & R. Peletier, 461–469Coccato, L., Morelli, L., Corsini, E. M., et al. 2011, MNRAS, 412, L113Codis, S., Pichon, C., Devriendt, J., et al. 2012, MNRAS, 427, 3320Combes, F. 2008, in IAU Symposium, Vol. 245, IAU Symposium, ed. M. Bureau,
E. Athanassoula, & B. Barbuy, 151–160Combes, F. 2013, Memorie della Societa Astronomica Italiana Supplementi, 25,
45Combes, F. 2014, in Astronomical Society of the Pacific Conference Series, Vol.
480, Astronomical Society of the Pacific Conference Series, ed. M. S. Seigar &P. Treuthardt, 211
Combes, F., Moiseev, A., & Reshetnikov, V. 2013, A&A, 554, A11Conselice, C. J., Mortlock, A., Bluck, A. F. L., Grutzbauch, R., & Duncan, K.
2013, MNRAS, 430, 1051Cooke, R., Pettini, M., Steidel, C. C., Rudie, G. C., & Jorgenson, R. A. 2011a,
MNRAS, 412, 1047Cooke, R., Pettini, M., Steidel, C. C., Rudie, G. C., & Nissen, P. E. 2011b, MN-
RAS, 417, 1534Corbin, M. R., Vacca, W. D., Cid Fernandes, R., et al. 2006, ApJ, 651, 861Corsini, E. M., Mendez-Abreu, J., Pastorello, N., et al. 2012, MNRAS, 423, L79Cowie, L. L., Hu, E. M., & Songaila, A. 1995, AJ, 110, 1576Crain, R. A., Theuns, T., Dalla Vecchia, C., et al. 2009, MNRAS, 399, 1773Cresci, G., Mannucci, F., Maiolino, R., et al. 2010, Nature, 467, 811Crighton, N. H. M., Hennawi, J. F., & Prochaska, J. X. 2013, ApJ, 776, L18Cullen, F., Cirasuolo, M., McLure, R. J., Dunlop, J. S., & Bowler, R. A. A. 2014,
MNRAS, 440, 2300

Star formation sustained by gas accretion 45
Dave, R., Finlator, K., & Oppenheimer, B. D. 2012, MNRAS, 421, 98Dave, R., Katz, N., Oppenheimer, B. D., Kollmeier, J. A., & Weinberg, D. H.
2013, MNRAS, 434, 2645Davidson, K., Kinman, T. D., & Friedman, S. D. 1989, AJ, 97, 1591Dayal, P., Ferrara, A., & Dunlop, J. S. 2013, MNRAS, 430, 2891de Avillez, M. A. & Mac Low, M.-M. 2002, ApJ, 581, 1047Dekel, A. & Birnboim, Y. 2006, MNRAS, 368, 2Dekel, A., Birnboim, Y., Engel, G., et al. 2009, Nature, 457, 451Dekel, A., Zolotov, A., Tweed, D., et al. 2013, MNRAS, 435, 999Diaz, J. D. & Bekki, K. 2012, ApJ, 750, 36Dickey, J. M. & Lockman, F. J. 1990, ARA&A, 28, 215Dohm-Palmer, R. C., Skillman, E. D., Gallagher, J., et al. 1998, AJ, 116, 1227Dubois, Y., Pichon, C., Welker, C., et al. 2014, ArXiv e-printsEdmunds, M. 2005, Astronomy and Geophysics, 46, 040000Edmunds, M. G. 1990, MNRAS, 246, 678Edmunds, M. G. & Greenhow, R. M. 1995, MNRAS, 272, 241Ekta, Chengalur, J. N., & Pustilnik, S. A. 2006, MNRAS, 372, 853Ekta, B. & Chengalur, J. N. 2010, MNRAS, 403, 295Ellison, S. L., Patton, D. R., Simard, L., & McConnachie, A. W. 2008, ApJ, 672,
L107Elmegreen, B. G., Bournaud, F., & Elmegreen, D. M. 2008, ApJ, 688, 67Elmegreen, B. G. & Elmegreen, D. M. 2010, ApJ, 722, 1895Elmegreen, B. G., Zhang, H.-X., & Hunter, D. A. 2012a, ApJ, 747, 105Elmegreen, D. M., Elmegreen, B. G., Ferguson, T., & Mullan, B. 2007a, ApJ, 663,
734Elmegreen, D. M., Elmegreen, B. G., Marcus, M. T., et al. 2009, ApJ, 701, 306Elmegreen, D. M., Elmegreen, B. G., Ravindranath, S., & Coe, D. A. 2007b, ApJ,
658, 763Elmegreen, D. M., Elmegreen, B. G., Rubin, D. S., & Schaffer, M. A. 2005, ApJ,
631, 85Elmegreen, D. M., Elmegreen, B. G., Sanchez Almeida, J., et al. 2012b, ApJ, 750,
95Elmegreen, D. M., Elmegreen, B. G., & Sheets, C. M. 2004, ApJ, 603, 74Fardal, M. A., Katz, N., Gardner, J. P., et al. 2001, ApJ, 562, 605Faucher-Giguere, C.-A. & Keres, D. 2011, MNRAS, 412, L118Faucher-Giguere, C.-A., Keres, D., & Ma, C.-P. 2011, MNRAS, 417, 2982Feldmann, R. 2013, MNRAS, 433, 1910Filho, M. E., Winkel, B., Sanchez Almeida, J., et al. 2013, A&A, 558, A18Finkelman, I., Moiseev, A., Brosch, N., & Katkov, I. 2011, MNRAS, 418, 1834Finlator, K. & Dave, R. 2008, MNRAS, 385, 2181Font, A. S., McCarthy, I. G., Crain, R. A., et al. 2011, MNRAS, 416, 2802Fontanot, F., De Lucia, G., Monaco, P., Somerville, R. S., & Santini, P. 2009,
MNRAS, 397, 1776Forbes, J. C., Krumholz, M. R., Burkert, A., & Dekel, A. 2013, ArXiv e-printsForbes, J. C., Krumholz, M. R., Burkert, A., & Dekel, A. 2014, MNRAS, 438, 1552Ford, A. B., Dave, R., Oppenheimer, B. D., et al. 2013, ArXiv e-printsForster Schreiber, N. M., Genzel, R., Bouche, N., et al. 2009, ApJ, 706, 1364Fox, A. J., Wakker, B. P., Barger, K. A., et al. 2014, ArXiv e-printsFrancis, P. J. & McDonnell, S. 2006, MNRAS, 370, 1372

46 J. Sanchez Almeida
Fraternali, F. 2014, in IAU Symposium, Vol. 298, IAU Symposium, ed. S. Feltzing,G. Zhao, N. A. Walton, & P. Whitelock, 228–239
Fraternali, F. & Tomassetti, M. 2012, MNRAS, 426, 2166Fu, J., Kauffmann, G., Huang, M.-l., et al. 2013, MNRAS, 434, 1531Fukugita, M. & Peebles, P. J. E. 2004, ApJ, 616, 643Fumagalli, M., O’Meara, J. M., & Prochaska, J. X. 2011a, Science, 334, 1245Fumagalli, M., Prochaska, J. X., Kasen, D., et al. 2011b, MNRAS, 418, 1796Gallazzi, A., Charlot, S., Brinchmann, J., White, S. D. M., & Tremonti, C. A.
2005, MNRAS, 362, 41Garnett, D. R. 2002, ApJ, 581, 1019Genel, S., Dekel, A., & Cacciato, M. 2012a, MNRAS, 425, 788Genel, S., Naab, T., Genzel, R., et al. 2012b, ApJ, 745, 11Genova-Santos, R., Suarez-Velasquez, I., Atrio-Barandela, F., & Mucket, J. P.
2013, MNRAS, 432, 2480Genzel, R., Newman, S., Jones, T., et al. 2011, ApJ, 733, 101Genzel, R., Tacconi, L. J., Gracia-Carpio, J., et al. 2010, MNRAS, 407, 2091Giavalisco, M., Vanzella, E., Salimbeni, S., et al. 2011, ApJ, 743, 95Glazebrook, K., Ellis, R., Santiago, B., & Griffiths, R. 1995, MNRAS, 275, L19Gnedin, N. Y., Tasker, E. J., & Fujimoto, Y. 2014, ApJ, 787, L7Goerdt, T. & Burkert, A. 2013, ArXiv e-printsGoerdt, T., Dekel, A., Sternberg, A., et al. 2010, MNRAS, 407, 613Guo, Q., White, S., Boylan-Kolchin, M., et al. 2011, MNRAS, 413, 101Gupta, A., Mathur, S., Krongold, Y., Nicastro, F., & Galeazzi, M. 2012, ApJ, 756,
L8Hallenbeck, G., Papastergis, E., Huang, S., et al. 2012, AJ, 144, 87Harris, J., Calzetti, D., Gallagher, III, J. S., Smith, D. A., & Conselice, C. J. 2004,
ApJ, 603, 503Haurberg, N. C., Rosenberg, J., & Salzer, J. J. 2013, ApJ, 765, 66Haynes, M. P. 2007, Nuovo Cimento B Serie, 122, 1109Haynes, M. P. 2008, in IAU Symposium, Vol. 244, IAU Symposium, ed. J. I. Davies
& M. J. Disney, 83–92Haynes, M. P., Giovanelli, R., & Chincarini, G. L. 1984, ARA&A, 22, 445Heald, G., Jozsa, G., Serra, P., et al. 2011, A&A, 526, A118Heavens, A., Panter, B., Jimenez, R., & Dunlop, J. 2004, Nature, 428, 625Hernandez, A. K., Wakker, B. P., Benjamin, R. A., et al. 2013, ApJ, 777, 19Hernquist, L., Katz, N., Weinberg, D. H., & Miralda-Escude, J. 1996, ApJ, 457,
L51Hernquist, L. & Springel, V. 2003, MNRAS, 341, 1253Hidalgo, S. L., Aparicio, A., Skillman, E., et al. 2011, ApJ, 730, 14Hobbs, A., Read, J., Power, C., & Cole, D. 2013, MNRAS, 434, 1849Hopkins, P. F., Keres, D., Onorbe, J., et al. 2013a, ArXiv e-printsHopkins, P. F., Keres, D., & Murray, N. 2013b, MNRAS, 432, 2639Hughes, T. M., Cortese, L., Boselli, A., Gavazzi, G., & Davies, J. I. 2013, A&A,
550, A115Husemann, B., Wisotzki, L., Jahnke, K., & Sanchez, S. F. 2011, A&A, 535, A72Im, M., Griffiths, R. E., Naim, A., et al. 1999, ApJ, 510, 82Immeli, A., Samland, M., Westera, P., & Gerhard, O. 2004, ApJ, 611, 20Izotov, Y. I., Chaffee, F. H., Foltz, C. B., et al. 1999, ApJ, 527, 757Izotov, Y. I., Guseva, N. G., Fricke, K. J., & Papaderos, P. 2009, A&A, 503, 61

Star formation sustained by gas accretion 47
Izotov, Y. I., Guseva, N. G., & Thuan, T. X. 2011, ApJ, 728, 161Izotov, Y. I., Thuan, T. X., & Guseva, N. G. 2005, ApJ, 632, 210Jia Liang, C. & Chen, H.-W. 2014, ArXiv e-printsJohnson, M., Hunter, D. A., Oh, S.-H., et al. 2012, AJ, 144, 152Jones, T., Ellis, R. S., Richard, J., & Jullo, E. 2013, ApJ, 765, 48Joung, M. R., Putman, M. E., Bryan, G. L., Fernandez, X., & Peek, J. E. G. 2012,
ApJ, 759, 137Kacprzak, G. G. & Churchill, C. W. 2011, ApJ, 743, L34Kacprzak, G. G., Churchill, C. W., & Nielsen, N. M. 2012a, ApJ, 760, L7Kacprzak, G. G., Churchill, C. W., Steidel, C. C., Spitler, L. R., & Holtzman,
J. A. 2012b, MNRAS, 427, 3029Kamphuis, P., Rand, R. J., Jozsa, G. I. G., et al. 2013, MNRAS, 434, 2069Kannappan, S. J. 2004, ApJ, 611, L89Kannappan, S. J., Stark, D. V., Eckert, K. D., et al. 2013, ApJ, 777, 42Kaviraj, S. 2014, MNRAS, 437, L41Kaviraj, S., Cohen, S., Windhorst, R. A., et al. 2013, MNRAS, 429, L40Keel, W. C., Cohen, S. H., Windhorst, R. A., & Waddington, I. 1999, AJ, 118,
2547Kennicutt, R. C. & Evans, N. J. 2012, ARA&A, 50, 531Kennicutt, Jr., R. C. 1983, ApJ, 272, 54Kennicutt, Jr., R. C. 1998, ApJ, 498, 541Keres, D., Katz, N., Fardal, M., Dave, R., & Weinberg, D. H. 2009, MNRAS, 395,
160Keres, D., Katz, N., Weinberg, D. H., & Dave, R. 2005, MNRAS, 363, 2Keres, D., Vogelsberger, M., Sijacki, D., Springel, V., & Hernquist, L. 2012, MN-
RAS, 425, 2027Kim, T.-S., Partl, A. M., Carswell, R. F., & Muller, V. 2013, A&A, 552, A77Koleva, M., De Rijcke, S., Zeilinger, W. W., et al. 2014, MNRAS, 441, 452Koppen, J. & Hensler, G. 2005, A&A, 434, 531Kormendy, J. 2013, Secular Evolution in Disk Galaxies, ed. J. Falcon-Barroso &
J. H. Knapen, 1Kravtsov, A. V. 2013, ApJ, 764, L31Kravtsov, A. V. & Borgani, S. 2012, ARA&A, 50, 353Kreckel, K., Peebles, P. J. E., van Gorkom, J. H., van de Weygaert, R., & van der
Hulst, J. M. 2011, AJ, 141, 204Krumholz, M. R., Dekel, A., & McKee, C. F. 2012, ApJ, 745, 69Kunth, D. & Lebouteiller, V. 2011, in EAS Publications Series, Vol. 48, EAS
Publications Series, ed. M. Koleva, P. Prugniel, & I. Vauglin, 95–96Kunth, D. & Ostlin, G. 2000, A&ARev, 10, 1Kunth, D. & Sargent, W. L. W. 1986, ApJ, 300, 496Lackner, C. N., Cen, R., Ostriker, J. P., & Joung, M. R. 2012, MNRAS, 425, 641Laigle, C., Pichon, C., Codis, S., et al. 2013, ArXiv e-printsLara-Lopez, M. A., Cepa, J., Bongiovanni, A., et al. 2010, A&A, 521, L53Larson, R. B. 1972, Nature Physical Science, 236, 7Latif, M. A., Schleicher, D. R. G., Spaans, M., & Zaroubi, S. 2011, MNRAS, 413,
L33Lebouteiller, V., Heap, S., Hubeny, I., & Kunth, D. 2013, A&A, 553, A16Lebouteiller, V., Kunth, D., Thuan, T. X., & Desert, J. M. 2009, A&A, 494, 915Lee, H., Bell, E. F., & Somerville, R. S. 2008, in IAU Symposium, Vol. 255, IAU

48 J. Sanchez Almeida
Symposium, ed. L. K. Hunt, S. C. Madden, & R. Schneider, 100–105Lehner, N. & Howk, J. C. 2011, Science, 334, 955Lehner, N., Howk, J. C., Tripp, T. M., et al. 2013, ApJ, 770, 138Leitner, S. N. & Kravtsov, A. V. 2011, ApJ, 734, 48Lelli, F., Verheijen, M., Fraternali, F., & Sancisi, R. 2012a, A&A, 537, A72Lelli, F., Verheijen, M., Fraternali, F., & Sancisi, R. 2012b, A&A, 544, A145Lemonias, J. J., Schiminovich, D., Thilker, D., et al. 2011, ApJ, 733, 74Levesque, E. M., Berger, E., Soderberg, A. M., & Chornock, R. 2011, ApJ, 739,
23L’Huillier, B., Combes, F., & Semelin, B. 2012, A&A, 544, A68Li, Y., Bresolin, F., & Kennicutt, Jr., R. C. 2013, ApJ, 766, 17Li, Y.-S. & Helmi, A. 2008, MNRAS, 385, 1365Libeskind, N. I., Knebe, A., Hoffman, Y., et al. 2011, MNRAS, 411, 1525Lilly, S. J., Carollo, C. M., Pipino, A., Renzini, A., & Peng, Y. 2013, ApJ, 772,
119Lilly, S. J., Le Fevre, O., Hammer, F., & Crampton, D. 1996, ApJ, 460, L1Lopez-Corredoira, M., Betancort-Rijo, J., & Beckman, J. E. 2002, A&A, 386, 169Lopez-Sanchez, A. R., Koribalski, B. S., van Eymeren, J., et al. 2012, MNRAS,
419, 1051Lovell, M. R., Eke, V. R., Frenk, C. S., & Jenkins, A. 2011, MNRAS, 413, 3013Ly, C., Malkan, M. A., Nagao, T., et al. 2014, ApJ, 780, 122Lynden-Bell, D. 1975, Vistas in Astronomy, 19, 299Lynden-Bell, D. 1983, in IAU Symposium, Vol. 100, Internal Kinematics and Dy-
namics of Galaxies, ed. E. Athanassoula, 89–91Madau, P. & Dickinson, M. 2014, ArXiv e-printsMadau, P., Ferguson, H. C., Dickinson, M. E., et al. 1996, MNRAS, 283, 1388Magrini, L., Corbelli, E., & Galli, D. 2007, A&A, 470, 843Mannucci, F., Cresci, G., Maiolino, R., Marconi, A., & Gnerucci, A. 2010, MNRAS,
408, 2115Marasco, A. & Fraternali, F. 2011, A&A, 525, A134Marasco, A., Fraternali, F., & Binney, J. J. 2012, MNRAS, 419, 1107Marasco, A., Marinacci, F., & Fraternali, F. 2013, MNRAS, 433, 1634Marinacci, F., Binney, J., Fraternali, F., et al. 2010, MNRAS, 404, 1464Martınez-Delgado, D., Gabany, R. J., Crawford, K., et al. 2010, AJ, 140, 962Martinkus, C., Cannon, J. M., Adams, E. A., et al. 2014, in American Astronomical
Society Meeting Abstracts, Vol. 223, American Astronomical Society MeetingAbstracts, 246.51
Mas-Hesse, J. M. & Kunth, D. 1999, A&A, 349, 765Mastropietro, C., Moore, B., Mayer, L., Wadsley, J., & Stadel, J. 2005, MNRAS,
363, 509Mathewson, D. S., Cleary, M. N., & Murray, J. D. 1974, ApJ, 190, 291Matsuda, Y., Yamada, T., Hayashino, T., et al. 2011, MNRAS, 410, L13Matthews, L. D., van Driel, W., & Gallagher, III, J. S. 1998, AJ, 116, 1169McQuinn, K. B. W., Skillman, E. D., Cannon, J. M., et al. 2010a, ApJ, 721, 297McQuinn, K. B. W., Skillman, E. D., Cannon, J. M., et al. 2010b, ApJ, 724, 49Melioli, C., Brighenti, F., D’Ercole, A., & de Gouveia Dal Pino, E. M. 2008,
MNRAS, 388, 573Miskolczi, A., Bomans, D. J., & Dettmar, R.-J. 2011, A&A, 536, A66Moffett, A. J., Kannappan, S. J., Baker, A. J., & Laine, S. 2012, ApJ, 745, 34
Star formation sustained by gas accretion 49
Moiseev, A. V., Smirnova, K. I., Smirnova, A. A., & Reshetnikov, V. P. 2011,MNRAS, 418, 244
Morales-Luis, A. B., Sanchez Almeida, J., Aguerri, J. A. L., & Munoz-Tunon, C.2011, ApJ, 743, 77
Moran, S. M., Heckman, T. M., Kauffmann, G., et al. 2012, ApJ, 745, 66Muller, C. A. & Oort, J. H. 1951, Nature, 168, 357Munoz-Tunon, C., Sanchez Almeida, J., Elmegreen, D. M., & Elmegreen, B. G.
2014, ArXiv e-printsMuratov, A. L., Gnedin, O. Y., Gnedin, N. Y., & Zemp, M. 2013, ApJ, 772, 106Nelson, D., Vogelsberger, M., Genel, S., et al. 2013, MNRAS, 429, 3353Nichols, M., Colless, J., Colless, M., & Bland-Hawthorn, J. 2011, ApJ, 742, 110Nidever, D. L., Ashley, T., Slater, C. T., et al. 2013, ApJ, 779, L15Noguchi, M. 1999, ApJ, 514, 77Ocvirk, P., Pichon, C., & Teyssier, R. 2008, MNRAS, 390, 1326Oesch, P. A., Bouwens, R. J., Illingworth, G. D., et al. 2010, ApJ, 709, L16Oort, J. H. 1966, BAIN, 18, 421Oosterloo, T. A., Heald, G. H., & de Blok, W. J. G. 2013, A&A, 555, L7Oppenheimer, B. D., Dave, R., Katz, N., Kollmeier, J. A., & Weinberg, D. H.
2012, MNRAS, 420, 829Ouchi, M., Ono, Y., Egami, E., et al. 2009, ApJ, 696, 1164Ouchi, M., Shimasaku, K., Okamura, S., et al. 2004, ApJ, 611, 685Papaderos, P., Guseva, N. G., Izotov, Y. I., & Fricke, K. J. 2008, A&A, 491, 113Papaderos, P., Loose, H.-H., Thuan, T. X., & Fricke, K. J. 1996, A&AS, 120, 207Peeples, M. S. & Shankar, F. 2011, MNRAS, 417, 2962Peng, Y.-j. & Maiolino, R. 2014, MNRAS, 438, 262Perez-Montero, E., Contini, T., Lamareille, F., et al. 2013, A&A, 549, A25Pettini, M., Madau, P., Bolte, M., et al. 2003, ApJ, 594, 695Pichon, C., Pogosyan, D., Kimm, T., et al. 2011, MNRAS, 418, 2493Pilyugin, L. S., Vılchez, J. M., & Contini, T. 2004, A&A, 425, 849Pisano, D. J. 2014, AJ, 147, 48Pisano, D. J., Wilcots, E. M., & Elmegreen, B. G. 1998, AJ, 115, 975Pizzella, A., Morelli, L., Corsini, E. M., Dalla Bonta, E., & Cesetti, M. 2013, A&A,
560, A14Popping, A. & Braun, R. 2011a, A&A, 533, A122Popping, A. & Braun, R. 2011b, A&A, 527, A90Powell, L. C., Slyz, A., & Devriendt, J. 2011, MNRAS, 414, 3671Prada, F., Gutierrez, C. M., Peletier, R. F., & McKeith, C. D. 1996, ApJ, 463, L9Queyrel, J., Contini, T., Kissler-Patig, M., et al. 2012, A&A, 539, A93Rafelski, M., Neeleman, M., Fumagalli, M., Wolfe, A. M., & Prochaska, J. X. 2014,
ApJ, 782, L29Rafelski, M., Wolfe, A. M., & Chen, H.-W. 2011, ApJ, 736, 48Rafelski, M., Wolfe, A. M., Prochaska, J. X., Neeleman, M., & Mendez, A. J. 2012,
ApJ, 755, 89Rauch, M., Becker, G. D., Haehnelt, M. G., et al. 2011, MNRAS, 418, 1115Reddy, N. A., Pettini, M., Steidel, C. C., et al. 2012, ApJ, 754, 25Rees, M. J. & Ostriker, J. P. 1977, MNRAS, 179, 541Reichard, T. A., Heckman, T. M., Rudnick, G., et al. 2009, ApJ, 691, 1005Ribaudo, J., Lehner, N., Howk, J. C., et al. 2011, ApJ, 743, 207Richter, P. 2012, ApJ, 750, 165

50 J. Sanchez Almeida
Robertson, P., Shields, G. A., Dave, R., Blanc, G. A., & Wright, A. 2013, ApJ,773, 4
Rosdahl, J. & Blaizot, J. 2012, MNRAS, 423, 344Roskar, R., Debattista, V. P., Brooks, A. M., et al. 2010, MNRAS, 408, 783Rubin, K. H. R., Prochaska, J. X., Koo, D. C., & Phillips, A. C. 2012, ApJ, 747,
L26Ryan-Weber, E. V., Pettini, M., Madau, P., & Zych, B. J. 2009, MNRAS, 395,
1476Sadoun, R., Mohayaee, R., & Colin, J. 2013, ArXiv e-printsSanchez, S. F., Rosales-Ortega, F. F., Iglesias-Paramo, J., et al. 2014, A&A, 563,
A49Sanchez Almeida, J., Aguerri, J. A. L., Munoz-Tunon, C., & Vazdekis, A. 2009,
ApJ, 698, 1497Sanchez Almeida, J., Morales-Luis, A. B., Munoz-Tunon, C., et al. 2014, ApJ, 783,
45Sanchez Almeida, J., Munoz-Tunon, C., Amorın, R., et al. 2008, ApJ, 685, 194Sanchez Almeida, J., Munoz-Tunon, C., Elmegreen, D. M., Elmegreen, B. G., &
Mendez-Abreu, J. 2013, ApJ, 767, 74Sanchez Almeida, J., Terlevich, R., Terlevich, E., Cid Fernandes, R., & Morales-
Luis, A. B. 2012, ApJ, 756, 163Sancisi, R., Fraternali, F., Oosterloo, T., & van der Hulst, T. 2008, A&ARev, 15,
189Santini, P. 2011, Journal of Physics Conference Series, 280, 012007Sargent, W. L. W. & Searle, L. 1970, ApJ, 162, L155Schaye, J. 2001, ApJ, 559, 507Schaye, J., Dalla Vecchia, C., Booth, C. M., et al. 2010, MNRAS, 402, 1536Schechter, P. 1976, ApJ, 203, 297Schmidt, M. 1959, ApJ, 129, 243Schmidt, M. 1963, ApJ, 137, 758Schmidt, P., Jozsa, G. I. G., Gentile, G., et al. 2014, A&A, 561, A28Schonrich, R. & Binney, J. 2009, MNRAS, 396, 203Semelin, B. & Combes, F. 2005, A&A, 441, 55Shen, S., Madau, P., Aguirre, A., et al. 2012, ApJ, 760, 50Shim, H., Chary, R.-R., Dickinson, M., et al. 2013, in Astronomical Society of the
Pacific Conference Series, Vol. 477, Astronomical Society of the Pacific Confer-ence Series, ed. W.-H. Sun, C. K. Xu, N. Z. Scoville, & D. B. Sanders, 185
Shlosman, I. 2013, Cosmological Evolution of Galaxies, ed. J. Falcon-Barroso &J. H. Knapen, 555
Sijacki, D., Vogelsberger, M., Keres, D., Springel, V., & Hernquist, L. 2012, MN-RAS, 424, 2999
Sil’chenko, O. K. & Moiseev, A. V. 2014, ArXiv e-printsSilich, S., Tenorio-Tagle, G., Munoz-Tunon, C., et al. 2010, ApJ, 711, 25Silk, J. 1977, ApJ, 211, 638Silk, J. & Mamon, G. A. 2012, Research in Astronomy and Astrophysics, 12, 917Simcoe, R. A., Sullivan, P. W., Cooksey, K. L., et al. 2012, Nature, 492, 79Skillman, E. D., Kennicutt, R. C., & Hodge, P. W. 1989, ApJ, 347, 875Somerville, R. S., Hopkins, P. F., Cox, T. J., Robertson, B. E., & Hernquist, L.
2008, MNRAS, 391, 481Spavone, M. & Iodice, E. 2013, MNRAS, 434, 3310
Star formation sustained by gas accretion 51
Spavone, M., Iodice, E., Arnaboldi, M., Longo, G., & Gerhard, O. 2011, A&A,531, A21
Spitoni, E., Recchi, S., & Matteucci, F. 2008, A&A, 484, 743Steidel, C. C., Adelberger, K. L., Giavalisco, M., Dickinson, M., & Pettini, M.
1999, ApJ, 519, 1Steidel, C. C., Adelberger, K. L., Shapley, A. E., et al. 2000, ApJ, 532, 170Stewart, K. R., Kaufmann, T., Bullock, J. S., et al. 2011a, ApJ, 735, L1Stewart, K. R., Kaufmann, T., Bullock, J. S., et al. 2011b, ApJ, 738, 39Stringer, M. J., Benson, A. J., Bundy, K., Ellis, R. S., & Quetin, E. L. 2009,
MNRAS, 393, 1127Swinbank, A. M., Webb, T. M., Richard, J., et al. 2009, MNRAS, 400, 1121Tenorio-Tagle, G. 1996, AJ, 111, 1641Tenorio-Tagle, G. & Munoz-Tunon, C. 1997, ApJ, 478, 134Tenorio-Tagle, G. & Munoz-Tunon, C. 1998, MNRAS, 293, 299Terlevich, R., Melnick, J., Masegosa, J., Moles, M., & Copetti, M. V. F. 1991,
A&AS, 91, 285Thone, C. C., Christensen, L., Prochaska, J. X., et al. 2014, ArXiv e-printsThuan, T. X. & Izotov, Y. I. 2005, ApJS, 161, 240Tornatore, L., Borgani, S., Viel, M., & Springel, V. 2010, MNRAS, 402, 1911Torrey, P., Cox, T. J., Kewley, L., & Hernquist, L. 2012, ApJ, 746, 108Tremonti, C. A., Heckman, T. M., Kauffmann, G., et al. 2004, ApJ, 613, 898Troncoso, P., Maiolino, R., Sommariva, V., et al. 2014, A&A, 563, A58Trujillo-Gomez, S., Klypin, A., Colin, P., et al. 2013, ArXiv e-printsTsujimoto, T. 2011, MNRAS, 410, 2540Tumlinson, J., Thom, C., Werk, J. K., et al. 2013, ApJ, 777, 59Tumlinson, J., Werk, J. K., Thom, C., et al. 2011, ApJ, 733, 111van de Voort, F. & Schaye, J. 2012, MNRAS, 423, 2991van de Voort, F., Schaye, J., Altay, G., & Theuns, T. 2012, MNRAS, 421, 2809van de Voort, F., Schaye, J., Booth, C. M., Haas, M. R., & Dalla Vecchia, C. 2011,
MNRAS, 414, 2458van den Bergh, S. 1962, AJ, 67, 486van den Bergh, S., Abraham, R. G., Ellis, R. S., et al. 1996, AJ, 112, 359van Dokkum, P. G., Leja, J., Nelson, E. J., et al. 2013, ApJ, 771, L35van Woerden, H., Wakker, B. P., Schwarz, U. J., & de Boer, K. S., eds. 2004,
Astrophysics and Space Science Library, Vol. 312, High Velocity Cloudsvan Zee, L., Salzer, J. J., Haynes, M. P., O’Donoghue, A. A., & Balonek, T. J.
1998, AJ, 116, 2805Vergani, D., Pizzella, A., Corsini, E. M., et al. 2007, A&A, 463, 883Vilchez, J. M., Pagel, B. E. J., Diaz, A. I., Terlevich, E., & Edmunds, M. G. 1988,
MNRAS, 235, 633Vogelsberger, M., Sijacki, D., Keres, D., Springel, V., & Hernquist, L. 2012, MN-
RAS, 425, 3024Wakker, B. P., York, D. G., Howk, J. C., et al. 2007, ApJ, 670, L113Wakker, B. P., York, D. G., Wilhelm, R., et al. 2008, ApJ, 672, 298Wang, J., Navarro, J. F., Frenk, C. S., et al. 2011, MNRAS, 413, 1373Wannier, P. & Wrixon, G. T. 1972, ApJ, 173, L119Werk, J. K., Putman, M. E., Meurer, G. R., et al. 2010, ApJ, 715, 656White, S. D. M. & Frenk, C. S. 1991, ApJ, 379, 52White, S. D. M. & Rees, M. J. 1978, MNRAS, 183, 341
52 J. Sanchez Almeida
Whitmore, B. C., Lucas, R. A., McElroy, D. B., et al. 1990, AJ, 100, 1489Wiersma, R. P. C., Schaye, J., & Smith, B. D. 2009, MNRAS, 393, 99Wisnioski, E., Glazebrook, K., Blake, C., et al. 2012, MNRAS, 422, 3339Wolfe, A. M., Gawiser, E., & Prochaska, J. X. 2005, ARA&A, 43, 861Worthey, G., Dorman, B., & Jones, L. A. 1996, AJ, 112, 948Yabe, K., Ohta, K., Iwamuro, F., et al. 2012, PASJ, 64, 60Yang, C.-C. & Krumholz, M. 2012, ApJ, 758, 48Yates, R. M., Kauffmann, G., & Guo, Q. 2012, MNRAS, 422, 215Yuan, T.-T., Kewley, L. J., & Rich, J. 2013, ApJ, 767, 106Zafar, T., Peroux, C., Popping, A., et al. 2013, A&A, 556, A141Zahid, H. J., Dima, G. I., Kewley, L. J., Erb, D. K., & Dave, R. 2012, ApJ, 757,
54Zahid, H. J., Kashino, D., Silverman, J. D., et al. 2013, ArXiv e-printsZhao, Y., Gao, Y., & Gu, Q. 2013, ApJ, 764, 44Zhu, G. & Menard, B. 2013, ApJ, 773, 16Zschaechner, L. K., Rand, R. J., Heald, G. H., Gentile, G., & Jozsa, G. 2012, ApJ,
760, 37


