Embed Size (px)
Citation preview
Report No.1 of the year 2019
Government of Kerala
STATE FINANCE AUDIT REPORT
OF
THE COMPTROLLER
AND AUDITOR GENERAL OF INDIAfor the year ended March 2018

http://www.cag.gov.in
STATE FINANCE AUDIT REPORT
OF
THE COMPTROLLER AND AUDITOR
GENERAL OF INDIA
for the year ended 31 March 2018
Government of Kerala
Report No. 1 of 2019

i
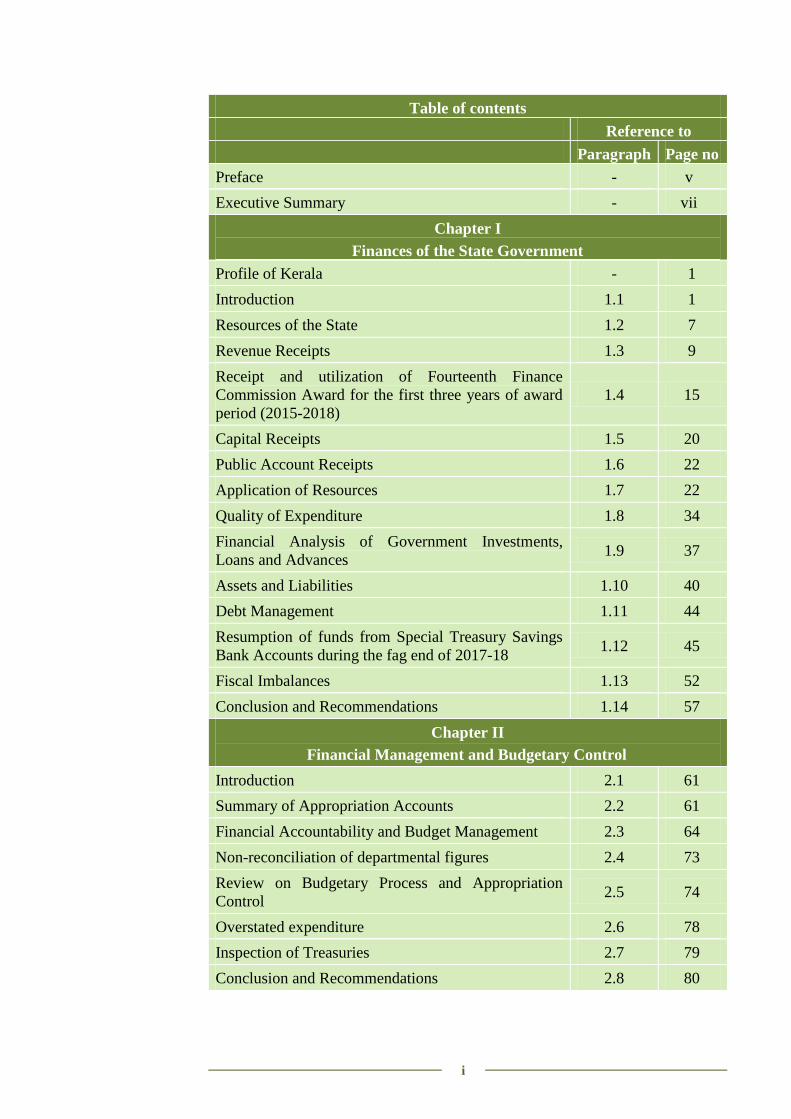
Table of contents
Reference to
Paragraph Page no
Preface - v
Executive Summary - vii
Chapter I
Finances of the State Government
Profile of Kerala - 1
Introduction 1.1 1
Resources of the State 1.2 7
Revenue Receipts 1.3 9
Receipt and utilization of Fourteenth Finance
Commission Award for the first three years of award
period (2015-2018)
1.4 15
Capital Receipts 1.5 20
Public Account Receipts 1.6 22
Application of Resources 1.7 22
Quality of Expenditure 1.8 34
Financial Analysis of Government Investments,
Loans and Advances 1.9 37
Assets and Liabilities 1.10 40
Debt Management 1.11 44
Resumption of funds from Special Treasury Savings
Bank Accounts during the fag end of 2017-18 1.12 45
Fiscal Imbalances 1.13 52
Conclusion and Recommendations 1.14 57
Chapter II
Financial Management and Budgetary Control
Introduction 2.1 61
Summary of Appropriation Accounts 2.2 61
Financial Accountability and Budget Management 2.3 64
Non-reconciliation of departmental figures 2.4 73
Review on Budgetary Process and Appropriation
Control 2.5 74
Overstated expenditure 2.6 78
Inspection of Treasuries 2.7 79
Conclusion and Recommendations 2.8 80
State Finance Audit Report for the year ended 31 March 2018
ii
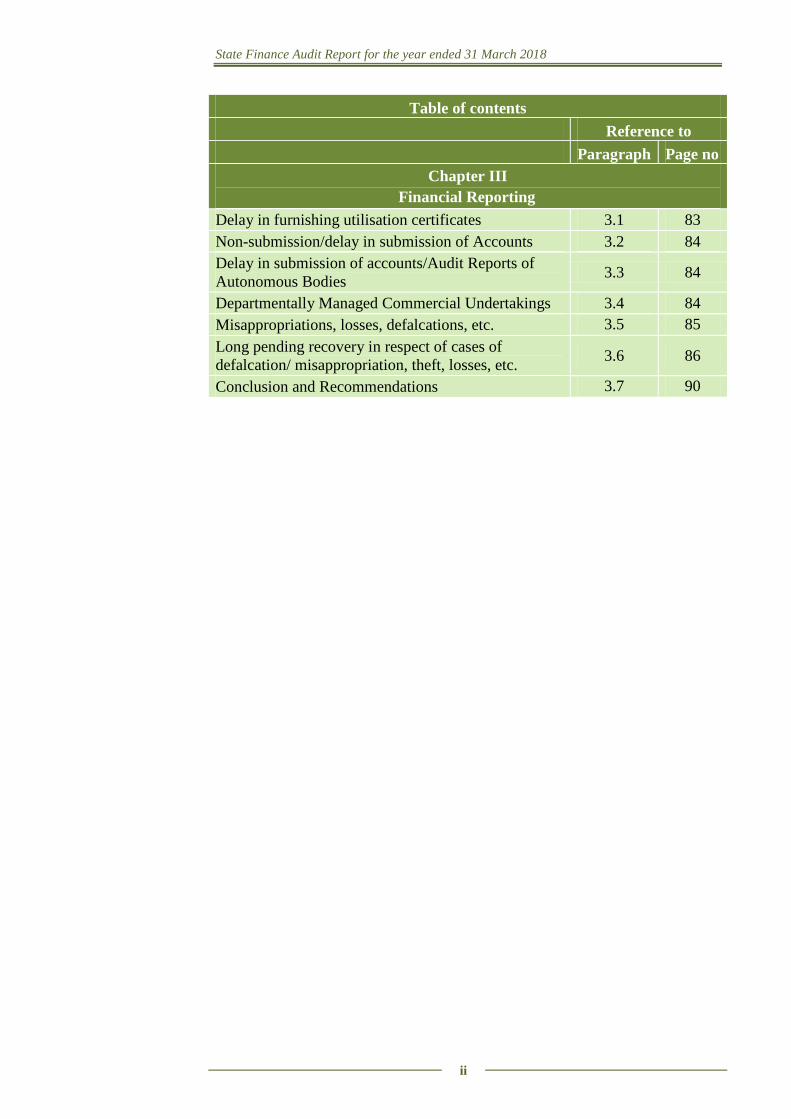
Table of contents
Reference to
Paragraph Page no
Chapter III
Financial Reporting
Delay in furnishing utilisation certificates 3.1 83
Non-submission/delay in submission of Accounts 3.2 84
Delay in submission of accounts/Audit Reports of
Autonomous Bodies 3.3 84
Departmentally Managed Commercial Undertakings 3.4 84
Misappropriations, losses, defalcations, etc. 3.5 85
Long pending recovery in respect of cases of
defalcation/ misappropriation, theft, losses, etc. 3.6 86
Conclusion and Recommendations 3.7 90
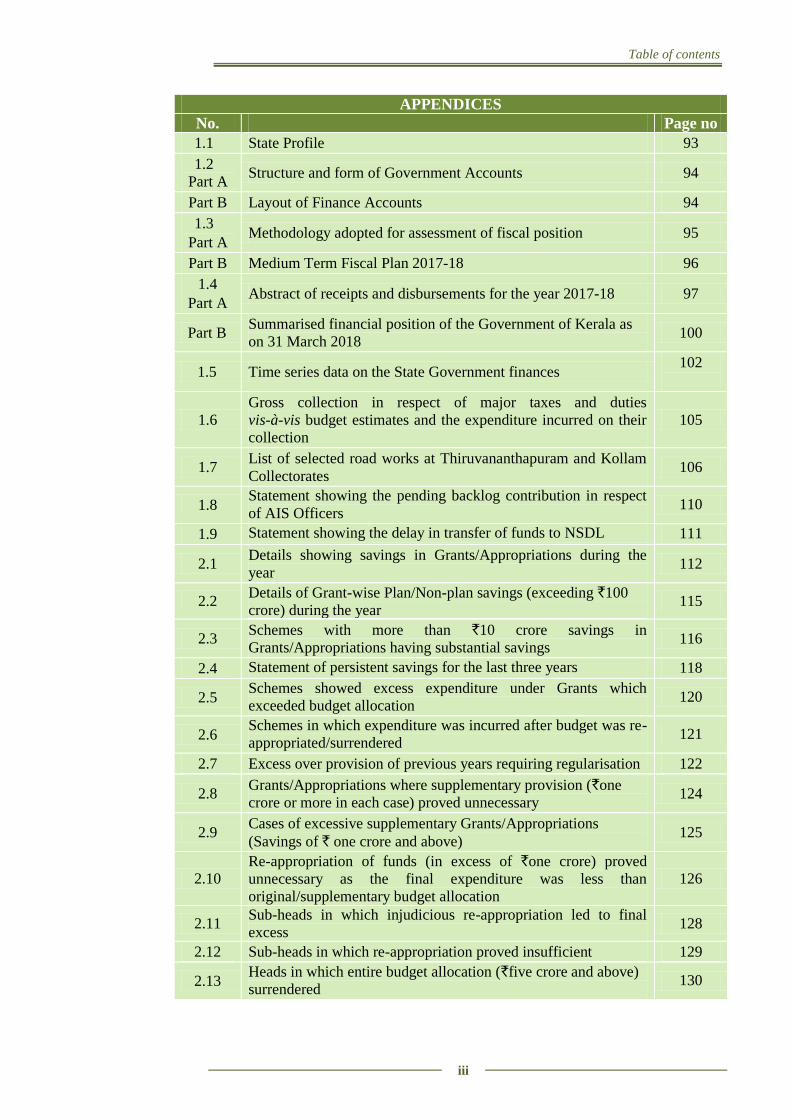
Table of contents
iii
APPENDICES
No. Page no
1.1 State Profile 93
1.2
Part A Structure and form of Government Accounts 94
Part B Layout of Finance Accounts 94
1.3
Part A Methodology adopted for assessment of fiscal position 95
Part B Medium Term Fiscal Plan 2017-18 96
1.4
Part A Abstract of receipts and disbursements for the year 2017-18 97
Part B Summarised financial position of the Government of Kerala as
on 31 March 2018 100
1.5 Time series data on the State Government finances 102
1.6
Gross collection in respect of major taxes and duties
vis-à-vis budget estimates and the expenditure incurred on their
collection
105
1.7 List of selected road works at Thiruvananthapuram and Kollam
Collectorates 106
1.8 Statement showing the pending backlog contribution in respect
of AIS Officers 110
1.9 Statement showing the delay in transfer of funds to NSDL 111
2.1 Details showing savings in Grants/Appropriations during the
year 112
2.2 Details of Grant-wise Plan/Non-plan savings (exceeding `100
crore) during the year 115
2.3 Schemes with more than `10 crore savings in
Grants/Appropriations having substantial savings 116
2.4 Statement of persistent savings for the last three years 118
2.5 Schemes showed excess expenditure under Grants which
exceeded budget allocation 120
2.6 Schemes in which expenditure was incurred after budget was re-
appropriated/surrendered 121
2.7 Excess over provision of previous years requiring regularisation 122
2.8 Grants/Appropriations where supplementary provision (`one
crore or more in each case) proved unnecessary 124
2.9 Cases of excessive supplementary Grants/Appropriations
(Savings of ` one crore and above) 125
2.10 Re-appropriation of funds (in excess of `one crore) proved
unnecessary as the final expenditure was less than
original/supplementary budget allocation
126
2.11 Sub-heads in which injudicious re-appropriation led to final
excess 128
2.12 Sub-heads in which re-appropriation proved insufficient 129
2.13 Heads in which entire budget allocation (`five crore and above)
surrendered 130
State Finance Audit Report for the year ended 31 March 2018
iv
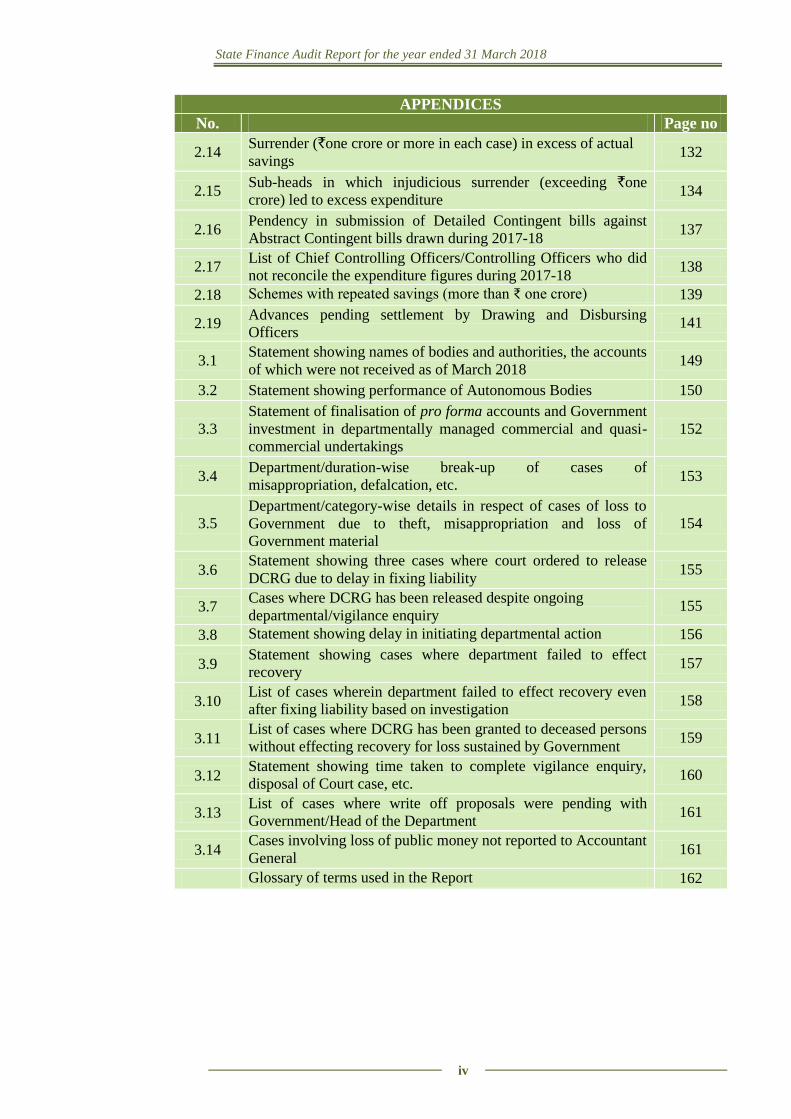
APPENDICES
No. Page no
2.14 Surrender (`one crore or more in each case) in excess of actual
savings 132
2.15 Sub-heads in which injudicious surrender (exceeding `one
crore) led to excess expenditure 134
2.16 Pendency in submission of Detailed Contingent bills against
Abstract Contingent bills drawn during 2017-18 137
2.17 List of Chief Controlling Officers/Controlling Officers who did
not reconcile the expenditure figures during 2017-18 138
2.18 Schemes with repeated savings (more than ₹ one crore) 139
2.19 Advances pending settlement by Drawing and Disbursing
Officers 141
3.1 Statement showing names of bodies and authorities, the accounts
of which were not received as of March 2018 149
3.2 Statement showing performance of Autonomous Bodies 150
3.3
Statement of finalisation of pro forma accounts and Government
investment in departmentally managed commercial and quasi-
commercial undertakings
152
3.4 Department/duration-wise break-up of cases of
misappropriation, defalcation, etc. 153
3.5
Department/category-wise details in respect of cases of loss to
Government due to theft, misappropriation and loss of
Government material
154
3.6 Statement showing three cases where court ordered to release
DCRG due to delay in fixing liability 155
3.7 Cases where DCRG has been released despite ongoing
departmental/vigilance enquiry 155
3.8 Statement showing delay in initiating departmental action 156
3.9 Statement showing cases where department failed to effect
recovery 157
3.10 List of cases wherein department failed to effect recovery even
after fixing liability based on investigation 158
3.11 List of cases where DCRG has been granted to deceased persons
without effecting recovery for loss sustained by Government 159
3.12 Statement showing time taken to complete vigilance enquiry,
disposal of Court case, etc. 160
3.13 List of cases where write off proposals were pending with
Government/Head of the Department 161
3.14 Cases involving loss of public money not reported to Accountant
General 161
Glossary of terms used in the Report 162
v
PREFACE
1. This Report is prepared for submission to the Governor of
Kerala under Article 151 of the Constitution of India for
being placed in the State Legislature.
2. Chapters I and II of this Report contain audit observations on
matters arising from examination of Finance Accounts and
Appropriation Accounts respectively, of the State
Government for the year ended 31 March 2018. Information
has also been obtained from the Government of Kerala,
wherever necessary.
3. Chapter III on ‘Financial Reporting’ provides an overview
and status of the State Government’s compliance with
various financial rules, procedures and directives during the
current year.
4. The Report containing the findings of performance audit and
audit of transactions in various departments and observations
arising out of audit of Statutory Corporations, Boards and
Government Companies and the Report containing
observations on Revenue Receipts are presented separately.

EXECUTIVE SUMMARY

vii
EXECUTIVE SUMMARY
Background
The State is located at the southern end of the country, sharing borders with
Tamil Nadu and Karnataka. Geographical area-wise, Kerala is ranked 22nd
in
the country with an area of 38,863 sq.km. The State has a population of 3.60
crore (12th
in the country) and it is ranked as the third most densely populated
State with a density of 860 persons per sq.km. The decadal growth rate of
population was 6.0 per cent (3.40 crore in 2008 to 3.60 crore in 2017), which
is the second lowest rate among Indian states. The literacy rate of Kerala
(94 per cent) is the highest among the Indian states. Gross State Domestic
Product (GSDP) of the State in 2017-18 at current prices was `6,86,116 crore.
About the Report
This Report of the Finances of the Government of Kerala is being brought out
with a view to assess objectively, the financial performance of the State during
2017-18 and to provide the State Government and the State Legislature with
timely inputs based on audit analysis of financial data. In order to give a
perspective to the analysis, an effort is made to compare the achievements
with the targets envisaged by the State Government in the budget estimates of
2017-18. Based on the audited accounts of the Government of Kerala for the
year ended March 2018, this Report provides an analytical review of the
Annual Accounts of the State Government. This Report is structured in three
Chapters.
Chapter 1 is based on the audit of Finance Accounts and makes an
assessment of the Kerala Government’s fiscal position as on 31 March 2018. It
provides an insight into trends in committed expenditure, borrowing pattern
and quality of expenditure, besides giving comparison on State’s expenditure
with other General Category States.
Chapter 2 is based on the audit of Appropriation Accounts and gives a Grant-
by-Grant description of appropriations and the manner in which the allocated
resources were managed by the service delivery departments.
Chapter 3 is an inventory of the Kerala Government’s compliance with
various reporting requirements and financial rules. The report also compiles
the data compiled from various Government departments/organizations in
support of the findings.
Audit findings and recommendations
Chapter I: Finances of the State Government
Overall financial status
Revenue deficit increased from `15,484 crore in 2016-17 to `16,928 crore in
2017-18 and fiscal deficit increased from `26,448 crore in 2016-17 to `26,838
crore in 2017-18. The ratio of fiscal deficit to GSDP improved from 4.3 per
State Finance Audit Report for the year ended 31 March 2018
viii
cent in 2016-17 to 3.9 per cent in 2017-18. State did not achieve any of the
targets fixed in its Medium Term Fiscal Plan or Kerala Fiscal Responsibility
Act during 2017-18. As per the recommendation of the Fourteenth Finance
Commission, Fiscal deficit to GSDP ratio was to be anchored at 3 per cent but
it was 3.9 per cent during 2017-18.
Revenue resources of the State
Revenue receipts of the State increased from `49,177 crore in 2013-14 to
`83,020 crore in 2017-18 recording a growth rate of 69 per cent during last
five years. Share of State’s own tax revenue being the main source of
revenue in revenue receipts decreased from 65 per cent in 2013-14 to 56 per
cent in 2017-18 indicating low growth rate of tax revenue when compared to
other components of revenue receipts. Though the receipts under State
Lotteries was `9,034 crore (81 per cent of Non-tax revenue) an equally high
expenditure of `7,628 crore on distribution of prizes, agent commission, etc.
reduced the net yield to `1,406 crore during the year.
Revenue expenditure of the State
Revenue Expenditure of the State increased from `91,096 crore in 2016-17 to
`99,948 crore in 2017-18 recording a growth of 9.72 per cent over the
previous year. Revenue expenditure as a percentage of total expenditure
increased during 2017-18 indicating low priority of Government towards
capital expenditure. Share of committed expenditure in revenue expenditure
increased from 63 per cent in 2016-17 to 69 per cent in 2017-18. Interest
payments and pension payments consumed 18 per cent and 24 per cent
respectively of revenue receipts and is a matter of concern for the State
Government.
Quality of expenditure
Capital expenditure decreased by `1,377 crore during the year and its share in
total expenditure decreased from 10 per cent in 2016-17 to 8 per cent in 2017-
18. State’s share of expenditure on health and education sector in total
expenditure was more than General Category States, but the share of capital
expenditure and development expenditure in total expenditure was less than
that of General Category States. The average return on investment made by
State Government was 1.44 per cent in the last five years while the
Government paid an average interest rate of 7.24 per cent on its borrowings
during the same period. The interest receipt on loans and advances given by
State Government was 0.25 per cent during 2017-18 against the average cost
of borrowing of 7.48 per cent.
Reserve Funds and liabilities
Consolidated Sinking Fund was constituted with the aim to amortize the
outstanding liabilities of Government, but Government did not contribute to
the fund during 2017-18. Similarly, Government has to constitute a Guarantee
Redemption Fund for crediting guarantee commission collected for meeting
future liability arising out of guarantees given by the Government. This fund
Executive Summary
ix
has not been constituted so far. The accumulated balance in State Disaster
Response Fund, at the end of March 2018 was `287.08 crore. As per the
guidelines, Government has to credit interest to the fund equal to the amount
of interest rate applicable to overdraft under overdraft regulation scheme of
Reserve Bank of India. However, this was not done. Interest payable on the
un-invested balances of the fund of earlier years was also not estimated by the
Government.
Debt management
Open market borrowings have a major share (54 per cent) in total fiscal
liabilities of the State. The net debt available with State for development
activities was only `6164 crore (26 per cent of public debt receipts) during
2017-18. Maturity profile of the State shows that about 50.14 per cent of the
debt (`71,698.62 crore) is to be repaid by March 2025.
Implementation of National Pension System
State Government implemented National Pension System (NPS) for the All
India Service Officers (July 2009) recruited to Kerala cadre on or after
1.1.2004 and for the State Government employees (January 2013) appointed
on or after 1.4.2013. Deficiencies like non providing of interest by State
Government towards the matching Government share for the backlog
contribution in respect of State Government employees, delay ranging from 27
to 41 months in transfer of NPS backlog contribution in respect of AIS
officers to NSDL, non-deduction of NPS subscription from the pay revision
arrears disbursed to employees etc were noticed in the implementation of the
NPS.
Receipt and utilisation of Fourteenth Finance Commission Award for the
first three years of award period (2015-2018)
State received `13,308.28 crore out of the award amount of `13,560.08 crore
during 2015-16 to 2017-18 resulting in short receipt of `251.80 crore from
Government of India. The short release was noticed under ‘Grants to local
bodies’.
Chapter II: Financial Management and Budgetary Control
The overall savings of `11,424.97 crore (7.89 per cent) in 2017-18 against the
total budget allocation of `1,44,881.94 crore was 7.60 per cent less than the
savings noticed during 2016-17 (15.49 per cent). Persistent savings exceeding
`100 crore were noticed in eight Grants under revenue section and five Grants
and one Appropriation under capital section. Excess expenditure of `3,545.44
crore occurred during 2017-18 under six Grants and three Appropriations is to
be regularized under Article 205 of the Constitution along with excess
expenditure of `1,189.56 crore relating to previous years (2011-12 to 2016-
17). Supplementary provisions aggregating to `2,417.30 crore obtained in 12
Grants/Appropriations proved unnecessary as the expenditure did not come up
to the level of even the original provisions. During 2017-18, 11 per cent of
the total budget allocation was surrendered at the end of the financial year,
which includes five grants having surrender more than `1,000 crore.
State Finance Audit Report for the year ended 31 March 2018
x
Unnecessary and injudicious re-appropriations indicated that departmental
officers failed in assessing actual requirement of funds in heads of account
under their control. Excess payment of pension and non-settlement of
advances by drawing and disbursing officers were noticed in Inspection of
Treasuries.
Chapter III: Financial Reporting
The audit of accounts of District Legal Services Authorities, Ernakulam and
Kasaragod, which was entrusted to the Comptroller and Auditor General of
India under Sections 19 (2), 19 (3) and 20 (1) of the Comptroller and Auditor
General’s (Duties, Powers and Conditions of Service) Act, 1971, were
pending for five years (from 2012-13).
Long pending recovery in respect of cases of defalcation/
misappropriation, theft, losses, etc.
There were delays in initiating departmental action, fixing liability, issuing
orders of recovery, etc., in respect of cases of misappropriation/loss of public
money.
CHAPTER I
FINANCES OF THE STATE GOVERNMENT

1
CHAPTER I
FINANCES OF THE STATE GOVERNMENT
Profile of Kerala
The State is located at the southern end of the country, sharing borders with
Tamil Nadu and Karnataka. Geographical area-wise, Kerala is ranked 22nd
in
the country with an area of 38,863 sq.km. The State has a population of 3.60
crore (12th
in the country) and is ranked as the third1 most densely populated
State with a density of 860 persons per sq.km. The decadal growth rate of
population was 6.0 per cent (3.40 crore in 2008 to 3.60 crore in 2017), which
is the second lowest2 among Indian states. The literacy rate of Kerala (94 per
cent) is the highest3 among the Indian states. Gross State Domestic Product
(GSDP) in 2017-18 of the State at current prices was `6,86,116 crore. General
data relating to the State is given in Appendix 1.1.
Gross State Domestic Product (GSDP)
GSDP is the market value of all officially recognized final goods and services
produced within the State in a given period of time. The growth of GSDP of
the State is an important indicator of the State’s economy as it indicates the
standard of living of the State’s population. The trends in the annual growth of
India’s GDP and that of the State at current prices are indicated below:
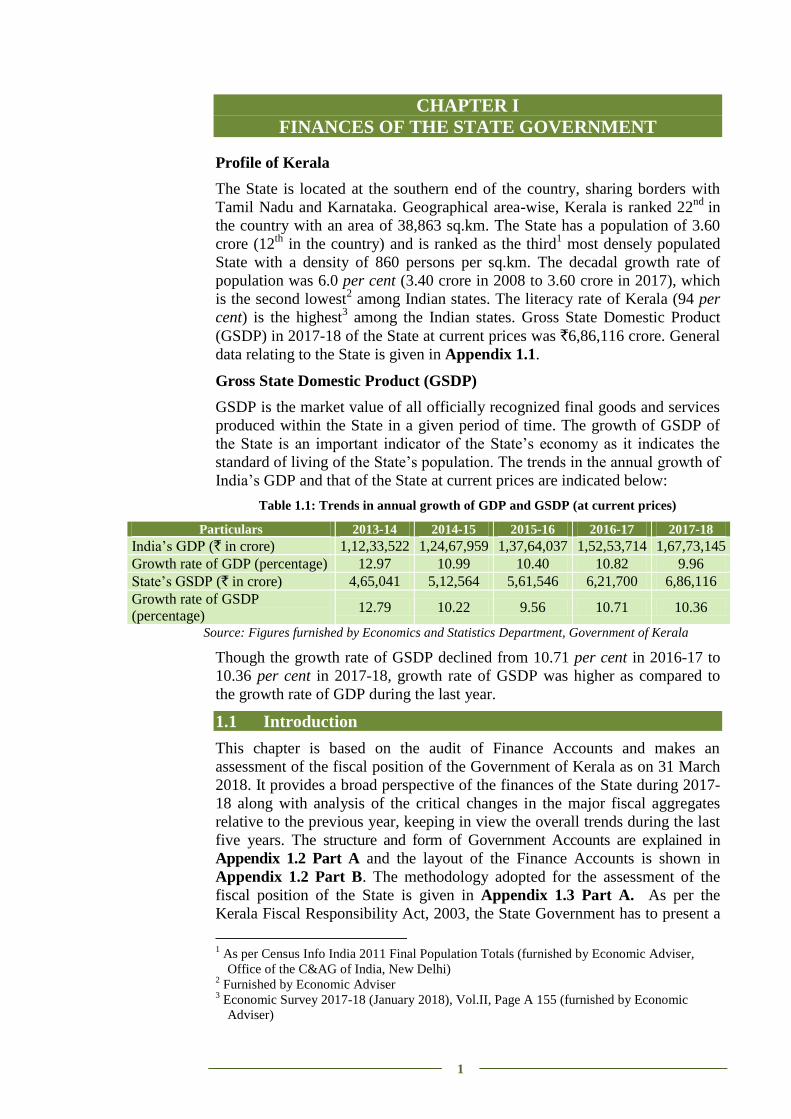
Table 1.1: Trends in annual growth of GDP and GSDP (at current prices)
Source: Figures furnished by Economics and Statistics Department, Government of Kerala
Though the growth rate of GSDP declined from 10.71 per cent in 2016-17 to
10.36 per cent in 2017-18, growth rate of GSDP was higher as compared to
the growth rate of GDP during the last year.
1.1 Introduction
This chapter is based on the audit of Finance Accounts and makes an
assessment of the fiscal position of the Government of Kerala as on 31 March
2018. It provides a broad perspective of the finances of the State during 2017-
18 along with analysis of the critical changes in the major fiscal aggregates
relative to the previous year, keeping in view the overall trends during the last
five years. The structure and form of Government Accounts are explained in
Appendix 1.2 Part A and the layout of the Finance Accounts is shown in
Appendix 1.2 Part B. The methodology adopted for the assessment of the
fiscal position of the State is given in Appendix 1.3 Part A. As per the
Kerala Fiscal Responsibility Act, 2003, the State Government has to present a
1 As per Census Info India 2011 Final Population Totals (furnished by Economic Adviser,
Office of the C&AG of India, New Delhi) 2 Furnished by Economic Adviser
3 Economic Survey 2017-18 (January 2018), Vol.II, Page A 155 (furnished by Economic
Adviser)
Particulars 2013-14 2014-15 2015-16 2016-17 2017-18
India’s GDP (` in crore) 1,12,33,522 1,24,67,959 1,37,64,037 1,52,53,714 1,67,73,145
Growth rate of GDP (percentage) 12.97 10.99 10.40 10.82 9.96
State’s GSDP (` in crore) 4,65,041 5,12,564 5,61,546 6,21,700 6,86,116
Growth rate of GSDP
(percentage) 12.79 10.22 9.56 10.71 10.36
State Finance Audit Report for the year ended 31 March 2018
2
Medium Term Fiscal Policy and Strategy Statement with Medium Term Fiscal
Plan, along with the budget document. The Medium Term Fiscal Plan for
2017-18 to 2019-20 was presented in the State Legislature in March 2017. It is
included as Appendix 1.3 Part B of this Report.
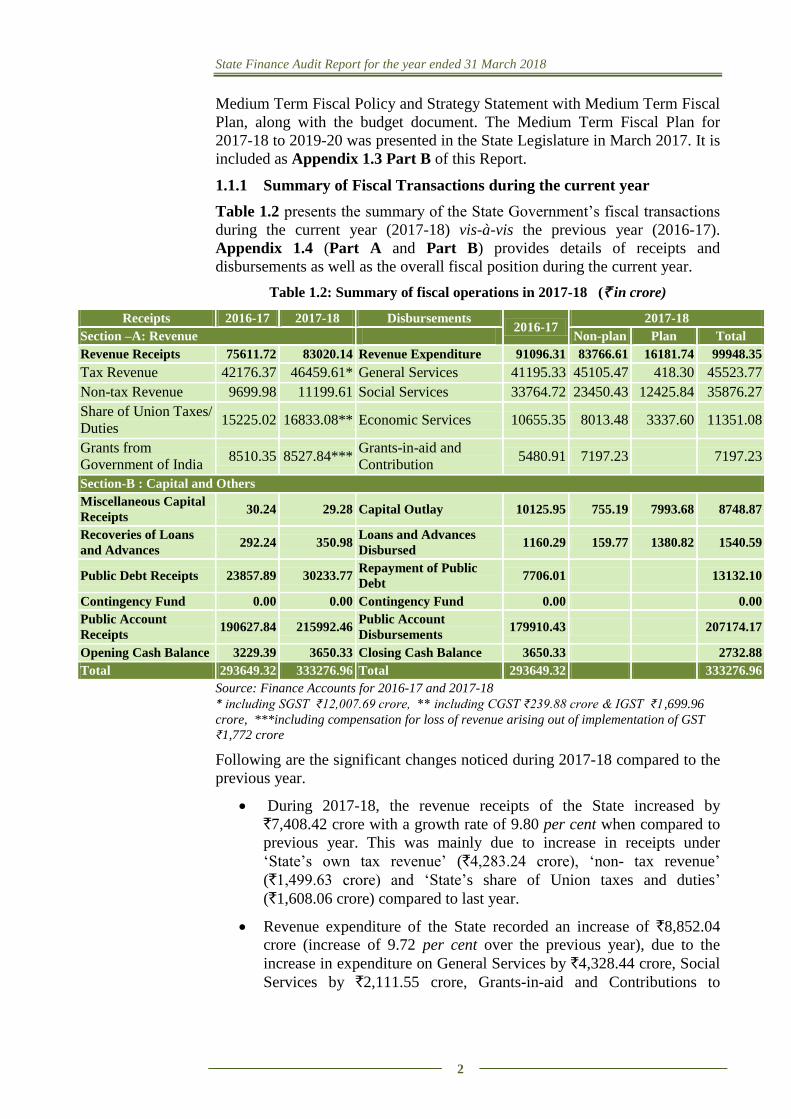
1.1.1 Summary of Fiscal Transactions during the current year
Table 1.2 presents the summary of the State Government’s fiscal transactions
during the current year (2017-18) vis-à-vis the previous year (2016-17).
Appendix 1.4 (Part A and Part B) provides details of receipts and
disbursements as well as the overall fiscal position during the current year.
Table 1.2: Summary of fiscal operations in 2017-18 (` in crore)
Source: Finance Accounts for 2016-17 and 2017-18
* including SGST ₹12,007.69 crore, ** including CGST ₹239.88 crore & IGST ₹1,699.96
crore, ***including compensation for loss of revenue arising out of implementation of GST
₹1,772 crore
Following are the significant changes noticed during 2017-18 compared to the
previous year.
During 2017-18, the revenue receipts of the State increased by
`7,408.42 crore with a growth rate of 9.80 per cent when compared to
previous year. This was mainly due to increase in receipts under
‘State’s own tax revenue’ (`4,283.24 crore), ‘non- tax revenue’
(`1,499.63 crore) and ‘State’s share of Union taxes and duties’
(`1,608.06 crore) compared to last year.
Revenue expenditure of the State recorded an increase of `8,852.04
crore (increase of 9.72 per cent over the previous year), due to the
increase in expenditure on General Services by `4,328.44 crore, Social
Services by `2,111.55 crore, Grants-in-aid and Contributions to
Receipts 2016-17 2017-18 Disbursements 2016-17
2017-18
Section –A: Revenue Non-plan Plan Total
Revenue Receipts 75611.72 83020.14 Revenue Expenditure 91096.31 83766.61 16181.74 99948.35
Tax Revenue 42176.37 46459.61* General Services 41195.33 45105.47 418.30 45523.77
Non-tax Revenue 9699.98 11199.61 Social Services 33764.72 23450.43 12425.84 35876.27
Share of Union Taxes/
Duties 15225.02 16833.08** Economic Services 10655.35 8013.48 3337.60 11351.08
Grants from
Government of India 8510.35 8527.84***
Grants-in-aid and
Contribution 5480.91 7197.23 7197.23
Section-B : Capital and Others
Miscellaneous Capital
Receipts 30.24 29.28 Capital Outlay 10125.95 755.19 7993.68 8748.87
Recoveries of Loans
and Advances 292.24 350.98
Loans and Advances
Disbursed 1160.29 159.77 1380.82 1540.59
Public Debt Receipts 23857.89 30233.77 Repayment of Public
Debt 7706.01 13132.10
Contingency Fund 0.00 0.00 Contingency Fund 0.00 0.00
Public Account
Receipts 190627.84 215992.46
Public Account
Disbursements 179910.43 207174.17
Opening Cash Balance 3229.39 3650.33 Closing Cash Balance 3650.33 2732.88
Total 293649.32 333276.96 Total 293649.32 333276.96
Chapter I – Finances of the State Government
3
Panchayat Raj Institutions by `1,716.32 crore and Economic Services
by `695.73 crore.
Capital expenditure decreased by `1,377.08 crore showing a decline in
growth of 13.60 per cent over the previous year.
Recoveries of Loans and Advances increased by `58.74 crore (20.10
per cent) and Disbursement of Loans and Advances increased by
`380.30 crore (32.78 per cent).
Public Account receipts and disbursements increased by `25,364.62
crore (13.31 per cent) and `27,263.74 crore (15.15 per cent)
respectively.
Cash balance position of the State decreased from `3,650.33 crore at
the end of 2016-17 to `2,732.88 crore at the end of 2017-18.
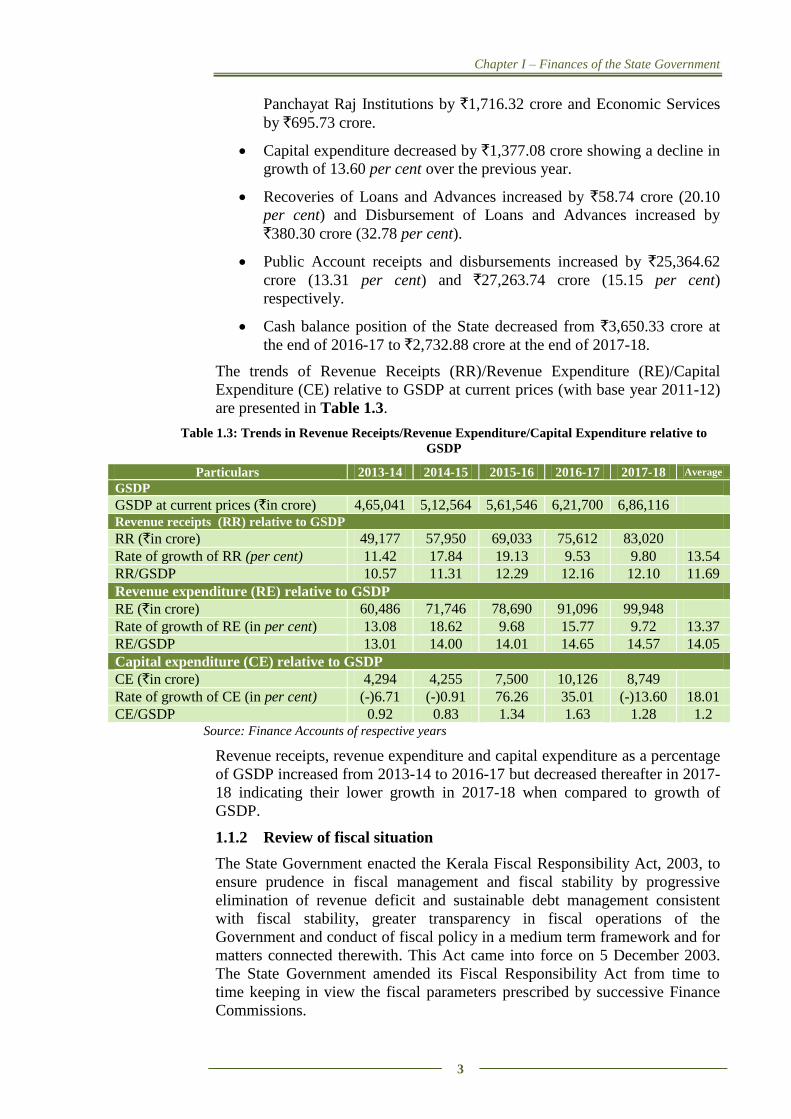
The trends of Revenue Receipts (RR)/Revenue Expenditure (RE)/Capital
Expenditure (CE) relative to GSDP at current prices (with base year 2011-12)
are presented in Table 1.3.
Table 1.3: Trends in Revenue Receipts/Revenue Expenditure/Capital Expenditure relative to
GSDP
Particulars 2013-14 2014-15 2015-16 2016-17 2017-18 Average
GSDP
GSDP at current prices (`in crore) 4,65,041 5,12,564 5,61,546 6,21,700 6,86,116 Revenue receipts (RR) relative to GSDP
RR (`in crore) 49,177 57,950 69,033 75,612 83,020
Rate of growth of RR (per cent) 11.42 17.84 19.13 9.53 9.80 13.54
RR/GSDP 10.57 11.31 12.29 12.16 12.10 11.69
Revenue expenditure (RE) relative to GSDP
RE (`in crore) 60,486 71,746 78,690 91,096 99,948
Rate of growth of RE (in per cent) 13.08 18.62 9.68 15.77 9.72 13.37
RE/GSDP 13.01 14.00 14.01 14.65 14.57 14.05
Capital expenditure (CE) relative to GSDP
CE (`in crore) 4,294 4,255 7,500 10,126 8,749
Rate of growth of CE (in per cent) (-)6.71 (-)0.91 76.26 35.01 (-)13.60 18.01
CE/GSDP 0.92 0.83 1.34 1.63 1.28 1.2 Source: Finance Accounts of respective years
Revenue receipts, revenue expenditure and capital expenditure as a percentage
of GSDP increased from 2013-14 to 2016-17 but decreased thereafter in 2017-
18 indicating their lower growth in 2017-18 when compared to growth of
GSDP.
1.1.2 Review of fiscal situation
The State Government enacted the Kerala Fiscal Responsibility Act, 2003, to
ensure prudence in fiscal management and fiscal stability by progressive
elimination of revenue deficit and sustainable debt management consistent
with fiscal stability, greater transparency in fiscal operations of the
Government and conduct of fiscal policy in a medium term framework and for
matters connected therewith. This Act came into force on 5 December 2003.
The State Government amended its Fiscal Responsibility Act from time to
time keeping in view the fiscal parameters prescribed by successive Finance
Commissions.
State Finance Audit Report for the year ended 31 March 2018
4
Based on the recommendations of the Fourteenth Finance Commission, the
State Government amended Kerala Fiscal Responsibility Act by enacting the
Kerala Fiscal Responsibility (Amendment) Act, 2018 on 31 March 2018 with
revised fiscal targets for the Finance Commission period. According to the
Act, the Government shall eliminate revenue deficit completely during the
period from 2017-18 to 2019-20 and shall maintain the fiscal deficit to 3 per
cent of GSDP during the period from 2017-18 to 2019-20.
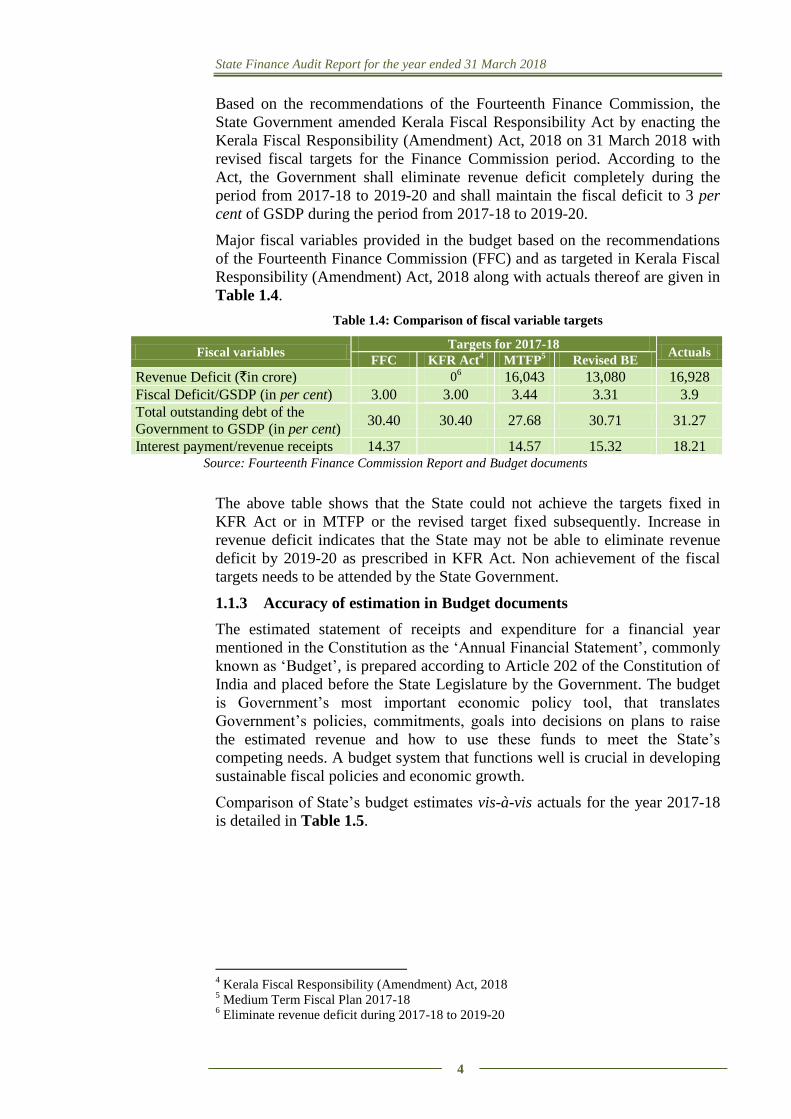
Major fiscal variables provided in the budget based on the recommendations
of the Fourteenth Finance Commission (FFC) and as targeted in Kerala Fiscal
Responsibility (Amendment) Act, 2018 along with actuals thereof are given in
Table 1.4.
Table 1.4: Comparison of fiscal variable targets
Source: Fourteenth Finance Commission Report and Budget documents
The above table shows that the State could not achieve the targets fixed in
KFR Act or in MTFP or the revised target fixed subsequently. Increase in
revenue deficit indicates that the State may not be able to eliminate revenue
deficit by 2019-20 as prescribed in KFR Act. Non achievement of the fiscal
targets needs to be attended by the State Government.
1.1.3 Accuracy of estimation in Budget documents
The estimated statement of receipts and expenditure for a financial year
mentioned in the Constitution as the ‘Annual Financial Statement’, commonly
known as ‘Budget’, is prepared according to Article 202 of the Constitution of
India and placed before the State Legislature by the Government. The budget
is Government’s most important economic policy tool, that translates
Government’s policies, commitments, goals into decisions on plans to raise
the estimated revenue and how to use these funds to meet the State’s
competing needs. A budget system that functions well is crucial in developing
sustainable fiscal policies and economic growth.
Comparison of State’s budget estimates vis-à-vis actuals for the year 2017-18
is detailed in Table 1.5.
4 Kerala Fiscal Responsibility (Amendment) Act, 2018
5 Medium Term Fiscal Plan 2017-18
6 Eliminate revenue deficit during 2017-18 to 2019-20
Fiscal variables Targets for 2017-18
Actuals FFC KFR Act
4 MTFP
5 Revised BE
Revenue Deficit (`in crore) 06 16,043 13,080 16,928
Fiscal Deficit/GSDP (in per cent) 3.00 3.00 3.44 3.31 3.9
Total outstanding debt of the
Government to GSDP (in per cent) 30.40 30.40 27.68 30.71 31.27
Interest payment/revenue receipts 14.37 14.57 15.32 18.21
Chapter I – Finances of the State Government
5
Table 1.5: Budget estimates and actuals for 2017-18 (` in crore)
Particulars Budget Estimate Revised Estimate Actual
Revenue Receipts 93,584.74 88,266.85 83,020.14
Revenue Expenditure 1,09,627.88 1,01,346.49 99,948.35
Revenue Deficit 16,043.14 13,079.64 16,928.21
Capital Expenditure 9,057.48 8,668.19 8,748.87
Loans and Advances (Net) 692.71 1,061.60 1,189.61
Public Debt (Net) 21,227.95 20,404.00 17,101.67
Public Account (Net) 4,050.70 1,677.54 9,739.36 Source: Budget in brief for 2018-19 and Finance Accounts for 2017-18
The revised estimate needs to be more accurate than the original budget
estimate as it was done after analysing the receipts and expenditure of the first
six months of the financial year. However, it was observed that actual revenue
receipts was short by `5,246.71 crore with respect to revised estimate and
short by `10,564.60 crore with respect to original estimate. Apart from
revenue receipts, substantial variation was noticed in the case of net Public
Account accretions. Against the revised estimation of `1,677.54 crore, net
accretions under ‘Public Accounts’ was `9,739.36 crore mainly due to
increase in net accretions under ‘Small Savings, PF etc.’ (`3,275.32 crore) and
‘Suspense and Miscellaneous’ (`4,558.05 crore) when compared to revised
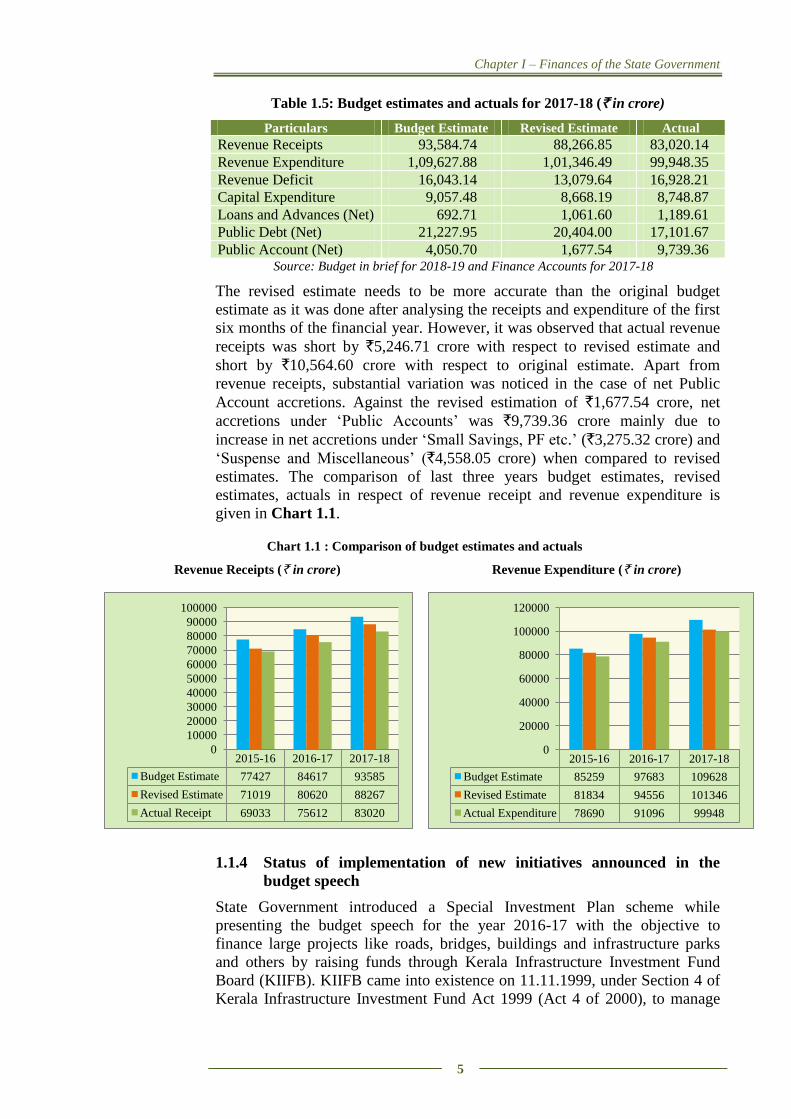
estimates. The comparison of last three years budget estimates, revised
estimates, actuals in respect of revenue receipt and revenue expenditure is
given in Chart 1.1.
Chart 1.1 : Comparison of budget estimates and actuals
Revenue Receipts (` in crore) Revenue Expenditure (` in crore)
1.1.4 Status of implementation of new initiatives announced in the
budget speech
State Government introduced a Special Investment Plan scheme while
presenting the budget speech for the year 2016-17 with the objective to
finance large projects like roads, bridges, buildings and infrastructure parks
and others by raising funds through Kerala Infrastructure Investment Fund
Board (KIIFB). KIIFB came into existence on 11.11.1999, under Section 4 of
Kerala Infrastructure Investment Fund Act 1999 (Act 4 of 2000), to manage
2015-16 2016-17 2017-18
Budget Estimate 77427 84617 93585
Revised Estimate 71019 80620 88267
Actual Receipt 69033 75612 83020
0
10000
20000
30000
40000
50000
60000
70000
80000
90000
100000
2015-16 2016-17 2017-18
Budget Estimate 85259 97683 109628
Revised Estimate 81834 94556 101346
Actual Expenditure 78690 91096 99948
0
20000
40000
60000
80000
100000
120000
State Finance Audit Report for the year ended 31 March 2018
6
the Kerala Infrastructure Investment Fund. The Fund was constituted for
investments in various infrastructure projects in the State. The Kerala
Infrastructure Investment Fund (Amendment) Act, 2016 came into force on 19
August 2016. As per the Amendment Act State Government will make budget
provisions in the annual budget towards the fund to defray the expenses
incurred for payment of annuity or other repayment obligation and to meet
operational and administrative expenses of KIIFB.
Funding for eight schemes with an outlay of `615 crore was to be made from
Special Investment Plan Scheme during 2016-17. It was announced in the
Budget Speech 2017-18 that construction works worth `20,000 crore were
being announced from KIIFB during the year 2017-18. No projects were
funded through KIIFB during 2016-17 as the projects were in planning stage.
Audit analysed the new initiatives announced in the budget speech for the
years 2016-17 and 2017-18 which were proposed to be funded through KIIFB.
The status of implementation of the schemes to be funded through KIIFB are
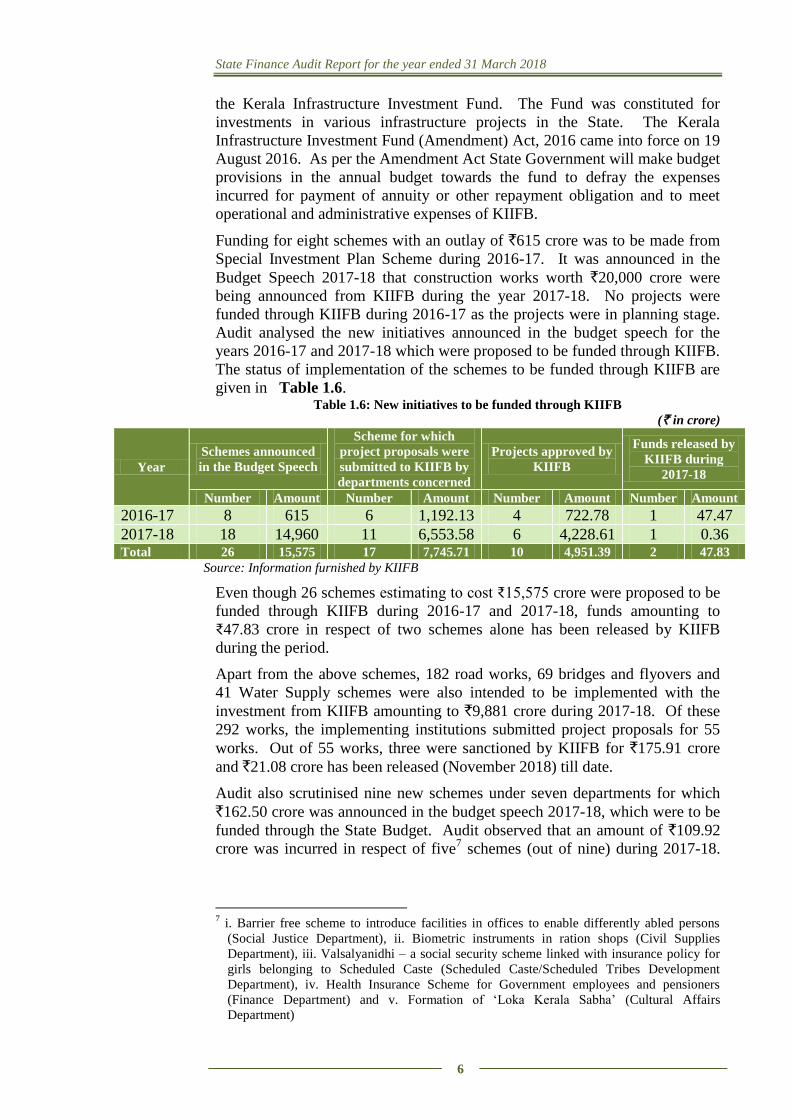
given in Table 1.6. Table 1.6: New initiatives to be funded through KIIFB
(` in crore)
Year
Schemes announced
in the Budget Speech
Scheme for which
project proposals were
submitted to KIIFB by
departments concerned
Projects approved by
KIIFB
Funds released by
KIIFB during
2017-18
Number Amount Number Amount Number Amount Number Amount
2016-17 8 615 6 1,192.13 4 722.78 1 47.47
2017-18 18 14,960 11 6,553.58 6 4,228.61 1 0.36 Total 26 15,575 17 7,745.71 10 4,951.39 2 47.83
Source: Information furnished by KIIFB
Even though 26 schemes estimating to cost ₹15,575 crore were proposed to be
funded through KIIFB during 2016-17 and 2017-18, funds amounting to
₹47.83 crore in respect of two schemes alone has been released by KIIFB
during the period.
Apart from the above schemes, 182 road works, 69 bridges and flyovers and
41 Water Supply schemes were also intended to be implemented with the
investment from KIIFB amounting to `9,881 crore during 2017-18. Of these
292 works, the implementing institutions submitted project proposals for 55
works. Out of 55 works, three were sanctioned by KIIFB for `175.91 crore
and `21.08 crore has been released (November 2018) till date.
Audit also scrutinised nine new schemes under seven departments for which
`162.50 crore was announced in the budget speech 2017-18, which were to be
funded through the State Budget. Audit observed that an amount of `109.92
crore was incurred in respect of five7 schemes (out of nine) during 2017-18.
7 i. Barrier free scheme to introduce facilities in offices to enable differently abled persons
(Social Justice Department), ii. Biometric instruments in ration shops (Civil Supplies
Department), iii. Valsalyanidhi – a social security scheme linked with insurance policy for
girls belonging to Scheduled Caste (Scheduled Caste/Scheduled Tribes Development
Department), iv. Health Insurance Scheme for Government employees and pensioners
(Finance Department) and v. Formation of ‘Loka Kerala Sabha’ (Cultural Affairs
Department)
Chapter I – Finances of the State Government
7
Four8 other schemes were not implemented due to reasons such as non
availability of suitable land, waiting for model plan for implementing the
scheme, etc.
1.2 Resources of the State
1.2.1 Resources of the State as per the Annual Finance Accounts
Revenue and capital are the two streams of receipts that constitute the
resources of the State Government. Revenue receipts consist of Tax revenues,
Non-tax revenues, State’s share of union taxes and duties and Grants-in-aid
from the Government of India (GoI). Capital receipts comprise of
miscellaneous capital receipts such as proceeds from disinvestments,
recoveries of loans and advances, debt receipts from internal sources (market
loans, borrowings from other financial institutions/commercial banks) and
loans and advances from GoI. The funds available in the Public Accounts after
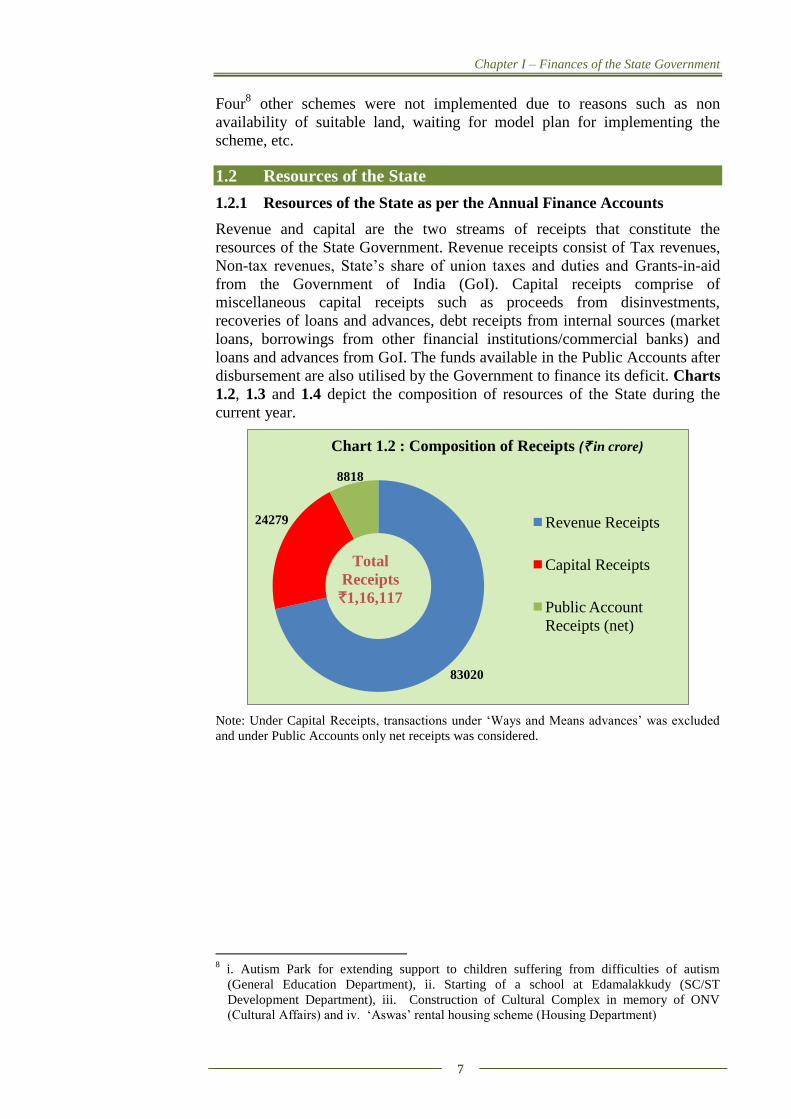
disbursement are also utilised by the Government to finance its deficit. Charts
1.2, 1.3 and 1.4 depict the composition of resources of the State during the
current year.
Note: Under Capital Receipts, transactions under ‘Ways and Means advances’ was excluded
and under Public Accounts only net receipts was considered.
8 i. Autism Park for extending support to children suffering from difficulties of autism
(General Education Department), ii. Starting of a school at Edamalakkudy (SC/ST
Development Department), iii. Construction of Cultural Complex in memory of ONV
(Cultural Affairs) and iv. ‘Aswas’ rental housing scheme (Housing Department)
83020
24279
8818
Chart 1.2 : Composition of Receipts (` in crore)
Revenue Receipts
Capital Receipts
Public Account
Receipts (net)
Total
Receipts
`1,16,117
(`i
n
c
r
o
r
e
)
State Finance Audit Report for the year ended 31 March 2018
8
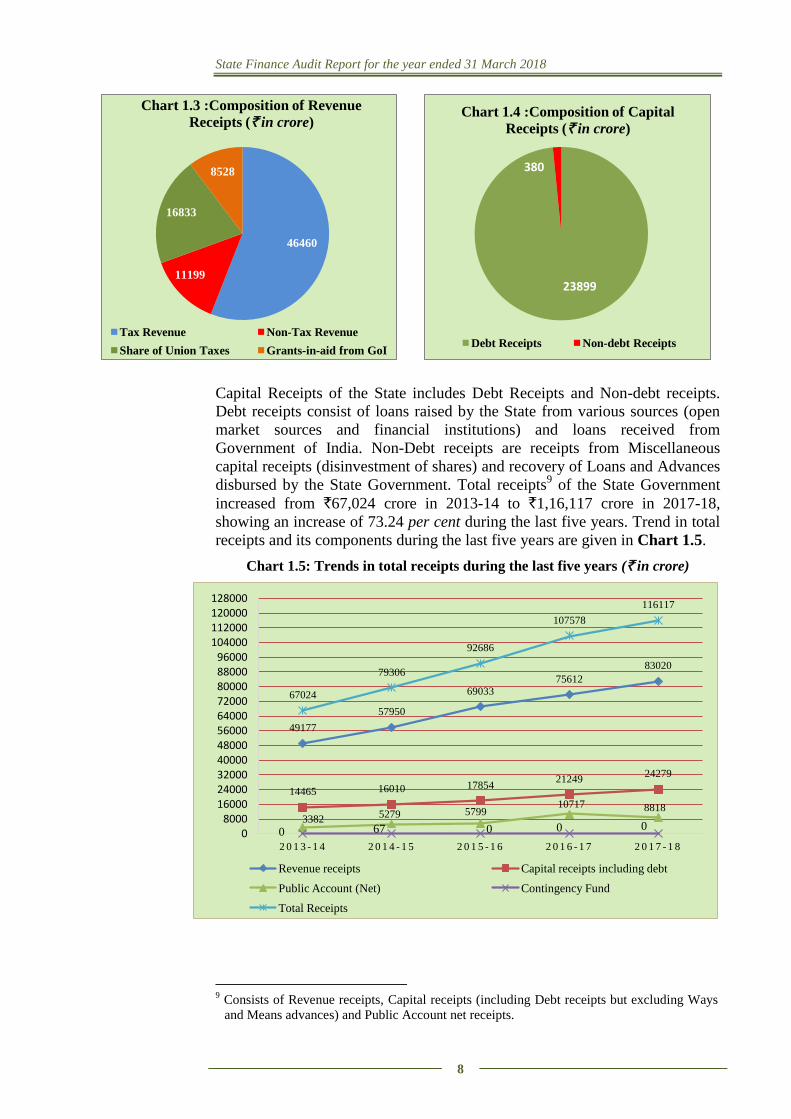
Capital Receipts of the State includes Debt Receipts and Non-debt receipts.
Debt receipts consist of loans raised by the State from various sources (open
market sources and financial institutions) and loans received from
Government of India. Non-Debt receipts are receipts from Miscellaneous
capital receipts (disinvestment of shares) and recovery of Loans and Advances
disbursed by the State Government. Total receipts9 of the State Government
increased from `67,024 crore in 2013-14 to `1,16,117 crore in 2017-18,
showing an increase of 73.24 per cent during the last five years. Trend in total
receipts and its components during the last five years are given in Chart 1.5.
Chart 1.5: Trends in total receipts during the last five years (` in crore)
9 Consists of Revenue receipts, Capital receipts (including Debt receipts but excluding Ways
and Means advances) and Public Account net receipts.
46460
11199
16833
8528
Chart 1.3 :Composition of Revenue
Receipts (` in crore)
Tax Revenue Non-Tax Revenue
Share of Union Taxes Grants-in-aid from GoI
23899
380
Chart 1.4 :Composition of Capital
Receipts (` in crore)
Debt Receipts Non-debt Receipts
49177
57950
69033 75612
83020
14465 16010 17854 21249
24279
3382 5279 5799
10717 8818
0 67 0 0 0
67024
79306
92686
107578
116117
0 8000
16000 24000 32000 40000 48000 56000 64000 72000 80000 88000 96000
104000 112000 120000 128000
2 0 1 3 - 1 4 2 0 1 4 - 1 5 2 0 1 5 - 1 6 2 0 1 6 - 1 7 2 0 1 7 - 1 8
Revenue receipts Capital receipts including debt
Public Account (Net) Contingency Fund
Total Receipts
Chapter I – Finances of the State Government
9
1.2.2 Direct transfer of Central Scheme Funds to Implementing
Agencies in the State (Funds routed outside State Budget)
Though the system of direct release of funds to state level implementing
agencies of GoI flagship programme was dispensed by GoI from 2014-15
onwards, GoI continues transferring funds directly to the State implementing
agencies for implementation of various schemes/programmes which are
recognized as critical. As these funds are not routed through the State Budget,
the Annual Finance Accounts do not capture the flow of these funds and to
that extent the State’s receipts and expenditure as well as other fiscal
variables/parameters derived from them are understated.
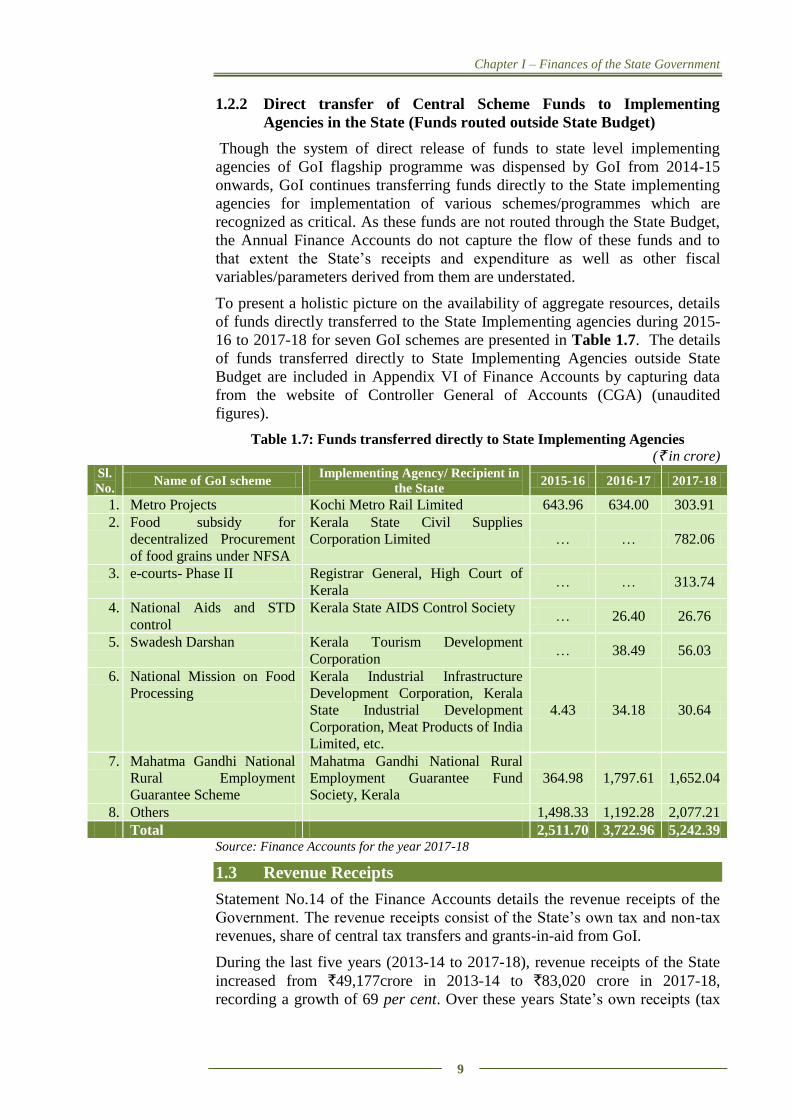
To present a holistic picture on the availability of aggregate resources, details
of funds directly transferred to the State Implementing agencies during 2015-
16 to 2017-18 for seven GoI schemes are presented in Table 1.7. The details
of funds transferred directly to State Implementing Agencies outside State
Budget are included in Appendix VI of Finance Accounts by capturing data
from the website of Controller General of Accounts (CGA) (unaudited
figures).
Table 1.7: Funds transferred directly to State Implementing Agencies
(` in crore) Sl.
No. Name of GoI scheme
Implementing Agency/ Recipient in
the State 2015-16 2016-17 2017-18
1. Metro Projects Kochi Metro Rail Limited 643.96 634.00 303.91
2. Food subsidy for
decentralized Procurement
of food grains under NFSA
Kerala State Civil Supplies
Corporation Limited … … 782.06
3. e-courts- Phase II Registrar General, High Court of
Kerala … … 313.74
4. National Aids and STD
control
Kerala State AIDS Control Society … 26.40 26.76
5. Swadesh Darshan Kerala Tourism Development
Corporation … 38.49 56.03
6. National Mission on Food
Processing
Kerala Industrial Infrastructure
Development Corporation, Kerala
State Industrial Development
Corporation, Meat Products of India
Limited, etc.
4.43 34.18 30.64
7. Mahatma Gandhi National
Rural Employment
Guarantee Scheme
Mahatma Gandhi National Rural
Employment Guarantee Fund
Society, Kerala
364.98 1,797.61 1,652.04
8. Others 1,498.33 1,192.28 2,077.21
Total 2,511.70 3,722.96 5,242.39 Source: Finance Accounts for the year 2017-18
1.3 Revenue Receipts
Statement No.14 of the Finance Accounts details the revenue receipts of the
Government. The revenue receipts consist of the State’s own tax and non-tax
revenues, share of central tax transfers and grants-in-aid from GoI.
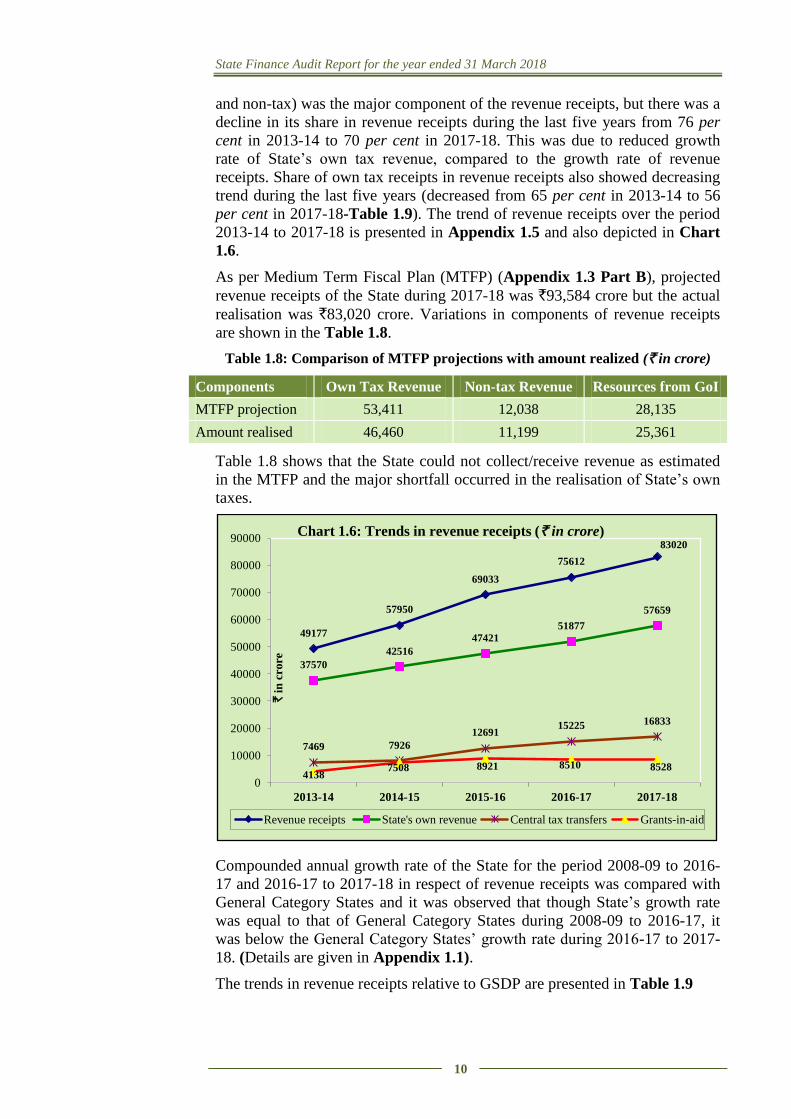
During the last five years (2013-14 to 2017-18), revenue receipts of the State
increased from `49,177crore in 2013-14 to `83,020 crore in 2017-18,
recording a growth of 69 per cent. Over these years State’s own receipts (tax
State Finance Audit Report for the year ended 31 March 2018
10
and non-tax) was the major component of the revenue receipts, but there was a
decline in its share in revenue receipts during the last five years from 76 per
cent in 2013-14 to 70 per cent in 2017-18. This was due to reduced growth
rate of State’s own tax revenue, compared to the growth rate of revenue
receipts. Share of own tax receipts in revenue receipts also showed decreasing
trend during the last five years (decreased from 65 per cent in 2013-14 to 56
per cent in 2017-18-Table 1.9). The trend of revenue receipts over the period
2013-14 to 2017-18 is presented in Appendix 1.5 and also depicted in Chart
1.6.
As per Medium Term Fiscal Plan (MTFP) (Appendix 1.3 Part B), projected
revenue receipts of the State during 2017-18 was `93,584 crore but the actual
realisation was `83,020 crore. Variations in components of revenue receipts
are shown in the Table 1.8.
Table 1.8: Comparison of MTFP projections with amount realized (` in crore)
Components Own Tax Revenue Non-tax Revenue Resources from GoI
MTFP projection 53,411 12,038 28,135
Amount realised 46,460 11,199 25,361
Table 1.8 shows that the State could not collect/receive revenue as estimated
in the MTFP and the major shortfall occurred in the realisation of State’s own
taxes.
Compounded annual growth rate of the State for the period 2008-09 to 2016-
17 and 2016-17 to 2017-18 in respect of revenue receipts was compared with
General Category States and it was observed that though State’s growth rate
was equal to that of General Category States during 2008-09 to 2016-17, it
was below the General Category States’ growth rate during 2016-17 to 2017-
18. (Details are given in Appendix 1.1).
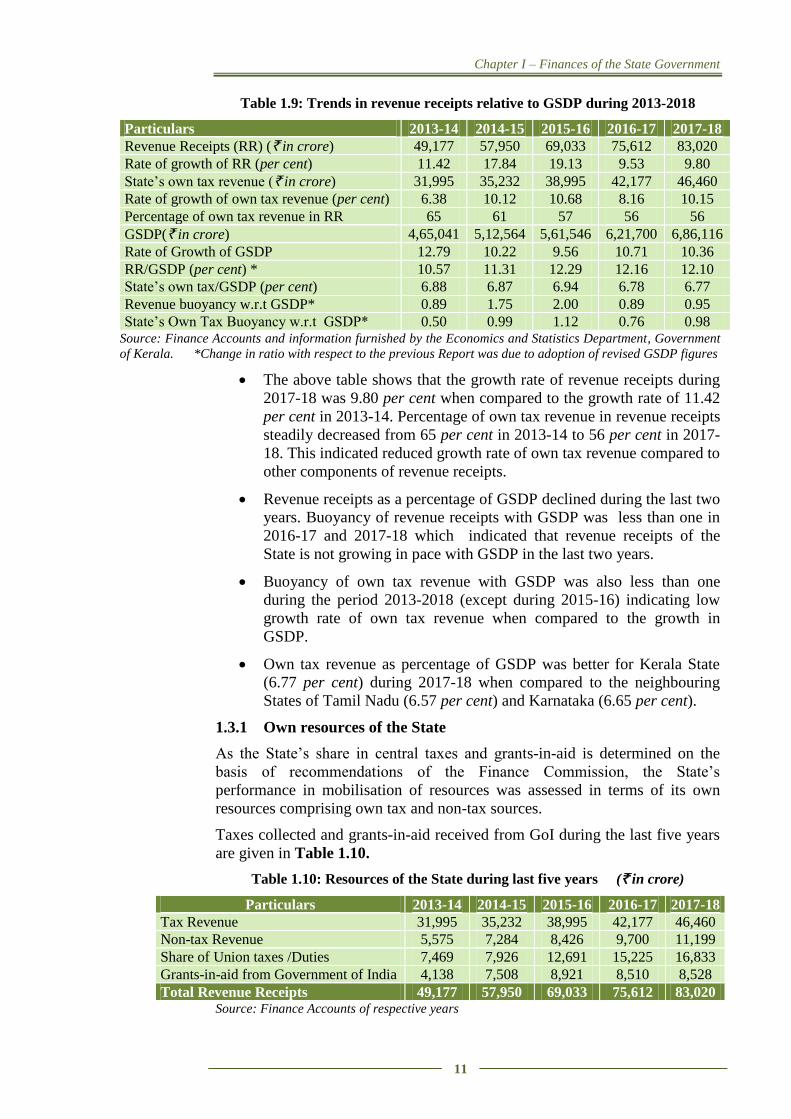
The trends in revenue receipts relative to GSDP are presented in Table 1.9
49177
57950
69033
75612
83020
37570
42516
47421
51877
57659
7469 7926
12691 15225 16833
4138 7508 8921 8510 8528
0
10000
20000
30000
40000
50000
60000
70000
80000
90000
2013-14 2014-15 2015-16 2016-17 2017-18
` in
cro
re
Chart 1.6: Trends in revenue receipts (` in crore)
Revenue receipts State's own revenue Central tax transfers Grants-in-aid
Chapter I – Finances of the State Government
11
Table 1.9: Trends in revenue receipts relative to GSDP during 2013-2018
Particulars 2013-14 2014-15 2015-16 2016-17 2017-18
Revenue Receipts (RR) (` in crore) 49,177 57,950 69,033 75,612 83,020
Rate of growth of RR (per cent) 11.42 17.84 19.13 9.53 9.80
State’s own tax revenue (` in crore) 31,995 35,232 38,995 42,177 46,460
Rate of growth of own tax revenue (per cent) 6.38 10.12 10.68 8.16 10.15
Percentage of own tax revenue in RR 65 61 57 56 56
GSDP(` in crore) 4,65,041 5,12,564 5,61,546 6,21,700 6,86,116
Rate of Growth of GSDP 12.79 10.22 9.56 10.71 10.36
RR/GSDP (per cent) * 10.57 11.31 12.29 12.16 12.10
State’s own tax/GSDP (per cent) 6.88 6.87 6.94 6.78 6.77
Revenue buoyancy w.r.t GSDP* 0.89 1.75 2.00 0.89 0.95
State’s Own Tax Buoyancy w.r.t GSDP* 0.50 0.99 1.12 0.76 0.98 Source: Finance Accounts and information furnished by the Economics and Statistics Department, Government
of Kerala. *Change in ratio with respect to the previous Report was due to adoption of revised GSDP figures
The above table shows that the growth rate of revenue receipts during
2017-18 was 9.80 per cent when compared to the growth rate of 11.42
per cent in 2013-14. Percentage of own tax revenue in revenue receipts
steadily decreased from 65 per cent in 2013-14 to 56 per cent in 2017-
18. This indicated reduced growth rate of own tax revenue compared to
other components of revenue receipts.
Revenue receipts as a percentage of GSDP declined during the last two
years. Buoyancy of revenue receipts with GSDP was less than one in
2016-17 and 2017-18 which indicated that revenue receipts of the
State is not growing in pace with GSDP in the last two years.
Buoyancy of own tax revenue with GSDP was also less than one
during the period 2013-2018 (except during 2015-16) indicating low
growth rate of own tax revenue when compared to the growth in
GSDP.
Own tax revenue as percentage of GSDP was better for Kerala State
(6.77 per cent) during 2017-18 when compared to the neighbouring
States of Tamil Nadu (6.57 per cent) and Karnataka (6.65 per cent).
1.3.1 Own resources of the State
As the State’s share in central taxes and grants-in-aid is determined on the
basis of recommendations of the Finance Commission, the State’s
performance in mobilisation of resources was assessed in terms of its own
resources comprising own tax and non-tax sources.
Taxes collected and grants-in-aid received from GoI during the last five years
are given in Table 1.10.
Table 1.10: Resources of the State during last five years (` in crore)
Particulars 2013-14 2014-15 2015-16 2016-17 2017-18
Tax Revenue 31,995 35,232 38,995 42,177 46,460
Non-tax Revenue 5,575 7,284 8,426 9,700 11,199
Share of Union taxes /Duties 7,469 7,926 12,691 15,225 16,833
Grants-in-aid from Government of India 4,138 7,508 8,921 8,510 8,528
Total Revenue Receipts 49,177 57,950 69,033 75,612 83,020 Source: Finance Accounts of respective years
State Finance Audit Report for the year ended 31 March 2018
12
Table 1.10 shows that all the revenue resources (except State’s own tax
revenue) of the State doubled during the five year period. However, State’s
own tax revenue increased only by 45 per cent during the same period. State
Government need to address this reduced growth as own tax revenue is the
main source of revenue of the State.
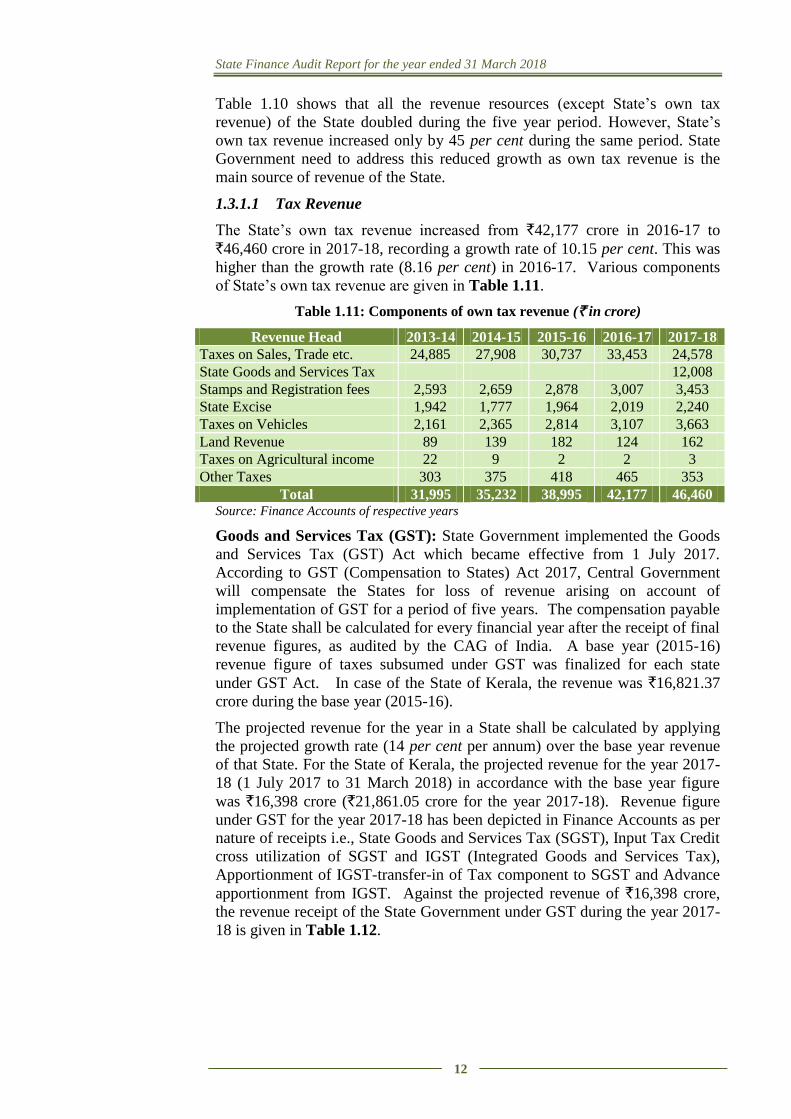
1.3.1.1 Tax Revenue
The State’s own tax revenue increased from `42,177 crore in 2016-17 to
`46,460 crore in 2017-18, recording a growth rate of 10.15 per cent. This was
higher than the growth rate (8.16 per cent) in 2016-17. Various components
of State’s own tax revenue are given in Table 1.11.
Table 1.11: Components of own tax revenue (` in crore)
Revenue Head 2013-14 2014-15 2015-16 2016-17 2017-18
Taxes on Sales, Trade etc. 24,885 27,908 30,737 33,453 24,578
State Goods and Services Tax 12,008
Stamps and Registration fees 2,593 2,659 2,878 3,007 3,453
State Excise 1,942 1,777 1,964 2,019 2,240
Taxes on Vehicles 2,161 2,365 2,814 3,107 3,663
Land Revenue 89 139 182 124 162
Taxes on Agricultural income 22 9 2 2 3
Other Taxes 303 375 418 465 353
Total 31,995 35,232 38,995 42,177 46,460 Source: Finance Accounts of respective years
Goods and Services Tax (GST): State Government implemented the Goods
and Services Tax (GST) Act which became effective from 1 July 2017.
According to GST (Compensation to States) Act 2017, Central Government
will compensate the States for loss of revenue arising on account of
implementation of GST for a period of five years. The compensation payable
to the State shall be calculated for every financial year after the receipt of final
revenue figures, as audited by the CAG of India. A base year (2015-16)
revenue figure of taxes subsumed under GST was finalized for each state
under GST Act. In case of the State of Kerala, the revenue was `16,821.37
crore during the base year (2015-16).
The projected revenue for the year in a State shall be calculated by applying
the projected growth rate (14 per cent per annum) over the base year revenue
of that State. For the State of Kerala, the projected revenue for the year 2017-
18 (1 July 2017 to 31 March 2018) in accordance with the base year figure
was `16,398 crore (`21,861.05 crore for the year 2017-18). Revenue figure
under GST for the year 2017-18 has been depicted in Finance Accounts as per
nature of receipts i.e., State Goods and Services Tax (SGST), Input Tax Credit
cross utilization of SGST and IGST (Integrated Goods and Services Tax),
Apportionment of IGST-transfer-in of Tax component to SGST and Advance
apportionment from IGST. Against the projected revenue of `16,398 crore,
the revenue receipt of the State Government under GST during the year 2017-
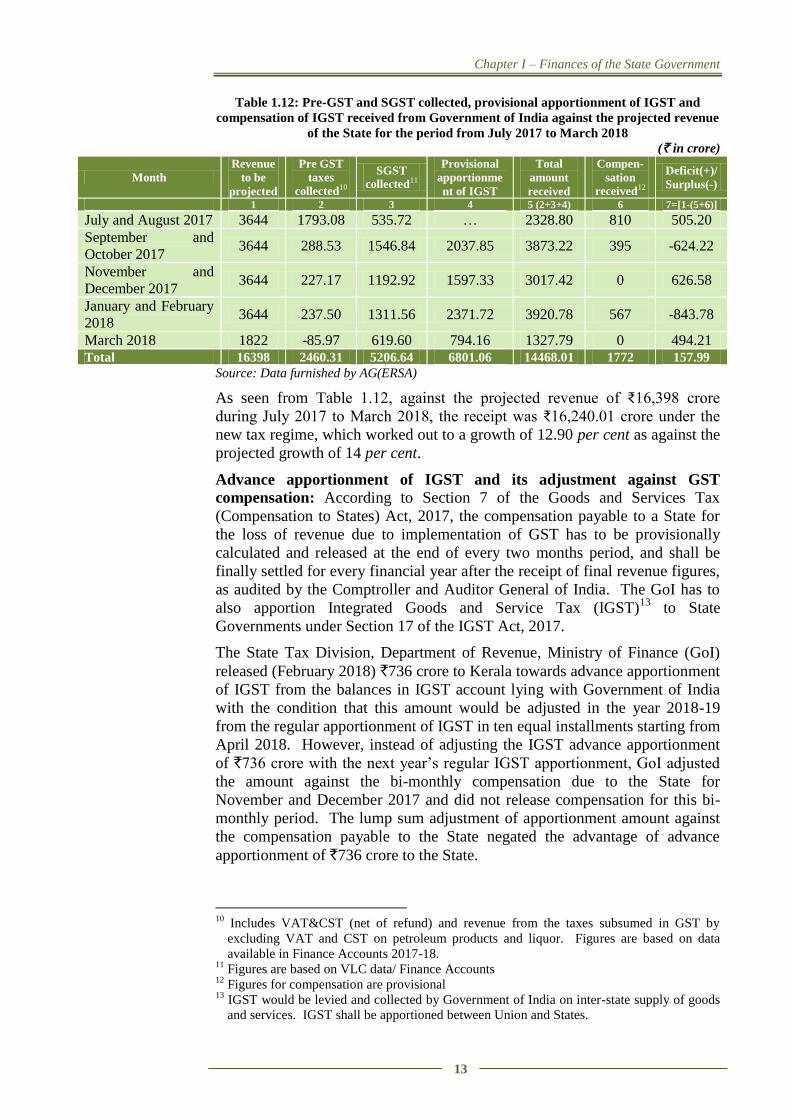
18 is given in Table 1.12.
Chapter I – Finances of the State Government
13
Table 1.12: Pre-GST and SGST collected, provisional apportionment of IGST and
compensation of IGST received from Government of India against the projected revenue
of the State for the period from July 2017 to March 2018
(` in crore)
Month
Revenue
to be
projected
Pre GST
taxes
collected10
SGST
collected11
Provisional
apportionme
nt of IGST
Total
amount
received
Compen-
sation
received12
Deficit(+)/
Surplus(-)
1 2 3 4 5 (2+3+4) 6 7=[1-(5+6)]
July and August 2017 3644 1793.08 535.72 … 2328.80 810 505.20
September and
October 2017 3644 288.53 1546.84 2037.85 3873.22 395 -624.22
November and
December 2017 3644 227.17 1192.92 1597.33 3017.42 0 626.58
January and February
2018 3644 237.50 1311.56 2371.72 3920.78 567 -843.78
March 2018 1822 -85.97 619.60 794.16 1327.79 0 494.21 Total 16398 2460.31 5206.64 6801.06 14468.01 1772 157.99
Source: Data furnished by AG(ERSA)
As seen from Table 1.12, against the projected revenue of ₹16,398 crore
during July 2017 to March 2018, the receipt was ₹16,240.01 crore under the
new tax regime, which worked out to a growth of 12.90 per cent as against the
projected growth of 14 per cent.
Advance apportionment of IGST and its adjustment against GST
compensation: According to Section 7 of the Goods and Services Tax
(Compensation to States) Act, 2017, the compensation payable to a State for
the loss of revenue due to implementation of GST has to be provisionally
calculated and released at the end of every two months period, and shall be
finally settled for every financial year after the receipt of final revenue figures,
as audited by the Comptroller and Auditor General of India. The GoI has to
also apportion Integrated Goods and Service Tax (IGST)13
to State
Governments under Section 17 of the IGST Act, 2017.
The State Tax Division, Department of Revenue, Ministry of Finance (GoI)
released (February 2018) `736 crore to Kerala towards advance apportionment
of IGST from the balances in IGST account lying with Government of India
with the condition that this amount would be adjusted in the year 2018-19
from the regular apportionment of IGST in ten equal installments starting from
April 2018. However, instead of adjusting the IGST advance apportionment
of `736 crore with the next year’s regular IGST apportionment, GoI adjusted
the amount against the bi-monthly compensation due to the State for
November and December 2017 and did not release compensation for this bi-
monthly period. The lump sum adjustment of apportionment amount against
the compensation payable to the State negated the advantage of advance
apportionment of `736 crore to the State.
10
Includes VAT&CST (net of refund) and revenue from the taxes subsumed in GST by
excluding VAT and CST on petroleum products and liquor. Figures are based on data
available in Finance Accounts 2017-18. 11
Figures are based on VLC data/ Finance Accounts 12
Figures for compensation are provisional 13
IGST would be levied and collected by Government of India on inter-state supply of goods
and services. IGST shall be apportioned between Union and States.

State Finance Audit Report for the year ended 31 March 2018
14
1.3.1.2 Non-tax Revenue
Receipts under ‘State Lotteries’ is the major source of non-tax revenue of the
State for the last five years and its share in non-tax revenue increased from 68
per cent in 2013-14 to 81 per cent in 2017-18. During the five year period,
receipts from State Lotteries also recorded an increase of 138 per cent. Major
sources of non-tax revenue of the State are given in Table 1.13.
Table 1.13: Components of non-tax revenue (` in crore)
Revenue Head 2013-14 2014-15 2015-16 2016-17 2017-18
Interest receipts 149 102 105 144 144
Dividends and profits 101 74 90 96 126
State Lotteries 3,796 5,445 6,271 7,283 9,034
Forestry and Wildlife 330 300 283 297 245
Other non-tax receipts 1,199 1,363 1,677 1,880 1,650
Total 5,575 7,284 8,426 9,700 11,199 Source: Finance Accounts of respective years
Though the receipts under State Lotteries was `9,034 crore, an equally high
expenditure of `7,628 crore on distribution of prizes, agent commission, etc.
reduced the net yield to `1,406 crore during the year.
1.3.2 Grants-in-aid from Government of India
Grants-in-aid from the GoI increased marginally by `18 crore from `8,510
crore in 2016-17 to `8,528 crore in 2017-18 as detailed in Table 1.14.
Table 1.14: Status of Grants-in-aid received from Government of India (` in crore)
Particulars 2013-14 2014-15 2015-16 2016-17 2017-18
Non-plan grants* 1,679 1,984 5,178 5,250 …
Grants for State plan schemes* 1,154 4,929 3,406 2,727 …
Grants for central plan schemes* 87 158 170 71 …
Grants for Centrally sponsored
plan schemes* 1,218 437 167 462 …
Centrally sponsored schemes** … … … … 3,213
Finance Commission Grants** … … … … 3,182
Other Transfer/Grants to States** … … … … 2,133
Total 4,138 7,508 8,921 8,510 8,528
Source: Finance Accounts of respective years
* Not operational from 1.4.2017 consequent on merger of Plan and non-plan classification by GoI
** New sub major heads opened for fresh transactions w.e.f.1.4.2017
As part of structural reforms GoI had dispensed distinction between Plan and
Non-plan classification from the year 2017-18 onwards and introduced new
sub major heads and minor heads for accounting grant-in-aid. State
Government received `1,529 crore as ‘Post Devolution Revenue Deficit
Grant’ based on the recommendations of Fourteenth Finance Commission to
cover the revenue deficit of the State Government during 2017-18. State also
received `1,772 crore under ‘Other Transfer/Grants to States’ as compensation
of loss of revenue arising out of implementation of GST.
1.3.3 Efficiency in Tax collection
The average expenditure on tax collection in respect of four major revenue
sources of the State compared with all India average, during the last five years,
Chapter I – Finances of the State Government
15
is given in Appendix 1.6. It shows that in respect of two major revenue
sources, viz. Stamps (Non-judicial) and Registration fees and State Excise, the
average tax collection expenditure of the State was much higher than the all
India average from 2013-14 to 2016-17. Expenditure on collection in respect
of Taxes on Vehicles was better than the All India average of expenditure on
tax collection except during 2016-17.
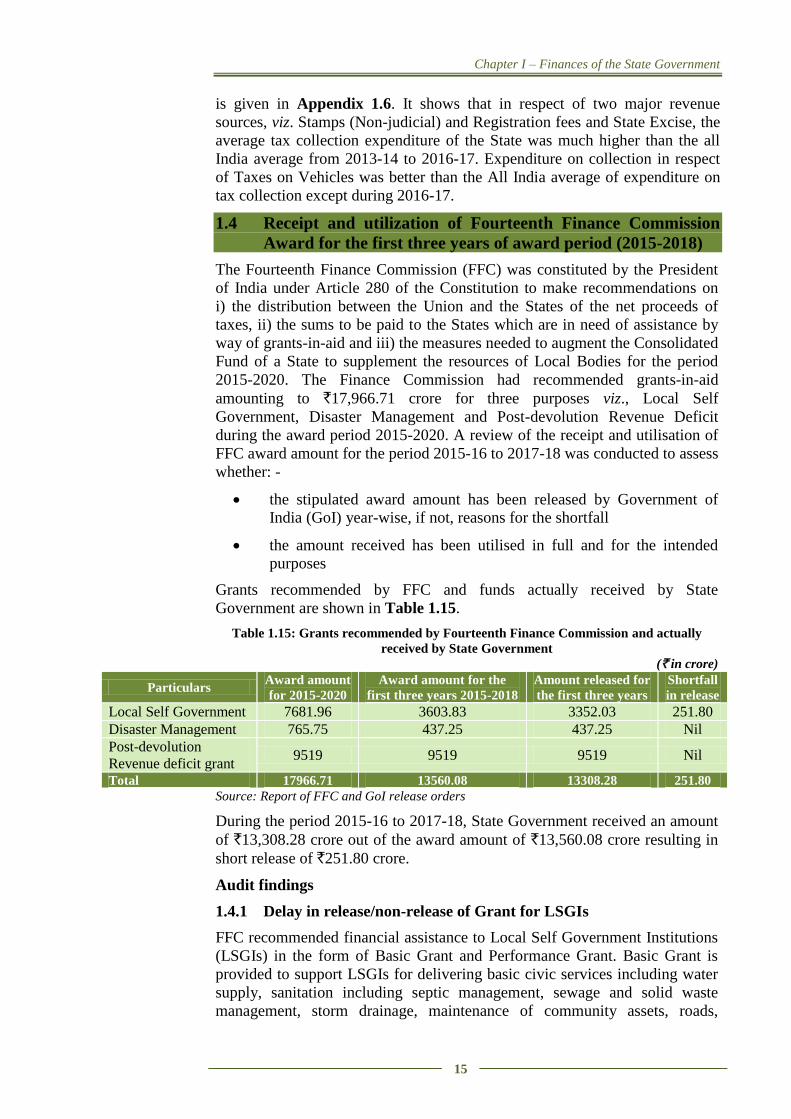
1.4 Receipt and utilization of Fourteenth Finance Commission
Award for the first three years of award period (2015-2018)
The Fourteenth Finance Commission (FFC) was constituted by the President
of India under Article 280 of the Constitution to make recommendations on
i) the distribution between the Union and the States of the net proceeds of
taxes, ii) the sums to be paid to the States which are in need of assistance by
way of grants-in-aid and iii) the measures needed to augment the Consolidated
Fund of a State to supplement the resources of Local Bodies for the period
2015-2020. The Finance Commission had recommended grants-in-aid
amounting to `17,966.71 crore for three purposes viz., Local Self
Government, Disaster Management and Post-devolution Revenue Deficit
during the award period 2015-2020. A review of the receipt and utilisation of
FFC award amount for the period 2015-16 to 2017-18 was conducted to assess
whether: -
the stipulated award amount has been released by Government of
India (GoI) year-wise, if not, reasons for the shortfall
the amount received has been utilised in full and for the intended
purposes
Grants recommended by FFC and funds actually received by State
Government are shown in Table 1.15.
Table 1.15: Grants recommended by Fourteenth Finance Commission and actually
received by State Government
(` in crore)
Particulars Award amount
for 2015-2020
Award amount for the
first three years 2015-2018
Amount released for
the first three years
Shortfall
in release
Local Self Government 7681.96 3603.83 3352.03 251.80
Disaster Management 765.75 437.25 437.25 Nil
Post-devolution
Revenue deficit grant 9519 9519 9519 Nil
Total 17966.71 13560.08 13308.28 251.80
Source: Report of FFC and GoI release orders
During the period 2015-16 to 2017-18, State Government received an amount
of `13,308.28 crore out of the award amount of `13,560.08 crore resulting in
short release of `251.80 crore.
Audit findings
1.4.1 Delay in release/non-release of Grant for LSGIs
FFC recommended financial assistance to Local Self Government Institutions
(LSGIs) in the form of Basic Grant and Performance Grant. Basic Grant is
provided to support LSGIs for delivering basic civic services including water
supply, sanitation including septic management, sewage and solid waste
management, storm drainage, maintenance of community assets, roads,
State Finance Audit Report for the year ended 31 March 2018
16
footpaths, street lighting, burial and cremation grounds and any other basic
services within the functions assigned to LSGIs under relevant legislations.
Performance Grant was designed to serve the purpose of ensuring reliable
audited accounts and data of receipts and expenditure and improvement in
own revenues of LSGIs. Audit noticed delay in release of grant/non-release
of basic as well as performance grant as detailed below:
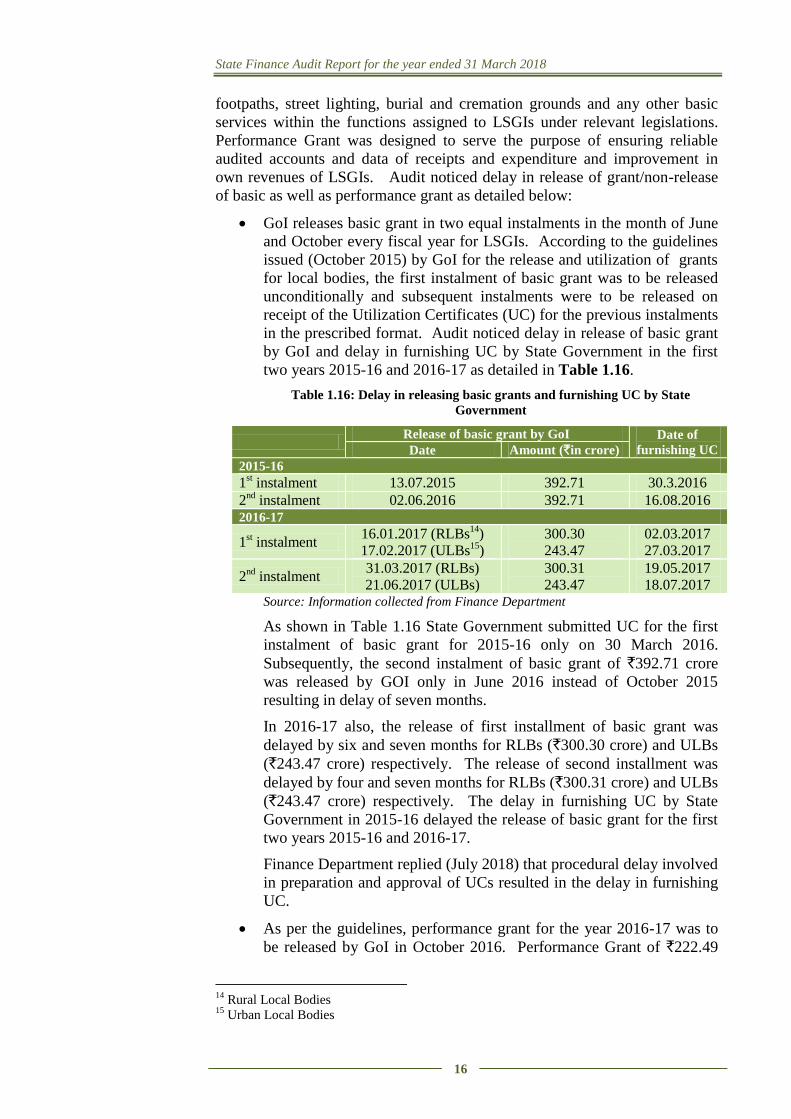
GoI releases basic grant in two equal instalments in the month of June
and October every fiscal year for LSGIs. According to the guidelines
issued (October 2015) by GoI for the release and utilization of grants
for local bodies, the first instalment of basic grant was to be released
unconditionally and subsequent instalments were to be released on
receipt of the Utilization Certificates (UC) for the previous instalments
in the prescribed format. Audit noticed delay in release of basic grant
by GoI and delay in furnishing UC by State Government in the first
two years 2015-16 and 2016-17 as detailed in Table 1.16.
Table 1.16: Delay in releasing basic grants and furnishing UC by State
Government
Release of basic grant by GoI Date of
furnishing UC Date Amount (`in crore)
2015-16
1st instalment 13.07.2015 392.71 30.3.2016
2nd
instalment 02.06.2016 392.71 16.08.2016 2016-17
1st instalment
16.01.2017 (RLBs14
)
17.02.2017 (ULBs15
)
300.30
243.47
02.03.2017
27.03.2017
2nd
instalment 31.03.2017 (RLBs)
21.06.2017 (ULBs)
300.31
243.47
19.05.2017
18.07.2017 Source: Information collected from Finance Department
As shown in Table 1.16 State Government submitted UC for the first
instalment of basic grant for 2015-16 only on 30 March 2016.
Subsequently, the second instalment of basic grant of `392.71 crore
was released by GOI only in June 2016 instead of October 2015
resulting in delay of seven months.
In 2016-17 also, the release of first installment of basic grant was
delayed by six and seven months for RLBs (`300.30 crore) and ULBs
(`243.47 crore) respectively. The release of second installment was
delayed by four and seven months for RLBs (`300.31 crore) and ULBs
(`243.47 crore) respectively. The delay in furnishing UC by State
Government in 2015-16 delayed the release of basic grant for the first
two years 2015-16 and 2016-17.
Finance Department replied (July 2018) that procedural delay involved
in preparation and approval of UCs resulted in the delay in furnishing
UC.
As per the guidelines, performance grant for the year 2016-17 was to
be released by GoI in October 2016. Performance Grant of `222.49
14
Rural Local Bodies 15
Urban Local Bodies
Chapter I – Finances of the State Government
17
crore for 2016-17 due for release in October 2016 was released by GoI
in January 2017 for ULBs (`143.71 crore) and in March 2017 for
RLBs (`78.78 crore). Further, as per guidelines, the State Government
has to design a detailed procedure/scheme for disbursal of the
Performance Grant and notify it by March 2016 and furnish the details
of the scheme to GoI. However, the State Government issued the
notification and furnished the information to GoI only in October
2016. Due to delay in issuing the notification, the release of
Performance Grant for 2016-17 was delayed by five months and three
months for RLBs and ULBs respectively. Local Self Government
(FM) Department replied (August 2018) that delay in notification was
due to the delay in completion of annual audit of accounts of LSGIs
for the year 2013-14 and 2014-15.
Ministry of Panchayati Raj, GoI forwarded a revised scheme
(September 2017) for disbursal of Performance Grant for the period
2017-18 to 2019-20 under FFC to State Government for notifying the
same by State Government. The State Government was also directed
to collect data towards the performance of LSGIs in the State and to
send the information to GoI by 31 October 2017 for receipt of
Performance Grant for 2017-18. However, the State Government
notified the revised scheme and furnished the requisite information to
GoI only by the end of March 2018. Hence, Performance Grant
amounting to `251.80 crore for the year 2017-18 due for release in
October 2017 has not been released by GoI during the year. Local Self
Government (FM) Department replied (August 2018) that the delay
occurred due to modifications suggested by GoI in the
scheme/guidelines.
1.4.2 Incorrect allotment of Performance Grant to LSGIs
The FFC recommended that 10 per cent and 20 per cent of the allocated
amount be released to RLBs and ULBs respectively as Performance Grant, on
fulfillment of stipulated conditions such as submission of audited accounts
relating to the year not earlier than two years preceding the year in which the
RLBs/ ULBs seek to claim the Performance Grant, increase in own revenue
over the preceding year, etc. In addition, ULBs must measure and publish the
Service Level Benchmarks relating to basic urban services each year for the
award period and make it publicly available. After disbursement of
Performance Grant to the eligible RLBs or ULBs, the undisbursed amount, if
any, should be distributed on equitable basis among all the eligible RLBs or
ULBs.
During the year 2016-17, GoI released Performance Grant of `222.49 crore to
LSGIs. It was observed that the State Government authorized (April,
November 2016 and January 2017) the Performance Grant for the year 2016-
17 to all RLBs and ULBs without insisting on compliance with the eligibility
criteria.
As per FFC recommendation, the Performance Grant due for the ineligible
local bodies was to be distributed among eligible ones. Since the State
Government released the amount of Performance Grant to all the RLBs and
ULBs, without insisting on conditions of eligibility, it was later found that the
State Finance Audit Report for the year ended 31 March 2018
18
eligible LSGIs received lesser amounts than their due share. In order to
compensate them, Government released an amount of `33.26 crore from
Consolidated Fund to eligible RLBs and ULBs in April 2017 and July 2017
respectively.
Thus, the release of Performance Grant to all the RLBs and ULBs without
following the FFC guidelines resulted in an extra expenditure of `33.26 crore
for the State Government.
The Finance Department replied (September 2018) that the State Government
had already authorized the Performance Grant to LSGIs during 2016-17
before the receipt of instructions from GoI regarding eligibility. The reply is
not acceptable as the instructions regarding eligibility criteria for release of
Performance Grant were clearly stated in the guidelines for release and
utilization of FFC grant issued by GoI in October 2015.
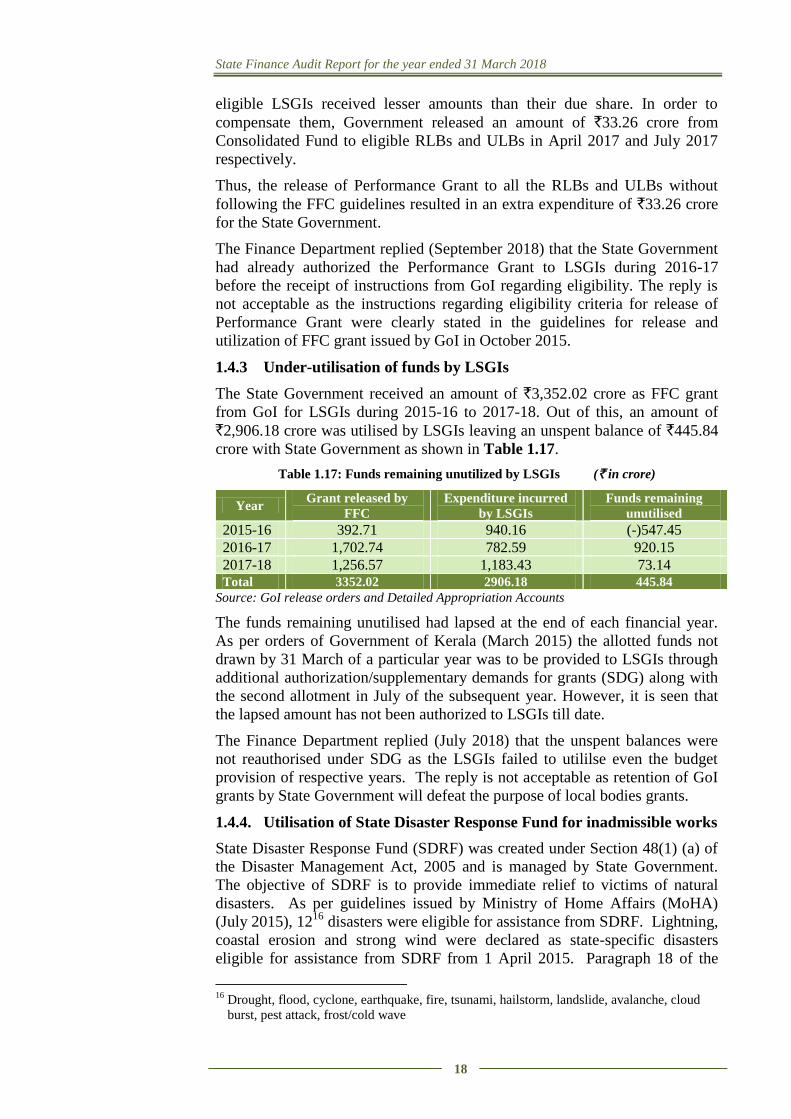
1.4.3 Under-utilisation of funds by LSGIs
The State Government received an amount of `3,352.02 crore as FFC grant
from GoI for LSGIs during 2015-16 to 2017-18. Out of this, an amount of
`2,906.18 crore was utilised by LSGIs leaving an unspent balance of `445.84
crore with State Government as shown in Table 1.17.
Table 1.17: Funds remaining unutilized by LSGIs (` in crore)
Year Grant released by
FFC
Expenditure incurred
by LSGIs
Funds remaining
unutilised
2015-16 392.71 940.16 (-)547.45
2016-17 1,702.74 782.59 920.15
2017-18 1,256.57 1,183.43 73.14 Total 3352.02 2906.18 445.84
Source: GoI release orders and Detailed Appropriation Accounts
The funds remaining unutilised had lapsed at the end of each financial year.
As per orders of Government of Kerala (March 2015) the allotted funds not
drawn by 31 March of a particular year was to be provided to LSGIs through
additional authorization/supplementary demands for grants (SDG) along with
the second allotment in July of the subsequent year. However, it is seen that
the lapsed amount has not been authorized to LSGIs till date.
The Finance Department replied (July 2018) that the unspent balances were
not reauthorised under SDG as the LSGIs failed to utililse even the budget
provision of respective years. The reply is not acceptable as retention of GoI
grants by State Government will defeat the purpose of local bodies grants.
1.4.4. Utilisation of State Disaster Response Fund for inadmissible works
State Disaster Response Fund (SDRF) was created under Section 48(1) (a) of
the Disaster Management Act, 2005 and is managed by State Government.
The objective of SDRF is to provide immediate relief to victims of natural
disasters. As per guidelines issued by Ministry of Home Affairs (MoHA)
(July 2015), 1216
disasters were eligible for assistance from SDRF. Lightning,
coastal erosion and strong wind were declared as state-specific disasters
eligible for assistance from SDRF from 1 April 2015. Paragraph 18 of the
16
Drought, flood, cyclone, earthquake, fire, tsunami, hailstorm, landslide, avalanche, cloud
burst, pest attack, frost/cold wave
Chapter I – Finances of the State Government
19
guidelines stipulates that the provision for preparedness/mitigation should not
be part of SDRF and the same is to be met from normal budgetary heads/State
Plan funds. However, scrutiny of records17
revealed that SDRF was utilised
for events which did not conform to the SDRF guidelines/norms as detailed
below:
1.4.4.1 Road works under flood relief
As per the revised list of items for assistance from SDRF issued by MoHA
(April 2015), only repair/restoration work of damaged roads (immediate
nature) such as filling up of breaches and potholes, use of pipe for creating
waterways, etc., can be met from SDRF. A total of 816 road works
amounting to `41.76 crore were carried out in Thiruvananthapuram and
Kollam Districts using funds from SDRF during the period from 2015-16 to
2017-18. Audit scrutinized records of 81 out of 816 road works involving
`3.92 crore. Audit scrutiny revealed that the entire expenditure of `3.92 crore
was inadmissible as the works done were regular road maintenance/
improvement works like conversion of earthen road to concrete road, metaling
and tarring of roads, repair of roads damaged due to cabling work, concreting
of footpath etc., and not for the type of urgent works permissible under SDRF
norms like filling up of breaches and potholes etc. The details are shown in
Appendix 1.7.
Government replied (October 2018) that SDRF was utilized for repairs and
restoration of roads damaged during floods. The reply is not acceptable as the
expenditure incurred was for regular maintenance works of roads, restoration
of damages caused by routine inundation due to rain etc and not for repair
works of immediate nature permitted under SDRF guidelines and norms.
1.4.4.2 Works executed under drought relief
As per the revised list of items for assistance from SDRF issued by MoHA
(April 2015), emergency supply of drinking water as part of relief measure
and repairs/restoration (immediate nature) of damaged infrastructure can be
met from SDRF. However, audit scrutiny revealed that SDRF was utilised for
inadmissible drought relief activities in selected districts during 2015-16 as
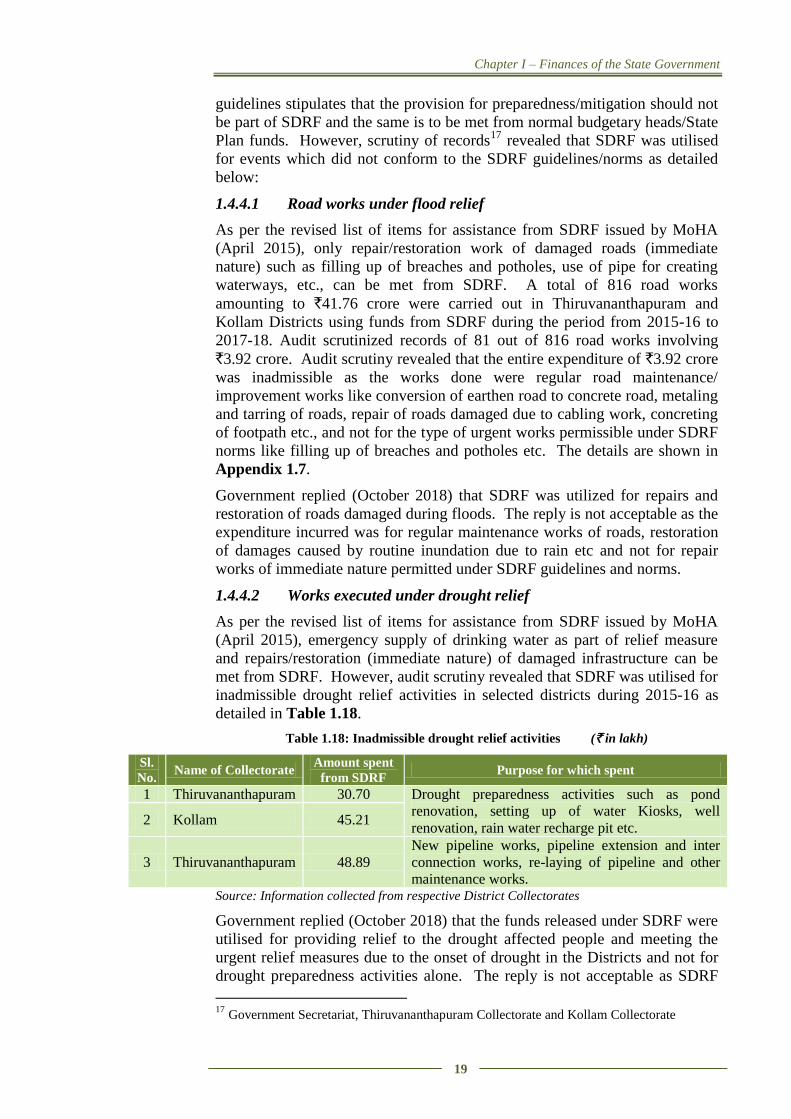
detailed in Table 1.18.
Table 1.18: Inadmissible drought relief activities (` in lakh)
Sl.
No. Name of Collectorate
Amount spent
from SDRF Purpose for which spent
1 Thiruvananthapuram 30.70 Drought preparedness activities such as pond
renovation, setting up of water Kiosks, well
renovation, rain water recharge pit etc. 2 Kollam 45.21
3 Thiruvananthapuram 48.89
New pipeline works, pipeline extension and inter
connection works, re-laying of pipeline and other
maintenance works. Source: Information collected from respective District Collectorates
Government replied (October 2018) that the funds released under SDRF were
utilised for providing relief to the drought affected people and meeting the
urgent relief measures due to the onset of drought in the Districts and not for
drought preparedness activities alone. The reply is not acceptable as SDRF
17
Government Secretariat, Thiruvananthapuram Collectorate and Kollam Collectorate
State Finance Audit Report for the year ended 31 March 2018
20
could not be utilized for drought preparedness activities. Expenditure
incurred for new pipeline works, pipe line extension and inter-connection
works, etc., are also inadmissible as these are new works and not assets
damaged due to any notified disaster.
1.4.5 Non-provision of interest by the State Government
As per guidelines on Constitution and Administration of SDRF issued by
MoHA, State Governments shall constitute SDRF in the Public Account under
the Reserve Fund bearing interest under the major head ‘8121-General and
other Reserve Fund.’ The guidelines stipulate that immediately upon receipt
of Government of India’s share, the State Government would transfer the
amount, along with their share to the Public Account Head within 15 days of
receipt of GoI share. Any delay will require the State Government to release
the amount, with interest, at Bank rate of RBI, for the number of days of
delay. It is seen that there was delay ranging from 41 to 132 days in issuing
Government Orders by Disaster Management Department for transferring the
funds received from GoI along with State share to SDRF account.
However, the State had not provided any interest for the delay in transferring
GoI funds to SDRF Account. The interest liability works out to `6.64 crore
calculated at average bank rate of RBI of seven per cent prevailing during the
period.
Disaster Management Department replied (September 2018) that earnest
efforts would be taken to issue Government Orders on time to transfer credit
the GoI fund to SDRF account in future. The existing interest liability is yet
to be credited to SDRF.
1.5 Capital Receipts
Capital receipts comprise of Miscellaneous Capital Receipts, Recovery of
Loans and Advances released to Government institutions and Public Debt
Receipts. Trends in receipts under capital sector are detailed in Table 1.19.
Chapter I – Finances of the State Government
21
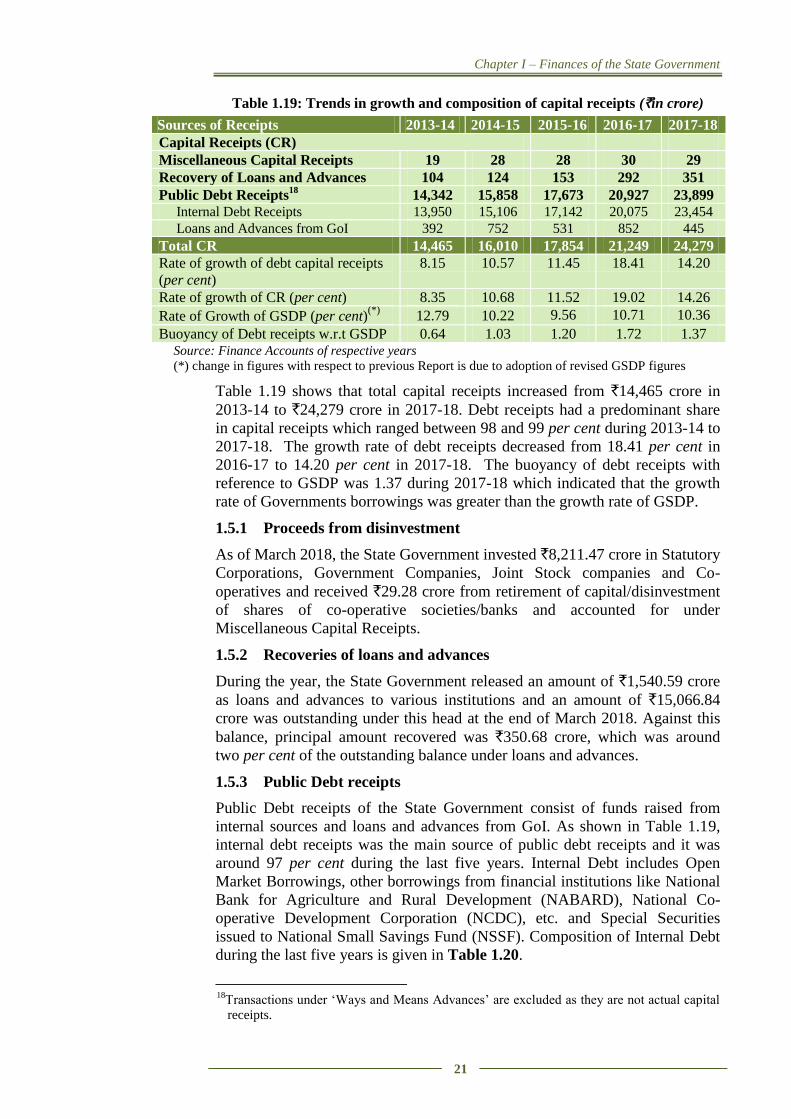
Table 1.19: Trends in growth and composition of capital receipts (`in crore)
Sources of Receipts 2013-14 2014-15 2015-16 2016-17 2017-18
Capital Receipts (CR)
Miscellaneous Capital Receipts 19 28 28 30 29
Recovery of Loans and Advances 104 124 153 292 351
Public Debt Receipts18
14,342 15,858 17,673 20,927 23,899
Internal Debt Receipts 13,950 15,106 17,142 20,075 23,454
Loans and Advances from GoI 392 752 531 852 445
Total CR 14,465 16,010 17,854 21,249 24,279
Rate of growth of debt capital receipts
(per cent)
8.15 10.57 11.45 18.41 14.20
Rate of growth of CR (per cent) 8.35 10.68 11.52 19.02 14.26
Rate of Growth of GSDP (per cent)(*)
12.79 10.22 9.56 10.71 10.36
Buoyancy of Debt receipts w.r.t GSDP 0.64 1.03 1.20 1.72 1.37 Source: Finance Accounts of respective years
(*) change in figures with respect to previous Report is due to adoption of revised GSDP figures
Table 1.19 shows that total capital receipts increased from `14,465 crore in
2013-14 to `24,279 crore in 2017-18. Debt receipts had a predominant share
in capital receipts which ranged between 98 and 99 per cent during 2013-14 to
2017-18. The growth rate of debt receipts decreased from 18.41 per cent in
2016-17 to 14.20 per cent in 2017-18. The buoyancy of debt receipts with
reference to GSDP was 1.37 during 2017-18 which indicated that the growth
rate of Governments borrowings was greater than the growth rate of GSDP.
1.5.1 Proceeds from disinvestment
As of March 2018, the State Government invested `8,211.47 crore in Statutory
Corporations, Government Companies, Joint Stock companies and Co-
operatives and received `29.28 crore from retirement of capital/disinvestment
of shares of co-operative societies/banks and accounted for under
Miscellaneous Capital Receipts.
1.5.2 Recoveries of loans and advances
During the year, the State Government released an amount of `1,540.59 crore
as loans and advances to various institutions and an amount of `15,066.84
crore was outstanding under this head at the end of March 2018. Against this
balance, principal amount recovered was `350.68 crore, which was around
two per cent of the outstanding balance under loans and advances.
1.5.3 Public Debt receipts
Public Debt receipts of the State Government consist of funds raised from
internal sources and loans and advances from GoI. As shown in Table 1.19,
internal debt receipts was the main source of public debt receipts and it was
around 97 per cent during the last five years. Internal Debt includes Open
Market Borrowings, other borrowings from financial institutions like National
Bank for Agriculture and Rural Development (NABARD), National Co-
operative Development Corporation (NCDC), etc. and Special Securities
issued to National Small Savings Fund (NSSF). Composition of Internal Debt
during the last five years is given in Table 1.20.
18
Transactions under ‘Ways and Means Advances’ are excluded as they are not actual capital
receipts.
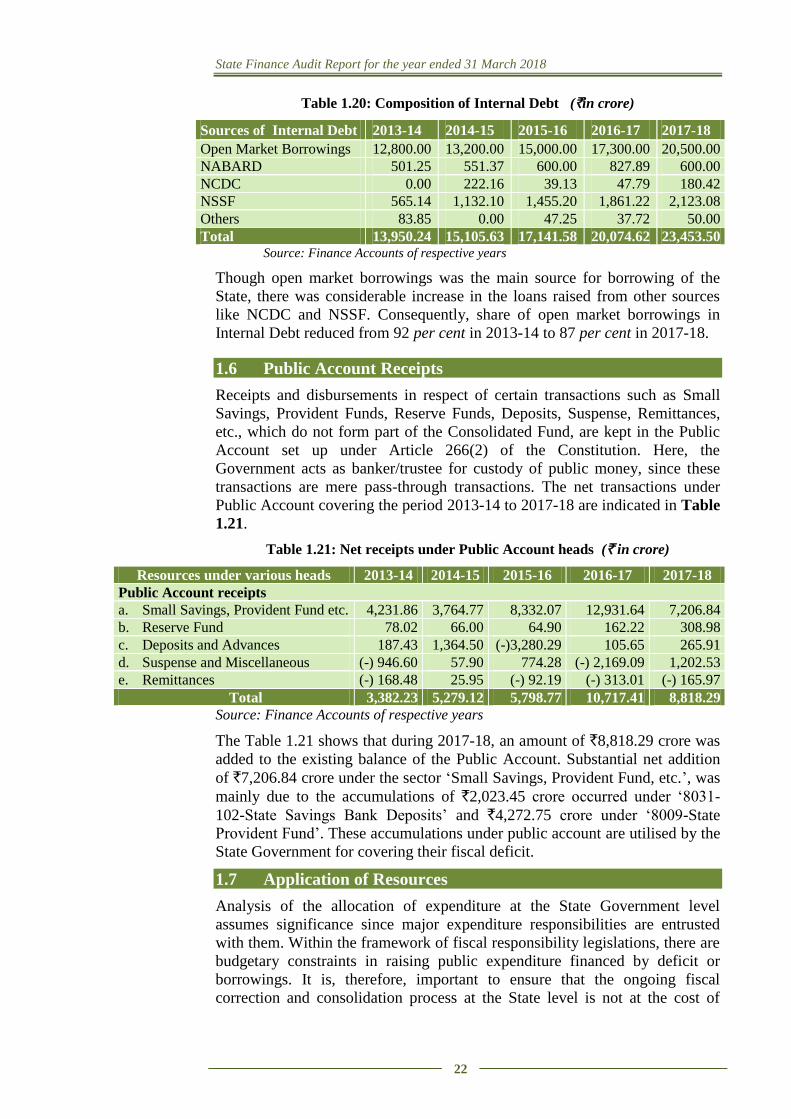
State Finance Audit Report for the year ended 31 March 2018
22
Table 1.20: Composition of Internal Debt (`in crore)
Sources of Internal Debt 2013-14 2014-15 2015-16 2016-17 2017-18
Open Market Borrowings 12,800.00 13,200.00 15,000.00 17,300.00 20,500.00
NABARD 501.25 551.37 600.00 827.89 600.00
NCDC 0.00 222.16 39.13 47.79 180.42
NSSF 565.14 1,132.10 1,455.20 1,861.22 2,123.08
Others 83.85 0.00 47.25 37.72 50.00
Total 13,950.24 15,105.63 17,141.58 20,074.62 23,453.50 Source: Finance Accounts of respective years
Though open market borrowings was the main source for borrowing of the
State, there was considerable increase in the loans raised from other sources
like NCDC and NSSF. Consequently, share of open market borrowings in
Internal Debt reduced from 92 per cent in 2013-14 to 87 per cent in 2017-18.
1.6 Public Account Receipts
Receipts and disbursements in respect of certain transactions such as Small
Savings, Provident Funds, Reserve Funds, Deposits, Suspense, Remittances,
etc., which do not form part of the Consolidated Fund, are kept in the Public
Account set up under Article 266(2) of the Constitution. Here, the
Government acts as banker/trustee for custody of public money, since these
transactions are mere pass-through transactions. The net transactions under
Public Account covering the period 2013-14 to 2017-18 are indicated in Table
1.21.
Table 1.21: Net receipts under Public Account heads (` in crore)
Resources under various heads 2013-14 2014-15 2015-16 2016-17 2017-18
Public Account receipts
a. Small Savings, Provident Fund etc. 4,231.86 3,764.77 8,332.07 12,931.64 7,206.84
b. Reserve Fund 78.02 66.00 64.90 162.22 308.98
c. Deposits and Advances 187.43 1,364.50 (-)3,280.29 105.65 265.91
d. Suspense and Miscellaneous (-) 946.60 57.90 774.28 (-) 2,169.09 1,202.53
e. Remittances (-) 168.48 25.95 (-) 92.19 (-) 313.01 (-) 165.97
Total 3,382.23 5,279.12 5,798.77 10,717.41 8,818.29
Source: Finance Accounts of respective years
The Table 1.21 shows that during 2017-18, an amount of `8,818.29 crore was
added to the existing balance of the Public Account. Substantial net addition
of `7,206.84 crore under the sector ‘Small Savings, Provident Fund, etc.’, was
mainly due to the accumulations of `2,023.45 crore occurred under ‘8031-
102-State Savings Bank Deposits’ and `4,272.75 crore under ‘8009-State
Provident Fund’. These accumulations under public account are utilised by the
State Government for covering their fiscal deficit.
1.7 Application of Resources
Analysis of the allocation of expenditure at the State Government level
assumes significance since major expenditure responsibilities are entrusted
with them. Within the framework of fiscal responsibility legislations, there are
budgetary constraints in raising public expenditure financed by deficit or
borrowings. It is, therefore, important to ensure that the ongoing fiscal
correction and consolidation process at the State level is not at the cost of
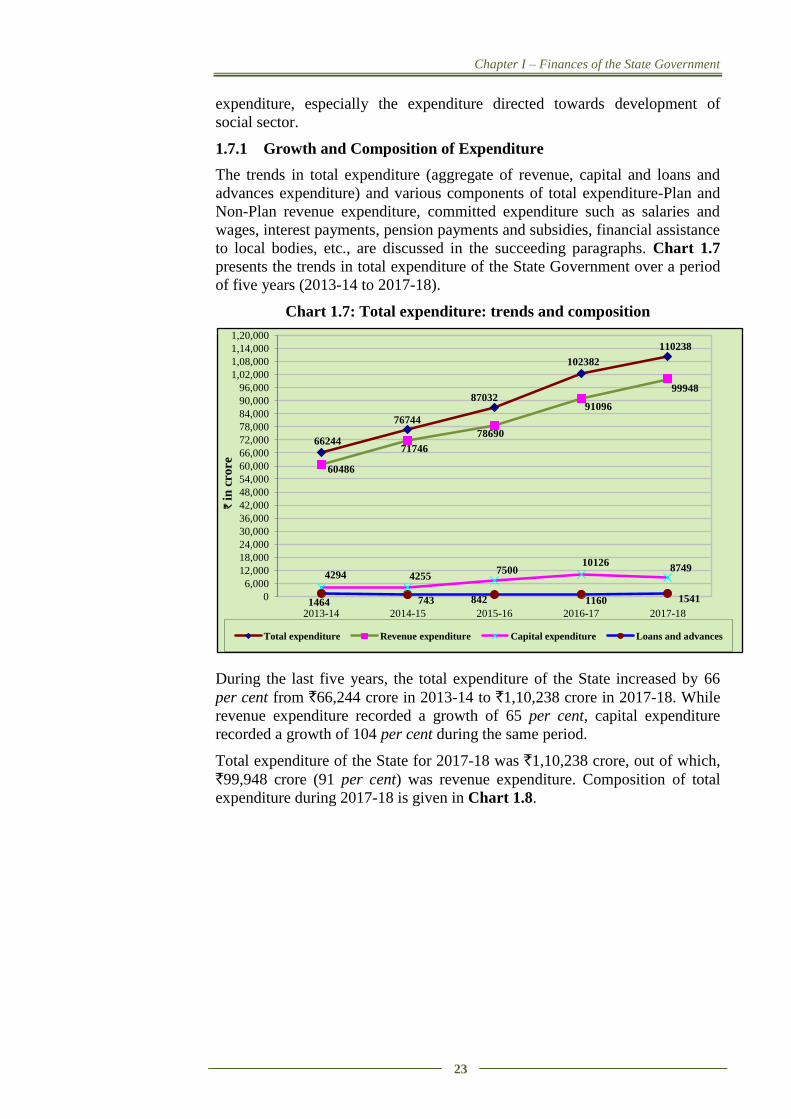
Chapter I – Finances of the State Government
23
expenditure, especially the expenditure directed towards development of
social sector.
1.7.1 Growth and Composition of Expenditure
The trends in total expenditure (aggregate of revenue, capital and loans and
advances expenditure) and various components of total expenditure-Plan and
Non-Plan revenue expenditure, committed expenditure such as salaries and
wages, interest payments, pension payments and subsidies, financial assistance
to local bodies, etc., are discussed in the succeeding paragraphs. Chart 1.7
presents the trends in total expenditure of the State Government over a period
of five years (2013-14 to 2017-18).
Chart 1.7: Total expenditure: trends and composition
During the last five years, the total expenditure of the State increased by 66
per cent from `66,244 crore in 2013-14 to `1,10,238 crore in 2017-18. While
revenue expenditure recorded a growth of 65 per cent, capital expenditure
recorded a growth of 104 per cent during the same period.
Total expenditure of the State for 2017-18 was `1,10,238 crore, out of which,
`99,948 crore (91 per cent) was revenue expenditure. Composition of total
expenditure during 2017-18 is given in Chart 1.8.
66244
76744
87032
102382
110238
60486
71746
78690
91096
99948
4294 4255 7500
10126 8749
1464 743 842 1160 1541 0
6,000
12,000
18,000
24,000
30,000
36,000
42,000
48,000
54,000
60,000
66,000
72,000
78,000
84,000
90,000
96,000
1,02,000
1,08,000
1,14,000
1,20,000
2013-14 2014-15 2015-16 2016-17 2017-18
` i
n c
rore
Total expenditure Revenue expenditure Capital expenditure Loans and advances
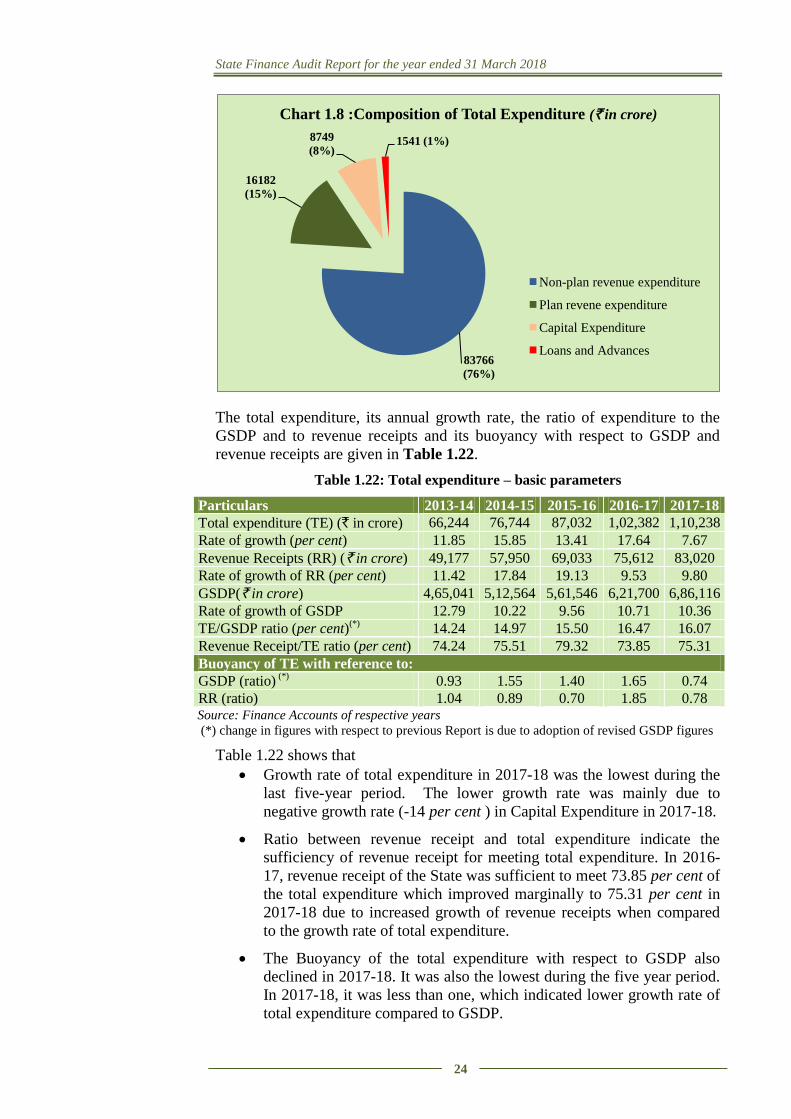
State Finance Audit Report for the year ended 31 March 2018
24
The total expenditure, its annual growth rate, the ratio of expenditure to the
GSDP and to revenue receipts and its buoyancy with respect to GSDP and
revenue receipts are given in Table 1.22.
Table 1.22: Total expenditure – basic parameters
Particulars 2013-14 2014-15 2015-16 2016-17 2017-18
Total expenditure (TE) (` in crore) 66,244 76,744 87,032 1,02,382 1,10,238
Rate of growth (per cent) 11.85 15.85 13.41 17.64 7.67
Revenue Receipts (RR) (` in crore) 49,177 57,950 69,033 75,612 83,020
Rate of growth of RR (per cent) 11.42 17.84 19.13 9.53 9.80
GSDP(` in crore) 4,65,041 5,12,564 5,61,546 6,21,700 6,86,116
Rate of growth of GSDP 12.79 10.22 9.56 10.71 10.36
TE/GSDP ratio (per cent)(*)
14.24 14.97 15.50 16.47 16.07
Revenue Receipt/TE ratio (per cent) 74.24 75.51 79.32 73.85 75.31
Buoyancy of TE with reference to:
GSDP (ratio) (*)
0.93 1.55 1.40 1.65 0.74
RR (ratio) 1.04 0.89 0.70 1.85 0.78 Source: Finance Accounts of respective years
(*) change in figures with respect to previous Report is due to adoption of revised GSDP figures
Table 1.22 shows that
Growth rate of total expenditure in 2017-18 was the lowest during the
last five-year period. The lower growth rate was mainly due to
negative growth rate (-14 per cent ) in Capital Expenditure in 2017-18.
Ratio between revenue receipt and total expenditure indicate the
sufficiency of revenue receipt for meeting total expenditure. In 2016-
17, revenue receipt of the State was sufficient to meet 73.85 per cent of
the total expenditure which improved marginally to 75.31 per cent in
2017-18 due to increased growth of revenue receipts when compared
to the growth rate of total expenditure.
The Buoyancy of the total expenditure with respect to GSDP also
declined in 2017-18. It was also the lowest during the five year period.
In 2017-18, it was less than one, which indicated lower growth rate of
total expenditure compared to GSDP.
83766
(76%)
16182
(15%)
8749
(8%) 1541 (1%)
Chart 1.8 :Composition of Total Expenditure (` in crore)
Non-plan revenue expenditure
Plan revene expenditure
Capital Expenditure
Loans and Advances
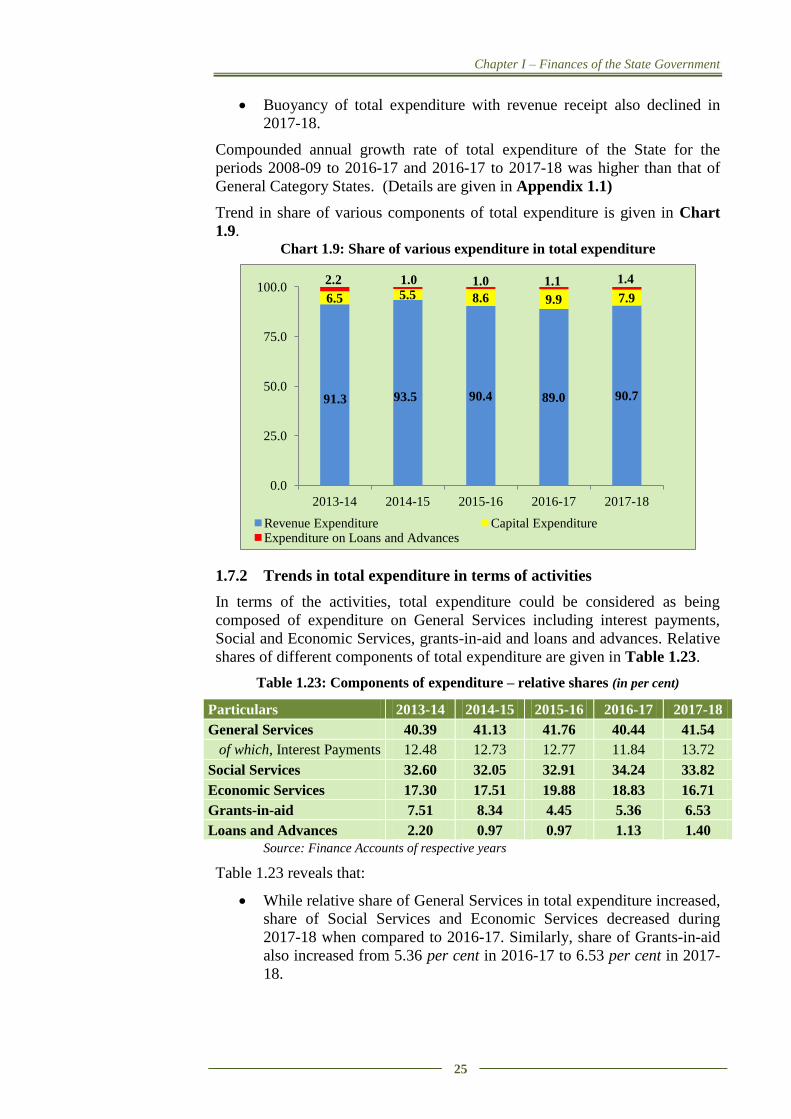
Chapter I – Finances of the State Government
25
Buoyancy of total expenditure with revenue receipt also declined in
2017-18.
Compounded annual growth rate of total expenditure of the State for the
periods 2008-09 to 2016-17 and 2016-17 to 2017-18 was higher than that of
General Category States. (Details are given in Appendix 1.1)
Trend in share of various components of total expenditure is given in Chart
1.9. Chart 1.9: Share of various expenditure in total expenditure
1.7.2 Trends in total expenditure in terms of activities
In terms of the activities, total expenditure could be considered as being
composed of expenditure on General Services including interest payments,
Social and Economic Services, grants-in-aid and loans and advances. Relative
shares of different components of total expenditure are given in Table 1.23.
Table 1.23: Components of expenditure – relative shares (in per cent)
Particulars 2013-14 2014-15 2015-16 2016-17 2017-18
General Services 40.39 41.13 41.76 40.44 41.54
of which, Interest Payments 12.48 12.73 12.77 11.84 13.72
Social Services 32.60 32.05 32.91 34.24 33.82
Economic Services 17.30 17.51 19.88 18.83 16.71
Grants-in-aid 7.51 8.34 4.45 5.36 6.53
Loans and Advances 2.20 0.97 0.97 1.13 1.40
Source: Finance Accounts of respective years
Table 1.23 reveals that:
While relative share of General Services in total expenditure increased,
share of Social Services and Economic Services decreased during
2017-18 when compared to 2016-17. Similarly, share of Grants-in-aid
also increased from 5.36 per cent in 2016-17 to 6.53 per cent in 2017-
18.
91.3 93.5 90.4 89.0 90.7
6.5 5.5 8.6 9.9 7.9
2.2 1.0 1.0 1.1 1.4
0.0
25.0
50.0
75.0
100.0
2013-14 2014-15 2015-16 2016-17 2017-18
Revenue Expenditure Capital Expenditure Expenditure on Loans and Advances
State Finance Audit Report for the year ended 31 March 2018
26
During 2017-18, share of interest payments in total expenditure was
the highest during the five-year period.
Relative share of loans and advances in total expenditure increased
during 2017-18 due to increase in release of loans and advances by the
State Government.
1.7.3 Revenue Expenditure
During 2017-18, revenue expenditure recorded an increase of `8,852 crore
(9.72 per cent), compared to the previous year. The increase in revenue
expenditure was mainly due to increase in expenditure under the major heads
‘Pension and Other Retirement Benefits’(`4,661 crore), ‘Interest
Payments’(`3,003 crore), ‘Compensation and Assignments to Local Bodies
and Panchayati Raj Institutions’ (`1,716 crore), ‘General Education’(`1,355
crore), ‘Roads and Bridges’ (`986 crore) and ‘Social Security and Welfare’
(`893 crore) etc.
1.7.3.1 Incidence of revenue expenditure
During the last five years, the share of revenue expenditure in total
expenditure, to maintain the current level of services and payment for past
obligations was between 89 and 93 per cent and it showed an increasing trend
during 2017-18. The overall revenue expenditure, its rate of growth, ratio of
revenue expenditure to GSDP and to revenue receipts and its buoyancy are
indicated in Table 1.24.
Table 1.24: Revenue expenditure – basic parameters (` in crore)
Particulars 2013-14 2014-15 2015-16 2016-17 2017-18
Revenue expenditure (RE) 60,486 71,746 78,690 91,096 99,948
Non-plan revenue expenditure (NPRE) 53,412 61,464 66,611 77,604 83,766
Plan revenue expenditure (PRE) 7,074 10,282 12,079 13,492 16,182
Rate of Growth of
RE (per cent) 13.08 18.62 9.68 15.77 9.72
NPRE (per cent) 14.52 15.08 8.37 16.50 7.94
PRE (per cent) 3.29 45.35 17.48 11.70 19.94
Revenue expenditure as percentage to TE 91.31 93.49 90.42 88.98 90.67
NPRE/GSDP (per cent) (*)
11.49 11.99 11.86 12.48 12.21
NPRE as percentage of TE 80.63 80.09 76.54 75.80 75.99
NPRE as percentage of RR 108.61 106.06 96.49 102.63 100.90
Buoyancy of revenue expenditure with
GSDP (ratio) (*)
1.02 1.82 1.01 1.47 0.94
Revenue receipts (ratio) 1.15 1.04 0.51 1.65 0.99 Source: Finance Accounts of respective years
(*) change in figures with respect to previous Report is due to adoption of revised GSDP
figures
Table 1.24 reveals the following:
There was considerable decrease in growth rate of NPRE in 2017-18
compared to previous year which attributed to onward decrease in the
growth rate of RE, whereas growth rate of PRE increased considerably.
Revenue expenditure as a percentage of total expenditure ranged
between 89 per cent and 93 per cent during the five year period which
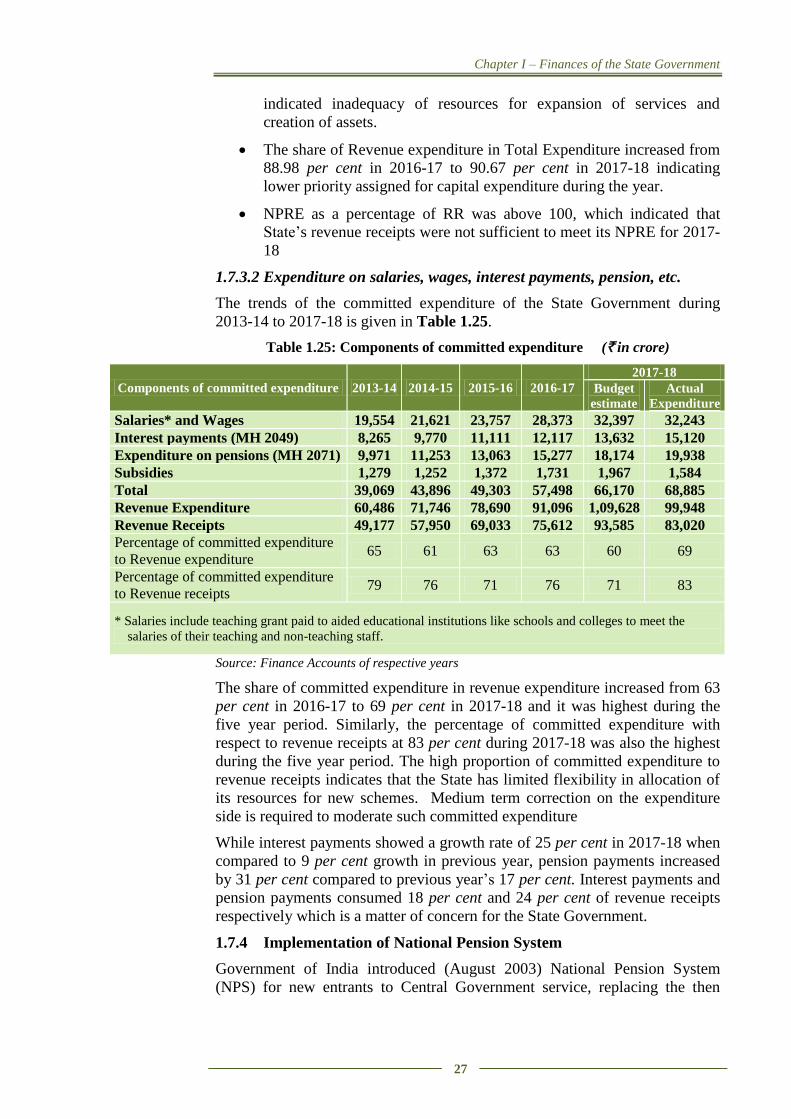
Chapter I – Finances of the State Government
27
indicated inadequacy of resources for expansion of services and
creation of assets.
The share of Revenue expenditure in Total Expenditure increased from
88.98 per cent in 2016-17 to 90.67 per cent in 2017-18 indicating
lower priority assigned for capital expenditure during the year.
NPRE as a percentage of RR was above 100, which indicated that
State’s revenue receipts were not sufficient to meet its NPRE for 2017-
18
1.7.3.2 Expenditure on salaries, wages, interest payments, pension, etc.
The trends of the committed expenditure of the State Government during
2013-14 to 2017-18 is given in Table 1.25.
Table 1.25: Components of committed expenditure (` in crore)
Components of committed expenditure 2013-14 2014-15 2015-16 2016-17
2017-18
Budget
estimate
Actual
Expenditure
Salaries* and Wages 19,554 21,621 23,757 28,373 32,397 32,243
Interest payments (MH 2049) 8,265 9,770 11,111 12,117 13,632 15,120
Expenditure on pensions (MH 2071) 9,971 11,253 13,063 15,277 18,174 19,938
Subsidies 1,279 1,252 1,372 1,731 1,967 1,584
Total 39,069 43,896 49,303 57,498 66,170 68,885
Revenue Expenditure 60,486 71,746 78,690 91,096 1,09,628 99,948
Revenue Receipts 49,177 57,950 69,033 75,612 93,585 83,020
Percentage of committed expenditure
to Revenue expenditure 65 61 63 63 60 69
Percentage of committed expenditure
to Revenue receipts 79 76 71 76 71 83
* Salaries include teaching grant paid to aided educational institutions like schools and colleges to meet the
salaries of their teaching and non-teaching staff.
Source: Finance Accounts of respective years
The share of committed expenditure in revenue expenditure increased from 63
per cent in 2016-17 to 69 per cent in 2017-18 and it was highest during the
five year period. Similarly, the percentage of committed expenditure with
respect to revenue receipts at 83 per cent during 2017-18 was also the highest
during the five year period. The high proportion of committed expenditure to
revenue receipts indicates that the State has limited flexibility in allocation of
its resources for new schemes. Medium term correction on the expenditure
side is required to moderate such committed expenditure
While interest payments showed a growth rate of 25 per cent in 2017-18 when
compared to 9 per cent growth in previous year, pension payments increased
by 31 per cent compared to previous year’s 17 per cent. Interest payments and
pension payments consumed 18 per cent and 24 per cent of revenue receipts
respectively which is a matter of concern for the State Government.
1.7.4 Implementation of National Pension System
Government of India introduced (August 2003) National Pension System
(NPS) for new entrants to Central Government service, replacing the then
State Finance Audit Report for the year ended 31 March 2018
28
existing system of defined benefit pension, General Provident Fund and
gratuity.
The GoI established Pension Fund Regulatory and Development Authority
(PFRDA) on 10 October 2003 to develop and regulate the Pension Funds
under the NPS. PFRDA has appointed National Securities Depository Limited
(NSDL) as the Central Record Keeping Agency to maintain the records of
contribution and its deployment in various pension fund schemes for the
employees and to issue Permanent Retirement Account Number (PRAN) to
NPS subscribers.
State Government introduced National Pension System in July 2009 to All
India Service (AIS) officers recruited to Kerala Cadre on or after 01.01.2004
and to the State Government employees in January 2013 appointed on or after
01.04.2013. According to the scheme, the employees have to contribute 10
per cent of the basic pay and dearness allowance and Government has to make
an equal contribution to the pension account.
Audit analysed the implementation of NPS among AIS officers and State
Government employees and audit observations in this regard are summarised
below:
1.7.4.1 Non- payment of backlog contribution by AIS officers
State Government implemented National Pension System (NPS) in July 2009
to the All India Service (AIS) Officers recruited to Kerala cadre on or after
01.01.2004.
Even though National Pension System has been made effective from
01.01.2004 for the AIS officers, the deduction of contribution commenced
only from the month of February 2014 for want of setting up of required
infrastructure for online transfer of the contribution amounts to the trustee
bank and data transfer to NSDL. Government issued guidelines and
accounting procedure only in January 2015 for the realisation of backlog
contribution in respect of the AIS officers recruited to Kerala Cadre from
1.1.2004 to 31.5.2014.
As per the provisions and modalities for the realisation of backlog contribution
in respect of AIS Officers issued in May 2016, the officers concerned were to
submit service details, pay particulars, details of NPS contributions already
remitted etc. to Finance Department. Service particulars would be verified by
the Administrative Departments concerned and pay particulars and NPS
remittance details would be verified by the Director of Treasuries. After
scrutiny of the details and verification reports, State Nodal Officer of Finance
(NPS Cell) would issue orders for the realisation of backlog contribution in
respect of each officer.
As per the records maintained in the Government Secretariat, Government of
Kerala, there are 82 AIS officers in Kerala cadre who joined service during the
backlog period from 1.1.2004 to 31.5.2014, and are hence eligible for backlog
contribution of NPS arrears. Government issued final Orders for the
realisation of backlog contribution in respect of 33 officers and information
received from 13 officers are pending scrutiny with Finance Department.
Chapter I – Finances of the State Government
29
Details in respect of the remaining 36 All India service officers for backlog
contribution have not been submitted to Finance department till date as shown
in Appendix 1.8.
The matter was brought to the notice (November 2018) of the Finance
Department and the reply is awaited (February 2019).
1.7.4.2 Non- payment of interest for the matching Government share for
backlog contribution in respect of State Government Employees
State Government implemented National Pension System (NPS) in January
2013 to the State Government employees appointed on or after 01.04.2013.
However, the deduction towards NPS commenced only from February 2014.
Government vide GO issued in January 2015 allowed interest applicable as
per GPF (Kerala) Rules 2011 to the State Government Employees for the
matching Government Contribution in respect of the backlog contribution
made by the Employees with effect from 1.4.2013 to 31.5.2014 subject to their
date of appointment. However, it was seen that State Government had not
given any interest towards the matching Government share in respect of
eligible Government employees till date.
Finance department replied that no interest was given to backlog contribution
of employees as none of the DDOs have submitted any document to the
concerned treasuries for claiming interest on Government contribution.
The reply is not tenable as department failed to take any further action for
payment of interest on the matching Government contribution.
1.7.4.3 Delay in transfer of funds to NSDL and non-payment of interest for
the delay in respect of AIS Officers
As per Government instructions issued in December 2013, the Treasury
Officer has to transfer the funds credited under 8342-00-117 to the trustee
bank of NSDL on the same day of credit.
Government issued final orders for realisation of back log contribution, in case
of 33 AIS officers in the state, of which 10 cases pertained to four treasuries of
Thiruvanathapuram District. Audit scrutinized two out of seven cases in two
treasuries (District Treasury Thiruvanathapuram and Sub Treasury
Vellayambalam) and observed that there was delay of 27 to 41 months in
transfer of funds to NSDL as shown in Appendix 1.9.
However, no interest was paid for the delayed transfer of funds to NSDL in
both these cases.
In the light of the above observations in the two test checked cases audit could
not rule out the possibility of similar deficiencies in the remaining cases.
The Finance Department replied (September 2018) that the delay in transfer of
funds was due to administrative reasons and interest was paid only up to May
2014 as per instructions in G.O dated 14 January 2015. The reply is not
tenable as Government is required to pay interest to the Officers till the date of
transfer of funds to NSDL.
State Finance Audit Report for the year ended 31 March 2018
30
1.7.4.4 Non recovery of NPS subscription from the pay revision arrears
Consequent on the implementation of Tenth Pay Revision Commission
recommendations State Government Employees were given pay revision
arrears in four instalments during 2017-19. As per the Government
instructions contained in G.O dated 07.01.2013, the NPS contributions were
to be recovered from the pay and DA of employees at the rate of 10 per cent.
However, a scrutiny of the records relating to recovery of NPS subscription
from the pay revision arrears disbursed up to April 2018 (first three
instalments), conducted in the offices of the Sub Treasury Officer,
Vellayambalam, Thiruvananthapuram (Treasury Department), Commissioner
of Land Revenue, Thiruvananthapuram and the Assistant Commissioner of
State Goods and Services Tax Department, Thiruvananthapuram revealed that
subscription towards NPS was not deducted from the bill for the drawal of
Pay revision arrears of employees.
Similarly, a scrutiny of records in three offices test checked19, relating to the
payment of pay revision arrears to AIS Officers, consequent on the
implementation of Seventh Central Pay Commission recommendations,
revealed that NPS contributions were not recovered from pay revision arrears
paid to three AIS Officers.
Finance Department replied (August 2018) that NPS contributions were not
recovered from Pay revision arrears of State Government employees as the
Pay revision arrears were credited to GPF account of employees as per the
instructions contained in G.O dated 13.10.2014.
The reply is not tenable as the pay revision arrears should have been credited
to GPF after deducting NPS subscription at prescribed rates.
Short transfer to NSDL would inevitably lead to bankruptcy of the NPS corpus
and eventual failure of the scheme itself. Similar irregularity in management
of employee provident fund by a private company would render them liable to
penal action.
1.7.4.5 Mismatch between Government contribution and employee
contribution credited to the deposit head
The amount deducted from the salary in respect of officials would be transfer
credited to the Head of account ‘8342-00-117’ under the relevant sub heads.
The Treasury Officer would draw the amount of matching Government
contribution equivalent to the contribution in respect of officials by debiting
the Head of account ‘2071-01-117’ and transfer credit the same to the relevant
sub heads under Head of account ‘8342-00-117’.
On a scrutiny, it is observed that there is mismatch between Government
servant’s contribution credited to the relevant sub head under ‘8342-00-117’
and matching Government contribution debited to the Major head ‘2071-01-
117’ during the period. It is also observed that there is mismatch in the amount
of Government contribution debited to the head of account ‘2071-01-117’ and
the amount transfer credited to the corresponding public account head ‘8342-
00-117’ as shown in Table 1.26.
19
Police Headquarters, Thiruvananthapuram; Government Secretariat, Thiruvananthapuram
and Corporation of Thiruvananthapuram
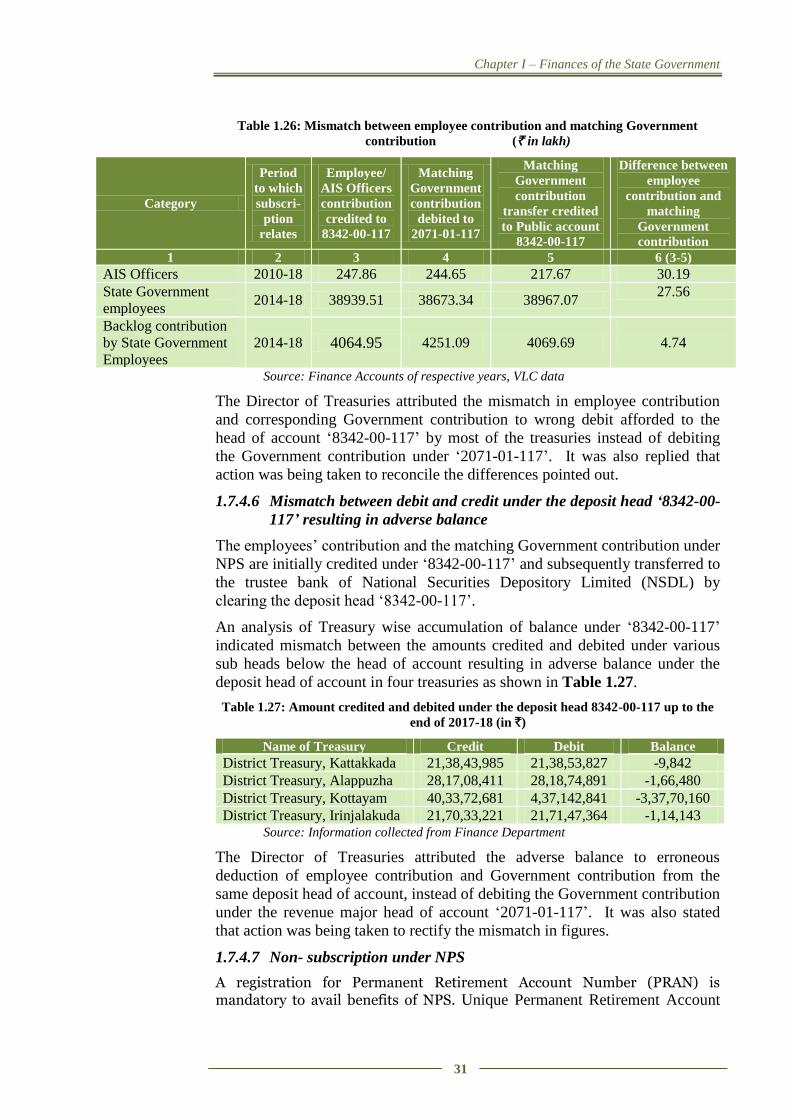
Chapter I – Finances of the State Government
31
Table 1.26: Mismatch between employee contribution and matching Government
contribution (` in lakh)
Category
Period
to which
subscri-
ption
relates
Employee/
AIS Officers
contribution
credited to
8342-00-117
Matching
Government
contribution
debited to
2071-01-117
Matching
Government
contribution
transfer credited
to Public account
8342-00-117
Difference between
employee
contribution and
matching
Government
contribution
1 2 3 4 5 6 (3-5)
AIS Officers 2010-18 247.86 244.65 217.67 30.19
State Government
employees 2014-18 38939.51 38673.34 38967.07
27.56
Backlog contribution
by State Government
Employees
2014-18 4064.95 4251.09 4069.69
4.74
Source: Finance Accounts of respective years, VLC data
The Director of Treasuries attributed the mismatch in employee contribution
and corresponding Government contribution to wrong debit afforded to the
head of account ‘8342-00-117’ by most of the treasuries instead of debiting
the Government contribution under ‘2071-01-117’. It was also replied that
action was being taken to reconcile the differences pointed out.
1.7.4.6 Mismatch between debit and credit under the deposit head ‘8342-00-
117’ resulting in adverse balance
The employees’ contribution and the matching Government contribution under
NPS are initially credited under ‘8342-00-117’ and subsequently transferred to
the trustee bank of National Securities Depository Limited (NSDL) by
clearing the deposit head ‘8342-00-117’.
An analysis of Treasury wise accumulation of balance under ‘8342-00-117’
indicated mismatch between the amounts credited and debited under various
sub heads below the head of account resulting in adverse balance under the
deposit head of account in four treasuries as shown in Table 1.27.
Table 1.27: Amount credited and debited under the deposit head 8342-00-117 up to the
end of 2017-18 (in `)
Name of Treasury Credit Debit Balance
District Treasury, Kattakkada 21,38,43,985 21,38,53,827 -9,842
District Treasury, Alappuzha 28,17,08,411 28,18,74,891 -1,66,480
District Treasury, Kottayam 40,33,72,681 4,37,142,841 -3,37,70,160
District Treasury, Irinjalakuda 21,70,33,221 21,71,47,364 -1,14,143 Source: Information collected from Finance Department
The Director of Treasuries attributed the adverse balance to erroneous
deduction of employee contribution and Government contribution from the
same deposit head of account, instead of debiting the Government contribution
under the revenue major head of account ‘2071-01-117’. It was also stated
that action was being taken to rectify the mismatch in figures.
1.7.4.7 Non- subscription under NPS
A registration for Permanent Retirement Account Number (PRAN) is mandatory to avail benefits of NPS. Unique Permanent Retirement Account
State Finance Audit Report for the year ended 31 March 2018
32
Number (PRAN) is allocated to each subscriber under the NPS Scheme at the
time of joining the scheme.
The officers appointed on or after 1.4.2013 and who are under the purview of
NPS have to apply to the District Treasury Officer (DTO) concerned for
allotment of PRAN. The DTO will generate the PRAN forms of the officer
concerned. After verification, the official will submit the duly filled/signed
PRAN form in duplicate to the DTO who will affix his seal and signature in
the form and forward it to NSDL. On receipt of PRAN kit from NSDL, the
DTO would forward the kit to the respective DDO/Appointing authority. The
DDO/Appointing authority will make necessary entry of the PRAN in
SPARK20 and distribute the kit to the employee concerned
Audit scrutiny of SPARK data base revealed that 1,09,657 employees had
joined service during the period from April 2013 to July 2018. Out of the
employees who joined service, 34,262 employees have not been allotted with
PRAN as on 31.07.2018. It was also seen that NSDL had allotted PRAN to
79,806 State Government employees, rejected 1938 applications and 768
applications were pending as on 31.10.2018.
The Finance Department has been requested to reconcile the difference
between the SPARK database and figures furnished by NSDL. It was also
found that there is no mechanism in Treasuries Department to watch the
prompt recovery of NPS contribution from the due dates in respect of AIS
Officers and State Government Employees covered under the scheme.
It was further observed that no monthly statement on the yield derived from
the investment of the fund is being received from the National Pension Trust.
The finance department replied that instructions had been issued to the
Director of Treasuries to take necessary steps to create a fruitful mechanism in
the department to watch the prompt recovery of NPS contribution. It was
further replied that request had been given to National Pension Trust, New
Delhi to furnish monthly statement on the yield delivered from the investment
of the fund.
1.7.5 Subsidies
The subsidies (`1,584 crore) given during 2017-18 were `147 crore less than
the subsidies (`1,731 crore) given in the previous year. The main items of
subsidies given during 2017-18 included amount given to Food Corporation of
India in respect of reimbursement of price difference of ration rice and wheat
(`784 crore), for Paddy procurement through Kerala State Civil Supplies
Corporation (`325 crore), grant to Kerala State Civil Supplies Corporation
Limited for market intervention operations (`200 crore), State Investment
Subsidy (`54 crore) and subsidy to Co-operatives for conducting festival
markets (`52 crore).
1.7.6 Financial assistance to Local Bodies and Other Institutions
The assistance provided by the Government as grants and loans to local
20
SPARK (Service and Payroll Administrative Repository for Kerala) is an integrated
personnel, payroll and accounts information system for all the employees in Government of
Kerala. The system caters to the personnel Administration, Pay roll and other Accounts
activities of Government Establishments.
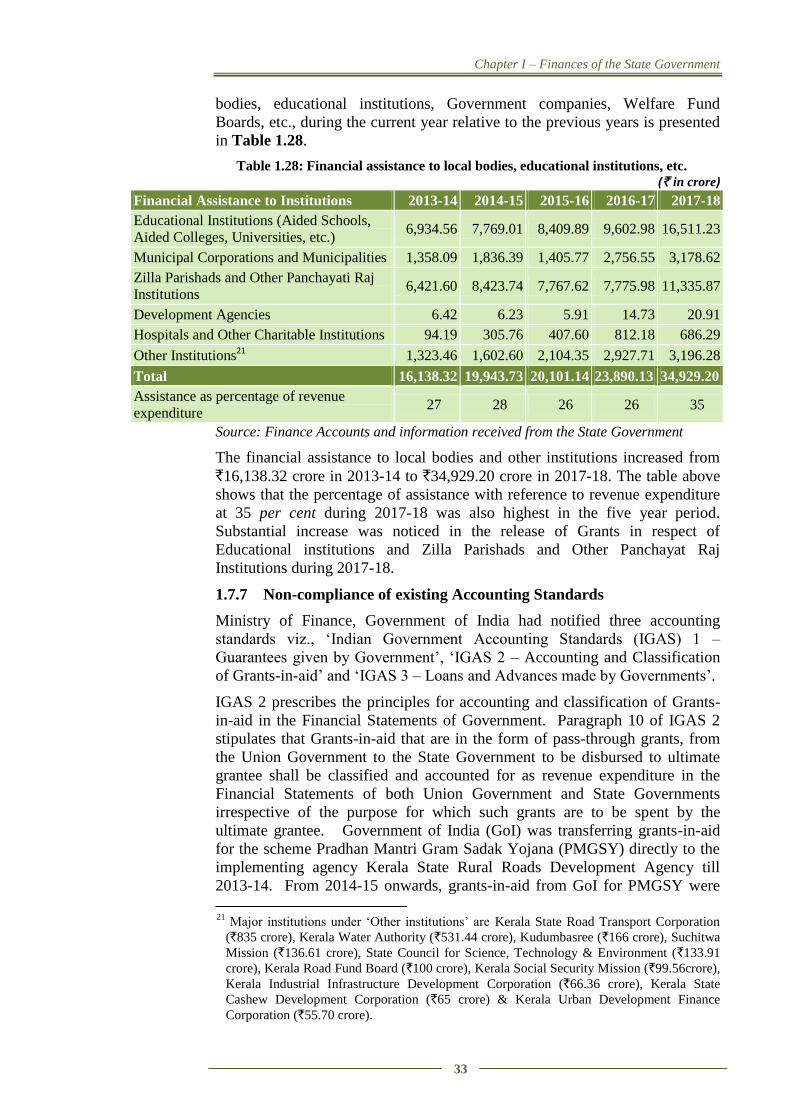
Chapter I – Finances of the State Government
33
bodies, educational institutions, Government companies, Welfare Fund
Boards, etc., during the current year relative to the previous years is presented
in Table 1.28.
Table 1.28: Financial assistance to local bodies, educational institutions, etc.
(` in crore)
Financial Assistance to Institutions 2013-14 2014-15 2015-16 2016-17 2017-18
Educational Institutions (Aided Schools,
Aided Colleges, Universities, etc.) 6,934.56 7,769.01 8,409.89 9,602.98 16,511.23
Municipal Corporations and Municipalities 1,358.09 1,836.39 1,405.77 2,756.55 3,178.62
Zilla Parishads and Other Panchayati Raj
Institutions 6,421.60 8,423.74 7,767.62 7,775.98 11,335.87
Development Agencies 6.42 6.23 5.91 14.73 20.91
Hospitals and Other Charitable Institutions 94.19 305.76 407.60 812.18 686.29
Other Institutions21
1,323.46 1,602.60 2,104.35 2,927.71 3,196.28
Total 16,138.32 19,943.73 20,101.14 23,890.13 34,929.20
Assistance as percentage of revenue
expenditure 27 28 26 26 35
Source: Finance Accounts and information received from the State Government
The financial assistance to local bodies and other institutions increased from
`16,138.32 crore in 2013-14 to `34,929.20 crore in 2017-18. The table above
shows that the percentage of assistance with reference to revenue expenditure
at 35 per cent during 2017-18 was also highest in the five year period.
Substantial increase was noticed in the release of Grants in respect of
Educational institutions and Zilla Parishads and Other Panchayat Raj
Institutions during 2017-18.
1.7.7 Non-compliance of existing Accounting Standards
Ministry of Finance, Government of India had notified three accounting
standards viz., ‘Indian Government Accounting Standards (IGAS) 1 –
Guarantees given by Government’, ‘IGAS 2 – Accounting and Classification
of Grants-in-aid’ and ‘IGAS 3 – Loans and Advances made by Governments’.
IGAS 2 prescribes the principles for accounting and classification of Grants-
in-aid in the Financial Statements of Government. Paragraph 10 of IGAS 2
stipulates that Grants-in-aid that are in the form of pass-through grants, from
the Union Government to the State Government to be disbursed to ultimate
grantee shall be classified and accounted for as revenue expenditure in the
Financial Statements of both Union Government and State Governments
irrespective of the purpose for which such grants are to be spent by the
ultimate grantee. Government of India (GoI) was transferring grants-in-aid
for the scheme Pradhan Mantri Gram Sadak Yojana (PMGSY) directly to the
implementing agency Kerala State Rural Roads Development Agency till
2013-14. From 2014-15 onwards, grants-in-aid from GoI for PMGSY were
21
Major institutions under ‘Other institutions’ are Kerala State Road Transport Corporation
(`835 crore), Kerala Water Authority (`531.44 crore), Kudumbasree (`166 crore), Suchitwa
Mission (`136.61 crore), State Council for Science, Technology & Environment (`133.91
crore), Kerala Road Fund Board (`100 crore), Kerala Social Security Mission (`99.56crore),
Kerala Industrial Infrastructure Development Corporation (`66.36 crore), Kerala State
Cashew Development Corporation (`65 crore) & Kerala Urban Development Finance
Corporation (`55.70 crore).
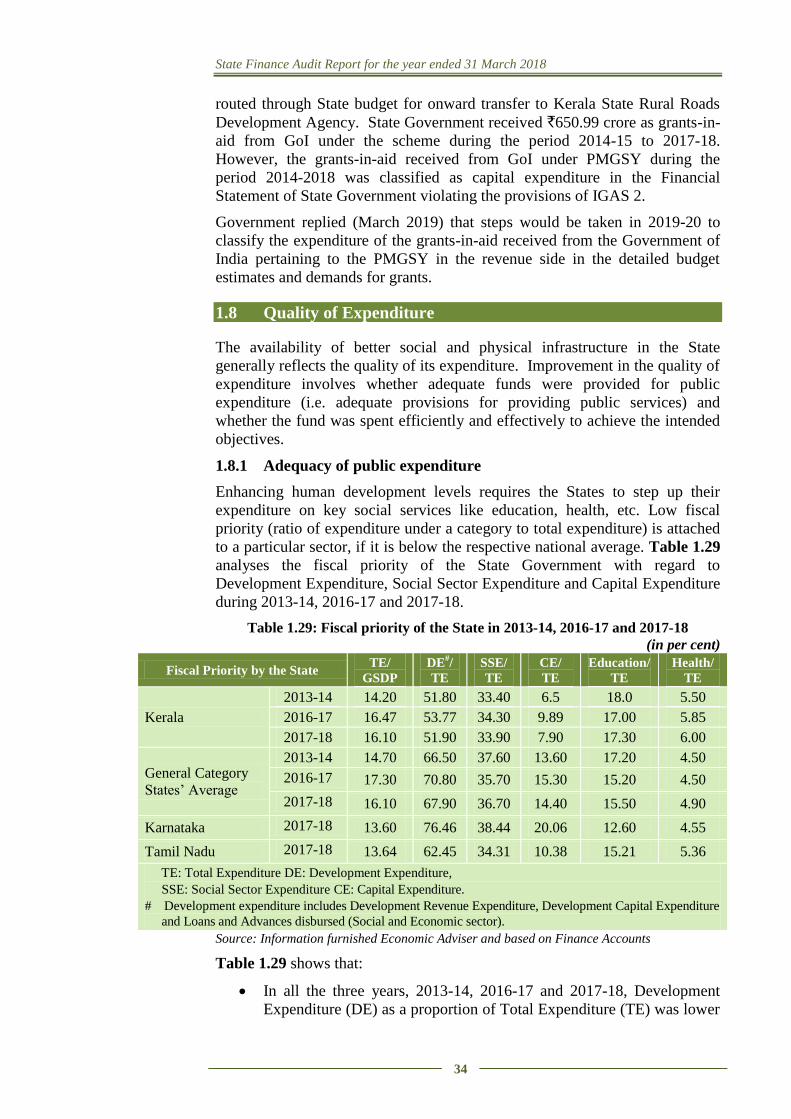
State Finance Audit Report for the year ended 31 March 2018
34
routed through State budget for onward transfer to Kerala State Rural Roads
Development Agency. State Government received `650.99 crore as grants-in-
aid from GoI under the scheme during the period 2014-15 to 2017-18.
However, the grants-in-aid received from GoI under PMGSY during the
period 2014-2018 was classified as capital expenditure in the Financial
Statement of State Government violating the provisions of IGAS 2.
Government replied (March 2019) that steps would be taken in 2019-20 to
classify the expenditure of the grants-in-aid received from the Government of
India pertaining to the PMGSY in the revenue side in the detailed budget
estimates and demands for grants.
1.8 Quality of Expenditure
The availability of better social and physical infrastructure in the State
generally reflects the quality of its expenditure. Improvement in the quality of
expenditure involves whether adequate funds were provided for public
expenditure (i.e. adequate provisions for providing public services) and
whether the fund was spent efficiently and effectively to achieve the intended
objectives.
1.8.1 Adequacy of public expenditure
Enhancing human development levels requires the States to step up their
expenditure on key social services like education, health, etc. Low fiscal
priority (ratio of expenditure under a category to total expenditure) is attached
to a particular sector, if it is below the respective national average. Table 1.29
analyses the fiscal priority of the State Government with regard to
Development Expenditure, Social Sector Expenditure and Capital Expenditure
during 2013-14, 2016-17 and 2017-18.
Table 1.29: Fiscal priority of the State in 2013-14, 2016-17 and 2017-18
(in per cent)
Fiscal Priority by the State TE/
GSDP
DE#/
TE
SSE/
TE
CE/
TE
Education/
TE
Health/
TE
Kerala
2013-14 14.20 51.80 33.40 6.5 18.0 5.50
2016-17 16.47 53.77 34.30 9.89 17.00 5.85
2017-18 16.10 51.90 33.90 7.90 17.30 6.00
General Category
States’ Average
2013-14 14.70 66.50 37.60 13.60 17.20 4.50
2016-17 17.30 70.80 35.70 15.30 15.20 4.50
2017-18 16.10 67.90 36.70 14.40 15.50 4.90
Karnataka 2017-18 13.60 76.46 38.44 20.06 12.60 4.55
Tamil Nadu 2017-18 13.64 62.45 34.31 10.38 15.21 5.36
TE: Total Expenditure DE: Development Expenditure,
SSE: Social Sector Expenditure CE: Capital Expenditure.
# Development expenditure includes Development Revenue Expenditure, Development Capital Expenditure
and Loans and Advances disbursed (Social and Economic sector).
Source: Information furnished Economic Adviser and based on Finance Accounts
Table 1.29 shows that:
In all the three years, 2013-14, 2016-17 and 2017-18, Development
Expenditure (DE) as a proportion of Total Expenditure (TE) was lower
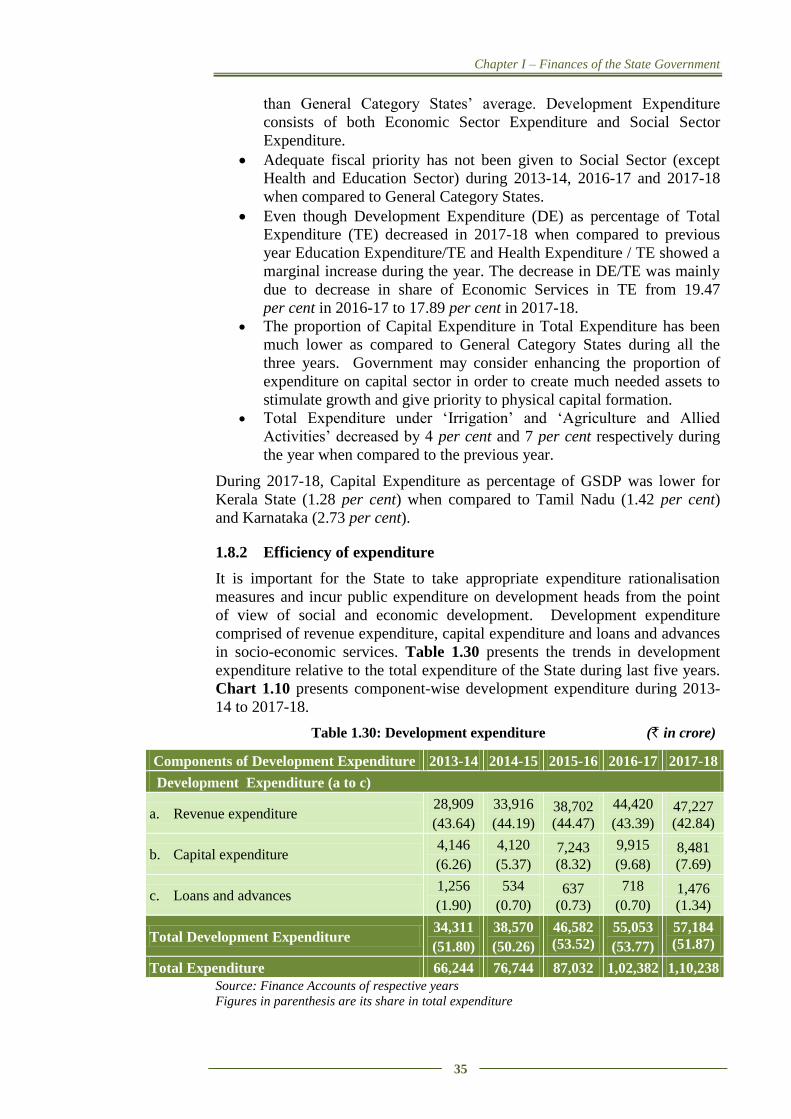
Chapter I – Finances of the State Government
35
than General Category States’ average. Development Expenditure
consists of both Economic Sector Expenditure and Social Sector
Expenditure.
Adequate fiscal priority has not been given to Social Sector (except
Health and Education Sector) during 2013-14, 2016-17 and 2017-18
when compared to General Category States.
Even though Development Expenditure (DE) as percentage of Total
Expenditure (TE) decreased in 2017-18 when compared to previous
year Education Expenditure/TE and Health Expenditure / TE showed a
marginal increase during the year. The decrease in DE/TE was mainly
due to decrease in share of Economic Services in TE from 19.47
per cent in 2016-17 to 17.89 per cent in 2017-18.
The proportion of Capital Expenditure in Total Expenditure has been
much lower as compared to General Category States during all the
three years. Government may consider enhancing the proportion of
expenditure on capital sector in order to create much needed assets to
stimulate growth and give priority to physical capital formation. Total Expenditure under ‘Irrigation’ and ‘Agriculture and Allied
Activities’ decreased by 4 per cent and 7 per cent respectively during
the year when compared to the previous year.
During 2017-18, Capital Expenditure as percentage of GSDP was lower for
Kerala State (1.28 per cent) when compared to Tamil Nadu (1.42 per cent)
and Karnataka (2.73 per cent).
1.8.2 Efficiency of expenditure
It is important for the State to take appropriate expenditure rationalisation
measures and incur public expenditure on development heads from the point
of view of social and economic development. Development expenditure
comprised of revenue expenditure, capital expenditure and loans and advances
in socio-economic services. Table 1.30 presents the trends in development
expenditure relative to the total expenditure of the State during last five years.
Chart 1.10 presents component-wise development expenditure during 2013-
14 to 2017-18.
Table 1.30: Development expenditure (` in crore)
Components of Development Expenditure 2013-14 2014-15 2015-16 2016-17 2017-18
Development Expenditure (a to c)
a. Revenue expenditure 28,909
(43.64)
33,916
(44.19)
38,702
(44.47)
44,420
(43.39)
47,227
(42.84)
b. Capital expenditure 4,146
(6.26)
4,120
(5.37)
7,243
(8.32)
9,915
(9.68)
8,481
(7.69)
c. Loans and advances 1,256
(1.90)
534
(0.70)
637
(0.73)
718
(0.70)
1,476
(1.34)
Total Development Expenditure 34,311
(51.80)
38,570
(50.26)
46,582
(53.52)
55,053
(53.77)
57,184
(51.87)
Total Expenditure 66,244 76,744 87,032 1,02,382 1,10,238
Source: Finance Accounts of respective years
Figures in parenthesis are its share in total expenditure
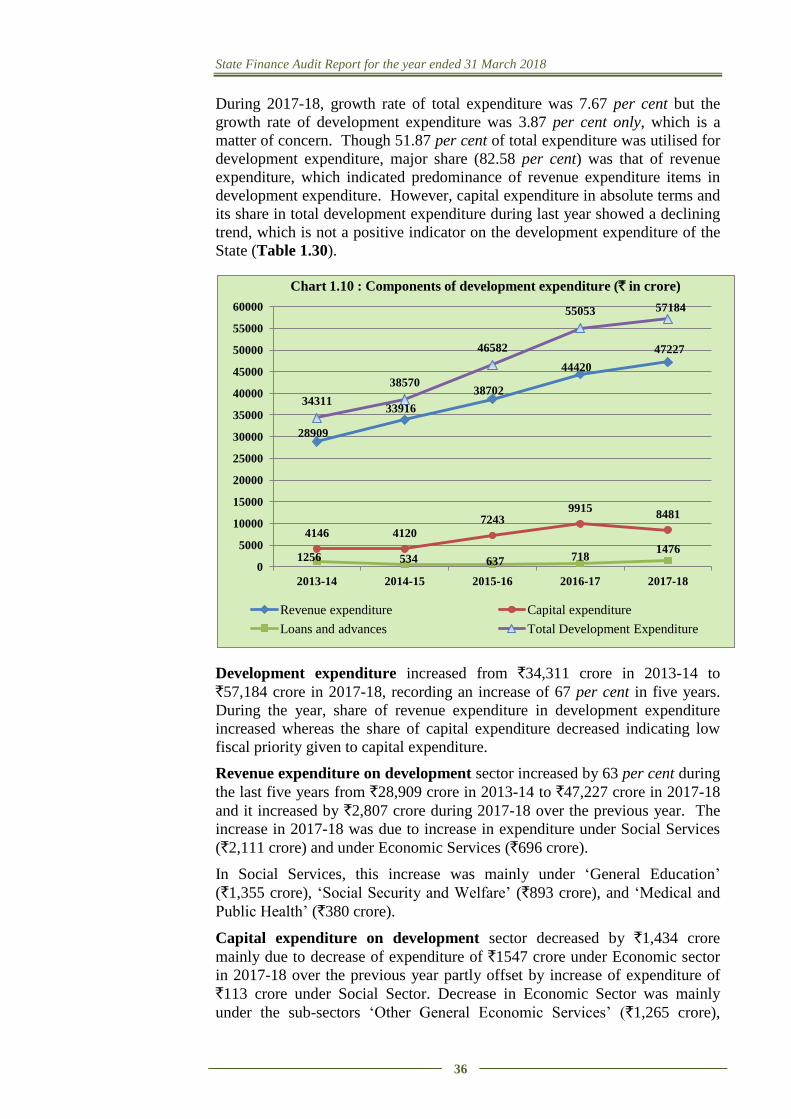
State Finance Audit Report for the year ended 31 March 2018
36
During 2017-18, growth rate of total expenditure was 7.67 per cent but the
growth rate of development expenditure was 3.87 per cent only, which is a
matter of concern. Though 51.87 per cent of total expenditure was utilised for
development expenditure, major share (82.58 per cent) was that of revenue
expenditure, which indicated predominance of revenue expenditure items in
development expenditure. However, capital expenditure in absolute terms and
its share in total development expenditure during last year showed a declining
trend, which is not a positive indicator on the development expenditure of the
State (Table 1.30).
Development expenditure increased from `34,311 crore in 2013-14 to
`57,184 crore in 2017-18, recording an increase of 67 per cent in five years.
During the year, share of revenue expenditure in development expenditure
increased whereas the share of capital expenditure decreased indicating low
fiscal priority given to capital expenditure.
Revenue expenditure on development sector increased by 63 per cent during
the last five years from `28,909 crore in 2013-14 to `47,227 crore in 2017-18
and it increased by `2,807 crore during 2017-18 over the previous year. The
increase in 2017-18 was due to increase in expenditure under Social Services
(`2,111 crore) and under Economic Services (`696 crore).
In Social Services, this increase was mainly under ‘General Education’
(`1,355 crore), ‘Social Security and Welfare’ (`893 crore), and ‘Medical and
Public Health’ (`380 crore).
Capital expenditure on development sector decreased by `1,434 crore
mainly due to decrease of expenditure of `1547 crore under Economic sector
in 2017-18 over the previous year partly offset by increase of expenditure of
`113 crore under Social Sector. Decrease in Economic Sector was mainly
under the sub-sectors ‘Other General Economic Services’ (`1,265 crore),
28909
33916
38702
44420
47227
4146 4120
7243 9915
8481
1256 534 637 718 1476
34311
38570
46582
55053 57184
0
5000
10000
15000
20000
25000
30000
35000
40000
45000
50000
55000
60000
2013-14 2014-15 2015-16 2016-17 2017-18
Chart 1.10 : Components of development expenditure (` in crore)
Revenue expenditure Capital expenditure
Loans and advances Total Development Expenditure
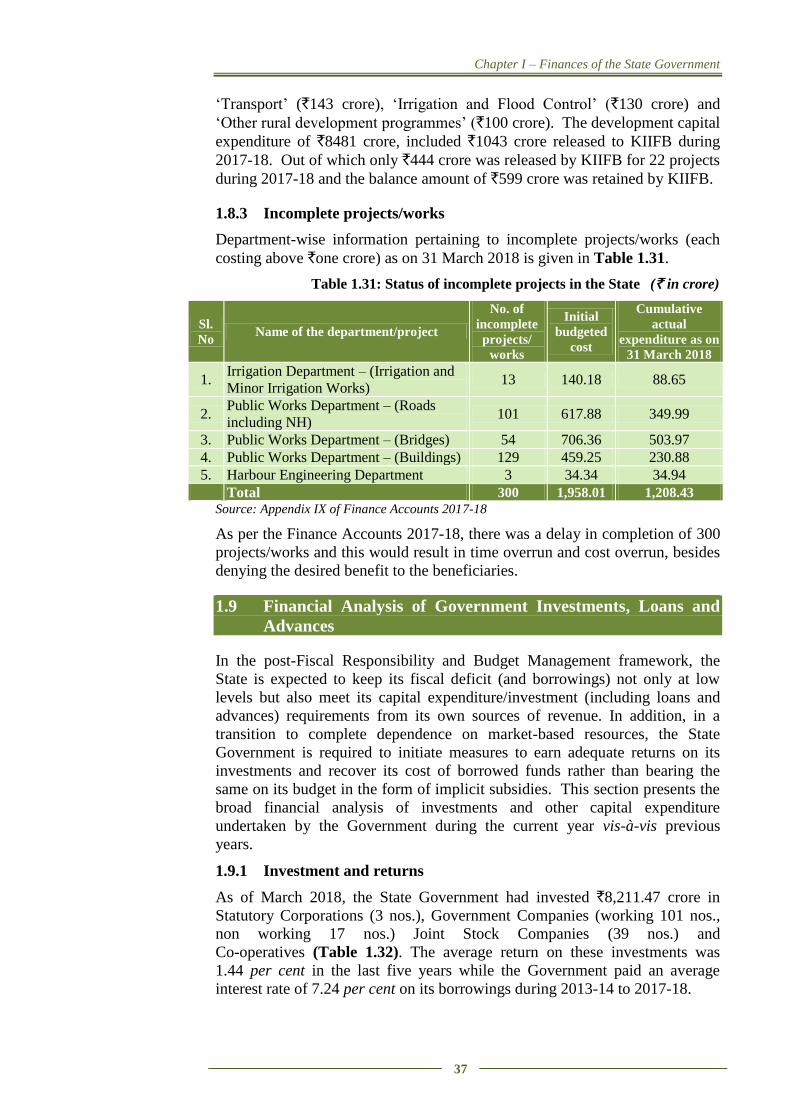
Chapter I – Finances of the State Government
37
‘Transport’ (`143 crore), ‘Irrigation and Flood Control’ (`130 crore) and
‘Other rural development programmes’ (`100 crore). The development capital
expenditure of `8481 crore, included `1043 crore released to KIIFB during
2017-18. Out of which only `444 crore was released by KIIFB for 22 projects
during 2017-18 and the balance amount of `599 crore was retained by KIIFB.
1.8.3 Incomplete projects/works
Department-wise information pertaining to incomplete projects/works (each
costing above `one crore) as on 31 March 2018 is given in Table 1.31.
Table 1.31: Status of incomplete projects in the State (` in crore)
Sl.
No Name of the department/project
No. of
incomplete
projects/
works
Initial
budgeted
cost
Cumulative
actual
expenditure as on
31 March 2018
1. Irrigation Department – (Irrigation and
Minor Irrigation Works) 13 140.18 88.65
2. Public Works Department – (Roads
including NH) 101 617.88 349.99
3. Public Works Department – (Bridges) 54 706.36 503.97
4. Public Works Department – (Buildings) 129 459.25 230.88
5. Harbour Engineering Department 3 34.34 34.94
Total 300 1,958.01 1,208.43
Source: Appendix IX of Finance Accounts 2017-18
As per the Finance Accounts 2017-18, there was a delay in completion of 300
projects/works and this would result in time overrun and cost overrun, besides
denying the desired benefit to the beneficiaries.
1.9 Financial Analysis of Government Investments, Loans and
Advances
In the post-Fiscal Responsibility and Budget Management framework, the
State is expected to keep its fiscal deficit (and borrowings) not only at low
levels but also meet its capital expenditure/investment (including loans and
advances) requirements from its own sources of revenue. In addition, in a
transition to complete dependence on market-based resources, the State
Government is required to initiate measures to earn adequate returns on its
investments and recover its cost of borrowed funds rather than bearing the
same on its budget in the form of implicit subsidies. This section presents the
broad financial analysis of investments and other capital expenditure
undertaken by the Government during the current year vis-à-vis previous
years.
1.9.1 Investment and returns
As of March 2018, the State Government had invested `8,211.47 crore in
Statutory Corporations (3 nos.), Government Companies (working 101 nos.,
non working 17 nos.) Joint Stock Companies (39 nos.) and
Co-operatives (Table 1.32). The average return on these investments was
1.44 per cent in the last five years while the Government paid an average
interest rate of 7.24 per cent on its borrowings during 2013-14 to 2017-18.
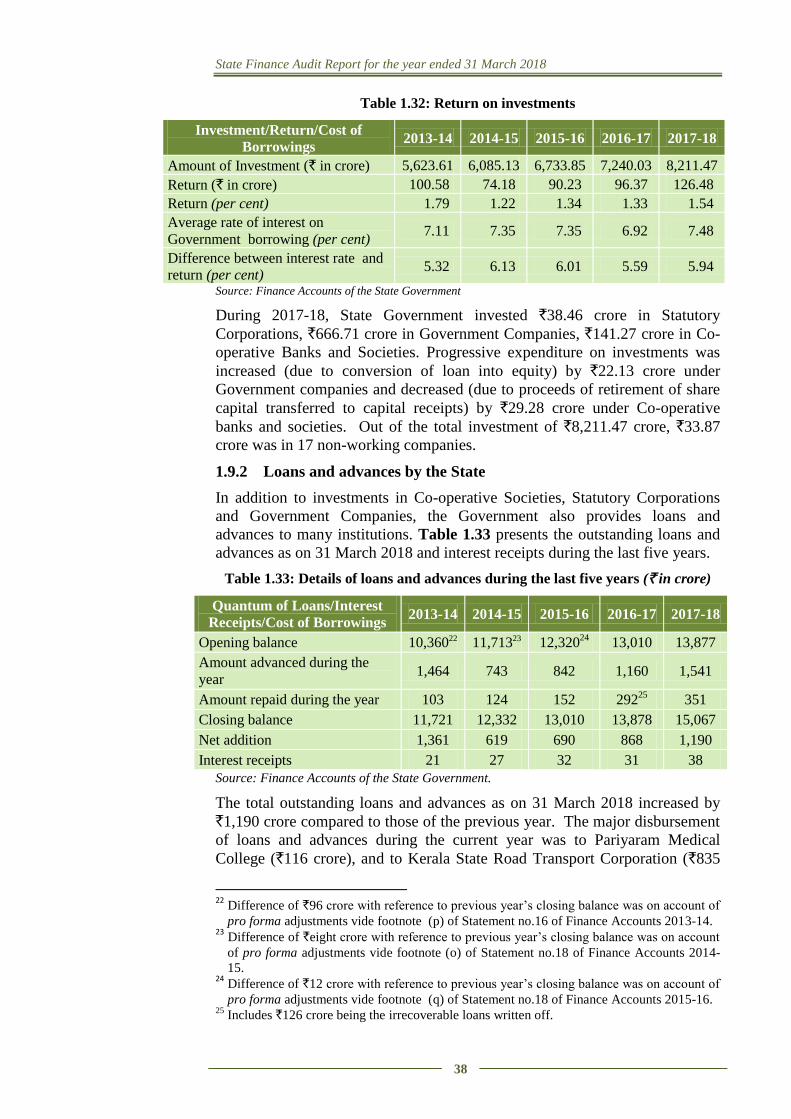
State Finance Audit Report for the year ended 31 March 2018
38
Table 1.32: Return on investments
Investment/Return/Cost of
Borrowings 2013-14 2014-15 2015-16 2016-17 2017-18
Amount of Investment (` in crore) 5,623.61 6,085.13 6,733.85 7,240.03 8,211.47
Return (` in crore) 100.58 74.18 90.23 96.37 126.48
Return (per cent) 1.79 1.22 1.34 1.33 1.54
Average rate of interest on
Government borrowing (per cent) 7.11 7.35 7.35 6.92 7.48
Difference between interest rate and
return (per cent) 5.32 6.13 6.01 5.59 5.94
Source: Finance Accounts of the State Government
During 2017-18, State Government invested `38.46 crore in Statutory
Corporations, `666.71 crore in Government Companies, `141.27 crore in Co-
operative Banks and Societies. Progressive expenditure on investments was
increased (due to conversion of loan into equity) by `22.13 crore under
Government companies and decreased (due to proceeds of retirement of share
capital transferred to capital receipts) by `29.28 crore under Co-operative
banks and societies. Out of the total investment of `8,211.47 crore, `33.87
crore was in 17 non-working companies.
1.9.2 Loans and advances by the State
In addition to investments in Co-operative Societies, Statutory Corporations
and Government Companies, the Government also provides loans and
advances to many institutions. Table 1.33 presents the outstanding loans and
advances as on 31 March 2018 and interest receipts during the last five years.
Table 1.33: Details of loans and advances during the last five years (` in crore)
Source: Finance Accounts of the State Government.
The total outstanding loans and advances as on 31 March 2018 increased by
`1,190 crore compared to those of the previous year. The major disbursement
of loans and advances during the current year was to Pariyaram Medical
College (`116 crore), and to Kerala State Road Transport Corporation (`835
22
Difference of `96 crore with reference to previous year’s closing balance was on account of
pro forma adjustments vide footnote (p) of Statement no.16 of Finance Accounts 2013-14. 23
Difference of `eight crore with reference to previous year’s closing balance was on account
of pro forma adjustments vide footnote (o) of Statement no.18 of Finance Accounts 2014-
15. 24
Difference of `12 crore with reference to previous year’s closing balance was on account of
pro forma adjustments vide footnote (q) of Statement no.18 of Finance Accounts 2015-16. 25
Includes `126 crore being the irrecoverable loans written off.
Quantum of Loans/Interest
Receipts/Cost of Borrowings 2013-14 2014-15 2015-16 2016-17 2017-18
Opening balance 10,36022 11,71323 12,32024
13,010 13,877
Amount advanced during the
year 1,464 743 842 1,160 1,541
Amount repaid during the year 103 124 152 29225
351
Closing balance 11,721 12,332 13,010 13,878 15,067
Net addition 1,361 619 690 868 1,190
Interest receipts 21 27 32 31 38
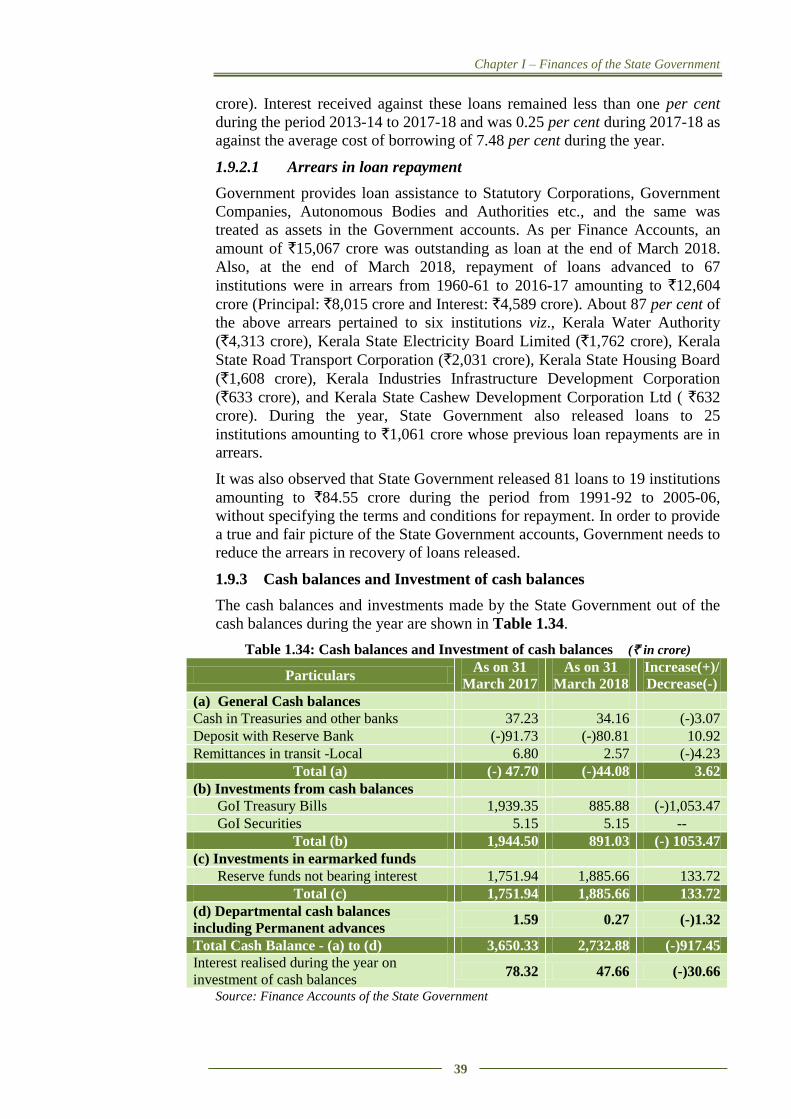
Chapter I – Finances of the State Government
39
crore). Interest received against these loans remained less than one per cent
during the period 2013-14 to 2017-18 and was 0.25 per cent during 2017-18 as
against the average cost of borrowing of 7.48 per cent during the year.
1.9.2.1 Arrears in loan repayment
Government provides loan assistance to Statutory Corporations, Government
Companies, Autonomous Bodies and Authorities etc., and the same was
treated as assets in the Government accounts. As per Finance Accounts, an
amount of `15,067 crore was outstanding as loan at the end of March 2018.
Also, at the end of March 2018, repayment of loans advanced to 67
institutions were in arrears from 1960-61 to 2016-17 amounting to `12,604
crore (Principal: `8,015 crore and Interest: `4,589 crore). About 87 per cent of
the above arrears pertained to six institutions viz., Kerala Water Authority
(`4,313 crore), Kerala State Electricity Board Limited (`1,762 crore), Kerala
State Road Transport Corporation (`2,031 crore), Kerala State Housing Board
(`1,608 crore), Kerala Industries Infrastructure Development Corporation
(`633 crore), and Kerala State Cashew Development Corporation Ltd ( `632
crore). During the year, State Government also released loans to 25
institutions amounting to `1,061 crore whose previous loan repayments are in
arrears.
It was also observed that State Government released 81 loans to 19 institutions
amounting to `84.55 crore during the period from 1991-92 to 2005-06,
without specifying the terms and conditions for repayment. In order to provide
a true and fair picture of the State Government accounts, Government needs to
reduce the arrears in recovery of loans released.
1.9.3 Cash balances and Investment of cash balances
The cash balances and investments made by the State Government out of the
cash balances during the year are shown in Table 1.34.
Table 1.34: Cash balances and Investment of cash balances (` in crore)
Particulars As on 31
March 2017
As on 31
March 2018
Increase(+)/
Decrease(-)
(a) General Cash balances
Cash in Treasuries and other banks 37.23 34.16 (-)3.07
Deposit with Reserve Bank (-)91.73 (-)80.81 10.92
Remittances in transit -Local 6.80 2.57 (-)4.23
Total (a) (-) 47.70 (-)44.08 3.62
(b) Investments from cash balances
GoI Treasury Bills 1,939.35 885.88 (-)1,053.47
GoI Securities 5.15 5.15 --
Total (b) 1,944.50 891.03 (-) 1053.47
(c) Investments in earmarked funds
Reserve funds not bearing interest 1,751.94 1,885.66 133.72
Total (c) 1,751.94 1,885.66 133.72
(d) Departmental cash balances
including Permanent advances 1.59 0.27 (-)1.32
Total Cash Balance - (a) to (d) 3,650.33 2,732.88 (-)917.45
Interest realised during the year on
investment of cash balances 78.32 47.66 (-)30.66
Source: Finance Accounts of the State Government
State Finance Audit Report for the year ended 31 March 2018
40
Table 1.34 shows that cash balance of the State, at the end of March 2018,
decreased by `917.45 crore compared to the closing balance at the end of
March 2017. This was due to the decrease in investments under GoI Treasury
Bills (`1,053.47 crore) partly offset by increase in investments in earmarked
funds (`133.72 crore). The interest realised on investment of cash balance also
decreased by `30.66 crore, compared to the previous year.
1.9.3.1 Outstanding balances under the head ‘Cheques and Bills’
This head is an intermediary accounting head for initial recording of
transactions which are to be cleared eventually. As per accounting rules, when
a cheque is issued, the functional head is debited and the Major Head-‘8670-
Cheques and Bills’ is credited. On clearance of the cheque by the bank, the
minus credit is given to Major Head-‘8670-Cheques and Bills’ by crediting the
Major Head-‘8675-Deposits with Reserve Bank’ and thereby reducing the
cash balance of the Government. Thus, the outstanding balance under the
Major Head-‘8670-Cheques and Bills’ represents the amount of un-encashed
cheques.
As on 31 March 2018, there was an outstanding balance (cumulative) of
`1,263.29 crore. This represents expenditure originally booked under different
major heads of Consolidated Fund, which did not result in any cash outflow
till the end of March 2018.
1.10 Assets and Liabilities
1.10.1 Growth and composition of assets and liabilities
In the existing Government accounting system, comprehensive accounting of
fixed assets like land and buildings owned by the Government is not done.
However, the Government accounts do capture the financial liabilities of the
Government and the assets created out of the expenditure incurred.
Appendix 1.4 Part B gives an abstract of such liabilities and assets as on 31
March 2018, compared with the corresponding position as on 31 March 2017.
While the liabilities in this Appendix consist mainly of internal borrowings,
loans and advances from GoI, receipts from the Public Account and Reserve
Funds, the assets mainly comprise of the capital outlay and loans and advances
given by the State Government and its cash balances.
1.10.2 Fiscal liabilities
The trends of outstanding fiscal liabilities of the State are presented in
Appendix 1.5. The composition of fiscal liabilities during the last five years
are presented in Chart 1.11.
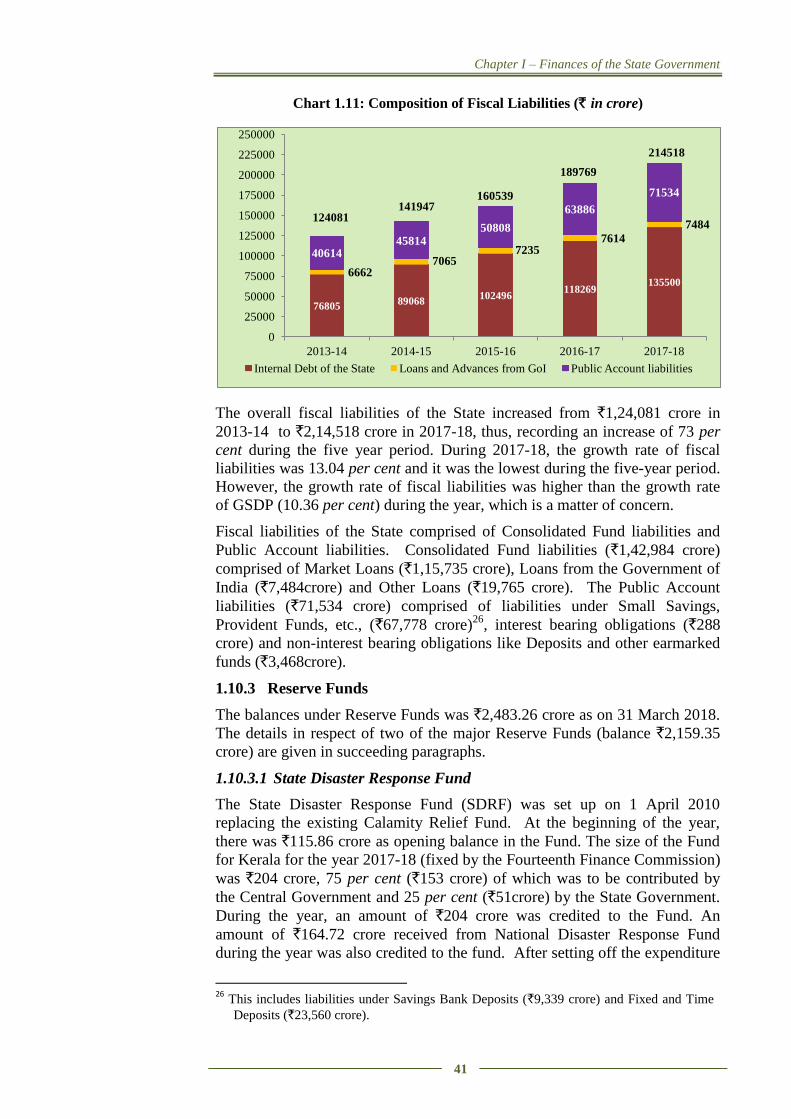
Chapter I – Finances of the State Government
41
Chart 1.11: Composition of Fiscal Liabilities (` in crore)
The overall fiscal liabilities of the State increased from `1,24,081 crore in
2013-14 to `2,14,518 crore in 2017-18, thus, recording an increase of 73 per
cent during the five year period. During 2017-18, the growth rate of fiscal
liabilities was 13.04 per cent and it was the lowest during the five-year period.
However, the growth rate of fiscal liabilities was higher than the growth rate
of GSDP (10.36 per cent) during the year, which is a matter of concern.
Fiscal liabilities of the State comprised of Consolidated Fund liabilities and
Public Account liabilities. Consolidated Fund liabilities (`1,42,984 crore)
comprised of Market Loans (`1,15,735 crore), Loans from the Government of
India (`7,484crore) and Other Loans (`19,765 crore). The Public Account
liabilities (`71,534 crore) comprised of liabilities under Small Savings,
Provident Funds, etc., (`67,778 crore)26
, interest bearing obligations (`288
crore) and non-interest bearing obligations like Deposits and other earmarked
funds (`3,468crore).
1.10.3 Reserve Funds
The balances under Reserve Funds was `2,483.26 crore as on 31 March 2018.
The details in respect of two of the major Reserve Funds (balance `2,159.35
crore) are given in succeeding paragraphs.
1.10.3.1 State Disaster Response Fund
The State Disaster Response Fund (SDRF) was set up on 1 April 2010
replacing the existing Calamity Relief Fund. At the beginning of the year,
there was `115.86 crore as opening balance in the Fund. The size of the Fund
for Kerala for the year 2017-18 (fixed by the Fourteenth Finance Commission)
was `204 crore, 75 per cent (`153 crore) of which was to be contributed by
the Central Government and 25 per cent (`51crore) by the State Government.
During the year, an amount of `204 crore was credited to the Fund. An
amount of `164.72 crore received from National Disaster Response Fund
during the year was also credited to the fund. After setting off the expenditure
26
This includes liabilities under Savings Bank Deposits (`9,339 crore) and Fixed and Time
Deposits (`23,560 crore).
76805 89068
102496 118269
135500 6662
7065 7235
7614
7484
40614 45814
50808
63886
71534
0
25000
50000
75000
100000
125000
150000
175000
200000
225000
250000
2013-14 2014-15 2015-16 2016-17 2017-18
Internal Debt of the State Loans and Advances from GoI Public Account liabilities
141947 124081
160539
214518
189769
State Finance Audit Report for the year ended 31 March 2018
42
for disaster relief operations to the extent of `197.50 crore, the balance in
SDRF as on 31 March 2018 was `287.08 crore.
According to the guidelines issued by the Government of India, SDRF shall be
kept in the Public Account of the State on which the State should pay interest
to the Fund at the rate applicable to overdrafts under the Overdrafts Regulation
Scheme of RBI. This was not done and also interest payable on the un-
invested balances of the earlier years was also not estimated by the
Government and credited to the Fund so far. Non-transfer of interest amount
resulted in under-statement of revenue expenditure and also reduced balance
under SDRF.
1.10.3.2 Consolidated Sinking Fund
The State Government set up a Consolidated Sinking Fund with effect from
the financial year 2007-08, according to which the Fund was to be utilised as
an Amortisation Fund for redemption of all outstanding liabilities of the
Government commencing from the financial year 2012-13. The Fund was to
be credited with contributions from revenue at the prescribed rate and interest
accrued on investments made out of the Fund. Only the interest accrued and
credited in the Fund was to be utilised for redemption of the outstanding
liabilities of the Government. As per paragraph 5 of revised model scheme for
the constitution and administration of Consolidated Sinking Fund of Kerala,
the rate of contribution to the Consolidated Sinking Fund was 0.50 per cent of
the outstanding liabilities at the end of the previous year. According to this,
the State Government had to contribute `948.84 crore during 2017-18 to the
Consolidated Sinking Fund. However, the State Government did not
contribute any amount to the Fund, during the current year. Non-contribution
resulted in under-statement of revenue expenditure to the extent of `948.84
crore and also reduced reserve fund for future amortization of loan liability.
As per the guidelines of the fund, the balance at credit of the Fund is required
to be invested in the Government of India Securities. During the year, an
amount of `134.89 crore was received as interest from the investment made
out of the fund. At the beginning of the year, `1,737.38 crore was available
and with the interest received on investment, the outstanding balance at the
end of year was `1,872.27 crore.
1.10.4 Status of Guarantees – Contingent Liabilities
Guarantees are contingent liabilities on the Consolidated Fund of the State in
cases of default by borrowers for whom the guarantees have been extended.
Section 3 of the Kerala Ceiling on Government Guarantees (Amendment) Act,
201527
stipulates that the total outstanding Government Guarantees as on the
first day of April every year shall not exceed `21,000 crore. The maximum
amount for which guarantees were given by the State and outstanding
guarantees at the end of the year since 2013-14 are given in Table 1.35.
27
Kerala Ceiling on Government Guarantees Act, 2003 was amended in 2015 and ceiling on
outstanding Government guarantee at the end of the year was revised from `14,000 crore to
`21,000 crore.
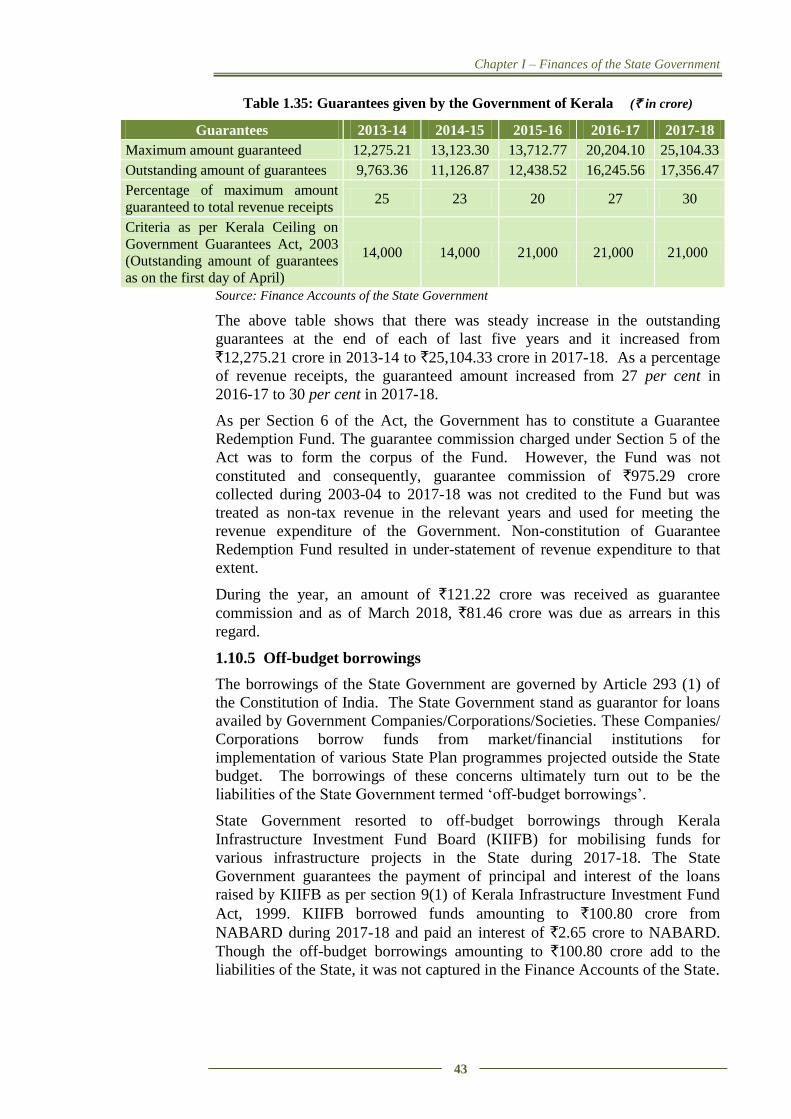
Chapter I – Finances of the State Government
43
Table 1.35: Guarantees given by the Government of Kerala (` in crore)
Guarantees 2013-14 2014-15 2015-16 2016-17 2017-18
Maximum amount guaranteed 12,275.21 13,123.30 13,712.77 20,204.10 25,104.33
Outstanding amount of guarantees 9,763.36 11,126.87 12,438.52 16,245.56 17,356.47
Percentage of maximum amount
guaranteed to total revenue receipts 25 23 20 27 30
Criteria as per Kerala Ceiling on
Government Guarantees Act, 2003
(Outstanding amount of guarantees
as on the first day of April)
14,000 14,000 21,000 21,000 21,000
Source: Finance Accounts of the State Government
The above table shows that there was steady increase in the outstanding
guarantees at the end of each of last five years and it increased from
`12,275.21 crore in 2013-14 to `25,104.33 crore in 2017-18. As a percentage
of revenue receipts, the guaranteed amount increased from 27 per cent in
2016-17 to 30 per cent in 2017-18.
As per Section 6 of the Act, the Government has to constitute a Guarantee
Redemption Fund. The guarantee commission charged under Section 5 of the
Act was to form the corpus of the Fund. However, the Fund was not
constituted and consequently, guarantee commission of `975.29 crore
collected during 2003-04 to 2017-18 was not credited to the Fund but was
treated as non-tax revenue in the relevant years and used for meeting the
revenue expenditure of the Government. Non-constitution of Guarantee
Redemption Fund resulted in under-statement of revenue expenditure to that
extent.
During the year, an amount of `121.22 crore was received as guarantee
commission and as of March 2018, `81.46 crore was due as arrears in this
regard.
1.10.5 Off-budget borrowings
The borrowings of the State Government are governed by Article 293 (1) of
the Constitution of India. The State Government stand as guarantor for loans
availed by Government Companies/Corporations/Societies. These Companies/
Corporations borrow funds from market/financial institutions for
implementation of various State Plan programmes projected outside the State
budget. The borrowings of these concerns ultimately turn out to be the
liabilities of the State Government termed ‘off-budget borrowings’.
State Government resorted to off-budget borrowings through Kerala
Infrastructure Investment Fund Board (KIIFB) for mobilising funds for
various infrastructure projects in the State during 2017-18. The State
Government guarantees the payment of principal and interest of the loans
raised by KIIFB as per section 9(1) of Kerala Infrastructure Investment Fund
Act, 1999. KIIFB borrowed funds amounting to `100.80 crore from
NABARD during 2017-18 and paid an interest of `2.65 crore to NABARD.
Though the off-budget borrowings amounting to `100.80 crore add to the
liabilities of the State, it was not captured in the Finance Accounts of the State.
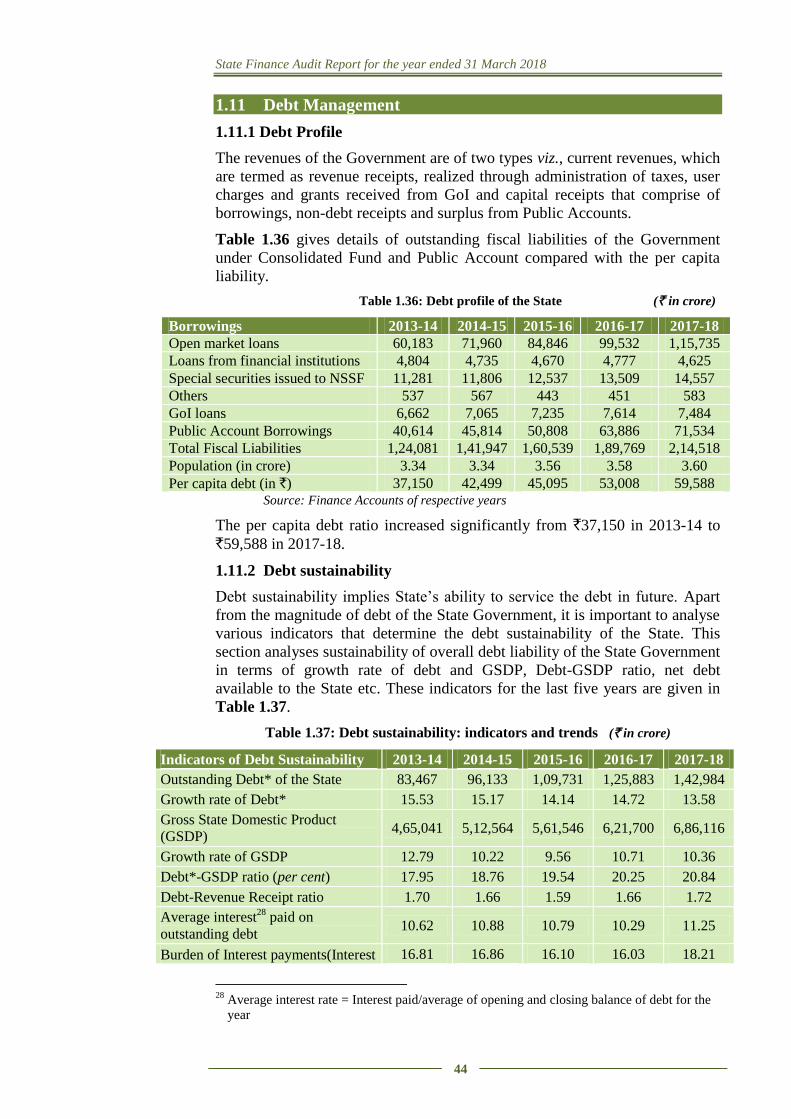
State Finance Audit Report for the year ended 31 March 2018
44
1.11 Debt Management
1.11.1 Debt Profile
The revenues of the Government are of two types viz., current revenues, which
are termed as revenue receipts, realized through administration of taxes, user
charges and grants received from GoI and capital receipts that comprise of
borrowings, non-debt receipts and surplus from Public Accounts.
Table 1.36 gives details of outstanding fiscal liabilities of the Government
under Consolidated Fund and Public Account compared with the per capita
liability.
Table 1.36: Debt profile of the State (` in crore)
Borrowings 2013-14 2014-15 2015-16 2016-17 2017-18
Open market loans 60,183 71,960 84,846 99,532 1,15,735
Loans from financial institutions 4,804 4,735 4,670 4,777 4,625
Special securities issued to NSSF 11,281 11,806 12,537 13,509 14,557
Others 537 567 443 451 583
GoI loans 6,662 7,065 7,235 7,614 7,484
Public Account Borrowings 40,614 45,814 50,808 63,886 71,534
Total Fiscal Liabilities 1,24,081 1,41,947 1,60,539 1,89,769 2,14,518
Population (in crore) 3.34 3.34 3.56 3.58 3.60
Per capita debt (in `) 37,150 42,499 45,095 53,008 59,588 Source: Finance Accounts of respective years
The per capita debt ratio increased significantly from `37,150 in 2013-14 to
`59,588 in 2017-18.
1.11.2 Debt sustainability
Debt sustainability implies State’s ability to service the debt in future. Apart
from the magnitude of debt of the State Government, it is important to analyse
various indicators that determine the debt sustainability of the State. This
section analyses sustainability of overall debt liability of the State Government
in terms of growth rate of debt and GSDP, Debt-GSDP ratio, net debt
available to the State etc. These indicators for the last five years are given in
Table 1.37.
Table 1.37: Debt sustainability: indicators and trends (` in crore)
Indicators of Debt Sustainability 2013-14 2014-15 2015-16 2016-17 2017-18
Outstanding Debt* of the State 83,467 96,133 1,09,731 1,25,883 1,42,984
Growth rate of Debt* 15.53 15.17 14.14 14.72 13.58
Gross State Domestic Product
(GSDP) 4,65,041 5,12,564 5,61,546 6,21,700 6,86,116
Growth rate of GSDP 12.79 10.22 9.56 10.71 10.36
Debt*-GSDP ratio (per cent) 17.95 18.76 19.54 20.25 20.84
Debt-Revenue Receipt ratio 1.70 1.66 1.59 1.66 1.72
Average interest28
paid on
outstanding debt 10.62 10.88 10.79 10.29 11.25
Burden of Interest payments(Interest 16.81 16.86 16.10 16.03 18.21
28
Average interest rate = Interest paid/average of opening and closing balance of debt for the
year
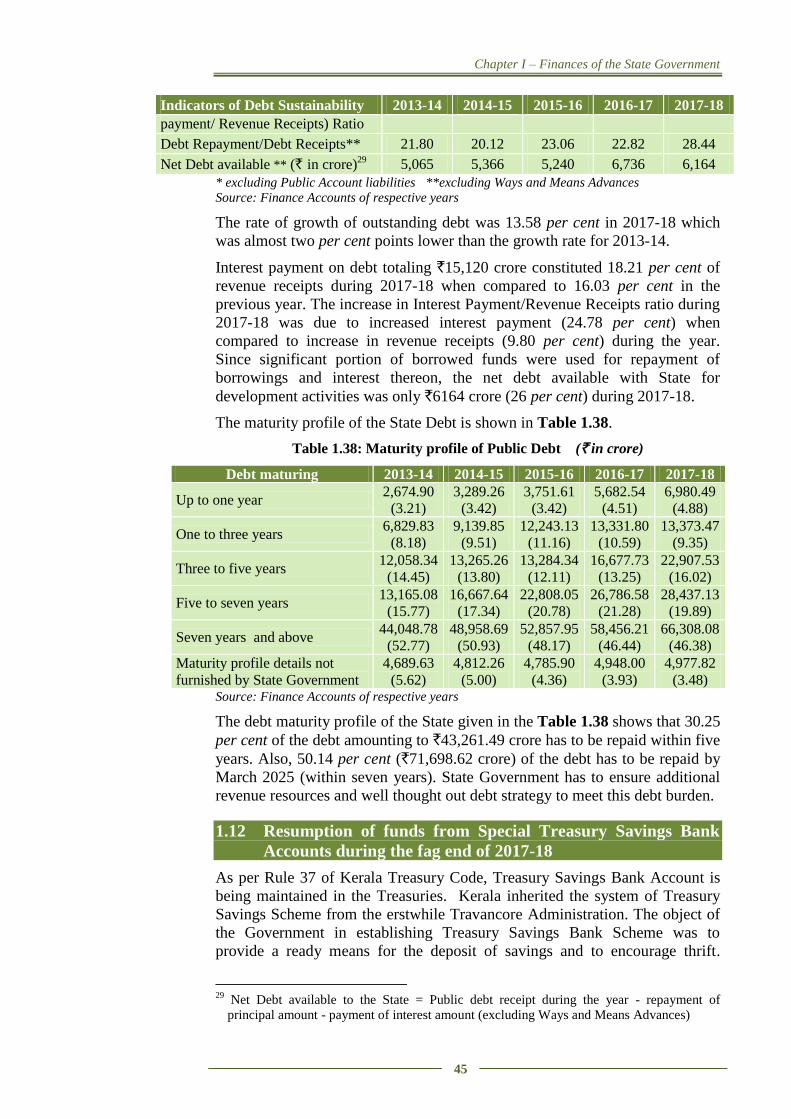
Chapter I – Finances of the State Government
45
Indicators of Debt Sustainability 2013-14 2014-15 2015-16 2016-17 2017-18
payment/ Revenue Receipts) Ratio
Debt Repayment/Debt Receipts** 21.80 20.12 23.06 22.82 28.44
Net Debt available ** (` in crore)29
5,065 5,366 5,240 6,736 6,164
* excluding Public Account liabilities **excluding Ways and Means Advances
Source: Finance Accounts of respective years
The rate of growth of outstanding debt was 13.58 per cent in 2017-18 which
was almost two per cent points lower than the growth rate for 2013-14.
Interest payment on debt totaling `15,120 crore constituted 18.21 per cent of
revenue receipts during 2017-18 when compared to 16.03 per cent in the
previous year. The increase in Interest Payment/Revenue Receipts ratio during
2017-18 was due to increased interest payment (24.78 per cent) when
compared to increase in revenue receipts (9.80 per cent) during the year.
Since significant portion of borrowed funds were used for repayment of
borrowings and interest thereon, the net debt available with State for
development activities was only `6164 crore (26 per cent) during 2017-18.
The maturity profile of the State Debt is shown in Table 1.38.
Table 1.38: Maturity profile of Public Debt (` in crore)
Source: Finance Accounts of respective years
The debt maturity profile of the State given in the Table 1.38 shows that 30.25
per cent of the debt amounting to `43,261.49 crore has to be repaid within five
years. Also, 50.14 per cent (`71,698.62 crore) of the debt has to be repaid by
March 2025 (within seven years). State Government has to ensure additional
revenue resources and well thought out debt strategy to meet this debt burden.
1.12 Resumption of funds from Special Treasury Savings Bank
Accounts during the fag end of 2017-18
As per Rule 37 of Kerala Treasury Code, Treasury Savings Bank Account is
being maintained in the Treasuries. Kerala inherited the system of Treasury
Savings Scheme from the erstwhile Travancore Administration. The object of
the Government in establishing Treasury Savings Bank Scheme was to
provide a ready means for the deposit of savings and to encourage thrift.
29
Net Debt available to the State = Public debt receipt during the year - repayment of
principal amount - payment of interest amount (excluding Ways and Means Advances)
Debt maturing 2013-14 2014-15 2015-16 2016-17 2017-18
Up to one year 2,674.90
(3.21)
3,289.26
(3.42)
3,751.61
(3.42)
5,682.54
(4.51)
6,980.49
(4.88)
One to three years 6,829.83
(8.18)
9,139.85
(9.51)
12,243.13
(11.16)
13,331.80
(10.59)
13,373.47
(9.35)
Three to five years 12,058.34
(14.45)
13,265.26
(13.80)
13,284.34
(12.11)
16,677.73
(13.25)
22,907.53
(16.02)
Five to seven years 13,165.08
(15.77)
16,667.64
(17.34)
22,808.05
(20.78)
26,786.58
(21.28)
28,437.13
(19.89)
Seven years and above 44,048.78
(52.77)
48,958.69
(50.93)
52,857.95
(48.17)
58,456.21
(46.44)
66,308.08
(46.38)
Maturity profile details not
furnished by State Government
4,689.63
(5.62)
4,812.26
(5.00)
4,785.90
(4.36)
4,948.00
(3.93)
4,977.82
(3.48)
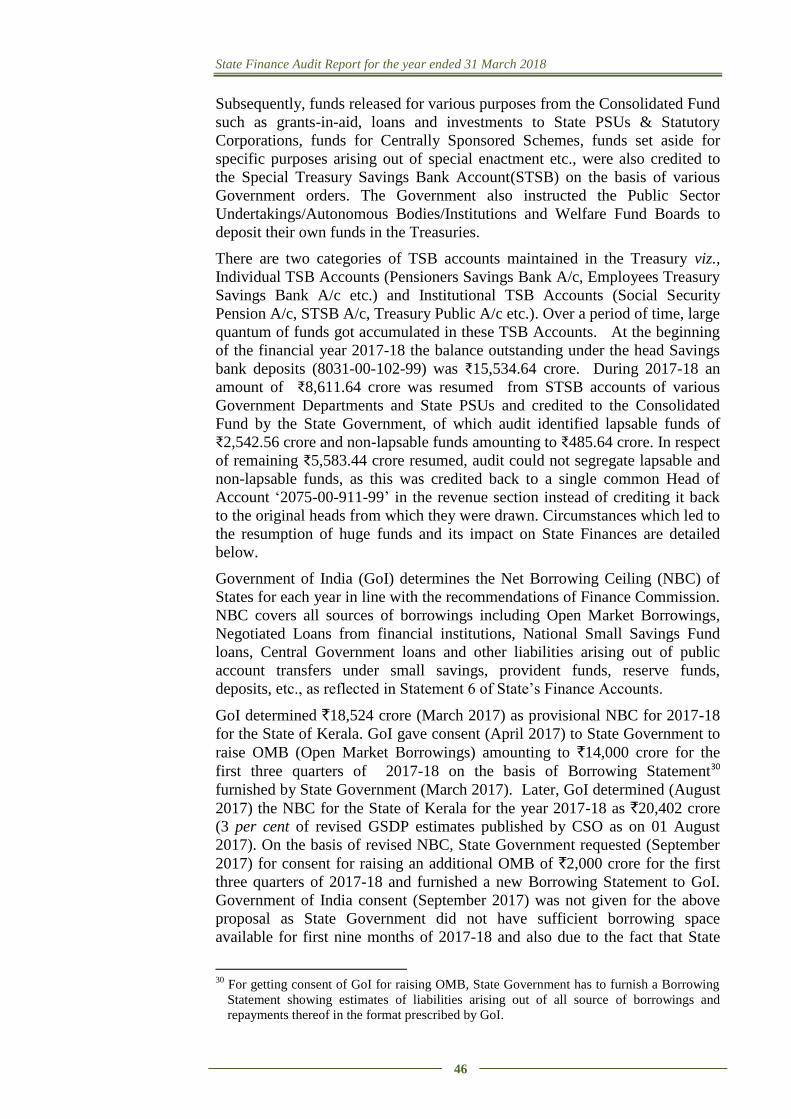
State Finance Audit Report for the year ended 31 March 2018
46
Subsequently, funds released for various purposes from the Consolidated Fund
such as grants-in-aid, loans and investments to State PSUs & Statutory
Corporations, funds for Centrally Sponsored Schemes, funds set aside for
specific purposes arising out of special enactment etc., were also credited to
the Special Treasury Savings Bank Account(STSB) on the basis of various
Government orders. The Government also instructed the Public Sector
Undertakings/Autonomous Bodies/Institutions and Welfare Fund Boards to
deposit their own funds in the Treasuries.
There are two categories of TSB accounts maintained in the Treasury viz.,
Individual TSB Accounts (Pensioners Savings Bank A/c, Employees Treasury
Savings Bank A/c etc.) and Institutional TSB Accounts (Social Security
Pension A/c, STSB A/c, Treasury Public A/c etc.). Over a period of time, large
quantum of funds got accumulated in these TSB Accounts. At the beginning
of the financial year 2017-18 the balance outstanding under the head Savings
bank deposits (8031-00-102-99) was ₹15,534.64 crore. During 2017-18 an
amount of ₹8,611.64 crore was resumed from STSB accounts of various
Government Departments and State PSUs and credited to the Consolidated
Fund by the State Government, of which audit identified lapsable funds of
₹2,542.56 crore and non-lapsable funds amounting to ₹485.64 crore. In respect
of remaining ₹5,583.44 crore resumed, audit could not segregate lapsable and
non-lapsable funds, as this was credited back to a single common Head of
Account ‘2075-00-911-99’ in the revenue section instead of crediting it back
to the original heads from which they were drawn. Circumstances which led to
the resumption of huge funds and its impact on State Finances are detailed
below.
Government of India (GoI) determines the Net Borrowing Ceiling (NBC) of
States for each year in line with the recommendations of Finance Commission.
NBC covers all sources of borrowings including Open Market Borrowings,
Negotiated Loans from financial institutions, National Small Savings Fund
loans, Central Government loans and other liabilities arising out of public
account transfers under small savings, provident funds, reserve funds,
deposits, etc., as reflected in Statement 6 of State’s Finance Accounts.
GoI determined `18,524 crore (March 2017) as provisional NBC for 2017-18
for the State of Kerala. GoI gave consent (April 2017) to State Government to
raise OMB (Open Market Borrowings) amounting to `14,000 crore for the
first three quarters of 2017-18 on the basis of Borrowing Statement30
furnished by State Government (March 2017). Later, GoI determined (August
2017) the NBC for the State of Kerala for the year 2017-18 as `20,402 crore
(3 per cent of revised GSDP estimates published by CSO as on 01 August
2017). On the basis of revised NBC, State Government requested (September
2017) for consent for raising an additional OMB of `2,000 crore for the first
three quarters of 2017-18 and furnished a new Borrowing Statement to GoI.
Government of India consent (September 2017) was not given for the above
proposal as State Government did not have sufficient borrowing space
available for first nine months of 2017-18 and also due to the fact that State
30
For getting consent of GoI for raising OMB, State Government has to furnish a Borrowing
Statement showing estimates of liabilities arising out of all source of borrowings and
repayments thereof in the format prescribed by GoI.
Chapter I – Finances of the State Government
47
Government had over-borrowed `5,84331 crore in 2016-17 beyond Net
Borrowing ceiling of `18,524 crore fixed for that year. In order to get the
consent of GoI for Open Market Borrowings for the last quarter of the
Financial year, State Government revised (December 2017) the Borrowing
Statement furnished in September 2017 by reducing Net Public Account
accretions by `5,500 crore. This reduction in Public Account accretions was
proposed by State Government by resuming funds parked in the Treasuries in
Special Treasury Savings Bank Accounts (STSB)32 by various Government
Departments and State owned PSUs under ‘Other Public Accounts’ into the
Consolidated Fund of the State. This enabled the State Government to depict a
reduction in net accretions in the revised Borrowing Statement under Public
Accounts from `350033 crore to (-)`2000 crore thereby increasing the State’s
entitlement for OMB to that extent.
As per the revised borrowing statement, State became eligible for Open
Market Borrowings amounting to `6,500 crore for the last quarter of 2017-18.
Overall, State Government raised `20,500 crore as Open Market Borrowings
during 2017-18.
State Government resumed an amount of `8,611.64 crore (January 2018 and
March 2018) to the Consolidated Fund during 2017-18 from Special Treasury
Saving Bank Accounts under ‘Public Accounts’; of which an amount of
`313.42 crore was refunded back to Government departments/ PSUs during
2017-18. The net resumption from Public Accounts to the Consolidated Fund
was `8,298.22 crore, including `7,812.58 crore, `347.05 crore and `138.59
crore under Revenue, Capital and Loan heads respectively. Resumption of
funds to the Consolidated Fund resulted in decrease of Revenue Deficit
(`7812.58 crore) Capital and Loan (`485.64 crore) and Fiscal Deficit
(`8298.22 crore). A scrutiny of resumption of funds revealed the following.
1.12.1 Resumption and credit back of funds to a common head of
account ‘2075-00-911-99’
As per Para 3.10 and 4.3 of General Directions contained in List of Major and
Minor Heads (LMMH) of Controller General of Accounts, Recoveries of
Overpayments pertaining to previous year(s) under Revenue Expenditure are
to be recorded under the distinct minor head ‘Deduct Recoveries of
Overpayments (code 911)’, below the concerned Major/ Sub Major head and
in the case of Capital Expenditure ‘Deduct-Receipts and Recoveries on Capital
Account’ are to be opened, wherever necessary below the relevant minor head
under various Capital Major/Sub Major heads where the expenditure was
initially incurred. During the fag end of 2017-18, State Government resumed
an amount of `5583.44 crore originally debited under various Revenue,
Capital and Loan heads of account and credited back the resumed amounts to
a common head of account ‘2075-00-911-99 Miscellaneous General Services-
31 Due to over borrowing in 2016-17, NBC of State in 2017-18 was reduced by `5,843 crore from
`20,402 crore to `14,559 crore (December 2017). 32
Government departments and state owned PSUs parked their unutilised plan funds in STSB
accounts under Public Account at the fag end of every financial year to avoid lapse of funds
which in turn resulted in accumulation of funds in public account adversely affecting the
borrowing capacity of State Government. 33
`3500 crore was the net Public Accounts accretions as per the Borrowing Statement
furnished by Government of Kerala in September 2017.
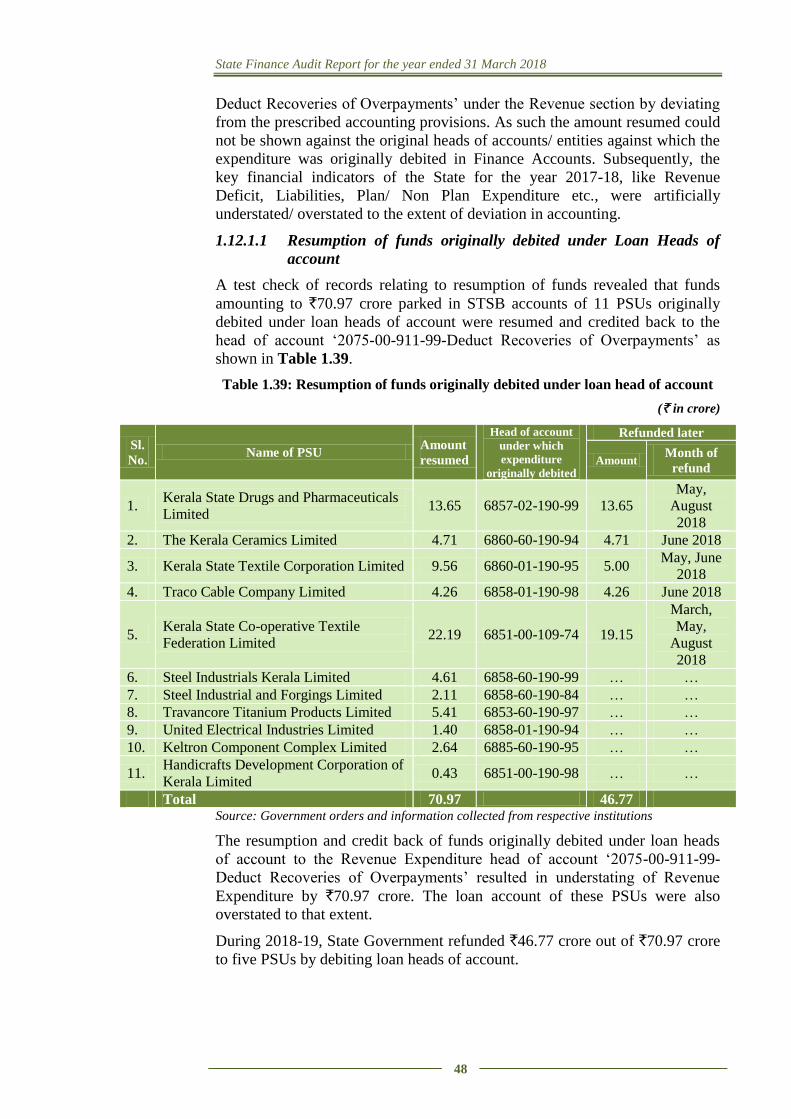
State Finance Audit Report for the year ended 31 March 2018
48
Deduct Recoveries of Overpayments’ under the Revenue section by deviating
from the prescribed accounting provisions. As such the amount resumed could
not be shown against the original heads of accounts/ entities against which the
expenditure was originally debited in Finance Accounts. Subsequently, the
key financial indicators of the State for the year 2017-18, like Revenue
Deficit, Liabilities, Plan/ Non Plan Expenditure etc., were artificially
understated/ overstated to the extent of deviation in accounting.
1.12.1.1 Resumption of funds originally debited under Loan Heads of
account
A test check of records relating to resumption of funds revealed that funds
amounting to `70.97 crore parked in STSB accounts of 11 PSUs originally
debited under loan heads of account were resumed and credited back to the
head of account ‘2075-00-911-99-Deduct Recoveries of Overpayments’ as
shown in Table 1.39.
Table 1.39: Resumption of funds originally debited under loan head of account
(` in crore)
Sl.
No. Name of PSU
Amount
resumed
Head of account
under which
expenditure
originally debited
Refunded later
Amount Month of
refund
1. Kerala State Drugs and Pharmaceuticals
Limited 13.65 6857-02-190-99 13.65
May,
August
2018
2. The Kerala Ceramics Limited 4.71 6860-60-190-94 4.71 June 2018
3. Kerala State Textile Corporation Limited 9.56 6860-01-190-95 5.00 May, June
2018
4. Traco Cable Company Limited 4.26 6858-01-190-98 4.26 June 2018
5. Kerala State Co-operative Textile
Federation Limited 22.19 6851-00-109-74 19.15
March,
May,
August
2018
6. Steel Industrials Kerala Limited 4.61 6858-60-190-99 … …
7. Steel Industrial and Forgings Limited 2.11 6858-60-190-84 … …
8. Travancore Titanium Products Limited 5.41 6853-60-190-97 … …
9. United Electrical Industries Limited 1.40 6858-01-190-94 … …
10. Keltron Component Complex Limited 2.64 6885-60-190-95 … …
11. Handicrafts Development Corporation of
Kerala Limited 0.43 6851-00-190-98 … …
Total 70.97 46.77 Source: Government orders and information collected from respective institutions
The resumption and credit back of funds originally debited under loan heads
of account to the Revenue Expenditure head of account ‘2075-00-911-99-
Deduct Recoveries of Overpayments’ resulted in understating of Revenue
Expenditure by `70.97 crore. The loan account of these PSUs were also
overstated to that extent.
During 2018-19, State Government refunded `46.77 crore out of `70.97 crore
to five PSUs by debiting loan heads of account.
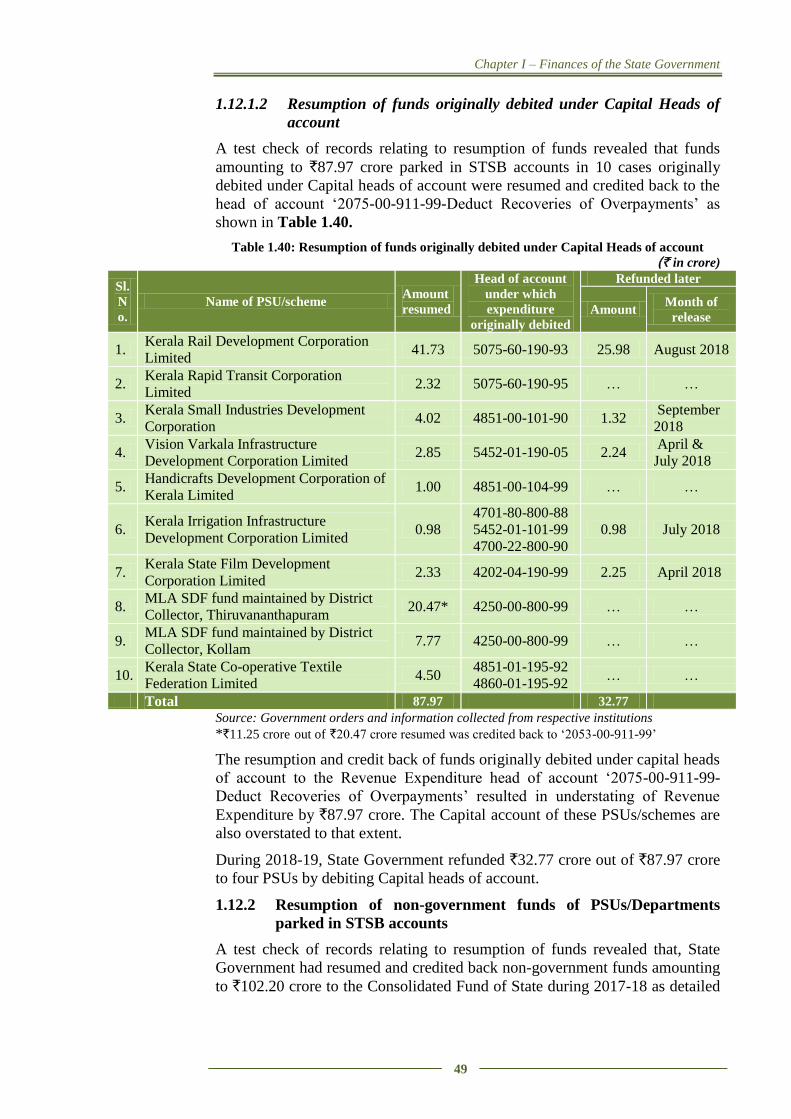
Chapter I – Finances of the State Government
49
1.12.1.2 Resumption of funds originally debited under Capital Heads of
account
A test check of records relating to resumption of funds revealed that funds
amounting to `87.97 crore parked in STSB accounts in 10 cases originally
debited under Capital heads of account were resumed and credited back to the
head of account ‘2075-00-911-99-Deduct Recoveries of Overpayments’ as
shown in Table 1.40.
Table 1.40: Resumption of funds originally debited under Capital Heads of account (` in crore)
Sl.
N
o.
Name of PSU/scheme Amount
resumed
Head of account
under which
expenditure
originally debited
Refunded later
Amount Month of
release
1. Kerala Rail Development Corporation
Limited 41.73 5075-60-190-93 25.98 August 2018
2. Kerala Rapid Transit Corporation
Limited 2.32 5075-60-190-95 … …
3. Kerala Small Industries Development
Corporation 4.02 4851-00-101-90 1.32
September
2018
4. Vision Varkala Infrastructure
Development Corporation Limited 2.85 5452-01-190-05 2.24
April &
July 2018
5. Handicrafts Development Corporation of
Kerala Limited 1.00 4851-00-104-99 … …
6. Kerala Irrigation Infrastructure
Development Corporation Limited 0.98
4701-80-800-88
5452-01-101-99
4700-22-800-90
0.98 July 2018
7. Kerala State Film Development
Corporation Limited 2.33 4202-04-190-99 2.25 April 2018
8. MLA SDF fund maintained by District
Collector, Thiruvananthapuram 20.47* 4250-00-800-99 … …
9. MLA SDF fund maintained by District
Collector, Kollam 7.77 4250-00-800-99 … …
10. Kerala State Co-operative Textile
Federation Limited 4.50
4851-01-195-92
4860-01-195-92 … …
Total 87.97 32.77
Source: Government orders and information collected from respective institutions *`11.25 crore out of `20.47 crore resumed was credited back to ‘2053-00-911-99’
The resumption and credit back of funds originally debited under capital heads
of account to the Revenue Expenditure head of account ‘2075-00-911-99-
Deduct Recoveries of Overpayments’ resulted in understating of Revenue
Expenditure by `87.97 crore. The Capital account of these PSUs/schemes are
also overstated to that extent.
During 2018-19, State Government refunded `32.77 crore out of `87.97 crore
to four PSUs by debiting Capital heads of account.
1.12.2 Resumption of non-government funds of PSUs/Departments
parked in STSB accounts
A test check of records relating to resumption of funds revealed that, State
Government had resumed and credited back non-government funds amounting
to `102.20 crore to the Consolidated Fund of State during 2017-18 as detailed
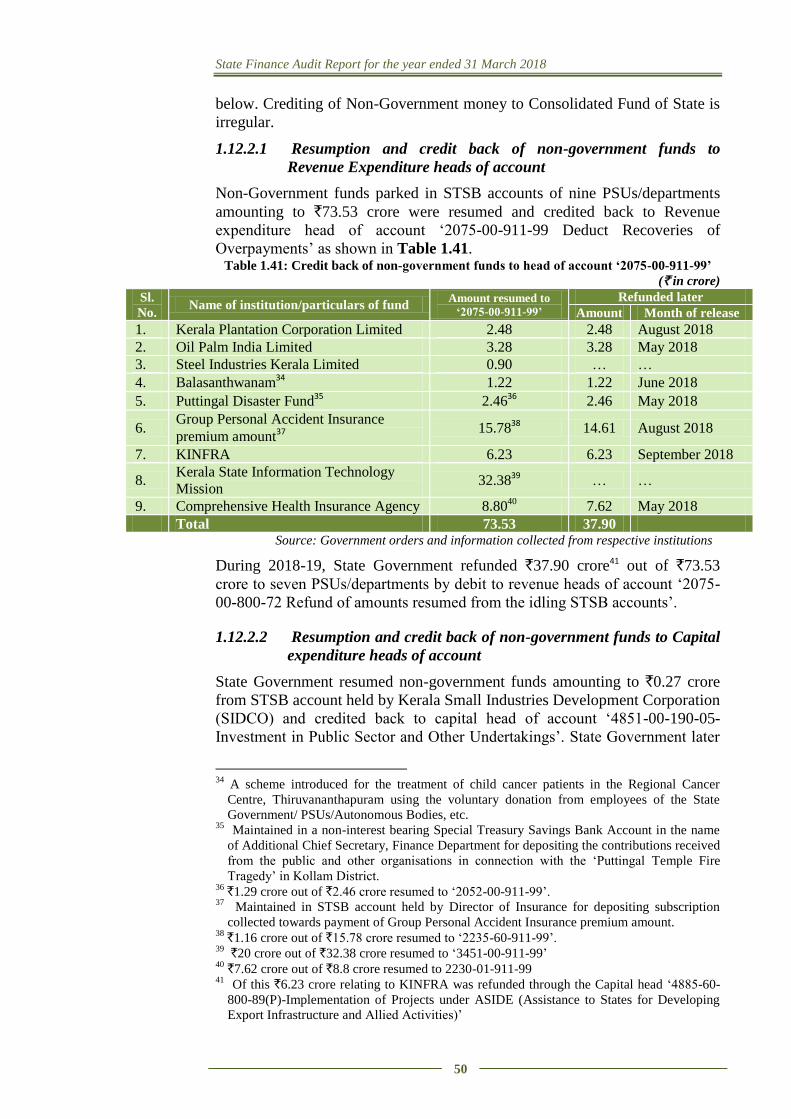
State Finance Audit Report for the year ended 31 March 2018
50
below. Crediting of Non-Government money to Consolidated Fund of State is
irregular.
1.12.2.1 Resumption and credit back of non-government funds to
Revenue Expenditure heads of account
Non-Government funds parked in STSB accounts of nine PSUs/departments
amounting to `73.53 crore were resumed and credited back to Revenue
expenditure head of account ‘2075-00-911-99 Deduct Recoveries of
Overpayments’ as shown in Table 1.41. Table 1.41: Credit back of non-government funds to head of account ‘2075-00-911-99’
(` in crore)
Sl.
No. Name of institution/particulars of fund
Amount resumed to
‘2075-00-911-99’
Refunded later
Amount Month of release
1. Kerala Plantation Corporation Limited 2.48 2.48 August 2018
2. Oil Palm India Limited 3.28 3.28 May 2018
3. Steel Industries Kerala Limited 0.90 … …
4. Balasanthwanam34
1.22 1.22 June 2018
5. Puttingal Disaster Fund35
2.4636
2.46 May 2018
6. Group Personal Accident Insurance
premium amount37
15.78
38 14.61 August 2018
7. KINFRA 6.23 6.23 September 2018
8. Kerala State Information Technology
Mission 32.38
39 … …
9. Comprehensive Health Insurance Agency 8.8040
7.62 May 2018
Total 73.53 37.90 Source: Government orders and information collected from respective institutions
During 2018-19, State Government refunded `37.90 crore41 out of `73.53
crore to seven PSUs/departments by debit to revenue heads of account ‘2075-
00-800-72 Refund of amounts resumed from the idling STSB accounts’.
1.12.2.2 Resumption and credit back of non-government funds to Capital
expenditure heads of account
State Government resumed non-government funds amounting to `0.27 crore
from STSB account held by Kerala Small Industries Development Corporation
(SIDCO) and credited back to capital head of account ‘4851-00-190-05-
Investment in Public Sector and Other Undertakings’. State Government later
34
A scheme introduced for the treatment of child cancer patients in the Regional Cancer
Centre, Thiruvananthapuram using the voluntary donation from employees of the State
Government/ PSUs/Autonomous Bodies, etc. 35
Maintained in a non-interest bearing Special Treasury Savings Bank Account in the name
of Additional Chief Secretary, Finance Department for depositing the contributions received
from the public and other organisations in connection with the ‘Puttingal Temple Fire
Tragedy’ in Kollam District. 36 `1.29 crore out of `2.46 crore resumed to ‘2052-00-911-99’. 37
Maintained in STSB account held by Director of Insurance for depositing subscription
collected towards payment of Group Personal Accident Insurance premium amount. 38 `1.16 crore out of `15.78 crore resumed to ‘2235-60-911-99’. 39
`20 crore out of `32.38 crore resumed to ‘3451-00-911-99’ 40
`7.62 crore out of `8.8 crore resumed to 2230-01-911-99 41
Of this `6.23 crore relating to KINFRA was refunded through the Capital head ‘4885-60-
800-89(P)-Implementation of Projects under ASIDE (Assistance to States for Developing
Export Infrastructure and Allied Activities)’
Chapter I – Finances of the State Government
51
refunded (September 2018) `0.27 crore to SIDCO in 2018-19 by wrongly
debiting it under loan head of account ‘6851-00-190-88 – Loans to Kerala
State Palmyrah Products Workers Welfare Corporation Limited’ instead of
booking the refund against the capital head of account of SIDCO.
1.12.2.3 Resumption and credit back of non- government funds to Loan
heads of Account
During January 2018, State Government resumed non-government
funds amounting to `17.81 crore parked in STSB accounts of two42
PSUs and credited back to loan head of account. As no loan amounts
were outstanding against these PSUs, Finance Accounts showed
adverse balance against these entities in their loan accounts for the year
2017-18. State Government refunded `17.81 crore in 2018-19 to these
PSUs (April 2018 and August 2018) by debiting revenue head of
account ‘2075-00-800-72-(02)-Refund of amounts resumed from the
idling STSB accounts’ instead of debiting the loan head of the PSU
concerned.
Similarly, State Government resumed non-government funds amounting
to `10.59 crore parked in STSB account of Kerala Industrial
Infrastructure Development Corporation (KINFRA) and credited back
to loan head of account. State Government refunded `10.59 crore to the
PSU in 2018-19 (September 2018) under capital head of account -
‘4885-60-800-89(P) - Implementation of Projects under ASIDE
(Assistance to States for Developing Export Infrastructure and Allied
Activities)’ instead of debiting the loan head of the PSU concerned
which resulted in wrong depiction of capital expenditure in Government
accounts.
1.12.3 Resumption of funds from River Management Fund and
Quarry Safety Fund
River Management fund43 and Quarry Safety fund44 are two funds maintained
by District Collectors in Special Treasury Savings Bank accounts as stipulated
in Kerala Protection of River Banks and Regulation of Removal of Sand
Rules, 2002 and Kerala Minor Mineral Concession Rules, 2015 respectively.
Revenue realized through sale of river sand, fines imposed for illegal sand
mining, etc., are being credited to River Management Fund and the fund is
being utilized for meeting expenditure connected with river bank protection
works and for meeting establishment related activities. Revenue realized
through royalty collected from every quarrying permit holder or lessee are
being credited to Quarry Safety Funds. The fund is intended to be utilized for
meeting expenditure in connection with protection work of abandoned
quarries. As part of resumption of funds kept in STSB accounts, State
42 Kerala Plantation Corporation Limited (`4.5 crore) and Oil Palm India Limited (`13.31
crore) 43
As per Rule 22 (4) of the Kerala Protection of River Banks and Regulation of Removal of
Sand Rules, 2002, all the amount available towards River Management Fund are to be kept
in Treasury Savings Bank account of District Collectors. 44
Rule 63(3) of Kerala Minor Mineral Concession Rules, 2015 stipulates that the entire
amount available towards Quarry Safety Fund are to be kept in Treasury Savings Bank
accounts of District Collectors.
State Finance Audit Report for the year ended 31 March 2018
52
Government resumed `129.24 crore from these two funds in March 2018
(`108.47 crore from River Management Fund maintained by 10 District
Collectorates and `20.78 crore from Quarry Safety fund maintained by nine
District Collectorates) to the consolidated fund. The resumption of River
Management Fund and Quarry Safety Fund maintained in Treasury Savings
Bank accounts of District Collectors to the consolidated fund, in violation of
provisions of relevant rules is irregular and defeated the intended objectives
for which the funds were created.
1.12.4 Resumption of GoI share released for Centrally Sponsored
Scheme (CSS)
State Government resumed an amount of `394 crore from STSB account of
Cochin Smart Mission Limited including `194 crore being the GoI share
released for Centrally Sponsored Scheme (CSS) ‘Smart City Mission’ for
development of Kochi city by crediting back to head of account ‘2217-05-911-
99- Deduct Recoveries of Overpayment’ and ‘2075-00-911-99 Deduct
Recoveries of Overpayments’. The resumption of grants received from GoI for
implementation of Centrally Sponsored Schemes to Consolidated Fund of
State is irregular.
Though the State Government resumed funds from the STSB accounts for
increasing State’s entitlement to open market borrowings during the last
quarter of 2017-18, the consequent increased market borrowing was used
mainly for financing the revenue expenditure. Decrease in capital
expenditure (14 per cent) during the year 2017-18 compared to the previous
year did not justify the requirement for enhancement in market borrowings.
1.13 Fiscal Imbalances
Three key fiscal parameters - revenue, fiscal and primary deficits - indicate the
extent of overall fiscal imbalances in the finances of the State Government
during a specified period. The deficit in the Government accounts represents
the gap between its receipts and expenditure. The nature of deficit is an
indicator of the prudence of fiscal management of the Government. Further,
the ways in which the deficit is financed and the resources are raised and
applied are important pointers to its fiscal health. This section presents the
trends, nature, magnitude and the manner of financing these deficits and also
the assessment of actual levels of revenue and fiscal deficits vis-à-vis targets
set under the Fiscal Responsibility Act/Rules for the financial year 2017-18
1.13.1 Trends in deficits
Charts 1.12 and 1.13 present the trends in deficit indicators over the period
2013-18.
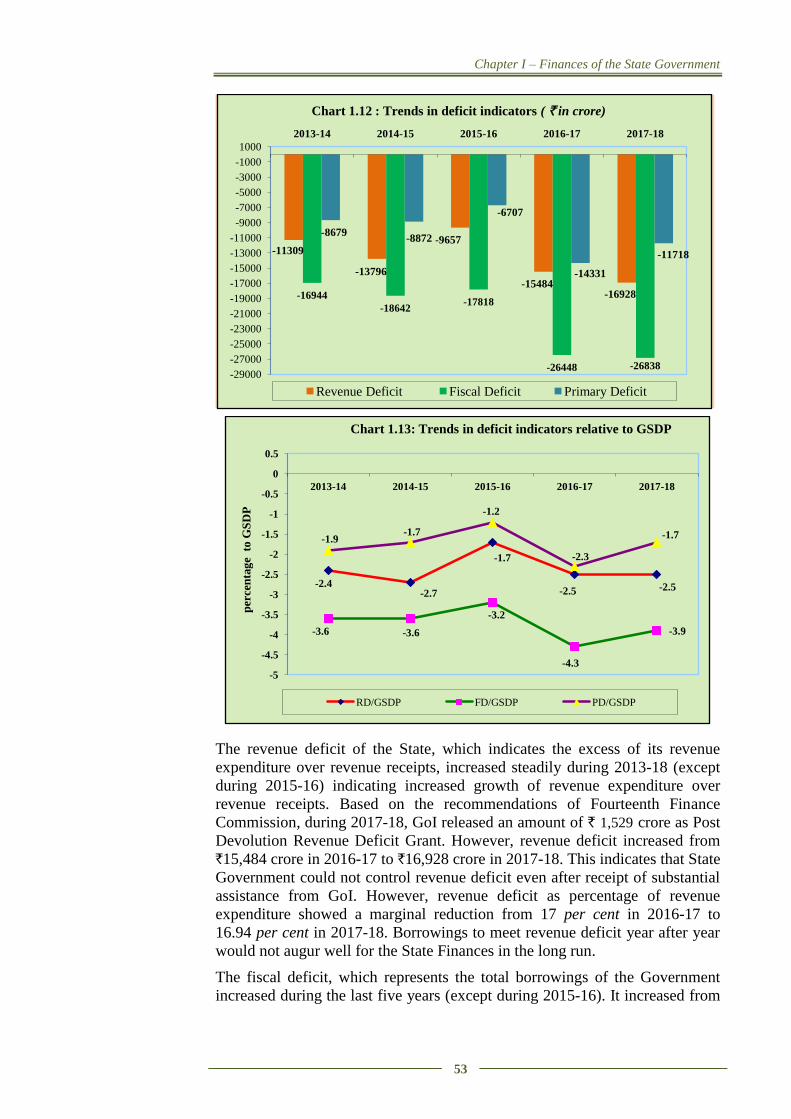
Chapter I – Finances of the State Government
53
The revenue deficit of the State, which indicates the excess of its revenue
expenditure over revenue receipts, increased steadily during 2013-18 (except
during 2015-16) indicating increased growth of revenue expenditure over
revenue receipts. Based on the recommendations of Fourteenth Finance
Commission, during 2017-18, GoI released an amount of ` 1,529 crore as Post
Devolution Revenue Deficit Grant. However, revenue deficit increased from
`15,484 crore in 2016-17 to `16,928 crore in 2017-18. This indicates that State
Government could not control revenue deficit even after receipt of substantial
assistance from GoI. However, revenue deficit as percentage of revenue
expenditure showed a marginal reduction from 17 per cent in 2016-17 to
16.94 per cent in 2017-18. Borrowings to meet revenue deficit year after year
would not augur well for the State Finances in the long run.
The fiscal deficit, which represents the total borrowings of the Government
increased during the last five years (except during 2015-16). It increased from
-11309
-13796
-9657
-15484 -16928 -16944
-18642 -17818
-26448 -26838
-8679 -8872
-6707
-14331
-11718
-29000
-27000
-25000
-23000
-21000
-19000
-17000
-15000
-13000
-11000
-9000
-7000
-5000
-3000
-1000
1000
2013-14 2014-15 2015-16 2016-17 2017-18
Chart 1.12 : Trends in deficit indicators ( ` in crore)
Revenue Deficit Fiscal Deficit Primary Deficit
-2.4 -2.7
-1.7
-2.5 -2.5
-3.6 -3.6
-3.2
-4.3
-3.9
-1.9 -1.7
-1.2
-2.3
-1.7
-5
-4.5
-4
-3.5
-3
-2.5
-2
-1.5
-1
-0.5
0
0.5
2013-14 2014-15 2015-16 2016-17 2017-18
per
cen
tag
e t
o G
SD
P
Chart 1.13: Trends in deficit indicators relative to GSDP
RD/GSDP FD/GSDP PD/GSDP
State Finance Audit Report for the year ended 31 March 2018
54
`16,944 crore in 2013-14 to `26,838 crore in 2017-18. Fiscal deficit increased
by `390 crore (1.50 per cent) during the year when compared to the previous
year. The ratio of FD to GSDP showed an improvement from 4.3 per cent in
2016-17 to 3.9 per cent in 2017-18.
Primary deficit decreased from `14,331 crore in 2016-17 to `11,718 crore in
2017-18 mainly due to huge increase in interest payment (`3,003 crore) during
the year.
As per the targets contained in Kerala Fiscal Responsibility (Amendment) Act
2018, revenue deficit of the state would be eliminated completely during
2017-18 to 2019-20 and fiscal deficit would be maintained at three per cent of
GSDP during 2017-18 to 2019-20. However, none of these targets could be
achieved during the year.
1.13.2 Components of fiscal deficit and its financing pattern
The financing pattern of the fiscal deficit had undergone a compositional shift
as reflected in the Table 1.42. Receipts and disbursements under the
components of financing the fiscal deficit during 2017-18 are given in Table
1.43.
Table 1.42: Components of fiscal deficit and its financing pattern (` in crore)
Particulars 2013-14 2014-15 2015-16 2016-17 2017-18
Decomposition of fiscal deficit
1. Revenue deficit 11,309 13,796 9,657 15,484 16,928
2. Net capital expenditure 4,275 4,227 7,472 10,096 8,720
3. Net loans and advances 1,360 619 689 868 1190
Total fiscal deficit 16,944 18,642 17,818 26,448 26838
Financing pattern of fiscal deficit*
1. Market borrowings 11,373 11,777 12,886 14,686 16,203
2. Loans from Government of India 40 402 169 379 (-)130
3. Special Securities Issued to
National Small Savings Fund (-)42 525 731 972 1,048
4. Loans from Financial Institutions (-)77 (-)69 (-)64 107 (-)19
5. Small Savings, PF, etc. 4,231 3,765 8,332 12,932 7,207
6. Deposits and Advances 188 1,365 (-)3,280 105 266
7. Suspense and Miscellaneous (-)946 58 774 (-)2,169 1,203
8. Remittances (-)168 26 (-)93 (-)313 (-)166
9. Others (-)68 164 (-)59 170 309
10. Total (1 to 9) 14,531 18,013 19,396 26,869 25,921
11. Increase (-)/Decrease (+) in Cash
Balance 2,413 629 (-)1,578 (-)421 917
12. Overall deficit 16,944 18,642 17,818 26,448 26,838 *All these figures are net of disbursements/outflows during the year.
Source: Finance Accounts of respective years
Table 1.43: Receipts and disbursements under components financing the fiscal deficit
during 2017-18 (` in crore)
Sl. No. Particulars Receipt Disbursement Net
1. Market borrowings 20,500 4297 16,203
2. Loans from Government of India 445 575 (-)130
3. Special Securities Issued to National
Small Savings Fund 2,123 1,075 1,048
4. Loans from Financial Institutions 830 849 (-)19
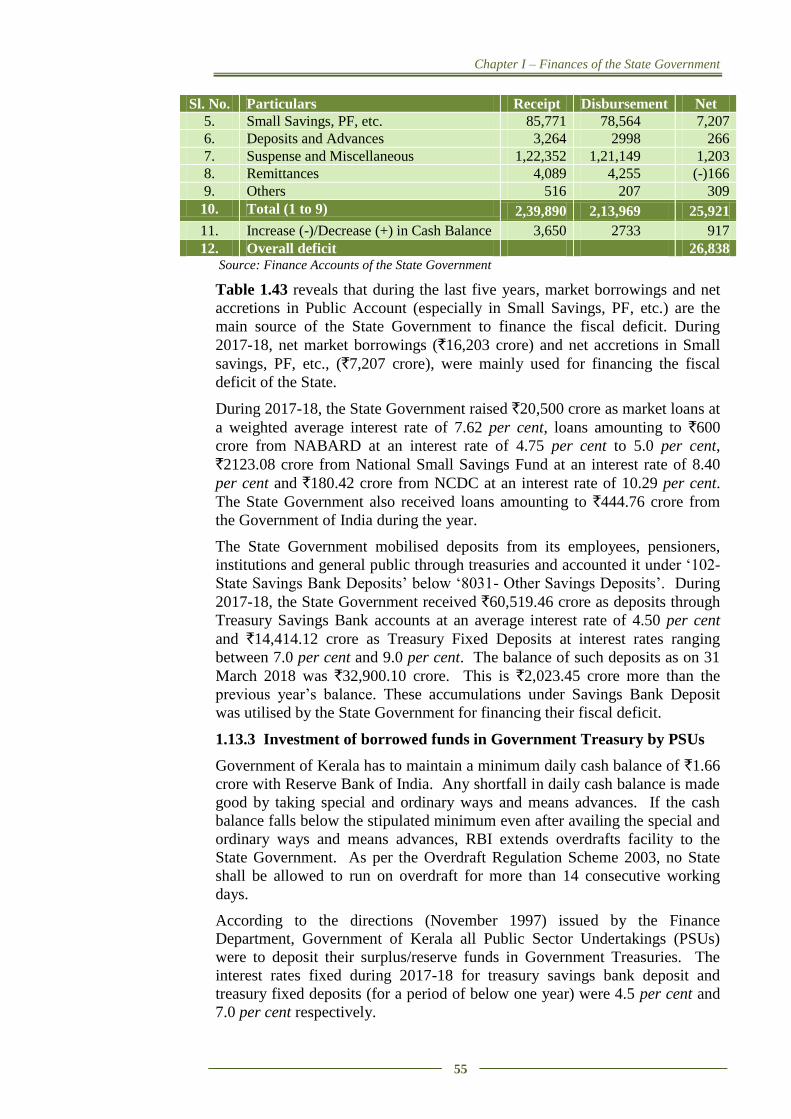
Chapter I – Finances of the State Government
55
Sl. No. Particulars Receipt Disbursement Net
5. Small Savings, PF, etc. 85,771 78,564 7,207
6. Deposits and Advances 3,264 2998 266
7. Suspense and Miscellaneous 1,22,352 1,21,149 1,203
8. Remittances 4,089 4,255 (-)166
9. Others 516 207 309
10. Total (1 to 9) 2,39,890 2,13,969 25,921
11. Increase (-)/Decrease (+) in Cash Balance 3,650 2733 917
12. Overall deficit 26,838 Source: Finance Accounts of the State Government
Table 1.43 reveals that during the last five years, market borrowings and net
accretions in Public Account (especially in Small Savings, PF, etc.) are the
main source of the State Government to finance the fiscal deficit. During
2017-18, net market borrowings (`16,203 crore) and net accretions in Small
savings, PF, etc., (`7,207 crore), were mainly used for financing the fiscal
deficit of the State.
During 2017-18, the State Government raised `20,500 crore as market loans at
a weighted average interest rate of 7.62 per cent, loans amounting to `600
crore from NABARD at an interest rate of 4.75 per cent to 5.0 per cent,
`2123.08 crore from National Small Savings Fund at an interest rate of 8.40
per cent and `180.42 crore from NCDC at an interest rate of 10.29 per cent.
The State Government also received loans amounting to `444.76 crore from
the Government of India during the year.
The State Government mobilised deposits from its employees, pensioners,
institutions and general public through treasuries and accounted it under ‘102-
State Savings Bank Deposits’ below ‘8031- Other Savings Deposits’. During
2017-18, the State Government received `60,519.46 crore as deposits through
Treasury Savings Bank accounts at an average interest rate of 4.50 per cent
and `14,414.12 crore as Treasury Fixed Deposits at interest rates ranging
between 7.0 per cent and 9.0 per cent. The balance of such deposits as on 31
March 2018 was `32,900.10 crore. This is `2,023.45 crore more than the
previous year’s balance. These accumulations under Savings Bank Deposit
was utilised by the State Government for financing their fiscal deficit.
1.13.3 Investment of borrowed funds in Government Treasury by PSUs
Government of Kerala has to maintain a minimum daily cash balance of `1.66
crore with Reserve Bank of India. Any shortfall in daily cash balance is made
good by taking special and ordinary ways and means advances. If the cash
balance falls below the stipulated minimum even after availing the special and
ordinary ways and means advances, RBI extends overdrafts facility to the
State Government. As per the Overdraft Regulation Scheme 2003, no State
shall be allowed to run on overdraft for more than 14 consecutive working
days.
According to the directions (November 1997) issued by the Finance
Department, Government of Kerala all Public Sector Undertakings (PSUs)
were to deposit their surplus/reserve funds in Government Treasuries. The
interest rates fixed during 2017-18 for treasury savings bank deposit and
treasury fixed deposits (for a period of below one year) were 4.5 per cent and
7.0 per cent respectively.
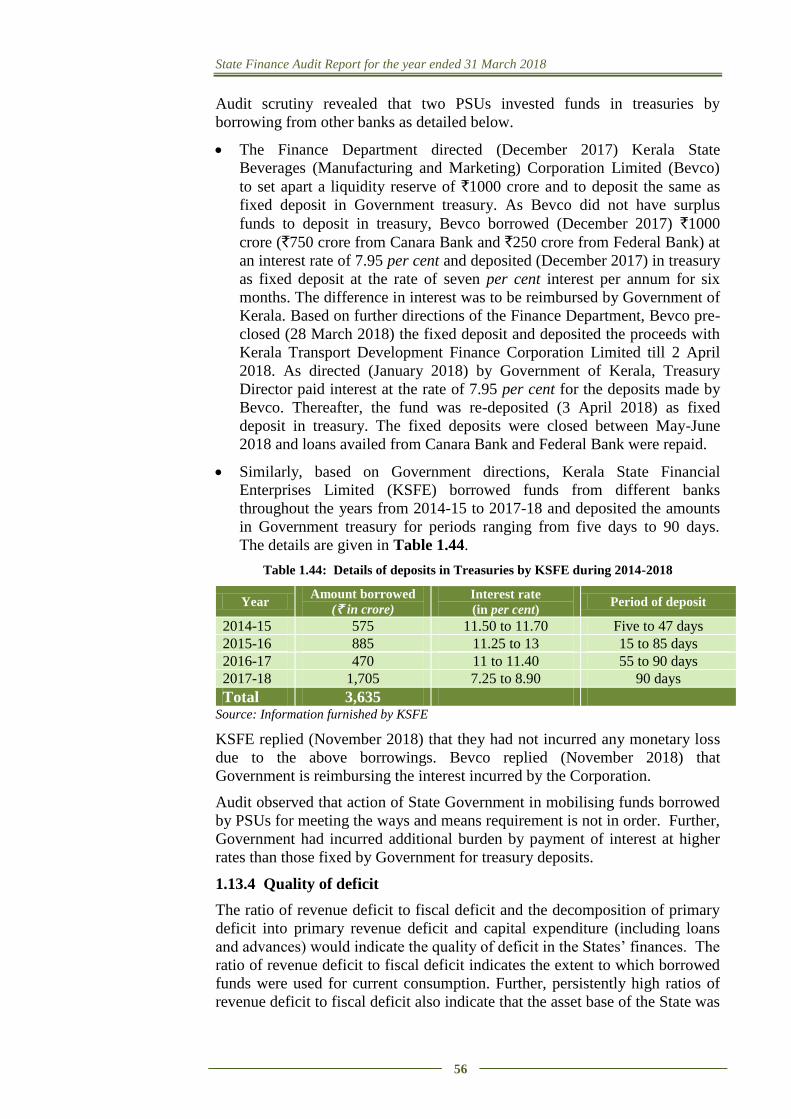
State Finance Audit Report for the year ended 31 March 2018
56
Audit scrutiny revealed that two PSUs invested funds in treasuries by
borrowing from other banks as detailed below.
The Finance Department directed (December 2017) Kerala State
Beverages (Manufacturing and Marketing) Corporation Limited (Bevco)
to set apart a liquidity reserve of `1000 crore and to deposit the same as
fixed deposit in Government treasury. As Bevco did not have surplus
funds to deposit in treasury, Bevco borrowed (December 2017) `1000
crore (`750 crore from Canara Bank and `250 crore from Federal Bank) at
an interest rate of 7.95 per cent and deposited (December 2017) in treasury
as fixed deposit at the rate of seven per cent interest per annum for six
months. The difference in interest was to be reimbursed by Government of
Kerala. Based on further directions of the Finance Department, Bevco pre-
closed (28 March 2018) the fixed deposit and deposited the proceeds with
Kerala Transport Development Finance Corporation Limited till 2 April
2018. As directed (January 2018) by Government of Kerala, Treasury
Director paid interest at the rate of 7.95 per cent for the deposits made by
Bevco. Thereafter, the fund was re-deposited (3 April 2018) as fixed
deposit in treasury. The fixed deposits were closed between May-June
2018 and loans availed from Canara Bank and Federal Bank were repaid.
Similarly, based on Government directions, Kerala State Financial
Enterprises Limited (KSFE) borrowed funds from different banks
throughout the years from 2014-15 to 2017-18 and deposited the amounts
in Government treasury for periods ranging from five days to 90 days.
The details are given in Table 1.44.
Table 1.44: Details of deposits in Treasuries by KSFE during 2014-2018
Year Amount borrowed
(` in crore)
Interest rate
(in per cent) Period of deposit
2014-15 575 11.50 to 11.70 Five to 47 days
2015-16 885 11.25 to 13 15 to 85 days
2016-17 470 11 to 11.40 55 to 90 days
2017-18 1,705 7.25 to 8.90 90 days
Total 3,635 Source: Information furnished by KSFE
KSFE replied (November 2018) that they had not incurred any monetary loss
due to the above borrowings. Bevco replied (November 2018) that
Government is reimbursing the interest incurred by the Corporation.
Audit observed that action of State Government in mobilising funds borrowed
by PSUs for meeting the ways and means requirement is not in order. Further,
Government had incurred additional burden by payment of interest at higher
rates than those fixed by Government for treasury deposits.
1.13.4 Quality of deficit
The ratio of revenue deficit to fiscal deficit and the decomposition of primary
deficit into primary revenue deficit and capital expenditure (including loans
and advances) would indicate the quality of deficit in the States’ finances. The
ratio of revenue deficit to fiscal deficit indicates the extent to which borrowed
funds were used for current consumption. Further, persistently high ratios of
revenue deficit to fiscal deficit also indicate that the asset base of the State was
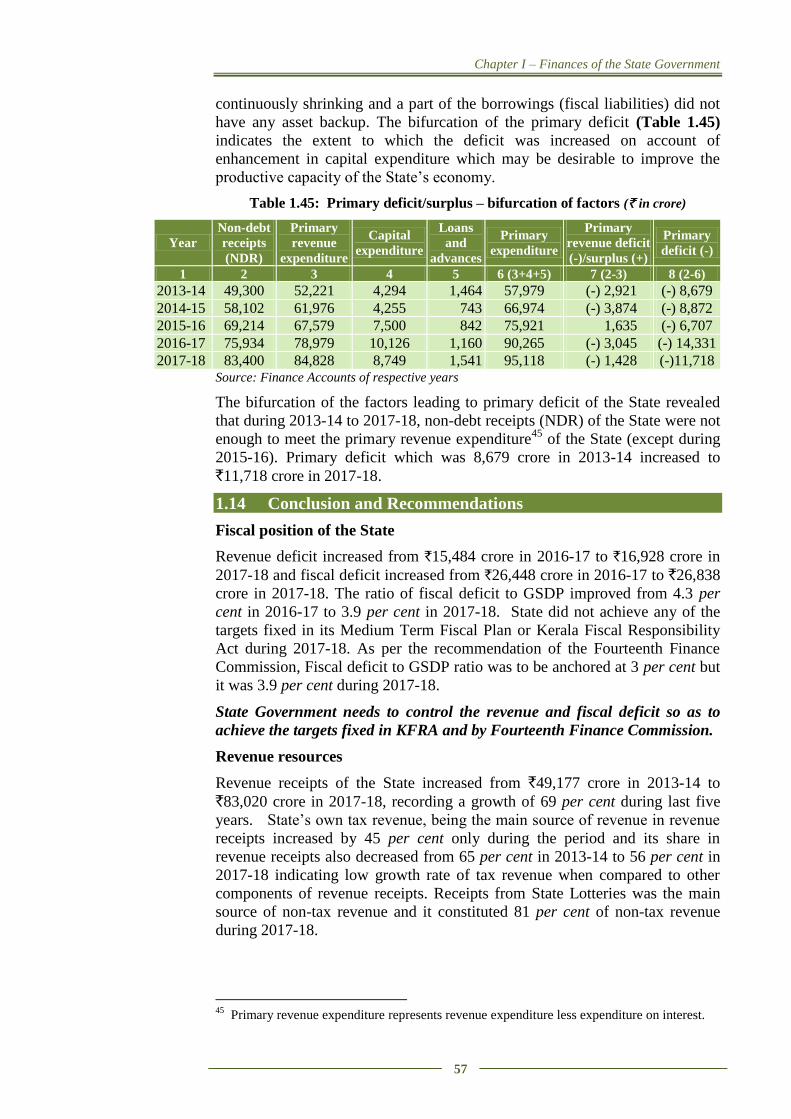
Chapter I – Finances of the State Government
57
continuously shrinking and a part of the borrowings (fiscal liabilities) did not
have any asset backup. The bifurcation of the primary deficit (Table 1.45)
indicates the extent to which the deficit was increased on account of
enhancement in capital expenditure which may be desirable to improve the
productive capacity of the State’s economy.
Table 1.45: Primary deficit/surplus – bifurcation of factors (` in crore)
Year
Non-debt
receipts
(NDR)
Primary
revenue
expenditure
Capital
expenditure
Loans
and
advances
Primary
expenditure
Primary
revenue deficit
(-)/surplus (+)
Primary
deficit (-)
1 2 3 4 5 6 (3+4+5) 7 (2-3) 8 (2-6)
2013-14 49,300 52,221 4,294 1,464 57,979 (-) 2,921 (-) 8,679
2014-15 58,102 61,976 4,255 743 66,974 (-) 3,874 (-) 8,872
2015-16 69,214 67,579 7,500 842 75,921 1,635 (-) 6,707
2016-17 75,934 78,979 10,126 1,160 90,265 (-) 3,045 (-) 14,331
2017-18 83,400 84,828 8,749 1,541 95,118 (-) 1,428 (-)11,718 Source: Finance Accounts of respective years
The bifurcation of the factors leading to primary deficit of the State revealed
that during 2013-14 to 2017-18, non-debt receipts (NDR) of the State were not
enough to meet the primary revenue expenditure45
of the State (except during
2015-16). Primary deficit which was 8,679 crore in 2013-14 increased to
`11,718 crore in 2017-18.
1.14 Conclusion and Recommendations
Fiscal position of the State
Revenue deficit increased from `15,484 crore in 2016-17 to `16,928 crore in
2017-18 and fiscal deficit increased from `26,448 crore in 2016-17 to `26,838
crore in 2017-18. The ratio of fiscal deficit to GSDP improved from 4.3 per
cent in 2016-17 to 3.9 per cent in 2017-18. State did not achieve any of the
targets fixed in its Medium Term Fiscal Plan or Kerala Fiscal Responsibility
Act during 2017-18. As per the recommendation of the Fourteenth Finance
Commission, Fiscal deficit to GSDP ratio was to be anchored at 3 per cent but
it was 3.9 per cent during 2017-18.
State Government needs to control the revenue and fiscal deficit so as to
achieve the targets fixed in KFRA and by Fourteenth Finance Commission.
Revenue resources
Revenue receipts of the State increased from `49,177 crore in 2013-14 to
`83,020 crore in 2017-18, recording a growth of 69 per cent during last five
years. State’s own tax revenue, being the main source of revenue in revenue
receipts increased by 45 per cent only during the period and its share in
revenue receipts also decreased from 65 per cent in 2013-14 to 56 per cent in
2017-18 indicating low growth rate of tax revenue when compared to other
components of revenue receipts. Receipts from State Lotteries was the main
source of non-tax revenue and it constituted 81 per cent of non-tax revenue
during 2017-18.
45
Primary revenue expenditure represents revenue expenditure less expenditure on interest.
State Finance Audit Report for the year ended 31 March 2018
58
Government needs to address the decreasing trend in growth of its own tax
revenue and measures should be taken to improve the same.
Revenue Expenditure
Revenue Expenditure of the State increased from `60,486 crore in 2013-14 to
`99,948 crore in 2017-18 recording a growth of 65 per cent during the five
year period. Revenue expenditure as a percentage of total expenditure
increased during 2017-18 indicating low priority of Government towards
capital expenditure. Share of committed expenditure in revenue expenditure
increased from 63 per cent in 2016-17 to 69 per cent in the current year and it
consumed 83 per cent of the revenue receipts during the year. Interest
payments and pension payments consumed 18 per cent and 24 per cent
respectively of revenue receipts and is a matter of concern for the State
Government.
Quality of expenditure
Capital Expenditure of the State decreased by `1,377 crore during the year
and its share in total expenditure decreased from 10 per cent in 2016-17 to 8
per cent in 2017-18. State’s share of expenditure on health and education
sector in total expenditure was more than General Category States, but the
share of capital expenditure and development expenditure in total expenditure
was less than that of General Category States. Though the State Government
invested `8,211.47 crore in Statutory Corporations, Government Companies,
Joint Stock Companies and Co-operatives, average return on these investments
was 1.44 per cent in the last five years while the Government paid an average
interest rate of 7.24 per cent on its borrowings during 2013-14 to 2017-18.
The interest receipt on loans and advances given by State Government was
0.25 per cent during 2017-18 against the average cost of borrowing of 7.48
per cent. At the end of the year, repayment of loans advanced to 67 institutions
were in arrears amounting to `12,604 crore (Principal: `8,015 crore and
Interest: `4,589 crore).
State needs to improve its expenditure on Capital section to match the status
of General Category States. Also steps should be taken to reduce arrears in
repayment of loan.
Reserve Funds and liabilities
Consolidated Sinking Fund was constituted with the aim to amortize the
outstanding liabilities of Government, but Government did not contribute to
the fund during 2017-18. Similarly, Government has to constitute a Guarantee
Redemption Fund for crediting guarantee commission collected for meeting
future liability arising out of guarantees given by the Government. Guarantee
Redemption Fund has not been constituted so far and guarantee commission of
`975.29 crore collected during 2003-04 to 2017-18 was not credited to the
Fund. State Disaster Response Fund had accumulated balance of `287.08
crore by the end of March 2018. As per the guidelines, Government has to
credit interest to the fund at the rate applicable to overdrafts under the
Overdraft Regulation Scheme of RBI. This was not done and also interest
Chapter I – Finances of the State Government
59
payable on the un-invested balances of the fund of earlier years was not
estimated by the Government.
Steps should be taken to credit the interest payable to State Disaster
Response Fund without further delay.
Debt Management
Open market Loans had a major share (54 per cent) in the total fiscal liabilities
of the State. The net debt available with State for development activities was
only `6164 crore (26 per cent of public debt receipts) during 2017-18.
Maturity profile of the State showed that 30.25 per cent of the debt amounting
to `43,261.49 crore has to be repaid within five years and 50.14 per cent
(`71,698.62 crore) by March 2025 (within seven years).

CHAPTER II
FINANCIAL MANAGEMENT
AND BUDGETARY CONTROL

61
CHAPTER II
FINANCIAL MANAGEMENT AND BUDGETARY CONTROL
2.1 Introduction
2.1.1 The Appropriation Accounts are accounts of the expenditure, voted
and charged, of the Government for each financial year, compared with the
amounts of voted Grants and charged Appropriations for different purposes, as
specified in the schedules appended to the Appropriation Acts. These accounts
list the original budget estimates, supplementary grants, surrenders and re-
appropriations distinctly and indicate actual capital and revenue expenditure
on various specified services vis-à-vis those authorised by the Appropriation
Act in respect of both charged and voted items of the budget. Appropriation
Accounts, thus, facilitate the management of finances and monitoring of
budgetary provisions and are, therefore, complementary to the Finance
Accounts.
2.1.2 Audit of appropriations by the Comptroller and Auditor General of
India seeks to ascertain whether the expenditure actually incurred under
various Grants is within the authorisation given under the Appropriation Act
and whether the expenditure required to be charged under the provisions of the
Constitution is so charged. It also seeks to ascertain whether the expenditure
so incurred is in conformity with the law, relevant rules, regulations and
instructions on the subject.
2.1.3 As per the Kerala Budget Manual, the Finance Department is
responsible for the preparation of the annual budget by obtaining estimates
from various departments. The departmental estimates of receipts and
expenditure are prepared by the Heads of Departments and other Estimating
Officers and submitted to the Finance Department on prescribed dates. The
Finance Department consolidates the estimates and prepares the Detailed
Estimates called ‘Demands for Grants’. In the preparation of the budget, the
aim should be to achieve as close an approximation to the actuals as possible.
This demands foresight in anticipating revenue and expenditure. An avoidable
extra provision in an estimate is as much a budgetary irregularity as an excess
in the sanctioned expenditure. The budget procedure envisages that the sum
provided in an estimate of expenditure on a particular item must be that sum,
which can be expended in the year and it should not be over or under
expenditure. A saving in an estimate constitutes as much of a financial
irregularity as an excess in it. The budget estimates of receipts should be
based on the existing rates of taxes, duties, fees, etc.
Deficiencies in the management of budget and expenditure and violation of
the provisions of Budget Manual noticed in audit are discussed in the
subsequent paragraphs.
2.2 Summary of Appropriation Accounts
The summarised position of actual expenditure during 2017-18 against
47 Grants/Appropriations is given in Table 2.1.
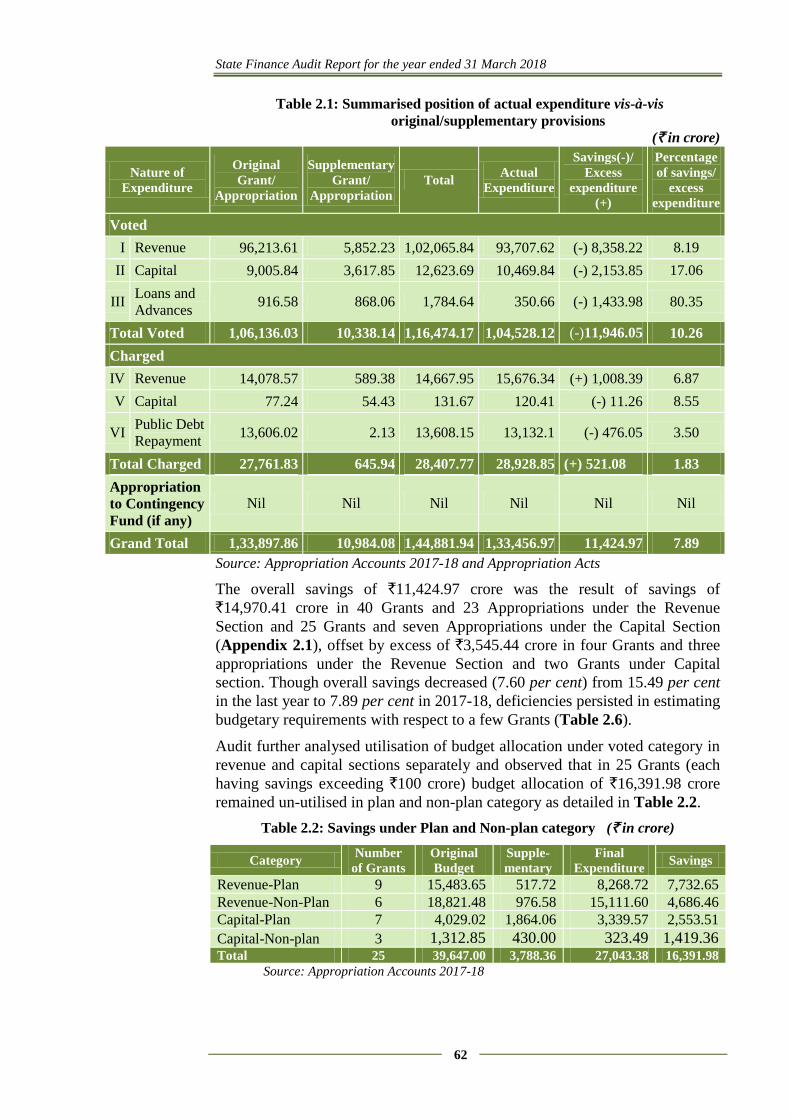
State Finance Audit Report for the year ended 31 March 2018
62
Table 2.1: Summarised position of actual expenditure vis-à-vis
original/supplementary provisions
(` in crore)
Nature of
Expenditure
Original
Grant/
Appropriation
Supplementary
Grant/
Appropriation
Total Actual
Expenditure
Savings(-)/
Excess
expenditure
(+)
Percentage
of savings/
excess
expenditure
Voted
I Revenue 96,213.61 5,852.23 1,02,065.84 93,707.62 (-) 8,358.22 8.19
II Capital 9,005.84 3,617.85 12,623.69 10,469.84 (-) 2,153.85 17.06
III Loans and
Advances 916.58 868.06 1,784.64 350.66 (-) 1,433.98 80.35
Total Voted 1,06,136.03 10,338.14 1,16,474.17 1,04,528.12 (-)11,946.05 10.26
Charged
IV Revenue 14,078.57 589.38 14,667.95 15,676.34 (+) 1,008.39 6.87
V Capital 77.24 54.43 131.67 120.41 (-) 11.26 8.55
VI Public Debt
Repayment 13,606.02 2.13 13,608.15 13,132.1 (-) 476.05 3.50
Total Charged 27,761.83 645.94 28,407.77 28,928.85 (+) 521.08 1.83
Appropriation
to Contingency
Fund (if any)
Nil Nil Nil Nil Nil Nil
Grand Total 1,33,897.86 10,984.08 1,44,881.94 1,33,456.97 11,424.97 7.89
Source: Appropriation Accounts 2017-18 and Appropriation Acts
The overall savings of `11,424.97 crore was the result of savings of
`14,970.41 crore in 40 Grants and 23 Appropriations under the Revenue
Section and 25 Grants and seven Appropriations under the Capital Section
(Appendix 2.1), offset by excess of `3,545.44 crore in four Grants and three
appropriations under the Revenue Section and two Grants under Capital
section. Though overall savings decreased (7.60 per cent) from 15.49 per cent
in the last year to 7.89 per cent in 2017-18, deficiencies persisted in estimating
budgetary requirements with respect to a few Grants (Table 2.6).
Audit further analysed utilisation of budget allocation under voted category in
revenue and capital sections separately and observed that in 25 Grants (each
having savings exceeding `100 crore) budget allocation of `16,391.98 crore
remained un-utilised in plan and non-plan category as detailed in Table 2.2.
Table 2.2: Savings under Plan and Non-plan category (` in crore)
Category Number
of Grants
Original
Budget
Supple-
mentary
Final
Expenditure Savings
Revenue-Plan 9 15,483.65 517.72 8,268.72 7,732.65
Revenue-Non-Plan 6 18,821.48 976.58 15,111.60 4,686.46
Capital-Plan 7 4,029.02 1,864.06 3,339.57 2,553.51
Capital-Non-plan 3 1,312.85 430.00 323.49 1,419.36 Total 25 39,647.00 3,788.36 27,043.38 16,391.98
Source: Appropriation Accounts 2017-18
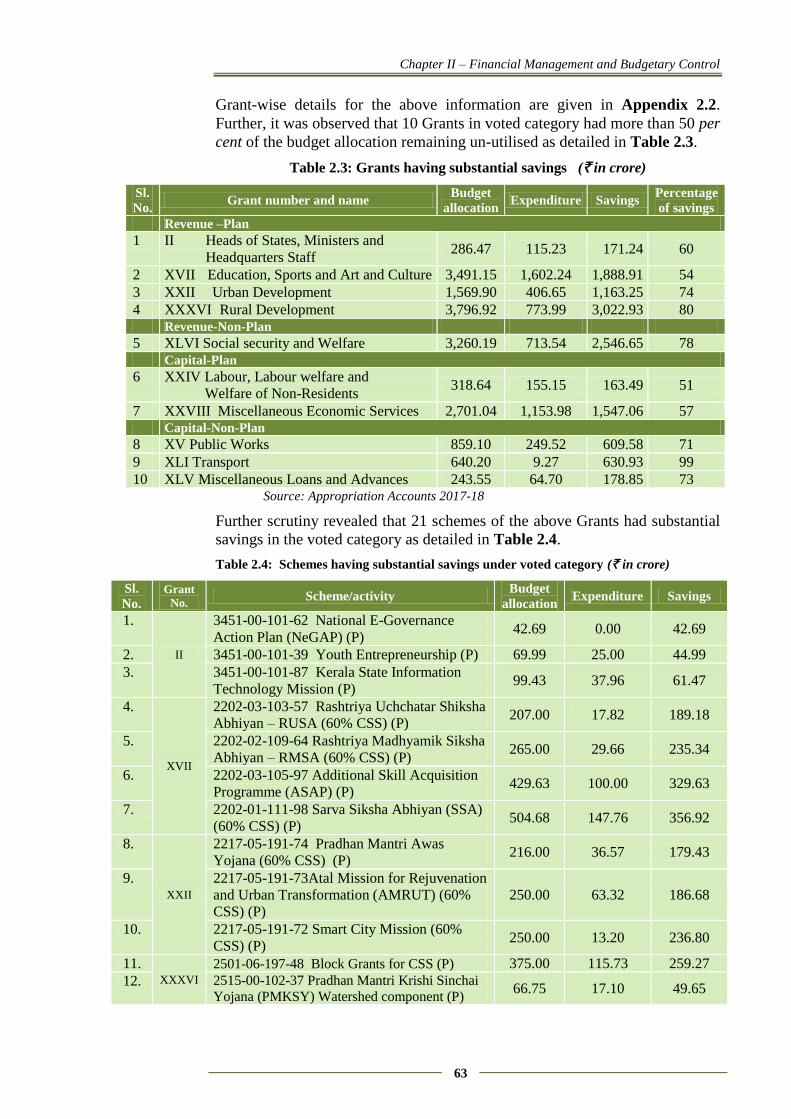
Chapter II – Financial Management and Budgetary Control
63
Grant-wise details for the above information are given in Appendix 2.2.
Further, it was observed that 10 Grants in voted category had more than 50 per
cent of the budget allocation remaining un-utilised as detailed in Table 2.3.
Table 2.3: Grants having substantial savings (` in crore)
Sl.
No. Grant number and name
Budget
allocation Expenditure Savings
Percentage
of savings
Revenue –Plan
1 II Heads of States, Ministers and
Headquarters Staff 286.47 115.23 171.24 60
2 XVII Education, Sports and Art and Culture 3,491.15 1,602.24 1,888.91 54
3 XXII Urban Development 1,569.90 406.65 1,163.25 74
4 XXXVI Rural Development 3,796.92 773.99 3,022.93 80 Revenue-Non-Plan
5 XLVI Social security and Welfare 3,260.19 713.54 2,546.65 78 Capital-Plan
6 XXIV Labour, Labour welfare and
Welfare of Non-Residents 318.64 155.15 163.49 51
7 XXVIII Miscellaneous Economic Services 2,701.04 1,153.98 1,547.06 57 Capital-Non-Plan
8 XV Public Works 859.10 249.52 609.58 71
9 XLI Transport 640.20 9.27 630.93 99
10 XLV Miscellaneous Loans and Advances 243.55 64.70 178.85 73 Source: Appropriation Accounts 2017-18
Further scrutiny revealed that 21 schemes of the above Grants had substantial
savings in the voted category as detailed in Table 2.4.
Table 2.4: Schemes having substantial savings under voted category (` in crore)
Sl.
No.
Grant
No. Scheme/activity
Budget
allocation Expenditure Savings
1.
II
3451-00-101-62 National E-Governance
Action Plan (NeGAP) (P) 42.69 0.00 42.69
2. 3451-00-101-39 Youth Entrepreneurship (P) 69.99 25.00 44.99
3. 3451-00-101-87 Kerala State Information
Technology Mission (P) 99.43 37.96 61.47
4.
XVII
2202-03-103-57 Rashtriya Uchchatar Shiksha
Abhiyan – RUSA (60% CSS) (P) 207.00 17.82 189.18
5. 2202-02-109-64 Rashtriya Madhyamik Siksha
Abhiyan – RMSA (60% CSS) (P) 265.00 29.66 235.34
6. 2202-03-105-97 Additional Skill Acquisition
Programme (ASAP) (P) 429.63 100.00 329.63
7. 2202-01-111-98 Sarva Siksha Abhiyan (SSA)
(60% CSS) (P) 504.68 147.76 356.92
8.
XXII
2217-05-191-74 Pradhan Mantri Awas
Yojana (60% CSS) (P) 216.00 36.57 179.43
9. 2217-05-191-73Atal Mission for Rejuvenation
and Urban Transformation (AMRUT) (60%
CSS) (P)
250.00 63.32 186.68
10. 2217-05-191-72 Smart City Mission (60%
CSS) (P) 250.00 13.20 236.80
11. XXXVI
2501-06-197-48 Block Grants for CSS (P) 375.00 115.73 259.27
12. 2515-00-102-37 Pradhan Mantri Krishi Sinchai
Yojana (PMKSY) Watershed component (P) 66.75 17.10 49.65
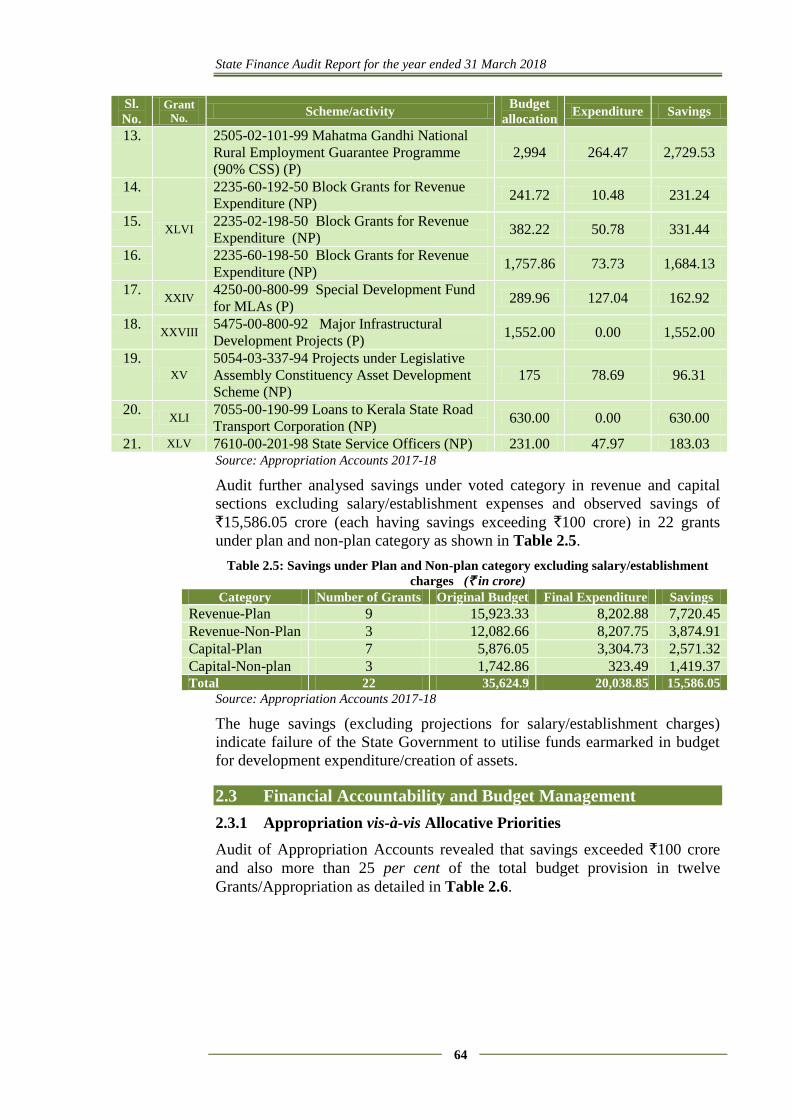
State Finance Audit Report for the year ended 31 March 2018
64
Sl.
No.
Grant
No. Scheme/activity
Budget
allocation Expenditure Savings
13. 2505-02-101-99 Mahatma Gandhi National
Rural Employment Guarantee Programme
(90% CSS) (P)
2,994 264.47 2,729.53
14.
XLVI
2235-60-192-50 Block Grants for Revenue
Expenditure (NP) 241.72 10.48 231.24
15. 2235-02-198-50 Block Grants for Revenue
Expenditure (NP) 382.22 50.78 331.44
16. 2235-60-198-50 Block Grants for Revenue
Expenditure (NP) 1,757.86 73.73 1,684.13
17. XXIV
4250-00-800-99 Special Development Fund
for MLAs (P) 289.96 127.04 162.92
18. XXVIII
5475-00-800-92 Major Infrastructural
Development Projects (P) 1,552.00 0.00 1,552.00
19. XV
5054-03-337-94 Projects under Legislative
Assembly Constituency Asset Development
Scheme (NP)
175 78.69 96.31
20. XLI
7055-00-190-99 Loans to Kerala State Road
Transport Corporation (NP) 630.00 0.00 630.00
21. XLV 7610-00-201-98 State Service Officers (NP) 231.00 47.97 183.03 Source: Appropriation Accounts 2017-18
Audit further analysed savings under voted category in revenue and capital
sections excluding salary/establishment expenses and observed savings of
`15,586.05 crore (each having savings exceeding `100 crore) in 22 grants
under plan and non-plan category as shown in Table 2.5.
Table 2.5: Savings under Plan and Non-plan category excluding salary/establishment
charges (` in crore)
Source: Appropriation Accounts 2017-18
The huge savings (excluding projections for salary/establishment charges)
indicate failure of the State Government to utilise funds earmarked in budget
for development expenditure/creation of assets.
2.3 Financial Accountability and Budget Management
2.3.1 Appropriation vis-à-vis Allocative Priorities
Audit of Appropriation Accounts revealed that savings exceeded `100 crore
and also more than 25 per cent of the total budget provision in twelve
Grants/Appropriation as detailed in Table 2.6.
Category Number of Grants Original Budget Final Expenditure Savings
Revenue-Plan 9 15,923.33 8,202.88 7,720.45
Revenue-Non-Plan 3 12,082.66 8,207.75 3,874.91
Capital-Plan 7 5,876.05 3,304.73 2,571.32
Capital-Non-plan 3 1,742.86 323.49 1,419.37 Total 22 35,624.9 20,038.85 15,586.05
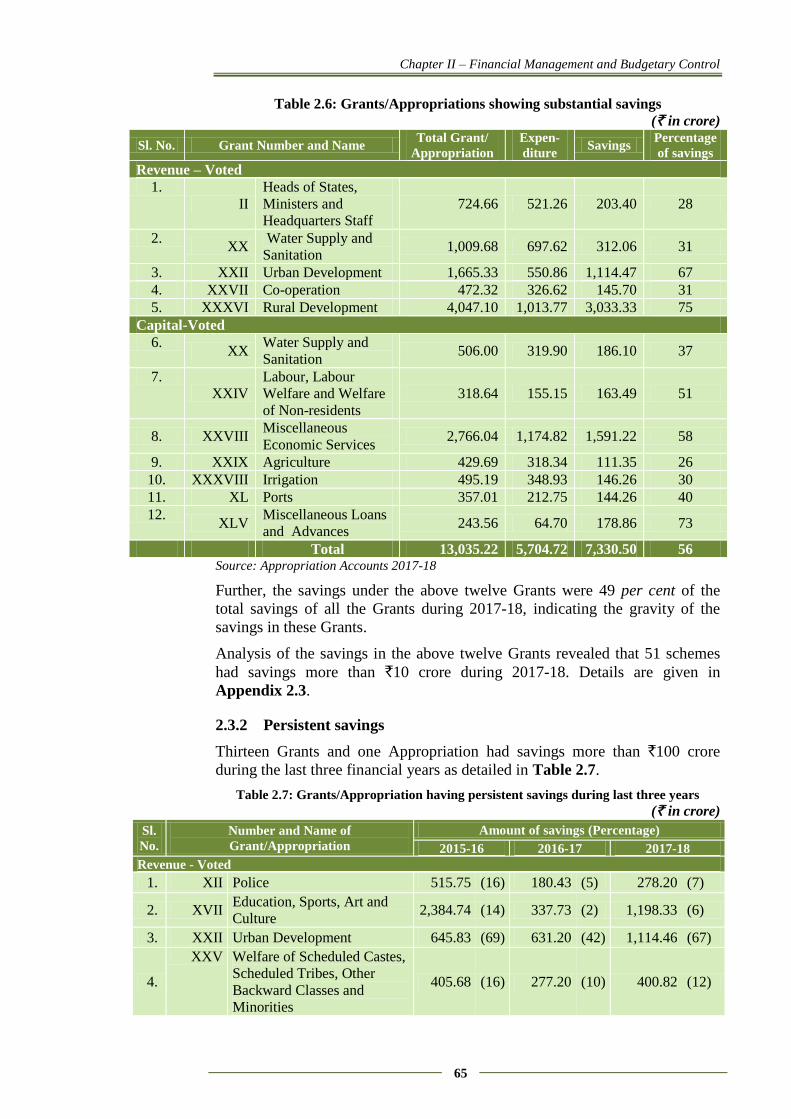
Chapter II – Financial Management and Budgetary Control
65
Table 2.6: Grants/Appropriations showing substantial savings
(` in crore)
Sl. No. Grant Number and Name Total Grant/
Appropriation
Expen-
diture Savings
Percentage
of savings
Revenue – Voted
1.
II
Heads of States,
Ministers and
Headquarters Staff
724.66 521.26 203.40 28
2. XX
Water Supply and
Sanitation 1,009.68 697.62 312.06 31
3. XXII Urban Development 1,665.33 550.86 1,114.47 67
4. XXVII Co-operation 472.32 326.62 145.70 31
5. XXXVI Rural Development 4,047.10 1,013.77 3,033.33 75
Capital-Voted
6. XX
Water Supply and
Sanitation 506.00 319.90 186.10 37
7.
XXIV
Labour, Labour
Welfare and Welfare
of Non-residents
318.64 155.15 163.49 51
8. XXVIII Miscellaneous
Economic Services 2,766.04 1,174.82 1,591.22 58
9. XXIX Agriculture 429.69 318.34 111.35 26
10. XXXVIII Irrigation 495.19 348.93 146.26 30
11. XL Ports 357.01 212.75 144.26 40
12. XLV
Miscellaneous Loans
and Advances 243.56 64.70 178.86 73
Total 13,035.22 5,704.72 7,330.50 56 Source: Appropriation Accounts 2017-18
Further, the savings under the above twelve Grants were 49 per cent of the
total savings of all the Grants during 2017-18, indicating the gravity of the
savings in these Grants.
Analysis of the savings in the above twelve Grants revealed that 51 schemes
had savings more than `10 crore during 2017-18. Details are given in
Appendix 2.3.
2.3.2 Persistent savings
Thirteen Grants and one Appropriation had savings more than `100 crore
during the last three financial years as detailed in Table 2.7.
Table 2.7: Grants/Appropriation having persistent savings during last three years
(` in crore)
Sl.
No.
Number and Name of
Grant/Appropriation
Amount of savings (Percentage)
2015-16 2016-17 2017-18
Revenue - Voted
1. XII Police 515.75 (16) 180.43 (5) 278.20 (7)
2. XVII Education, Sports, Art and
Culture 2,384.74 (14) 337.73 (2) 1,198.33 (6)
3. XXII Urban Development 645.83 (69) 631.20 (42) 1,114.46 (67)
4.
XXV Welfare of Scheduled Castes,
Scheduled Tribes, Other
Backward Classes and
Minorities
405.68 (16) 277.20 (10) 400.82 (12)
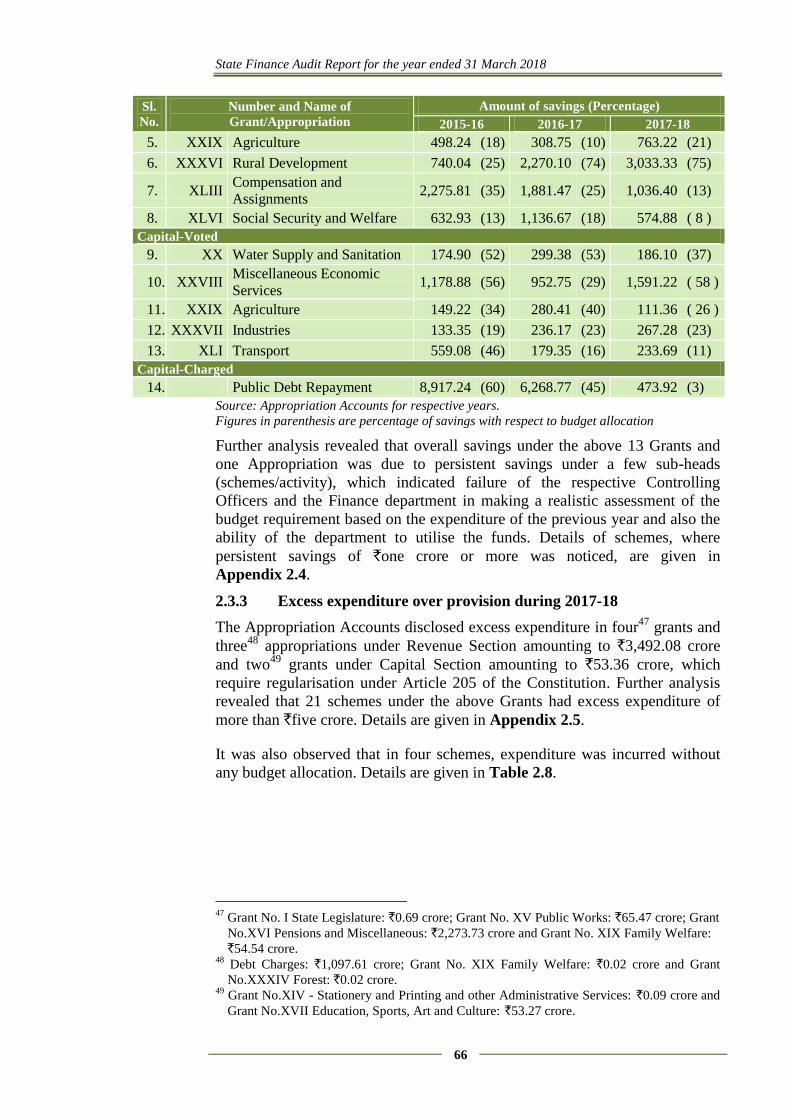
State Finance Audit Report for the year ended 31 March 2018
66
Sl.
No.
Number and Name of
Grant/Appropriation
Amount of savings (Percentage)
2015-16 2016-17 2017-18
5. XXIX Agriculture 498.24 (18) 308.75 (10) 763.22 (21)
6. XXXVI Rural Development 740.04 (25) 2,270.10 (74) 3,033.33 (75)
7. XLIII Compensation and
Assignments 2,275.81 (35) 1,881.47 (25) 1,036.40 (13)
8. XLVI Social Security and Welfare 632.93 (13) 1,136.67 (18) 574.88 ( 8 )
Capital-Voted
9. XX Water Supply and Sanitation 174.90 (52) 299.38 (53) 186.10 (37)
10. XXVIII Miscellaneous Economic
Services 1,178.88 (56) 952.75 (29) 1,591.22 ( 58 )
11. XXIX Agriculture 149.22 (34) 280.41 (40) 111.36 ( 26 )
12. XXXVII Industries 133.35 (19) 236.17 (23) 267.28 (23)
13. XLI Transport 559.08 (46) 179.35 (16) 233.69 (11)
Capital-Charged
14. Public Debt Repayment 8,917.24 (60) 6,268.77 (45) 473.92 (3)
Source: Appropriation Accounts for respective years.
Figures in parenthesis are percentage of savings with respect to budget allocation
Further analysis revealed that overall savings under the above 13 Grants and
one Appropriation was due to persistent savings under a few sub-heads
(schemes/activity), which indicated failure of the respective Controlling
Officers and the Finance department in making a realistic assessment of the
budget requirement based on the expenditure of the previous year and also the
ability of the department to utilise the funds. Details of schemes, where
persistent savings of `one crore or more was noticed, are given in
Appendix 2.4.
2.3.3 Excess expenditure over provision during 2017-18
The Appropriation Accounts disclosed excess expenditure in four47
grants and
three48
appropriations under Revenue Section amounting to `3,492.08 crore
and two49
grants under Capital Section amounting to `53.36 crore, which
require regularisation under Article 205 of the Constitution. Further analysis
revealed that 21 schemes under the above Grants had excess expenditure of
more than `five crore. Details are given in Appendix 2.5.
It was also observed that in four schemes, expenditure was incurred without
any budget allocation. Details are given in Table 2.8.
47
Grant No. I State Legislature: `0.69 crore; Grant No. XV Public Works: `65.47 crore; Grant
No.XVI Pensions and Miscellaneous: `2,273.73 crore and Grant No. XIX Family Welfare:
`54.54 crore. 48
Debt Charges: `1,097.61 crore; Grant No. XIX Family Welfare: `0.02 crore and Grant
No.XXXIV Forest: `0.02 crore. 49
Grant No.XIV - Stationery and Printing and other Administrative Services: `0.09 crore and
Grant No.XVII Education, Sports, Art and Culture: `53.27 crore.
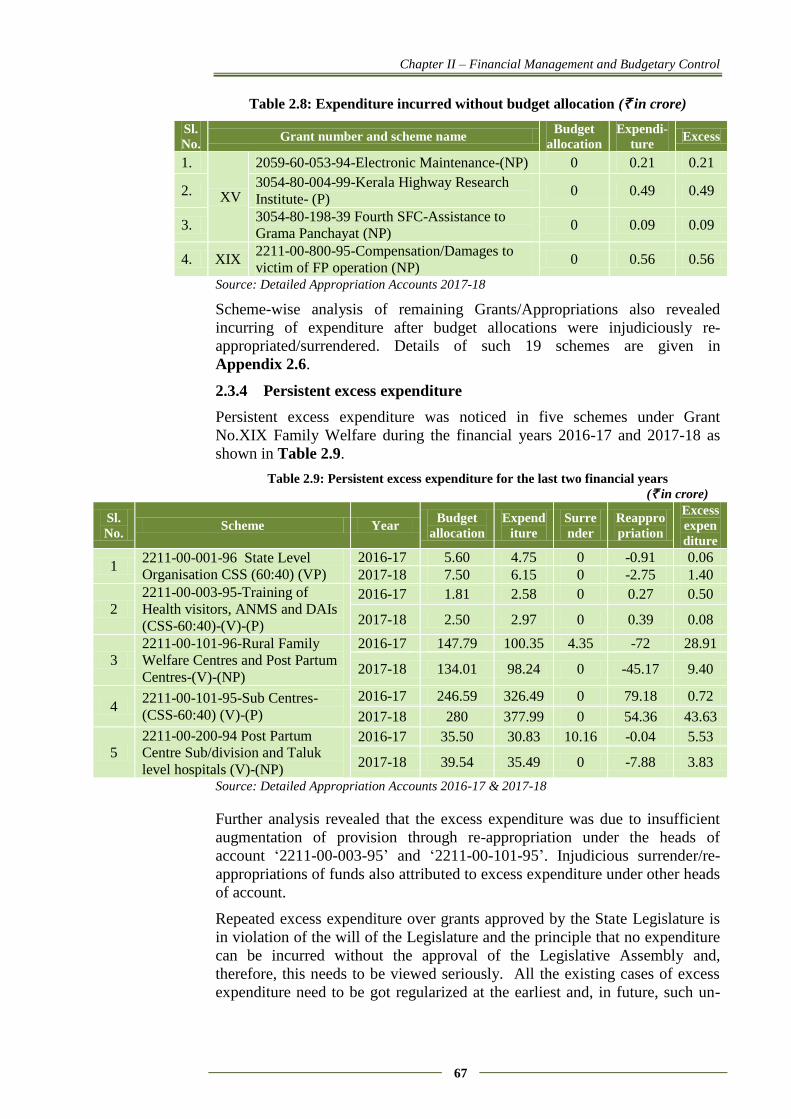
Chapter II – Financial Management and Budgetary Control
67
Table 2.8: Expenditure incurred without budget allocation (` in crore)
Sl.
No. Grant number and scheme name
Budget
allocation
Expendi-
ture Excess
1.
XV
2059-60-053-94-Electronic Maintenance-(NP) 0 0.21 0.21
2. 3054-80-004-99-Kerala Highway Research
Institute- (P) 0 0.49 0.49
3. 3054-80-198-39 Fourth SFC-Assistance to
Grama Panchayat (NP) 0 0.09 0.09
4. XIX 2211-00-800-95-Compensation/Damages to
victim of FP operation (NP) 0 0.56 0.56
Source: Detailed Appropriation Accounts 2017-18
Scheme-wise analysis of remaining Grants/Appropriations also revealed
incurring of expenditure after budget allocations were injudiciously re-
appropriated/surrendered. Details of such 19 schemes are given in
Appendix 2.6.
2.3.4 Persistent excess expenditure
Persistent excess expenditure was noticed in five schemes under Grant
No.XIX Family Welfare during the financial years 2016-17 and 2017-18 as
shown in Table 2.9.
Table 2.9: Persistent excess expenditure for the last two financial years
(` in crore)
Sl.
No. Scheme Year
Budget
allocation
Expend
iture
Surre
nder
Reappro
priation
Excess
expen
diture
1 2211-00-001-96 State Level
Organisation CSS (60:40) (VP)
2016-17 5.60 4.75 0 -0.91 0.06
2017-18 7.50 6.15 0 -2.75 1.40
2
2211-00-003-95-Training of
Health visitors, ANMS and DAIs
(CSS-60:40)-(V)-(P)
2016-17 1.81 2.58 0 0.27 0.50
2017-18 2.50 2.97 0 0.39 0.08
3
2211-00-101-96-Rural Family
Welfare Centres and Post Partum
Centres-(V)-(NP)
2016-17 147.79 100.35 4.35 -72 28.91
2017-18 134.01 98.24 0 -45.17 9.40
4 2211-00-101-95-Sub Centres-
(CSS-60:40) (V)-(P)
2016-17 246.59 326.49 0 79.18 0.72
2017-18 280 377.99 0 54.36 43.63
5
2211-00-200-94 Post Partum
Centre Sub/division and Taluk
level hospitals (V)-(NP)
2016-17 35.50 30.83 10.16 -0.04 5.53
2017-18 39.54 35.49 0 -7.88 3.83
Source: Detailed Appropriation Accounts 2016-17 & 2017-18
Further analysis revealed that the excess expenditure was due to insufficient
augmentation of provision through re-appropriation under the heads of
account ‘2211-00-003-95’ and ‘2211-00-101-95’. Injudicious surrender/re-
appropriations of funds also attributed to excess expenditure under other heads
of account.
Repeated excess expenditure over grants approved by the State Legislature is
in violation of the will of the Legislature and the principle that no expenditure
can be incurred without the approval of the Legislative Assembly and,
therefore, this needs to be viewed seriously. All the existing cases of excess
expenditure need to be got regularized at the earliest and, in future, such un-
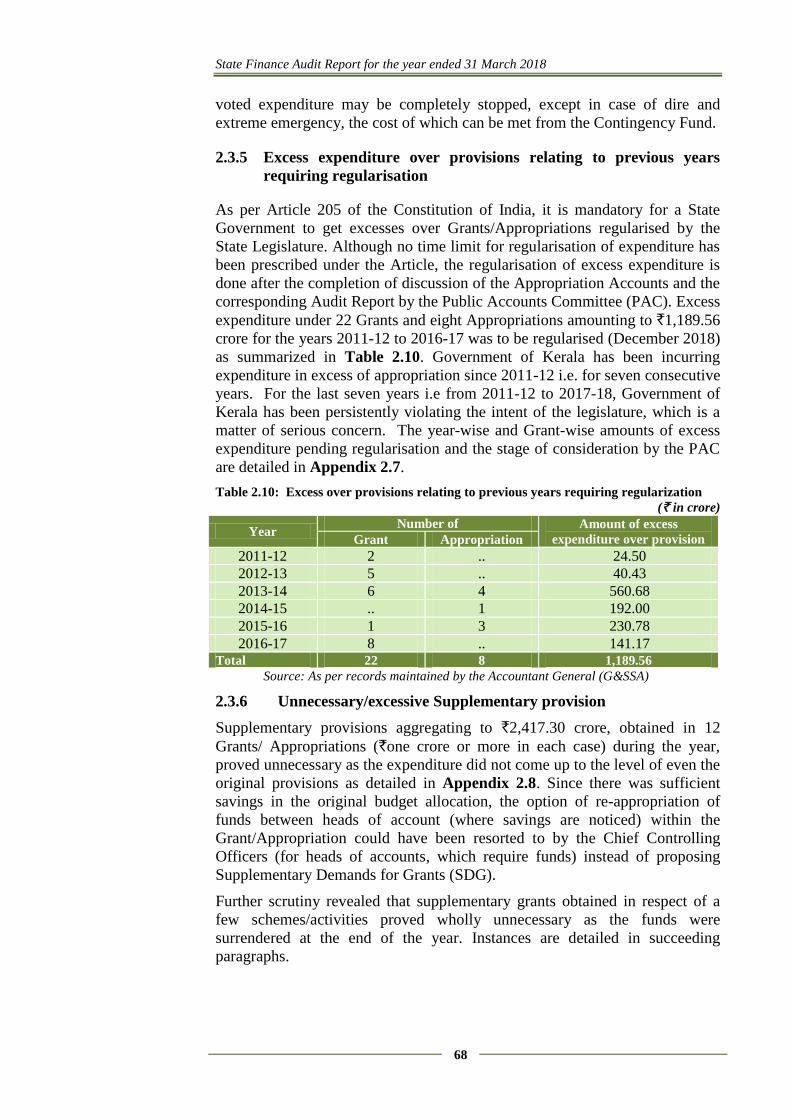
State Finance Audit Report for the year ended 31 March 2018
68
voted expenditure may be completely stopped, except in case of dire and
extreme emergency, the cost of which can be met from the Contingency Fund.
2.3.5 Excess expenditure over provisions relating to previous years
requiring regularisation
As per Article 205 of the Constitution of India, it is mandatory for a State
Government to get excesses over Grants/Appropriations regularised by the
State Legislature. Although no time limit for regularisation of expenditure has
been prescribed under the Article, the regularisation of excess expenditure is
done after the completion of discussion of the Appropriation Accounts and the
corresponding Audit Report by the Public Accounts Committee (PAC). Excess
expenditure under 22 Grants and eight Appropriations amounting to `1,189.56
crore for the years 2011-12 to 2016-17 was to be regularised (December 2018)
as summarized in Table 2.10. Government of Kerala has been incurring
expenditure in excess of appropriation since 2011-12 i.e. for seven consecutive
years. For the last seven years i.e from 2011-12 to 2017-18, Government of
Kerala has been persistently violating the intent of the legislature, which is a
matter of serious concern. The year-wise and Grant-wise amounts of excess
expenditure pending regularisation and the stage of consideration by the PAC
are detailed in Appendix 2.7.
Table 2.10: Excess over provisions relating to previous years requiring regularization
(` in crore)
Source: As per records maintained by the Accountant General (G&SSA)
2.3.6 Unnecessary/excessive Supplementary provision
Supplementary provisions aggregating to `2,417.30 crore, obtained in 12
Grants/ Appropriations (`one crore or more in each case) during the year,
proved unnecessary as the expenditure did not come up to the level of even the
original provisions as detailed in Appendix 2.8. Since there was sufficient
savings in the original budget allocation, the option of re-appropriation of
funds between heads of account (where savings are noticed) within the
Grant/Appropriation could have been resorted to by the Chief Controlling
Officers (for heads of accounts, which require funds) instead of proposing
Supplementary Demands for Grants (SDG).
Further scrutiny revealed that supplementary grants obtained in respect of a
few schemes/activities proved wholly unnecessary as the funds were
surrendered at the end of the year. Instances are detailed in succeeding
paragraphs.
Year Number of Amount of excess
expenditure over provision Grant Appropriation
2011-12 2 .. 24.50
2012-13 5 .. 40.43
2013-14 6 4 560.68
2014-15 .. 1 192.00
2015-16 1 3 230.78
2016-17 8 .. 141.17 Total 22 8 1,189.56
Chapter II – Financial Management and Budgetary Control
69
(i) Grant number II – Heads of States, Ministers and Headquarters Staff
(Revenue charged)
The supplementary appropriation of `26 crore, obtained in February 2018
under the head of account ‘2051-102-99 Public Service Commission’ was to
regularize the additional expenditure of `10 crore and to provide `16 crore to
PSC for conducting examinations, various tests, interviews, for meeting the
charges of examination centres, etc. But the final expenditure under the sub
head (`184.63 crore) was less than the original budget allocation (`190.78
crore) and the final surrender (`29.59 crore) from the head of account was
more than the amount obtained through supplementary appropriation in
February 2018.
(ii) Grant number XII – Police (Revenue Voted)
Supplementary grant of `3.94 crore obtained in February 2018 under the head
of account ‘2055-116-98 Setting up of Cyber forensic Lab cum Training
Centre’, remained unutilised and was surrendered at the end of the year.
(iii) Grant number XIV - Stationery and Printing and other Administrative
Services (Revenue Voted)
Entire Supplementary grant of ` 2.26 crore obtained in August 2017 under the
head of account ‘2070-106-96 Civil Defence Institute’ remained unutilised
and was surrendered at the end of the year.
(iv) Grant number XXVII – Co-operation (Revenue Voted)
The supplementary grant of ` 90 crore, obtained in August 2017 to provide
fund to Consumerfed for effective market intervention operations, under the
head of account ‘2425-108-80 Subsidy to Co-operatives for conducting
Festival Markets’ proved unnecessary as the final expenditure under the sub
head (`52 crore) was less than the original budget allocation (`60 crore) and
the final surrender (`95.82 crore) from the head of account was more than the
amount obtained through supplementary grant in August 2017.
(v) Grant number XXX – Food (Revenue Voted)
The supplementary grant of ` 125 crore, obtained in May 2017 to provide
fund to meet the expenditure towards Paddy procurement as announced in the
Budget speech 2017-18 under the head of account ‘2408-01-101-96 Paddy
Procurement through Kerala State Civil Supplies Corporation and other
agencies’ proved unnecessary as the final expenditure under the sub head
(`325.14 crore) was less than the original budget allocation (`400 crore) and
the final surrender (`199.86 crore) from the head of account was more than the
amount obtained through supplementary grant in May 2017.
(vi) Grant number XXXV – Panchayat (Revenue Voted)
The supplementary grant of `0.40 crore obtained in August 2017 for satisfying
‘ New Service procedure’ and to provide fund under the head of account
‘2515-101-54 Assistance to ‘Thanal’ for supporting the activities of Carbon
Neutral Wayanad’ as announced in the Budget speech 2017-18 remained
unutilised and was surrendered at the end of the year.
State Finance Audit Report for the year ended 31 March 2018
70
(vii) Grant number XXXV – Panchayat (Capital Voted)
Rupees six crore obtained in August 2017 under the head of account ‘4515-
800-94 Completion of construction and land acquisition activities of
convention centre at Pinarayi Grama Panchayat’ for providing fund towards
land acquisition and construction activities of Convention Centre at Pinarayi
Grama Panchayat, remained unutilised and was surrendered at the end of the
year.
Further, in 21 Grants/Appropriation, against the additional requirement of
`4,794.06 crore, supplementary budget allocation of `6,819.39 crore obtained
during the year proved excessive (Appendix 2.9) by `2,025.33 crore which
resulted in avoidable savings to that extent.
2.3.7 Re-appropriation of funds
Re-appropriation is transfer of funds within a Grant from one unit of
appropriation, where savings are anticipated, to another unit where additional
funds are needed. Augmentation of funds through re-appropriation was
resorted to by departmental officers. However, audit analysis revealed that
augmentation of budget allocation was wholly unnecessary in some sub-heads
as the final expenditure was less than the budget allocation (original and
supplementary grant) provided under it. Sub-heads in which augmentation was
done through re-appropriation (exceeding `one crore) but no part was utilised
are given in Appendix 2.10.
Failure of the departmental officers in assessing the actual requirement of
funds also resulted in excess withdrawal of funds from units of appropriation,
which finally led to excess expenditure over provision in certain sub-heads.
Cases of such injudicious re-appropriations noticed in 18 schemes/activities
are given in Appendix 2.11. It was also observed that even though
augmentation through re-appropriation was done in 22 schemes/activities, the
final expenditure exceeded the budget allocation available under the heads of
account by more than `one crore. Details are given in Appendix 2.12.
2.3.8 Surrender of budget allocations
As per Paragraph 91 of the Kerala Budget Manual, the Administrative
Departments should surrender all anticipated savings before the close of the
financial year to Finance Department as and when they are foreseen, unless
they are required to meet the excesses under other units of appropriation.
During 2017-18, `15,709.26 crore (11 per cent) out of the total budget
allocation (`1,44,882 crore) was surrendered at the end of the financial year.
More than `1,000 crore was surrendered in five Grants as detailed in Table
2.11.
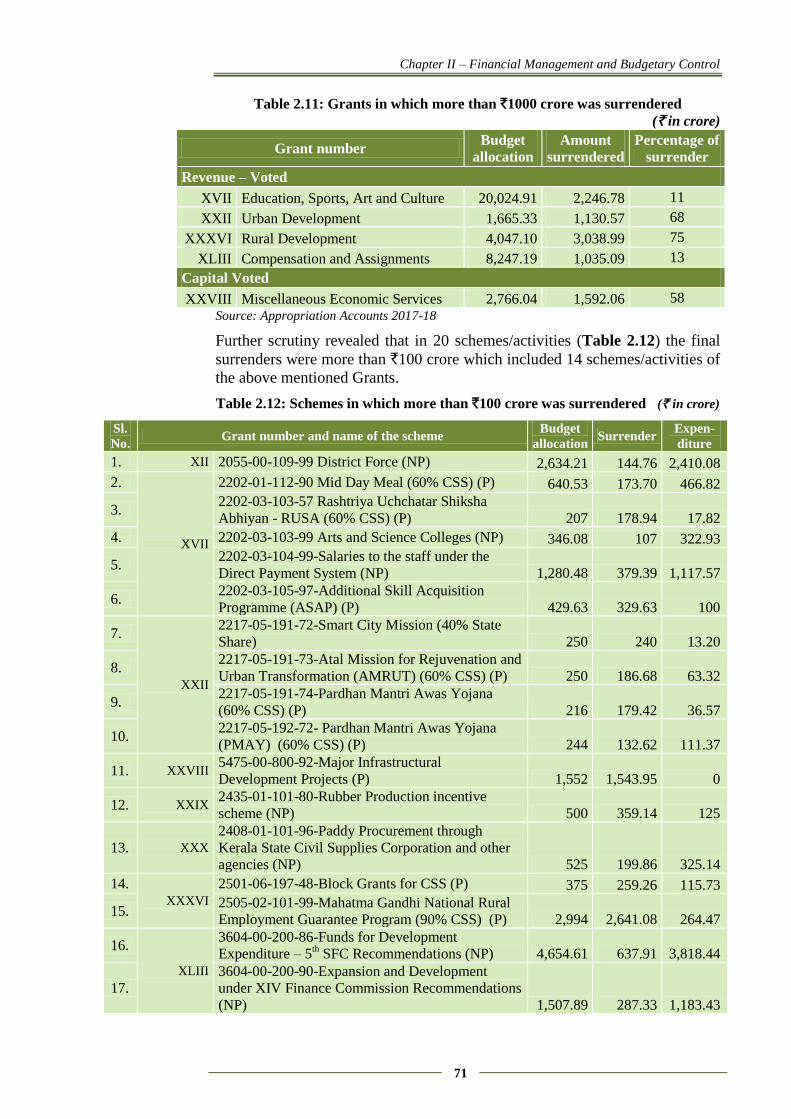
Chapter II – Financial Management and Budgetary Control
71
Table 2.11: Grants in which more than `1000 crore was surrendered
(` in crore)
Grant number Budget
allocation
Amount
surrendered
Percentage of
surrender
Revenue – Voted
XVII Education, Sports, Art and Culture 20,024.91 2,246.78 11
XXII Urban Development 1,665.33 1,130.57 68
XXXVI Rural Development 4,047.10 3,038.99 75
XLIII Compensation and Assignments 8,247.19 1,035.09 13
Capital Voted
XXVIII Miscellaneous Economic Services 2,766.04 1,592.06 58
Source: Appropriation Accounts 2017-18
Further scrutiny revealed that in 20 schemes/activities (Table 2.12) the final
surrenders were more than `100 crore which included 14 schemes/activities of
the above mentioned Grants.
Table 2.12: Schemes in which more than `100 crore was surrendered (` in crore)
Sl.
No. Grant number and name of the scheme
Budget
allocation Surrender
Expen-
diture
1. XII 2055-00-109-99 District Force (NP) 2,634.21 144.76 2,410.08
2.
XVII
2202-01-112-90 Mid Day Meal (60% CSS) (P) 640.53 173.70 466.82
3. 2202-03-103-57 Rashtriya Uchchatar Shiksha
Abhiyan - RUSA (60% CSS) (P) 207 178.94 17.82
4. 2202-03-103-99 Arts and Science Colleges (NP) 346.08 107 322.93
5. 2202-03-104-99-Salaries to the staff under the
Direct Payment System (NP) 1,280.48 379.39 1,117.57
6. 2202-03-105-97-Additional Skill Acquisition
Programme (ASAP) (P) 429.63 329.63 100
7.
XXII
2217-05-191-72-Smart City Mission (40% State
Share) 250 240 13.20
8. 2217-05-191-73-Atal Mission for Rejuvenation and
Urban Transformation (AMRUT) (60% CSS) (P) 250 186.68 63.32
9. 2217-05-191-74-Pardhan Mantri Awas Yojana
(60% CSS) (P) 216 179.42 36.57
10. 2217-05-192-72- Pardhan Mantri Awas Yojana
(PMAY) (60% CSS) (P) 244 132.62 111.37
11. XXVIII 5475-00-800-92-Major Infrastructural
Development Projects (P) 1,552 1,543.95 0
12. XXIX 2435-01-101-80-Rubber Production incentive
scheme (NP) 500 359.14 125
13. XXX
2408-01-101-96-Paddy Procurement through
Kerala State Civil Supplies Corporation and other
agencies (NP) 525 199.86 325.14
14. XXXVI
2501-06-197-48-Block Grants for CSS (P) 375 259.26 115.73
15. 2505-02-101-99-Mahatma Gandhi National Rural
Employment Guarantee Program (90% CSS) (P) 2,994 2,641.08 264.47
16.
XLIII
3604-00-200-86-Funds for Development
Expenditure – 5th SFC Recommendations (NP) 4,654.61 637.91 3,818.44
17. 3604-00-200-90-Expansion and Development
under XIV Finance Commission Recommendations
(NP) 1,507.89 287.33 1,183.43
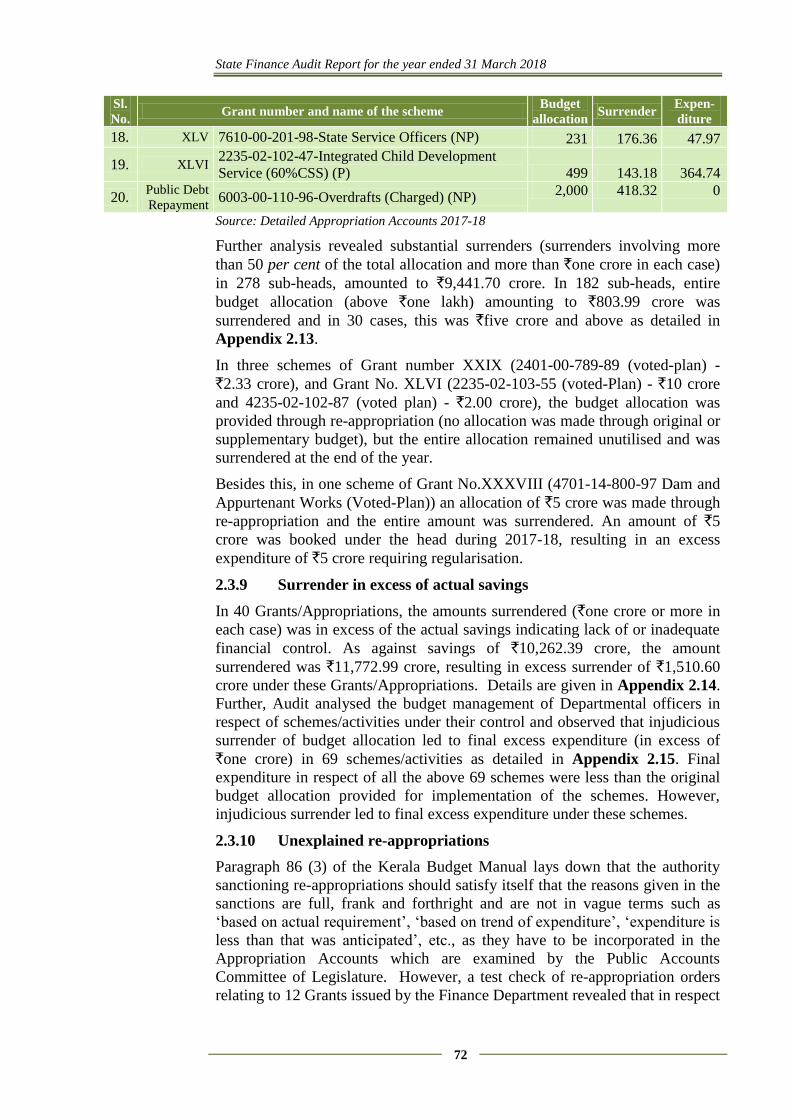
State Finance Audit Report for the year ended 31 March 2018
72
Sl.
No. Grant number and name of the scheme
Budget
allocation Surrender
Expen-
diture
18. XLV 7610-00-201-98-State Service Officers (NP) 231 176.36 47.97
19. XLVI 2235-02-102-47-Integrated Child Development
Service (60%CSS) (P) 499 143.18 364.74
20. Public Debt
Repayment 6003-00-110-96-Overdrafts (Charged) (NP)
2,000 418.32 0
Source: Detailed Appropriation Accounts 2017-18
Further analysis revealed substantial surrenders (surrenders involving more
than 50 per cent of the total allocation and more than `one crore in each case)
in 278 sub-heads, amounted to `9,441.70 crore. In 182 sub-heads, entire
budget allocation (above `one lakh) amounting to `803.99 crore was
surrendered and in 30 cases, this was `five crore and above as detailed in
Appendix 2.13.
In three schemes of Grant number XXIX (2401-00-789-89 (voted-plan) -
`2.33 crore), and Grant No. XLVI (2235-02-103-55 (voted-Plan) - `10 crore
and 4235-02-102-87 (voted plan) - `2.00 crore), the budget allocation was
provided through re-appropriation (no allocation was made through original or
supplementary budget), but the entire allocation remained unutilised and was
surrendered at the end of the year.
Besides this, in one scheme of Grant No.XXXVIII (4701-14-800-97 Dam and
Appurtenant Works (Voted-Plan)) an allocation of `5 crore was made through
re-appropriation and the entire amount was surrendered. An amount of `5
crore was booked under the head during 2017-18, resulting in an excess
expenditure of `5 crore requiring regularisation.
2.3.9 Surrender in excess of actual savings
In 40 Grants/Appropriations, the amounts surrendered (`one crore or more in
each case) was in excess of the actual savings indicating lack of or inadequate
financial control. As against savings of `10,262.39 crore, the amount
surrendered was `11,772.99 crore, resulting in excess surrender of `1,510.60
crore under these Grants/Appropriations. Details are given in Appendix 2.14.
Further, Audit analysed the budget management of Departmental officers in
respect of schemes/activities under their control and observed that injudicious
surrender of budget allocation led to final excess expenditure (in excess of
`one crore) in 69 schemes/activities as detailed in Appendix 2.15. Final
expenditure in respect of all the above 69 schemes were less than the original
budget allocation provided for implementation of the schemes. However,
injudicious surrender led to final excess expenditure under these schemes.
2.3.10 Unexplained re-appropriations
Paragraph 86 (3) of the Kerala Budget Manual lays down that the authority
sanctioning re-appropriations should satisfy itself that the reasons given in the
sanctions are full, frank and forthright and are not in vague terms such as
‘based on actual requirement’, ‘based on trend of expenditure’, ‘expenditure is
less than that was anticipated’, etc., as they have to be incorporated in the
Appropriation Accounts which are examined by the Public Accounts
Committee of Legislature. However, a test check of re-appropriation orders
relating to 12 Grants issued by the Finance Department revealed that in respect
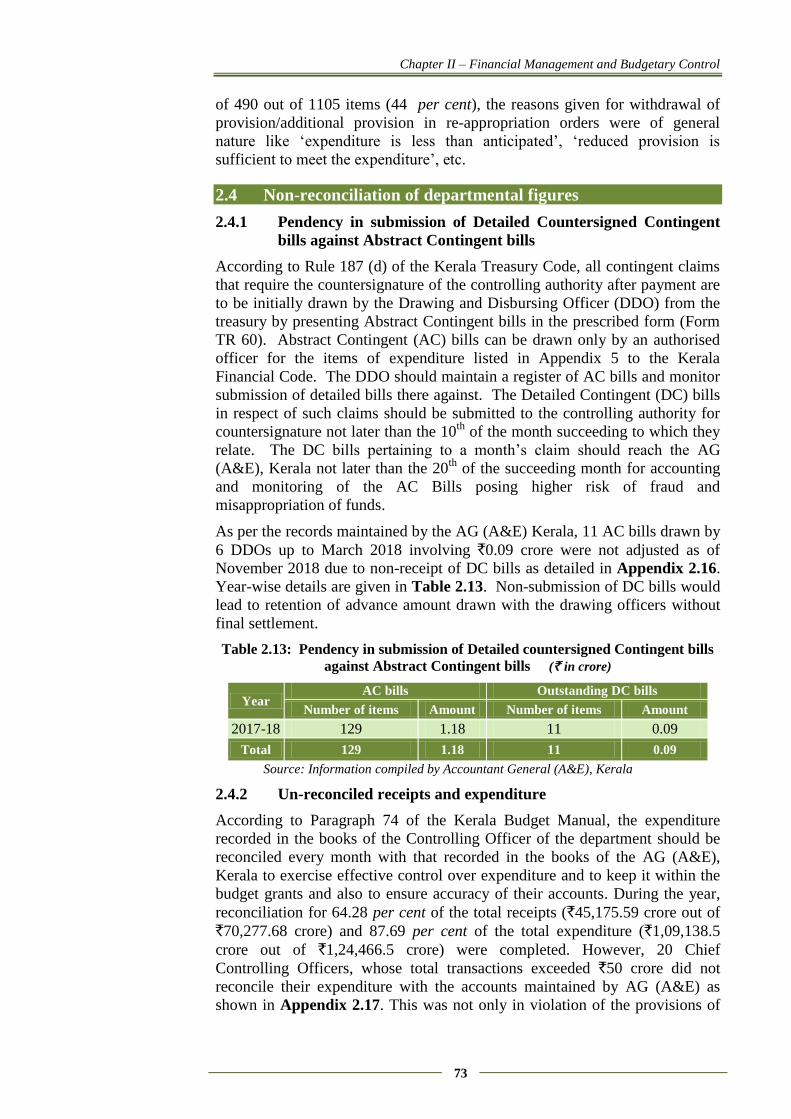
Chapter II – Financial Management and Budgetary Control
73
of 490 out of 1105 items (44 per cent), the reasons given for withdrawal of
provision/additional provision in re-appropriation orders were of general
nature like ‘expenditure is less than anticipated’, ‘reduced provision is
sufficient to meet the expenditure’, etc.
2.4 Non-reconciliation of departmental figures
2.4.1 Pendency in submission of Detailed Countersigned Contingent
bills against Abstract Contingent bills
According to Rule 187 (d) of the Kerala Treasury Code, all contingent claims
that require the countersignature of the controlling authority after payment are
to be initially drawn by the Drawing and Disbursing Officer (DDO) from the
treasury by presenting Abstract Contingent bills in the prescribed form (Form
TR 60). Abstract Contingent (AC) bills can be drawn only by an authorised
officer for the items of expenditure listed in Appendix 5 to the Kerala
Financial Code. The DDO should maintain a register of AC bills and monitor
submission of detailed bills there against. The Detailed Contingent (DC) bills
in respect of such claims should be submitted to the controlling authority for
countersignature not later than the 10th
of the month succeeding to which they
relate. The DC bills pertaining to a month’s claim should reach the AG
(A&E), Kerala not later than the 20th
of the succeeding month for accounting
and monitoring of the AC Bills posing higher risk of fraud and
misappropriation of funds.
As per the records maintained by the AG (A&E) Kerala, 11 AC bills drawn by
6 DDOs up to March 2018 involving `0.09 crore were not adjusted as of
November 2018 due to non-receipt of DC bills as detailed in Appendix 2.16.
Year-wise details are given in Table 2.13. Non-submission of DC bills would
lead to retention of advance amount drawn with the drawing officers without
final settlement.
Table 2.13: Pendency in submission of Detailed countersigned Contingent bills
against Abstract Contingent bills (` in crore)
Year AC bills Outstanding DC bills
Number of items Amount Number of items Amount
2017-18 129 1.18 11 0.09
Total 129 1.18 11 0.09
Source: Information compiled by Accountant General (A&E), Kerala
2.4.2 Un-reconciled receipts and expenditure
According to Paragraph 74 of the Kerala Budget Manual, the expenditure
recorded in the books of the Controlling Officer of the department should be
reconciled every month with that recorded in the books of the AG (A&E),
Kerala to exercise effective control over expenditure and to keep it within the
budget grants and also to ensure accuracy of their accounts. During the year,
reconciliation for 64.28 per cent of the total receipts (`45,175.59 crore out of
`70,277.68 crore) and 87.69 per cent of the total expenditure (`1,09,138.5
crore out of `1,24,466.5 crore) were completed. However, 20 Chief
Controlling Officers, whose total transactions exceeded `50 crore did not
reconcile their expenditure with the accounts maintained by AG (A&E) as
shown in Appendix 2.17. This was not only in violation of the provisions of
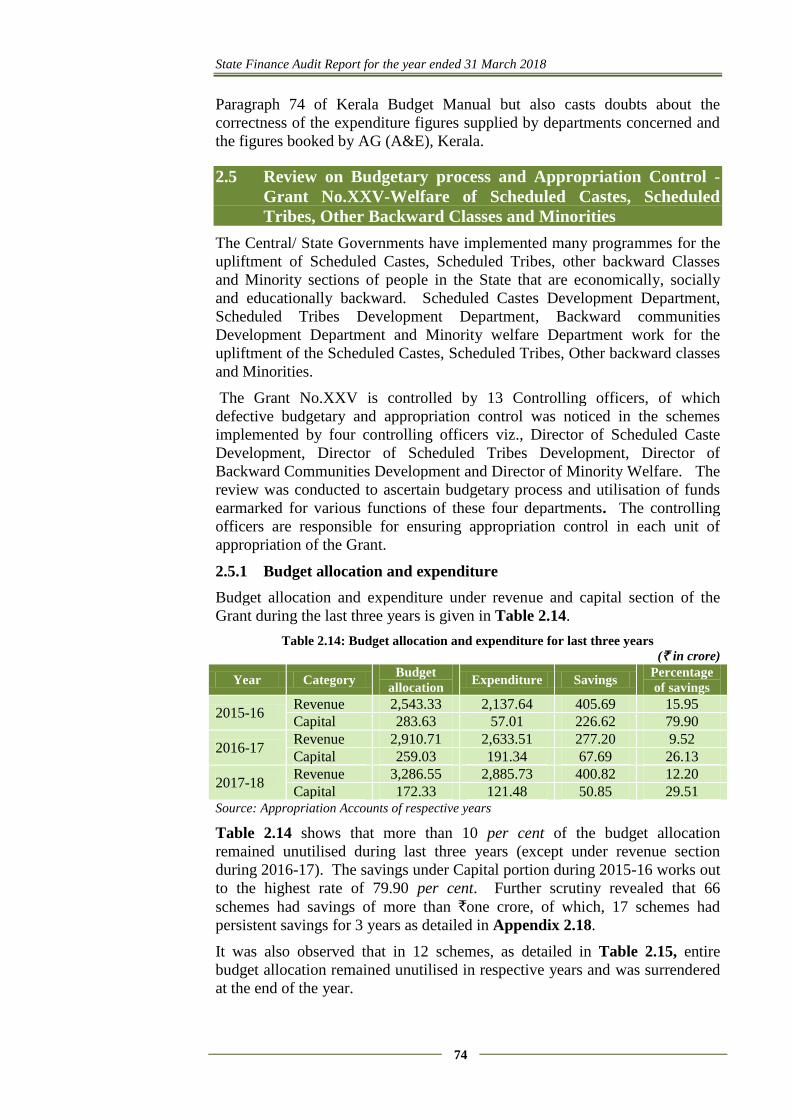
State Finance Audit Report for the year ended 31 March 2018
74
Paragraph 74 of Kerala Budget Manual but also casts doubts about the
correctness of the expenditure figures supplied by departments concerned and
the figures booked by AG (A&E), Kerala.
2.5 Review on Budgetary process and Appropriation Control -
Grant No.XXV-Welfare of Scheduled Castes, Scheduled
Tribes, Other Backward Classes and Minorities
The Central/ State Governments have implemented many programmes for the
upliftment of Scheduled Castes, Scheduled Tribes, other backward Classes
and Minority sections of people in the State that are economically, socially
and educationally backward. Scheduled Castes Development Department,
Scheduled Tribes Development Department, Backward communities
Development Department and Minority welfare Department work for the
upliftment of the Scheduled Castes, Scheduled Tribes, Other backward classes
and Minorities.
The Grant No.XXV is controlled by 13 Controlling officers, of which
defective budgetary and appropriation control was noticed in the schemes
implemented by four controlling officers viz., Director of Scheduled Caste
Development, Director of Scheduled Tribes Development, Director of
Backward Communities Development and Director of Minority Welfare. The
review was conducted to ascertain budgetary process and utilisation of funds
earmarked for various functions of these four departments. The controlling
officers are responsible for ensuring appropriation control in each unit of
appropriation of the Grant.
2.5.1 Budget allocation and expenditure
Budget allocation and expenditure under revenue and capital section of the
Grant during the last three years is given in Table 2.14.
Table 2.14: Budget allocation and expenditure for last three years
(` in crore)
Year Category Budget
allocation Expenditure Savings
Percentage
of savings
2015-16 Revenue 2,543.33 2,137.64 405.69 15.95
Capital 283.63 57.01 226.62 79.90
2016-17 Revenue 2,910.71 2,633.51 277.20 9.52
Capital 259.03 191.34 67.69 26.13
2017-18 Revenue 3,286.55 2,885.73 400.82 12.20
Capital 172.33 121.48 50.85 29.51 Source: Appropriation Accounts of respective years
Table 2.14 shows that more than 10 per cent of the budget allocation
remained unutilised during last three years (except under revenue section
during 2016-17). The savings under Capital portion during 2015-16 works out
to the highest rate of 79.90 per cent. Further scrutiny revealed that 66
schemes had savings of more than `one crore, of which, 17 schemes had
persistent savings for 3 years as detailed in Appendix 2.18.
It was also observed that in 12 schemes, as detailed in Table 2.15, entire
budget allocation remained unutilised in respective years and was surrendered
at the end of the year.
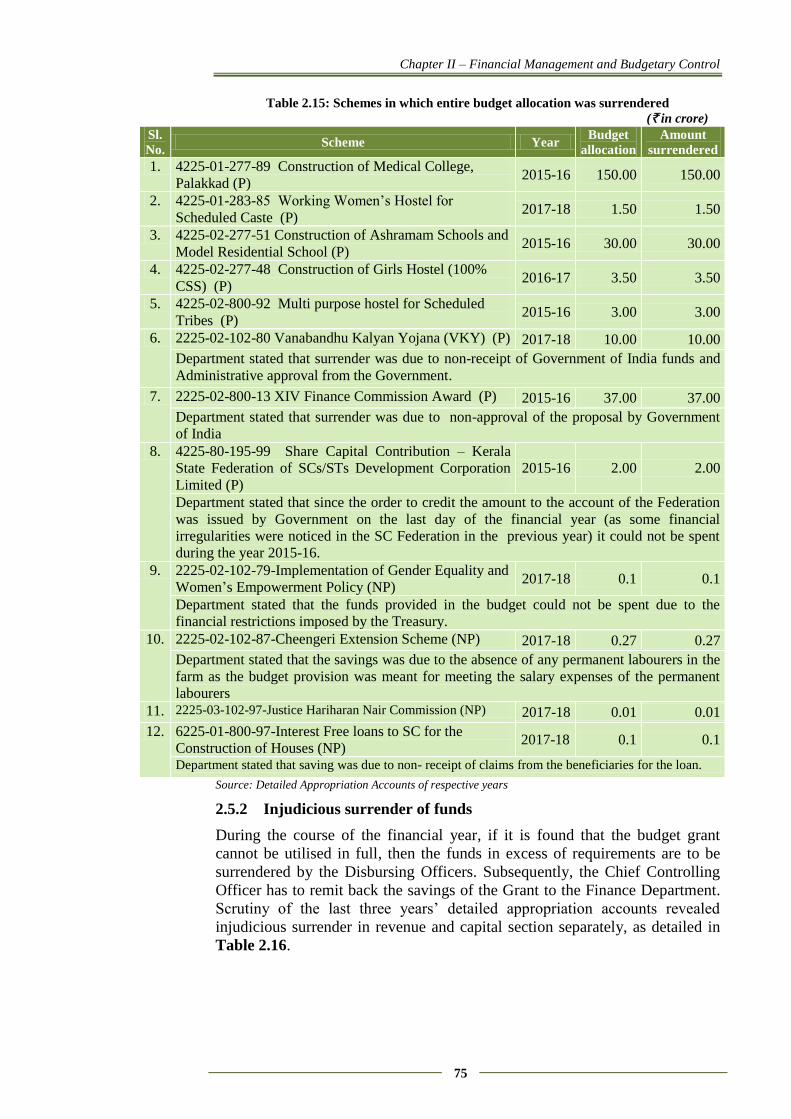
Chapter II – Financial Management and Budgetary Control
75
Table 2.15: Schemes in which entire budget allocation was surrendered
(` in crore)
Sl.
No. Scheme Year
Budget
allocation
Amount
surrendered
1. 4225-01-277-89 Construction of Medical College,
Palakkad (P) 2015-16 150.00 150.00
2. 4225-01-283-85 Working Women’s Hostel for
Scheduled Caste (P) 2017-18 1.50 1.50
3. 4225-02-277-51 Construction of Ashramam Schools and
Model Residential School (P) 2015-16 30.00 30.00
4. 4225-02-277-48 Construction of Girls Hostel (100%
CSS) (P) 2016-17 3.50 3.50
5. 4225-02-800-92 Multi purpose hostel for Scheduled
Tribes (P) 2015-16 3.00 3.00
6. 2225-02-102-80 Vanabandhu Kalyan Yojana (VKY) (P) 2017-18 10.00 10.00
Department stated that surrender was due to non-receipt of Government of India funds and
Administrative approval from the Government.
7. 2225-02-800-13 XIV Finance Commission Award (P) 2015-16 37.00 37.00
Department stated that surrender was due to non-approval of the proposal by Government
of India
8. 4225-80-195-99 Share Capital Contribution – Kerala
State Federation of SCs/STs Development Corporation
Limited (P)
2015-16 2.00 2.00
Department stated that since the order to credit the amount to the account of the Federation
was issued by Government on the last day of the financial year (as some financial
irregularities were noticed in the SC Federation in the previous year) it could not be spent
during the year 2015-16.
9. 2225-02-102-79-Implementation of Gender Equality and
Women’s Empowerment Policy (NP) 2017-18 0.1 0.1
Department stated that the funds provided in the budget could not be spent due to the
financial restrictions imposed by the Treasury.
10. 2225-02-102-87-Cheengeri Extension Scheme (NP) 2017-18 0.27 0.27
Department stated that the savings was due to the absence of any permanent labourers in the
farm as the budget provision was meant for meeting the salary expenses of the permanent
labourers
11. 2225-03-102-97-Justice Hariharan Nair Commission (NP) 2017-18 0.01 0.01
12. 6225-01-800-97-Interest Free loans to SC for the
Construction of Houses (NP) 2017-18 0.1 0.1
Department stated that saving was due to non- receipt of claims from the beneficiaries for the loan.
Source: Detailed Appropriation Accounts of respective years
2.5.2 Injudicious surrender of funds
During the course of the financial year, if it is found that the budget grant
cannot be utilised in full, then the funds in excess of requirements are to be
surrendered by the Disbursing Officers. Subsequently, the Chief Controlling
Officer has to remit back the savings of the Grant to the Finance Department.
Scrutiny of the last three years’ detailed appropriation accounts revealed
injudicious surrender in revenue and capital section separately, as detailed in
Table 2.16.
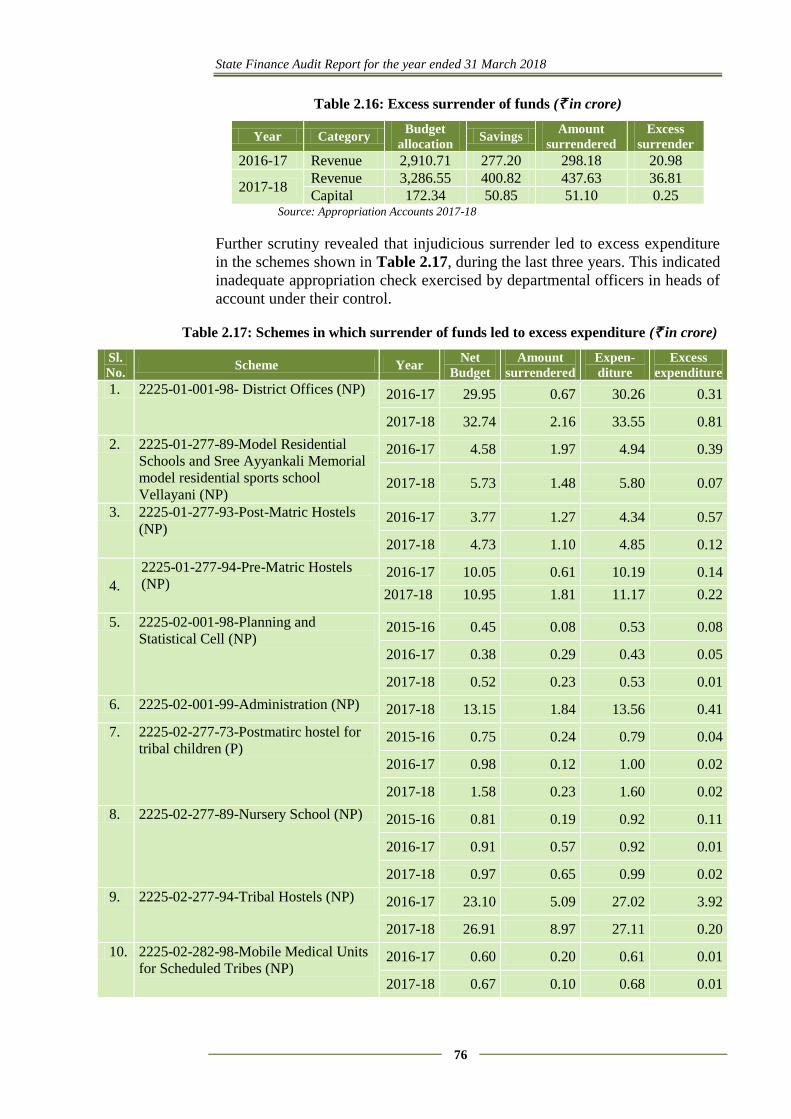
State Finance Audit Report for the year ended 31 March 2018
76
Table 2.16: Excess surrender of funds (` in crore)
Year Category Budget
allocation Savings
Amount
surrendered
Excess
surrender
2016-17 Revenue 2,910.71 277.20 298.18 20.98
2017-18 Revenue 3,286.55 400.82 437.63 36.81
Capital 172.34 50.85 51.10 0.25 Source: Appropriation Accounts 2017-18
Further scrutiny revealed that injudicious surrender led to excess expenditure
in the schemes shown in Table 2.17, during the last three years. This indicated
inadequate appropriation check exercised by departmental officers in heads of
account under their control.
Table 2.17: Schemes in which surrender of funds led to excess expenditure (` in crore)
Sl.
No. Scheme Year
Net
Budget
Amount
surrendered
Expen-
diture
Excess
expenditure
1. 2225-01-001-98- District Offices (NP) 2016-17 29.95 0.67 30.26 0.31
2017-18 32.74 2.16 33.55 0.81
2. 2225-01-277-89-Model Residential
Schools and Sree Ayyankali Memorial
model residential sports school
Vellayani (NP)
2016-17 4.58 1.97 4.94 0.39
2017-18 5.73 1.48 5.80 0.07
3. 2225-01-277-93-Post-Matric Hostels
(NP) 2016-17 3.77 1.27 4.34 0.57
2017-18 4.73 1.10 4.85 0.12
4.
2225-01-277-94-Pre-Matric Hostels
(NP) 2016-17 10.05 0.61 10.19 0.14
2017-18 10.95 1.81 11.17 0.22
5. 2225-02-001-98-Planning and
Statistical Cell (NP) 2015-16 0.45 0.08 0.53 0.08
2016-17 0.38 0.29 0.43 0.05
2017-18 0.52 0.23 0.53 0.01
6. 2225-02-001-99-Administration (NP) 2017-18 13.15 1.84 13.56 0.41
7. 2225-02-277-73-Postmatirc hostel for
tribal children (P) 2015-16 0.75 0.24 0.79 0.04
2016-17 0.98 0.12 1.00 0.02
2017-18 1.58 0.23 1.60 0.02
8. 2225-02-277-89-Nursery School (NP) 2015-16 0.81 0.19 0.92 0.11
2016-17 0.91 0.57 0.92 0.01
2017-18 0.97 0.65 0.99 0.02
9. 2225-02-277-94-Tribal Hostels (NP) 2016-17 23.10 5.09 27.02 3.92
2017-18 26.91 8.97 27.11 0.20
10. 2225-02-282-98-Mobile Medical Units
for Scheduled Tribes (NP) 2016-17 0.60 0.20 0.61 0.01
2017-18 0.67 0.10 0.68 0.01
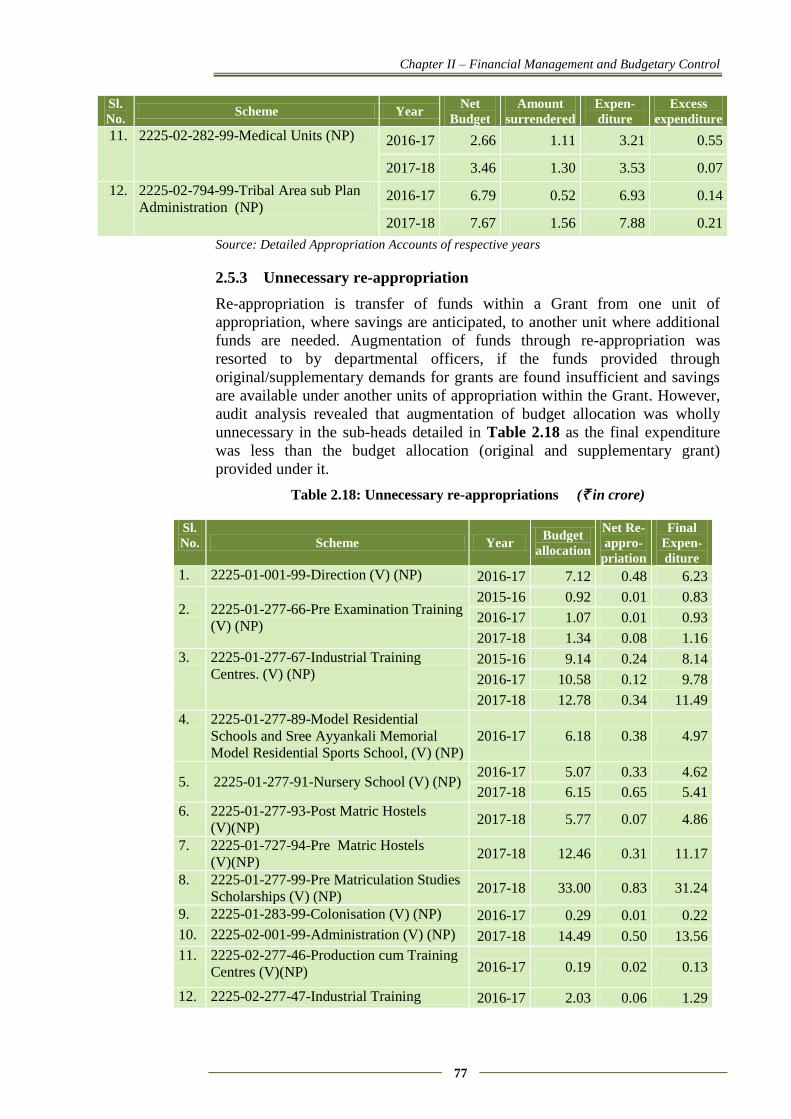
Chapter II – Financial Management and Budgetary Control
77
Sl.
No. Scheme Year
Net
Budget
Amount
surrendered
Expen-
diture
Excess
expenditure
11. 2225-02-282-99-Medical Units (NP) 2016-17 2.66 1.11 3.21 0.55
2017-18 3.46 1.30 3.53 0.07
12. 2225-02-794-99-Tribal Area sub Plan
Administration (NP) 2016-17 6.79 0.52 6.93 0.14
2017-18 7.67 1.56 7.88 0.21
Source: Detailed Appropriation Accounts of respective years
2.5.3 Unnecessary re-appropriation
Re-appropriation is transfer of funds within a Grant from one unit of
appropriation, where savings are anticipated, to another unit where additional
funds are needed. Augmentation of funds through re-appropriation was
resorted to by departmental officers, if the funds provided through
original/supplementary demands for grants are found insufficient and savings
are available under another units of appropriation within the Grant. However,
audit analysis revealed that augmentation of budget allocation was wholly
unnecessary in the sub-heads detailed in Table 2.18 as the final expenditure
was less than the budget allocation (original and supplementary grant)
provided under it.
Table 2.18: Unnecessary re-appropriations (` in crore)
Sl.
No. Scheme Year Budget
allocation
Net Re-
appro-
priation
Final
Expen-
diture
1. 2225-01-001-99-Direction (V) (NP) 2016-17 7.12 0.48 6.23
2.
2225-01-277-66-Pre Examination Training
(V) (NP)
2015-16 0.92 0.01 0.83
2016-17 1.07 0.01 0.93
2017-18 1.34 0.08 1.16
3.
2225-01-277-67-Industrial Training
Centres. (V) (NP) 2015-16 9.14 0.24 8.14
2016-17 10.58 0.12 9.78
2017-18 12.78 0.34 11.49
4. 2225-01-277-89-Model Residential
Schools and Sree Ayyankali Memorial
Model Residential Sports School, (V) (NP)
2016-17 6.18 0.38 4.97
5. 2225-01-277-91-Nursery School (V) (NP) 2016-17 5.07 0.33 4.62
2017-18 6.15 0.65 5.41
6. 2225-01-277-93-Post Matric Hostels
(V)(NP) 2017-18 5.77 0.07 4.86
7. 2225-01-727-94-Pre Matric Hostels
(V)(NP) 2017-18 12.46 0.31 11.17
8. 2225-01-277-99-Pre Matriculation Studies
Scholarships (V) (NP) 2017-18 33.00 0.83 31.24
9. 2225-01-283-99-Colonisation (V) (NP) 2016-17 0.29 0.01 0.22
10. 2225-02-001-99-Administration (V) (NP) 2017-18 14.49 0.50 13.56
11. 2225-02-277-46-Production cum Training
Centres (V)(NP) 2016-17 0.19 0.02 0.13
12. 2225-02-277-47-Industrial Training 2016-17 2.03 0.06 1.29
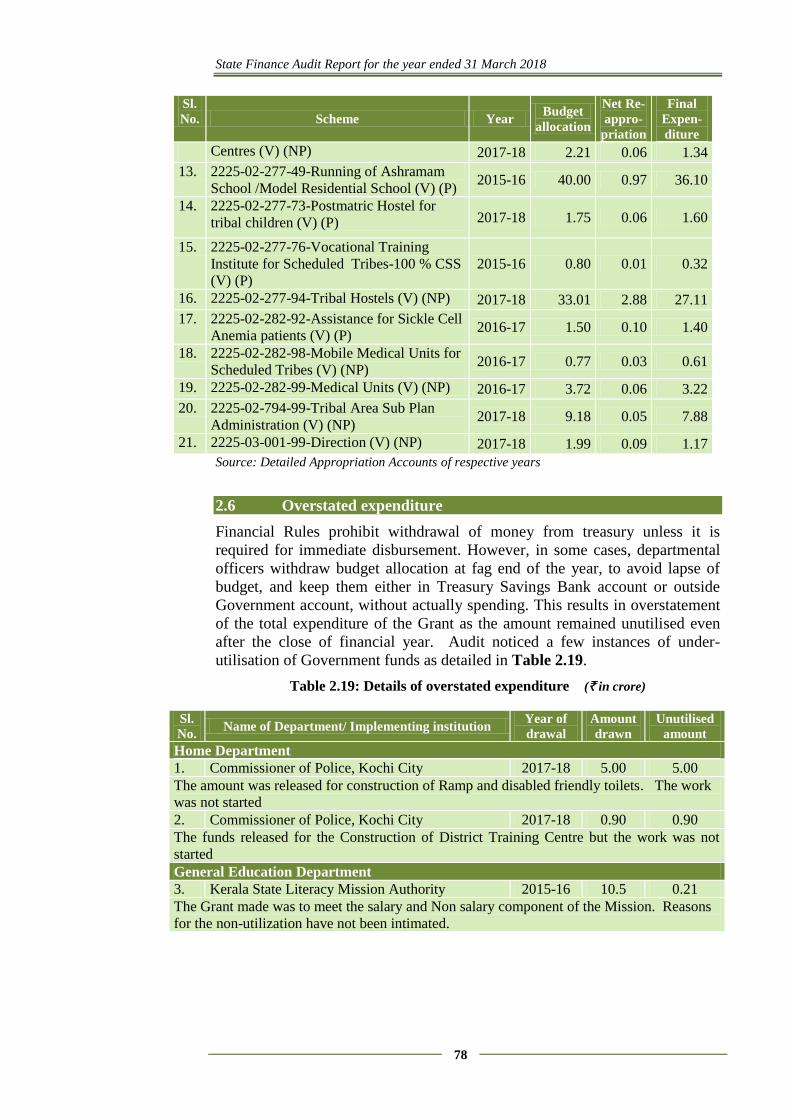
State Finance Audit Report for the year ended 31 March 2018
78
Sl.
No. Scheme Year Budget
allocation
Net Re-
appro-
priation
Final
Expen-
diture
Centres (V) (NP) 2017-18 2.21 0.06 1.34
13. 2225-02-277-49-Running of Ashramam
School /Model Residential School (V) (P) 2015-16 40.00 0.97 36.10
14. 2225-02-277-73-Postmatric Hostel for
tribal children (V) (P) 2017-18 1.75 0.06 1.60
15. 2225-02-277-76-Vocational Training
Institute for Scheduled Tribes-100 % CSS
(V) (P)
2015-16 0.80 0.01 0.32
16. 2225-02-277-94-Tribal Hostels (V) (NP) 2017-18 33.01 2.88 27.11
17. 2225-02-282-92-Assistance for Sickle Cell
Anemia patients (V) (P) 2016-17 1.50 0.10 1.40
18. 2225-02-282-98-Mobile Medical Units for
Scheduled Tribes (V) (NP) 2016-17 0.77 0.03 0.61
19. 2225-02-282-99-Medical Units (V) (NP) 2016-17 3.72 0.06 3.22
20. 2225-02-794-99-Tribal Area Sub Plan
Administration (V) (NP) 2017-18 9.18 0.05 7.88
21. 2225-03-001-99-Direction (V) (NP) 2017-18 1.99 0.09 1.17
Source: Detailed Appropriation Accounts of respective years
2.6 Overstated expenditure
Financial Rules prohibit withdrawal of money from treasury unless it is
required for immediate disbursement. However, in some cases, departmental
officers withdraw budget allocation at fag end of the year, to avoid lapse of
budget, and keep them either in Treasury Savings Bank account or outside
Government account, without actually spending. This results in overstatement
of the total expenditure of the Grant as the amount remained unutilised even
after the close of financial year. Audit noticed a few instances of under-
utilisation of Government funds as detailed in Table 2.19.
Table 2.19: Details of overstated expenditure (` in crore)
Sl.
No. Name of Department/ Implementing institution
Year of
drawal
Amount
drawn
Unutilised
amount
Home Department
1. Commissioner of Police, Kochi City 2017-18 5.00 5.00
The amount was released for construction of Ramp and disabled friendly toilets. The work
was not started
2. Commissioner of Police, Kochi City 2017-18 0.90 0.90
The funds released for the Construction of District Training Centre but the work was not
started
General Education Department
3. Kerala State Literacy Mission Authority 2015-16 10.5 0.21
The Grant made was to meet the salary and Non salary component of the Mission. Reasons
for the non-utilization have not been intimated.
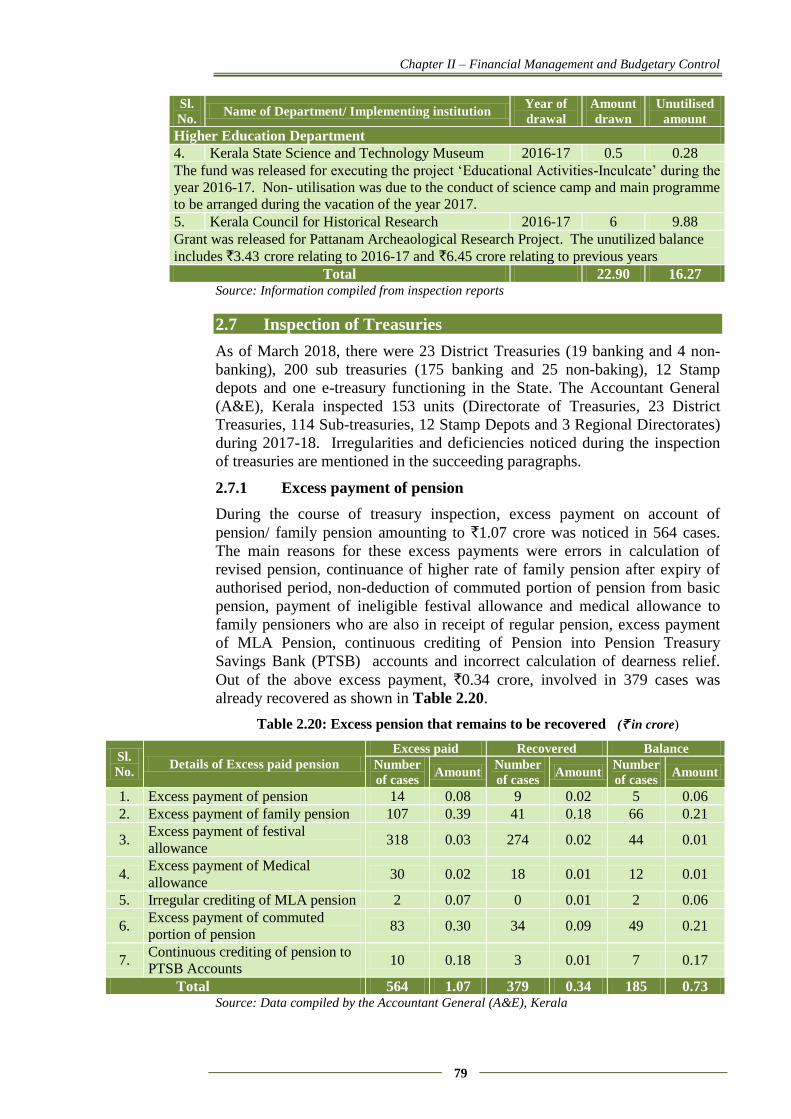
Chapter II – Financial Management and Budgetary Control
79
Sl.
No. Name of Department/ Implementing institution
Year of
drawal
Amount
drawn
Unutilised
amount
Higher Education Department
4. Kerala State Science and Technology Museum 2016-17 0.5 0.28
The fund was released for executing the project ‘Educational Activities-Inculcate’ during the
year 2016-17. Non- utilisation was due to the conduct of science camp and main programme
to be arranged during the vacation of the year 2017.
5. Kerala Council for Historical Research 2016-17 6 9.88
Grant was released for Pattanam Archeaological Research Project. The unutilized balance
includes `3.43 crore relating to 2016-17 and `6.45 crore relating to previous years Total 22.90 16.27
Source: Information compiled from inspection reports
2.7 Inspection of Treasuries
As of March 2018, there were 23 District Treasuries (19 banking and 4 non-
banking), 200 sub treasuries (175 banking and 25 non-baking), 12 Stamp
depots and one e-treasury functioning in the State. The Accountant General
(A&E), Kerala inspected 153 units (Directorate of Treasuries, 23 District
Treasuries, 114 Sub-treasuries, 12 Stamp Depots and 3 Regional Directorates)
during 2017-18. Irregularities and deficiencies noticed during the inspection
of treasuries are mentioned in the succeeding paragraphs.
2.7.1 Excess payment of pension
During the course of treasury inspection, excess payment on account of
pension/ family pension amounting to `1.07 crore was noticed in 564 cases.
The main reasons for these excess payments were errors in calculation of
revised pension, continuance of higher rate of family pension after expiry of
authorised period, non-deduction of commuted portion of pension from basic
pension, payment of ineligible festival allowance and medical allowance to
family pensioners who are also in receipt of regular pension, excess payment
of MLA Pension, continuous crediting of Pension into Pension Treasury
Savings Bank (PTSB) accounts and incorrect calculation of dearness relief.
Out of the above excess payment, `0.34 crore, involved in 379 cases was
already recovered as shown in Table 2.20.
Table 2.20: Excess pension that remains to be recovered (` in crore)
Sl.
No. Details of Excess paid pension
Excess paid Recovered Balance
Number
of cases Amount
Number
of cases Amount
Number
of cases Amount
1. Excess payment of pension 14 0.08 9 0.02 5 0.06
2. Excess payment of family pension 107 0.39 41 0.18 66 0.21
3. Excess payment of festival
allowance 318 0.03 274 0.02 44 0.01
4. Excess payment of Medical
allowance 30 0.02 18 0.01 12 0.01
5. Irregular crediting of MLA pension 2 0.07 0 0.01 2 0.06
6. Excess payment of commuted
portion of pension 83 0.30 34 0.09 49 0.21
7. Continuous crediting of pension to
PTSB Accounts 10 0.18 3 0.01 7 0.17
Total 564 1.07 379 0.34 185 0.73 Source: Data compiled by the Accountant General (A&E), Kerala
State Finance Audit Report for the year ended 31 March 2018
80
Government replied (April 2019) that excess payment of pension in 121 cases
have since been settled and action is being taken to effect recovery in respect
of the remaining cases.
The reply is not tenable, as it has been confirmed from A&E office that since
the details of recovery are not furnished the para in the treasury inspection
report has been outstanding.
2.7.2 Retention of excess cash balance
According to Rule 309 of Kerala Treasury Code Volume I, every year in
January, Government fixes the maximum cash balance for each District
Treasury for the next financial year. The District Treasury Officer in turn fixes
the cash balance for each Sub Treasury in the district. The actual cash balance
in treasury should ordinarily be kept much below the normal maximum
balance fixed for a treasury so that Government’s credit balance in the Reserve
Bank of India may be as large as possible. Moreover, excess retention of cash
balance in treasuries may cause loss of revenue to the State by way of loss of
interest on investment, payment of interest on ways and means advances, etc.
Excess retention of cash balance was noticed in 125 treasuries/sub treasuries
on 1251 occasions during the financial year.
Government replied (April 2019) 959 cases have since been settled and strict
instructions had been issued to the Treasury officers to retain cash balance
within the prescribed limit.
2.7.3 Pending adjustment of advances drawn by Drawing and
Disbursing Officers
During the audit of Treasury Information System, Accountant General (A&E)
observed that 311 Drawing and Disbursing Officers drew an amount of `95.33
crore, of which an amount of `30.92 crore drawn by 172 Drawing and
Disbursing Officers, during the period from October 2011 to December 2016,
was pending for final settlement (November 2018). Details are given in
Appendix 2.19. Non-settlement of advances distorts the correctness of
expenditure booked in Government accounts.
2.7.4 Un-operated Savings Bank Accounts
Rule 28 and 40 of Treasury Savings Bank Rules stipulate that Savings Bank
accounts in respect of which no transactions have taken place for five
complete financial years and more has to be treated as un-operated accounts.
The balance in such accounts is to be transferred to Revenue Deposit in
Government accounts. However, inspection of treasuries by Accountant
General (A&E) revealed that 1825 un-operated savings bank account with a
balance of `2.58 crore were retained in 106 treasuries during 2017-18 without
transferring the same to Revenue Deposit head.
Government replied (April 2019) that 1364 accounts have since been closed.
2.8 Conclusion and Recommendations
Compared to previous year, overall savings from the budget allocation
decreased by 7.60 per cent (from 15.49 per cent in 2016-17 to 7.89 per
cent in 2017-18) which showed an improvement in budgetary process.
Chapter II – Financial Management and Budgetary Control
81
Persistent savings exceeding `100 crore during the last three years
were noticed in eight grants under Revenue section and five grants and
one appropriation under Capital section.
Surrender of budget allocations obtained through supplementary
demands for grants at the end of the year showed laxity on the part of
Departmental Officers in assessing actual requirement of funds.
Unnecessary and injudicious re-appropriations indicated that
departmental officers failed in assessing actual requirement of funds in
heads of account under their control.
Surrender of money in excess of actual savings indicated improper
maintenance of appropriation control registers at all levels.
Persistence of excess payment of pension showed that treasury officers
are not plugging the loopholes in the system.
Government may review grants showing persistent savings to assess the
reasons for savings and control the same.
Necessary checks should be put in place to avoid withdrawal of funds in
excess of budget allocation by departmental officers.

CHAPTER III
FINANCIAL REPORTING

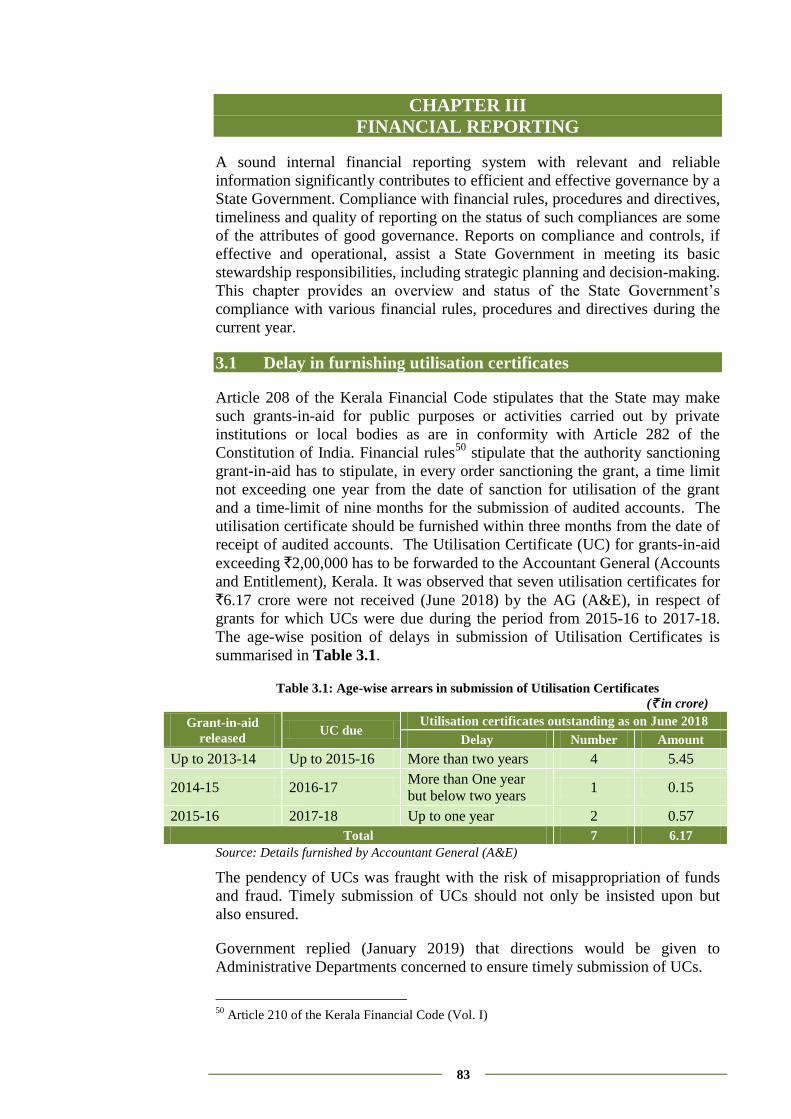
83
CHAPTER III
FINANCIAL REPORTING
A sound internal financial reporting system with relevant and reliable
information significantly contributes to efficient and effective governance by a
State Government. Compliance with financial rules, procedures and directives,
timeliness and quality of reporting on the status of such compliances are some
of the attributes of good governance. Reports on compliance and controls, if
effective and operational, assist a State Government in meeting its basic
stewardship responsibilities, including strategic planning and decision-making.
This chapter provides an overview and status of the State Government’s
compliance with various financial rules, procedures and directives during the
current year.
3.1 Delay in furnishing utilisation certificates
Article 208 of the Kerala Financial Code stipulates that the State may make
such grants-in-aid for public purposes or activities carried out by private
institutions or local bodies as are in conformity with Article 282 of the
Constitution of India. Financial rules50
stipulate that the authority sanctioning
grant-in-aid has to stipulate, in every order sanctioning the grant, a time limit
not exceeding one year from the date of sanction for utilisation of the grant
and a time-limit of nine months for the submission of audited accounts. The
utilisation certificate should be furnished within three months from the date of
receipt of audited accounts. The Utilisation Certificate (UC) for grants-in-aid
exceeding `2,00,000 has to be forwarded to the Accountant General (Accounts
and Entitlement), Kerala. It was observed that seven utilisation certificates for
`6.17 crore were not received (June 2018) by the AG (A&E), in respect of
grants for which UCs were due during the period from 2015-16 to 2017-18.
The age-wise position of delays in submission of Utilisation Certificates is
summarised in Table 3.1.
Table 3.1: Age-wise arrears in submission of Utilisation Certificates
(` in crore)
Grant-in-aid
released UC due
Utilisation certificates outstanding as on June 2018
Delay Number Amount
Up to 2013-14 Up to 2015-16 More than two years 4 5.45
2014-15 2016-17 More than One year
but below two years 1 0.15
2015-16 2017-18 Up to one year 2 0.57
Total 7 6.17
Source: Details furnished by Accountant General (A&E)
The pendency of UCs was fraught with the risk of misappropriation of funds
and fraud. Timely submission of UCs should not only be insisted upon but
also ensured.
Government replied (January 2019) that directions would be given to
Administrative Departments concerned to ensure timely submission of UCs.
50
Article 210 of the Kerala Financial Code (Vol. I)
State Finance Audit Report for the year ended 31 March 2018
84
3.2 Non-submission/delay in submission of Accounts
In order to identify the institutions, which attract audit under Sections 14 and
15 of the Comptroller and Auditor General’s (Duties, Powers and Conditions
of Service) Act, 1971, the Government/Heads of Department are required to
furnish detailed information about the financial assistance provided to various
institutions, the purpose of assistance granted and the total expenditure of the
institutions to Audit every year.
As of March 2018, the annual accounts of 17 autonomous bodies/authorities
due up to 2016-17 were not furnished to the Accountant General (Economic
and Revenue Sector Audit), Kerala as detailed in Appendix 3.1.
3.3 Delay in submission of accounts/Audit Reports of
Autonomous Bodies
The audit of accounts of 26 Autonomous Bodies in the field of legal aid,
human rights, development of khadi, etc., in the State was entrusted to the
Comptroller and Auditor General of India under Sections 19(2), 19(3) and 20
(1) of the Comptroller and Auditor General’s (Duties, Powers and Conditions
of Service) Act, 1971. The status of entrustment of audit, rendering of
accounts to audit, issuance of Separate Audit Reports (SAR) and their
placement in the Legislature are indicated in Appendix 3.2.
Audit observed that accounts of District Legal Services Authorities,
Ernakulam and Kasaragod were due for five years (from 2012-13) and that of
District Legal Service Authority, Wayanad was due for four years (from 2013-
14). Apart from above, accounts of five51
and four52
autonomous bodies were
due from 2014-15 and 2015-16 respectively.
3.4 Departmentally managed Commercial Undertakings
The departmental undertakings of certain Government departments
performing activities of quasi-commercial nature are required to prepare pro
forma accounts annually in the prescribed format, showing the working results
of their financial operations so that the Government can assess the overall
financial strength and efficiency of these departments in conducting their
business. Non-finalisation of accounts in time prevents the above scrutiny and
also puts the investment of the Government outside the scrutiny of Audit.
Heads of Department in the Government are also required to ensure that the
undertakings prepare such accounts and submit to the Accountants General
(General and Social Sector Audit/Economic and Revenue Sector Audit),
Kerala within the specified timeframe.
The department-wise position of arrears in preparation of pro forma accounts
51
Command Area Development Authority, Thrissur; District Legal Services Authority,
Kollam; District Legal Services Authority, Pathanamthitta; Permanent Lok Adalath,
Ernakulam and Kerala Water Authority. 52
Kerala Khadi and Village Industries Board, Thiruvananthapuram; District Legal Services
Authority, Kozhikode; District Legal Services Authority, Kannur and Permanent Lok
Adalath, Kozhikode.
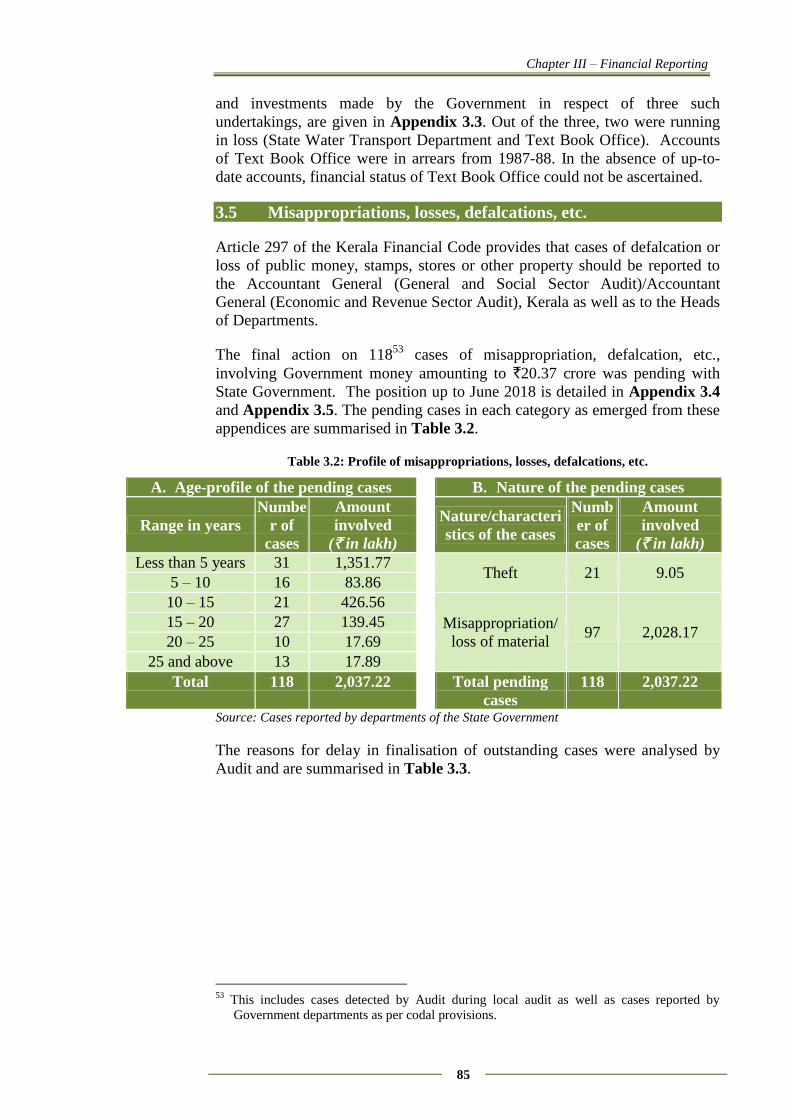
Chapter III – Financial Reporting
85
and investments made by the Government in respect of three such
undertakings, are given in Appendix 3.3. Out of the three, two were running
in loss (State Water Transport Department and Text Book Office). Accounts
of Text Book Office were in arrears from 1987-88. In the absence of up-to-
date accounts, financial status of Text Book Office could not be ascertained.
3.5 Misappropriations, losses, defalcations, etc.
Article 297 of the Kerala Financial Code provides that cases of defalcation or
loss of public money, stamps, stores or other property should be reported to
the Accountant General (General and Social Sector Audit)/Accountant
General (Economic and Revenue Sector Audit), Kerala as well as to the Heads
of Departments.
The final action on 11853
cases of misappropriation, defalcation, etc.,
involving Government money amounting to `20.37 crore was pending with
State Government. The position up to June 2018 is detailed in Appendix 3.4
and Appendix 3.5. The pending cases in each category as emerged from these
appendices are summarised in Table 3.2.
Table 3.2: Profile of misappropriations, losses, defalcations, etc.
A. Age-profile of the pending cases B. Nature of the pending cases
Range in years
Numbe
r of
cases
Amount
involved
(` in lakh)
Nature/characteri
stics of the cases
Numb
er of
cases
Amount
involved
(` in lakh)
Less than 5 years 31 1,351.77 Theft 21 9.05
5 – 10 16 83.86
10 – 15 21 426.56
Misappropriation/
loss of material 97 2,028.17
15 – 20 27 139.45
20 – 25 10 17.69
25 and above 13 17.89
Total 118 2,037.22 Total pending
cases
118 2,037.22
Source: Cases reported by departments of the State Government
The reasons for delay in finalisation of outstanding cases were analysed by
Audit and are summarised in Table 3.3.
53
This includes cases detected by Audit during local audit as well as cases reported by
Government departments as per codal provisions.
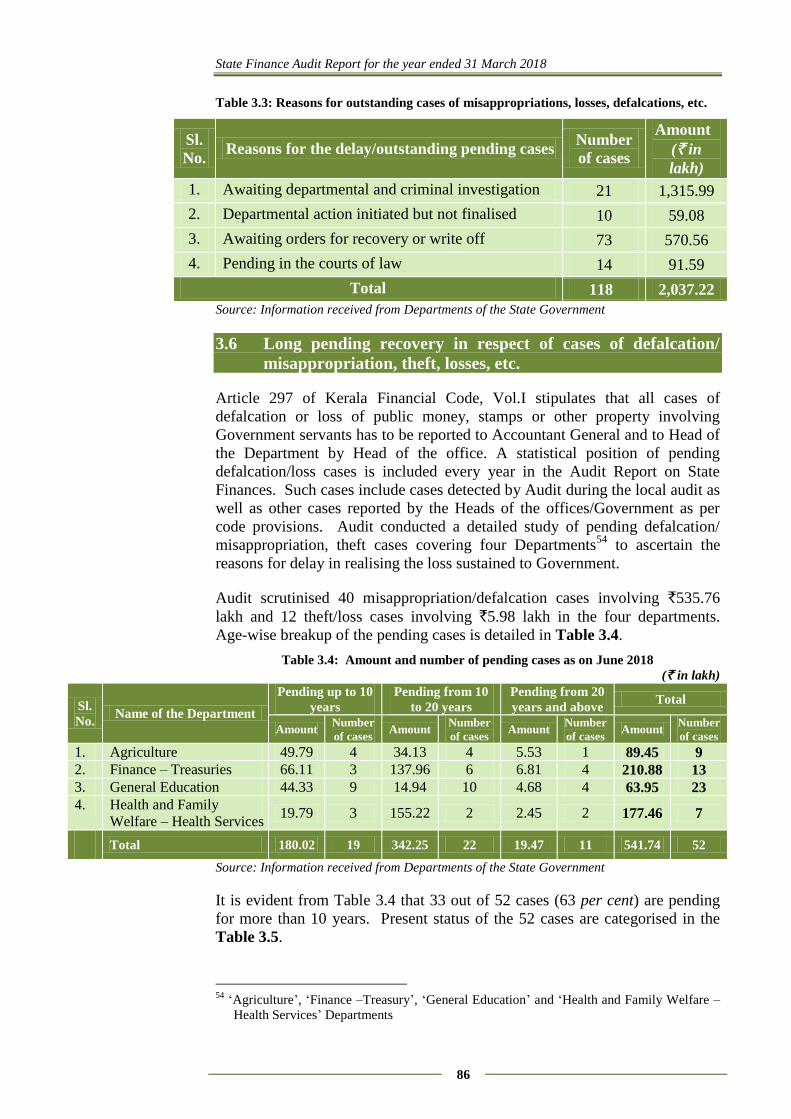
State Finance Audit Report for the year ended 31 March 2018
86
Table 3.3: Reasons for outstanding cases of misappropriations, losses, defalcations, etc.
Sl.
No. Reasons for the delay/outstanding pending cases
Number
of cases
Amount
(` in
lakh)
1. Awaiting departmental and criminal investigation 21 1,315.99
2. Departmental action initiated but not finalised 10 59.08
3. Awaiting orders for recovery or write off 73 570.56
4. Pending in the courts of law 14 91.59
Total 118 2,037.22
Source: Information received from Departments of the State Government
3.6 Long pending recovery in respect of cases of defalcation/
misappropriation, theft, losses, etc.
Article 297 of Kerala Financial Code, Vol.I stipulates that all cases of
defalcation or loss of public money, stamps or other property involving
Government servants has to be reported to Accountant General and to Head of
the Department by Head of the office. A statistical position of pending
defalcation/loss cases is included every year in the Audit Report on State
Finances. Such cases include cases detected by Audit during the local audit as
well as other cases reported by the Heads of the offices/Government as per
code provisions. Audit conducted a detailed study of pending defalcation/
misappropriation, theft cases covering four Departments54
to ascertain the
reasons for delay in realising the loss sustained to Government.
Audit scrutinised 40 misappropriation/defalcation cases involving `535.76
lakh and 12 theft/loss cases involving `5.98 lakh in the four departments.
Age-wise breakup of the pending cases is detailed in Table 3.4.
Table 3.4: Amount and number of pending cases as on June 2018
(` in lakh)
Sl.
No. Name of the Department
Pending up to 10
years
Pending from 10
to 20 years
Pending from 20
years and above Total
Amount Number
of cases Amount
Number
of cases Amount
Number
of cases Amount
Number
of cases
1. Agriculture 49.79 4 34.13 4 5.53 1 89.45 9
2. Finance – Treasuries 66.11 3 137.96 6 6.81 4 210.88 13
3. General Education 44.33 9 14.94 10 4.68 4 63.95 23
4. Health and Family
Welfare – Health Services 19.79 3 155.22 2 2.45 2 177.46 7
Total 180.02 19 342.25 22 19.47 11 541.74 52
Source: Information received from Departments of the State Government
It is evident from Table 3.4 that 33 out of 52 cases (63 per cent) are pending
for more than 10 years. Present status of the 52 cases are categorised in the
Table 3.5.
54
‘Agriculture’, ‘Finance –Treasury’, ‘General Education’ and ‘Health and Family Welfare –
Health Services’ Departments
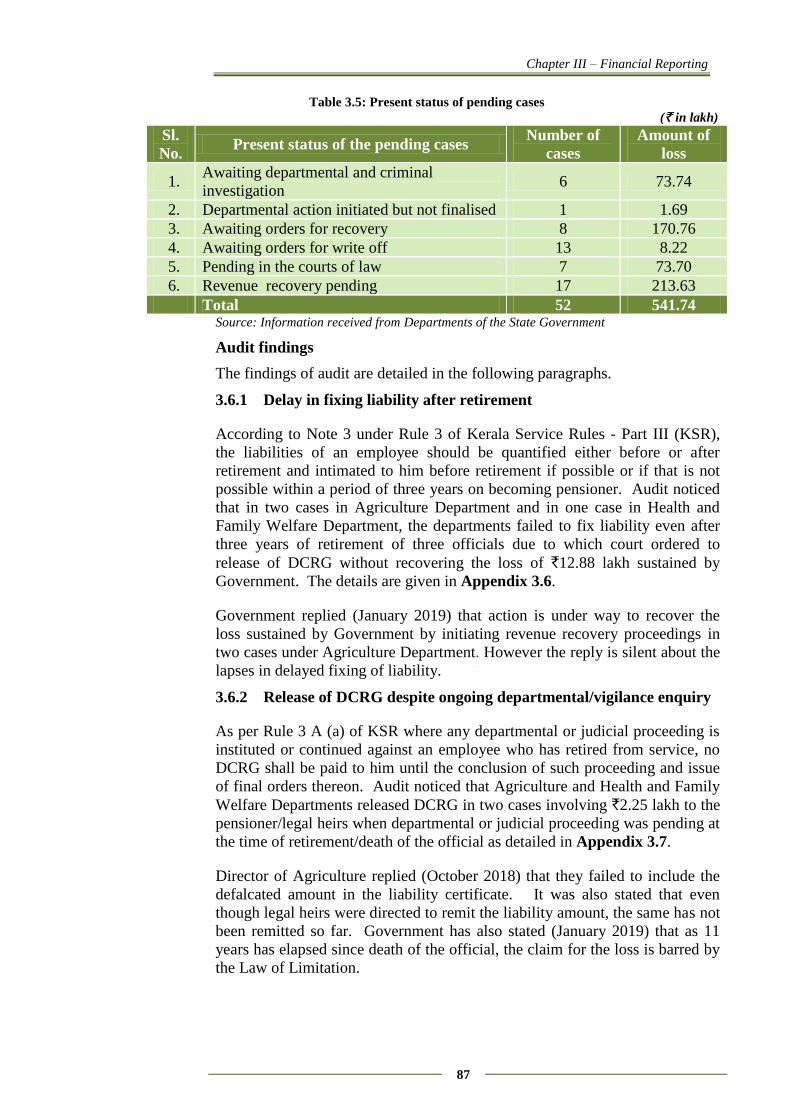
Chapter III – Financial Reporting
87
Table 3.5: Present status of pending cases
(` in lakh)
Sl.
No. Present status of the pending cases
Number of
cases
Amount of
loss
1. Awaiting departmental and criminal
investigation 6 73.74
2. Departmental action initiated but not finalised 1 1.69
3. Awaiting orders for recovery 8 170.76
4. Awaiting orders for write off 13 8.22
5. Pending in the courts of law 7 73.70
6. Revenue recovery pending 17 213.63
Total 52 541.74 Source: Information received from Departments of the State Government
Audit findings
The findings of audit are detailed in the following paragraphs.
3.6.1 Delay in fixing liability after retirement
According to Note 3 under Rule 3 of Kerala Service Rules - Part III (KSR),
the liabilities of an employee should be quantified either before or after
retirement and intimated to him before retirement if possible or if that is not
possible within a period of three years on becoming pensioner. Audit noticed
that in two cases in Agriculture Department and in one case in Health and
Family Welfare Department, the departments failed to fix liability even after
three years of retirement of three officials due to which court ordered to
release of DCRG without recovering the loss of `12.88 lakh sustained by
Government. The details are given in Appendix 3.6.
Government replied (January 2019) that action is under way to recover the
loss sustained by Government by initiating revenue recovery proceedings in
two cases under Agriculture Department. However the reply is silent about the
lapses in delayed fixing of liability.
3.6.2 Release of DCRG despite ongoing departmental/vigilance enquiry
As per Rule 3 A (a) of KSR where any departmental or judicial proceeding is
instituted or continued against an employee who has retired from service, no
DCRG shall be paid to him until the conclusion of such proceeding and issue
of final orders thereon. Audit noticed that Agriculture and Health and Family
Welfare Departments released DCRG in two cases involving `2.25 lakh to the
pensioner/legal heirs when departmental or judicial proceeding was pending at
the time of retirement/death of the official as detailed in Appendix 3.7.
Director of Agriculture replied (October 2018) that they failed to include the
defalcated amount in the liability certificate. It was also stated that even
though legal heirs were directed to remit the liability amount, the same has not
been remitted so far. Government has also stated (January 2019) that as 11
years has elapsed since death of the official, the claim for the loss is barred by
the Law of Limitation.
State Finance Audit Report for the year ended 31 March 2018
88
Absence of proper internal control mechanism to identify whether any
departmental proceedings were going on against the official and to assess the
liability at the time of retirement, resulted in release of DCRG which led to
non-realisation of loss sustained by Government till date.
3.6.3 Delay in initiating departmental action
In two misappropriation cases amounting to `6.67 lakh, departmental action
was initiated by the Agriculture Department against the officials after they had
retired from service and had received their retirement benefits, even though
the misappropriation had come to the notice of the department well in advance
of their retirement as detailed in Appendix 3.8. The Department did not take
any action to realise the loss in one case involving `0.16 lakh. Action is being
taken to recover the loss through revenue recovery in other case amounting to
`6.51 lakh.
Government replied (January 2019) that action is being taken to file civil suit
against the officials for the recovery of loss sustained by the Government.
3.6.4 Failure to effect recovery
3.6.4.1 Cases cleared by court
Agriculture, General Education and Health and Family Welfare Departments
did not take any action to recover the loss amounting to `159.57 lakh
sustained by Government in four cases even after disposal of these cases by
court. The details are given in Appendix 3.9. Government replied (January
2019) that the loss will be recovered from the DCRG of the official in one
case under Agriculture Department. Replies are awaited (February 2019)
from departments concerned.
3.6.4.2 Liability fixed based on investigation
In four misappropriation cases involving `33.95 lakh, Agriculture and General
Education Departments failed to recover the loss even though liabilities were
fixed against the officials as shown in Appendix 3.10. Details are shown
below:
In General Education Department, one case involving `5.10 lakh was
pending due to non-receipt of directions from Administrative Department
to effect recovery, though the liability was fixed in September 2010
against the official. In another case in General Education Department
involving `5.25 lakh, even though Government directed (July 2012) to
recover the loss from the official with 8 per cent interest, Department is
yet to effect recovery.
On this being pointed out by Audit, General Education Department replied
(December 2018) that direction has since been issued to DPI in November
2018 to effect recovery in the misappropriation case involving `5.10 lakh.
In the other case involving `5.25 lakh, Director of Public Instruction (DPI)
replied (August 2018) that as the official had not applied for pension,
recovery could not be effected. The reply is not acceptable as Department
failed to initiate further action to recover the loss.
Chapter III – Financial Reporting
89
Audit also noticed that in the Agriculture Department, the Director of
Agriculture fixed liability in two cases involving `4.94 lakh and `18.66
lakh in October 2012 and April 2015 respectively. Though the Director of
Agriculture had directed (April 2013 and May 2015) the respective
Principal Agricultural Officers to recover the loss through revenue
recovery, the recovery has not been effected till date (November 2018).
Government replied (January 2019) that action is being taken to recover
the loss sustained by the Government.
3.6.5 Irregular granting of pensionary benefits in respect of deceased
persons
As per Rule 3 A (a) of KSR where any departmental or judicial proceeding is
instituted or continued against an employee who has retired from service, no
DCRG shall be paid to him until the conclusion of such proceeding and issue
of final orders thereon. Audit observed that in two cases DCRG has been
released to legal heirs of deceased persons, against whom vigilance
enquiry/court case was pending at the time of death in violation of above rules
as shown below. The details are shown in Appendix 3.11.
In one case under Health and Family Welfare Department involving `4.67
lakh, Government instructed (January 2011) the Department to recover the
loss from the official concerned. However, the Department failed to effect
recovery before his death on 14.07.2012. Even though vigilance enquiry
was going on against the deceased official, Government directed (August
2016) to release the DCRG to the legal heirs on the ground that four years
has elapsed since the death of the official and ordered to recover the loss
through revenue recovery. The Director of Health Services informed
Government in June 2018 that action is underway to recover the loss
through revenue recovery.
In another case under Finance (Treasury) Department involving loss of
`9.65 lakh, the investigation of the case was completed and charge sheet
filed before the Chief Judicial Magistrate Court, Thiruvananthapuram in
May 2008. The official died on 28.2.2014. While the case was pending in
court, Government directed (March 2016) to release the DCRG to legal
heirs without recovering the loss sustained by Government. The loss
sustained to Government has not been realised till date.
The decision of the Government to release the DCRG to the legal heirs of
deceased persons was irregular. Reply from Government is awaited (February
2019).
3.6.6 Inordinate delay in completing enquiry
Audit noticed inordinate delays in vigilance/departmental enquiries, fixing of
liability by the department and disposal of the cases by the Court which
resulted in long pendency in settling the cases of misappropriation/loss of
Government money as detailed below.
In four misappropriation cases pertaining to the Agriculture Department, it
took four to seven years to complete vigilance/departmental enquiry. In
State Finance Audit Report for the year ended 31 March 2018
90
these four cases, department took another two to 13 years in fixing liability
against the officials concerned after completion of enquiry. Two cases
were disposed by the Court in another three to six years.
In the Treasury Department, it took four to 13 years to complete
vigilance/departmental enquiry in seven cases. Four out of these seven
cases were disposed by the Court in another six to 18 years.
In three cases under the General Education Department, it took three to
seven years to complete vigilance/departmental enquiry. These cases were
cleared by the Court in another 8 to 11 years.
In three cases under the Health and Family Welfare Department, it took
four to six years to complete vigilance/departmental enquiry. Court
disposed these cases in another two to 16 years.
The details are given in Appendix 3.12.
3.6.7 Inordinate delay in settling irrecoverable losses
As per Government orders (March 2013), the Administrative Departments can
write off amounts up to `50,000 per each case with annual limit of `10 lakh
without previous consultation with Finance Department and Heads of the
Departments can write off up to `25,000 in each case with an annual limit of
`1 lakh subject to strict compliance with Article 300 to 303 of KFC. It is seen
that in five instances under General Education Department, write off proposals
of irrecoverable losses amounting to `3.81 lakh were pending with
Administrative Department/Head of the Department from 5 to 19 years as
shown in Appendix 3.13.
3.6.8 Cases not reported to the Accountant General
As per Art 297 KFC Vol.I cases of misappropriation/defalcation losses are to
be reported to the Accountant General as well as Head of department
immediately after notice. However, Agriculture, General Education and
Treasury Departments did not report five cases involving loss of `53.06 lakh
to Accountant General as shown in Appendix 3.14. Directorate of Treasuries
and Director of Public Instructions replied (January 2019) that the
misappropriation cases would be reported to Accountant General on time in
future. Reply is awaited (February 2019) from Agriculture Department.
3.7 Conclusion and Recommendations
The Audit of Accounts of Autonomous Bodies, which was entrusted to the
Comptroller and Auditor General of India under Sections 19 (2), 19 (3) and 20
(1) of the Comptroller and Auditor General’s (Duties, Powers and Conditions
of Service) Act, 1971, were pending in respect of 19 bodies due to delay in
submission of accounts.
There were delays in departmental action at every stage of a case such as
initiating departmental action, fixing liability, issuing orders of recovery, etc.
Proper internal control mechanism was absent in Departments to identify
whether any departmental proceedings were going on against the official and
to assess the liability at the time of retirement. It is evident that a time bound
Chapter III – Financial Reporting
91
system was not in place at departmental level for settlement of cases of
misappropriation/ defalcation, theft and loss of public money.
Government may ensure that there is no delay in completing departmental
action in order to realise the loss either from the salary or from the
pensionary benefits of the officials concerned.
Government may take timely action to write off irrecoverable losses which
were long pending.
(S. SUNIL RAJ) Thiruvananthapuram, Accountant General
The 11 October 2019 (General and Social Sector Audit), Kerala
Countersigned
New Delhi, (RAJIV MEHRISHI)
The 24 October 2019 Comptroller and Auditor General of India

APPENDICES

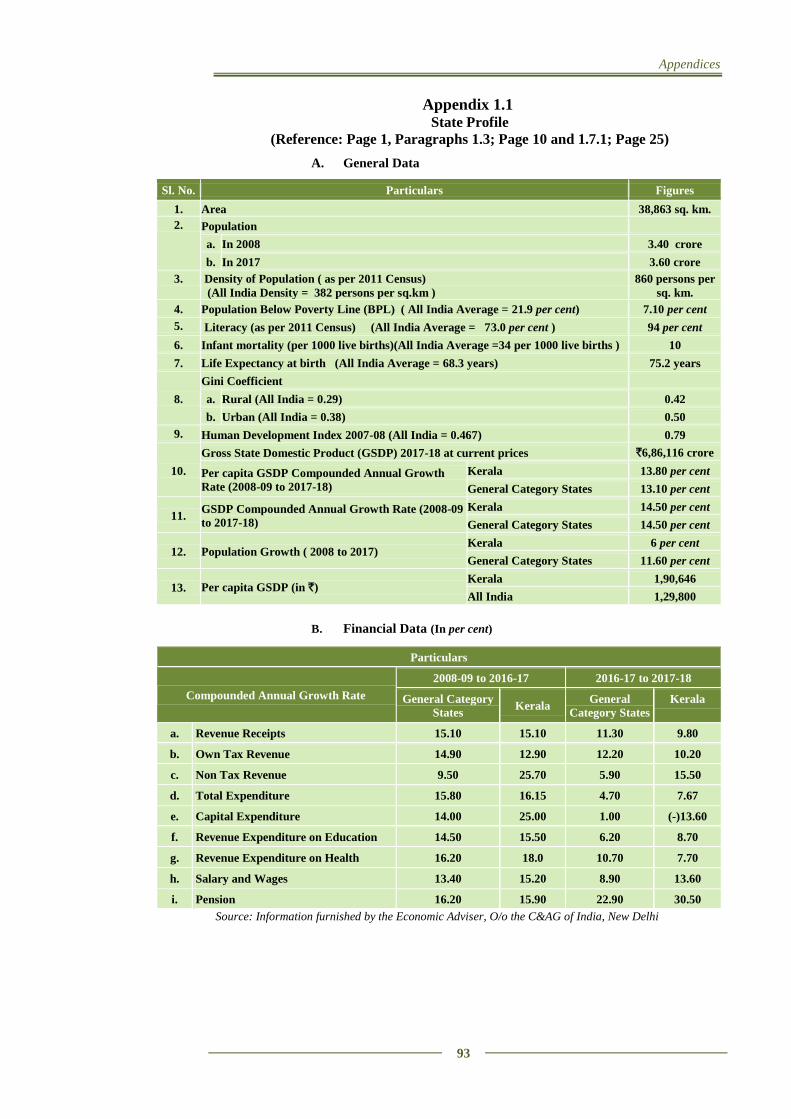
Appendices
93
Appendix 1.1 State Profile
(Reference: Page 1, Paragraphs 1.3; Page 10 and 1.7.1; Page 25)
A. General Data
Sl. No. Particulars Figures
1. Area 38,863 sq. km.
2. Population
a. In 2008 3.40 crore
b. In 2017 3.60 crore
3. Density of Population ( as per 2011 Census)
(All India Density = 382 persons per sq.km )
860 persons per
sq. km.
4. Population Below Poverty Line (BPL) ( All India Average = 21.9 per cent) 7.10 per cent
5. Literacy (as per 2011 Census) (All India Average = 73.0 per cent ) 94 per cent
6. Infant mortality (per 1000 live births)(All India Average =34 per 1000 live births ) 10
7. Life Expectancy at birth (All India Average = 68.3 years) 75.2 years
8.
Gini Coefficient
a. Rural (All India = 0.29) 0.42
b. Urban (All India = 0.38) 0.50
9. Human Development Index 2007-08 (All India = 0.467) 0.79
10.
Gross State Domestic Product (GSDP) 2017-18 at current prices `6,86,116 crore
Per capita GSDP Compounded Annual Growth
Rate (2008-09 to 2017-18)
Kerala 13.80 per cent
General Category States 13.10 per cent
11. GSDP Compounded Annual Growth Rate (2008-09
to 2017-18)
Kerala 14.50 per cent
General Category States 14.50 per cent
12. Population Growth ( 2008 to 2017) Kerala 6 per cent
General Category States 11.60 per cent
13. Per capita GSDP (in `) Kerala 1,90,646
All India 1,29,800
B. Financial Data (In per cent)
Particulars
Compounded Annual Growth Rate
2008-09 to 2016-17 2016-17 to 2017-18
General Category
States Kerala
General
Category States
Kerala
a. Revenue Receipts 15.10 15.10 11.30 9.80
b. Own Tax Revenue 14.90 12.90 12.20 10.20
c. Non Tax Revenue 9.50 25.70 5.90 15.50
d. Total Expenditure 15.80 16.15 4.70 7.67
e. Capital Expenditure 14.00 25.00 1.00 (-)13.60
f. Revenue Expenditure on Education 14.50 15.50 6.20 8.70
g. Revenue Expenditure on Health 16.20 18.0 10.70 7.70
h. Salary and Wages 13.40 15.20 8.90 13.60
i. Pension 16.20 15.90 22.90 30.50
Source: Information furnished by the Economic Adviser, O/o the C&AG of India, New Delhi
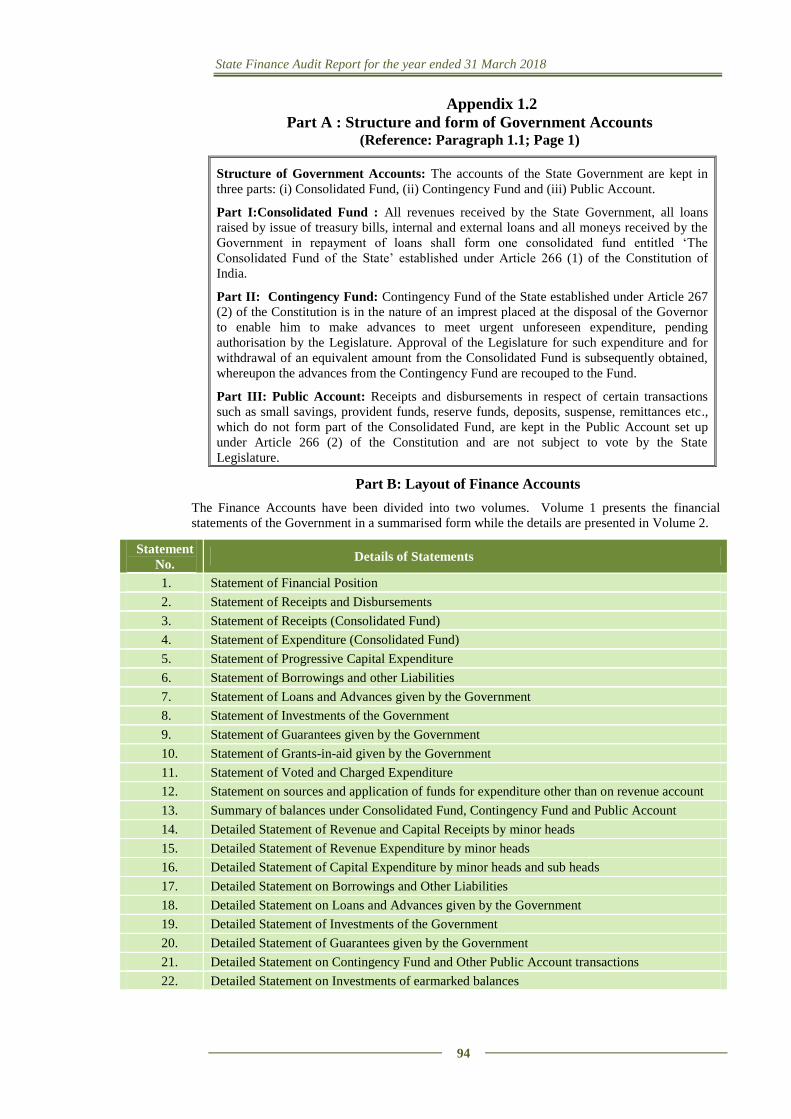
State Finance Audit Report for the year ended 31 March 2018
94
Appendix 1.2
Part A : Structure and form of Government Accounts (Reference: Paragraph 1.1; Page 1)
Structure of Government Accounts: The accounts of the State Government are kept in
three parts: (i) Consolidated Fund, (ii) Contingency Fund and (iii) Public Account.
Part I:Consolidated Fund : All revenues received by the State Government, all loans
raised by issue of treasury bills, internal and external loans and all moneys received by the
Government in repayment of loans shall form one consolidated fund entitled ‘The
Consolidated Fund of the State’ established under Article 266 (1) of the Constitution of
India.
Part II: Contingency Fund: Contingency Fund of the State established under Article 267
(2) of the Constitution is in the nature of an imprest placed at the disposal of the Governor
to enable him to make advances to meet urgent unforeseen expenditure, pending
authorisation by the Legislature. Approval of the Legislature for such expenditure and for
withdrawal of an equivalent amount from the Consolidated Fund is subsequently obtained,
whereupon the advances from the Contingency Fund are recouped to the Fund.
Part III: Public Account: Receipts and disbursements in respect of certain transactions
such as small savings, provident funds, reserve funds, deposits, suspense, remittances etc.,
which do not form part of the Consolidated Fund, are kept in the Public Account set up
under Article 266 (2) of the Constitution and are not subject to vote by the State
Legislature.
Part B: Layout of Finance Accounts
The Finance Accounts have been divided into two volumes. Volume 1 presents the financial
statements of the Government in a summarised form while the details are presented in Volume 2.
Statement
No. Details of Statements
1. Statement of Financial Position
2. Statement of Receipts and Disbursements
3. Statement of Receipts (Consolidated Fund)
4. Statement of Expenditure (Consolidated Fund)
5. Statement of Progressive Capital Expenditure
6. Statement of Borrowings and other Liabilities
7. Statement of Loans and Advances given by the Government
8. Statement of Investments of the Government
9. Statement of Guarantees given by the Government
10. Statement of Grants-in-aid given by the Government
11. Statement of Voted and Charged Expenditure
12. Statement on sources and application of funds for expenditure other than on revenue account
13. Summary of balances under Consolidated Fund, Contingency Fund and Public Account
14. Detailed Statement of Revenue and Capital Receipts by minor heads
15. Detailed Statement of Revenue Expenditure by minor heads
16. Detailed Statement of Capital Expenditure by minor heads and sub heads
17. Detailed Statement on Borrowings and Other Liabilities
18. Detailed Statement on Loans and Advances given by the Government
19. Detailed Statement of Investments of the Government
20. Detailed Statement of Guarantees given by the Government
21. Detailed Statement on Contingency Fund and Other Public Account transactions
22. Detailed Statement on Investments of earmarked balances
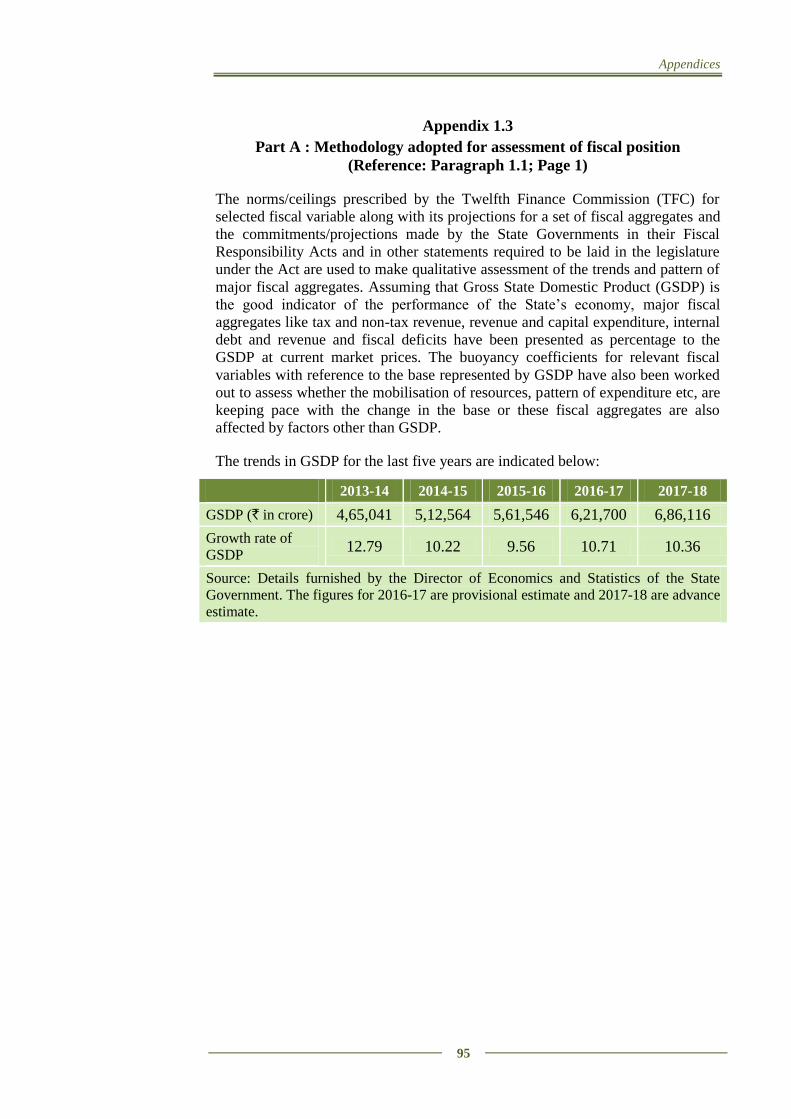
Appendices
95
Appendix 1.3
Part A : Methodology adopted for assessment of fiscal position
(Reference: Paragraph 1.1; Page 1)
The norms/ceilings prescribed by the Twelfth Finance Commission (TFC) for
selected fiscal variable along with its projections for a set of fiscal aggregates and
the commitments/projections made by the State Governments in their Fiscal
Responsibility Acts and in other statements required to be laid in the legislature
under the Act are used to make qualitative assessment of the trends and pattern of
major fiscal aggregates. Assuming that Gross State Domestic Product (GSDP) is
the good indicator of the performance of the State’s economy, major fiscal
aggregates like tax and non-tax revenue, revenue and capital expenditure, internal
debt and revenue and fiscal deficits have been presented as percentage to the
GSDP at current market prices. The buoyancy coefficients for relevant fiscal
variables with reference to the base represented by GSDP have also been worked
out to assess whether the mobilisation of resources, pattern of expenditure etc, are
keeping pace with the change in the base or these fiscal aggregates are also
affected by factors other than GSDP.
The trends in GSDP for the last five years are indicated below:
2013-14 2014-15 2015-16 2016-17 2017-18
GSDP (` in crore) 4,65,041 5,12,564 5,61,546 6,21,700 6,86,116
Growth rate of
GSDP 12.79 10.22 9.56 10.71 10.36
Source: Details furnished by the Director of Economics and Statistics of the State
Government. The figures for 2016-17 are provisional estimate and 2017-18 are advance
estimate.
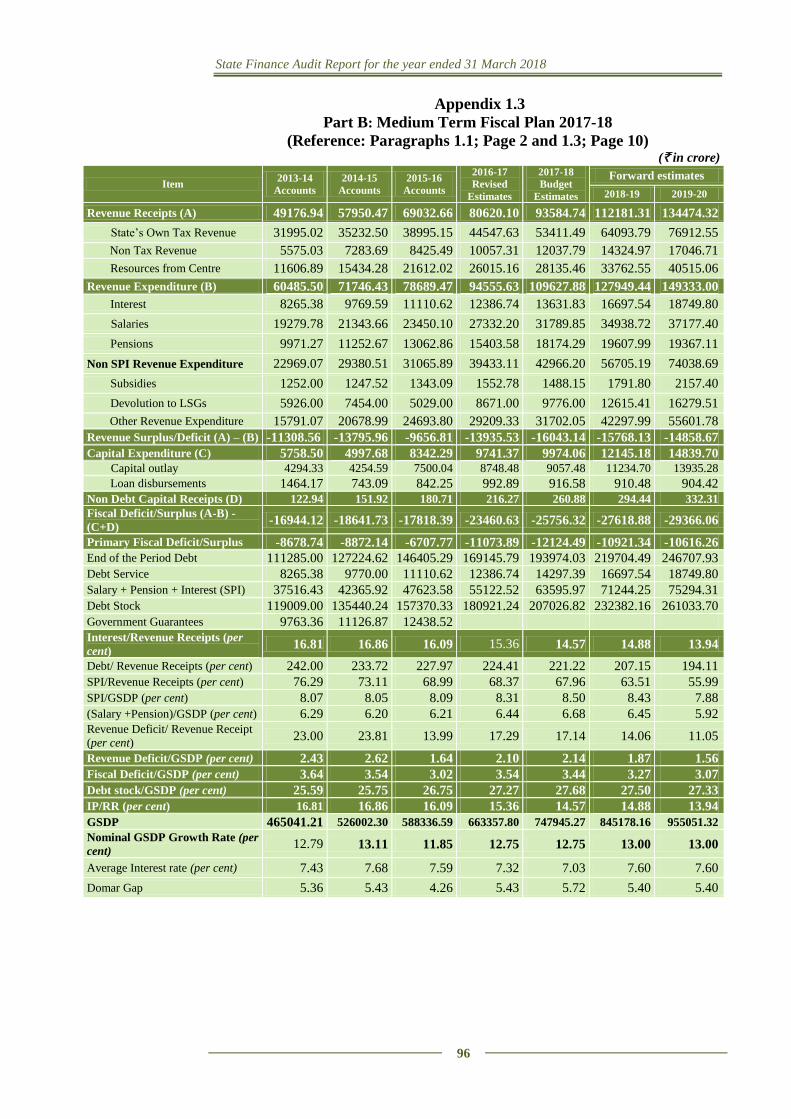
State Finance Audit Report for the year ended 31 March 2018
96
Appendix 1.3
Part B: Medium Term Fiscal Plan 2017-18
(Reference: Paragraphs 1.1; Page 2 and 1.3; Page 10) (` in crore)
Item 2013-14
Accounts
2014-15
Accounts
2015-16
Accounts
2016-17
Revised
Estimates
2017-18
Budget
Estimates
Forward estimates
2018-19 2019-20
Revenue Receipts (A) 49176.94 57950.47 69032.66 80620.10 93584.74 112181.31 134474.32
State’s Own Tax Revenue 31995.02 35232.50 38995.15 44547.63 53411.49 64093.79 76912.55
Non Tax Revenue 5575.03 7283.69 8425.49 10057.31 12037.79 14324.97 17046.71
Resources from Centre 11606.89 15434.28 21612.02 26015.16 28135.46 33762.55 40515.06
Revenue Expenditure (B) 60485.50 71746.43 78689.47 94555.63 109627.88 127949.44 149333.00
Interest 8265.38 9769.59 11110.62 12386.74 13631.83 16697.54 18749.80
Salaries 19279.78 21343.66 23450.10 27332.20 31789.85 34938.72 37177.40
Pensions 9971.27 11252.67 13062.86 15403.58 18174.29 19607.99 19367.11
Non SPI Revenue Expenditure 22969.07 29380.51 31065.89 39433.11 42966.20 56705.19 74038.69
Subsidies 1252.00 1247.52 1343.09 1552.78 1488.15 1791.80 2157.40
Devolution to LSGs 5926.00 7454.00 5029.00 8671.00 9776.00 12615.41 16279.51
Other Revenue Expenditure 15791.07 20678.99 24693.80 29209.33 31702.05 42297.99 55601.78
Revenue Surplus/Deficit (A) – (B) -11308.56 -13795.96 -9656.81 -13935.53 -16043.14 -15768.13 -14858.67
Capital Expenditure (C) 5758.50 4997.68 8342.29 9741.37 9974.06 12145.18 14839.70 Capital outlay 4294.33 4254.59 7500.04 8748.48 9057.48 11234.70 13935.28
Loan disbursements 1464.17 743.09 842.25 992.89 916.58 910.48 904.42
Non Debt Capital Receipts (D) 122.94 151.92 180.71 216.27 260.88 294.44 332.31
Fiscal Deficit/Surplus (A-B) -
(C+D) -16944.12 -18641.73 -17818.39 -23460.63 -25756.32 -27618.88 -29366.06
Primary Fiscal Deficit/Surplus -8678.74 -8872.14 -6707.77 -11073.89 -12124.49 -10921.34 -10616.26
End of the Period Debt 111285.00 127224.62 146405.29 169145.79 193974.03 219704.49 246707.93
Debt Service 8265.38 9770.00 11110.62 12386.74 14297.39 16697.54 18749.80
Salary + Pension + Interest (SPI) 37516.43 42365.92 47623.58 55122.52 63595.97 71244.25 75294.31
Debt Stock 119009.00 135440.24 157370.33 180921.24 207026.82 232382.16 261033.70
Government Guarantees 9763.36 11126.87 12438.52
Interest/Revenue Receipts (per
cent) 16.81 16.86 16.09 15.36 14.57 14.88 13.94
Debt/ Revenue Receipts (per cent) 242.00 233.72 227.97 224.41 221.22 207.15 194.11
SPI/Revenue Receipts (per cent) 76.29 73.11 68.99 68.37 67.96 63.51 55.99
SPI/GSDP (per cent) 8.07 8.05 8.09 8.31 8.50 8.43 7.88
(Salary +Pension)/GSDP (per cent) 6.29 6.20 6.21 6.44 6.68 6.45 5.92 Revenue Deficit/ Revenue Receipt
(per cent) 23.00 23.81 13.99 17.29 17.14 14.06 11.05
Revenue Deficit/GSDP (per cent) 2.43 2.62 1.64 2.10 2.14 1.87 1.56
Fiscal Deficit/GSDP (per cent) 3.64 3.54 3.02 3.54 3.44 3.27 3.07
Debt stock/GSDP (per cent) 25.59 25.75 26.75 27.27 27.68 27.50 27.33
IP/RR (per cent) 16.81 16.86 16.09 15.36 14.57 14.88 13.94
GSDP 465041.21 526002.30 588336.59 663357.80 747945.27 845178.16 955051.32
Nominal GSDP Growth Rate (per
cent) 12.79 13.11 11.85 12.75 12.75 13.00 13.00
Average Interest rate (per cent) 7.43 7.68 7.59 7.32 7.03 7.60 7.60
Domar Gap 5.36 5.43 4.26 5.43 5.72 5.40 5.40
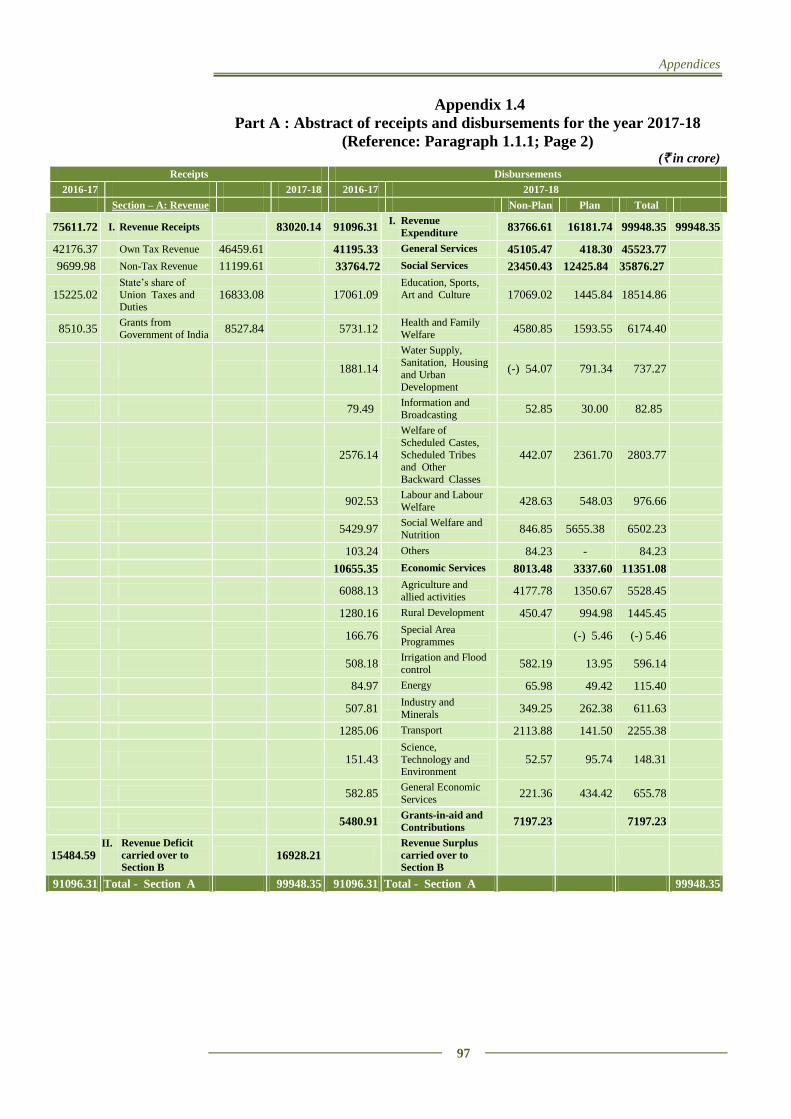
Appendices
97
Appendix 1.4
Part A : Abstract of receipts and disbursements for the year 2017-18
(Reference: Paragraph 1.1.1; Page 2) (` in crore)
Receipts Disbursements
2016-17 2017-18 2016-17 2017-18
Section – A: Revenue Non-Plan Plan Total
75611.72 I. Revenue Receipts 83020.14 91096.31 I. Revenue
Expenditure 83766.61 16181.74 99948.35 99948.35
42176.37 Own Tax Revenue 46459.61 41195.33 General Services 45105.47 418.30 45523.77
9699.98 Non-Tax Revenue 11199.61 33764.72 Social Services 23450.43 12425.84 35876.27
15225.02
State’s share of
Union Taxes and Duties
16833.08 17061.09 Education, Sports,
Art and Culture 17069.02 1445.84 18514.86
8510.35 Grants from
Government of India 8527.84 5731.12
Health and Family
Welfare 4580.85 1593.55 6174.40
1881.14
Water Supply,
Sanitation, Housing
and Urban
Development
(-) 54.07 791.34 737.27
79.49 Information and
Broadcasting 52.85 30.00 82.85
2576.14
Welfare of
Scheduled Castes,
Scheduled Tribes and Other
Backward Classes
442.07 2361.70 2803.77
902.53 Labour and Labour
Welfare 428.63 548.03 976.66
5429.97 Social Welfare and
Nutrition 846.85 5655.38 6502.23
103.24 Others 84.23 - 84.23
10655.35 Economic Services 8013.48 3337.60 11351.08
6088.13 Agriculture and
allied activities 4177.78 1350.67 5528.45
1280.16 Rural Development 450.47 994.98 1445.45
166.76 Special Area
Programmes (-) 5.46 (-) 5.46
508.18 Irrigation and Flood
control 582.19 13.95 596.14
84.97 Energy 65.98 49.42 115.40
507.81 Industry and
Minerals 349.25 262.38 611.63
1285.06 Transport 2113.88 141.50 2255.38
151.43 Science,
Technology and Environment
52.57 95.74 148.31
582.85 General Economic
Services 221.36 434.42 655.78
5480.91 Grants-in-aid and
Contributions 7197.23 7197.23
15484.59 II. Revenue Deficit
carried over to
Section B 16928.21
Revenue Surplus
carried over to
Section B
91096.31 Total - Section A 99948.35 91096.31 Total - Section A 99948.35
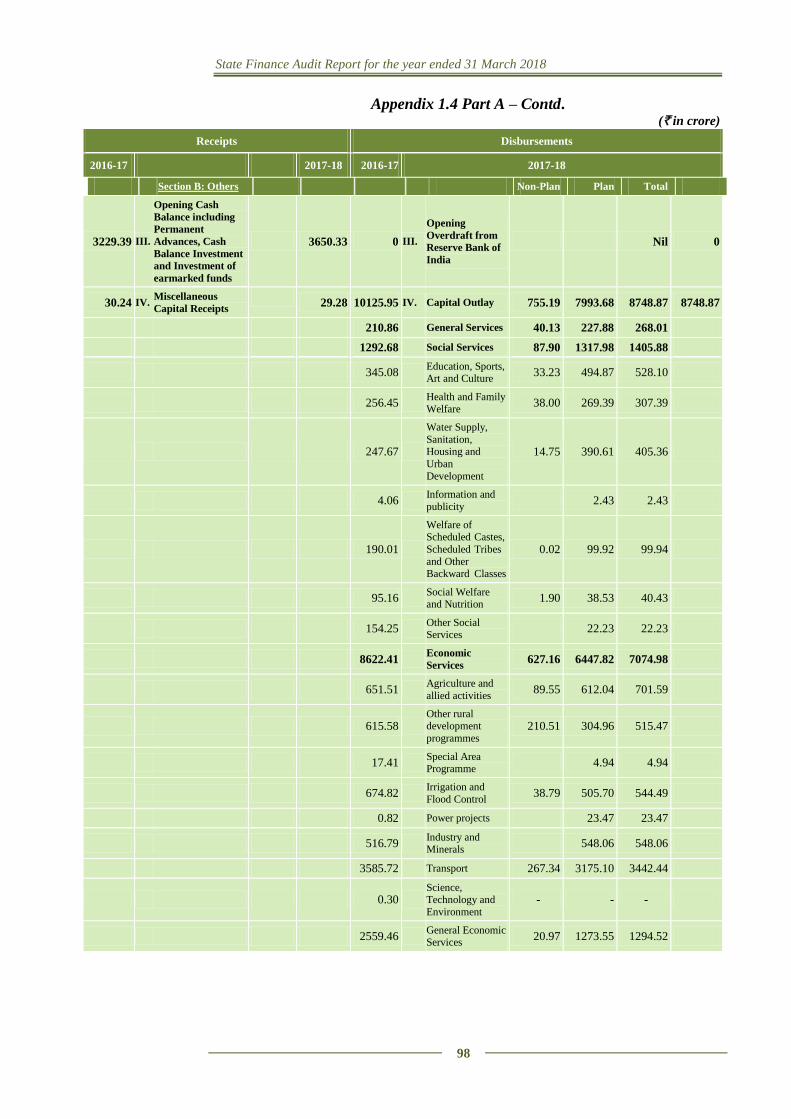
State Finance Audit Report for the year ended 31 March 2018
98
Appendix 1.4 Part A – Contd. (` in crore)
Receipts Disbursements
2016-17 2017-18 2016-17 2017-18
Section B: Others Non-Plan Plan Total
3229.39 III.
Opening Cash
Balance including
Permanent
Advances, Cash
Balance Investment
and Investment of
earmarked funds
3650.33 0 III.
Opening
Overdraft from
Reserve Bank of
India
Nil 0
30.24 IV. Miscellaneous
Capital Receipts
29.28 10125.95 IV. Capital Outlay 755.19 7993.68 8748.87 8748.87
210.86 General Services 40.13 227.88 268.01
1292.68 Social Services 87.90 1317.98 1405.88
345.08 Education, Sports,
Art and Culture 33.23 494.87 528.10
256.45 Health and Family Welfare
38.00 269.39 307.39
247.67
Water Supply,
Sanitation, Housing and
Urban
Development
14.75 390.61 405.36
4.06 Information and
publicity 2.43 2.43
190.01
Welfare of Scheduled Castes,
Scheduled Tribes
and Other Backward Classes
0.02 99.92 99.94
95.16 Social Welfare and Nutrition
1.90 38.53 40.43
154.25 Other Social Services
22.23 22.23
8622.41 Economic
Services 627.16 6447.82 7074.98
651.51 Agriculture and
allied activities 89.55 612.04 701.59
615.58 Other rural development
programmes 210.51 304.96 515.47
17.41 Special Area Programme
4.94 4.94
674.82 Irrigation and
Flood Control 38.79 505.70 544.49
0.82 Power projects 23.47 23.47
516.79 Industry and Minerals
548.06 548.06
3585.72 Transport 267.34 3175.10 3442.44
0.30 Science, Technology and
Environment - - -
2559.46 General Economic Services
20.97 1273.55 1294.52
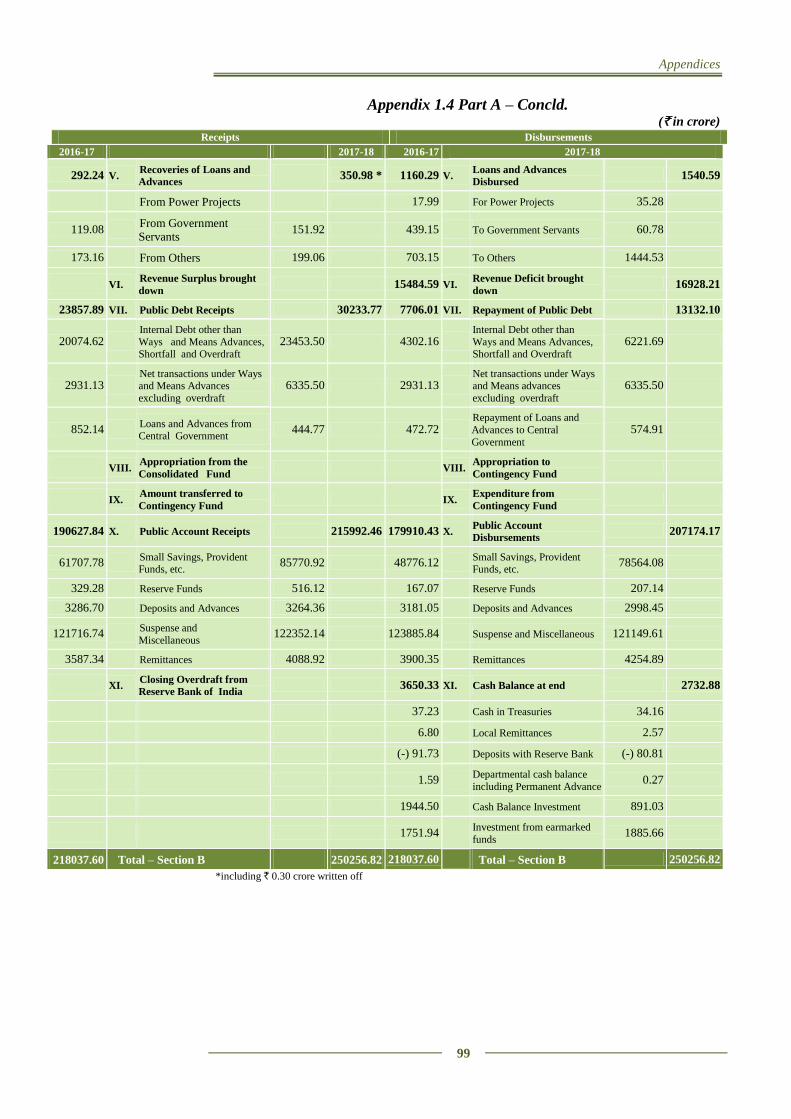
Appendices
99
Appendix 1.4 Part A – Concld. (` in crore)
Receipts Disbursements
2016-17 2017-18 2016-17 2017-18
292.24 V. Recoveries of Loans and
Advances 350.98 * 1160.29 V.
Loans and Advances
Disbursed 1540.59
From Power Projects 17.99 For Power Projects 35.28
119.08 From Government Servants
151.92 439.15 To Government Servants 60.78
173.16 From Others 199.06 703.15 To Others 1444.53
VI. Revenue Surplus brought
down 15484.59 VI.
Revenue Deficit brought
down 16928.21
23857.89 VII. Public Debt Receipts 30233.77 7706.01 VII. Repayment of Public Debt 13132.10
20074.62
Internal Debt other than
Ways and Means Advances, Shortfall and Overdraft
23453.50 4302.16 Internal Debt other than
Ways and Means Advances, Shortfall and Overdraft
6221.69
2931.13
Net transactions under Ways and Means Advances
excluding overdraft
6335.50 2931.13 Net transactions under Ways and Means advances
excluding overdraft
6335.50
852.14 Loans and Advances from Central Government
444.77 472.72 Repayment of Loans and
Advances to Central
Government
574.91
VIII. Appropriation from the
Consolidated Fund VIII.
Appropriation to
Contingency Fund
IX. Amount transferred to
Contingency Fund IX.
Expenditure from
Contingency Fund
190627.84 X. Public Account Receipts 215992.46 179910.43 X. Public Account
Disbursements 207174.17
61707.78 Small Savings, Provident Funds, etc.
85770.92 48776.12 Small Savings, Provident Funds, etc.
78564.08
329.28 Reserve Funds 516.12 167.07 Reserve Funds 207.14
3286.70 Deposits and Advances 3264.36 3181.05 Deposits and Advances 2998.45
121716.74 Suspense and
Miscellaneous 122352.14 123885.84 Suspense and Miscellaneous 121149.61
3587.34 Remittances 4088.92 3900.35 Remittances 4254.89
XI. Closing Overdraft from
Reserve Bank of India 3650.33 XI. Cash Balance at end 2732.88
37.23 Cash in Treasuries 34.16
6.80 Local Remittances 2.57
(-) 91.73 Deposits with Reserve Bank (-) 80.81
1.59 Departmental cash balance
including Permanent Advance 0.27
1944.50 Cash Balance Investment 891.03
1751.94 Investment from earmarked
funds 1885.66
218037.60 Total – Section B 250256.82 218037.60 Total – Section B 250256.82
*including ` 0.30 crore written off
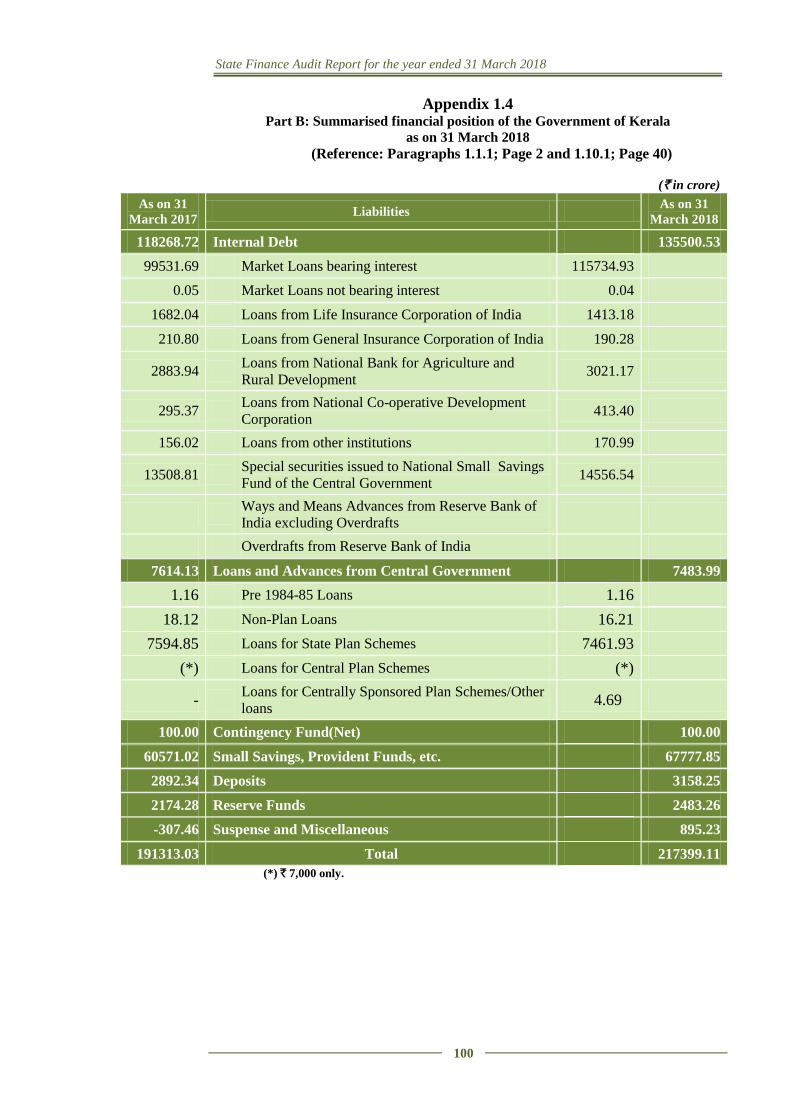
State Finance Audit Report for the year ended 31 March 2018
100
Appendix 1.4 Part B: Summarised financial position of the Government of Kerala
as on 31 March 2018
(Reference: Paragraphs 1.1.1; Page 2 and 1.10.1; Page 40)
(` in crore)
As on 31
March 2017 Liabilities
As on 31
March 2018
118268.72 Internal Debt 135500.53
99531.69 Market Loans bearing interest 115734.93
0.05 Market Loans not bearing interest 0.04
1682.04 Loans from Life Insurance Corporation of India 1413.18
210.80 Loans from General Insurance Corporation of India 190.28
2883.94 Loans from National Bank for Agriculture and
Rural Development 3021.17
295.37 Loans from National Co-operative Development
Corporation 413.40
156.02 Loans from other institutions 170.99
13508.81 Special securities issued to National Small Savings
Fund of the Central Government 14556.54
Ways and Means Advances from Reserve Bank of
India excluding Overdrafts
Overdrafts from Reserve Bank of India
7614.13 Loans and Advances from Central Government 7483.99
1.16 Pre 1984-85 Loans 1.16
18.12 Non-Plan Loans 16.21
7594.85 Loans for State Plan Schemes 7461.93
(*) Loans for Central Plan Schemes (*)
- Loans for Centrally Sponsored Plan Schemes/Other
loans 4.69
100.00 Contingency Fund(Net) 100.00
60571.02 Small Savings, Provident Funds, etc. 67777.85
2892.34 Deposits 3158.25
2174.28 Reserve Funds 2483.26
-307.46 Suspense and Miscellaneous 895.23
191313.03 Total 217399.11
(*) ` 7,000 only.
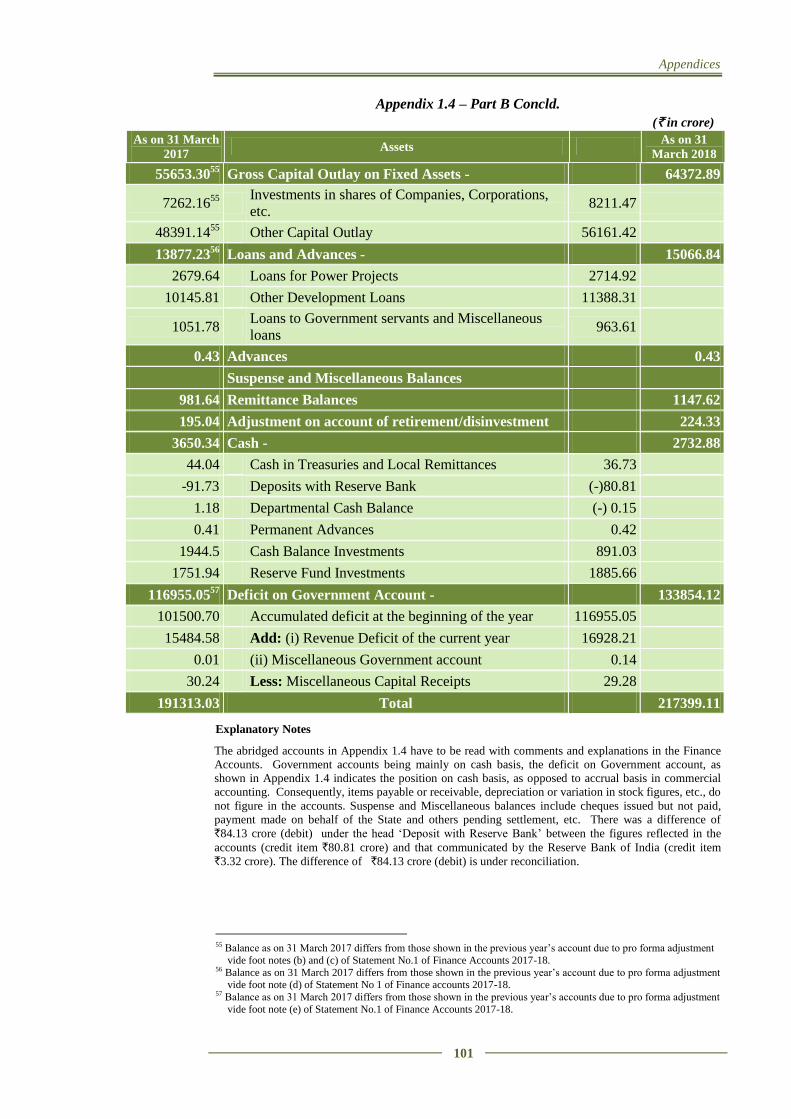
Appendices
101
Appendix 1.4 – Part B Concld.
(` in crore)
As on 31 March
2017 Assets
As on 31
March 2018
55653.3055 Gross Capital Outlay on Fixed Assets - 64372.89
7262.1655
Investments in shares of Companies, Corporations,
etc. 8211.47
48391.1455
Other Capital Outlay 56161.42
13877.2356 Loans and Advances - 15066.84
2679.64 Loans for Power Projects 2714.92
10145.81 Other Development Loans 11388.31
1051.78 Loans to Government servants and Miscellaneous
loans 963.61
0.43 Advances 0.43
Suspense and Miscellaneous Balances
981.64 Remittance Balances 1147.62
195.04 Adjustment on account of retirement/disinvestment 224.33
3650.34 Cash - 2732.88
44.04 Cash in Treasuries and Local Remittances 36.73
-91.73 Deposits with Reserve Bank (-)80.81
1.18 Departmental Cash Balance (-) 0.15
0.41 Permanent Advances 0.42
1944.5 Cash Balance Investments 891.03
1751.94 Reserve Fund Investments 1885.66
116955.0557 Deficit on Government Account - 133854.12
101500.70 Accumulated deficit at the beginning of the year 116955.05
15484.58 Add: (i) Revenue Deficit of the current year 16928.21
0.01 (ii) Miscellaneous Government account 0.14
30.24 Less: Miscellaneous Capital Receipts 29.28
191313.03 Total 217399.11
Explanatory Notes
The abridged accounts in Appendix 1.4 have to be read with comments and explanations in the Finance
Accounts. Government accounts being mainly on cash basis, the deficit on Government account, as
shown in Appendix 1.4 indicates the position on cash basis, as opposed to accrual basis in commercial
accounting. Consequently, items payable or receivable, depreciation or variation in stock figures, etc., do
not figure in the accounts. Suspense and Miscellaneous balances include cheques issued but not paid,
payment made on behalf of the State and others pending settlement, etc. There was a difference of
`84.13 crore (debit) under the head ‘Deposit with Reserve Bank’ between the figures reflected in the
accounts (credit item `80.81 crore) and that communicated by the Reserve Bank of India (credit item `3.32 crore). The difference of `84.13 crore (debit) is under reconciliation.
55 Balance as on 31 March 2017 differs from those shown in the previous year’s account due to pro forma adjustment
vide foot notes (b) and (c) of Statement No.1 of Finance Accounts 2017-18. 56 Balance as on 31 March 2017 differs from those shown in the previous year’s account due to pro forma adjustment
vide foot note (d) of Statement No 1 of Finance accounts 2017-18. 57 Balance as on 31 March 2017 differs from those shown in the previous year’s accounts due to pro forma adjustment
vide foot note (e) of Statement No.1 of Finance Accounts 2017-18.
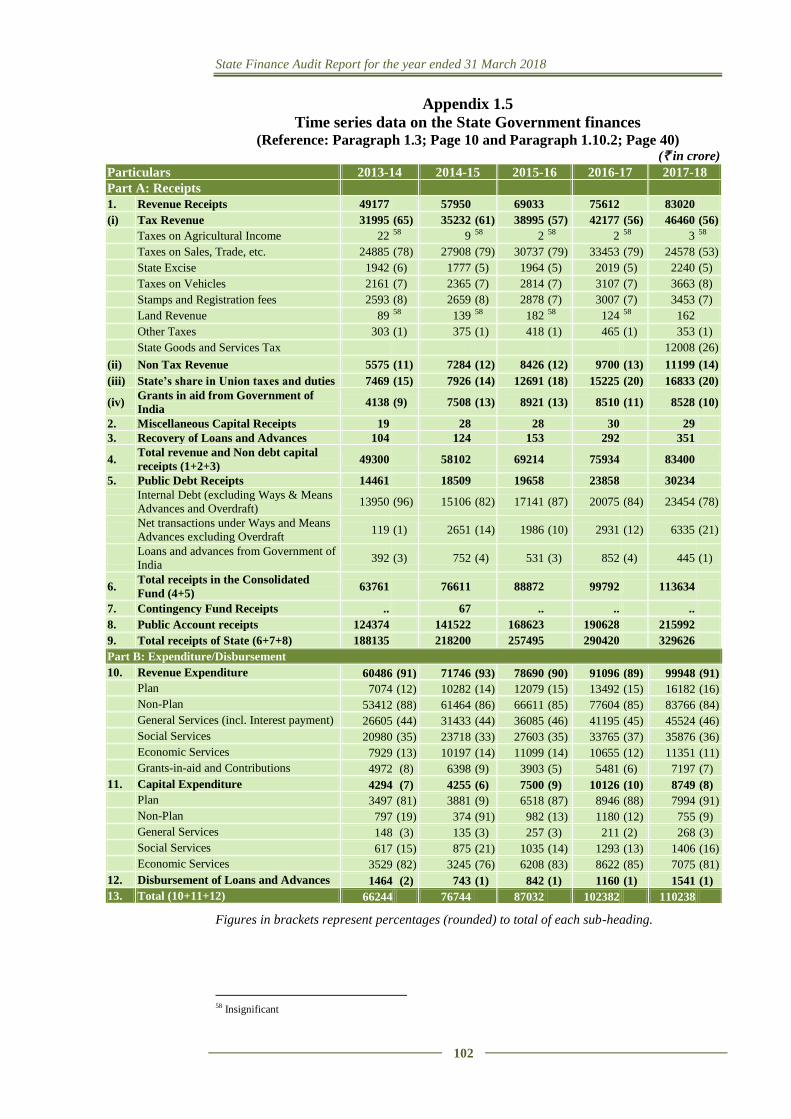
State Finance Audit Report for the year ended 31 March 2018
102
Appendix 1.5
Time series data on the State Government finances (Reference: Paragraph 1.3; Page 10 and Paragraph 1.10.2; Page 40)
(` in crore)
Figures in brackets represent percentages (rounded) to total of each sub-heading.
58 Insignificant
Particulars 2013-14 2014-15 2015-16 2016-17 2017-18
Part A: Receipts
1. Revenue Receipts 49177 57950 69033 75612 83020
(i) Tax Revenue 31995 (65) 35232 (61) 38995 (57) 42177 (56) 46460 (56)
Taxes on Agricultural Income 22 58 9 58 2 58 2 58 3 58
Taxes on Sales, Trade, etc. 24885 (78) 27908 (79) 30737 (79) 33453 (79) 24578 (53)
State Excise 1942 (6) 1777 (5) 1964 (5) 2019 (5) 2240 (5)
Taxes on Vehicles 2161 (7) 2365 (7) 2814 (7) 3107 (7) 3663 (8)
Stamps and Registration fees 2593 (8) 2659 (8) 2878 (7) 3007 (7) 3453 (7)
Land Revenue 89 58 139 58 182 58 124 58 162
Other Taxes 303 (1) 375 (1) 418 (1) 465 (1) 353 (1)
State Goods and Services Tax 12008 (26)
(ii) Non Tax Revenue 5575 (11) 7284 (12) 8426 (12) 9700 (13) 11199 (14)
(iii) State’s share in Union taxes and duties 7469 (15) 7926 (14) 12691 (18) 15225 (20) 16833 (20)
(iv) Grants in aid from Government of
India 4138 (9) 7508 (13) 8921 (13) 8510 (11) 8528 (10)
2. Miscellaneous Capital Receipts 19 28 28 30 29
3. Recovery of Loans and Advances 104 124 153 292 351
4. Total revenue and Non debt capital
receipts (1+2+3) 49300 58102 69214 75934 83400
5. Public Debt Receipts 14461 18509 19658 23858 30234
Internal Debt (excluding Ways & Means
Advances and Overdraft) 13950 (96) 15106 (82) 17141 (87) 20075 (84) 23454 (78)
Net transactions under Ways and Means
Advances excluding Overdraft 119 (1) 2651 (14) 1986 (10) 2931 (12) 6335 (21)
Loans and advances from Government of
India 392 (3) 752 (4) 531 (3) 852 (4) 445 (1)
6. Total receipts in the Consolidated
Fund (4+5) 63761 76611 88872 99792 113634
7. Contingency Fund Receipts .. 67 .. .. ..
8. Public Account receipts 124374 141522 168623 190628 215992
9. Total receipts of State (6+7+8) 188135 218200 257495 290420 329626
Part B: Expenditure/Disbursement
10. Revenue Expenditure 60486 (91) 71746 (93) 78690 (90) 91096 (89) 99948 (91)
Plan 7074 (12) 10282 (14) 12079 (15) 13492 (15) 16182 (16)
Non-Plan 53412 (88) 61464 (86) 66611 (85) 77604 (85) 83766 (84)
General Services (incl. Interest payment) 26605 (44) 31433 (44) 36085 (46) 41195 (45) 45524 (46)
Social Services 20980 (35) 23718 (33) 27603 (35) 33765 (37) 35876 (36)
Economic Services 7929 (13) 10197 (14) 11099 (14) 10655 (12) 11351 (11)
Grants-in-aid and Contributions 4972 (8) 6398 (9) 3903 (5) 5481 (6) 7197 (7)
11. Capital Expenditure 4294 (7) 4255 (6) 7500 (9) 10126 (10) 8749 (8)
Plan 3497 (81) 3881 (9) 6518 (87) 8946 (88) 7994 (91)
Non-Plan 797 (19) 374 (91) 982 (13) 1180 (12) 755 (9)
General Services 148 (3) 135 (3) 257 (3) 211 (2) 268 (3)
Social Services 617 (15) 875 (21) 1035 (14) 1293 (13) 1406 (16)
Economic Services 3529 (82) 3245 (76) 6208 (83) 8622 (85) 7075 (81)
12. Disbursement of Loans and Advances 1464 (2) 743 (1) 842 (1) 1160 (1) 1541 (1)
13. Total (10+11+12) 66244 76744 87032 102382 110238
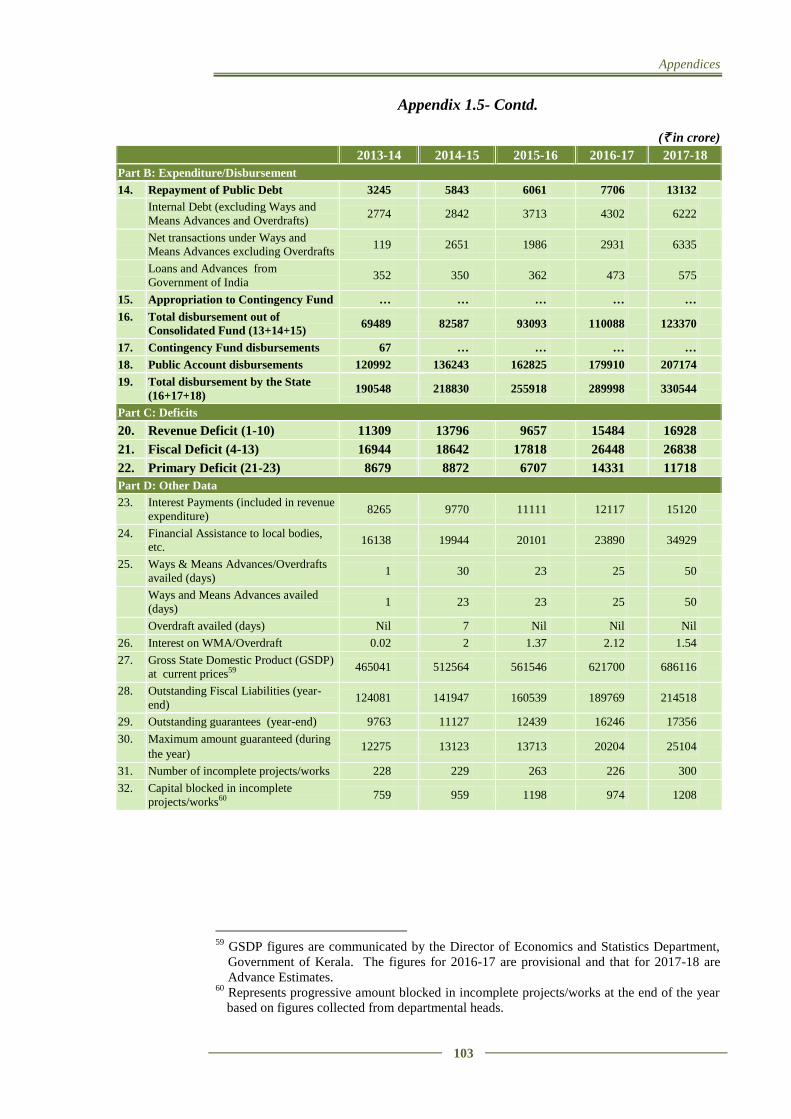
Appendices
103
Appendix 1.5- Contd.
(` in crore)
59
GSDP figures are communicated by the Director of Economics and Statistics Department,
Government of Kerala. The figures for 2016-17 are provisional and that for 2017-18 are
Advance Estimates. 60
Represents progressive amount blocked in incomplete projects/works at the end of the year
based on figures collected from departmental heads.
2013-14 2014-15 2015-16 2016-17 2017-18
Part B: Expenditure/Disbursement
14. Repayment of Public Debt 3245 5843 6061 7706 13132
Internal Debt (excluding Ways and
Means Advances and Overdrafts) 2774 2842 3713 4302
6222
Net transactions under Ways and
Means Advances excluding Overdrafts 119 2651 1986 2931
6335
Loans and Advances from
Government of India 352 350 362 473
575
15. Appropriation to Contingency Fund … … … … …
16. Total disbursement out of
Consolidated Fund (13+14+15) 69489 82587 93093 110088
123370
17. Contingency Fund disbursements 67 … … … …
18. Public Account disbursements 120992 136243 162825 179910 207174
19. Total disbursement by the State
(16+17+18) 190548 218830 255918 289998
330544
Part C: Deficits
20. Revenue Deficit (1-10) 11309 13796 9657 15484 16928
21. Fiscal Deficit (4-13) 16944 18642 17818 26448 26838
22. Primary Deficit (21-23) 8679 8872 6707 14331 11718
Part D: Other Data
23. Interest Payments (included in revenue
expenditure) 8265 9770 11111 12117 15120
24. Financial Assistance to local bodies,
etc. 16138 19944 20101 23890 34929
25. Ways & Means Advances/Overdrafts
availed (days) 1 30 23 25 50
Ways and Means Advances availed
(days) 1 23 23 25 50
Overdraft availed (days) Nil 7 Nil Nil Nil
26. Interest on WMA/Overdraft 0.02 2 1.37 2.12 1.54
27. Gross State Domestic Product (GSDP)
at current prices59 465041 512564 561546 621700 686116
28. Outstanding Fiscal Liabilities (year-
end) 124081 141947 160539 189769 214518
29. Outstanding guarantees (year-end) 9763 11127 12439 16246 17356
30. Maximum amount guaranteed (during
the year) 12275 13123 13713 20204 25104
31. Number of incomplete projects/works 228 229 263 226 300
32. Capital blocked in incomplete
projects/works60 759 959 1198 974 1208
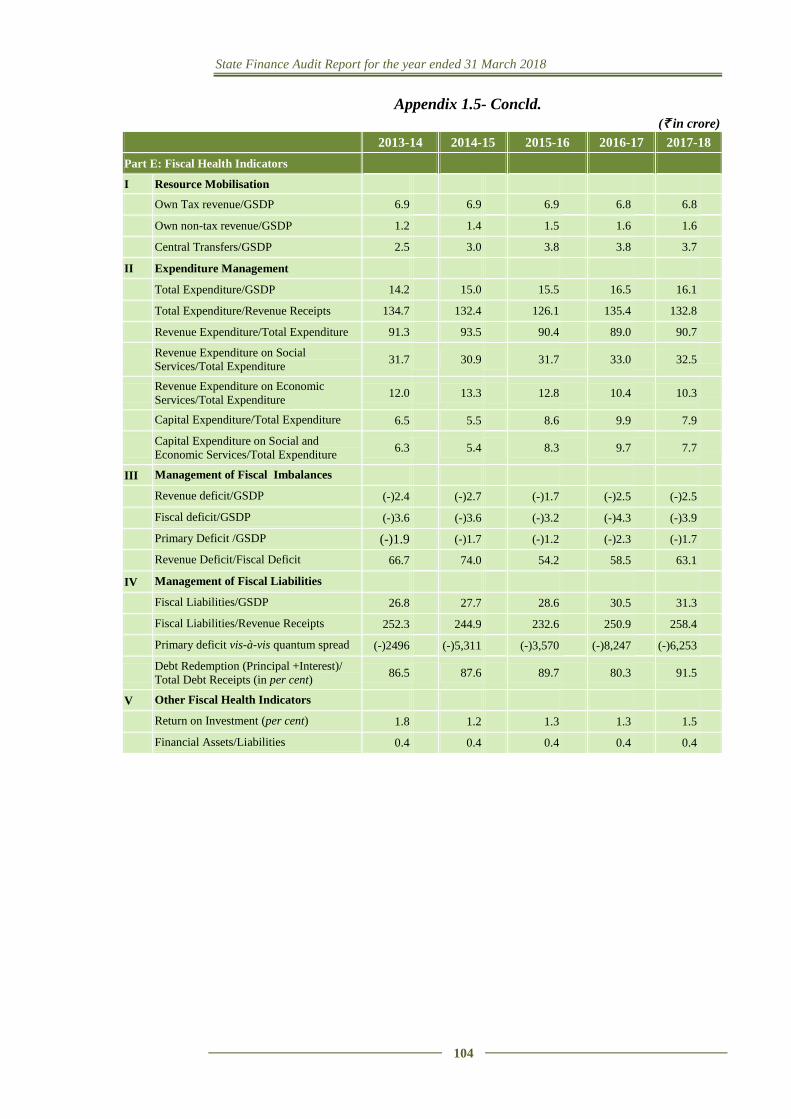
State Finance Audit Report for the year ended 31 March 2018
104
Appendix 1.5- Concld.
(` in crore)
2013-14 2014-15 2015-16 2016-17 2017-18
Part E: Fiscal Health Indicators
I Resource Mobilisation
Own Tax revenue/GSDP 6.9 6.9 6.9 6.8 6.8
Own non-tax revenue/GSDP 1.2 1.4 1.5 1.6 1.6
Central Transfers/GSDP 2.5 3.0 3.8 3.8 3.7
II Expenditure Management
Total Expenditure/GSDP 14.2 15.0 15.5 16.5 16.1
Total Expenditure/Revenue Receipts 134.7 132.4 126.1 135.4 132.8
Revenue Expenditure/Total Expenditure 91.3 93.5 90.4 89.0 90.7
Revenue Expenditure on Social
Services/Total Expenditure 31.7 30.9 31.7 33.0 32.5
Revenue Expenditure on Economic
Services/Total Expenditure 12.0 13.3 12.8 10.4 10.3
Capital Expenditure/Total Expenditure 6.5 5.5 8.6 9.9 7.9
Capital Expenditure on Social and
Economic Services/Total Expenditure 6.3 5.4 8.3 9.7 7.7
III Management of Fiscal Imbalances
Revenue deficit/GSDP (-)2.4 (-)2.7 (-)1.7 (-)2.5 (-)2.5
Fiscal deficit/GSDP (-)3.6 (-)3.6 (-)3.2 (-)4.3 (-)3.9
Primary Deficit /GSDP (-)1.9 (-)1.7 (-)1.2 (-)2.3 (-)1.7
Revenue Deficit/Fiscal Deficit 66.7 74.0 54.2 58.5 63.1
IV Management of Fiscal Liabilities
Fiscal Liabilities/GSDP 26.8 27.7 28.6 30.5 31.3
Fiscal Liabilities/Revenue Receipts 252.3 244.9 232.6 250.9 258.4
Primary deficit vis-à-vis quantum spread (-)2496 (-)5,311 (-)3,570 (-)8,247 (-)6,253
Debt Redemption (Principal +Interest)/
Total Debt Receipts (in per cent) 86.5 87.6 89.7 80.3 91.5
V Other Fiscal Health Indicators
Return on Investment (per cent) 1.8 1.2 1.3 1.3 1.5
Financial Assets/Liabilities 0.4 0.4 0.4 0.4 0.4
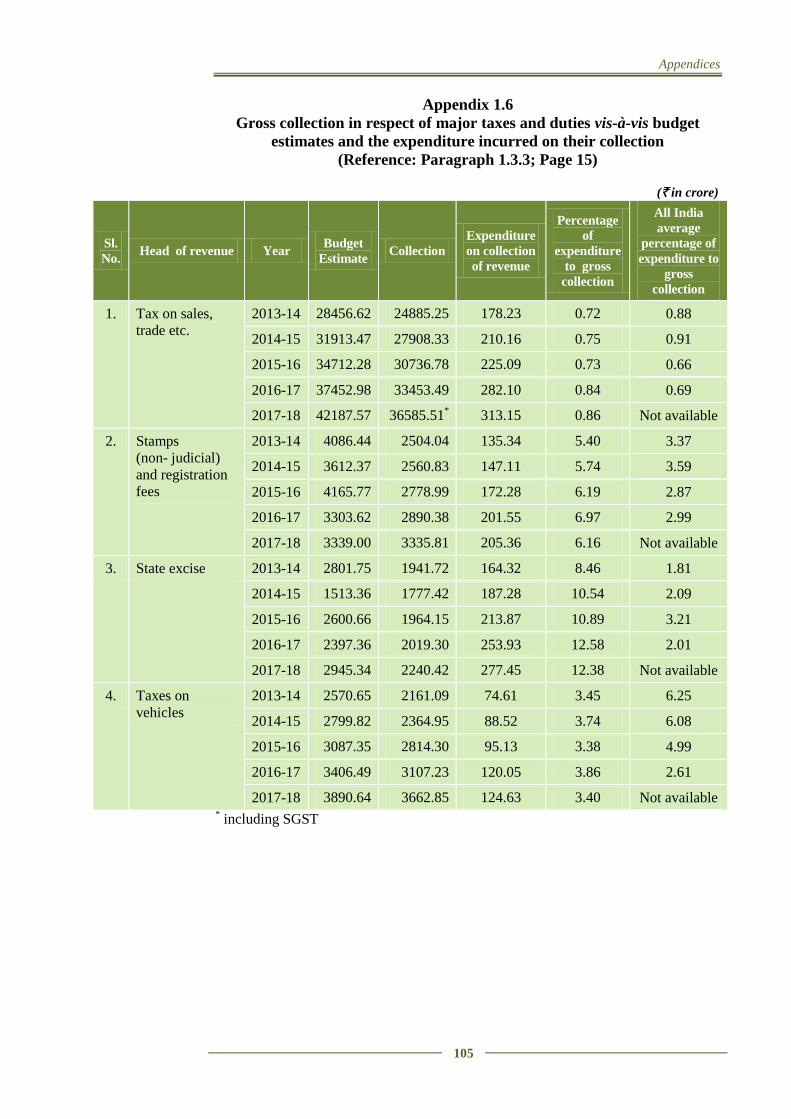
Appendices
105
Appendix 1.6
Gross collection in respect of major taxes and duties vis-à-vis budget
estimates and the expenditure incurred on their collection
(Reference: Paragraph 1.3.3; Page 15)
(` in crore)
Sl.
No. Head of revenue Year
Budget
Estimate Collection
Expenditure
on collection
of revenue
Percentage
of
expenditure
to gross
collection
All India
average
percentage of
expenditure to
gross
collection
1. Tax on sales,
trade etc. 2013-14 28456.62 24885.25 178.23 0.72 0.88
2014-15 31913.47 27908.33 210.16 0.75 0.91
2015-16 34712.28 30736.78 225.09 0.73 0.66
2016-17 37452.98 33453.49 282.10 0.84 0.69
2017-18 42187.57 36585.51* 313.15 0.86 Not available
2. Stamps
(non- judicial)
and registration
fees
2013-14 4086.44 2504.04 135.34 5.40 3.37
2014-15 3612.37 2560.83 147.11 5.74 3.59
2015-16 4165.77 2778.99 172.28 6.19 2.87
2016-17 3303.62 2890.38 201.55 6.97 2.99
2017-18 3339.00 3335.81 205.36 6.16 Not available
3. State excise 2013-14 2801.75 1941.72 164.32 8.46 1.81
2014-15 1513.36 1777.42 187.28 10.54 2.09
2015-16 2600.66 1964.15 213.87 10.89 3.21
2016-17 2397.36 2019.30 253.93 12.58 2.01
2017-18 2945.34 2240.42 277.45 12.38 Not available
4. Taxes on
vehicles 2013-14 2570.65 2161.09 74.61 3.45 6.25
2014-15 2799.82 2364.95 88.52 3.74 6.08
2015-16 3087.35 2814.30 95.13 3.38 4.99
2016-17 3406.49 3107.23 120.05 3.86 2.61
2017-18 3890.64 3662.85 124.63 3.40 Not available * including SGST
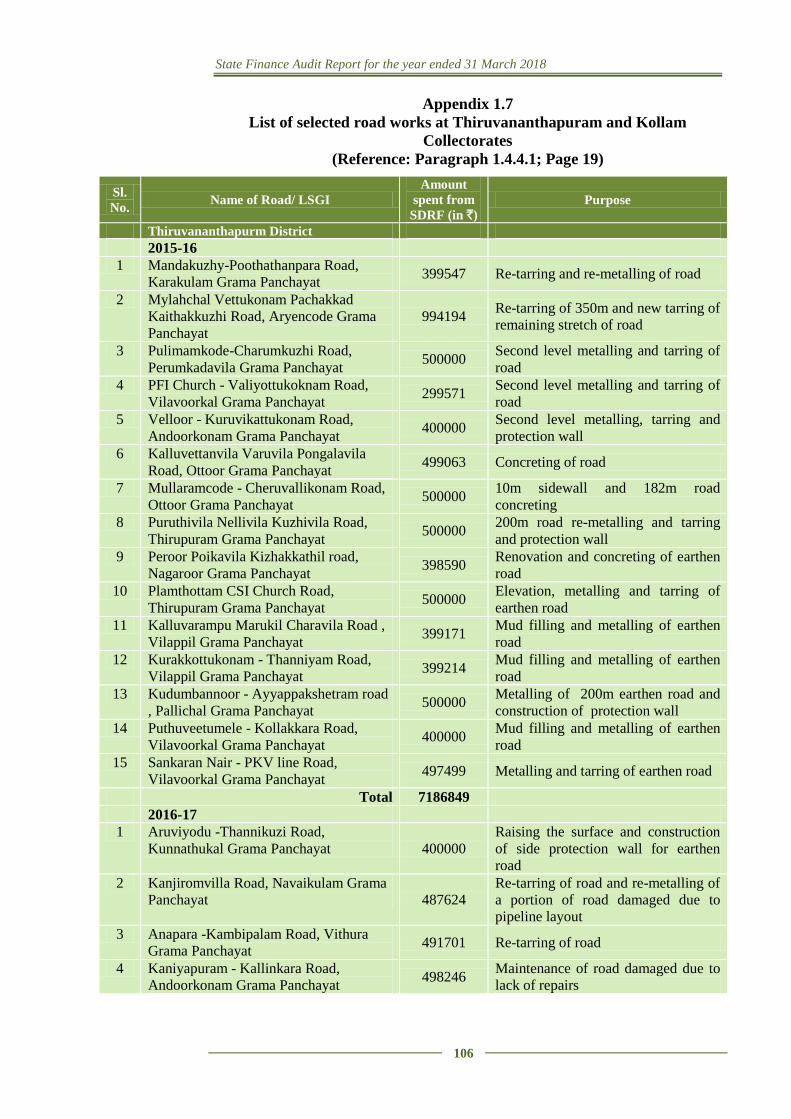
State Finance Audit Report for the year ended 31 March 2018
106
Appendix 1.7
List of selected road works at Thiruvananthapuram and Kollam
Collectorates
(Reference: Paragraph 1.4.4.1; Page 19)
Sl.
No. Name of Road/ LSGI
Amount
spent from
SDRF (in `)
Purpose
Thiruvananthapurm District
2015-16
1 Mandakuzhy-Poothathanpara Road,
Karakulam Grama Panchayat 399547 Re-tarring and re-metalling of road
2 Mylahchal Vettukonam Pachakkad
Kaithakkuzhi Road, Aryencode Grama
Panchayat
994194 Re-tarring of 350m and new tarring of
remaining stretch of road
3 Pulimamkode-Charumkuzhi Road,
Perumkadavila Grama Panchayat 500000
Second level metalling and tarring of
road
4 PFI Church - Valiyottukoknam Road,
Vilavoorkal Grama Panchayat 299571
Second level metalling and tarring of
road
5 Velloor - Kuruvikattukonam Road,
Andoorkonam Grama Panchayat 400000
Second level metalling, tarring and
protection wall
6 Kalluvettanvila Varuvila Pongalavila
Road, Ottoor Grama Panchayat 499063 Concreting of road
7 Mullaramcode - Cheruvallikonam Road,
Ottoor Grama Panchayat 500000
10m sidewall and 182m road
concreting
8 Puruthivila Nellivila Kuzhivila Road,
Thirupuram Grama Panchayat 500000
200m road re-metalling and tarring
and protection wall
9 Peroor Poikavila Kizhakkathil road,
Nagaroor Grama Panchayat 398590
Renovation and concreting of earthen
road
10 Plamthottam CSI Church Road,
Thirupuram Grama Panchayat 500000
Elevation, metalling and tarring of
earthen road
11 Kalluvarampu Marukil Charavila Road ,
Vilappil Grama Panchayat 399171
Mud filling and metalling of earthen
road
12 Kurakkottukonam - Thanniyam Road,
Vilappil Grama Panchayat 399214
Mud filling and metalling of earthen
road
13 Kudumbannoor - Ayyappakshetram road
, Pallichal Grama Panchayat 500000
Metalling of 200m earthen road and
construction of protection wall
14 Puthuveetumele - Kollakkara Road,
Vilavoorkal Grama Panchayat 400000
Mud filling and metalling of earthen
road
15 Sankaran Nair - PKV line Road,
Vilavoorkal Grama Panchayat 497499 Metalling and tarring of earthen road
Total 7186849
2016-17
1 Aruviyodu -Thannikuzi Road,
Kunnathukal Grama Panchayat 400000
Raising the surface and construction
of side protection wall for earthen
road
2 Kanjiromvilla Road, Navaikulam Grama
Panchayat 487624
Re-tarring of road and re-metalling of
a portion of road damaged due to
pipeline layout
3 Anapara -Kambipalam Road, Vithura
Grama Panchayat 491701 Re-tarring of road
4 Kaniyapuram - Kallinkara Road,
Andoorkonam Grama Panchayat 498246
Maintenance of road damaged due to
lack of repairs
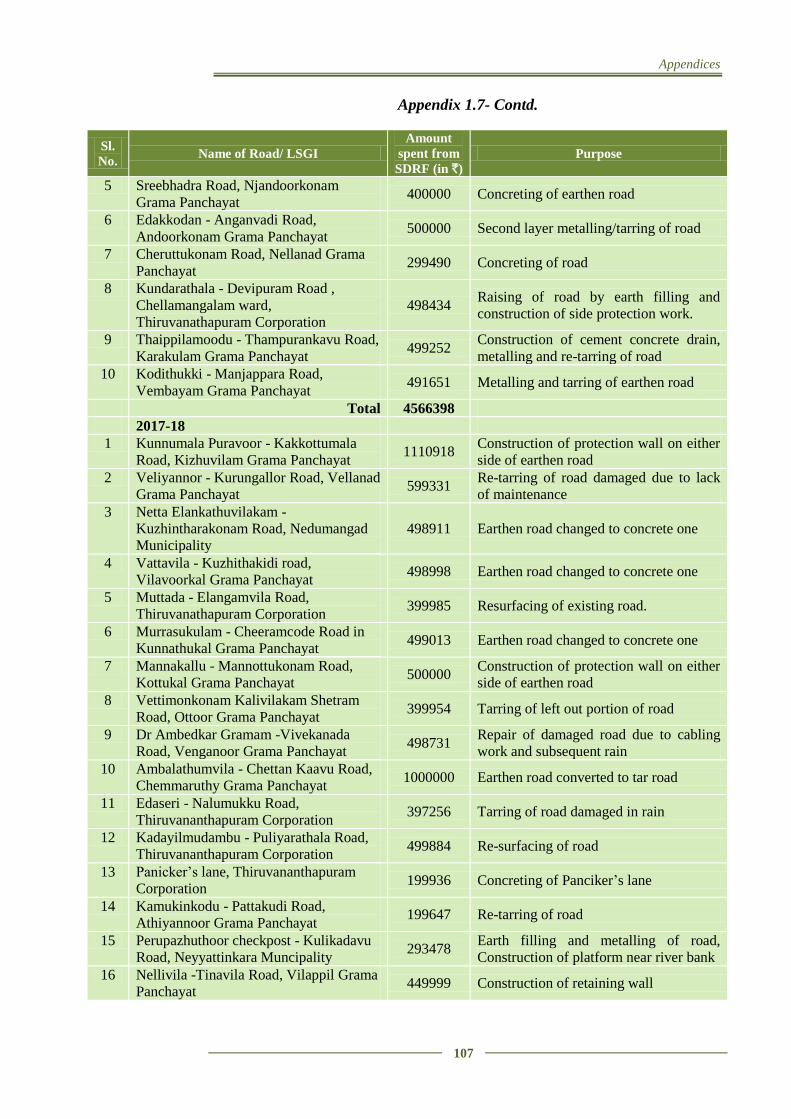
Appendices
107
Appendix 1.7- Contd.
Sl.
No. Name of Road/ LSGI
Amount
spent from
SDRF (in `)
Purpose
5 Sreebhadra Road, Njandoorkonam
Grama Panchayat 400000 Concreting of earthen road
6 Edakkodan - Anganvadi Road,
Andoorkonam Grama Panchayat 500000 Second layer metalling/tarring of road
7 Cheruttukonam Road, Nellanad Grama
Panchayat 299490 Concreting of road
8 Kundarathala - Devipuram Road ,
Chellamangalam ward,
Thiruvanathapuram Corporation
498434 Raising of road by earth filling and
construction of side protection work.
9 Thaippilamoodu - Thampurankavu Road,
Karakulam Grama Panchayat 499252
Construction of cement concrete drain,
metalling and re-tarring of road
10 Kodithukki - Manjappara Road,
Vembayam Grama Panchayat 491651 Metalling and tarring of earthen road
Total 4566398
2017-18
1 Kunnumala Puravoor - Kakkottumala
Road, Kizhuvilam Grama Panchayat 1110918
Construction of protection wall on either
side of earthen road
2 Veliyannor - Kurungallor Road, Vellanad
Grama Panchayat 599331
Re-tarring of road damaged due to lack
of maintenance
3 Netta Elankathuvilakam -
Kuzhintharakonam Road, Nedumangad
Municipality
498911 Earthen road changed to concrete one
4 Vattavila - Kuzhithakidi road,
Vilavoorkal Grama Panchayat 498998 Earthen road changed to concrete one
5 Muttada - Elangamvila Road,
Thiruvanathapuram Corporation 399985 Resurfacing of existing road.
6 Murrasukulam - Cheeramcode Road in
Kunnathukal Grama Panchayat 499013 Earthen road changed to concrete one
7 Mannakallu - Mannottukonam Road,
Kottukal Grama Panchayat 500000
Construction of protection wall on either
side of earthen road
8 Vettimonkonam Kalivilakam Shetram
Road, Ottoor Grama Panchayat 399954 Tarring of left out portion of road
9 Dr Ambedkar Gramam -Vivekanada
Road, Venganoor Grama Panchayat 498731
Repair of damaged road due to cabling
work and subsequent rain
10 Ambalathumvila - Chettan Kaavu Road,
Chemmaruthy Grama Panchayat 1000000 Earthen road converted to tar road
11 Edaseri - Nalumukku Road,
Thiruvananthapuram Corporation 397256 Tarring of road damaged in rain
12 Kadayilmudambu - Puliyarathala Road,
Thiruvananthapuram Corporation 499884 Re-surfacing of road
13 Panicker’s lane, Thiruvananthapuram
Corporation 199936 Concreting of Panciker’s lane
14 Kamukinkodu - Pattakudi Road,
Athiyannoor Grama Panchayat 199647 Re-tarring of road
15 Perupazhuthoor checkpost - Kulikadavu
Road, Neyyattinkara Muncipality 293478
Earth filling and metalling of road,
Construction of platform near river bank
16 Nellivila -Tinavila Road, Vilappil Grama
Panchayat 449999 Construction of retaining wall
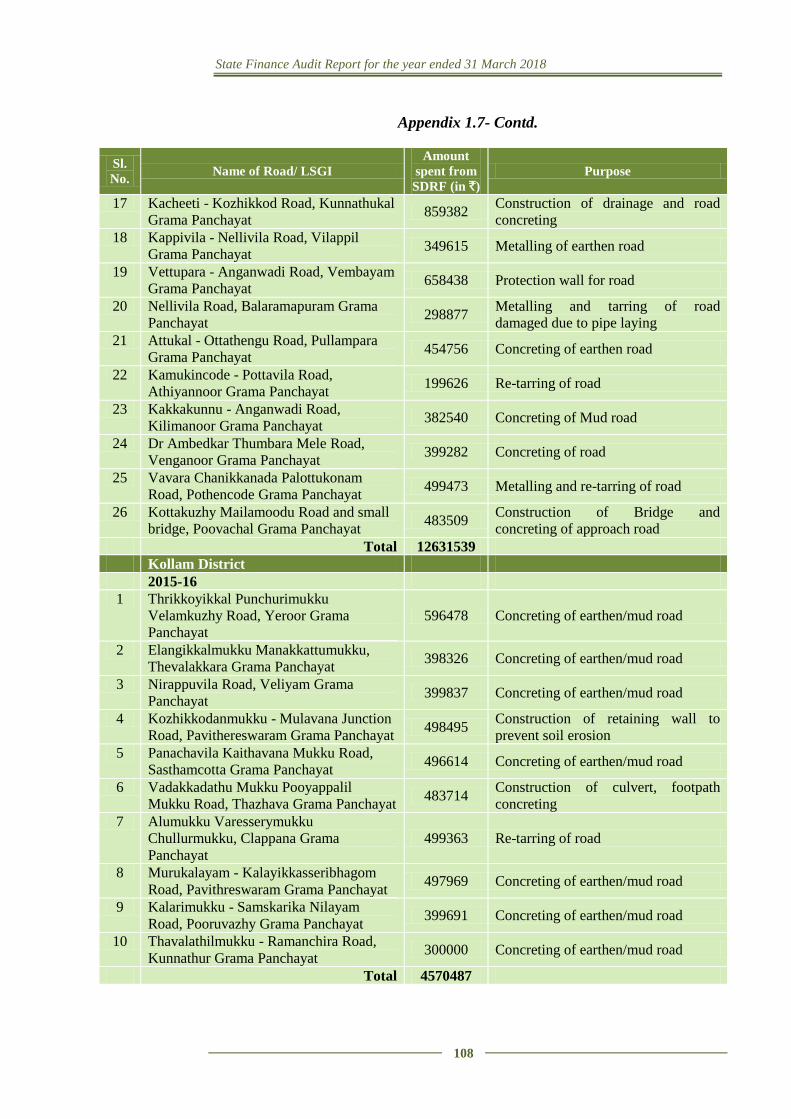
State Finance Audit Report for the year ended 31 March 2018
108
Appendix 1.7- Contd.
Sl.
No. Name of Road/ LSGI
Amount
spent from
SDRF (in `)
Purpose
17 Kacheeti - Kozhikkod Road, Kunnathukal
Grama Panchayat 859382
Construction of drainage and road
concreting
18 Kappivila - Nellivila Road, Vilappil
Grama Panchayat 349615 Metalling of earthen road
19 Vettupara - Anganwadi Road, Vembayam
Grama Panchayat 658438 Protection wall for road
20 Nellivila Road, Balaramapuram Grama
Panchayat 298877
Metalling and tarring of road
damaged due to pipe laying
21 Attukal - Ottathengu Road, Pullampara
Grama Panchayat 454756 Concreting of earthen road
22 Kamukincode - Pottavila Road,
Athiyannoor Grama Panchayat 199626 Re-tarring of road
23 Kakkakunnu - Anganwadi Road,
Kilimanoor Grama Panchayat 382540 Concreting of Mud road
24 Dr Ambedkar Thumbara Mele Road,
Venganoor Grama Panchayat 399282 Concreting of road
25 Vavara Chanikkanada Palottukonam
Road, Pothencode Grama Panchayat 499473 Metalling and re-tarring of road
26 Kottakuzhy Mailamoodu Road and small
bridge, Poovachal Grama Panchayat 483509
Construction of Bridge and
concreting of approach road
Total 12631539
Kollam District
2015-16
1 Thrikkoyikkal Punchurimukku
Velamkuzhy Road, Yeroor Grama
Panchayat
596478 Concreting of earthen/mud road
2 Elangikkalmukku Manakkattumukku,
Thevalakkara Grama Panchayat 398326 Concreting of earthen/mud road
3 Nirappuvila Road, Veliyam Grama
Panchayat 399837 Concreting of earthen/mud road
4 Kozhikkodanmukku - Mulavana Junction
Road, Pavithereswaram Grama Panchayat 498495
Construction of retaining wall to
prevent soil erosion
5 Panachavila Kaithavana Mukku Road,
Sasthamcotta Grama Panchayat 496614 Concreting of earthen/mud road
6 Vadakkadathu Mukku Pooyappalil
Mukku Road, Thazhava Grama Panchayat 483714
Construction of culvert, footpath
concreting
7 Alumukku Varesserymukku
Chullurmukku, Clappana Grama
Panchayat
499363 Re-tarring of road
8 Murukalayam - Kalayikkasseribhagom
Road, Pavithreswaram Grama Panchayat 497969 Concreting of earthen/mud road
9 Kalarimukku - Samskarika Nilayam
Road, Pooruvazhy Grama Panchayat 399691 Concreting of earthen/mud road
10 Thavalathilmukku - Ramanchira Road,
Kunnathur Grama Panchayat 300000 Concreting of earthen/mud road
Total 4570487
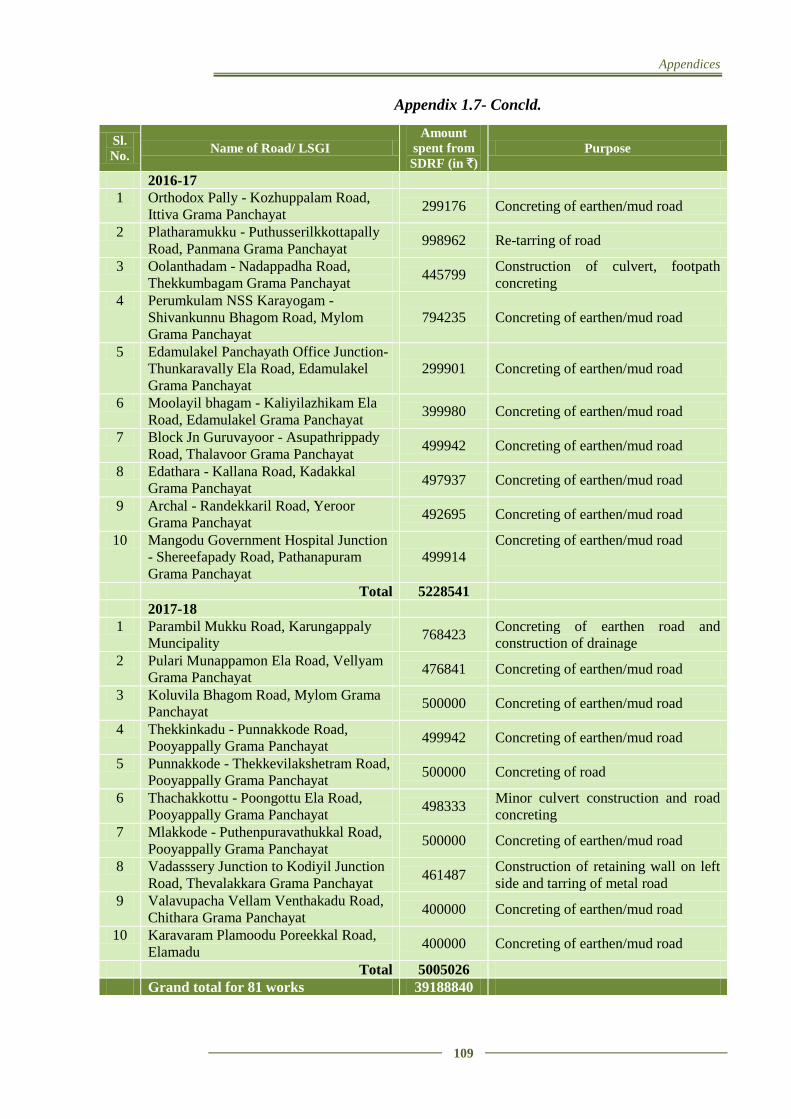
Appendices
109
Appendix 1.7- Concld.
Sl.
No. Name of Road/ LSGI
Amount
spent from
SDRF (in `)
Purpose
2016-17
1 Orthodox Pally - Kozhuppalam Road,
Ittiva Grama Panchayat 299176 Concreting of earthen/mud road
2 Platharamukku - Puthusserilkkottapally
Road, Panmana Grama Panchayat 998962 Re-tarring of road
3 Oolanthadam - Nadappadha Road,
Thekkumbagam Grama Panchayat 445799
Construction of culvert, footpath
concreting
4 Perumkulam NSS Karayogam -
Shivankunnu Bhagom Road, Mylom
Grama Panchayat
794235 Concreting of earthen/mud road
5 Edamulakel Panchayath Office Junction-
Thunkaravally Ela Road, Edamulakel
Grama Panchayat
299901 Concreting of earthen/mud road
6 Moolayil bhagam - Kaliyilazhikam Ela
Road, Edamulakel Grama Panchayat 399980 Concreting of earthen/mud road
7 Block Jn Guruvayoor - Asupathrippady
Road, Thalavoor Grama Panchayat 499942 Concreting of earthen/mud road
8 Edathara - Kallana Road, Kadakkal
Grama Panchayat 497937 Concreting of earthen/mud road
9 Archal - Randekkaril Road, Yeroor
Grama Panchayat 492695 Concreting of earthen/mud road
10 Mangodu Government Hospital Junction
- Shereefapady Road, Pathanapuram
Grama Panchayat
499914
Concreting of earthen/mud road
Total 5228541
2017-18
1 Parambil Mukku Road, Karungappaly
Muncipality 768423
Concreting of earthen road and
construction of drainage
2 Pulari Munappamon Ela Road, Vellyam
Grama Panchayat 476841 Concreting of earthen/mud road
3 Koluvila Bhagom Road, Mylom Grama
Panchayat 500000 Concreting of earthen/mud road
4 Thekkinkadu - Punnakkode Road,
Pooyappally Grama Panchayat 499942 Concreting of earthen/mud road
5 Punnakkode - Thekkevilakshetram Road,
Pooyappally Grama Panchayat 500000 Concreting of road
6 Thachakkottu - Poongottu Ela Road,
Pooyappally Grama Panchayat 498333
Minor culvert construction and road
concreting
7 Mlakkode - Puthenpuravathukkal Road,
Pooyappally Grama Panchayat 500000 Concreting of earthen/mud road
8 Vadasssery Junction to Kodiyil Junction
Road, Thevalakkara Grama Panchayat 461487
Construction of retaining wall on left
side and tarring of metal road
9 Valavupacha Vellam Venthakadu Road,
Chithara Grama Panchayat 400000 Concreting of earthen/mud road
10 Karavaram Plamoodu Poreekkal Road,
Elamadu 400000 Concreting of earthen/mud road
Total 5005026
Grand total for 81 works 39188840
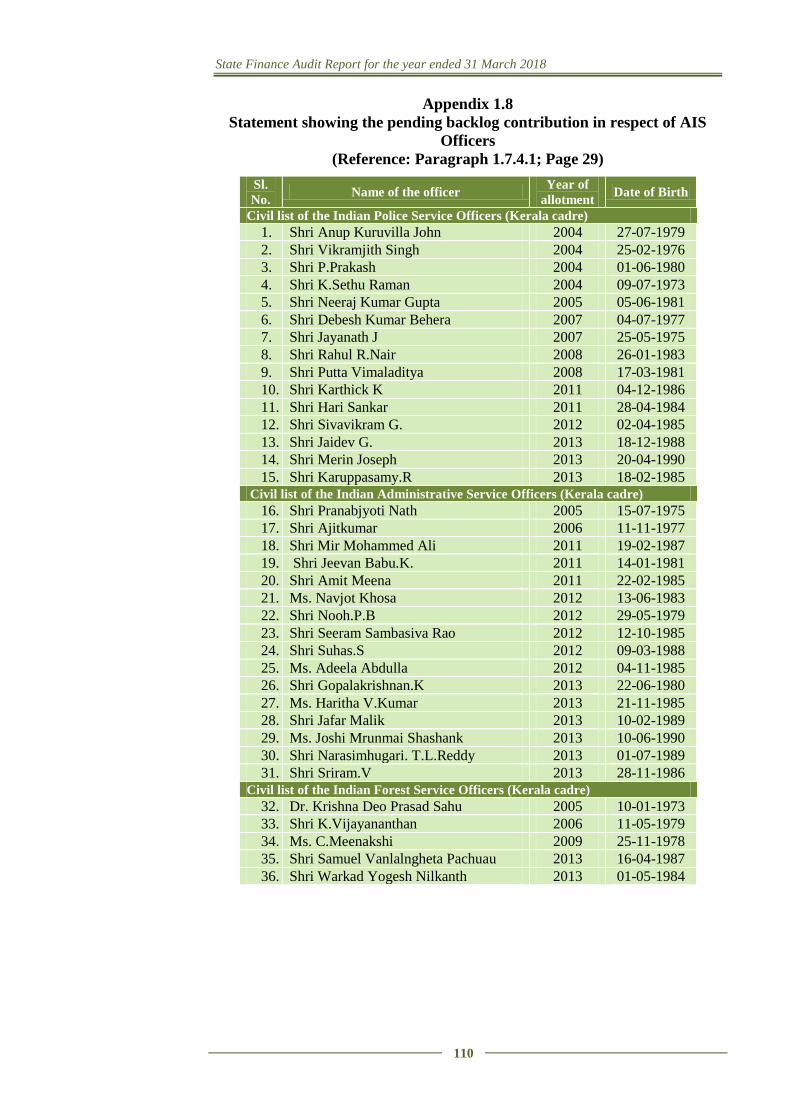
State Finance Audit Report for the year ended 31 March 2018
110
Appendix 1.8
Statement showing the pending backlog contribution in respect of AIS
Officers
(Reference: Paragraph 1.7.4.1; Page 29)
Sl.
No. Name of the officer
Year of
allotment Date of Birth
Civil list of the Indian Police Service Officers (Kerala cadre)
1. Shri Anup Kuruvilla John 2004 27-07-1979
2. Shri Vikramjith Singh 2004 25-02-1976
3. Shri P.Prakash 2004 01-06-1980
4. Shri K.Sethu Raman 2004 09-07-1973
5. Shri Neeraj Kumar Gupta 2005 05-06-1981
6. Shri Debesh Kumar Behera 2007 04-07-1977
7. Shri Jayanath J 2007 25-05-1975
8. Shri Rahul R.Nair 2008 26-01-1983
9. Shri Putta Vimaladitya 2008 17-03-1981
10. Shri Karthick K 2011 04-12-1986
11. Shri Hari Sankar 2011 28-04-1984
12. Shri Sivavikram G. 2012 02-04-1985
13. Shri Jaidev G. 2013 18-12-1988
14. Shri Merin Joseph 2013 20-04-1990
15. Shri Karuppasamy.R 2013 18-02-1985 Civil list of the Indian Administrative Service Officers (Kerala cadre)
16. Shri Pranabjyoti Nath 2005 15-07-1975
17. Shri Ajitkumar 2006 11-11-1977
18. Shri Mir Mohammed Ali 2011 19-02-1987
19. Shri Jeevan Babu.K. 2011 14-01-1981
20. Shri Amit Meena 2011 22-02-1985
21. Ms. Navjot Khosa 2012 13-06-1983
22. Shri Nooh.P.B 2012 29-05-1979
23. Shri Seeram Sambasiva Rao 2012 12-10-1985
24. Shri Suhas.S 2012 09-03-1988
25. Ms. Adeela Abdulla 2012 04-11-1985
26. Shri Gopalakrishnan.K 2013 22-06-1980
27. Ms. Haritha V.Kumar 2013 21-11-1985
28. Shri Jafar Malik 2013 10-02-1989
29. Ms. Joshi Mrunmai Shashank 2013 10-06-1990
30. Shri Narasimhugari. T.L.Reddy 2013 01-07-1989
31. Shri Sriram.V 2013 28-11-1986 Civil list of the Indian Forest Service Officers (Kerala cadre)
32. Dr. Krishna Deo Prasad Sahu 2005 10-01-1973
33. Shri K.Vijayananthan 2006 11-05-1979
34. Ms. C.Meenakshi 2009 25-11-1978
35. Shri Samuel Vanlalngheta Pachuau 2013 16-04-1987
36. Shri Warkad Yogesh Nilkanth 2013 01-05-1984
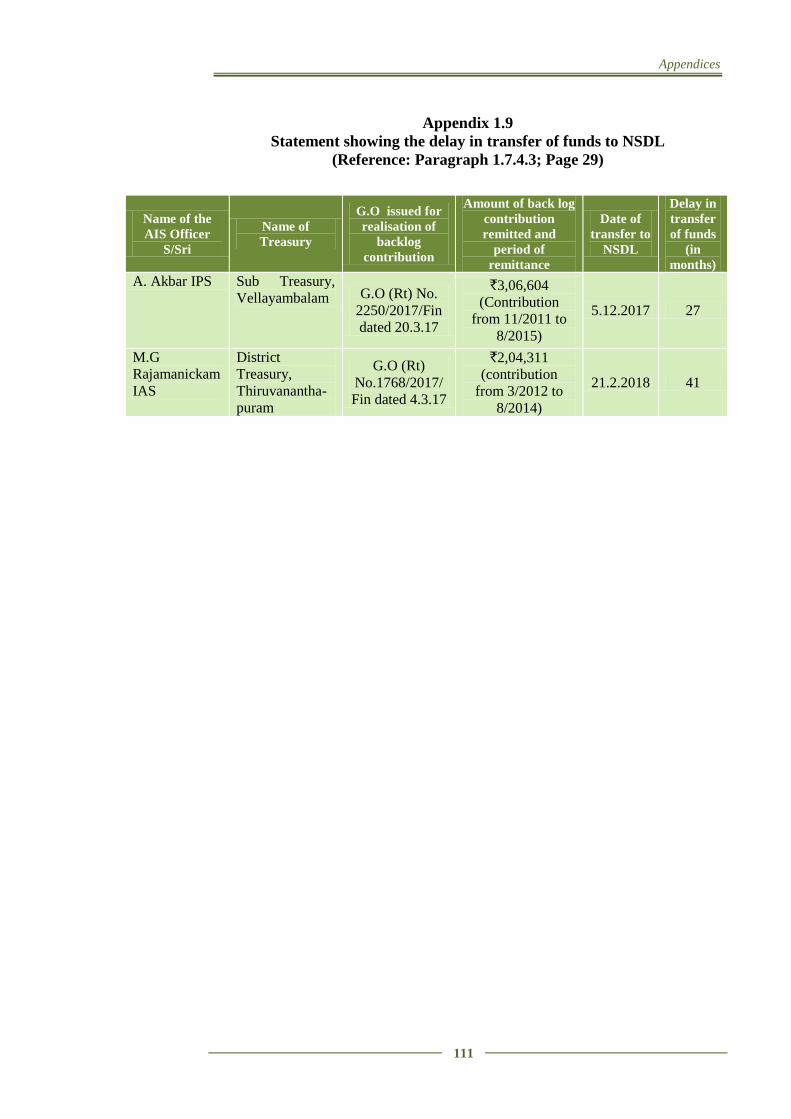
Appendices
111
Appendix 1.9
Statement showing the delay in transfer of funds to NSDL
(Reference: Paragraph 1.7.4.3; Page 29)
Name of the
AIS Officer
S/Sri
Name of
Treasury
G.O issued for
realisation of
backlog
contribution
Amount of back log
contribution
remitted and
period of
remittance
Date of
transfer to
NSDL
Delay in
transfer
of funds
(in
months)
A. Akbar IPS Sub Treasury,
Vellayambalam G.O (Rt) No.
2250/2017/Fin
dated 20.3.17
`3,06,604
(Contribution
from 11/2011 to
8/2015)
5.12.2017 27
M.G
Rajamanickam
IAS
District
Treasury,
Thiruvanantha-
puram
G.O (Rt)
No.1768/2017/
Fin dated 4.3.17
`2,04,311
(contribution
from 3/2012 to
8/2014)
21.2.2018 41
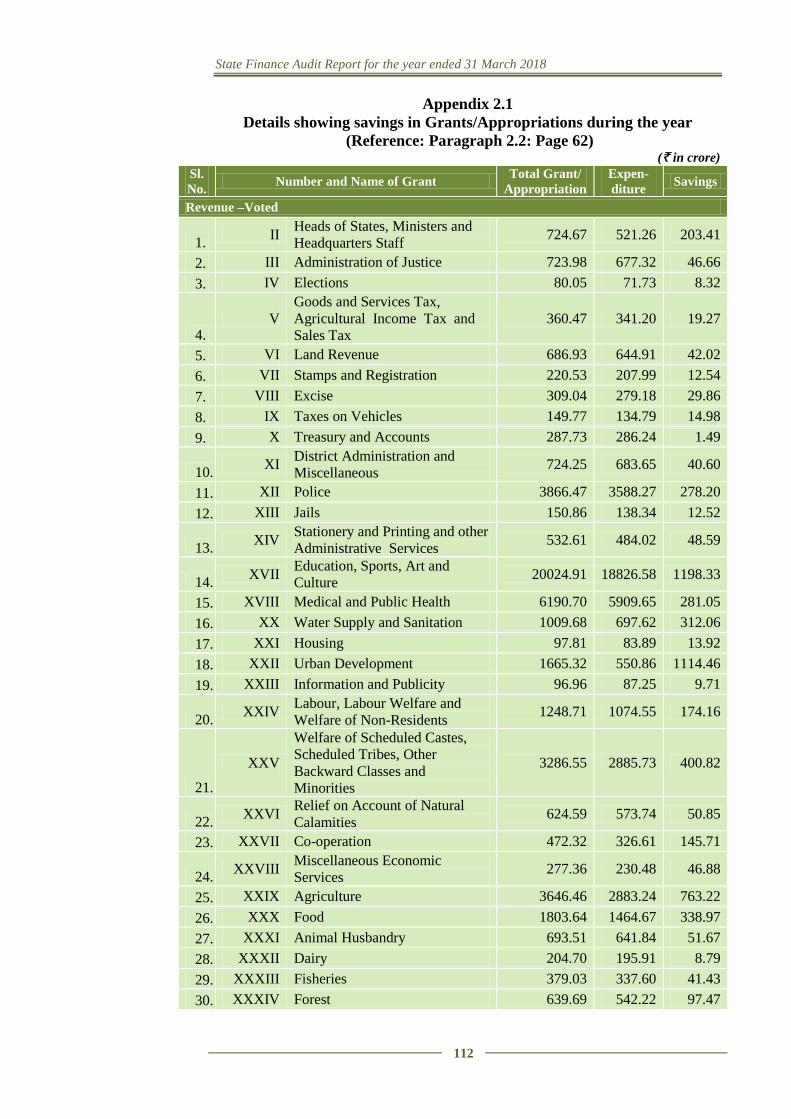
State Finance Audit Report for the year ended 31 March 2018
112
Appendix 2.1
Details showing savings in Grants/Appropriations during the year
(Reference: Paragraph 2.2: Page 62) (` in crore)
Sl.
No. Number and Name of Grant
Total Grant/
Appropriation
Expen-
diture Savings
Revenue –Voted
1. II
Heads of States, Ministers and
Headquarters Staff 724.67 521.26 203.41
2. III Administration of Justice 723.98 677.32 46.66
3. IV Elections 80.05 71.73 8.32
4. V
Goods and Services Tax,
Agricultural Income Tax and
Sales Tax 360.47 341.20 19.27
5. VI Land Revenue 686.93 644.91 42.02
6. VII Stamps and Registration 220.53 207.99 12.54
7. VIII Excise 309.04 279.18 29.86
8. IX Taxes on Vehicles 149.77 134.79 14.98
9. X Treasury and Accounts 287.73 286.24 1.49
10. XI
District Administration and
Miscellaneous 724.25 683.65 40.60
11. XII Police 3866.47 3588.27 278.20
12. XIII Jails 150.86 138.34 12.52
13. XIV
Stationery and Printing and other
Administrative Services 532.61 484.02 48.59
14. XVII
Education, Sports, Art and
Culture 20024.91 18826.58 1198.33
15. XVIII Medical and Public Health 6190.70 5909.65 281.05
16. XX Water Supply and Sanitation 1009.68 697.62 312.06
17. XXI Housing 97.81 83.89 13.92
18. XXII Urban Development 1665.32 550.86 1114.46
19. XXIII Information and Publicity 96.96 87.25 9.71
20. XXIV
Labour, Labour Welfare and
Welfare of Non-Residents 1248.71 1074.55 174.16
21.
XXV
Welfare of Scheduled Castes,
Scheduled Tribes, Other
Backward Classes and
Minorities
3286.55 2885.73 400.82
22. XXVI
Relief on Account of Natural
Calamities 624.59 573.74 50.85
23. XXVII Co-operation 472.32 326.61 145.71
24. XXVIII
Miscellaneous Economic
Services 277.36 230.48 46.88
25. XXIX Agriculture 3646.46 2883.24 763.22
26. XXX Food 1803.64 1464.67 338.97
27. XXXI Animal Husbandry 693.51 641.84 51.67
28. XXXII Dairy 204.70 195.91 8.79
29. XXXIII Fisheries 379.03 337.60 41.43
30. XXXIV Forest 639.69 542.22 97.47
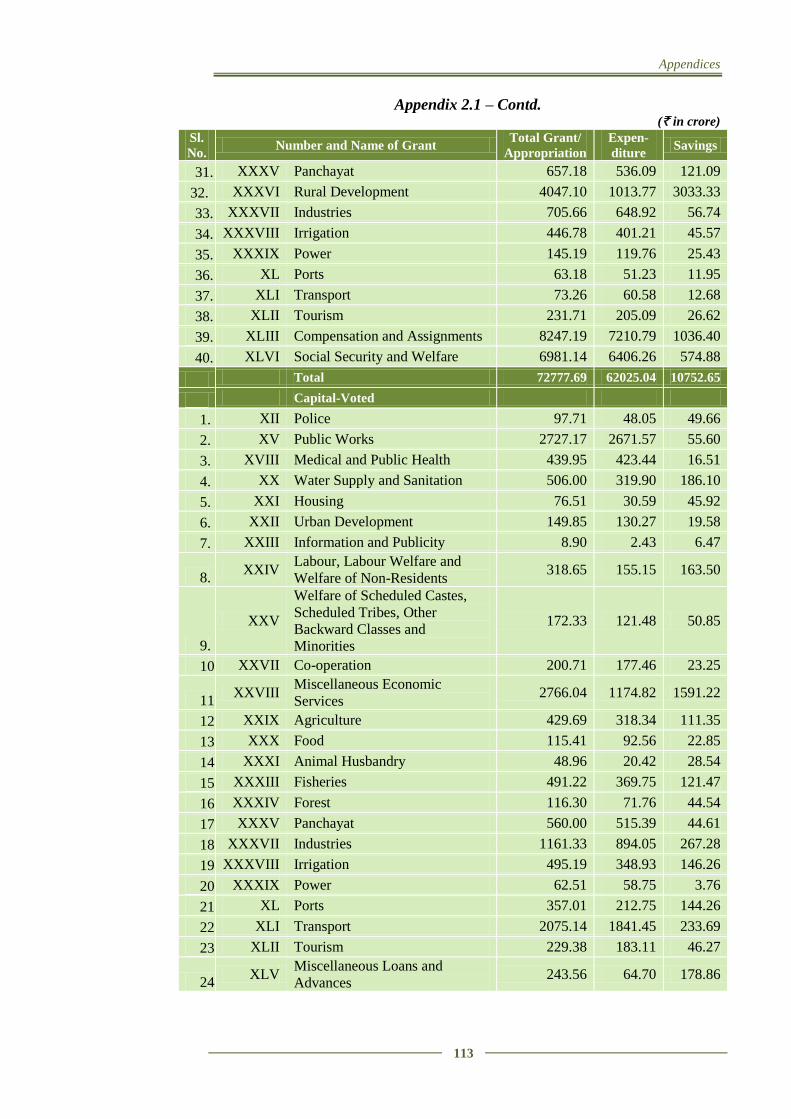
Appendices
113
Appendix 2.1 – Contd. (` in crore)
Sl.
No. Number and Name of Grant
Total Grant/
Appropriation
Expen-
diture Savings
31. XXXV Panchayat 657.18 536.09 121.09
32. XXXVI Rural Development 4047.10 1013.77 3033.33
33. XXXVII Industries 705.66 648.92 56.74
34. XXXVIII Irrigation 446.78 401.21 45.57
35. XXXIX Power 145.19 119.76 25.43
36. XL Ports 63.18 51.23 11.95
37. XLI Transport 73.26 60.58 12.68
38. XLII Tourism 231.71 205.09 26.62
39. XLIII Compensation and Assignments 8247.19 7210.79 1036.40
40. XLVI Social Security and Welfare 6981.14 6406.26 574.88
Total 72777.69 62025.04 10752.65
Capital-Voted
1. XII Police 97.71 48.05 49.66
2. XV Public Works 2727.17 2671.57 55.60
3. XVIII Medical and Public Health 439.95 423.44 16.51
4. XX Water Supply and Sanitation 506.00 319.90 186.10
5. XXI Housing 76.51 30.59 45.92
6. XXII Urban Development 149.85 130.27 19.58
7. XXIII Information and Publicity 8.90 2.43 6.47
8. XXIV
Labour, Labour Welfare and
Welfare of Non-Residents 318.65 155.15 163.50
9.
XXV
Welfare of Scheduled Castes,
Scheduled Tribes, Other
Backward Classes and
Minorities
172.33 121.48 50.85
10. XXVII Co-operation 200.71 177.46 23.25
11. XXVIII
Miscellaneous Economic
Services 2766.04 1174.82 1591.22
12. XXIX Agriculture 429.69 318.34 111.35
13. XXX Food 115.41 92.56 22.85
14. XXXI Animal Husbandry 48.96 20.42 28.54
15. XXXIII Fisheries 491.22 369.75 121.47
16. XXXIV Forest 116.30 71.76 44.54
17. XXXV Panchayat 560.00 515.39 44.61
18. XXXVII Industries 1161.33 894.05 267.28
19. XXXVIII Irrigation 495.19 348.93 146.26
20. XXXIX Power 62.51 58.75 3.76
21. XL Ports 357.01 212.75 144.26
22. XLI Transport 2075.14 1841.45 233.69
23. XLII Tourism 229.38 183.11 46.27
24. XLV
Miscellaneous Loans and
Advances 243.56 64.70 178.86
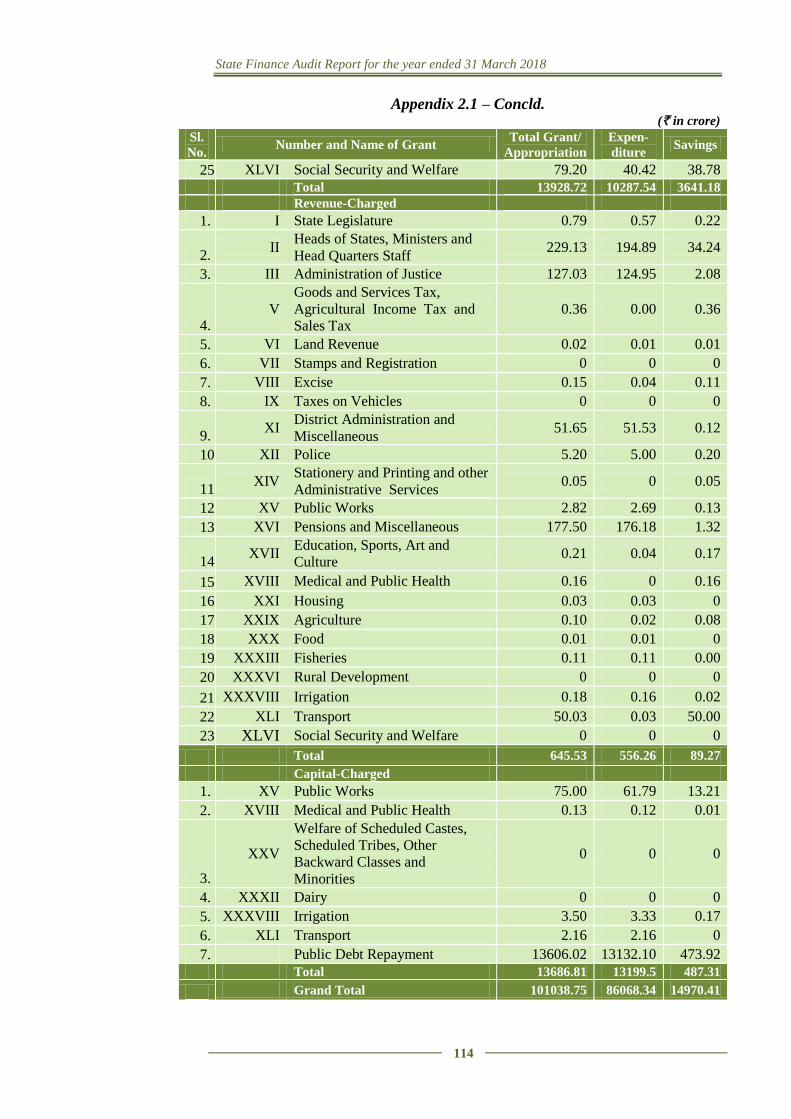
State Finance Audit Report for the year ended 31 March 2018
114
Appendix 2.1 – Concld. (` in crore)
Sl.
No. Number and Name of Grant
Total Grant/
Appropriation
Expen-
diture Savings
25. XLVI Social Security and Welfare 79.20 40.42 38.78 Total 13928.72 10287.54 3641.18
Revenue-Charged
1. I State Legislature 0.79 0.57 0.22
2. II
Heads of States, Ministers and
Head Quarters Staff 229.13 194.89 34.24
3. III Administration of Justice 127.03 124.95 2.08
4. V
Goods and Services Tax,
Agricultural Income Tax and
Sales Tax 0.36 0.00 0.36
5. VI Land Revenue 0.02 0.01 0.01
6. VII Stamps and Registration 0 0 0
7. VIII Excise 0.15 0.04 0.11
8. IX Taxes on Vehicles 0 0 0
9. XI
District Administration and
Miscellaneous 51.65 51.53 0.12
10. XII Police 5.20 5.00 0.20
11. XIV
Stationery and Printing and other
Administrative Services 0.05 0 0.05
12. XV Public Works 2.82 2.69 0.13
13. XVI Pensions and Miscellaneous 177.50 176.18 1.32
14. XVII
Education, Sports, Art and
Culture 0.21 0.04 0.17
15. XVIII Medical and Public Health 0.16 0 0.16
16. XXI Housing 0.03 0.03 0
17. XXIX Agriculture 0.10 0.02 0.08
18. XXX Food 0.01 0.01 0
19. XXXIII Fisheries 0.11 0.11 0.00
20. XXXVI Rural Development 0 0 0
21. XXXVIII Irrigation 0.18 0.16 0.02
22. XLI Transport 50.03 0.03 50.00
23. XLVI Social Security and Welfare 0 0 0
Total 645.53 556.26 89.27
Capital-Charged
1. XV Public Works 75.00 61.79 13.21
2. XVIII Medical and Public Health 0.13 0.12 0.01
3.
XXV
Welfare of Scheduled Castes,
Scheduled Tribes, Other
Backward Classes and
Minorities
0 0 0
4. XXXII Dairy 0 0 0
5. XXXVIII Irrigation 3.50 3.33 0.17
6. XLI Transport 2.16 2.16 0
7. Public Debt Repayment 13606.02 13132.10 473.92 Total 13686.81 13199.5 487.31
Grand Total 101038.75 86068.34 14970.41
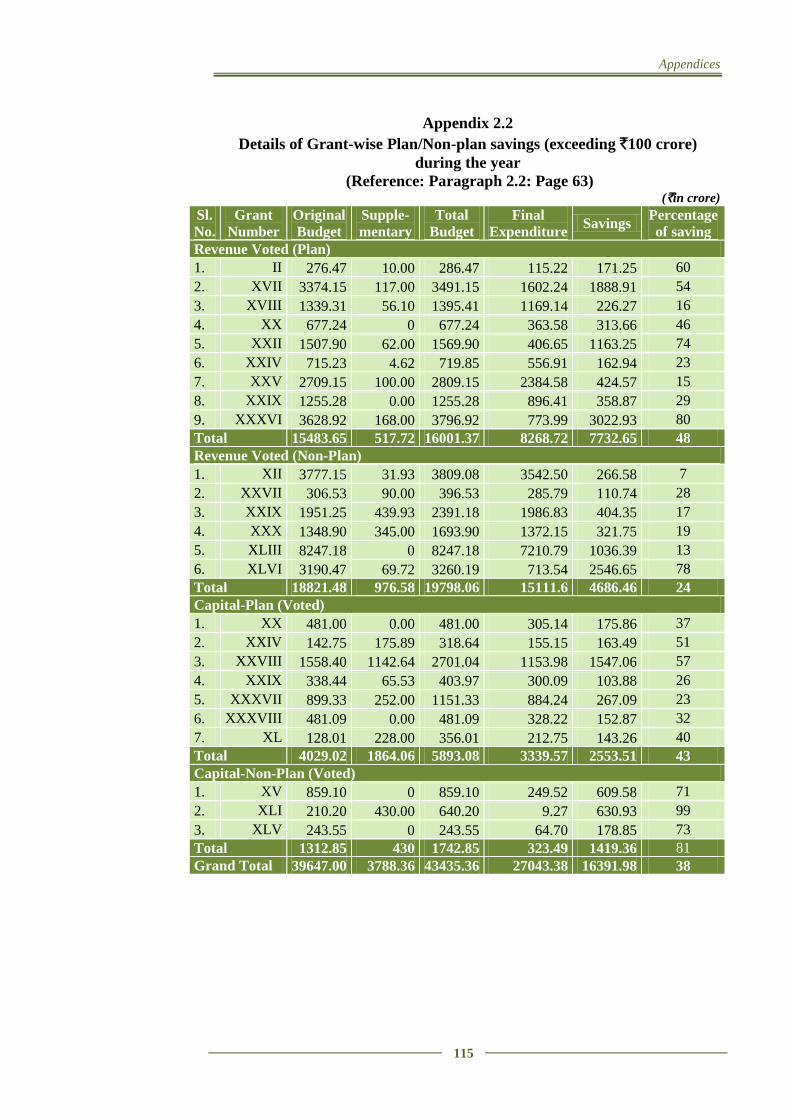
Appendices
115
Appendix 2.2
Details of Grant-wise Plan/Non-plan savings (exceeding `100 crore)
during the year
(Reference: Paragraph 2.2: Page 63) (`in crore)
Sl.
No. Grant
Number Original
Budget Supple-
mentary Total
Budget Final
Expenditure Savings
Percentage
of saving Revenue Voted (Plan)
1. II 276.47 10.00 286.47 115.22 171.25 60
2. XVII 3374.15 117.00 3491.15 1602.24 1888.91 54
3. XVIII 1339.31 56.10 1395.41 1169.14 226.27 16
4. XX 677.24 0 677.24 363.58 313.66 46
5. XXII 1507.90 62.00 1569.90 406.65 1163.25 74
6. XXIV 715.23 4.62 719.85 556.91 162.94 23
7. XXV 2709.15 100.00 2809.15 2384.58 424.57 15
8. XXIX 1255.28 0.00 1255.28 896.41 358.87 29
9. XXXVI 3628.92 168.00 3796.92 773.99 3022.93 80
Total 15483.65 517.72 16001.37 8268.72 7732.65 48 Revenue Voted (Non-Plan)
1. XII 3777.15 31.93 3809.08 3542.50 266.58 7
2. XXVII 306.53 90.00 396.53 285.79 110.74 28
3. XXIX 1951.25 439.93 2391.18 1986.83 404.35 17
4. XXX 1348.90 345.00 1693.90 1372.15 321.75 19
5. XLIII 8247.18 0 8247.18 7210.79 1036.39 13
6. XLVI 3190.47 69.72 3260.19 713.54 2546.65 78
Total 18821.48 976.58 19798.06 15111.6 4686.46 24 Capital-Plan (Voted)
1. XX 481.00 0.00 481.00 305.14 175.86 37
2. XXIV 142.75 175.89 318.64 155.15 163.49 51
3. XXVIII 1558.40 1142.64 2701.04 1153.98 1547.06 57
4. XXIX 338.44 65.53 403.97 300.09 103.88 26
5. XXXVII 899.33 252.00 1151.33 884.24 267.09 23
6. XXXVIII 481.09 0.00 481.09 328.22 152.87 32
7. XL 128.01 228.00 356.01 212.75 143.26 40
Total 4029.02 1864.06 5893.08 3339.57 2553.51 43 Capital-Non-Plan (Voted)
1. XV 859.10 0 859.10 249.52 609.58 71
2. XLI 210.20 430.00 640.20 9.27 630.93 99
3. XLV 243.55 0 243.55 64.70 178.85 73
Total 1312.85 430 1742.85 323.49 1419.36 81 Grand Total 39647.00 3788.36 43435.36 27043.38 16391.98 38
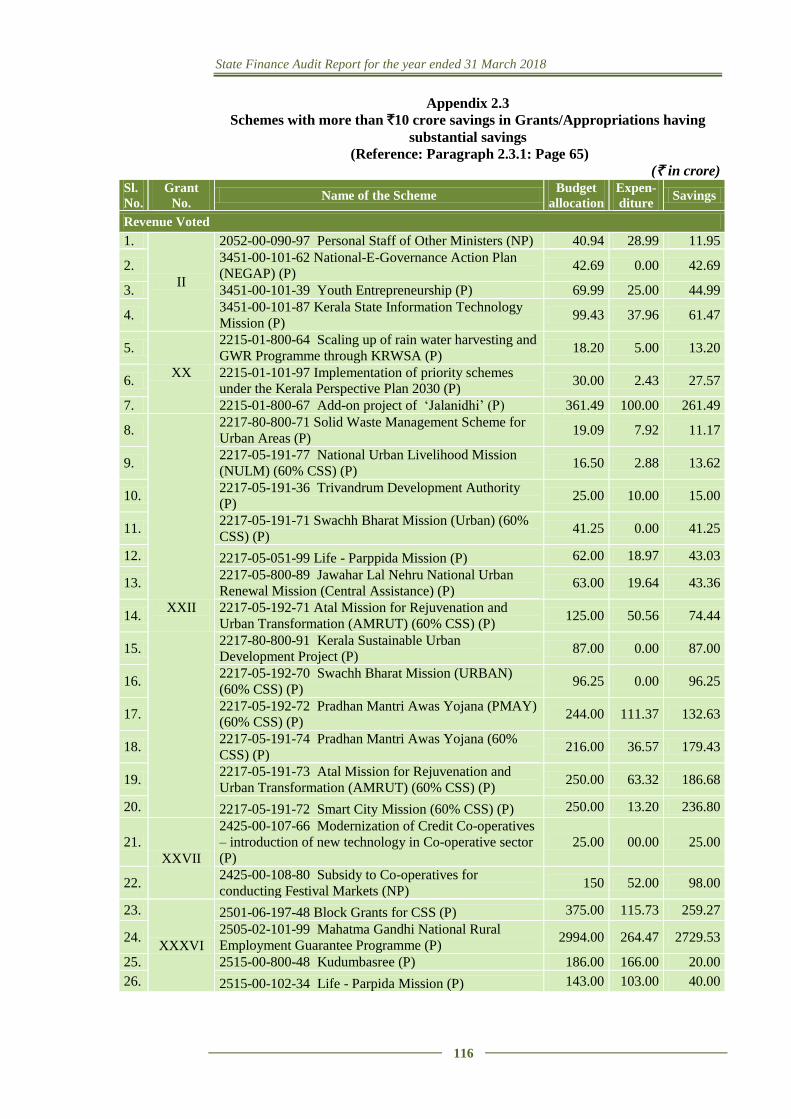
State Finance Audit Report for the year ended 31 March 2018
116
Appendix 2.3
Schemes with more than `10 crore savings in Grants/Appropriations having
substantial savings
(Reference: Paragraph 2.3.1: Page 65)
(` in crore) Sl.
No.
Grant
No. Name of the Scheme
Budget
allocation
Expen-
diture Savings
Revenue Voted
1.
II
2052-00-090-97 Personal Staff of Other Ministers (NP) 40.94 28.99 11.95
2. 3451-00-101-62 National-E-Governance Action Plan
(NEGAP) (P) 42.69 0.00 42.69
3. 3451-00-101-39 Youth Entrepreneurship (P) 69.99 25.00 44.99
4. 3451-00-101-87 Kerala State Information Technology
Mission (P) 99.43 37.96 61.47
5.
XX
2215-01-800-64 Scaling up of rain water harvesting and
GWR Programme through KRWSA (P) 18.20 5.00 13.20
6. 2215-01-101-97 Implementation of priority schemes
under the Kerala Perspective Plan 2030 (P) 30.00 2.43 27.57
7. 2215-01-800-67 Add-on project of ‘Jalanidhi’ (P) 361.49 100.00 261.49
8.
XXII
2217-80-800-71 Solid Waste Management Scheme for
Urban Areas (P) 19.09 7.92 11.17
9. 2217-05-191-77 National Urban Livelihood Mission
(NULM) (60% CSS) (P) 16.50 2.88 13.62
10. 2217-05-191-36 Trivandrum Development Authority
(P) 25.00 10.00 15.00
11. 2217-05-191-71 Swachh Bharat Mission (Urban) (60%
CSS) (P) 41.25 0.00 41.25
12. 2217-05-051-99 Life - Parppida Mission (P) 62.00 18.97 43.03
13. 2217-05-800-89 Jawahar Lal Nehru National Urban
Renewal Mission (Central Assistance) (P) 63.00 19.64 43.36
14. 2217-05-192-71 Atal Mission for Rejuvenation and
Urban Transformation (AMRUT) (60% CSS) (P) 125.00 50.56 74.44
15. 2217-80-800-91 Kerala Sustainable Urban
Development Project (P) 87.00 0.00 87.00
16. 2217-05-192-70 Swachh Bharat Mission (URBAN)
(60% CSS) (P) 96.25 0.00 96.25
17. 2217-05-192-72 Pradhan Mantri Awas Yojana (PMAY)
(60% CSS) (P) 244.00 111.37 132.63
18. 2217-05-191-74 Pradhan Mantri Awas Yojana (60%
CSS) (P) 216.00 36.57 179.43
19. 2217-05-191-73 Atal Mission for Rejuvenation and
Urban Transformation (AMRUT) (60% CSS) (P) 250.00 63.32 186.68
20. 2217-05-191-72 Smart City Mission (60% CSS) (P) 250.00 13.20 236.80
21.
XXVII
2425-00-107-66 Modernization of Credit Co-operatives
– introduction of new technology in Co-operative sector
(P)
25.00 00.00 25.00
22. 2425-00-108-80 Subsidy to Co-operatives for
conducting Festival Markets (NP) 150 52.00 98.00
23.
XXXVI
2501-06-197-48 Block Grants for CSS (P) 375.00 115.73 259.27
24. 2505-02-101-99 Mahatma Gandhi National Rural
Employment Guarantee Programme (P) 2994.00 264.47 2729.53
25. 2515-00-800-48 Kudumbasree (P) 186.00 166.00 20.00
26. 2515-00-102-34 Life - Parpida Mission (P) 143.00 103.00 40.00
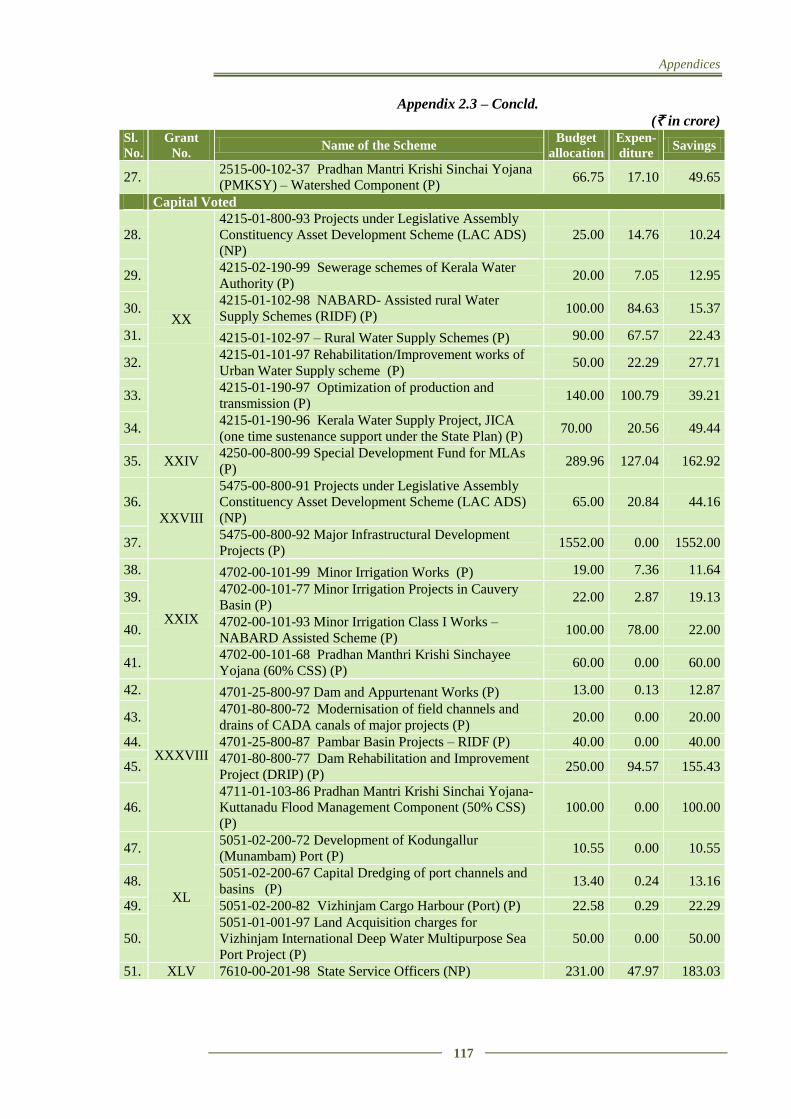
Appendices
117
Appendix 2.3 – Concld.
(` in crore) Sl.
No.
Grant
No. Name of the Scheme
Budget
allocation
Expen-
diture Savings
27. 2515-00-102-37 Pradhan Mantri Krishi Sinchai Yojana
(PMKSY) – Watershed Component (P) 66.75 17.10 49.65
Capital Voted
28.
XX
4215-01-800-93 Projects under Legislative Assembly
Constituency Asset Development Scheme (LAC ADS)
(NP)
25.00 14.76 10.24
29. 4215-02-190-99 Sewerage schemes of Kerala Water
Authority (P) 20.00 7.05 12.95
30. 4215-01-102-98 NABARD- Assisted rural Water
Supply Schemes (RIDF) (P) 100.00 84.63 15.37
31. 4215-01-102-97 – Rural Water Supply Schemes (P) 90.00 67.57 22.43
32. 4215-01-101-97 Rehabilitation/Improvement works of
Urban Water Supply scheme (P) 50.00 22.29 27.71
33. 4215-01-190-97 Optimization of production and
transmission (P) 140.00 100.79 39.21
34. 4215-01-190-96 Kerala Water Supply Project, JICA
(one time sustenance support under the State Plan) (P) 70.00 20.56 49.44
35. XXIV 4250-00-800-99 Special Development Fund for MLAs
(P) 289.96 127.04 162.92
36.
XXVIII
5475-00-800-91 Projects under Legislative Assembly
Constituency Asset Development Scheme (LAC ADS)
(NP)
65.00 20.84 44.16
37. 5475-00-800-92 Major Infrastructural Development
Projects (P) 1552.00 0.00 1552.00
38.
XXIX
4702-00-101-99 Minor Irrigation Works (P) 19.00 7.36 11.64
39. 4702-00-101-77 Minor Irrigation Projects in Cauvery
Basin (P) 22.00 2.87 19.13
40. 4702-00-101-93 Minor Irrigation Class I Works –
NABARD Assisted Scheme (P) 100.00 78.00 22.00
41. 4702-00-101-68 Pradhan Manthri Krishi Sinchayee
Yojana (60% CSS) (P) 60.00 0.00 60.00
42.
XXXVIII
4701-25-800-97 Dam and Appurtenant Works (P) 13.00 0.13 12.87
43. 4701-80-800-72 Modernisation of field channels and
drains of CADA canals of major projects (P) 20.00 0.00 20.00
44. 4701-25-800-87 Pambar Basin Projects – RIDF (P) 40.00 0.00 40.00
45. 4701-80-800-77 Dam Rehabilitation and Improvement
Project (DRIP) (P) 250.00 94.57 155.43
46.
4711-01-103-86 Pradhan Mantri Krishi Sinchai Yojana-
Kuttanadu Flood Management Component (50% CSS)
(P)
100.00 0.00 100.00
47.
XL
5051-02-200-72 Development of Kodungallur
(Munambam) Port (P) 10.55 0.00 10.55
48. 5051-02-200-67 Capital Dredging of port channels and
basins (P) 13.40 0.24 13.16
49. 5051-02-200-82 Vizhinjam Cargo Harbour (Port) (P) 22.58 0.29 22.29
50.
5051-01-001-97 Land Acquisition charges for
Vizhinjam International Deep Water Multipurpose Sea
Port Project (P)
50.00 0.00 50.00
51. XLV 7610-00-201-98 State Service Officers (NP) 231.00 47.97 183.03
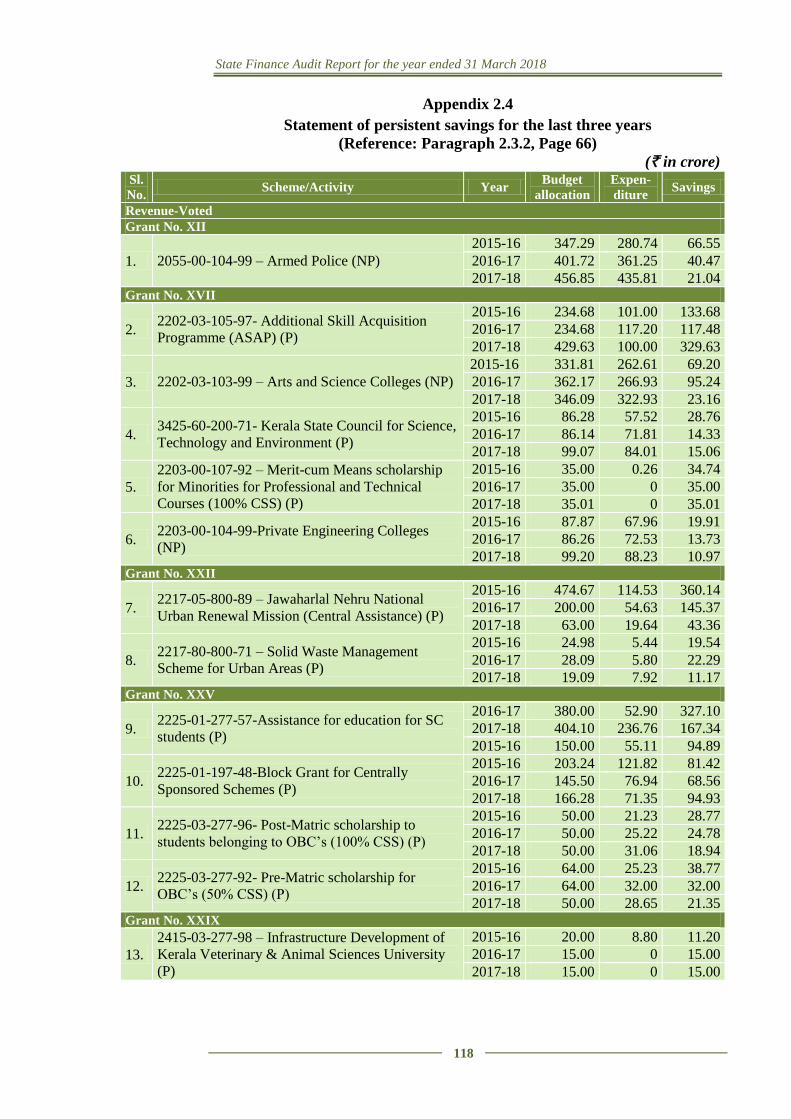
State Finance Audit Report for the year ended 31 March 2018
118
Appendix 2.4
Statement of persistent savings for the last three years
(Reference: Paragraph 2.3.2, Page 66)
(` in crore) Sl.
No. Scheme/Activity Year
Budget
allocation
Expen-
diture Savings
Revenue-Voted
Grant No. XII
1. 2055-00-104-99 – Armed Police (NP) 2015-16 347.29 280.74 66.55 2016-17 401.72 361.25 40.47 2017-18 456.85 435.81 21.04
Grant No. XVII
2. 2202-03-105-97- Additional Skill Acquisition
Programme (ASAP) (P)
2015-16 234.68 101.00 133.68 2016-17 234.68 117.20 117.48 2017-18 429.63 100.00 329.63
3. 2202-03-103-99 – Arts and Science Colleges (NP) 2015-16 331.81 262.61 69.20 2016-17 362.17 266.93 95.24 2017-18 346.09 322.93 23.16
4. 3425-60-200-71- Kerala State Council for Science,
Technology and Environment (P)
2015-16 86.28 57.52 28.76 2016-17 86.14 71.81 14.33 2017-18 99.07 84.01 15.06
5. 2203-00-107-92 – Merit-cum Means scholarship
for Minorities for Professional and Technical
Courses (100% CSS) (P)
2015-16 35.00 0.26 34.74 2016-17 35.00 0 35.00 2017-18 35.01 0 35.01
6. 2203-00-104-99-Private Engineering Colleges
(NP)
2015-16 87.87 67.96 19.91 2016-17 86.26 72.53 13.73 2017-18 99.20 88.23 10.97
Grant No. XXII
7. 2217-05-800-89 – Jawaharlal Nehru National
Urban Renewal Mission (Central Assistance) (P)
2015-16 474.67 114.53 360.14 2016-17 200.00 54.63 145.37 2017-18 63.00 19.64 43.36
8. 2217-80-800-71 – Solid Waste Management
Scheme for Urban Areas (P)
2015-16 24.98 5.44 19.54 2016-17 28.09 5.80 22.29 2017-18 19.09 7.92 11.17
Grant No. XXV
9. 2225-01-277-57-Assistance for education for SC
students (P)
2016-17 380.00 52.90 327.10 2017-18 404.10 236.76 167.34 2015-16 150.00 55.11 94.89
10. 2225-01-197-48-Block Grant for Centrally
Sponsored Schemes (P)
2015-16 203.24 121.82 81.42 2016-17 145.50 76.94 68.56 2017-18 166.28 71.35 94.93
11. 2225-03-277-96- Post-Matric scholarship to
students belonging to OBC’s (100% CSS) (P)
2015-16 50.00 21.23 28.77 2016-17 50.00 25.22 24.78 2017-18 50.00 31.06 18.94
12. 2225-03-277-92- Pre-Matric scholarship for
OBC’s (50% CSS) (P)
2015-16 64.00 25.23 38.77 2016-17 64.00 32.00 32.00 2017-18 50.00 28.65 21.35
Grant No. XXIX
13. 2415-03-277-98 – Infrastructure Development of
Kerala Veterinary & Animal Sciences University
(P)
2015-16 20.00 8.80 11.20 2016-17 15.00 0 15.00 2017-18 15.00 0 15.00
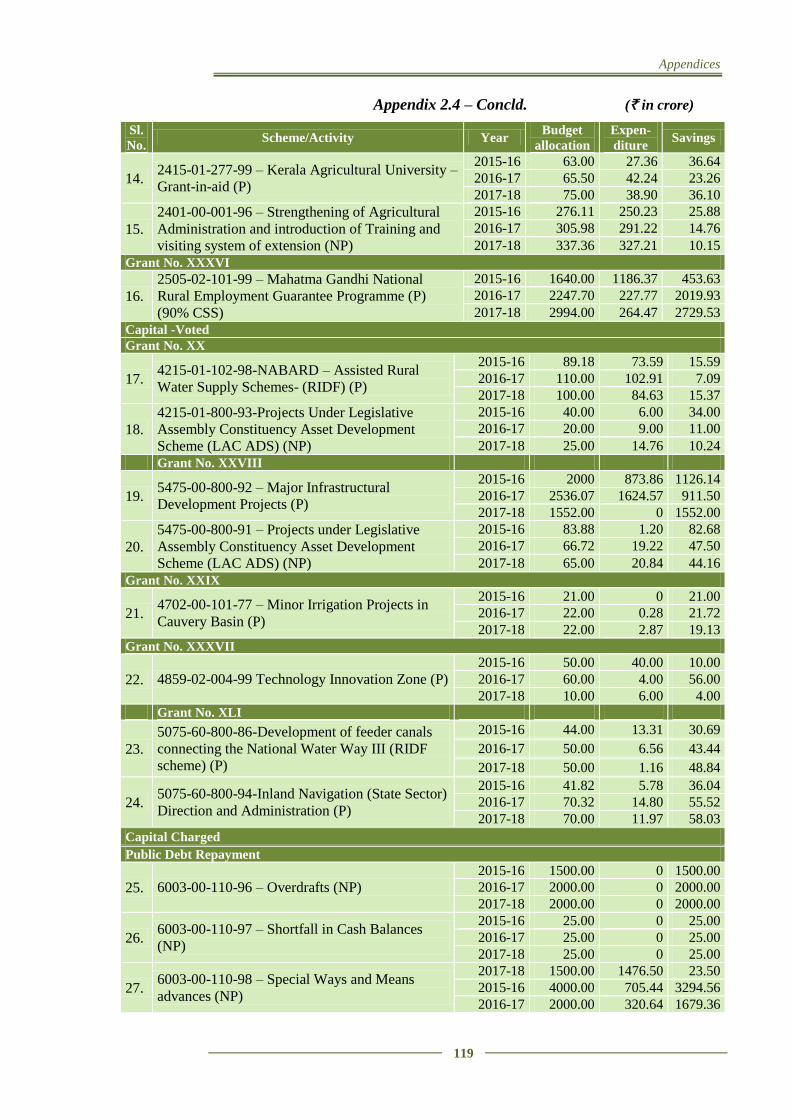
Appendices
119
Appendix 2.4 – Concld. (` in crore)
Sl.
No. Scheme/Activity Year
Budget
allocation
Expen-
diture Savings
14. 2415-01-277-99 – Kerala Agricultural University –
Grant-in-aid (P)
2015-16 63.00 27.36 36.64
2016-17 65.50 42.24 23.26
2017-18 75.00 38.90 36.10
15. 2401-00-001-96 – Strengthening of Agricultural
Administration and introduction of Training and
visiting system of extension (NP)
2015-16 276.11 250.23 25.88
2016-17 305.98 291.22 14.76
2017-18 337.36 327.21 10.15
Grant No. XXXVI
16. 2505-02-101-99 – Mahatma Gandhi National
Rural Employment Guarantee Programme (P)
(90% CSS)
2015-16 1640.00 1186.37 453.63
2016-17 2247.70 227.77 2019.93
2017-18 2994.00 264.47 2729.53
Capital -Voted
Grant No. XX
17. 4215-01-102-98-NABARD – Assisted Rural
Water Supply Schemes- (RIDF) (P)
2015-16 89.18 73.59 15.59
2016-17 110.00 102.91 7.09
2017-18 100.00 84.63 15.37
18. 4215-01-800-93-Projects Under Legislative
Assembly Constituency Asset Development
Scheme (LAC ADS) (NP)
2015-16 40.00 6.00 34.00
2016-17 20.00 9.00 11.00
2017-18 25.00 14.76 10.24
Grant No. XXVIII
19. 5475-00-800-92 – Major Infrastructural
Development Projects (P)
2015-16 2000 873.86 1126.14
2016-17 2536.07 1624.57 911.50
2017-18 1552.00 0 1552.00
20. 5475-00-800-91 – Projects under Legislative
Assembly Constituency Asset Development
Scheme (LAC ADS) (NP)
2015-16 83.88 1.20 82.68
2016-17 66.72 19.22 47.50
2017-18 65.00 20.84 44.16
Grant No. XXIX
21. 4702-00-101-77 – Minor Irrigation Projects in
Cauvery Basin (P)
2015-16 21.00 0 21.00
2016-17 22.00 0.28 21.72
2017-18 22.00 2.87 19.13
Grant No. XXXVII
22. 4859-02-004-99 Technology Innovation Zone (P) 2015-16 50.00 40.00 10.00
2016-17 60.00 4.00 56.00
2017-18 10.00 6.00 4.00
Grant No. XLI
23. 5075-60-800-86-Development of feeder canals
connecting the National Water Way III (RIDF
scheme) (P)
2015-16 44.00 13.31 30.69
2016-17 50.00 6.56 43.44
2017-18 50.00 1.16 48.84
24. 5075-60-800-94-Inland Navigation (State Sector)
Direction and Administration (P)
2015-16 41.82 5.78 36.04
2016-17 70.32 14.80 55.52
2017-18 70.00 11.97 58.03
Capital Charged
Public Debt Repayment
25. 6003-00-110-96 – Overdrafts (NP) 2015-16 1500.00 0 1500.00
2016-17 2000.00 0 2000.00
2017-18 2000.00 0 2000.00
26. 6003-00-110-97 – Shortfall in Cash Balances
(NP)
2015-16 25.00 0 25.00
2016-17 25.00 0 25.00
2017-18 25.00 0 25.00
27. 6003-00-110-98 – Special Ways and Means
advances (NP)
2017-18 1500.00 1476.50 23.50
2015-16 4000.00 705.44 3294.56
2016-17 2000.00 320.64 1679.36
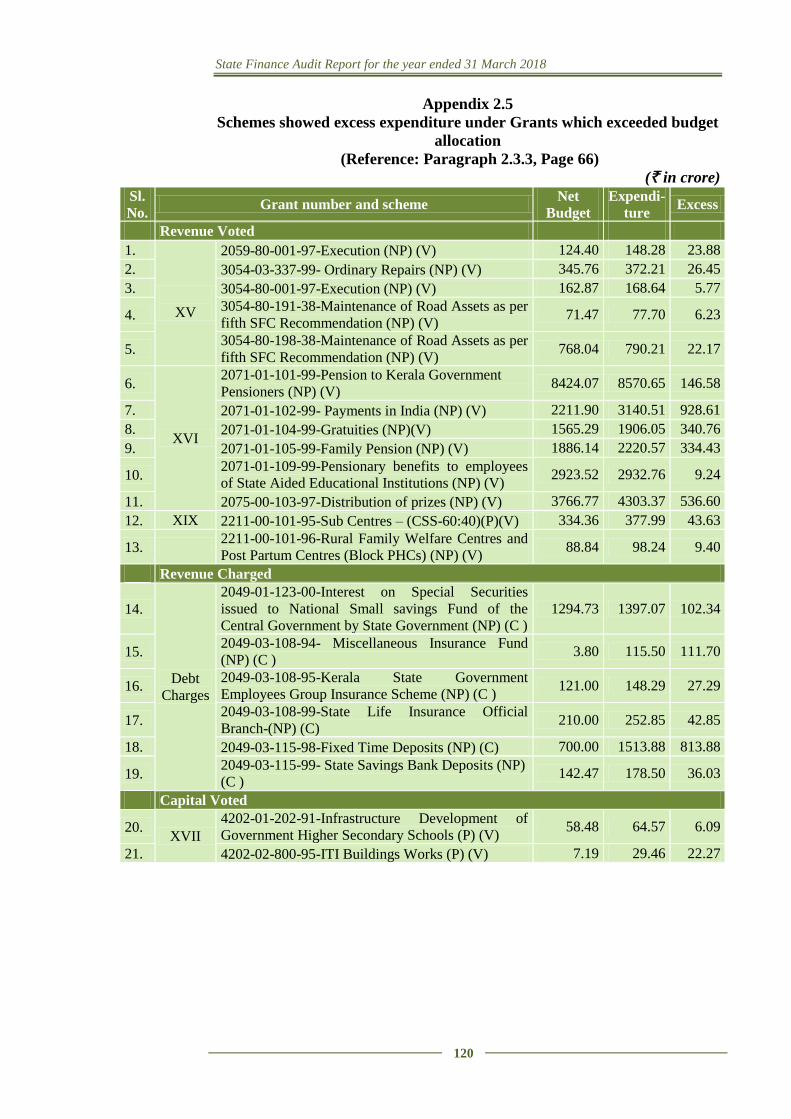
State Finance Audit Report for the year ended 31 March 2018
120
Appendix 2.5
Schemes showed excess expenditure under Grants which exceeded budget
allocation
(Reference: Paragraph 2.3.3, Page 66)
(` in crore)
Sl.
No. Grant number and scheme
Net
Budget Expendi-
ture Excess
Revenue Voted
1.
XV
2059-80-001-97-Execution (NP) (V) 124.40 148.28 23.88
2. 3054-03-337-99- Ordinary Repairs (NP) (V) 345.76 372.21 26.45
3. 3054-80-001-97-Execution (NP) (V) 162.87 168.64 5.77
4. 3054-80-191-38-Maintenance of Road Assets as per
fifth SFC Recommendation (NP) (V) 71.47 77.70 6.23
5. 3054-80-198-38-Maintenance of Road Assets as per
fifth SFC Recommendation (NP) (V) 768.04 790.21 22.17
6.
XVI
2071-01-101-99-Pension to Kerala Government
Pensioners (NP) (V) 8424.07 8570.65 146.58
7. 2071-01-102-99- Payments in India (NP) (V) 2211.90 3140.51 928.61
8. 2071-01-104-99-Gratuities (NP)(V) 1565.29 1906.05 340.76
9. 2071-01-105-99-Family Pension (NP) (V) 1886.14 2220.57 334.43
10. 2071-01-109-99-Pensionary benefits to employees
of State Aided Educational Institutions (NP) (V) 2923.52 2932.76 9.24
11. 2075-00-103-97-Distribution of prizes (NP) (V) 3766.77 4303.37 536.60
12. XIX 2211-00-101-95-Sub Centres – (CSS-60:40)(P)(V) 334.36 377.99 43.63
13. 2211-00-101-96-Rural Family Welfare Centres and
Post Partum Centres (Block PHCs) (NP) (V) 88.84 98.24 9.40
Revenue Charged
14.
Debt
Charges
2049-01-123-00-Interest on Special Securities
issued to National Small savings Fund of the
Central Government by State Government (NP) (C ) 1294.73 1397.07 102.34
15. 2049-03-108-94- Miscellaneous Insurance Fund
(NP) (C ) 3.80 115.50 111.70
16. 2049-03-108-95-Kerala State Government
Employees Group Insurance Scheme (NP) (C ) 121.00 148.29 27.29
17. 2049-03-108-99-State Life Insurance Official
Branch-(NP) (C) 210.00 252.85 42.85
18. 2049-03-115-98-Fixed Time Deposits (NP) (C) 700.00 1513.88 813.88
19. 2049-03-115-99- State Savings Bank Deposits (NP)
(C ) 142.47 178.50 36.03
Capital Voted
20. XVII
4202-01-202-91-Infrastructure Development of
Government Higher Secondary Schools (P) (V) 58.48 64.57 6.09
21. 4202-02-800-95-ITI Buildings Works (P) (V) 7.19 29.46 22.27
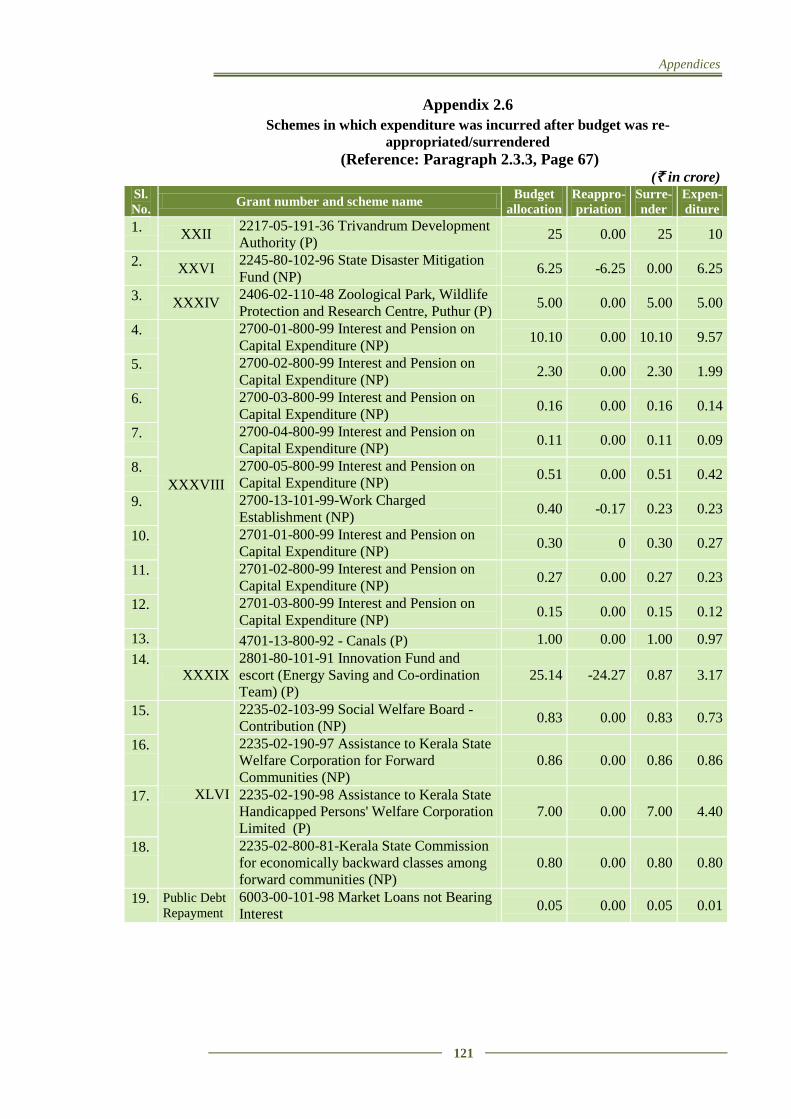
Appendices
121
Appendix 2.6
Schemes in which expenditure was incurred after budget was re-
appropriated/surrendered
(Reference: Paragraph 2.3.3, Page 67) (` in crore)
Sl.
No. Grant number and scheme name
Budget
allocation
Reappro-
priation
Surre-
nder
Expen-
diture
1. XXII
2217-05-191-36 Trivandrum Development
Authority (P) 25 0.00 25 10
2. XXVI
2245-80-102-96 State Disaster Mitigation
Fund (NP) 6.25 -6.25 0.00 6.25
3. XXXIV
2406-02-110-48 Zoological Park, Wildlife
Protection and Research Centre, Puthur (P) 5.00 0.00 5.00 5.00
4.
XXXVIII
2700-01-800-99 Interest and Pension on
Capital Expenditure (NP) 10.10 0.00 10.10 9.57
5. 2700-02-800-99 Interest and Pension on
Capital Expenditure (NP) 2.30 0.00 2.30 1.99
6. 2700-03-800-99 Interest and Pension on
Capital Expenditure (NP) 0.16 0.00 0.16 0.14
7. 2700-04-800-99 Interest and Pension on
Capital Expenditure (NP) 0.11 0.00 0.11 0.09
8. 2700-05-800-99 Interest and Pension on
Capital Expenditure (NP) 0.51 0.00 0.51 0.42
9. 2700-13-101-99-Work Charged
Establishment (NP) 0.40 -0.17 0.23 0.23
10. 2701-01-800-99 Interest and Pension on
Capital Expenditure (NP) 0.30 0 0.30 0.27
11. 2701-02-800-99 Interest and Pension on
Capital Expenditure (NP) 0.27 0.00 0.27 0.23
12. 2701-03-800-99 Interest and Pension on
Capital Expenditure (NP) 0.15 0.00 0.15 0.12
13. 4701-13-800-92 - Canals (P) 1.00 0.00 1.00 0.97
14. XXXIX
2801-80-101-91 Innovation Fund and
escort (Energy Saving and Co-ordination
Team) (P) 25.14 -24.27 0.87 3.17
15.
XLVI
2235-02-103-99 Social Welfare Board -
Contribution (NP) 0.83 0.00 0.83 0.73
16. 2235-02-190-97 Assistance to Kerala State
Welfare Corporation for Forward
Communities (NP) 0.86 0.00 0.86 0.86
17. 2235-02-190-98 Assistance to Kerala State
Handicapped Persons' Welfare Corporation
Limited (P) 7.00 0.00 7.00 4.40
18. 2235-02-800-81-Kerala State Commission
for economically backward classes among
forward communities (NP) 0.80 0.00 0.80 0.80
19. Public Debt
Repayment
6003-00-101-98 Market Loans not Bearing
Interest 0.05 0.00 0.05 0.01
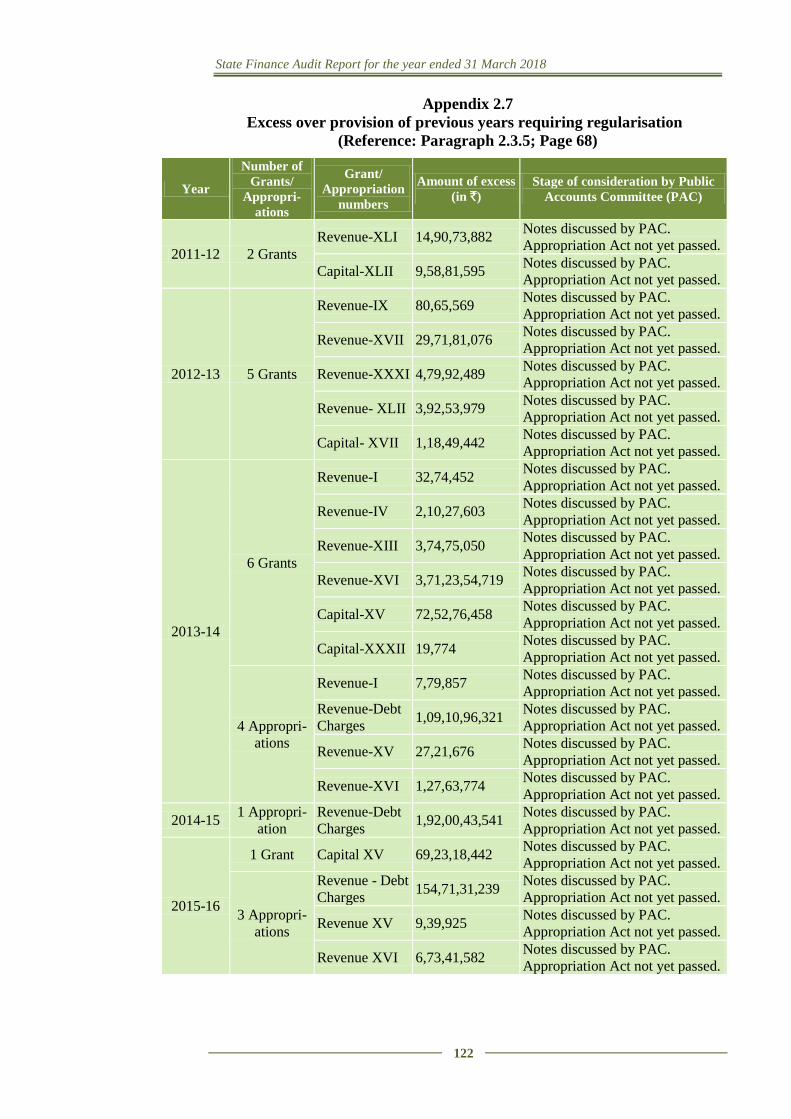
State Finance Audit Report for the year ended 31 March 2018
122
Appendix 2.7
Excess over provision of previous years requiring regularisation
(Reference: Paragraph 2.3.5; Page 68)
Year
Number of
Grants/
Appropri-
ations
Grant/
Appropriation
numbers
Amount of excess
(in `)
Stage of consideration by Public
Accounts Committee (PAC)
2011-12 2 Grants Revenue-XLI 14,90,73,882
Notes discussed by PAC.
Appropriation Act not yet passed.
Capital-XLII 9,58,81,595 Notes discussed by PAC.
Appropriation Act not yet passed.
2012-13 5 Grants
Revenue-IX 80,65,569 Notes discussed by PAC.
Appropriation Act not yet passed.
Revenue-XVII 29,71,81,076 Notes discussed by PAC.
Appropriation Act not yet passed.
Revenue-XXXI 4,79,92,489 Notes discussed by PAC.
Appropriation Act not yet passed.
Revenue- XLII 3,92,53,979 Notes discussed by PAC.
Appropriation Act not yet passed.
Capital- XVII 1,18,49,442 Notes discussed by PAC.
Appropriation Act not yet passed.
2013-14
6 Grants
Revenue-I 32,74,452 Notes discussed by PAC.
Appropriation Act not yet passed.
Revenue-IV 2,10,27,603 Notes discussed by PAC.
Appropriation Act not yet passed.
Revenue-XIII 3,74,75,050 Notes discussed by PAC.
Appropriation Act not yet passed.
Revenue-XVI 3,71,23,54,719 Notes discussed by PAC.
Appropriation Act not yet passed.
Capital-XV 72,52,76,458 Notes discussed by PAC.
Appropriation Act not yet passed.
Capital-XXXII 19,774 Notes discussed by PAC.
Appropriation Act not yet passed.
4 Appropri-
ations
Revenue-I 7,79,857 Notes discussed by PAC.
Appropriation Act not yet passed. Revenue-Debt
Charges 1,09,10,96,321
Notes discussed by PAC.
Appropriation Act not yet passed.
Revenue-XV 27,21,676 Notes discussed by PAC.
Appropriation Act not yet passed.
Revenue-XVI 1,27,63,774 Notes discussed by PAC.
Appropriation Act not yet passed.
2014-15 1 Appropri-
ation Revenue-Debt
Charges 1,92,00,43,541
Notes discussed by PAC.
Appropriation Act not yet passed.
2015-16
1 Grant Capital XV 69,23,18,442 Notes discussed by PAC.
Appropriation Act not yet passed.
3 Appropri-
ations
Revenue - Debt
Charges 154,71,31,239
Notes discussed by PAC.
Appropriation Act not yet passed.
Revenue XV 9,39,925 Notes discussed by PAC.
Appropriation Act not yet passed.
Revenue XVI 6,73,41,582 Notes discussed by PAC.
Appropriation Act not yet passed.
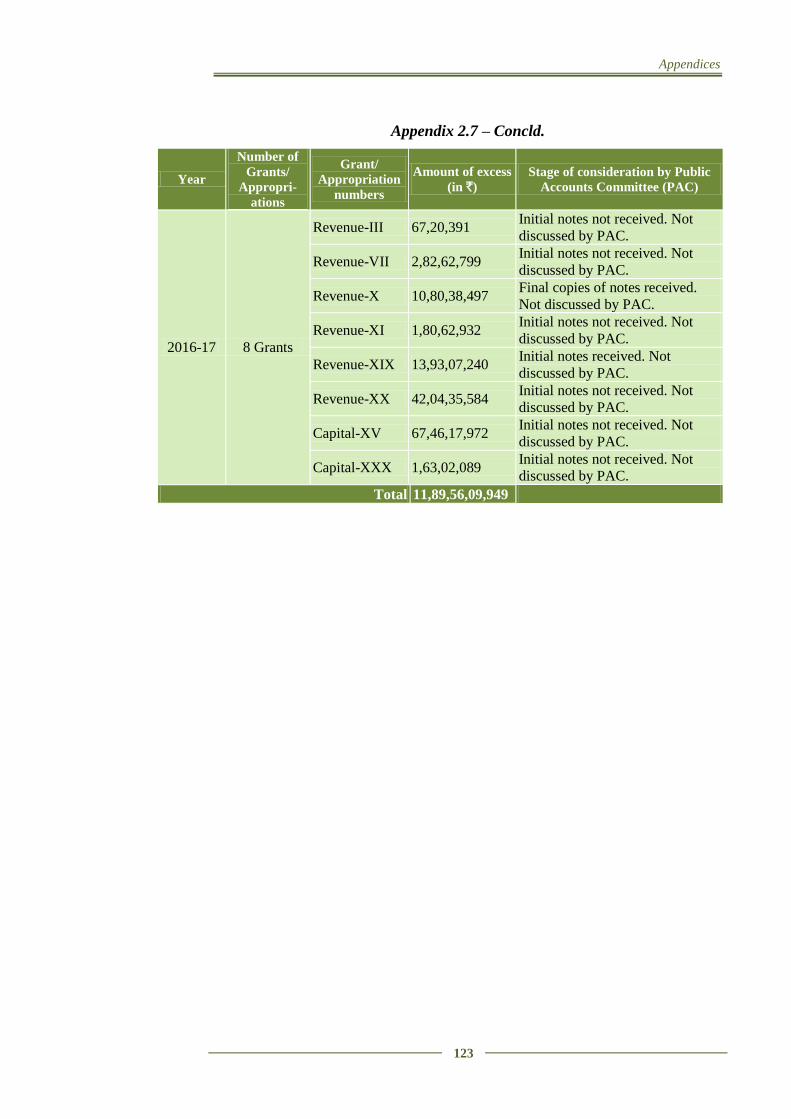
Appendices
123
Appendix 2.7 – Concld.
Year
Number of
Grants/
Appropri-
ations
Grant/
Appropriation
numbers
Amount of excess
(in `)
Stage of consideration by Public
Accounts Committee (PAC)
2016-17 8 Grants
Revenue-III 67,20,391 Initial notes not received. Not
discussed by PAC.
Revenue-VII 2,82,62,799 Initial notes not received. Not
discussed by PAC.
Revenue-X 10,80,38,497 Final copies of notes received.
Not discussed by PAC.
Revenue-XI 1,80,62,932 Initial notes not received. Not
discussed by PAC.
Revenue-XIX 13,93,07,240 Initial notes received. Not
discussed by PAC.
Revenue-XX 42,04,35,584 Initial notes not received. Not
discussed by PAC.
Capital-XV 67,46,17,972 Initial notes not received. Not
discussed by PAC.
Capital-XXX 1,63,02,089 Initial notes not received. Not
discussed by PAC.
Total 11,89,56,09,949
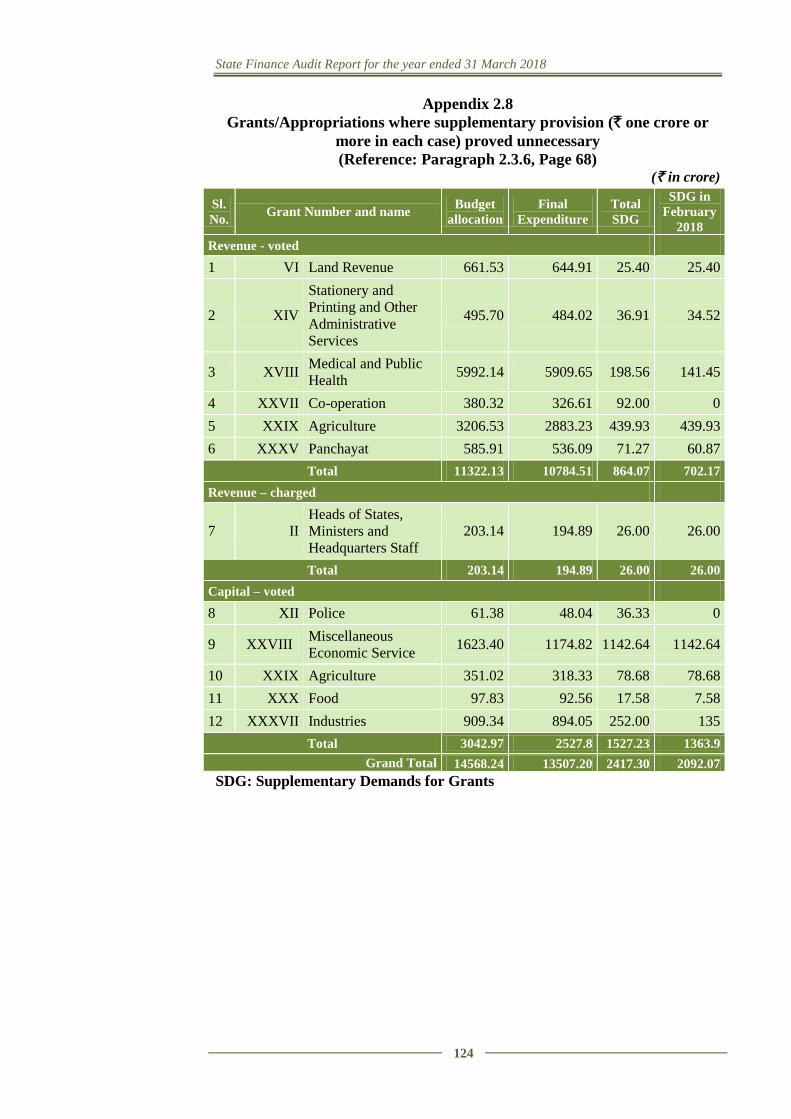
State Finance Audit Report for the year ended 31 March 2018
124
Appendix 2.8
Grants/Appropriations where supplementary provision (` one crore or
more in each case) proved unnecessary
(Reference: Paragraph 2.3.6, Page 68) (` in crore)
Sl.
No. Grant Number and name
Budget
allocation
Final
Expenditure
Total
SDG
SDG in
February
2018
Revenue - voted
1 VI Land Revenue 661.53 644.91 25.40 25.40
2 XIV
Stationery and
Printing and Other
Administrative
Services
495.70 484.02 36.91 34.52
3 XVIII Medical and Public
Health 5992.14 5909.65 198.56 141.45
4 XXVII Co-operation 380.32 326.61 92.00 0
5 XXIX Agriculture 3206.53 2883.23 439.93 439.93
6 XXXV Panchayat 585.91 536.09 71.27 60.87
Total 11322.13 10784.51 864.07 702.17
Revenue – charged
7 II Heads of States,
Ministers and
Headquarters Staff 203.14 194.89 26.00 26.00
Total 203.14 194.89 26.00 26.00
Capital – voted
8 XII Police 61.38 48.04 36.33 0
9 XXVIII Miscellaneous
Economic Service 1623.40 1174.82 1142.64 1142.64
10 XXIX Agriculture 351.02 318.33 78.68 78.68
11 XXX Food 97.83 92.56 17.58 7.58
12 XXXVII Industries 909.34 894.05 252.00 135
Total 3042.97 2527.8 1527.23 1363.9
Grand Total 14568.24 13507.20 2417.30 2092.07
SDG: Supplementary Demands for Grants
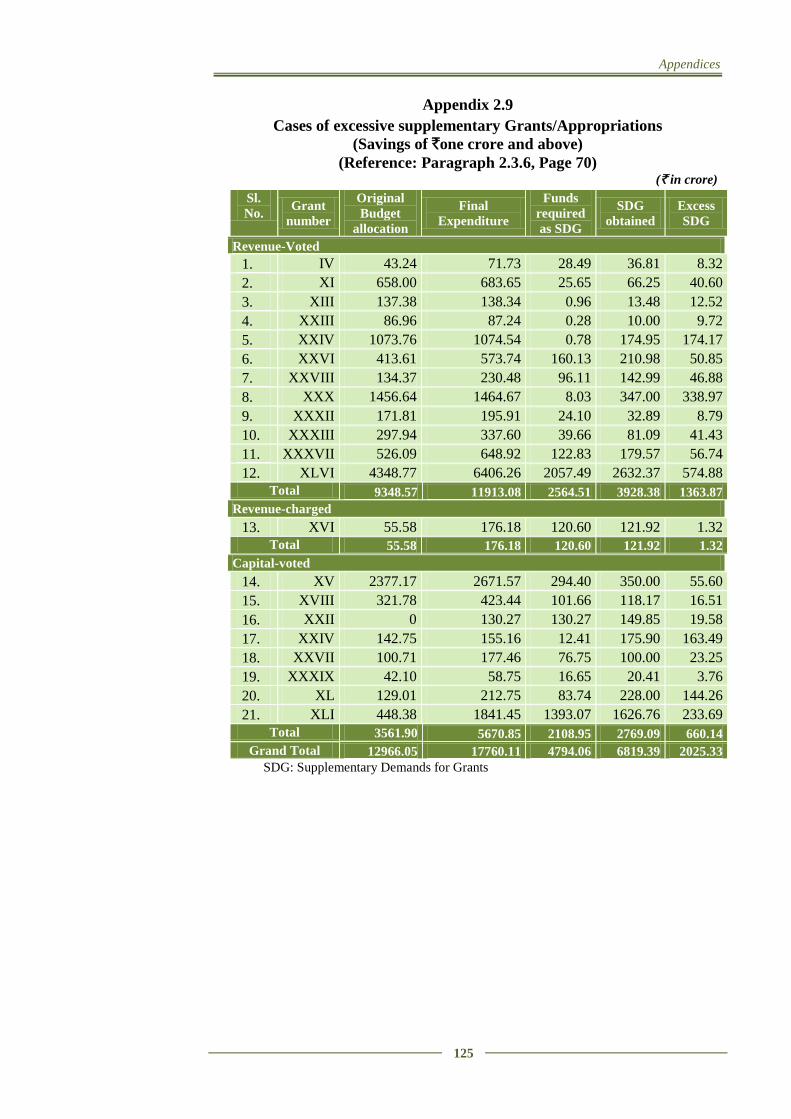
Appendices
125
Appendix 2.9
Cases of excessive supplementary Grants/Appropriations
(Savings of `one crore and above)
(Reference: Paragraph 2.3.6, Page 70) (` in crore)
Sl.
No. Grant
number
Original
Budget
allocation
Final
Expenditure
Funds
required
as SDG
SDG
obtained
Excess
SDG
Revenue-Voted
1. IV 43.24 71.73 28.49 36.81 8.32
2. XI 658.00 683.65 25.65 66.25 40.60
3. XIII 137.38 138.34 0.96 13.48 12.52
4. XXIII 86.96 87.24 0.28 10.00 9.72
5. XXIV 1073.76 1074.54 0.78 174.95 174.17
6. XXVI 413.61 573.74 160.13 210.98 50.85
7. XXVIII 134.37 230.48 96.11 142.99 46.88
8. XXX 1456.64 1464.67 8.03 347.00 338.97
9. XXXII 171.81 195.91 24.10 32.89 8.79
10. XXXIII 297.94 337.60 39.66 81.09 41.43
11. XXXVII 526.09 648.92 122.83 179.57 56.74
12. XLVI 4348.77 6406.26 2057.49 2632.37 574.88 Total 9348.57 11913.08 2564.51 3928.38 1363.87
Revenue-charged
13. XVI 55.58 176.18 120.60 121.92 1.32 Total 55.58 176.18 120.60 121.92 1.32
Capital-voted
14. XV 2377.17 2671.57 294.40 350.00 55.60
15. XVIII 321.78 423.44 101.66 118.17 16.51
16. XXII 0 130.27 130.27 149.85 19.58
17. XXIV 142.75 155.16 12.41 175.90 163.49
18. XXVII 100.71 177.46 76.75 100.00 23.25
19. XXXIX 42.10 58.75 16.65 20.41 3.76
20. XL 129.01 212.75 83.74 228.00 144.26
21. XLI 448.38 1841.45 1393.07 1626.76 233.69 Total 3561.90 5670.85 2108.95 2769.09 660.14
Grand Total 12966.05 17760.11 4794.06 6819.39 2025.33
SDG: Supplementary Demands for Grants
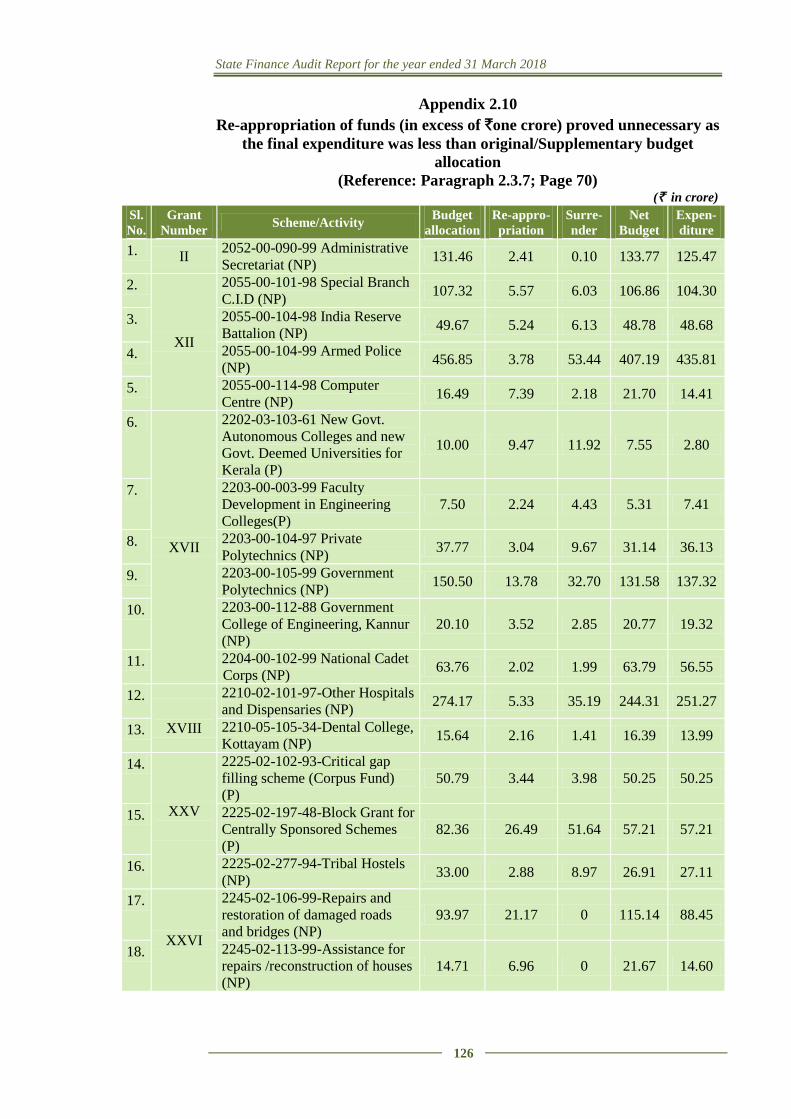
State Finance Audit Report for the year ended 31 March 2018
126
Appendix 2.10
Re-appropriation of funds (in excess of `one crore) proved unnecessary as
the final expenditure was less than original/Supplementary budget
allocation
(Reference: Paragraph 2.3.7; Page 70) (` in crore)
Sl.
No.
Grant
Number Scheme/Activity
Budget
allocation
Re-appro-
priation
Surre-
nder
Net
Budget
Expen-
diture
1. II 2052-00-090-99 Administrative
Secretariat (NP) 131.46 2.41 0.10 133.77 125.47
2.
XII
2055-00-101-98 Special Branch
C.I.D (NP) 107.32 5.57 6.03 106.86 104.30
3. 2055-00-104-98 India Reserve
Battalion (NP) 49.67 5.24 6.13 48.78 48.68
4. 2055-00-104-99 Armed Police
(NP) 456.85 3.78 53.44 407.19 435.81
5. 2055-00-114-98 Computer
Centre (NP) 16.49 7.39 2.18 21.70 14.41
6.
XVII
2202-03-103-61 New Govt.
Autonomous Colleges and new
Govt. Deemed Universities for
Kerala (P)
10.00 9.47 11.92 7.55 2.80
7. 2203-00-003-99 Faculty
Development in Engineering
Colleges(P) 7.50 2.24 4.43 5.31 7.41
8. 2203-00-104-97 Private
Polytechnics (NP) 37.77 3.04 9.67 31.14 36.13
9. 2203-00-105-99 Government
Polytechnics (NP) 150.50 13.78 32.70 131.58 137.32
10. 2203-00-112-88 Government
College of Engineering, Kannur
(NP) 20.10 3.52 2.85 20.77 19.32
11. 2204-00-102-99 National Cadet
Corps (NP) 63.76 2.02 1.99 63.79 56.55
12.
XVIII
2210-02-101-97-Other Hospitals
and Dispensaries (NP) 274.17 5.33 35.19 244.31 251.27
13. 2210-05-105-34-Dental College,
Kottayam (NP) 15.64 2.16 1.41 16.39 13.99
14.
XXV
2225-02-102-93-Critical gap
filling scheme (Corpus Fund)
(P) 50.79 3.44 3.98 50.25 50.25
15. 2225-02-197-48-Block Grant for
Centrally Sponsored Schemes
(P) 82.36 26.49 51.64 57.21 57.21
16. 2225-02-277-94-Tribal Hostels
(NP) 33.00 2.88 8.97 26.91 27.11
17.
XXVI
2245-02-106-99-Repairs and
restoration of damaged roads
and bridges (NP) 93.97 21.17 0 115.14 88.45
18. 2245-02-113-99-Assistance for
repairs /reconstruction of houses
(NP) 14.71 6.96 0 21.67 14.60
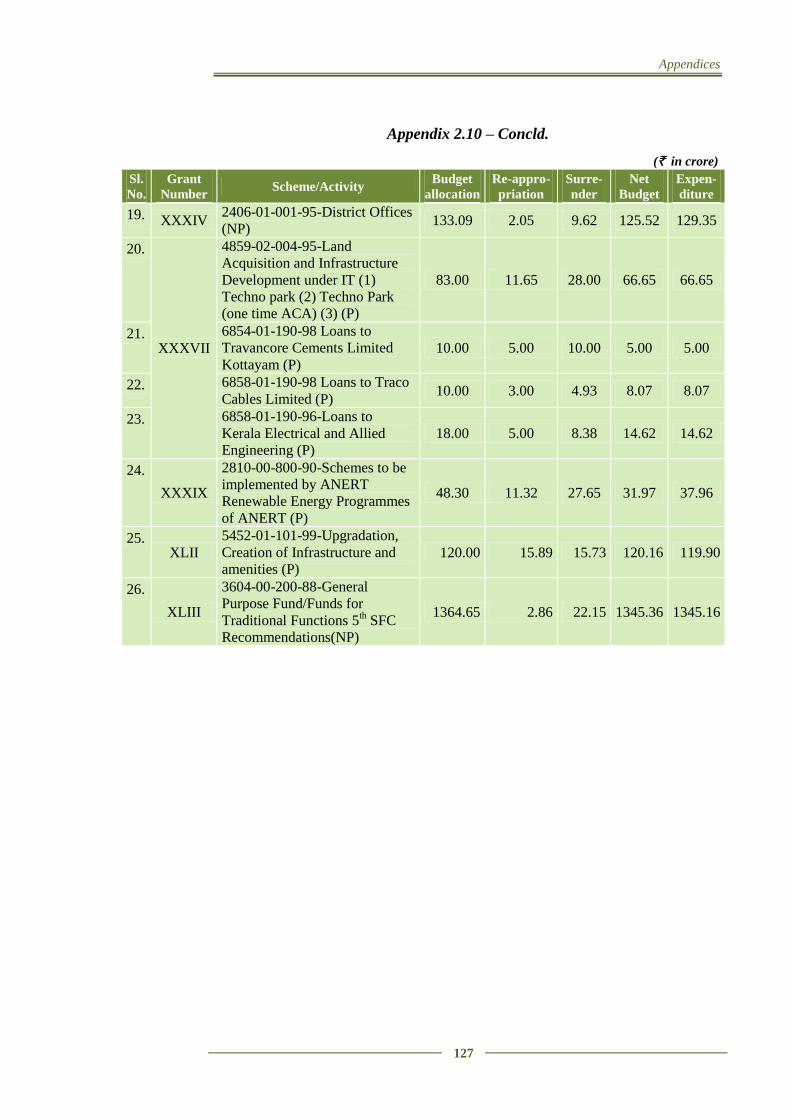
Appendices
127
Appendix 2.10 – Concld.
(` in crore)
Sl.
No.
Grant
Number Scheme/Activity
Budget
allocation
Re-appro-
priation
Surre-
nder
Net
Budget
Expen-
diture
19. XXXIV 2406-01-001-95-District Offices
(NP) 133.09 2.05 9.62 125.52 129.35
20.
XXXVII
4859-02-004-95-Land
Acquisition and Infrastructure
Development under IT (1)
Techno park (2) Techno Park
(one time ACA) (3) (P)
83.00 11.65 28.00 66.65 66.65
21. 6854-01-190-98 Loans to
Travancore Cements Limited
Kottayam (P) 10.00 5.00 10.00 5.00 5.00
22. 6858-01-190-98 Loans to Traco
Cables Limited (P) 10.00 3.00 4.93 8.07 8.07
23. 6858-01-190-96-Loans to
Kerala Electrical and Allied
Engineering (P) 18.00 5.00 8.38 14.62 14.62
24.
XXXIX
2810-00-800-90-Schemes to be
implemented by ANERT
Renewable Energy Programmes
of ANERT (P)
48.30 11.32 27.65 31.97 37.96
25. XLII
5452-01-101-99-Upgradation,
Creation of Infrastructure and
amenities (P) 120.00 15.89 15.73 120.16 119.90
26.
XLIII
3604-00-200-88-General
Purpose Fund/Funds for
Traditional Functions 5th SFC
Recommendations(NP)
1364.65 2.86 22.15 1345.36 1345.16
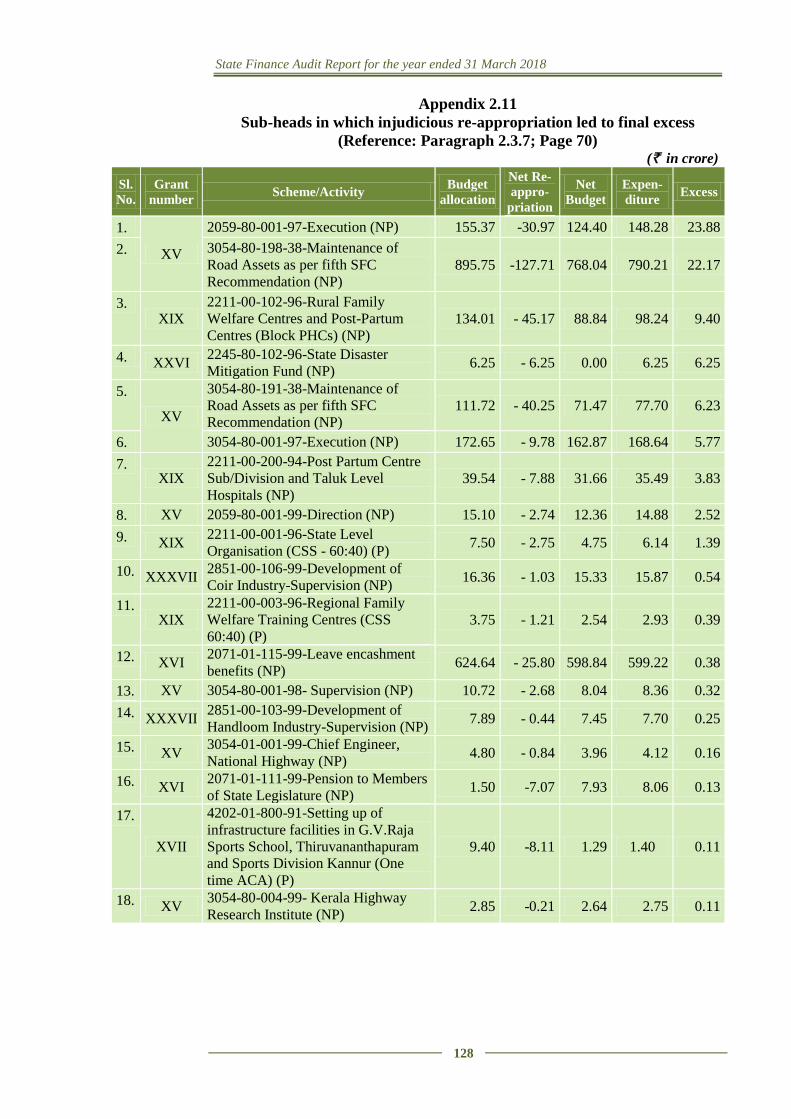
State Finance Audit Report for the year ended 31 March 2018
128
Appendix 2.11
Sub-heads in which injudicious re-appropriation led to final excess
(Reference: Paragraph 2.3.7; Page 70) (` in crore)
Sl.
No.
Grant
number Scheme/Activity
Budget
allocation
Net Re-
appro-
priation
Net
Budget
Expen-
diture Excess
1.
XV
2059-80-001-97-Execution (NP) 155.37 -30.97 124.40 148.28 23.88
2. 3054-80-198-38-Maintenance of
Road Assets as per fifth SFC
Recommendation (NP) 895.75 -127.71 768.04 790.21 22.17
3. XIX
2211-00-102-96-Rural Family
Welfare Centres and Post-Partum
Centres (Block PHCs) (NP) 134.01 - 45.17 88.84 98.24 9.40
4. XXVI 2245-80-102-96-State Disaster
Mitigation Fund (NP) 6.25 - 6.25 0.00 6.25 6.25
5.
XV
3054-80-191-38-Maintenance of
Road Assets as per fifth SFC
Recommendation (NP) 111.72 - 40.25 71.47 77.70 6.23
6. 3054-80-001-97-Execution (NP) 172.65 - 9.78 162.87 168.64 5.77
7. XIX
2211-00-200-94-Post Partum Centre
Sub/Division and Taluk Level
Hospitals (NP) 39.54 - 7.88 31.66 35.49 3.83
8. XV 2059-80-001-99-Direction (NP) 15.10 - 2.74 12.36 14.88 2.52
9. XIX 2211-00-001-96-State Level
Organisation (CSS - 60:40) (P) 7.50 - 2.75 4.75 6.14 1.39
10. XXXVII 2851-00-106-99-Development of
Coir Industry-Supervision (NP) 16.36 - 1.03 15.33 15.87 0.54
11. XIX
2211-00-003-96-Regional Family
Welfare Training Centres (CSS
60:40) (P) 3.75 - 1.21 2.54 2.93 0.39
12. XVI 2071-01-115-99-Leave encashment
benefits (NP) 624.64 - 25.80 598.84 599.22 0.38
13. XV 3054-80-001-98- Supervision (NP) 10.72 - 2.68 8.04 8.36 0.32
14. XXXVII 2851-00-103-99-Development of
Handloom Industry-Supervision (NP) 7.89 - 0.44 7.45 7.70 0.25
15. XV 3054-01-001-99-Chief Engineer,
National Highway (NP) 4.80 - 0.84 3.96 4.12 0.16
16. XVI 2071-01-111-99-Pension to Members
of State Legislature (NP) 1.50 -7.07 7.93 8.06 0.13
17.
XVII
4202-01-800-91-Setting up of
infrastructure facilities in G.V.Raja
Sports School, Thiruvananthapuram
and Sports Division Kannur (One
time ACA) (P)
9.40 -8.11 1.29 1.40 0.11
18. XV 3054-80-004-99- Kerala Highway
Research Institute (NP) 2.85 -0.21 2.64 2.75 0.11
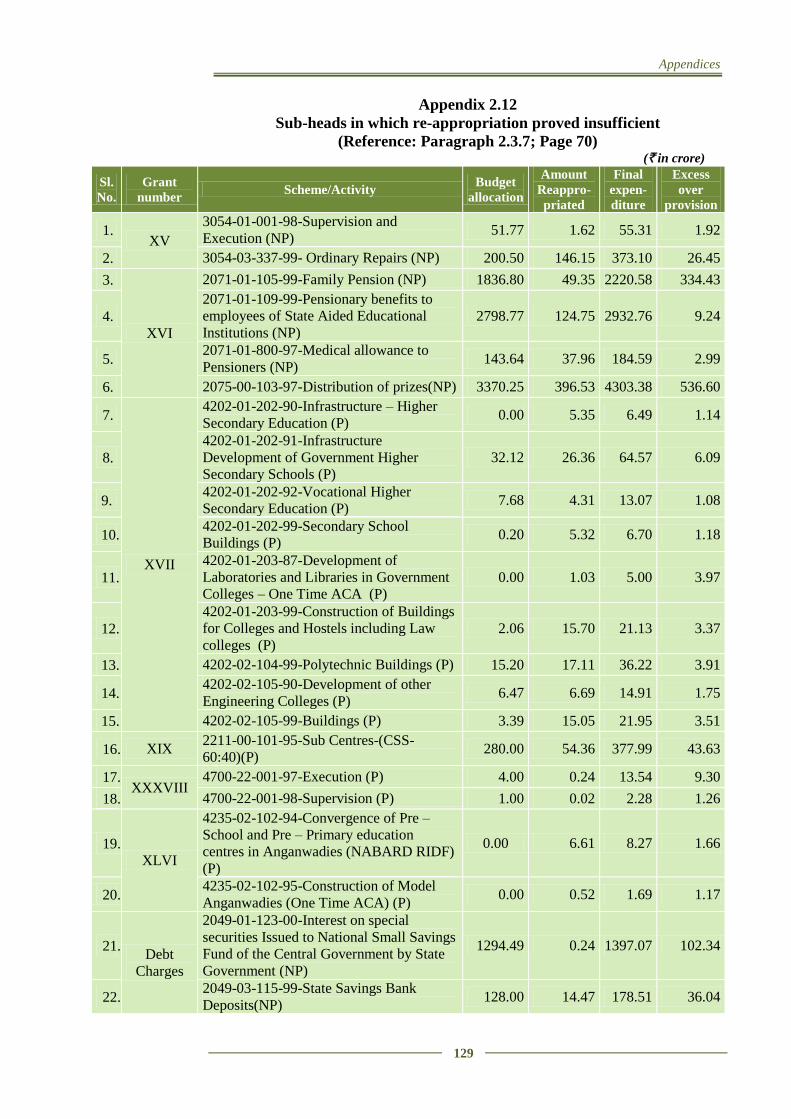
Appendices
129
Appendix 2.12
Sub-heads in which re-appropriation proved insufficient
(Reference: Paragraph 2.3.7; Page 70) (` in crore)
Sl.
No.
Grant
number Scheme/Activity
Budget
allocation
Amount
Reappro-
priated
Final
expen-
diture
Excess
over
provision
1. XV
3054-01-001-98-Supervision and
Execution (NP) 51.77 1.62 55.31 1.92
2. 3054-03-337-99- Ordinary Repairs (NP) 200.50 146.15 373.10 26.45
3.
XVI
2071-01-105-99-Family Pension (NP) 1836.80 49.35 2220.58 334.43
4. 2071-01-109-99-Pensionary benefits to
employees of State Aided Educational
Institutions (NP) 2798.77 124.75 2932.76 9.24
5. 2071-01-800-97-Medical allowance to
Pensioners (NP) 143.64 37.96 184.59 2.99
6. 2075-00-103-97-Distribution of prizes(NP) 3370.25 396.53 4303.38 536.60
7.
XVII
4202-01-202-90-Infrastructure – Higher
Secondary Education (P) 0.00 5.35 6.49 1.14
8. 4202-01-202-91-Infrastructure
Development of Government Higher
Secondary Schools (P) 32.12 26.36 64.57 6.09
9. 4202-01-202-92-Vocational Higher
Secondary Education (P) 7.68 4.31 13.07 1.08
10. 4202-01-202-99-Secondary School
Buildings (P) 0.20 5.32 6.70 1.18
11. 4202-01-203-87-Development of
Laboratories and Libraries in Government
Colleges – One Time ACA (P) 0.00 1.03 5.00 3.97
12. 4202-01-203-99-Construction of Buildings
for Colleges and Hostels including Law
colleges (P) 2.06 15.70 21.13 3.37
13. 4202-02-104-99-Polytechnic Buildings (P) 15.20 17.11 36.22 3.91
14. 4202-02-105-90-Development of other
Engineering Colleges (P) 6.47 6.69 14.91 1.75
15. 4202-02-105-99-Buildings (P) 3.39 15.05 21.95 3.51
16. XIX 2211-00-101-95-Sub Centres-(CSS-
60:40)(P) 280.00 54.36 377.99 43.63
17. XXXVIII
4700-22-001-97-Execution (P) 4.00 0.24 13.54 9.30
18. 4700-22-001-98-Supervision (P) 1.00 0.02 2.28 1.26
19. XLVI
4235-02-102-94-Convergence of Pre –
School and Pre – Primary education
centres in Anganwadies (NABARD RIDF)
(P)
0.00 6.61 8.27 1.66
20. 4235-02-102-95-Construction of Model
Anganwadies (One Time ACA) (P) 0.00 0.52 1.69 1.17
21. Debt
Charges
2049-01-123-00-Interest on special
securities Issued to National Small Savings
Fund of the Central Government by State
Government (NP)
1294.49 0.24 1397.07 102.34
22. 2049-03-115-99-State Savings Bank
Deposits(NP) 128.00 14.47 178.51 36.04
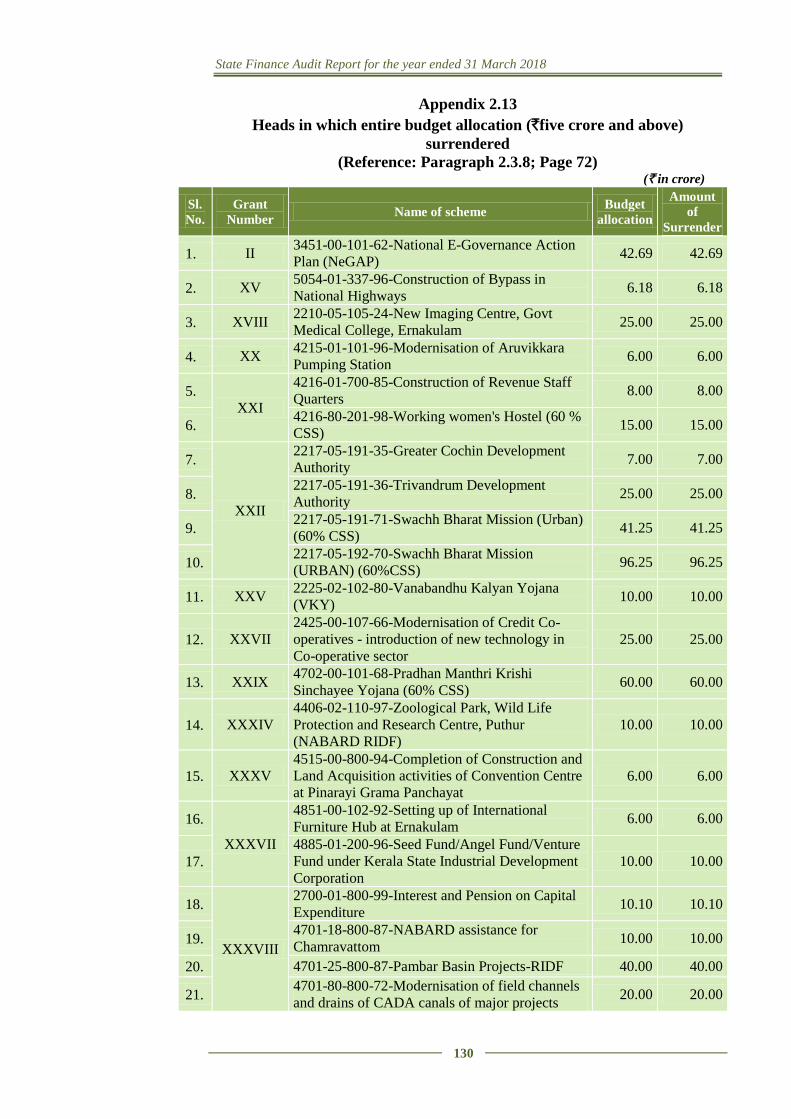
State Finance Audit Report for the year ended 31 March 2018
130
Appendix 2.13
Heads in which entire budget allocation (`five crore and above)
surrendered
(Reference: Paragraph 2.3.8; Page 72) (` in crore)
Sl.
No.
Grant
Number Name of scheme
Budget
allocation
Amount
of
Surrender
1. II 3451-00-101-62-National E-Governance Action
Plan (NeGAP) 42.69 42.69
2. XV 5054-01-337-96-Construction of Bypass in
National Highways 6.18 6.18
3. XVIII 2210-05-105-24-New Imaging Centre, Govt
Medical College, Ernakulam 25.00 25.00
4. XX 4215-01-101-96-Modernisation of Aruvikkara
Pumping Station 6.00 6.00
5. XXI
4216-01-700-85-Construction of Revenue Staff
Quarters 8.00 8.00
6. 4216-80-201-98-Working women's Hostel (60 %
CSS) 15.00 15.00
7.
XXII
2217-05-191-35-Greater Cochin Development
Authority 7.00 7.00
8. 2217-05-191-36-Trivandrum Development
Authority 25.00 25.00
9. 2217-05-191-71-Swachh Bharat Mission (Urban)
(60% CSS) 41.25 41.25
10. 2217-05-192-70-Swachh Bharat Mission
(URBAN) (60%CSS) 96.25 96.25
11. XXV 2225-02-102-80-Vanabandhu Kalyan Yojana
(VKY) 10.00 10.00
12. XXVII 2425-00-107-66-Modernisation of Credit Co-
operatives - introduction of new technology in
Co-operative sector 25.00 25.00
13. XXIX 4702-00-101-68-Pradhan Manthri Krishi
Sinchayee Yojana (60% CSS) 60.00 60.00
14. XXXIV 4406-02-110-97-Zoological Park, Wild Life
Protection and Research Centre, Puthur
(NABARD RIDF) 10.00 10.00
15. XXXV 4515-00-800-94-Completion of Construction and
Land Acquisition activities of Convention Centre
at Pinarayi Grama Panchayat 6.00 6.00
16.
XXXVII
4851-00-102-92-Setting up of International
Furniture Hub at Ernakulam 6.00 6.00
17. 4885-01-200-96-Seed Fund/Angel Fund/Venture
Fund under Kerala State Industrial Development
Corporation 10.00 10.00
18.
XXXVIII
2700-01-800-99-Interest and Pension on Capital
Expenditure 10.10 10.10
19. 4701-18-800-87-NABARD assistance for
Chamravattom 10.00 10.00
20. 4701-25-800-87-Pambar Basin Projects-RIDF 40.00 40.00
21. 4701-80-800-72-Modernisation of field channels
and drains of CADA canals of major projects 20.00 20.00
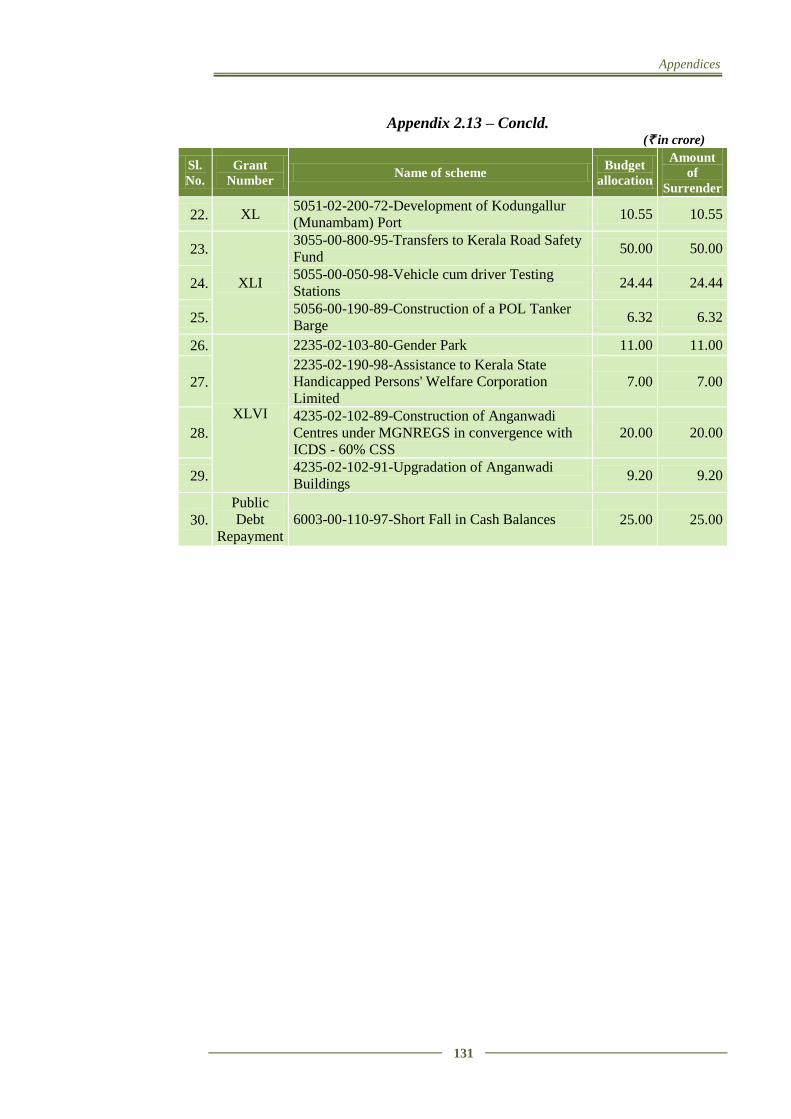
Appendices
131
Appendix 2.13 – Concld. (` in crore)
Sl.
No.
Grant
Number Name of scheme
Budget
allocation
Amount
of
Surrender
22. XL 5051-02-200-72-Development of Kodungallur
(Munambam) Port 10.55 10.55
23.
XLI
3055-00-800-95-Transfers to Kerala Road Safety
Fund 50.00 50.00
24. 5055-00-050-98-Vehicle cum driver Testing
Stations 24.44 24.44
25. 5056-00-190-89-Construction of a POL Tanker
Barge 6.32 6.32
26.
XLVI
2235-02-103-80-Gender Park 11.00 11.00
27. 2235-02-190-98-Assistance to Kerala State
Handicapped Persons' Welfare Corporation
Limited 7.00 7.00
28. 4235-02-102-89-Construction of Anganwadi
Centres under MGNREGS in convergence with
ICDS - 60% CSS 20.00 20.00
29. 4235-02-102-91-Upgradation of Anganwadi
Buildings 9.20 9.20
30. Public
Debt
Repayment 6003-00-110-97-Short Fall in Cash Balances 25.00 25.00
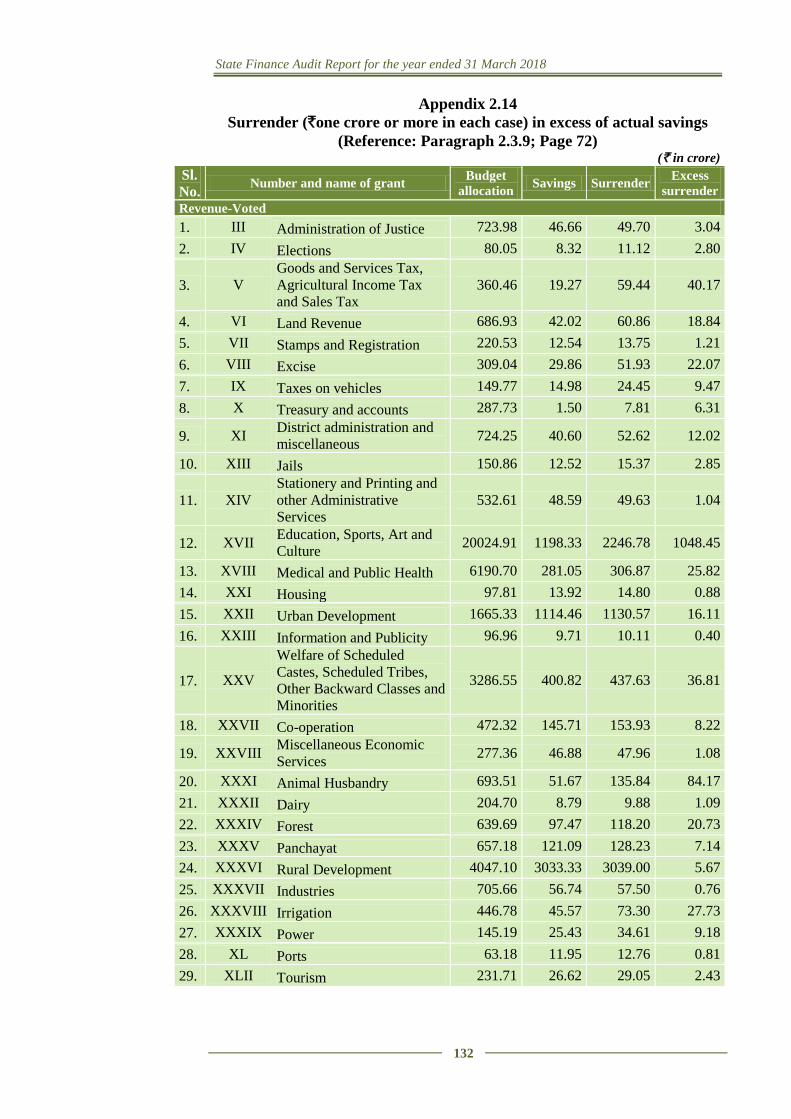
State Finance Audit Report for the year ended 31 March 2018
132
Appendix 2.14
Surrender (`one crore or more in each case) in excess of actual savings
(Reference: Paragraph 2.3.9; Page 72) (` in crore)
Sl.
No. Number and name of grant
Budget
allocation Savings Surrender
Excess
surrender
Revenue-Voted
1. III Administration of Justice 723.98 46.66 49.70 3.04
2. IV Elections 80.05 8.32 11.12 2.80
3. V Goods and Services Tax,
Agricultural Income Tax
and Sales Tax 360.46 19.27 59.44 40.17
4. VI Land Revenue 686.93 42.02 60.86 18.84
5. VII Stamps and Registration 220.53 12.54 13.75 1.21
6. VIII Excise 309.04 29.86 51.93 22.07
7. IX Taxes on vehicles 149.77 14.98 24.45 9.47
8. X Treasury and accounts 287.73 1.50 7.81 6.31
9. XI District administration and
miscellaneous 724.25 40.60 52.62 12.02
10. XIII Jails 150.86 12.52 15.37 2.85
11. XIV Stationery and Printing and
other Administrative
Services 532.61 48.59 49.63 1.04
12. XVII Education, Sports, Art and
Culture 20024.91 1198.33 2246.78 1048.45
13. XVIII Medical and Public Health 6190.70 281.05 306.87 25.82
14. XXI Housing 97.81 13.92 14.80 0.88
15. XXII Urban Development 1665.33 1114.46 1130.57 16.11
16. XXIII Information and Publicity 96.96 9.71 10.11 0.40
17. XXV
Welfare of Scheduled
Castes, Scheduled Tribes,
Other Backward Classes and
Minorities
3286.55 400.82 437.63 36.81
18. XXVII Co-operation 472.32 145.71 153.93 8.22
19. XXVIII Miscellaneous Economic
Services 277.36 46.88 47.96 1.08
20. XXXI Animal Husbandry 693.51 51.67 135.84 84.17
21. XXXII Dairy 204.70 8.79 9.88 1.09
22. XXXIV Forest 639.69 97.47 118.20 20.73
23. XXXV Panchayat 657.18 121.09 128.23 7.14
24. XXXVI Rural Development 4047.10 3033.33 3039.00 5.67
25. XXXVII Industries 705.66 56.74 57.50 0.76
26. XXXVIII Irrigation 446.78 45.57 73.30 27.73
27. XXXIX Power 145.19 25.43 34.61 9.18
28. XL Ports 63.18 11.95 12.76 0.81
29. XLII Tourism 231.71 26.62 29.05 2.43
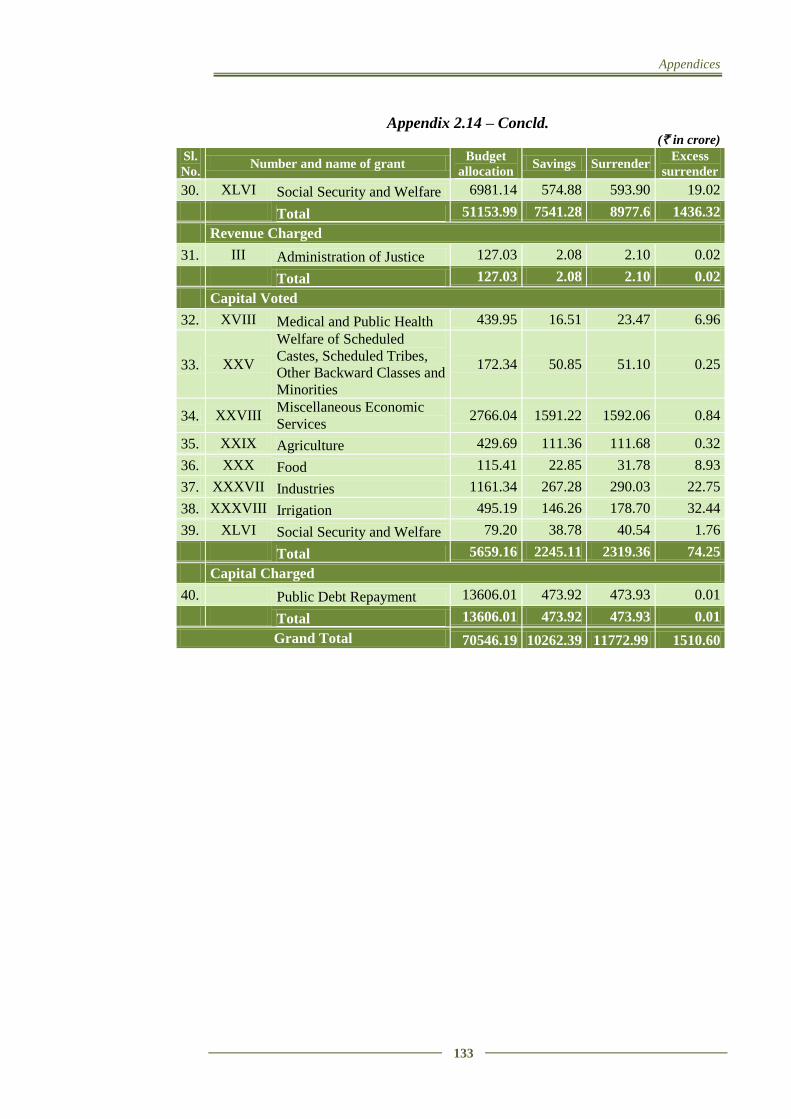
Appendices
133
Appendix 2.14 – Concld. (` in crore)
Sl.
No. Number and name of grant
Budget
allocation Savings Surrender
Excess
surrender
30. XLVI Social Security and Welfare 6981.14 574.88 593.90 19.02
Total 51153.99 7541.28 8977.6 1436.32
Revenue Charged
31. III Administration of Justice 127.03 2.08 2.10 0.02
Total 127.03 2.08 2.10 0.02
Capital Voted
32. XVIII Medical and Public Health 439.95 16.51 23.47 6.96
33. XXV
Welfare of Scheduled
Castes, Scheduled Tribes,
Other Backward Classes and
Minorities
172.34 50.85 51.10 0.25
34. XXVIII Miscellaneous Economic
Services 2766.04 1591.22 1592.06 0.84
35. XXIX Agriculture 429.69 111.36 111.68 0.32
36. XXX Food 115.41 22.85 31.78 8.93
37. XXXVII Industries 1161.34 267.28 290.03 22.75
38. XXXVIII Irrigation 495.19 146.26 178.70 32.44
39. XLVI Social Security and Welfare 79.20 38.78 40.54 1.76
Total 5659.16 2245.11 2319.36 74.25
Capital Charged
40. Public Debt Repayment 13606.01 473.92 473.93 0.01
Total 13606.01 473.92 473.93 0.01
Grand Total 70546.19 10262.39 11772.99 1510.60
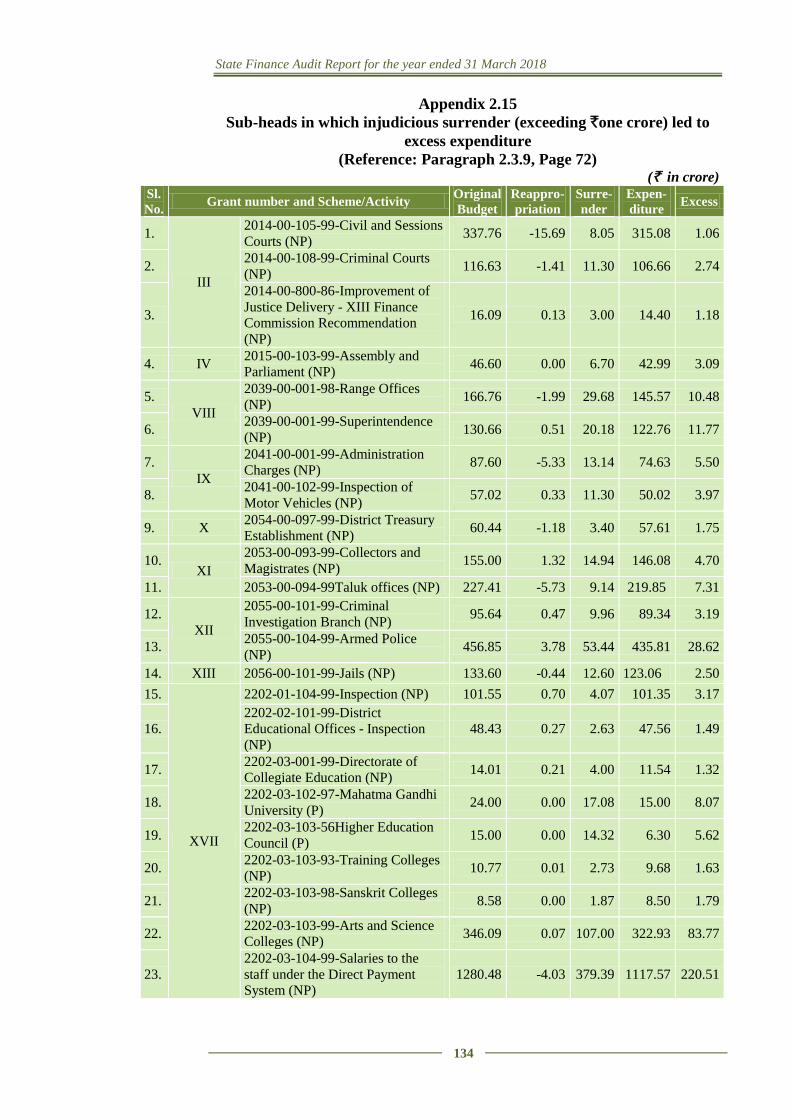
State Finance Audit Report for the year ended 31 March 2018
134
Appendix 2.15
Sub-heads in which injudicious surrender (exceeding `one crore) led to
excess expenditure
(Reference: Paragraph 2.3.9, Page 72) (` in crore)
Sl.
No. Grant number and Scheme/Activity
Original
Budget
Reappro-
priation
Surre-
nder
Expen-
diture Excess
1.
III
2014-00-105-99-Civil and Sessions
Courts (NP) 337.76 -15.69 8.05 315.08 1.06
2. 2014-00-108-99-Criminal Courts
(NP) 116.63 -1.41 11.30 106.66 2.74
3.
2014-00-800-86-Improvement of
Justice Delivery - XIII Finance
Commission Recommendation
(NP)
16.09 0.13 3.00 14.40 1.18
4. IV 2015-00-103-99-Assembly and
Parliament (NP) 46.60 0.00 6.70 42.99 3.09
5.
VIII
2039-00-001-98-Range Offices
(NP) 166.76 -1.99 29.68 145.57 10.48
6. 2039-00-001-99-Superintendence
(NP) 130.66 0.51 20.18 122.76 11.77
7.
IX
2041-00-001-99-Administration
Charges (NP) 87.60 -5.33 13.14 74.63 5.50
8. 2041-00-102-99-Inspection of
Motor Vehicles (NP) 57.02 0.33 11.30 50.02 3.97
9. X 2054-00-097-99-District Treasury
Establishment (NP) 60.44 -1.18 3.40 57.61 1.75
10. XI
2053-00-093-99-Collectors and
Magistrates (NP) 155.00 1.32 14.94 146.08 4.70
11. 2053-00-094-99Taluk offices (NP) 227.41 -5.73 9.14 219.85 7.31
12.
XII
2055-00-101-99-Criminal
Investigation Branch (NP) 95.64 0.47 9.96 89.34 3.19
13. 2055-00-104-99-Armed Police
(NP) 456.85 3.78 53.44 435.81 28.62
14. XIII 2056-00-101-99-Jails (NP) 133.60 -0.44 12.60 123.06 2.50
15.
XVII
2202-01-104-99-Inspection (NP) 101.55 0.70 4.07 101.35 3.17
16.
2202-02-101-99-District
Educational Offices - Inspection
(NP)
48.43 0.27 2.63 47.56 1.49
17. 2202-03-001-99-Directorate of
Collegiate Education (NP) 14.01 0.21 4.00 11.54 1.32
18. 2202-03-102-97-Mahatma Gandhi
University (P) 24.00 0.00 17.08 15.00 8.07
19. 2202-03-103-56Higher Education
Council (P) 15.00 0.00 14.32 6.30 5.62
20. 2202-03-103-93-Training Colleges
(NP) 10.77 0.01 2.73 9.68 1.63
21. 2202-03-103-98-Sanskrit Colleges
(NP) 8.58 0.00 1.87 8.50 1.79
22. 2202-03-103-99-Arts and Science
Colleges (NP) 346.09 0.07 107.00 322.93 83.77
23.
2202-03-104-99-Salaries to the
staff under the Direct Payment System (NP)
1280.48 -4.03 379.39 1117.57 220.51
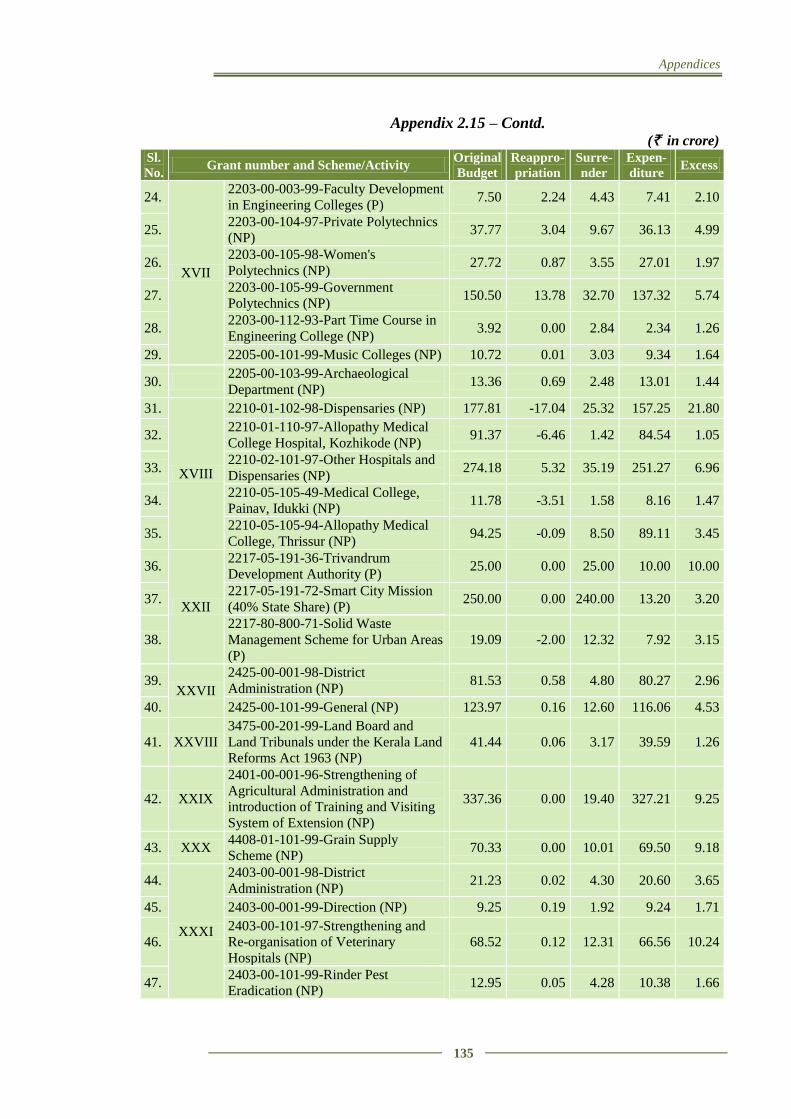
Appendices
135
Appendix 2.15 – Contd. (` in crore)
Sl.
No. Grant number and Scheme/Activity
Original
Budget
Reappro-
priation
Surre-
nder
Expen-
diture Excess
24.
XVII
2203-00-003-99-Faculty Development
in Engineering Colleges (P) 7.50 2.24 4.43 7.41 2.10
25. 2203-00-104-97-Private Polytechnics
(NP) 37.77 3.04 9.67 36.13 4.99
26. 2203-00-105-98-Women's
Polytechnics (NP) 27.72 0.87 3.55 27.01 1.97
27. 2203-00-105-99-Government
Polytechnics (NP) 150.50 13.78 32.70 137.32 5.74
28. 2203-00-112-93-Part Time Course in
Engineering College (NP) 3.92 0.00 2.84 2.34 1.26
29. 2205-00-101-99-Music Colleges (NP) 10.72 0.01 3.03 9.34 1.64
30. 2205-00-103-99-Archaeological
Department (NP) 13.36 0.69 2.48 13.01 1.44
31.
XVIII
2210-01-102-98-Dispensaries (NP) 177.81 -17.04 25.32 157.25 21.80
32. 2210-01-110-97-Allopathy Medical
College Hospital, Kozhikode (NP) 91.37 -6.46 1.42 84.54 1.05
33. 2210-02-101-97-Other Hospitals and
Dispensaries (NP) 274.18 5.32 35.19 251.27 6.96
34. 2210-05-105-49-Medical College,
Painav, Idukki (NP) 11.78 -3.51 1.58 8.16 1.47
35. 2210-05-105-94-Allopathy Medical
College, Thrissur (NP) 94.25 -0.09 8.50 89.11 3.45
36.
XXII
2217-05-191-36-Trivandrum
Development Authority (P) 25.00 0.00 25.00 10.00 10.00
37. 2217-05-191-72-Smart City Mission
(40% State Share) (P) 250.00 0.00 240.00 13.20 3.20
38.
2217-80-800-71-Solid Waste
Management Scheme for Urban Areas
(P)
19.09 -2.00 12.32 7.92 3.15
39. XXVII
2425-00-001-98-District
Administration (NP) 81.53 0.58 4.80 80.27 2.96
40. 2425-00-101-99-General (NP) 123.97 0.16 12.60 116.06 4.53
41. XXVIII
3475-00-201-99-Land Board and
Land Tribunals under the Kerala Land
Reforms Act 1963 (NP)
41.44 0.06 3.17 39.59 1.26
42. XXIX
2401-00-001-96-Strengthening of
Agricultural Administration and
introduction of Training and Visiting
System of Extension (NP)
337.36 0.00 19.40 327.21 9.25
43. XXX 4408-01-101-99-Grain Supply
Scheme (NP) 70.33 0.00 10.01 69.50 9.18
44.
XXXI
2403-00-001-98-District
Administration (NP) 21.23 0.02 4.30 20.60 3.65
45. 2403-00-001-99-Direction (NP) 9.25 0.19 1.92 9.24 1.71
46.
2403-00-101-97-Strengthening and
Re-organisation of Veterinary
Hospitals (NP)
68.52 0.12 12.31 66.56 10.24
47. 2403-00-101-99-Rinder Pest Eradication (NP)
12.95 0.05 4.28 10.38 1.66
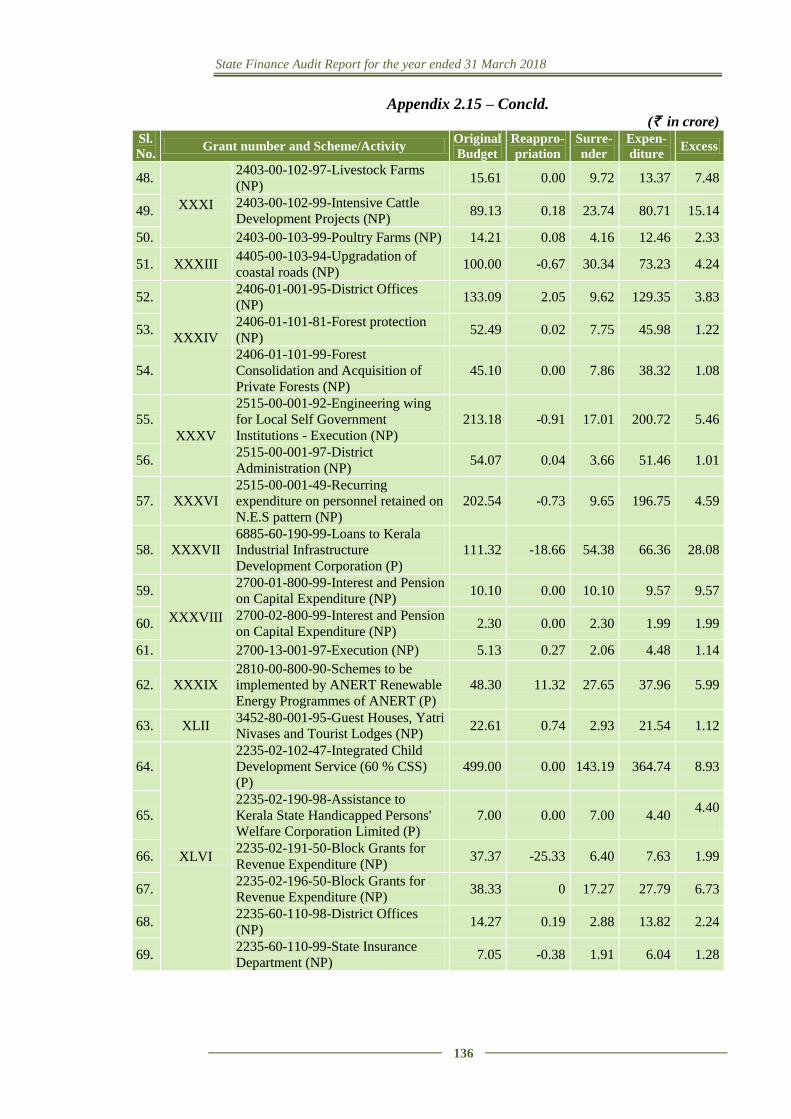
State Finance Audit Report for the year ended 31 March 2018
136
Appendix 2.15 – Concld. (` in crore)
Sl.
No. Grant number and Scheme/Activity
Original
Budget
Reappro-
priation
Surre-
nder
Expen-
diture Excess
48.
XXXI
2403-00-102-97-Livestock Farms
(NP) 15.61 0.00 9.72 13.37 7.48
49. 2403-00-102-99-Intensive Cattle
Development Projects (NP) 89.13 0.18 23.74 80.71 15.14
50. 2403-00-103-99-Poultry Farms (NP) 14.21 0.08 4.16 12.46 2.33
51. XXXIII 4405-00-103-94-Upgradation of
coastal roads (NP) 100.00 -0.67 30.34 73.23 4.24
52.
XXXIV
2406-01-001-95-District Offices
(NP) 133.09 2.05 9.62 129.35 3.83
53. 2406-01-101-81-Forest protection
(NP) 52.49 0.02 7.75 45.98 1.22
54.
2406-01-101-99-Forest
Consolidation and Acquisition of
Private Forests (NP)
45.10 0.00 7.86 38.32 1.08
55.
XXXV
2515-00-001-92-Engineering wing
for Local Self Government
Institutions - Execution (NP)
213.18 -0.91 17.01 200.72 5.46
56. 2515-00-001-97-District
Administration (NP) 54.07 0.04 3.66 51.46 1.01
57. XXXVI
2515-00-001-49-Recurring
expenditure on personnel retained on
N.E.S pattern (NP)
202.54 -0.73 9.65 196.75 4.59
58. XXXVII
6885-60-190-99-Loans to Kerala
Industrial Infrastructure
Development Corporation (P)
111.32 -18.66 54.38 66.36 28.08
59.
XXXVIII
2700-01-800-99-Interest and Pension
on Capital Expenditure (NP) 10.10 0.00 10.10 9.57 9.57
60. 2700-02-800-99-Interest and Pension
on Capital Expenditure (NP) 2.30 0.00 2.30 1.99 1.99
61. 2700-13-001-97-Execution (NP) 5.13 0.27 2.06 4.48 1.14
62. XXXIX
2810-00-800-90-Schemes to be
implemented by ANERT Renewable
Energy Programmes of ANERT (P)
48.30 11.32 27.65 37.96 5.99
63. XLII 3452-80-001-95-Guest Houses, Yatri
Nivases and Tourist Lodges (NP) 22.61 0.74 2.93 21.54 1.12
64.
XLVI
2235-02-102-47-Integrated Child
Development Service (60 % CSS)
(P)
499.00 0.00 143.19 364.74 8.93
65.
2235-02-190-98-Assistance to
Kerala State Handicapped Persons'
Welfare Corporation Limited (P)
7.00 0.00 7.00 4.40 4.40
66. 2235-02-191-50-Block Grants for
Revenue Expenditure (NP) 37.37 -25.33 6.40 7.63 1.99
67. 2235-02-196-50-Block Grants for
Revenue Expenditure (NP) 38.33 0 17.27 27.79 6.73
68. 2235-60-110-98-District Offices
(NP) 14.27 0.19 2.88 13.82 2.24
69. 2235-60-110-99-State Insurance
Department (NP) 7.05 -0.38 1.91 6.04 1.28
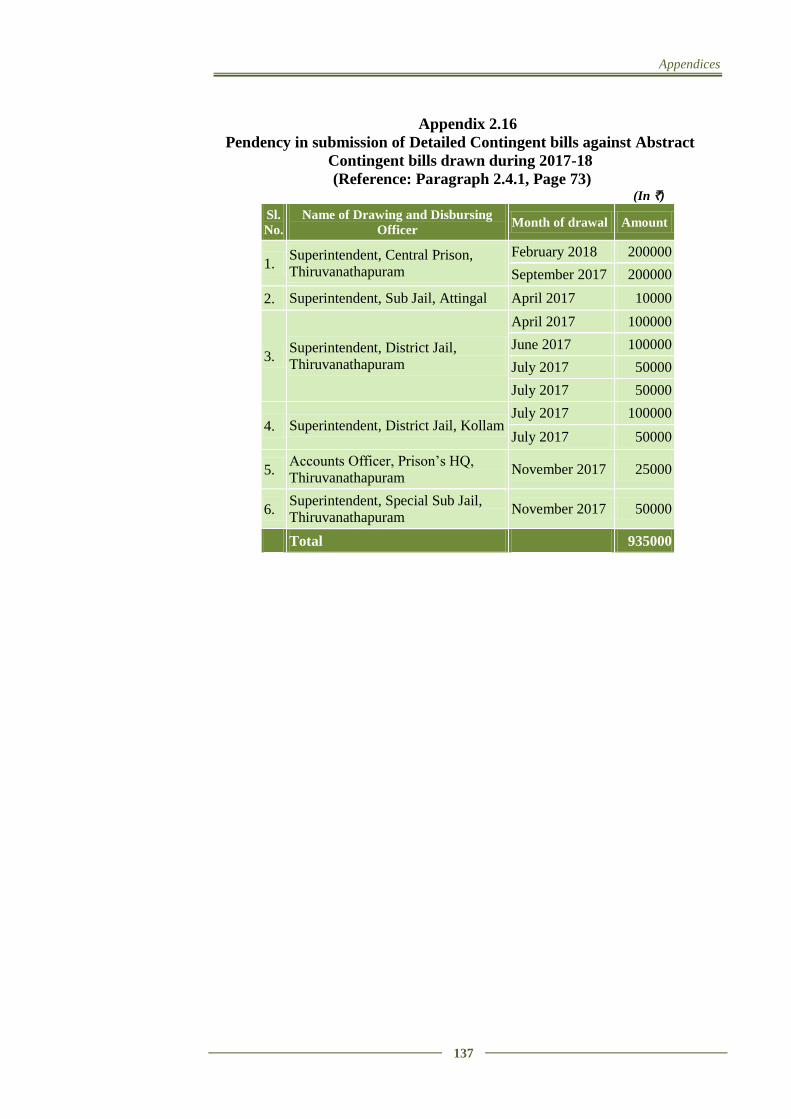
Appendices
137
Appendix 2.16
Pendency in submission of Detailed Contingent bills against Abstract
Contingent bills drawn during 2017-18
(Reference: Paragraph 2.4.1, Page 73) (In `)
Sl.
No.
Name of Drawing and Disbursing
Officer Month of drawal Amount
1. Superintendent, Central Prison,
Thiruvanathapuram
February 2018 200000
September 2017 200000
2. Superintendent, Sub Jail, Attingal April 2017 10000
3. Superintendent, District Jail,
Thiruvanathapuram
April 2017 100000
June 2017 100000
July 2017 50000
July 2017 50000
4. Superintendent, District Jail, Kollam July 2017 100000
July 2017 50000
5. Accounts Officer, Prison’s HQ,
Thiruvanathapuram November 2017 25000
6. Superintendent, Special Sub Jail,
Thiruvanathapuram November 2017 50000
Total 935000
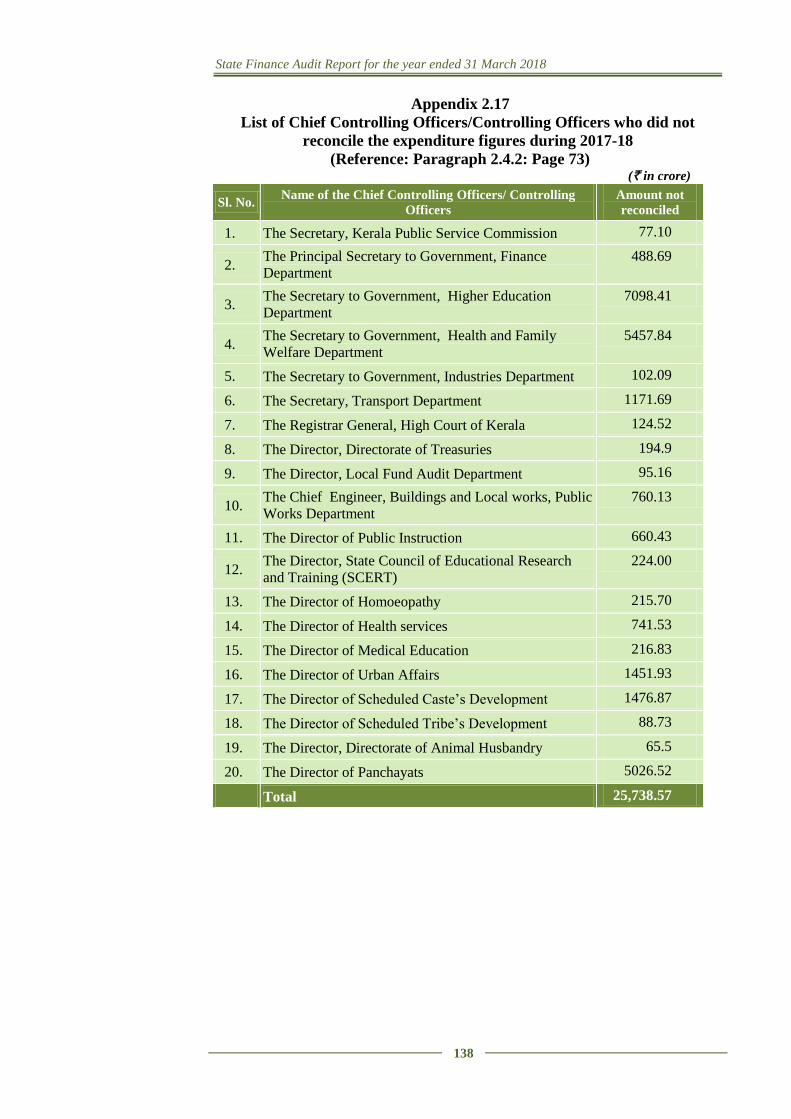
State Finance Audit Report for the year ended 31 March 2018
138
Appendix 2.17
List of Chief Controlling Officers/Controlling Officers who did not
reconcile the expenditure figures during 2017-18
(Reference: Paragraph 2.4.2: Page 73) (` in crore)
Sl. No. Name of the Chief Controlling Officers/ Controlling
Officers
Amount not
reconciled
1. The Secretary, Kerala Public Service Commission 77.10
2. The Principal Secretary to Government, Finance
Department 488.69
3. The Secretary to Government, Higher Education
Department 7098.41
4. The Secretary to Government, Health and Family
Welfare Department 5457.84
5. The Secretary to Government, Industries Department 102.09
6. The Secretary, Transport Department 1171.69
7. The Registrar General, High Court of Kerala 124.52
8. The Director, Directorate of Treasuries 194.9
9. The Director, Local Fund Audit Department 95.16
10. The Chief Engineer, Buildings and Local works, Public
Works Department 760.13
11. The Director of Public Instruction 660.43
12. The Director, State Council of Educational Research
and Training (SCERT) 224.00
13. The Director of Homoeopathy 215.70
14. The Director of Health services 741.53
15. The Director of Medical Education 216.83
16. The Director of Urban Affairs 1451.93
17. The Director of Scheduled Caste’s Development 1476.87
18. The Director of Scheduled Tribe’s Development 88.73
19. The Director, Directorate of Animal Husbandry 65.5
20. The Director of Panchayats 5026.52
Total 25,738.57
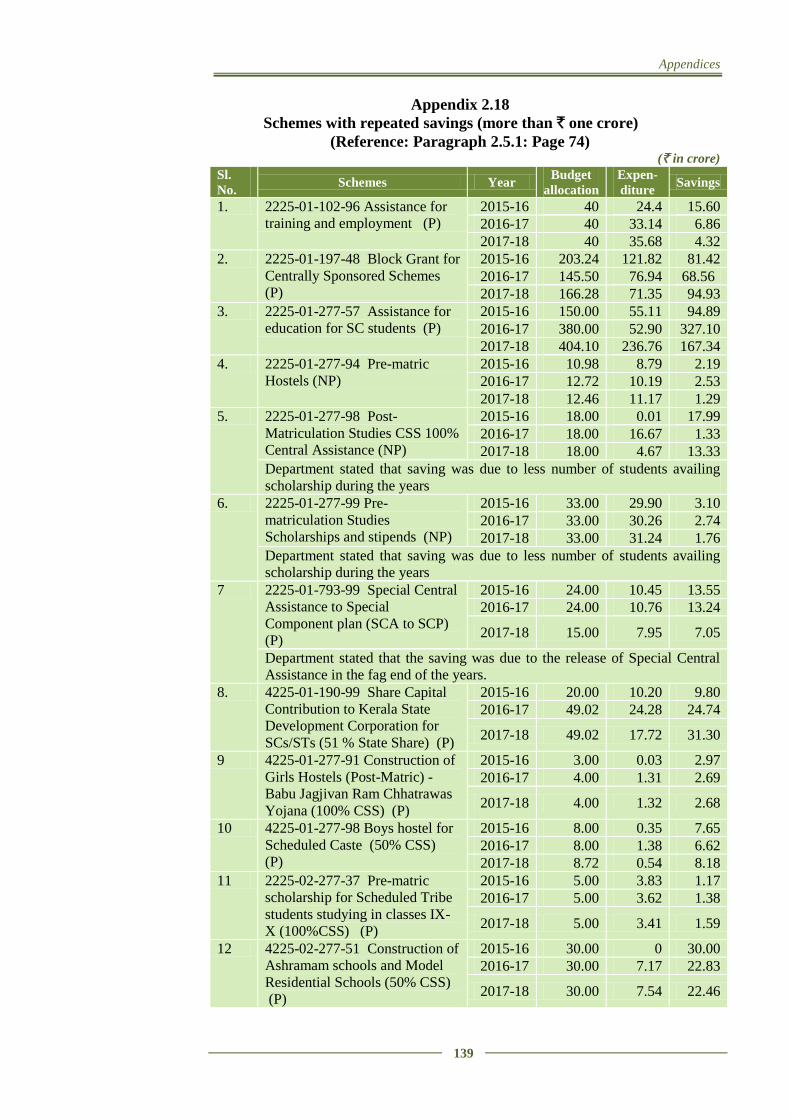
Appendices
139
Appendix 2.18
Schemes with repeated savings (more than ` one crore)
(Reference: Paragraph 2.5.1: Page 74) (` in crore)
Sl.
No. Schemes Year
Budget
allocation
Expen-
diture Savings
1. 2225-01-102-96 Assistance for
training and employment (P)
2015-16 40 24.4 15.60
2016-17 40 33.14 6.86
2017-18 40 35.68 4.32
2. 2225-01-197-48 Block Grant for
Centrally Sponsored Schemes
(P)
2015-16 203.24 121.82 81.42
2016-17 145.50 76.94 68.56
2017-18 166.28 71.35 94.93
3. 2225-01-277-57 Assistance for
education for SC students (P)
2015-16 150.00 55.11 94.89
2016-17 380.00 52.90 327.10
2017-18 404.10 236.76 167.34
4. 2225-01-277-94 Pre-matric
Hostels (NP)
2015-16 10.98 8.79 2.19
2016-17 12.72 10.19 2.53
2017-18 12.46 11.17 1.29
5. 2225-01-277-98 Post-
Matriculation Studies CSS 100%
Central Assistance (NP)
2015-16 18.00 0.01 17.99
2016-17 18.00 16.67 1.33
2017-18 18.00 4.67 13.33
Department stated that saving was due to less number of students availing
scholarship during the years
6. 2225-01-277-99 Pre-
matriculation Studies
Scholarships and stipends (NP)
2015-16 33.00 29.90 3.10
2016-17 33.00 30.26 2.74
2017-18 33.00 31.24 1.76
Department stated that saving was due to less number of students availing
scholarship during the years
7 2225-01-793-99 Special Central
Assistance to Special
Component plan (SCA to SCP)
(P)
2015-16 24.00 10.45 13.55
2016-17 24.00 10.76 13.24
2017-18 15.00 7.95 7.05
Department stated that the saving was due to the release of Special Central
Assistance in the fag end of the years.
8. 4225-01-190-99 Share Capital
Contribution to Kerala State
Development Corporation for
SCs/STs (51 % State Share) (P)
2015-16 20.00 10.20 9.80
2016-17 49.02 24.28 24.74
2017-18 49.02 17.72 31.30
9 4225-01-277-91 Construction of
Girls Hostels (Post-Matric) -
Babu Jagjivan Ram Chhatrawas
Yojana (100% CSS) (P)
2015-16 3.00 0.03 2.97
2016-17 4.00 1.31 2.69
2017-18 4.00 1.32 2.68
10 4225-01-277-98 Boys hostel for
Scheduled Caste (50% CSS)
(P)
2015-16 8.00 0.35 7.65
2016-17 8.00 1.38 6.62
2017-18 8.72 0.54 8.18
11 2225-02-277-37 Pre-matric
scholarship for Scheduled Tribe
students studying in classes IX-
X (100%CSS) (P)
2015-16 5.00 3.83 1.17
2016-17 5.00 3.62 1.38
2017-18 5.00 3.41 1.59
12 4225-02-277-51 Construction of
Ashramam schools and Model
Residential Schools (50% CSS)
(P)
2015-16 30.00 0 30.00
2016-17 30.00 7.17 22.83
2017-18 30.00 7.54 22.46
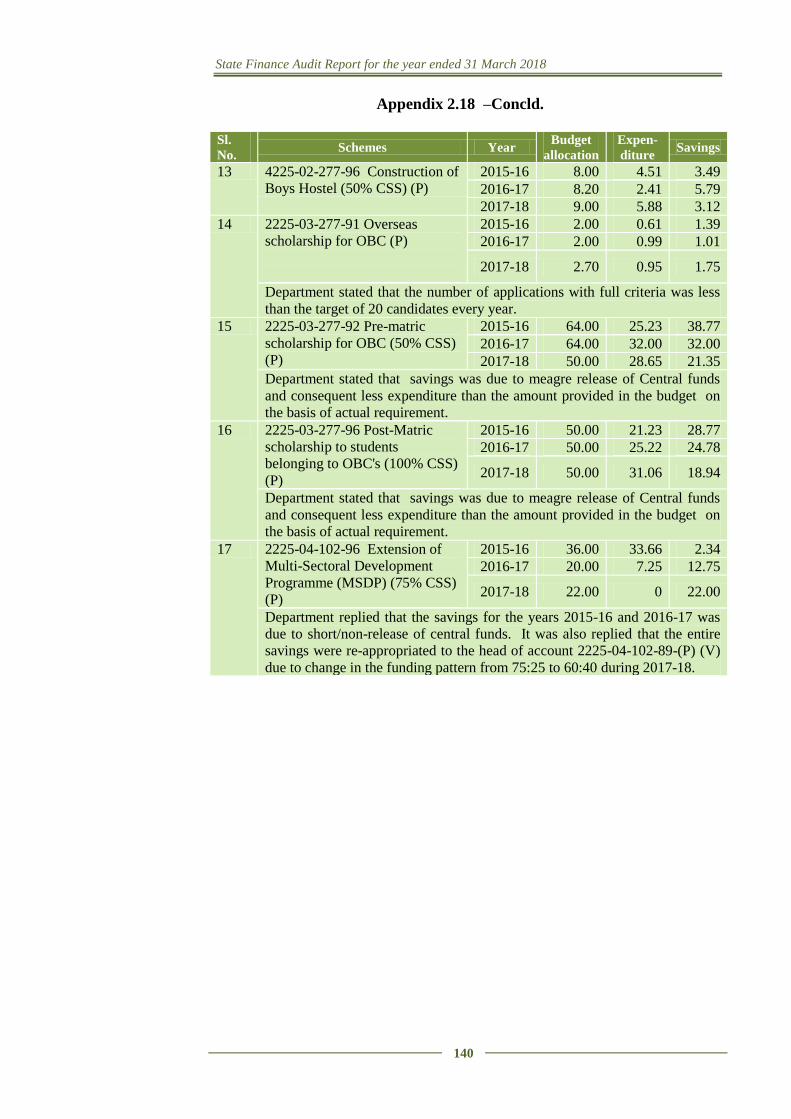
State Finance Audit Report for the year ended 31 March 2018
140
Appendix 2.18 –Concld.
Sl.
No. Schemes Year
Budget
allocation
Expen-
diture Savings
13 4225-02-277-96 Construction of
Boys Hostel (50% CSS) (P)
2015-16 8.00 4.51 3.49
2016-17 8.20 2.41 5.79
2017-18 9.00 5.88 3.12
14 2225-03-277-91 Overseas
scholarship for OBC (P)
2015-16 2.00 0.61 1.39
2016-17 2.00 0.99 1.01
2017-18 2.70 0.95 1.75
Department stated that the number of applications with full criteria was less
than the target of 20 candidates every year.
15 2225-03-277-92 Pre-matric
scholarship for OBC (50% CSS)
(P)
2015-16 64.00 25.23 38.77
2016-17 64.00 32.00 32.00
2017-18 50.00 28.65 21.35
Department stated that savings was due to meagre release of Central funds
and consequent less expenditure than the amount provided in the budget on
the basis of actual requirement.
16 2225-03-277-96 Post-Matric
scholarship to students
belonging to OBC's (100% CSS)
(P)
2015-16 50.00 21.23 28.77
2016-17 50.00 25.22 24.78
2017-18 50.00 31.06 18.94
Department stated that savings was due to meagre release of Central funds
and consequent less expenditure than the amount provided in the budget on
the basis of actual requirement.
17 2225-04-102-96 Extension of
Multi-Sectoral Development
Programme (MSDP) (75% CSS)
(P)
2015-16 36.00 33.66 2.34
2016-17 20.00 7.25 12.75
2017-18 22.00 0 22.00
Department replied that the savings for the years 2015-16 and 2016-17 was
due to short/non-release of central funds. It was also replied that the entire
savings were re-appropriated to the head of account 2225-04-102-89-(P) (V)
due to change in the funding pattern from 75:25 to 60:40 during 2017-18.
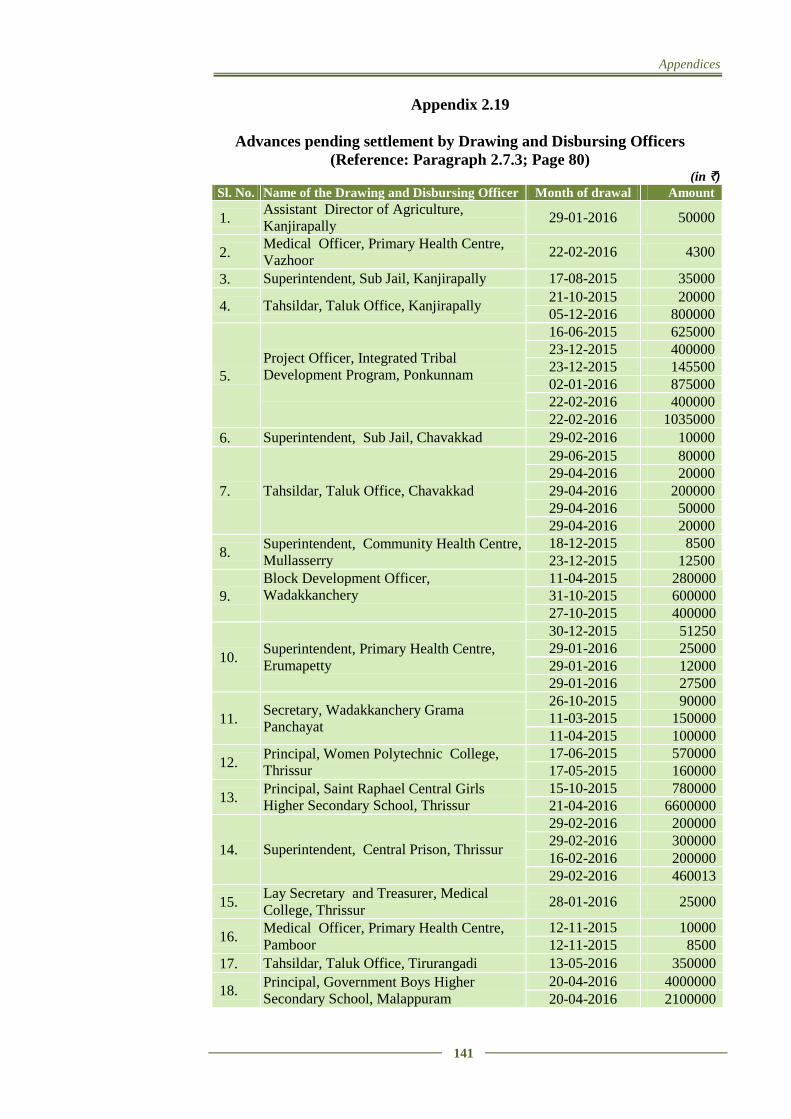
Appendices
141
Appendix 2.19
Advances pending settlement by Drawing and Disbursing Officers
(Reference: Paragraph 2.7.3; Page 80) (in `)
Sl. No. Name of the Drawing and Disbursing Officer Month of drawal Amount
1. Assistant Director of Agriculture,
Kanjirapally 29-01-2016 50000
2. Medical Officer, Primary Health Centre,
Vazhoor 22-02-2016 4300
3. Superintendent, Sub Jail, Kanjirapally 17-08-2015 35000
4. Tahsildar, Taluk Office, Kanjirapally 21-10-2015 20000 05-12-2016 800000
5. Project Officer, Integrated Tribal
Development Program, Ponkunnam
16-06-2015 625000 23-12-2015 400000 23-12-2015 145500 02-01-2016 875000 22-02-2016 400000 22-02-2016 1035000
6. Superintendent, Sub Jail, Chavakkad 29-02-2016 10000
7. Tahsildar, Taluk Office, Chavakkad
29-06-2015 80000 29-04-2016 20000 29-04-2016 200000 29-04-2016 50000 29-04-2016 20000
8. Superintendent, Community Health Centre,
Mullasserry 18-12-2015 8500 23-12-2015 12500
9. Block Development Officer,
Wadakkanchery
11-04-2015 280000 31-10-2015 600000 27-10-2015 400000
10. Superintendent, Primary Health Centre,
Erumapetty
30-12-2015 51250 29-01-2016 25000 29-01-2016 12000 29-01-2016 27500
11. Secretary, Wadakkanchery Grama
Panchayat
26-10-2015 90000 11-03-2015 150000 11-04-2015 100000
12. Principal, Women Polytechnic College,
Thrissur 17-06-2015 570000 17-05-2015 160000
13. Principal, Saint Raphael Central Girls
Higher Secondary School, Thrissur 15-10-2015 780000 21-04-2016 6600000
14. Superintendent, Central Prison, Thrissur
29-02-2016 200000 29-02-2016 300000 16-02-2016 200000 29-02-2016 460013
15. Lay Secretary and Treasurer, Medical
College, Thrissur 28-01-2016 25000
16. Medical Officer, Primary Health Centre,
Pamboor 12-11-2015 10000 12-11-2015 8500
17. Tahsildar, Taluk Office, Tirurangadi 13-05-2016 350000
18. Principal, Government Boys Higher
Secondary School, Malappuram 20-04-2016 4000000 20-04-2016 2100000
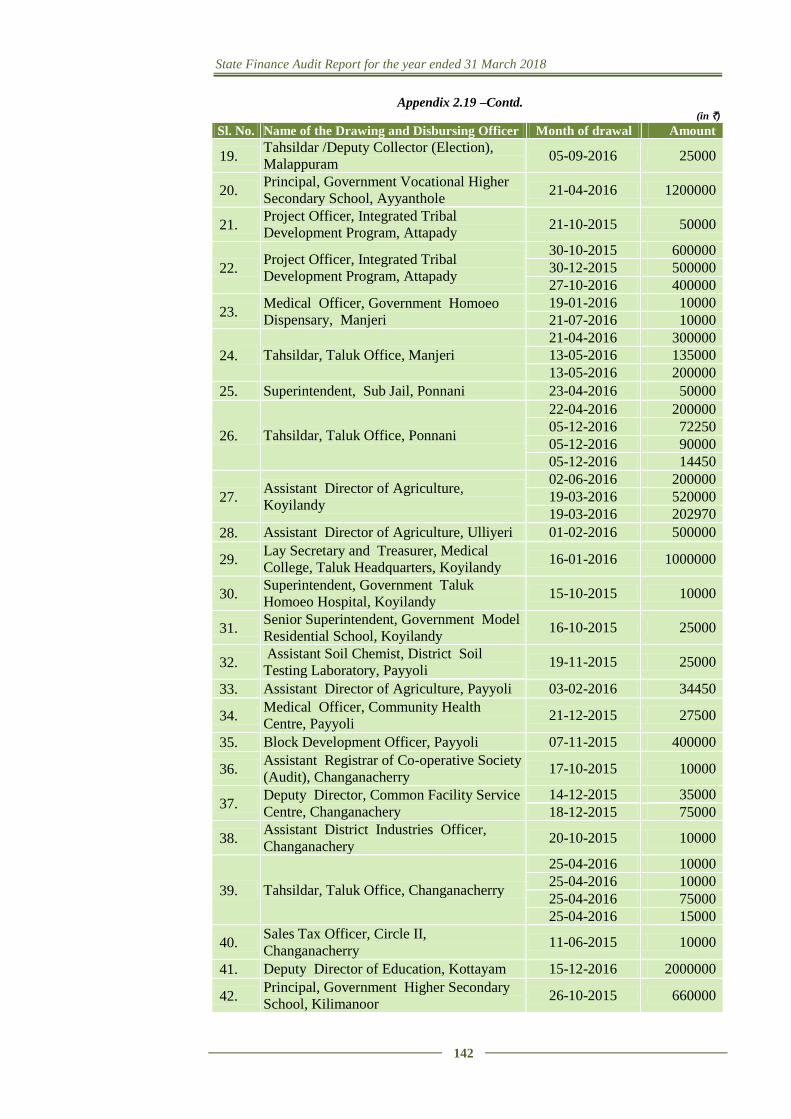
State Finance Audit Report for the year ended 31 March 2018
142
Appendix 2.19 –Contd. (in `)
Sl. No. Name of the Drawing and Disbursing Officer Month of drawal Amount
19. Tahsildar /Deputy Collector (Election),
Malappuram 05-09-2016 25000
20. Principal, Government Vocational Higher
Secondary School, Ayyanthole 21-04-2016 1200000
21. Project Officer, Integrated Tribal
Development Program, Attapady 21-10-2015 50000
22. Project Officer, Integrated Tribal
Development Program, Attapady
30-10-2015 600000 30-12-2015 500000 27-10-2016 400000
23. Medical Officer, Government Homoeo
Dispensary, Manjeri 19-01-2016 10000 21-07-2016 10000
24. Tahsildar, Taluk Office, Manjeri 21-04-2016 300000 13-05-2016 135000 13-05-2016 200000
25. Superintendent, Sub Jail, Ponnani 23-04-2016 50000
26. Tahsildar, Taluk Office, Ponnani
22-04-2016 200000 05-12-2016 72250 05-12-2016 90000 05-12-2016 14450
27. Assistant Director of Agriculture,
Koyilandy
02-06-2016 200000 19-03-2016 520000 19-03-2016 202970
28. Assistant Director of Agriculture, Ulliyeri 01-02-2016 500000
29. Lay Secretary and Treasurer, Medical
College, Taluk Headquarters, Koyilandy 16-01-2016 1000000
30. Superintendent, Government Taluk
Homoeo Hospital, Koyilandy 15-10-2015 10000
31. Senior Superintendent, Government Model
Residential School, Koyilandy 16-10-2015 25000
32. Assistant Soil Chemist, District Soil
Testing Laboratory, Payyoli 19-11-2015 25000
33. Assistant Director of Agriculture, Payyoli 03-02-2016 34450
34. Medical Officer, Community Health
Centre, Payyoli 21-12-2015 27500
35. Block Development Officer, Payyoli 07-11-2015 400000
36. Assistant Registrar of Co-operative Society
(Audit), Changanacherry 17-10-2015 10000
37. Deputy Director, Common Facility Service
Centre, Changanachery 14-12-2015 35000 18-12-2015 75000
38. Assistant District Industries Officer,
Changanachery 20-10-2015 10000
39. Tahsildar, Taluk Office, Changanacherry
25-04-2016 10000 25-04-2016 10000 25-04-2016 75000 25-04-2016 15000
40. Sales Tax Officer, Circle II,
Changanacherry 11-06-2015 10000
41. Deputy Director of Education, Kottayam 15-12-2016 2000000
42. Principal, Government Higher Secondary
School, Kilimanoor 26-10-2015 660000
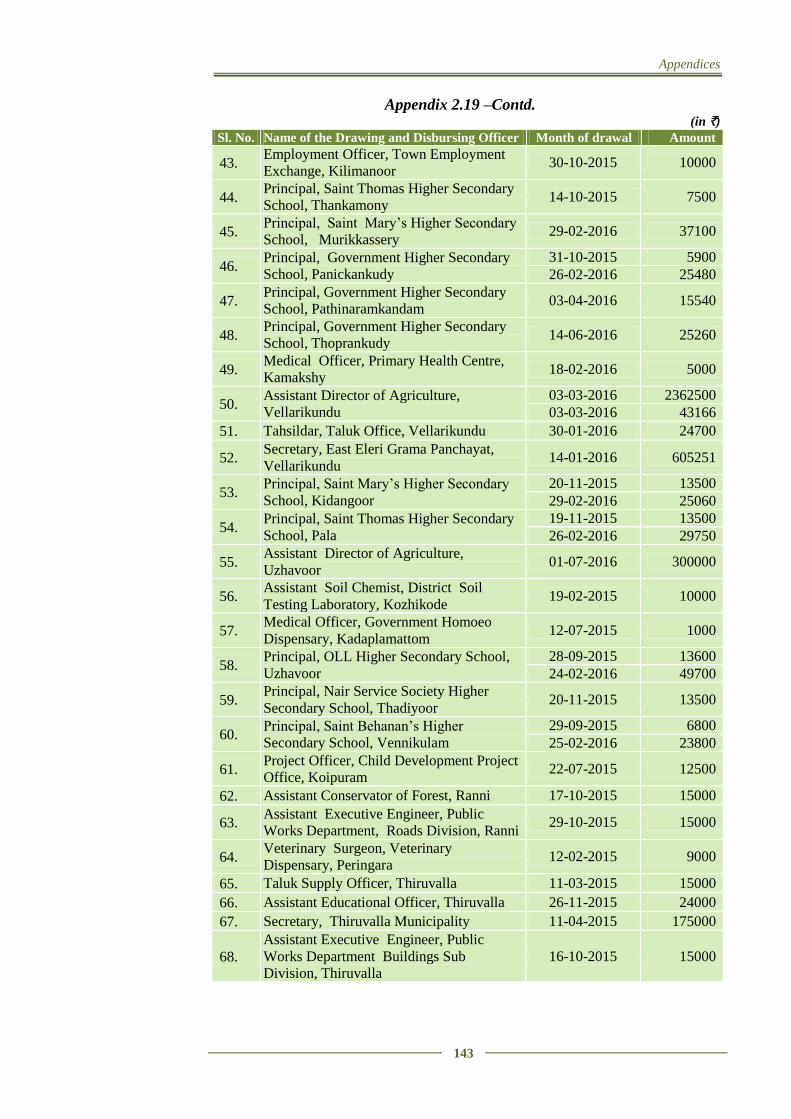
Appendices
143
Appendix 2.19 –Contd. (in `)
Sl. No. Name of the Drawing and Disbursing Officer Month of drawal Amount
43. Employment Officer, Town Employment
Exchange, Kilimanoor 30-10-2015 10000
44. Principal, Saint Thomas Higher Secondary
School, Thankamony 14-10-2015 7500
45. Principal, Saint Mary’s Higher Secondary
School, Murikkassery 29-02-2016 37100
46. Principal, Government Higher Secondary
School, Panickankudy 31-10-2015 5900 26-02-2016 25480
47. Principal, Government Higher Secondary
School, Pathinaramkandam 03-04-2016 15540
48. Principal, Government Higher Secondary
School, Thoprankudy 14-06-2016 25260
49. Medical Officer, Primary Health Centre,
Kamakshy 18-02-2016 5000
50. Assistant Director of Agriculture,
Vellarikundu 03-03-2016 2362500 03-03-2016 43166
51. Tahsildar, Taluk Office, Vellarikundu 30-01-2016 24700
52. Secretary, East Eleri Grama Panchayat,
Vellarikundu 14-01-2016 605251
53. Principal, Saint Mary’s Higher Secondary
School, Kidangoor 20-11-2015 13500 29-02-2016 25060
54. Principal, Saint Thomas Higher Secondary
School, Pala 19-11-2015 13500 26-02-2016 29750
55. Assistant Director of Agriculture,
Uzhavoor 01-07-2016 300000
56. Assistant Soil Chemist, District Soil
Testing Laboratory, Kozhikode 19-02-2015 10000
57. Medical Officer, Government Homoeo
Dispensary, Kadaplamattom 12-07-2015 1000
58. Principal, OLL Higher Secondary School,
Uzhavoor 28-09-2015 13600 24-02-2016 49700
59. Principal, Nair Service Society Higher
Secondary School, Thadiyoor 20-11-2015 13500
60. Principal, Saint Behanan’s Higher
Secondary School, Vennikulam 29-09-2015 6800 25-02-2016 23800
61. Project Officer, Child Development Project
Office, Koipuram 22-07-2015 12500
62. Assistant Conservator of Forest, Ranni 17-10-2015 15000
63. Assistant Executive Engineer, Public
Works Department, Roads Division, Ranni 29-10-2015 15000
64. Veterinary Surgeon, Veterinary
Dispensary, Peringara 12-02-2015 9000
65. Taluk Supply Officer, Thiruvalla 11-03-2015 15000
66. Assistant Educational Officer, Thiruvalla 26-11-2015 24000
67. Secretary, Thiruvalla Municipality 11-04-2015 175000
68. Assistant Executive Engineer, Public
Works Department Buildings Sub
Division, Thiruvalla 16-10-2015 15000
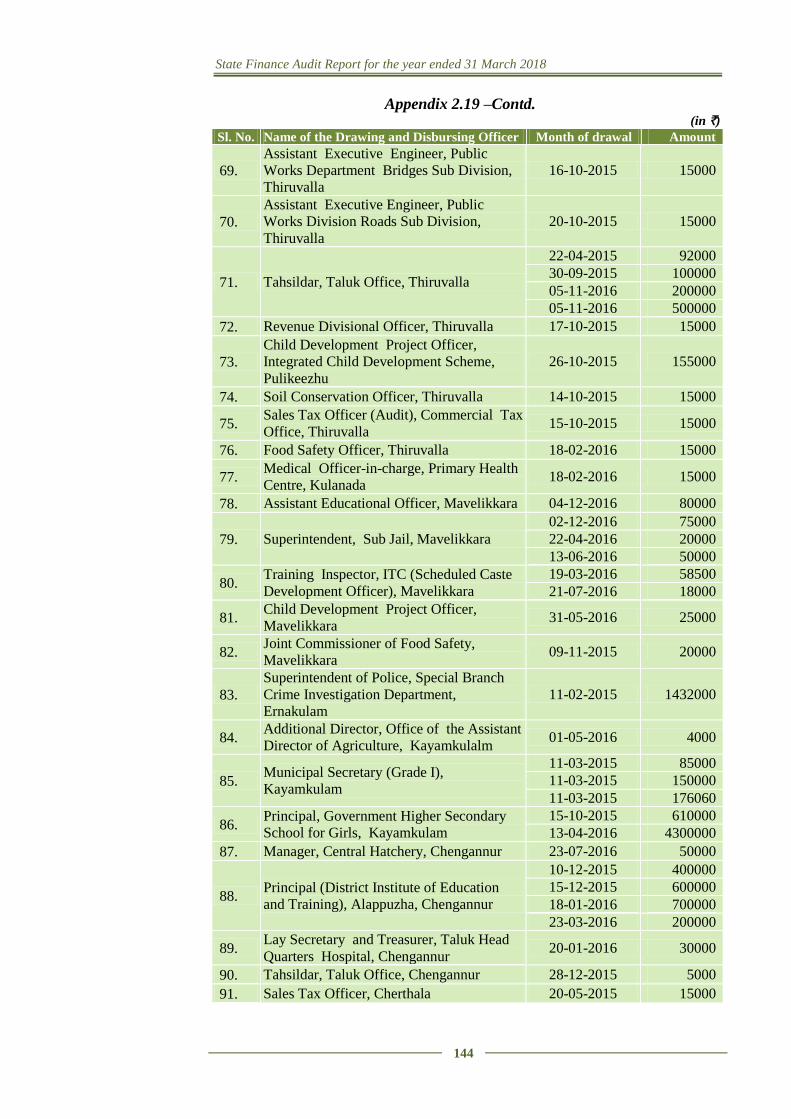
State Finance Audit Report for the year ended 31 March 2018
144
Appendix 2.19 –Contd. (in `)
Sl. No. Name of the Drawing and Disbursing Officer Month of drawal Amount
69. Assistant Executive Engineer, Public
Works Department Bridges Sub Division,
Thiruvalla 16-10-2015 15000
70. Assistant Executive Engineer, Public
Works Division Roads Sub Division,
Thiruvalla 20-10-2015 15000
71. Tahsildar, Taluk Office, Thiruvalla
22-04-2015 92000 30-09-2015 100000 05-11-2016 200000 05-11-2016 500000
72. Revenue Divisional Officer, Thiruvalla 17-10-2015 15000
73. Child Development Project Officer,
Integrated Child Development Scheme,
Pulikeezhu 26-10-2015 155000
74. Soil Conservation Officer, Thiruvalla 14-10-2015 15000
75. Sales Tax Officer (Audit), Commercial Tax
Office, Thiruvalla 15-10-2015 15000
76. Food Safety Officer, Thiruvalla 18-02-2016 15000
77. Medical Officer-in-charge, Primary Health
Centre, Kulanada 18-02-2016 15000
78. Assistant Educational Officer, Mavelikkara 04-12-2016 80000
79. Superintendent, Sub Jail, Mavelikkara 02-12-2016 75000 22-04-2016 20000 13-06-2016 50000
80. Training Inspector, ITC (Scheduled Caste
Development Officer), Mavelikkara 19-03-2016 58500 21-07-2016 18000
81. Child Development Project Officer,
Mavelikkara 31-05-2016 25000
82. Joint Commissioner of Food Safety,
Mavelikkara 09-11-2015 20000
83. Superintendent of Police, Special Branch
Crime Investigation Department,
Ernakulam 11-02-2015 1432000
84. Additional Director, Office of the Assistant
Director of Agriculture, Kayamkulalm 01-05-2016 4000
85. Municipal Secretary (Grade I),
Kayamkulam
11-03-2015 85000 11-03-2015 150000 11-03-2015 176060
86. Principal, Government Higher Secondary
School for Girls, Kayamkulam 15-10-2015 610000 13-04-2016 4300000
87. Manager, Central Hatchery, Chengannur 23-07-2016 50000
88. Principal (District Institute of Education
and Training), Alappuzha, Chengannur
10-12-2015 400000 15-12-2015 600000 18-01-2016 700000 23-03-2016 200000
89. Lay Secretary and Treasurer, Taluk Head
Quarters Hospital, Chengannur 20-01-2016 30000
90. Tahsildar, Taluk Office, Chengannur 28-12-2015 5000
91. Sales Tax Officer, Cherthala 20-05-2015 15000
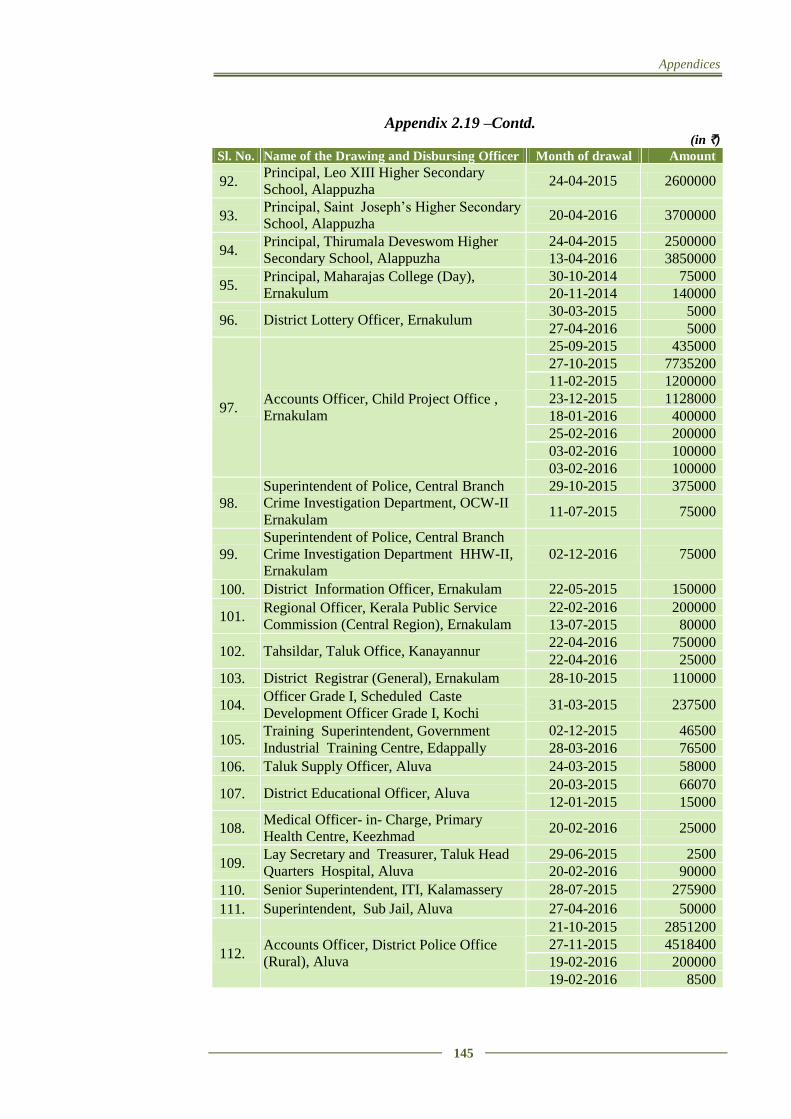
Appendices
145
Appendix 2.19 –Contd. (in `)
Sl. No. Name of the Drawing and Disbursing Officer Month of drawal Amount
92. Principal, Leo XIII Higher Secondary
School, Alappuzha 24-04-2015 2600000
93. Principal, Saint Joseph’s Higher Secondary
School, Alappuzha 20-04-2016 3700000
94. Principal, Thirumala Deveswom Higher
Secondary School, Alappuzha 24-04-2015 2500000 13-04-2016 3850000
95. Principal, Maharajas College (Day),
Ernakulum 30-10-2014 75000 20-11-2014 140000
96. District Lottery Officer, Ernakulum 30-03-2015 5000 27-04-2016 5000
97. Accounts Officer, Child Project Office ,
Ernakulam
25-09-2015 435000 27-10-2015 7735200 11-02-2015 1200000 23-12-2015 1128000 18-01-2016 400000 25-02-2016 200000 03-02-2016 100000 03-02-2016 100000
98. Superintendent of Police, Central Branch
Crime Investigation Department, OCW-II
Ernakulam
29-10-2015 375000
11-07-2015 75000
99. Superintendent of Police, Central Branch
Crime Investigation Department HHW-II,
Ernakulam 02-12-2016 75000
100. District Information Officer, Ernakulam 22-05-2015 150000
101. Regional Officer, Kerala Public Service
Commission (Central Region), Ernakulam 22-02-2016 200000 13-07-2015 80000
102. Tahsildar, Taluk Office, Kanayannur 22-04-2016 750000 22-04-2016 25000
103. District Registrar (General), Ernakulam 28-10-2015 110000
104. Officer Grade I, Scheduled Caste
Development Officer Grade I, Kochi 31-03-2015 237500
105. Training Superintendent, Government
Industrial Training Centre, Edappally 02-12-2015 46500 28-03-2016 76500
106. Taluk Supply Officer, Aluva 24-03-2015 58000
107. District Educational Officer, Aluva 20-03-2015 66070 12-01-2015 15000
108. Medical Officer- in- Charge, Primary
Health Centre, Keezhmad 20-02-2016 25000
109. Lay Secretary and Treasurer, Taluk Head
Quarters Hospital, Aluva 29-06-2015 2500 20-02-2016 90000
110. Senior Superintendent, ITI, Kalamassery 28-07-2015 275900
111. Superintendent, Sub Jail, Aluva 27-04-2016 50000
112. Accounts Officer, District Police Office
(Rural), Aluva
21-10-2015 2851200 27-11-2015 4518400 19-02-2016 200000 19-02-2016 8500
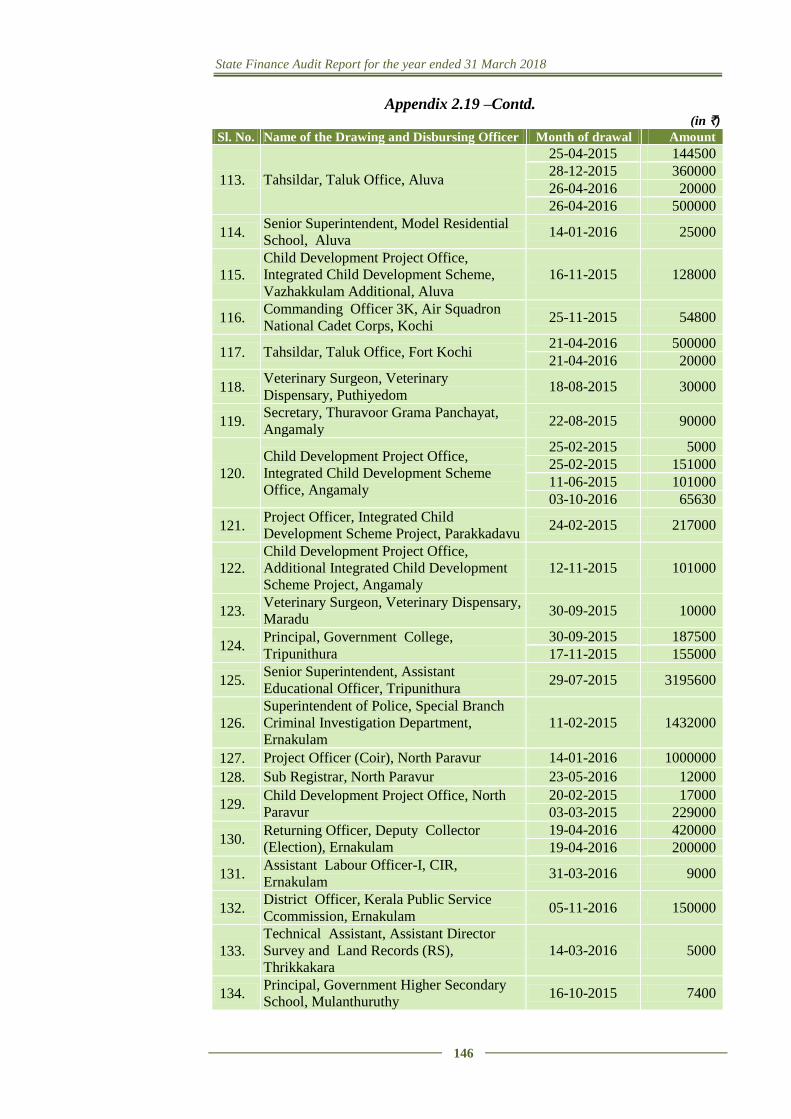
State Finance Audit Report for the year ended 31 March 2018
146
Appendix 2.19 –Contd. (in `)
Sl. No. Name of the Drawing and Disbursing Officer Month of drawal Amount
113. Tahsildar, Taluk Office, Aluva
25-04-2015 144500 28-12-2015 360000 26-04-2016 20000 26-04-2016 500000
114. Senior Superintendent, Model Residential
School, Aluva 14-01-2016 25000
115. Child Development Project Office,
Integrated Child Development Scheme,
Vazhakkulam Additional, Aluva 16-11-2015 128000
116. Commanding Officer 3K, Air Squadron
National Cadet Corps, Kochi 25-11-2015 54800
117. Tahsildar, Taluk Office, Fort Kochi 21-04-2016 500000 21-04-2016 20000
118. Veterinary Surgeon, Veterinary
Dispensary, Puthiyedom 18-08-2015 30000
119. Secretary, Thuravoor Grama Panchayat,
Angamaly 22-08-2015 90000
120. Child Development Project Office,
Integrated Child Development Scheme
Office, Angamaly
25-02-2015 5000 25-02-2015 151000 11-06-2015 101000 03-10-2016 65630
121. Project Officer, Integrated Child
Development Scheme Project, Parakkadavu 24-02-2015 217000
122. Child Development Project Office,
Additional Integrated Child Development
Scheme Project, Angamaly 12-11-2015 101000
123. Veterinary Surgeon, Veterinary Dispensary,
Maradu 30-09-2015 10000
124. Principal, Government College,
Tripunithura 30-09-2015 187500 17-11-2015 155000
125. Senior Superintendent, Assistant
Educational Officer, Tripunithura 29-07-2015 3195600
126. Superintendent of Police, Special Branch
Criminal Investigation Department,
Ernakulam 11-02-2015 1432000
127. Project Officer (Coir), North Paravur 14-01-2016 1000000
128. Sub Registrar, North Paravur 23-05-2016 12000
129. Child Development Project Office, North
Paravur 20-02-2015 17000 03-03-2015 229000
130. Returning Officer, Deputy Collector
(Election), Ernakulam 19-04-2016 420000 19-04-2016 200000
131. Assistant Labour Officer-I, CIR,
Ernakulam 31-03-2016 9000
132. District Officer, Kerala Public Service
Ccommission, Ernakulam 05-11-2016 150000
133. Technical Assistant, Assistant Director
Survey and Land Records (RS),
Thrikkakara 14-03-2016 5000
134. Principal, Government Higher Secondary
School, Mulanthuruthy 16-10-2015 7400
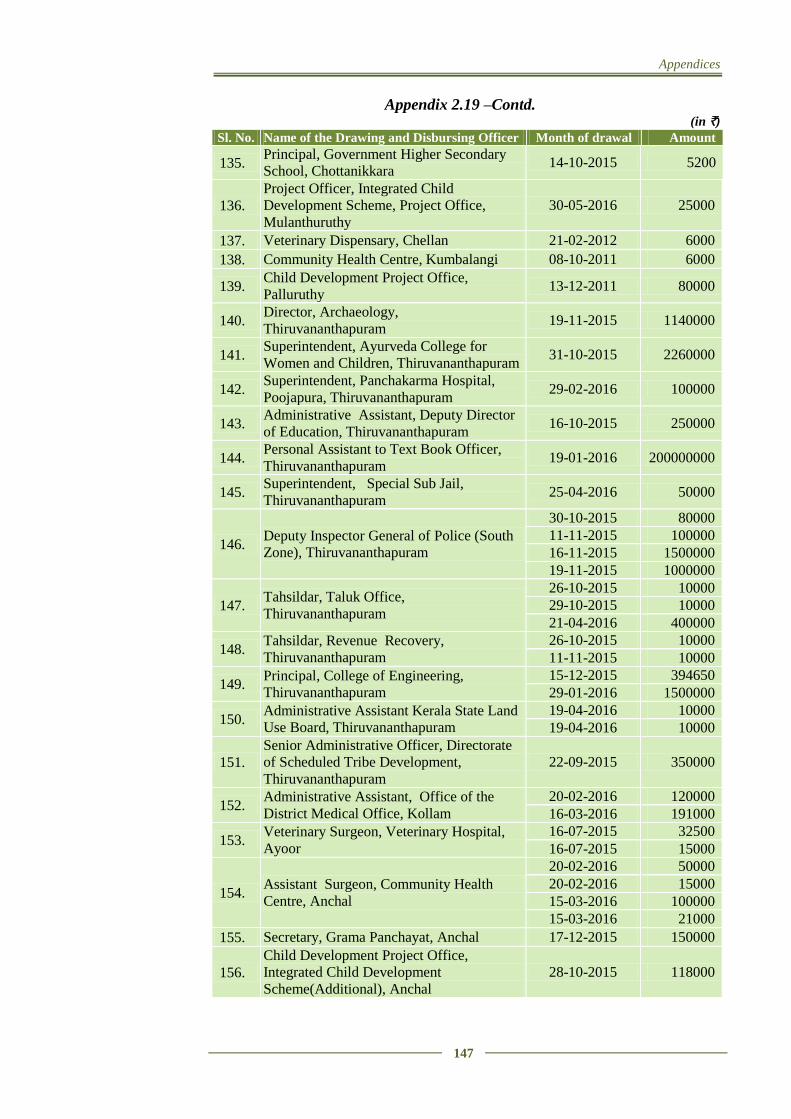
Appendices
147
Appendix 2.19 –Contd. (in `)
Sl. No. Name of the Drawing and Disbursing Officer Month of drawal Amount
135. Principal, Government Higher Secondary
School, Chottanikkara 14-10-2015 5200
136. Project Officer, Integrated Child
Development Scheme, Project Office,
Mulanthuruthy 30-05-2016 25000
137. Veterinary Dispensary, Chellan 21-02-2012 6000
138. Community Health Centre, Kumbalangi 08-10-2011 6000
139. Child Development Project Office,
Palluruthy 13-12-2011 80000
140. Director, Archaeology,
Thiruvananthapuram 19-11-2015 1140000
141. Superintendent, Ayurveda College for
Women and Children, Thiruvananthapuram 31-10-2015 2260000
142. Superintendent, Panchakarma Hospital,
Poojapura, Thiruvananthapuram 29-02-2016 100000
143. Administrative Assistant, Deputy Director
of Education, Thiruvananthapuram 16-10-2015 250000
144. Personal Assistant to Text Book Officer,
Thiruvananthapuram 19-01-2016 200000000
145. Superintendent, Special Sub Jail,
Thiruvananthapuram 25-04-2016 50000
146. Deputy Inspector General of Police (South
Zone), Thiruvananthapuram
30-10-2015 80000 11-11-2015 100000 16-11-2015 1500000 19-11-2015 1000000
147. Tahsildar, Taluk Office,
Thiruvananthapuram
26-10-2015 10000 29-10-2015 10000 21-04-2016 400000
148. Tahsildar, Revenue Recovery,
Thiruvananthapuram 26-10-2015 10000 11-11-2015 10000
149. Principal, College of Engineering,
Thiruvananthapuram 15-12-2015 394650 29-01-2016 1500000
150. Administrative Assistant Kerala State Land
Use Board, Thiruvananthapuram 19-04-2016 10000 19-04-2016 10000
151. Senior Administrative Officer, Directorate
of Scheduled Tribe Development,
Thiruvananthapuram 22-09-2015 350000
152. Administrative Assistant, Office of the
District Medical Office, Kollam 20-02-2016 120000 16-03-2016 191000
153. Veterinary Surgeon, Veterinary Hospital,
Ayoor 16-07-2015 32500 16-07-2015 15000
154. Assistant Surgeon, Community Health
Centre, Anchal
20-02-2016 50000 20-02-2016 15000 15-03-2016 100000 15-03-2016 21000
155. Secretary, Grama Panchayat, Anchal 17-12-2015 150000
156. Child Development Project Office,
Integrated Child Development
Scheme(Additional), Anchal 28-10-2015 118000
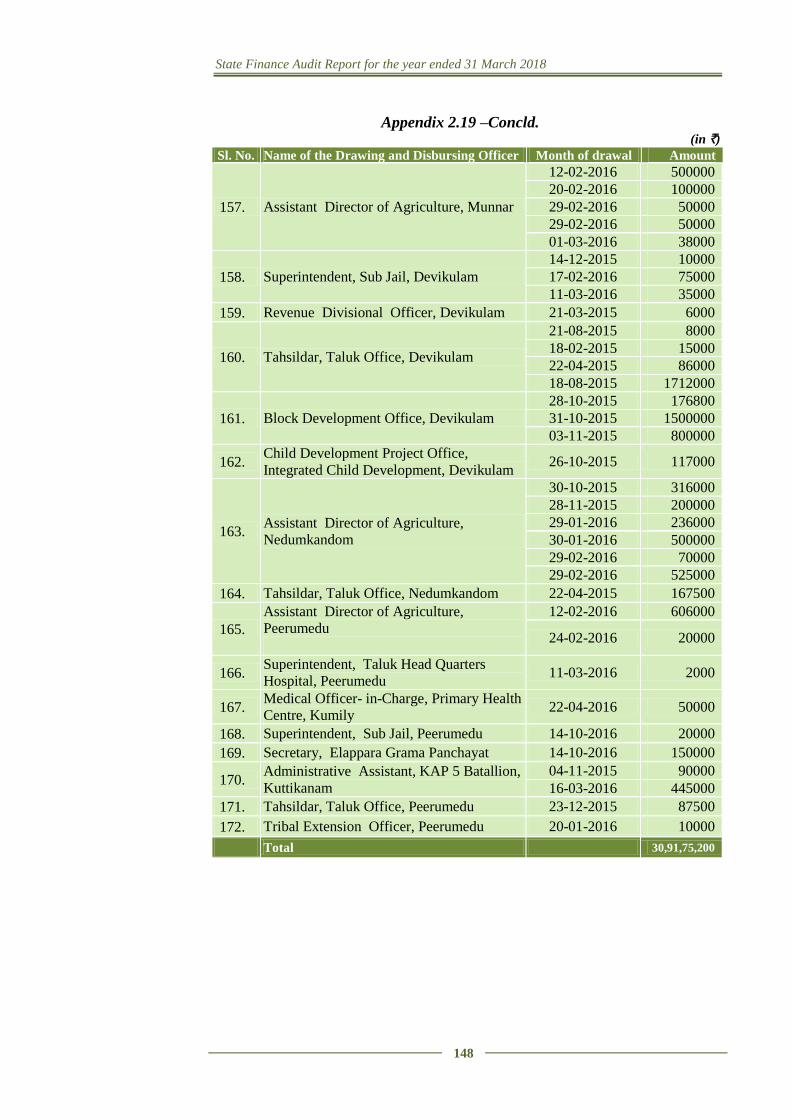
State Finance Audit Report for the year ended 31 March 2018
148
Appendix 2.19 –Concld. (in `)
Sl. No. Name of the Drawing and Disbursing Officer Month of drawal Amount
157. Assistant Director of Agriculture, Munnar
12-02-2016 500000 20-02-2016 100000 29-02-2016 50000 29-02-2016 50000 01-03-2016 38000
158. Superintendent, Sub Jail, Devikulam 14-12-2015 10000 17-02-2016 75000 11-03-2016 35000
159. Revenue Divisional Officer, Devikulam 21-03-2015 6000
160. Tahsildar, Taluk Office, Devikulam
21-08-2015 8000 18-02-2015 15000 22-04-2015 86000 18-08-2015 1712000
161. Block Development Office, Devikulam 28-10-2015 176800 31-10-2015 1500000 03-11-2015 800000
162. Child Development Project Office,
Integrated Child Development, Devikulam 26-10-2015 117000
163. Assistant Director of Agriculture,
Nedumkandom
30-10-2015 316000 28-11-2015 200000 29-01-2016 236000 30-01-2016 500000 29-02-2016 70000 29-02-2016 525000
164. Tahsildar, Taluk Office, Nedumkandom 22-04-2015 167500
165. Assistant Director of Agriculture,
Peerumedu
12-02-2016 606000
24-02-2016 20000
166. Superintendent, Taluk Head Quarters
Hospital, Peerumedu 11-03-2016 2000
167. Medical Officer- in-Charge, Primary Health
Centre, Kumily 22-04-2016 50000
168. Superintendent, Sub Jail, Peerumedu 14-10-2016 20000
169. Secretary, Elappara Grama Panchayat 14-10-2016 150000
170. Administrative Assistant, KAP 5 Batallion,
Kuttikanam 04-11-2015 90000 16-03-2016 445000
171. Tahsildar, Taluk Office, Peerumedu 23-12-2015 87500
172. Tribal Extension Officer, Peerumedu 20-01-2016 10000
Total 30,91,75,200
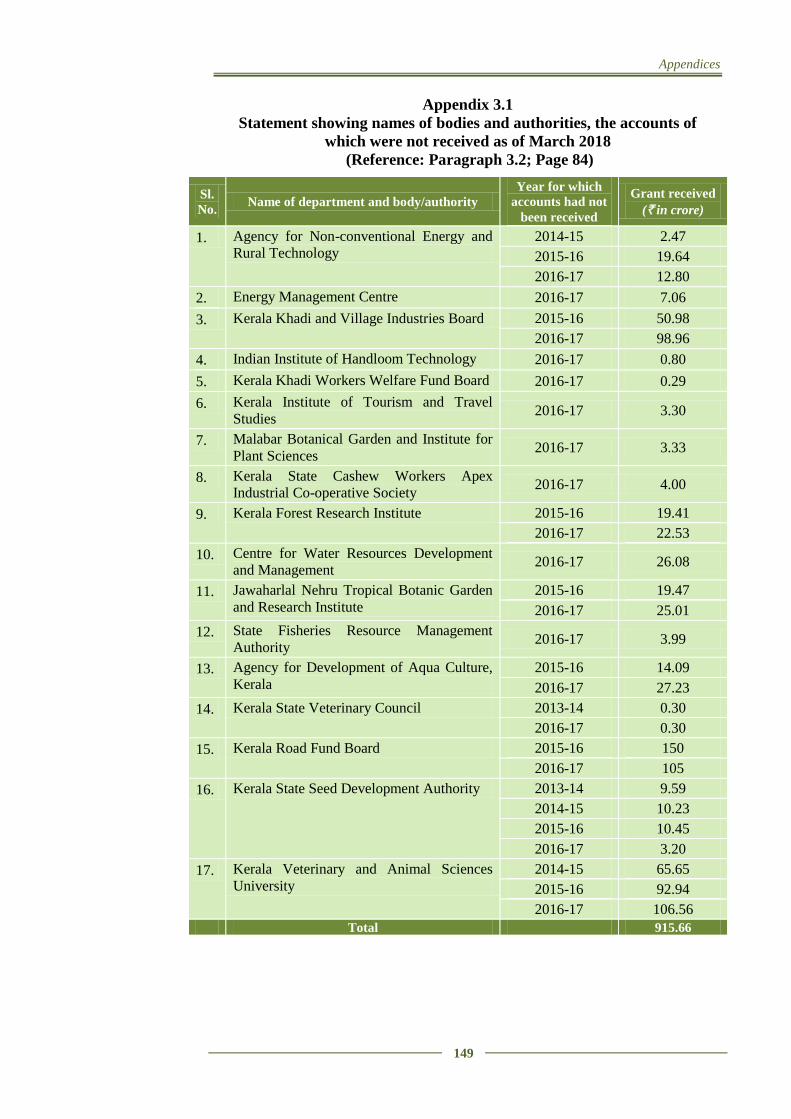
Appendices
149
Appendix 3.1
Statement showing names of bodies and authorities, the accounts of
which were not received as of March 2018
(Reference: Paragraph 3.2; Page 84)
Sl.
No. Name of department and body/authority
Year for which
accounts had not
been received
Grant received
(` in crore)
1. Agency for Non-conventional Energy and
Rural Technology 2014-15 2.47
2015-16 19.64
2016-17 12.80
2. Energy Management Centre 2016-17 7.06
3. Kerala Khadi and Village Industries Board 2015-16 50.98
2016-17 98.96
4. Indian Institute of Handloom Technology 2016-17 0.80
5. Kerala Khadi Workers Welfare Fund Board 2016-17 0.29
6. Kerala Institute of Tourism and Travel
Studies 2016-17 3.30
7. Malabar Botanical Garden and Institute for
Plant Sciences 2016-17 3.33
8. Kerala State Cashew Workers Apex
Industrial Co-operative Society 2016-17 4.00
9. Kerala Forest Research Institute 2015-16 19.41
2016-17 22.53
10. Centre for Water Resources Development
and Management 2016-17 26.08
11. Jawaharlal Nehru Tropical Botanic Garden
and Research Institute 2015-16 19.47
2016-17 25.01
12. State Fisheries Resource Management
Authority 2016-17 3.99
13. Agency for Development of Aqua Culture,
Kerala 2015-16 14.09
2016-17 27.23
14. Kerala State Veterinary Council 2013-14 0.30
2016-17 0.30
15. Kerala Road Fund Board 2015-16 150
2016-17 105
16. Kerala State Seed Development Authority 2013-14 9.59
2014-15 10.23
2015-16 10.45
2016-17 3.20
17. Kerala Veterinary and Animal Sciences
University 2014-15 65.65
2015-16 92.94
2016-17 106.56 Total 915.66
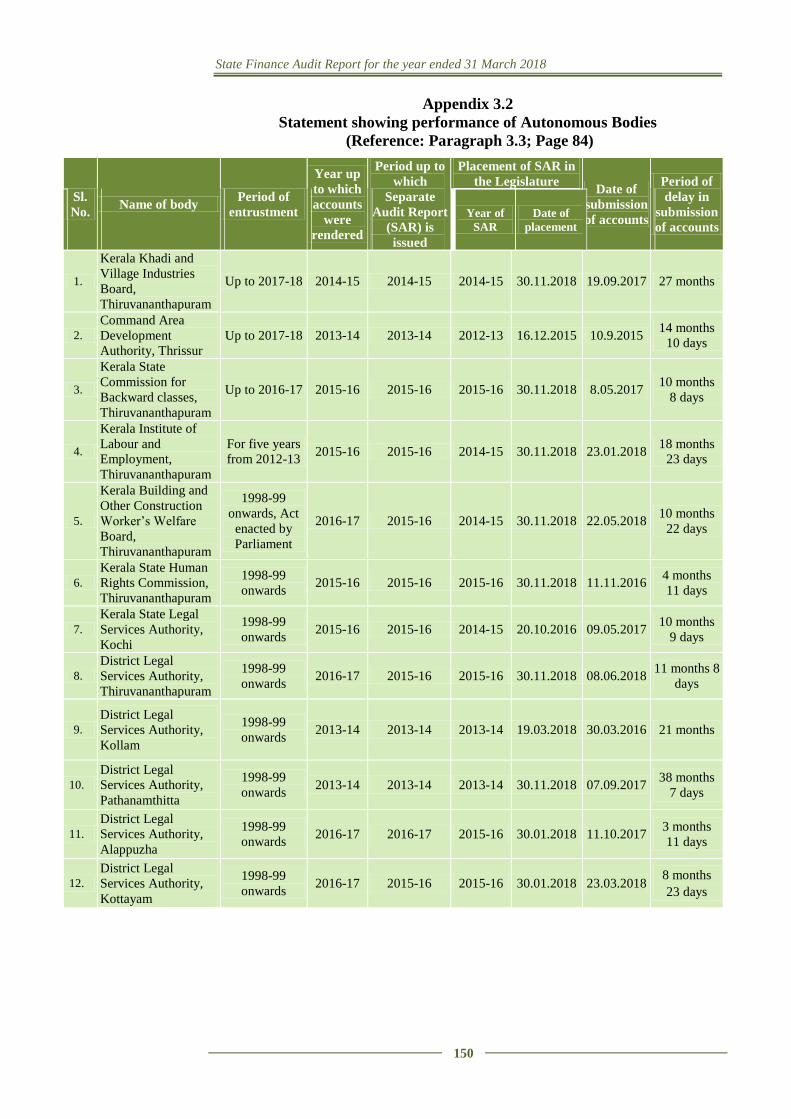
State Finance Audit Report for the year ended 31 March 2018
150
Appendix 3.2
Statement showing performance of Autonomous Bodies
(Reference: Paragraph 3.3; Page 84)
Sl.
No. Name of body
Period of
entrustment
Year up
to which
accounts
were
rendered
Period up to
which
Separate
Audit Report
(SAR) is
issued
Placement of SAR in
the Legislature Date of
submission
of accounts
Period of
delay in
submission
of accounts Year of
SAR
Date of
placement
1.
Kerala Khadi and
Village Industries
Board,
Thiruvananthapuram
Up to 2017-18 2014-15 2014-15 2014-15 30.11.2018 19.09.2017 27 months
2.
Command Area
Development
Authority, Thrissur
Up to 2017-18 2013-14 2013-14 2012-13 16.12.2015 10.9.2015 14 months
10 days
3.
Kerala State
Commission for
Backward classes,
Thiruvananthapuram
Up to 2016-17 2015-16 2015-16 2015-16 30.11.2018 8.05.2017 10 months
8 days
4.
Kerala Institute of
Labour and
Employment,
Thiruvananthapuram
For five years
from 2012-13 2015-16 2015-16 2014-15 30.11.2018 23.01.2018
18 months
23 days
5.
Kerala Building and
Other Construction
Worker’s Welfare
Board,
Thiruvananthapuram
1998-99
onwards, Act
enacted by
Parliament
2016-17 2015-16 2014-15 30.11.2018 22.05.2018 10 months
22 days
6.
Kerala State Human
Rights Commission,
Thiruvananthapuram
1998-99
onwards 2015-16 2015-16 2015-16 30.11.2018 11.11.2016
4 months
11 days
7.
Kerala State Legal
Services Authority,
Kochi
1998-99
onwards 2015-16 2015-16 2014-15 20.10.2016 09.05.2017
10 months
9 days
8.
District Legal
Services Authority,
Thiruvananthapuram
1998-99
onwards 2016-17 2015-16 2015-16 30.11.2018 08.06.2018
11 months 8
days
9.
District Legal
Services Authority,
Kollam
1998-99
onwards 2013-14 2013-14 2013-14 19.03.2018 30.03.2016 21 months
10.
District Legal
Services Authority,
Pathanamthitta
1998-99
onwards 2013-14 2013-14 2013-14 30.11.2018 07.09.2017
38 months
7 days
11.
District Legal
Services Authority,
Alappuzha
1998-99
onwards 2016-17 2016-17 2015-16 30.01.2018 11.10.2017
3 months
11 days
12.
District Legal
Services Authority,
Kottayam
1998-99
onwards 2016-17 2015-16 2015-16 30.01.2018 23.03.2018
8 months
23 days
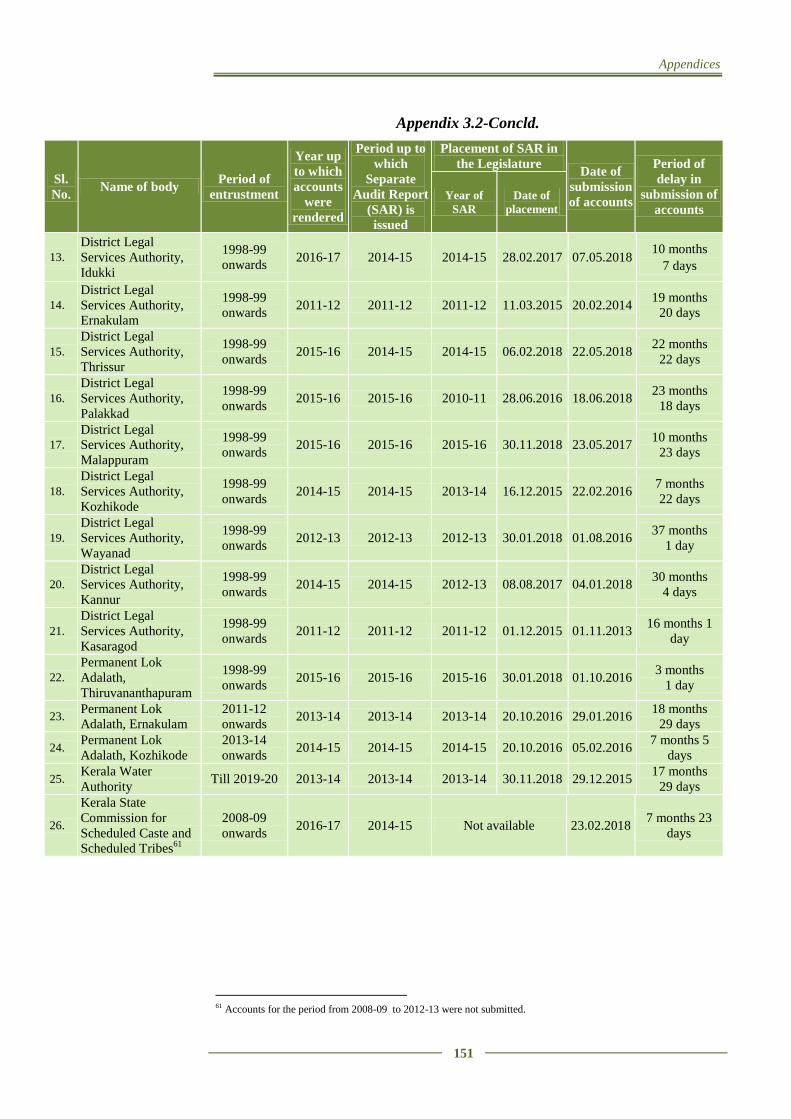
Appendices
151
Appendix 3.2-Concld.
Sl.
No. Name of body
Period of
entrustment
Year up
to which
accounts
were
rendered
Period up to
which
Separate
Audit Report
(SAR) is
issued
Placement of SAR in
the Legislature Date of
submission
of accounts
Period of
delay in
submission of
accounts Year of
SAR
Date of
placement
13.
District Legal
Services Authority,
Idukki
1998-99
onwards 2016-17 2014-15 2014-15 28.02.2017 07.05.2018
10 months
7 days
14.
District Legal
Services Authority,
Ernakulam
1998-99
onwards 2011-12 2011-12 2011-12 11.03.2015 20.02.2014
19 months
20 days
15.
District Legal
Services Authority,
Thrissur
1998-99
onwards 2015-16 2014-15 2014-15 06.02.2018 22.05.2018
22 months
22 days
16.
District Legal
Services Authority,
Palakkad
1998-99
onwards 2015-16 2015-16 2010-11 28.06.2016 18.06.2018
23 months
18 days
17.
District Legal
Services Authority,
Malappuram
1998-99
onwards 2015-16 2015-16 2015-16 30.11.2018 23.05.2017
10 months
23 days
18.
District Legal
Services Authority,
Kozhikode
1998-99
onwards 2014-15 2014-15 2013-14 16.12.2015 22.02.2016
7 months
22 days
19.
District Legal
Services Authority,
Wayanad
1998-99
onwards 2012-13 2012-13 2012-13 30.01.2018 01.08.2016
37 months
1 day
20.
District Legal
Services Authority,
Kannur
1998-99
onwards 2014-15 2014-15 2012-13 08.08.2017 04.01.2018
30 months
4 days
21.
District Legal
Services Authority,
Kasaragod
1998-99
onwards 2011-12 2011-12 2011-12 01.12.2015 01.11.2013
16 months 1
day
22.
Permanent Lok
Adalath,
Thiruvananthapuram
1998-99
onwards 2015-16 2015-16 2015-16 30.01.2018 01.10.2016
3 months
1 day
23. Permanent Lok
Adalath, Ernakulam
2011-12
onwards 2013-14 2013-14 2013-14 20.10.2016 29.01.2016
18 months
29 days
24. Permanent Lok
Adalath, Kozhikode
2013-14
onwards 2014-15 2014-15 2014-15 20.10.2016 05.02.2016
7 months 5
days
25. Kerala Water
Authority Till 2019-20 2013-14 2013-14 2013-14 30.11.2018 29.12.2015
17 months
29 days
26.
Kerala State
Commission for
Scheduled Caste and
Scheduled Tribes61
2008-09
onwards 2016-17 2014-15 Not available 23.02.2018
7 months 23
days
61 Accounts for the period from 2008-09 to 2012-13 were not submitted.
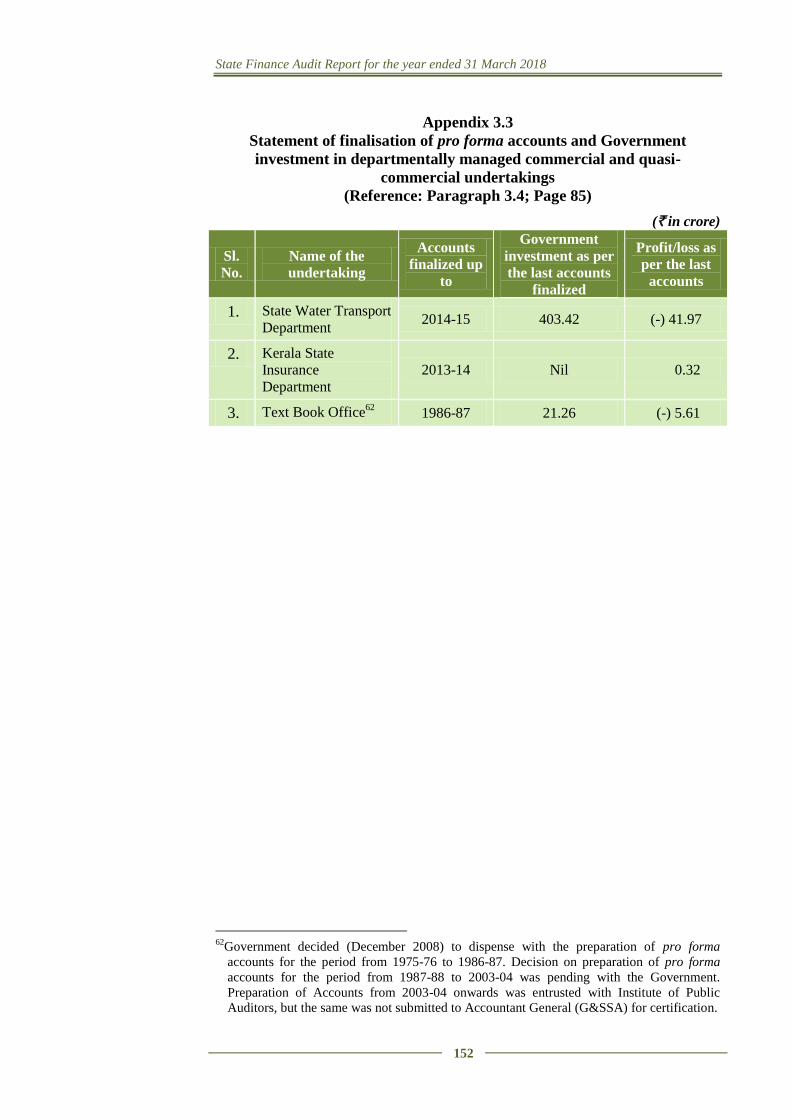
State Finance Audit Report for the year ended 31 March 2018
152
Appendix 3.3
Statement of finalisation of pro forma accounts and Government
investment in departmentally managed commercial and quasi-
commercial undertakings
(Reference: Paragraph 3.4; Page 85)
(` in crore)
Sl.
No. Name of the
undertaking
Accounts
finalized up
to
Government
investment as per
the last accounts
finalized
Profit/loss as
per the last
accounts
1. State Water Transport
Department 2014-15 403.42 (-) 41.97
2. Kerala State
Insurance
Department 2013-14 Nil 0.32
3. Text Book Office62 1986-87 21.26 (-) 5.61
62
Government decided (December 2008) to dispense with the preparation of pro forma
accounts for the period from 1975-76 to 1986-87. Decision on preparation of pro forma
accounts for the period from 1987-88 to 2003-04 was pending with the Government.
Preparation of Accounts from 2003-04 onwards was entrusted with Institute of Public
Auditors, but the same was not submitted to Accountant General (G&SSA) for certification.
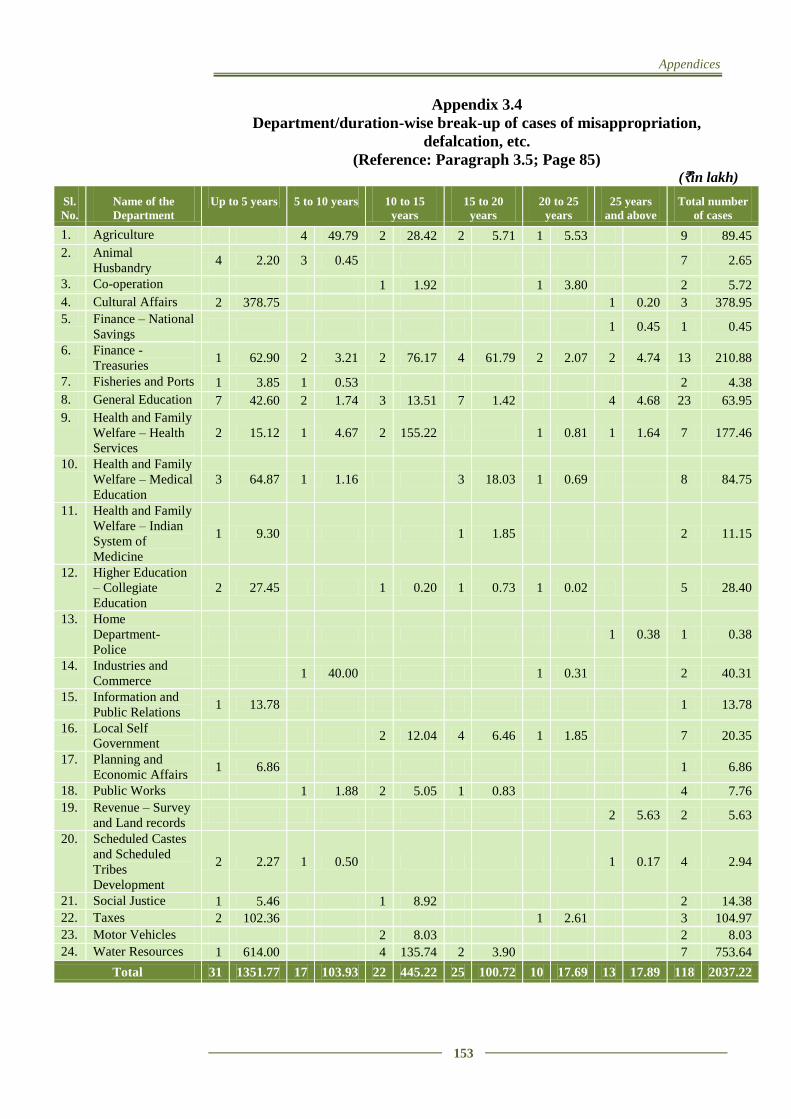
Appendices
153
Appendix 3.4
Department/duration-wise break-up of cases of misappropriation,
defalcation, etc.
(Reference: Paragraph 3.5; Page 85) (`in lakh)
Sl.
No.
Name of the
Department
Up to 5 years 5 to 10 years 10 to 15
years
15 to 20
years
20 to 25
years
25 years
and above
Total number
of cases
1. Agriculture 4 49.79 2 28.42 2 5.71 1 5.53 9 89.45
2. Animal
Husbandry 4 2.20 3 0.45 7 2.65
3. Co-operation 1 1.92 1 3.80 2 5.72
4. Cultural Affairs 2 378.75 1 0.20 3 378.95
5. Finance – National
Savings 1 0.45 1 0.45
6. Finance -
Treasuries 1 62.90 2 3.21 2 76.17 4 61.79 2 2.07 2 4.74 13 210.88
7. Fisheries and Ports 1 3.85 1 0.53 2 4.38
8. General Education 7 42.60 2 1.74 3 13.51 7 1.42 4 4.68 23 63.95
9. Health and Family
Welfare – Health
Services
2 15.12 1 4.67 2 155.22 1 0.81 1 1.64 7 177.46
10. Health and Family
Welfare – Medical
Education
3 64.87 1 1.16 3 18.03 1 0.69 8 84.75
11. Health and Family
Welfare – Indian
System of
Medicine
1 9.30 1 1.85 2 11.15
12. Higher Education
– Collegiate
Education
2 27.45 1 0.20 1 0.73 1 0.02 5 28.40
13. Home
Department-
Police
1 0.38 1 0.38
14. Industries and
Commerce 1 40.00 1 0.31 2 40.31
15. Information and
Public Relations 1 13.78 1 13.78
16. Local Self
Government 2 12.04 4 6.46 1 1.85 7 20.35
17. Planning and
Economic Affairs 1 6.86 1 6.86
18. Public Works 1 1.88 2 5.05 1 0.83 4 7.76
19. Revenue – Survey
and Land records 2 5.63 2 5.63
20. Scheduled Castes
and Scheduled
Tribes
Development
2 2.27 1 0.50 1 0.17 4 2.94
21. Social Justice 1 5.46 1 8.92 2 14.38
22. Taxes 2 102.36 1 2.61 3 104.97
23. Motor Vehicles 2 8.03 2 8.03
24. Water Resources 1 614.00 4 135.74 2 3.90 7 753.64
Total 31 1351.77 17 103.93 22 445.22 25 100.72 10 17.69 13 17.89 118 2037.22
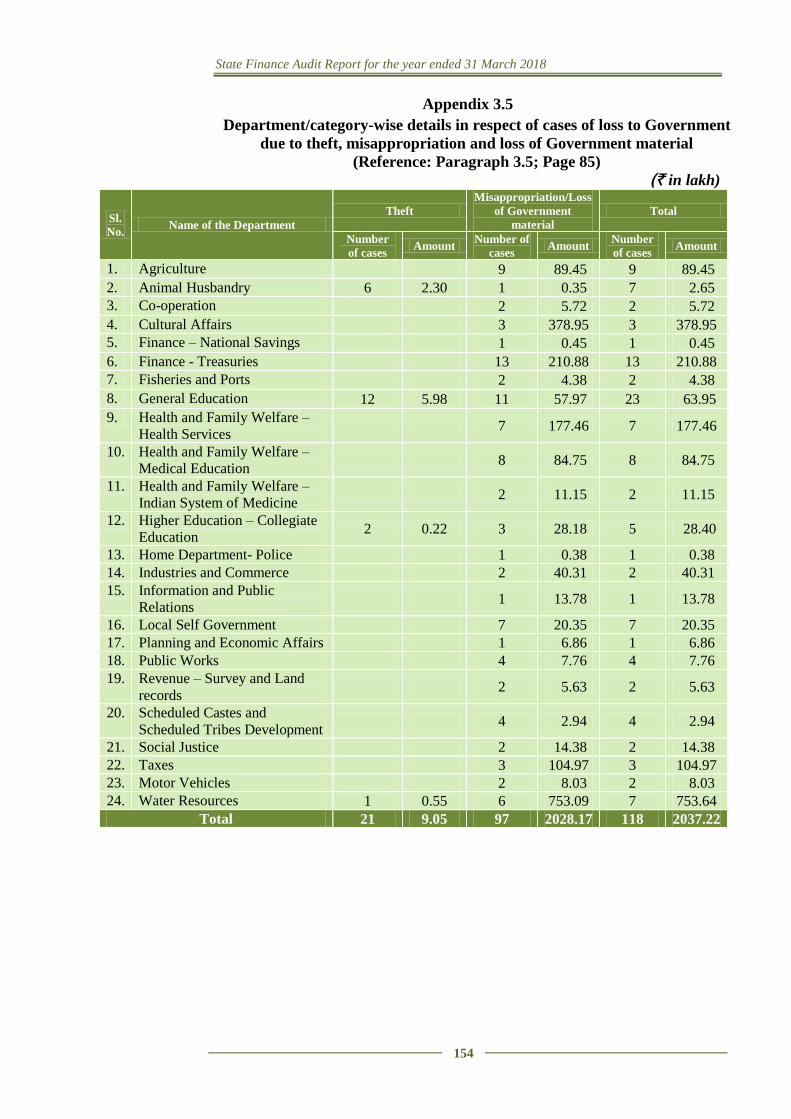
State Finance Audit Report for the year ended 31 March 2018
154
Appendix 3.5
Department/category-wise details in respect of cases of loss to Government
due to theft, misappropriation and loss of Government material
(Reference: Paragraph 3.5; Page 85)
(` in lakh)
Sl.
No. Name of the Department
Theft
Misappropriation/Loss
of Government
material
Total
Number
of cases Amount
Number of
cases Amount
Number
of cases Amount
1. Agriculture 9 89.45 9 89.45
2. Animal Husbandry 6 2.30 1 0.35 7 2.65
3. Co-operation 2 5.72 2 5.72
4. Cultural Affairs 3 378.95 3 378.95
5. Finance – National Savings 1 0.45 1 0.45
6. Finance - Treasuries 13 210.88 13 210.88
7. Fisheries and Ports 2 4.38 2 4.38
8. General Education 12 5.98 11 57.97 23 63.95
9. Health and Family Welfare –
Health Services 7 177.46 7 177.46
10. Health and Family Welfare –
Medical Education 8 84.75 8 84.75
11. Health and Family Welfare –
Indian System of Medicine 2 11.15 2 11.15
12. Higher Education – Collegiate
Education 2 0.22 3 28.18 5 28.40
13. Home Department- Police 1 0.38 1 0.38
14. Industries and Commerce 2 40.31 2 40.31
15. Information and Public
Relations 1 13.78 1 13.78
16. Local Self Government 7 20.35 7 20.35
17. Planning and Economic Affairs 1 6.86 1 6.86
18. Public Works 4 7.76 4 7.76
19. Revenue – Survey and Land
records 2 5.63 2 5.63
20. Scheduled Castes and
Scheduled Tribes Development 4 2.94 4 2.94
21. Social Justice 2 14.38 2 14.38
22. Taxes 3 104.97 3 104.97
23. Motor Vehicles 2 8.03 2 8.03
24. Water Resources 1 0.55 6 753.09 7 753.64
Total 21 9.05 97 2028.17 118 2037.22
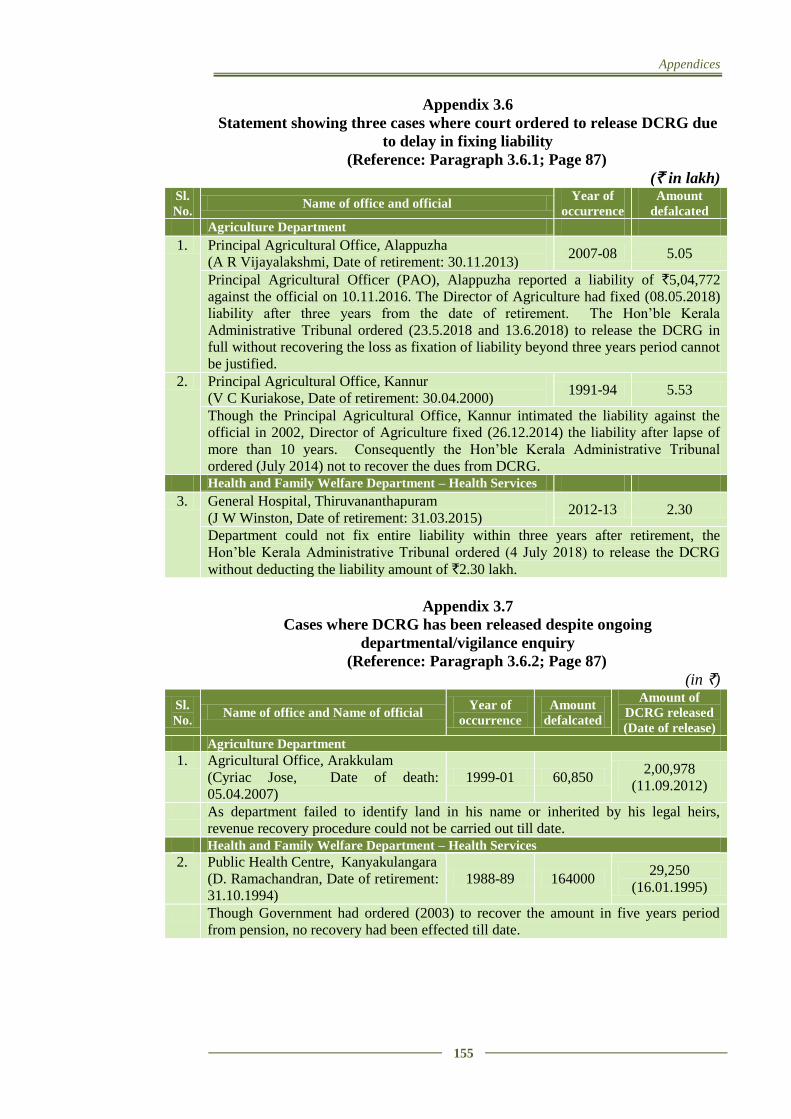
Appendices
155
Appendix 3.6
Statement showing three cases where court ordered to release DCRG due
to delay in fixing liability
(Reference: Paragraph 3.6.1; Page 87)
(` in lakh) Sl.
No. Name of office and official
Year of
occurrence
Amount
defalcated
Agriculture Department
1. Principal Agricultural Office, Alappuzha
(A R Vijayalakshmi, Date of retirement: 30.11.2013) 2007-08 5.05
Principal Agricultural Officer (PAO), Alappuzha reported a liability of `5,04,772
against the official on 10.11.2016. The Director of Agriculture had fixed (08.05.2018)
liability after three years from the date of retirement. The Hon’ble Kerala
Administrative Tribunal ordered (23.5.2018 and 13.6.2018) to release the DCRG in
full without recovering the loss as fixation of liability beyond three years period cannot
be justified.
2. Principal Agricultural Office, Kannur
(V C Kuriakose, Date of retirement: 30.04.2000) 1991-94 5.53
Though the Principal Agricultural Office, Kannur intimated the liability against the
official in 2002, Director of Agriculture fixed (26.12.2014) the liability after lapse of
more than 10 years. Consequently the Hon’ble Kerala Administrative Tribunal
ordered (July 2014) not to recover the dues from DCRG.
Health and Family Welfare Department – Health Services
3. General Hospital, Thiruvananthapuram
(J W Winston, Date of retirement: 31.03.2015) 2012-13 2.30
Department could not fix entire liability within three years after retirement, the
Hon’ble Kerala Administrative Tribunal ordered (4 July 2018) to release the DCRG
without deducting the liability amount of `2.30 lakh.
Appendix 3.7
Cases where DCRG has been released despite ongoing
departmental/vigilance enquiry
(Reference: Paragraph 3.6.2; Page 87)
(in `)
Sl.
No. Name of office and Name of official
Year of
occurrence
Amount
defalcated
Amount of
DCRG released
(Date of release)
Agriculture Department
1. Agricultural Office, Arakkulam
(Cyriac Jose, Date of death:
05.04.2007)
1999-01 60,850 2,00,978
(11.09.2012)
As department failed to identify land in his name or inherited by his legal heirs,
revenue recovery procedure could not be carried out till date. Health and Family Welfare Department – Health Services
2. Public Health Centre, Kanyakulangara
(D. Ramachandran, Date of retirement:
31.10.1994)
1988-89 164000 29,250
(16.01.1995)
Though Government had ordered (2003) to recover the amount in five years period
from pension, no recovery had been effected till date.
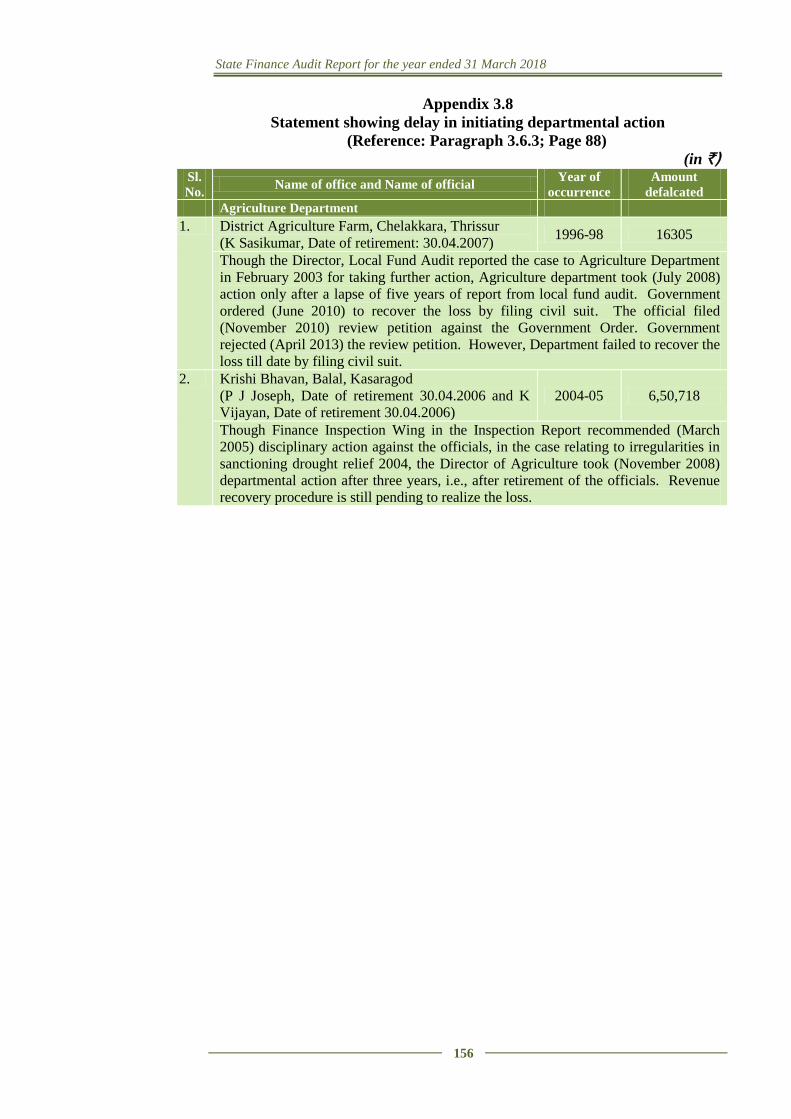
State Finance Audit Report for the year ended 31 March 2018
156
Appendix 3.8
Statement showing delay in initiating departmental action
(Reference: Paragraph 3.6.3; Page 88)
(in `) Sl.
No. Name of office and Name of official
Year of
occurrence
Amount
defalcated
Agriculture Department
1. District Agriculture Farm, Chelakkara, Thrissur
(K Sasikumar, Date of retirement: 30.04.2007) 1996-98 16305
Though the Director, Local Fund Audit reported the case to Agriculture Department
in February 2003 for taking further action, Agriculture department took (July 2008)
action only after a lapse of five years of report from local fund audit. Government
ordered (June 2010) to recover the loss by filing civil suit. The official filed
(November 2010) review petition against the Government Order. Government
rejected (April 2013) the review petition. However, Department failed to recover the
loss till date by filing civil suit.
2. Krishi Bhavan, Balal, Kasaragod
(P J Joseph, Date of retirement 30.04.2006 and K
Vijayan, Date of retirement 30.04.2006)
2004-05 6,50,718
Though Finance Inspection Wing in the Inspection Report recommended (March
2005) disciplinary action against the officials, in the case relating to irregularities in
sanctioning drought relief 2004, the Director of Agriculture took (November 2008)
departmental action after three years, i.e., after retirement of the officials. Revenue
recovery procedure is still pending to realize the loss.
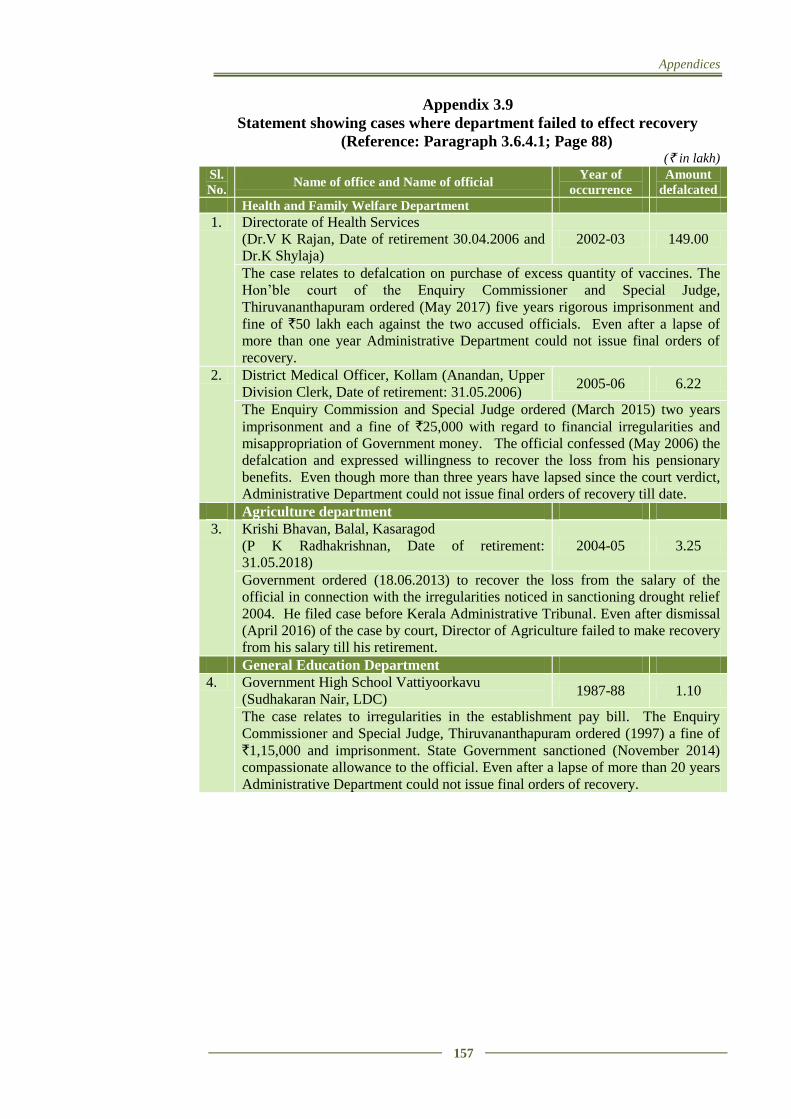
Appendices
157
Appendix 3.9
Statement showing cases where department failed to effect recovery
(Reference: Paragraph 3.6.4.1; Page 88) (` in lakh)
Sl.
No. Name of office and Name of official
Year of
occurrence
Amount
defalcated
Health and Family Welfare Department
1. Directorate of Health Services
(Dr.V K Rajan, Date of retirement 30.04.2006 and
Dr.K Shylaja)
2002-03 149.00
The case relates to defalcation on purchase of excess quantity of vaccines. The
Hon’ble court of the Enquiry Commissioner and Special Judge,
Thiruvananthapuram ordered (May 2017) five years rigorous imprisonment and
fine of `50 lakh each against the two accused officials. Even after a lapse of
more than one year Administrative Department could not issue final orders of
recovery.
2. District Medical Officer, Kollam (Anandan, Upper
Division Clerk, Date of retirement: 31.05.2006) 2005-06 6.22
The Enquiry Commission and Special Judge ordered (March 2015) two years
imprisonment and a fine of `25,000 with regard to financial irregularities and
misappropriation of Government money. The official confessed (May 2006) the
defalcation and expressed willingness to recover the loss from his pensionary
benefits. Even though more than three years have lapsed since the court verdict,
Administrative Department could not issue final orders of recovery till date.
Agriculture department
3. Krishi Bhavan, Balal, Kasaragod
(P K Radhakrishnan, Date of retirement:
31.05.2018)
2004-05 3.25
Government ordered (18.06.2013) to recover the loss from the salary of the
official in connection with the irregularities noticed in sanctioning drought relief
2004. He filed case before Kerala Administrative Tribunal. Even after dismissal
(April 2016) of the case by court, Director of Agriculture failed to make recovery
from his salary till his retirement.
General Education Department
4. Government High School Vattiyoorkavu
(Sudhakaran Nair, LDC) 1987-88 1.10
The case relates to irregularities in the establishment pay bill. The Enquiry
Commissioner and Special Judge, Thiruvananthapuram ordered (1997) a fine of
`1,15,000 and imprisonment. State Government sanctioned (November 2014)
compassionate allowance to the official. Even after a lapse of more than 20 years
Administrative Department could not issue final orders of recovery.
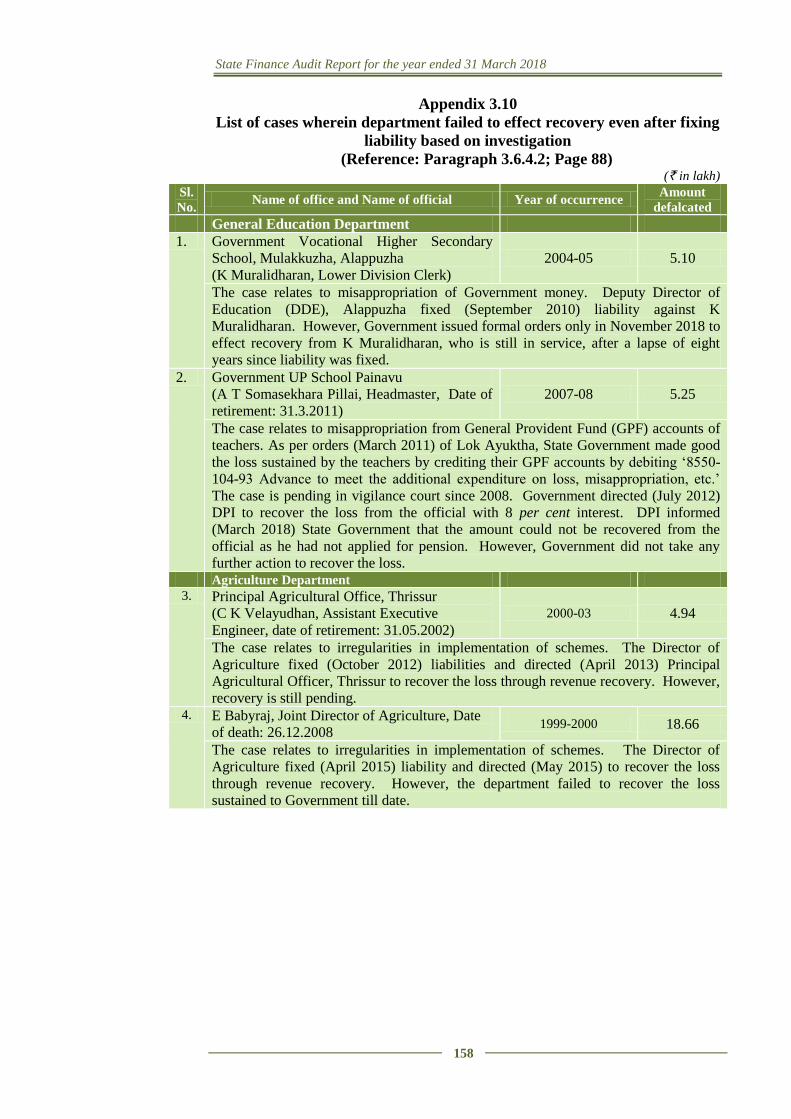
State Finance Audit Report for the year ended 31 March 2018
158
Appendix 3.10
List of cases wherein department failed to effect recovery even after fixing
liability based on investigation
(Reference: Paragraph 3.6.4.2; Page 88) (` in lakh)
Sl.
No. Name of office and Name of official Year of occurrence
Amount
defalcated
General Education Department
1. Government Vocational Higher Secondary
School, Mulakkuzha, Alappuzha
(K Muralidharan, Lower Division Clerk)
2004-05 5.10
The case relates to misappropriation of Government money. Deputy Director of
Education (DDE), Alappuzha fixed (September 2010) liability against K
Muralidharan. However, Government issued formal orders only in November 2018 to
effect recovery from K Muralidharan, who is still in service, after a lapse of eight
years since liability was fixed.
2. Government UP School Painavu
(A T Somasekhara Pillai, Headmaster, Date of
retirement: 31.3.2011)
2007-08 5.25
The case relates to misappropriation from General Provident Fund (GPF) accounts of
teachers. As per orders (March 2011) of Lok Ayuktha, State Government made good
the loss sustained by the teachers by crediting their GPF accounts by debiting ‘8550-
104-93 Advance to meet the additional expenditure on loss, misappropriation, etc.’
The case is pending in vigilance court since 2008. Government directed (July 2012)
DPI to recover the loss from the official with 8 per cent interest. DPI informed
(March 2018) State Government that the amount could not be recovered from the
official as he had not applied for pension. However, Government did not take any
further action to recover the loss. Agriculture Department
3. Principal Agricultural Office, Thrissur
(C K Velayudhan, Assistant Executive
Engineer, date of retirement: 31.05.2002)
2000-03 4.94
The case relates to irregularities in implementation of schemes. The Director of
Agriculture fixed (October 2012) liabilities and directed (April 2013) Principal
Agricultural Officer, Thrissur to recover the loss through revenue recovery. However,
recovery is still pending. 4. E Babyraj, Joint Director of Agriculture, Date
of death: 26.12.2008 1999-2000 18.66
The case relates to irregularities in implementation of schemes. The Director of
Agriculture fixed (April 2015) liability and directed (May 2015) to recover the loss
through revenue recovery. However, the department failed to recover the loss
sustained to Government till date.
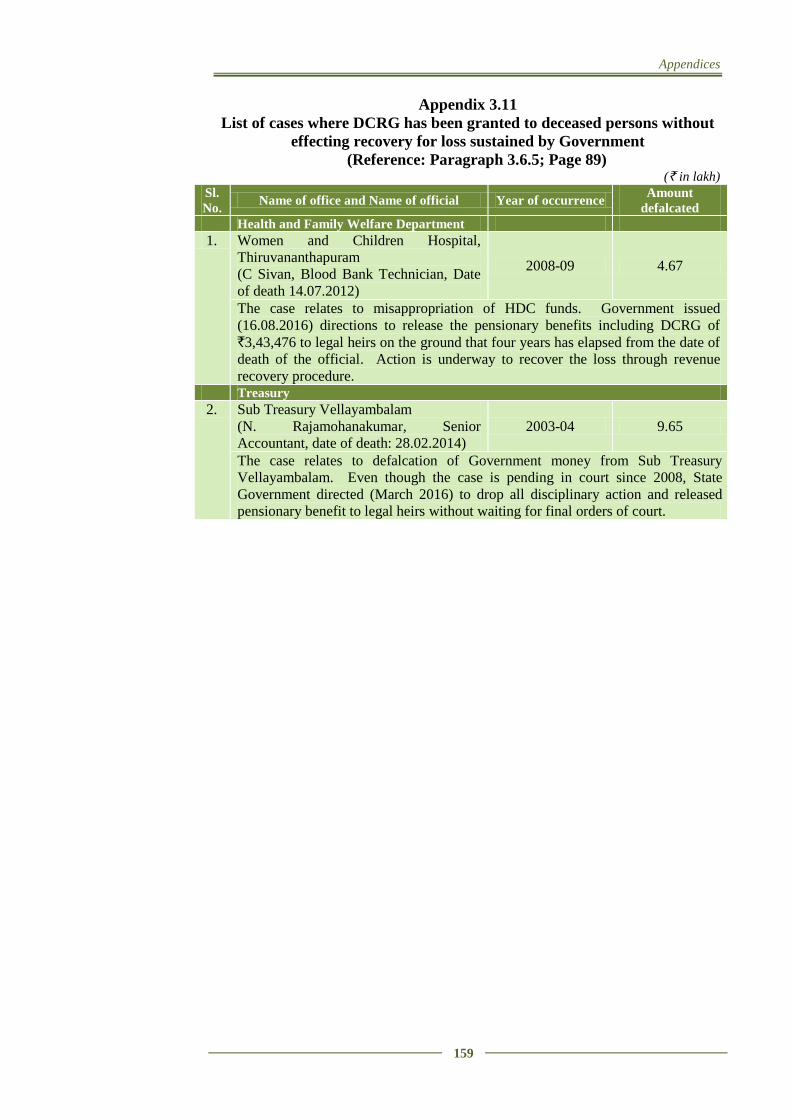
Appendices
159
Appendix 3.11
List of cases where DCRG has been granted to deceased persons without
effecting recovery for loss sustained by Government
(Reference: Paragraph 3.6.5; Page 89) (` in lakh)
Sl.
No. Name of office and Name of official Year of occurrence
Amount
defalcated
Health and Family Welfare Department
1. Women and Children Hospital,
Thiruvananthapuram
(C Sivan, Blood Bank Technician, Date
of death 14.07.2012)
2008-09 4.67
The case relates to misappropriation of HDC funds. Government issued
(16.08.2016) directions to release the pensionary benefits including DCRG of
`3,43,476 to legal heirs on the ground that four years has elapsed from the date of
death of the official. Action is underway to recover the loss through revenue
recovery procedure. Treasury
2. Sub Treasury Vellayambalam
(N. Rajamohanakumar, Senior
Accountant, date of death: 28.02.2014)
2003-04 9.65
The case relates to defalcation of Government money from Sub Treasury
Vellayambalam. Even though the case is pending in court since 2008, State
Government directed (March 2016) to drop all disciplinary action and released
pensionary benefit to legal heirs without waiting for final orders of court.
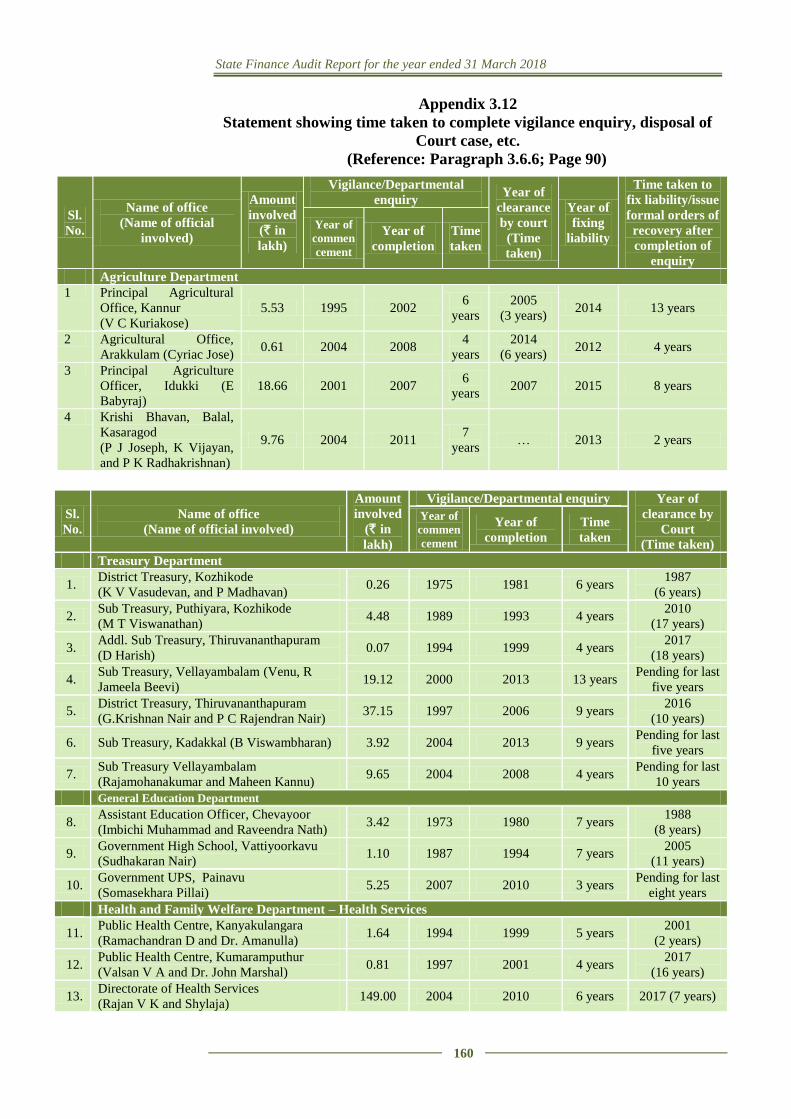
State Finance Audit Report for the year ended 31 March 2018
160
Appendix 3.12
Statement showing time taken to complete vigilance enquiry, disposal of
Court case, etc.
(Reference: Paragraph 3.6.6; Page 90)
Sl.
No.
Name of office
(Name of official
involved)
Amount
involved
(` in
lakh)
Vigilance/Departmental
enquiry Year of
clearance
by court
(Time
taken)
Year of
fixing
liability
Time taken to
fix liability/issue
formal orders of
recovery after
completion of
enquiry
Year of
commen
cement
Year of
completion
Time
taken
Agriculture Department
1 Principal Agricultural
Office, Kannur
(V C Kuriakose)
5.53 1995 2002 6
years
2005
(3 years) 2014 13 years
2 Agricultural Office,
Arakkulam (Cyriac Jose) 0.61 2004 2008
4
years
2014
(6 years) 2012 4 years
3 Principal Agriculture
Officer, Idukki (E
Babyraj)
18.66 2001 2007 6
years 2007 2015 8 years
4 Krishi Bhavan, Balal,
Kasaragod
(P J Joseph, K Vijayan,
and P K Radhakrishnan)
9.76 2004 2011 7
years … 2013 2 years
Sl.
No.
Name of office
(Name of official involved)
Amount
involved
(` in
lakh)
Vigilance/Departmental enquiry Year of
clearance by
Court
(Time taken)
Year of
commen
cement
Year of
completion
Time
taken
Treasury Department
1. District Treasury, Kozhikode
(K V Vasudevan, and P Madhavan) 0.26 1975 1981 6 years
1987
(6 years)
2. Sub Treasury, Puthiyara, Kozhikode
(M T Viswanathan) 4.48 1989 1993 4 years
2010
(17 years)
3. Addl. Sub Treasury, Thiruvananthapuram
(D Harish) 0.07 1994 1999 4 years
2017
(18 years)
4. Sub Treasury, Vellayambalam (Venu, R
Jameela Beevi) 19.12 2000 2013 13 years
Pending for last
five years
5. District Treasury, Thiruvananthapuram
(G.Krishnan Nair and P C Rajendran Nair) 37.15 1997 2006 9 years
2016
(10 years)
6. Sub Treasury, Kadakkal (B Viswambharan) 3.92 2004 2013 9 years Pending for last
five years
7. Sub Treasury Vellayambalam
(Rajamohanakumar and Maheen Kannu) 9.65 2004 2008 4 years
Pending for last
10 years
General Education Department
8. Assistant Education Officer, Chevayoor
(Imbichi Muhammad and Raveendra Nath) 3.42 1973 1980 7 years
1988
(8 years)
9. Government High School, Vattiyoorkavu
(Sudhakaran Nair) 1.10 1987 1994 7 years
2005
(11 years)
10. Government UPS, Painavu
(Somasekhara Pillai) 5.25 2007 2010 3 years
Pending for last
eight years
Health and Family Welfare Department – Health Services
11. Public Health Centre, Kanyakulangara
(Ramachandran D and Dr. Amanulla) 1.64 1994 1999 5 years
2001
(2 years)
12. Public Health Centre, Kumaramputhur
(Valsan V A and Dr. John Marshal) 0.81 1997 2001 4 years
2017
(16 years)
13. Directorate of Health Services
(Rajan V K and Shylaja) 149.00 2004 2010 6 years 2017 (7 years)
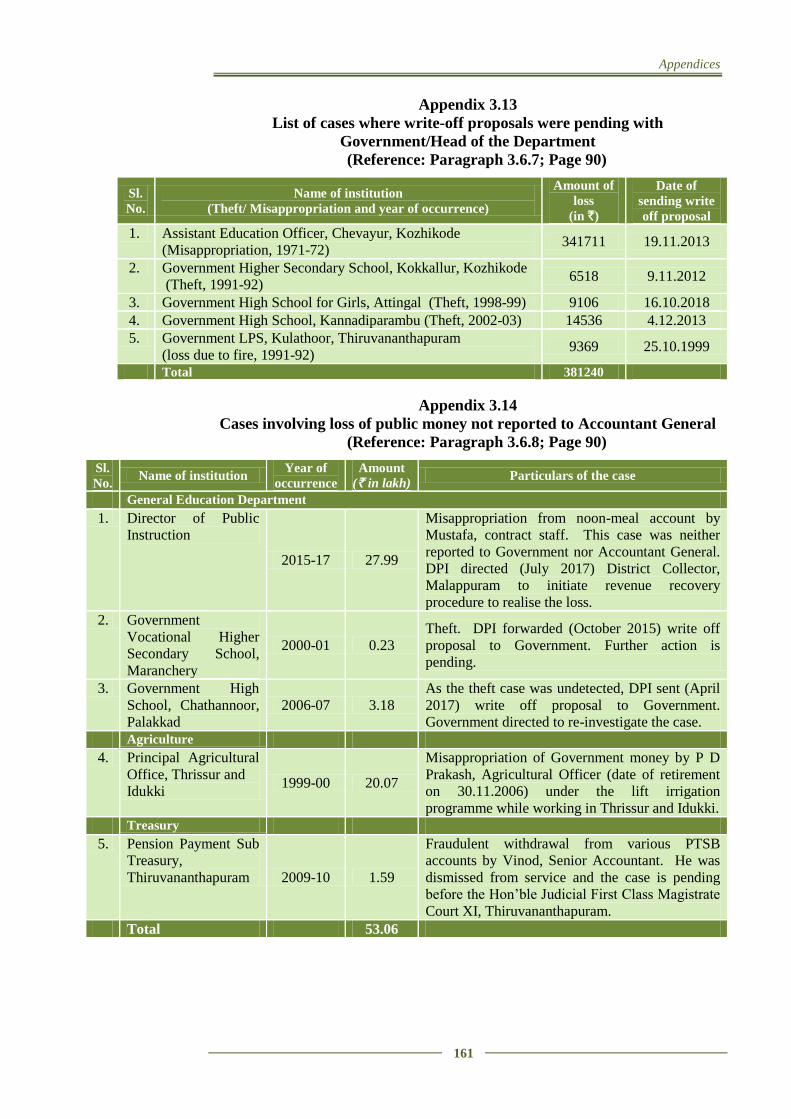
Appendices
161
Appendix 3.13
List of cases where write-off proposals were pending with
Government/Head of the Department
(Reference: Paragraph 3.6.7; Page 90)
Sl.
No.
Name of institution
(Theft/ Misappropriation and year of occurrence)
Amount of
loss
(in `)
Date of
sending write
off proposal
1. Assistant Education Officer, Chevayur, Kozhikode
(Misappropriation, 1971-72) 341711 19.11.2013
2. Government Higher Secondary School, Kokkallur, Kozhikode
(Theft, 1991-92) 6518 9.11.2012
3. Government High School for Girls, Attingal (Theft, 1998-99) 9106 16.10.2018
4. Government High School, Kannadiparambu (Theft, 2002-03) 14536 4.12.2013
5. Government LPS, Kulathoor, Thiruvananthapuram
(loss due to fire, 1991-92) 9369 25.10.1999
Total 381240
Appendix 3.14
Cases involving loss of public money not reported to Accountant General
(Reference: Paragraph 3.6.8; Page 90)
Sl.
No. Name of institution
Year of
occurrence
Amount
(` in lakh) Particulars of the case
General Education Department
1. Director of Public
Instruction
2015-17 27.99
Misappropriation from noon-meal account by
Mustafa, contract staff. This case was neither
reported to Government nor Accountant General.
DPI directed (July 2017) District Collector,
Malappuram to initiate revenue recovery
procedure to realise the loss.
2. Government
Vocational Higher
Secondary School,
Maranchery
2000-01 0.23
Theft. DPI forwarded (October 2015) write off
proposal to Government. Further action is
pending.
3. Government High
School, Chathannoor,
Palakkad
2006-07 3.18
As the theft case was undetected, DPI sent (April
2017) write off proposal to Government.
Government directed to re-investigate the case.
Agriculture
4. Principal Agricultural
Office, Thrissur and
Idukki 1999-00 20.07
Misappropriation of Government money by P D
Prakash, Agricultural Officer (date of retirement
on 30.11.2006) under the lift irrigation
programme while working in Thrissur and Idukki.
Treasury
5. Pension Payment Sub
Treasury,
Thiruvananthapuram 2009-10 1.59
Fraudulent withdrawal from various PTSB
accounts by Vinod, Senior Accountant. He was
dismissed from service and the case is pending
before the Hon’ble Judicial First Class Magistrate
Court XI, Thiruvananthapuram.
Total 53.06
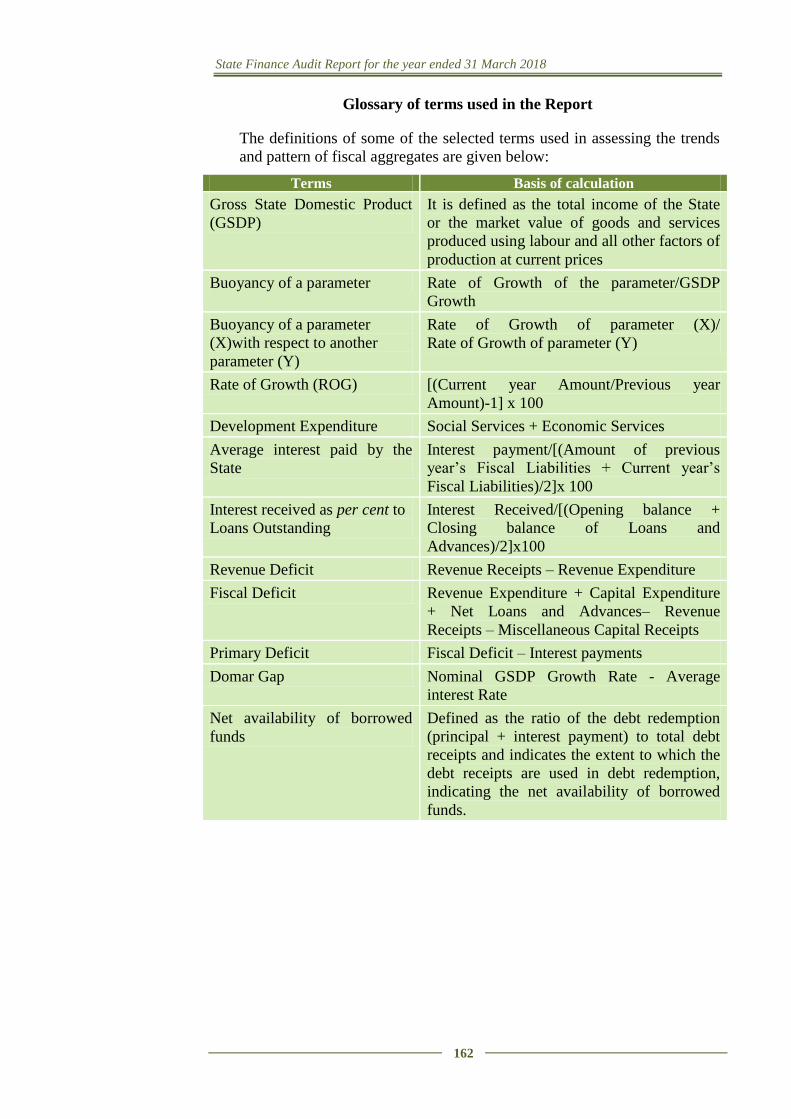
State Finance Audit Report for the year ended 31 March 2018
162
Glossary of terms used in the Report
The definitions of some of the selected terms used in assessing the trends
and pattern of fiscal aggregates are given below:
Terms Basis of calculation
Gross State Domestic Product
(GSDP)
It is defined as the total income of the State
or the market value of goods and services
produced using labour and all other factors of
production at current prices
Buoyancy of a parameter Rate of Growth of the parameter/GSDP
Growth
Buoyancy of a parameter
(X)with respect to another
parameter (Y)
Rate of Growth of parameter (X)/
Rate of Growth of parameter (Y)
Rate of Growth (ROG) [(Current year Amount/Previous year
Amount)-1] x 100
Development Expenditure Social Services + Economic Services
Average interest paid by the
State
Interest payment/[(Amount of previous
year’s Fiscal Liabilities + Current year’s
Fiscal Liabilities)/2]x 100
Interest received as per cent to
Loans Outstanding
Interest Received/[(Opening balance +
Closing balance of Loans and
Advances)/2]x100
Revenue Deficit Revenue Receipts – Revenue Expenditure
Fiscal Deficit Revenue Expenditure + Capital Expenditure
+ Net Loans and Advances– Revenue
Receipts – Miscellaneous Capital Receipts
Primary Deficit Fiscal Deficit – Interest payments
Domar Gap Nominal GSDP Growth Rate - Average
interest Rate
Net availability of borrowed
funds
Defined as the ratio of the debt redemption
(principal + interest payment) to total debt
receipts and indicates the extent to which the
debt receipts are used in debt redemption,
indicating the net availability of borrowed
funds.