Embed Size (px)
Citation preview

84 (2007) 13–29www.elsevier.com/locate/atmos
Atmospheric Research
Statistical analysis of cyclone hazard for Guadeloupe, Lesser Antilles
Narcisse Zahibo a,⁎, Efim Pelinovsky b,c, Tatiana Talipova b, Alexander Rabinovich d,Andrey Kurkin c, Irina Nikolkina c
a Département de Physique, Université des Antilles et de la Guyane, Pointe-à-Pitre, Franceb Department of Nonlinear Processes in Geophysics, Institute of Applied Physics, Nizhny Novgorod, Russia
c Applied Mathematics Department, State Technical University, Nizhny Novgorod, Russiad Institute of Oceanology, Moscow, Russia
Received 30 January 2005; received in revised form 31 December 2005; accepted 30 March 2006
Abstract
The statistical analysis of the tropical cyclone activity for Guadeloupe (Lesser Antilles, Caribbean Sea) is given. In total, 162events are selected for period 1635–2000. The number of cyclones in different periods has a large variability. In average, the timeinterval about 100 years can be considered as stationary one to have the reliability assessment of cyclone hazard. The distributionfunctions and cumulative frequencies of the cyclones depending on the atmospheric pressure drop and wind speed are calculated.They are used to determine the return period for cyclones with given characteristics (category, atmospheric pressure, and windspeed). The data of the storm-induced surges in the coastal locations of Guadeloupe is collected. It is shown that the surge heightincreases with increase of the wind speed, but observed data have great dispersion. Numerical simulation of the long water wavesinduced by the hurricane “Lili” in 2002 is performed; surge heights in Guadeloupe exceed 10 cm.© 2006 Elsevier B.V. All rights reserved.
Keywords: Cyclones; Hazards; Storm surges; Statistics; Numerical modelling; Lesser Antilles
1. Introduction
Tropical cyclones are formed over the warm watersof the tropical oceans, mainly in the belt between 20° Nand 20° S. In comparison with extra-tropical (con-tinental) cyclones, tropical cyclones are characterized bymuch smaller size and much higher intensity, i.e. bymuch higher atmospheric pressure gradients andrespective wind speeds (Murty, 1984). Tropical
⁎ Corresponding author. Tel.: +7 590 93 86 77; fax: +7 590 590 9386 75.
E-mail addresses: [email protected] (N. Zahibo),[email protected] (E. Pelinovsky), [email protected](A. Rabinovich), [email protected] (A. Kurkin).
0169-8095/$ - see front matter © 2006 Elsevier B.V. All rights reserved.doi:10.1016/j.atmosres.2006.03.008
cyclones which sustain maximum wind speeds greaterthan 33 m/s are known as typhoons in the Pacific Oceanand as hurricanes in the Atlantic Ocean. Severehurricanes have maximum wind speeds more than100 m/s. In an average hurricane, the release of latentheat from the condensation of water vapor provides asmuch energy as the detonation of 400 20-megatonhydrogen bombs (Davis, 1993). The cyclones induce thestorm surges and the evaluation of storm surge hazardfor Canada and Bangladesh is actively discussed(Sharma and Murty, 1988; Danard et al., 2003; Rao etal., 2004).
Neumann and Hill (1976) and Neumann et al. (1978)gave detailed tracks and statistics of the tropicalcyclones of the North Atlantic Ocean for the period

14 N. Zahibo et al. / Atmospheric Research 84 (2007) 13–29
1871–1977. During this 107-year period, at least 850tropical cyclones occurred in this region, mainly in theperiod from June to November (maximum number ofthese cyclones is related to the end of August–beginningof September). Each year on average, 10 tropical storms(on which 6 become hurricanes) develop over theAtlantic Ocean, Caribbean Sea, or Gulf of Mexico.Many of these remain in the ocean. The deadliestAtlantic tropical cyclones during 1492–1996 aredescribed by Rappaport and Fernandez-Partagas(1997). Various data of tropical storms and hurricanesin the Atlantic can be found in sites (NTC; UNISYS;Hurricanecity) and in papers (Gray and Landsea, 1992;Gray et al., 1993; Gray et al., 1992; Landsea et al.,1992). Recently, Goldenberg et al. (2001) studied themajor North Atlantic hurricanes for high and lowactivity periods, and found the average numbers ofmajor hurricane per year 2.7, 1.5 and 3.8 for the 1944–1970, 1971–1994, 1995–2000 respectively.
Recently Pielke et al. (2003) discussed the hurricanevulnerability in Latin America and the Caribbean aftercatastrophic Hurricane Mitch killed more than 10,000people and caused as much as $8.5 billion in damage inHonduras and Nicaragua. The fatalities and destructioncaused by Hurricane Mitch were the greatest in at leastseveral decades. The Caribbean Sea basin has a greathistory of natural disasters; for instance, the GreatHurricane in October 1780 killed about 22,000 people inthe Lesser Antilles (Martinique, Barbados). Authors
Fig. 1. Chart of the Guad
analyze the regional climatology of hurricanes in theCaribbean Sea and point out that hurricane frequency isnot constant: in 1968–1991 it was less than in theprevious period 1944–1967. Webster et al. (2005)examined the characteristics of tropical cyclones overthe past 35 years and concluded that a large increase wasseen in the number of hurricanes reaching categories 4and 5 which has not been accompanied by an increase inthe actual intensity of the most intense hurricanes: themaximum intensity remained remarkably static over thepast 35 years; and claimed that the smallest percentageincrease occurred in the North Atlantic Ocean.
The French West India situated in the Lesser Antilleshas a huge experience with tropical cyclones. Tropicalcyclones are a very important part of natural disastersand influence all components of life in the French WestIndies (Yacou, 1999; Martin, 2002). Saffache et al.(2002, 2003) collected the descriptions of cycloneactivity in Martinique and Guadeloupe. In particular,about 160 events occurred in Martinique and Guade-loupe during 1635–1999, and therefore, the mean returnperiod for the cyclones in the French West India is 3–4 years. The very catastrophic cyclone of September 6,1776 (its category is highest, 5 according to the Saffir–Simpson scale (Simpson, 1974)) killed more than 6000people in Pointe-á-Pitre Bay (Guadeloupe). In Septem-ber 17, 1989 the Hugo Hurricane slammed Guadeloupe(the wind speed reached 60 m/s), killing 5, injuring 80and leaving 11,000 homeless (Duteil, 1999).
eloupe Department.

15N. Zahibo et al. / Atmospheric Research 84 (2007) 13–29
The main goal of this paper is to give a quantitativeanalysis of the tropical cyclone activity for GuadeloupeDepartment included islands: Guadeloupe, Marie-Galante, La Desirade, Les Saintes, St Martin and StBarthelemy (Fig. 1). The paper is organized as follows.Data of cyclone observations in Guadeloupe andcorresponding literature sources for data are discussedin Section 2. The analysis of the variability of thecyclone activity over time is given in Section 3. Inaverage, the time interval of about 100 years can beconsidered as a stationary one to have the reliabilityassessment of cyclone characteristics. The distributionfunctions and cumulative frequencies of the cyclonesdepending on the atmospheric pressure drop and windspeed are studied in Section 4. The data of the storm-induced surges in the coastal locations of Guadeloupeare given in Section 5. It is shown that the surge heightincreases with increase of the wind speed. Numericalsimulation of water waves induced by the hurricane“Lili” in 2002 is performed in the framework of theshallow water theory. The surge heights in Guadeloupeexceed 10 cm. Obtained results are summarized inconclusion.
2. Data
Recently published book by Saffache et al. (2003)collects the various descriptions of the cyclones onGuadeloupe Department for period 1635–2000 (totalnumber of cyclones is 76). Quantitative information ofthe cyclones tracks, wind speed, atmospheric pressure inGuadeloupe for the period 1851–2002 can be extractedfrom site (UNISYS) based on the data of the TropicalPrediction Center, NOAA. Also, some data of deadliest
Table 1Data of catastrophic cyclones (categories 4 and 5) on the Guadeloupe for 16
No. Date (yr, day/m) Name Place
1 1642 Guadeloupe2 1642 Guadeloupe3 1666, 23–24/10 Guadeloupe, Les Saintes4 1880, 04–14/08 Hurricane #2 Guadeloupe5 1900, 27/08–15/09 Hurricane #1 Guadeloupe, St Martin6 1906, 23/09 Hurricane #3 Guadeloupe7 1928, 12/09 Hurricane #4 Guadeloupe8 1960, 29/08–14/09 Hurricane Donna Les Antilles9 1964, 20/08–05/09 Hurricane Cleo Guadeloupe Marie-Galante,10 1966,21/09–11/10 Hurricane Inez Guadeloupe11 1979, 29/08 Hurricane David Guadeloupe Desirade12 1989, 13/09 Hurricane Hugo Guadeloupe, St Martin, Des13 1998, 20–21/09 Hurricane Georges Guadeloupe, St Martin14 1999, 17/11 Hurricane Lenny Guadeloupe, St Martin, St B
References: [1]—UNISYS, [2] — Saffache et al., 2003, [3] — Rappaport a
cyclones in Guadeloupe (for instance for 1656, 1666and 1821) can be found for example in Rappaport andFernandez-Partagas (1997). Rough estimates of thereturn period have been done in (Hurricanecity); inparticular, cyclones affect Guadeloupe each 3.4 years,and St Martin — 2.8 years; hurricane hits Guadeloupeeach 14.8 years and St Martin — 8.3 year.
The quantitative information of cyclones in theGuadeloupe Department contained in (UNISYS; Saf-fache et al., 2003; Rappaport and Fernandez-Partagas,1997) for the period 1635–2000 (totally 162 events) issummarized, and Table 1 gives the information ofcyclones with category exceeded 4. The cyclonecategory is determined according to the Saffir–Simpsonscale (Simpson, 1974). The number of cyclonescontained in these literature sources is shown in Fig.2. These characteristics of the cyclones in the Guade-loupe Department will be used for the statistical analysisof the cyclone activity in Guadeloupe.
Of course, some uncertainty in the tropic cyclonescharacteristics determination occur in the used datasets,this could probably influence on the statistical analysis.Recently, a good documentation of the inherentpotential for possible errors was published in (Buckleyet al., 2003) for the Australian Basin, the same approachis important for the Caribbean basin. But we believe thatmain statistical conclusions given below are not“sensitive” for possible errors in tropical cycloneparameters due to large amount of data. In fact, as it isshown further, the statistical characteristics are the samefor 100-yr and 150-yr datasets.
Geographically, the Guadeloupe Department con-tains the two groups of the nearest islands; the one groupcontains Guadeloupe, Marie-Galante, La Desirade and
35–2000
Category Wind m/s Pressure, kPa Reference
4 [2,p.29]4 [2,p.29]4 [2,p.34]4 93 [1]4 23 96 [1]4 [1],[2,p.55]4 33 94 [1],[2,p.72],[3]4 21 [1],[2,p.76]
Les Saintes 4 59 96 [1],[2,p.80],[3]4 15 96 [1],[2,p.89]5 75 92 [1],[2,p.98]
irade 4 21 94 [1],[2,p.124],[3]5 42 97 [1]
arthelemy 4 39 97 [1],[2,p.232]
nd Fernandez-Partagas, 1997.

Fig. 2. Number of cyclones presented in various literature sources (R and F–P is Rappaport and Fernandez-Partagas).
16 N. Zahibo et al. / Atmospheric Research 84 (2007) 13–29
Les Saintes, and the second one — St Martin and StBarthelemy; the distance between these groups is about180 km (Fig. 1). The distribution of the recordedcyclones for 1635–2000 in Guadeloupe is presented inFig. 3. Cyclones were recorded mainly on Guadeloupe(59%), and on St Martin (26%), and significantly less onMarie-Galante (4%), La Desirade (3%), Les Saintes(3%), and St Barthelemy (4%). The largely differentdistributions observed in the six different islands of thestudy area is connected with the relative space scales ofthe cyclones and the islands, also the different distribu-tions occurred due to a density population bias; it is apossible subject of further study.
Fig. 3. Geographic distribution of cyclon
3. Analysis of the tropical cyclone occurrence forGuadeloupe
According to the data discussed in the Section 2 andparticularly presented in Table 1 the mean value of thefrequency of the cyclone appearance for Guadeloupe is0.44 1/yr. It corresponds to the return period 2.25 yearsconfirming high frequency of the tropical cyclones.
Pielke et al. (2003) analyzed the cyclone activity forthe whole Caribbean for the period 1944–1999 anddemonstrated the annual and decade variability of thenumber of cyclones; see also Landsea (1993); Landseaet al. (1996); Gray et al. (1997). They concluded that the
es in the Guadeloupe Department.
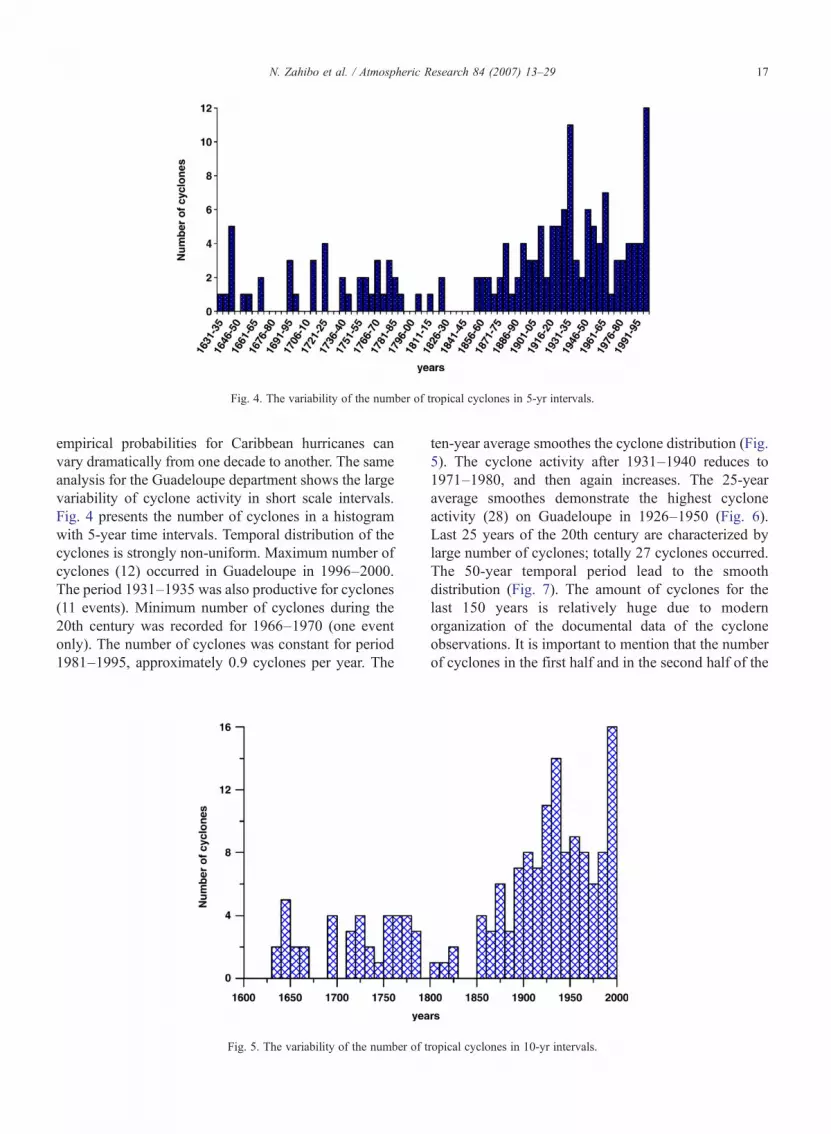
Fig. 4. The variability of the number of tropical cyclones in 5-yr intervals.
17N. Zahibo et al. / Atmospheric Research 84 (2007) 13–29
empirical probabilities for Caribbean hurricanes canvary dramatically from one decade to another. The sameanalysis for the Guadeloupe department shows the largevariability of cyclone activity in short scale intervals.Fig. 4 presents the number of cyclones in a histogramwith 5-year time intervals. Temporal distribution of thecyclones is strongly non-uniform. Maximum number ofcyclones (12) occurred in Guadeloupe in 1996–2000.The period 1931–1935 was also productive for cyclones(11 events). Minimum number of cyclones during the20th century was recorded for 1966–1970 (one eventonly). The number of cyclones was constant for period1981–1995, approximately 0.9 cyclones per year. The
Fig. 5. The variability of the number of t
ten-year average smoothes the cyclone distribution (Fig.5). The cyclone activity after 1931–1940 reduces to1971–1980, and then again increases. The 25-yearaverage smoothes demonstrate the highest cycloneactivity (28) on Guadeloupe in 1926–1950 (Fig. 6).Last 25 years of the 20th century are characterized bylarge number of cyclones; totally 27 cyclones occurred.The 50-year temporal period lead to the smoothdistribution (Fig. 7). The amount of cyclones for thelast 150 years is relatively huge due to modernorganization of the documental data of the cycloneobservations. It is important to mention that the numberof cyclones in the first half and in the second half of the
ropical cyclones in 10-yr intervals.
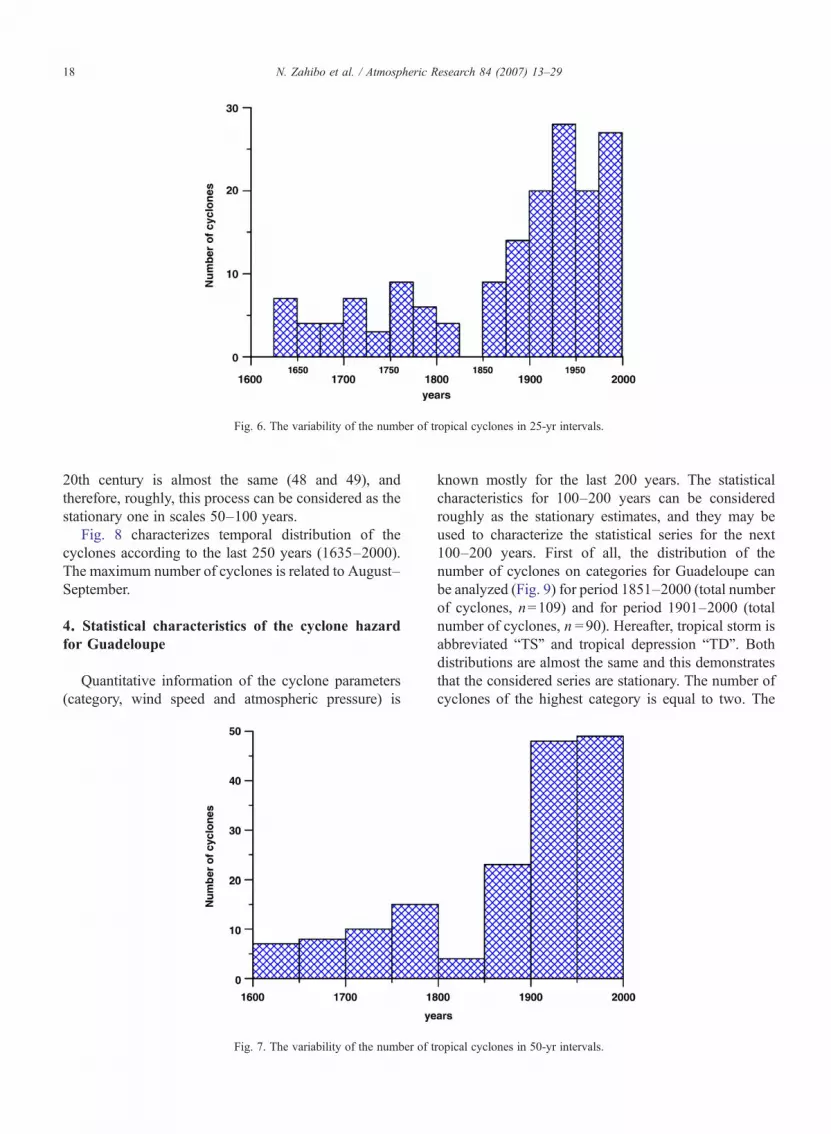
Fig. 6. The variability of the number of tropical cyclones in 25-yr intervals.
18 N. Zahibo et al. / Atmospheric Research 84 (2007) 13–29
20th century is almost the same (48 and 49), andtherefore, roughly, this process can be considered as thestationary one in scales 50–100 years.
Fig. 8 characterizes temporal distribution of thecyclones according to the last 250 years (1635–2000).The maximum number of cyclones is related to August–September.
4. Statistical characteristics of the cyclone hazardfor Guadeloupe
Quantitative information of the cyclone parameters(category, wind speed and atmospheric pressure) is
Fig. 7. The variability of the number of t
known mostly for the last 200 years. The statisticalcharacteristics for 100–200 years can be consideredroughly as the stationary estimates, and they may beused to characterize the statistical series for the next100–200 years. First of all, the distribution of thenumber of cyclones on categories for Guadeloupe canbe analyzed (Fig. 9) for period 1851–2000 (total numberof cyclones, n=109) and for period 1901–2000 (totalnumber of cyclones, n=90). Hereafter, tropical storm isabbreviated “TS” and tropical depression “TD”. Bothdistributions are almost the same and this demonstratesthat the considered series are stationary. The number ofcyclones of the highest category is equal to two. The
ropical cyclones in 50-yr intervals.

Fig. 8. The variability of the number of tropical cyclones for months in 250 years.
19N. Zahibo et al. / Atmospheric Research 84 (2007) 13–29
number of tropical depressions is also relatively small,and it is related with weak identification of the weakcyclones. As expected, the number of cyclonesdecreases with increase of category, but this dependenceis not monotonic. For instance, the number of Category3 hurricanes is less than the number Category 4hurricanes. Possible explanations of this phenomenoninclude a shift in operation practices depressions orchanges in observed technology that changed whethersome disturbances were classified as depressions or not.
Fig. 9. The distribution of c
Furthermore, Landsea (1993) documented a “high bias”in intensity classification from the 1940s to the 1960s ofapproximately 2.5 m/s. As it is mentioned in the Section2, we believe that a large amount of data leads to the factthat the main statistical conclusions are not “sensitive”for possible errors in tropical cyclone parameters.
The exceedance characteristics are used for applica-tions. Fig. 10 shows the cumulative frequency of thecyclones exceeded the given category. And here theestimates based on 100 and 150-year intervals are
yclones on categories.

Fig. 10. Cumulative frequency of cyclones versus categories.
20 N. Zahibo et al. / Atmospheric Research 84 (2007) 13–29
almost the same. The best fit for data is an exponentialcurve with coefficient of determinations, R=0.95
logðN=TÞ ¼ −0:4−0:6C; ð1Þ
where C is category, and T is measured in years. Theycan be used to evaluate the return period required for the“design” cyclone definition and corresponding formulais (Fig. 11)
T ¼ 0:67expð0:60CÞ: ð2ÞIn average, the cyclone, which can be categorized,
occurred almost each year. Cyclone with category morethan 1 occurs each 2.3 year and this estimation is closeto the estimation given by (Hurricanecity). The strongestcyclones with category more 2, 3 and 4 occur each 4, 7.6and 13.4 years, respectively. The cyclone with highestcategory 5 occurs once in 75 years, but this is not a
Fig. 11. Return period v
reliable estimate taking into account that there were onlytwo such cyclones in Guadeloupe.
The integral distribution of the cyclone occurrence(cumulative frequency) versus the atmospheric pressuredrop is shown in Fig. 12 for the period 150 years (1851–2000, total number of cyclones, n is 41) and for period100 years (1901–2000, n=34). As accepted in Sharmaand Murty (1988), for the further discussion in order tohave a precise view, the difference between the normalvalue (P0=101.325 kPa) and real value, p is taken intoconsideration. Atmospheric pressure drop (ΔP=P0−P)is measured in kPa as the difference between the normalvalue P0 and real value. The difference between twocurves is weak confirming that 100–150 years can beconsidered as the stationary time for the process of thecyclone occurrence. These data are fitted very well bythe exponential curve with R=0.91
lnðN=TÞ ¼ −0:38DP−0:87: ð3Þ
ersus categories.

Fig. 12. Cumulative frequency versus the atmospheric pressure.
21N. Zahibo et al. / Atmospheric Research 84 (2007) 13–29
As a result, the return period versus the atmosphericpressure can be determined in (Fig. 13)
T ¼ 2:39expð0:38DPÞ: ð4Þ
Cyclones with huge fall of the atmospheric pressure(ΔP=5 kPa) may occur in Guadeloupe each 15 years.
The integral distribution of the cyclone occurrenceversus the wind speed is presented in Fig. 14 for period150 years (1851–2000, n=108), and for period100 years (1901–2000, n=88). And here the differencebetween the curves is relatively small. Presented data arefitted by the exponential curve with R=0.89
lnðN=TÞ ¼ 1:07−0:06W ; ð5Þ
where W is the wind speed in m/s. Measured data havesome oscillations around the exponential curve, but its
Fig. 13. Return period of cyclones
nature is not clear. As a result, the return period versusthe wind speed can be determined (Fig. 15)
T ¼ 0:9expð0:06W Þ: ð6ÞThe cyclones with wind speed exceeding 10 m/s
occurred each year, catastrophic cyclones with speedabout 50 m/s occurred approximately each 11 years.
5. Storm surges induced by cyclones in Guadeloupe
Cyclones passed through Guadeloupe induce flood-ing in many coastal locations. Atmospherically gener-ated sea level disturbances, S in a general case may beexpressed as the superposition of three major compo-nents (Murty, 1984)
S ¼ S1 þ S2 þ S3; ð7Þ
versus atmospheric pressure.

Fig. 14. Cumulative frequency versus the wind speed.
22 N. Zahibo et al. / Atmospheric Research 84 (2007) 13–29
where
S1 ¼ aDP ð8Þis the dynamic sea level rise associated with theatmospheric pressure drop, ΔP and α is the barometricfactor,
S2 ¼ bjW jWcosh ð9Þis the sea level rise caused by onshore component of thewind stress, W is the wind speed, and θ is the anglebetween the wind vector and orientation of the coastalline, and β is the respective empiric coefficientdepending on shelf parameters
S3 ¼ g f m ð10Þis the bathystrophic storm surge, f is the Coriolisparameter, v is the alongshore drift flow, initiatedmainly by the alongshore component of wind stress,
Fig. 15. Return period of cycl
and γ is the coefficient depending on water depth andbottom friction (see Pararas-Carayannis (1975) fordetails).
The source of the coastal flooding in many historicmaterials is not clarified; sometimes it can be relatedwith tsunamis (Zahibo and Pelinovsky, 2001; Lander etal., 2002). The quantitative information of the recordedsurges and parameters of cyclones is summarized inTable 2. In fact, the surge heights are known for 17cyclones during 1928–2000 only. Taking into accountvarious points of observations, the total number of datais 46, and they can be used to analyze the relationbetween the surge heights in the coastal locations andcyclone characteristics (wind speed and atmosphericpressure) and clarify the major factors of storm surges inGuadeloupe.
Fig. 16 shows the surge height versus the atmo-spheric pressure drop, ΔP for Guadeloupe. The
ones versus wind speed.

Table 2Data of storm surges for Guadeloupe (references as in Table 1)
No. Cyclone name Date Point Wind, m/s Pressure, kPa Height, m Reference
1 1928/09/12 Petit Cul-de-Sac-Marin, 57 94 5 [2, p.75]Pointe-a-Pitre 4.5 [2, p.67]
2 1949/09 Basse-Terre 23 6 [2, p.75]3 Inez 1966/09/27 North Grande-Terre 46 96.1 2 [2, p.84]4 David 1979/08/29–30 Basse-Terre, sw 50 93.3 6 [2, p.99–100]
Basse-Terre, ssw 33 93.3 3.5Gosier, St Francois, La Desirade 31 93.3 4Basse-Terre, wsw 25 92.4 4
5 Frederic 1979/09/03 Boucan 28 99.9 0.7 [2, p.118–120]St Claude 0.5Gosier 0.2
6 Hugo 1989/09/17–19 La Pointe des Chateaux, Moule, Gosier,Goyave, Pointe-a-Pitre, Abymes
72 95.9 15 [2. p.125–134]
Canal de la Dominique 72 95.9 7St Rose 67 95 3Grand Cul-de-Sac Marin 67 93.4 3Grande-Terre 67 95 2.5Petit Cul-de-Sac Marin 67 94.1 1.5
7 Luis 1995/09/05 Illes de Nord 56 10 [2, p.174–182]St Martin 69 8Pointe-a-Pitre 69 8
8. Iris 1995/08/25 Marie-Galante, les Saintes, La Desirade, le PetitCul-de-Sac Marin, Gourbeyre, Petit-Bourg
22 99.5 3 [2, p.162]
9 Marilyn 1995/09/14–18 Marie-Galante,les Saintes, Capesterre,Petit-Bourg
42 96.9 6 [2, p.184–200]36 4
Basse-Terre 41 6Boucan 51 95 2.5Deshaies 44 96.3 1.5
10 Erica 1997/09/06 Illes de Nord 33 4 [2, p.224–225]19 3.5
11 George 1998/09/20–21 Port Luis 51 96.3 7 [1]69 93.7 4.6
12 Bonnie 1998/08/20 Guadeloupe 22 2 [2, p.227]13 Danielle 1998/08/26 Illes de Nord 10 2.5 [2, p.229]
21.5
14 Jose 1999/10/19–21 La Desirade 50 99 8 [2, p.230]41 97.9 5.6 [1]33 99 5.6 [2, p.229]44 97.9 3 [1]33 99.2 2.5 [1]
15 Lenny 1999/11/17–20 Guadeloupe, sw 59 93.3 4 [1]Petit-Perou 69 93.3 1.8 [2, p.355]Pointe-a-Pitre 59 93.3 1.5 [2, p.247]Point-Moir 28 99.4 1 [2, p.242]
16. Debby 2000/08/21–22 La Desirade 36 99.3 4 [1]33 99.3 3
17 Joice 2000/09/29 L’est-sud-est de la Guadeloupe 17 2 [2, p.258]
23N. Zahibo et al. / Atmospheric Research 84 (2007) 13–29
variations in the surge height are rather significant, butin average our data is in a good agreement with the datafrom other regions. For instance, the surge height alongthe east coast of India is varied twice, having the order1–2 m for pressure drop 5 kPa (Sharma and Murty,1988). The same numbers of storm surges are
characterized for storm surges in the Sea of Azov(Eremeev et al., 2000). Formally we may conclude thatthe correlation between storm surges and atmosphericpressure is very poor, and therefore, the contribution ofthe atmospheric pressure mechanism in the dynamic sealevel rise cannot be clarified based on observed data.
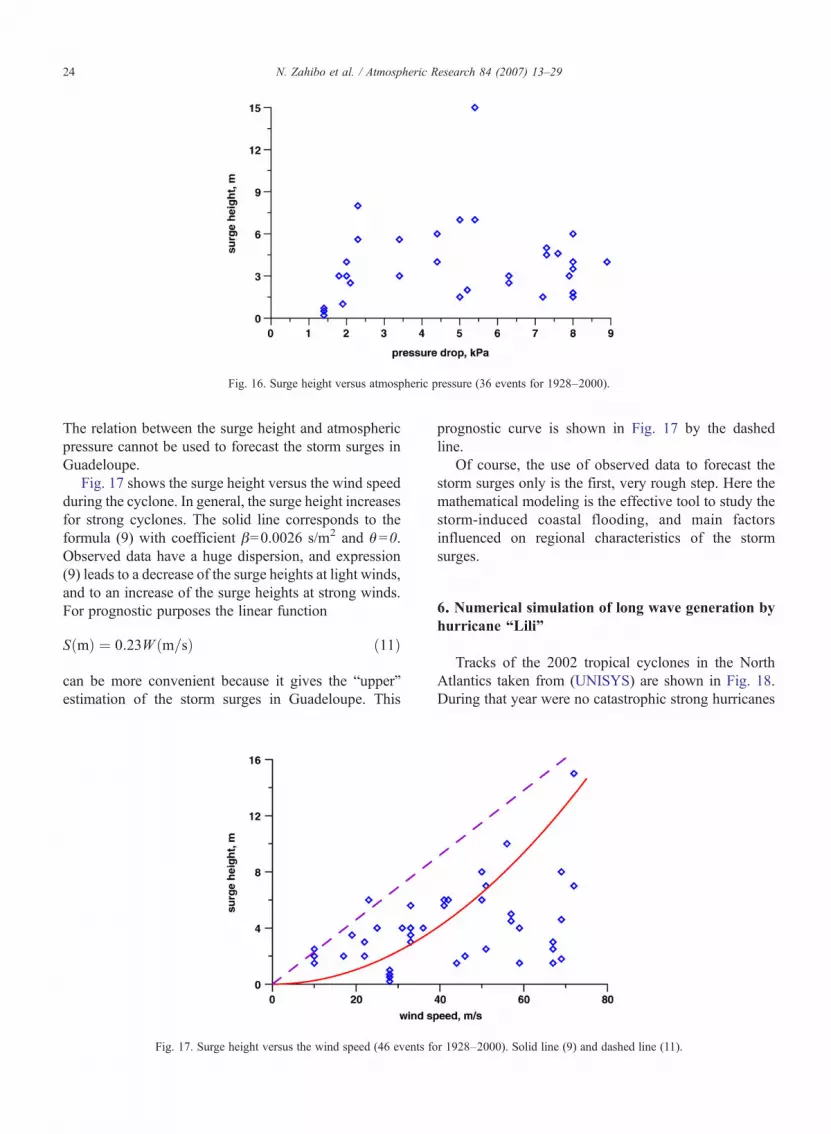
Fig. 16. Surge height versus atmospheric pressure (36 events for 1928–2000).
24 N. Zahibo et al. / Atmospheric Research 84 (2007) 13–29
The relation between the surge height and atmosphericpressure cannot be used to forecast the storm surges inGuadeloupe.
Fig. 17 shows the surge height versus the wind speedduring the cyclone. In general, the surge height increasesfor strong cyclones. The solid line corresponds to theformula (9) with coefficient β=0.0026 s/m2 and θ=0.Observed data have a huge dispersion, and expression(9) leads to a decrease of the surge heights at light winds,and to an increase of the surge heights at strong winds.For prognostic purposes the linear function
SðmÞ ¼ 0:23W ðm=sÞ ð11Þ
can be more convenient because it gives the “upper”estimation of the storm surges in Guadeloupe. This
Fig. 17. Surge height versus the wind speed (46 events fo
prognostic curve is shown in Fig. 17 by the dashedline.
Of course, the use of observed data to forecast thestorm surges only is the first, very rough step. Here themathematical modeling is the effective tool to study thestorm-induced coastal flooding, and main factorsinfluenced on regional characteristics of the stormsurges.
6. Numerical simulation of long wave generation byhurricane “Lili”
Tracks of the 2002 tropical cyclones in the NorthAtlantics taken from (UNISYS) are shown in Fig. 18.During that year were no catastrophic strong hurricanes
r 1928–2000). Solid line (9) and dashed line (11).

Fig. 18. Track chart of tropical cyclones in the North Atlantic in 2002.
25N. Zahibo et al. / Atmospheric Research 84 (2007) 13–29
in the region of the Lesser Antilles Islands, exceptHurricane “Lili”, which passed through the LesserAntilles on September 23–24. Hurricane “Lili” crossedwestern Cuba as a category two (by Saffir–SimpsonHurricane Scale) and made landfall on the Louisianacoast as a category one. Lili also affected the WindwardIslands as a tropical storm, the northeastern CaymanIslands as a category one hurricane, and caused seriousrainfall flooding in Jamaica. Thirteen deaths areattributed to this hurricane. Lili achieved category four
Table 3The track of Hurricane Lili
Date/time(UTC)
Position P(
Lat. (° N) Lon. (° W)
21 / 1800 10.2 44.6 122 / 0000 10.3 46.5 122 / 0600 10.8 48.5 123 / 0000 12.1 54.6 123 / 0600 12.2 56.8 123 / 1200 12.4 58.7 123 / 1800 12.5 60.4 124 / 0600 12.8 63.7 124 / 1200 13.0 64.9 124 / 1800 13.2 66.0 125 / 0000 13.5 66.9 125 / 1200 14.0 68.2 125 / 1800 14.2 68.9 1
over the Gulf of Mexico. Landslides initiated by thishurricane killed four people in St Vincent (CaribbeanSea), including one child. About 400 homes in Barbadoswere damaged and half the banana crop of St Lucia wastotally destroyed. Time variations of the characteristicsof hurricane Lili are presented in Table 3.
The numerical simulation of the water wavesgenerated by the hurricane “Lili” is done in theframework of the shallow-water theory widely usedfor simulation of the storm-induced flooding (Murty,
ressurekPa)
Wind speed(m/s)
Stage
09 13 Tropical depression07 15 “06 15 “05 18 Tropical storm05 21 “04 23 “05 26 “06 26 “04 31 “07 26 “08 18 “08 21 Tropical wave07 21

26 N. Zahibo et al. / Atmospheric Research 84 (2007) 13–29
1984; Poplavsky et al., 1997; Eremeev et al., 2000;Cheung et al., 2003)
AMAt
þ A
AxM 2
D
� �þ A
AyMND
� �þ gD
AgAx
−f N
¼ −Dqa
APa
Axþ ssx−sbx
q0; ð12Þ
ANAt
þ B
AxMND
� �þ A
AyN2
D
� �þ gD
AgAy
þ f M
¼ −Dqa
APa
Ayþ ssy−sby
qa; ð13Þ
AgAt
þ AMAx
þ ANAy
¼ 0; ð14Þ
where η is the water surface elevation, t is time, x and yare horizontal coordinates in zonal and meridiandirections, M and N are discharge fluxes in horizontalplane along x and y coordinates, D=h(x,y)+η is thetotal water depth, h(x,y) is the unperturbed basin depth,g is the gravity acceleration, f is the Coriolis parameter,Pa(x,y,t) is an atmospheric pressure, τs and τb are the
Fig. 19. Storm initial position (black cycle) an
wind and bottom stresses expressed as quadraticfunctions of wind and fluid velocities, respectively.The shallow-water system is realized numerically byVasily Khramushin (Poplavsky et al., 1997), as thespecial package. This package was applied early todescribe the tsunami waves in the Lesser Antilles(Zahibo and Pelinovsky, 2001) and obtained results arein a good agreement with the simulation for theCaribbean Sea within the international code TUNAMI(Zahibo et al., 2003; Pelinovsky et al., 2004). Thebathymetry used is ETOPE3 (Smith and Sandwell,1997) with grid resolution 3 min. Near the coast thereflected boundary conditions are used (approximationof the vertical wall in last sea points on depth 10–20 m).The open boundaries of the computed domain aresimulated by absorbing conditions.
We chose the storm positions from 23 September(12:00) to 25 September (12:00) with observed para-meters (Table 3) as input for numerical modeling. Thestorm initial position and the hurricane track used formodeling are shown in Fig. 19.
The snapshot of hurricane motion and induced wavesis shown in Fig. 20. Results of the calculations of the sealevel variations near several coastal locations atGuadeloupe are presented in Fig. 21 starting from12:00 on 23 September. Wave heights in both locations(Pointe-a-Pitre and Deshaies, see for locations Fig. 1)
d the following positions (grey cycles).

Fig. 20. Snapshots of hurricane motion and water wave generation.
27N. Zahibo et al. / Atmospheric Research 84 (2007) 13–29
exceed 10 cm. In fact, the model does not take intoaccount the runup due to not high resolution of thecoastal zone, so the storm surge heights can be higher inseveral times in agreement with observed data. We planto model the storm surges using more detail bathymetryof Guadeloupe.
7. Conclusion
The cyclone activity for Guadeloupe is analyzed. Intotal, 162 events are selected for period 1635–2000from various literature sources. Cyclones were recordedmainly on Guadeloupe (59%), and on St Martin (26%),

Fig. 21. Computed sea level oscillations in Guadeloupe during the Lili passing.
28 N. Zahibo et al. / Atmospheric Research 84 (2007) 13–29
and significantly less on Marie-Galante (4%), LaDesirade (3%), St Barthelemy (4%) and Les Saintes(3%). The number of cyclones in different periods has alarge variability. In 20th century, the maximum numberof cyclones (12) occurred in Guadeloupe in 1996–2000.Productive for cyclones was also the period 1931–1935,when 11 cyclones occurred. Minimum number ofcyclones during 20th century recorded for 1966–1970(one event only). On average, the time interval of about100 years can be considered a stationary one to have thereliability assessment of cyclone characteristics. Thedistribution functions and cumulative frequencies of thecyclones depending on the atmospheric pressure andwind speed are calculated. They are used to determinethe return period for cyclones with given characteristics(category, atmospheric pressure, and wind speed). Inaverage, the cyclone, which can be categorized, occursin Guadeloupe almost each year. Cyclone with categorymore than 1 occurs each 2.6 year, and the cyclone with
highest category (5) occurs once in 75 years. The data ofthe storm-induced surges in the coastal locations ofGuadeloupe is collected and analyzed. It is shown thatthe surge height increases with increase of the windspeed, but observed data has great dispersion. Theregression between the surge height and atmosphericpressure is not followed from observed data. Themodeling of the wave generation by the hurricane“Lili” in 2002 passed through the Lesser Antilles isperformed in the framework of the shallow-watertheory. Surge heights computed for several locationsin Guadeloupe exceed 10 cm. Obtained results may beapplied for the risk assessment for Guadeloupe.
Acknowledgements
This study is supported by the grants from INTAS(01-2156), and for the Russian co-authors also by thegrants from RFBR (05-05-64265).

29N. Zahibo et al. / Atmospheric Research 84 (2007) 13–29
References
Buckley, B.W., Leslie, L.M., Speer, M.S., 2003. The impact ofobservational technology on climate database quality: tropicalcyclones in the Tasman Sea. Journal of Climate 16 (15),2640–2645.
Cheung, K.F., Phadke, A.C., Wei, Y., Rojas, R., Douyere, Y.J.-M.,Martino, C.D., Houston, S.H., Liu, P.L.-F., Lynett, P.J., Dodd, N.,Liao, S., Nakazaki, E., 2003. Modeling of storm-induced coastalflooding for emergency management. Ocean Engineering 30,1353–1386.
Danard, M., Munro, A., Murty, T., 2003. Storm surge hazards inCanada. Natural Hazards 28, 407–431.
Davis, L., 1993. Encyclopedia of Natural Hazards. Headline BookPublishing, p. 433.
Duteil, A., 1999. Hugo ou l'hiver en Guadeloupe. Centre d'Edition etde Diffusion International du Livre, Paris, p. 143.
Eremeev, V.N., Konovalov, A.V., Manilyuk, Yu.V., Cherkesov, L.V.,2000. Modeling of long waves in the Sea of Azov generated bycyclone propagation. Oceanology 40 (5), 616–623.
Goldenberg, S.B., Landsea, C.W., Mestas-Nunez, A.M., Gray, W.M.,2001. The recent increase in the Atlantic hurricane activity: causesand implications. Science 309, 1844–1846.
Gray, W.M., Landsea, C.W., 1992. Examples of the large modificationin US east coast hurricane spawned destruction by prior occurringwest African rainfall conditions. ICSU/WIVIO InternationalSymposium on Tropical Cyclone Disasters October 12–16,Beijing.
Gray, W.M., Landsea, C.W., Mielke Jr., P.W., Berry, K.J, 1992.Predicting Atlantic seasonal hurricane activity 6–11 months inadvance. Weather Forecasting 7, 440–455.
Gray, W.M., Landsea, C.W., Mielke Jr., P.W., Berry, K.J., 1993.Predicting Atlantic basin seasonal tropical cyclone activity by 1August. Weather Forecasting 8, 73–86.
Gray, W.M., Sheaffer, J.D., Landsea, C.W., 1997. Climate trendsassociated with multi-decadal variability of Atlantic hurricaneactivity. In: Diaz, H.F., Pulwarty, R.S. (Eds.), Hurricanes: Climateand Socioeconomic Impacts. Springer-Verlag, New York, pp.15–53.
Hurricanecity, <http://www.hurricanecity.com/city/Rank.htm>.Lander, J.F., Whiteside, L.S., Lockridge, P.A., 2002. A brief history of
tsunami in the Caribbean Sea. Science of Tsunami Hazards 20,57–94.
Landsea, C.W., 1993. A climatology of intense (or major) Atlantichurricanes. Monthly Weather Review 121, 1703–1713.
Landsea, C.W., Gray, W.M., Mielke, P.W., Berry, K.J., 1992. Long-term variations of western Sahelian monsoon rainfall and intenseU.S. landfalling hurricanes. Journal of Climate 5, 1528–1534.
Landsea, C.W., Nicholls, N., Gray, W.M., Avila, L.A., 1996.Downward trends in the frequency of intense Atlantic hurricanesduring the past five decades. Geophysical Research Letters 23,1697–1700.
Martin, J.-L., 2002. Le Grand livre des cyclones et tempetes tropicales.ORPHIE, p. 157 (in French).
Murty, T.S., 1984. Storm surges: meteorological ocean tides. Bull.,212. Dep. Fish. Oceans, Ottawa, p. 897.
Neumann, C.J., Hill, D.A., 1976. Computerized tropical cycloneclimatology. Monthly Weather Log 20 (5), 257–262.
Neumann, C.J., Cry, G.W., Caso, E.L., Jarvinen, B.R., 1978. Tropicalcyclones of the North Atlantic Ocean, 1871–1977. NationalClimatic Center, Asheville, NC, p. 178.
NTC. National Hurricane Center, Tropical Prediction Center, NationalWeather Service, NOAA, <http://www.tpc.ncep.noaa.gov >.
Pararas-Carayannis, G., 1975. Verification study of bathystrophicstorm surge model. Techn. Mem., vol. 50. Coast. Eng. Res. Center,p. 248.
Pelinovsky, E., Zahibo, N., Dunkley, P., Edmonds, M., Herd, R.,Talipova, T., Kozelkov, A., Nikolkina, I., 2004. Tsunami generatedby the volcano eruption on July 12–13 2003 at Montserrat, LesserAntilles. Science of Tsunami Hazards 22 (1), 44–57.
Pielke Jr., R.A., Rubiera, J., Landsea, C., Fernandez, C.M.L., Klein,R., 2003. Hurricane vulnerability in Latin America and theCaribbean: normalized damage and loss potentials. NaturalHazards Review 4 (3), 101–113.
Poplavsky, A., Khramushin, V., Nepon, K., Korolev, Yu., 1997.Tsunami prediction for the sea coasts of the far east of Russia.Institute of Marine Geology and Geophysics, Yuzhno –Sakhalinsk.
Rao, A.D., Babu, S.V., Dube, S.K., 2004. Impact of tropical cycloneson coastal upwelling processes. Natural Hazards 31, 415–435.
Rappaport, E.N., Fernandez-Partagas, J., 1997. The deadliest AtlanticTropical Cyclones, 1492–1996. NOAA Technical MemorandumNWS NHC 47. <http://www.nhc.noaa.gov/pastdeadly.shtml>.
Saffache, P., Marc, J.-V., Cospar, O., 2002. Les cyclones enMartinique: quatre siècles cataclysmiques. IBIS Rouge Editions,Martinique, p. 197.
Saffache, P., Marc, J.-V., Huyghes-Belrose, V., 2003. Les cyclones enGuadeloupe: quatre siècles cataclysmiques. IBIS Rouge Editions,Martinique, p. 276.
Simpson, R.H., 1974. The hurricane disaster potential scale. Weath-erwise 27 (4), 169–186.
Sharma, G.S., Murty, A.S., 1988. Storm surges along the East Coast ofIndia. In: El-Sabh, M., Murty, T. (Eds.), Natural and Made-Manhazards. Reidel Publ. Company, pp. 255–277.
Smith, W.H.F., Sandwell, D.T., 1997. Global sea floor topographyfrom satellite altimetry and ship depth soundings. Science 277,1956–1962.
Webster, P.J., Holland, G.J., Curry, J.A., Chang, H.-R., 2005. Changesin tropical cyclone number, duration, and intensity in a warmingenvironment. Science 293, 474–479.
UNISYS, Atlantic Tropical Storm Tracking by Year (1851–2002),Based on data from the Tropical Prediction Center, NOAA, <http://www.weather.unisys.com/hurricane/atlantic/index.html >.
Yacou, A., 1999. Les catastrophes naturelles aux Antilles. EditionsKarthala, Paris, p. 334.
Zahibo, N., Pelinovsky, E., 2001. Evaluation of tsunami risk in theLesser Antilles. Natural Hazard and Earth Sciences 3, 221–231.
Zahibo, N., Pelinovsky, E., Yalciner, A., Kurkin, A., Koselkov, A.,Zaitsev, A., 2003. The 1867 Virgin Island Tsunami: observationsand modelling. Oceanologica Acta 26 (5–6), 609–621.


