Embed Size (px)
Citation preview

Page 1/20
Statistical Interpretation and Pro�ling the LeachingCharacteristic of Chromium in the Basic ChromeSulphate (BCS) Sludge Dumping at VillageKhanchandpur-Rania, District Kanpur Dehat, UttarPradesh (India)Vinod Kumar
Babu Banarasi Das UniversityPokhraj Sahu
Bharat Oil and Waste Management LtdRicha Singh
Babu Banarasi Das UniversityArti Gupta
Babu Banarasi Das UniversityPramod Kumar Singh ( [email protected] )
Babu Banarasi Das University
Research Article
Keywords: Hazardous waste, dumping site, BCS sludge, hexavalent Cr, TCLP
Posted Date: November 29th, 2021
DOI: https://doi.org/10.21203/rs.3.rs-584387/v1
License: This work is licensed under a Creative Commons Attribution 4.0 International License. Read Full License

Page 2/20
AbstractWithout immobilized hazardous waste contaminates soil and groundwater, which can further bio-accumulates and poses serious negative health impact on �ora as well as fauna. The presentinvestigation has been conducted to study of leaching behavior of chromium species in immobilizedhazardous waste containing Basic Chrome Sulphate (BCS) dumped at dumping site KhanchandpurKharanja, Rania, Kanpur Dehat district of Uttar Pradesh, India. Results indicated that the pH of sludgeranged from 10.16–11.90 while EC ranged from 840-16160 dSm-1 in a different layer of the dumpsite andsigni�cantly varies on increasing depth. A similar trend was also observed in TDS contents whichstrongly justi�ed the leaching of salts in lower depth. Total Cr concentration (25029.94 mg kg-1) wasobserved in the top layer which was signi�cantly increased on increasing depth i.e., 36102.0 mg kg-1 and42811.77 mg kg-1 while TCLP based concentration ( 216.44 mg kg-1 in top layer) was signi�cantlyincreased on increasing depth i.e., 406.25 mg kg-1 and 517.60 mg kg-1. A similar trend was also observedin total and TCLP hexavalent and trivalent (Cr6+ and Cr3+) chromium concentration. Hierarchical ClusterAnalysis is separated all sample based on depth into three different cluster based on dissimilarity. Asigni�cant correlation was observed with TCLP Cr6+ in TCLP Cr3+, EC, and TDS at 0.01 levels while EC,TDS, total Cr6+, and TCLP Cr were signi�cant correlated with TCLP Cr3+. The leaching behavior of Crspecies was higher as well as increasing of depth in the dumping site.
IntroductionThe rapid industrialization of India led to a geometrical rise in the level of air, water, and land pollution.Chromium is considered an environmentally hazardous element and classi�ed as a class-A humancarcinogen. Chromium is a naturally occurring element present in water, sediments, rocks, soils, plants,biota, animals, and volcanic emissions under various chemical, physical, and morphological forms (Sirajet al. 2012) which exist in several oxidation states (0–6). Only two of them, the Cr3+ and Cr6+ are stableand enough to occur in the environment (Ducros 1992; Shriver et al.1994), which differs from one anotherin charge, physicochemical properties as well as chemical and biological activities. Hexavalent chromiumin the form of water-soluble complex anions in surface water undergoes reduction to Cr3+ possessing amuch shorter lifetime (Callahan et al. 1979). Cr6+ may exist in three different ionic forms in a solution:hydro chromate (HCrO4
−), chromate (CrO4 2−), and dichromate (Cr2O72−). Although the chromate ion
predominates in both basic and neutral media, the hydro-chromium predominates in solutions of lowerpHs indicating the pH dependence of the proportion (Dhungana et al. 2009; Nriagu and Nieboer 1988;USEPA 1998; EPA 1984).
Industrial applications of Cr include electroplating, pigment production, leather tanning (Fishbein 1971),and controlling bio�lms in cooling towers (Lund 1971). Inadequate storage and improper disposalpractices of Cr have caused incidents of soil and groundwater contamination in many areas (Nriagu &Nieboer 1988; Palmer and Wittbrodt, 1991). Once chromium enters the environment, it exists in the twomost stable oxidation states i.e., Cr3+ and Cr6+ (Bartlett 1991). Among these trivalent form of chromium is

Page 3/20
comparatively offensive and nearly immobile, while hexavalent chromium moves rapidly through soil andwater. This form of chromium generally acts as an irritant to plant and animal tissues and carcinogenic(Nieboer & Jusys 1988). Cr3+ occurs primarily as a cation in solution and forms complexes with inorganicand organic ligands (Hartford 1979). It is considered an essential trace nutrient for animals and humans(Anderson 1993; Richard & Bourg 1991). Cr6+ can be toxic to bacteria, plants, and animals (Anderson,1995; Kimbrough 1999). The use of chromium and chromium compounds is increase due to fast growththrough intensive industrialization. In the metallurgical industry, it is used for the manufacture of variousalloys and steel. Chromate ore is also extensively used in making refractory materials like bricks.Chromate is used in the chemical industry to make many chromium-containing chemicals. Chromiumcompounds are used in electroplating, tanneries catalysts, pigments, wood preservatives, and corrosioninhibitors (Dhal et al. 2013).
A detailed investigation about the status of hexavalent chromium was undertaken by CPCB and CGWB inthe area of sludge dump at village Umran (Singh et al. 2013), Rania – Jainpur area in Kanpur Dehat, UP,India where had long-standing problem due to indiscriminate disposal of high concentration chromiumbearing Basic chromium sulfate (BCS) sludge by BCS units and also due to improper drainage in the area(Singh et al. 2013). BCS used in leather tanning processes is not completely taken up by the hides andskins. Its uptake is limited to 55–70%, and the remaining portion is discharged as waste. Therefore, about40% of the Cr amount remains in the solid and liquid wastes especially spent tanning solutions(Covington & Sykes 1983; Silveira et al. 2006). The presence of Cr3+ and its salts in the sludge of both thewastewater biological treatment plants or the chemical plants for recycling spent tanning liquorsrepresents an inconvenience for the safe reuse of these sludge and a cost forming factor for theirdisposal as well as a real threat to the environment. Also, tanneries are doing illegal dumping ofwastewater and sludge that causes serious environmental pollution. Tanning is one of the oldest andfastest-growing industries in India. There are about 2,000 tanneries located at different centers with atotal processing capacity of 600,000 tons of hides and skins per year as per observed by Raju andTandon (1999). Two major sources of Cr contamination are sludge-treated/amended soil (Dreiss 1986)and uncontrolled disposal of wastes (Makdisi 1991).
According to the inventory of the Central Pollution Control Board (CPCB) as of 2015, the total chromium-containing waste illegally dump in various Indian City is about 430960 MT and out of this 70000 MTwaste is still dumped in Kanpur Uttar Pradesh at three different sites one of them is most pollutedchromium (Cr) containing hazardous waste dumped at Khanchandpur, Rania, Kanpur Dehat (U.P.) since1976 as Basic Chrome Sulphate Sludge (BCS). Although responsible polluter industries were also noti�edby Uttar Pradesh Pollution Control Board and CPCB, the dumpsite was closed in 2005 by the Governmentof India. Matern et al. 2020 studied the column experiment and modeling to identify the leachingcharacteristic of chromium (VI) in the young chromite ore residue. Researchers reported the Level ofchromium (VI) in ground water of Raniya area in District Kanpur Dehat (Singh et al 2013; Matern et al.2017). In the present study, pro�ling of chromium in the BCS sludge sample collected from dumping siteof hazardous waste to assess the total concentration of chromium and its different oxidation species. It

Page 4/20
was also assessed the leachability of different chromium oxidation states e.g., chromium, chromiumtrivalent (Cr3+), chromium hexavalent (Cr6+), and comparative study of total and TCLP basedconcentration. As Concern of Chemicals (CoCs) chromium metal pro�ling was needed for preparing theremedial action. Different statistical tools were executed to interpret the �nding and correlate them.
Materials And Methods
Study Area of Dump SiteThe sample was collect from the unlined/ illegal waste dumpsite of Chromium bearing Hazardous Waste,which was situated at 26 24'57'' NL and 80 3'28'' EL at Khanchandpur Kharanja, Rania, Kanpur Dehatdistrict of Uttar Pradesh, India (Fig. 1). The area of the dumpsite was 30000 to 35000 m2 and thequantity had 63000 MT of waste as per Central Pollution Control Board (CPCB) inventory which wasclassi�ed under schedule-II of Hazardous and Other Wastes. The dumpsite area has a huge stockpile ofchromium-containing sludge which had generated by the local industries engaged in manufacturingBasic Chrome Sulphate (BCS) and under the consideration of the prevailing manufacturing practicesadopted by BCS manufacturing units in the area and their role in causing pollution of groundwater. At thisdumping site i.e., Khanchandpur, Rania, Kanpur Dehat (U.P.) dump Basic Chrome Sulphate Sludge (BCS)since 197. Although responsible polluter industries were also noti�ed by Uttar Pradesh Pollution ControlBoard and CPCB, the dumpsite was closed in 2005 by the Government of India.
Kanpur Dehat district having an area of about 3021 square kilometers and the dumpsite located at Rania-Khanchandpur also known as Khanchandpur kharanja near NH-2 Toll Plaza 10 km east from the maindense populated city was Akbarpur which was approximately 20 km west side from Kanpur city.According to the 2011 census, the Kanpur Dehat district has a total population was 1,795,092. KanpurDehat district of Uttar Pradesh state in northern India and the administrative headquarters of the districtare at Mati-Akbarpur. This district was part of the Kanpur division.
Sample CollectionFor sampling of hazardous waste standard methods was followed by CPCB manuals 2011. The sampleswere collected in polythene bags and transported to the laboratory after appropriate labeling for furtheranalysis. A total of twenty-seven (27) samples were collected from nine places up to 150 cm depth andthese depths were divided as D1:Top layer (0–15 cm), D2: Subsurface layer(15–75 cm), and D3: Lowerdepth(75–150 cm) in three vertical strata of the dumpsite. The personnel protective equipment was usedduring the collecting of samples. The sample was collected into the clean and air tight polybag whichwas air dry in the laboratory. After the air-drying sample was crushed through the porcelain motor andthen sieved with a 10mm sieve. The samples were analyzed for the TCLP extraction method and totalconcentration of chromium oxide including bulk density (BD), pH, EC, and TDS.
TCLP Extraction based determination of chromium species

Page 5/20
TCLP designed to determine the mobility of both organic and inorganic analytes present in liquid, solid,and multiphasic wastes which is chemical analysis process used to determine whether there arehazardous elements present in a waste. The test involves a simulation of leaching through a land�ll andcan provide a rating that can prove if the waste is dangerous to the environment or not. This rating candictate the waste management methodology that should be adopts to dispose of the waste afterward.For the TCLP extraction, the test procedure was adopted as mentioned in USEPA SW-846 Test Method1311: Toxicity Characteristic Leaching Procedure. Weight accurately 25.0 gm prepared test sample andslowly add 500 ml of extraction �uid which is prepared by dilute 5.7 mL glacial CH3CH2OOH with reagentwater to a volume of 1 liter. When correctly prepared, the pH of this �uid will be 2.88 + 0.05 to the extractorvessel. Close the extractor bottle tightly, secure in rotary agitation device, and rotate it at 30 ± 2 rpm for 18 ± 2 hours. As de�ne in Hazardous and Other Wastes (Management and Transboundary Movement) Rules,2016 schedule-II note three, Cr6 + extractions was done using distilled water in place of the leachingmedia speci�ed in the TCLP procedures. The leachable Total chromium concentration measured followedby Atomic absorption spectrophotometer make “analytical jena novAA-350” and hexavalent chromiumwas measured by spectrophotometer make Systronics-108.
Determination of total chromium hexavalent2.5 gm of the moist sample was taken in a cleaned and labeled 250 ml beaker and added 50 ml digestionsolution (20.0 ± 0.05 gm Sodium hydroxide, 30.0 gm ± 0.05 Sodium carbonate dissolve in 1000 mldistilled water). 392.18 mg MgCl2 and 0.5 ml of 1.0 M phosphate buffer were added to the beaker andallow to stirrer without heat for at least 5 m by using a stirring bar. The sample was heated and maintainsthe temperature between 90–95 ̊C with constant stirring for 60 minutes and cover all samples with awatch glass. Gradually allow cooling down each solution at room temperature, �ltering the all solutionsby using Whatman �lter paper (0.45µm) and rinses to clean the 250 ml beaker and again place amagnetic stirrer into digested sample beaker and added the concentrated nitric acid solution drop wisewith constant stirring. Adjust the pH 7.5 ± 0.5. Transfer quantitatively the content of the beaker to a 100ml volumetric �ask and make up the volume with double distilled water. The digested sample ready foranalysis. 95 ml of the extract was transferred into a 100-mL volumetric �ask. Diphenylcarbazide solution(2.0 mL) was added and mix properly. The pH was maintained upto 2 ± 0.5 by adding H2SO4 solution andthen volume was make up 100 mL with reagent water. Within 5 to 10 minutes full-color was developed.Simultaneously blank was also run with distilled water for blank correction. Absorbance was measured at540 nm by UV-spectrophotometer (make- systronics-108). Chromium was determined from the referencecalibration curve.
Determination of pH, EC & TDSFor the characterization of the physical property i.e., bulk density (BD), pH, EC, and TDS were assessed byadopting standard methods USEPA SW-846; 9045D, 20 g of soil sample was taken in a 50-mL beaker andadded 20 mL of double-distilled water, cover, and continuously stir the suspension for 5 min by stirrer.Additional dilutions were allowed if working with hygroscopic soils and salts or other problematicmatrices. Let the soil suspension stand for about 1 hr to allow most of the suspended clay to settle down

Page 6/20
from the suspension or �lter or centrifuge off the aqueous phase for pH measurement, the same aliquotis also used for measurement of electrical conductivity (EC) as well as TDS by gravimetric method.
Digestion of sample for total chromium analysisThe processed sludge sample was digested by nitric/hydrochloric acid digestion followed by metalanalysis (SW 846 US EPA method 3050B). 2.0 g of samples was digested in 10 mL HNO3 (1:1) by heating
95oC up to 15 minutes. 5 mL HNO3 added after cooling. Chromium was extracted from solid samples bycovering the beaker with a watch glass and re�uxing the sample in the dilute acid mixture for 30 minutes.After extraction, extract was diluted to specify volumes with reagent water, mixed and either centrifugedor allowed to settle overnight before analysis. Diluted samples were to be analyzed by atomic absorptionspectrometer (AAS) methods as soon as possible after digestion completed.
Statistical analysisThe SPSS software was used for the interpretation of descriptive statistics (Mean and SEM), Bivariatesanalysis of variance, LSD Post hoc test, Hierarchical cluster analysis (HCA), and Pearson correlationanalysis.
Bivariates analysis of varianceThe analysis of variance (ANOVA) was performed in the data set for comparing the mean and relativedifference in the data set. It was a parametric statistical solution to �nd out a signi�cant difference in theindividual and dependent variables. ANOVA has been performed in several ways but, It has three typesnamely univariate (One-way), bivariates (Two-way), and multivariates (K-way) analysis of variance. Theunivariate ANOVA test analyzing the group of data by using only one variable from the group. A variableis just a conditioned or subset that the groups of data fall into if the variables have more than one at atime it is called bivariates and variables further increase up to three or more it is called multivariateANOVA (Gagné 2014). The bivariates analysis of variance (ANOVA) was performed in the SPSS softwareagainst the concentration of hexavalent and total chromium in TCLP extract of BCR sludge samplecollected from deferent depth. In which is further multi comparison test conducted by Post hoc test.
Hierarchical cluster analysis (HCA)The HCA is a useful technique for visual comparison in the data; it builds a tree plot where dataparticipated within branches that are close together and dissimilar data separated in other branches(Sahu et al. 2018). The HCA was performed in the SPSS software against the physicochemical data ofBCR sludge sample collected from the deferent depth the Linkage algorithm applied through ward linkageand distance was measured through rescaled distance cluster.
Pearson Correlation analysisThe correlation matrix is a Statistical tool to �nding the relationship between data sets is signi�cant ornot at 0.01 and 0.05 level (Kumar et al. 2020; Singh et al. 2021). The correlation was analyzed in thephysicochemical data sets of BCS sludge.

Page 7/20
Results And DiscussionsChromium pro�ling was done from the unlined/ illegal waste dumpsite of Chromium bearing HazardousWaste, which was situated at 26 24'57'' NL & 80 3'28'' EL in Khanchandpur Kharanja, Rania, KanpurDehat, district of Uttar Pradesh, India. Basic Chrome Sulphate Sludge (BCS) was dumped in 1976.Different industries were responsible for generating Cr containing hazardous wastes which were alsodumped and stored since 1976 and were closed in 2005. Now it was prohibited by the pollution controlboard to dump any kind of waste materials at the said dump site, so it was almost closed. A similar casewas also found in Tamil Nadu. The Tamil Nadu Pollution Control Board (TNPCB) estimates that about150,000 tons of solid wastes accumulated over two decades of plant operation were stacked in an openyard (three to �ve meters high and on 2 hectares of land) on the facility premises. It is commonconception nowadays that the total concentrations of metals in soils are not a good indicator ofphytoavailability, or a good tool for potential risk assessment, due to the different and complexdistribution patterns of metals among various chemical species or solid phases (Silveira et al. 2006;Tessier et al. 1979; Elzinga and Cirmo 2010). Hence, in 1995, the Supreme Court of India ordered theclosure of hundreds of tanneries in Tamil Nadu for failing to treat their e�uents (Kennedy 1991).
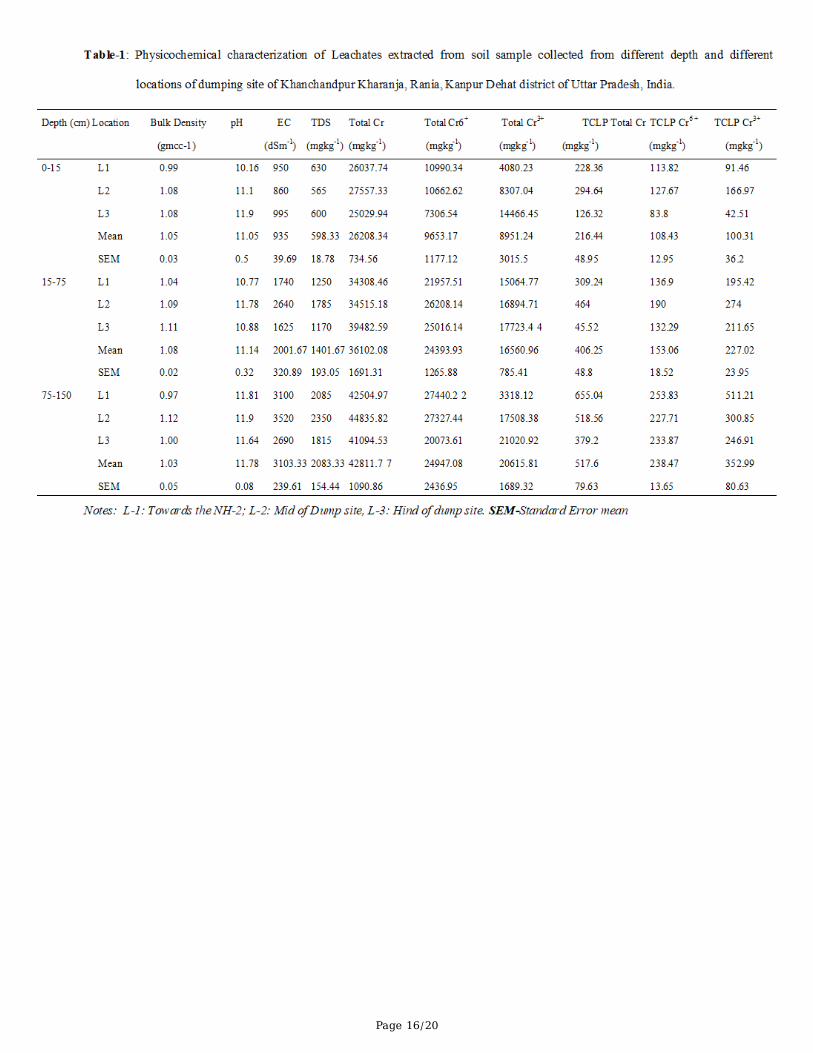
Characterization of dumping site sludgeResults indicated that the pH of BCS sludge ranged from 10.16–11.90 which were signi�cantly variedand shows alkali in nature (Table-1). Maximum pH was observed in the middle of the dumpsite indifferent depths while the least pH was observed towards the NH2 (L-1). pH signi�cantly increased onincreasing depth which may be due to leaching of salts in lower depth. A similar �nding was alsoobserved by other worker and stated that chromites ore processing residue(CORP) contains un-reactedchromites ore as well as residual (i.e., non-extracted) CrO4
2−. COPR is strongly alkaline, with pH valuestypically between 11.0 and 12.5 (Chrysochoou et al. 2009; Deakin et al. 2001b ; Földi et al. 2013). Thesestatements had also justi�ed with the results of EC which indicated that EC of sludge ranged from 840-16160 dSm-1 in a different layer of BCS dumpsite and signi�cantly varies on increasing depth (Table 1).The mean values of EC signi�cantly increased on increasing depth due to leaching of salts in lowerdepth. Least EC at surface layer (935 dSm-1) while maximum in lower depth (3103.3dSm-1). A similartrend was also observed in TDS contents which strongly justi�ed the �nding. While bulk density was non-signi�cant variation was observed. Geelhoed et al. 2002 reported that during leaching, the pH decreasedmoderately from 12.3 to 11.7 (Rania COPR) and 12.6 to 12.1 (Chhiwali COPR). Considering that COPRhas a high buffer capacity that alkaline pH values will prevail in the seepage water of COPR dumps in thenext decades.
Total chromium and its different oxidation speciesThe BCS sludge from the dumping site indicated that the least concentration of total Cr was observed inthe top layer which was signi�cantly increased on increasing depth. The mean value of total Crconcentration was 26208.33 mg kg-1 in the top layer which was signi�cantly increased 36102.0 mg kg-1

Page 8/20
and 42811.77 mg kg-1 in the subsurface and the depth respectively (Fig. 2a). If we observe location-wisethen the maximum concentration in the top layer was observed in the middle of the dumpsite while leastconcentration (25029.94 mg kg-1) in hind or towards village side of the top layer while in the subsurfacelayer it was observed least towards NH24 highway (34308.46 mg kg-1) and maximum (39482.59 mg kg-1)towards village side of dumpsite (Table 1). This variability in the concentration of total Cr at a differentlocation in different depths may be due to the leachability of total Cr as per time duration and depth. Butoverall average mean values indicated that total Cr concentration increased signi�cantly on increasingdepth (Fig. 2a).
Total Cr6+ showed a similar trend as observed in total Cr concentration which was signi�cantly decreasedon increasing depth at all locations. The average mean concentration was indicated that 9653.16 mg kg-
1, 24393.93 mg kg-1, and 24946.88 mg kg-1 in the upper layer, subsurface, and depth respectively(Table 1& Fig. 2b) which showed minimum concentration in the top layer and maximum total Cr6+
concentration in depth. There were insigni�cant changes were observed in between subsurface and lowerdepth that may be due to either hindered rate of leaching of total Cr Cr6+ on increasing depth (Fig. 2b).
The mean concentration of total Cr3+ was indicated as 8951.24 mg kg-1, 16560.96 mg kg-1, and 20615.80mg kg-1 in the upper layer, subsurface, and lower depth respectively which was signi�cantly increased onincreasing depth (Table 1& Fig. 2c)). Total Cr3+ showed similar trends as observed in total Cr and Cr6+
concentrations which were signi�cantly decreased on increasing depth at all locations. If we thoroughlyobserved location-wise concentration of total Cr + 3 then the least concentrated in the upper layer wasobserved towards NH-2 of dumping site which was signi�cantly increased towards the middle (L2) andvillage site (L3). This may be due to the time duration that Cr3+ vertically moves downwards in earlierdumping hazardous waste (Table 1& Fig. 2c) i.e., towards NH2. A similar �nding was also reported inwhich Cr concentration ranging between 2000 and 5000 mg/L in the aqueous e�uent from the tanningindustries which was very high than the recommended permissible limit of 2 mg/L while 0.05 mg/L indrinking water( Mohan 2006). Singh et al. 2013 studied a detailed investigation about the status ofhexavalent chromium in the area of sludge dump at village Umran, Rania – Jainpur area in Kanpur Dehat,UP, India where had long-standing problem due to indiscriminate disposal of high concentrationchromium bearing BCS sludge and also due to improper drainage in the area. They observed that thequality of groundwater in bordering stockpiles and nearby villages was badly affected by hexavalentchromium (80mg/L) while BIS permissible limit is up to 0.05 mg/L. They marked the entire area alarminghigh concentration of Cr which was imparted strong pale yellow color to groundwater. Wang et al. 2004reported that correlation was better between plant growth and available Cr than between plant growthand total Cr. It has long been recognized that the soluble, exchangeable, and loosely adsorbed metals arequite labile and hence more bioavailable for plants (Cary et al. 1977; Lasat 2004). Also, clayey soil mighthave high sorption capacity for Cr than other types of soils (Adriano 1986). Pendias and Pendias 1992considered 75–100 mg/kg as a critical value/load for chromium in soils. The concentration in the lowestsoil horizon is commonly used to represent the natural background value, which is representative of theindividual soil pro�le (Blaser 2000). Mandal et al. 2011 reported total Cr in sludge samples collected from

Page 9/20
the dumping site contained 377–1052 µg Cr/g sludge( acid digestion), whereas 413–1213 µg Cr/gsludge( microwave digestion), whereas sludge samples collected from the tannery contained 492–2941µg Cr/g sludge (acid digestion), whereas 490–3540 µg Cr/g sludge ( microwave digestion). So, propertreatment and disposal of sludge in stockpile on priority have required simultaneously techno-feasibilitymust be explored for chemical treatment (immobilization) of chromium bearing sludge and its judiciousdisposal must be required.
TCLP based concentration of Cr and its different oxidationspeciesTCLP or Toxicity Characteristic Leaching Procedure is a chemical analysis process used to determinewhether there are hazardous elements present in the waste. The test involves a simulation of leachingthrough a land�ll and can provide a rating that can prove if the waste is dangerous to the environment ornot. This rating can dictate the waste management methodology that the company adopts to dispose ofthe waste afterward. In the present study TCLP based concentration of Cr and its different oxidationspecies were assessed. Results indicated that TCLP based concentration of Cr was very high in alllocations which was signi�cantly increased on increasing the depth of the dumping site. In the top layer,it was ranged from 126.32-294.64 mg kg-1 with an average mean value of 216.44 mg kg-1 which wassigni�cantly increased on increasing depth i.e., 406.25 mg kg-1 and 517.60 mg kg-1 in the subsurface andlower depth respectively (Table 1& Fig. 2d). These values of TCLP based Cr were manifold higher than thepermissible limit. The same trend was also observed in the case of TCLP based Cr6+ and Cr3+ whichconcentration was observed minimum in the top layer (mean 108.43 mg kg-1 and 100.31 mg kg-1
respectively) and further these were signi�cantly increased on increasing depth i.e., 153.06 mg kg-1 and230.35 mg kg-1 respectively in subsurface layer while 198.47 mg kg-1 and 352.99 mg kg-1 respectively inthe lower depth of dumping site (Table 1 & Fig. 2e & 2f).
Statistical AnalysisPro�ling of different oxidation states of chromium was executed in the different depth of dumpedhazardous waste and following statistical interpretation conducted on the analyzed data.
Analysis of varianceIn this study, the Bivariates analysis of variance had performed in SPSS software to identifying theleaching characteristic of chromium species in different depth i.e., the top layer (0–15 cm), subsurfacelayer(15–75 cm), and lower depth(75–150 cm) at dumping site through comparing the meanconcentration of Cr6+ & total Cr shown in Table 2. In this group of data chromium species (Cr6+ & total Cr)serves as variable 1st and the depth level of the dumping site were 2nd variable and the concentration ofchromium species is treated as dependent variables. Three hypotheses were proposed as
1. Depth will have no signi�cant effect on the leaching of chromium species,

Page 10/20
2. Chromium species will have no signi�cant effect on the leaching of chromium species (Cr6+ & totalCr) and
3. Depth and chromium species interaction will have no signi�cant effect on the leaching of chromiumspecies.
The result pointed out a signi�cant effect on depth factor F(2,12) = 37.334, p (0.000) < 0.05and reject the1st hypothesis and explain that there were signi�cant differences in the TCLP concentration of chromiumspecies within the group of different depth at the dumping site. The variable second also indicates asigni�cant effect on Chromium species factor F (1,12) = 9.380, p (0.004) < 0.05and rejected the 2ndhypothesis and elucidate that there were signi�cant differences in the TCLP concentration of chromiumspecies within the group (Cr6+ & Total Cr). Output of SPSS, F(2,12) = 3.022, p (0.099) > 0.05 accepted thehypothesis and explains the interaction of both factors have no signi�cant effect on the TCLPconcentration of chromium species.
LSD Post Hoc TestsLSD stand for Least Signi�cant Difference means determined the smallest differences in mean valuewould be statically signi�cant and it does not adjust for the fact through multiple comparisons are made.In a Bivariates ANOVA, the p values de�ned the difference between groups are signi�cant or not, but itfailed to compare with each group such as signi�cance between group 1 and group 2, Group 2 and group3, and group 1 and group 3 respectively. The multiple comparisons have been done by LSD Post Hoc Testin the concentration of hexavalent chromium and total chromium in TCLP extract of deferent depth, 6pairwise comparisons are given in Table 3. The p-value of all the tested groups has been less than 0.05showing the signi�cant differences in all the comparisons. The leaching behavior of Chromium species indifferent depths (0-15cm, 15-75cm, and 5-150cm) at duping site is signi�cant means the leachingbehavior of Chromium species is higher as well as increasing of depth of dumping site.
Hierarchical cluster analysis (HCA)Hierarchical Cluster Analysis is an advanced helpful technique, which pulls together all the objects basedon their similarity. HCA was performed using ward linkage with rescaling distance cluster combined assimilarity a measure that is offered visually meaningful dendrogram and separate/cluster the groups(Sahu et al. 2018). HCA classi�es physicochemical parameters of BCS sludge given in Fig. 3.1,physicochemical parameters clustered into two major groups that two major groups further divided intotwo sub-groups step by step. In this study, physicochemical parameters of BCS sludge were divided intofour clusters, Bulk density (BD), pH, and hexavalent Chromium (TCLP Cr6+) grouped in cluster 1, trivalentChromium (TCLP Cr3+), total Chromium (TCLP Cr), TDS and EC represent cluster 2. Trivalent Chromium(Cr3+), and hexavalent Chromium (TCLP Cr6+) formed cluster 3, while total Chromium was separated thecluster 4.
The dendrogram of HCA given in Fig. 3.2 represents the visual identity for the concentration of Chromiumspecies at different depth levels in three sampling location. In this dendrogram, the triplicate sample of

Page 11/20
three deferent depth level at the dumping site was divided into two major clusters in which one majorcluster is further divided into two sub-clusters; sample 1 and sample 2 at 0–15 cm depth contributes insub-cluster 1, while sample 3 at 0–15 cm depth formed sub-cluster 2. The second major cluster wasfurther divided into three sub-cluster; sample 1 and sample 2 at 15–75 cm depth contribute to sub-cluster3 at 15–75 cm depth. Sample 3 at 15–75 cm depth and sample 2 at 75–150 cm depth both contributedin sub-cluster 4, while sample 1 at 75–150 cm and sample 3 at 75–150 cm formed Sub-cluster 5.
Pearson Correlation analysisTwo tails Bivariates correlation was run through Pearson correlation methods in SPSS to �nding therelation between a physicochemical variable of BCS sludge. In this study, statistical correlation analysiswas done at 0.05 and 0.01 level which is given in Table 4. The correlation was found signi�cant with totalCr3+ at 0.05 level are pH, EC, TDS, Total Cr6+, TCLP TCr, and TCLP Cr3+. The correlation of TCLP Cr6+, andTCLP Cr3 + both are signi�cant at 0.05 level with total Cr. The correlation was signi�cant at 0.01 level inEC, TDS, total Cr, total Cr6+, TCLP Cr6+, and TCLP Cr3+ with TCLP TCr. A signi�cant correlation was notedwith TCLP Cr6+ in TCLP Cr3+, EC, and TDS at 0.01 level while EC, TDS, total Cr6+, and TCLP Cr have asigni�cant correlation with TCLP Cr3+.
ConclusionsThe present study was executed to the pro�ling of chromium and its different oxidation species in thechromium-containing hazardous waste collected from the unlined/ illegal waste dumpsite which wassituated at 26 24'57'' NL & 80 3'28'' EL in Khanchandpur Kharanja, Rania, Kanpur Dehat, district of UttarPradesh, India. Basic Chrome Sulphate Sludge (BCS) was dumped by different industries which wereresponsible for generating Cr containing hazardous wastes since 1976 and closed in 2005 by theGovernment of India. Total 27 samples were collected from the BCS dumping site, 3–3 samples drawnfrom each depth i.e., Top layer (0–15 cm), subsurface layer (15–75 cm), and lower depth (75–150 cm).. Itwas observed that sludge pH, EC, and TDS were signi�cantly increased on increasing depth whichstrongly justi�ed the leaching of salts in lower depth. Total Cr and its different oxidation species werealso showed that concentration of Cr increased on increasing depth and TCLP based concentration wasalso signi�cantly increased on increasing depth wise-versa similar trend was also observed in total andTCLP hexavalent and trivalent (Cr6+ and Cr3+) chromium concentration which showed high leachingtendency of sludge. Bivariates analysis of variance had performed to identifying the leachingcharacteristic of chromium species in different depth in which chromium species (Cr6+ & total Cr) servesas variable Ist which showed a signi�cant effect on depth factor F (2,12) = 37.334, p (0.000) < 0.05, andexplain that there are signi�cant differences in the TCLP concentration of chromium species within thegroup of different depth at the dumping site. Depth level of the dumping site was 2nd variable which alsoindicated a signi�cant effect on Chromium species factor F (1,12) = 9.380, p (0.004) < 0.05, and theconcentration of chromium species is treated as dependent variables and elucidate that there were

Page 12/20
signi�cant differences in the TCLP concentration of chromium species within the group (Cr6+ & Total Cr).Hierarchical Cluster Analysis (HCA) showed that BD, pH, and TCLP Cr6+ were grouped in cluster 1, TCLPCr3+, TCLP Cr, TDS, and EC represented cluster 2. Cr3+ and TCLP Cr6+ formed cluster 3, while total Cr wasseparated in cluster 4. A signi�cant correlation was observed with TCLP Cr6+ in TCLP Cr3+, EC, and TDSat 0.01 level while EC, TDS, total Cr6+, and TCLP Cr were signi�cant correlated with TCLP Cr3+. Theleaching behavior of Cr species was higher as well as increasing of depth in the dumping site. So, it wasconcluded that BCS sludge required proper treatment, storage, and proper disposal facilities to avoid thecontamination of soil and groundwater. Techno-economic feasibility must be explored for chemicaltreatment (immobilization) of chromium bearing sludge and its judicious disposal in either of two land-�ll(TSDF) facilities operational in close proximity at village Khanchandpur Kharanja, Rania, Kanpur Dehat,UP, India.
DeclarationsAcknowledgement: The author was thankful to Director, Bharat Oil and Waste Management Ltd, Kanpur,UP, India for permission to use the lab facility. Author was also appreciated continuous support andsuggestion of Dr. R. K. Singh (Scientist E), Regional Director, Central Pollution Control Board, Lucknow.
Competing interest: The author declares no competing interest.
Funding: Authors have not received any fund from any Govt. Department for this study.
References1. Adriano DC (1986) Trace Elements in the Terrestrial Environment, Springer, New York, NY, USA.
2. Anderson RA (1995) Chromium and parental nutrition. Nutrition 11: 83-86.
3. Anderson RA (1993) Recent advances in the clinical and biochemical effects of chromium de�ciency.Progress in Clinical and Biological Research 380:221-234.
4. Bartlett R J (1991) Chromium cycling in soils and water: links, gaps, and methods. EnvironmentHealth Perspecive 92 : 17-24.
5. Blaser P, Zimmermann S, Luster J, Shotyk W (2000) Critical examination of trace elementenrichments and depletions in soils: as, Cr, Cu, Ni, Pb, and Zn in Swiss forest soils. Science of theTotal Environment 249 (1–3): 257–280. DOI: 10.1016/s0048-9697(99)00522-7
�. Callahan MA, Slimak MW, Bagel N, and Grevatt, PC (1979) Water-related environmental fate of 129priority pollutants, vol. II. U.S. EPA, o�ce of water planning and standards, o�ce of water and wastemanagement. Washington, DC. EPA/440/4-79-029.
7. Cary E E, Allaway WH, Olson O E (1977) Control of chromium concentrations in food plants. 1.Absorption and translocation of chromium by plants. Journal of Agricultural and Food Chemistry25(2):300–304. DOI: 10.1021/jf60210a048

Page 13/20
�. Central Pollution Control Board (2011) Manual of Sampling, Analysis and Characterization ofHazardous wastes, CPCB, Delhi.
9. Chrysochoou M, Sirine C F, Matthew AM, Moon DH, Dermatas D (2009) Microstructural Analyses ofCr (VI) Speciation in Chromite Ore Processing Residue (COPR). Environmental Science & Technology43:5461–5466.
10. Covington AD, Sykes R L (1983) A practical chrome recovery system using magnesium oxide.Journal of the Society of Leather Technologists and Chemists 67(1): 5–12.
11. Deakin D, West L.J, Stewart DI, Yardley BWD (2001) The leaching characteristics of chromite oreprocessing residue. Environmental Geochemistry and Health 23:201–206.http://doi.org/10.1023/A:1012271330251
12. Dhungana T P, Yadav P. N (2009) Determination of chromium in tannery e�uent and study ofadsorption of Cr(VI) on sawdust and charcoal from sugarcane bagasses. Journal of Nepal ChemicalSociety 23: 93–101. DOI: https://doi.org/10.3126/jncs.v23i0.2102
13. Dreiss SJ (1986) Chromium migration through sludge-treated soils. Ground Water 24(3):312–321.https://doi.org/10.1111/j.1745-6584.1986.tb01007.x
14. Ducros V (1992) Chromium metabolism: A literature review. Biological Trace Element Research32:65–77.
15. Elzinga E J, Cirmo A (2010) Application of sequential extractions and X-ray absorption spectroscopyto determine the speciation of chromium in Northern New Jersey marsh soils developed in chromiteore processing residue (COPR). Journal of Hazardous Materials 183( 1–3):145–154.
1�. EPA (1984) Health assessment document for chromium. Environmental criteria and assessmento�ce, research triangle park, NC. p1. EPA/600/8-83-014F. NTIS PB 85-115905 Available fromNational Technical Information Service: Spring�eld, VA
17. Fishbein L (1981) Sources, transport and alterations of metal compounds: an overview. I. Arsenic,beryllium, cadmium, chromium, and nickel. Environmental Health Perspective 40:43-64. DOI:10.1289/ehp.814043
1�. Földi C, Dohrmann R, Matern K Mansfeldt T (2013) Characterization of chromium-containing wastesand soils affected by the production of chromium tanning agents. Journal of Soils and Sediments13(7):1170–1179. https://doi.org/10.1007/s11368-013-0714-2
19. François Gagné (2014) Descriptive Statistics and Analysis in Biochemical Ecotoxicology. In FrançoisGagné (Eds.). Biochemical Ecotoxicology (p.p. 209-229). Academic press. DOI:http://dx.doi.org/10.1016/B978-0-12-411604-7.00012-X
20. Geelhoed JS, Meeussen JCL, Hillier S, Lumsdon DG, Thomas RP, Farmer JG, Paterson E (2002)Identi�cation and geochemical modeling of processes controlling leaching of Cr(VI) and other majorelements from chromite ore processing residue. Geochimica et Cosmochimica Acta 66:3927–3942.https://doi.org/10.1016/S0016-7037(02)00977-8
21. Hartford W, Kirk-Othmer (1979) Encyclopedia of Chemical Technology, 3rd ed.; John Wiley and Sons:(Vol. 6), New York.

Page 14/20
22. Kennedy L (1999). Cooperating for survival: tannery pollution and joint action in the Palar Valley(India). World Development 27(9):1673–1691.
23. Kimbrough DE, Cohen Y, Winer AM, Creelman L, Mabuni C, (1999) A critical assessment of chromiumin the environment. Critical Reviews in Environmental Science and Technology 29:1-46.https://doi.org/10.1080/10643389991259164
24. Kumar V, Sahu P, Singh PK, Markandeya (2020) Organic and inorganic pollutants in diverse locationof Gomti river at Lucknow City; A multivariate statistical approach. International Journal ofEnvironmental Research. https://doi.org/10.1007/s41742-020-00290-1
25. Lasat MM (2002) Phytoextraction of toxic metals: a review of biological mechanisms. Journal ofEnvironmental Quality, 31(1), 109–120.
2�. Lund HF (1971) Industrial Pollution Control Handbook. McGrawHill: New York.
27. Makdisi RS (1991) Tannery wastes de�nition, risk assessment and cleanup options, Berkeley,California. Journal of Hazardous Materials 29(1):79–96.
2�. Mandal BK, Vankayala R, Kumar LU (2011). Speciation of Chromium in Soil and Sludge in theSurrounding Tannery Region, Ranipet, Tamil Nadu. ISRN Toxicology 697980:1-10.
29. Martin TD, Martin ER (1989) Evaluation of Method 200.2 Sample Preparation Procedure forSpectrochemical Analyses of Total Recoverable Elements, December 1989, U.S. EnvironmentalProtection Agency, O�ce of Research and Development, Environmental Monitoring SystemsLaboratory, Cincinnati, Ohio 45268.
30. Matern K, Weigand H, Kretzschmar R, Mansfeldt T (2020) Leaching of hexavalent chromium fromyoung chromite ore processing residue. J. Environ. Qual. 49:712–722.
31. Matern K, Weigand H, Singh A, Mansfeldt T (2017) Environmental status of groundwater affected bychromite ore processing residue (COPR) dumpsites during pre-monsoon and monsoon seasons.Environ Sci Pollut Res 24: 3582–3592. https://doi.org/10.1007/s11356-016-8110-2
32. Mohan D, Singh K P, Singh VK (2006) Trivalent chromium removal from wastewater using low costactivated carbon derived from agricultural waste material and activated carbon fabric cloth. Journalof Hazardous Materials 135(1–3):280–295.
33. Nieboer E, Jusys AA (1988) Chromium in the natural and human environments (John Wiley & Sons,New Yark) 21.
34. Nriagu JO, Nieboer E (1988) Chromium in the Natural and Human Environments; John Wiley andSons: New York.
35. Palmer CD, Wittbrodt PR (1991) Processes Affecting the Remediation of Chromium-ContaminatedSites. Environmetal Health Perspective 92:25-40. doi: 10.1289/ehp.919225
3�. Pendias K, Pendias H (1992) Trace Elements in Soils and Plants, CRC Press, Boca Raton, Fla, USA.
37. Raju M, Tandon SN (1999) Operationally determined speciation of chromium in tannery sludges.Chemical Speciation and Bioavailability 11(2): 67–70.

Page 15/20
3�. Richard FC, Bourg ACM (1991) Aqueous geochemistry of chromium: a review. Water Research25:807-816.
39. Sahu P, Kisku GC, Singh PK, Kumar V, Kumar P, Shukla N (2018) Multivariate statistical interpretationon seasonal variations of �uoride-contaminated groundwater quality of Lalganj Tehsil, RaebareliDistrict (UP), India. Environmental Earth Science, 77, 484. https://doi.org/10.1007/s12665-018-7658-1
40. Shriver DF, Atkins PW, Langford CH (1994) Inorganic chemistry (2nd ed.). Oxford: Oxford UniversityPress.
41. Silveira ML, Alleoni LRF, O’Connor GA, Chang AC (2006) Heavy metal sequential extraction methods-A modi�cation for tropical soils. Chemosphere 64(11): 1929–1938.https://doi.org/10.1016/j.chemosphere.2006.01.018
42. Singh RK, Sachan VK, Ansari MQ, Pandey DS and Kamyotra JS (2013) Groundwater Pollution due tochromium rich hazardous waste disposal in Rania-Khanchandpur area, district Kanpur Dehat (R),U.P., India: A case study. Water and Biodiversity, 11-16.
43. Singh M, Tapadia K, Jhariya D, Sahu P (2021) Evaluation of uranium containing ground water qualityand non-carcinogenic risk assessment in inhabitant of Bijapur District of Chhattisgarh, Central India.Journal of Radioanalytical Nuclear Chemistry 327:939-947. https://doi.org/10.1007/s10967-020-07572-0
44. Siraj S, Islam M, Das PC, Masum S, Jahan I A, Ahsan A, Shajahan M D (2012) Removal of chromiumfrom tannery e�uent using chitosancharcoal composite. Journal of the Bangladish ChemicalSociety 25(1): 53–61.
45. Tessier A, Campbell PGC, Blsson M (1979) Sequential extraction procedure for the speciation ofparticulate traces metals. Analytical Chemistry 51(7): 844–851.https://doi.org/10.1021/ac50043a017
4�. USEPA (1998) Toxicological Review of hexavalent chromium. CAS No. 18540-29-9, U.S. EnvoronmentProtection Agency, Washington, DC.
47. USEPA (1998) Test Method: Soil and Waste pH(SW-845;9045D).
4�. USEPA (1998) Method 1311 Toxicity Characteristic Leaching Procedure (SW-846; 9045D).
49. Wang XP, Shan XQ, Zhang SZ, Wen B (2004) A model for evaluation of the phytoavailability of traceelements to vegetables under the �eld conditions. Chemosphere 55(6): 811–822.https://doi.org/10.1016/j.chemosphere.2003.12.003
Tables
Page 16/20

Page 17/20

Page 18/20
Figures

Page 19/20
Figure 1
Geographical representation of sampling point at BCS sludge dumping site of Khanchandpur Kharanja,Rania, Kanpur Dehat, U.P., India.
Figure 2

Page 20/20
Comparative study of different oxidation state of chromium species (e.g. Cr, Cr+3 and Cr+6) as total andTCLP based concentration in dump site waste.
Figure 3
Dendrograph of Cluster analysis, 3.1 the measurement of similarity/dissimilarity in Physicho-chemicalpro�ling of BCS Sludge and 3.2 the measurement of similarity/dissimilarity in Chromium species atdeferent depth of BCS Sludge dumping site.


