Embed Size (px)
Citation preview

Statutory information
Auditors’ reportFinancial statementsDirectors' reportIndependent verifi cation report of Non-Financial Disclosures Report
Auditor s report on information Regar-ding the Internal Control System over Financial Reporting (ICSFR)

171Statutory information

172 Banco Sabadell Annual report 2018

173Statutory information

174 Banco Sabadell Annual report 2018

175Statutory information

176 Banco Sabadell Annual report 2018

177Statutory information
178 Banco Sabadell Annual report 2018

179Statutory information

180 Banco Sabadell Annual report 2018
181Statutory information
BANCO DE SABADELL, S.A. AND COMPANIES FORMING BANCO
SABADELL GROUP
Consolidated annual accounts for the year ended 31 December 2018

182 Banco Sabadell Annual report 2018
CContents: Banco de Sabadell, S.A. Group consolidated annual accounts for 2018
Consolidated financial statements
Consolidated balance sheets of Banco Sabadell Group .......................................................................................................... 184Consolidated income statements of Banco Sabadell Group ................................................................................................... 187Consolidated statements of changes in equity of Banco Sabadell Group .............................................................................. 189Consolidated cash flow statements of Banco Sabadell Group ................................................................................................ 192
Explanatory notes
Note 1 – Activity, accounting policies and practices ................................................................................................................ 1941.1. Activity .............................................................................................................................................................................. 1941.2. Basis of presentation....................................................................................................................................................... 1941.3. Accounting principles and policies and measurement criteria ..................................................................................... 202
1.3.1 Consolidation principles ............................................................................................................................................. 2021.3.2 Business combinations .............................................................................................................................................. 2031.3.3 Measurement of financial instruments and recognition of changes arising in their
subsequent measurement ............................................................................................................................................... 2041.3.4 Impairment of financial assets .................................................................................................................................. 2081.3.5 Hedging operations .................................................................................................................................................... 2221.3.6 Financial guarantees .................................................................................................................................................. 2231.3.7 Transfers and derecognition of financial instruments from the balance sheet ...................................................... 2241.3.8 Offsetting of financial instruments ............................................................................................................................ 2241.3.9 Non-current assets and assets and liabilities included in disposal groups classified as held
for sale and discontinued operations .............................................................................................................................. 2241.3.10 Tangible assets ........................................................................................................................................................ 2251.3.11 Leases ...................................................................................................................................................................... 2261.3.12 Intangible assets ...................................................................................................................................................... 2261.3.13 Inventories ................................................................................................................................................................ 2281.3.14 Own equity items ...................................................................................................................................................... 2281.3.15 Remuneration based on equity instruments .......................................................................................................... 2291.3.16 Provisions and contingent assets and liabilities .................................................................................................... 2291.3.17 Provisions for pensions ............................................................................................................................................ 2291.3.18 Transactions in foreign currency and conversion differences ............................................................................... 2321.3.19 Recognition of income and expenses ..................................................................................................................... 2331.3.20 Corporation tax ......................................................................................................................................................... 2341.3.21 Consolidated cash flow statements ........................................................................................................................ 235
1.4. Comparability of information ........................................................................................................................................... 235Note 2 –Banco Sabadell Group ................................................................................................................................................. 237Note 3 – Shareholder remuneration and earnings per share.................................................................................................. 242Note 4 – Financial risk management ........................................................................................................................................ 243
4.1 Introduction ....................................................................................................................................................................... 2434.2 Key milestones during the year........................................................................................................................................ 246
4.2.1 Improvement of the Group’s risk profile during the year ......................................................................................... 2464.2.2 Strengthened risk management and control environment ...................................................................................... 246
4.2.3 I mprovement of monitoring environment ................................................................................................................. 2474.2.4 Improvement in the management of non-performing asset risk ............................................................................. 248
4.3 General principles of risk management .......................................................................................................................... 2484.3.1 Corporate risk culture ................................................................................................................................................ 2484.3.2 Risk Appetite Framework ........................................................................................................................................... 2504.3.3 General Organisation of the Risk Function ............................................................................................................... 2514.3.4 Planning and stress testing exercise ......................................................................................................................... 252
4.4 Management and monitoring of the main significant risks ............................................................................................ 2544.4.1 Credit risk .................................................................................................................................................................... 2544.4.2 Liquidity risk ................................................................................................................................................................ 2674.4.3 Market risk .................................................................................................................................................................. 2774.4.4 Operational risk .......................................................................................................................................................... 2834.4.5 Tax risk ........................................................................................................................................................................ 2844.4.6 Compliance risk .......................................................................................................................................................... 285
Note 5 – Minimum own funds and capital management ......................................................................................................... 286Note 6 – Fair value of assets and liabilities .............................................................................................................................. 295Note 7 – Cash, cash balances at central banks and other demand deposits ........................................................................ 305Note 8 – Debt securities ............................................................................................................................................................ 305Note 9 – Equity instruments ...................................................................................................................................................... 307Note 10 – Asset and liability derivatives held for trading ........................................................................................................ 308Note 11 – Loans and advances ................................................................................................................................................ 309Note 12 – Derivatives-asset and liability hedge accounting .................................................................................................... 316Note 13 – Non-current assets and assets and liabilities included in disposal groups classified as held for sale ............... 321Note 14 – Investments in joint ventures and associates......................................................................................................... 324

183Statutory information
Note 15 – Tangible assets ......................................................................................................................................................... 326Nota 16 – Intangible assets ...................................................................................................................................................... 329Note 17 – Other assets .............................................................................................................................................................. 332Note 18 – Deposits in central banks and credit institutions ................................................................................................... 333Note 19 – Customer deposits .................................................................................................................................................... 333Note 20 – Debt securities issued .............................................................................................................................................. 334Note 21 – Other financial liabilities ........................................................................................................................................... 335Note 22 – Provisions and contingent liabilities ........................................................................................................................ 336Nota 23 – Own Funds ................................................................................................................................................................ 341Note 24 – Accumulated other comprehensive income ............................................................................................................ 344Note 25 – Minority interests (non-controlling interests) .......................................................................................................... 346Note 26 – Off-balance sheet exposures ................................................................................................................................... 347Note 27 – Off-balance sheet customer funds .......................................................................................................................... 349Note 28 – Interest income and expenses ................................................................................................................................. 349Note 29 – Fee and commission income and expenses ........................................................................................................... 353Note 30 – Gains or (-) losses on financial assets and liabilities, net ..................................................................................... 353Note 31 – Other operating income ............................................................................................................................................ 354Note 32 – Other operating expenses ........................................................................................................................................ 354Note 33 – Administrative expenses .......................................................................................................................................... 355Note 34 – Impairment or (-) reversal of impairment on financial assets not measured at fair value
through profit or loss and modification gains or (-) losses, net............................................................................................. 359Note 35 – Impairment or (-) reversal of impairment of non-financial assets .......................................................................... 359Note 36 – Gains or (-) losses on derecognition of non-financial assets, net .......................................................................... 360Note 37 – Gains or (-) losses on non-current assets and disposal groups classified as held for sale
not qualifying as discontinued operations ............................................................................................................................. 360Note 38 – Segment reporting .................................................................................................................................................... 361Note 39 – Tax situation (income tax relating to continuing operations) ................................................................................. 366Note 40 – Related party transactions ....................................................................................................................................... 370Note 41 – Remuneration of and balances with members of the Board of Directors and senior management ...................371Note 42 – Other information ..................................................................................................................................................... 373Note 43 – Subsequent events ................................................................................................................................................... 374Schedule I –Banco Sabadell Group companies ....................................................................................................................... 375Schedule II – Structured entities – Securitisation funds ......................................................................................................... 391Schedule III –Information required to be kept by issuers of mortgage market securities and the special
accounting mortgage register ................................................................................................................................................. 392Schedule IV – Information on issuers of public sector covered bonds and on the special accounting
record of public sector covered bonds ................................................................................................................................... 398Schedule V – Details of outstanding issues and subordinate liabilities of the Group ............................................................ 400Schedule VI – Other risk information ........................................................................................................................................ 405Schedule VII –Annual banking report ........................................................................................................................................ 417
Consolidated Directors’ report
Glossary of terms on performance indicators

184 Banco Sabadell Annual report 2018
CConsolidated balance sheets of Banco Sabadell Group
As at 31 December 2018 and 31 December 2017
Thousand euro Assets Note 2018 2017 (*) Cash, cash balances at central banks and other demand deposits (**) 7 23,494,479 26,362,807 Financial assets held for trading 2,044,965 1,572,504
Derivatives 10 1,720,274 1,440,743 Equity instruments 9 7,254 7,432 Debt securities 8 317,437 124,329 Loans and advances - -
Central banks - - Credit institutions - - Customers - -
Memorandum item: loaned or pledged as security with sale or pledging rights 66,006 20,245 Non--trading financial assets mandatorily at fair value through profit or loss 141,314 39,526
Equity instruments - 39,526 Debt securities 8 141,314 - Loans and advances - -
Central banks - - Credit institutions - - Customers - -
Memorandum item: loaned or pledged as security with sale or pledging rights - - Financial assets designated at fair value through profit or loss - -
Debt securities - - Loans and advances - -
Central banks - - Credit institutions - - Customers - -
Memorandum item: loaned or pledged as security with sale or pledging rights - - Financial assets at fair value through other comprehensive income 13,247,055 13,180,716
Equity instruments 9 270,336 413,298 Debt securities 8 12,976,719 12,767,418 Loans and advances - -
Central banks - - Credit institutions - - Customers - -
Memorandum item: loaned or pledged as security with sale or pledging rights 4,676,769 2,814,601 Financial assets at amortised cost 164,415,563 160,723,766
Debt securities 8 13,131,824 11,746,645 Loans and advances 11 151,283,739 148,977,121
Central banks 98,154 63,151 Credit institutions 8,198,763 5,316,004 Customers 142,986,822 143,597,966
Memorandum item: loaned or pledged as security with sale or pledging rights 4,680,404 7,701,852 Derivatives –– HHedge accounting 12 301,975 374,021 Fair value changes of the hedged items in portfolio hedge of interest rate risk 56,972 48,289 Investments in joint ventures and associates 14 574,940 575,644
Joint ventures - - Associates 574,940 575,644
Assets under insurance or reinsurance contracts - - Tangible assets 15 2,497,703 3,826,523
Property, plant and equipment 1,796,682 1,861,730 For own use 1,526,976 1,625,032 Leased out under operating leases 269,706 236,698
Investment properties 701,021 1,964,793 Of which: leased out under operating leases - -
Memorandum item: acquired through finance leases - - Intangible assets 16 2,461,142 2,245,858
Goodwill 1,032,618 1,019,440 Other intangible assets 1,428,524 1,226,418
Tax assets 6,859,405 6,861,406 Current tax assets 312,272 329,558 Deferred tax assets 39 6,547,133 6,531,848
Other assets 17 1,639,985 2,975,511 Insurance contracts linked to pensions 132,299 139,114 Inventories 934,857 2,076,294 Rest of other assets 572,829 760,103
Non--current assets and disposal groups classified as held for sale 13 4,586,923 2,561,744 TOTAL ASSETS 222,322,421 221,348,315 (*) Shown for comparative purposes only (see section “Comparability of information” in Note 1). (**) See details in the consolidated cash flow statement of the Group. Notes 1 to 43 and accompanying schedules I to VII form an integral part of the consolidated balance sheet as at 31 December 2018.

185Statutory information
CConsolidated balance sheets of Banco Sabadell Group As at 31 December 2018 and 31 December 2017
Thousand euro Liabilities Note 2018 2017 (*) Financial liabilities held for trading 1,738,354 1,431,215
Derivatives 10 1,690,233 1,361,361 Short positions 48,121 69,854 Deposits - -
Central banks - - Credit institutions - - Customers - -
Debt securities issued - - Other financial liabilities - -
Financial liabilities designated at fair value through profit or loss - 39,540 Deposits - -
Central banks - - Credit institutions - - Customers - -
Debt securities issued - - Other financial liabilities - 39,540 Memorandum item: subordinated liabilities - -
Financial liabilities at aamortised cost 206,076,860 204,045,482 Deposits 179,877,663 177,325,784
Central banks 18 28,799,092 27,847,618 Credit institutions 18 11,999,629 14,170,729 Customers 19 139,078,942 135,307,437
Debt securities issued 20 22,598,653 23,787,844 Other financial liabilities 21 3,600,544 2,931,854 Memorandum item: subordinated liabilities 2,023,978 2,552,417
Derivatives –– HHedge accounting 12 633,639 1,003,854 Fair value changes of the hedged items in portfolio hedge of interest rate risk 36,502 (4,593) Liabilities under insurance or reinsurance contracts - - Provisions 22 466,379 317,538
Pensions and other post employment defined benefit obligations 88,456 84,843 Other long term employee benefits 12,404 16,491 Pending legal issues and tax litigation 5,107 36,293 Commitments and guarantees given 108,568 84,949 Other provisions 251,844 94,962
Tax liabilities 176,013 531,938 Current tax liabilities 8,783 106,482 Deferred tax liabilities 39 167,230 425,456
Share capital repayable on demand - - Other liabilities 995,069 740,915 Liabilities included in disposal groups classified as held for sale 13 82,605 20,645
TOTAL LIABILITIES 210,205,421 208,126,534 (*) Shown for comparative purposes only (see section “Comparability of information” in Note 1). Notes 1 to 43 and accompanying schedules I to VII form an integral part of the consolidated balance sheet as at 31 December 2018.

186 Banco Sabadell Annual report 2018
CConsolidated balance sheets of Banco Sabadell Group
As at 31 December 2018 and 31 December 2017
Thousand euro Equity Note 2018 2017 (*) Own Funds 23 12,544,931 13,425,916
Capital 703,371 703,371 Paid up capital 703,371 703,371 Unpaid capital which has been called up - - Memorandum item: capital not called up - -
Share premium 7,899,227 7,899,227 Equity instruments issued other than capital - -
Equity component of compound financial instruments - - Other equity instruments issued - -
Other equity 35,487 32,483 Retained earnings - - Revaluation reserves - - Other reserves 3,832,935 4,207,340
Reserves or accumulated losses of investments in joint ventures and associates 206,149 (13,633) Other 3,626,786 4,220,973
(-) Treasury shares (143,452) (106,343) Profit or loss attributable to owners of the parent 328,102 801,466 (-) Interim dividends (110,739) (111,628)
Accumulated other comprehensive income 24 (491,470) (265,311) Items that will not be reclassified to profit or loss (52,564) 49,443
Actuarial gains or (-) losses on defined benefit pension plans (329) 6,767 Non-current assets and disposal groups classified as held for sale - -
Share of other recognised income and expense of investments in joint ventures and associates - -
Fair value changes of equity instruments measured at fair value through other comprehensive income
(52,235) 42,676
Hedge ineffectiveness of fair value hedges for equity instruments measured at fair value through other comprehensive income
- -
Fair value changes of equity instruments measured at fair value through other comprehensive income [hedged item]
- -
Fair value changes of equity instruments measured at fair value through other comprehensive income [hedging instrument]
- -
Fair value changes of financial liabilities at fair value through profit or loss attributable to changes in their credit risk
- -
Items that may be reclassified to profit or loss (438,906) (314,754) Hedge of net investments in foreign operations [effective portion] 213,031 236,647 Foreign currency translation (640,720) (678,451) Hedging derivatives. Cash flow hedges reserve [effective portion] 4,306 (80,402)
Fair value changes of debt instruments measured at fair value through other comprehensive income
(22,958) 195,869
Hedging instruments [not designated elements] - - Non-current assets and disposal groups classified as held for sale - -
Share of other recognised income and expense of investments in joint ventures and associates 7,435 11,583
Minority interests (non--controlling interests) 25 63,539 61,176 Accumulated other comprehensive income 118 207 Other items 63,421 60,969
TOTAL EQUITY 12,117,000 13,221,781 TOOTAL EQUITY AND TOTAL LIABILITIES 222,322,421 221,348,315
Memorandum item: ooff-bbalance sheet exposures
Financial guarantees given 26 2,040,786 1,983,143 Loan commitments given 26 22,645,948 20,906,053 Other commitments given 26 8,233,226 9,916,992
(*) Shown for comparative purposes only (see section “Comparability of information” in Note 1).
Notes 1 to 43 and accompanying schedules I to VII form an integral part of the consolidated balance sheet as at 31 December 2018.

187Statutory information
CConsolidated income statements of Banco Sabadell Group For the years ended 31 December 2018 and 2017
Thousand euro
Note 2018 2017 (*) Interest income 28 4,861,943 4,839,633
Financial assets at fair value through other comprehensive income 212,080 368,422 Financial assets at amortised cost 4,268,831 4,145,503 Other interest income 381,032 325,708
(Interest expenses) 28 (1,186,759) (1,037,263) (Expenses on share capital repayable on demand) - - Net interest income 3,675,184 3,802,370 Dividend income 8,180 7,252 Profit or loss of entities accounted for using the equity method 14 56,554 308,686 Fee and commission income 29 1,558,648 1,478,603 (Fee and commission expenses) 29 (223,347) (255,167) Gains or (-) losses on financial assets and liabilities, net 30 226,709 614,104
Gains or (-) losses on derecognition of financial assets and liabilities not measured at fair value through profit or loss, net 208,106 371,365
Financial assets at amortised cost (75,870) (12,268) Other financial assets and liabilities 283,976 383,633
Gains or (-) losses on financial assets and liabilities held for trading, net 10,568 214,786 Reclassification of financial assets from fair value through other comprehensive income - - Reclassification of financial assets from amortised cost - - Other gains or (-) losses 10,568 214,786
Gains or (-) losses on non-trading financial assets mandatorily at fair value through profit or loss, net (13,902) -
Reclassification of financial assets from fair value through other comprehensive income - - Reclassification of financial assets from amortised cost - - Other gains or (-) losses (13,902) -
Gains or (-) losses on financial assets and liabilities designated at fair value through profit or loss, net 19 134
Gains or (-) losses from hedge accounting, net 21,918 27,819 Exchange differences [gain or (-) loss], net (1,318) 8,429 Other operating income 31 256,682 338,365 (Other operating expenses) 32 (547,065) (546,323) Income from assets under insurance or reinsurance contracts - 67,415 (Expenses on liabilities under insurance or reinsurance contracts) - (86,462) Gross income 5,010,227 5,737,272
(*) Shown for comparative purposes only (see section “Comparability of information” in Note 1). Notes 1 to 43 and accompanying schedules I to VII form an integral part of the consolidated income statement for 2018.
188 Banco Sabadell Annual report 2018
CConsolidated income statements of Banco Sabadell Group
For the years ended 31 December 2018 and 2017
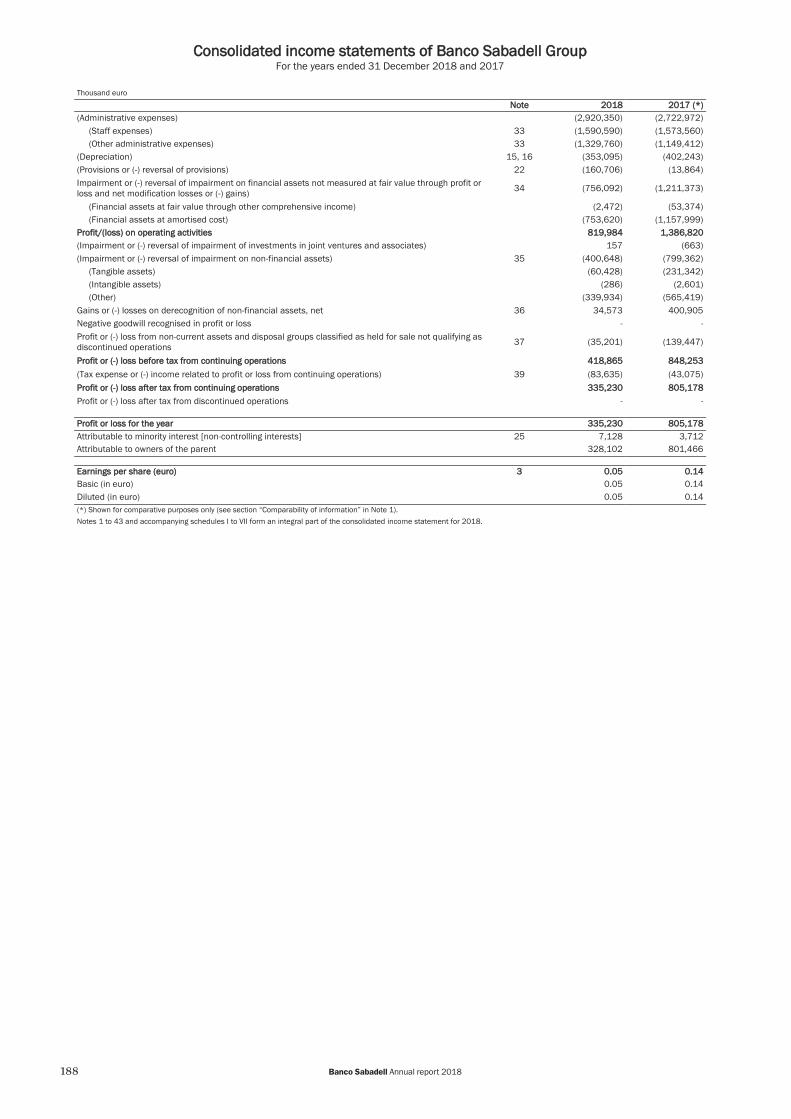
Thousand euro Note 2018 2017 (*) (Administrative expenses) (2,920,350) (2,722,972)
(Staff expenses) 33 (1,590,590) (1,573,560) (Other administrative expenses) 33 (1,329,760) (1,149,412)
(Depreciation) 15, 16 (353,095) (402,243) (Provisions or (-) reversal of provisions) 22 (160,706) (13,864) Impairment or (-) reversal of impairment on financial assets not measured at fair value through profit or loss and net modification losses or (-) gains) 34 (756,092) (1,211,373)
(Financial assets at fair value through other comprehensive income) (2,472) (53,374) (Financial assets at amortised cost) (753,620) (1,157,999)
Profit/(loss) on operating activities 819,984 1,386,820 (Impairment or (-) reversal of impairment of investments in joint ventures and associates) 157 (663) (Impairment or (-) reversal of impairment on non-financial assets) 35 (400,648) (799,362)
(Tangible assets) (60,428) (231,342) (Intangible assets) (286) (2,601) (Other) (339,934) (565,419)
Gains or (-) losses on derecognition of non-financial assets, net 36 34,573 400,905 Negative goodwill recognised in profit or loss - - Profit or (-) loss from non-current assets and disposal groups classified as held for sale not qualifying as discontinued operations 37 (35,201) (139,447)
Profit or (--) loss before tax from continuing operations 418,865 848,253 (Tax expense or (-) income related to profit or loss from continuing operations) 39 (83,635) (43,075) Profit or (--) loss after tax from continuing operations 335,230 805,178 Profit or (-) loss after tax from discontinued operations - -
Profit or loss for the year 335,230 805,178 Attributable to minority interest [non-controlling interests] 25 7,128 3,712 Attributable to owners of the parent 328,102 801,466
Earnings per sshare (euro) 3 0.05 0.14 Basic (in euro) 0.05 0.14 Diluted (in euro) 0.05 0.14 (*) Shown for comparative purposes only (see section “Comparability of information” in Note 1). Notes 1 to 43 and accompanying schedules I to VII form an integral part of the consolidated income statement for 2018.

189Statutory information
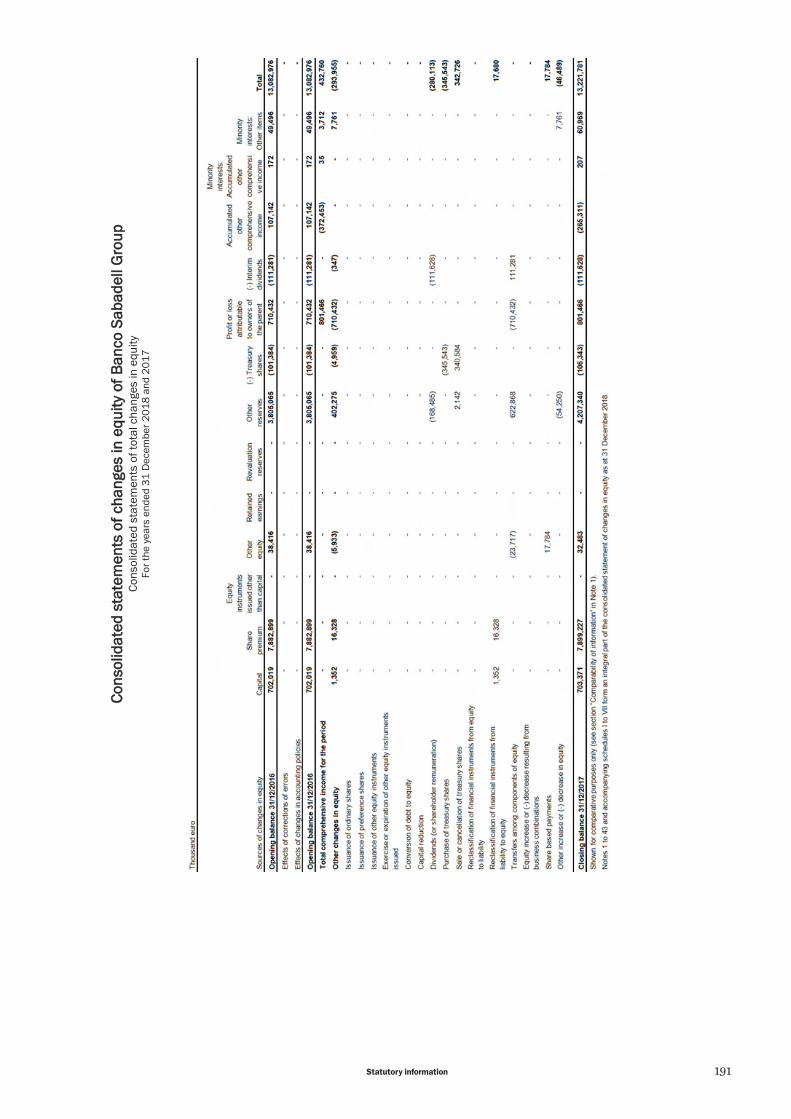
CConsolidated statements of changes in equity of Banco Sabadell Group Consolidated statements of recognised income and expenses
For the years ended 31 December 2018 and 2017
Thousand euro Note 2018 2017 (*) Profit or loss for the year 335,230 805,178 Other comprehensive income (*) 24 (285,394) (372,418)
Items that will not be reclassified to profit or loss (102,007) (15,109) Actuarial gains or (-) losses on defined benefit pension plans (10,138) (9,278) Non-current assets and disposal groups held for sale - - Share of other recognised income and expense of investments in joint ventures and associates - - Fair value changes of equity instruments measured at fair value through other comprehensive income (135,478) (12,306)
Gains or (-) losses from hedge accounting of equity instruments at fair value through other comprehensive income, net - -
Fair value changes of equity instruments measured at fair value through other comprehensive income [hedged item] - -
Fair value changes of equity instruments measured at fair value through other comprehensive income [hedging instrument] - -
Fair value changes of financial liabilities at fair value through profit or loss attributable to changes in their credit risk - -
Income tax relating to items that will not be reclassified 43,609 6,475 Items that may be reclassified to profit or loss (183,387) (357,309)
Hedge of net investments in foreign operations [effective portion] (23,616) 85,282 Valuation gains or (-) losses taken to equity (23,616) 80,351 Transferred to profit or loss - 4,931 Other reclassifications - -
Foreign currency translation 38,813 (249,801) Translation gains or (-) losses taken to equity 38,813 (175,573) Transferred to profit or loss - (74,228) Other reclassifications - -
Cash flow hedges (effective portion) 121,163 (87,004) Valuation gains or (-) losses taken to equity 200,505 (123,824) Transferred to profit or loss (79,342) 36,820 Transferred to initial carrying amount of hedged items - - Other reclassifications - -
Hedging instruments [not designated elements] - - Valuation gains or (-) losses taken to equity - - Transferred to profit or loss - - Other reclassifications - -
Debt instruments at fair value through other comprehensive income (396,409) (45,506) Valuation gains or (-) losses taken to equity (120,071) 281,250 Transferred to profit or loss (276,338) (326,756) Other reclassifications - -
Non-current assets and disposal groups held for sale - (137,571) Valuation gains or (-) losses taken to equity - - Transferred to profit or loss - (137,571) Other reclassifications - -
Share of other recognised income and expense of investments in joint ventures and associates (4,148) (4,257) Income tax relating to items that may be reclassified to profit or (-) loss 80,810 81,548
Total comprehensive iincome for the year 49,836 432,760 Attributable to minority interest [non-controlling interests] 7,039 3,747 Attributable to owners of the parent 42,797 429,013 (*) Shown for comparative purposes only (see section “Comparability of information” in Note 1).
(**) Includes “Other comprehensive income” obtained between 1 January 2018 (date of first implementation of IFRS 9) and 31 December 2018.
The consolidated statement of recognised income and expense and the consolidated statement of total changes in equity of Banco Sabadell Group make up the consolidated statement of changes in equity. Notes 1 to 43 and accompanying schedules I to VII form an integral part of the consolidated statement of changes in equity for 2018.

190 Banco Sabadell Annual report 2018
CCons
olid
ated
sta
tem
ents
of c
hang
es in
equ
ity o
f Ban
co S
abad
ell G
roup
Co
nsol
idat
ed s
tate
men
ts o
f tot
al c
hang
es in
equ
ity
For t
he y
ears
end
ed 3
1 De
cem
ber 2
018
and
2017
191Statutory information
CCons
olid
ated
sta
tem
ents
of c
hang
es in
equ
ity o
f Ban
co S
abad
ell G
roup
Co
nsol
idat
ed s
tate
men
ts o
f tot
al c
hang
es in
equ
ity
For t
he y
ears
end
ed 3
1 De
cem
ber 2
018
and
2017

192 Banco Sabadell Annual report 2018
CConsolidated cash flow statements of Banco Sabadell Group For the years ended 31 December 2018 and 2017
Thousand euro
Note 2018 2017 (*) Cash flows from operating activities (3,527,010) 12,723,308
Profit or loss for the year 335,230 805,178 Adjustments to obtain cash flows from operating activities 1,734,258 1,922,332
Depreciation 353,095 402,243 Other adjustments 1,381,163 1,520,089
Net increase/decrease in operating assets (6,889,631) (4,638,398) Financial assets held for trading (472,461) 1,911,717 Non-trading financial assets mandatorily at fair value through profit or loss 18,417 - Financial assets designated at fair value through profit or loss - (4,699) Financial assets at fair value through other comprehensive income 1,572,710 956,589 Financial assets at amortised cost (8,349,090) (8,202,376) Other operating assets 340,793 700,371
Net increase/decrease in operating liabilities 1,351,513 14,825,272 Financial liabilities held for trading 307,139 (544,592) Financial liabilities designated at fair value through profit or loss - 4,704 Financial liabilities at amortised cost 1,534,920 15,677,746 Other operating liabilities (490,546) (312,587)
Income tax receipts or payments (58,380) (191,076) Cash flows from investment activities 624,954 1,310,144
Payments (738,048) (1,018,119) Tangible assets 15 (300,530) (588,086) Intangible assets 16 (375,093) (376,703) Investments in joint ventures and associates 14 (46,178) (52,930) Subsidiaries and other business units Schedule I (16,247) (400) Non-current assets and liabilities classified as held for sale - - Other payments related to investment activities - -
Collections 1,363,002 2,328,264 Tangible assets 15, 36 504,881 249,029 Intangible assets - - Investments in joint ventures and associates 14 93,240 187,327 Subsidiaries and other business units - 1,100,869 Non-current assets and liabilities classified as held for sale 13, 37 764,881 791,038 Other collections related to investment activities - -
(*) Shown for comparative purposes only (see section “Comparability of information” in Note 1).
Notes 1 to 43 and accompanying schedules I to VII form an integral part of the consolidated cash flow statement for 2018.

193Statutory information
CConsolidated cash flow statements of Banco Sabadell Group For the years ended 31 December 2018 and 2017
Thousand euro
Note 2018 2017 (*) Cash flows from financing activities 21,324 727,763
Payments (710,811) (764,963) Dividends (392,087) (280,113) Subordinated liabilities Schedule V - (115,790) Amortisation of own equity instruments - - Acquisition of own equity instruments (267,449) (345,543) Other payments related to financing activities (51,275) (23,517)
Collections 732,135 1,492,726 Subordinated liabilities Schedule V 500,000 1,150,000 Issuance of own equity instruments - - Disposal of own equity instruments 232,135 342,726 Other collections related to financing activities - -
Effect of exchange rate fluctuations 12,404 (86,659) Net increase (decrease) in cash and cash equivalents (2,868,328) 14,674,556 Cash and cash equivalents at the beginning of the year 26,362,807 11,688,250 Cash and cash equivalents at the end of the year 23,494,479 26,362,807
Memorandum item CASH FLOWS CORRESPONDING TO:
Interest received 4,822,300 5,156,766 Interest paid 1,134,273 1,161,233 Dividends received 8,180 185,237
COMPONENTS OF CASH AND CASH EQUIVALENTS AT THE END OF THE YEAR Cash 814,761 733,923 Cash equivalents in central banks 22,065,440 25,097,038 Other demand deposits 614,278 531,846 Other financial assets - - Less: bank overdrafts repayable on demand - -
TOTAL CASH AND CASH EQUIVALENTS AT THE END OF THE YEAR 23,494,479 26,362,807 Of which: held by Group entities but which cannot be drawn by the Group -
(*) Shown for comparative purposes only (see section “Comparability of information” in Note 1).
Notes 1 to 43 and accompanying schedules I to VII form an integral part of the consolidated cash flow statement for 2018.

194 Banco Sabadell Annual report 2018
BBANCO SABADELL GROUP CONSOLIDATED ANNUAL ACCOUNTS For the year ended 31 December 2018 Note 1 – Activity, accounting policies and practices 1.1. Activity Banco de Sabadell, S.A. (hereinafter, also referred to as Banco Sabadell, the bank or the company), with registered office in Alicante, Avenida Óscar Esplá, 37, engages in banking business and is subject to the standards and regulations of governing banking institutions operating in Spain. The functions of prudential supervision of Banco Sabadell on a consolidated basis were taken on by the European Central Bank (ECB) in November 2014. The bank is the parent company of a corporate group (see Schedule I and Note 2) whose activity it controls directly or indirectly and which comprise, together with the bank, Banco Sabadell Group (hereinafter, the Group). 1.2. Basis of presentation The consolidated annual accounts for the year 2018 of the Group have been prepared in accordance with that set forth in International Financial Reporting Standards adopted by the European Union (IFRS) applicable at the end of 2018, taking into account Bank of Spain Circular 4/2017, of 27 November, and other provisions of the regulatory framework of financial information applicable to the Group, in a manner which shows a faithful image of equity and of the Group’s consolidated financial position as at 31 December 2018 and of the results of its operations, changes in equity and cash flow on a consolidated basis, which materialised in 2018. The consolidated annual accounts have been prepared based on the accounting records kept by the bank and each of the other entities in the Group, and include adjustments and reclassifications necessary to ensure the harmonisation of the accounting principles and policies and the measurement criteria applied by the Group, which are described in this note. The information included in these consolidated annual accounts is the responsibility of the directors of the Group's parent company. The bank’s consolidated annual accounts for 2018 were signed off by the directors of Banco Sabadell at a meeting of the Board of Directors on 31 January 2019 and will be submitted to the shareholders at the Annual General Meeting for approval. It is expected that the shareholders will approve the accounts without significant changes. Except as otherwise indicated, these consolidated annual accounts are expressed in thousands of euros. In order to show the amounts in thousands of euros, the accounting balances have been subject to rounding; for this reason, some of the amounts appearing in certain tables may not be the exact arithmetic sum of the preceding figures. Standards and interpretations issued by the International Accounting Standards Board (IASB) which have entered into effect in 2018 During 2018 the following standards have come into force and have been adopted by the European Union:
Standards Titles
IFRS 9 Financial instruments
IFRS 15 Revenue from contracts with customers
Clarifications to IFRS 15 Revenue from contracts with customers
Amendments to IFRS 4 Application of IFRS 9 "Financial Instruments" with IFRS 4 "Insurance contracts"
Amendments to IFRS 2 Classification and measurement of share-based payment transactions
Annual improvements to IFRS Cycle 2014 - 2016
Amendments to IAS 40 Investment property transfers
Interpretation of IFRIC 22 Foreign currency transactions and advance consideration

195Statutory information
IFRS 9 “Financial instruments” On 1 January 2018 IFRS9 “Financial Instruments”, which replaced IAS 39 “Financial instruments: recognition and measurement” came into force, and has represented the amendment of accounting requirements for the recognition and measurement of financial assets and liabilities, which are described in the sections “Measurement of financial instruments and recognition of changes arising in their subsequent measurement” and “Impairment of financial assets” in this note. Additionally, IFRS 9 has introduced an additional accounting scheme for hedge accounting, supplementary to the scheme available to date, with the latter prevailing during a transitional period. During 2018, the Group has continued applying hedge accounting criteria set forth in IAS 39. On the other hand, the implementation of this standard has given rise to significant amendments in IFRS 7 “Financial instruments: disclosures”, which have been considered in the preparation of these consolidated annual accounts. The application of this standard implies, in general, the anticipation of the recognition of losses due to the impairment of financial assets in relation to the criteria applied in accordance with the foregoing regulation. The principal quantitative impacts of the first implementation of IFRS 9 as at 1 January 2018 are shown below: The reconciliation of the portfolios in which the Group’s financial assets were grouped as at 31 December 2017,
for the purposes of their presentation and valuation in the consolidated annual accounts for 2017 with those established by IFRS 9 at the date of its entry into force, is as follows:

196 Banco Sabadell Annual report 2018
The reconciliation of asset impairment allowances and the Group’s off-balance sheet exposures as at 31 December 2017 recorded in the consolidated annual accounts for 2017, with those recorded in accordance with IFRS 9, on the date of its entry into force, is as follows:
The reconciliation between consolidated equity as at 31 December 2017 and the date of entry into force of IFRS 9
is as follows: Million euro
BBalance IAS 39 331/12/2017 RReclassification RRemeasurement TTax Impact BBalance IFRS 9
001/01/2018
CConsolidated equity 113,222 -- ((917) 2268 112,573 Of which:
Accumulated other comprehensive income
(265) (1) 84 (25) (207)
Other reserves 4,207 1 (1,001) 293 3,500
The first implementation of this standard implied, as at 1 January 2018, an increase in the NPL ratio by 18 basis points, an increase in the NPL coverage ratio (covering risks classified as Stage 3) by 10.79 percentage points, and an impact of 90 basis points on the fully-loaded CET 1 ratio (see Note 5). On the other hand, the entry into force of IFRS 9 has not had a significant impact on the classification and recognition of the rest of the Group’s financial assets and liabilities.

197Statutory information
IFRS 15 “Revenues from contracts with customers” IFRS 15 lays down new requirements for the recognition of revenue, based on the principle that an institution should recognise revenue in order to depict the transfer of promised goods or services to customers in an amount that reflects the consideration to which the entity expects to be entitled in exchange for these goods or services. This principle is reflected in a model for revenue recognition consisting of five steps, in which institutions must identify the separate performance obligations in contracts with customers, allocate the transaction price to the performance obligations identified and recognise revenue when, or as, the institution satisfies its performance obligation. This standard is therefore expected to have a greater impact on companies selling products and services on a combined basis or those that take part in long-term projects, such as telecommunications, software, engineering, construction and real estate companies. In view of the Group's core activities, and the fact that IFRS 15 is not applicable to financial instruments and other contractual rights or obligations under the scope of IFRS 9, the impact of the application of this standard has been very limited. Clarifications to IFRS 15 “Revenue from Contracts with Customers” These clarifications address the identification of performance obligations, principal versus agent considerations, licensing, as well as some information regarding transition rules. Amendments to IFRS 4 “Application of IFRS 9 “Financial instruments” with IFRS 4 “Insurance contracts” The objective of these amendments is to address the concerns of some entities, particularly insurance entities, regarding the different effective dates of the first application of IFRS 9 and the new standard on insurance contracts, which has not yet been approved. These concerns relate to the possibility of accounting mismatches and volatility in results if IFRS 9 is applied before the new standard on insurance contracts, as well as the difficulties and costs of implementing both standards. Therefore, there are two options which entities who issue insurance contracts may choose in accordance with IFRS 4: - Reclassification of gains included in profit or loss for the year to total equity, for income and expenses deriving
from designated financial assets.
- Temporarily not applying IFRS 9, in the case of entities whose activity predominantly consists of issuing insurance contracts within the scope of IFRS 4.
Amendments to IFRS 2 “Classification and measurement of share based payment transactions" These amendments address specific issues such as the accounting of cash-settled share-based payment transactions that include a performance condition, the classification of share-based payments settled net of tax and certain aspects of the accounting of the amendments to the terms and conditions of share-based payments. Annual Improvements to IFRS “Cycle 2014-2016” These improvements have included non-urgent amendments to IFRS 1 “First-time Adoption of International Financial Reporting Standards”; IFRS 12 “Disclosure of Interests in Other Entities”; and IAS 28 “Investments in Associates and Joint Ventures.” Amendments to IAS 40 “Investment Property” According to these amendments, it is only possible to record one asset as a real estate investment, or reclassify it to a different item on the balance sheet, when there is evidence that a change in its use has occurred. In particular, in accordance with these amendments, a change in the intended use of the asset does not constitute, in itself, evidence of a change in the use of the asset. Interpretation of IFRIC 22 “Foreign currency transactions and advance consideration” This interpretation refers to the treatment of transactions in a foreign currency when an entity recognises a non-monetary item arising from the payment or receipt of advance consideration before the entity recognises the related asset, expense or income. In these cases, the exchange rate to be used is that of the date of initial recognition of the payment or receipt of advance consideration. In the event that there are various advance consideration payments, the exchange rate used for each such consideration shall be the exchange rate on the date of their recognition.

198 Banco Sabadell Annual report 2018
Except for the impact deriving from the adoption of IFRS 9, described above, no significant effects have derived from the application of the consolidated annual accounts. IIASB standards and interpretations not yet in effect As at 31 December 2018 the most significant standards and interpretations for the Group that have been published by the IASB but which have not been applied when preparing these consolidated annual accounts, either because their effective date is subsequent to the date thereof or because they have not yet been endorsed by the European Union, are as follows:
Standards and Interpretations Title Mandatory for years beginning:
Approved for application in the EU IFRS 16 Leases 1 January 2019
Amendments to IFRS 9 Prepayment features with negative compensation 1 January 2019
Interpretation of IFRIC 23 Uncertainty over income tax treatments 1 January 2019
Not approved for application in the EU
Amendments to IAS 28 Long-term interests in associates and joint ventures 1 January 2019
IFRS 17 Insurance contracts 1 January 2021
Annual improvements to IFRS Cycle 2015 - 2017 1 January 2019
Amendments to IAS 19 Plan amendment, settlement or curtailment 1 January 2019
Amendments to IFRS Conceptual Framework Amendment of references to IFRS Conceptual Framework 1 January 2020
Amendments to IFRS 3 Business combinations 1 January 2020
Amendments to IFRS 1 and 8 Definition of material 1 January 2020
The Group has carried out an assessment of the impacts resulting from these standards and decided not to exercise its option to adopt early, where possible. Similarly, unless otherwise indicated, management estimates that their adoption would not have a material impact on the Group.

199Statutory information
Approved for implementation in the EU IFRS 16 “Leases” In January 2016, IASB published this new standard, which supersedes IAS 17 “Leases”, and establishes new criteria for the identification and accounting of leasing contracts, for both lessors and lessees. IFRS 16 establishes a control model for the identification of these contracts, distinguishing between lease and service contracts based on the existence of a specific asset controlled by the lessee. This standard includes significant changes in the accounting of lessees, eliminating the distinction between finance leases and operating leases. The standard requires right-of-use assets and lease liabilities to be recognised on the balance sheet. This standard does not introduce significant amendments in the accounting of these contracts by lessors. IFRS 16 also introduces amendments in the accounting of sale and leaseback transactions. However, on the date of this standard’s first application, banks shall not be required to reassess whether sale and leaseback transactions carried out in previous years resulting in asset disposals comply with the requirements of IFRS 15 in order to be considered as sales. In the specific case of transactions recognised as sale and leasebacks, the lease contracts shall be accounted for following the same criteria as other operating leases in effect at the time of the standard’s first application. In 2018 the Group has carried out an analysis of the impact of the first application of IFRS 16, concluding that this fundamentally affects the accounting of the leasing contracts of properties and branches where the Group carries out its activity. As a consequence of the entry into force of this standard, the Group has registered, on 1 January 2019, a liability for the pending payments of the estimated lease contracts, based on their expected maturity date, discounting the incremental financing rate, understanding it as the interest rate that the Group would pay for financing asset purchases for a similar value to the rights of use acquired for the goods subject to lease for an equal term to the estimation duration of the lease contracts. For the purpose of carrying out this estimation, the Group, in accordance with that permitted by new regulations, has not included contracts for goods of negligible value or with short term maturity. Additionally, it has chosen to fully record contracts which includes services other than lease services as leasing contracts. In accordance with the foregoing, the Group has recorded a lease liability as at 1 January 2019 for the amount of 1,107 million euros, and an asset for an amount equal to the lease liability. Consequently, the first application of this standard has not had an impact on the Group’s equity. Amendments to IFRS 9 “Prepayment features with negative compensation” This amendment allows financial assets whose cash flows represent payments of principal and interest only, with the exception of cases in which their early termination gives rise to payments as compensation by the lending institution to the borrower, to be measured, under certain circumstances, at their amortised cost or fair value with a counterpart in equity. Interpretation of IFRIC 23 “Uncertainty over income tax treatments” This interpretation establishes how to estimate the accounting position when there is uncertainty over the income tax treatments. This requires entities to determine whether tax positions for which there is uncertainty must be valued separately or together, and whether it is probable that the tax authority will accept the uncertain tax treatment that an entity has used, or plans to use, in its income tax filing.
- If considered probable, the entity will have to determine its tax position consistently with the tax treatment which it
has used or plans to use;
- If considered not probable, the entity should reflect the effect of such uncertainty when determining its tax position.

200 Banco Sabadell Annual report 2018
Not approved for their implementation in the EU Amendments to IAS 28 “Long term interests in Associates and Joint Ventures” These amendments clarify that institutions must apply IFRS 9, including their requirements relating to the impairment of financial instruments, long term interests in associates and joint ventures which form part of net investment in the associate or joint venture, but which are not valued by the equity method. IFRS 17 “Insurance contracts” IFRS 17 establishes the principles of recognition, measurement, presentation and breakdown of insurance contracts. The objective of IFRS 17 is to ensure that entities provide relevant information that faithfully represents those contracts. In accordance with this standard, insurance contracts combine components of financial instruments and service contracts. Furthermore, many insurance contracts generate cash flows that vary substantially and have a long duration. For the purpose of providing useful information on these aspects, IFRS 17: - Combines the current measure of future cash flows with recognition of income throughout the period during which
the services established in the contracts are provided.
- Presents results for services provided separately from the expenses and income relating to these contracts.
- Requires entities to decide whether to recognise the entirety of their financial income and expenses relating to insurance contracts in the income statement or whether part of such revenue shall be recognised in the statement of equity.
Annual Improvements to IFRS “2015-2017 Cycle” These improvements include slight amendments to standards IAS 12 - “Income Taxes”, IAS 23 “Borrowing Costs” and IAS 28 “Investments in Associates and Joint Ventures”. Amendments to IAS 19 “Plan Amendment, Curtailment or Settlement” This amendment to IAS 19 uses actuarial assumptions to determine the cost of the actual service and net interest for the rest of the period after the amendment, curtailment or settlement, and which recognises in the results, as part of the cost of the service, or earnings or loss in the settlement, or any reduction of a surplus, even if the surplus had not previously been recognised due to the impact of the limit of the assets. This amendment shall be applied prospectively to the amendments, settlements or curtailments of the defined benefit pension plans from 1 January 2019 onwards, whereby their early application is permitted. Amendment of references to IFRS Conceptual Framework The Conceptual Framework establishes the fundamental concepts applied in the development of new IFRS and contributes to ensuring that they are coherent and that similar transactions are recorded in the same manner, with the purpose of providing useful information to users. Furthermore, it also helps institutions to develop accounting criteria in the cases in which developed standards which are applicable to a particular transaction do not exist. The revised Conceptual Framework entered into force in March 2018, and amongst other aspects, it reintroduces the concept of prudence, amends the definitions of assets and liabilities, includes clarifications with regards to the recording and write off of assets and liabilities and based on the measurement of items in the financial statements and uses profit/loss as a key indicator of the profitability of an entity. Additionally, the IASB has published the document “Amendments to References to the Conceptual Framework in IFRS”, which updates the references included in several IFRS to the new Conceptual Framework. These amendments shall be applicable from 1 January 2020, as their early application is permitted.

201Statutory information
Amendments to IFRS 3 “Business combinations” The objective of these modifications is to introduce improvements in the definition of business, with the purpose of helping institutions to differentiate between asset purchases and business acquisitions. This distinction is relevant because goodwill is only generated in business acquisitions. The amended definition of business emphasises that the purpose of a business is to provide goods and services to consumers, whereas the previous definition focused on obtaining dividends, reducing costs or other benefits for investors. Amendments to IAS 1 and IAS 8 “Definition of material” These amendments establish a new definition of “material” with the objective of helping companies to make decisions which imply the application of best judgement with regards to the information that should be included in the financial statements. In accordance with the new definition, information is material if its omission, distortion, or obscuration may reasonably impact the decisions which users make on the basis of the entity’s financial statements. No accounting principles or valuation criteria that have ceased to be applied in the preparation of the Group’s annual consolidated accounts for 2018 due to any significant effect thereof. BBest judgement and estimates The preparation of the consolidated annual accounts requires certain accounting estimates to be made. It also requires that management exercise judgement in the process of applying the Group’s accounting policies. Such estimates could affect the amount of assets and liabilities and the breakdown of contingent assets and liabilities at the date of the consolidated annual accounts, as well as income and expenses during the year. The main estimates refer to the following items:
- Amendments to business models under which financial assets are managed (see Notes 1.3.3, 8 and 11).
- The determination of the significant increase in credit risk of financial assets from their initial recognition (see Notes 1.3.4, 8 and 11).
- Losses due to the impairment of certain financial assets (see Notes 1.3.4, 8, 9 and 11).
- The assumptions used in actuarial calculations of liabilities and commitments in respect of post-employment remuneration (see Notes 1.3.17 and 22).
- The useful life of tangible and intangible assets (see Notes 1.3.10, 1.3.12, 15 and 16).
- The valuation of consolidated goodwill (see Notes 1.3.12 and 16).
- The provisions and consideration of contingent liabilities (see Notes 1.3.16 and 22).
- The fair value of certain unquoted financial assets (see Note 6).
- The fair value of real estate assets included in the balance sheet (see Notes 1.3.9, 1.3.10, 1.3.13 and 6).
- The recoverability of non-monetisable deferred tax assets and tax credits (see Note 39).
Although estimates are based on the best information available to management about the current and foreseeable circumstances, final results could differ from these estimates.

202 Banco Sabadell Annual report 2018
1.3. Accounting principles and policies and measurement criteria The most significant accounting principles and policies, as well as measurement criteria that have been applied in preparing these consolidated annual accounts are as follows: 1.3.1 Consolidation principles In the consolidation process, a distinction is drawn between subsidiaries entities, joint ventures and associates and structured entities.
Subsidiaries entities Subsidiaries entities are institutions over which the Group has control. This occurs when the Group is exposed to, or entitled to, variable returns derived from its involvement in the subsidiary entity and it has the ability to influence those returns through its power over the entity. For control to exist, the following criteria must be met:
- Power: an investor has power over an investee when it holds rights which provide it with the capacity to direct
the relevant activities, i.e. those that significantly affect the investee's returns. - Returns: an investor is exposed, or is entitled, to variable returns due to his/her involvement in the investee
when the returns obtained from such involvement may vary depending on the investee’s business performance. The returns may only be positive, only negative or both positive and negative.
- Relationship between power and returns: an investor controls an investee if the investor not only has power
over the investee and is exposed or is entitled, to variable returns due to his/her involvement with the investee, but also the ability to use their power to affect the returns obtained due to their involvement with the investee.
At the time of the takeover of a subsidiary entity, the Group applies the acquisition method provided for in the regulatory framework for business combinations (see Note 1.3.2) except in the case of acquisitions of an asset or group of assets. The financial statements of subsidiaries entities are consolidated with the bank's financial statements using the full consolidation method. The participation of third parties in Group consolidated equity is shown in the heading “Minority interests (non-controlling interest)” of the consolidated balance sheet and the part of the profit for the year attributable to the same is shown under the heading “Profit or loss for the year - Attributed to minority interests (non-controlling interest)” in the consolidated income statement. Joint ventures These are institutions subject to joint control agreements whereby decisions on significant activities are made unanimously by the institutions which share control. Investments in joint ventures are accounted for by the equity method i.e. they are accounted for in terms of the fraction of equity represented by the Group’s share of their capital stock, after taking account of any dividends received from them and any other equity disposals. The Group has not held investments in joint ventures during 2018. Associates Associates are institutions over which the Group has a significant influence which generally, although not exclusively, takes the form of direct or indirect interest representing 20% or more of the investee’s voting rights. In the consolidated annual accounts, associated entities are accounted for using the equity method. Structured entities A structured entity is an entity that has been designed so that voting or other similar rights are not the determining factor when it comes to deciding who controls the entity.

203Statutory information
In cases in which the Group holds a stake in an entity, or constitutes an entity, for the purpose of transferring risks or for any other purposes, or to allow customers access to certain investments, whether or not there is control over the entity is determined based on the provisions of the regulatory framework, as described above and, subsequently, a determination is made as to whether or not they should be subject to consolidation. Specifically, the following factors, among others, are considered: - Analysis of the influence of the Group over the significant activities of the entity that could have an influence
on the amount of its returns.
- Implicit or explicit commitments of the Group to provide financial support to the entity.
- Identification of the entity's manager and analysis of the remuneration scheme.
- Existence of removal rights (possibility of dismissing managers).
- -Significant exposure of the Group to the variable returns on the assets of the entity.
These entities include those known as “Asset securitisation funds”, which are consolidated in cases where, based on the above analysis, it is determined that the Group has maintained control. For these operations, there are contractual agreements for financial aid commonly used in securitisation markets, but there are no significant financial aid agreements other than those established contractually. By reason of the foregoing, it is considered that for virtually all securitisations made by the Group, the risks transferred cannot be derecognised from the asset side of the consolidated balance sheet and the issues of securitisation funds are recognised as liabilities on the Group consolidated balance sheet.
In the case of investment firms and investment and pension funds managed by the Group (in most cases, retail funds with no legal personality over which the investors acquire proportional units providing them with ownership of the equity managed), they are considered not to meet the regulatory requirements for them to be considered structured entities and they are analysed under the same criteria as subsidiaries. Such firms and funds are self-sufficient in terms of their activities, and their capital structure does not prevent them from carrying out their activities without further financial aid, for which reason they are not subject to consolidation. Schedule II provides details of the structured entities of the Group.
In all cases, the consolidation of the results generated by the companies forming part of the Group during a given year is carried out considering only those relating to the period spanning between the acquisition date and year-end. Similarly, the consolidation of the results generated by the companies disposed of during the year is carried out considering only those relating to the period spanning between the start of the year and the disposal date. In the consolidation process, all material balances and transactions between the companies forming part of the Group have been eliminated, in the proportion corresponding to them based on the applied consolidation method. The financial and insurance institutions, both subsidiaries and associates, regardless of the country in which they are located, are subject to supervision and regulation by various bodies. Current laws in the various jurisdictions, along with the need to meet certain minimum capital requirements and carry out oversight activities, are circumstances that could affect the capacity of such institutions to transfer funds in the form of cash, dividends, loans or advances. Note 2 includes information on the most significant acquisitions and disposals that have taken place during the year. Relevant information regarding the Group’s companies is provided in Schedule I. 11.3.2 Business combinations A business combination is a transaction, or any other event, whereby the Group obtains control over one or more businesses. Business combinations are accounted for using the acquisition method. Under this method, the acquiring entity recognises the assets and liabilities acquired in its financial statements, also considering contingent liabilities, in line with their fair value, including those which were not recognised for accounting purposes by the institution acquired. This method also requires the estimate of the cost of the business combination, which will normally correspond to the consideration paid, defined as the fair value, on the date of acquisition, of the assets delivered, the liabilities incurred against the former owners of the acquired business and the equity instruments issued, if any, by the acquiring entity.

204 Banco Sabadell Annual report 2018
The Group recognises goodwill in the consolidated annual accounts if at the acquisition date there is a positive difference between: - the sum of the consideration paid and the amount of all minority interests and the fair value of prior interests held
in the acquired business, and
- the fair value of recognised assets and liabilities.
If the difference is negative, it is recorded under the heading “Negative goodwill recognised in profit and loss” in the consolidated income statement. In cases where the amount of the consideration depends on future events, any contingent consideration is recognised as part of the consideration paid and is measured at fair value on the acquisition date. The costs associated with the transaction do not form part of the cost of the business combination for these purposes. If the cost of the business combination or the fair value assigned to the acquired institution’s assets, liabilities or contingent liabilities cannot be definitively determined, the initial accounting of the business combination is considered provisional. In any event, the process should be completed within a maximum of one year from the acquisition date and effective as of that date. Minority interests in the acquired institution are measured on the basis of the proportional percentage of its identified net assets. All purchases and disposals of these minority interests are accounted for as equity transactions when they do not result in a change of control. No profit or loss is recognised in the consolidated income statement and the initially recognised goodwill is not re-measured. Any difference between the consideration paid or received and the decrease or increase in minority interests, respectively, is recognised in reserves. With regard to non-monetary contributions of businesses to associates or jointly controlled institutions in which control is lost over said businesses, the Group’s accounting policy is to record the full profit or loss in the consolidated income statement, recognising any remaining equity interest at fair value. 1.3.3 Measurement of financial instruments and recognition of changes arising in their subsequent measurement In general, all financial instruments are initially recognised at fair value (see definition in Note 6) which, unless evidence to the contrary is available, coincides with the transaction price. For financial instruments which are not recognised at fair value through profit or loss, the amount of fair value is adjusted either by adding or deducting the transaction costs directly attributable to its acquisition or issue. In the case of financial instruments at fair value through profit or loss, the transaction costs directly attributable are recognised immediately in the consolidated income statement. In general, conventional sales and purchases of financial assets are recognised in the Group’s consolidated balance sheet using the settlement date. Changes in value of financial instruments originating from the accrual of interest and similar items are recorded in the consolidated income statement, under the headings “Interest income” or “Interest expenses”, as applicable. Dividends received from other companies are recognised in the consolidated income statement for the year in which the right to receive them is originated. The instruments which form part of a hedge are treated in accordance with current regulations applicable to hedge accounting. Variations in the evaluations which arise subsequent to the initial registration due to causes other than those mentioned above are treated based on the classification of financial assets and liabilities for the purposes of their evaluation which, in general, is based on the following aspects: - The business model for the management of financial assets, and - The characteristics of contractual cash flows from financial assets. Business model Business model under which the financial assets are managed to generate cash flows. The business model is determined considering how groups of financial assets are managed together, to achieve a specific objective. Therefore, the business model does not rely on the Group’s intentions for an individual instrument, yet it is determined for a group of instruments.
205Statutory information
The business models used by the Group are indicated below: - Maintenance of financial assets to receive contractual cash flows: under this model, financial assets are managed
with the objective of receiving specific contractual cash flows and not to receive overall returns by maintaining and selling assets. Notwithstanding the foregoing, disposals prior to the maturity of assets under determined circumstances are permitted. Amongst the sales which could be compatible with a model of maintaining assets to receive contractual cash flows, assets close to maturity, those which are maintained due to an increase in credit risk and those carried out to manage concentration risk, are the least common or least significant.
- Sale of financial assets. - Combination of the two business models above (maintenance of financial assets to receive contractual cash flows
and sale of financial assets): this business model implies carrying out the sales of the most frequent and highest-value assets, which are essential to the business model.
CCharacteristics of contractual cash flows of financial assets A financial asset must initially be classified in one of the following two categories: - Those whose contractual conditions given rise, on specific dates, to cash flows which only consist of principal and
interest payments on the amount of outstanding principal. - Rest of financial assets. For the purposes of this classification, the principal of a financial asset is its fair value at the moment of the initial recognition, which could change throughout the life of the financial asset; for example, if there are principal repayments. Furthermore, interest is understood as the sum of the compensation for the temporary value of money, financing and structural costs, and credit risk associated with the amount of the principal pending payment during a specific period, plus a profit margin. Financial instrument classification portfolios for the purpose of their valuation Financial assets and liabilities are classified for the purposes of their valuation in the following portfolios, based on the aspects described above: Financial assets at amortised cost This category includes financial assets which comply with the following two conditions: - They are managed using a business model, the purpose of which is to maintain them to receive their contractual
cash flows, and - Their contractual conditions give rise to cash flows on specific dates, which are only for principal and interest
payments for the amount of outstanding principal. This category comprises investments associated with typical lending activities such as amounts loaned to customers and not yet repaid, deposits placed with other institutions, regardless of the legal arrangements under which the funds were provided, debt securities which comply with the two conditions indicated above, as well as debts incurred by purchasers of goods or users of services forming part of the Group’s business. Following their initial recognition, financial assets classified in this category are measured at amortised cost, which consists of the acquisition cost adjusted to take into account principal repayments and the portion allocated in the consolidated income statement, using the effective interest rate method, of the difference between the initial cost and the repayment value at maturity. In addition, the amortised cost is decreased by any reduction in value due to impairment recognised directly as a decrease in the value of the asset or through an allowance or compensatory item of the same value. The effective interest rate is the discount rate that equals the value of a financial instrument exactly to the estimated cash flows over the instrument’s expected life, on the basis of the contractual conditions, such as early repayment options, but without taking into account future credit losses. For fixed rate financial instruments, the effective interest rate coincides with the contractual interest rate set at the time of their acquisition, plus, where appropriate, the fees which, because of their nature, may be likened to an interest rate. In the case of variable-rate financial instruments, the effective interest rate is the same as the rate of return in respect of all applicable concepts, until the first date on which the reference interest rate is reviewed.

206 Banco Sabadell Annual report 2018
Financial assets at fair value through other comprehensive income This category includes financial assets which comply with the following two conditions: - Managed through a business model, the objective of which combines the perception of its contractual cash flows
and its sale, and - Contractual conditions give rise to cash flows on specific dates which are only for principal and interest payments
for the amount of outstanding principal. These financial assets primarily correspond to debt securities. Furthermore, the Group may opt, at the time of the initial recognition, and irrevocably, to include the portfolio of financial assets at fair value through other comprehensive income, investments in equity instruments that should not be classed as held for trading and which would otherwise be classified as financial assets mandatorily at fair value through profit or loss. This option is exercised instrument by instrument. The Group has exercised this option for almost all of these financial instruments in these consolidated annual accounts. Income and expenses from financial assets at fair value through other comprehensive income are recognised in accordance with the following criteria: - Interest accrued, or when applicable, dividends accrued, in the consolidated income statement. - Exchange differences, in the consolidated income statement for monetary financial assets, and through other
comprehensive income for non-monetary financial assets. - Losses due to impairment of debt securities, or gains due to their subsequent recovery, in the consolidated income
statement, and in the case of equity instruments, through other comprehensive income. - Other changes in value, through other comprehensive income. When a debt instrument at fair value through other comprehensive income is derecognised from the balance sheet, the amount due to the change in value is recognised under the heading “Accumulated other comprehensive income” of consolidated equity is reclassified to the consolidated income statement. However, when an equity instrument at fair value through other comprehensive income is derecognised from the balance sheet, this amount is not reclassified to the consolidated income statement, yet to a reserves account. Financial assets mandatorily at fair value through profit or loss A financial asset is classified in the financial assets portfolio mandatorily at fair value through changes in profit or loss always provided that the Group business model for its management or due to the characteristics of its contractual cash flows it is not appropriate to classify it in one of the portfolios described above. This portfolio is then subdivided into: Financial assets held for trading
Financial assets held for trading are those which have been acquired to be used in the short term, or which form part of a portfolio of financial instruments that are identified and managed together and for which activities have been recently carried out to achieve short-term profits. Derivative instruments which do not comply with the definition of a financial guarantee contract, nor which have been designated as hedging instruments are also considered as financial assets held for trading.

207Statutory information
Non-trading financial assets mandatorily at fair value through profit or loss
The rest of financial assets mandatorily at fair value through profit or loss are classified in this portfolio. Changes in fair value are directly recognised in the consolidated income statement, for instruments which are not derivatives, distinguishing between the part attributable to returns accrued from the instrument which are recognised as “Interest income”, applying the effective interest rate method, or as dividends, depending on their nature, and the rest shall be recognised as “Gains or (-) losses on financial assets and liabilities, net” under the corresponding heading. Financial liabilities held for trading Financial liabilities held for trading include financial liabilities which have been issued to be repurchased in the short term, or which form part of a portfolio of financial instruments that are identified and managed together and for which activities have recently been carried out to achieve short-term profits. It also includes short positions arising from sales of assets acquired under repurchase agreements or loans of securities, as well as derivative instruments that do not comply with the definition of a financial guarantee contract and have not been designated as hedging instruments for accounting purposes. Changes in fair value are directly recognised in the consolidated income statement, for instruments which are not derivatives, distinguishing between the part attributable to returns accrued from the instrument which are recognised as interest, applying the effective interest rate method and the rest shall be recognised as “Gains or (-) losses on financial assets and liabilities, net” under the corresponding heading. Financial liabilities designated at fair value through profit or loss This category includes financial liabilities which do not form part of the financial liabilities held for trading and which have been irrevocably designated in their initial recognition. This designation can only be carried out if it relates to hybrid financial instruments (see section “Hybrid financial instruments in this note) which comply with the conditions for their designation; if by doing so it eliminates or significantly reduces any accounting mismatches in the valuation or the recognition that would arise, otherwise, from the valuation of the assets or liabilities or the gains or losses, with different bases, or if more relevant information is obtained as it is a group of financial instruments which is managed and the returns of which is evaluated based on its fair value in accordance with a risk management or documented investment strategy, and information for such group is provided in accordance with its fair value for key management personnel. Changes in fair value of these instruments are recognised in the consolidated income statement. Financial liabilities at amortised cost Financial liabilities at amortised cost correspond to financial liabilities that cannot be classified under the categories above and are associated with the normal deposit-taking activity of a financial institution, irrespective of their instrumentalisation and their maturity. In particular, this category includes capital having the nature of a financial liability. This item corresponds to the amount of financial instruments issued by the Group which, although they are treated as capital for legal purposes, do not qualify for classification as consolidated equity for accounting purposes. They consist mainly of issued shares that do not carry voting rights on which a dividend is paid based on a fixed or variable rate of interest. Following initial recognition they are valued at amortised cost applying the same criteria as those applicable to financial assets at amortised cost. Interest accrued calculated using the effective interest rate method is recorded in the consolidated income statement. However, if the Group has discretionary powers with regards to the payment of coupons associated with the financial instruments issued and reclassified as financial liabilities, the Group’s accounting policy consists of recognising them by charging them to consolidated reserves. HHybrid financial instruments Hybrid financial instruments are a combination of a non-derivative principal contract and a financial derivative, known as a “implicit derivative”, which cannot be independently transferred, nor does it have a different counterparty, the effect of which is that some of the cash flows of the hybrid instrument vary in a way which is similar to the cash flows of the derivative considered independently. Generally, when the principal contract of a hybrid financial instrument is a financial asset, the implicit derivative is not segregated and the valuation rules are applied to the hybrid financial instrument.
208 Banco Sabadell Annual report 2018
When the principal contract of a hybrid financial instrument is a financial liability, the implicit derivatives of this contract are segregated, and they are treated independently for accounting purposes if the characteristics and the economic risks of the implicit derivative are not closely related to the principal contract; a different financial instrument with the same conditions as those of the implicit derivative would comply with the definition of a derivative instrument; and the hybrid contract is not fully valued in its entirety at its fair value through profit or loss. The fair value of the bank’s financial instruments as at 31 December 2018 and 2017 is included in Note 6. 11.3.4 Impairment of financial assets A financial asset or a credit exposure is considered to be impaired upon the existence of objective evidence that an event has occurred, or that various events have occurred, and their combined effect have given rise to: - For debt instruments, including loans and debt securities, a negative impact on future cash flows estimated at the
time the transaction was formalised, due to the materialisation of credit risk. - In the case that off-balance sheet exposures include credit risk, the flows which are expected to be received are
lower than contractual cash flows, in the event of the drawdown of the payment or the payments expected to be made, in the case of financial guarantees given.
- In the case of investments in joint ventures and associates, in which their carrying values will not be recovered. Debt instruments and off-balance sheet exposures Impairment losses for debt instruments and other off-balance sheet exposures are recognised as an expense in the consolidated income statement in which the impairment is estimated and the recoveries of previously recognised impairment allowances, if applicable, are also recognised in the consolidated income statement for the year in which the impairment is eliminated or reduced. The impairment of financial assets is calculated depending on the type of instrument and other circumstances that could affect it, taking into account the effective guarantees received. For debt instruments valued at amortised cost, the Group recognises adjustment accounts, when provisions for insolvencies are created to cover impairment losses, as well as write-offs against the asset, when the probability of recovery is considered to be low. For debt instruments at fair value through other comprehensive income, impairment losses are recognised in the consolidated income statement, with a counterparty under the heading “Accumulated other comprehensive income” of consolidated equity. Impairment losses for off balance sheet exposures are recognised as liabilities in the consolidated balance sheet as a provision. For risks classified as Stage 3 (see the section “Definition of classification categories” in this note), the recognition in the consolidated income statement of the accrual of interest is carried out applying the effective interest rate on the adjusted amortised cost due to any impairment allowances. To determine impairment losses, the Group monitors borrowers individually, at least those who are significant borrowers, and collectively, for groups of financial assets with similar credit risk characteristics indicative of the capacity of borrowers to satisfy their outstanding payments. When a specific instrument cannot be included in any group of assets with similar risk characteristics, it is analysed on a solely individual basis to determine whether it is impaired and, if so, to estimate the impairment losses. The Group has policies, methods and procedures in place to estimate losses that may arise as a result of its credit risks, both due to insolvency attributed to counterparties and due to country risk. These policies, methods and procedures are applied when granting, assessing and formalising off-balance sheet debt instruments and exposures, and when identifying their possible impairment and, where applicable, when calculating the necessary amounts to cover such estimated losses. Accounting classification of transactions on the basis of credit risk attributable to insolvency The Group has set forth criteria that allow borrowers showing weaknesses or objective evidence of impairment to be identified and classified in line with their credit risk. The following sections lay out the classification principles and methodologies used by the Group.
209Statutory information
Definition of classification categories Credit exposures, as well as off-balance sheet exposures are classified, based on credit risk, into the following phases or stages: - Stage 1: operations which do not meet the requirements to be classified into other categories. - Stage 2: this category is comprised of all operations which, without complying with criteria to be individually
classified as stage 3 or write-off, show significant increases in credit risk from their initial recognition. Transactions with amounts that are more than 30 days past-due are included in this category. Refinanced and restructured operations classified in this category shall be classified into a lower risk category when the requirements established for such classification to be granted have been met. Operations which have been classified as underperforming (stage 2), due to significant increases in risk or due to amounts more than 30 days past-due, are reclassified to the performing category (Stage 1) once they have exceeded a test period of 6 months, based on the probability of entering into the performing category.
- Stage 3: comprised of debt instruments, whether they have matured or not, in which, without meeting the
circumstances to classify them as write-off, there are reasonable doubts about their full repayment (principal and interests) by the holder, as well as off-balance sheet exposures, whose payment by the Group is likely, but whose recovery is doubtful.
As a result of borrower arrears: transactions any part of whose principal, interest or contractually agreed
expenses is, in general, more than 90 days past-due, (although the specific characteristics of the operations originated or purchased with credit impairment are taken into account), unless they should be classed as write-offs. This category also includes guarantees given if the guaranteed party has fallen into in arrears in the guaranteed transaction. This category also includes the amounts of all of a borrower’s transactions when such transactions have amounts which are generally, as previously indicated, more than 90 days past-due, and exceed 20% of the amounts pending collection.
For reasons other than borrower arrears: transactions which are not classifiable as write-off or stage 3 due to
borrower arrears, but for which there are reasonable doubts about obtaining the estimated cash flows of the transaction, as well off-balance sheet exposures, not classified as stage 3 due to borrower arrears, whose payment by the Group is likely and whose recovery is doubtful.
The accounting definition of stage 3 is aligned with the definition used in the management of credit risk carried out by the Group. Furthermore, it is aligned with the regulatory definition of default, with the exception that in regulatory terms, default is considered to be all of a holder's transactions in the business segment, when amounts are more than 90 days past-due, whilst the accounting definition of default considers all of a holder’s transactions to be stage 3 when the amounts which are more than 90 days past due exceed 20% of the amounts pending collection.
- Write-off risk:
The Group derecognises from the consolidated balance sheet transactions for which the possibility of full or partial recovery is considered remote after an individual assessment. This category includes risks of customers who are in bankruptcy proceedings filing for liquidation and transactions classified as stage 3 due to arrears, with payments over four years past-due, or less than four years, when the amount not covered with effective guarantees has been maintained with 100% credit risk coverage for more than two years, except for balances which have sufficient efficient guarantees. It also includes transactions which, despite not being in any of the previous situations, are undergoing a manifest and irreversible deterioration of their solvency. The remaining amount of operations with amounts which have been written off (“partial write-off”), whether due to the expiry of Group rights (“definitive loss”) - due to motives such as remissions or reductions-or because they are considered irrecoverable, without the extinction of the rights (“partial write-offs”) they will be fully classified in the corresponding category based on credit risk.
In the situations described above, the Group has derecognised from the consolidated balance sheet any amount recorded as write-off, together with its provision, without prejudice to any actions that may be taken to collect payment, until no more rights to collect payment exist, whether due to prescription, discharged loans or any other reasons.

210 Banco Sabadell Annual report 2018
PPurchased or originated credit-impaired transactions Estimated credit loss in the purchase or origination of these assets will not form part of the coverage or the gross book value in the initial recognition. When a transaction is purchased or originates with credit deterioration, the coverage will be equal to the cumulative amount of the changes expected in the life of transactions subsequent to initial recognition and interest income of these assets will be calculating by applying the effective interest rate adjusted for credit quality to the amortised cost of the financial asset. Classification criteria for transactions The Group applies diverse criteria to classify borrowers and operations into different categories based on their credit risk. These categories include: o Automatic criteria;
o Specific criteria for refinancing; and
o Criteria based on indicators (triggers).
The automatic factors and specific criteria for refinancing constitute the classification and cure algorithm, and are applied to the entire portfolio. Furthermore, with the objective of enabling the early identification of the significant increase in risk, or the weaknesses and the impairment of transactions, the Group establishes triggers based on the number of days of non-payment, on refinancing and restructuring indicators, and in bankruptcy indicators and significant risk increase, amongst others, differentiating between significant and non-significant borrowers. In particular, non-significant borrowers who, once the automatic classification algorithm has been applied, do not meet any of the criteria based on which they would be classified as stage 2 or 3 are evaluated using indicators which aim to identify significant increases in risk or signs of weakness which could lead to the incurrence of losses exceeding those in other similar transactions classified as stage 1. Transactions classified as stage 3 are reclassified as stage 1 or 2 when, as a consequence of the total or partial payment of unpaid risks in the case of transactions classed as stage 3 due to default, or due to having exceeded the cure period in the case of operations classified as stage 3 for reasons other than default, eliminating the causes which motivated their classification into stage 3, unless other reasons make it advisable to maintain them in this category. As a result of the application of these criteria, the Group classifies its borrowers as stage 2 or 3 or maintains them in stage 1. Individual risk The Group has established a threshold in terms of exposure to classify borrowers as significant, based on the exposure at default parameter (draw down risk and off-balance sheet exposures). Furthermore, borrower’s exposures corresponding to the principal risk groups are considered individually, as well as those borrowers who are not associated with a homogenous risk group for which, subsequently, their classification and coverage cannot be estimated collectively. The following table shows the thresholds established by the Group to differentiate between borrowers whose classification is determined individually from those which are determined collectively.
211Statutory information
For significant borrowers, a system of triggers or indicators has been established which allows any significant increase in risk or impairment weaknesses to be identified. The system of triggers covers signs of impairment or weakness by using the definition of: o Specific triggers that signal when there has been a significant increase in risk; o Specific triggers that signal when there are signs of impairment; o Triggers that allow an increase in credit risk and signs of impairment to be detected, on the basis of the various
early warning thresholds. A team of expert risk analysts will individually analyse borrowers that have activated triggers to determine whether there has been a significant increase in credit risk or whether there is any objective evidence of impairment. If there is evidence of impairment, they determine whether the event or events that have given rise to the loss have an impact on estimated future cash flows of the financial asset or its group. The indicators system for significant borrowers is automated and takes into account the particular characteristics of segments that perform differently to the loan portfolio. The triggers system seeks to identify the following aspects: - Significant financial difficulties of the issuer or obligor, indicative of a significant increase in risk or an impairment
event insofar as their classification as being significant limits the ability of the issuer or obligor to honour their financial obligations in the usual manner.
- In this regard, to identify a significant increase in risk or impairment, it is necessary to consider variables which are
indicative of a poor economic and financial situation as well as variables that are the potential cause or which anticipate this poor economic and financial situation.
For example:
Stage 2 triggers:
o Adverse changes in the financial situation, such as a significant increase of debt levels, significant declines in the business figures or a significant tightening of operating margins.
o Adverse changes in the economy or market indicators, such as a significant decline in share prices or a
reduction in the price of debt issues. In the case of sovereign debt issues, price spreads compared to the German bond (risk premium) are also analysed.
o Significant decline, real or expected, or the internal credit rating of the transaction or the holder, or a reduction in the performance scoring attributed to the internal monitoring of credit risk.
o For transactions with collateral, deterioration of the relationship between the amount and the value of the collateral, due to an unfavourable evolution of the value of the guarantee, or the maintenance or increase of the amount pending amortisation due to the payment conditions established.
o Significant increase in credit risk of other operations by the same holder, or entities related to the risk group of the holder.

212 Banco Sabadell Annual report 2018
Stage 3 triggers:
o Signs of impairment of other operations by the same holder, or entities related to the risk group of the holder.
o Negative EBITDA, significant decrease in EBITDA or business figures, or in general, of current holder
cashflows.
o Increase in the holder’s leverage ratios.
o Negative equity or decrease as a consequence of equity losses of the holder, by at least 50% in the last year.
o Internal or external credit rating which shows that the holder is in a situation of default.
o Matured commitments by the holder for significant amounts payable to public bodies.
o For transactions secured with collateral, significant impairment of the value of the collateral received.
o Remissions or write-offs for the same holder or entities related to the Group in the last 2 years.
o Temporary suspension of the listing of the holder’s shares.
- Non-compliance with contractual clauses, defaults or delays in the payment of principal or interests: in addition to defaults longer than 90 days, which form part of the automatic classification algorithm, defaults and delays of less than 90 days are also identified, as these can be a sign of impairment or significant risk increase. Breaches of covenants and non-payments declared in other credit institutions in the financial system are also considered in the analysis.
- Borrowers are granted concessions or benefits due to their financial difficulties that would not otherwise be
considered: the act of granting refinancing to a debtor in financial difficulties may prevent or delay their failure to comply with their obligations whilst at the same time preventing or delaying the recognition of the impairment associated with the financial asset linked to that debtor.
- Probability of the borrower becoming insolvent: in cases in which there is a high probability of borrowers going
bankrupt or entering restructuring proceedings, the solvency of the issuers and obligors is ostensibly affected, and could give rise to a loss event depending on the impact on estimated future cash flows pending collection.
- The disappearance of an active market for the financial asset due to financial difficulties: the discontinuance of
financial assets issued by the obligor or issuer could give rise to a complicated economic and financial situation and therefore a reduced capacity to honour their payment obligations.
The Group carries out an annual review of the reasonableness of the thresholds and the individual analysis coverage achieved through their application.

213Statutory information
Collective risk For borrowers who have been classed below the materiality threshold and who, in addition, have not been classified as stage 2 or 3 by the automatic classification algorithm, the Group has established a process to identify transactions which exhibit a significant increase in risk compared to the time of granting the transaction, which could result in losses higher than losses on other similar transactions classified as stage 1. For borrower transactions which are evaluated under collective risk, the Group uses a statistical model which allows the temporary structure of PD, and therefore, the residual lifetime PD of a contract to be obtained, based on different characteristics:
• Systemic: characterised by common macroeconomic conditions for all exposures.
• Cross-cutting: characterised by common aspects which are stable over time, in a pool of transactions such as the common effect of credit policies valid at the time of concession, or the channel of concession.
• Idiosyncratic: characterised by specific aspects of each transaction or borrower. Under this specification, the Group is able to measure the residual lifetime PD at each moment of the transaction, under the conditions at the time of concession, or under the conditions in force at that particular moment in time. In this manner, actual lifetime PD may fluctuate with regards to PD at the time of concession, due to changes in the economic environment, or in the idiosyncratic characteristics of the transaction or of the borrower. Based on the residual lifetime PD comparison under the actual systemic and idiosyncratic conditions at the time of the concession, an algorithm has been created which makes it possible to identify when a significant increase in risk has arisen, taking into account the historic performance of customers, and therefore, when a transaction should be classified as stage 2. This algorithm seeks to identify populations whose rate of default is statistically different. This threshold is not unique and it has a non-linear relationship with PD, in a way that the increase required in PDs with low likelihood must be relatively higher than the increase required for PDs with high likelihood in order to identify a significant increase in PD. The level required is variable and it is aligned with the criteria which has been published in other regulatory specifications (EBA “2018 EU-Wide Stress Test – Methodological Note.” January 2018 paragraph 51). In the case of retail exposures, in which the valuation of the transaction is carried out at contract level, the thresholds are calibrated and applied to this level. Nonetheless, in the case of companies, in which the ratings are carried out at borrower level, the thresholds are calibrated to ensure that they correspond to the borrower's PD and to the period between concession and maturity, as it is applied at contract level. RRefinancing and restructuring operations Credit risk management policies and procedures applied by the Group guarantee a detailed monitoring of borrowers, and demonstrate the need to make provisions when there is evidence of impairment to their solvency (see Note 4). For this purpose, the Group generates the insolvency provisions for transactions in which the borrower’s circumstances requires them, prior to formalising the restructuring/refinancing operations, which should be understood as follows: - Refinancing operation: this is granted or used for economic or legal reasons associated with current or foreseeable
financial difficulties of the borrower in order to cancel one or more operations granted by the bank, or to bring outstanding payments either fully or partly up to date, to enable borrowers to pay their debt (principal and interest) when they are unable, or will predictably soon be unable, to honour their payment obligations in due time and form.
- Restructuring transactions: financial terms and conditions of a transaction are amended for economic or legal
reasons associated with current or foreseeable financial difficulties of the borrower in order to facilitate the repayment of their debt (principal and interest) when they are unable, or will predictably soon be unable, to meet such terms and conditions in due time and form, even when this amendment is already envisaged in the contract. In any case, restructured transactions are those in which the terms and conditions are amended to extend the period to maturity, to amend the repayment schedule to reduce the amounts of short-term repayments or to reduce the repayment frequency, or to establish or extend the grace period for the repayment of principal, interest, or both, unless it can be proven that the terms and conditions are being amended for reasons other than borrowers’ financial difficulties and which are equivalent to the terms that would be applied by other institutions in the market for similar risks.
The formalisation of amendments to contractual terms and conditions does not entail any significant additional deterioration of the borrowers’ circumstances that will require the creation of additional provisions.

214 Banco Sabadell Annual report 2018
If a transaction is classified under a specific risk category, the refinancing operation does not entail any automatic improvement in its risk classification. For refinancing operations, the algorithm establishes its initial classification based on the characteristics of the operations, mainly that the borrower encounters financial difficulties (for example, an unsuitable business plan) the fulfilment of certain clauses as well as long grace periods, or which include amounts which have been written off as they are considered to be non-revocable. Subsequently, the algorithm modifies the initial classification based on the fixed cure periods. A reclassification into a lower risk category shall only be considered if there is a quantitative or qualitative increase in efficient guarantees backing the transaction and if there has been a significant improvement in the continuous recovery of the debt over time, therefore the act of refinancing does not in itself produce any immediate improvements. Refinancing, refinanced and restructured transactions remain in the stage 2 category during the test period until all of the following requirements have been fulfilled:
That upon the completion of the review of the equity and financial position of the borrower, it is concluded that they may face financial difficulties.
That a minimum period of 2 years has elapsed from the date of the formalisation of the restructuring or refinancing transaction, or if later, from the date of reclassification from the stage 3 risk category.
That the holder has mainly paid the amounts accruing from the principal and interest from the date of the formalisation of the restructuring or refinancing transaction, or if later, from the date of reclassification from the stage 3 risk category.
That the holder does not have any other transactions with amounts which are more than 30 days past-due from the end of the test period.
On the other hand, refinancing, refinanced or restructured transactions remain in the stage 3 category until the general criteria which determine the reclassification of the transactions outside of stage 3 have been verified, and in particular, the following requirements:
That the period of one year has elapsed from the date of the refinancing or restructuring.
That the holder has paid the amounts accruing from the principal and interests.
That the holder does not have any other transaction with amounts which are more than ninety days past due as at the date of the reclassification to stage 2 risk of the refinancing, refinanced or restructured transaction.
With regard to refinanced/restructured loans classified as stage 2, different types of transactions are specifically assessed to reclassify them, if applicable, into a higher risk category using the same categories described in the previous section (i.e. in stage 3 due to counterparty arrears, when payments are, in general, over 90 days past-due, or for reasons other than borrower arrears, when there are reasonable doubts concerning their recoverability). Estimated losses due to credit impairment that are consistent with the accounting classification of the risk are provisioned for as soon as they are identified. The methodology used to estimate losses for these portfolios is generally similar to that used for other financial assets at amortised cost, but it is considered that, a priori, a transaction that has had to be restructured to enable payment obligations to be satisfied should have a higher loss estimate than a transaction that has never suffered default (unless there are sufficient additional effective guarantees to justify otherwise). Determination of allowances The Group applies the following parameters when calculating allowances for credit risk losses. • EAD (Exposure at Default): the entity defines exposure at default as the amount of exposure which is anticipated
at the moment of default. As an exposure metric for allowances and provisions, the Group uses current drawn down balances, and the estimation of the amounts that it expects to disburse in the case of entry into default for off-balance sheet exposures, through the application of a Credit Conversion Factor (CCF).

215Statutory information
• PD (Probabililty of Default): estimation of the probability of a borrower’s default in a specific time horizon.
The Group has tools which support credit risk management in order to predict the probability of default of each borrower, which covers almost all credit activity. In this context, the Group reviews the quality and stability of the rating tools which are currently in use on an annual basis. The review process includes the definition of the sample used and the methodology to be applied for the monitoring of rating models. The tools used to assess the profitability of default of a debtor are comprised of behavioural scorings for the risk monitoring of natural persons and company ratings:
o Rating: in general terms, credit risks contracted with companies are classified through a rating system based
on the internal estimate of the probability of default (PD). Comprised of factors which predict default in one year, designed for different segments. The rating model is reviewed annually based on the analysis of real default trends. A predicted default rate is assigned to each credit rating level, which also allows a homogeneous comparison to be made of other segments and credit ratings from external credit rating agencies using a master ratings scale. Ratings are used within risk management. Most notably through being a key input in the automatic tool that determines authorization levels, monitoring of risk and risk-based pricing.
o Scoring: in general, credit risks undertaken with individual customers are rated using scoring systems, which are in turn based on a quantitative model of historic statistical data, where the relevant predictive factors are identified. In geographies in which scoring takes place, the latter is divided into two types:
o Reactive scoring: this is used to evaluate applications for consumer loans, mortgage loans and credit
cards. Once all of the data relating to the transaction has been entered, the system calculates a result based on the estimated debt capacity, financial profile and, if applicable, the profile of pledged assets. The result of the rating is integrated into the risk management through the automatic tool.
o Behavioural scoring: the system automatically classifies customers based on information regarding their
activity and on each product which they have acquired. These scorings are mainly used in: the granting of transactions, setting (authorised) overdraft limits, advertising campaigns and modulation of the complaints process in the initial stage.
If no scoring system exists, it is replaced with individual assessments supplemented with policies.
• LGD (Loss Given Default): estimation of the expected loss for transactions which are in default. This loss also takes into account outstanding debt, late payment interest and expenses relating to the recovery process. Additionally, for each one of the flows (outstanding balances and recoveries) an adjustment is applied to consider the temporary value of the money).
• Effective Interest Rate (EIR): rate which exactly discounts estimated future cash payments or receipts through the expected life of the financial assets or liability with the carrying amount of the financial asset or with the amortised cost of the financial liability.
• Multiple scenarios: in order to estimate expected losses, the Group applies different scenarios to include the effect of the non-linearity of losses. To do so, the provisions required are estimated against different scenarios for which a probability of likelihood is established. Specifically, the Group has considered three macroeconomic scenarios: a central scenario, an adverse scenario and a favourable scenario, which have been defined at Group level, whereby the likelihood of such scenarios occurring is 65%, 20% and 15%, respectively. To carry out the projections of these scenarios, 5-year time horizons are considered. The principle variables considered are the evolution of GDP, the unemployment rate and housing prices. o Central scenario: The (geo) political situation is maintained as one of the main pillars of the scenario, increasing its influence as monetary stimuli are withdrawn and the economic policy becomes more interventionist. This scenario is not exempt from international conflicts, and legal security is affected. Furthermore, governments prioritise growth, applying expansionary fiscal and pro-cyclical policies for macroeconomic stability. The growth environment, alongside protectionism, are conducive for inflation to reach higher levels, and global funding conditions are tightened.
216 Banco Sabadell Annual report 2018
In this scenario, it is considered that the United Kingdom and the European Union reach an agreement to initiate a transition period after Brexit, and that China and Europe are able to maintain healthy economic growth, that Italy recovers its fiscal tightening and that the tightening of financial conditions takes place in an orderly manner. Long term public debt returns are driven upwards, and the ECB monetary policy gains importance. Trump's mercantilist policy and persistent deficits in the United States weigh the dollar down. The Spanish economy shows lower growth than in the last few years, although it shall maintain a favourable evolution compared to the Euro Zone. Domestic demand shall continue to remain the principal driver of economic activity. o Adverse scenario: Characterised by an increase in inflation in developed countries, as a result of: - Economic overheating in the United States and output gaps which are lower than those initially estimated
in the Euro Zone and in the United Kingdom. - Reduced globalisation and the application of populist and interventionist policies. - Higher commodities prices ahead of demand from China and other economies. - Higher petrol prices due to OPEC policies and certain premiums due to geopolitical risks. Central banks focus their attention on tackling high inflation by hiking the interest rate at a faster rate than in the central scenario. Higher inflation, interest rate hikes and the term premium lead to a very significant rebound in long term public debt yields and economic activity eventually suffers. In currency markets, the dollar appreciates, benefitting from international risk aversion. For the Spanish economy, the cost of the significant increase in interest rates hinders fiscal consolidation and the stabilisation of public debt. Furthermore, the increase in oil prices leads to an increase in the economy's energy bill, which entails a loss of competitivity, thus threatening current/account surpluses. o Favourable scenario: This scenario differs from the central scenario primarily due to four aspects: - Productivity gains facilitate improved economic growth without generating imbalances and with a similar
rate of inflation. - The political and geopolitical situation improve significantly. - Increased dynamism in international trade. - Global funding conditions are maintained in spite of interest rate increases on behalf of central banks,
and the upturn in long term interest rates. In the political environment, Europe makes progress in the integration process and adequate progress is achieved in Brexit negotiations. In the United States, institutions prevent Trump from making progress in his protectionist policies programme. Productivity improvements enable sustainable growth in the absence of inflationary pressure, which facilitates soft increases in interest rates and long term public debt interest rates show an upturn. This environment generates a positive impact on the financial sector and public accounts, translating into multiple sovereign debt rating upgrades in the European periphery. Productivity gains in the Spanish economy enable potential growth to increase, in line with the growth rate prior to the crisis. The favourable economic environment materialises with a stable political environment, which enables structural reforms to be achieved. Furthermore, the reduction of public debt is maintained, and progress is made in the correction of the public defecit. Rating agencies carry out credit rating upgrades.
Based on the foregoing parameters, the Group applies the criteria described below to calculate allowances and provisions for credit risk losses.

217Statutory information
The amount of coverage for impairment losses is calculated based on whether a significant increase in credit risk has materialised or not, compared to the initial recognition of the transaction, and whether a breach has arisen or not. In this way, coverage for impairment losses in the transactions is equal to: - Expected credit losses in twelve months, when the risk of a breach of the transaction has not significantly
increased from its initial recognition (assets classified as stage 1). - Expected credit losses during the lifecycle of the transaction, if the risk of the materialisation of a breach of the
transaction has significantly increased from its initial recognition (assets classified as stage 2). - Expected credit losses, when a breach of the transaction has materialised (assets classified as stage 3). Expected losses in twelve months are defined as:
Where:
is the 12 month exposure to default, the probability of default in 12 months and estimated losses when a risk is at default. Expected lifetime losses are defined as:
Where:
is the exposure at default for each year, taking into account entry into default as well as the amortisation (agreed and/or anticipated), the probability of entering into default in twelve months for each year, the estimated loss once a risk is at default for each year, and EIR, the effective interest rate for each transaction. During this estimation process, on one hand, calculations are made of the amount required to hedge credit risk attributable to the borrower and on the other hand, credit risk attributable to country risk is also calculated. The Group includes forward-looking information when calculating expected credit losses and determining whether there has been a significant increase in credit risk. Simulation models have been used for this scenario. The Group uses estimates of the prepayment rates for different products and segments based on historical data observed (historical data from 2000 onwards). These prepayment rates are used to determine the lifetime expected loss of exposures classified as stage 2. The agreed amortisation schedule for each transaction is used. Subsequently, these expected cash flow losses are updated by applying the effective interest rate of the instrument (if its interest rate is fixed) or by applying the effective contractual interest rate on the date on which they are updated (if the interest rate is variable). Similarly, the amount of effective guarantees received is also taken into account. The following sections describe the different methodologies applied by the Group to determine impairment loss coverage. Individual provisioning estimations
The following must be estimated individually: - Provisions for transactions classified as stage 2 and 3 of borrowers individually considered to be significant. - Where applicable, the transactions or borrowers whose characteristics do not allow a collective calculation of
impairment to be carried out. - Provisions for transactions identified as without negligible risk classified as stage 3. The Group has developed a methodology to estimate these provisions and allowances, calculating the difference between the gross carrying amount of the operation and the present value of the estimated cash flows it expects to collect, discounted using the effective interest rate. To do, effective guarantees received are taken into account (see the “Guarantees” section of this note).

218 Banco Sabadell Annual report 2018
Three methods are established to calculate the recoverable value of assets which are assessed individually: - Discounted cash flow method: debtors who are estimated to be able to generate future cash flows through their
own business activity, thereby allowing them, through the economic and financial structure of the company, to repay the debt owed in full or in part. This involves the estimation of cash flows generated by the borrower through their business activity.
- Method involving the recovery of collateral: debtors who do not have the capacity to generate cash flows through
their own business activities, who are then forced to liquidate assets in order to honour their payment obligations. Involves the estimation of cash flows based on the enforcement of the guarantees.
- Combined method: debtors who are estimated to be able to generate future cash flows and also have non-core
assets. These flows can be supplemented with the potential sale of non-functional assets, insofar as they are not required for the performance of their activity, and subsequently, for the generation of future cash flows.
Collective allowance estimations Exposures which are not assessed using individual allowance estimates are subject to collective allowance estimates.
When carrying out the calculation of collective impairment, the Group, in accordance with that laid out in IFRS 9, takes the following aspects into consideration: - The impairment estimation process takes all credit exposures into account. The Group recognises an impairment
loss equal to the best estimation available from internal models, taking into account all of the relevant information which the Group holds on the current conditions at the end of the period which is being reported on. For certain types of exposures, including sovereign risk for Public Administrations in European Union countries and countries classified as Group 1 for country-risk purposes, the Group does not use internal models. These exposures are considered to be without negligible risk, due to estimating, based on the information available at the date of the formulation of the consolidated annual accounts, that the impairment coverage that these exposures could require is not as significant, insofar as that they are not classified as stage 3.
- For the purpose of carrying out a collective evaluation of impairment, financial assets are pooled together based on
the similarity of their characteristics with regard to credit risk, for the purpose of estimating differentiated risk parameters for each group of similar assets. This segmentation differs for each estimated risk parameter. In the case of PDs, the pooling is carried out through a statistical technique which determines which PD ranges have an observed default rate which is statistically different. With regards to LGD, the pooling is principally carried out by guarantee type and borrower segments. In this manner, the historical loss experience observed for a homogeneous group of assets is taken into account, once it has been adjusted to the current economic situation, and the estimation of the scenarios considered, which are representative of the expected credit losses in this segment. This segmentation discriminates against risk, and it is aligned with risk management. It is used in the Group’s internal models, as well as by internal control units for different purposes, and it is also used by the supervisor. Additionally, it is subject to recurring back-testing, and the estimates are regularly updated and reviewed in order to ensure that all of the information available is included.
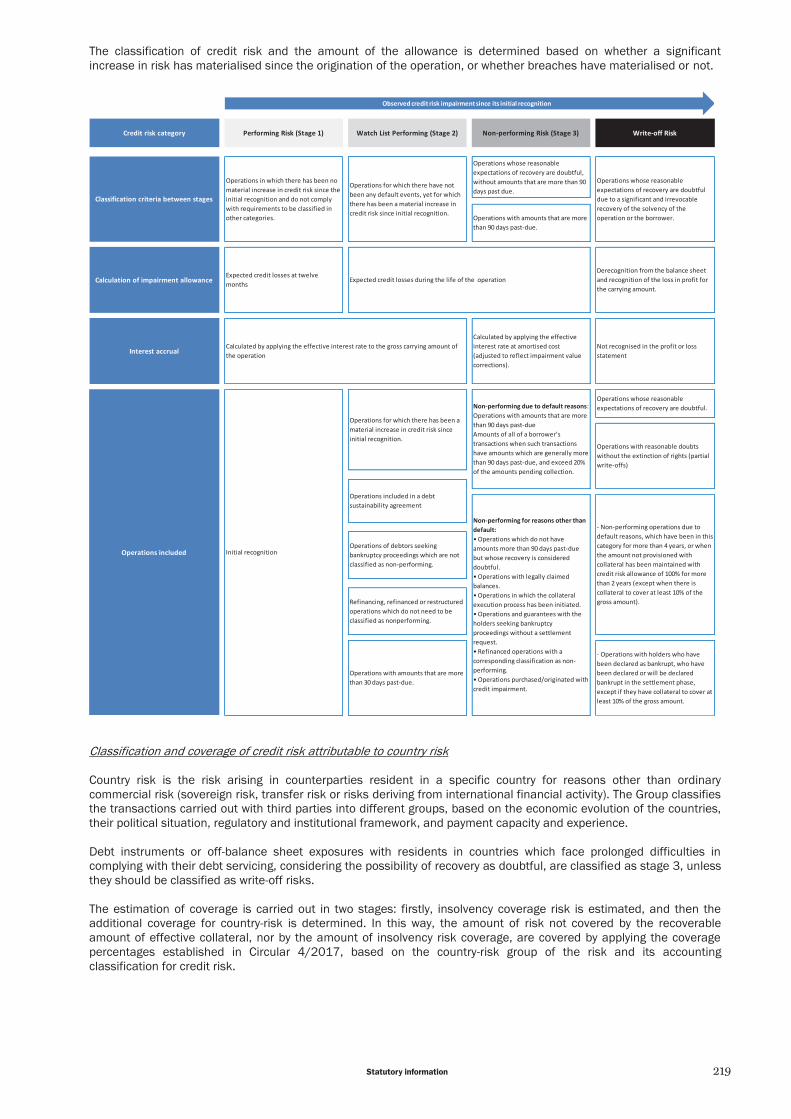
219Statutory information
The classification of credit risk and the amount of the allowance is determined based on whether a significant increase in risk has materialised since the origination of the operation, or whether breaches have materialised or not.
Classification and coverage of credit risk attributable to country risk Country risk is the risk arising in counterparties resident in a specific country for reasons other than ordinary commercial risk (sovereign risk, transfer risk or risks deriving from international financial activity). The Group classifies the transactions carried out with third parties into different groups, based on the economic evolution of the countries, their political situation, regulatory and institutional framework, and payment capacity and experience. Debt instruments or off-balance sheet exposures with residents in countries which face prolonged difficulties in complying with their debt servicing, considering the possibility of recovery as doubtful, are classified as stage 3, unless they should be classified as write-off risks. The estimation of coverage is carried out in two stages: firstly, insolvency coverage risk is estimated, and then the additional coverage for country-risk is determined. In this way, the amount of risk not covered by the recoverable amount of effective collateral, nor by the amount of insolvency risk coverage, are covered by applying the coverage percentages established in Circular 4/2017, based on the country-risk group of the risk and its accounting classification for credit risk.
Credit risk category Performing Risk (Stage 1) Watch List Performing (Stage 2) Non-performing Risk (Stage 3) Write-off Risk
Operations in which there has been no material increase in credit risk since the initial recognition and do not comply with requirements to be classified in other categories.
Operations for which there have not been any default events, yet for which there has been a material increase in credit risk since initial recognition.
Operations whose reasonable expectations of recovery are doubtful due to a significant and irrevocable recovery of the solvency of the operation or the borrower.
Initial recognition
Operations with reasonable doubts without the extinction of rights (partial write-offs)
Classification criteria between stages
Operations whose reasonable expectations of recovery are doubtful, without amounts that are more than 90 days past due.
Operations with amounts that are more than 90 days past-due.
Calculation of impairment allowanceExpected credit losses at twelve months
Expected credit losses during the life of the operation
Operations included
Derecognition from the balance sheet and recognition of the loss in profit for the carrying amount.
Interest accrualCalculated by applying the effective interest rate to the gross carrying amount of the operation
Calculated by applying the effective interest rate at amortised cost (adjusted to reflect impairment value corrections).
Not recognised in the profit or loss statement
Operations for which there has been a material increase in credit risk since initial recognition.
Operations included in a debt sustainability agreement
Non-performing due to default reasons: Operations with amounts that are more than 90 days past-due Amounts of all of a borrower’s transactions when such transactions have amounts which are generally more than 90 days past-due, and exceed 20% of the amounts pending collection.
Non-performing for reasons other than default:• Operations which do not have amounts more than 90 days past-due but whose recovery is considered doubtful.• Operations with legally claimed balances.• Operations in which the collateral execution process has been initiated.• Operations and guarantees with the holders seeking bankruptcy proceedings without a settlement request.• Refinanced operations with a corresponding classification as non-performing.• Operations purchased/originated with credit impairment.
Operations whose reasonable expectations of recovery are doubtful.
Operations of debtors seeking bankruptcy proceedings which are not classified as non-performing.
Refinancing, refinanced or restructured operations which do not need to be classified as nonperforming.
Operations with amounts that are more than 30 days past-due.
- Operations with holders who have been declared as bankrupt, who have been declared or will be declared bankrupt in the settlement phase, except if they have collateral to cover at least 10% of the gross amount.
- Non-performing operations due to default reasons, which have been in this category for more than 4 years, or when the amount not provisioned with collateral has been maintained with credit risk allowance of 100% for more than 2 years (except when there is collateral to cover at least 10% of the gross amount).
Observed credit risk impairment since its initial recognition
220 Banco Sabadell Annual report 2018
The provisioning levels for this item are not significant in terms of the impairment coverage generated by the Group. Guarantees Effective guarantees are collateral and personal guarantees proven by the bank to be a valid means of mitigating credit risk. Under no circumstances will guarantees whose effectiveness significantly depends on the credit quality of the debtor, or where applicable, the economic group of which the debtor forms part, be accepted as effective guarantees. Based on the foregoing, the following types of guarantees can be considered as effective: - Real estate guarantees applied as real estate mortgages, provided that they are first mortgages.
Completed buildings and parts thereof:
o Housing units.
o Offices, commercial premises and multi-purpose industrial buildings.
o Other buildings, such as non-multi-purpose industrial buildings and hotels.
Urban land and regulated building land.
Other real estate.
- Collateral in the form of pledged financial instruments:
Cash deposits.
Equity instruments in listed entities and debt securities issued by creditworthy issuers.
- Other collateral:
Personal property received as collateral. Subsequent mortgages of properties.
- Personal guarantees such that direct and joint liability to the customer falls to the new guarantors, whose solvency
is sufficiently verified to ensure the full redemption of the transaction under the terms set forth.
The Group has collateral evaluation criteria for assets located in Spain, aligned with current regulations. In particular, the Group applies selection and contracting criteria of appraisers that are geared towards assuring the independence of the appraisers, and the quality of the appraisals. For this purpose, all of the appraisal companies are registered in the Bank of Spain Special Registry, and the evaluations are carried out in accordance with the criteria established in Ministerial Order ECO/805/2003 on rules for the appraisal of real estate and of certain rights for financial purposes.

221Statutory information
Real estate guarantees for credit transactions and property are valued at their origination or registration date, in the case of the latter, whether it is via the purchase, foreclosure or payment in kind and when the asset suffers a significant reduction in value. Additionally, minimum updating criteria are applied, which guarantees an annual update in the case of impaired assets (assets classified as stages 2 or 3 and foreclosed properties or received in lieu of debt), or every three years for large debts classified as stage 1 with no signs of latent risk. Statistical approaches are only used to update valuations for the assets described above when they have reduced exposure and risk, although a full ECO valuation must be carried out at least every three years. For assets located in other EU countries, the valuation is carried out in accordance with that set forth in Royal Decree 716/2009 of 24 April, and in the rest of the world, by companies and/or experts with recognised expertise in the country. To estimate credit loss allowances, the Group has developed internal methodologies, in order to determine the recoverable amount of real estate guarantees, which use the appraisal value as a starting point. This appraisal value is adjusted considering the time required to enforce such guarantees, price trends and the Group’s capacity and experience in realising the value of similar properties in terms of prices and terms, as well as the costs of enforcement, maintenance and sale. Backtesting of credit risk provisions and real estate asset impairment The Group has established backtesting methods between estimated losses and losses incurred. Thanks to this comparison, the Group establishes amendments to its internal methodologies when the regular comparison, through backtesting, reveals significant differences between estimated losses and losses incurred. The backtests carried out show that the classification and coverage of credit loss risk are adequate, given the credit risk profile of the portfolio. Investments in joint ventures and associates The Group recognises impairment allowances joint ventures and associates, always provided that there is objective evidence that the book value of an investment is not recoverable. There is objective evidence that equity instruments have become impaired when, subsequent to their initial recognition, an event occurs, or various events occur, and their combined effect proves that the book value is not recoverable. The Group considers, amongst others, the following indicators to determine whether there is evidence of impairment. - Significant financial difficulties.
- The disappearance of an active market for the financial asset due to financial difficulties.
- Significant changes in profit or loss, compared to the data included in budgets, business plans or objectives.
- Significant changes in the market in the issuer's equity instruments, or its products, or potential products.
- Significant changes in the global economy or in the economy in the environment in which the issuer operates.
- Significant changes in the technology or legal environment in which the issuer operates in. The amount of the impairment allowances of interests in associated entities included under the heading of “Investments in joint ventures and associates” is estimated by comparing their recoverable amount with their book value. The latter shall be the higher of its fair value, less selling costs, and its value in use.

222 Banco Sabadell Annual report 2018
The Group determines the value in use of each interest based on its net asset value, or based on estimates of their profit/loss, pooling them into activity sectors (real estate, renewable energy, industrial, financial, etc.) and evaluating the macroeconomic factors specific to that sector that could affect the performance of such companies. Specifically, insurance investees are assessed by applying the market consistent embedded value methodology, companies related to real estate are assessed based on their net asset value, and financial investees based on multiples of their book value and/or the profit from other comparable listed companies. Losses due to impairment are recognised in the consolidated income statement for the year in which they took place and subsequent recoveries are recognised in the consolidated income statement for the year in which they were recovered. 11.3.5 Hedging operations The Group uses financial derivatives to (i) to supply them to customers requesting such derivatives, (ii) manage risks associated with the Group’s proprietary positions (hedging derivatives), and (iii) realise gains as a result of price fluctuations. The Group uses both derivatives traded on organised markets and those traded bilaterally with counterparties on over-the-counter (OTC) markets. Financial derivatives that do not qualify for designation as hedging instruments are classified as derivatives held for trading. To be designated as a hedging instrument, a financial derivative must meet the following criteria:
- It must cover exposure to changes in the value of assets and liabilities caused by interest rate and/or exchange rate fluctuations (fair value hedge), exposure to changes in the estimated cash flows originating in financial assets and liabilities, commitments and highly probable forecast transactions (cash flow hedge), or the exposure associated with net investments in foreign operations (hedge of net investments in foreign operations).
- The derivative must effectively eliminate a risk that is inherent in the hedged item or position over the entire
expected term of the hedge, in terms of both prospective and retrospective efficiency. To this end, the Group analyses whether, at the time the hedge is arranged, it is expected to operate, under business-as-usual conditions, with a high degree of effectiveness and verifies, throughout the life of the hedge and using effectiveness tests, that the effectiveness of the hedge varies between 80% and 125% with respect to the hedged item.
- Suitable documentation must be available to show that the financial derivative has been acquired specifically to
provide a hedge for certain balances or transactions and to show how effective coverage was to be achieved and measured, provided that this is consistent with the Group’s risk management processes.
Hedges are applied to either individual items and balances (micro-hedges) or to portfolios of financial assets and liabilities (macro-hedges). In the latter case, the set of financial assets and liabilities being collectively hedged share the same type of risk, which is determined when the interest rate sensitivities of the individual hedged items are similar. Changes that take place after the designation of the hedge in the measurement of the financial instruments designated as hedged items and financial instruments designated as hedging instruments are recorded as follows:
- In fair value hedges, differences arising in the fair value of the derivative and the hedged item attributable to the risk being hedged are recognised directly in the consolidated income statement; the balancing entries consist of the balance sheet headings in which the hedged item is recorded or under the heading “Derivatives - Hedge accounting”, as appropriate.
In fair value hedges of interest rate risk in a portfolio of financial instruments, gains or losses arising when the hedging instrument is measured are recognised directly in the consolidated income statement. Losses and gains arising from changes in the fair value of the hedged item attributable to the hedged risk are recognised in the consolidated income statement with a balancing entry under the heading “Fair value changes of the hedged items in portfolio hedge of interest rate risk” on the asset side or the liabilities side of the balance sheet, as applicable. In this case, effectiveness is assessed by comparing the overall net position of assets and liabilities in each time period with the hedged amount designated for each one of them, and the ineffective portion is immediately recorded under the heading “Gains or (-) losses on financial assets and liabilities, net” of the consolidated income statement.

223Statutory information
- In cash flow hedges, differences in the value arising in the effective portion of hedging instruments are recorded under the heading “Accumulated other comprehensive income - Hedging derivatives”. Cash flow hedges reserve (effective portion)” of consolidated equity. These differences are recognised in the consolidated income statement when the gains or losses of the hedged item are recognised, when the envisaged transactions are performed or on the date of maturity of the hedged item.
- In hedges of net investments in foreign operations, measurement differences in the effective portion of hedging
instruments are recorded temporarily in the statement of equity under “Accumulated other comprehensive income – Hedges of net investments in foreign operations (effective portion)” of consolidated equity. These differences are recognised in the consolidated income statement when the investment in a foreign operation is disposed of or derecognised from the consolidated balance sheet.
- Measurement differences in hedging instruments relating to the ineffective portion of cash flow hedging transactions and net investments in foreign operations are recognised in the income statement under the heading “Gains or (-) losses on financial assets and liabilities, net” of the consolidated income statement.
If a derivative which is treated as a hedging derivative does not meet the above requirements due to its ineffectiveness or for any other reason it does not comply with the requirements described above, it will be treated as a derivative maintained for trading for accounting purposes. Therefore, changes in its valuation shall be recorded with a counterparty in income. When a fair value hedge is discontinued, any previous adjustments made to the hedged item are charged to the income statement using the effective interest rate method, recalculated as of the date on which the item ceased to be hedged, which must be fully amortised upon maturity. Where a cash flow hedge is discontinued, the accumulated income on the hedging instrument recognised in the statement of equity under “Accumulated other comprehensive income” in consolidated equity (while the hedge was in effect), will continue to be recognised under that heading until the hedged transaction takes place, at which time the gain or loss will be recognised in the income statement, unless the hedged transaction is not expected to take place, in which case it will be recognised in the income statement immediately. 11.3.6 Financial guarantees Contracts by which the Group undertakes to make specific payments for a third party in the event of the third party failing to do so, irrespective of their legal form are considered financial guarantees. These can take the form of, amongst others, bonds, bank guarantees, insurance contracts or credit derivatives. The Group recognises financial guarantee contracts under the heading “Financial liabilities at amortised cost - Other financial liabilities” at their fair value which, at inception and unless otherwise evidenced, is the present value of the expected fees and returns to be received. At the same time, the Group recognises fees and similar income received at the commencement of the operations and the accounts receivable for the present value of future cash flows pending collection as loans on the asset side of the balance sheet. In the particular case of long-term guarantees given in cash to third parties within the framework of service contracts, when the Group guarantees a certain level or volume in terms of the provision of such services, it initially recognises these guarantees at their fair value. The difference between their fair value and the disbursed amount is considered as an early payment or collection for the provision of this service, and this is recorded in the consolidated profit and loss statement during the period for which such service is provided. Subsequently, the Group applies analogous criteria to debt instruments valued at amortised cost. Financial guarantees are classified according to the insolvency risk attributable to the customer or the transaction and in appropriate cases an assessment is made of the need to make provisions for such guarantees by applying similar criteria for debt instruments valued at amortised cost. Income from guarantee instruments are recorded under the heading “Fee and commission income” in the consolidated income statement and are calculated applying the rate laid down in the related contract to the nominal amount of the guarantee. Interest from long-term guarantees given in cash to third parties is recognised by the Group under the heading “Interest income” in the consolidated profit and loss statement for their remuneration.
224 Banco Sabadell Annual report 2018
11.3.7 Transfers and derecognition of financial instruments from the balance sheet Financial assets are only derecognised from the consolidated balance sheet when they no longer generate cash flows or when their inherent risks and benefits have been substantially transferred to third parties. Similarly, financial liabilities are only derecognised from the consolidated balance sheet when the obligations generated by the liabilities have expired or are acquired for the purpose of their cancellation or resale. Note 4 provides details of asset transfers in effect at the end of 2018 and 2017, indicating those that did not involve the derecognition of the asset from the consolidated balance sheet. 1.3.8 Offsetting of financial instruments Financial assets and liabilities are only offset in order to be included in the consolidated balance sheet when the Group has a legally enforceable right to offset the amounts recognised in such instruments and intends to settle them at their net amounts or to realise the asset and settle the liability simultaneously. 1.3.9 Non-current assets and assets and liabilities included in disposal groups classified as held for sale and discontinued operations The “Non-current assets and disposal groups classified as held for sale” heading on the consolidated balance sheet comprises the carrying values of assets – stated individually or combined in a disposal group, or as part of a business unit that the Group intends to sell (discontinued operations) – which are very likely to be sold in their current condition within one year of the date of the consolidated annual accounts. It can therefore be assumed that the carrying value of an asset of this kind, which may be of a financial or non-financial nature, will be recovered through the disposal of the item concerned rather than from its continued use. Specifically, real estate or other non-current assets received by the Group in the full or partial settlement of borrowers’ payment obligations are treated as non-current assets held for sale, unless the Group has decided to make continued use of the assets or include them in its rental operations. Similarly, investments in joint ventures or associates that meet these criteria also qualify as non-current assets classified as held for sale. For all of these assets, the Group has specific units focused on real estate management and sale. The heading “Liabilities included in disposal groups classified as held for sale” includes credit balances associated with disposal groups or assets, or with the Group's discontinued operations. Non-current assets and disposal groups classified as held for sale are measured both on the acquisition date and thereafter, at the lowest between their carrying value and the net fair value of their estimated sale costs. The book value at the date of acquisition of non-current assets and disposal groups of items classified as held for sale derived from foreclosure or recovery is defined as the balance pending collection on the loans or credit facilities that give rise to these purchases (net of any associated impairment allowances), whilst they are classified as “Non current assets and disposal groups held for sale” tangible and intangible assets that would otherwise not be subject to amortisation. In order to determine the net fair value of real estate assets, the Group uses its own internal methodology, which uses as a starting point the appraisal value, which is adjusted considering experience of selling similar properties in terms of prices, the period during which each asset remains on the consolidated balance sheet and other explanatory factors. Similarly, agreements reached with third parties for the disposal of these assets are also taken into consideration. The appraisal amount of real estate assets recognised in this heading is obtained following the policies and criteria described in the section “Guarantees” section in note 1.3.4. The main appraisal companies and agencies used to obtain market values are listed in Note 6. Gains and losses arising from the disposal of assets and liabilities classified as held for sale, as well as impairment losses and their reversal, if applicable, are recognised under the heading “Profit or (-) loss from non-current assets and disposal groups classified as held for sale not qualifying as discontinued operations” in the consolidated income statement. The remaining income and expenses relating to these assets and liabilities are disclosed based on their nature.

225Statutory information
Discontinued operations are components of the entity that have been disposed of or classified as held for sale and which: (i) represent a line of business or geography which is significant and separate from the rest or is part of a single coordinated plan to dispose of said business or geography, or (ii) are subsidiaries acquired solely in order to be resold. Income and expenses of any kind generated by discontinued operations during the year, including those granted before they were classified as discontinued operations, are presented net of the tax effect as a single amount under the heading “Profit or loss after tax from discontinued operations” in the consolidated income statement, both when the business has been derecognised from the asset side of the balance sheet and when it continues to be recorded on such side of the balance sheet at year end. This heading also includes the results obtained from their sale or disposal. 1.3.10 Tangible assets Tangible assets include (i) property, plant and equipment held by the Group for current or future use which is expected to be used for over one year, (ii) property, plant and equipment loaned to customers under operating leases, and (iii) investment properties, which include land, buildings and other structures held in order to be leased out or to obtain a capital gain on their sale. This heading also includes tangible assets received in lieu of debts classified on the basis of their final use. As a general rule, tangible these assets are valued at cost less accumulated depreciation and, if applicable, less any impairment allowances identified from a comparison of the net carrying value of each item with its recoverable amount. Depreciation of tangible assets is calculated using the straight-line method, applying the estimated years of useful life of the various items to the acquisition cost of acquisition of the assets less their residual value. The land on which the buildings and other structures stand is considered to have an indefinite life and is therefore not depreciated. The annual depreciation charge on tangible assets is reflected against the consolidated income statement and calculated over the remaining years of their estimated useful lives, on average, of the different asset groups: Useful life (years)
Land and buildings 37,5 to 75 Fixtures and fittings 4,2 to 25 Furniture and office equipment 3,3 to 18 Vehicles 3,1 to 6,25 Cash dispensers, computers and computer equipment 4
The Group reviews the estimated useful life of tangible assets at the end of each year as a minimum, in order to detect any major changes in such lives. Should any such changes arise, the corresponding adjustments are made in the consolidated income statement for future years to the depreciation charge based on the new estimated useful life. At each reporting date, the Group analyses whether there are internal or external indications that a tangible asset might be impaired. If there is evidence of impairment, the Group analyses if such impairment has actually taken place by comparing the asset’s carrying value with its recoverable value (the higher of its fair value less selling costs and its fair value less its value in use). When the asset’s carrying value exceeds the recoverable value, the Group reduces the carrying value of the corresponding item to its recoverable value and future depreciation charges are adjusted in proportion to the adjusted carrying value and new remaining useful life, if this needs to be re-estimated. Where there are indications that the value of an asset has been recovered, the Group records the reversal of the impairment loss recognised in previous years and adjusts future depreciation charges accordingly. The reversal of an impairment loss on an asset will in no circumstances result in an increase in its carrying value above the value that the asset would have had if impairment allowances had not been recognised in previous years. In particular, certain items of property, plant and equipment are assigned to cash generating units in the banking business. Impairment tests are conducted on these units to verify whether sufficient cash flows are generated to support the assets’ value. To this end, the Group (i) calculates the recurring net cash flow at each branch based on the accumulated contribution margin less an allocated recurring risk cost, and (ii) this recurring net cash flow is regarded as a perpetual flow and a valuation is effected using the discounted cash flow method applying the cost of capital and growth rate to perpetuity determined by the Group (see Note 16). For real estate investments, the Group uses third party valuations, registered with Bank of Spain’s special register of appraisal firms, in accordance with criteria set forth in Order ECO/805/2003. Maintenance expenses and the maintenance of tangible assets are recorded on the consolidated income statement for the year in which they occur.

226 Banco Sabadell Annual report 2018
11.3.11 Leases Finance leases A lease is treated as a finance lease when there is a substantial transfer of risks and benefits associated with ownership of the asset. Where the Group is the lessor of an asset, the sum of the present values of payments receivable from the lessee is recorded as financing provided to a third party and is therefore included in the balance sheet under the heading “Financial assets at amortised cost” from the consolidated balance sheet. This financing includes the exercise price of the purchase option available to the lessee upon the termination of the contract in cases where the exercise price is sufficiently lower than the fair value of the asset at the date of maturity of the option, such that it is reasonably likely to be exercised. When the Group acts as lessee, the cost of the leased assets is recorded in the consolidated balance sheet according to the nature of the leased asset, and at the same time a liability is reflected for the same amount which will be the lower of the fair value of the leased asset and the sum of the present values of the amounts payable to the lessor, plus, if applicable, the exercise price of the purchase option. These assets are depreciated using criteria similar to those applicable to tangible assets for the Group’s own use. Financial income and expenses arising from lease agreements are credited or charged, respectively, to the consolidated income statement in such a way as to ensure that the return remains constant throughout the term of the contracts. Operating leases In operating leases, ownership of the leased asset and a substantial proportion of all of the risks and benefits of ownership of the asset remain with the lessor. When the Group is the lessor of the asset, the acquisition cost of the leased item is recorded under the heading “Tangible assets”. These assets are depreciated by the same procedure as for similar tangible assets for own use and the revenue from the leases is recognised in the consolidated income statement on a straight-line basis. Where the Group is the lessee, the expenses arising from the lease, including any incentives offered by the lessor, are recorded in the consolidated income statement on a straight-line basis. When contracts include interest rate revision clauses, the revision takes place annually on the basis of fluctuations in the consumer price index in Spain or the country in which the asset is located, without adding any spread thereto. Sale and lease-back In the case of sales at fair value with subsequent lease-backs, any profit or loss is recorded at the time of the sale. In the event of a subsequent lease-back, the income generated is apportioned over the term of the lease. When determining whether a sale with a lease-back operation results in an operating lease the Group analyses, amongst other aspects, whether at the inception of the lease there are purchase options which, due to their terms, are reasonably likely to be exercised, and which party will receive the losses or gains derived from fluctuations in the fair value of the residual amount of the corresponding asset. 1.3.12 Intangible assets Intangible assets are identifiable, non-physical, non-monetary assets that arise as a result of an acquisition from third parties or which are carried out internally by the Group. An intangible asset will be recognised when it meets this criterion and the Group considers it likely that economic benefits deriving from the asset and its cost can be reliably estimated. Intangible assets are initially recognised at their acquisition or production cost and are subsequently measured at cost less, when applicable, any accumulated depreciation and impairment loss which may have been sustained.

227Statutory information
Goodwill Positive differences between the cost of a business combination and the acquired portion of the net fair value of the assets, liabilities and contingent liabilities of the entity acquired is recognised on the consolidated balance sheet as goodwill. These differences represent an advance payment made by the Group of the future economic benefits derived from the acquired entities that are not individual and separately identifiable and recognisable. Goodwill, which is not amortised, is only recognised when acquired for good and valuable consideration in a joint venture. Each goodwill is assigned to one or more cash-generating units (UGE, for their acronym in Spanish) which are expected to benefit from the synergies derived from the business combinations. These UGE are the smallest identifiable groups of assets which, as a result of their continuous operation, generate cash flow for the Group, irrespective of other assets or groups of assets. The UGEs to which the goodwill has been assigned are tested annually for impairment, or whenever there is evidence that impairment might have arisen. In this respect, the Group recalculates the recoverable amount mainly using the distributed profit discount method in which the following parameters are taken into account: - Key business assumptions: these assumptions are used as a basis for cash flow projections used as part of the
valuation. For businesses engaging in financial activity, projections are made for variables such as: changes in lending volumes, default rates, customer deposits and interest rates under a forecast macroeconomic scenario and capital requirements.
- Estimates of macroeconomic variables and other financial parameters.
- Projection period: this is usually five years, after which a recurring level is attained in terms of both income and
profitability. These projections take account of the economic outlook at the time of the valuation. These projections take account of the economic outlook at the time of the valuation.
- Type of discount: the present value of future dividends, from which a value in use is derived, is calculated using the
capital cost of the entity (Ke) from the standpoint of a market participant as a discount rate. To determine the capital cost the CAPM (Capital Asset Pricing Model) is used in accordance with the formula: “Ke = Rf + β (Pm) + α”, where: Ke = Required return or cost of capital, Rf = Risk-free rate, β = Company’s systemic risk coefficient, Pm = Market premium and α = Non-systemic risk premium.
- Growth rate used to extrapolate cash flow projections beyond the period covered by the most recent forecasts: it is
based on long-term estimates for the main macroeconomic figures and key business variables, and bearing in mind the current financial market outlook at all times.
If the carrying value of a UGE is higher than its recoverable amount, the Group recognises an impairment loss which is allocated firstly by reducing the goodwill attributed to that UGE and secondly, if any losses remain to be allocated, by reducing the carrying value of the remaining assigned assets on a proportional basis. Impairment losses recognised for goodwill cannot subsequently be reversed. Other intangible assets This heading includes intangible assets identified in business combinations such as the value of brands and contractual rights arising from relations with customers acquired through the acquired businesses, as well as computer software. These intangible assets are amortised on the basis of their useful lives, applying similar criteria to those used for tangible assets. In particular, the useful lives of brands and contractual rights arising from customer relations in acquired businesses vary between 5 and 15 years, while for computer software the useful life is between 7 and 15 years. The criteria for recognising impairment allowances in intangible assets and any recoveries of impairment allowances recorded in earlier financial years are similar to those applied to tangible assets. In this respect, the Group determines whether there is evidence of impairment by comparing actual trends with the initial assumptions applied in the parameters used when they were first recognised. These include possible loss of customers, average customer balances, average ordinary income and the assigned cost-to-income ratio. Changes in the estimated useful lives of intangible assets are treated in a similar way to changes in the estimated useful lives of tangible assets.

228 Banco Sabadell Annual report 2018
11.3.13 Inventories Inventories are non-financial assets that are held for use or sale by the Group in the normal course of its business activity, or which are in the process of production, construction or development in order to be sold or used, or are to be used in the production process or in the provision of services. In general, inventories are valued at the lower of their value at cost, including all purchase and conversion costs and other direct and indirect costs incurred in bringing the inventories to their present condition and location, and their net realisable value. Net realisable value means the estimated sale price net of the estimated production and marketing costs to carry out the sale. This figure is revised and recalculated on the basis of actual losses incurred on the sale of the assets. Any value adjustments to inventories, whether caused by impairment due to damage, obsolescence or a fall in sale prices, to reflect their net realisable value, or arising from other losses, are recognised as expense in the year in which the impairment or other loss occurred. Any subsequent recoveries in value are recognised in the consolidated income statement in the year in which they occur. For inventories comprising land and buildings , the net realisable value is calculated based on the appraisal carried out by an independent expert, registered with the Bank of Spain Special Register of Valuation Firms and prepared in accordance with the criteria established in Order ECO/805/2003 on valuation rules for real estate and certain rights for certain financial purposes, which are adjusted in line with the internal methodology developed by the Group, considering its experience in selling similar property, in terms of prices, the period during which each asset remains on the consolidated balance sheet and other explanatory factors. The book value of the inventories is derecognised from the consolidated balance sheet, and it is recorded as en expense during the year in which the income proceeding from its sale is recorded. 1.3.14 Own equity items Own equity items are defined as equity instruments that meet the following criteria:
- Does not involve any contractual obligation for the issuer which entails: delivering cash or another financial asset to a third party, or exchanging financial assets or liabilities with a third party in terms which are potentially unfavourable to the issuer.
- If they may be, or will be, settled with the issuer’s own equity instruments: in the case of a non-derivative
financial instrument, it does not entail an obligation to deliver a variable number of its own equity instruments; in the case of a derivative instrument, it will be considered an equity item provided that it is settled for a fixed amount of cash or with another financial asset, in exchange for a fixed number of the issuer’s own equity instruments.
All transactions involving the Group’s own equity items, including their issuance or redemption, are recognised directly with a balancing entry in consolidated equity. Changes in the value of instruments classified as own equity items are not recognised in the financial statements. Any consideration received or paid in exchange for such instruments is added to or deducted directly from the consolidated equity and the associated transaction costs are deducted therefrom. Equity instruments issued in full or partial settlement of a financial liability are recognised at fair value unless this cannot be reliably determined. In this case, the difference between the carrying value of a financial liability (or any part thereof) that has been settled and the fair value of the equity instruments issued is recognised in the income statement for the year. On the other hand, compound financial instruments, which are those contracts which simultaneously generate a financial liability and their own equity instrument for the issuer (such as, for example, convertible debentures which grant their holder the right to convert them into equity instruments of the issuing entity) are recognised on the date of their issue, separating their components and classifying them in accordance with the economic fund.

229Statutory information
The assignment of the initial amount to the different components of the compound instrument will not imply, under any circumstances, a recognition of income. The amount shall firstly be assigned to the component which is a financial liability, including any implicit derivative for which its own equity is not used as an underlying asset. The amount shall be obtained based on the fair value of the entity’s financial liabilities, with similar characteristics to compound instruments, but which are not associated with own equity instruments. The attributable value at the start of the capital instrument will be the residual portion of the initial amount of the compound instrument, once the fair value assigned to the financial liability has been deducted. 1.3.15 Remuneration based on equity instruments The delivery to employees of the Group’s own equity instruments in payment for their services, where the instruments are determined at the start and are delivered on completion of a specified period of service, is recognised as an expense for services over the period during which the services are being provided, with a balancing entry under the heading “Other equity” in the consolidated equity. On the date such instruments are awarded, the services received are measured at fair value unless this cannot be reliably estimated, in which case they are measured by reference to the fair value of the committed equity instruments, bearing in mind the terms and other conditions envisaged in the commitments. The amounts recognised in consolidated equity are not subsequently reversed, even when employees do not exercise their right to receive the equity instruments. For transactions involving share-based remuneration paid in cash, the Group records an expense for services as the employees provide them, with a balancing entry on the liabilities side of the consolidated balance sheet. The Group recognises said liability at fair value until it is settled. Changes in value are recognised in the income statement for the year. 1.3.16 Provisions and contingent assets and liabilities Provisions are current obligations of the Group which have arisen from past events and whose nature at the balance sheet date is clearly specified, but which are of uncertain timing and amount; when such obligations mature or become due for settlement, the Group expects to settle them through an outflow of resources. In general, the Group's annual consolidated accounts include all significant provisions with respect to which it is estimated that the likelihood of having met the obligation is higher than the opposite. These provisions include, amongst others, pension commitments undertaken with employees by some of the Group’s entities (see Note 1.3.17), as well as provisions for legal and other disputes. Contingent liabilities are possible obligations that arise from past events and whose existence will be confirmed only by the occurrence or non-occurrence of one or more future events that lie outside the Group’s control. Contingent liabilities include present obligations of the Group, the cancellation of which is not likely to result in an outflow of resources embodying economic benefits or whose amount, in extremely rare instances, cannot be measured with sufficient reliability. Contingent liabilities are not recognised in the annual consolidated accounts but they are disclosed in the report on such consolidated annual accounts. As set forth in IAS 37.92, if it is considered that giving a detailed breakdown of information on certain provisions and contingent liabilities would seriously affect the bank’s position in disputes with third parties related to situations which contemplate provisions and contingent liabilities (such as those linked to certain disputes or arbitration issues), the Group chooses not to give details of this information. Contingent assets are potential assets arising out of past events the existence of which is conditional upon events that are out of the Group’s control and confirmation must be given both when such events occur and when they do not occur. These contingent assets are not recognised on the consolidated balance sheet or in the consolidated income statement, but are disclosed in the corresponding report provided that an increase in resources embodying economic benefits for this reason is likely. 1.3.17 Provisions for pensions The Group’s pension commitments to its employees are as follows: Defined contribution schemes These are predetermined contributions made to a separate entity under the agreements reached with each group of employees in particular, without any legal or effective obligation to make additional contributions where the separate entity is unable to pay benefits to the employees for the services rendered in the current year and in previous years.
230 Banco Sabadell Annual report 2018
These contributions are recorded each year in the consolidated income statement (see Note 33). DDefined benefit schemes Defined benefit schemes provide for all current commitments under Articles 42, 43, 44 and 48 of the 23rd Collective Agreement for the Banking Industry. These commitments are financed through the following formats: the pension scheme, insurance contracts, and the voluntary social welfare entity “E.P.S.V.” and internal funds. 1. The pension scheme: Banco Sabadell’s employee pension scheme covers benefits payable under the aforementioned collective agreement with the employees belonging to regulated groups, with the following exceptions:
- Additional commitments due to early retirement as set out in Article 43 of the Collective Agreement. - Disability arising in certain circumstances. - Widowhood and orphanhood benefits arising from the death of a retiree joining the bank after 8 March 1980.
The Banco Sabadell employee pension scheme is regarded to all intents and purposes as an asset of the scheme for the obligations insured in entities that are not connected to the Group. Obligations of the pension scheme insured in companies associated with the group are not considered scheme assets. A Control Committee has been created for the pensions plan, formed of the representatives of the promotor and the representatives of the investees and beneficiaries. This Control Committee is the body responsible for supervising its function and execution. 2. Insurance contracts Insurance contracts provide general cover for specified commitments under Articles 43 and 44 of the 23rd Collective Agreement for the Banking Industry, including:
- Commitments that are expressly excluded from the Banco Sabadell employee pension scheme (listed in the previous section).
- Serving employees covered by a collective agreement with the former Banco Atlántico. - Pension commitments in respect of some serving employees, not provided for under the collective
agreement. - Commitments towards employees on leave of absence who are not entitled to benefits under the Banco
Sabadell employee pension scheme. - Commitments towards early retirees. These may be partly financed out of pension rights under the Banco
Sabadell employee pension scheme. These insurance policies have been arranged with non-Group insurers, principally for commitments to former Banco Atlántico employees, and also with BanSabadell Vida, S.A. de Seguros y Reaseguros. 3. The voluntary social welfare entity “E.P.S.V.”. The acquisition and subsequent merger of Banco Guipuzcoano resulted in the takeover of Gertakizun, E.P.S.V., which covers defined benefit commitments in respect of the bank’s serving and former employees and are insured by policies. This entity was set up by Banco Guipuzcoano in 1991 as a legally separate entity. Pension commitments to serving and former employees are fully covered by entities separate from the Group. 4. Internal funds Internal funds cover obligations to early retirees up to their legal retirement age for employees previously working for Banco Sabadell, Banco Guipuzcoano and Banco CAM.

231Statutory information
Accounting record of defined benefit obligations The “Provisions - Pensions and other post-employment defined benefit obligations” heading on the liabilities side of the balance sheet includes the current actuarial value of pension commitments, which is calculated individually using the projected unit credit method on the basis of financial and actuarial assumptions with are set out below. This is the same method used for the sensitivity analysis described in Note 22. From the obligations thus calculated, the fair value of the scheme assets have been deducted. Scheme assets are assets that will be used to settle obligations, including insurance policies, since they meet the following requirements:
- They are not owned by the Bank but by a legally separate, non-related third party.
- They are available only to pay or fund employee benefits and are not available to creditors of the bank, even in the event of the Bank becoming insolvent.
- They cannot be returned to the bank unless the assets remaining in the scheme are sufficient to meet all obligations of the scheme and of the bank relating to employee benefits, or unless assets are to be returned to the bank to reimburse it for employee benefits previously paid.
- They are not non-transferable financial instruments issued by the bank.
The assets that back pension commitments shown in the individual balance sheet of BanSabadell Vida, S.A. de Seguros y Reaseguros are not scheme assets as the company is a related party of the Group. Pension commitments are recognised as follows:
- In the consolidated income statement, net interest on the net defined benefit liability (asset) net of pension commitments as well as the cost of the services, which includes i) the cost of services in the current year, ii) the cost of past services arising from past changes made to existing commitments or from the introduction of new benefits and iii) any gain or loss arising from a settlement of the scheme.
- Under the heading “Accumulated other comprehensive income” in consolidated equity, the re-evaluation of the net liabilities (assets) for pension commitments, which includes (i) actuarial gains and losses generated in the year arising from differences between the prior actuarial assumptions and the real situation and from changes in the actuarial assumptions made, (ii) the performance of the scheme assets, and (iii) any change in the effects of the asset limit, excluding, for the last two items, the amounts included in net interest on the net liabilities (assets). The amounts recorded in the consolidated statement of equity are not reclassified to the consolidated income statement in subsequent years but are reclassified under the heading “Other reserves - Other” of the consolidated equity.
Under the heading “Provisions- Other long-term employee benefits” on the consolidated balance sheet mainly includes the value of commitments undertaken with early retirees. Changes occurring during the year in the value of liabilities are recognised in the consolidated income statement. Actuarial assumptions The most significant actuarial assumptions used in the valuation of pension commitments are as follows:
2018 2017
Tables PERM / F 2000 New production PERM / F 2000 New production Discount rate, pension scheme 1.50% per annum 1.50% per annum Discount rate, internal fund 1.50% per annum 1.50% per annum Discount rate, related insurance 1.50% per annum 1.50% per annum Discount rate, non-related insurance 1.50% per annum 1.50% per annum Inflation 2.00% per annum 2.00% per annum Rate of increase in salaries 3.00% per annum 3.00% per annum Retirement due to disability SS90-Absolute SS90-Absolute Staff turnover None assumed None assumed Early retirement Allowed for Allowed for Normal retirement age 65 or 67 years 65 or 67 years

232 Banco Sabadell Annual report 2018
In 2018 and 2017, the technical interest rate on all commitments has been determined by reference to the yield on AA-rated corporate bonds (iBoxx € Corporates AA 10+), with an average duration of 11.94 years in 2018 and 11.52 years in 2017. The age of early retirement is assumed to be the earliest retirement date after which pension entitlements cannot be revoked by the employer for all employees. The yield on long-term assets related to scheme assets and insurance policies linked to pensions has been determined by applying the same technical interest rate (1.50% in 2018). 11.3.18 Transactions in foreign currency and conversion differences The Group’s functional and presentation currency is the euro. All balances and transactions denominated in currencies other than the euro are thus treated as denominated in a foreign currency. On initial recognition, debit and credit balances denominated in foreign currency are translated to the functional currency at the spot exchange rate, defined as the exchange rate for immediate delivery, on the recognition date. Subsequent to the initial recognition, the following procedures are used to translate foreign currency balances to the functional currency of each entity.
- Monetary assets and liabilities are translated at the closing exchange rate, defined as the average spot exchange rate as at the reporting date of the financial statements.
- Non-monetary items measured at historical cost are translated at the exchange rate ruling on the date of acquisition.
- Non-monetary items stated at fair value are translated at the exchange rate ruling on the date on which the fair value was determined.
- Income and expenses are translated at the exchange rates ruling at the transaction date. In general, foreign exchange differences arising on the translation of debit and credit balances denominated in foreign currency are recorded in the consolidated income statement. However, for foreign exchange differences arising on non-monetary items measured at fair value where the fair value adjustment is made and recognised under the heading “Accumulated other comprehensive income” in consolidated equity, a breakdown is given for the exchange rate component of the revaluation of the non-monetary item. The balances of the financial statements of consolidated entities whose functional currency is different to the euro are converted into euros in the following manner:
- Assets, liabilities and valuation adjustments are converted by applying exchange rates at the end of each year.
- Income and expenses applying the average exchange rate, weighted by the volume of transactions of the converted company.
- Own funds, at historic exchange rates. Exchange differences which have arisen in the conversion of financial statements of consolidated entities whose functional currency is different to the euro are recognised under the heading “Accumulated other comprehensive income” of consolidated equity. The exchange rates applied in the datr the balances in foreign currency to euros are those published by the European Central Bank as at 31 December of each year.

233Statutory information
11.3.19 Recognition of income and expense Interest income and expense and similar items are generally accounted for over the period in which they accrue using the effective interest rate method, under the headings “Interest income” or “Interest expenses” of the income statement, as applicable. Dividends received from other entities are recognised as income at the time the right to receive them originates. Generally, income and expenses on commissions and similar fees are recorded in the consolidated income statement in accordance with the following criteria:
- Those linked to financial assets and liabilities carried at fair value through profit or loss are reflected at the time of disbursement.
- Those related to transactions or services performed over a period of time are reflected over this period.
- Those relating to a transaction or service that is performed in a single act are recorded when the originating act takes place.
Financial fees and commissions, which form an integral part of the effective cost or yield of a financial transaction, are deferred net of associated direct costs and recognised in the consolidated income statement over the expected average life of the transaction. The equity managed by the Group that is owned by third parties is not included in the consolidated balance sheet. Fees generated by this activity are recorded under the heading “Fee and commission income” in the consolidated income statement. Non-financial income and expenses are accounted for on an accrual basis. Deferred payments and collections are accounted for at the amount obtained by discounting expected cash flows at market rates. For levies and tax obligations whose amount and date of payment are correct, the obligation is recognised when the event that leads to its payment takes place in line with the legislative terms and conditions. Therefore, the item to be paid is recognised when there is an obligation to pay the tax, such as, for example, in the case of contributions to guarantee deposit funds in the different countries where the Group operates. In these cases in which the payment obligation is accrued throughout a period of time, this is recognised progressively during this period. Deposit guarantee funds The bank is a member of the Deposit Guarantee Fund. In 2018, the Management Committee of the Deposit Guarantee Fund of credit institutions, in accordance with that laid out in Royal Decree Law 16/2011 and Royal Decree 2606/1996, set the contribution for all entities adhered to the deposit guarantee scheme at 1.8 promille of the amount of the deposits guaranteed as at 30 June 2018. The calculation of each entity’s contribution was based on the amount of deposits guaranteed and the risk profile of the entity, taking into account indicators such as capital adequacy, the quality of the assets and liquidity, which have been defined in Bank of Spain Circular 5/2016 of 27 May. Furthermore, the contribution to the securities guarantee scheme has been set at 0.2% of 5% of the amount of the securities guaranteed as at 31 December 2018. In accordance with that set forth by IFRIC 21, the transaction is recognised whenever there is a payment obligation, recorded as at 31 December each year (see Note 32). Some of the consolidated entities are integrated into systems which are similar to the Deposit Guarantee Fund and they make contributions to these systems in accordance with national regulations (see Note 32). The most relevant entities are listed below:
- TSB Bank plc makes contributions to the Financial Services Compensation Scheme, which are accrued on 1 April of every year.
- Banco Sabadell, S.A. Institución de Banca Múltiple (BS IMB México) makes contributions to the deposit guarantee fund establish by the Institute for Bank Savings Protection. In this case the payment obligation, and therefore its accrual, is monthly.
234 Banco Sabadell Annual report 2018
SSingle Resolution Fund Law 11/2015 of 18 June, together with its implementing regulation through Royal Decree 1012/2015, entailed the transposition into Spanish law of Directive 2014/59/EU. This Directive established a new framework for the resolution of credit institutions and investment firms, and is also one of the standards that have contributed to the constitution of the Single Resolution Mechanism, created through Regulation (EU) 806/2014. This regulation establishes standard rules and procedures for the resolution of credit institutions and investment firms within the framework of a Single Supervisory Mechanism and a Single Resolution Fund at European level. As part of the implementation of this regulation, on 1 January 2016 the Single Resolution Fund entered into effect, to operate as a financing instrument which the Single Resolution Board can use. The Single Resolution Board is the European authority which makes decisions on the resolution of failing banks, in order to efficiently undertake the resolution measures which are adopted. The Single Resolution Fund receives contributions from credit institutions and investment firms subject to the same. The calculation of each entity’s contribution to the Single Resolution Fund, governed by Regulation (EU) 2015/63, is based on the proportion that each entity represents with respect to the aggregate total liabilities of the Fund’s member entities, after deducting own funds and the guaranteed amount of the deposits. The latter is then adjusted to the entity’s risk profile (see Note 32). The obligation to contribute to the Single Resolution Fund accrues on 1 January of each year. 1.3.20 Corporation tax The Corporation Tax applicable to the Spanish companies of Banc Sabadell Group, and similar taxes applicable to foreign investees, is considered to be an expense and it is recorded under the heading “Tax expense or income related to profit or loss from continuing operations” of the consolidated income statement, except when they arise as a consequence of a transaction directly recorded in consolidated equity, in which case, they are directly recorded in the latter. The total corporation tax expense is equivalent to the sum of current tax calculated by applying the relevant levy to taxable income for the year (after applying fiscally admissible deductions and allowances) and the variation in deferred tax assets and liabilities recognised in the consolidated income statement. Taxable income for the year may be at variance with the income for the year as shown in the consolidated income statement, as it excludes items of income or expenditure that are taxable or deductible in other years as well as items which are non-taxable or non-deductible. Deferred tax assets and liabilities relate to taxes expected to be payable or recoverable arising from differences between the carrying value of the assets and liabilities figuring in the financial statements and the related tax bases (“tax value”), as well as tax losses carried forward and unused tax credits that might be offset or applied in the future. They are calculated by applying to the relevant timing differences or tax credits the tax rate at which they are expected to be recovered or settled (see Note 39). A deferred tax asset such as a tax prepayment or a credit in respect of a tax deduction or allowance, or a credit in respect of tax-loss carry-forwards is always recognised provided that the Group is likely to obtain sufficient future taxable profits against which the tax asset can be realised, and that these are not derived from the initial recognition (except in a business combination) of other assets and liabilities in an operation that does not affect either the tax result or the accounting result. Deferred tax assets originated due to deductible temporary differences arising from investments in subsidiaries, branches and associates, or from equity interests in joint ventures are only recognised insofar as the bank has the intention of liquidating the investee in the future. Deferred tax liabilities arising from timing differences associated with investments in subsidiaries and associates are recognised in the accounts unless the group is capable of determining when the timing difference will reverse and, in addition, such a reversal is unlikely. The “Tax assets” and “Tax liabilities” on the consolidated balance sheet include all tax assets and liabilities, differentiating between current (to be recovered in the coming 12 months, for example, payment to the tax authority (Hacienda Pública) of corporate tax) and deferred (to be recovered/paid in future years). At each year-end, recorded deferred tax assets and liabilities are reviewed to ascertain whether they are current and to ensure that there is sufficient evidence of the likelihood of generating future tax profits that will allow them to be realised, in the case of assets, by applying relevant adjustments as necessary.

235Statutory information
To conduct the aforementioned analysis, the following variables are taken into consideration:
- Forecasts of results of the Spanish tax group and of the other entities, based on the financial budgets approved by the bank’s administrators for a five-year period, subsequently applying constant growth rates similar to the mean long-term growth rates of the sector in which the various companies of the Group operate.
- Estimate of the reversal of timing differences on the basis of their nature; and
- The period or limit set forth in current legislation in each country for the reversal of the different tax assets. Income or expenses recognised directly in the consolidated statement of equity that do not affect profits for tax purposes, and income or expenses that are not recognised directly and do affect profits for tax purposes, are recorded as timing differences. The Banco Sabadell Group companies included in Spain’s consolidated tax regime for the bank’s Corporation Tax are listed in Schedule I. 11.3.21 Consolidated cash flow statements Consolidated cash flow statements have been prepared using the indirect method, in such a way that, based on the group’s results, the non-monetary transactions and all types of deferred payment items and accruals which have been or will be the cause of operating income and expense have been taken into account, in addition to the income and expenses associated with cash flows from activities classified as investment or funding activities. The consolidated cash flow statement includes certain items which are defined as follows:
- Cash flows: inflows and outflows of cash and cash equivalents, where “cash equivalents” are short-term, highly liquid investments with a low risk of changes in value. For these purposes, in addition to cash, deposits held with central banks and demand deposits held with credit institutions are also classified as cash components or equivalents.
- Operating activities: typical day-to-day activities of the Group and other activities that cannot be classified as
investment or financing activities. - Investment activities: the acquisition, sale or other disposal of long-term assets and other investments not
included in cash and cash equivalents or in operating activities. - Financing activities: activities that result in changes in the size and composition of consolidated equity and of
liabilities that do not form part of operating activities. No situations requiring the application of significant judgements to classify cash flows have arisen during the year. There have been no significant transactions that have not generated cash flows not reflected in the consolidated cash flow statement.
1.4. Comparability of information The information presented in these annual accounts for 2017 is provided solely and exclusively for purposes of comparison with the information for the year ended 31 December 2018 and therefore does not constitute the bank’s annual accounts for 2017. In accordance with that permitted by regulations, the Group has opted not to re-express the comparison information for 2017, applying classification and measurement criteria set forth in IFRS 9, and instead, recognise as at 1 January 2018 the impact deriving from the entry into force of this standard on the Group’s consolidated equity. The effects of the initial application of IFRS 9 are presented in the section “Standards and interpretations issued by the International Accounting Standards Board (IASB) which have entered into force in 2018” in Note 1.2.

236 Banco Sabadell Annual report 2018
Additionally, on 6 December 2017, Bank of Spain Circular 4/2017 of 27 November to credit institutions, on public and reserved financial information and financial statement models, was published, and entered into force on 1 January 2018, the objective of which is to adapt the accounting regime of Spanish credit institutions to changes in European accounting regulation deriving from the adoption of IFRS 9 and IFRS 15. This Circular has amended the breakdowns and the denomination of certain headings of the financial statements. With the objective of making this information comparable, in the information for 2017 presented in these consolidated annual accounts, the balances recorded under certain headings of the consolidated financial statements which are no longer used after the entry into force of the aforementioned Circular 4/2017 have been reclassified for comparison purposes only to the new headings established by the Circular. In this way, the balances recorded as at 31 December 2017 in the different portfolios for the purpose of presentation and measure of the financial assets used in the preparation of the consolidated balance sheet as at 31 December 2017 have been reclassified to portfolios in the consolidated balance sheet after the entry into force of Circular 4/2017, presented for comparison purposes, as shown below:
Million euro PPortfolios used after the entry into force of IFRS 9
Financial assets at
amortised cost
Financial assets at fair value
through other comprehensive
income
Non-trading financial assets mandatorily at
fair value through profit or loss
Financial assets held for
trading TTotal
PPortfolios used in the consolidated annual aaccounts for 2017 (IAS 39)
Loans and receivables and held-to-maturity investments
160,724 - - - 1160,724
Available-for-sale financial assets - 13,181 - - 113,181 Financial assets held for trading - - - 1,572 11,572 Financial assets designated at fair value through profit or loss - - 40 - 440
TTotal 1160,724 113,181 440 11,572 1175,517
Furthermore, the balances of the headings of the rest of the consolidated financial statements of 2017 (income statement, statement of changes in equity, and cash flows statement, all of which are consolidated) which on one hand refer to the portfolio of “Available-for-sale financial assets” and on the other hand “Loans and receivables” and “Held-to-maturity investments”, have been reclassified to new headings in the financial statements, which have been introduced by new regulations and which refer to the following portfolios: “Financial assets at fair value through profit or loss” and “Financial assets at amortised cost”, respectively. On the other hand, in December 2018, Bank of Spain Circular 2/2018 of 21 December was published, amending Circular 4/2017. This new Circular has included certain changes in the presentation of the headings of financial statements, particularly the consolidated income statement, extending the breakdown of the information required in this statement. These changes have been considered in the preparation of these Consolidated Annual Accounts, in a way that the information corresponding to 2017 has been adapted to the formats of the financial statements required by Circular 2/2018, for the purpose of making it comparable.

237Statutory information
NNote 2 – Banco Sabadell Group The companies comprising the Group as at 31 December 2018 and 2017 are listed in Schedule I, along with their registered offices, primary activities, the bank’s percentage shareholding in each, key financial data and the consolidation method used (full consolidation or equity method) in each case. Schedule II provides a breakdown of consolidated structured entities (securitisation funds). The following section provides a description of the business combinations, acquisitions and sales or liquidations which are most representative of investments in the capital of other entities (subsidiaries and/or investments in associates) performed by the Group during 2018 and 2017. Schedule I also includes a detailed list of the companies consolidated for the first time and those no longer consolidated for each year.
Changes in the Group’s scope of consolidation in 2018 Additions to the scope of consolidation: There have been no significant additions to the scope of consolidation in 2018 (see details of the additions in Schedule I). Exclusions from the scope of consolidation: There have been no significant exclusions from the scope of consolidation in 2018 (see details of the exclusions in Schedule I). Changes in the Group’s scope of consolidation in 2017 Additions to the scope of consolidation: There were no significant additions to the scope of consolidation in 2017. Exclusions from the scope of consolidation: - In June 2017, having obtained the regulatory authorisations required for the contract signed in June 2016, the
Group proceeded to recognise the sale of shares representative of 100% of the share capital of Mediterráneo Vida, Sociedad Anónima de Seguros y Reaseguros, an insurance firm that provides life insurance and retirement savings plans, recognising a capital gain net of expenses of 16,634 thousand euros.
- On 28 February 2017, Banco Sabadell reached an agreement to sell shares representing 100% of the share capital
of its subsidiary Sabadell United Bank, N.A. (SUB) to the US entity Iberiabank Corporation (hereinafter, “IBKC”).
In July 2017, after receiving the corresponding authorisations, Banco Sabadell completed the sale of its subsidiary, receiving from IBKC, as the purchase price, 795,980 thousand US dollars in cash and 2,610,304 IBKC shares representing 4.87% of its share capital with a value at close of trading on 28 July 2017 of 208,955 thousand US dollars. The capital gain generated by this transaction amounted to 369,817 thousand euros, net of associated costs. The IBKC shares were sold in October 2017, with no significant impact on the income statement.
- In October 2017, the subsidiary Hotel Investment Partners, S.L. sold shares representing 100% of the share capital
of HI Partners Holdco Value Added, S.A.U., its hotel management platform, to Halley Bidco S.à r.l., an entity controlled by funds advised by the subsidiaries of The Blackstone Group L.P., for a total price of 630,733 thousand euros. Once the corresponding authorisation had been obtained from the CNMV, and once the transaction had been closed, the capital gain generated by this transaction, which amounted to 50,655 thousand euros, was recognised net of associated costs.
Other significant transactions in 2018 - On 19 July 2018, Banco Sabadell agreed to transfer practically all of its problematic real estate exposures to a
subsidiary of Cerberus Capital Management L.P. (hereinafter, Cerberus). The overall gross book value of the real estate assets involved in the transaction amounts to approximately 9.1 billion euros, and their overall net book value amounts to approximately 3.9 billion euros.

238 Banco Sabadell Annual report 2018
The transaction has been structured through the transfer of two real estate asset portfolios, called Challenger and Coliseum, to one or more newly incorporated companies (hereinafter, NewCo(s)). The capital of the latter will be contributed and/or sold, as required, in such a way as to ensure that Cerberus ends up directly or indirectly holding an interest of 80% of the capital of the NewCo(s), with Banco Sabadell holding the remaining 20%. Banco Sabadell and Cerberus shall enter into an agreement to govern their relationship as partners of the NewCo(s). Solvia Servicios Inmobiliarios, S.L.U. will continue to provide comprehensive management services (known as ‘servicing’) for the real estate assets involved in the transaction on an exclusive basis. The closing of the transaction, once the corresponding authorisations have been obtained and the terms and conditions of each of the portfolios have been met, will entail the transfer of control over the real estate assets and, consequently, their derecognition from the consolidated balance sheet. The transaction contributes to improving the Group’s profitability, having required the recognition of additional provisions with a net impact of approximately 92 million euros, in turn contributing a positive impact on the Group’s fully-loaded CET1 ratio of approximately 13 basis points as at the date of signing the deal.
- On 16 May 2018, Banco Sabadell agreed to transfer a portfolio of loans with an outstanding balance of approximately 866 million euros, of which of 737 million euros corresponded to write-offs, to Axactor Capital Luxembourg, S.A.R.L. The closing of this transaction was completed on 13 December 2018, once the corresponding authorisations had been obtained and the relevant terms and conditions had been met. This transaction resulted in a net impact of approximately 6 million euros in losses.
- On 24 July 2018, Banco Sabadell reached an agreement to transfer a portfolio of loans, comprised in turn of three sub-portfolios, mostly mortgage loans, with an outstanding balance of approximately 2,295 million euros, of which 480 million euros corresponded to write-offs, to Deutsche Bank and Carval Investors. The transaction will be completed once the corresponding authorisations have been received and the relevant terms and conditions have been met. As at 31 December 2018, the balance of loans of this portfolio recognised on the balance sheet prior the transfer of credit risk to the DGF amounted to 1,393 million euros. The transaction will have a negative impact on Banco Sabadell’s fully-loaded Common Equity Tier 1 capital ratio of 3 basis points, which includes additional provisions with a net impact on results of approximately 32 million euros.
- On 14 December 2018, the bank agreed the sale of 80% of the share capital of Solvia Servicios Inmobiliarios, S.L.U. to Lindorff Holding Spain, S.A.U., a company owned by Intrum AB Group. Solvia has been valued at a total of 300 million euros. The object of the sale is an 80% stake in Solvia, the price of which may increase by a maximum of 40 million euros, provided that the conditions relating to the evolution of Solvia’s business lines are met. The closing of the transaction, which was subject to obtaining the relevant authorisations, is expected to materialise in the second quarter of 2019 therefore, as at the end of 2018, this stake has been reclassified under “Non-current assets and assets and liabilities included in disposal groups classified as held for sale”. The Group will generate an estimated capital gain of 138 million euros and the transaction will have a positive impact of 15 basis points on its Common Equity Tier 1 (fully-loaded) capital ratio. The assets subject to the transfer deals described in this Note and not yet closed have been transferred to the heading “Non-current assets and disposal groups classified as held for sale ”of the consolidated balance sheet (see Note 13).
Other relevant information AAsset protection scheme As a result of the acquisition of Banco CAM on 1 June 2012, the Asset Protection Scheme (hereinafter, APS) envisaged in the protocol on financial assistance measures for the restructuring of Banco CAM came into force with retroactive effect as from 31 July 2011. Under the scheme, which covers a specified portfolio of assets with a gross value of 24,644 million euros as at 31 July 2011, the Deposit Guarantee Fund (hereinafter, “DGF”) will bear 80% of the losses on the portfolio for a period of ten years, once impairment allowances in respect of those assets, which amounted to 3,882 million euros at the aforementioned date, have been fully applied.
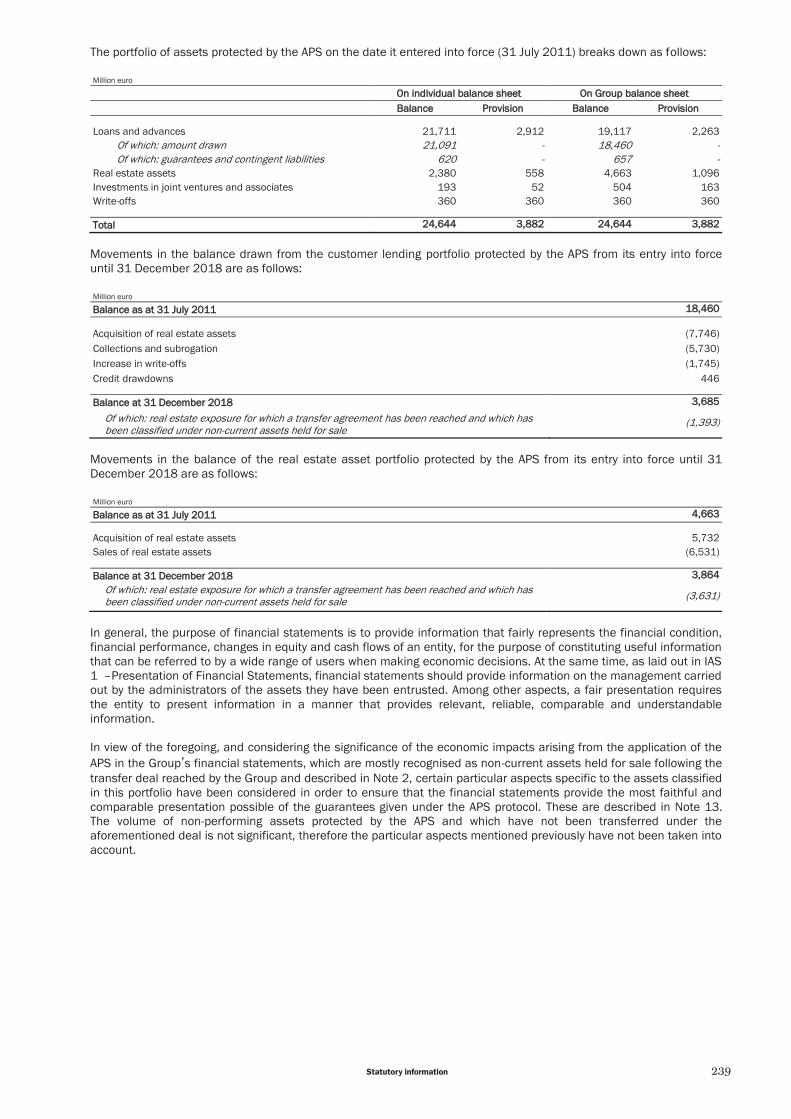
239Statutory information
The portfolio of assets protected by the APS on the date it entered into force (31 July 2011) breaks down as follows: Million euro
OOn individual balance sheet OOn Group balance sheet BBalance PProvision BBalance PProvision Loans and advances 21,711 2,912 19,117 2,263
Of which: amount drawn 21,091 - 18,460 - Of which: guarantees and contingent liabilities 620 - 657 -
Real estate assets 2,380 558 4,663 1,096 Investments in joint ventures and associates 193 52 504 163 Write-offs 360 360 360 360
TTotal 224,644 33,882 224,644 33,882
Movements in the balance drawn from the customer lending portfolio protected by the APS from its entry into force until 31 December 2018 are as follows: Million euro
BBalance as at 31 July 2011 118,460
Acquisition of real estate assets (7,746) Collections and subrogation (5,730) Increase in write-offs (1,745) Credit drawdowns 446
BBalance at 31 December 2018 33,685
Of which: real estate exposure for which a transfer agreement has been reached and which has been classified under non-current assets held for sale
(1,393)
Movements in the balance of the real estate asset portfolio protected by the APS from its entry into force until 31 December 2018 are as follows: Million euro
BBalance as at 31 July 2011 44,663
Acquisition of real estate assets 5,732 Sales of real estate assets (6,531)
BBalance at 31 December 2018 33,864
Of which: real estate exposure for which a transfer agreement has been reached and which has been classified under non-current assets held for sale (3,631)
In general, the purpose of financial statements is to provide information that fairly represents the financial condition, financial performance, changes in equity and cash flows of an entity, for the purpose of constituting useful information that can be referred to by a wide range of users when making economic decisions. At the same time, as laid out in IAS 1 – Presentation of Financial Statements, financial statements should provide information on the management carried out by the administrators of the assets they have been entrusted. Among other aspects, a fair presentation requires the entity to present information in a manner that provides relevant, reliable, comparable and understandable information. In view of the foregoing, and considering the significance of the economic impacts arising from the application of the APS in the Group’s financial statements, which are mostly recognised as non-current assets held for sale following the transfer deal reached by the Group and described in Note 2, certain particular aspects specific to the assets classified in this portfolio have been considered in order to ensure that the financial statements provide the most faithful and comparable presentation possible of the guarantees given under the APS protocol. These are described in Note 13. The volume of non-performing assets protected by the APS and which have not been transferred under the aforementioned deal is not significant, therefore the particular aspects mentioned previously have not been taken into account.

240 Banco Sabadell Annual report 2018
The portfolio of assets protected by the APS as at 31 December 2018 breaks down as follows: Million euro
BBalance PProvision Loans and advances, guarantees and contingent liabilities 2,300 183
Of which, amount drawn not classified as Stage 3 1,884 15 Of which, amount drawn classified as Stage 3 409 166 Of which, guarantees and contingent liabilities not classified as Stage 3 7 0 Of which, guarantees and contingent liabilities classified as Stage 3 1 1
Real estate exposures 233 95
Non-current assets held for sale for which a transfer agreement has been reached 5,024 3,412
Of which loans and advances (*) 1,393 1,085 Of which real estate exposure 3,631 2,327
Investments in joint ventures and associates 40 32 Write-offs 1,172 1,172
TTotal 88,770 44,894 (*) See classification of assets from portfolio sales described in Note 2 and Note 13.
The NPL ratio and NPL coverage ratio (covering risks classified as Stage 3) are indicated below, together with the lending volumes for construction and real estate development, which correspond to loans and advances not classified as non-current assets held for sale: %
22018 NPL ratio 17.80 NPL coverage ratio (covering risks classified as Stage 3) 44.62
Million euro
OOn Group balance sheet OOf which, Stage 3 BBalance PProvision BBalance PProvision Loans and advances - amount drawn 2,292 182 409 166
Of which, lending to construction and real estate development sector (business in Spain) 412 93 167 89
TTotal 22,292 1182 4409 1166
For all of the losses that have been accounted for (those deriving from loan loss provisions, loan reductions, impairment allowances for real estate assets and losses on the disposal of these assets), the Group keeps an account receivable classed under the “Financial assets at amortised cost – Loans and advances - Customers ”heading and recognised to the income statement, in order to reflect the rights of collection from the DGF under the latter’s guarantee, and to offset the impact of losses on assets covered by the APS recognised on the income statement. The accumulated amount recorded as at 31 December 2018 amounts to close to 4,080 million euros. TTSB migration project When TSB Bank plc (hereinafter, “TSB”) was incorporated, it used the IT platform of Lloyds Banking Group, and the process for making changes to products and services took longer the period that would have suited TSB. For this reason, one of the major projects in recent years has been the creation of a new IT platform, the installation of all of the infrastructures required to support TSB’s activity and the migration of data to the new platform. The design and construction of the new system has required more than two years of work, after which TSB conducted a rigorous verification programme. This programme included the testing of business processes, non-functional testing of the technological architecture and operation of the platform and a number of migration test runs. A comprehensive and carefully governed process was also established to ensure that TSB was ready for migration. This process was supervised by TSB’s second line of defence and subjected to a wide range of reviews and checks by Internal Audit.

241Statutory information
The data migration was carried out 22 April 2018, which entailed transferring the data of around 8.5 million customers to the new technology platform. The Group also received the payment agreed to with Lloyds Banking Group (LBG) as part of the initial public offering in June 2014, in which LBG sold 50% of its capital in TSB for 318 million pounds sterling (450 million pounds, less the migration costs incurred by LBG). The amount recognised in the income statement as at 31 December 2018 includes the impact of migration costs, net of the payment described, amounting to 121 million euros. The Group has recognised TSB's new IT platform, called Proteo4UK, as an intangible asset designed and constructed specifically for TSB. The book value of Proteo4UK, constructed under the framework of the migration project, as at 31 December 2018 amounted to 322 million euros (233 million euros as at 31 December 2017). The data migration was carried out successfully and all customers ’data and information were adequately transferred to the new platform. However, in the initial period post-migration, some customers encountered difficulties when accessing their online banking and when using the institution’s mobile banking app. There were also delays in the services provided by branches and via the telephone banking system due to the instability of the application, which were exacerbated by the high demand for services using these channels as a result of the issues experienced in digital channels. Aside from some minor incidents, the operational processes worked adequately, ensuring that customers ’account balances were accurate and correctly updated, and that the payment processes were adequately fulfilled. These incidents are being investigated by both TSB, with the support of independent experts, as well as by UK regulators. As a result of the foregoing, TSB implemented a remediation plan to resolve the service-related issues that were affecting its customers and to adequately compensate these customers for the inconvenience caused. At present, all major IT issues have been resolved, and the number of incidents has declined significantly to business-as-usual levels in the sector. The breakdown of the costs related to the remediation plan and recognised in the consolidated income statement for 2018 is shown below: Million euro
22018
Commercial initiatives (includes Classic Plus account) 48.6 NNII and fees & commission income 448.6
Losses due to fraud and other 55.8 OOther operating expenses 555.8
Services provided by independent professionals 39.2 Appeals & communications with customers 98.8
AAdministrative expenses 1138.0
Allocation to provisions for customer redress 142.1 PProvisions 1142.1
TTotal post--mmigration costs 3384.6
As at 31 December 2018 the Group had a provision of 46 million euros to compensate customers for the incidents which arose post-migration, which include the operating costs required to allocate this provision (see Note 22). As at the date of authorisation of these consolidated annual accounts, the investigation mentioned above is still ongoing. The decision to recognise a provision for this item requires the use of judgement in order to determine whether there is a current payment obligation and, if so, to reliably estimate the same. Based on the information available regarding the progress of the aforementioned investigation, the Group’s management considers that the circumstances do not require a provision for potential sanctions to be recognised, as there is currently no payment obligation and, if such obligation were to exist, there is no way to reliably estimate the amount that would need to be disbursed.

242 Banco Sabadell Annual report 2018
NNote 3 – Shareholder remuneration and earnings per share Set out below is the distribution of 2018 Banco de Sabadell, S.A. profits which the Board of Directors will propose to the shareholders at the Annual General Meeting for approval, together with the proposed distribution of Banco de Sabadell S.A.’s 2017 profits, which was approved by shareholders on 19 April 2018:
Thousand euro
2018 2017 To dividends 167,008 392,977 To statutory reserve - 270 To Canary Island investment reserve 383 239 To voluntary reserves 372,475 125,684
Profit for the year of Banco de Sabadell, S.A. 539,866 519,170
Proposed distributions of profits of subsidiaries are subject to approval by shareholders at their respective Annual General Meetings. The Board of Directors will submit a proposal at the Annual General Meeting for the distribution of a gross dividend of 0.03 euros per share for 2018. On 25 October 2018, the Board of Directors agreed to distribute an interim dividend of the 2018 earnings amounting to a total of 110,739 thousand euros (0.02 euros (gross) per share), paid out on 28 December 2018. Pursuant to Article 277 of the Spanish Capital Companies Act, the forward-looking accounting statement prepared as a mandatory requirement to demonstrate the existence of sufficient liquidity and profit at the bank at the time of approving the interim dividend is shown below: Thousand euro
Available for the payment of dividends according to the interim statement at: 30/09/2018 Banco Sabadell profit as at the date indicated, after provisions for taxes 465,560
Estimated statutory reserve - Estimated Canary Island investment reserve -
Maximum amount available for distribution 465,560
Interim dividend, proposed and distributed 110,739 Cash balance at Banco de Sabadell, S.A available (*) 12,604,719
(*) Includes the balance of the heading "Cash, cash balances at central banks and other demand deposits".
The Annual General Meeting, held on 19 April 2018, approved shareholder remuneration, supplementary to the dividend corresponding to 2017, of 0.05 euros per share (281,348 thousand euros), which was paid on 27 April 2018. Previously, in December 2017, shareholders received remuneration in the form of a dividend of 0.02 euros per share, charged to the income statement for 2017, which was paid on 29 December 2017. Earnings per share Basic earnings per share are calculated by dividing the net profit attributable to the Group (adjusted by remuneration in other equity instruments) by the weighted average number of ordinary shares outstanding in the year, excluding any treasury shares acquired by the Group. Diluted earnings per share are calculated by applying adjustments for the estimated effect of potential conversions of ordinary shares to the net profit attributable to the Group and the weighted average number of ordinary shares outstanding.

243Statutory information
The Group’s earnings per share calculations are shown in the following table:
22018 22017
Profit or loss attributable to owners of the parent (thousand euro) 328,102 801,466 Adjustment: Remuneration of other equity instruments (thousand euro) (51,275) (23,517) Profit or (-) loss after tax from discontinued operations (thousand euro) - - Adjusted net profit attributable to the owners of the parent company (thousand euro) 276,827 777,949
Weighted average number of ordinary shares outstanding (*) 5,564,718,978 5,570,031,161 Conversion undertaken of convertible debt and other equity instruments - - Adjusted weighted average number of ordinary shares outstanding 5,564,718,978 5,570,031,161
Earnings per share (euro) 0.05 0.14 Basic earnings per share adjusted for mandatory convertible bonds (euro) 0.05 0.14 Diluted earnings per share (euro) 0.05 0.14
(*) Average number of shares outstanding, excluding the average number of own shares held in treasury stock during the period.
As at 31 December 2018 and 2017, there were no other share-based financial instruments or commitments to employees with a material impact on the calculation of diluted earnings per share for the periods presented. For this reason, basic earnings per share coincide with diluted earnings per share. NNote 4 – Financial risk management 4.1 Introduction During 2018, Banco Sabadell Group has continued to strengthen its risk management and control framework, incorporating improvements which align it with the best practices of the financial sector. Banco Sabadell Group has a Risk Appetite Framework in place which is intended to guarantee the control and proactive management of all of the Group’s risks. This framework is used, among other purposes, to determine the Risk Appetite Statement (RAS), which establishes the quantity and diversity of risks that the Group seeks and tolerates in order to achieve its business objectives, whilst maintaining a balance between return and risk. The Risk Appetite Framework of Banco Sabadell Group takes into account the Group’s international structure in order to ensure a consistent and effective deployment of the Group’s RAS in all geographies. Thus, a first level is established which makes up the Group's RAS, setting general targets and limits, and a second level deploys the targets and limits of the first level to the various geographies. The RAS comprises quantitative metrics that allow risk management to be objectively monitored, as well as qualitative aspects that complement the quantitative aspects and give the Group’s position in relation to risks that cannot be easily quantified. It is worth noting that these quantitative metrics are divided into: Basic first-tier metrics: quantitative aspects that allow the risks undertaken to be objectively monitored and which
enable them to be efficiently controlled and managed, both at Group level and in the various geographies.
Second-tier metrics: quantitative aspects at portfolio level that allow the stock of existing loans as well as the new production (i.e. new lending) to be monitored and which enable the risks undertaken to be efficiently controlled and managed.
The management and control of risks are embodied in a broad framework of principles, policies, procedures and advanced valuation methodologies, forming an efficient decision-making structure within a risk governance framework that is in line with Spanish and European regulations. The risk policies of Banco Sabadell Group are a set of documents that are reviewed regularly, following the established governance. The body ultimately responsible for their approval is the Board of Directors.

244 Banco Sabadell Annual report 2018
For each of the Group's significant risks, the policies describe the principles and critical management parameters, the main people and units involved and their duties (including the roles and responsibilities of the various divisions and committees in relation to risks and their control systems), the associated procedures, as well as monitoring and control mechanisms. The main financial risks faced by Banco Sabadell Group entities as a result of their activity related to the use of financial instruments are credit risk, liquidity risk and market risk. Of these, credit risk is the most significant risk for the Group’s portfolio. The main non-financial risks faced by the Group are operational risk, technology risk, tax risk and compliance risk. In its management of risks, the Group considers the macroeconomic environment and the regulatory environment. The most significant aspects of 2018 are set out below:
Geopolitics have once again been in the media spotlight: Brexit negotiations, the questioning of European tax rules by the new government in Italy, the United States ’protectionist policies, political shifts in certain emerging countries, etc.
The UK government and the EU reached an agreement to enter a transition period starting in March 2019, during which to negotiate the new bilateral relationship. This deal still needs to be approved by the UK Parliament, although the vote has been postponed until early 2019.
The US has started a trade war with China and has also renegotiated NAFTA with Canada and Mexico.
Global economic activity has continued to record relatively high growth rates, supported by factors such as the expansionary nature of the tax policy of countries such as the United States and China, and a monetary policy which is still accommodating in areas such as the Eurozone.
The Spanish economy has maintained its robust growth rates, exceeding the euro area average, although figures have been slightly lower than in previous years.
The UK economy has been affected by the uncertainty surrounding Brexit, while the Mexican economy has been hindered by the political situation.
Financial markets have been increasingly volatile, and they have been more exposed to political events given the gradual normalisation of monetary policies.
The assets and countries that had benefited the most from the search for yield have recorded a more negative performance, as in the case of corporate debt and emerging markets.
The ECB has completed its asset purchase programme and the Fed has continued with its gradual interest rate hikes.
The difference between yields on US and German long-term government bonds has reached its peak since EMU was launched. The political situation in Italy has been one of the determining factors of German bond yields.
The Italian risk premium increased to its highest level since 2013, and this has affected the performance of the Spanish risk premium.
The dollar appreciated against the euro as a result of the widening interest rate spread, political noise in Italy and trade tensions, among other aspects.
The pound has not followed any clear trend in its currency pair with the euro, although it has shown elements of volatility as a result of Brexit negotiations and the domestic political situation.
The Mexican peso has been subjected to high volatility and downward pressures due to the existing political uncertainty.

245Statutory information
The European banking system has strengthened its solvency, increased its profitability and continued making progress in reducing its NPL ratio in 2018. Political and geopolitical uncertainty could exacerbate the risk of a sudden upturn in risk premiums and volatility, which represents the main vulnerability of the European banking sector.
In terms of Banking Union, discussions have focused on the common support arrangements for the Single Resolution Fund (SRF), channelled through the European Stability Mechanism (ESM). Voices have also been raised in favour of making further progress with the European Deposit Insurance Scheme, although the lack of a political agreement has prevented much progress from being made.
In terms of the Capital Markets Union, progress has been limited to the submission of the action plan drawn up by the European Commission on sustainable finances and fintech.
In 2018, the implementation of reforms to the regulatory and supervisory framework has continued, with new requirements entering into force. The various jurisdictions have also made progress with the interest rate benchmark reforms.
Brexit The Group has considered the potential developments and consequences of Brexit in its macroeconomic and financial scenarios. The baseline scenario considers that the UK’s withdrawal from the EU in March 2019 takes place in a way that maintains the trade and regulatory status quo during the transition period. In this scenario, the UK continues to incur the economic costs of the uncertainty associated with the process and the lack of clarity on the final framework for the relationship with the EU. It also considers the relocation of some services, particularly financial services. One of the risk scenarios that the Group is working with (a Cliff Edge Brexit) considers a disorderly Brexit in which the UK leaves the EU without a deal. In this scenario the UK experiences a significant decline in foreign trade, and its economy falls into a lengthy recession. The Spanish economy is particularly affected, given its close links with the UK in terms of trade, tourism and investment. The bank has analysed Spain’s sectoral exposure to the United Kingdom. The forecasts in this risk scenario are aligned with those established by the Bank of England for the stress tests that it carries out for financial institutions. In November, the Bank of England also published the economic implications of the various scenarios for the UK’s withdrawal from the EU. The differences between these scenarios relate to whether the withdrawal takes place with or without a deal and whether the new relationship with the EU is a closer relationship or a less close relationship. The Cliff Edge Brexit scenario considered by the Group is similar, in economic terms, to the worst of the scenarios considered by the Bank of England. The forecasts under the Group’s baseline scenario are similar to those of the Bank of England scenario which considers a withdrawal with a deal and a less close relationship with the EU. Other than the impacts on the real economy, TSB’s exposure to Brexit is relatively limited, given the domestic nature of its activity. From an operational point of view, it does not show any vulnerability in terms of existing contracts with counterparties, cross dependency on financial market infrastructures, reliance on funding markets, etc. As such, it is worth noting that TSB has a low risk profile, with one of the most robust capital positions in the UK (fully-loaded CET1 capital ratio of 19.5%), an evenly distributed balance sheet between loans and deposits (loan-to-deposit ratio of 104%) as well as a loan portfolio in which over 90% of loans are secured with a mortgage. The quality of its mortgage portfolio is also very high, with an average LTV of 44%, and it has a relatively low exposure to London and high risk segments.

246 Banco Sabadell Annual report 2018
4.2 Key milestones during the year 4.2.1 Improvement of the Group’s risk profile during the year The Group’s risk profile during 2018 has mainly improved for three reasons:
(i) International diversification
- International credit risk exposures (45,225 million euros) account for 31.0% of the Group’s total exposure, six times more than in 2014.
- The increase in the Group’s international diversification continues to be largely due to the acquisition of TSB, with an exposure of 34,151 million euros. TSB’s portfolios are following a stable trend and have a remarkably low risk profile (over 90% in retail mortgages with an average LTV of 44%). TSB is also continuously improving its portfolio composition by reducing exposures in its Interest Only and Buy to Let portfolios.
- Similarly, international growth since 2014, excluding the effect of the acquisition of TSB, stands at 65% (even when taking into account the sale of Sabadell United Bank in July 2017), with business growth rates in Mexico being particularly noteworthy.
(ii) Concentration risk
- Reduction of real estate exposures (reduced by one third since 2014) and increase of exposures to the retail
segment following the acquisition of TSB in 2015. - From a sectoral point of view, the portfolio is well diversified with an upward trend in sectors with high credit
quality. In terms of individual concentration, concentration risk metrics of large exposures have also been reduced.
- In geographical terms, the portfolio is positioned in the most dynamic regions, both nationally and internationally.
(iii) Quality the loan book
- During 2018, non-performing assets at Group level have been reduced by 1,518 million euros, and it is also
important to note that this decline does not include the impact of the institutional portfolio sales announced in the second quarter of 2018.
- Throughout 2018, the Group has closed a number of transactions for the institutional sale of non-performing assets, disposing of practically all of the problematic exposures of the Group's balance sheet.
- In parallel, the Group continues to reduce its volume of loans classified as Stage 3, in line with the trends of recent years. Since 2013, non-performing exposures have been reduced by 63.5%, with the balance falling to 11,401 million euros.
- The foregoing has led to a reduction of the Group’s NPL ratio from 5.14% to 4.22%. The improvement in the Group’s fundamentals, particularly in terms of risk, is reflected in the Investment Grade rating assigned by all of the credit rating agencies that rate its debt (see Directors ’Report - Other significant information), with highlights including the upgrade in the long-term credit rating assigned by S&P to BBB from BBB- on 6 April 2018 and the improvement in the outlook to positive (from stable) by DBRS Ratings Limited on 16 July 2018, confirming the long-term rating of BBB (high). 4.2.2 Strengthened risk management and control environment Planning and control of existing stock and new production During 2018, the risk management and control environment has been further strengthened by preparing and deploying credit risk management and control frameworks for certain portfolios, sectors and geographies, providing a powerful tool that allows the Risk Appetite Framework to be implemented and guides the growth of lending, seeking to optimise the duality between long-term profitability and risk. Each such framework defines the Group’s risk appetite in each sector or portfolio and the requirements to achieve it, establishing: Asset allocation, setting the growth targets in each key pillar (quality, type, etc.). General criteria that should govern activity in each portfolio, sector or geography. Basic policies for the approval and monitoring of loans and credit. Risk monitoring and control metrics (for both existing and new stock).

247Statutory information
Lastly, the set of management and control frameworks, together with ongoing planning and management, allow portfolio performance to be anticipated, enabling the Group to guide the growth in a way that is profitable in the long term. Asset Allocation / Sectoral Strategic Debate The Sectoral Strategic Debate arises in the context of the Risk Appetite Framework (RAF) and the Risk Appetite Statement (RAS), and is one of the key developments that have taken place since 2014 in the creation of the Sectoral Risk Management and Control model of Banco Sabadell Group. As a result of this initial development, the following steps were taken: Definition and calculation of key metrics to monitor and manage sectoral concentration risk and their subsequent
incorporation into the RAS as first-tier metrics. Creation of the Sectoral Analysis Division, reporting to the Chief Economist. Generation of a ‘correlated sectorisation model’, i.e. a model which considers all interrelated aspects of a given
supply chain and pools them together into a single sector, thereby creating a model in which each sector represents a more comprehensive concept, following an approach that focuses on risk management and thus enabling the existing expert model to be improved.
In this same context, a decision was made to create a mechanism that would allow all of the current outlooks of the Group in relation to sectoral risk to be integrated. This determined the need to promote a Sectoral Strategic Debate in order to establish the Group’s sectoral asset allocation strategy, integrating to this end the various existing outlooks within the organisation in relation to the various economic activity sectors. The project pursues the following objectives:
(i) Obtain the Group’s sectoral strategic outlook. (ii) Detect growth opportunities as well as undesirable scenarios. (iii) Define mechanisms to achieve the agreed objectives.
Pricing system that guarantees alignment with credit risk Pricing process in which prices are assigned on the basis of the cost, risk and capital allocated at transaction level, which is particularly important in the current environment of very competitive pricing. The Group uses Risk adjusted Return on Capital (RaRoC) as a key risk screening factor to ensure the existence of a framework that measures return on the basis of risks and that contributes a coherent outlook of profitability using the various portfolios. 4.2.3 Improvement of monitoring environment In 2018, the Group has continued to strengthen its customer credit risk monitoring environment, incorporating the sectoral strategic outlook into the monitoring environment and using this outlook on a forward-looking basis in order to anticipate the needs of its customers. The early warnings system is incorporated into management procedures through a monitoring environment that allows different strategies to be implemented depending on the segment (individuals, retailers and self-employed, and corporates). The main input used in this monitoring environment is taken from the early warning models adapted to different segments. This leads to: Improved efficiency by focusing monitoring activities on customers with signs of impairment. Forward-looking management when there are signs of deterioration, in which the Basic Management Team is
responsible for renewing the rating of customers in which there has been an impairment. Customers whose situation remains unchanged and who have been evaluated by the Basic Management Team to
be regularly monitored. Feedback using the information provided by the Basic Management Team as a result of this management.

248 Banco Sabadell Annual report 2018
44.2.4 Improvement in the management of non-performing asset risk During 2018, in compliance with the requirements set forth by the European Central Bank in its document “Guidance to Banks on Non-Performing Loans”, the Board of Directors has approved the second version of its “Strategic plan for the management of non-performing assets ”as well as the corresponding update of the “Operational Plan for the management of non-performing assets”. The key points of the Strategic Plan are: Management principles for these assets, A governance and management structure that allows these objectives to be achieved, and Quantitative objectives with different time horizons, to reduce both assets classified as Stage 3 and foreclosed
assets. In order to achieve these results, the bank has set itself three strategic priorities in relation to the management of non-performing assets: Continuous reduction of non-performing assets until full de-risking has been achieved. Focus on the management of non-performing assets through the specialised management of its Asset
Transformation and Industrial and Real Estate Investees Division, one of the first ‘workout units ’in Spain. Maintenance of solid and adequate coverage levels of its non-performing assets.
These three strategic priorities translate into six principles for the management of non-performing assets, which are: Early default management and the preventive management of potential new entries into default. Segmented management of all non-performing and potentially non-performing loans (potential default). Large-scale reduction of non-performing loans and foreclosed assets that have been on the balance sheet the
longest. Business intelligence and continuous improvement of processes. Financial capacity. Clear governance system based on three lines of defence.
The Strategic Plan for the management of Non-Performing Assets (NPAs) and the objectives included therein are fully integrated into the bank’s risk management and control mechanisms, given that: The 2020 Plan and the Budget are fully consistent therewith, They are included in the risk appetite framework (RAF), where the risks relating to NPAs are considered significant
and are therefore subject to specific policies and metrics, They have been taken into account in risk assessment processes, capital planning, stress tests and in the
quantification of economic capital as part of the ICAAP and, lastly, They have been incorporated into other tools used by the organisation (ILAAP, Recovery Plan, etc.)
In view of the foregoing, the actions set out in the Strategic Plan and in the Operational Plan in relation to NPAs are successfully implemented throughout the entire organisation. 4.3 General principles of risk management. 4.3.1 Corporate risk culture The risk culture of Banco Sabadell is one of the factors that set it apart, and it is firmly rooted throughout the organisation as a result of its progressive development spanning over decades. The aspects that characterise this strong risk culture include: A high level of involvement of the Board of Directors in risk management and control procedures. Since before
1994, there has been a Risks Committee in the bank, whose main function is to oversee the management of all significant risks and align these with the risk profile defined by the Group.
Banco Sabadell Group has had a Risk Appetite Framework in place since 2014. It includes the Risk Appetite
Statement, which guarantees the control and proactive management of risks under a strengthened framework of corporate governance, which has been approved by the Board of Directors.
A Basic Management Team as a key player in the acceptance and monitoring of risk. The team has existed for
more than 20 years, and is formed of the account manager on one hand, and the risk analyst on the other. Risks are managed based on the points of view expressed by each party. Decisions must always be discussed and agreed on by all of the parties involved. This ensures that the Commercial and Risks units work together as a single

249Statutory information
team and guarantees their involvement in decision-making processes, contributing to the quality of discussions and the soundness of the conclusions reached, while improving customer experience.
Proactive management agreed to by the Basic Management Team regarding actions that need to be taken with
customers, in terms of both growth and prevention, by applying a forward-looking management of the shared portfolio.
Career paths that offer the opportunity to work as part of both the Commercial team and the Risks team, which allows staff to increase their cross-functional duties, contributes to their professional growth and allows them to increase their knowledge of customers by providing them with a unique and overall outlook.
High degree of specialisation: there are specific management teams for each segment (Real Estate, Corporate
Banking, Corporates, SMEs, Retailers, Banks and Countries, etc.), which allows a specialised risk management process to be implemented in each area.
Advanced internal credit rating models that have served as a fundamental element of decision-making processes for over 15 years (since 1999 for individuals and since 2000 for corporates). The Group, in accordance with the relevant best practices, applies these models to improve the overall efficiency of the process. These models not only allow borrowers to be organised in ordinal terms, but they also provide a basis for a quantitative risk measurement, and they can therefore be used in various key management processes: finetuning the conferral of powers, efficient risk monitoring, Group-wide risk management, risk-adjusted returns and the Group's capital adequacy assessment are just some examples.
The conferral of powers to approve corporate risk transactions at various levels is based on the level of exposure
and expected losses. As a general policy in relation to the conferral of powers, the Group has opted for a system in which different levels are determined using the Expected Loss metric, which takes into account the credit risk exposure of the customer’s transaction pending approval, the risk group, the expected default rate and the estimated loss given default.
Rigorous credit risk monitoring, supported by an advanced system of early warnings for corporates and individuals,
which is integrated into a tool with a comprehensive and forward-looking vision of customers. Risk monitoring at customer and risk group level can be divided into three types: operational, systematic and comprehensive. One of the key sources for this risk monitoring is the implementation of an early warning indicator system for both corporates and individuals (started in 2008 and 2011, respectively) which allows credit risk to be anticipated. These warnings are based on internal information such as, for example, the number of days in non-performing status, overdrawn invoice discounting facilities, bank guarantees and international credit, as well as external information, such as customers classed as defaulters in the rest of the financial system or in information available from credit bureaux.
Advanced non-performing asset risk management model that strengthens the anticipation and specialised
management of this risk. A comprehensive management model which allows different options to be applied to situations in which default is most likely (early default management, refinancing, collections, etc.). This comprehensive system uses specific tools (simulators to help find the best solution on a case-by-case basis), as well as managers who specialise in the different segments and who are dedicated exclusively to this task.
Risk-adjusted pricing. The business policy in respect of price management is dynamic, and adapted to the
economic and financial environment of the market (liquidity premiums, difficulty of accessing credit, interest rate volatility, etc.). The cost of funding and cost of risk (expected credit loss and cost of capital) are taken into account in order to avoid adverse selection caused by an inadequate identification of the risk involved. Risk models are a key element in pricing and profitability objectives.
The risk management model is fully integrated into the bank’s IT platform, in such a way that all policies can be
immediately transferred for daily management: the policies, procedures, methodologies and models that make up the risk management model of Banco Sabadell are technically integrated into the bank’s operational platform. This aspect has been particularly significant in the Group’s acquisitions.
Use of stress testing as a risk management tool: For years, Banco Sabadell has been working with an internal tool
to conduct stress tests, working together with internal teams with extensive experience in carrying out these tests.

250 Banco Sabadell Annual report 2018
44.3.2 Risk Appetite Framework The Risk Appetite Framework includes, among others, the Risk Appetite Statement, which is defined as the quantity and diversity of risks that Banco Sabadell Group seeks and tolerates in order to achieve its business objectives, whilst maintaining a balance between return and risk. The Risk Appetite Statement (RAS) comprises quantitative metrics which allow the achievement of the established targets and limits to be objectively monitored, in addition to qualitative elements that complement these metrics and govern the Group’s risk control and management policy. Quantitative elements The quantitative metrics of the RAS are divided into nine general areas: Capital and Solvency: level and quality of capital. Liquidity: liquidity buffers and funding structure. Profitability: balance between return and risk. Asset Quality: for different significant risks and in stress scenarios. Credit and Concentration: individual and sector-wide. Market Risk. Structural Interest Rate and Exchange Rate Risk. Counterparty Credit Risk. Operational Risk.
Qualitative aspects As a supplement to the above quantitative metrics, the following qualitative principles should be used to guide the Group’s risk management and control: The general position maintained by the Group with regard to risk-taking aims to achieve a medium-low risk profile
through the use of a prudent and balanced risk policy that ensures the profitable and sustainable growth of its activity, and that it is in line with the strategic objectives of the Group, in order to maximise the generation of value whilst guaranteeing an adequate level of solvency.
The Board of Directors is committed to risk management and control procedures: it approves policies, limits, the
management model and procedures, as well as methodologies for risk measurement, monitoring and control. The Group maintains a risk culture that is embedded throughout the institution, and has various units that
specialise in addressing different risks. The risk function conveys this culture by introducing policies, implementing and starting up internal models, and adapting these to the risk management processes.
The risk management policies and procedures are geared towards adapting the risk profile to the Risk Appetite
Framework, whilst maintaining a balance between the expected return and risk. The risk control and management system in Banco Sabadell Group is set up as an extensive framework of
principles, policies, procedures and advanced assessment methodologies that are integrated into an efficient decision-making structure. The risk variable is taken into account when making any kind of decision and quantified in terms of allocated capital using a common measurement method.
Risk management requires sound and ongoing control procedures to keep risks within the pre-defined limits, with
clear-cut responsibilities for identifying and monitoring early warning and other indicators, as well as an advanced risk assessment methodology.
The levels of capital and liquidity should be sufficient to cover the risks undertaken by the institution, including in
unfavourable economic scenarios. There should be no risk concentration levels that could significantly compromise own funds.
The objectives behind accepting market risk for trading purposes are to handle the flow of transactions produced
by customers ’operations and to seize market opportunities, whilst maintaining a position that is in line with the bank’s market share, risk appetite, risk-taking capacities and risk profile.

251Statutory information
The risk function is independent and Senior Management has a high degree of involvement. This guarantees a strong risk culture focused on protecting and ensuring an adequate rate of return on capital.
The Group’s aim in terms of tax risk is to ensure compliance with its fiscal obligations whilst guaranteeing an
adequate return for shareholders. The achievement of the business objectives must be compatible, at all times, with compliance with the law and the
application of best practices. The Group will have the necessary human and technological resources in place to monitor, control and manage all
risks that may arise during the course of its activities. The Group’s remuneration systems should align the interests of employees and Senior Management with
compliance with the Risk Appetite Framework. 44.3.3 General Organisation of the Risk Function The Group has a risk culture that is embedded throughout the organisation, with units that specialise in handling the different types of risks, thereby guaranteeing the independence of the risk function and a close involvement of Senior Management. The Board of Directors is the body responsible for setting forth general guidelines on the organisational structure of risk management and control functions and for determining the main strategies in this regard. It is the body responsible for approving the Risk Appetite Framework (prepared together with the Chief Executive Officer, the Chief Risk Officer and the Chief Financial Officer) and ensuring that it is aligned with the institution’s short- and long-term strategic objectives, as well as with the business plan, capital planning, risk-taking capacity and remuneration schemes. There are four Delegated Committees in operation to which the Board of Directors delegates functions by making use of the powers conferred to it in the Articles of Association. These Committees report to the full Board on the performance of their activities and report on any decisions made.

252 Banco Sabadell Annual report 2018
The Group has established its Control Framework based on the model of Three Lines of Defence, which is structured around the following assignment of duties:
FFirst Line of Defence, consisting mainly of business units and corporate centres, among the most noteworthy of which are the Risk Management Division, the Financial Division, the Treasury and Capital Markets Division and the IT Control Division. The first line of defence is responsible for the management of risks inherent in the bank’s activity, mainly in the acceptance, monitoring, measurement and assessment of risks and associated processes.
They are responsible for implementing corrective actions to correct weaknesses in their processes and controls. The core responsibilities attributed to this line under the control framework are:
– Maintaining effective internal controls and performing risk assessment and control procedures on a daily
basis; – Identifying, assessing, controlling and mitigating risks, following internal policies and procedures and
ensuring that activities are consistent with the bank’s targets and objectives; – Implementing adequate management and oversight processes to guarantee compliance and which focus
on control errors, inadequate processes and unforeseen events.
Second Line of Defence, consisting mainly of: – The Risk Control Division, which is independent of the first line of defence and is responsible for
identifying, assessing, monitoring and controlling the Group’s significant risks and for providing information about such risks.
– The Compliance Division, which aims to minimise the risk of failing to comply with regulations and seeks to ensure that any instances of non-compliance are identified, reported and diligently resolved and that the appropriate preventive measures are implemented.
– The Internal Validation Division, which is responsible for reviewing these models and ensuring that they work as expected and that the results obtained from them are appropriate to their various uses, both internal and regulatory.
In general, the second line of defence ensures that the first line of defence is well designed and performs its assigned duties. It also puts forward suggestions for its continuous improvement. The core responsibilities attributed to this line under the control framework are:
– Proposing the risk management and control framework. – Guiding and ensuring the implementation of risk policies, defining responsibilities and objectives for their
effective implementation. – Cooperating in the implementation of risk management processes and controls. – Identifying changes in the underlying risk appetite of the organisation. – Verifying compliance with regulations applicable to the Group in the performance of its business activities. – Providing the technological infrastructure for risk management, measurement and control. – Analysing and comparing existing and future incidents by reviewing available information. – Ensuring that the models work as expected and that the results obtained from them are appropriate to
their various uses, both internal and regulatory. – Promoting and pursuing the highest possible levels of compliance with current legislation and professional
ethics within the Group. – Guaranteeing both the continuity of ordinary business activities and the security of the information on
which such activities are based.
As a TThird Line of Defence, the Internal Audit Division:
– Conducts an independent and objective verification and advisory service, governed by a philosophy of adding value and helping the Group to achieve its objectives.
– It helps the Group to achieve its objectives by providing a systematic, disciplined approach to evaluate the sufficiency and effectiveness of the organisation’s governance processes and its risk management and internal control activities.
4.3.4 Planning and stress testing exercises Banco Sabadell Group has an internal process for conducting planning and stress testing exercises in which teams with extensive experience in such exercises take part and which involves carrying out an in-depth analysis of the evolution of the Group’s income statement and balance sheet in a specific scenario.

253Statutory information
The risk forecasting models represent a key aspect of the Group’s management activities, as they enable an assessment to be made of the ways in which diverse economic scenarios could impact the Group’s solvency and its compliance with the target risk appetite. These scenarios set out the main risk factors that could affect the Group's results and solvency. Three general uses of the forecasting techniques developed by the Group have been identified: preparation of the Strategic Business plan, performance of internal stress tests and execution of regulatory stress tests. The various internal forecasting exercises, Strategic Business Plan and stress tests are not carried out independently; they share certain common factors in terms of the definition of the economic scenarios used for such purposes and also in relation to other exercises such as liquidity stress tests and the development of Recovery Plans. The internal economic scenarios are described in terms of the main macroeconomic aggregates (GDP, unemployment rate, etc.) and in terms of financial variables (housing prices, interest rates, exchange rates, etc.) and they generally follow the structure described below: • Baseline scenario: this is the most likely economic scenario and it is used to prepare the Strategic Business Plan
and also as the baseline scenario for the internal capital adequacy assessment process (ICAAP) and the internal liquidity adequacy assessment process (ILAAP).
• Global adverse systemic scenario: this is an adverse scenario which, while plausible, is unlikely to materialise and which considers a global recession. This scenario is used as the most adverse scenario when preparing the ICAAP and it is also shared with the ILAAP.
• Specific adverse scenarios: these are adverse scenarios that reflect situations which are relevant in terms of the Group’s specific risk profile, e.g. Brexit developments.
• Recovery scenario: this is the most adverse scenario possible. It is based on the global adverse systemic scenario but includes an additional level of stress which makes it suitable to the purposes of the recovery plan.
Strategic Business Plan The Group prepares a Strategic Business Plan which sets out the institution’s strategy over a certain period of time (currently 2018-2020). The Plan is also monitored on a regular basis, and it is updated every year to ensure it takes into account the most recent evolution of the portfolios and risks undertaken by the Group. This projection is carried out on the basis of the most likely economic scenario for the key geographies (baseline scenario), and it is also included in the ICAAP as a baseline scenario. The economic scenario is described in terms of the key risk factors impacting the Group’s income statement and balance sheet. The projection exercises of the Strategic Business Plan and its monitoring are integrated into management procedures, as they set out the key aspects of the Group’s strategy in the medium and long term. The Plan is prepared at business unit level, on the basis of which the Group manages its activity, and annual profit and loss is also assessed in terms of compliance with the target risk appetite. Together with the internal stress test results, the outcomes of the projections used to prepare and monitor the Strategic Business Plan make up a necessary input to assess the suitability of the thresholds (targets or tolerance limits) defined in order to quantify the Group's risk appetite. Internal Stress Test Under the framework of the ICAAP, the Group regularly carries out multi-year stress testing exercises (over a 3-year projection period) in order to assess the potential impacts that adverse economic scenarios could have on the Group's solvency and the compliance with its Risk Appetite Framework. The macroeconomic scenarios are designed and selected to reflect feasible but unlikely adverse situations which have also been adjusted in line with the particular characteristics of the Group’s business: composition and geographical location of the risks. The Group's internal stress testing exercises are integrated into its management procedures. They assess the impact of adverse economic scenarios on the level of compliance with the Risk Appetite Framework, as well as the impact of a potential adverse scenario on each business unit. The results of the exercise are sent to the governing bodies for approval, thereby ensuring that the Group’s management team has access to the necessary information to assess the Group's solvency and situation in terms of compliance with its risk appetite under adverse scenarios. The results of these types of exercises are used as input for the review and definition of the different thresholds (targets and tolerance limits) relating to the metrics used to define the Group’s risk appetite. These scenarios are complemented with the identification of specific events, under the framework of the reverse stress testing exercises, which could represent significant risks for the Group's solvency.

254 Banco Sabadell Annual report 2018
Regulatory Stress Test The Group takes part in regulatory stress tests conducted by the European Banking Authority together with competent national authorities, the European Central Bank and the European Systemic Risk Board. These exercises are carried out every two years and cover the main risks undertaken by the Group. They assess the level of solvency of institutions under a baseline scenario and under an adverse scenario over a three-year time horizon which serves as a basis for establishing Pillar 2G. The main new feature in 2018 compared to the previous stress tests was the inclusion of IFRS 9 when projecting credit losses. The Group carries out its regulatory stress test using existing internal approaches, although these are subject to the methodological restrictions of the regulatory stress test. This allows the results of the regulatory stress test to be analysed and considered during internal processes and provides an additional input with which to assess the internal stress tests, and vice versa. The results of the tress tests, in the same way as other forecasting exercises, are submitted to the Group's management bodies for approval. 4.4 Management and monitoring of the main significant risks 44.4.1 Credit risk Credit risk refers to the risk of incurring losses as a result of borrowers ’failure to comply with payment obligations, as well as experiencing a loss of value due to the deterioration of borrowers ’creditworthiness. 4.4.1.1 Credit risk management framework Acceptance and monitoring Credit risk exposures are rigorously managed and monitored through regular assessments of borrowers ’creditworthiness and their ability to honour their payment obligations undertaken with the Group, adjusting the exposure limits for each counterparty to levels that are deemed to be acceptable. It is also normal practice to mitigate credit risk exposures by requiring borrowers to provide collateral or other guarantees to the bank. The Board of Directors grants powers and discretions to the Executive Committee to allow the latter to delegate responsibilities to different decision-making levels. The implementation of authority thresholds in credit approval management systems ensures that the conferral of powers established at each level is linked to the expected loss calculated for each transaction requested. To optimise the business opportunities provided by each customer and guarantee an appropriate level of security, responsibility for accepting and monitoring risks is shared between the account manager and the risk analyst who, by maintaining effective communication with the corresponding units, are able to obtain a comprehensive (360°) and forward-looking view of each customer’s individual circumstances and needs. The account manager monitors the business aspect through direct contact with customers and by handling their day-to-day banking activity, whilst the risk analyst takes a more system-based approach making use of his/her specialised knowledge.

255Statutory information
The implementation of advanced risk management methodologies (adapted to the New Basel Capital Accord and best practices in the industry) also benefits the process in ensuring that proactive measures can be taken once a risk has been identified. Of vital importance in this process are tools such as credit rating systems for corporate borrowers and credit scoring systems for retail customers, as well as early warning indicators for monitoring risk. These are integrated into a single tool that provides a comprehensive and forward-looking vision of customers. The analysis of indicators and early warnings, in addition to credit rating reviews, allows an integrated and continuous measurement to be made of the level of the accepted risk. The establishment of efficient procedures to manage performing loans also benefits the management of past-due loans by enabling a proactive policy to be devised based on a preliminary identification of any cases with propensity to default. Risk monitoring is carried out for all exposures in order to identify potentially problematic situations and prevent the deterioration of credit quality. In general, this monitoring is based on early warnings systems at both transaction/borrower level and at portfolio level, and both systems use the firm’s internal information and external information in order to obtain results. The monitoring is carried out prior to any default and on a forward-looking basis, i.e. with an outlook based on the foreseeable future development of circumstances, in order to determine both actions to strengthen the business (increase lending) and prevent risk (risk mitigation, improvement of guarantees, etc.). The early warnings system allows an integrated measurement to be made of the level of the risk taken and allows it to be transferred to recovery management specialists, who determine the different types of procedures that should be implemented. Therefore, based on risks in excess of a set limit and predicted default rates, groups or categories are established to be treated individually. These warnings are additionally managed by the account manager and the risk analyst. NPA risk management Generally, during stages of weakness of the economic cycle, debt forbearance and restructuring are the main risk management techniques used. The bank’s objective, when faced with debtors and borrowers that have, or are expected to have, financial difficulties to honour their payment obligations under the agreed contractual terms, is to facilitate the repayment of the debt by reducing the probability of default as much as possible. A number of common policies to achieve this are in place in the institution, as well as procedures for the approval, monitoring and control of potential debt forbearance (refinancing and restructuring) processes, the most significant of which are the following: The availability of a sufficiently detailed compliance record for the borrower and a manifest intention to repay the
loan, assessing the period of time during which the customer is likely to continue experiencing financial difficulties.
Forbearance and restructuring conditions based on a realistic repayment schedule which is in line with the borrower’s current and expected repayment capacity, preventing issues being put off until a later date.
If new guarantees are provided, these must be regarded as a secondary and exceptional means for recovering the debt, so as to avoid adversely affecting existing means. All ordinary interest accrued must always be paid up to the refinancing date.
A maximum length is applied to grace periods. The Group continually monitors compliance with the agreed terms and conditions and with the above policies. Internal risk models Banco Sabadell Group also has a system in place which is made up of three lines of defence to ensure the quality and oversight of internal models, as well as a governance process which has been specifically designed to manage and monitor these models and to ensure compliance with regulations and the Supervisor’s instructions.
256 Banco Sabadell Annual report 2018
The governance framework of internal credit risk and impairment models (risk management, regulatory capital and provisions) is based on the following pillars: Effective management of changes to internal models. Ongoing monitoring of internal models. Regular reporting, both internal and external. Management tools for internal models.
One of the main bodies within the governance framework of internal credit risk and impairment models is the Models Committee, which meets on a monthly basis and carries out internal approval functions, depending on the levels of materiality of the risks, and which also monitors internal credit risk models. Banco Sabadell Group also has an advanced NPA risk management model in place to manage the impaired assets portfolio. The purpose of managing NPA risk is to identify the best solution for the customer upon detecting the first signs of impairment, whilst reducing the entry into default of customers with financial difficulties, ensuring the smooth progression and consistent management across the different phases. For further quantitative information, see Schedule VI “Other risk information: Forbearance”. Real estate credit risk management As part of its general policy on risks and, in particular, its policy on the construction and real estate development sector, the Group has a number of specific policies in place for mitigating risks. The main measure being implemented is the continuous monitoring of risks and the reappraisal of borrowers ’financial viability based on their new economic circumstances. If the results of the reappraisal are satisfactory, the existing arrangements continue on the basis agreed, with new commitments being required where appropriate in light of the new circumstances. The policy to be implemented depends in each case on the type of asset being financed. For completed developments, sale support actions are carried out through the Group's distribution channels, setting a competitive price to attract buyers and providing final buyers with access to financing, provided they comply with risk requirements. For works in progress, the main objective is to complete the work, provided that the market is able to absorb the resulting supply of property based on short and medium term market expectations. For land-related loans, the saleability of properties to be built on the site is the key consideration in deciding on the provision of finance for construction. Where monitoring and scrutiny of a borrower’s position do not indicate a reasonable degree of viability, the solution may take the form of a surrender of assets in settlement of the debt and/or the purchase of assets. Where a solution of this kind is not practicable, legal proceedings will be taken, leading to subsequent foreclosure of the assets. All assets taken into possession by the Group, whether by surrender in settlement of debt or by purchase, or as a result of legal proceedings, to ensure collection or to execute other lending improvements are mainly foreclosed tangible assets received from borrowers and other obligors of the bank, to satisfy financial assets representing the bank’s collection rights, and are actively managed with the primary purpose of divestment. In terms of the stage of completion of the construction process of real estate assets, three strategic lines of action have been established: 1. New lending: real estate development business A commercial unit was established at the end of 2014, for the exclusive management of new funding for real estate developers, having identified the requirements of the market and the solvency of its new players. A new monitoring approach was developed for this unit, which enables the Group to have a detailed knowledge of the projects being considered in the unit (including the land area for sale, the number of units being sold, the construction budget and the extent of pre-marketing activities).

257Statutory information
In parallel, a new “Real Estate Analysis ”division has been created, responsible for analysing all of the real estate projects that the bank is considering awarding funding to from a perspective of real estate business only, analysing the location and suitability of the product, as well as the potential current supply and demand, and comparing in each case the figures of the business plan submitted by the customer (particularly costs, sales and timelines) against these aspects. The new analysis model is coupled with a model for monitoring approved real estate development projects. The progress of each real estate development project is monitored using standardised reports in order to control drawdowns and the compliance with the business plan (sales, costs and timelines). The new management model has allowed a system of warnings to be developed for monitoring purposes, which is used by both the “Analysis and monitoring ”division and the “Risks ”division, both of which were involved in the process to define the system. In addition to warnings for already approved real estate development projects, new funding uses the “real estate development framework”, which defines the optimum allocation of the new business on the basis of the quality of the customer and development project. 2. Management of problematic real estate exposures Problematic exposures are managed in line with the defined policy. In general, they are managed taking into account the customer, guarantees and status of the loan (from the time when a warning is triggered, warning of a potential deterioration of the current status, up until the properties are surrendered in payment of debt (payment in kind) / purchased in an amicable settlement, or until an auction is held following a mortgage enforcement process and whenever there is a ruling in favour of foreclosure). After analysing the three aforementioned aspects, an optimum solution is sought to stabilise or settle the position (whether through an amicable settlement or through judicial proceedings), which differs depending on the evolution of each customer / case. Cases in which the stabilisation or settlement of the loan by the customer is not a feasible option are managed using support models on the basis of the type of loan or funded property. In the case of completed real estate developments or completed non-residential properties, customers are given the option to sell the assets via Solvia at competitive prices. In the case of plots of land, they can be given the option to increase the debt to develop housing projects if the internal teams at Banco Sabadell identify a demand for housing in that location and are responsible for controlling their investment and marketing. For other funded real estate, the possibility of closing sale agreements with third parties is considered and amicable settlement solutions are proposed (purchase, payment in kind, which in the case of properties owned by retail customers can be coupled with favourable conditions for relocation or social renting depending on the needs of the customer) or else judicial proceedings are initiated. 3. Management of foreclosed assets Once the loan has been converted into a real estate asset, a management strategy is defined depending on the type of asset and its location, in order to identify the potential of each asset according to its potential demand. The main disposal mechanism is the sale of the asset, for which the bank, through Solvia, has developed different channels on the basis of the type of property and customer. The success of these sales channels is reflected in the high volumes of properties that are sold year after year, the significant growth in the volume of sales of non-residential properties, land ready for development and plots under management. This growth began when the market began to show a greater interest in these types of assets and customers began to entrust the sale of their properties to Solvia. A decision has been made to invest in certain land sites and plots under management with a high potential demand located in markets for which significant price increases are expected, in order to optimise the revenue from such assets considering the forecast income and applying conservative growth assumptions.

258 Banco Sabadell Annual report 2018
The Group, given the past significance of high concentrations of this type of risk, has a first-tier RAS metric in place which establishes a maximum level of concentration of exposures associated with real estate developments based on the TIER 1 capital in Spain. This metric is monitored on a monthly basis and reported to the Technical Risks Committee, the Risks Committee and the Board of Directors. Lastly, it is worth highlighting that the Risk Control Division, together with the Business and Risk Management divisions, regularly monitors the adequacy of new loans granted to real estate developers. The monitoring process includes a review of compliance with policies and asset allocation. Results of this monitoring exercise are escalated to the Technical Risks Committee for information. For further quantitative information, see Schedule VI “Credit risk: Risk concentration and exposure to the construction and real estate development sector”.
4.4.1.2. Risk management models Rating Credit risks incurred with corporates, real estate developers, specialised lending projects, financial institutions and countries are rated using a rating system based on predictive factors and an internal estimate of the probability of default. The rating model is reviewed annually based on the analysis of performance patterns of defaulted loans. A predicted default rate is assigned to each internal credit rating level, which also allows a uniform comparison to be made against other segments and ratings assigned by external credit agencies using a master ratings scale. %
BBreakdown of Sabadell corporates portfolio by rating 9 8 7 6 5 4 3 2 1 0 TTOTAL
0.37% 8.27% 21.44% 21.78% 29.58% 13.12% 4.17% 0.96% 0.25% 0.06% 100% Includes sovereigns, corporates and financial institutions
Credit scoring In general, credit risks undertaken with individual customers are rated using credit scoring systems that are based on a quantitative model of past statistical data, and which identify the relevant predictive factors. In geographies in which credit scoring takes place, the latter is divided into two types: Behavioural scoring: the system automatically classifies customers based on information regarding their activity and on each product which they have acquired. These scores are mainly used in: approving transactions, setting (authorised) overdraft limits, advertising campaigns, monitoring and segmentation of claims and/or recovery procedures. Reactive scoring: this is used to evaluate applications for consumer loans, mortgage loans and credit cards. Once all of the data relating to the transaction has been entered, the system calculates a result based on the estimated repayment capacity, financial profile and, if applicable, the level of assets pledged as guarantees. If no credit scoring system exists, individual assessments supplemented with policies are used instead. %
BBreakdown of individuals portfolio by rating 9 8 7 6 5 4 3 2 1 0 TTOTAL
0.80% 4.13% 15.14% 35.21% 23.48% 12.78% 5.49% 1.69% 0.58% 0.69% 100% Does not include transactions originating in TSB, or individuals' transactions originating in Banco CAM, BMN-Penedès, Banco Gallego and Sabadell Solbank (formerly, Lloyds Bank)

259Statutory information
Warning tools In general, Banco Sabadell Group has a system of warning tools in place, which include both individual warnings and advanced early warning models for both the Corporates sector and the Individuals sector. These warning tools are based on behavioural factors obtained from available sources of information (credit rating or credit scores, customer files, balance sheets, CIRBE (Bank of Spain Central Credit Register), information relating to the industry or past banking activity, etc.). They measure the risk presented by the customer on a short-term basis (predicted propensity to default), obtaining a high level of predictability to detect potential defaulters. The resulting rating or score, which is obtained automatically, is used as a basic input in monitoring the risk of corporates and individuals. This warnings system enables:
Efficiency to be improved, as monitoring exercises focus on customers with the lowest credit rating or credit score (different cut-off points for each group).
The institution to anticipate actions required to manage any negative change in the situation of the customer (change in rating, new severe warnings, etc.).
Customers whose situation remains unchanged and who have been evaluated by the Basic Management Team to be regularly monitored.
4.4.1.3. Credit risk exposure The tables below show the breakdown, by headings of the consolidated balance sheet, of the Group’s maximum gross exposure to credit risk as at 31 December 2018 and 31 December 2017, without deducting collateral or credit enhancements received in order to ensure compliance with payment obligations, broken down by portfolios and in accordance with the nature of the financial instruments: Thousand euro
MMaximum credit risk exposure NNote 22018 22017 FFinancial assets held for trading 3324,691 1131,761
Equity instruments 9 7,254 7,432 Debt securities 8 317,437 124,329
NNon--ttrading financial assets mandatorily at fair value through profit or loss 1141,314 339,526
Equity instruments - 39,526 Debt securities 8 141,314 -
FFinancial assets at fair vvalue through other comprehensive income 113,247,055 113,187,168
Equity instruments 9 270,336 413,298 Debt securities 8 12,976,719 12,773,870
FFinancial assets at amortised cost 1167,850,730 1164,457,771
Debt securities 8 13,132,060 11,748,660 Loans and advances 11 154,718,670 152,709,111
DDerivatives 110, 12 22,022,249 11,814,764
TTotal credit risk due to financial assets 1183,586,039 1179,630,990
Financial guarantees given 26 2,040,786 1,983,143 Loan commitments given 26 22,645,948 20,906,053 Other commitments given 26 8,233,226 9,916,992
TTotal off--bbalance sheet exposures 332,919,960 332,806,187
TTotal maximum credit risk exposure 2216,505,999 2212,437,177
The Group has also given borrowers guarantees and loan commitments, materialising in the establishment of guaranties given or commitments inherent in credit agreements up to an availability level or limit that ensures that customers can access funding when required. These facilities also require the Group to assume credit risk and are subject to the same management and monitoring systems described above. For further information, see Note 26. Schedule VI of these consolidated annual accounts shows quantitative data relating to credit risk exposures by geography.

260 Banco Sabadell Annual report 2018
4.4.1.4. Credit risk mitigation Credit risk exposures are rigorously managed and monitored through regular assessments of borrowers ’creditworthiness and their ability to honour their payment obligations undertaken with the Group, adjusting the exposure limits for each counterparty to levels that are deemed to be acceptable. It is also normal practice to mitigate credit risk exposures by requiring borrowers to provide collateral or other guarantees to the bank. Generally, these take the form of collateral, mainly mortgages on properties used as housing, whether finished or under construction. The Group also accepts, although to a lesser degree, other types of collateral, such as mortgages on retail properties, industrial warehouses, etc. and financial assets. Another credit risk mitigation technique commonly used by the institution is the acceptance of sureties, in this case subject to the surety presenting a certificate of good standing. All of these mitigation techniques are established ensuring their legal certainty, i.e. under legal contracts that are legally binding for all parties and which are enforceable in all relevant jurisdictions, thus guaranteeing that the collateral can be seized at any time. This process is fully subject to an internal verification of the legal adequacy of these contracts, and legal opinions of international specialists can be requested and applied where these contracts have been entered into under foreign legislation. All collateral is executed before a notary public through a public document, thus ensuring its enforceability before third parties. In the case of property mortgages, these public documents are also registered with the corresponding land registries, thus gaining constitutive effectiveness before third parties. In the case of pledges, the pledged items are generally deposited with the institution. Unilateral cancellation by the obligor is not permitted, and the guarantee remains valid until the debt has been fully repaid. Personal guaranties or sureties are established in favour of the institution and, except in certain exceptional cases, these are also executed before a notary public through a public document, to vest the agreement with the highest possible legal certainty and to allow legal claims to be filed through executive proceedings in the event of default. They constitute a credit right with respect to the guarantor that is irrevocable and payable on first demand. In addition to the mitigation of the risk arising from guarantees executed between the obligors and the institution, as a result of the acquisition of Banco CAM, the Group also has an additional guarantee for a particular asset portfolio, provided by the APS, with retroactive effects from 31 July 2011, and for a period of ten years (see further details in Note 2). The bank has not received any significant guarantees which it is authorised to sell or pledge, irrespective of any non-payment by the owner of the referred guarantees, except for those intrinsic to treasury activities, which are mostly repos with maturities of no more than six months, therefore their fair value does not differ substantially from their carrying value (see Note 6). The fair value of the assets sold in connection with repos is included under the heading “Financial liabilities held for trading ”as part of the short positions of securities. Assets assigned under the same transactions amounted to 814,658 thousand euros and are included by type under the repos heading in Notes 18 and 19. There have been no significant changes to the Group’s policies in relation to guarantees during this year. Neither have there been any significant changes in the quality of the Group’s guarantees with respect to the preceding year. The table below shows the value of the guarantees received to ensure collection, divided into collateral and other guarantees, along with the book value of the financial assets whose guarantees are large enough to allow the institution not to recognise any credit loss, in line with the expected loss model, as at 31 December 2018 and 2017: Thousand euro
22018 22017 Value of collateral 87,807,280 89,271,478
Of which: securing Stage 3 loans 2,916,904 3,983,614 Value of other guarantees 10,882,213 12,462,899
Of which: securing Stage 3 loans 320,192 355,839 TTotal value of guarantees received 998,689,493 1101,734,377
The value of collateral and other guarantees securing risks classified as Stage 2 amounted to 6,222,290 and 820,106 thousand euros, respectively, as at 31 December 2018.

261Statutory information
The main risk concentration in relation to all of these types of collateral and credit enhancements corresponds to the use of mortgage guarantees as a credit risk mitigation technique in exposures of loans for use in the financing or construction of housing or other types of real estate. On a like-for-like basis, exposures secured with mortgage loans represent 61.09% of total gross lending. In the case of market transactions, counterparty credit risk is managed as explained in section 4.4.1.7. 4.4.1.5. Credit quality of financial assets As stated earlier, in general terms, the Group uses internal models to rate most borrowers (or transactions) through which credit risk is incurred. These models have been designed considering the best practices proposed by the New Basel Capital Accord (NBCA). However, not all portfolios in which credit risk is incurred have internal models, partly due to the fact that such models can only be reasonably designed if a minimum level of experience with cases of non-payment is available. The percentage exposure of the institution calculated using internal models, for solvency purposes, is 79%. This percentage has been calculated following the TRIM guidelines (Article 31(a)). The breakdown of the exposure, rated based on the various internal rating levels, is as follows: Million euro
BBreakdown of exposure by rating
LLoans assigned rating/score 22018
SStage 1 SStage 2 SStage 3 OOf which: purchased credit--iimpaired TTotal
AAA/AA 13,417 242 - - 13,659 A 17,386 79 - - 17,465
BBB 69,002 263 - - 69,265 BB 52,127 893 - - 53,020 B 6,195 3,428 - 15 9,623
Rest 480 3,924 6,368 405 10,772 No rating/score assigned 7,048 66 104 - 7,218
TTotal gross amount 1165,655 88,895 66,472 4420 1181,022
IImpairment allowances 3373 3325 22,737 886 33,435
TTotal net amount 1165,282 88,570 33,735 3334 1177,587
The breakdown of total off-balance sheet exposures, rated based on the various internal rating levels, is as follows:
Million euro
BBreakdown of eexposure by rating
LLoans assigned rating/score 22018
SStage 1 SStage 2 SStage 3 OOf which: purchased ccredit--iimpaired TTotal
AAA/AA 6,546 17 9 9 6,572 A 5,083 73 - - 5,156
BBB 14,413 229 - - 14,642 BB 1,859 142 - - 2,001 B 571 464 102 - 1,137
Rest 232 63 12 - 307 No rating/score assigned 3,092 - 14 - 3,106
TTotal gross amount 331,796 9988 1137 99 332,921
IImpairment allowances 446 114 448 -- 1108
TTotal net amount 331,750 9974 889 99 332,813
Further details on the credit rating and credit scoring models are included in section 4.4.1.2 of these consolidated annual accounts.

262 Banco Sabadell Annual report 2018
During 2018 an improvement has been observed in the reduction of assets classified as Stage 3, which have been reduced by 1,372 million euros during the year, resulting in a reduction of the Group’s NPL ratio as shown in the table below: %
22018 22017
NPL ratio (*) 4.22 5.14 NPL coverage ratio (covering risks classified as Stage 3) (*) 54.07 48.27
(*) The NPL ratio excluding TSB stands at 5,04 and the NPL coverage ratio at 54,34 (in 2017, 6,57 and 48,13).
The NPL ratio, broken down by lending segment, is set out below: %
PProforma 2018 (*) 22018 PProforma 2017 (*) 22017 Real estate development and construction 15.68 15.62 21.37 21.30 Non-real estate construction 5.68 5.67 6.87 6.86 Corporates 2.32 2.32 3.33 3.33 SMEs and self-employed 6.48 6.45 8.09 8.04 Individuals with 1st mortgage guarantee 5.82 3.82 6.88 3.97 Sabadell Group NPL ratio 5.04 4.22 6.57 5.14
(*) Corresponds to the NPL ratio excluding TSB.
A more detailed breakdown of allowances and assets classified as Stage 3 can be found in Note 11 and a more detailed breakdown of forborne and restructured transactions is included in Schedule VI. 4.4.1.6. Concentration risk Concentration risk refers to the level of credit exposures to a series of economic groups whose materiality could generate significant credit losses in the event of an adverse economic situation. Exposures can be concentrated within a single customer or economic group, or at sector or geography level. Concentration risk can be caused by two risk subtypes:
Individual concentration risk: this refers to the possibility of incurring significant credit losses as a result of maintaining large exposures with specific customers.
Sector concentration risk: imperfect diversification of systematic components of risk within the portfolio,
which can be sector-based factors, geographical factors, etc. Banco Sabadell has a series of specific tools and policies in place to ensure an efficient management of concentration risk:
Quantitative measures from the Risk Appetite Statement and their subsequent monitoring, such as first-tier metrics.
Individual limits for risks and customers considered to be significant, which are set by the Executive
Committee.
A structure of conferred powers which requires transactions with significant customers to be approved by the Credit Operations Committee, or even by the Executive Committee.
In order to control its concentration risk, Banco Sabadell Group has deployed the following critical control parameters: CConsistency with the Risk Appetite Framework The Group guarantees the consistency between the concentration of its risk exposures and the tolerance of such risks, as defined in the RAS. There are overall concentration risk limits and adequate internal controls are in place to ensure that the concentration of these risk exposures does not exceed the risk appetite levels established by the Group.

263Statutory information
EEstablishment of limits and metrics for concentration risk control Given the nature of the Group’s activity and its business model, concentration risk is primarily linked to credit risk, and various metrics along with their associated limits are in place. Credit risk exposure limits are set based on the institution’s historical loss experience, seeking to ensure that exposures are in line with the Group’s level of capitalisation as well as the expected level of profitability under different scenarios. All of the metrics used to measure such levels, as well as appetite limits and tolerance thresholds for the identified risks, are described as part of the RAS metrics. Risk control monitoring and regular reporting Banco Sabadell Group ensures that concentration risk is monitored on a regular basis, in order to enable any weaknesses in the mechanisms implemented to manage this risk to be quickly identified and resolved. This information is also reported to the Board of Directors on a recurring basis in accordance with the established risk governance. Action plans and mitigation techniques When dealing with exceptions to internally established limits, the criteria based on which such exceptions can be approved must be included. If necessary, the Group will take the corresponding measures to match the concentration risk to the levels approved in the RAS by the Board of Directors. 4.4.1.6.1 Exposure to customers or significant risks As at 31 December 2018 there were no borrowers with approved lending that individually exceeded 10% of the Group’s own funds. 4.4.1.6.2. Country risk: geographic exposure to credit risk Country risk is defined as the risk of a country's debts taken as a whole due to factors inherent to the sovereignty and the economic situation of a country, i.e. for circumstances other than regular credit risk. It manifests itself in the eventual inability of obligors to honour their foreign currency payment obligations to external creditors due to, among other reasons, the country preventing access to that foreign currency, the inability to transfer it or the non-enforceability of legal actions against borrowers for reasons of sovereignty, or for reasons of war, expropriation or nationalisation.
Country risk not only affects debts undertaken with a state or entities guaranteed by it, but also all private debtors that belong to that state and who, for reasons outside their control and not at their volition, are generally unable to honour their debts. An exposure limit is set for each country which is applicable across the whole of Banco Sabadell Group. These limits are approved by the Executive Committee and the corresponding decision-making bodies, as per their conferred powers, and they are continuously monitored to ensure that any deterioration in the political, economic or social situation of a country can be detected in good time. The main component of the framework for the acceptance of country risk and financial institution risk is the structure of limits for different metrics. This structure is used to monitor the various risks and it is also used by Senior Management and the delegated committees to establish the Group’s risk appetite. The structure of limits comprises two levels: first-tier RAS metrics and second-tier or management limits. Additionally, different indicators and tools are used to manage country risk: Credit ratings, credit default swaps, macroeconomic indicators, etc. Schedule VI includes quantitative data relating to the breakdown of the concentration of risks by activity and on a global scale.

264 Banco Sabadell Annual report 2018
4.4.1.6.3. Exposure to sovereign risk and exposure to the construction and real estate development sector Schedule VI includes quantitative data relating to sovereign risk exposures and exposures to the construction and real estate development sector. 4.4.1.7. Counterparty credit risk This heading considers credit risk associated with activities in financial markets involving transactions with counterparty credit risk. Counterparty credit risk refers to the risk of a counterparty defaulting before definitively settling cash flows of either a transaction with derivatives or a transaction with a repurchase commitment, with deferred settlements or collateral financing. Exposure to counterparty credit risk is mainly concentrated in customers, financial institutions and central counterparty clearing houses. The following two tables show the breakdown of exposure by credit rating and by the geographies in which the Group operates. %
AAA AA+ AA AA- A+ A A- BBB+ BBB BBB- BB+ BB BB- B+ Rest
- - 5.7% 3.1% 40.5% 20.3% 9.8% 5.7% 3.3% 1.4% 1.7% 2.8% 1.9% 0.9% 2.9% 1100.0%
%
22018
Euro Zone 62.1% Rest of Europe 29.4% U.S.A. and Canada 7.5% Rest of the world 1.0%
TTotal 1100.0%
As can be seen in the table, the risk is concentrated in counterparties with a high credit quality, with 79% of the risk relating to counterparties with a credit rating of A. In 2016, under the European Market Infrastructure Regulation (EMIR) (Regulation 648/2012), the obligation to settle and clear certain over-the-counter derivatives through central counterparty clearing houses (CCPs) has been applicable to the Group. For this reason, the derivatives subscribed by the Group and subject to the foregoing are channelled via these agents. At the same time, the Group has strengthened the standardisation of OTC derivatives with a view to promoting the use of CCPs. The exposure to risk with CCPs largely depends on the value of the deposited guarantees. With regard to derivative transactions in organised markets (OMs), it is considered, based on management criteria, that there is no exposure, given that there is no risk as the OMs act as counterparties in the transactions and a daily settlement and guarantee mechanism is in place to ensure the transparency and continuity of the activity. In OMs the exposure is equivalent to the deposited guarantees. The breakdown of transactions involving derivatives in financial markets depending on whether the counterparty is another financial institution, clearing house or organised market is as follows: Million euro
22018 22017 Transactions with organised markets 2,784 3,582 OTC transactions 178,102 170,015
Settled through clearing houses 88,452 87,502 TTotal 1180,886 1173,597
There are currently no transactions that meet the criteria set forth in IAS 32 for offsetting transactions involving financial assets and financial liabilities on the balance sheet. The netting of derivative and repo transactions is only material when calculating the amount pending collateralisation, and is not material in terms of their presentation on the balance sheet.

265Statutory information
The following table shows the aggregate amount reflected on the balance sheet for the financial instruments subject to a master netting and collateral agreement for 2018 and 2017: Thousand euro
22018 FFinancial assets subject to collateral agreements
AAmount recognised oon balance sheet
AAmount offset (for ccollateral calculations only)
GGuarantee received
NNet value CCash SSecurities
FFinancial assets ((a) ((b) ((c) ((d) ((a)--((b)--((c)--((d) Derivatives 1,508,703 1,208,294 243,375 - 57,034 Assets acquired under repurchase agreements 5,960,839 - 7,194 5,992,028 (38,383)
TTotal 77,469,542 11,208,294 2250,569 55,992,028 118,651
Thousand euro
22018 FFinancial liabilities subject to collateral agreements
AAmount recognised oon balance sheet
AAmount offset (for ccollateral calculations only)
GGuarantee given
NNet value CCash SSecurities
FFinancial lliabilities ((a) ((b) ((c) ((d) ((a)--((b)--((c)--((d) Derivatives 2,219,489 1,208,294 1,067,530 197,924 (254,259) Assets sold under repurchase agreements 9,819,345 - 258,490 9,940,126 (379,271)
TTotal 112,038,834 11,208,294 11,326,020 110,138,050 ((633,530)
Thousand euro
22017
FFinancial assets subject to collateral agreements
AAmount recognised oon balance sheet
AAmount offset (for ccollateral calculations only)
GGuarantee received
NNet value CCash SSecurities
FFinancial assets ((a) ((b) (( cc) (( d) ((a)--((b)--((c)--((d) Derivatives 1,204,328 1,042,820 132,061 - 29,447 Assets acquired under repurchase agreements 4,966,485 - 23,127 4,883,010 60,348
TTotal 66,170,813 11,042,820 1155,188 44,883,010 889,795
Thousand euro
22017
FFinancial liabilities subject to collateral agreements
AAmount recognised oon balance sheet
AAmount offset (for ccollateral calculations only)
GGuarantee received
NNet value CCash SSecurities
FFinancial liabilities ((a) ((b) (( c) (( d) ((a)--((b)--((c)--((d) Derivatives 2,129,342 1,042,820 1,370,579 274 (284,331) Assets sold under repurchase agreements 14,123,760 - 314,593 14,583,471 (774,304)
TTotal 116,253,102 11,042,820 11,685,172 114,583,745 ((1,058,635)

266 Banco Sabadell Annual report 2018
The values of derivative financial instruments which are settled through a clearing house as at 31 December 2018, are indicated hereafter: Thousand euro
22018 22017 Derivative financial assets settled through a clearing house 652,615 436,521 Derivative financial liabilities settled through a clearing house 858,273 929,033
The philosophy behind counterparty credit risk management is consistent with the business strategy, and seeks to ensure the creation of value at all times whilst maintaining a balance between return and risk. To this end, criteria have been established for controlling and monitoring counterparty credit risk arising from activity in financial markets so as to ensure that the bank can carry out its business activity whilst adhering to the risk thresholds approved by Senior Management. The approach for quantifying counterparty credit risk exposure takes into account current and future exposure. Current exposure represents the cost of substituting a transaction at market value in the event that a counterparty defaults at the present time. To calculate it, the current or Mark to Market (MtM) value of the transaction is required. The future exposure represents the risk that a transaction could potentially represent over a certain period of time, given the characteristics of the transaction and the market variables on which it depends. In the case of transactions carried out under a collateral agreement, the future exposure represents the possible fluctuation of the MtM between the time of default and the replacement of such transactions in the market. If the transaction is not carried out through a collateral agreement, it represents the possible changes in MtM throughout the life of the transaction. Each day at close of business all of the exposures are recalculated in accordance with the transaction inflows and outflows, changes in market variables and risk mitigation techniques established by the Group. Exposures are thus subjected to daily monitoring and controlled in accordance the limits approved by Senior Management. This information is included in risk reports for disclosure to the departments and units responsible for their management and monitoring. With regard to counterparty credit risk, the Group adopts different mitigation measures. The main measures are:
Netting agreements for derivatives (ISDA and EMA). Collateral agreements for derivatives (CSA and Schedule 3 - EMA), repos (GMRA, EMA) and securities lending
(GMSLA).
Netting agreements allow positive and negative MtM to be aggregated for transactions with a single counterparty, in such a way that in the event of default, a single payment or collection obligation is established in relation to all of the transactions closed with such counterparty. By default, the Group has netting agreements with all of the counterparties that wish to operate with derivatives. Collateral agreements, as well as including the netting effect, also include the regular exchange of guarantees which mitigate the current exposure with a counterparty in respect of the transactions subject to such agreement. In order to operate in derivatives or repos with financial institutions, the Group has established the requirement of having collateral agreements. Furthermore, for derivative transactions with such institutions, the Group is required to exchange collateral with financial counterparties in order to mitigate the current exposure pursuant to Delegated Regulation (EU) 2251/2016. The Group’s standard collateral agreement, which complies with the aforementioned regulation, is bilateral (i.e. both parties are obliged to deposit collateral) and includes a daily exchange of guarantees in the form of cash and in euros. 4.4.1.8 Assets pledged in financing operations As at the end of 2018 and 2017, there were certain financial assets pledged in financing operations, i.e. offered as collateral or guarantees for certain liabilities. These assets correspond mainly to loans linked to the issuance of covered bonds, public sector covered bonds and long-term securitisation bonds (see Note 20 and Schedule III for transactions linked to the Spanish Mortgage Market and Schedule IV for details of issues). The remaining pledged assets are debt securities which are submitted in transactions involving assets sold under repurchase agreements, pledged collateral (loans or debt instruments) to access certain financing operations with central banks and all types of collateral provided to secure derivatives transactions.

267Statutory information
Information on mortgage-secured loans awarded in Spain and included in the “Loans and advances – Customers ”portfolio, which are linked to the issuance of covered bonds pursuant to the Spanish Mortgage Market Law, is included in Schedule III on “Information required to be kept by issuers of mortgage market securities and the special accounting mortgage register”, a special accounting record of the issuing entity Banco Sabadell, as required by Bank of Spain Circular 5/2011, implementing Royal Decree 716/2009 of 24 April (implementing certain aspects of Law 2/1981 of 25 March on the regulation of the mortgage market). The Group has used part of its portfolio of loans and similar credit in fixed-income securities by transferring assets to various securitisation funds created for this purpose. Under current regulations, securitisations in which there is no substantial risk transfer cannot be derecognised from the balance sheet. The balance of the financial assets securitised under these programmes by the Group, identifying those in which the risks and associated rewards of ownership have been transferred, is as follows: Thousand euro
22018 22017
DDerecognised in full from the balance sheet: 8833,792 9986,224 Securitised mortgage assets 186,899 322,074 Other securitised assets 16,122 16,712 Other financial assets transferred 630,771 647,438
RRetained in full on the balance sheet: 115,092,110 117,813,667 Securitised mortgage assets 13,876,927 15,773,930 Other securitised assets 1,215,183 2,039,737 Other transfers to credit institutions - -
TTotal 115,925,902 118,799,891
The assets and liabilities associated with securitisation funds of assets which originated after 1 January 2004, and for which inherent risks and rewards of ownership have not been transferred to third parties, have been maintained in the consolidated financial statements. In terms of the assets shown, the risk is not transferred as some form of subordinated loan or credit enhancement has been transferred to the securitisation funds. As at 31 December 2018, there was no significant financial aid from the Group for unconsolidated securitisations. The heading ‘other transferred financial assets fully derecognised from the balance sheet ’included mainly assets transferred to the Spanish company for the management of assets arising from the restructuring of the banking system (Sociedad de Gestión de Activos procedentes de la Reestructuración Bancaria, SAREB) by Banco Gallego, as they continue to be managed by the entity. These assets amount to 621,627 thousand euros. Schedule II to these consolidated annual accounts includes certain information regarding the securitisation funds originated by the Group. 44.4.2. Liquidity risk 4.4.2.1. Description Liquidity risk refers to the possibility of losses being incurred as a result of the institution being unable, albeit temporarily, to honour payment commitments due to a lack of liquid assets, or of its being unable to access the markets to refinance debts at a reasonable cost. This risk may be associated with factors of a systemic nature or specific to the institution itself. In this regard, the Group aims to maintain a liquid asset base and a funding structure that, in line with its strategic objectives and based on its Risk Appetite Statement, allows it to honour its payment commitments normally and at a reasonable cost, both under business-as-usual conditions and under a stress situation caused by systemic and/or idiosyncratic factors. The pillars of Banco Sabadell’s governance structure for liquidity management and control are the direct involvement of governing bodies, management bodies and Senior Management, following the model of three lines of defence, and a strict separation of duties, as well as a clear-cut structure of responsibilities.

268 Banco Sabadell Annual report 2018
4.4.2.2 Liquidity management Banco Sabadell’s liquidity management seeks to ensure funding for its business activity at an appropriate cost and term while minimising liquidity risk. The institution’s funding policy focuses on maintaining a balanced funding structure, based mainly on customer deposits, and it is supplemented with access to wholesale markets that allows the Group to maintain a comfortable liquidity position at all times. The Group follows a structure based on Liquidity Management Units (“UGL”, for their acronym in Spanish) to manage its liquidity. Each UGL is responsible for managing its own liquidity and for setting its own metrics to control liquidity risk, working together with the Group’s corporate functions. At present, the UGLs are Banco Sabadell (includes foreign branches, or OFEX for their acronym in Spanish, and the entities Banco Sabadell S.A., I.B.M. and Sabcapital S.A. de C.V., SOFOM, E.R., which correspond to the business in Mexico), Banc Sabadell d’Andorra (BSA) and TSB. In order to achieve these objectives, the Group’s current liquidity risk management strategy is based on the following principles and pillars, in line with the UGLs ’retail business model and the defined strategic objectives:
The involvement of the Board of the Directors and Senior Management in the management and control of liquidity and funding risk.
Clear separation of functions and duties between the different areas and units within the organisation, with a clear-cut delineation of the three lines of defence, to give a degree of independence when evaluating positions and when controlling and assessing risks.
Decentralised liquidity management system for the more significant units but with a centralised risk oversight
and management system.
Sound identification, measurement, management, control and reporting processes for the different liquidity and funding risks to which the Group is exposed.
Existence of a funds transfer pricing system to transfer the cost of funding.
Balanced funding structure largely based on customer deposits.
Ample base of unencumbered liquid assets that can be accessed immediately to generate liquidity and which
comprise the Group’s first line of defence.
Diversification of sources of funding, with controlled use of short-term wholesale funding without having to depend on individual fund suppliers.
Self-funding by the main banking subsidiaries outside of Spain.
Monitoring of the balance sheet volume being used as collateral in funding transactions.
Maintenance of a second line of liquidity that includes the issuing capacity of covered bonds.
Compliance with regulatory requirements, recommendations and guidelines.
Regular disclosure to the public of information relating to liquidity risk.
Availability of a Liquidity Contingency Plan.
With respect to TSB, although ring-fencing will not officially enter into effect until 2019, TSB is set up as an autonomous unit within the Group’s liquidity management, or in other words, as an independent UGL. The future economic performance of the United Kingdom should not generate liquidity problems, as TSB operates independently from its parent company.

269Statutory information
Tools/metrics for monitoring and controlling liquidity risk management Banco Sabadell Group has a system of metrics and tolerance limits that define its liquidity risk appetite. This system is described in the Risk Appetite Statement (RAS) and approved by the Board of Directors. The system enables liquidity risk to be assessed and monitored, ensuring the achievement of strategic objectives, adherence to the risk profile, as well as compliance with regulations and supervisory guidelines. As part of the monitoring of liquidity metrics at Group level, there are metrics that have been established at Group level and which are calculated on a consolidated basis, metrics established at Group level and deployed to each Group UGL, as well as metrics established at UGL level to reflect specific local characteristics. Both the metrics defined in the Banco Sabadell Group RAS and those defined in the local RAS of subsidiaries are subject to governance relating to the approval, monitoring, reporting of breaches and remediation plans established in the Risk Appetite Framework (RAF) on the basis of the hierarchical level of each metric (these are classified into three levels). It should be mentioned that the Group has designed and implemented an early warning indicators (EWIs) system at the UGL level, which includes market and liquidity indicators adapted to the funding structure and the business model of each UGL. The deployment of these indicators at UGL level complements the RAS metrics and allows tensions in the local liquidity position and funding structure to be detected early, thereby facilitating the implementation of corrective measures and actions and reducing the risk of contagion between the different management units. The risk of each UGL is also monitored daily through the Structural Treasury Report, which measures the daily changes in the funding needs of the balance sheet, the daily changes in the outstanding balance of transactions in capital markets, as well as the daily changes in the first line of liquidity maintained by each UGL. The reporting and control framework involves, among other aspects:
Monitoring the RAS metrics and the associated thresholds on a consolidated basis, as well as those
established for each UGL, in line with the established monitoring frequency.
Reporting to the relevant committees, governing and management bodies on the basis of the levels into which such metrics have been classified.
In the event a breach is detected, activating the communication protocols and necessary plans for its resolution.
Within the Group’s overall budgeting process, Banco Sabadell plans its liquidity and funding requirements over different time horizons, which it aligns with the Group’s strategic objectives and target risk appetite. Each UGL has a 1 and 3-year funding plan in which they set out their potential funding needs as well as their management strategy, and they regularly analyse the compliance therewith, any deviations from the projected budget and the adequacy of the plan in terms of the market environment. The institution also has an internal funds transfer pricing system to transfer the funding costs to business units. Lastly, Banco Sabadell has a Liquidity Contingency Plan (LCP) in place, which sets forth the strategy for guaranteeing that the institution has sufficient management capacities and measures in place to limit any negative impacts of a crisis situation affecting is liquidity position and to allow it to return to a business-as-usual situation. The LCP also aims to facilitate business continuity in the management of liquidity, particularly in the event that the crisis has arisen due to a substandard performance of one or more financial market infrastructures. The LCP can be activated in response to different crisis situations in either the markets or the institution itself. The key components of the LCP include: measures available to generate liquidity in business-as-usual situations or in a crisis situation linked to the activation of the LCP and a communication plan (both internal and external) for the LCP.

270 Banco Sabadell Annual report 2018
4.4.2.3. Residual maturity periods The table below shows the breakdown by contractual term to maturity, excluding, in some cases, valuation adjustments and impairment losses, of certain consolidated balance sheet items as at 31 December 2018 and 2017, under business-as-usual market conditions:
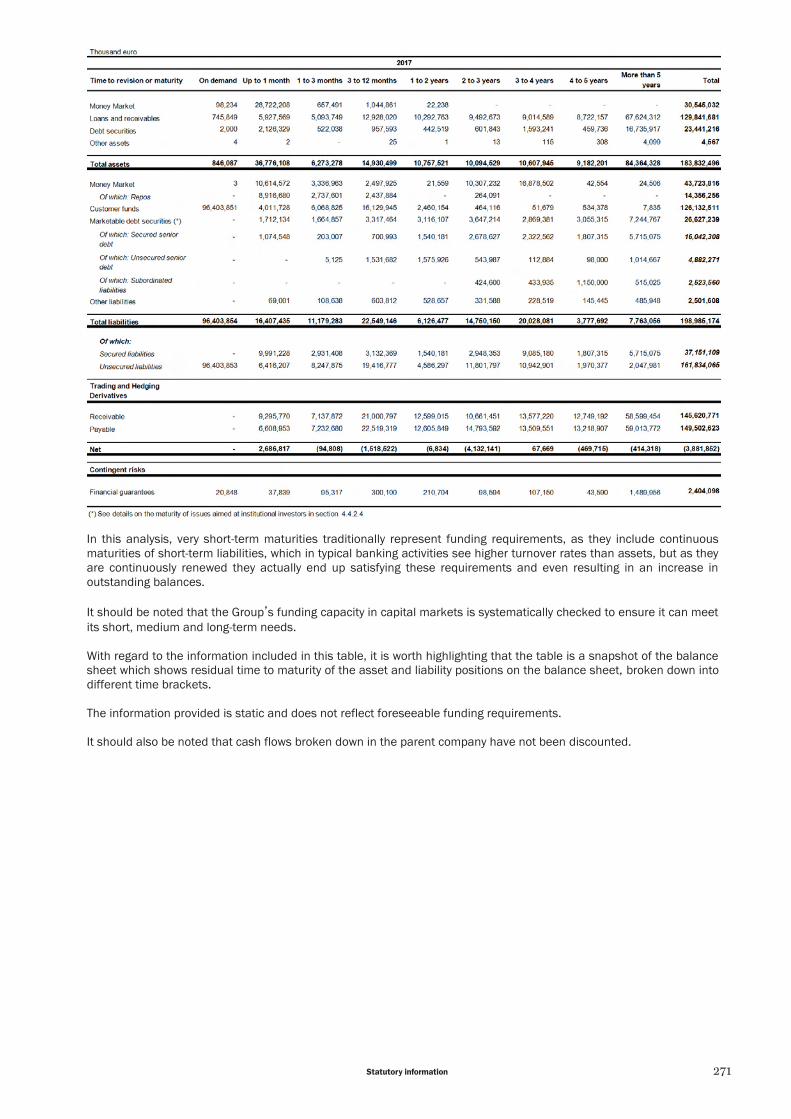
271Statutory information
In this analysis, very short-term maturities traditionally represent funding requirements, as they include continuous maturities of short-term liabilities, which in typical banking activities see higher turnover rates than assets, but as they are continuously renewed they actually end up satisfying these requirements and even resulting in an increase in outstanding balances. It should be noted that the Group’s funding capacity in capital markets is systematically checked to ensure it can meet its short, medium and long-term needs. With regard to the information included in this table, it is worth highlighting that the table is a snapshot of the balance sheet which shows residual time to maturity of the asset and liability positions on the balance sheet, broken down into different time brackets.
The information provided is static and does not reflect foreseeable funding requirements. It should also be noted that cash flows broken down in the parent company have not been discounted.

272 Banco Sabadell Annual report 2018
In order to present the contractual maturities of financial liabilities with certain particular characteristics, the parent company has applied the following approach:
For any transaction that includes flows corresponding to repayments (regular or irregular), each capital flow is
shown in the time bracket in which the payment/collection is expected to take place (in accordance with the contractual amortisation schedule). Demand liabilities are included in the “on demand ”tranche, without taking into account their type (stable vs. unstable).
There are also contingent commitments which could lead to changes in liquidity requirements. These are fundamentally credit facilities with amounts undrawn by the borrowers as at the balance sheet date. The Board of Directors also establishes limits in this regard for their control. Note 26 includes a breakdown of balances of loan commitments given. Given the characteristics of these contracts, loan commitments given are generally enforceable from the time of their contractual formalisation. It is for this reason that they should appear as “on demand ”in the table of the parent company’s contractual maturities.
Balances from financial guarantee contracts have been included in the parent company’s table, assigning the maximum amount of the guarantee to the first year in which the guarantee can be enforced.
Financing in the capital markets via instruments which include clauses that could lead to accelerated repayment (puttables or instruments with clauses linked to a downgrade in credit rating) is reduced in line with the Group’s financial liabilities. It is for this reason that the estimated impact on the parent company would not be significant.
As at 31 December 2018 the Group has no instruments in addition to those regulated by master agreements associated with the acquisition of derivatives and repos/reverse repos.
The Group does not have any instruments which allow the institution to decide whether to settle its financial liabilities using cash (or another financial asset) or through the submission of its own shares as at 31 December 2018.
As at 31 December 2018 the Group does not have any instruments which are subject to master netting agreements.
4.4.2.4 Funding strategy and evolution of liquidity in 2018 The Group’s primary source of funding is customer deposits (mainly demand deposits and term deposits acquired through the branch network), supplemented by funding through interbank and capital markets in which the institution maintains various short-term and long-term funding programmes in effect in order to achieve an adequate level of diversification by type of product, term and investor. The institution maintains a diversified portfolio of liquid assets that are largely eligible as collateral in exchange for access to funding operations with the European Central Bank (ECB). On-balance sheet customer funds As at 31 December 2018, the balances of on-balance sheet customer funds amounted to: Million euro
Note 2018 2017 Change (%) year--onn-yyear
Ex TSB Ex TTSB Change (%) year--onn-yyear 2018 2017
On-balance sheet customer funds 137,343 132,096 4.0 104,859 97,686 7.3 Of which: sight accounts 19 107,665 98,020 9.8 77,736 68,039 14.3 Of which: customer term deposits (*) 28,709 32,425 (11.5) 26,154 27,996 (6.6)
(*) Includes deposits redeemable at notice and hybrid financial liabilities.

273Statutory information
The downward trend of interest rates in financial markets has caused a shift in the composition of on-balance sheet customer funds from term deposits to demand deposits and off-balance sheet funds. On-balance sheet customer funds by maturity are shown below: Million euro
NNote 22018 33 months 66 months 112 months >>12 months NNo mat.
TTotal on--bbalance sheet customer funds (*) 1137,343 77.3% 44.3% 77.4% 22.6% 778.4% Deposits with agreed maturity 26,593 32.9% 18.7% 37.3% 11.1% - Sight accounts 19 107,665 - - - - 100.0% Retail issues 3,085 42.3% 31.1% 5.5% 21.2% -
(*) Includes customer deposits (ex-repos) and other liabilities sold by the branch network: mandatory convertible bonds, Banco Sabadell straight bonds, commercial paper and others.
Million euro
NNote 22017 33 months 66 months 112 months >>12 mmonths NNo mat.
TTotal on--bbalance sheet customer funds (*) 1132,096 88.4% 44.8% 77.2% 55.4% 774.2% Deposits with agreed maturity 29,816 33.9% 19.4% 29.7% 17.1% - Sight accounts 19 98,020 - - - - 100.0% Retail issues 4,260 24.0% 12.9% 15.2% 47.8% -
(*) Includes customer deposits (ex-repos) and other liabilities sold by the branch network: mandatory convertible bonds, Banco Sabadell straight bonds, commercial paper and others.
Off-balance sheet customer funds managed by the Group and those sold but not under management are shown in Note 27 to these consolidated annual accounts. The Group’s deposits are sold through the following business units/companies of the Group (Commercial Banking, Corporate Banking and Global Businesses, Private Banking and TSB). Details of the volumes of these business units are included in the section on business results of the Directors ’Report. In 2018, the positive trend in terms of the generation of a customer funding gap observed in recent years has continued, which has allowed the Group to continue with its policy to partially refinance capital market maturities and, at the same time, continue reducing the Group's Loan-to-Deposit (LtD) ratio (from 147% as at 2010 year-end to 101.6% as at 2018 year-end). Capital Markets The level of funding in capital markets has declined in recent years, due to, among other aspects, the positive evolution of the customer funding gap. The outstanding balance of funding in capital markets by type of product as at December 2018 and 2017 is shown below:
Million euro 22018 22017
BBalance outstanding 221,719 222,390 Covered Bonds 12,165 13,335 Of which: TSB 559 564 Commercial paper and ECP 2,353 2,037 Senior debt 1,805 1,669 Subordinated debt and preference shares 3,001 2,497 Of which: TSB 430 434 Securitisation bonds 2,381 2,820 Of which: TSB 698 925 Other medium/long term financial instruments 14 33

274 Banco Sabadell Annual report 2018
Maturities of issuances aimed at institutional investors by type of product as at 31 December 2018 are analysed below: Million euro
22019 22020 22021 22022 22023 22024 >>2024 OOuutstanding BBalance
Covered bonds (*) 1,124 2,015 1,808 1,678 1,388 1,850 2,301 12,165 Senior Debt (**) 52 - - 25 984 744 - 1,805 Subordinated debt and preference shares (**) - 411 430 - 500 - 1,660 3,001
Other medium/long term financial instruments (**) - - 10 - - 4 - 14
TTotal 11,176 22,426 22,249 11,703 22,872 22,598 33,961 116,985 (*) Secured issues. (**) Unsecured issues.
Banco Sabadell Group is an active participant in capital markets and has a number of funding programmes in operation, with a view to diversifying its sources of liquidity. In terms of short-term funding, the institution maintains a corporate commercial paper programme and a Euro Commercial Paper (ECP) programme:
Corporate commercial paper programme: this programme regulates issues of commercial paper and is aimed at institutional and retail investors. On 15 March 2018, the commercial paper programme of Banco Sabadell for 2018 was registered with the Spanish Securities Market Commission, with an issue limit of 7 billion euros, eligible to be extended up to 9 billion euros. The outstanding balance of the commercial paper programme has been declining over the year. As at 31 December 2018, the outstanding balance of the programme was of 2,565 million euros (net of commercial paper subscribed by companies of the Group), compared with the 2,823 million euros as at 31 December 2017.
Euro Commercial Paper (ECP) Programme: this programme is aimed at institutional investors, whereby short-term securities are issued in various foreign currencies (EUR, USD and GBP). On 18 December 2015, Banco Sabadell renewed its Euro Commercial Paper Programme for a maximum nominal amount of 3.5 billion euros. As at 31 December 2018 the outstanding balance of the programme stood at 696 million euros, increasing in comparison to the 346 million euros as at the end of 2017.
Regarding medium- and long-term funding, the institution has the following programmes in effect:
Programme for the issuance of non-equity securities (“Fixed Income Programme”) registered with the CNMV on 10 April 2018, with a maximum issue amount of 16.5 billion euros: this regulates the issues of bonds and debentures (straight, subordinated and structured), as well as covered bonds, public sector covered bonds and mortgage bonds carried out under Spanish law through the CNMV and aimed at both national and foreign institutional and retail investors. The limit available for new issues under the Programme for the issue of non-equity securities for 2018 of Banco Sabadell as at 31 December 2018, was of 12,280 million euros (as at 31 December 2017, the limit available under the 2017 Fixed Income Programme was of 10,046 million euros).
During 2018, Banco Sabadell has carried out public issues under the Fixed-Income Programme in force for a total of 436 million euros. Banco Sabadell has carried out the following issues throughout the year:
Million euro
IISIN Code TType of investor IIssue Date AAmount TTerm
Issue of Non-Convertible Bonds I/2018 ES0213860283 Retail February-18 4 5 Issue of Non-Convertible Bonds II/2018 ES0213860291 Retail March-18 6 7 Issue of Non-Convertible Bonds III/2018 ES03138602Z0 Retail April-18 6 5 Issue of Non-Convertible Bonds IV/2018 ES03138603A1 Retail May-18 3 5 Issuance of Structured Bonds 1/2018 ES0213860309 Retail November-18 10 6 Issuance of Structured Bonds 2/2018 ES0213860325 Retail November-18 13 6 Issue of Non-Convertible Bonds V/2018 ES03138603B9 Retail November-18 1 5 Issue of Non-Convertible Bonds VI/2018 ES0213860317 Retail November-18 3 7 Covered Bonds BEI I/2018 ES0413860646 Institutional December-18 390 8

275Statutory information
Euro Medium Term Notes (EMTN) programme, registered with the Irish Stock Exchange on 23 March 2018,
and replaced on 27 April, 30 July and 30 October 2018. This programme allows senior debt (preferred and non-preferred) and subordinated bonds to be issued in any currency, with a maximum limit of €5 billion. On 7 September 2018, Banco Sabadell carried out one 5.5-year issue of senior preferred debt for 750 million euros under this programme, and on 12 December it carried out one subordinated Tier 2 issue for 500 million euros, maturing after 10 years, with an an early call option in favour of Banco Sabadell in the fifth year.
Million euro
IISIN Code TType of investor IIssue Date AAmount TTerm
Issuance of Senior Debentures I/2018 XS1876076040 Institutional September-18 750 5.5 Issuance of Subordinated Bonds I/2018 XS1918887156 Institutional December-18 500 10
In relation to asset securitisation:
Since 1993, the Group has been an active participant in this market and has taken part in a number of securitisation programmes, in some cases together with other highly solvent institutions, awarding mortgage loans, SME loans, consumer loans and finance lease receivables.
There are currently 24 outstanding asset securitisation transactions (including those performed by Banco Guipuzcoano, Banco CAM, BMN, Banco Gallego and TSB). Although part of the bonds issued were retained by the institution as liquid assets eligible for funding operations with the European Central Bank, the rest of the bonds were placed in capital markets. As at the end of 2018, the balance of securitisation bonds placed in the market stood at 2,381 million euros.
In the first quarter, Banco Sabadell sold a total of 455 million euros from tranche A of the asset securitisation
IM Sabadell PYME 11 to the EIB for the funding of two new lines.
For efficiency reasons, three securitisation transactions were redeemed early in 2018 (see further details on securitisation funds in Schedule II to these consolidated annual accounts).
In general, the tone of the markets in 2018 has been characterised by high volatility, caused mainly by geopolitical uncertainty, which has translated into a significant widening of credit spreads of market issuances, and by the closure of markets on different occasions during the year over relatively long periods of time. In March 2016, the European Central Bank announced new economic stimulus measures through a new targeted long-term refinancing operations programme (TLTRO II), consisting of four auctions of liquidity at a term of four years, to be performed between June 2016 and March 2017. Banco Sabadell took part in TLTRO II for a total amount of 20.5 billion euros (10 billion euros in the first auction of June 2016 and 10.5 billion euros in the last auction of March 2017). In 2016, the Bank of England also implemented a package of measures to support economic growth. This package includes the introduction of the Term Funding Scheme (TFS), a scheme to incentivise lending which was implemented in August 2016 by the Bank of England, through which British banks could carry out 4-year drawdowns in exchange for the provision of collateral eligible as consideration. TSB, as a member of the Sterling Monetary Framework (SMF), made use of the TFS throughout 2017, drawing 6,334 million euros, and also in February 2018, with an additional drawdown of 958 million euros. Including this, the amount drawn under this scheme amounted to 7,233 million euros as at the end of 2018.
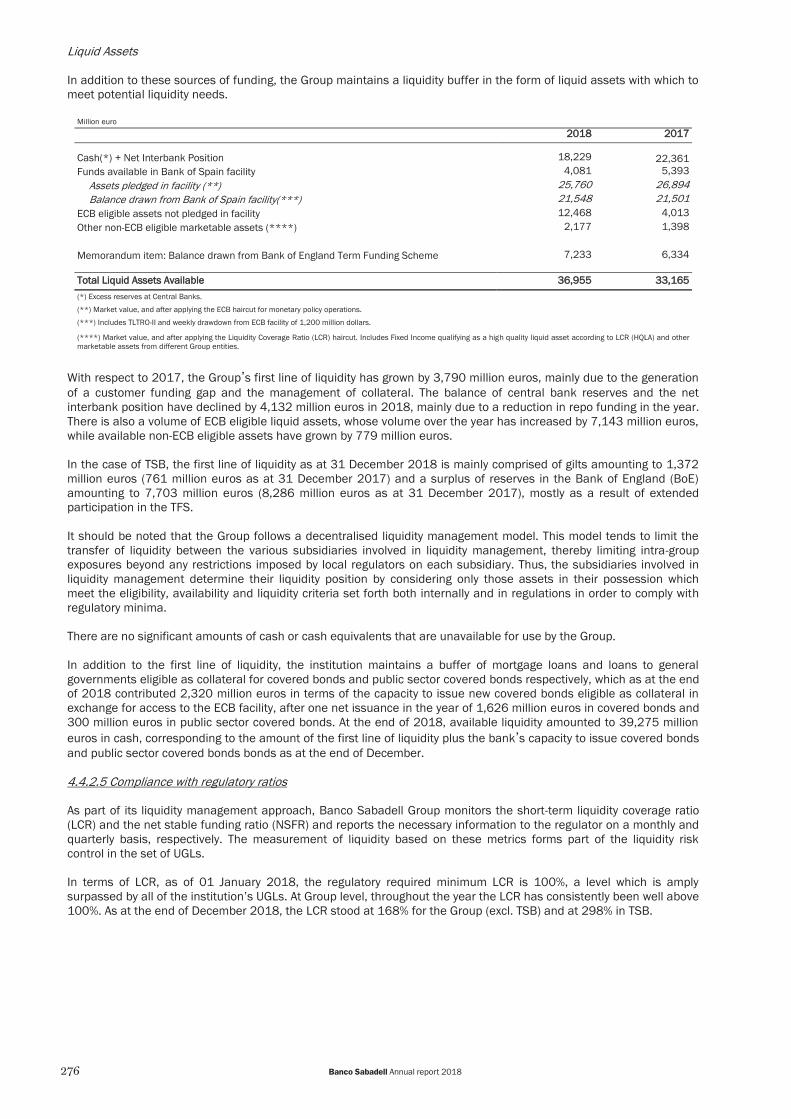
276 Banco Sabadell Annual report 2018
Liquid Assets In addition to these sources of funding, the Group maintains a liquidity buffer in the form of liquid assets with which to meet potential liquidity needs.
Million euro 22018 22017
Cash(*) + Net Interbank Position 18,229 22,361 Funds available in Bank of Spain facility 4,081 5,393
Assets pledged in facility (**) 25,760 26,894 Balance drawn from Bank of Spain facility(***) 21,548 21,501
ECB eligible assets not pledged in facility 12,468 4,013 Other non-ECB eligible marketable assets (****) 2,177 1,398
Memorandum item: Balance drawn from Bank of England Term Funding Scheme 7,233 6,334
TTotal Liquid Assets Available 336,955 333,165 (*) Excess reserves at Central Banks.
(**) Market value, and after applying the ECB haircut for monetary policy operations.
(***) Includes TLTRO-II and weekly drawdown from ECB facility of 1,200 million dollars.
(****) Market value, and after applying the Liquidity Coverage Ratio (LCR) haircut. Includes Fixed Income qualifying as a high quality liquid asset according to LCR (HQLA) and other marketable assets from different Group entities.
With respect to 2017, the Group’s first line of liquidity has grown by 3,790 million euros, mainly due to the generation of a customer funding gap and the management of collateral. The balance of central bank reserves and the net interbank position have declined by 4,132 million euros in 2018, mainly due to a reduction in repo funding in the year. There is also a volume of ECB eligible liquid assets, whose volume over the year has increased by 7,143 million euros, while available non-ECB eligible assets have grown by 779 million euros. In the case of TSB, the first line of liquidity as at 31 December 2018 is mainly comprised of gilts amounting to 1,372 million euros (761 million euros as at 31 December 2017) and a surplus of reserves in the Bank of England (BoE) amounting to 7,703 million euros (8,286 million euros as at 31 December 2017), mostly as a result of extended participation in the TFS. It should be noted that the Group follows a decentralised liquidity management model. This model tends to limit the transfer of liquidity between the various subsidiaries involved in liquidity management, thereby limiting intra-group exposures beyond any restrictions imposed by local regulators on each subsidiary. Thus, the subsidiaries involved in liquidity management determine their liquidity position by considering only those assets in their possession which meet the eligibility, availability and liquidity criteria set forth both internally and in regulations in order to comply with regulatory minima. There are no significant amounts of cash or cash equivalents that are unavailable for use by the Group. In addition to the first line of liquidity, the institution maintains a buffer of mortgage loans and loans to general governments eligible as collateral for covered bonds and public sector covered bonds respectively, which as at the end of 2018 contributed 2,320 million euros in terms of the capacity to issue new covered bonds eligible as collateral in exchange for access to the ECB facility, after one net issuance in the year of 1,626 million euros in covered bonds and 300 million euros in public sector covered bonds. At the end of 2018, available liquidity amounted to 39,275 million euros in cash, corresponding to the amount of the first line of liquidity plus the bank’s capacity to issue covered bonds and public sector covered bonds bonds as at the end of December. 4.4.2.5 Compliance with regulatory ratios As part of its liquidity management approach, Banco Sabadell Group monitors the short-term liquidity coverage ratio (LCR) and the net stable funding ratio (NSFR) and reports the necessary information to the regulator on a monthly and quarterly basis, respectively. The measurement of liquidity based on these metrics forms part of the liquidity risk control in the set of UGLs. In terms of LCR, as of 01 January 2018, the regulatory required minimum LCR is 100%, a level which is amply surpassed by all of the institution’s UGLs. At Group level, throughout the year the LCR has consistently been well above 100%. As at the end of December 2018, the LCR stood at 168% for the Group (excl. TSB) and at 298% in TSB.

277Statutory information
In terms of NSFR, this is still undergoing evaluation and has yet to be finalised, despite its implementation being scheduled for January 2018. However, the Group has already started monitoring this ratio as a liquidity metric for UGLs. Given the Group's funding structure, with a preponderance of customer deposits, and as the majority of its market funding is in the medium/long-term, the Group has maintained stable levels consistently over 100%. 44.4.3. Market risk Market risk is defined as the risk of financial asset positions losing their market value due to changes in risk factors affecting their quoted price or market performance, their volatility, or the interconnections that exist between them. Positions that generate market risk are usually held in connection with trading activity, which consists of hedging transactions arranged by the bank to provide services to its customers as well as discretionary proprietary positions. It may also arise simply due to maintaining overall balance sheet positions (also known as structural positions) that in net terms are left open. In the latter case, the institution uses the market risk management and monitoring system to manage its structural exchange rate risk position. The items of the Group’s consolidated balance sheet are shown below, making a distinction between positions included in trading activity and other positions. In the case of of items not included in trading activity, their main risk factor is indicated: Thousand euro
On--balance sheet balance Trading activity Rest Main risk factor for balance
sheet under "Rest" Assets subject to market risk 222,322,421 1,974,271 220,348,150
Cash, cash balances at central banks and other demand deposits 23,494,479 - 23,494,479 Interest rate
Financial assets held for trading 2,044,965 1,564,828 480,137 Interest rate
Non-trading financial assets mandatorily at fair value through profit or loss 141,314 - 141,314 Interest rate; credit spread
Financial assets at fair value through other comprehensive income 13,247,055 409,443 12,837,612 Interest rate; credit spread
Financial assets at amortised cost 164,415,563 - 164,415,563 Interest rate
Derivatives – Hedge accounting 301,975 - 301,975 Interest rate
Investments in joint ventures and associates 574,940 - 574,940 Equity; Exchange rate
Other financial assets 56,972 - 56,972 Interest rate Other non-financial assets 18,045,158 - 18,045,158
Liabilities subject tto market risk 210,205,421 1,319,238 208,886,183
Financial liabilities held for trading 1,738,354 1,319,238 419,116 Interest rate Derivatives – Hedge accounting 633,639 - 633,639 Interest rate Financial liabilities at amortised cost 206,076,860 - 206,076,860 Interest rate Provisions 466,379 - 466,379 Interest rate Other financial liabilities 36,502 - 36,502 Interest rate Other non-financial liabilities 1,253,687 - 1,253,687
Equity 12,117,000 - 12,117,000
The market risk acceptance, management and oversight system is based on managing positions expressly assigned to different trading desks and the establishment of limits for each one, in such a way that the trading desks have the obligation to manage their positions within the established limits and to obtain approval from the risks unit.

278 Banco Sabadell Annual report 2018
4.4.3.1 Trading activity The main risk factors considered by the Group in its trading activity are:
Interest rate risk: risk associated with the possibility of interest rate fluctuations adversely affecting the value of a financial instrument. This is reflected, for example, in transactions involving interbank deposits, fixed income and interest rate derivatives.
Credit spread risk: this risk arises from fluctuations in the credit spreads at which instruments are quoted with respect to other benchmark instruments, such as interbank interest rates. This risk occurs mainly in fixed-income instruments.
Exchange rate risk: risk associated with the fluctuation in exchange rates with respect to the functional currency. In the case of Banco Sabadell, the functional currency is the euro. This risk occurs mainly in currency exchange transactions and currency derivatives.
Equity price risk: risk arising from fluctuations in the value of capital instruments (shares and indices). This
risk is reflected in the market prices of the securities and their derivatives. Changes in commodities prices have not had an impact in the year, given that the Group’s has residual (both direct and underlying) exposures. Market risk in trading activities is measured using the VaR and stressed VaR methodologies. This allows for a standardisation of risks across different types of financial market transactions. VaR provides an estimate of the maximum potential loss associated with a position due to adverse, but normal, movements of one or more of the identified parameters generating market risk. This estimate is expressed in monetary terms and refers to a specific date, a particular level of confidence and a specific time horizon. A 99% confidence interval is used. Due to the low complexity of the instruments and the high level of liquidity of the positions, a time horizon of 1 day is used. The methodology used to calculate VaR is historical simulation. The advantages of this methodology are that it is based on the full revaluation of the transactions under recent historical scenarios, and that no assumptions are required concerning the distribution of market prices. The main limitation to this methodology is its reliance on historical data, given that, if a potential event has not materialised within the range of historical data used, it will not be reflected in the VaR information. The reliability of the VaR methodology can be checked using backtesting techniques, which serve to verify that the VaR estimates fall within the considered confidence level. Backtesting consists of comparing daily VaR against daily results. If losses exceed the level of VaR, an exception occurs. In 2018, there were no exceptions in the backtesting exercise due to the institution's low exposure in terms of its trading activity to the significant events that took place during the year, such as the decline of international stock markets in February and December, the devaluations of the euro against the dollar in April, May and August and the price drop of Italian bonds which began in May. Stressed VaR is calculated in the same way as VaR but with a historical insight into variations of the risk factors in stressed market conditions. This stress situation is determined on the basis of currently outstanding transactions, and it can vary if the portfolios ’risk profile changes. The methodology used for this risk metric is historical simulation. Its supervision is supplemented with additional measurements such as risk sensitivities, which refer to a change in the value of a position or portfolio in response to a change in a specific risk factor, and also with the calculation of management results, which are used to monitor stop-loss limits. Furthermore, specific simulation exercises are carried out applying extreme market scenarios (stress testing), which analyse the impacts of different historical and theoretical scenarios on the portfolios.

279Statutory information
Market risks are monitored on a daily basis and reports are made to the control bodies on the existing risk levels and on the compliance with the limits set forth by the Risks Committee for each management unit (limits based on nominal, VaR and sensitivity, as applicable). This makes it possible to keep track of changes in exposure levels and measure the contribution of market risk factors. Market risk incurred on trading activity in terms of the 1-day VaR with a 99% confidence interval for 2018 and 2017 is as follows:
Million euro
22018 22017 AAverage MMaximum MMinimum AAverage MMaximum MMinimum
Interest rate risk 2.35 26.73 0.41 5.97 23.74 0.40
Currency risk-trading 0.11 0.27 0.04 0.17 0.41 0.05
Equity 0.59 1.59 0.29 1.17 3.40 0.30
Credit spread 0.15 0.61 0.07 0.37 2.38 0.08
AAggregate VaR 33.19 227.46 00.97 77.69 224.95 11.35
The preceding table shows the market risk associated with trading activity, initially including interest rate derivatives (swaps) under accounting hedges, which were discontinued in 2018 and 2017, between the date of discontinuation of the accounting hedge and the subsequent final cancellation of the derivative. Taking into account only trading activity excluding discontinued hedging derivatives, the average VaR over 1 day and with a 99% confidence interval stood at 1.73 million euros in 2018 and at 2.84 million euros in 2017. 4.4.3.2 Structural interest rate risk Structural Interest rate risk (also known as Interest Rate Risk in the Banking Book, or IRRBB) is inherent to banking activities and is defined as the possibility of incurring losses as a result of the impact caused by interest rate fluctuations on the income statement (income and expenses) and on an entity’s equity structure (current value of assets, liabilities and off-balance sheet positions that are sensitive to interest rates). The concept of structural interest rate risk includes the following risk subtypes:
Repricing risk: related to a temporary mismatch between the maturity dates and the repricing of assets, liabilities and short and long-term off-balance sheet positions.
Curve risk: arising from changes in the form or gradient of the interest rate curve.
Basis risk: arising from hedging an interest rate exposure position by using a contrary position that is not
repriced in correlation with the initial position. Option risk: arising from options, including implicit options.
The metrics developed to control and monitor the Group’s structural interest rate risk are aligned with the market’s best practices and are consistently implemented across all balance sheet management units (UGBs, for their acronym in Spanish), and by local asset and liability committees. The diversification effect between currencies and UGBs is taken into account when presenting overall figures. The Group’s current interest rate risk management strategy is based particularly on the following principles and pillars, in line with the business model and the defined strategic objectives:
Each UGB has appropriate tools and processes and robust systems in order to properly identify, measure, manage, control and report on IRRBB. This allows them to obtain information from all of the identified sources of IRRBB, assess their effect on net interest margin and the economic value of equity and measure the vulnerability of the Group/UGB in the event of potential losses deriving from IRRBB under different stress scenarios.
The Group establishes a set of limits for overseeing and monitoring the level of IRRBB exposure that are appropriate to its internal management policies and risk appetite. However, each UGB is given discretions to set any other additional limits deemed necessary, based on their specific needs and the nature of their activities.

280 Banco Sabadell Annual report 2018
The existence of a funds transfer pricing system.
The set of systems, processes, metrics, limits, reporting and governance covered by the IRRBB strategy must
comply with regulatory requirements. The metrics used to monitor structural interest rate risk include, on one hand, the interest rate gap, a static measure which shows the breakdown of maturities, and the repricing of sensitive balance sheet items on the other. For items with no contractual maturity, expected maturities estimated using the bank’s past experience are considered. To this end, a model has been defined using historical monthly data in order to reproduce customer behaviour, establishing stability and interest payout parameters in line with the type of product and the type of customer, thereby satisfying current regulatory requirements. For the loan portfolio, prepayment assumptions are defined, broken down by type of product, to capture consumer behaviour. To this end, the institution uses historical data to allow such assumptions to be aligned with the market’s best practices. The following table gives details of the Group’s interest rate gap as at 31 December 2018:
A calculation is made of the sensitivities (difference between the value of forward rates in the baseline scenario and in the stressed scenario) of the various key economic figures: net interest margin (difference between interests accrued received and payable) and the economic value of equity (sum of the current net value of cash flows of assets, liabilities and off-balance sheet exposures that form part of the banking book) to changes in the interest rate curve. The following table shows the interest rate risk levels in terms of the sensitivity of the Group’s main currencies, as at 2018 year-end, to the most frequently used interest rate scenarios in the sector.
IInstant and parallel increase of 100 bps IInterest rate sensitivity IImpact on net interest margin IImpact on economic value of equity
EUR 2.6% (3.8%) GBP 2.3% 0.2% USD 0.1% (0.5%)

281Statutory information
In addition to the impact on the net interest margin within the time horizon of one year shown in the previous table, the Group calculates the impact on the margin over a time horizon of two years, the result of which is notably more positive for all of the currencies. In particular, the net interest margin’s sensitivity for the second year considering the main currencies of the Group has a high “pass through”, i.e. the percentage increase in benchmark interest rates which is transferred to customers ’term deposits and remunerated demand deposits stands at 7.9%, whereas with an average pass through this increases to 12.1%, as shown in the following table:
IInstant and parallel increase of 100 bps IImpact on net interest margin 2nd year HHigh Pass Through MMedium Pass TThrough
Total 7.9% 12.1% Of which EUR 4.2% 6.9% Of which GBP 3.4% 4.6%
Given the current level of market interest rates, in the scenario of a decline in interest rates, for the points of the curve in which rates are positive, a maximum shift of 100 basis points is applied in each term, so that the resulting interest rate is always greater than or equal to zero. In the points of the curve in which rates are negative, no shift is applied. Derivatives, mainly interest rate swaps (IRS), which qualify as hedges for accounting purposes, are arranged in financial markets to be used as risk hedging instruments. Two separate types of macro-hedging are used:
Interest rate macro-hedging of cash flows, the purpose of which is to reduce the volatility of the net interest margin in the event of interest rate fluctuations, for a one-year time horizon.
Interest rate macro-hedging of fair value, the purpose of which is to maintain the economic value of the
hedged items, consisting of assets and liabilities at a fixed interest rate. In Banco Sabadell, as part of the continuous improvement process, structural interest rate risk management and monitoring activities are implemented and regularly updated, aligning the institution with best market practices and current regulations. 4.4.3.3 Structural exchange rate risk Structural exchange rate risk arises in the event that changes in market exchange rates between different currencies generate losses on financial investments and on permanent investments in foreign branches and subsidiaries with functional currencies other than the euro. The purpose of managing structural exchange rate risk is to minimise the impact on the value of the portfolio / the institution's equity in the event of any adverse movements in currency markets. The foregoing takes into account the potential impacts on the capital (CET1) ratio and on the net interest margin, subject to the risk appetite defined in the RAS. Furthermore, the established levels for the risk metrics must be complied with at all times. Exchange rate risk is monitored on a regular basis and reports on current risk levels and compliance with the established limits are sent to the relevant control bodies. The main monitoring metric is currency exposure (measured as a percentage of Tier 1), which measures the sum of the net open position (assets less liabilities) maintained by the institution in each currency through any type of financial instrument (FX spots, forwards and options), valued in euros and in terms of Tier 1. Compliance with, and the effectiveness of, the Group's objectives and policies are monitored and reported on a monthly basis to the Risks Committee and to the Audit and Control Committee, respectively. The bank’s Financial Division, through the ALCO, designs and executes strategies to hedge structural FX positions in order to achieve its objectives in relation to the management of structural exchange rate risk. As regards permanent investments in US dollars, the structural position in this currency has gone from 442 million US dollars as at 31 December 2017 to 968 million US dollars as at 31 December 2018. In terms of permanent investments in Mexican pesos, given the uncertainty surrounding the new government (increasing market volatility linked to the perceived increase in political risk), the evolution of balances deriving from the business in Mexico is monitored, as is the EURMXN currency pair, in order to maintain a coverage level of over 70% of the total exposure in this currency. This has enabled the capital buffer to go from 7,474 million Mexican pesos as at 31 December 2017 (of a total exposure of 10,566 million Mexican pesos) to 11,050 million Mexican pesos as at 31 December 2018 (of a total exposure of 14,703 million Mexican pesos) (see Note 12 in the section on hedges of net investments in foreign operations).
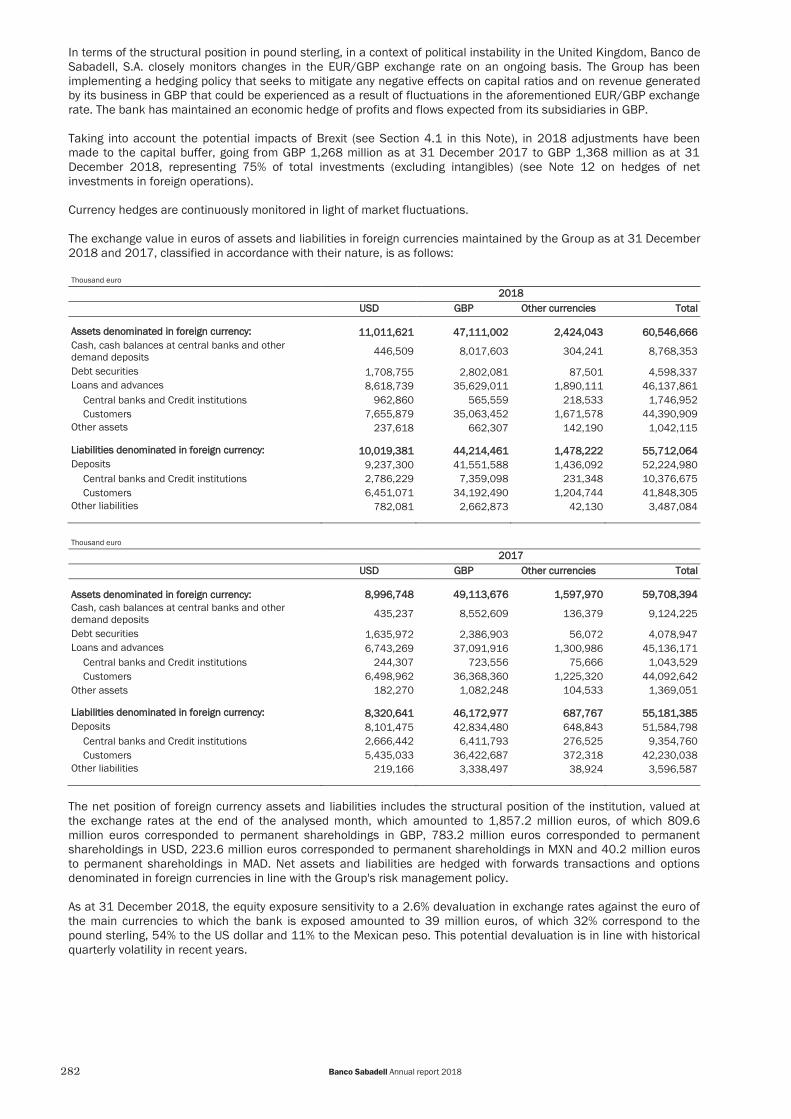
282 Banco Sabadell Annual report 2018
In terms of the structural position in pound sterling, in a context of political instability in the United Kingdom, Banco de Sabadell, S.A. closely monitors changes in the EUR/GBP exchange rate on an ongoing basis. The Group has been implementing a hedging policy that seeks to mitigate any negative effects on capital ratios and on revenue generated by its business in GBP that could be experienced as a result of fluctuations in the aforementioned EUR/GBP exchange rate. The bank has maintained an economic hedge of profits and flows expected from its subsidiaries in GBP. Taking into account the potential impacts of Brexit (see Section 4.1 in this Note), in 2018 adjustments have been made to the capital buffer, going from GBP 1,268 million as at 31 December 2017 to GBP 1,368 million as at 31 December 2018, representing 75% of total investments (excluding intangibles) (see Note 12 on hedges of net investments in foreign operations). Currency hedges are continuously monitored in light of market fluctuations. The exchange value in euros of assets and liabilities in foreign currencies maintained by the Group as at 31 December 2018 and 2017, classified in accordance with their nature, is as follows: Thousand euro
22018 UUSD GGBP OOther currencies TTotal
AAssets denominated in foreign currency: 111,011,621 447,111,002 22,424,043 660,546,666 Cash, cash balances at central banks and other demand deposits 446,509 8,017,603 304,241 8,768,353
Debt securities 1,708,755 2,802,081 87,501 4,598,337 Loans and advances 8,618,739 35,629,011 1,890,111 46,137,861
Central banks and Credit institutions 962,860 565,559 218,533 1,746,952 Customers 7,655,879 35,063,452 1,671,578 44,390,909
Other assets 237,618 662,307 142,190 1,042,115 LLiabilities denominated in foreign currency: 110,019,381 444,214,461 11,478,222 555,712,064 Deposits 9,237,300 41,551,588 1,436,092 52,224,980
Central banks and Credit institutions 2,786,229 7,359,098 231,348 10,376,675 Customers 6,451,071 34,192,490 1,204,744 41,848,305
Other liabilities 782,081 2,662,873 42,130 3,487,084
Thousand euro
22017 UUSD GGBP OOther ccurrencies TTotal
AAssets denominated in foreign currency: 88,996,748 449,113,676 11,597,970 559,708,394 Cash, cash balances at central banks and other demand deposits 435,237 8,552,609 136,379 9,124,225
Debt securities 1,635,972 2,386,903 56,072 4,078,947 Loans and advances 6,743,269 37,091,916 1,300,986 45,136,171
Central banks and Credit institutions 244,307 723,556 75,666 1,043,529 Customers 6,498,962 36,368,360 1,225,320 44,092,642
Other assets 182,270 1,082,248 104,533 1,369,051 LLiabilities denominated in foreign currency: 88,320,641 446,172,977 6687,767 555,181,385 Deposits 8,101,475 42,834,480 648,843 51,584,798
Central banks and Credit institutions 2,666,442 6,411,793 276,525 9,354,760 Customers 5,435,033 36,422,687 372,318 42,230,038
Other liabilities 219,166 3,338,497 38,924 3,596,587
The net position of foreign currency assets and liabilities includes the structural position of the institution, valued at the exchange rates at the end of the analysed month, which amounted to 1,857.2 million euros, of which 809.6 million euros corresponded to permanent shareholdings in GBP, 783.2 million euros corresponded to permanent shareholdings in USD, 223.6 million euros corresponded to permanent shareholdings in MXN and 40.2 million euros to permanent shareholdings in MAD. Net assets and liabilities are hedged with forwards transactions and options denominated in foreign currencies in line with the Group's risk management policy. As at 31 December 2018, the equity exposure sensitivity to a 2.6% devaluation in exchange rates against the euro of the main currencies to which the bank is exposed amounted to 39 million euros, of which 32% correspond to the pound sterling, 54% to the US dollar and 11% to the Mexican peso. This potential devaluation is in line with historical quarterly volatility in recent years.

283Statutory information
44.4.4. Operational Risk Operational risk is defined as the risk of incurring losses due to inadequate or failed internal processes, people or systems or due to unexpected external events. This definition includes reputational risk, conduct risk, technology risk, model risk and outsourcing risk. The management of operational risk is decentralised and devolved to process managers throughout the organisation. The processes that they manage are indicated in the corporate process flowchart, which facilitates the integration of data throughout the organisation. The Group has a central unit specialised in the management of operational risk, whose main functions are to coordinate, oversee and promote the identification, assessment and management of risks by the process managers, based on the management model adopted by Banco Sabadell Group. Senior Management and the Board of Directors are directly involved and effectively take part in managing this risk by approving the management framework and its implementation as proposed by the Operational Risk Committee. The latter is formed of Senior Management members from different functional areas within the institution. The management of this risk also requires regular audits to be carried out of the application of the management framework and the reliability of the information provided, as well as internal validation tests of the operational risk model. Operational risk management is based on two lines of action: The first line of action is based on the analysis of processes, the identification of risks associated with such processes that may result in losses and a qualitative assessment of the risks and the associated controls. The foregoing are carried out jointly between process managers and the central operational risk unit. This provides an assessment which lets the bank know its future exposure to the risk in terms of expected and unexpected loss and also allows trends to be foreseen and the corresponding mitigating actions to be efficiently planned. This is complemented by the identification, monitoring and active management of the risk through the use of key risk indicators. These allow warnings to be established, which alert the bank to any increase in this exposure, and also enable the identification of the causes for this increase, and the measurement of the effectiveness of the implemented controls and improvements. At the same time, a check is carried out to ensure that processes identified as being highly critical in the event of discontinued service have specific business continuity plans defined and in place. In terms of the identified risks, a qualitative estimate is made of the reputational impact that these risks could cause in the event of their occurrence. The second line of action is based on experience. It consists in recording all losses incurred by the institution in a database, which provides information about operational risks encountered by each line of business as well as their causes, so that action may be taken to minimise these risks. Additionally, this information allows the consistency between the estimated losses and the actual losses to be determined, in terms of both frequency and severity, iteratively improving the estimates of exposure levels. Within operational risk, the following risks are also managed and controlled:
Reputational risk: the possibility of incurring losses as a result of negative publicity related to the institution’s practices and business, which may also generate a loss of confidence in the institution, thereby affecting is solvency.
Technology risk: impact or effect on customer services (both internal and external) in terms of the types of
services affected and the resulting quality of such services, which could give rise to losses and/or errors in relation to data integrity, arising from the incorrect management, operation, control and/or failure of information systems and the resilience of such systems and the teams responsible for their management.
Outsourcing risk: the possibility of incurring losses deriving from suppliers failing to provide subcontracted services or discontinuing their provision, weaknesses in their systems ’security, disloyal customers or a breach of applicable regulations.
Model risk: the possibility of losses arising from decisions made using inadequate models.

284 Banco Sabadell Annual report 2018
In relation to technology risk, it should be noted that this has become a key focus area in the risk management of Banco Sabadell Group for different reasons:
Increase in the significance, complexity and use of technology in banking processes.
Increase in external threats (cyber crime) and their potential impacts on institutions and the financial system in general.
Implementation of new business models based on data and new technology and which therefore bring new
risks (emerging risks) which could potentially change Banco Sabadell’s risk profile. Additionally, this risk is not only applicable to the bank’s systems, but it is also applicable to suppliers, given the widespread use of third parties for support in technological and business processes, and this therefore represents a significant risk when it comes to managing outsourcing. 44.4.5. Tax Risk Tax risk is defined as the probability of failing to comply with the objectives set out in Banco Sabadell's tax strategy from a dual perspective due to either internal or external factors:
On one hand, the probability of failing to comply with tax obligations, potentially resulting in an undue shortfall of income, or the occurrence of any other event that generates potential damages for the bank in terms of meeting its objectives.
On the other hand, the probability of receiving an undue surplus of income as a result of failing to comply with
tax obligations, thus negatively affecting shareholders and other stakeholders. Banco Sabadell’s tax risk policies aim to set out principles and guidelines in order to ensure that any tax risks that may affect the Group's tax strategy and fiscal objectives are systematically identified, measured and managed so as to comply with the new requirements of the Spanish Capital Companies Act and of Banco Sabadell Group stakeholders. In terms of tax risk, Banco Sabadell aims to comply with its tax obligations at all times, adhering to the current legal framework in matters relating to taxation. Banco Sabadell’s tax strategy reflects its commitment to promoting responsible taxation, promoting prevention measures and developing key transparency schemes in order to gain the confidence and trust of its various stakeholders. The tax strategy is governed by the principles of efficiency, prudence, transparency and mitigation of tax risk, and is generally aligned with the business strategy of Banco Sabadell Group.
The Board of Directors of Banco Sabadell, under the mandate set out in the Spanish Capital Companies Act for the improvement of corporate governance, is responsible, and cannot delegate such responsibility, for the following:
Setting the institution's tax strategy.
Approving investments and operations of all types which are considered strategic or to have a particular tax risk due to their amounts or particular characteristics, except when such approval corresponds to the Annual General Meeting.
Approving the creation and acquisition of shareholdings in special purpose entities or entities domiciled in countries or territories classified as tax havens.
Approving any transaction which, due to its complexity, might undermine the transparency of the institution and its Group.
Thus, the duties of the Board of Directors of Banco Sabadell include the obligation to approve the corporate tax policy and ensure compliance therewith by implementing an appropriate control and oversight system, which is enshrined in the general risk management and control framework of the Group.

285Statutory information
44.4.6. Compliance Risk Compliance risk is the risk of incurring legal or administrative sanctions, significant financial losses or a loss or damage to the institution’s reputation as a result of an infringement of laws, regulations, internal procedures and codes of conduct applicable to the Group’s activity. An essential aspect of Banco Sabadell Group’s policy, and one of the foundations of its corporate culture, is the meticulous fulfilment of all legal provisions. The achievement of the business objectives must be compatible, at all times, with compliance with the law and the application of best practices. To this end, the Group has a Compliance Division whose mission is to seek the highest levels of compliance with current legislation and ensure that professional ethics are present in all areas of the Group’s activity. This Division assesses and manages compliance risk in order to minimise the possibility of any failures to comply with such legislation, and to ensure that any instances of non-compliance are identified, reported and diligently resolved. It does this by:
Distributing and overseeing the implementation of new regulations applicable to all of the institution’s activities, in order to keep them in line with the legislative framework.
Promoting the establishment of adequate policies, procedures and controls in order to ensure that the
company, in addition to its management staff, employees and third parties, comply with the applicable regulatory framework and to ensure that the necessary measures are taken to anticipate any changes in legislation.
Coordinating the different units within the Compliance Division in order to unify criteria and provide action guidelines in relation to compliance with the regulatory framework.
Promoting the creation of a methodological framework that enables the identification, classification and assessment of compliance risks, including risks relating to corporate crime prevention.
Directing the definition and implementation of control mechanisms to guarantee that all activity is in line with the established laws and rules in relation to: (i) anti-money laundering and counter-terrorist financing, (ii) market integrity, (iii) codes of conduct and investor protection, (iv) insurance distribution and (v) data protection, in order to place the standard of compliance within the market’s best practices.
Guaranteeing that compliance is supervised through a compliance risk oversight programme, reporting regularly to Senior Management on compliance risk.
Acting as a spokesperson before the relevant regulatory bodies, overseeing the responses to requirements and inspections by official or supervisory bodies in relation to anti-money laundering and counter-terrorist financing (SEPBLAC, Bank of Spain, etc.), and in relation to securities markets (CNMV), insurance distribution (Directorate General of Insurance and Pension Plans) and data protection (AGPD).
Advising on and overseeing compliance with the Group’s data protection regulation and acting as a link between organisations and control authorities.
Managing the capabilities required in the different units within the Compliance Division and the Customer Care Service in order to ensure that the necessary technical and human resources are in place, thereby enabling Group-level control mechanisms to be designed and implemented that can guarantee the alignment of all activities with the established laws, rules and ethical codes.
Lending support to the Internal Control Body responsible for compliance with regulations governing anti-money laundering and counter-terrorist financing.
Reporting on, reviewing or proposing corrective measures and/or responses to incidents detected in relation to conduct and queries submitted to the Corporate Ethics Committee on potential conflicts of interest, so that these may be used as guidance by employees.

286 Banco Sabadell Annual report 2018
NNote 5 – Minimum own funds and capital management Regulatory Framework The new regulatory framework with which the European Union implemented the capital regulations envisaged in the Basel III accords by the Basel Committee on Banking Supervision (BCBS) entered into force on 1 January 2014 in the form of a phase-in model spanning from this date until 1 January 2019. This regulation, which is split into three pillars, regulates the minimum own funds required to be kept by credit institutions, on an individual basis as well as on a consolidated basis, taking into account the way in which these own funds must be calculated (Pillar I), the internal capital assessment and oversight process (Pillar II), and the public information that must be disclosed to the market (Pillar III). This regulatory framework is based on the following legal acts:
• Directive 2013/36/EU (generally known as CRD-IV) of 26 June, of the European Parliament and of the Council, on access to the activity of credit institutions and the prudential supervision of credit institutions and investment firms, amending Directive 202/87/EC and repealing Directives 2006/48/EC and 2006/49/EC.
• Regulation (EU) 575/2013 (generally known as CRR) of 26 June 2013, of the European Parliament and of the
Council, on prudential requirements for credit institutions and investment firms and amending Regulation (EU) 648/2012.
Directive CRD-IV was transposed into the Spanish legal system through:
• RD-Law 14/2013 of 29 November, on urgent measures for adapting Spanish law to European Union
regulations in terms of supervision and solvency of financial institutions. • Law 10/2014 of 26 June, on the regulation, supervision and solvency of credit institutions. • Royal Decree 84/2015 of 13 February, implementing Law 10/2014 of 26 June, on the regulation,
supervision and solvency of credit institutions, completing the regulatory implementation of the above law, while merging into a single text all of the regulatory requirements for the organisation and discipline of credit institutions.
• Bank of Spain Circular 2/2016 of 2 February, the primary objective of which is to complete, in matters related
to credit institutions, the transposition of Directive 2013/36/EU (Supervision of Credit Institutions) into the Spanish legal system.
The CRR, which is directly applicable to Member States and, as such, to Spanish credit institutions, grants powers to the competent national authorities to make use of certain regulatory options. In this respect, Bank of Spain, by virtue of the enabling clause included in Royal Decree Law 14/2013, published Circulars 2/2014 and 3/2014, of 31 January and 30 July, respectively. It also recently published Circular 2/2016 by which it makes use of and implements these regulatory options. Under the requirements set forth in the CRR, credit institutions must comply with a total capital ratio of 8% at all times. However, regulators may exercise their authority under the new regulatory framework and require institutions to maintain additional capital. On 14 December 2017 the bank received a communication from the European Central Bank, subsequent to the Supervisory Review and Evaluation Process (SREP), with regard to the minimum prudential requirements applicable to the institution for 2018, based on which the Group must maintain a Common Equity Tier 1 (CET1) ratio of 8.3125%, measured on the basis of phase-in regulatory capital. This requirement includes the minimum required by Pillar 1 (4.50%), the Pillar 2 requirement (1.75%), the capital conservation buffer (1.875%) and the systemic risk buffer (O-SIIs) (0.1875%), and no final communication has been received since the aforementioned date regarding the prudential minimum requirements for 2019. Additionally, the Group must comply with the requirement arising from the calculation of the institution's specific counter-cyclical capital buffer, which, as at December 2018, stands at 0.14%.

287Statutory information
Furthermore, this is the consolidated CET1 level below which the Group would be obligated to calculate the maximum distributable amount (MDA), which would limit its distributions in the form of dividends, variable remuneration and coupon payments to holders of AT1 capital securities. As at 31 December 2018, the Group’s CET1 capital ratio stood at 12% therefore, with regard to the capital requirements mentioned in the preceding points, this does not imply any of the limitations mentioned. In 2018, Banco Sabadell Group took part in the stress test carried out by the European Banking Authority (EBA), together with Bank of Spain, the European Central Bank (ECB) and the European System Risk Board (ESRB).
In the baseline scenario, Banco Sabadell Group showed a significant organic capital generation capacity of +86 basis points over a three-year time horizon, from 2018-2020.
In the adverse scenario, the Group would achieve a phase-in CET1 ratio of 8.40% and a fully-loaded CET 1
ratio of 7.58% in 2020. This adverse scenario has been set by the ECB and the ESRB with a time horizon of 2020, basing its projections on a static balance sheet assumption as at December 2017 and therefore it does not take into account subsequent business strategies and management actions taken by the Group. Of the Group’s overall fully-loaded CET1 ratio reduction of 446 basis points in the adverse scenario:
(i) 180 basis points (40% of the total) are related to the United Kingdom and specifically to the adverse
macro-economic scenario defined for the stress test exercise in this geography, which was particularly severe compared to the scenarios applied to other geographies.
(ii) This impact is also driven by the fact that the contractual step-up in IT fees paid by TSB to Lloyds is projected and included in the Group’s recurrent cost base throughout the entire 2018-2020 period, even though this cost was only applicable from January 2017 until migration was completed in April 2018. In accordance with the methodology used in the stress test, this amount is considered constant during this three-year period although, in reality, this cost was only incurred for four months. This represents a reduction of the fully-loaded CET1 ratio of 45 basis points.
(iii) Likewise, 2018-2020 financial projections include the expenses incurred by Sabadell United Bank in 2017 prior to the sale of this subsidiary in July 2017, but not its revenue or its balance sheet. This represents a reduction of 15 basis points in the fully-loaded CET1 ratio.
These last two factors have a combined idiosyncratic effect which has translated into a negative impact of 60 basis points in the fully-loaded CET1 ratio. Finally, the results of the stress test demonstrate the Group’s resilience and its ability to overcome the adverse scenario that has been considered. On 15 May 2014 the following two regulations were published: Directive 2014/59/EU, of the European Parliament and of the Council, establishing a framework for the recovery and resolution of credit institutions and investment firms, and Regulation (EU) 806/2014, of the European Parliament and of the Council (BRRD), establishing the Single Resolution Mechanism, which aims to ensure an orderly resolution of failing banks with minimal costs for taxpayers and the real economy. With a view to achieving these objectives, the BRRD considers a series of instruments available to the competent resolution authority, which include the bail-in tool. The BRRD introduces a minimum requirement for own funds and eligible liabilities (MREL), which banks are required to comply with at all times in order to ensure that they have a buffer in place to absorb losses and guarantee the effective implementation of resolution tools. Within the scope of banking restructuring and resolution, Banco Sabadell is subject to the Single Resolution Board (SRB) as a resolution authority, and to Spanish competent authorities:
Bank of Spain, which acts a resolution prevention authority.
Fondo de Reestructuración Ordenada Bancaria (FROB), the Fund for Orderly Bank Restructuring, is the executive resolution authority.
In May 2018 Banco Sabadell received a communication from Bank of Spain regarding the decision adopted by the Single Resolution Board (SRB) regarding minimum own funds requirements and eligible liabilities (MREL) which are applicable to Sabadell. This decision established a minimum MREL, on a consolidated basis, of 22.7% of risk-weighted assets calculated as at 31 December 2016 and a transition period for compliance, ending on 1 January 2020. The decision was based on current legislation, it shall be updated every year and may be subject to subsequent

288 Banco Sabadell Annual report 2018
amendments by the resolution authority. The MREL decision is aligned with Banco Sabadell forecasts and it is included in the funding plan, which forms part of its strategic plan for 2020. Capital management The management of capital funds is the result of the ongoing capital planning process. This process considers the expected evolution of the economic, regulatory and sectoral environment, as well as more adverse scenarios. It takes into account the expected capital consumption in different activities, under the various envisaged scenarios, and the market conditions that could determine the effectiveness of the various actions that could be considered for implementation. The process is enshrined within the strategic objectives of the bank and aims to achieve an attractive return for shareholders, whilst also ensuring that its own funds are appropriate in terms of the inherent risks of banking activity. As regards capital management, as a general policy, the Group aims to adjust its overall available capital to the incurred risks. The Group follows the guidelines set out in CRD-IV and associated regulations in order to establish own funds requirements that are inherent to the risks that have been incurred by the Group, based on internal risk measurement models that have been previously validated by independent parties. To this end, the Group has been authorised by the supervisor to use the majority of its internal models in place to calculate regulatory capital requirements. The following table outlines the status of credit rating models developed by Banco Sabadell Group with regard to the authorisation by the supervisor for their usage when calculating own funds requirements.
BBreakdown of portfolios authorised by the supervisor for the use or gradual application of the iinternal--rratings based (IRB) approach
BBank RRegulatory EExposure PPortfolio
IInternal Portfolio IInternal Estimates Used IInternal ratings based aapproach SStatus
BSab Corporates
Portfolios subject to rating models for customers ranging
from corporate banking customers to SMEs and RE
developers
Probability of Default (PD) Loss Given Default (LGD)
Credit Conversion Factor (CCF) Advanced IRB Authorised on
06/2008
BSab Retail Mortgage scoring Probability of Default (PD)
Loss Given Default (LGD) Advanced IRB Authorised on 06/2008
BSab Retail Consumer Scoring Probability of Default (PD)
Loss Given Default (LGD) Advanced IRB Authorised on 06/2008
BSab Corporates Project Finance Probability of Default (PD) Supervisory Slotting
Criteria Authorised on
12/2009
BSab Retail Retailers and self-employed
Probability of Default (PD) Loss Given Default (LGD)
Credit Conversion Factor (CCF) Advanced IRB Authorised on
12/2010
BSab Retail Behavioural scoring of Cards
and Loans
Probability of Default (PD) Loss Given Default (LGD)
Credit Conversion Factor (CCF) Advanced IRB Authorised on
12/2011
BSab Retail Behavioural scoring of
Consumer Loans
Probability of Default (PD) Loss Given Default (LGD)
Credit Conversion Factor (CCF) Advanced IRB Authorised on
06/2008
BSab Retail Behavioural scoring of mortgage
loans
Probability of Default (PD) Loss Given Default (LGD)
Credit Conversion Factor (CCF) Advanced IRB Authorised on
06/2008
BSab Institutions Financial Institutions Probability of Default (PD) Foundation IRB Authorised on
12/2012
TSB Retail Mortgage scoring Probability of Default (PD) Loss Given Default (LGD)
Credit Conversion Factor (CCF) Advanced IRB Authorised on
06/2014
TSB Retail Consumer Loans Scoring Probability of Default (PD) Loss Given Default (LGD)
Credit Conversion Factor (CCF) Advanced IRB Authorised on
10/2014
TSB Retail Cards Scoring Probability of Default (PD) Loss Given Default (LGD)
Credit Conversion Factor (CCF) Advanced IRB Authorised on
06/2015
TSB Retail Current Accounts Scoring Probability of Default (PD) Loss Given Default (LGD)
Credit Conversion Factor (CCF) Advanced IRB Authorised on
06/2015
Data of models approved by the Supervisor, as at 31 December 2018 The date of authorisation refers to the date on which the Supervisor authorised the use of IRB models for each specific portfolio. The Group carries out frequent backtesting exercises on its IRB models, at least on an annual basis. These backtesting exercises are independently reviewed by the Internal Validation unit and reported for their monitoring to the internal governing bodies, such as the Technical Risks Committee and the Risks Committee (delegated Board committees).

289Statutory information
Additionally, the backtesting results that affect the risk parameters, and the main conclusions from these results, taking into account the criteria established by the EBA in its disclosure Guidelines, are included in the annual Pillar III Disclosures report. The Group has a model in place that comprehensively measures its risks using an internal measurement of allocated capital, and this model is based on the risk measurements provided by the new methodologies. The allocation of capital by risk type as at the end of 2018 is as follows: %
22018
Credit risk 81% Structural risk 5% Operational risk 10% Market risk 1% Other 3%
TTotal 1100%
The Group has a sophisticated system to measure each type of risk incurred as well as methodologies capable of integrating all of them. Such an approach requires a broad perspective of risk that considers possible stress scenarios and suitable financial planning in each case. The risk assessment systems used are in line with current best practices. Each year the Group carries out an internal capital adequacy assessment process. This process starts from a broad spectrum of previously identified risks and a qualitative internal assessment of policies, procedures and systems for accepting, measuring and controlling each type of risk as well as the corresponding mitigation techniques. The next stage involves a comprehensive quantitative assessment of the necessary capital based on internal parameters and using the Group’s own models (such as borrower credit rating and scoring systems) and other internal estimates appropriate to each type of risk. The assessments for each type of risk are then integrated and a figure is calculated to be used as an indicator in terms of allocated capital. In addition, the institution’s business and financial plans and stress testing exercises are taken into account to determine whether certain business developments or extreme scenarios could endanger its solvency when compared to its available own funds. Assessing the risk in terms of the capital that needs to allocated enables the risk to be linked to the profitability obtained at both transaction and customer level, all the way up to business unit level. The Group has implemented a risk adjusted return on capital (RaRoC) system which provides this assessment, enabling uniform comparisons to be made and included in the transaction pricing process. The level and quality of capital are metrics corresponding to the Risk Appetite Statement, and are included within the Group’s Risk Appetite Framework, which is detailed in Note 4. For more information on capital management see the Pillar III Disclosures report, published annually, which is available on the bank’s website (www.grupbancsabadell.com), in the section on Information for Shareholders and investors / Financial information.
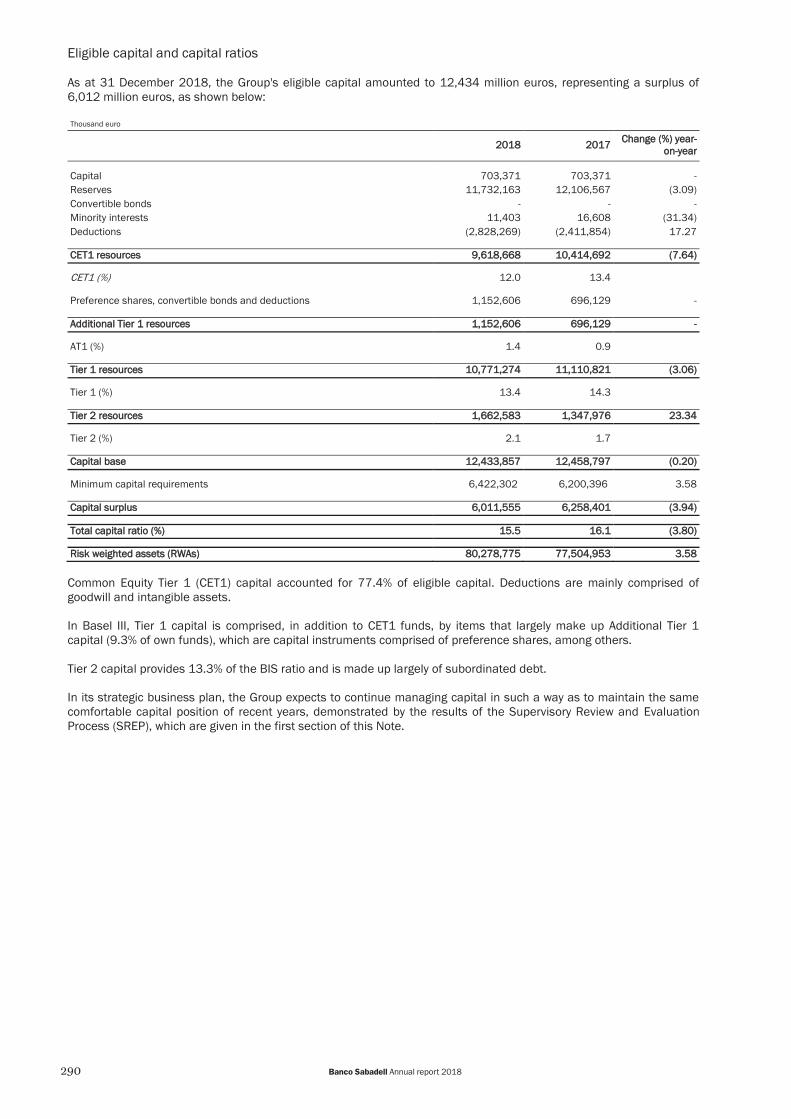
290 Banco Sabadell Annual report 2018
Eligible capital and capital ratios As at 31 December 2018, the Group's eligible capital amounted to 12,434 million euros, representing a surplus of 6,012 million euros, as shown below: Thousand euro
22018 22017 CChange (%) year--
oon--yyear
Capital 703,371 703,371 - Reserves 11,732,163 12,106,567 (3.09) Convertible bonds - - - Minority interests 11,403 16,608 (31.34) Deductions (2,828,269) (2,411,854) 17.27
CCET1 resources 99,618,668 110,414,692 ((7.64)
CET1 (%) 12.0 13.4 Preference shares, convertible bonds and deductions 1,152,606 696,129 -
AAdditional Tier 1 resources 11,152,606 6696,129 --
AT1 (%) 1.4 0.9 TTier 1 resources 110,771,274 111,110,821 ((3.06)
Tier 1 (%) 13.4 14.3 TTier 2 rresources 11,662,583 11,347,976 223.34
Tier 2 (%) 2.1 1.7 CCapital base 112,433,857 112,458,797 ((0.20)
Minimum capital requirements 6,422,302 6,200,396 3.58 CCapital surplus 66,011,555 66,258,401 ((3.94)
TTotal capital ratio (%) 115.5 116.1 ((3.80)
RRisk weighted assets (RWAs) 880,278,775 777,504,953 33.58
Common Equity Tier 1 (CET1) capital accounted for 77.4% of eligible capital. Deductions are mainly comprised of goodwill and intangible assets. In Basel III, Tier 1 capital is comprised, in addition to CET1 funds, by items that largely make up Additional Tier 1 capital (9.3% of own funds), which are capital instruments comprised of preference shares, among others. Tier 2 capital provides 13.3% of the BIS ratio and is made up largely of subordinated debt. In its strategic business plan, the Group expects to continue managing capital in such a way as to maintain the same comfortable capital position of recent years, demonstrated by the results of the Supervisory Review and Evaluation Process (SREP), which are given in the first section of this Note.

291Statutory information
Over the last 5 years, the Group has increased its capital base by over 5 billion euros, through the organic generation of profits and issues of capital qualifying as CET1, including the capital increase with pre-emptive subscription rights of 1,607 million euros carried out in 2015 in connection with the acquisition of TSB. In December 2018 500 million euros in subordinated bonds (Tier 2) were issued. All of these actions and events, both in terms of available capital and in terms of risk-weighted assets, have enabled Banco Sabadell to reach a phase-in Common Equity Tier 1 (CET 1) ratio of 12%, and a total capital ratio of 15.5% as at December 2018, substantially above regulatory minima. The following table shows movements in the various regulatory capital components during 2017-2018: Thousand euro CCET1 balance as at 31 December 2017 110,414,692
Profit attributed to the Group, net of dividends 164,052 Reserves (782,893) Minority interests 162 Valuation adjustments (326,851) Deductions and transition effects 149,506
CCET1 balance as at 31 December 2018 99,618,668
Thousand euro AAdditional Tier 1 balance as at 31 December 2017 6696,129
Eligible instruments - Minority interests 197 Deductions and transition effects 456,280
AAdditional Tier 1 balance as at 31 December 2018 11,152,606
Thousand euro TTier 2 balance as at 31 December 2017 11,347,976
Eligible instruments 418,116 Credit risk adjustments (14,198) Minority interests 263 Deductions and transition effects (89,575)
TTier 2 balance as at 31 December 2018 11,662,583
The changes in the period are largely the effects of two factors:
The end of the transitional period for the deduction of intangible assets and goodwill, which have been fully deducted from CET1, while in 2017 20% was deducted from AT1.
The implementation of IFRS 9, although, as the Group decided to apply the transitional arrangements set
forth in Regulation (EU) 2017/2395, this effect can be seen in a number of items. For further details, please refer to the table showing the impact that the application of these transitional arrangements has had on the various capital ratios compared to the impact if the IFRS 9 rules had been applied in full (on fully-loaded terms), later on in this section.
In addition to the foregoing, particularly in the second half of the year, there were also impacts caused by the valuation adjustments of the fair value portfolio, the SAREB debt impairment and the impact of institutional sales of non-performing assets (impact on the consolidated income statement through extraordinary provisions). The changes in Tier 2 reflect the issuance of 500 million euros in subordinated bonds carried out in December 2018.

292 Banco Sabadell Annual report 2018
The table below shows the reconciliation between equity and regulatory capital: Thousand euro
22018 22017
Own funds 12,544,931 13,425,916 Accumulated other comprehensive income (491,470) (265,311) Minority interests 63,539 61,176 TTotal equity 112,117,000 113,221,781
Goodwill and intangibles (2,461,142) (1,796,685) Other adjustments (37,190) (1,010,404) RRegulatory accounting adjustments ((2,498,332) ((2,807,089)
CCommon Equity Tier 1 capital 99,618,668 110,414,692
AAdditional Tier 1 capital 11,152,606 6696,129 TTier 2 capital 11,662,583 11,347,976
TTotal regulatory capital 112,433,857 112,458,797
As at 31 December 2018, there is no significant difference between the public scope of consolidation and the regulatory scope of consolidation. Risk-weighted assets (RWAs) for the period stand at 80,278,775 thousand euros, which represents a 7.7% increase compared with the previous year. The following table shows the reasons for changes in RWAs weighted by credit risk occurring during the year: Thousand euro
RRWA CCapital requirements ((*)
BBalance as at 31 December 2017 668,645,275 55,491,622
Change in business volume 2,252,468 180,197 Asset quality (1,171,501) (93,720) Changes in models (39,603) (3,168) Methodology, parameters and policies (770,716) (61,657) Exchange rate (**) 114,630 9,170 Other 8,343 667 BBalance as at 31 December 2018 669,038,896 55,523,112 Excludes credit valuation adjustment (CVA) requirements and contributions to the default guarantee fund of CCPs.
(*) Calculated as 8% of RWAs.
(**) Changes due to exchange rate fluctuations are due to structural positions in GBP, USD and MXN, which are not hedged in order to protect the capital ratio against adverse exchange rate effects.
The breakdown of risk-weighted assets by type of risk in 2018 is shown below, with credit risk accounting for the largest proportion. %
22018
Credit risk (*) 88.71% Operational risk 10.37% Market risk 0.92%
TTotal 1100% (*) Includes counterparty credit risk and other risk exposure amounts.
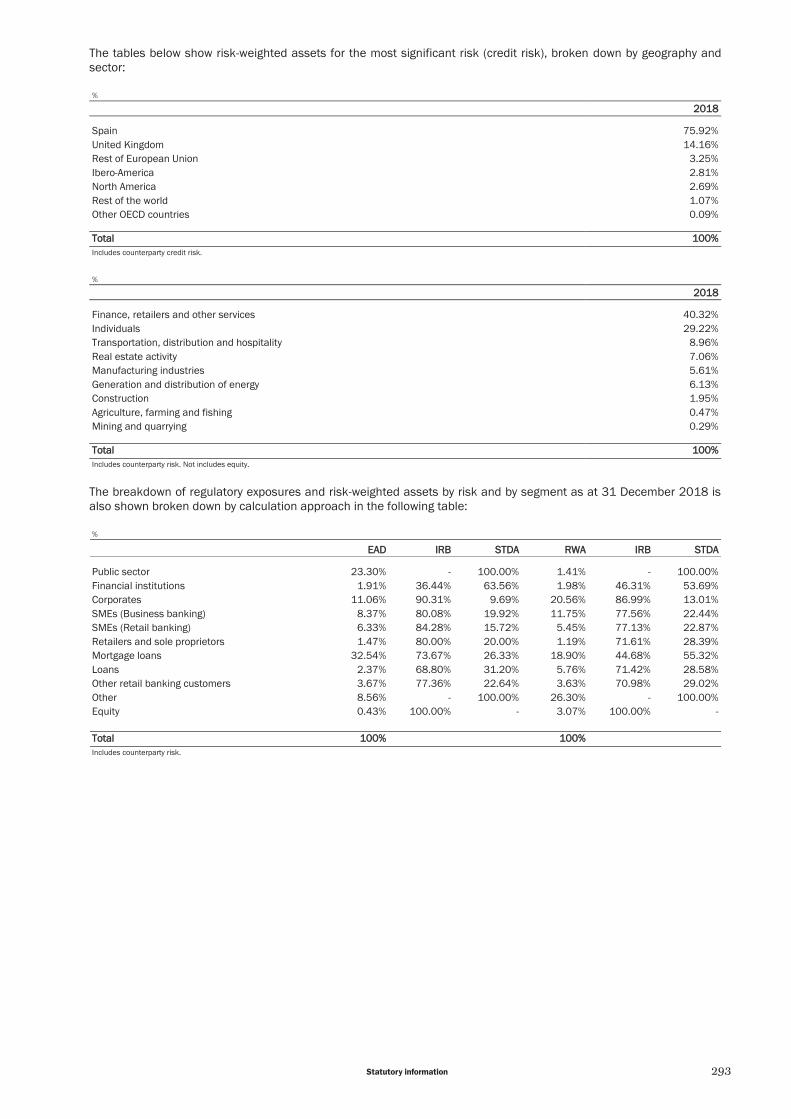
293Statutory information
The tables below show risk-weighted assets for the most significant risk (credit risk), broken down by geography and sector: %
22018
Spain 75.92% United Kingdom 14.16% Rest of European Union 3.25% Ibero-America 2.81% North America 2.69% Rest of the world 1.07% Other OECD countries 0.09%
TTotal 1100% Includes counterparty credit risk.
%
22018
Finance, retailers and other services 40.32% Individuals 29.22% Transportation, distribution and hospitality 8.96% Real estate activity 7.06% Manufacturing industries 5.61% Generation and distribution of energy 6.13% Construction 1.95% Agriculture, farming and fishing 0.47% Mining and quarrying 0.29%
TTotal 1100% Includes counterparty risk. Not includes equity.
The breakdown of regulatory exposures and risk-weighted assets by risk and by segment as at 31 December 2018 is also shown broken down by calculation approach in the following table: %
EEAD IIRB SSTDA RRWA IIRB SSTDA
Public sector 23.30% - 100.00% 1.41% - 100.00% Financial institutions 1.91% 36.44% 63.56% 1.98% 46.31% 53.69% Corporates 11.06% 90.31% 9.69% 20.56% 86.99% 13.01% SMEs (Business banking) 8.37% 80.08% 19.92% 11.75% 77.56% 22.44% SMEs (Retail banking) 6.33% 84.28% 15.72% 5.45% 77.13% 22.87% Retailers and sole proprietors 1.47% 80.00% 20.00% 1.19% 71.61% 28.39% Mortgage loans 32.54% 73.67% 26.33% 18.90% 44.68% 55.32% Loans 2.37% 68.80% 31.20% 5.76% 71.42% 28.58% Other retail banking customers 3.67% 77.36% 22.64% 3.63% 70.98% 29.02% Other 8.56% - 100.00% 26.30% - 100.00% Equity 0.43% 100.00% - 3.07% 100.00% -
TTotal 1100% 1100% Includes counterparty risk.
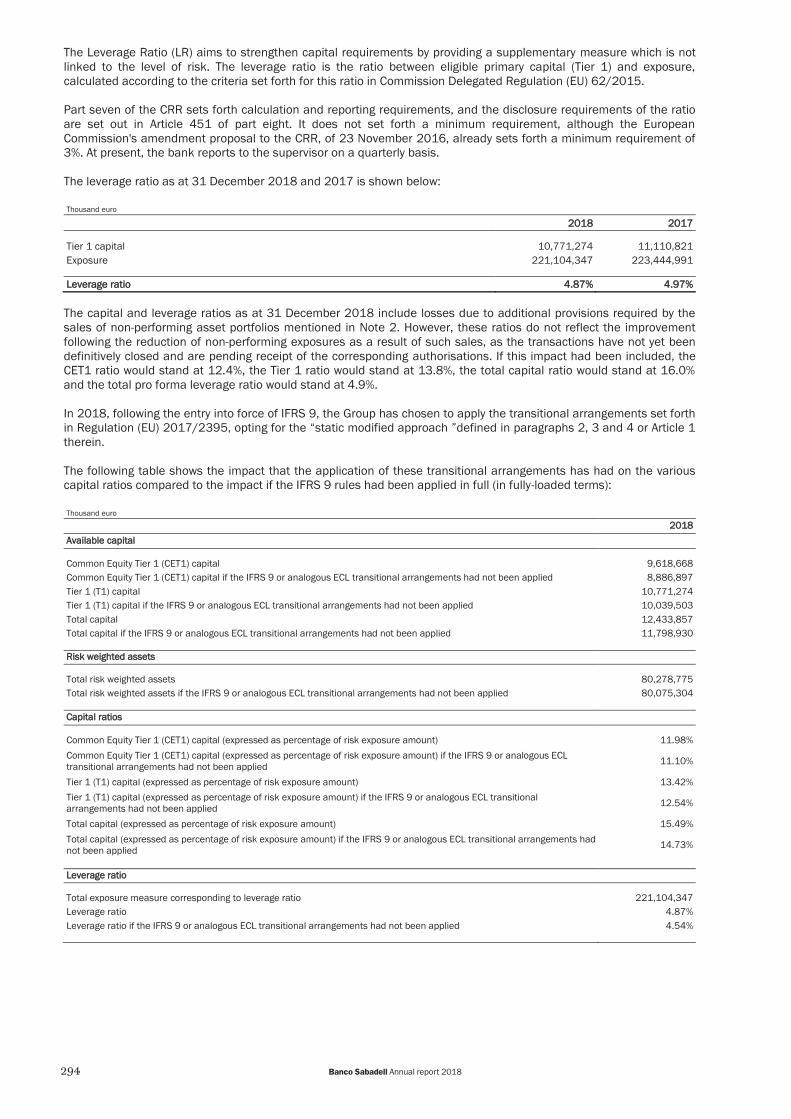
294 Banco Sabadell Annual report 2018
The Leverage Ratio (LR) aims to strengthen capital requirements by providing a supplementary measure which is not linked to the level of risk. The leverage ratio is the ratio between eligible primary capital (Tier 1) and exposure, calculated according to the criteria set forth for this ratio in Commission Delegated Regulation (EU) 62/2015. Part seven of the CRR sets forth calculation and reporting requirements, and the disclosure requirements of the ratio are set out in Article 451 of part eight. It does not set forth a minimum requirement, although the European Commission's amendment proposal to the CRR, of 23 November 2016, already sets forth a minimum requirement of 3%. At present, the bank reports to the supervisor on a quarterly basis. The leverage ratio as at 31 December 2018 and 2017 is shown below: Thousand euro
22018 22017
Tier 1 capital 10,771,274 11,110,821 Exposure 221,104,347 223,444,991
LLeverage ratio 44.87% 44.97%
The capital and leverage ratios as at 31 December 2018 include losses due to additional provisions required by the sales of non-performing asset portfolios mentioned in Note 2. However, these ratios do not reflect the improvement following the reduction of non-performing exposures as a result of such sales, as the transactions have not yet been definitively closed and are pending receipt of the corresponding authorisations. If this impact had been included, the CET1 ratio would stand at 12.4%, the Tier 1 ratio would stand at 13.8%, the total capital ratio would stand at 16.0% and the total pro forma leverage ratio would stand at 4.9%. In 2018, following the entry into force of IFRS 9, the Group has chosen to apply the transitional arrangements set forth in Regulation (EU) 2017/2395, opting for the “static modified approach ”defined in paragraphs 2, 3 and 4 or Article 1 therein. The following table shows the impact that the application of these transitional arrangements has had on the various capital ratios compared to the impact if the IFRS 9 rules had been applied in full (in fully-loaded terms): Thousand euro
22018
AAvailable ccapital Common Equity Tier 1 (CET1) capital 9,618,668 Common Equity Tier 1 (CET1) capital if the IFRS 9 or analogous ECL transitional arrangements had not been applied 8,886,897 Tier 1 (T1) capital 10,771,274 Tier 1 (T1) capital if the IFRS 9 or analogous ECL transitional arrangements had not been applied 10,039,503 Total capital 12,433,857 Total capital if the IFRS 9 or analogous ECL transitional arrangements had not been applied 11,798,930
RRisk weighted assets
Total risk weighted assets 80,278,775 Total risk weighted assets if the IFRS 9 or analogous ECL transitional arrangements had not been applied 80,075,304
CCapital ratios
Common Equity Tier 1 (CET1) capital (expressed as percentage of risk exposure amount) 11.98%
Common Equity Tier 1 (CET1) capital (expressed as percentage of risk exposure amount) if the IFRS 9 or analogous ECL transitional arrangements had not been applied 11.10%
Tier 1 (T1) capital (expressed as percentage of risk exposure amount) 13.42%
Tier 1 (T1) capital (expressed as percentage of risk exposure amount) if the IFRS 9 or analogous ECL transitional arrangements had not been applied 12.54%
Total capital (expressed as percentage of risk exposure amount) 15.49%
Total capital (expressed as percentage of risk exposure amount) if the IFRS 9 or analogous ECL transitional arrangements had not been applied 14.73%
LLeverage ratio
Total exposure measure corresponding to leverage ratio 221,104,347 Leverage ratio 4.87% Leverage ratio if the IFRS 9 or analogous ECL transitional arrangements had not been applied 4.54%
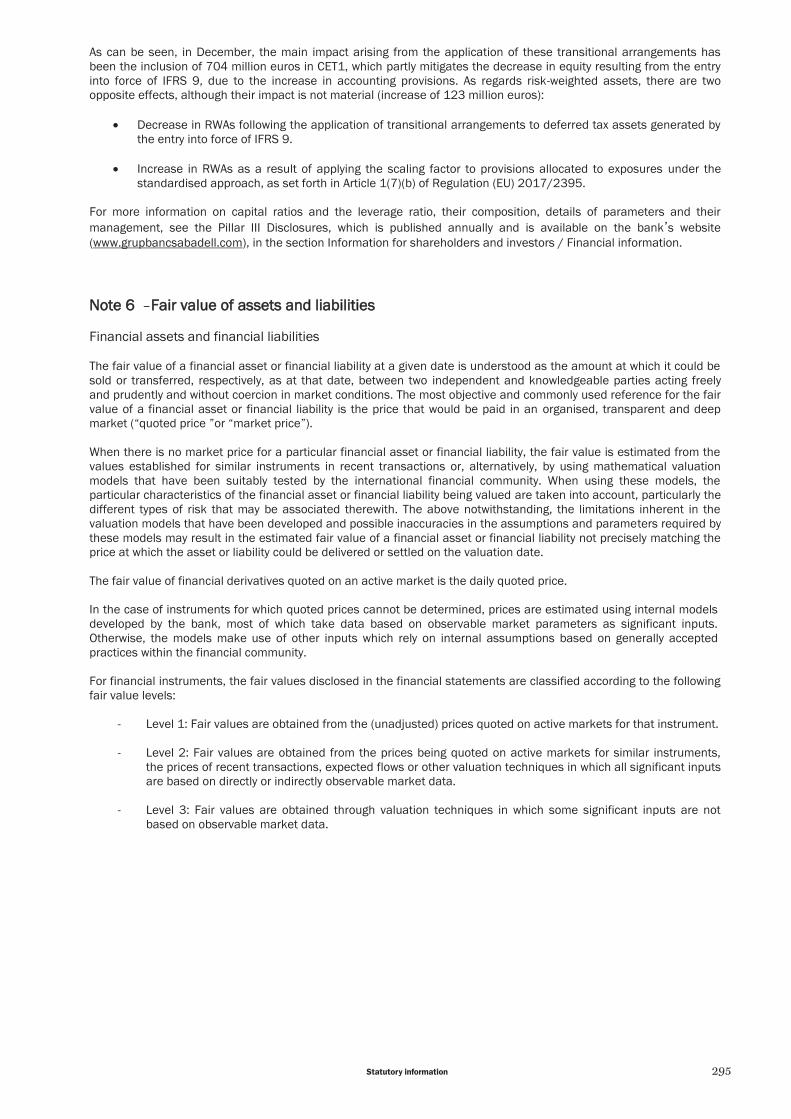
295Statutory information
As can be seen, in December, the main impact arising from the application of these transitional arrangements has been the inclusion of 704 million euros in CET1, which partly mitigates the decrease in equity resulting from the entry into force of IFRS 9, due to the increase in accounting provisions. As regards risk-weighted assets, there are two opposite effects, although their impact is not material (increase of 123 million euros):
Decrease in RWAs following the application of transitional arrangements to deferred tax assets generated by the entry into force of IFRS 9.
Increase in RWAs as a result of applying the scaling factor to provisions allocated to exposures under the standardised approach, as set forth in Article 1(7)(b) of Regulation (EU) 2017/2395.
For more information on capital ratios and the leverage ratio, their composition, details of parameters and their management, see the Pillar III Disclosures, which is published annually and is available on the bank’s website (www.grupbancsabadell.com), in the section Information for shareholders and investors / Financial information. NNote 6 – Fair value of assets and liabilities Financial assets and financial liabilities The fair value of a financial asset or financial liability at a given date is understood as the amount at which it could be sold or transferred, respectively, as at that date, between two independent and knowledgeable parties acting freely and prudently and without coercion in market conditions. The most objective and commonly used reference for the fair value of a financial asset or financial liability is the price that would be paid in an organised, transparent and deep market (“quoted price ”or “market price”). When there is no market price for a particular financial asset or financial liability, the fair value is estimated from the values established for similar instruments in recent transactions or, alternatively, by using mathematical valuation models that have been suitably tested by the international financial community. When using these models, the particular characteristics of the financial asset or financial liability being valued are taken into account, particularly the different types of risk that may be associated therewith. The above notwithstanding, the limitations inherent in the valuation models that have been developed and possible inaccuracies in the assumptions and parameters required by these models may result in the estimated fair value of a financial asset or financial liability not precisely matching the price at which the asset or liability could be delivered or settled on the valuation date. The fair value of financial derivatives quoted on an active market is the daily quoted price. In the case of instruments for which quoted prices cannot be determined, prices are estimated using internal models developed by the bank, most of which take data based on observable market parameters as significant inputs. Otherwise, the models make use of other inputs which rely on internal assumptions based on generally accepted practices within the financial community. For financial instruments, the fair values disclosed in the financial statements are classified according to the following fair value levels:
- Level 1: Fair values are obtained from the (unadjusted) prices quoted on active markets for that instrument.
- Level 2: Fair values are obtained from the prices being quoted on active markets for similar instruments, the prices of recent transactions, expected flows or other valuation techniques in which all significant inputs are based on directly or indirectly observable market data.
- Level 3: Fair values are obtained through valuation techniques in which some significant inputs are not
based on observable market data.

296 Banco Sabadell Annual report 2018
Set out below are the main valuation methods, assumptions and inputs used when estimating the fair value of financial instruments classified in Levels 2 and 3, according to the type of instrument concerned:
LLevel 2 financial iinstruments VValuation methods MMain assumptions MMain inputs used
Debt securities Net present value method
Calculation of the present value of financial instruments as the present value of future cash flows (discounted at market interest rates), taking into account: - An estimate of pre-payment rates - Issuers' credit risk
- Issuer credit spreads - Observable market interest rates
Equity instruments Sector multiples (P/BV)
Based on the NACE code that best represents the company's primary activity, the price-to-book value (P/BV) ratio obtained from peers is applied.
- NACE codes - Share price listings in organised markets
Derivatives (a)
Black-Scholes model (analytic/semi-analytic formulae)
For equity derivatives, inflation, currencies and commodities: - Black-Scholes assumes a lognormal process of forward rates taking into account potential convexity adjustments. For equity derivatives, inflation,
currencies and commodities: - Forward structure of the underlying asset, given by market data (dividends, swap points, etc.) - Volatility surfaces of options For interest rate derivatives: - Term structure of interest –Volatility surfaces of Libor rate Options (caps) and Swap rates (swaptions) - Probability of default for the calculation of CVA and DVA (b) For credit derivatives: - Price listings of Credit Default Swaps (CDS) - Historic volatility of credit spreads
For equity derivatives, currencies and commodities: - Monte Carlo simulations - SABR
Black-Scholes model: a lognormal distribution is assumed for the underlying asset with volatility depending on the term. - SABR: stochastic volatility model.
For interest rate derivatives: - Standard Model - Shifted Libor Market Model
These models assume that: - The standard and shifted models allow negative interest rates. - Forward rates in the term structure of the interest rate curve are fully correlated.
For credit derivatives: - Intensity models
These models assume a default probability structure resulting from term-based default intensity rates.
(a) Given the small net position of Banco Sabadell, the funding value adjustment (FVA) is estimated to have a non-material impact on the valuation of derivatives. (b) To calculate CVA and DVA, levels of severity fixed at 60% have been used, which corresponds to the market standard for senior debt. Average future, positive and negative exposures have been estimated using market models, Libor for interest rates and the Black-Scholes model for currencies, using market inputs. The probability of default of customers with no quoted debt instruments or CDS have been obtained using the IRB model and for Banco Sabadell those obtained from the CDS stock prices have been assigned.
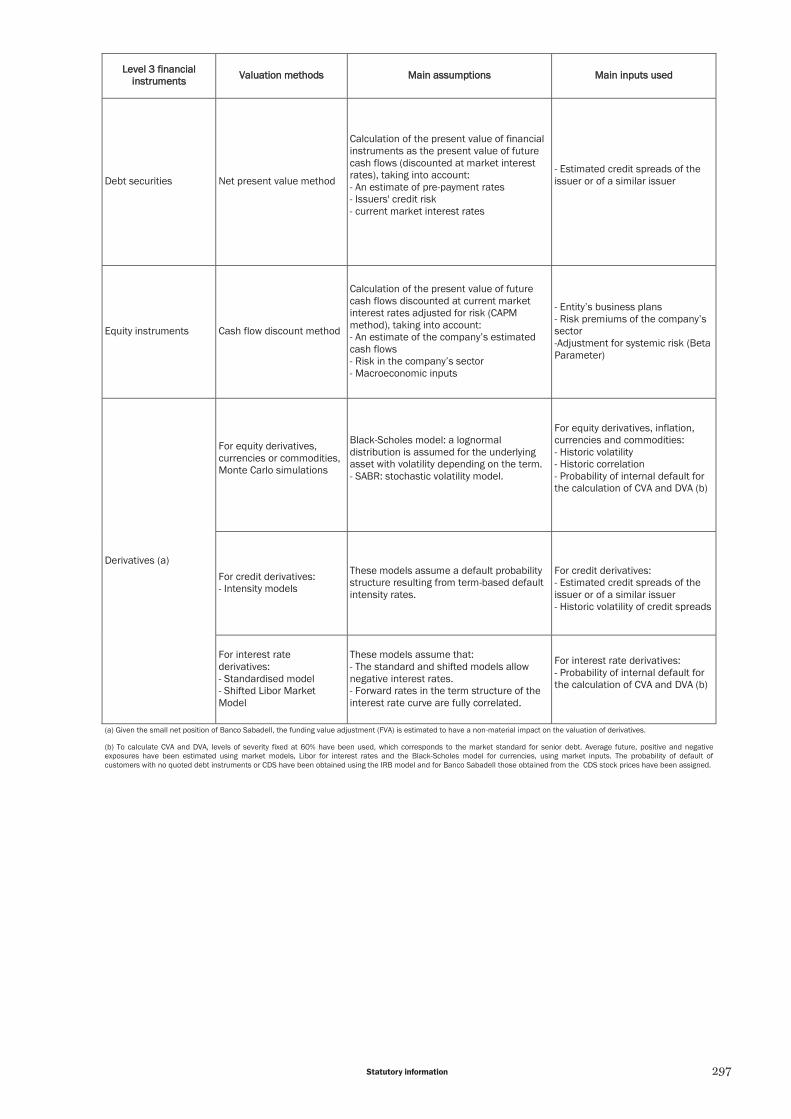
297Statutory information
LLevel 33 ffinancial iinstruments VValuation methods MMain assumptions MMain inputs used
Debt securities Net present value method
Calculation of the present value of financial instruments as the present value of future cash flows (discounted at market interest rates), taking into account: - An estimate of pre-payment rates - Issuers' credit risk - current market interest rates
- Estimated credit spreads of the issuer or of a similar issuer
Equity instruments Cash flow discount method
Calculation of the present value of future cash flows discounted at current market interest rates adjusted for risk (CAPM method), taking into account: - An estimate of the company’s estimated cash flows - Risk in the company’s sector - Macroeconomic inputs
- Entity’s business plans - Risk premiums of the company’s sector -Adjustment for systemic risk (Beta Parameter)
Derivatives (a)
For equity derivatives, currencies or commodities, Monte Carlo simulations
Black-Scholes model: a lognormal distribution is assumed for the underlying asset with volatility depending on the term. - SABR: stochastic volatility model.
For equity derivatives, inflation, currencies and commodities: - Historic volatility - Historic correlation - Probability of internal default for the calculation of CVA and DVA (b)
For credit derivatives: - Intensity models
These models assume a default probability structure resulting from term-based default intensity rates.
For credit derivatives: - Estimated credit spreads of the issuer or of a similar issuer - Historic volatility of credit spreads
For interest rate derivatives: - Standardised model - Shifted Libor Market Model
These models assume that: - The standard and shifted models allow negative interest rates. - Forward rates in the term structure of the interest rate curve are fully correlated.
For interest rate derivatives: - Probability of internal default for the calculation of CVA and DVA (b)
(a) Given the small net position of Banco Sabadell, the funding value adjustment (FVA) is estimated to have a non-material impact on the valuation of derivatives.
(b) To calculate CVA and DVA, levels of severity fixed at 60% have been used, which corresponds to the market standard for senior debt. Average future, positive and negative exposures have been estimated using market models, Libor for interest rates and the Black-Scholes model for currencies, using market inputs. The probability of default of customers with no quoted debt instruments or CDS have been obtained using the IRB model and for Banco Sabadell those obtained from the CDS stock prices have been assigned.

298 Banco Sabadell Annual report 2018
DDetermination of the fair value of financial instruments A comparison between the value at which the Group's financial assets and financial liabilities are recognised on the accompanying consolidated balance sheets and their corresponding fair values is shown below: Thousand euro
2018 2017 Note Carrying balance Fair value Carrying balance Fair value
Assets: Cash, cash balances at central banks and other demand deposits 7 23,494,479 23,494,479 26,362,807 26,362,807
Financial assets held for trading 8, 9, 10 2,044,965 2,044,965 1,572,504 1,572,504 Non-trading financial assets mandatorily at fair value through profit or loss 8 141,314 141,314 39,526 39,526
Financial assets designated at fair value through profit or loss - - - -
Financial assets at fair value through other comprehensive income 8, 9 13,247,055 13,247,055 13,180,716 13,180,716
Financial assets at amortised cost 8, 11 164,415,563 166,537,253 160,723,766 167,818,359 Derivatives – Hedge accounting 12 301,975 301,975 374,021 374,021 Fair value changes of the hedged items in portfolio hedge of interest rate risk 56,972 56,972 48,289 48,289
Total assets 203,702,323 205,824,013 202,301,629 209,396,222
Thousand euro
2018 2017 Note Carrying balance Fair value Carrying balance Fair value
Liabilities: Financial liabilities held for trading 10 1,738,354 1,738,354 1,431,215 1,431,215 Financial liabilities designated at fair value through profit or loss
- - 39,540 39,540
Financial liabilities at amortised cost 18, 19, 20, 21 206,076,860 201,463,185 204,045,482 203,506,188
Derivatives – Hedge accounting 12 633,639 633,639 1,003,854 1,003,854 Fair value changes of the hedged items in portfolio hedge of interest rate risk 36,502 36,502 (4,593) (4,593)
Total liabilities 208,485,355 203,871,680 206,515,498 205,976,204
In relation to financial instruments whose book value differs from their fair value, the latter has been calculated as follows: – The fair value of the heading "Cash, cash balances at central banks and other demand deposits" has been likened
to its book value, as these are mainly short-term balances. – The fair value of the headings “Financial assets at amortised cost" and “Financial liabilities at amortised cost ”has
been estimated by the discounted cash flow method, using market interest rates at the end of each year, with the exception of debt securities, for which it has been estimated using year-end market prices. The majority of the valuations of these financial assets are considered as Level 2. – Under the heading “Fair value changes of hedged items in portfolio hedge of interest rate risk ”of the accompanying
consolidated balance sheets, adjustments (positive or negative) are recorded measured at the fair value of the financial assets or financial liabilities included in the amortised cost portfolio, which correspond exclusively to hedged interest rate risk. Fair value is calculated using internal models and observable market data variables.

299Statutory information
The following table shows the main financial instruments recognised at fair value in the accompanying consolidated balance sheets, broken down according to the valuation method used to estimate their fair value: Thousand euro
22018 NNote LLevel 1 LLevel 2 LLevel 3 TTotal AAssets: Financial assets held for trading 320,241 1,724,724 - 2,044,965
Derivatives 10 - 1,720,274 - 1,720,274 Equity instruments 9 4,246 3,008 - 7,254 Debt securities 8 315,995 1,442 - 317,437 Loans and advances – Customers - - - -
Non-trading financial assets mandatorily at fair value through profit or loss
24,412 42,648 74,254 141,314
Equity instruments - - - - Debt securities 8 24,412 42,648 74,254 141,314 Loans and advances - - - -
Financial assets designated at fair value through profit or loss
- - - -
Debt securities - - - - Loans and advances – Credit institutions - - - -
Financial assets at fair value through other comprehensive income
12,722,944 468,627 55,484 13,247,055
Equity instruments 9 59,027 155,825 55,484 270,336 Debt securities 8 12,663,917 312,802 - 12,976,719 Loans and advances - - - -
Derivatives – Hedge accounting 12 737 301,238 - 301,975 TTotal assets 113,068,334 22,537,237 1129,738 115,735,309
Thousand euro
22018 NNote LLevel 1 LLevel 2 LLevel 3 TTotal LLiabilities: Financial liabilities held for trading 48,121 1,690,233 - 1,738,354
Derivatives 10 - 1,690,233 - 1,690,233 Short positions 48,121 - - 48,121 Deposits with credit institutions - - - -
Financial liabilities designated at fair value through profit or loss
- - - -
Derivatives – Hedge accounting 12 35,871 597,768 - 633,639 TTotal liabilities 883,992 22,288,001 -- 22,371,993

300 Banco Sabadell Annual report 2018
Thousand euro
22017 NNote LLevel 1 LLevel 2 LLevel 3 TTotal AAssets: Financial assets held for trading 110,358 1,462,146 - 1,572,504
Derivatives 10 325 1,440,418 - 1,440,743 Equity instruments 9 - 7,432 - 7,432 Debt securities 8 110,033 14,296 - 124,329 Loans and advances – Customers - - - -
Non-trading financial assets mandatorily at fair value through profit or loss
- 39,526 - 39,526
Equity instruments 9 - 39,526 - 39,526 Debt securities - - - - Loans and advances - - - -
Financial assets designated at fair value through profit or loss
- - - -
Debt securities - - - - Loans and advances – Credit institutions - - - -
Financial assets at fair value through other comprehensive income
12,529,039 475,395 176,282 13,180,716
Equity instruments 9 56,717 180,299 176,282 413,298 Debt securities 8 12,472,322 295,096 - 12,767,418 Loans and advances - - - -
Derivatives – Hedge accounting 12 41,039 332,982 - 374,021 TTotal assets 112,680,436 22,310,049 1176,282 115,166,767
Thousand euro
22017 NNote LLevel 1 LLevel 2 LLevel 3 TTotal LLiabilities: Financial liabilities held for trading 70,165 1,361,050 - 1,431,215
Derivatives 10 311 1,361,050 - 1,361,361 Short positions 69,854 - - 69,854 Deposits with credit institutions - - - -
Financial liabilities designated at fair value through profit or loss
- 39,540 - 39,540
Derivatives – Hedge accounting 12 22,502 981,352 - 1,003,854 TTotal liabilities 992,667 22,381,942 -- 22,474,609
Derivatives without a collateral contract (CSAs) include the Credit Valuation Adjustment (CVA) and Debit Valuation Adjustment (DVA) in their fair value. The fair value of these derivatives represents 7.99% of the total, and their adjustment for credit and debit risks represents 1.38% of their fair value.

301Statutory information
The movements in the balances of the financial assets and financial liabilities recognised at fair value and classified as Level 3 that are disclosed in the accompanying consolidated balance sheets are as follows: Thousand euro
AAssets LLiabilities BBalance as at 31 December 2016 2250,807 --
Valuation adjustments recognised in profit and loss (*) (45,857) - Valuation adjustments not recognised in profit and loss 716 - Purchases, sales and write-offs (37,536) - Net additions/removals in Level 3 8,193 - Exchange differences and other (41) -
BBalance as at 31 December 22017 1176,282 --
Valuation adjustments recognised in profit and loss (*) (17,810) - Valuation adjustments not recognised in profit and loss (129,245) - Purchases, sales and write-offs (8,601) - Net additions/removals in Level 3 109,090 - Exchange differences and other 22 -
BBalance as at 31 December 2018 1129,738 -- (*) Relates to securities retained on the balance sheet.
Net level 3 inflows primarily correspond to debt instruments which, as at the date of the first application of IFRS 9, are no longer recorded in the amortised cost portfolio, and are now recorded in portfolios of instruments measured at fair value. In 2018 no transfers have materialised between different valuation levels. Details of financial instruments that were transferred between valuation levels in 2017 are as follows: Thousand euro
22017 FFrom
: LLevel 1 LLevel 2 LLevel 3
TTo: LLevel 2 LLevel 3 LLevel 1 LLevel 3 LLevel 1 LLevel 2 AAssets: Financial assets held for trading - - - - - - Non-trading financial assets mandatorily at fair value through profit or loss
- - - - - -
Financial assets designated at fair value through profit or loss
- - - - - -
Financial assets at fair value through other comprehensive income
- - 353,314 8,193 - -
Derivatives - - - - - - LLiabilities: Financial liabilities held for trading - - - - - - Financial liabilities designated at fair value through profit or loss
- - - - - -
Derivatives – Hedge accounting - - - - - - TTotal -- -- 3353,314 88,193 -- -- As at 31 December 2018, the effect of replacing the main assumptions used in the valuation of Level 3 financial instruments with other reasonably possible assumptions, taking the highest value (most favourable assumption) or lowest value (least favourable assumption) of the range that is considered likely, is not significant. The instruments considered as Level 3 mainly correspond to the interest that the institution holds in the Spanish company for the management of assets arising from the restructuring of the banking system (Sociedad de Gestión de Activos procedentes de la Reestructuración Bancaria, SAREB), and which, given the unique nature of this investment, is measured at fair value calculated based on the business plan and financial projections of that entity. At the end of both years there were no derivatives using equity instruments as underlying assets or material interests in discretionary gains in any companies.

302 Banco Sabadell Annual report 2018
LLoans and financial liabilities at fair value through profit or loss As at 31 December 2018 and 2017, there were no loans or financial liabilities recognised at fair value through profit or loss. Financial instruments at cost As at the end of 2018 and 2017, there were also no equity instruments valued at their cost of acquisition that could be considered significant. Non-financial assets Real estate assets As at 31 December 2018 and 2017, net carrying values of real estate assets do not differ significantly from the fair values of these assets (see Notes 13, 15 and 17). The selection criteria for valuation suppliers and the update of appraisals are defined in the section on “Guarantees”, in Note 1.3.4. to these consolidated annual financial statements. Valuation techniques are generally used by all appraisal companies based on the type of each real estate asset. As per regulatory requirements, in the valuation techniques used, the valuation companies maximise the use of observable market data and other factors which would be taken into account by market operators when setting prices, endeavouring to keep the use of subjective considerations and unobservable or non-verifiable data to a minimum. The main valuation methods used fall into the following measurement levels: Level 2 Comparison method: applicable to all kinds of properties provided that there is a representative market of
comparable properties and that sufficient data is available relating to transactions that reflect the current market situation. Rental update method: applicable when the valued property generates or may generate income and there is a
representative market of comparable data. Statistical model: this model adjusts the value of the assets based on the date of acquisition and their location,
updating the value in accordance with price trends in the area concerned as from the date of purchase. To this end, it includes statistical information on price trends in all provinces, as provided by external valuation firms, as well as demographic data from the Spanish Office for National Statistics (INE) to calculate sensitivity at a municipality level. At the same time, the value obtained is adjusted based on the construction progress (finished product, development in progress, plots or land under management) and use (residential, industrial, etc.) of the asset. Level 3 Cost method: applicable to determine the value of buildings being planned, under construction or undergoing
renovations. Residual method: in the present macroeconomic climate, the dynamic calculation procedure is being used
preferentially in new land valuations to the detriment of the statistical procedure, which is reserved for specific cases in which the envisaged time frames for project completion are in line with the relevant regulations. Depending on the type of asset, the methods used in the valuation of the Group’s portfolio are the following: - Completed works: valued in comparable terms, based on updates to income or the statistical model (Level 2). - Works in progress: valued using the cost method as a sum of the land value and the value of the work carried out
(Level 3). - Land: valued using the residual method (Level 3).

303Statutory information
DDetermination of the fair value of real estate assets The following tables show the main real estate assets broken down using the valuation method used in their fair value estimate as at 31 December 2018 and 2017: Thousand euro
2018 Level 1 Level 2 Level 3 Total Housing - 3,298,398 - 3,298,398 Offices, retail establishments and other real estate - 1,928,348 - 1,928,348 Land and building plots - - 999,575 999,575 Work in progress - - 312,457 312,457
Total assets - 5,226,746 1,312,032 6,538,778
Thousand euro
2017 Level 1 Level 2 Level 3 Total Housing - 3,086,525 - 3,086,525 Offices, retail establishments and other real estate - 2,342,601 - 2,342,601 Land and building plots - - 1,481,920 1,481,920 Work in progress - - 383,916 383,916
Total assets - 5,429,126 1,865,836 7,294,962
Significant unobservable variables used in valuations classed as Level 3 have not been developed by the Group but by the independent third party valuation companies that performed the appraisals. Given the widespread use of the appraisals, the valuation techniques of which are clearly set out in the regulation governing the valuation of properties, the unobservable variables used reflect the assumptions frequently used by all valuation firms. In terms of proportional weight, unobservable variables represent almost all of the value of these appraisals. The main unobservable variables used in the valuation of assets in accordance with the dynamic residual method are the future sale price, the estimated construction costs, the costs of development, the time required for land planning and development and the upgrade fee. The main unobservable variables used in accordance with the static residual method are construction costs, the costs of development and the profit for the developer.
The number of plots in the Group’s possession is very fragmented, and they are very varied, both in terms of location and in terms of the stage of development of the urban infrastructure and the possibility of future development. For this reason, no quantitative information can be provided regarding the unobservable variables affecting the fair value of these types of assets. Movements in the balances of real estate assets classified as Level 3 in 2018 and 2017 are shown below: Thousand euro
For house purchase Offices, retail
establishments and other real estate
Land, building plots and work in progress
Balance as at 31 December 2016 - - 2,429,521 Purchases - - 268,515 Sales - - (276,344) Impairments recognised on income statement (*) - - (429,529) Net additions/removals in Level 3 - - (126,327)
Balance as at 31 December 2017 - - 1,865,836
Purchases - - 93,658 Sales - - (174,596) Impairments recognised on income statement (*) - - (473,444) Net additions/removals in Level 3 - - 578
Balance as at 31 DDecember 2018 - - 1,312,032 (*) Relates to assets kept on the balance sheet as at 31 December 2018 and 2017 (see Note 35).
During 2018, certain real estate assets have been transferred between the different valuation levels, due to the transformation of assets that were in the process of construction into finished products.

304 Banco Sabadell Annual report 2018
The following table shows a comparison between the value at which the Group’s real estate assets were recognised under the headings “Non-current assets and disposal groups classified as held for sale”, “Investment properties ”and “Inventories ”and their appraisal value, as at the end of 2018 and 2017:
Thousand euro
22018 22017
GGross ccarrying aamount
IImpairment CCarrying aamount
VValuation aamount GGross ccarrying
aamount IImpairment CCarrying aamount
VValuation aamount
Investment properties 772,959 (72,894) 700,065 811,492 2,481,601 (517,845) 1,963,756 2,296,475
Inventories 1,859,878 (925,018) 934,860 1,204,111 4,631,749 (2,555,455) 2,076,294 3,212,610 Non-current assets held for sale 6,908,521 (2,805,971) 4,102,550 6,994,966 3,420,414 (1,040,081) 2,380,333 4,150,396
TTotal 99,541,358 ((3,803,883) 55,737,475 99,010,569 110,533,764 ((4,113,381) 66,420,383 99,659,481
The fair values of real estate assets valued by appraisal companies and included in the headings “Non-current assets and disposal groups classified as held for sale”, “Investment properties ”and “Inventories ”in 2018 are as follows: Thousand euro
VValuation firm NNon--ccurrent assets held ffor sale
IInvestment properties IInventories
Afes técnicas de tasación, S.A. 23,853 3,195 - Alia tasaciones, S.A. 461,866 25,092 121,866 Aplicaciones Estadisticas y Consultoría, S.L. 499 - - Arco valoraciones, S.A. 5,458 - - Assets-Valoració d'actius S.A. 113 - - Col.lectiu d'arquitectes taxadors 3,028 - - Compañía hispania de tasaciones y valoraciones, S.A. 175 - - Cushman & Wakefield - 16,393 - Egara Optiminn, S.L. 447 - - Eurovaloraciones, S.A. 318,332 30,298 148,544 Eurovasan, S.L. 209 - - Gestión de valoraciones y tasaciones, S.A. 382,218 193,616 145,070 Grupo Tasvalor, S.A. 219 - - Ibérica de tasaciones, S.A. 15,157 - - Ibertasa, S.A. 255,064 18,947 28,390 Innotasa, S.A. 471 - - Instituto de valoraciones, S.A. 158,500 3,325 47,415 Krata, S.A. 202,438 2,202 51 Peritand 9,139 11,387 - Savills Consultores Inmobiliarios, S.A. 1,033 - - Servatas, S.A. - - 429 Sociedad de tasación, S.A. 1,245,692 280,082 45,573 Tabimed gestión de proyectos, S.L. 4,726 - - Tasaciones de bienes Mediterráneo, S.A. 4,470 - - Tasaciones hipotecarias 139,931 - 128 Tasaciones inmobiliarias, S.A. 152,152 9,929 128,953 Tasalia Sociedad de Tasación 127 - 300 Tasasur sociedad de tasaciones, S.A. 1,231 - - Tasiberica, S.A. 3,766 1,127 - Tecglen tasaciones, S.A. 654 - - Tecnitasa técnicos en tasación, S.A 216,065 15,290 5,657 Thirsa 69,415 43 1,226 Tinsa Tasaciones Inmobiliarias, S.A. 7,194 1,987 - Valoraciones Mediterráneo, S.A. 282,312 14,085 28,523 Valtécnic, S.A. 88,729 12,302 43,676 Rest 47,867 60,765 189,059
TTotal 44,102,550 7700,065 9934,860 The fair value of property, plant and equipment for own use does not differ significantly from its net carrying amount.

305Statutory information
NNote 7 – Cash, cash balances at central banks and other demand deposits The composition of this heading on the asset side of the consolidated balance sheets as at 31 December 2018 and 2017 is as follows: Thousand euro
2018 2017
By nature: Cash 814,761 733,923 Cash balances at central banks 22,065,440 25,097,038 Other demand deposits 614,278 531,846
Total 23,494,479 26,362,807
By currency: In euro 14,726,126 17,238,582 In foreign currency 8,768,353 9,124,225
Total 23,494,479 26,362,807
Cash balances at central banks include balances held to comply with the central bank’s minimum reserve requirement. Throughout 2018 Banco Sabadell has complied with minimum requirements set out in applicable regulations regarding this ratio. Note 8 – Debt securities Debt securities reported in the consolidated balance sheets as at 31 December 2018 and 2017 are analysed below: Thousand euro
2018 2017
By heading: Financial assets held for trading 317,437 124,329 Non-trading financial assets mandatorily at fair value through profit or loss 141,314 - Financial assets designated at fair value through profit or loss - - Financial assets at fair value through other comprehensive income 12,976,719 12,767,418 Financial assets at amortised cost 13,131,824 11,746,645
Total 26,567,294 24,638,392
By nature: Central banks - - General governments 23,732,596 21,979,861 Credit institutions 987,601 856,208 Other sectors 1,575,346 1,435,635 Stage 3 assets 357 13,124 Impairment allowances (236) (8,467) Other valuation adjustments (interest, fees and commissions, other) 271,630 362,031
Total 26,567,294 24,638,392
By currency: In euro 21,968,957 20,559,445 In foreign currency 4,598,337 4,078,947
Total 26,567,294 24,638,392

306 Banco Sabadell Annual report 2018
In 2018 the Group has sold debt instruments issued by Italy with a book value of 1,549 and 2,832 million euros and which were classified under the heading “Financial assets at amortised cost ”and “Financial assets at fair value through other comprehensive income ”of the consolidated balance sheet, respectively. These sales have been carried out for the purpose of managing the increase in credit risk of debt instruments issued by Italy, as a result of changes in the political and economic situation in this country. Therefore, in the case of debt instruments recognised at amortised cost, the Group has considered that these sales are consistent with the business model under which these assets were managed (retained with the objective of receiving cash flows). The results obtained from these disposals have been recorded under the headings “Gains or (-) losses on derecognition of financial assets and liabilities not at fair value through profit or loss, net – Financial assets at amortised cost ” and “Gains or losses (-) on derecognition of financial assets and liabilities not at fair value through profit or loss, net – Other financial assets and liabilities ” of the consolidated income statement for 2018, respectively (see Note 30). The breakdown of the debt securities classified based on their credit risk and the movement of impairment allowances associated with these instruments are included, together with those of other financial assets, in Note 11. Details of debt instruments included under the “Financial assets at fair value through other comprehensive income ”heading are as follows: Thousand euro
22018 22017 Amortised cost (*) 13,020,937 12,499,359 Fair value 12,976,719 12,767,418 Accumulated losses recognised in equity (138,296) (134,950) Accumulated capital gains recognised in equity 99,906 406,403 Value adjustments made for credit risk (5,828) (3,394)
(*) Includes net gains/(-) losses due to impairment in the consolidated income statement for 2018 and 2017 of (2,472) and (6,277) thousand euros, of which those due to provisions during the year amount to (7,685) and (9,323) thousand euros, and those due to reversal of impairment amount to 5,213 and 3,046 thousand in 2018 and 2017 (see Note 34).
The breakdown of public debt securities classified as “Financial assets at fair value through other comprehensive income ”is as follows: Thousand euro
22018 22017 Amortised cost 10,979,744 10,934,636 Fair value 10,939,940 11,177,627 Accumulated losses recognised in equity (120,525) (115,704) Accumulated capital gains recognised in equity 81,236 358,913 Value adjustments made for credit risk (515) (218)
The portfolio of “Financial assets at amortised cost ”breaks down as follows: Thousand euro
22018 22017 Central banks - - General governments 12,606,171 11,079,997 Credit institutions 81,007 93,221 Other sectors 444,900 574,171 Impairment allowances (254) (744)
TTotal 113,131,824 111,746,645
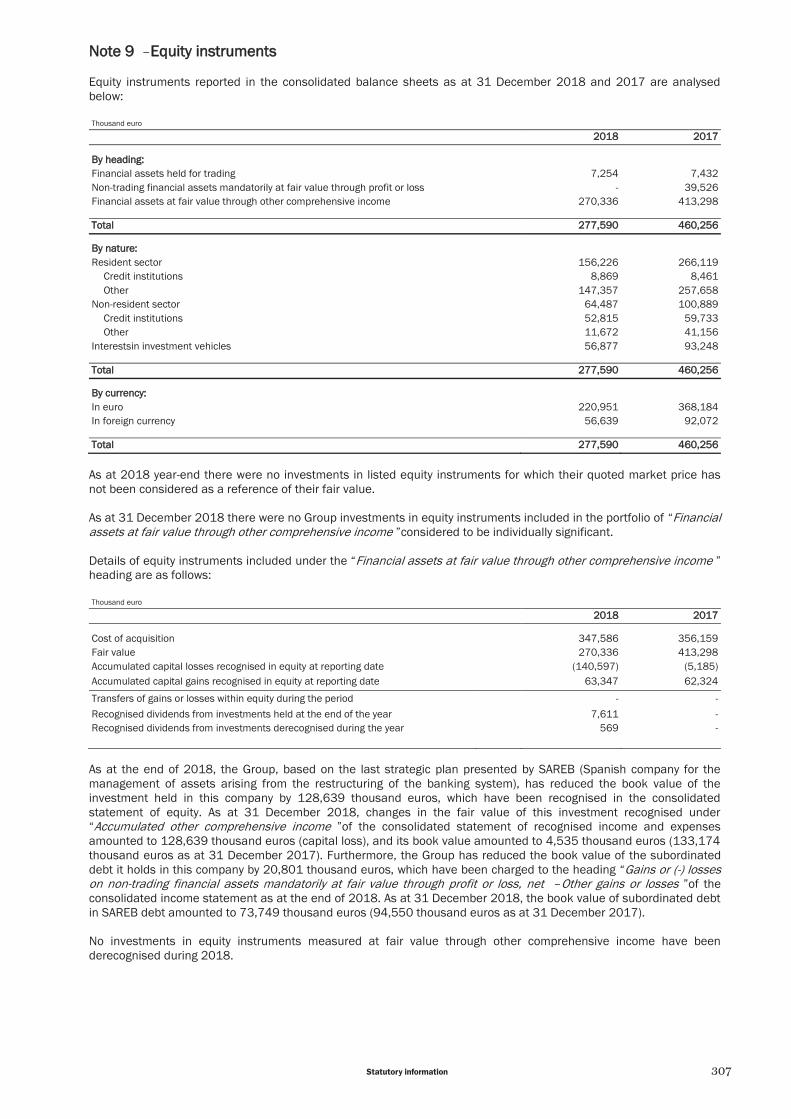
307Statutory information
NNote 9 – Equity instruments Equity instruments reported in the consolidated balance sheets as at 31 December 2018 and 2017 are analysed below: Thousand euro
2018 2017
By heading: Financial assets held for trading 7,254 7,432 Non-trading financial assets mandatorily at fair value through profit or loss - 39,526 Financial assets at fair value through other comprehensive income 270,336 413,298
Total 277,590 460,256
By nature: Resident sector 156,226 266,119
Credit institutions 8,869 8,461 Other 147,357 257,658
Non-resident sector 64,487 100,889 Credit institutions 52,815 59,733 Other 11,672 41,156
Interestsin investment vehicles 56,877 93,248 Total 277,590 460,256
By currency: In euro 220,951 368,184 In foreign currency 56,639 92,072
Total 277,590 460,256
As at 2018 year-end there were no investments in listed equity instruments for which their quoted market price has not been considered as a reference of their fair value. As at 31 December 2018 there were no Group investments in equity instruments included in the portfolio of “Financial assets at fair value through other comprehensive income ”considered to be individually significant. Details of equity instruments included under the “Financial assets at fair value through other comprehensive income ”heading are as follows: Thousand euro
2018 2017 Cost of acquisition 347,586 356,159 Fair value 270,336 413,298 Accumulated capital losses recognised in equity at reporting date (140,597) (5,185) Accumulated capital gains recognised in equity at reporting date 63,347 62,324
Transfers of gains or losses within equity during the period - - Recognised dividends from investments held at the end of the year 7,611 - Recognised dividends from investments derecognised during the year 569 -
As at the end of 2018, the Group, based on the last strategic plan presented by SAREB (Spanish company for the management of assets arising from the restructuring of the banking system), has reduced the book value of the investment held in this company by 128,639 thousand euros, which have been recognised in the consolidated statement of equity. As at 31 December 2018, changes in the fair value of this investment recognised under “Accumulated other comprehensive income ”of the consolidated statement of recognised income and expenses amounted to 128,639 thousand euros (capital loss), and its book value amounted to 4,535 thousand euros (133,174 thousand euros as at 31 December 2017). Furthermore, the Group has reduced the book value of the subordinated debt it holds in this company by 20,801 thousand euros, which have been charged to the heading “Gains or (-) losses on non-trading financial assets mandatorily at fair value through profit or loss, net – Other gains or losses ” of the consolidated income statement as at the end of 2018. As at 31 December 2018, the book value of subordinated debt in SAREB debt amounted to 73,749 thousand euros (94,550 thousand euros as at 31 December 2017). No investments in equity instruments measured at fair value through other comprehensive income have been derecognised during 2018.

308 Banco Sabadell Annual report 2018
NNote 10 – Asset and liability derivatives held for trading The breakdown by type of risk of this heading on the asset and liability sides of the consolidated balance sheets as at 31 December 2018 and 2017 is as follows: Thousand euro
2018 2017 Assets Liabilities Assets Liabilities Securities risk 162,458 165,141 111,239 111,701 Interest rate risk 1,073,148 1,057,141 891,179 847,753 Currency risk 473,271 456,015 426,520 389,299 Other types of risk 11,397 11,936 11,805 12,608
Total 1,720,274 1,690,233 1,440,743 1,361,361
By currency: In euro 1,545,066 1,519,317 1,271,688 1,263,837 In foreign currency 175,208 170,916 169,055 97,524
Total 1,720,274 1,690,233 1,440,743 1,361,361 The fair values of derivatives held for trading, broken down by type of derivative instrument as at 31 December 2018 and 2017, are shown below: Thousand euro
2018 2017
Assets
Swaps, CCIRS, Call Money Swap 1,050,903 858,154 Currency options 95,011 99,858 Interest rate options 33,717 40,527 Index and securities options 162,383 114,393 Currency forwards 378,260 326,661 Fixed income forwards - 1,150
Total dderivatives on asset side held for trading 1,720,274 1,440,743
Liabilities
Swaps, CCIRS, Call Money Swap 1,030,712 807,412 Currency options 95,289 101,028 Interest rate options 29,857 39,241 Index and securities options 173,649 124,309 Currency forwards 360,726 288,271 Fixed income forwards - 1,100
Total derivatives on liability side held for trading 1,690,233 1,361,361

309Statutory information
NNote 11 – Loans and advances Central banks and Credit institutions The breakdown of the headings “Loans and advances – Central banks ”and “Loans and advances – Credit institutions ”in the consolidated balance sheets as at 31 December 2018 and 2017 is as follows: Thousand euro
2018 2017
By heading: Financial assets held for trading - - Non-trading financial assets mandatorily at fair value through profit or loss - - Financial assets designated at fair value through profit or loss - - Financial assets at fair value through other comprehensive income - - Financial assets at amortised cost 8,296,917 5,379,156
Total 8,296,917 5,379,156
By nature: Deposits with agreed maturity 2,414,351 1,769,568 Assets acquired under repurchase agreements 5,367,349 2,965,960 Hybrid financial assets - 106 Other 512,058 644,885 Stage 3 assets 299 364 Impairment allowances (1,861) (5,306) Other valuation adjustments (interest, fees and commissions, other) 4,721 3,579
Total 8,296,917 5,379,156
By currency: In euro 6,549,965 4,335,627 In foreign currency 1,746,952 1,043,529
Total 8,296,917 5,379,156

310 Banco Sabadell Annual report 2018
Customers The breakdown of the heading “Loans and advances – Customers ”(General governments and Other sectors) of the consolidated balance sheets as at 31 December 2018 and 2017 is as follows: Thousand euro
22018 22017
BBy heading: Financial assets held for trading - - Non-trading financial assets mandatorily at fair value through profit or loss - - Financial assets designated at fair value through profit or loss - - Financial assets at fair value through other comprehensive income - - Financial assets at amortised cost 142,986,822 143,597,966
TTotal 1142,986,822 1143,597,966
BBy nature: On-demand loans and other 7,807,725 7,567,029 Trade credit 6,185,828 5,801,602 Finance leases 2,564,586 2,316,285 Secured loans 83,639,258 86,581,398 Assets acquired under repurchase agreements 595,917 2,001,437 Other term loans 39,168,359 35,255,351 Stage 3 assets 6,471,569 7,867,154 Impairment allowances (3,433,070) (3,726,682) Other valuation adjustments (interest, fees and commissions, other) (13,350) (65,608)
TTotal 1142,986,822 1143,597,966
BBy sector: General governments 10,875,811 9,802,679 Other sectors 129,085,862 129,720,423 Stage 3 assets 6,471,569 7,867,154 Impairment allowances (3,433,070) (3,726,682) Other valuation adjustments (interest, fees and commissions, other) (13,350) (65,608)
TTotal 1142,986,822 1143,597,966
BBy currency: In euro 98,595,913 99,505,324 In foreign currency 44,390,909 44,092,642
TTotal 1142,986,822 1143,597,966
BBy geography: Spain 96,209,799 98,843,426 Rest of European Union 40,527,715 40,702,868 Ibero-America 4,957,126 3,695,269 North America 2,658,009 2,280,429 Other OECD countries 291,301 206,892 Rest of the world 1,775,942 1,595,764 Impairment allowances (3,433,070) (3,726,682)
TTotal 1142,986,822 1143,597,966
The “Loans and advances ”heading on the consolidated balance sheets includes certain assets pledged in funding operations, i.e. they have been pledged as collateral or guarantees with respect to certain liabilities. For further information, see the “Credit risk ”section of Note 4.

311Statutory information
Finance leases Assets leased out under finance leases are recognised by the amortised cost of the instalments payable by the lessee plus the guaranteed and non-guaranteed residual value, excluding interest expenses and value added tax. Details of the foregoing are set out hereafter: Thousand euro
22018 22017
FFinance leases Total gross investment 2,490,608 2,271,417
of which: Contingent lease payments recognised in income 60,522 71,601 Unearned financial income 236,005 234,829 Unguaranteed residual value 163,411 146,854 Impairment allowances (52,888) (41,924)
The table below shows a breakdown by term of the current value of minimum future amounts receivable by the Group during the period of mandatory compliance (assuming that no extensions or existing purchase options will be exercised): Thousand euro
UUp to 1 year 11--55 years MMore than 5 years TTotal MMinimum finance lease payments receivable
Mandatory minimum lease payments receivable 686,285 1,362,771 570,919 2,619,975
Past-due financial assets The balance of “Loans and advances – Customers ”past-due and pending collection not classified as Stage 3 as at 31 December 2018 amounted to 130,322 thousand euros (188,311 thousand euros as at 31 December 2017). Of this total, over 52% of the balance as at 31 December 2018 (76% of the balance as at 31 December 2017) had become due in a period no longer than one month.

312 Banco Sabadell Annual report 2018
Financial assets classified on the basis of their credit risk The breakdown of the gross book values, excluding valuation adjustments, of financial assets classified on the basis of their credit risk as at 31 December 2018 and 1 January 2018 (date of first application of IFRS 9) is as follows: Thousand euro
SStage 11 331/12/2018 001/01/2018
Debt securities 26,279,110 24,272,982 Loans and advances 139,376,896 137,142,828
Customers 131,106,667 131,785,242 Central banks and Credit institutions 8,270,229 5,357,586
TTotal sstage 11 1165,656,006 1161,415,810
BBy sector:
General governments 34,573,924 31,776,082 Central banks and Credit institutions 9,244,381 6,213,794 Other private sectors 121,837,701 123,425,934
TTotal sstage 11 1165,656,006 1161,415,810
SStage 22
Debt securities (*) 16,435 - Loans and advances 8,878,533 7,505,184
Customers 8,855,004 7,482,251 Central banks and Credit institutions 23,529 22,933
TTotal sstage 22 88,894,968 77,505,184 (*) Of which, 8,972 thousand euros correspond to "Financial assets at amortised cost".
BBy sector:
General governments 34,482 6,458 Central banks and Credit institutions 36,978 22,933 Other private sectors 8,823,508 7,475,793
TTotal sstage 22 88,894,968 77,505,184
SStage 33
Debt securities 357 11,846 Loans and advances 6,471,868 8,123,127
Customers 6,471,569 8,122,763 Central banks and Credit institutions 299 364
TTotal sstage 33 66,472,225 88,134,973
BBy sector:
General governments 20,434 12,432 Central banks and Credit institutions 299 364 Other private sectors 6,451,492 8,122,177
TTotal sstage 33 66,472,225 88,134,973
TTotal sstages 1181,023,199 1177,055,967

313Statutory information
Movements of gross values, excluding valuation adjustments, of assets subject to impairment by the Group during the year ended 31 December 2018 were as follows: Thousand euro
SStage 1 SStage 2 SStage 3 OOf which: purchased ccredit--iimpaired TTotal
BBalance as at 1 January 2018 1161,415,810 77,505,184 88,134,973 4480,525 1177,055,967
Transfers between impairment stages (3,364,981) 2,194,203 1,170,778 - - Stage 1 1,713,189 (1,698,333) (14,856) - - Stage 2 (4,157,125) 4,512,248 (355,123) - - Stage 3 (921,045) (619,712) 1,540,757 - -
Increases 35,525,449 867,622 279,017 17,774 36,672,088 Decreases (28,097,540) (1,634,236) (2,250,806) (78,137) (31,982,582) Transfers to write-offs (2,680) (346) (857,144) - (860,170) Adjustments for exchange differences (136,028) (37,452) (4,592) - (178,072) Other movements 315,976 (7) (1) - 315,968
BBalance as at 31 December 2018 1165,656,006 88,894,968 66,472,225 4420,162 1181,023,199
The breakdown of assets classified as Stage 3 by type of guarantee as at 31 December 2018 and 1 January 2018 (date of first application of IFRS 9) is as follows: Thousand euro
331/12/2018 001/01/2018
Secured with a mortgage 3,480,089 4,258,939 Of which: Stage 3 financial assets with guarantees covering all of the risk 2,167,560 2,974,180
Other collateral (*) 343,581 482,687 Of which: Stage 3 financial assets with guarantees covering all of the risk 192,788 230,976
Rest 2,648,555 3,393,347 TTotal 66,472,225 88,134,973 (*) Includes the rest of assets secured with collateral.
The breakdown by geography of assets classified as Stage 3 as at 31 December 2018 and 1 January 2018 (date of first application of IFRS 9) is as follows: Thousand euro
331/12/2018 001/01/2018
Spain 5,785,832 7,472,062 Rest of European Union 564,060 539,329 Ibero-America 72,694 29,965 North America 3,974 2,425 Other OECD countries 2,691 3,525 Rest of the world 42,974 87,667
TTotal 66,472,225 88,134,973
Accumulated financial income on impaired financial assets incurred but not recorded in the consolidated income statement amounted to 402,022 thousand euros as at 31 December 2018 and to 551,729 thousand euros as at 31 December 2017.

314 Banco Sabadell Annual report 2018
The movements in impaired financial assets derecognised from the asset side because the likelihood of their recovery is deemed remote are as follows: Thousand euro
BBalance as at 31 December 2016 55,249,683 AAdditions 5583,192 Use of accumulated impairment balance 404,726 Directly recognised on income statement 135,416 Contractually payable interests 24,193 Other items 18,857
DDisposals ((997,940) Collections of principal in cash from counterparties (153,782) Collections of interest in cash from counterparties (9,568) Debt forgiveness (16,466) Referrals (447,629) Forbearance (541) Sales (369,954)
EExchange differences ((8,037)
BBalance as at 31 December 2017 44,826,898
AAdditions 9940,386 Use of accumulated impairment balance 850,289 Directly recognised on income statement 5,718 Contractually payable interests 59,911 Other items 24,468
DDisposals ((335,096) Collections of principal in cash from counterparties (72,305) Collections of interest in cash from counterparties (4,151) Debt forgiveness (44,311) Referrals - Forbearance (21) Sales (214,146) Other items (162)
EExchange differences 6648
BBalance as at 31 December 2018 55,432,836
Allowances The values of financial asset impairment allowances under the different headings on the asset side of the consolidated balance sheets as at 31 December 2018 and 2017 are as follows: Thousand euro
22018 22017
Debt securities 236 8,467 Loans and advances
Central banks and Credit institutions 1,861 5,306 Customers 3,433,070 3,726,682
TTotal 33,435,167 33,740,455

315Statutory information
Movements in impairment allowances allocated by the Group to cover credit risk during 2018 are as follows: Thousand euro
IIndividually measured CCollectively measured TTotal SStage 2 SStage 3 SStage 1 SStage 2 SStage 3 BBalance as at 1 January 2018 (*) 339,594 8857,590 6638,877 3360,671 22,836,309 44,733,041
MMovements reflected in impairment ggains/(losses) (**)
115,116 772,482 ((75,831) 779,771 4427,520 5519,058
Increases due to origination - - 174,318 - - 174,318
Changes due to credit risk variance 13,404 100,904 (154,297) 114,568 466,534 541,113
Changes in calculation approach - - - - - - Other movements 1,712 (28,422) (95,852) (34,797) (39,014) (196,373)
MMovements not reflected in impairment ggains/(losses)
((27,807) ((192,959) ((188,411) ((142,543) ((1,262,468) ((1,814,188)
Transfers between impairment stages (27,807) 91,167 18,401 (99,172) 17,411 - Stage 1 (1,532) (20,746) 135,809 (67,168) (46,363) - Stage 2 2,994 (496) (78,873) 158,017 (81,642) - Stage 3 (29,269) 112,409 (38,535) (190,021) 145,416 -
Utilisation of allocated provisions - (277,292) (6,192) (42,938) (1,124,688) (1,451,110) Other movements (***) - (6,834) (200,620) (433) (155,191) (363,078)
AAdjustments for exchange differences ((19) ((1,077) ((1,544) ((38) ((66) ((2,744)
BBalance as at 31 December 2018 226,884 7736,036 3373,091 2297,861 22,001,295 33,435,167
(*) Includes the impact of the first application of IFRS 9 which has entailed an increase in impairment allowances for the amount of 992,586 thousand euros (see section ''Implementation of IFRS 9 Financial Instruments'' in Note 1). (**) This figure, corresponding to the amortisation charged to results on impaired financial assets derecognised from the asset side of the balance sheet and the recovery of write-offs, has been recognised with a counterpart under the heading “Impairment or (-) reversal of impairment of financial assets not measured at fair value through profit or loss and net modification losses or (-) gains” (see Note 34). (***) Corresponds, mainly, to the transfer of 200,615 thousand euros in impairment allowances allocated to cover the occurrence of contingencies related to mortgage floor clauses (see Note 22) and to the transfer of 162,463 thousand euros to cover credit risk on non-current assets held for sale (see Note 13) and investment properties (see Note 15).
The breakdown by geography of the balance of impairment allowances as at 31 December 2018 and 2017 is as follows: Thousand euro
22018 22017
Spain 3,051,311 3,488,647 Rest of European Union 284,298 174,943 Ibero-America 52,936 35,264 North America 8,816 4,982 Other OECD countries 1,509 1,378 Rest of the world 36,297 35,241
TTotal 33,435,167 33,740,455

316 Banco Sabadell Annual report 2018
Sensitivity analysis of the key variables of macroeconomic scenarios In order to measure the potential impact of the economic scenario on cost of risk, an analysis is carried out to determine the sensitivity of cost of risk to any deviations, ceteris paribus, with respect to the baseline economic scenario, which is the most likely of the scenarios considered in the Group’s business plan. The results of this analysis are shown below: CChange in the variable IImpact on cost of risk
DDeviation in GDP growth -100pb +10pb +100pb -7pb
DDeviation in unemployment rate +350pb +13pb -350pb -10pb
CChanges in housing prices -300pb +12pb +300pb -10pb
NNote 12 – Derivatives - asset and liability hedge accounting Hedging management The main hedges arranged by the Group are described below: Interest rate risk hedge Banco Sabadell Group establishes strategies to hedge against the interest rate risk of positions not included in the trading book as a fundamental tool with which to manage this risk. To this end, derivative instruments are used, whether fair value instruments or cash flows, and a distinction is made between them depending on the items hedged: Macro-hedges: hedges intended to mitigate ALM risk. Micro-hedges: hedges intended to mitigate the risk of a particular asset or liability.
The Group operates with the following types of macro-hedges intended to mitigate structural interest rate risk: - Fair value hedges: hedges against the exposure to changes in the fair value of assets and liabilities recognised on
the balance sheet, or of the exposure of a specific selection of such assets and liabilities, to changes in their fair value that can be attributed to interest rate risk. These are used to keep a stable economic value of equity.
The following balance sheet items are hedged: o Fixed-rate loans included in the lending portfolio (macro-hedging of assets). o Debt securities included in the portfolio of “Financial assets at fair value through other comprehensive
income ”and the portfolio of “Financial assets at amortised cost ”(macro-hedging of assets). o Fixed-rate liabilities, including fixed-term deposits and the institution’s capital market funding transactions
(macro-hedging of liabilities).
317Statutory information
If the macro-hedge relates to assets, the Group enters into a fixed-for-floating swap, whereas if the macro-hedge relates to liabilities, it enters into a floating to fixed interest rate swap. These derivatives can be traded as cash or F&O. The hedged risk is the interest rate risk arising from a potential change in the risk-free interest rate that gives rise to changes in the value of the hedged balance sheet items. It therefore excludes the hedging of risks other than risk-free interest rate risk to which the balance sheet items are exposed. In order to assess the hedge effectiveness from the beginning, a backtesting exercise is carried out which compares the accumulated monthly variance in the fair value of the hedged item against the accumulated monthly variance in the fair value of the hedging derivative. Hedge effectiveness is also assessed on a forward-looking basis, verifying that future changes to the fair value of the hedged balance sheet items are offset by future changes in the fair value of the derivative.
- Cash flows: hedging against the exposure to changes in cash flows arising from a particular risk associated with a
previously recognised asset or liability, or a forecast transaction that is highly likely to materialise and which could affect the year’s profit and loss. They are used to reduce net interest income volatility. The following balance sheet items are hedged: o Floating rate mortgage loans indexed to the mortgage Euribor (macro-hedging of assets). o Floating rate liabilities indexed to the 3-month Euribor (macro-hedging of liabilities).
If the macro-hedge relates to assets, the Group enters into a floating to fixed interest rate swap, whereas if the macro-hedge relates to liabilities, it enters into a fixed-for-floating swap. These derivatives can be traded as cash or F&O. The hedged risk is the interest rate risk associated with the effect that a potential change in the benchmark interest rate could have on the future interest accrued on balance sheet items. The hedge expressly excludes the credit spread and risk premium which, together with the benchmark index, make up the contractual interest rate applicable to the hedged balance sheet items. In order to assess the hedge effectiveness from the beginning, a backtesting exercise is carried out which compares the accumulated variance in the fair value of the hedged item against the accumulated variance in the fair value of the hedging derivative. Hedge effectiveness is also assessed on a forward-looking basis, verifying that the expected cash flows on the hedged items are still highly likely to materialise.
When designing its hedges, the Group links the notional value of derivatives to the balance of the hedged balance sheet items. Possible causes of partial or total ineffectiveness include changes in the sufficiency of the portfolio of hedged balance sheet items or differences in their contractual characteristics in relation to hedging derivatives. Every month the Group calculates the interest rate risk metrics and establishes hedging strategies in accordance with the established risk appetite framework. Hedges are therefore managed, establishing hedges or discontinuing them, as required, on the basis of the evolution of the balance sheet items described previously within the management and control framework defined by the Group in its policies and procedures. HHedging of net investments in foreign operations The Group has investments in foreign subsidiaries that are consolidated in its financial statements. These positions implicitly entail exposure to exchange rate risk, which is managed by creating hedges through the use of forward contracts. The maturities of these instruments are periodically renewed on the basis of prudential and forward-looking criteria.

318 Banco Sabadell Annual report 2018
2018 hedging disclosures The nominal values and the fair values of the hedging instruments as at 31 December 2018 and 2017, broken down by risk category and type of hedge, are as follows: Thousand euro
22018 22017 NNominal AAssets LLiabilities NNominal AAssets LLiabilities MMicro--hhedges: Fair value hedges 113,000,928 447,422 882,045 88,078,666 777,576 334,317
Exchange rate risk 57,838 347 58 5,000 - 120 For funding operations (A) 5,000 - 58 5,000 - 120 Of permanent investments - - - - - - Of non-monetary items (B) 52,838 347 - - - -
Interest rate risk 10,983,284 47,041 55,117 5,459,440 77,575 14,378 For funding operations (A) 3,708,940 12,139 16,266 4,884,694 25,128 6,299 For lending operations (C) 7,274,344 34,902 38,851 574,746 52,447 8,079
Risk associated with shares 1,959,806 34 26,870 2,614,226 1 19,819 For funding operations (A) 1,959,806 34 26,870 2,614,226 1 19,819
- - - Cash flow hedges 66,443,227 1140,787 113,150 112,438,680 2227,305 1152,649
Exchange rate risk 554,999 72,952 - 691,467 74,877 36 Of non-monetary items (D) 554,999 72,952 - 691,467 74,877 36
Interest rate risk 3,636,428 77 9,123 10,907,129 152,412 137,350 Of future transactions (E) 786,546 - 7,254 7,546,378 41,039 23,538 For securitisation operations (F) 2,844,909 - 1,869 3,355,778 111,343 113,812 Rest 4,973 77 - 4,973 30 -
Risk associated with shares 800 1 3 4,084 16 47 For funding operations (G) 800 1 3 4,084 16 47
Other risks 2,251,000 67,757 4,024 836,000 - 15,216 For inflation-linked bonds (H) 2,251,000 67,757 4,024 836,000 - 15,216
Hedge of net investment in foreign operations 22,155,118 55,315 222,956 11,745,045 221,888 33,249
Exchange rate risk (I) 2,155,118 5,315 22,956 1,745,045 21,888 3,249
MMacro--hhedges: Fair value hedges 223,356,122 887,174 4493,492 225,077,994 447,252 7781,373
Interest rate risk 23,356,122 87,174 493,492 25,077,994 47,252 781,373 For funding operations (J) 10,571,060 60,863 20,778 4,441,520 3,268 45,098 For lending operations (K) 12,785,062 26,311 472,714 20,636,474 43,984 736,275
Cash flow hedges 22,050,000 221,277 221,996 8850,000 -- 332,266
Interest rate risk 2,050,000 21,277 21,996 850,000 - 32,266 For funding operations (L) 700,000 - 21,996 850,000 - 32,266 For lending operations (M) 1,350,000 21,277 - - - -
TTotal 447,005,395 3301,975 6633,639 448,190,385 3374,021 11,003,854
BBy currency: In euro 25,734,732 182,794 242,786 30,671,942 239,644 361,854 In foreign currency 21,270,663 119,181 390,853 17,518,443 134,377 642,000
TTotal 447,005,395 3301,975 6633,639 448,190,385 3374,021 11,003,854

319Statutory information
The types of hedges according to their composition that are identified in the table are as follows:
A. Micro-hedges of the institution’s funding transactions in capital markets, transactions involving term deposits and demand deposit accounts opened by customers and recognised under the heading “Financial liabilities at amortised cost”.
B. Micro-hedges against the exchange rate risk of equity transactions recognised under the heading “Financial assets at fair value through other comprehensive income”.
C. Micro-hedges of transactions involving customer loans, recognised under the heading “Financial assets at amortised cost ”and debt securities classified in the fair value through other comprehensive income portfolio.
D. Micro-hedges against exchange rate risk to reduce the volatility in the event of exchange rate fluctuations of securitisation bonds, recognised under the heading “Financial liabilities at amortised cost”, equity transactions recognised under the heading “Financial assets at fair value through other comprehensive income ”and transactions involving currency futures.
E. Micro-hedges of interest rates on future transactions, mainly fixed-income securities. The institution designates as a hedging item derivative contracts that will be settled at their gross value by transferring the underlying asset (according to the contracted price) which, in accordance with the implementation guidelines of IAS 39, can be considered as a cash flow hedge in respect of the consideration that will be settled in a future transaction arising from the settlement of the derivative itself in gross terms. If no derivative had been arranged, the Group would be exposed to changes in price.
F. Micro-hedging operations carried out by the Group’s securitisation funds. G. Micro-hedges for transactions involving term deposits arranged by customers and which are currently being sold. H. Micro-hedges of interest rates on inflation-linked bonds recognised under the headings “Financial assets at fair
value through other comprehensive income ”and “Financial assets at amortised cost”. The Group has arranged financial swaps to hedge future changes in cash flows that will be settled by ILBs.
I. Hedges against exchange rate risk on permanent shareholdings currently cover 1,368 million pounds sterling and 11,050 million Mexican pesos corresponding to shareholdings in Group entities, considered as fair value hedges, as well as 40 million US dollars corresponding to shareholdings in foreign branches, which are considered as hedges of net investments in foreign operations (see Note 4). All of these hedges are carried out through currency forwards.
J. Macro-hedges of the institution’s funding transactions in capital markets, transactions involving term deposits and demand deposit accounts opened by customers and recognised under the heading “Financial liabilities at amortised cost”.
K. Macro-hedges of debt securities classified in the portfolios of fair value through other comprehensive income and at amortised cost, and of fixed-rate mortgage loans granted to customers (recognised under the heading “Financial assets at amortised cost”).
L. Cash flow macro-hedges the purpose of which is to reduce the volatility of the buy-sell spread as a result of interest rate fluctuations, for a one-year time horizon. Thus, this macro-hedge covers future cash flows based on the net exposure of a portfolio consisting of floating rate liabilities recognised under the heading “Financial liabilities at amortised cost”. The average rate of interest rate swaps used for this hedge is -0.32%.
M. Macro-hedges for floating rate mortgage loans granted to customers recognised under the heading “Financial assets at amortised cost”. The average rate of interest rate swaps used for this hedge is -0.18%.
The maturity profiles of the hedging instruments used by the Group as at 31 December 2018 are shown below: Thousand euro
22018 NNominal
UUp to 1 month 11 to 3 months 33 to 12 mmonths 11 and 5 years MMore than 5
yyears TTotal
Exchange rate risk 827,595 1,561,679 23,675 355,006 - 22,767,955 Interest rate risk 6,954,835 733,234 3,122,764 16,008,965 13,206,036 440,025,834 Risk associated with shares 4,600 263,626 288,737 1,378,902 24,741 11,960,606 Other risks - - - 261,000 1,990,000 22,251,000
TTotal 77,787,030 22,558,539 33,435,176 118,003,873 115,220,777 447,005,395
In 2018 there have been no reclassifications from equity to the consolidated income statement due to cash flow hedges and hedges of net investments in foreign operations for transactions that have ultimately not been executed.

320 Banco Sabadell Annual report 2018
The following table shows the accounting information of items covered by the fair value micro-hedges contracted by the Group:
In terms of fair value macro-hedges, the book value of the hedged items recognised in assets and liabilities for 2018 amounts to 16,067,394 and 55,300,022 thousand euros, respectively (40,363,123 and 54,520,172 thousand euros in 2017, respectively). Similarly, fair value adjustments of the hedged items amount to 56,972 and 36,502 thousand euros as at 31 December 2018, respectively (48,289 and -4,593 thousand euros as at 31 December 2017). In relation to fair value hedges, the losses and gains recognised in 2018 and 2017 arising from both hedging instruments and hedged items are detailed hereafter: Thousand euro
22018 22017
HHedging iinstruments HHedged items HHedging
iinstruments HHedged items
MMicro--hhedges ((93,700) 889,053 ((56,163) 551,863 Fixed-rate assets (49,663) 45,989 (33,790) 30,969 Capital markets (15,011) 14,561 (10,731) 10,192 Fixed-rate liabilities (13,214) 12,594 (11,642) 10,702 Assets denominated in foreign currency (15,812) 15,909 - -
MMacro--hhedges ((11,728) 338,895 334,604 ((2,486) Capital markets and fixed-rate liabilities 80,892 (61,467) 8,696 19,822 Fixed-rate assets (92,620) 100,362 25,908 (22,308)
TTotal ((105,428) 1127,948 ((21,559) 449,377
In cash flow hedges, the amounts recognised in the statement of equity during the year and the amounts derecognised from equity and included in earnings during the year are indicated in the statement of total changes in equity of the bank. The hedge ineffectiveness in 2018 results related to cash flow hedges amounted to losses of 602 thousand euros.

321Statutory information
NNote 13 – Non-current assets and assets and liabilities included in disposal groups classified as held for sale The composition of these headings in the consolidated balance sheets as at 31 December 2018 and 2017 is as follows: Thousand euro
2018 2017
Assets 7,409,293 3,559,232
Cash, cash balances at central banks and other demand deposits - 4,169
Loans and advances 421,422 83,620 Credit institutions 14 1,346 Customers 421,408 82,274
Debt securities - - Equity instruments - - Real estate exposure 6,929,301 3,411,451
Tangible assets for own use 104,451 54,556 Investment properties 20,533 34,408 Foreclosed assets 6,795,709 3,319,131 Leased out under operating leases 8,608 3,355
Rest of other assets 58,570 59,992
Impairment allowances (2,822,370) (997,488)
Non--current assets and disposal groups classified as held for sale 4,586,923 2,561,744
Liabilities Financial liabilities at amortised cost - - Tax liabilities - - Liabilities under insurance or reinsurance contracts - - Rest 82,605 20,645
Liabilities included in disposal groups classified as held for sale 82,605 20,645
The increase in the balance of the real estate exposures shown in the table above mainly corresponds to the assets subject to the transfer agreement reached with Cerberus described in Note 2. The increase in the value of loans and advances recognised as non-current assets held for sale is mainly due to the transfer of the loan portfolio that was agreed on 24 July 2018 and to the loans and advances of Solvia Servicios Inmobiliarios, S.L.U., an institution for which an agreement was reached on 14 December 2018 to sell 80% of its share capital. Both transactions are described in Note 2. These loans and advances have been reclassified as “Non-current assets and disposal groups classified as held for sale ”by their net carrying value.

322 Banco Sabadell Annual report 2018
The breakdown of the gross value and impairment allowances of the loans included in this portfolio, pooled on the basis of their credit risk and intended purpose, is shown below: Thousand euro
GGross Value AAllowances NNet value PPortfolio of loans for which a sale agreement has been reached (*) 5525,895 2217,247 3308,648
LLoans and advances previously classified in Stage 3 5525,753 2217,222 3308,531
Real estate development and construction 324,063 143,241 180,821 Non-real estate construction 1,020 293 727 Corporates 1,066 359 707 SMEs and self-employed 74,526 28,217 46,309 Individuals 125,078 45,111 79,967
LLoans and advances previously classified in Stage 2 116 116 --
Individuals 16 16 -
LLoans and advances previously classified in Stage 1 1125 88 1117 Individuals 125 8 117
OOther loans and advances 1112,760 -- 1112,760
Of which, loans and advances of Solvia Servicios Inmobiliarios, S.L.U. (*) 111,887 - 111,887 TTotal 6638,655 2217,247 4421,408 (*) See Note 2.
As mentioned in Note 2, certain characteristics specific to the assets classified in this portfolio have been considered in order to achieve the most faithful and comparable presentation possible of the guarantees given under the APS protocol in the financial statements. In order to prevent gross lending from being overvalued or duplicated, provisions allocated for this 80% are presented net of gross lending classified as “Non-current assets and disposal groups classified as held for sale”. This exclusion of gross lending explains the difference of 867 million euros between the loans and advances for which a transfer deal has been reached, which are shown in Note 2, and those shown in the table above. Presenting the information in this way does not impact the net lending classified under this heading. With regard to customer lending classified as Stage 3, the Group considers as Stage 3 balances the portion corresponding to 20% of exposure that has been retained as the credit risk has not been transferred to the DGF. For as long as the credit or loan is included on the balance sheet, 80% of the risk is presented as a standard exposure as the credit risk has been transferred. In other words, for each asset protected by the APS, the Group considers the proportion of its flows that will be obtained from borrowers or third parties and the proportion that will be obtained from the DGF as a result of the guarantee given, taking into account the value of any mortgage guarantees securing the loan. The reconciliation between gross lending recognised as non-current assets held for sale both prior and subsequent to the transfer of credit risk to the DGF is shown below: Million euro
22018
PPost credit risk transfer CCredit risk transfer PPre credit risk transfer
GGross lending classified as instruments held for sale 5526 -- 5526
Of which Stage 3 assets 526 (867) 1,393 Of which other investments - 867 (867)
As the loans and advances that have been classified as non-current assets held for sale mainly correspond to the transfer agreement reached on 24 July 2018 described in Note 2, and given that these loans comprise mainly exposures classified as Stage 3, the NPL ratio of this portfolio is not shown. The coverage ratio before and after excluding the gross lending classified as non-current assets held for sale explained above stands at 77.85% and 41.31%, respectively. Tangible assets for own use relate mainly to commercial establishments. In respect of real estate assets originating in foreclosures, 89.09% of the balance corresponds to residential properties, 9.38% to industrial properties and 1.53% to agricultural properties.

323Statutory information
The average term during which assets remained within the category of “ Non-current assets and assets and liabilities included in disposal groups classified as held for sale – Foreclosed assets ”was 47.5 months in 2018 (refer to Note 4 for policies on selling or otherwise disposing of these assets). The percentage of foreclosed assets sold with financing granted to the buyer by the bank in 2018 was 20.74% (21.58% in 2017). Movements in “Non-current assets and disposal groups classified as held for sale ”during 2018 and 2017 were as follows: Thousand euro
NNote NNon--ccurrent assets held for ssale
CCost:
BBalances as at 31 December 2016 55,423,159
Reclassification Mediterráneo Vida 972,306 Additions (710,022) Disposals (2,438,065) Other transfers/reclassifications 476,439 Transfer of credit losses (*) (164,585)
BBalances as at 31 December 2017 33,559,232
Additions 1,011,285 Disposals (1,831,457) Other transfers/reclassifications 4,840,137 Transfer of credit losses (*) (169,904)
BBalances as at 31 December 2018 77,409,293
IImpairment allowances:
BBalances as at 31 December 2016 8844,464
Impairment through profit or loss 37 725,326 Reversal of impairment through profit or loss 37 (512,735) Utilisations (198,482) Other transfers/reclassifications 138,915
BBalances as at 31 December 2017 9997,488
Impairment through profit or loss 37 708,949 Reversal of impairment through profit or loss 37 (636,650) Utilisations (1,103,674) Other transfers/reclassifications 2,856,256
BBalances as at 31 DDecember 2018 22,822,370
NNet balances as at 31 December 2017 22,561,744
NNet balances as at 31 December 2018 44,586,923 (*) Allowance arising from provisions allocated to cover credit risk.

324 Banco Sabadell Annual report 2018
Details of the net carrying value of transfers shown in the table above are as follows: Thousand euro
NNote 22018 22017 Loans and advances 11 409,129 12,292 Tangible assets 15 865,165 297,243 Other assets 17 697,533 - Rest 2 12,054 27,989
TTotal 11,983,881 3337,524
NNote 14 – Investments in joint ventures and associates Movements in this heading of the consolidated balance sheets as at 31 December 2018 and 2017 are as follows: Thousand euro
Balance as at 31 December 2016 380,672
Scope additions / exclusions (1,173) Profit/(loss) for the year 308,686 Acquisition or capital increase (*) 52,930 Sale or dissolution (9,351) Dividends (177,985) Transfer 25,804 Impairment, allowances, translation differences and other (3,939)
Balance as at 31 December 22017 575,644
Scope additions / exclusions - Profit/(loss) for the year 56,554 Acquisition or capital increase (*) 46,178 Sale or dissolution (3,894) Dividends (83,772) Transfer (11,800) Impairment, allowances, translation differences and other (3,970)
Balance as at 31 December 2018 574,940 (*) See cash flow statement.
The section of the cash flow statement “Investment activities – Collections from investments in joint ventures and associates ”shows 93,240 thousand euros which correspond to the sum of 3,894 thousand euros on sales or settlements, 83,772 thousand euros on dividends charged and 5,574 thousand euros, which correspond to the derecognitions or settlements included in the breakdown shown in Schedule I. Furthermore, the section “Investment activities – Payments for investments in joint ventures and associates ”of this statement shows 46,178 thousand euros, which correspond to the acquisitions carried out during 2018.

325Statutory information
The main investee companies included for the first time in the balance sheet and those no longer in the balance sheet in 2018 and 2017 are indicated in Schedule I. On 24 June 2017, Bansabadell Vida, S.A. de Seguros y Reaseguros (Bansabadell Vida), a company in which Banco Sabadell and Zurich Vida, Compañía de Seguros y Reaseguros, S.A. (Zurich) each held a 50% interest, entered into a reinsurance contract with the Spanish branch of the reinsurance company Swiss Re Europe, S.A., in respect of its individual life insurance portfolio as at 30 June 2017. BanSabadell Vida received a reinsurance fee of 683.7 million euros, resulting in net income of approximately 253.5 million euros for Banco Sabadell Group, after deducting taxes and expenses relating to this transaction. This revenue was recognised under the heading “Share of profit or loss of entities accounted for using the equity method ”in the row of “Profit/(loss) for the year ”corresponding to 2017 in the table above. As at 31 December 2018 and 2017, there was no goodwill associated with investments in joint ventures and associates. As at 31 December 2018 and 2017, no support agreements or other type of significant contractual commitment had been provided by the bank or its subsidiaries to associates. The reconciliation between the Group’s investment in investees and the balance recorded under the heading “Investments in joint ventures and associates ”is as follows: Thousand euro
22018 22017
Group investment in investees (Schedule I) 291,056 243,632 Contributions due to retained earnings 262,859 294,684 Valuation adjustments 21,025 37,328
TTotal 5574,940 5575,644
The following table shows the key financial data relating to the investment considered to be individually significant, BanSabadell Vida, as at 31 December 2018 and 2017. This institution is an associate through which Banco Sabadell completes its product and service offering for customers by distributing this firm’s insurance products through the bank’s branch network:
Thousand euro
BBanSabadell Vida (*) 22018 22017 Total assets 10,072,813 9,485,336
Of which: financial investments 9,307,566 8,952,022 Total liabilities 9,408,757 8,748,778
Of which: technical provisions 9,043,282 8,367,112
Result of the technical account of insurer 73,361 777,165 Of which: premiums allocated to the year 2,404,090 2,594,082 Of which: claims ratio for the year (1,574,663) (2,555,765) Of which: technical financial yield 143,423 156,735
(*) Figures taken from BanSabadell Vida accounts without taking into consideration consolidation adjustments nor the Group's percentage holding.
As at 31 December 2018 and 2017, the book value of the investment in BanSabadell Vida, S.A. amounted to 312,803 and 350,511 thousand euros, respectively. As at 31 December 2018 and 2017, the aggregate book value of investments in associates considered as non-material on an individual basis was of 262,137 and 225,133 thousand euros, respectively.

326 Banco Sabadell Annual report 2018
NNote 15 – Tangible assets The composition of this heading in the consolidated balance sheets as at 31 December 2018 and 2017 is as follows: Thousand euro
2018 2017
Cost Depreciation Impairment Net value Cost Depreciation Impairment Net value Property, plant and equipment 3,273,845 (1,461,375) (15,788) 1,796,682 3,378,020 (1,490,374) (25,916) 1,861,730
For own use: 2,933,404 (1,396,127) (10,301) 1,526,976 3,078,409 (1,427,883) (25,494) 1,625,032
Computer equipment and related facilities 510,945 (378,773) - 132,172 534,237 (391,481) - 142,756
Furniture, vehicles and other facilities 1,276,404 (691,182) (4,078) 581,144 1,329,670 (724,675) (8,580) 596,415
Buildings 1,094,086 (309,497) (6,223) 778,366 1,178,037 (298,627) (16,914) 862,496 Work in progress 7,987 (1) - 7,986 1,844 (1) - 1,843 Other 43,982 (16,674) - 27,308 34,621 (13,099) - 21,522
Leased out under operating leases 340,441 (65,248) (5,487) 269,706 299,611 (62,491) (422) 236,698
Investment properties 821,885 (47,970) (72,894) 701,021 2,483,103 (122,586) (395,724) 1,964,793
Buildings 818,128 (47,444) (72,362) 698,322 2,427,264 (119,394) (377,275) 1,930,595 Rural property, plots and sites 3,757 (526) (532) 2,699 55,839 (3,192) (18,449) 34,198
Total 4,095,730 (1,509,345) (88,682) 2,497,703 5,861,123 (1,612,960) (421,640) 3,826,523

327Statutory information
Movements in the balance of the “Tangible assets ”heading during 2018 and 2017 were as follows: Thousand euro
OOwn use -- BBuildings, work in
pprogress and oother
OOwn use -- CComputer
eequipment, ffurniture and
rrelated facilities
IInvestment pproperties
AAssets leased out uunder operating
lleases TTotal
CCost: NNot
e
BBalances aas at 31 December 2016 11,551,599 11,786,751 22,966,638 2229,357 66,534,345
Scope additions / exclusions 2 (323,164) (7,630) (140,297) - (471,091) Additions 34,343 108,539 348,295 96,909 588,086 Disposals (26,101) (17,151) (276,799) (24,701) (344,752) Other transfers (13,471) (3,204) (393,433) (1,595) (411,703) Transfer of credit losses (*) - - (21,301) - (21,301) Exchange rate (8,704) (3,398) - (359) (12,461)
BBalances as at 31 December 2017 11,214,502 11,863,907 22,483,103 2299,611 55,861,123
Scope additions / exclusions - - - - - Additions 17,279 100,697 76,758 105,796 300,530 Disposals (24,052) (142,650) (513,080) (64,631) (744,413) Other transfers (59,512) (33,799) (1,218,629) (260) (1,312,200) Transfer of credit losses (*) - - (6,266) - (6,266) Exchange rate (2,162) (806) - (75) (3,044)
BBalances as at 31 December 2018 11,146,055 11,787,349 8821,885 3340,441 44,095,730
AAccumulated depreciation: BBalances as at 31 DDecember 2016 3351,634 11,057,816 1181,841 444,823 11,636,114
Scope additions / exclusions 2 (74,658) (29,836) (19,309) - (123,803) Additions 46,391 113,790 63,957 33,853 257,991 Disposals (6,271) (19,816) (19,836) (15,929) (61,852) Other transfers (1,739) (3,604) (84,067) (95) (89,505) Exchange rate (3,630) (2,194) - (161) (5,985)
BBalances as at 31 December 2017 3311,727 11,116,156 1122,586 662,491 11,612,960
Additions 34,064 109,658 38,084 39,253 221,060 Disposals (9,397) (138,093) (46,972) (31,917) (226,379) Other transfers (9,084) (17,230) (65,728) (4,534) (96,577) Exchange rate (1,138) (536) - (44) (1,718)
BBalances as at 31 December 2018 3326,172 11,069,955 447,970 665,248 11,509,345
IImpairment llosses: BBalances as at 31 December 2016 441,366 -- 3380,551 7714 4422,631
Scope additions / exclusions 2 (21,878) 3,923 (61,441) - (79,396) Impairment through profit or loss 35 10,643 4,657 507,510 - 522,810 Reversal of impairment through profit or loss 35 - - (291,468) - (291,468) Utilisations - - (14,830) (292) (15,122) Other transfers (13,217) - (124,598) - (137,815)
BBalances as at 31 December 2017 116,914 88,580 3395,724 4422 4421,640
Impairment through profit or loss 35 - - 211,212 - 211,212 Reversal of impairment through profit or loss 35 (907) - (149,877) - (150,784) Utilisations (78) (4,502) (38,105) (243) (42,927) Other transfers (9,706) - (346,060) 5,308 (350,458)
BBalances as at 31 DDecember 2018 66,223 44,078 772,894 55,487 888,682
NNet balances as at 31 December 2017 8885,861 7739,171 11,964,793 2236,698 33,826,523
NNet balances as at 31 December 2018 8813,660 7713,316 7701,021 2269,706 22,497,703 (*) Allowance arising from provisions allocated to cover credit risk.
Details of the net carrying value of transfers shown in the table above are as follows: Thousand euro
NNote 22018 22017 Non-current assets and disposal groups classified as held for sale 13 (865,165) (297,243) Credit losses 11 (6,266) (21,301) Other assets - 112,860
TTotal ((871,431) ((205,684)

328 Banco Sabadell Annual report 2018
Specific information relating to tangible assets as at 31 December 2018 and 2017 is shown hereafter: Thousand euro
22018 22017 Gross value of tangible assets for own use in use and fully amortised 459,417 510.673 Net carrying value of tangible assets of foreign operations 232,636 240,846
Minimum future payments over the period that cannot be cancelled for operating lease contracts in effect as at 31 December 2018 are indicated below: Thousand euro
22018 Operating lease expenses (*) 161,506 Current value of future payments up to 1 year 104,430 Current value of future payments between 1 and 5 years 271,873 Current value of future payments of more than 5 years 423,955
(*) Recognised in the "Administrative expenses" heading, in the item on "Of property, plant and equipment" (see note 33).
The Group has closed deals for the sale of properties and in the same operation entered into an operating lease contract with buyers (maintenance, insurance and taxes to be borne by the bank) for the same properties. The main characteristics of the most significant lease contracts in effect as at the end of 2018 are as follows:
22018
OOperating lease contracts NNº.. properties ssold
NNºº.. contracts with ppurchase option
NNºº.. contracts without ppurchase option MMandatory term
2009 68 28 40 10 to 20 years 2010 379 378 1 10 to 25 years 2011 (acquisition B.Guipuzcoano) 82 64 18 8 to 20 years 2012 (acquisition Banco CAM) 15 15 - 10 to 25 years 2012 4 4 - 15 years
Specific information in connection with this set of operating lease contracts is given below: Thousand euro
22018 Operating lease expenses 53,795 Current value of future payments up to 1 year 49,718 Current value of future payments between 1 and 5 years 175,090 Current value of future payments of more than 5 years 326,696
(*) Recognised in the "Administrative expenses" heading, in the item on "Of property, plant and equipment" (see note 33).
For the batch of 379 properties the sale of which was closed in April 2010 for which an operating lease was arranged at the same time, the income for the mandatory term of the lease, initially set at 37.5 thousand euros per month, is updated annually based on the Spanish CPI with a minimum increase of 2.75% per year until April 2018. For all other real estate, the income is updated annually with the Spanish CPI. With regard to the tangible assets leased out under operating leases, the bulk of the operating lease operations is carried out by BanSabadell Renting, S.A. and consists of vehicle leases. As regards the investment properties item, the rental income from these investment properties and the direct costs associated with the investment properties that produced rental income during 2018 amounted to 40,196 and 20,612 thousand euros, respectively. Direct expenses associated with investment properties that did not produce income were not significant in the context of the consolidated annual financial statements.

329Statutory information
NNote 16 – Intangible assets The composition of this item as at 31 December 2018 and 2017 was as follows: Thousand euro
2018 2017
Goodwill: 1,032,618 1,019,440 Banco Urquijo 473,837 473,837 Grupo Banco Guipuzcoano 285,345 285,345 From acquisition of Banco BMN Penedés assets 245,364 245,364 Rest 28,072 14,894
Other intangible assets: 1,428,524 1,226,418 With a finite useful life: 1,428,524 1,226,418
Contractual relations with customers and brand (Banco Urquijo) - 2,115 Contractual relations with customers (Banco Guipuzcoano) 10,495 15,983 Private Banking Business, Miami 19,730 22,457 Contractual relations with TSB customers and brand 199,497 241,481 Computer applications 1,197,357 942,766 Other 1,445 1,616
Total 2,461,142 2,245,858
Goodwill As set forth in the regulatory framework of reference, Banco Sabadell has carried out an analysis to evaluate the existence of any potential impairment to its goodwill. The valuation method used in this analysis was that of discounting future net distributable profit associated with the activity carried out by the bank over a 5-year projection period (to 2023). It is considered that by 2023, the bank will have generated recurring revenue, therefore the terminal value is calculated using that year as a reference and applying a perpetuity growth rate of 1.85%. An interest rate of 10.2% was used, a figure reached through the CAPM (Capital Asset Pricing Model) approach. The key variables on which the financial projections are based are: growth in the buy-sell spread (determined by expected trading volumes and interest rates) and changes of other items on the income statement and solvency levels. Recoverable values, both at Group-wide level and at the level of the UGEs (Commercial Banking, Corporate Banking, Private Banking, TSB and Rest), are higher than their respective book values and therefore no impairment has been recognised. Furthermore, a number of sensitivity analyses have been carried out in an extremely adverse scenario, in which key variables are individually subjected to stress, and the results do not show any sign of impairment. Variables for which the various sensitivity analyses have been carried out were as follows:
A 15% haircut on recurring fees and commissions for 2023.
A 50% increase in recurring cost of risk for 2023.
An increase in expenses for 2023, calculated by applying a multiplier of 5x the expected inflation to the expenses for 2023.
A further 1% increase in the premium to calculate the interest rate.
An increase of +0.5% of the minimum capital requirement for each year.
No growth rate is applied.
Aggregated assumption that jointly considers changes in all key variables: a 5% haircut in recurring fees and commissions in 2023, a 5% increase in the recurrent cost of risk for 2023, an increase in expenses as a result of applying a multiplier of twice the expected inflation to 2023 expenses, and an additional 0.5% increase in the premium to calculate the interest rate.

330 Banco Sabadell Annual report 2018
The impairment of goodwill is calculated taking into account the central macroeconomic scenario described in Note 1.3.4. Evaluation of whether there is any evidence of significant impairment to goodwill: BBanco Urquijo The goodwill of Banco Urquijo is assigned to cash generating units (UGE, for their acronym in Spanish), which are expected to benefit from the identified synergies. The UGEs and their weight as a percentage of Banco Urquijo’s total goodwill are: Private Banking UGE (12.7%), Commercial Banking UGE (21.2%), Corporate Banking UGE (1.9%) and Other UGEs (2.3%). Synergies that could not be assigned to a specific UGE due to limited available historical information of the acquired entity have been assigned to the overall set of UGEs (61.9%). Banco Guipuzcoano Banco Guipuzcoano’s goodwill was assigned to the Commercial Banking UGE and reflects the future income-generating capacity of the acquired assets and liabilities, the value of the potential income and cost synergies identified and the costs associated with the transaction. BMN-Penedès Goodwill generated from the business combination corresponding to the acquisition of assets from BMN-Penedès was assigned to the Commercial Banking UGE. In accordance with the specifications of the restated text of the Corporation Tax Law, the generated goodwill is not tax-deductible. Other intangible assets Banco Guipuzcoano The intangible assets associated with the acquisition of Banco Guipuzcoano mainly include the value of the contractual rights arising from relationships with customers taken over from Banco Guipuzcoano for core deposits and mutual funds. The valuation of core deposits has been carried out with the income approach using the cost savings method. The fair value was mainly determined by estimating the net present value of the cash flows generated by the lower cost of core deposits compared with alternative sources of funding. Mutual funds management was valued by the income approach using the excess earnings method. The fair value was mainly determined by estimating the net present value of the cash flows generated by the fees received for the sale of mutual funds. These assets are amortised within ten years from the date of acquisition of Banco Guipuzcoano. Private Banking business, Miami Intangible assets associated with the acquisition in 2008 of the Private Banking business in Miami include the value of contractual rights arising from relationships with customers taken over from this business, mainly short-term lending and deposits. These assets are amortised within 15 years from their creation. TSB The intangible assets associated with the acquisition of TSB include the value of the contractual rights arising from relationships with customers taken over from TSB for core deposits. This asset is amortised within 8 years. The valuation of these intangible assets was carried out by calculating the value in use based on the income approach (discounted cash flows) with the multi-period excess earnings technique. To determine whether there is any evidence of impairment, the balance of deposits currently in TSB linked to existing customers at the time of its acquisition by the bank has been compared against the estimated balance that such customers would have at the end of 2018, which was forecast at the time of the initial valuation. Based on this comparison, it can be concluded that there is no evidence of any impairment. The value of the exclusive right of use of the TSB brand was also estimated at 73 million euros. The value attributable to this asset was determined through the replacement cost method, consisting of establishing the cost of rebuilding or acquiring an exact replica of the asset in question. This asset is amortised within 12 years. For the brand, the assessment of the recoverable value of the TSB UGE has implicitly analysed its valuation, concluding that there is no impairment.
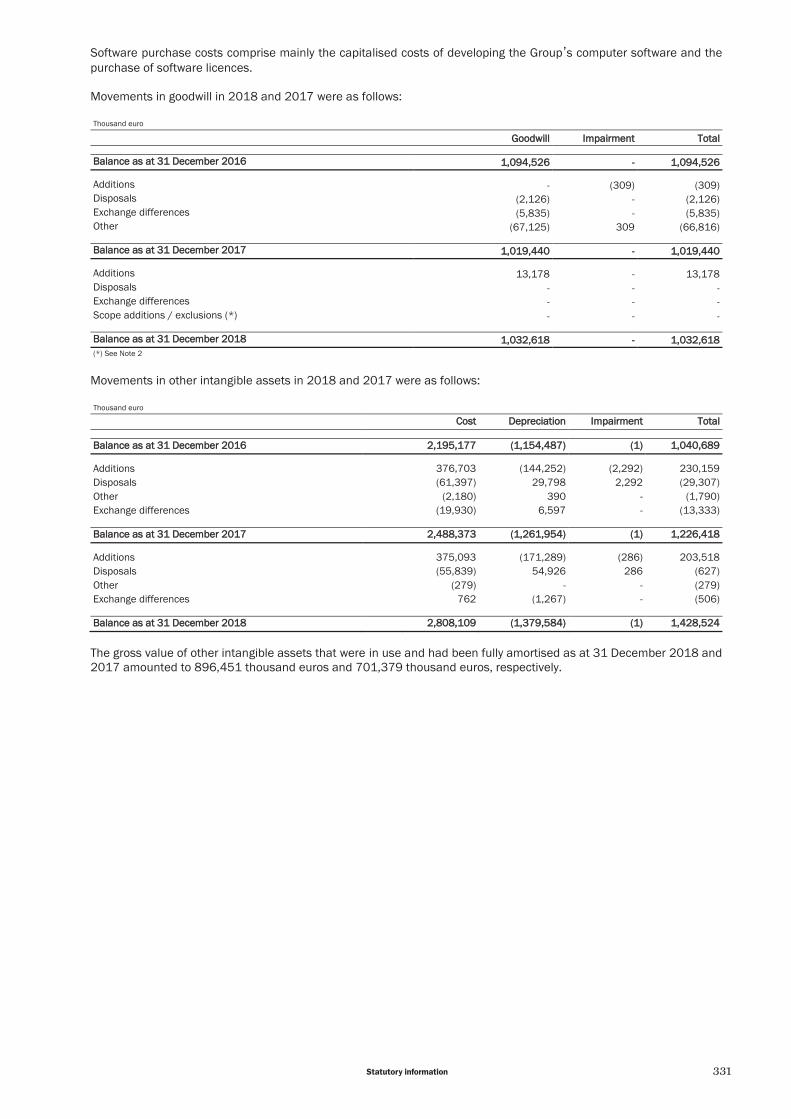
331Statutory information
Software purchase costs comprise mainly the capitalised costs of developing the Group’s computer software and the purchase of software licences. Movements in goodwill in 2018 and 2017 were as follows: Thousand euro
GGoodwill IImpairment TTotal
BBalance as at 31 December 2016 11,094,526 -- 11,094,526
Additions - (309) (309) Disposals (2,126) - (2,126) Exchange differences (5,835) - (5,835) Other (67,125) 309 (66,816)
BBalance as at 31 December 2017 11,019,440 -- 11,019,440
Additions 13,178 - 13,178 Disposals - - - Exchange differences - - - Scope additions / exclusions (*) - - -
BBalance as at 31 December 2018 11,032,618 -- 11,032,618 (*) See Note 2
Movements in other intangible assets in 2018 and 2017 were as follows: Thousand euro
CCost DDepreciation IImpairment TTotal
BBalance as at 31 December 2016 22,195,177 ((1,154,487) ((1) 11,040,689
Additions 376,703 (144,252) (2,292) 230,159 Disposals (61,397) 29,798 2,292 (29,307) Other (2,180) 390 - (1,790) Exchange differences (19,930) 6,597 - (13,333)
BBalance as at 31 December 2017 22,488,373 ((1,261,954) ((1) 11,226,418
Additions 375,093 (171,289) (286) 203,518 Disposals (55,839) 54,926 286 (627) Other (279) - - (279) Exchange differences 762 (1,267) - (506)
BBalance as at 31 December 2018 22,808,109 ((1,379,584) ((1) 11,428,524
The gross value of other intangible assets that were in use and had been fully amortised as at 31 December 2018 and 2017 amounted to 896,451 thousand euros and 701,379 thousand euros, respectively.

332 Banco Sabadell Annual report 2018
NNote 17 – Other assets The “Other assets ”heading on the consolidated balance sheets as at 31 December 2018 and 2017 breaks down as follows: Thousand euro
Note 2018 2017
Insurance contracts linked to pensions 22 132,299 139,114 Inventories 934,857 2,076,294 Rest of other assets 572,829 760,103
Total 1,639,985 2,975,511
The heading “Rest of other assets ”includes mainly unearned expenses paid, the accrual of customer fees and commissions and transactions in progress pending settlement. Movements in inventories in 2018 and 2017 were as follows: Thousand euro
Note Land Buildings under construction
Finished buildings Total
Balance as at 31 December 2016 1,776,858 234,922 912,679 2,924,459
Additions 74,692 72,132 221,350 368,174 Disposals (211,679) (35,253) (291,128) (538,060) Impairment through profit or loss 35 (515,408) (125,373) (426,121) (1,066,902) Reversal of impairment through profit or loss 35 113,967 97,285 290,231 501,483 Other transfers 15 (31,080) (25,213) (56,567) (112,860)
Balance as at 31 December 2017 1,207,350 218,500 650,444 2,076,294
Additions 74,926 88,263 183,873 347,062 Disposals (148,208) (53,806) (249,017) (451,032) Impairment through profit or loss 35 (503,145) (38,461) (156,914) (698,520) Reversal of impairment through profit or loss 35 215,714 40,255 102,618 358,586 Other transfers 13 (245,214) (109,322) (342,997) (697,533)
Balance as at 31 December 2018 601,422 145,428 188,006 934,857
As at 31 December 2018 and 2017, there are no inventories associated with debt secured with mortgages.

333Statutory information
NNote 18 – Deposits in central banks and credit institutions The breakdown of the deposits in central banks and credit institutions heading in the consolidated balance sheets as at 31 December 2018 and 2017 is as follows: Thousand euro
2018 2017
By heading: Financial liabilities at amortised cost 40,798,721 42,018,348
Total 40,798,721 42,018,348
By nature: Demand deposits 399,836 235,076 Deposits with agreed maturity 32,517,567 31,964,417 Repurchase agreements 7,600,498 9,591,000 Deposits redeemable at notice - - Hybrid financial liabilities 59,504 62,605 Other accounts 198,300 151,394 Valuation adjustments 23,016 13,856
Total 40,798,721 42,018,348
By currency: In euro 30,422,046 32,663,588 In foreign currency 10,376,675 9,354,760
Total 40,798,721 42,018,348
Note 19 – Customer deposits The customer deposits heading on the consolidated balance sheets as at 31 December 2018 and 2017 breaks down as follows: Thousand euro
Note 2018 2017
By heading: Financial liabilities at amortised cost 139,078,942 135,307,437
Total 139,078,942 135,307,437
By nature: Demand deposits 4 107,665,339 98,019,789 Deposits with agreed maturity 26,705,427 30,377,798
Fixed term 23,925,215 27,521,501 Non-marketable covered bonds and bonds issued 1,962,867 2,412,422 Rest 817,345 443,875
Hybrid financial liabilities 2,003,569 2,047,546 Repurchase agreements 2,532,968 4,749,634 Valuation adjustments 171,639 112,670
Total 139,078,942 135,307,437
By sector: General governments 5,943,438 5,437,779 Other sectors 132,963,865 129,756,988 Other valuation adjustments (interest, fees and commissions, other) 171,639 112,670
Total 139,078,942 135,307,437
By currency: In euro 97,230,637 93,077,399 In foreign currency 41,848,305 42,230,038
Total 139,078,942 135,307,437

334 Banco Sabadell Annual report 2018
NNote 20 – Debt securities issued The breakdown of the balance of debt securities issued by the Group by type of issuance and recognised on the consolidated balance sheets as at 31 December 2018 and 2017 is as follows: Thousand euro
2018 2017
Straight bonds/debentures 3,979,311 4,843,573 Straight bonds 3,759,097 4,408,506 Structured bonds 220,214 435,067
Commercial paper 3,276,336 3,179,100 Covered Bonds 9,525,100 10,099,200 Covered Bonds (TSB) 558,953 563,552 Securitisation funds 2,247,953 2,544,173 Subordinated marketable debt securities 2,986,344 2,481,835
Subordinated liabilities 1,836,344 1,331,835 Preference shares 1,150,000 1,150,000
Valuation and other adjustments 24,656 76,411 Total 22,598,653 23,787,844 Schedule V shows details of the outstanding issuances at 2018 and 2017 year-end. Two issues of preference shares contingently convertible into the bank’s ordinary shares (Additional Tier 1) have been carried out in 2017. On 18 May 2017, Banco Sabadell carried out its first Additional Tier 1 issuance, amounting to 750,000 thousand euros with a coupon rate of 6.5%. Subsequently, on 23 November 2017, it carried out a second Additional Tier 1 issuance, amounting to 400,000 thousand euros with a coupon rate of 6.125%. These securities are perpetual, although they may be converted into newly issued Banco Sabadell shares, if Banco Sabadell, or its consolidated Group had a Common Equity Tier 1 (CET1) ratio lower than 5.125%, calculated in accordance with Regulation (EU) No. 575/2013 of the European Parliament and of the Council, of 26 June, on prudential requirements for credit institutions and investment firms. The conversion price of the securities shall be the higher of (i) the average of the average prices weighted by the daily volume of the Banco Sabadell share, corresponding to the share listings five days prior to the date of the announcement of the corresponding conversion, (ii) 1.221 euros (floor price for the inaugural issuance in April) and 1,095 euros (floor price for the issuance carried out in November) and (iii) the nominal value of the Banco Sabadell share at the time of the conversion (the nominal value of the share is 0.125 euros). The remuneration of the securities, the payment of which is subject to certain conditions and is also discretional, is established at an annual 6.5% (for the inaugural issuance in April) and 6.125% annually (for the issuance carried out in November) for the first 5 years, which is then renewed every five years, applying a margin of 641.4 and 605.1 basis points to the 5 year mid-swap rate) respectively. The securities are considered as Additional Tier 1 Capital. These issuances were exclusively aimed at qualified investors. Expenses relating to the remuneration for preference shares contingently converted into ordinary shares amount to 73,250 thousand euros as at 31 December 2018 (32,870 thousand euros as at 31 December 2017). The net cost of its fiscal impact has been recorded under the “Other reserves” heading of equity. On 28 October 2017, the final maturity was reached of the Series IV/2013 mandatory convertible subordinated bond issue, resulting in the mandatory conversion of the 70,720,450 Series IV/2013 Bonds which remained in circulation into ordinary shares of Banco Sabadell. As a result, on 16 November 2017, the public deed for the capital increase of a nominal amount of 1,351,688.125 euros was registered with the Alicante Mercantile Registry, agreed by the Executive Committee of Banco Sabadell on 2 November 2017, to attend to the mandatory total conversion arising from the maturity of the issue of mandatory convertible subordinated bonds series IV/2013, which gave rise to the issue and allotment of a total of 10,813,505 ordinary shares of Banco Sabadell. On 23 November 2017, the National Securities Market Commission (CNMV) verified that the requirements for the admission to trading of these new shares with a par value of 0.125 euros each, issued by Banco Sabadell had been satisfied. Lastly, on 23 November 2017, the Governing Bodies of the Stock Exchanges of Barcelona, Bilbao, Madrid and Valencia agreed to the admission to trading of the aforementioned new shares, for which reason the effective trading of these new shares in the Stock Exchanges of Barcelona, Bilbao, Madrid and Valencia through Spain’s electronic trading system (S.I.B.E, also called Mercado Continuo) was initiated on 24 November 2017.

335Statutory information
The capital increases implemented as a result of the mandatory conversions in 2017 are as follows:
IIssue CConveersion/ mmaturity date RReason for conversion BBonds converted
((*) SShares issued CCapital increase aat nominal value ((thousand euro)
DDate of aadmission to
qquotation
OSNC IV/2013 28/10/2017 Mandatory total conversion 70,720,450 10,813,505 1,352 23/11/2017
TTotal 2017 (**) 11,352
(*) Each year 25% of the nominal amount of the 70,720,450 bonds issued were converted.
(**) See consolidated Statement of changes in equity for 2018 and 2017.
Expenses relating to the remuneration of mandatory convertible subordinated bonds amounted to 726 thousand euros in 2017. NNote 21 – Other financial liabilities The breakdown of the balance of other financial liabilities in the consolidated balance sheet as at 31 December 2018 and 2017 is as follows: Thousand euro
2018 2017
By heading: Financial liabilities designated at fair value through profit or loss - 39,540 Financial liabilities at amortised cost 3,600,544 2,931,854
Total 3,600,544 2,971,394
By nature: Debentures payable 421,562 298,470 Guarantee deposits received 77,907 91,548 Clearing houses 647,274 730,746 Collection accounts 1,789,344 1,285,297 Other financial liabilities (*) 664,457 565,333
Total 3,600,544 2,971,394
By currency: In euro 3,421,501 2,618,984 In foreign currency 179,043 352,410
Total 3,600,544 2,971,394 (*) Includes trade payables.
The following table shows information relating to the average payment period to suppliers, as required by Additional Provision Three of Law 15/2010, taking into account the amendments introduced by Law 31/2014 of 3 December, amending the Capital Companies Act in order to improve corporate governance: Number of days and thousand euro
2018 2017
Days Average time taken to pay suppliers 32.89 32.46 Ratio of paid operations 32.89 32.47 Ratio of operations pending payment 42.73 22.92
Amount Total payments made 1,115,620 920,214 Total payments pending 11 594

336 Banco Sabadell Annual report 2018
NNote 22 – Provisions and contingent liabilities Movements during 2018 y 2017 under the heading of provisions are shown below: Thousand euro
Pensions and other post
employment defined benefit
obligations
Other long term employee benefits
Pending legal issues and tax
litigation
Commitments and gguarantees
given
Other provisions Total
Balance as at 31 December 2016 89,471 24,554 49,404 84,032 58,753 306,214
Scope additions / exclusions - - - - 5 5
Interest and similar charges -- ppension commitments 1,050 183 - - - 1,233
Allowances charged to income statement -- sstaff expenses (c) 1,995 7 - - - 2,002
Allowances not charged to income statement - - - - 37,644 37,644
Allowances charged to income statement -- provisions (518) (71) (3,446) 6,065 11,834 13,864
Allocation of provisions - 844 413 124,099 17,761 143,117 Reversal of provisions - - (3,859) (118,034) (5,927) (127,820) Actuarial losses / (gains) (518) (915) - - - (1,433)
Exchange differences - - - (2,485) (787) (3,272)
Utilisations: (31) (9,689) (9,665) - (13,454) (32,839) Contributions by the sponsor - (358) - - - (358) Pension payments (9,272) (9,367) - - - (18,639) Other 9,241 36 (9,665) - (13,454) (13,842)
Other movements (7,124) 1,507 - (2,663) 967 (7,313)
Balance as at 31 December 2017 84,843 16,491 36,293 84,949 94,962 317,538
Impact of first application of IFRS 9 (a) - - - 8,468 - 8,468
Scope additions / exclusions - - - - - -
Interest and similar charges -- ppension commitments 1,202 114 - - - 1,316
Allowances charged to income statement -- sstaff expenses (c) 1,771 4 - - - 1,775
Allowances not charged to income statement - - - 14,360 - 14,360
Allowances charged to income statement -- provisions (896) 1,586 (631) (5,516) 166,163 160,706
Allocation of provisions 217 1,880 2 85,996 175,318 (b) 263,413 Reversal of provisions - - (633) (91,512) (9,155) (101,300) Actuarial losses / (gains) (1,113) (294) - - - (1,407)
Exchange differences - - - (369) (630) (999)
Utilisations: (8,590) (6,595) (30,569) - (197,779) (243,533) Net contributions by the sponsor 29 1 - - - 30 Pension payments (8,619) (6,596) - - - (15,215) Other - - (30,569) - (197,779) (228,348)
Other movements 10,126 804 14 6,676 189,128 (d) 206,748
Balance as at 31 December 2018 88,456 12,404 5,107 108,568 251,844 466,379 (a) See section "Implementation of IFRS 9 Financial Instruments” in Note 1.
(b) Mainly corresponds to provisions allocated to compensate customers for the incidents which occurred following the migration to TSB’s new IT platform (see Note 2).
(c) See Note 33.
(d) Includes transfer of €200,615 thousand in provisions allocated to cover materialisation of contingencies related to floor clauses (see Note 11).
The headings “Pensions and other post-employment defined benefit obligations” and “Other long term employee benefits” includes the amount of provisions for the coverage of post-employment remuneration and commitments undertaken with early retirees and similar commitments.

337Statutory information
The heading “Provisions for commitments and guarantees given” includes the amount of provisions for the coverage of guarantees given as a result of financial guarantees or other types of contract. During the usual course of business, the Group is exposed to fiscal, legal and regulatory contingencies, among others. All significant contingencies are analysed on a regular basis, with the collaboration of third party experts when necessary, in order to determine the probability of the Group being required to make a disbursement. In cases in which a disbursement is considered likely, a provision is allocated, the amount of which is equivalent to the best estimate of the current value of such disbursement, which is registered under the heading “Pending legal issues and tax litigation” or under the heading “Other provisions”. As at 31 December 2018 and 2017, these headings mainly include: • Provisions for tax contingencies amounting to 5 million euros as at 31 December 2018 (36 million euros as at 31
December 2017) which mainly include inspections by the tax authority signed on a contested basis (see Note 39) and contested tax settlements.
• As at 31 December 2018, operational losses in the commercialisation of products for TSB customers for the
amount of 17 million euros (39 million euros) as at 31 December 2017). TSB is protected against the losses arising from historic operations through coverage provided by Lloyds Bank Plc, therefore recognising an account receivable for the same amount recognised under the heading of “Other assets”. These losses are shown as a provision with no impact on the profit/loss shown in the table above.
• Provisions carried out to compensate customers for the incidences which materialised subsequent to the
migration to TSB’s new technology platform for the amount of 46 million euros as at 31 December 2018 (see Note 2).
• Liabilities for legal contingencies amounting to 33 million euros at the end of 2018 (37 million euros at the end
of 2017). • Provisions for the possible reimbursement of amounts paid as a result of the application of mortgage floor
clauses, whether as a result of the hypothetical voiding by the courts of law of floor clauses or whether due to the implementation of Royal Decree-Law 1/2017 of 20 January on measures to protect consumers regarding floor clauses, for the amount of 110 million euros as at 31 December 2018. In the unlikely scenario in which all potential existing claims are made through the procedures established by the entity, in accordance with that set forth in Royal Decree, applying the percentages set forth in the current agreement, the maximum contingency would amount to 505 million euros. With regards to these provisions, the bank considers its floor clauses to be transparent and clear to customers, and in general, these have not been definitively cancelled with a final ruling. On 12 November 2018, Section 28 of the Civil Division of the Provisional Court of Madrid issued a ruling in which it partially supported the appeal brought forth by Banco de Sabadell against the ruling issued by the Commercial Court no.11 of Madrid on the invalidity of the restrictive interest rate clauses, considering that some of the clauses established by Banco Sabadell are transparent and valid in their entirety. With regards to the rest of the clauses, the bank considers that it has legal arguments which should be reviewed in the legal appeal which the entity aims to present to the Supreme Court, with regards to the ruling made by the Provincial Court of Madrid.
The final disbursement amount and the payment schedule are uncertain due to the difficulties inherent in estimating the factors used to determine the provision amount. Pensions and similar obligations The origins of liabilities recognised in respect of post-employment benefits and other similar long-term obligations on the Group’s balance sheet are shown below: Thousand euro
22018 22017 22016 22015 22014
Obligations arising from pension and similar commitments 768,695 793,871 862,218 858,877 1,044,326
Fair value of defined benefit plan assets (667,835) (692,537) (749,295) (744,256) (922,165)
NNet liability recognised on balance sheet 1100,860 1101,334 1112,923 1114,621 1122,161
The returns on the Banco Sabadell pension plan have been negative 2.57% as well as for E.P.S.V. 0.06% in 2018. The returns on the Banco Sabadell pension plan have been negative 0.15% as well as for E.P.S.V. 0.93% in 2017.

338 Banco Sabadell Annual report 2018
Movements during 2018 and 2017 in obligations due to pensions and similar commitments and the fair value of the scheme assets are as follows: Thousand euro
OObligations arising ffrom ppension and
ssimilar commitments
FFair value of defined bbenefit plan assets
BBalance as at 31 December 2016 8862,218 7749,295 Interest costs 10,372 - Interest income - 9,139 Normal cost in year 2,002 - Past service cost 486 - Benefits paid (56,244) (37,604) Settlements, curtailments and terminations 1,724 2,242 Net contributions by the institution - (249) Actuarial gains or losses from changes in demographic assumptions - - Actuarial gains or losses from changes in financial assumptions (23,139) - Actuarial gains or losses from changes in actuarial assumptions (108) - Yield on defined benefit plan assets excluding interest income - (24,683) Other movements (3,440) (5,603)
BBalance as at 31 December 2017 7793,871 6692,537
Interest costs 11,424 - Interest income - 10,108 Normal cost in year 1,775 - Past service cost 1,880 - Benefits paid (52,465) (37,250) Settlements, curtailments and terminations 11,761 12,874 Net contributions by the institution - (215) Actuarial gains or losses from changes in demographic assumptions - - Actuarial gains or losses from changes in financial assumptions - - Actuarial gains or losses from changes in actuarial assumptions 7,054 - Yield on defined benefit plan assets excluding interest income - (2,738) Other movements (6,605) (7,481)
BBalance as at 31 December 2018 7768,695 6667,835
The breakdown of Group pension commitment and similar obligations as at 31 December 2018 and 2017 based on its financing vehicle, coverage and the interest rate applied in its calculation is listed below: Thousand euro
22018 FFinancing vehicle CCoverage AAmount IInterest rate
PPension plans 4408,264 Insurance policies with related parties Matched 34,565 1.50% Insurance policies with unrelated parties Matched 373,699 1.50%
IInsurance policies 3348,127 Insurance policies with related parties Matched 84,865 1.50% Insurance policies with unrelated parties Matched 263,262 1.50%
IInternal funds Without cover 112,304 1.50%
TTotal obligations 7768,695

339Statutory information
Thousand euro
22017 FFinancing vehicle CCoverage AAmount IInterest rate
PPension plans 4427,904 Insurance policies with related parties Matched 44,988 1.50% Insurance policies with unrelated parties Matched 382,916 1.50%
IInsurance policies 3349,766 Insurance policies with related parties Matched 89,930 1.50% Insurance policies with unrelated parties Matched 259,836 1.50%
IInternal funds Without cover 116,201 1.50%
TTotal obligations 7793,871
The amount of obligations covered with matched insurance policies as at 31 December 2018 was 756,391 thousand euros (777,670 thousand euros as at 31 December 2017), therefore in 98.40% of its commitments (97.96% as at 31 December 2017), the Group had no mortality risk (mortality tables) or profitability risk (interest rates). Therefore, the evolution of interest rates throughout the year has not had an impact on the bank’s financial situation. The amount of obligations covered with specific assets was 756,391 thousand euros (of which 31 thousand euros covered early retirement commitments) as at 31 December 2018 and 777,670 thousand euros (of which 186 thousand euros covered early retirement commitments) as at 31 December 2017. The sensitivity analysis for each key actuarial assumption, as at 31 December 2018 and 31 December 2017, shows how the obligation would have been affected and the cost of the services during the current year for reasonably likely changes on such date. %
22018 22017 SSensitivity analysis PPercentage change
DDiscount rate
DDiscount rate --550 basis points: Assumption 1.00% 1.00% Change in obligation 5.68% 6.00% Change of service cost in current year 8.48% 8.21%
DDiscount rate +50 basis points: Assumption 2.00% 2.00% Change in obligation (5.31%) (5.38%) Change of service cost in current year (7.49%) (7.08%)
RRate of salary increase
RRate of salary increase --550 basis points: Assumption 2.50% 2.50% Change in obligation (0.31%) (0.30%) Change of service cost in current year (3.62%) (2.32%)
RRate of salary increase +50 basis points: Assumption 3.50% 3.50% Change in obligation 0.33% 0.31% Change of service cost in current year 3.72% 2.43%

340 Banco Sabadell Annual report 2018
The estimation of the current probabilised values, as at 31 December 2018 of benefits payable for the next ten years: Thousand euro
YYears 22019 22020 22021 22022 22023 22024 22025 22026 22027 22028 TTotal Future benefit payments 13,889 11,383 9,582 8,587 8,061 7,732 7,441 7,150 6,864 6,570 887,259
The fair value of assets linked to pensions recognised on the consolidated balance sheet amount to 132,299 thousand euros as at 31 December 2018 and 139,114 thousand euros as at 31 December 2017 (see Note 17). The principal categories of the plan assets as the total percentage of the plan assets are listed below: %
22018 22017
Equity 0.01% 0.02% Other equity instruments - - Debt instruments 1.39% 2.10% Mutual funds 1.53% 1.41% Deposits and current accounts 0.05% 0.45% Other (insurance policies with related parties) 97.02% 96.02%
TTotal 1100% 1100%
The following financial instruments issued by the bank are included in the fair value of the plan assets: Thousand euro
22018 22017
Equity instruments 100 165 Debt instruments 1,000 - Deposits and current accounts 314 3,123
TTotal 11,414 33,288

341Statutory information
NNote 23 – Own Funds The breakdown of the balance of own funds recognised on the consolidated balance sheets as at 31 December 2018 and 2017 is the following: Thousand euro
2018 2017
Capital 703,371 703,371 Share premium 7,899,227 7,899,227 Equity instruments issued other than capital - - Other equity 35,487 32,483 Retained earnings - - Revaluation reserves - - Other reserves 3,832,935 4,207,340 (-) Treasury shares (143,452) (106,343) Profit or loss attributable to owners of the parent 328,102 801,466 (-) Interim dividends (110,739) (111,628)
Total 12,544,931 13,425,916
Capital Share capital at year-end The bank’s share capital as at 31 December 2018 and 2017 stood at 703,370,587,63 euros, represented by 5,626,964.701 registered shares with a par value of 0.125 euros each. All shares have been fully disbursed and are numbered in sequential order from 1 through 5,626,964,701, inclusive. The bank’s shares are listed on the Madrid, Barcelona, Bilbao and Valencia stock exchanges and on Spain’s continuous securities market managed by Sociedad de Bolsas, S.A. None of the other companies included in the scope of consolidation are listed on the stock exchange. The rights conferred to the equity instruments are those regulated by the Capital Companies Act. During the Annual General Meeting, shareholders can issue a percentage of votes equivalent to the percentage of the share capital in their possession. Changes in share capital Changes in the bank’s share capital in 2018 and 2017 are shown below: Thousand euro
Number of shares Capital
Balances as at 31 December 2016 5,616,151,196 702,019
Conversion of mandatory convertible bonds IV/2013 - November 2017 (*) 10,813,505 1,352
Balances as at 31 December 2017 5,626,964,701 703,371 - - -
Balances as at 31 December 2018 5,626,964,701 703,371 (*) See Note 20.

342 Banco Sabadell Annual report 2018
Significant investments in the bank’s capital As required by Articles 23 and 32 of Royal Decree 1362/2007 of 19 October, implementing the Securities Market Law 24/1988 of 28 July, on transparency requirements relating to information on the issuers whose securities have been admitted to trading on an official secondary market or on any other European Union regulated market, the following table gives details of significant investments in Banco Sabadell as at 31 December 2018:
DDirect owner of the shareholdinng %% of voting rights aassigned to shares
%% of voting rights through ffinancial instruments
%% of total voting rrights
IIndirect owner of the sshareholding
Various subsidiaries of BlackRock Inc. 5.12% 0.20% 5.32% BlackRock Inc. Fintech Europe S.A.R.L. 3.10% - 3.10% David Martínez Guzmán Norges Bank 3.06% 0.11% 3.17% - Coltrane Master Fund, L.P. - 1.07% 1.07% -
The sources for the information provided are communications sent by shareholders to the National Securities Market Commission or directly to the institution.
Share premium The balance in the share premium as at 31 December 2018 amounted to 7,899,227 thousand euros (7,899,227 thousand euros as at 31 December 2017). Movements made during 2018 and 2017 are shown below. Thousand euro
BBalance as at 31 December 2016 77,882,899
Capital increase - Conversion of subordinated bonds (equity) - Conversion of subordinated bonds (financial liabilities) 16,328 Distribution of dividends - Reclassification of capital increase expenses to reserves - Rest -
BBalance as at 31 December 2017 77,899,227
Capital increase - Conversion of subordinated bonds (equity) - Conversion of subordinated bonds (financial liabilities) - Distribution of dividends - Reclassification of capital increase expenses to reserves - Rest -
BBalance as at 31 December 2018 77,899,227

343Statutory information
Other reserves The balance of this heading breaks down as follows on the consolidated balance sheets as at 31 December 2018 and 2017: Thousand euro
22018 22017
RRestricted reserves: 3325,020 4414,921 Statutory reserve 140,674 140,404 Reserves for treasury shares pledged as security 136,459 226,869 Capitalisation reserve Law 27/2014 35,985 35,985 Canary Island investment reserve 8,787 8,548 Reserve for share capital redenomination in euro 113 113 Capital redemption reserve 3,002 3,002
UUnrestricted reserves 33,301,766 33,806,052
RReserves of entities valued using the equity method 2206,149 ((13,633)
TTotal 33,832,935 44,207,340
Information on the reserves for each one of the consolidated companies is indicated in Schedule I. Other equity The amount of the instruments associated with instrumentalised remunerations through long term share based incentives plans are included under other equity (see Note 33 “Administrative expenses”) which as at 31 December 2018 and 2017 amounted to 35,487 and 32,483 thousand euros. Business on own equity instruments The movements of the parent company’s shares acquired by the bank are as follows: NNominal value AAverage price
%% Shareholding NNo. of shares (in thousand euro) (in euro)
BBalance as aat 31 December 2016 551,901,666 66,487.71 11.72 00.92 Purchases 202,784,158 25,348.02 1.67 3.60 Sales 206,452,578 25,806.57 1.66 3.66
BBalance as at 31 December 2017 448,233,246 66,029.16 11.82 00.86
Purchases 188,236,870 23,529.61 1.41 3.34 Sales 147,681,602 18,460.20 1.46 2.62
BBalance as at 31 December 2018 888,788,514 111,098.57 11.57 11.58
Net gains and losses arising on transactions in equity have been included under the heading “Own funds - Other reserves” on the balance sheet, and they are shown in the statement of changes in equity, in the row corresponding to sales or cancellations of treasury shares. As at 31 December 2018 TSB owns 2,448,704 Banco Sabadell shares (11,635,555 at the end of 2017), with a cost of 3,692 thousand euros (18,390 thousand euros at the end of 2017), which are recognised as own shares on the consolidated balance sheet. As at 31 December 2018, 136,390,382 bank shares are pledged as operation guarantees for a nominal value of 17,049 thousand euros (136,998,348 shares for a nominal value of 17,125 thousand euros as at 31 December 2017). The number of Banco de Sabadell, S.A. equity instruments owned by third parties, yet managed by the different companies of the Group, amounts to 21,506,506 and 16,051,137 securities as at 31 December 2018 and 2017, respectively. Their nominal value amounts to 2,688 thousand euros and 2,006 thousand euros, respectively. In both years, 100% of the securities corresponded to Banco Sabadell shares.

344 Banco Sabadell Annual report 2018
NNote 24 – Accumulated other comprehensive income The composition of this heading of consolidated equity as at 31 December 2018 and 2017 is as follows: Thousand euro
2018 2017
Items that will not be reclassified to profit or loss (52,564) 49,443 Actuarial gains or (-) losses on defined benefit pension plans (329) 6,767
Non-current assets and disposal groups classified as held for sale - -
Share of other recognised income and expense of investments in joint ventures and associates - - Fair value changes of equity instruments measured at fair value through other comprehensive income (52,235) 42,676
Hedge ineffectiveness of fair value hedges for equity instruments measured at fair value through other comprehensive income - -
Fair value changes of equity instruments measured at fair value through other comprehensive income [hedged item] -
- Fair value changes of equity instruments measured at fair value through other comprehensive income [hedging instrument] -
- Fair value changes of financial liabilities at fair value through profit or loss attributable to changes in their credit risk -
- Items that may be reclassified to profit or loss (438,906) (314,754)
Hedge of net investments in foreign operations [effective portion] (*) 213,031 236,647 Foreign currency translation (640,720) (678,451) Hedging derivatives. Cash flow hedges (effective portion) (**) 4,306 (80,402)
Amount deriving from outstanding operations 6,002 (32,726) Amount deriving from discontinued operations (1,696) (47,676)
Fair value changes of debt instruments measured at fair value through other comprehensive income (22,958) 195,869
Hedging instruments [not designated elements] - - Non-current assets and disposal groups classified as held for sale - -
Share of other recognised income and expense of investments in joint ventures and associates 7,435 11,583 Total (491,470) (265,311) (*) The value of the hedge of net investments in foreign operations is fully obtained from outstanding transactions. (**) Cash flow hedges mainly mitigate interest rate risk and other risks (see note 12).

345Statutory information
The breakdown of corporation tax in respect of items that can reclassified to profit or loss related to each heading on the statement of recognised income and expenses as at 31 December 2018 and 2017 is shown below: Thousand euro
22018 22017
GGross amount TTax effect NNet GGross amount TTax effect NNet Items that will not be reclassified to profit or loss (145,616) 43,609 (102,007) (21,584) 6,475 (15,109)
Actuarial gains or (-) losses on defined benefit pension plans (10,138) 3,041 (7,097) (9,278) 2,783 (6,495)
Non-current assets and disposal groups classified as held for sale - - - - - -
Share of other recognised income and expense of investments in joint ventures and associates - - - - - -
Fair value changes of equity instruments measured at fair value through other comprehensive income
(135,478) 40,568 (94,910) (12,306) 3,692 (8,614)
Hedge ineffectiveness of fair value hedges for equity instruments measured at fair value through other comprehensive income
- - - - - -
Fair value changes of equity instruments measured at fair value through other comprehensive income [hedged item]
- - - - - -
Fair value changes of equity instruments measured at fair value through other comprehensive income [hedging instrument]
- - - - - -
Fair value changes of financial liabilities at fair value through profit or loss attributable to changes in their credit risk
- - - - - -
Items that may be reclassified to profit or loss (264,197) 80,810 (183,387) (438,857) 81,548 (357,309)
Hedge of net investments in foreign operations [effective portion] (23,616) - (23,616) 85,282 - 85,282
Foreign currency translation 38,813 (1,082) 37,731 (249,801) - (249,801)
Hedging derivatives. Cash flow hedges reserve [effective portion] 121,163 (36,455) 84,708 (87,004) 28,123 (58,881)
Fair value changes of debt instruments measured at fair value through other comprehensive income
(396,409) 118,347 (278,062) (45,506) 12,153 (33,353)
Hedging instruments [not designated elements] - - - - - -
Non-current assets and disposal groups classified as held for sale - - - (137,571) 41,272 (96,299)
Share of other recognised income and expense of investments in joint ventures and associates (4,148) - (4,148) (4,257) - (4,257)
TTotal ((409,813) 1124,419 ((285,394) ((460,441) 888,023 ((372,418)
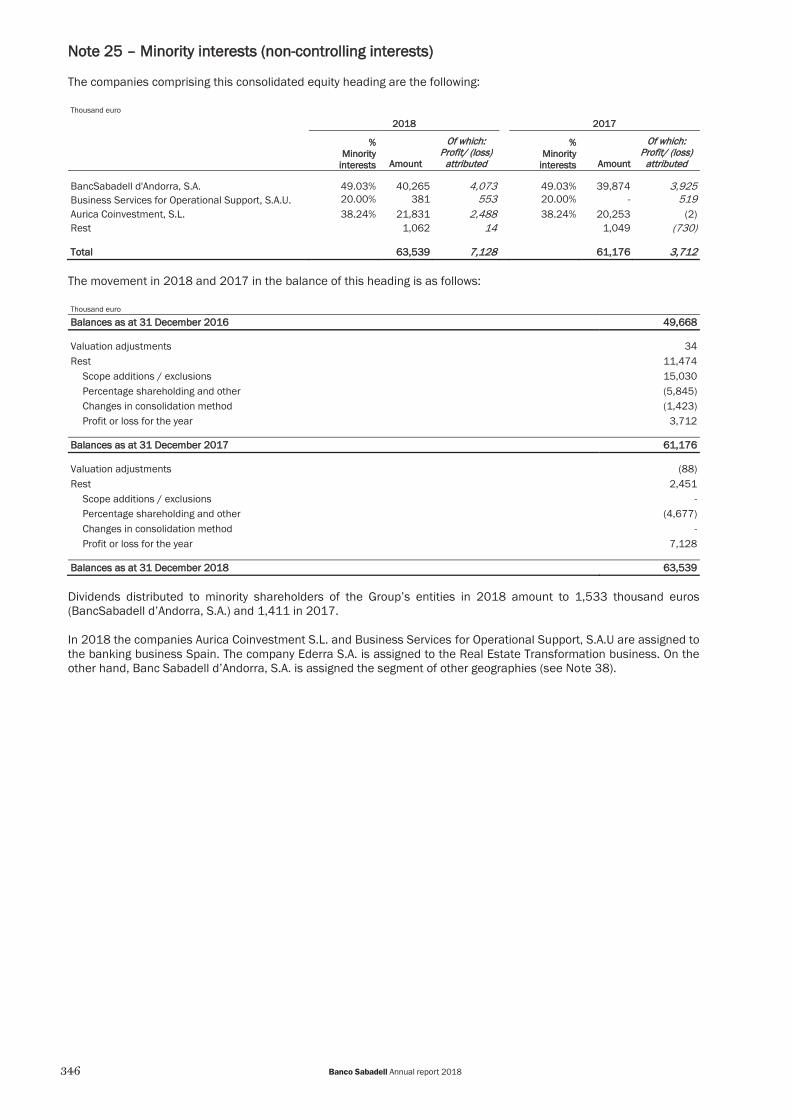
346 Banco Sabadell Annual report 2018
NNote 25 – Minority interests (non-controlling interests) The companies comprising this consolidated equity heading are the following: Thousand euro
2018 2017
%
Amount
Of which: Profit/ (loss)
attributed
% Of which: Profit/ (loss)
attributed Minority
interests Minority
interests Amount
BancSabadell d'Andorra, S.A. 49.03% 40,265 4,073 49.03% 39,874 3,925 Business Services for Operational Support, S.A.U. 20.00% 381 553 20.00% - 519 Aurica Coinvestment, S.L. 38.24% 21,831 2,488 38.24% 20,253 (2) Rest 1,062 14 1,049 (730)
Total 63,539 7,128 61,176 3,712
The movement in 2018 and 2017 in the balance of this heading is as follows: Thousand euro
Balances as at 31 December 2016 49,668 Valuation adjustments 34 Rest 11,474
Scope additions / exclusions 15,030 Percentage shareholding and other (5,845) Changes in consolidation method (1,423) Profit or loss for the year 3,712
Balances as at 31 December 2017 61,176
Valuation adjustments (88) Rest 2,451
Scope additions / exclusions - Percentage shareholding and other (4,677) Changes in consolidation method - Profit or loss for the year 7,128
Balances as at 31 DDecember 2018 63,539
Dividends distributed to minority shareholders of the Group’s entities in 2018 amount to 1,533 thousand euros (BancSabadell d’Andorra, S.A.) and 1,411 in 2017. In 2018 the companies Aurica Coinvestment S.L. and Business Services for Operational Support, S.A.U are assigned to the banking business Spain. The company Ederra S.A. is assigned to the Real Estate Transformation business. On the other hand, Banc Sabadell d’Andorra, S.A. is assigned the segment of other geographies (see Note 38).

347Statutory information
NNote 26– Off-balance sheet exposures The breakdown of this heading for the annual periods ended 31 December 2018 and 2017 is the following: Thousand euro
Commitments and guarantees given Note 2018 2017
Financial guarantees given (*) 2,040,786 1,983,143 Of which, amount classified as Stage 3 25,890 48,163
Amount recognised within liabilities on the balance sheet (**) 22 22,617 32,500
Loan commitments given 22,645,948 20,906,053 Of which, amount classified as Stage 3 55,932 61,719 Can be drawn by third parties 22,645,948 20,906,053
By credit institutions 549 468 By general governments 638,858 677,317 By other resident sectors 15,640,631 13,750,112 By non-residents 6,365,910 6,478,156
Amount recognised within liabilities on the balance sheet 22 45,759 23,677 Other commitments given 8,233,226 9,916,992 Of which, amount classified as Stage 3 55,305 9,729 Other guarantees given 7,341,297 6,743,704
Assets earmarked for third-party obligations - - Irrevocable letter of credit 921,336 838,922 Additional settlement guarantee 20,000 20,000 Other guarantees and sureties given 6,399,961 5,884,782 Other contingent risks - -
Other commitments given 891,929 3,173,287 Financial asset forward purchase commitments 557,375 2,825,731 Conventional financial asset purchase contracts 158,985 126,999 Capital subscribed but not paid up 1,939 1,939 Underwriting and subscription commitments - - Other loan commitments given 173,630 218,618
Amount recognised within liabilities on the balance sheet 22 40,192 28,772 Total 32,919,960 32,806,188 (*) Of which, 137,481 and 89,881 thousand euros as at 31 December 2018 and 31 December 2017, respectively, granted in relation to construction and real estate development.
(**) Of which, 6,410 and 5,451 thousand euros as at 31 December 2018 and 31 December 2017, respectively, recognised within liabilities on the balance sheet in relation to construction and real estate development.
The amount of financial guarantees, loans commitments and other commitments given classed as stage 2, amount to 125,649, 501,605 and 397,675 thousand euros, respectively, as at 31 December 2018. The total contingent commitments drawable by third parties as at 31 December 2018 includes mortgage-secured lending commitments for the amount of 4,415.019 thousand euros (2,616,999 thousand euros as at 31 de December 2017). As regards other commitments, in the majority of cases there are other types of guarantees which are in line with the Group’s risk management policy. Guarantees given classed as stage 3 The movement of the balance of guarantees classed as stage 3 during 2018 is the following: Thousand euro
Balances as at 1 January 2018 57,892 Additions 57,036 Disposals (33,733)
Balances as at 31 December 2018 81,195

348 Banco Sabadell Annual report 2018
The breakdown by geography of the balance guarantees classed as stage 3 as at 31 December 2018 and 2017 is as follows: Thousand euro
22018 22017
Spain 80,507 56,766 Rest of European Union 387 22 Ibero-America 131 145 Rest of OECD - - Rest of the world 170 959
TTotal 881,195 557,892
The coverage of credit risk corresponding to guarantees given as at 31 December 2018 and 1 January 2018 (date of the first application of IFRS 9), distributed based on its method of determination, and the credit risk of off-balance sheet exposures, is as follows: Thousand euro
331/12/2018 001/01/2018
SSpecific iindividually measured allowances: 336,008 336,293 Stage 2 2,663 16,735 Stage 3 33,345 19,557
SSpecific collectively measured allowances: 226,725 225,691 Stage 1 11,727 9,520 Stage 2 5,153 3,477 Stage 3 9,432 10,727 Allowances for country risk 413 1,967
TTotal 662,733 661,983
The movement of this coverage during the periods 2018 and 2017, together with the coverage of other commitments given is shown in Note 22.

349Statutory information
NNote 27 – Off-balance sheet customer funds Off-balance sheet customer funds managed by the Group and those sold but not under management are shown below: Thousand euro
2018 2017
Managed by the Group: 21,893,067 23,090,028 Investment firms and funds 18,297,797 19,091,344 Asset management 3,595,270 3,998,685
Investment funds sold but not managed 8,081,426 8,283,255
Pension funds (*) 3,594,186 3,986,555
Insurance (*) 10,465,118 9,964,863
Financial instruments deposited by third parties 76,324,331 80,970,536
Total 120,358,128 126,295,237 (*) The balance in pension funds and insurance relates to those sold by the Group.
Note 28 – Interest income and expenses These headings in the consolidated income statement include interests accrued during the year on all financial assets and liabilities the yield of which, implicit or explicit, is obtained by applying the effective interest rate approach, irrespective of whether they are measured at fair value or otherwise, and using product adjustments due to accounting hedges. Interests are recorded at their gross value, without deducting any tax withholdings exercised at the source. The majority of interest income is generated by the Group’s financial assets measured either at amortised cost or at fair value through other comprehensive income. The average annual interest rate during 2018 and 2017 of the indicated balance sheet headings is shown below: %
2018 2017
Banco Sabadell
Group Ex TSB Banco Sabadell Group Ex TSB
Assets
Cash, cash balances at central banks and other demand deposits 0.08 (0.11) 0.02 (0.11)
Debt securities 1.36 1.41 1.72 1.74 Loans and advances
Customers 2.96 2.86 3.00 2.84
Liabilities Deposits
Central banks and Credit institutions 0.11 (0.03) 0.10 0.05 Customers 0.22 0.15 0.19 0.12

350 Banco Sabadell Annual report 2018
The breakdown of quarterly net interest income for the years 2018 and 2017, as well as returns and average costs of the different components which comprise the total investment and funds, is as follows:
In terms of annual average, net interest margin on average total assets stood at 1.69% (1.57% without TSB), declining by 8 basis points in comparison with the previous year (1.77% in 2017). With regards to the evolution of quarterly net interest margin, net interest margin on average total assets in the fourth quarter of 2018 stood at 1.70% (1.56% excluding TSB). In the fourth quarter of 2017 this margin stood at 1.71%.

351Statutory information
The contractual difference between the operations contracted in the different quarters of the years 2018 and 2017 (new entry) is shown for the investment positions and deposits corresponding to Spain business-network operations, without including subsidiaries operations, as well as the portfolio arising from each one of them (stock): BBasis point spread AAdditions (quarterly average) SStock
22018 22018 11T 22T 33T 44T 11T 22T 33T 44T
Credit 214 245 217 258 228 225 228 227 Loans 256 222 265 239 237 233 229 231 Home mortgage loans 120 124 124 135 115 115 115 115 Leasing 267 350 243 304 244 258 256 257 Renting 427 373 355 364 464 444 428 400 Discounting 240 225 226 218 250 236 242 232 Confirming 242 226 232 227 224 225 219 213 Forfaiting 251 331 355 331 304 261 224 232
LLending 2218 2212 2214 2211 1179 1178 1177 1178
1-month term deposit 15 11 12 4 14 14 13 4 3-month term deposit 11 4 (2) 1 10 5 (4) 4 6-month term deposit 5 (4) (4) (5) 14 1 3 - 12-month term deposit 10 7 8 10 15 13 12 11 +12 month term deposit 26 21 20 17 25 24 22 19
DDeposits with agreed maturity 118 111 110 110 220 118 116 114
BBasis point spread AAdditions (quarterly average) SStock
22017 22017 11T 22T 33T 44T 11T 22T 33T 44T
Credit 236 257 256 250 241 238 249 241 Loans 300 263 215 250 240 240 236 238 Home mortgage loans 155 164 153 136 113 114 114 115 Leasing 305 286 313 265 238 242 245 245 Renting 449 374 446 418 513 477 468 475 Discounting 266 249 243 241 284 259 258 252 Confirming 259 249 252 232 245 231 234 223 Forfaiting 547 529 481 396 407 408 409 392
LLending 2249 2238 2220 2225 1182 1181 1179 1180
1-month term deposit 32 27 22 30 30 22 21 26 3-month term deposit 37 17 10 24 34 19 11 21 6-month term deposit 16 24 17 25 17 22 20 23 12-month term deposit 15 14 11 20 18 15 14 16 +12 month term deposit 26 25 9 38 28 25 22 30
DDeposits with agreed maturity 225 222 113 332 223 220 118 224
With regards to the existing home mortgages portfolio as at 31 December 2018, the breakdown for the period in which the interest rate applied to each operation is as follows: Thousand euro
MMortgage repricing schedule 11Q 19 22Q 19 33Q 19 44Q 19 TTotal
Home mortgages 7,723,996 7,103,793 5,587,547 6,296,430 226,711,766
Corresponds to Business Spain – branch network operations.

352 Banco Sabadell Annual report 2018
New deposits until 31 December 2018 and 2017 as well as their breakdown by contractual maturity have been the following: Million euro
AAdditions DDeposits by mmaturity 22018
11T 22T 33T 44T
Up to 3M 2,591 2,571 2,696 3,077 3 to 6M 715 966 712 826 6 to 12M 1,603 1,926 1,415 1,771 12 to 18M 905 1,198 992 931 More than 18M 2,964 1,847 1,279 3,964
TTotal deposits 88,778 88,508 77,094 110,569
%
Up to 3M 29.5 30.2 38.0 29.1 3 to 6M 8.1 11.4 10.0 7.8 6 to 12M 18.3 22.6 19.9 16.8 12 to 18M 10.3 14.1 14.0 8.8 More than 18M 33.8 21.7 18.1 37.5
TTotal deposits 1100 1100 1100 1100 Corresponds to Business Spain – branch network operations.
Million euro
AAdditions DDeposits by maturity 22017
11T 22T 33T 44T
Up to 3M 3,042 3,121 2,391 2,343 3 to 6M 586 902 735 961 6 to 12M 2,923 3,241 1,988 2,024 12 to 18M 601 905 906 495 More than 18M 3,445 3,757 3,756 6,829
TTotal ddeposits 110,597 111,926 99,776 112,652
%
Up to 3M 28.7 26.2 24.5 18.5 3 to 6M 5.5 7.6 7.5 7.6 6 to 12M 27.6 27.2 20.3 16.0 12 to 18M 5.7 7.6 9.3 3.9 More than 18M 32.5 31.4 38.4 54.0
TTotal deposits 1100 1100 1100 1100 Corresponds to Business Spain – branch network operations.

353Statutory information
NNote 29 – Fee and commission income and expenses Fee income and expenses of financial operations and for the provision of services are as follows: Thousand euro
2018 2017
Fees from risk ttransactions 240,612 304,801 Lending operations 137,964 206,092 Sureties and other guarantees 102,648 98,709
Service fees 722,297 580,016 Payment cards 224,871 205,721 Payment orders 61,602 53,982 Securities 61,058 60,413 Sight accounts 220,962 130,783 Rest 153,804 129,117
Asset management fees 372,393 338,619 Mutual funds 157,740 158,409 Sale of pension funds and insurance products 185,463 152,826 Assets under management 29,190 27,384
Total 1,335,302 1,223,436
Memorandum item
Fee and commission income 1,558,648 1,478,603 Fee and commission expenses (223,347) (255,167)
Net fees and commissions 1,335,301 1,223,436
Note 30 – Gains or (-) losses on financial assets and liabilities, net Gains or (-) losses on financial assets and liabilities, net groups together a series of headings of the consolidated income statement for the years ended 31 December 2018 and 2017 which are shown below: Thousand euro
2018 2017
By heading: Gains or (-) losses on derecognition of financial assets and liabilities not measured at fair value through profit or loss, net
208,106 371,365
Financial assets at fair value through other comprehensive income 292,256 388,698 Financial assets at amortised cost (75,870) (12,268) Financial liabilities at amortised cost (8,280) (5,065)
Gains or (-) losses on financial assets and liabilities held for trading, net 10,568 214,786 Gains or (-) losses on non-trading financial assets mandatorily at fair value through profit or loss, net
(13,902) -
Gains or (-) losses on financial assets and liabilities designated at fair value through profit or loss, net
19 134
Gains or (-) losses from hedge accounting, net 21,918 27,819
Total 226,709 614,104
By type of financial iinstrument: Net gain/(loss) on debt securities 203,620 384,568 Net gain/(loss) other equity instruments (1,174) 16,252 Net gain/(loss) on derivatives 29,896 230,622 Net gain/(loss) on other items (*) (5,633) (17,338)
Total 226,709 614,104 (*) Mainly includes gains/(losses) on the sale of various loan portfolios sold during the year.

354 Banco Sabadell Annual report 2018
During the years 2018 and 2017 the Group has carried out sales of certain debt securities which it held in its portfolio of financial assets through other comprehensive income, generating profits of 292,249 thousand euros as at 31 December 2018 (388,698 thousand euros as at 31 December 2017). Of this profit, 289,366 thousand euros (348,709 thousand euros in 2017) of profit derive from the sale of debt securities maintained with general governments. Additionally, in 2018 the Group has carried out sales of certain debt securities which it held in its portfolio of financial assets at amortised cost with the purpose of managing the increase in credit risk (see Note 8). Similarly, the item “Net gain/(loss) on derivatives” in the table above includes the change in fair value of hedging derivatives which have been discontinued from the date of discontinuation until their settlement for the amount of 38,513 thousand euros. NNote 31 – Other operating income The composition of this item of the consolidated income statement for the years ended 31 December 2018 and 2017 is as follows: Thousand euro
2018 2017
Income from use of investment properties 84,907 104,724 Sales and other income from the provision of non-financial services 78,441 148,452 Other operating income 93,334 85,189
Total 256,682 338,365
Sales and income from the provision of non-financial services include income generated by the management of real estate asset portfolios of other institutions (SAREB). The income recognised in other operating income mostly corresponds to income from Group entities engaging in non-financial activities (mostly operating leases). Note 32 – Other operating expenses The composition of this item of the consolidated income statement for the years ended 31 December 2018 and 2017 is as follows: Thousand euro
2018 2017
Contribution to deposit guarantee funds (106,332) (98,295) Banco Sabadell (103,317) (95,751) TSB 1,558 (355) Sabadell United Bank - (497) BS IBM México (4,573) (1,692)
Contribution to resolution fund (49,744) (50,639)
Other items (390,989) (397,389)
Monetisation taxes (*) (44,996) (54,668) Rest (345,993) (342,721)
Total (547,065) (546,323) (*) See Note 39.
The “Rest ”subheading includes expenses corresponding to Tax on Deposits to Credit Institutions, amounting to 30,650 thousand euros in 2018 (28,146 thousand euros in 2017), as well as expenses associated with non-financial activities.

355Statutory information
NNote 33 – Administrative expenses This heading in the consolidated income statement includes expenses incurred by the Group in respect of staff and other general administrative expenses. Staff expenses The staff expenses recognised in the consolidated income statement for the years ended 31 December 2018 and 2017 are as follows: Thousand euro
Notee 2018 2017
Payrolls and bonuses for active staff (1,159,614) (1,181,796) Social Security payments (239,243) (241,550) Contributions to defined benefit pension plans 22 (1,775) (2,002) Contributions to defined contribution pension plans (71,096) (67,575) Other staff expenses (118,862) (80,637)
Total (1,590,590) (1,573,560)
As at 31 December 2018 and 2017, the breakdown of the average workforce for all companies within the Group by category and by gender is as follows: Average number of employees
2018 2017 Men Women Total Men Women Total
Management staff 507 173 680 482 154 636 Technical staff 10,015 10,812 20,827 10,065 10,930 20,995 Administrative staff 1,038 3,502 4,540 1,007 3,533 4,540
Total 11,560 14,487 26,047 11,554 14,617 26,171
The breakdown of the bank’s average workforce by category at 31 December 2018 and 2017 and with a disability of 33% or more is as follows: Average number of employees
Banco Sabadell Group 2018 2017 Management staff 6 14 Technical staff 189 178 Administrative staff 19 75
Total 214 267
As at 31 December 2018 and 2017, the breakdown of Group workforce by category and gender is as follows: Number of employees
2018 2017 Men Women Total Men Women Total
Management staff 501 173 674 488 157 645 Technical staff 10,025 10,855 20,880 9,980 10,734 20,714 Administrative staff 1,079 3,548 4,627 999 3,487 4,486
Total 11,605 14,576 26,181 11,467 14,378 25,845
Of the total workforce as at 31 December 2018, 188 had some form of recognised disability (253 as at 31 December 2017). Non-recurring staff expenses amounted to 61,009 thousand euros as at 31 December 2018. Expenses which do not form part of the institution’s ordinary activities are considered non-recurring. Non-recurring staff expenses are those linked to changes in the organisational structure, commercial transformation and the post-migration incidents described in Note 2.

356 Banco Sabadell Annual report 2018
LLong-term share-based complementary incentives scheme At the Annual General Meeting held on 27 March 2014, the shareholders approved a long-term complementary incentive based on the increase in value of Banco de Sabadell, S.A. shares for Executive Directors, 5 members of Senior Management and 419 Group management staff. This scheme expired in March 2017, and no bank shares were given as the exercise price of the option was of 2.015 euros. The Group has three long-term share-based complementary incentive schemes currently in effect, the ICLP 2016, approved on 31 March 2016, the ICLP 2017, approved on 30 March 2017 and the ICLP 2018, approved on 19 April 2018.
- At the Annual General Meeting held on 31 March 2016, the shareholders approved a long-term complementary incentive based on the increase in value of Banco de Sabadell, S.A. shares for 3 Executive Directors, 7 members of Senior Management and 472 Group Management Staff (“ICLP 2016”). It consists of assigning a certain number of rights to the beneficiaries, including the right to receive the increase in value of the same number of Banco de Sabadell, S.A. shares over a period which began on 25 February 2016 and will end on the last day of the first twenty trading sessions of March 2019, using as a reference their share price, which shall be made effective by means of the delivery of the bank’s shares. A necessary condition for the rights coming into effect will be that the beneficiary exceed the minimum compliance (i.e. level of achievement) of the individual target called “Professional Effectiveness Appraisal ”(’Valoración de Eficacia Profesional’) set by the bank’s Remuneration Committee.
- At the Annual General Meeting held on 30 March 2017, the shareholders approved a long-term
complementary incentive based on the increase in value of Banco de Sabadell, S.A. shares for 3 Executive Directors, 7 members of Senior Management and 466 Group Management Staff (“ICLP 2017”). It consists of assigning a certain number of rights to the beneficiaries, including the right to receive the increase in value of the same number of Banco de Sabadell, S.A. shares over a period which began on 30 January 2017 and will end on the last day of the twenty trading sessions of March 2020, using as a reference their share price, which shall be made effective by means of the delivery of the bank’s shares. A necessary condition for the rights coming into effect will be that the beneficiary exceed the minimum compliance (i.e. level of achievement) of the individual target called “Professional Effectiveness Appraisal ”(‘Valoración de Eficacia Profesional’) set by the bank’s Remuneration Committee.
- At the Annual General Meeting held on 19 April 2018, the shareholders approved a long-term complementary incentive based on the increase in value of Banco de Sabadell, S.A. shares for Executive Directors, Senior Management and other management staff included in the Group’s Identified Staff (“ICLP 2018”). As at 31 December 2018, the beneficiaries of the Incentive are 4 Executive Directors, 8 Senior Management staff and 71 other management staff that form part of the Group's Identified Staff. It consists of assigning a specific number of rights to the beneficiaries of the ICLP 2018, which carry the right to receive the increase in value of the same number of shares of Banco de Sabadell, S.A., based on the share’s market price, while also being tied to the Bank’s attainment of certain multi-year indicators over a given period of time, to be paid 55% in the form of shares of Banco de Sabadell, S.A. and the remaining 45% in cash. The number of rights to be settled may be equal to or less than the number of vested rights in the first quarter of 2019, depending on the level to which Banco de Sabadell, Sociedad Anónima attains four indicators during the lifetime of the ICLP 2018. The period for evaluating compliance (i.e. achievement) will cover the years 2018, 2019 and 2020, for which targets are established for the following indicators and with the following weights: shareholder return (25%), for which the benchmark will be the share’s closing price, rounded to the third decimal place, in the first 20 sessions of 2018 and the first 20 sessions of 2021; liquidity coverage ratio (25%); CET1 capital (25%); and the bank’s return on risk-adjusted capital - RoRAC (25%). The last three indicators will be measured at the end of the multi-year period, taking the average of the last three months of the year 2020.
Their main characteristics are shown below:
Incentives Schemes in effect End date Exercise price Maximum number of riights affected
ICLP 2016 30/04/2019 1.494 30,000,000 ICLP 2017 30/03/2020 1.353 35,000,000 ICLP 2018 18/04/2022 1.841 21,000,000

357Statutory information
The fair value of services is calculated based on the fair value of pledged capital instruments, i.e. bank stock options, as indicated in Note 6, employing the Monte Carlo simulations valuation technique and the Black-Scholes valuation model. Movements in rights associated with the aforementioned schemes were as follows: Rights – ICLP 2016
BBalance as at 331 December 2016 228,495,000
Granted - Cancelled (1,606,666)
BBalance as at 31 December 2017 226,888,334
Granted - Cancelled (986,667)
BBalance as at 31 December 2018 225,901,667
Rights - ICLP 2017
BBalance as at 30 April 2017 335,000,000 Granted - Cancelled (3,770,004)
BBalance as at 31 December 2017 331,229,996
Granted - Cancelled (1,158,003)
BBalance as at 31 December 2018 330,071,993
Rights - ICLP 2018
BBalance at 30 April 2018 221,000,000
Granted - Cancelled (400,000)
BBalance as at 31 December 2018 220,600,000
TSB Banking Group employees have a complementary incentive linked to a target achievement plan between 2016 and 2020, and this remuneration is paid in Banco de Sabadell, S.A. shares and in cash. As regards the staff expenses associated with share-based incentives schemes (see Note 1.3.15), the counterpart for such expenses is recognised in equity in the case of rights settled using shares (see statement of equity – share-based payments), while those settled in cash are recognised in the “Other liabilities ”heading of the consolidated balance sheet. Thousand euro
22018 22017 Settled in Shares 3,004 17,784 Settled in Cash 49 -
TTotal 33,053 117,784

358 Banco Sabadell Annual report 2018
Other administrative expenses The composition of this item in the consolidated income statement for the years 2018 and 2017 was as follows: Thousand euro
22018 22017
Property, plant and equipment (230,744) (229,656) Information technology (439,292) (394,582) Communication (46,820) (43,477) Publicity (114,162) (106,706) Subcontracted administrative services (109,533) (95,436) Contributions and taxes (114,908) (106,889) Technical reports (32,089) (54,982) Security services and fund transfers (21,290) (26,107) Entertainment expenses and staff travel expenses (23,531) (20,111) Membership fees (31,181) (22,593) Other expenses (166,210) (48,873)
TTotal ((1,329,760) ((1,149,412)
FFees with Auditing Companies The fees received by PricewaterhouseCoopers Auditores, S.L. in 2018 for statutory auditing services and other audit-related services provided in Spain amounted to 1,839 and 659 thousand euros, respectively (1,920 and 321 thousand euros in 2017). Auditing services provided by other companies in the PwC network in relation to foreign branches and subsidiaries amounted to 4,649 thousand euros in 2018 (2,816 thousand euros in 2017). Fees received by other auditors in 2018 for auditing and other audit-related services provided in Spain amounted to 31 and 0 thousand euros, respectively (52 and 0 thousand euros in 2017). Fees for audit and other audit-related services for foreign branches and subsidiaries amounted to 17 and 21 thousand euros in 2018 (8 and 16 thousand euros in 2017). Fees received by other companies in the PwC network for tax advisory services and other services provided in 2018 amounted to 68 and 507 thousand euros. The amounts recognised for these services in 2017 amounted to 92 and 740 thousand euros, respectively. Other information As at 31 December 2018, non-recurring administrative expenses amounted to 230,506 thousand euros, including expenses associated with specific cost-cutting schemes and special projects associated with changes in the scope of consolidation and the post-migration incidents described in Note 2. The cost-to-income ratio as at 2018 year-end (staff and general expenses/gross income) stood at 58.29% (50.15% in 2017). Information about the Group's branches and offices is given below: Number of branches
2018 2017 Branches 2,457 2,473 Spain 1,865 1,880 Outside Spain 592 593

359Statutory information
NNote 34 – Impairment or (-) reversal of impairment on financial assets not measured at fair value through profit or loss and modification gains or (-) losses, net
The composition of this item of the consolidated income statement for the years ended 31 December 2018 and 2017 is as follows: Thousand euro
Note 2018 2017
Financial assets at fair value through other comprehensive income (2,472) (53,374) Debt securities 8 (2,472) (6,277) Other equity instruments - (47,097)
Financial assets at amortised cost 11 (753,620) (1,157,999) Debt securities 3,381 1,823 Loans and advances (757,001) (1,159,822)
Total (756,092) (1,211,373)
Note 35 – Impairment or (-) reversal of impairment of non-financial assets The breakdown of this heading in the consolidated balance sheets for the years ended 31 December 2018 and 2017 was as follows: Thousand euro
Note 2018 2017
Property, plant and equipment 15 907 (15,300) Investment properties 15 (61,335) (216,042) Goodwill and other intangible assets 16 (286) (2,601) Inventories 17 (339,934) (565,419)
Total (400,648) (799,362)
The total allowance for the impairment of investment properties in 2018 and 2017 was calculated based on Level 2 valuations (see Note 6). The fair value of impaired assets amounted to 602,004 and 1,746,296 thousand euros in 2018 and 2017, respectively. Of the total inventory impairment allowances for 2018 and 2017, 54,296 and 135,890 thousand euros were allocated based on Level 2 valuations, respectively, and 285,637 and 429,529 thousand euros based on Level 3 valuations, respectively. The fair value of impaired assets amounts to 730,494 and 1,963,363 thousand euros as at the end of 2018 and 2017.

360 Banco Sabadell Annual report 2018
NNote 36 – Gains or (-) losses on derecognition of non-financial assets, net The composition of this item of the consolidated income statement for the years ended 31 December 2018 and 2017 is as follows: Thousand euro
2018 2017
Property, plant and equipment (2,398) (3,726) Investment properties 32,172 (15,024) Intangible assets (1,027) - Interests (*) 5,826 418,067 Other capital instruments - - Other items - 1,588
Total 34,573 400,905 (*) See Note 2 and Schedule I – Companies no longer consolidated.
Note 37 – Gains or (-) losses on non-current assets and disposal groups classified as held for sale not qualifying as discontinued operations
The composition of this item of the consolidated income statement for the years ended 31 December 2018 and 2017 is as follows: Thousand euro
Note 2018 2017
Property, plant and equipment for own use and foreclosed (22,793) (155,636) Gains/losses on sales 49,506 56,955 Impairment/Reversal 13 (72,299) (212,591)
Investment properties (12,353) (409) Intangible assets 100 - Interests (*) (194) 16,646 Other capital instruments - - Other items 39 (48)
Total (35,201) (139,447) (*) See Schedule I – Companies no longer consolidated.
The impairment of non-current assets held for sale excludes income from the increase in fair value less sale costs. The total provision for the impairment of non-current assets held for sale in 2018 and 2017 was calculated based on Level 2 valuations (see Note 6). The fair value of impaired assets amounted to 3,449,290 and 1,769,557 thousand euros as at the end of 2018 and 2017.

361Statutory information
NNote 38 – Segment reporting Segmentation criteria This section gives information regarding earnings and other indicators of the Group’s business units. The criteria that Banco Sabadell Group uses to report on results for each segment are:
There are four separate geographies: Banking Business Spain, Asset Transformation, Banking Business United Kingdom and Other Geographies.
Each business is allocated 11% of the capital divided by its risk-weighted assets and the surplus of own funds is allocated to Banking Business Spain.
Banking Business United Kingdom includes TSB’s contribution to the Group. Other Geographies mostly comprises Mexico, foreign branches and representative offices. For the purpose of
comparison, changes have been calculated for investment, funds and the income statement, excluding Sabadell United Bank.
In terms of the other criteria applied, segment information is first structured with a breakdown by geography and then broken down based on the customers to which each segment is aimed. Segmentation by geography and business units As regards the basis of presentation and approach used, information for each business unit is based on the individual accounting records of each Group company, after all consolidation disposals and adjustments have been made, and on analytical accounting of income and expenses where particular business lines are allocated to one or more legal entities, which allows income and expenses to be allocated to each customer in line with the business to which they are assigned. Each business unit is treated as an independent business, therefore flows of income and expenses take place between businesses for the provision of services involving the distribution of products, services and systems. The final impact on the Group’s income statement is nil. Each business unit bears its own direct costs, on the basis of general and analytical accounting, as well as the indirect costs of corporate units. Capital is allocated in such a way that each business is assigned capital equivalent to the minimum regulatory capital requirements to cover its risk exposure. This regulatory minimum requirement depends on the body responsible for supervising each business.

362 Banco Sabadell Annual report 2018
Details of profit before tax and other key figures for each business unit for the years 2018 and 2017 are shown in the table below, along with a reconciliation of the totals shown in the table with those shown in the consolidated Group accounts: Million euro
22018
BBanking Business SSpain
RReal estate asset ttransformation
BBanking Business UUK (*)
OOther ggeographies
((**) TTotal Group
NNet interest income 22,445 ((28) 11,000 2259 33,675 Profit or loss on entities valued using the equity method and on dividends 62 - - 3 65
Net fees and commissions 1,202 1 85 47 1,335 Gains or (-) losses on financial assets and liabilities, net and exchange differences 193 5 18 10 225
Other operating income/expenses (359) 119 (60) 10 (290) GGross income 33,543 997 11,042 3328 55,010
Administrative and depreciation expenses (1,791) (140) (1,148) (195) (3,273)
OOperating income 11,752 ((43) ((106) 1133 11,737
Provisions and impairments (543) (520) (231) (27) (1,320) Gains or losses on asset derecognition and others 1 - 1 -
2 PProfit or loss before tax 11,211 ((563) ((335) 1107 4419
Corporation tax (253) 85 95 (11) (84)
PProfit or loss after tax 9957 ((478) ((240) 996 3335
Profit or loss attributed to minority interests 2 - - 5 7
TTotal profit or loss of reported Group segments 9955 ((478) ((240) 991 3328
ROE (earnings divided by average equity) 10.9% - - 9.% 2.6% Cost-to-income (administrative expenses divided by gross income) 44.4% - 101.6% 56.% 58.3%
NPL ratio 5.2% 33.5% 1.3% 0.3% 4.2% NPL coverage ratio (covering risks classified as Stage 3) 52.1% 83.4% 50.4% 292.9% 54.1%
Employees 15,847 1,073 8,353 908 26,181 Domestic and foreign branches 1,865 - 550 42 2,457
(*) Includes contribution to TSB’s consolidated balance sheet. Exchange rate applied to income statement: GBP 0.8945 (average).
(**) Mainly includes Mexico, overseas branches and representative offices. Exchange rate applied to income statement: GBP 0.8945, MXN 22.4921, USD 1.1450 and MAD 10.953 (average).
Million euro
22018
BBanking Business SSpain
RReal estate asset ttransformation
BBanking Business UUK (*)
OOther ggeographies
((**) TTotal Group
AAssets 1146,411 111,907 446,182 117,822 2222,322
Customer lending (net) excluding repos 96,234 1,332 33,929 10,896 142,391
Real estate exposure - 959 - - 959 LLiabilities 1138,029 110,791 444,596 116,789 2210,205
On-balance sheet customer funds 98,296 235 32,484 6,328 137,343 Wholesale Funding Capital Markets 19,833 - 1,688 - 21,520
AAllocated capital 88,382 11,116 11,586 11,033 112,117
OOff--bbalance sheet customer ffunds 442,976 335 -- 11,023 444,034 (*) Includes contribution to TSB’s consolidated balance sheet. Exchange rate applied to balance sheet: GBP 0.8873.
(**) Mainly includes Mexico, overseas branches and representative offices. Exchange rate applied to balance sheet: GBP 0.8873, MXN 22.6901, USD 1.1851 and MAD 10.8752.

363Statutory information
Million euro 22017
BBanking Business SSpain
RReal estate asset ttransformation
BBanking Business UUK (*)
OOther ggeographies
((**) TTotal Group
NNet interest income 22,528 ((52) 11,034 2293 33,802 Profit or loss on entities valued using the equity method and on dividends 313 (1) - 3 316
Net fees and commissions 1,076 2 96 50 1,223 Gains or (-) losses on financial assets and liabilities, net and exchange differences 541 (37) 110 9 623
Other operating income/expenses (332) 118 (16) 3 (227) GGross income 44,126 330 11,223 3358 55,737
Administrative and depreciation expenses (1,756) (163) (1,002) (205) (3,125)
OOperating income 22,370 ((133) 2221 1153 22,612
Provisions and impairments (867) (1,216) (89) (24) (2,196) Gains or losses on asset derecognition and others 384 41 7 1 432
PProfit or loss before tax 11,887 ((1,307) 1139 1130 8848
Corporation tax (321) 364 (49) (37) (43)
PProfit or loss after tax 11,566 ((943) 990 992 8805
Profit or loss attributed to minority interests - - - 4 4
TTotal profit or loss of Group segments 11,566 ((943) 990 888 8801
ROE (earnings divided by average equity) 17.8% - 5.8% 8.8% 6.1%
Cost-to-income (administrative expenses divided by gross income) 39.1% - 79.5% 54.5% 50.2%
NPL ratio 5.7% 32.2% 0.4% 0.9% 5.1% NPL coverage ratio (covering risks classified as Stage 3) 45.6% 49.9% 55.9% 113.0% 45.7%
Employees (***) 15,775 1,018 8,287 765 25,845 Domestic and foreign branches 1,880 - 551 42 2,473
(*) Includes contribution to TSB’s consolidated balance sheet. Exchange rate applied to income statement: GBP 0.875 (average).
(**) Mainly includes Mexico, overseas branches and representative offices. Exchange rate applied to income statement: GBP 0.875, MXN 21.303, USD 1.132 and MAD 11.597 (average).
(***) For the purpose of comparison with 2018, in 2017 113 Fonomed (call centre) employees need to be included.

364 Banco Sabadell Annual report 2018
Million euro
22017
BBanking Business SSpain
RReal estate asset ttransformation
BBanking Business UUK (*)
OOther ggeographies
((**) TTotal Group
AAssets 1142,521 115,384 448,145 115,298 2221,348
Customer lending (net) excluding repos 93,394 3,865 35,501 8,836 141,596
Real estate exposure - 3,372 - 23 3,395 LLiabilities 1133,370 113,728 446,597 114,431 2208,127
On-balance sheet customer funds 92,558 104 34,410 5,024 132,096
Wholesale Funding Capital Markets 20,168 - 1,920 - 22,088
AAllocated capital 99,151 11,656 11,548 8866 113,222
OOff--bbalance sheet customer funds 444,265 227 -- 11,033 445,325
(*) Includes contribution to TSB’s consolidated balance sheet. Exchange rate applied to balance sheet: GBP 0.887.
(**) Mainly includes Mexico, overseas branches and representative offices. Exchange rate applied to balance sheet: GBP 0.887, MXN 23.661, USD 1.199 and MAD 11.426.
Average total assets for the institution as a whole as at 31 December 2018 amounted to 217,168,348 thousand euros, compared with 214,356,229 thousand euros on the same date in the preceding year. The types of products and services from which ordinary income is derived are described below for each business unit: - Banking Business Spain includes the following customer-centric business units:
Commercial Banking offers both investment and savings products. In terms of investment, the sale of mortgage products, working capital and revolving credit is particularly noteworthy. In terms of savings, the main products are deposits (demand deposits and term deposits), mutual funds, savings insurance and pension plans.
Protection insurance products and payment services are also noteworthy, such as credit cards and the issues of transfers, amongst others.
Corporate Banking offers specialised lending services together with a comprehensive offering of solutions, from
transactional banking services to more complex and tailored solutions relating to financing and treasury, amongst others.
Markets and Private Banking offers and designs products and services with a high added-value with a view to
achieving a high rate of return for the customer, increasing and diversifying the customer base and ensuring the consistency of investment processes through an in-depth analysis and with high-quality management, while taking the customer relationship model towards a multichannel level.
- Asset Transformation: Comprehensively manages NPA risk and real estate exposures, and also sets out and implements the strategy of real estate investee companies. Almost all of the non-current assets held for sale not classed as financial assets or deferred tax assets are located in Spain and therefore pooled into this segment. - Banking business United Kingdom: The TSB franchise includes retail banking business conducted in the United Kingdom, which includes current and savings accounts, personal loans, credit cards and mortgages. - Other geographies: Other Geographies mostly comprises Mexico, foreign branches and representative offices that offer all types of banking and financial services of Corporate Banking, Private Banking and Commercial Banking.

365Statutory information
Ordinary income generated by each business unit for 2018 and 2017 is shown below: Thousand euro
CConsolidated
IIncome from ordinary activities PProfit oor loss before tax SSEGMENTS 22018 22017 22018 22017
Banking Business Spain 3,969,437 3,888,107 1,210,794 1,886,643 Asset Transformation 279,547 387,749 (563,076) (1,307,423) Banking Business UK 1,290,125 1,424,935 (335,415) 139,110 Other geographies 544,632 486,779 106,562 129,923
(-) Adjustments and disposals of ordinary income between segments
(226,400) (257,208) - -
TTotal 55,857,341 55,930,362 4418,865 8848,253
The table below shows the balance of net interest income and net fees and commissions income generated by each business unit as a percentage of the total for 2018 and 2017: %
22018
BBreakdown net interest income and net fees and commissions
CCustomer loans CCustomer deposits
IIncome from (*)
sservices
%% of average
bbalance %% of total yield %% of average
bbalance %% of total cost %% of total balance SSEGMENTS
Banking Business Spain 65.9% 59.9% 71.6% 26.0% 84.2% Asset Transformation 0.9% 0.8% 0.2% 0.1% 0.1% Banking Business UK 25.0% 28.1% 23.7% 46.5% 10.4% Other geographies 8.1% 11.2% 4.6% 27.5% 5.3%
TTotal 1100.0% 1100.0% 1100.0% 1100.0% 1100.0% (*) Percentage by segment of total fees and commissions.
%
22017 BBreakdown net interest income and net fees and commissions
CCustomer loans
CCustomer ddeposits IIncome from (*)
sservices
%% of average
bbalance %% of total yield %% of average bbalance %% of total cost %% of total balance
SSEGMENTS
Banking Business Spain 65.6% 58.6% 70.1% 31.5% 80.5% Asset Transformation 2.2% 2.1% 0.1% 0.1% 0.1% Banking Business UK 25.8% 29.3% 26.0% 50.7% 14.9% Other geographies 6.4% 10.0% 3.8% 17.7% 4.4%
TTotal 1100.0% 1100.0% 1100.0% 1100.0% 1100.0% (*) Percentage by segment of total fees and commissions.

366 Banco Sabadell Annual report 2018
Furthermore, the breakdown by geography of interest and similar income during 2018 and 2017 is shown below: Thousand euro
BBreakdown of interest income by geography GGeography IIndividual CConsolidated
22018 22017 22018 22017
National market 3,168,683 3,178,663 3,138,138 3,160,953 International market 256,764 193,642 1,723,805 1,678,680
European Union 73,096 61,232 1,281,538 1,294,590 Euro zone 22,420 19,165 22,420 19,165 Non Euro zone 50,676 42,067 1,259,118 1,275,425
Other 183,668 132,410 442,267 384,090 TTotal 33,425,447 33,372,305 44,861,943 44,839,633
The Directors ’Report (see section 2 therein) gives a more detailed assessment of each of these business units. NNote 39 – Tax situation (income tax relating to continuing operations) Consolidated tax group Banco de Sabadell, S.A. is the parent company of a consolidated tax group for corporation tax purposes, comprising all the Spanish companies in which Banco de Sabadell, S.A. holds an interest that meet the requirements of the Spanish Corporation Tax Law (see Schedule I). The remaining Spanish companies in the accounting group pay corporation tax on an individual basis. Companies in the accounting group that are not tax residents in Spain are taxed in accordance with the tax regulations applicable to them. Reconciliation The reconciliation of the difference between consolidated accounting results and income subject to corporation tax is as follows: Thousand euro
2018 2017
Profit or loss before tax 418,865 848,253 Increases in taxable income 982,757 1,218,295 From profits 982,757 1,218,295 From equity - - Decreases in taxable income (1,927,772) (1,942,380) From profits (1,286,215) (1,908,777) From equity (641,557) (33,603)
Taxable income (526,150) 124,168
Tax payable (30%) (157,845) 37,250
Deductions for double taxation, training and other (4,292) (15,363)
Tax payable (less tax credits) (162,137) 21,887
Due to timing differences (net) 247,407 15,330 Other adjustments (net) (1,635) 5,858
Tax expense or (--) income related to profit or loss from continuing ooperations 83,635 43,075
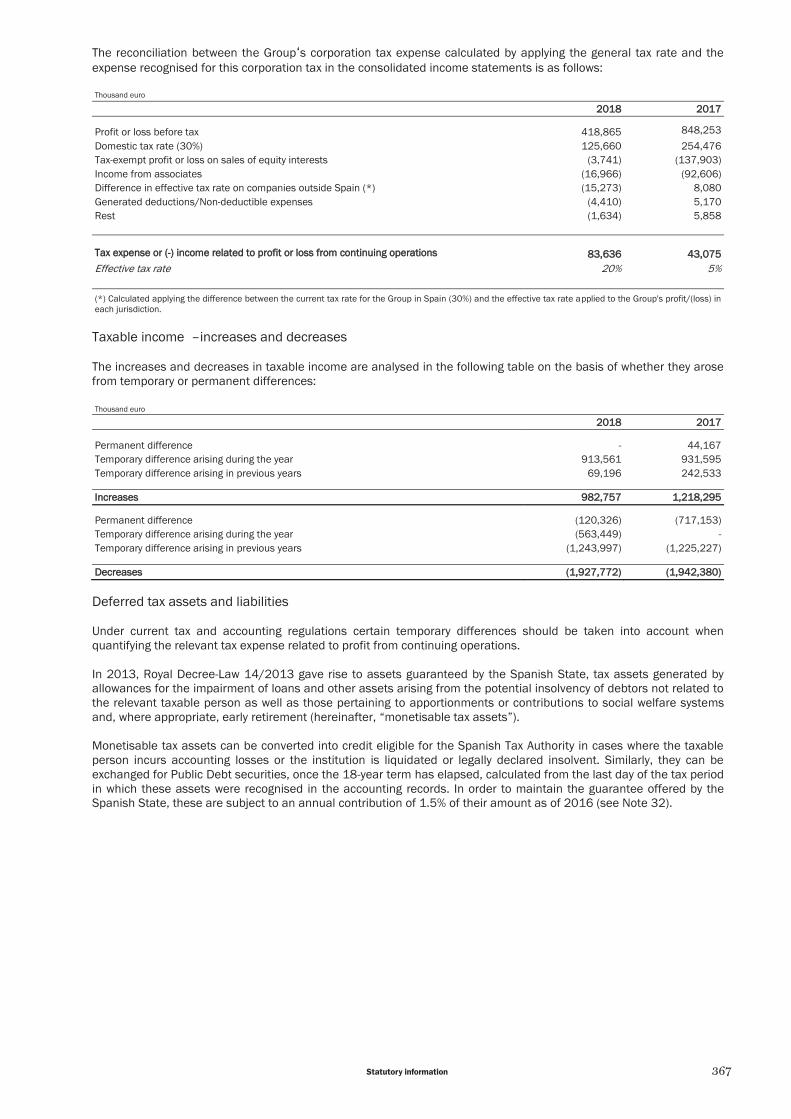
367Statutory information
The reconciliation between the Group‘s corporation tax expense calculated by applying the general tax rate and the expense recognised for this corporation tax in the consolidated income statements is as follows: Thousand euro
22018 22017
Profit or loss before tax 418,865 848,253 Domestic tax rate (30%) 125,660 254,476 Tax-exempt profit or loss on sales of equity interests (3,741) (137,903) Income from associates (16,966) (92,606) Difference in effective tax rate on companies outside Spain (*) (15,273) 8,080 Generated deductions/Non-deductible expenses (4,410) 5,170 Rest (1,634) 5,858
TTax expense or (--)) income related to profit or loss from continuing operations 883,636 443,075 Effective tax rate 20% 5%
(*) Calculated applying the difference between the current tax rate for the Group in Spain (30%) and the effective tax rate applied to the Group's profit/(loss) in each jurisdiction.
Taxable income – increases and decreases The increases and decreases in taxable income are analysed in the following table on the basis of whether they arose from temporary or permanent differences: Thousand euro
22018 22017
Permanent difference - 44,167 Temporary difference arising during the year 913,561 931,595 Temporary difference arising in previous years 69,196 242,533
IIncreases 9982,757 11,218,295
Permanent difference (120,326) (717,153) Temporary difference arising during the year (563,449) - Temporary difference arising in previous years (1,243,997) (1,225,227)
DDecreases ((1,927,772) ((1,942,380)
Deferred tax assets and liabilities Under current tax and accounting regulations certain temporary differences should be taken into account when quantifying the relevant tax expense related to profit from continuing operations. In 2013, Royal Decree-Law 14/2013 gave rise to assets guaranteed by the Spanish State, tax assets generated by allowances for the impairment of loans and other assets arising from the potential insolvency of debtors not related to the relevant taxable person as well as those pertaining to apportionments or contributions to social welfare systems and, where appropriate, early retirement (hereinafter, “monetisable tax assets”). Monetisable tax assets can be converted into credit eligible for the Spanish Tax Authority in cases where the taxable person incurs accounting losses or the institution is liquidated or legally declared insolvent. Similarly, they can be exchanged for Public Debt securities, once the 18-year term has elapsed, calculated from the last day of the tax period in which these assets were recognised in the accounting records. In order to maintain the guarantee offered by the Spanish State, these are subject to an annual contribution of 1.5% of their amount as of 2016 (see Note 32).

368 Banco Sabadell Annual report 2018
The sources of the deferred tax assets / liabilities recognised in the consolidated balance sheets as at 31 December 2018 and 2017 are as follows: Thousand euro
DDeferred tax assets 22018 22017
MMonetisable 55,185,285 55,336,979 Due to credit impairment 3,491,405 3,524,948 Due to real estate asset impairment 1,569,466 1,674,955 Due to pension funds 124,414 137,076
NNon--mmonetisable 11,025,949 8821,117
TTax credits for losses carried forward 3317,932 3350,927
DDeductions not applied 117,967 222,825
TTotal 66,547,133 66,531,848
DDeferred tax liabilities 22018 22018
Property restatements 65,449 67,865 Adjustments to value of wholesale debt issuances arising in business combinations 43,394 59,511 Other financial asset value adjustments 40,714 278,182 Other 17,673 19,898
TTotal 1167,230 4425,456
The increase in non-monetisable assets for 2018 is largely explained by the tax effect of the first application of IFRS 9, explained in Note 1. In Spain, pursuant to that set forth in Royal Decree 27/2018 of 29 December, any income or expenses directly recognised in reserves as a consequence of the first application of IFRS 9 and which give rise to tax effects in accordance with current regulations shall be included within the fiscal group’s taxable income for three years (starting in 2018). The breakdown by country of deferred tax assets and liabilities is as follows: Thousand euro
22018 22017
CCountry DDeferred tax assets DDeferred tax liabilities DDeferred tax assets DDeferred tax liabilities Spain 6,387,014 158,865 6,430,233 414,568 UK 123,433 8,365 78,182 9,449 US 59 - 1,491 1,439 Mexico 36,238 - 21,634 - Other 389 - 307 -
TTotal 66,547,133 1167,230 66,531,847 4425,456
As indicated in Note 1.3.20, according to the information available as at year-end, and the projections taken from the Group’s business plan for the coming years, the Group estimates that it will be able to generate sufficient taxable income to offset tax loss carry-forwards and non-monetisable tax assets when these can be deducted on the basis of current tax regulations, and that it will be able to generate this within a maximum of 8 years. Monetisable tax assets are guaranteed by the Spanish State, therefore their recoverability does not depend on the generation of future tax benefits. The Group has no material deferred tax assets that have not been recognised in the balance sheet.

369Statutory information
Years subject to tax inspections In July 2016, the Tax Authority notified Banco de Sabadell, S.A. of the beginning of verification and investigation activities relating to the items and periods broken down below, having signed the relevant assessments containing the tax regularisation proposals on 9 January 2019:
Currently, in relation to disputed tax assessments relating to Value Added Tax and Corporation Tax, the procedure is currently open for public comment, and no liabilities are expected to arise which could have a material impact on the Group’s results, as the actions taken by the Group are considered to have been lawful and the possibility of a significant contingency materialising is remote. Furthermore, the regularisation proposals included in the accepted tax assessments shall result in settlements at the end of the legal one-month period, if no express administrative proceeding is initiated. At the end of the procedure described above, it is considered likely that the net amount receivable for all items will be 10,140 thousand euros. The review of all taxes not verified and not legally required in accordance with tax regulations is still pending for other Group entities which are not taxed within the consolidated tax group in Spain. The main tax litigations in progress as at the end of the year are listed below:
- Appeal for judicial review before the Spanish National Court in relation to the rebuttal of the settlement of the disputed tax assessment for the VAT between 2008-2010 for an amount of tax due of 1,792 thousand euros.
- Appeal against decision of the regional tax appeal board of Catalonia (Tribunal Económico-Administrativo Regional de Cataluña) filed by BanSabadell Renting, S.L. against the disputed tax assessment regarding the VAT for 2014-2015 for an amount of tax due of 3,496 thousand euros.
- Appeals against the decision of the regional tax appeal board of Murcia (Tribunal Económico-Administrativo Regional de Murcia) filed by Sabadell Real Estate Development, S.L. relating to property transfer tax (impuesto de transferencia de propiedades) and stamp duty (actos jurídicos documentados) for an amount of tax due of 3,635 thousand euros.
The Group has, in any event, made suitable provisions for any contingencies that may arise in relation to these tax settlements. In relation to the remaining periods and tax items not legally required, due to potential interpretations in the banking industry, there could be certain contingent tax liabilities. However, the possibility of such liabilities materialising is remote, and if they did materialise the resulting tax charge would not be such as to have any significant impact on these consolidated annual financial statements.
Concept Period Assessment status
Withholding / Payment on account of work/Professional Remuneration
07/2012 to 12/2014 Accepted
Withholding / Payment on account of investment income 07/2012 to 12/2014 Accepted
Corporation Tax 01/2011 to 12/2014 Disputed
Value Added Tax 07/2012 to 12/2014 Accepted and Disputed

370 Banco Sabadell Annual report 2018
NNote 40 – Related party transactions There are no transactions with the company’s administrators or directors that could be considered significant. Those that did take place were in the normal course of the company’s business or were conducted at market prices or under the terms normally applicable to employees. The bank is not aware of any transactions carried out at non-market prices with any persons or companies related to the bank’s administrators or Senior Management staff. The most significant balances recognised by the Group in its dealings with related parties, and the effect on the income statement of related party transactions, are shown below: Thousand euro
2018 2017
Joint control or signif. influence (in B.Sab) Associates Key
personnel Other related
parties (*) TOTAL TOTAL
Assets: Customer lending and other financial assets
- 222,310 10,098 72,864 305,272 362,803
Liabilities: Customer deposits and other financial liabilities
- 491,166 8,597 165,205 664,968 826,693
Off--balance sheet exposures: Financial guarantees given - 20,537 - 3,689 24,226 35,780 Loan commitments given - 153 7,176 3,925 11,254 28,745 Other commitments given - 16,478 15 7,141 23,634 23,338
Income statement: Interest and similar income - 1,268 151 1,923 3,342 6,642 Interest and similar charges - (4,233) (14) (10) (4,257) (4,588) Return on capital instruments - - - - - - Net fees and commissions - 122,958 54 397 123,409 109,877 Other operating income - 7,202 - 27 7,229 9,879
(*) Includes employee pension schemes.
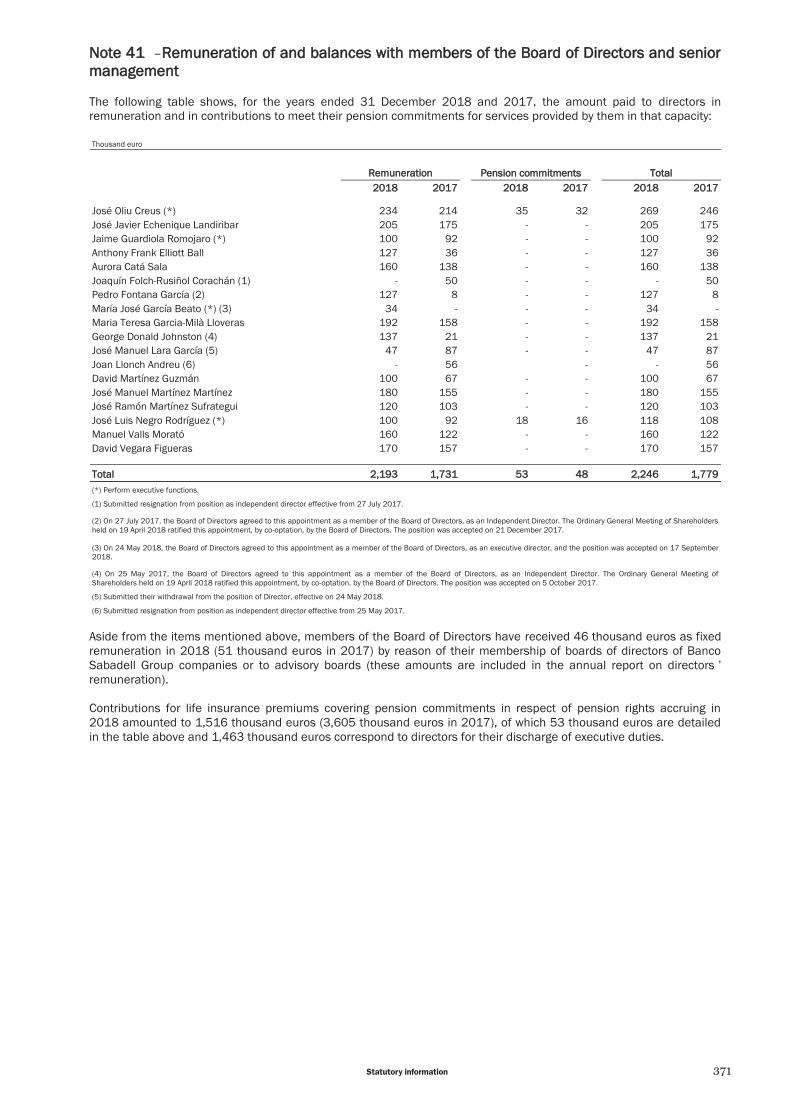
371Statutory information
NNote 41 – Remuneration of and balances with members of the Board of Directors and senior management The following table shows, for the years ended 31 December 2018 and 2017, the amount paid to directors in remuneration and in contributions to meet their pension commitments for services provided by them in that capacity: Thousand euro
Remuneration Pension commitments Total 2018 2017 2018 2017 2018 2017 José Oliu Creus (*) 234 214 35 32 269 246 José Javier Echenique Landiribar 205 175 - - 205 175 Jaime Guardiola Romojaro (*) 100 92 - - 100 92 Anthony Frank Elliott Ball 127 36 - - 127 36 Aurora Catá Sala 160 138 - - 160 138 Joaquín Folch-Rusiñol Corachán (1) - 50 - - - 50 Pedro Fontana García (2) 127 8 - - 127 8 María José García Beato (*) (3) 34 - - - 34 - Maria Teresa Garcia-Milà Lloveras 192 158 - - 192 158 George Donald Johnston (4) 137 21 - - 137 21 José Manuel Lara García (5) 47 87 - - 47 87 Joan Llonch Andreu (6) - 56 - - 56 David Martínez Guzmán 100 67 - - 100 67 José Manuel Martínez Martínez 180 155 - - 180 155 José Ramón Martínez Sufrategui 120 103 - - 120 103 José Luis Negro Rodríguez (*) 100 92 18 16 118 108 Manuel Valls Morató 160 122 - - 160 122 David Vegara Figueras 170 157 - - 170 157
Total 2,193 1,731 53 48 2,246 1,779 (*) Perform executive functions.
(1) Submitted resignation from position as independent director effective from 27 July 2017.
(2) On 27 July 2017, the Board of Directors agreed to this appointment as a member of the Board of Directors, as an Independent Director. The Ordinary General Meeting of Shareholders held on 19 April 2018 ratified this appointment, by co-optation, by the Board of Directors. The position was accepted on 21 December 2017.
(3) On 24 May 2018, the Board of Directors agreed to this appointment as a member of the Board of Directors, as an executive director, and the position was accepted on 17 September 2018.
(4) On 25 May 2017, the Board of Directors agreed to this appointment as a member of the Board of Directors, as an Independent Director. The Ordinary General Meeting of Shareholders held on 19 April 2018 ratified this appointment, by co-optation, by the Board of Directors. The position was accepted on 5 October 2017.
(5) Submitted their withdrawal from the position of Director, effective on 24 May 2018.
(6) Submitted resignation from position as independent director effective from 25 May 2017.
Aside from the items mentioned above, members of the Board of Directors have received 46 thousand euros as fixed remuneration in 2018 (51 thousand euros in 2017) by reason of their membership of boards of directors of Banco Sabadell Group companies or to advisory boards (these amounts are included in the annual report on directors ’remuneration). Contributions for life insurance premiums covering pension commitments in respect of pension rights accruing in 2018 amounted to 1,516 thousand euros (3,605 thousand euros in 2017), of which 53 thousand euros are detailed in the table above and 1,463 thousand euros correspond to directors for their discharge of executive duties.

372 Banco Sabadell Annual report 2018
Remuneration earned by Directors for discharging their executive duties during 2018 amounted to 4.224 thousand euros (6,980 thousand euros in 2017). Total risk transactions granted by the bank and consolidated companies to directors of the parent company amounted to 7,722 thousand euros as at 31 December 2018, of which 2,607 thousand euros corresponded to loans and receivables and 5,115 thousand euros related to guarantees and documentary credit (7,491 thousand euros in 2017, consisting of 5,231 thousand euros in loans and receivables and 2,260 thousand euros in guarantees and documentary credit). The average interest rate charged was 1.16% (0.71% in 2017). Liabilities balances amounted to 7,609 thousand euros in 2018 (6,966 thousand euros in 2017). Total Senior Management remuneration earned during 2018 amounted to 6,326 thousand euros. Pursuant to applicable regulations, this amount includes the remuneration of the Senior Management members plus the Internal Audit Officer. Risk transactions granted by the bank and consolidated companies to Senior Management staff (with the exception of those who are also executive directors, for whom details are provided above) amounted to 10,028 thousand euros as at 31 December 2018 (6,723 thousand euros in 2017), comprising 7,917 thousand euros in loans and receivables and 2,111 thousand euros in guarantees and documentary credit (in 2017, 5,760 thousand euros relate to loans and receivables and 963 thousand euros to guarantees and documentary credit). Liabilities balances amounted to 987 thousand euros (1,243 thousand euros in 2017). Stock appreciation rights conferred to members of Senior Management, including executive directors, under the 2018 remuneration incentive schemes (see Note 33) resulted in staff expenses of 2.0 million euros during the year (2.0 million euros in 2017). Details of existing agreements between the company and members of the Board and management staff with regard to severance pay are set out in the Group’s Annual Report on Corporate Governance, which forms part of the Directors ’Report. The directors and management staff mentioned above are specified below with their positions held in the bank as at 31 December 2018:
EExecutive Directors José Oliu Creus Chair Jaime Guardiola Romojaro CEO José Luis Negro Rodríguez Director - General Manager María José García Beato Director - General Secretary - Deputy Secretary to the Board
SSenior MManagement
Tomás Varela Muiña General Manager Miquel Montes Güell General Manager Carlos Ventura Santamans General Manager Rafael García Nauffal Deputy General Manager Ramón de la Riva Reina Deputy General Manager Enric Rovira Masachs Deputy General Manager Manuel Tresánchez Montaner Deputy General Manager José Nieto de la Cierva Deputy General Manager

373Statutory information
Other information relating to the Board Pursuant to Article 229 of the Capital Companies Act, in accordance with the wording set out in Law 31/2014 of 3 December, amending the Spanish Capital Companies Act in order to improve corporate governance, and in order to strengthen transparency in public limited companies, the directors have notified the company that, during 2018, they or persons related to them, as defined in Article 231 of the Spanish Capital Companies Act: a. Have not carried out transactions with the company, without taking into account usual operations, performed
under standard conditions for customers and whose significance is immaterial, understanding such operations to be those that do not need to be reported to give a true and fair view of the company’s equity, financial situation and income.
b. They have not used the name of the company or their position as administrator to unduly influence the
performance of personal transactions. c. They have not made use of corporate assets, including the company’s confidential information, for personal
purposes. d. They have not taken undue advantage of the company’s business opportunities. e. They have not obtained advantages or remuneration from third parties other than the company or group in
connection with the discharge of their duties, with the exception of acts of mere courtesy. f. They have not carried out activities on their own behalf or on behalf of a third party involving competition with the
company, whether on an isolated or potential basis, or which might otherwise place them in permanent conflict with the company’s interests.
The bank has entered into a liability insurance policy for 2018 that covers the bank’s administrators and senior officer positions. The total premium paid was 722 thousand euros (623 thousand euros in 2017). NNote 42 – Other information Transactions with significant shareholders No major transactions with significant shareholders have been carried out during 2018 and 2017. Information relating to the environment All operations of the Group as a whole are subject to legal requirements on environmental protection and health and safety in the workplace. The Group considers that it substantially complies with these laws and it has procedures in place which have been designed to foster and guarantee such compliance. The Group has adopted the corresponding measures relating to the protection and improvement of the environment and the minimisation of any environmental impacts of its activities, complying with the regulations in force in this regard. During 2018, the Group has continued to implement a number of Group-wide waste treatment, consumables recycling and energy saving schemes. It has not considered it necessary to recognise any provision for risks or expenses relating to the environment, as there are no contingencies related to the protection and improvement of the environment. For further details on the policies and activities adopted by the bank relating to the environment, see the non-financial disclosures report, which is included as part of the Directors ’Report. Customer Care Service The Customer Care Service is located on the control line of the organisational structure of Banco Sabadell Group and its leader, who is appointed by the Board of Directors, reports directly to the Compliance Division of the bank. Its functions are to handle and resolve complaints and claims brought forward by customers and users of the Group’s financial services, when these relate to their interests and legally recognised rights arising from contracts, transparency and customer protection regulations or good banking practices.

374 Banco Sabadell Annual report 2018
CCases handled During 2018, the Customer Care Service received 44,713 complaints and claims (76,505 in 2017), of which 32,849 (67,532 in 2017) were accepted for processing, in accordance with the provisions of Finance Ministry Order 734/2004 of 11 March. The number of cases handled, however, was 35,445 (65,964 in 2017) due to the resolution of issues pending from the previous year (2,596 cases, against 1,593 in 2018). By type, 5.9% were complaints (3.5% in 2017) and 94.1% were claims (96.5% in 2017). Of the total complaints and claims examined by the Customer Care Service, 40.6% resulted in a decision that was favourable to the customer or user (17.6% in 2017), in 0.1% of cases the customer withdrew the claim (0.1% in 2017) and 40.0% were resolved in favour of the institution (63.7% in 2017). As at 31 December 2018, 0.6% of cases had yet to be ruled on by the regulatory bodies and the Customer and Stakeholder Ombudsman. Lastly, the Customer Care Service declared itself not to be authorised to resolve 18.7% of the cases. In addition to its main activity, the Customer Care Service also provides assistance and information to customers and users on matters that do not take the form of complaints or claims, in accordance with Finance Ministry Order 734/2004 of 11 March, and the Regulations for the Protection of Customers and Users of Financial Services of Banco Sabadell Group. In this respect, the Service has handled 2,848 requests for assistance and information during 2018, compared to 1,917 in 2017. The average response time to complaints and claims was as follows: 12,090 cases were resolved within 15 days (14,308 cases in 2017), 18,575 cases were resolved between 15 and 30 days (15,962 cases in 2017) and 4,780 cases were resolved in a period of over 30 days (35,694 cases in 2017). The Finance Ministry Order and the company’s Regulations for the Protection of Customers and Users of Financial Services sets forth a maximum response period of two months. Ombudsman In the Group, the role of Customer Ombudsman is assumed by Mr José Luís Gómez-Dégano y Ceballos-Zúniga. The Ombudsman is responsible for resolving the complaints brought forward by the customers and users of Banco Sabadell Group, both in the first and second instances, and for settling issues that are passed on to him by the Customer Care Service. The Customer Ombudsman received 1,358 complaints and claims in 2018 (1,044 in 2017), of which 1,251 were accepted for processing. During the year, the Ombudsman has processed and resolved 1,252 claims (852 in 2017), as certain matters had remained unresolved from the previous year. As at 31 December 2018, 105 claims remained to be resolved by the Ombudsman (86 in 2017). In 18 cases, the Customer Care Service had yet to submit the corresponding complaints and claims. Of the total complaints and claims resolved by the Ombudsman, 19.5% were resolved in favour of the institution (24.2% in 2017) and 0.9% in favour of the customer (0.7% in 2017). Of the remaining cases processed and resolved, the bank acquiesced to customer requests in 39.1% of the cases (34.9% in 2017). In 40.3% of the cases (39.5% in 2017) the Ombudsman did not issue any judgements due to a lack of authority (without prejudice to the claimants ’option to pursue their claims elsewhere) and in 0.2% of the cases the customer withdrew the complaint (0.7% in 2017). Bank of Spain, the Spanish National Securities Market Commission and the General Board of Insurance and Pension Plans Under current legislation, customers and users can submit their claims and complaints to the Market Conduct and Complaints Department of the Bank of Spain, to the Spanish National Market Commission and to the General Board of Insurance and Pension Plans. In any event, it is a mandatory prerequisite that the parties concerned first address their complaints to the institution concerned in order to attempt to resolve the conflict. Note 43 – Subsequent events Since 31 December 2018, there have been no significant events worthy of mention.

375Statutory information
SSche
dule
I –
Banc
o Sa
bade
ll G
roup
com
pani
es

376 Banco Sabadell Annual report 2018

377Statutory information

378 Banco Sabadell Annual report 2018

379Statutory information
The
bala
nce
of to
tal o
rdin
ary
inco
me
from
ass
ocia
tes
cons
olid
ated
by
the
equi
ty m
etho
d an
d in
divi
dual
ly co
nsid
ered
to b
e no
n-m
ater
ial a
mou
nted
to
1,80
7,55
2 th
ousa
nd e
uros
as
at 3
1 D
ecem
ber
2018
. The
liab
ilitie
s ba
lanc
e as
at
the
end
of 2
018
tota
lled
1,77
9,92
2 th
ousa
nd e
uros
. See
the
key
fig
ures
as
at 2
018
year
-end
for B
anSa
bade
ll Vi
da in
Not
e 14
.

380 Banco Sabadell Annual report 2018
Chan
ges
in th
e G
roup
’s s
cope
of c
onso
lidat
ion
in 2
018
AAddi
tions
to th
e sc
ope
of c
onso
lidat
ion:

381Statutory information
EExcl
usio
ns fr
om th
e sc
ope
of c
onso
lidat
ion:

382 Banco Sabadell Annual report 2018

383Statutory information

384 Banco Sabadell Annual report 2018

385Statutory information

386 Banco Sabadell Annual report 2018

387Statutory information
Th
e ba
lanc
e of
tota
l ord
inar
y in
com
e fro
m a
ssoc
iate
s co
nsol
idat
ed b
y th
e eq
uity
met
hod
amou
nted
to 1
,776
,022
thou
sand
eur
os a
s at
31
Dec
embe
r 20
17. T
he li
abili
ties
bala
nce
of a
ssoc
iate
s as
at t
he e
nd o
f 201
7 to
talle
d 1,
795,
729
thou
sand
eur
os.

388 Banco Sabadell Annual report 2018
Chan
ges
in th
e G
roup
’s s
cope
of c
onso
lidat
ion
in 2
017
AAddi
tions
to th
e sc
ope
of c
onso
lidat
ion:

389Statutory information
EExcl
usio
ns fr
om th
e sc
ope
of c
onso
lidat
ion:
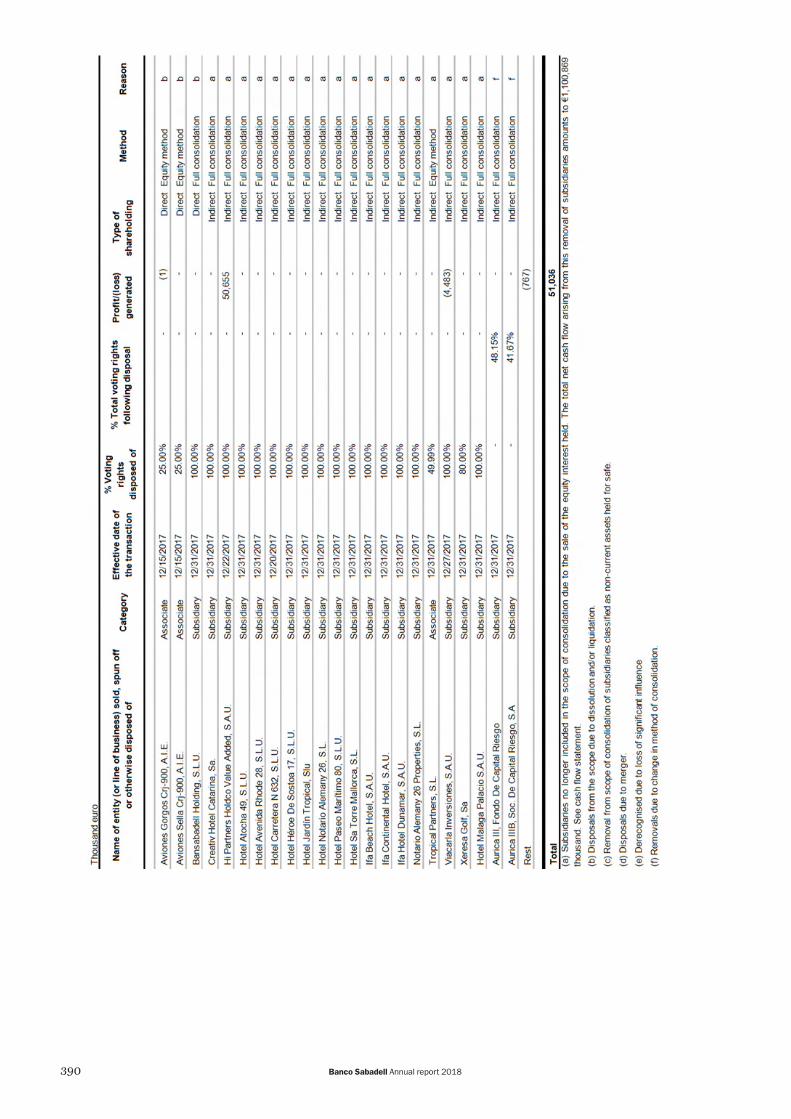
390 Banco Sabadell Annual report 2018

391Statutory information
SSchedule II - Structured entities - Securitisation funds Thousand euro
Year Securitisation funds fully retained on the balance sheet Entity
Total securitised assets as at 31/12/2018
2004 GC SABADELL 1, F.T.H Banc Sabadell 117,271 2005 TDA 23, F.T.A Banco Guipuzcoano 32,510 2005 TDA CAM 4 F.T.A Banco CAM 273,575 2005 TDA CAM 5 F.T.A Banco CAM 483,285 2006 TDA 26-MIXTO, F.T.A Banco Guipuzcoano 87,806 2006 TDA CAM 6 F.T.A Banco CAM 334,116 2006 FTPYME TDA CAM 4 F.T.A Banco CAM 136,181 2006 TDA CAM 7 F.T.A Banco CAM 510,076 2006 CAIXA PENEDES 1 TDA, FTA BMN- Penedés 230,842 2007 TDA 29, F.T.A Banco Guipuzcoano 107,519 2007 TDA CAM 8 F.T.A Banco CAM 494,406 2007 TDA CAM 9 F.T.A Banco CAM 471,038 2007 CAIXA PENEDES PYMES 1 TDA, FTA BMN- Penedés 53,176 2007 CAIXA PENEDES 2 TDA, FTA BMN- Penedés 185,425 2008 CAIXA PENEDES FTGENCAT 1 TDA, FTA BMN- Penedés 74,145 2009 GAT-ICO-FTVPO 1, F.T.H (CP) BMN- Penedés 8,273 2015 DUNCAN FUNDING 2015-1 PLC TSB 1,532,545 2016 DUNCAN FUNDING 2016-1 PLC TSB 2,667,406 2016 IM SABADELL PYME 10 Banc Sabadell 627,066 2017 TDA SABADELL RMBS 4, FT Banc Sabadell 5,451,534 2017 IM SABADELL PYME 11, FT Banc Sabadell 1,213,915
Total 15,092,110
Thousand euro
Year Securitisation funds fully dderecognised from the balance sheet Entity
Total securitised assets as at 31/12/2018
2001 TDA 14-MIXTO, F.T.A Banco Guipuzcoano 2,693 2001 TDA 14-MIXTO, F.T.A BMN- Penedés 15,776 2002 TDA 15-MIXTO, F.T.A Banco Guipuzcoano 7,962 2006 TDA 25, FTA (*) Banco Gallego 5,725 2010 FTPYMES 1 LIMITED Banco CAM 170,865
Total 203,021 (*) Securitisation fund in process of early liquidation.
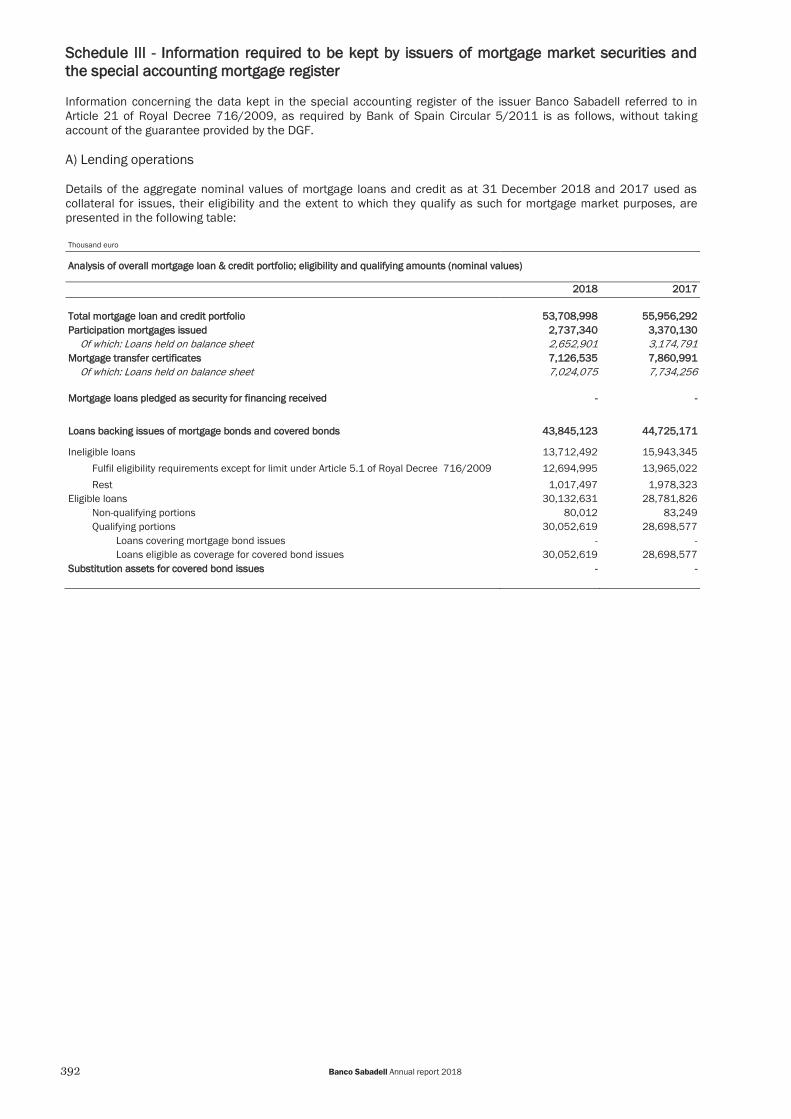
392 Banco Sabadell Annual report 2018
SSchedule III - Information required to be kept by issuers of mortgage market securities and the special accounting mortgage register Information concerning the data kept in the special accounting register of the issuer Banco Sabadell referred to in Article 21 of Royal Decree 716/2009, as required by Bank of Spain Circular 5/2011 is as follows, without taking account of the guarantee provided by the DGF. A) Lending operations Details of the aggregate nominal values of mortgage loans and credit as at 31 December 2018 and 2017 used as collateral for issues, their eligibility and the extent to which they qualify as such for mortgage market purposes, are presented in the following table: Thousand euro
Analysis of overall mortgage loan & credit portfolio; eligibility and qualifying amounts (nominal values)
2018 2017 Total mortgage loan and credit portfolio 53,708,998 55,956,292 Participation mortgages issued 2,737,340 3,370,130
Of which: Loans held on balance sheet 2,652,901 3,174,791 Mortgage transfer certificates 7,126,535 7,860,991
Of which: Loans held on balance sheet 7,024,075 7,734,256
Mortgage loans pledged as security for financing received - -
Loans backing issues of mortgage bonds and covered bonds 43,845,123 44,725,171
Ineligible loans 13,712,492 15,943,345 Fulfil eligibility requirements except for limit under Article 5.1 of Royal Decree 716/2009 12,694,995 13,965,022 Rest 1,017,497 1,978,323
Eligible loans 30,132,631 28,781,826 Non-qualifying portions 80,012 83,249 Qualifying portions 30,052,619 28,698,577
Loans covering mortgage bond issues - - Loans eligible as coverage for covered bond issues 30,052,619 28,698,577
Substitution assets for covered bond issues - -

393Statutory information
A breakdown of these nominal values according to different classifications is given below: Thousand euro
AAnalysis of total mortgage loan and credit portfolio backing mortgage market issues
22018 22017
TTotal OOf which: EEligible loans TTotal OOf which: Eligible
lloans
TTotal mortgage loan and credit portfolio 443,845,123 330,132,631 444,725,171 228,781,826
OOrigin of operations 443,845,123 330,132,631 444,725,171 228,781,826 Originated by the institution 43,165,526 29,696,214 43,999,139 28,398,509
Subrogated from other entities 312,754 257,131 237,588 180,011 Rest 366,843 179,286 488,444 203,306
CCurrency 443,845,123 330,132,631 444,725,171 228,781,826 Euro 43,758,869 30,083,348 44,619,869 28,702,376
Other currencies 86,254 49,283 105,302 79,450 PPayment sstatus 443,845,123 330,132,631 444,725,171 228,781,826 Satisfactory payment 39,344,180 28,875,322 38,240,207 27,002,079 Other situations 4,500,943 1,257,309 6,484,964 1,779,747
AAverage residual maturity 443,845,123 330,132,631 444,725,171 228,781,826 Up to 10 years 11,749,774 8,416,923 12,566,865 8,170,011 10 to 20 years 17,276,398 12,762,148 17,416,966 12,343,583 20 to 30 years 12,633,196 8,286,463 12,156,652 7,425,285 More than 30 years 2,185,755 667,097 2,584,688 842,947
IInterest rate 443,845,123 330,132,631 444,725,171 228,781,826 Fixed 12,871,219 9,796,935 10,240,956 7,418,574 Variable 30,973,904 20,335,696 34,484,215 21,363,252 Mixed - - - -
BBorrowers 443,845,123 330,132,631 444,725,171 228,781,826 Legal entities and individual entrepreneurs 14,750,289 8,641,999 16,428,024 8,882,296 Of which: Real estate developments 3,602,883 1,393,704 4,555,082 1,546,541 Other individuals and NPISHs 29,094,834 21,490,632 28,297,147 19,899,530
TType of guarantee 443,845,123 330,132,631 444,725,171 228,781,826 Assets /finished buildings 41,816,188 29,375,324 42,086,553 27,930,395 Residential 33,588,699 23,944,284 33,344,659 22,390,471
Of which: Subsidised housing 1,670,994 1,306,243 1,500,528 1,153,703 Commercial 8,038,216 5,298,139 8,559,381 5,421,465 Other 189,273 132,901 182,513 118,459 Assets/ buildings under construction 254,599 180,336 277,855 149,543 Residential 216,051 146,706 262,645 139,681
Of which: Subsidised housing 180 180 62 1 Commercial 37,945 33,027 14,247 8,899 Other 603 603 963 963 Land 1,774,336 576,971 2,360,763 701,888 Developed 738,779 121,329 1,210,598 220,792 Rest 1,035,557 455,642 1,150,165 481,096

394 Banco Sabadell Annual report 2018
The nominal values of available funds (i.e. undrawn commitments) within the total mortgage loans and credit portfolio were as follows: Thousand euro
UUndrawn balances (nominal value). Total mortgage loans and credit backing the issue of mortgage bonds and covered bonds
22018 22017 Potentially eligible 1,083,230 925,789 Ineligible 2,816,709 2,506,240
The breakdown of nominal values based on the loan-to-value (LTV) ratio measuring the risk based on the last available valuation of the mortgage loans and credit portfolio eligible for the issuance of mortgage bonds and covered bonds is given hereafter: Thousand euro
LLTV ratio by type of security. Eligible loans for the issue of mortgage bonds and covered bonds 22018 22017 SSecured on residential property 224,114,006 222,613,853 Of which LTV <= 40% 7,235,411 7,075,581 Of which LTV 40%-60% 8,690,528 8,353,242 Of which LTV 60%-80% 8,188,067 7,185,030 Of which LTV > 80% - -
SSecured on other property 66,018,625 66,167,973 Of which LTV <= 40% 3,568,263 3,754,551 Of which LTV 40%-60% 2,450,362 2,413,422 Of which LTV > 60% - -
Changes during 2018 and 2017 in the nominal values of mortgage loans that secure issues of mortgage bonds and covered bonds (eligible and non-eligible) are as follows: Thousand euro
CChanges in nominal values of mortgage loans EEligible IIneligible BBalance as at 31 December 2016 335,765,385 115,411,370
DDerecognised during the year ((13,588,188) ((7,315,145)
Terminations at maturity (2,593,920) (852,488) Early terminations (1,171,986) (803,018) Subrogations by other entities (13,996) (3,085) Derecognised due to securitisations (3,105,737) - Rest (6,702,549) (5,656,554)
AAdditions during the year 66,604,629 77,847,120
Originated by the institution 3,447,310 1,337,231 Subrogations by other entities 22,465 3,632 Rest 3,134,854 6,506,257
BBalance as at 31 December 2017 228,781,826 115,943,345

395Statutory information
B) Borrowing operations Information on issuances carried out and collateralised with Banco Sabadell’s mortgage loans and credit portfolio is provided in the following table, analysed by residual maturity and according to whether the sale was by public offering or otherwise: Thousand euro
NNominal value 22018 22017 CCovered bonds issued 222,353,833 220,727,543
Of which: Not reflected under liabilities on the balance sheet 10,727,900 7,913,800 DDebt securities. Issued through public offering 66,200,000 77,200,000 Time to maturity up to one year - 1,000,000 Time to maturity from one to two years 1,750,000 - Time to maturity from two to three years 1,350,000 1,750,000 Time to maturity from three to five years 1,000,000 1,350,000 Time to maturity from five to ten years 2,100,000 3,100,000 Time to maturity more than ten years - - DDebt ssecurities. Other issues 114,053,000 110,813,000 Time to maturity up to one year 3,150,000 150,000 Time to maturity from one to two years 5,380,000 3,150,000 Time to maturity from two to three years 3,000,000 4,380,000 Time to maturity from three to five years 783,000 1,445,000 Time to maturity from five to ten years 1,740,000 1,688,000 Time to maturity more than ten years - - DDeposits 22,100,833 22,714,543 Time to maturity up to one year 524,146 593,710 Time to maturity from one to two years 145,833 524,146 Time to maturity from two to three years 300,000 145,833 Time to maturity from three to five years 794,444 994,444 Time to maturity from five to ten years 336,410 436,410 Time to maturity more than ten years - 20,000
22018 22017
NNominal value
AAverage rresidual mmaturity NNominal value
AAverage rresidual mmaturity
(thousand euro) (years) (thousand euro) (years) MMortgage transfer certificates 77,126,535 223 77,860,991 223 Issued through public offering - - - - Other issues 7,126,535 23 7,860,991 23
PParticipation mortgages 22,737,340 113 33,370,130 113 Issued through public offering - - - - Other issues 2,737,340 13 3,370,130 13
Banco de Sabadell, S.A.'s overcollateralisation ratio (the nominal value of the full mortgage lending portfolio backing the issuance of covered bonds, divided by the nominal value of issued covered bonds) stood at 196% as at 31 December 2018 (216% as at 31 December 2017). As required by Royal Decree 716/2009, implementing certain aspects of Law 2/1981 of 25 March on the regulation of the mortgage market and other matters relating to mortgage lending, the Board of Directors represents that it is responsible for ensuring that the institution has a set of policies and procedures in place to assure compliance with mortgage market regulations. In line with these policies and procedures related to the Group's mortgage market activities, the Board of Directors is responsible for ensuring compliance with mortgage market regulations and for implementing the Group's risk management and control procedures (see Note 4.3 on financial risk management). In terms of credit risk, in particular, the Board of Directors confers powers and discretions to its Executive Committee, which then sub-delegates authority to the various decision-making levels. The internal procedures set up to handle the origination and monitoring of assets that make up the Group's lending and particularly those secured by mortgages, which back the Group's covered bond issues, are described in detail below for each type of loan applicant.

396 Banco Sabadell Annual report 2018
RRetail customers Loans to retail customers are approved and decided on using the credit scoring tools described in Note 4.4.1.2 on financial risk management. Where necessary, these tools are complemented with the work of a risk analyst, who carries out more in-depth studies of supplementary materials and reports. Furthermore, a series of other information and parameters are considered, such as the consistency of customers' applications and how well their requested products match their repayment possibilities; customers' ability to pay based on their current and future circumstances; the value of the property provided as security for the loan (as determined by an appraisal carried out by a valuation firm authorised by Bank of Spain and which the institution’s own internal approval processes will, additionally, have shown to be free of any association with the Group); the availability of any additional guarantees; examinations of internal and external databases of defaulters, etc. One aspect of the decision-making process involves establishing the maximum amount of the loan, based on the assessed value of the assets pledged as guarantees (hereinafter, loan-to-value, or LTV) as well as the purchase value, if that is the purpose of the loan. As a general rule, under internal Group policies the lower of the maximum LTV and the purchase value is applicable to purchases by individuals of properties for use as their primary residence and is fixed at 80%. This provides an upper limit below which a range of other maximum ratios of less than 80% are set, having regard to the purpose of the loan. A further step that must be taken before an application can be decided upon is to review all charges and liens associated with the property on which the loan is to be secured and also any insurance taken out to cover the security. Once a loan application has been approved, the mortgage must be registered with the Property Registry as part of the formalities for arranging the loan. Concerning approval discretions, the credit scoring tools are the main reference for determining the feasibility of the transaction. Where the loan being sought is above a certain amount, or where factors are present that are not readily captured by a credit scoring procedure, a risk analyst will be involved. The limit for each discretion is based on credit scores and the amount of the transaction/risk of the customer, with additional conditions being specified at each level to determine when special intervention is required. A list of exceptions has been drawn up, based on the particular circumstances of the borrower and the transaction, and these exceptions are covered in the Group's internal rules and procedures. As mentioned in Note 4.4.1.2 on financial risk management, the Group has a comprehensive monitoring system in place which uses early warning tools that enable the early detection of borrowers that could be predisposed to compliance issues. A key part of this process consists of well-established procedures to review and validate the guarantees given. Corporates unrelated to construction and/or real estate development Analyses and decisions concerning the approval of risks (lending and guarantees) are based on rating tools and "basic risk management teams", formed by one person from the business side and one from the risks side at different decision-making levels, both described in Note 4.4.1.2 on financial risk management. A range of other data and parameters are also taken into account, such as the consistency of the application, ability to pay and the nature of the security provided (as determined by an appraisal carried out by a Bank of Spain-authorised valuation firm which Banco Sabadell's own approval processes will, additionally, have shown to be free of any association with the Group) and considering any supplementary guarantees, the "fit" between the company's working capital and its total sales; the appropriateness of the total amount borrowed from the Group based on the business's capital strength, examinations of internal and external databases of defaulters, etc. Reviews of charges and liens associated with the security provided and the registration of mortgages with the Property Registry are also applicable in this case. Discretion figures are assigned based on the expected loss on the transaction/customer/risk group and the total risk of the customer or risk group. There are several levels at which decisions may be taken. In each such level there is a “basic management team", one member of which will be on the business side and one on the risk management side. All loan approvals must be the result of a joint decision. As with retail customers, a set of exceptional circumstances has been specified for borrowers and sectors, and these are provided for in the Group's internal procedures. As in the case of retail customers, transactions are monitored using early warning tools. There are also procedures to ensure that the securities and guarantees provided are constantly being reviewed and validated.

397Statutory information
CCorporates engaging in construction and/or real estate development Real estate assets and real estate developer loans are handled by the bank’s Asset Transformation and Industrial and Real Estate Investees division. This division is organisationally structured to focus on the specialised management of assets of this type based on knowledge of the situation and the evolution of the real estate market. Managing the risks in this portfolio is the responsibility of the bank’s Assets Risk Division, part of the Risk Management Division. Risk assessments are carried out by teams of specialised analysts who operate in conjunction with the Real Estate Investment Divisions to ensure that a risk management perspective is combined with a view based on direct contact with customers. Factors influencing the decision include the rating of both the developer and the project together with a series of other supplementary considerations such as the financial position and net worth of the developer, revenue and cash flow projections, any business plans relating to the project and, most particularly, an in-depth technical study of the project, carried out by the Real Estate Analysis unit. There is a scale of maximum LTV ratios defined internally by the Group based on the purpose of the financing, quality of the developer and an internal appraisal of the development. Decision-making powers and discretions are assigned according to the specific types of portfolios handled within this business segment, which may be related to new projects, sales, purchases or action plans. All these different circumstances are provided for in internal rules and procedures. Loans are subject to the kind of continuous monitoring that asset management necessarily implies. For completed developments, monitoring will focus on sales or rental figures; for developments under construction, the progress of the work. A system of continuous control is established to check that commitments are being adhered to and, as with non-real estate businesses, procedures are in place for the continuous review and validation of the guarantees provided. Other matters Banco Sabadell Group is an active participant in capital markets and has a number of funding programmes in operation (see Note 4.4.2.4). As one element of the Group’s funding strategy, Banco de Sabadell, S.A. is an issuer of covered bonds. Covered bond issues are backed by the bank’s portfolio of mortgage loans granted by the issuer that meet the eligibility criteria defined in Royal Decree 716/2009 regulating the mortgage market and other standards of the financial mortgages system in Spain. The Group has control procedures in place to monitor its entire portfolio of mortgage loans and credit (one of which involves maintaining special accounting records of all mortgage loans and credit – and any assets that replace them – used to back issues of covered bonds and mortgage bonds, as well as records of any associated financial derivatives). There are also procedures in place to verify that all loans and other assets meet the eligibility criteria for use as collateral in issues of covered bonds, and to ensure that bond issues are kept within their maximum limits at all times. These procedures are all regulated by current mortgage market regulations.

398 Banco Sabadell Annual report 2018
SSchedule IV - Information on issuers of public sector covered bonds and on the special accounting record of public sector covered bonds Details of the data from the special accounting record of public sector covered bonds of the issuing entity Banco Sabadell, referred to in the sole additional provision of Royal Decree 579/2014, required by Bank of Spain Circular 4/2015, are given below: A) Lending operations Details of the aggregate nominal values of loans and credit with general governments as at 31 December 2018 which are used as collateral for issuances, their eligibility and the extent to which they qualify as such for public sector covered bonds are presented in the following table: Thousand euro
2018
Total Residents in Spain
Residents in other countries of the Economic Area
Central governments 142,683 142,683 - Regional governments or governments in autonomous communities 1,436,589 1,436,589 - Local governments 1,036,998 1,036,998 - Social Security Trust Funds - - -
Total loans and credit portfolio 2,616,270 2,616,270 -
Thousand euro
2017
Total Residents in Spain
Residents in other countries of the Economic Area
Central governments 167,305 167,305 - Regional governments or governments in autonomous communities 1,182,839 1,182,839 - Local governments 557,573 557,573 - Social Security Trust Funds 44 44 -
Total loans and credit portfolio 1,907,761 1,907,761 -
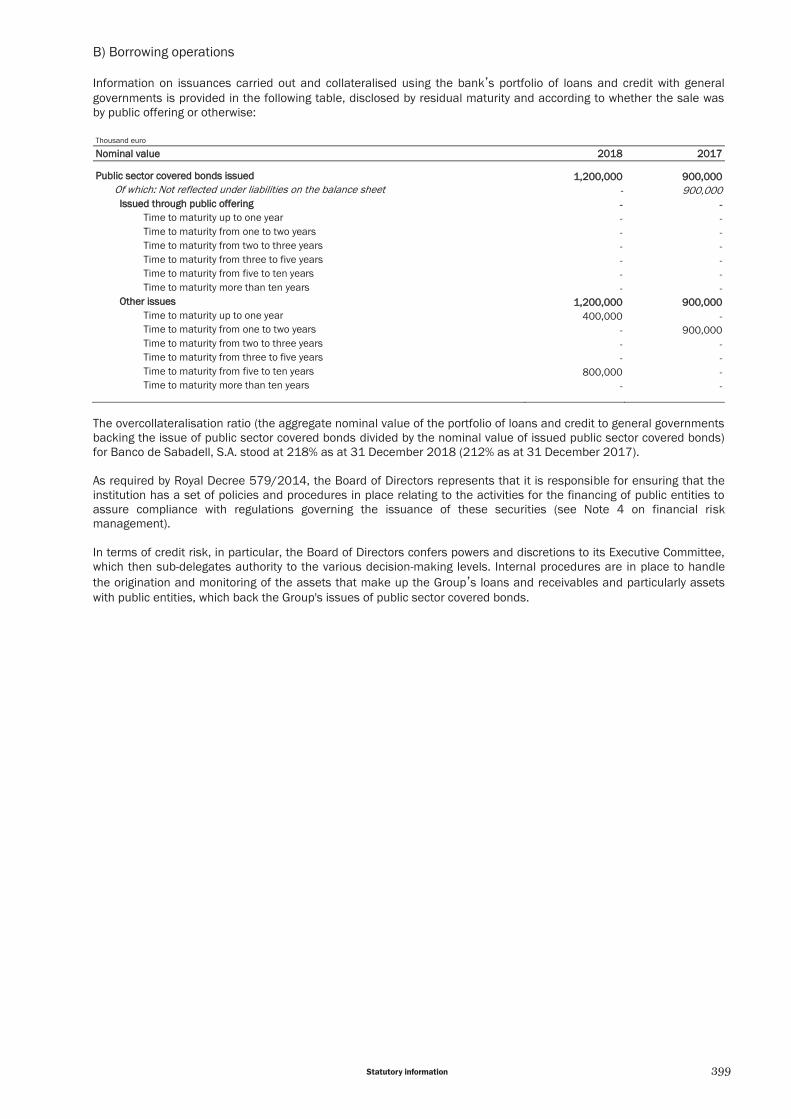
399Statutory information
B) Borrowing operations Information on issuances carried out and collateralised using the bank’s portfolio of loans and credit with general governments is provided in the following table, disclosed by residual maturity and according to whether the sale was by public offering or otherwise: Thousand euro
NNominal value 22018 22017 PPublic sector covered bonds issued 11,200,000 9900,000 Of which: Not reflected under liabilities on the balance sheet - 900,000
IIssued through public offering -- -- Time to maturity up to one year - - Time to maturity from one to two years - - Time to maturity from two to three years - - Time to maturity from three to five years - - Time to maturity from five to ten years - - Time to maturity more than ten years - -
OOther issues 11,200,000 9900,000 Time to maturity up to one year 400,000 - Time to maturity from one to two years - 900,000 Time to maturity from two to three years - - Time to maturity from three to five years - - Time to maturity from five to ten years 800,000 - Time to maturity more than ten years - -
The overcollateralisation ratio (the aggregate nominal value of the portfolio of loans and credit to general governments backing the issue of public sector covered bonds divided by the nominal value of issued public sector covered bonds) for Banco de Sabadell, S.A. stood at 218% as at 31 December 2018 (212% as at 31 December 2017). As required by Royal Decree 579/2014, the Board of Directors represents that it is responsible for ensuring that the institution has a set of policies and procedures in place relating to the activities for the financing of public entities to assure compliance with regulations governing the issuance of these securities (see Note 4 on financial risk management). In terms of credit risk, in particular, the Board of Directors confers powers and discretions to its Executive Committee, which then sub-delegates authority to the various decision-making levels. Internal procedures are in place to handle the origination and monitoring of the assets that make up the Group’s loans and receivables and particularly assets with public entities, which back the Group's issues of public sector covered bonds.
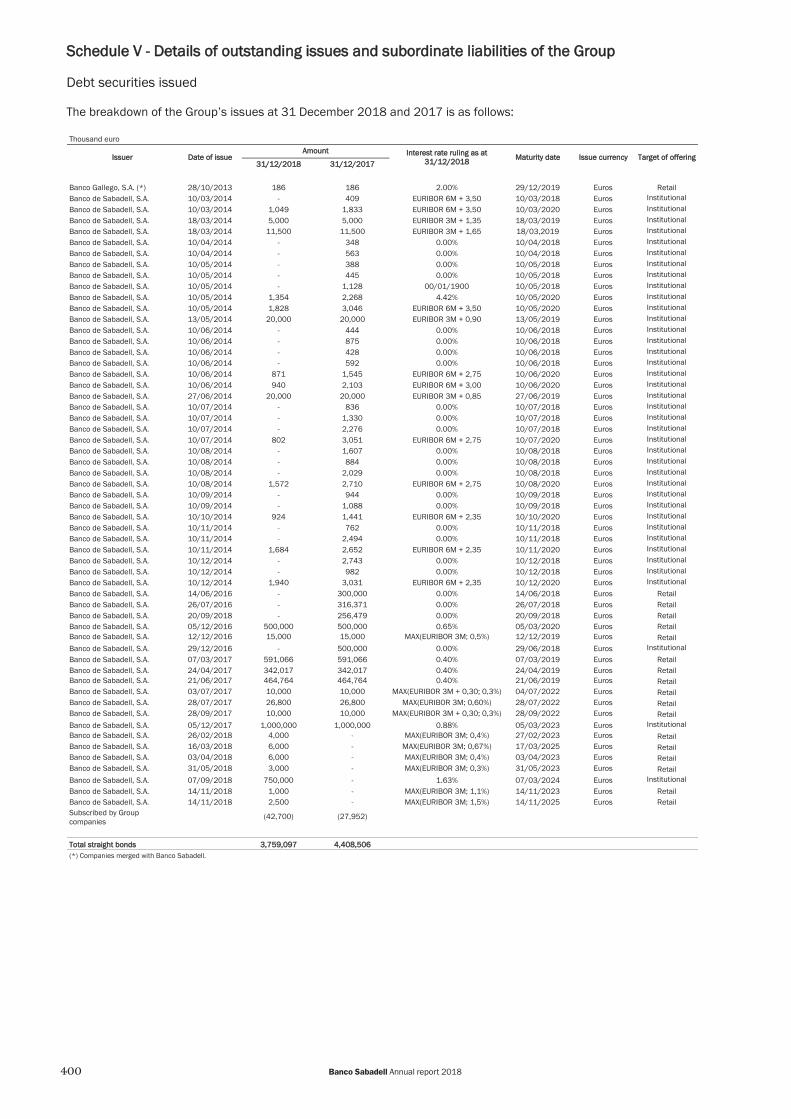
400 Banco Sabadell Annual report 2018
SSchedule V - Details of outstanding issues and subordinate liabilities of the Group Debt securities issued The breakdown of the Group’s issues at 31 December 2018 and 2017 is as follows: Thousand euro
Issuer Date of issue Amount Interest rate ruling as at
31/12/2018 Maturity date Issue currency Target of offering 31/12/2018 31/12/2017
Banco Gallego, S.A. (*) 28/10/2013 186 186 2.00% 29/12/2019 Euros Retail Banco de Sabadell, S.A. 10/03/2014 - 409 EURIBOR 6M + 3,50 10/03/2018 Euros Institutional Banco de Sabadell, S.A. 10/03/2014 1,049 1,833 EURIBOR 6M + 3,50 10/03/2020 Euros Institutional Banco de Sabadell, S.A. 18/03/2014 5,000 5,000 EURIBOR 3M + 1,35 18/03/2019 Euros Institutional Banco de Sabadell, S.A. 18/03/2014 11,500 11,500 EURIBOR 3M + 1,65 18/03,2019 Euros Institutional Banco de Sabadell, S.A. 10/04/2014 - 348 0.00% 10/04/2018 Euros Institutional Banco de Sabadell, S.A. 10/04/2014 - 563 0.00% 10/04/2018 Euros Institutional Banco de Sabadell, S.A. 10/05/2014 - 388 0.00% 10/05/2018 Euros Institutional Banco de Sabadell, S.A. 10/05/2014 - 445 0.00% 10/05/2018 Euros Institutional Banco de Sabadell, S.A. 10/05/2014 - 1,128 00/01/1900 10/05/2018 Euros Institutional Banco de Sabadell, S.A. 10/05/2014 1,354 2,268 4.42% 10/05/2020 Euros Institutional Banco de Sabadell, S.A. 10/05/2014 1,828 3,046 EURIBOR 6M + 3,50 10/05/2020 Euros Institutional Banco de Sabadell, S.A. 13/05/2014 20,000 20,000 EURIBOR 3M + 0,90 13/05/2019 Euros Institutional Banco de Sabadell, S.A. 10/06/2014 - 444 0.00% 10/06/2018 Euros Institutional Banco de Sabadell, S.A. 10/06/2014 - 875 0.00% 10/06/2018 Euros Institutional Banco de Sabadell, S.A. 10/06/2014 - 428 0.00% 10/06/2018 Euros Institutional Banco de Sabadell, S.A. 10/06/2014 - 592 0.00% 10/06/2018 Euros Institutional Banco de Sabadell, S.A. 10/06/2014 871 1,545 EURIBOR 6M + 2,75 10/06/2020 Euros Institutional Banco de Sabadell, S.A. 10/06/2014 940 2,103 EURIBOR 6M + 3,00 10/06/2020 Euros Institutional Banco de Sabadell, S.A. 27/06/2014 20,000 20,000 EURIBOR 3M + 0,85 27/06/2019 Euros Institutional Banco de Sabadell, S.A. 10/07/2014 - 836 0.00% 10/07/2018 Euros Institutional Banco de Sabadell, S.A. 10/07/2014 - 1,330 0.00% 10/07/2018 Euros Institutional Banco de Sabadell, S.A. 10/07/2014 - 2,276 0.00% 10/07/2018 Euros Institutional Banco de Sabadell, S.A. 10/07/2014 802 3,051 EURIBOR 6M + 2,75 10/07/2020 Euros Institutional Banco de Sabadell, S.A. 10/08/2014 - 1,607 0.00% 10/08/2018 Euros Institutional Banco de Sabadell, S.A. 10/08/2014 - 884 0.00% 10/08/2018 Euros Institutional Banco de Sabadell, S.A. 10/08/2014 - 2,029 0.00% 10/08/2018 Euros Institutional Banco de Sabadell, S.A. 10/08/2014 1,572 2,710 EURIBOR 6M + 2,75 10/08/2020 Euros Institutional Banco de Sabadell, S.A. 10/09/2014 - 944 0.00% 10/09/2018 Euros Institutional Banco de Sabadell, S.A. 10/09/2014 - 1,088 0.00% 10/09/2018 Euros Institutional Banco de Sabadell, S.A. 10/10/2014 924 1,441 EURIBOR 6M + 2,35 10/10/2020 Euros Institutional Banco de Sabadell, S.A. 10/11/2014 - 762 0.00% 10/11/2018 Euros Institutional Banco de Sabadell, S.A. 10/11/2014 - 2,494 0.00% 10/11/2018 Euros Institutional Banco de Sabadell, S.A. 10/11/2014 1,684 2,652 EURIBOR 6M + 2,35 10/11/2020 Euros Institutional Banco de Sabadell, S.A. 10/12/2014 - 2,743 0.00% 10/12/2018 Euros Institutional Banco de Sabadell, S.A. 10/12/2014 - 982 0.00% 10/12/2018 Euros Institutional Banco de Sabadell, S.A. 10/12/2014 1,940 3,031 EURIBOR 6M + 2,35 10/12/2020 Euros Institutional Banco de Sabadell, S.A. 14/06/2016 - 300,000 0.00% 14/06/2018 Euros Retail Banco de Sabadell, S.A. 26/07/2016 - 316,371 0.00% 26/07/2018 Euros Retail Banco de Sabadell, S.A. 20/09/2018 - 256,479 0.00% 20/09/2018 Euros Retail Banco de Sabadell, S.A. 05/12/2016 500,000 500,000 0.65% 05/03/2020 Euros Retail Banco de Sabadell, S.A. 12/12/2016 15,000 15,000 MAX(EURIBOR 3M; 0,5%) 12/12/2019 Euros Retail Banco de Sabadell, S.A. 29/12/2016 - 500,000 0.00% 29/06/2018 Euros Institutional Banco de Sabadell, S.A. 07/03/2017 591,066 591,066 0.40% 07/03/2019 Euros Retail Banco de Sabadell, S.A. 24/04/2017 342,017 342,017 0.40% 24/04/2019 Euros Retail Banco de Sabadell, S.A. 21/06/2017 464,764 464,764 0.40% 21/06/2019 Euros Retail Banco de Sabadell, S.A. 03/07/2017 10,000 10,000 MAX(EURIBOR 3M + 0,30; 0,3%) 04/07/2022 Euros Retail Banco de Sabadell, S.A. 28/07/2017 26,800 26,800 MAX(EURIBOR 3M; 0,60%) 28/07/2022 Euros Retail Banco de Sabadell, S.A. 28/09/2017 10,000 10,000 MAX(EURIBOR 3M + 0,30; 0,3%) 28/09/2022 Euros Retail Banco de Sabadell, S.A. 05/12/2017 1,000,000 1,000,000 0.88% 05/03/2023 Euros Institutional Banco de Sabadell, S.A. 26/02/2018 4,000 - MAX(EURIBOR 3M; 0,4%) 27/02/2023 Euros Retail Banco de Sabadell, S.A. 16/03/2018 6,000 - MAX(EURIBOR 3M; 0,67%) 17/03/2025 Euros Retail Banco de Sabadell, S.A. 03/04/2018 6,000 - MAX(EURIBOR 3M; 0,4%) 03/04/2023 Euros Retail Banco de Sabadell, S.A. 31/05/2018 3,000 - MAX(EURIBOR 3M; 0,3%) 31/05/2023 Euros Retail Banco de Sabadell, S.A. 07/09/2018 750,000 - 1.63% 07/03/2024 Euros Institutional Banco de Sabadell, S.A. 14/11/2018 1,000 - MAX(EURIBOR 3M; 1,1%) 14/11/2023 Euros Retail Banco de Sabadell, S.A. 14/11/2018 2,500 - MAX(EURIBOR 3M; 1,5%) 14/11/2025 Euros Retail Subscribed by Group companies
(42,700) (27,952)
Total straight bonds 3,759,097 4,408,506 (*) Companies merged with Banco Sabadell.

401Statutory information
En miles de euros
IIssuer DDate of issue AAmount IInterest rate ruling as at
331/12/2018 MMaturity date IIssue currency TTarget of ooffering 331/12/2018 331/12/2017
Banco Guipuzcoano, S.A. (*) 18/04/2007 25,000 25,000 1.70% 18/04/2022 Euros Institutional
CAM Global Finance, S.A.U. 04/06/2008 - 100,000 ref . underlying assets 04/06/2018 Euros Institutional
Banco de Sabadell, S.A. 25/07/2012 3,000 3,000 ref . underlying assets 25/07/2022 Euros Retail Banco de Sabadell, S.A. 20/12/2012 3,000 3,000 ref . underlying assets 20/12/2019 Euros Retail Banco de Sabadell, S.A. 16/05/2013 - 5,000 ref . underlying assets 16/05/2018 Euros Retail Banco de Sabadell, S.A. 27/05/2014 5,000 5,000 ref . underlying assets 27/05/2019 Euros Retail Banco de Sabadell, S.A. 14/07/2014 10,000 10,000 ref . underlying assets 15/07/2024 Euros Retail Banco de Sabadell, S.A. 14/07/2014 3,000 3,000 ref . underlying assets 14/07/2021 Euros Retail Banco de Sabadell, S.A. 16/07/2014 5,000 5,000 ref . underlying assets 16/07/2019 Euros Retail Banco de Sabadell, S.A. 24/07/2014 4,000 4,000 ref . underlying assets 24/07/2019 Euros Retail Banco de Sabadell, S.A. 03/02/2015 - 7,000 ref . underlying assets 03/02/2020 Euros Retail Banco de Sabadell, S.A. 15/04/2015 4,000 4,000 ref . underlying assets 15/04/2020 Euros Retail Banco de Sabadell, S.A. 15/04/2015 - 8,000 ref . underlying assets 15/04/2020 Euros Retail Banco de Sabadell, S.A. 06/07/2015 1,800 1,800 ref . underlying assets 06/07/2020 Euros Retail Banco de Sabadell, S.A. 24/07/2015 - 39,998 ref . underlying assets 24/07/2018 Euros Retail Banco de Sabadell, S.A. 12/02/2016 - 13,500 ref . underlying assets 12/02/2021 Euros Retail Banco de Sabadell, S.A. 15/03/2016 - 10,500 ref . underlying assets 15/03/2021 Euros Retail Banco de Sabadell, S.A. 01/04/2016 - 13,200 ref . underlying assets 01/04/2022 Euros Retail Banco de Sabadell, S.A. 01/04/2016 - 10,000 ref . underlying assets 01/04/2022 Euros Retail Banco de Sabadell, S.A. 13/05/2016 - 11,600 ref . underlying assets 13/05/2021 Euros Retail Banco de Sabadell, S.A. 01/06/2016 6,000 6,000 ref . underlying assets 03/06/2019 Euros Retail Banco de Sabadell, S.A. 17/06/2016 75,000 75,000 ref . underlying assets 17/06/2019 Euros Retail Banco de Sabadell, S.A. 21/06/2016 8,500 8,500 ref . underlying assets 21/06/2019 Euros Retail Banco de Sabadell, S.A. 23/06/2016 - 19,000 ref . underlying assets 23/06/2021 Euros Retail Banco de Sabadell, S.A. 30/11/2016 45,000 45,000 ref . underlying assets 30/11/2021 Euros Retail Banco de Sabadell, S.A. 05/11/2018 10,000 - ref . underlying assets 01/04/2025 Euros Retail Banco de Sabadell, S.A. 12/11/2018 13,200 - ref . underlying assets 01/04/2025 Euros Retail Subscribed by Group companies (1,286) (1,031)
TTotal structured bonds 2220,214 4435,067 (*) Companies merged with Banco Sabadell.
Thousand euro
IIssuer DDate of issue AAmount AAverage iinterest rate
MMaturity date IIssue ccurrency
TTarget of ooffering 331/12/2018 331/12/2017 331/12/2018 331/12/2017
Banco de Sabadell, S.A. ( London Office) (*) 18/12/2015 695,373 346,500 -0.07% 0.12% Multiple dates Euros Institutional
Banco de Sabadell, S.A. (**) 15/03/2018 5,111,812 5,075,495 0.04% 0.18% Multiple dates Euros Institutional
Subscribed by Group companies (2,530,849) (2,242,895)
TTotal commercial paper 33,276,336 33,179,100 (*) Commercial paper (ECP). (**) Prospectus for 7,000,000 thousand euros, eligible for extension up to 9,000,000 thousand euros, filed with the National Securities Market Commission .

402 Banco Sabadell Annual report 2018
Thousand euro
IIssuer DDate of issue AAmount IInterest rate ruling as at
331/12/2018 MMaturity ddate IIssue currency TTarget of offering 331/12/2018 331/12/2017
Banco de Sabadell, S.A. 08/05/2009 100,000 100,000 EURIBOR 3M + 1 08/05/2021 Euros Institutional
Banco de Sabadell, S.A. 18/09/2009 - 150,000 - 18/09/2018 Euros Institutional
Banco CAM, S.A. (*) 27/04/2010 30,000 30,000 4.600% 31/07/2020 Euros Institutional
Banco de Sabadell, S.A. 10/12/2010 150,000 150,000 EURIBOR 3M + 2.35 10/12/2020 Euros Institutional
Banco de Sabadell, S.A. 11/01/2011 100,000 100,000 EURIBOR 3M + 2.60 11/01/2019 Euros Institutional
Banco Guipuzcoano, S.A. (*) 19/01/2011 100,000 100,000 EURIBOR 3M + 2.75 19/01/2019 Euros Institutional
Banco de Sabadell, S.A. 07/06/2011 200,000 200,000 EURIBOR 3M + 2.25 07/06/2019 Euros Institutional
Banco de Sabadell, S.A. 13/07/2011 50,000 50,000 EURIBOR 3M + 2.60 13/07/2021 Euros Institutional
Banco de Sabadell, S.A. 12/12/2011 150,000 150,000 EURIBOR 3M + 3.10 12/12/2021 Euros Institutional
Banco de Sabadell, S.A. 05/10/2012 95,000 95,000 EURIBOR 3M + 4.80 05/10/2022 Euros Institutional
Banco de Sabadell, S.A. 28/12/2012 200,000 200,000 EURIBOR 3M + 4.15 28/12/2020 Euros Institutional
Banco de Sabadell, S.A. 23/01/2013 - 1,000,000 - 23/01/2018 Euros Institutional
Banco de Sabadell, S.A. 09/12/2013 200,000 200,000 EURIBOR 3M+ 1.60 09/12/2021 Euros Institutional
Banco de Sabadell, S.A. 26/09/2014 250,000 250,000 EURIBOR 3M + 0.70 26/09/2022 Euros Institutional
Banco de Sabadell, S.A. 03/10/2014 38,000 38,000 EURIBOR 3M + 0.68 03/10/2023 Euros Institutional
Banco de Sabadell, S.A. 12/11/2014 1,350,000 1,350,000 0.88% 12/11/2021 Euros Institutional
Banco de Sabadell, S.A. 05/12/2014 100,000 100,000 EURIBOR 3 M + 0.40 05/12/2022 Euros Institutional
Banco de Sabadell, S.A. 29/01/2015 1,250,000 1,250,000 EURIBOR 12 M + 0.232 29/01/2019 Euros Institutional
Banco de Sabadell, S.A. 23/04/2015 1,500,000 1,500,000 EURIBOR 12 M + 0.08 23/04/2019 Euros Institutional
Banco de Sabadell, S.A. 04/05/2015 250,000 250,000 EURIBOR 3 M + 0.13 04/05/2023 Euros Institutional
Banco de Sabadell, S.A. 10/06/2015 750,000 750,000 0.38% 10/06/2020 Euros Institutional
Banco de Sabadell, S.A. 18/06/2015 1,500,000 1,500,000 EURIBOR 12 M + 0.05 18/06/2020 Euros Institutional
Banco de Sabadell, S.A. 03/07/2015 50,000 50,000 EURIBOR 3 M + 0.20 03/07/2023 Euros Institutional
Banco de Sabadell, S.A. 20/07/2015 1,500,000 1,500,000 EURIBOR 12 M + 0.05 20/07/2020 Euros Institutional
Banco de Sabadell, S.A. 16/09/2015 1,000,000 1,000,000 EURIBOR 12 M + 0.07 16/09/2020 Euros Institutional
Banco de Sabadell, S.A. 03/11/2015 1,000,000 1,000,000 0.00625 03/11/2020 Euros Institutional
Banco de Sabadell, S.A. 26/01/2016 550,000 550,000 EURIBOR 3M + 0.80 26/01/2024 Euros Institutional
Banco de Sabadell, S.A. 24/05/2016 50,000 50,000 EURIBOR 3M + 0.535 24/05/2024 Euros Institutional
Banco de Sabadell, S.A. 10/06/2016 1,000,000 1,000,000 0.625% 10/06/2024 Euros Institutional
Banco de Sabadell, S.A. 20/10/2016 1,000,000 1,000,000 0.13% 20/10/2023 Euros Institutional
Banco de Sabadell, S.A. 21/12/2016 500,000 500,000 EURIBOR 12M + 0.27 21/12/2021 Euros Institutional
Banco de Sabadell, S.A. 29/12/2016 250,000 250,000 0.00969 27/12/2024 Euros Institutional
Banco de Sabadell, S.A. 26/04/2017 1,100,000 1,100,000 1.00% 26/04/2027 Euros Institutional
Banco de Sabadell, S.A. 21/07/2017 500,000 500,000 0.89% 21/07/2025 Euros Institutional
Banco de Sabadell, S.A. 18/12/2018 1,000,000 - EURIBOR 12M + 0.027 18/09/2020 Euros Institutional
Banco de Sabadell, S.A. 18/12/2018 1,000,000 - EURIBOR 12M + 0.085 18/06/2021 Euros Institutional
Banco de Sabadell, S.A. 18/12/2018 1,000,000 - EURIBOR 12M + 0.086 18/07/2021 Euros Institutional
Banco de Sabadell, S.A. 21/12/2018 390,000 - 1.086% 21/12/2026 Euros Institutional
Subscribed by Group companies (10,727,900) (7,913,800)
TTotal covered bonds 99,525,100 110,099,200
(*) Companies merged with Banco Sabadell.
Thousand euro
DDate of issue
AAmount IInterest rate ruling as at
331/12/2018 MMaturity date IIssue ccurrency TTarget of offering IIssuer 331/12/2018 331/12/2017 Banco de Sabadell, S.A. 23/04/2015 - 500,000 EURIBOR 12M + 0.13 23/04/2019 Euros Institutional
Banco de Sabadell, S.A. 16/12/2015 400,000 400,000 EURIBOR 12M + 0.33 16/12/2019 Euros Institutional
Banco de Sabadell, S.A. 18/12/2018 800,000 - EURIBOR 12M + 0.242 18/12/2024 Euros Institutional
Subscribed by Group companies (1,200,000) (900,000)
TTotal public sector covered bonds -- --
Thousand euro
DDate of issue
AAmount IInterest rate ruling as at
331/12/2018 MMaturity date IIssue currency TTarget of offering IIssuer 331/12/2018 331/12/2017
TSB Banking Group Plc 07/12/2017 558,953 563,552 LIBOR 3M + 0.24 07/12/2022 Pound sterling
Institutional
Subscribed by Group companies - -
TTotal Covered Bonds 5558,953 5563,552
(*) Companies merged with Banco Sabadell.

403Statutory information
Securitisations The following table shows the bonds issued by asset securitisation funds outstanding as at 31 December 2018 and 2017, respectively: Thousand euro
IIssue OOutstanding balance of lliabilities
YYear TType of assets securitised QQuotation NNumber of ssecurities AAmount 22018 22017 YYield
2004 TDA CAM 3,FTA (C) (*) RMBS 12,000 1,200,000 - 92,354 EURIBOR 3M + (between 0.23% and 0.70%)
2004 GC SABADELL 1, F.T.H. (A) RMBS 12,000 1,200,000 80,501 101,069 EURIBOR 3M + (between 0.06% and 0.78%)
2005 TDA CAM 4,FTA (A) RMBS 20,000 2,000,000 167,845 208,778 EURIBOR 3M + (between 0.09% and 0.24%)
2005 TDA CAM 5,FTA (A) RMBS 20,000 2,000,000 194,632 222,355 EURIBOR 3M + (between 0.12% and 0.35%)
2005 TDA 23, FTA (A) RMBS 8,557 289,500 - - EURIBOR 3M + (between 0.09% and 0.75%)
2006 TDA CAM 6 F.T.A (A) RMBS 13,000 1,300,000 132,076 150,333 EURIBOR 3M + (between 0.13% and 0.27%)
2006 TDA CAM 7 F.T.A (A) RMBS 15,000 1,500,000 157,718 178,462 EURIBOR 3M + (between 0.14% and 0.30%)
2006 CAIXA PENEDES 1 TDA, FTA (A) RMBS 10,000 1,000,000 61,021 71,738 EURIBOR 3M + (between 0.14% and 0.55%)
2006 TDA 26-MIXTO, FTA (A) RMBS 6,783 435,500 - - EURIBOR 3M + (between 0.14% and 3.50%)
2006 FTPYME TDA CAM 4 F.T.A (A) PYMES 11,918 1,191,800 61,996 79,910 EURIBOR 3M + (between 0.02% and 4%)
2007 TDA CAM 8 F.T.A (A) RMBS 17,128 1,712,800 129,892 166,212 EURIBOR 3M + (between 0.13% and 3.50%)
2007 CAIXA PENEDES PYMES 1 TDA, FTA (A) PYMES 7,900 790,000 300 300 EURIBOR 3M + (between 0.19% and 0.80%)
2007 TDA CAM 9 F.T.A (A) RMBS 15,150 1,515,000 175,861 197,550 EURIBOR 3M + (between 0.12% and 3.50%)
2007 TDA 29, FTA (A) RMBS 8,128 452,173 - - EURIBOR 3M + (between 0.20% and 3.50%)
2007 CAIXA PENEDES 2 TDA, FTA (A) RMBS 7,500 750,000 - - EURIBOR 3M + (between 0.30% and 1.75%)
2008 CAIXA PENEDES FTGENCAT 1 TDA, FTA (A) PYMES 5,700 570,000 - - EURIBOR 3M + (between 0.35% and 1.75%)
2015 DUNCAN FUNDING 2015-1 PLC (B) (*) RMBS 20,912 2,940,691 468,627 527,817 EURIBOR 3M +0.48% and £ LIBOR 3M + (between 0% and 1.5%)
2016 DUNCAN FUNDING 2016-1 PLC (B) (*) RMBS 30,120 4,354,356 229,603 397,295 EURIBOR 3 M +0.40% and £ LIBOR 3 M + (between 0.77% and 2.5%)
2016 IM SABADELL PYME 10, F.T. (A) PYMES 17,500 1,750,000 - - EURIBOR 3M + (between 0.75% and 0.90%)
2017 TDA SABADELL RMBS4, F.T. (A) RMBS 60,000 6,000,000 - - EURIBOR 3M + (between 0.50% and 0.65%)
2017 IM SABADELL PYME 11, F.T. (A) PYMES 19,000 1,900,000 387,881 150,000 EURIBOR 3M + (between 0.75% and 0.90%)
TTotal 22,247,953 22,544,173
(*) TSB securitisation funds in effect. The funds held in Cape Funding 2014-1 PLC were drawn in full in November.
(A) Issues quoted on AIAF (Spanish Brokers' Association) fixed income market.
(B) Issues quoted on the LSE market.
(C) Securitisation funds liquidated during 2018.

404 Banco Sabadell Annual report 2018
Subordinated liabilities Subordinated liabilities issued by the Group as at 31 December 2018 and 2017 are as follows: Thousand euro
IIssuer DDate of issue AAmount IInterest rate ruling as
aat 31/12/2018 MMaturity / termination date IIssue currency TTarget of ooffering 331/12/2018 331/12/2017
Banco de Sabadell, S.A. 26/04/2010 424,600 424,600 6.250% 26/04/2020 Euros Institutional
TSB Banking Group Plc 01/05/2014 430,394 433,935 5.750% 06/05/2021 Pound sterling Institutional
Banco de Sabadell, S.A. 06/05/2016 500,000 500,000 5.625% 06/05/2026 Euros Institutional
Banco de Sabadell, S.A. (*) 12/12/2018 500,000 - 5.375% 12/12/2023 Euros Institutional
Subscribed by Group companies (18,650) (26,700)
TTotal subordinated bonds 11,836,344 11,331,835
(*) 10-year subordinated issuance. Reported as date of maturity/cancellation of the call option.
Thousand euro
IIssuer DDate of issue AAmount IInterest rate ruling as
aat 31/12/2018 MMaturity / termination date IIssue currency TTarget of ooffering 331/12/2018 331/12/2017
Banco de Sabadell, S.A. (*) 18/05/2017 750,000 750,000 6.500% 18/05/2022 Euros Institutional
Banco de Sabadell, S.A. (*) 23/11/2017 400,000 400,000 6.125% 23/11/2022 Euros Institutional
Subscribed by Group companies - -
TTotal preference shares 11,150,000 11,150,000
(*) Perpetual issuance. Reported as date of maturity/termination of first call option.
The issues included in subordinated liabilities, for the purposes of credit priority, are ranked below all of the Group’s unsecured creditors. For the purpose of complying with the requirements of IAS 7, the table below shows the reconciliation of liabilities derived from funding activities, identifying the components that have entailed their movements: Thousand euro TTotal subordinated liabilities as at 31 December 2017 22,481,835
New issuances (*) 500,000 Amortised (*) - Capitalisation - Exchange rate (3,541) Change in those subscribed by Group companies 8,050
TTotal subordinated liabilities as aat 31 December 2018 22,986,344 (*) See cash flow statement.

405Statutory information
SSchedule VI - Other risk information Credit risk exposure Loans and advances to customers broken down by activity and type of guarantee The breakdown of the heading “Loans and advances - Customers” by activity and guarantee, excluding advances not classed as loans, as at 31 December 2018 and 2017, respectively, is as follows:
In terms of risks with LTV >80%, these mainly correspond to transactions from acquired institutions or business operations in which, as a supplement to the valuation of the operation, a mortgage guarantee is available to cover that operation. Similarly, there are other additional reasons for approval, which mainly correspond to solvent borrowers with a proven payment capacity, as well as customers with a good profile who contribute guarantees (personal guarantees and/or pledges) which are additional to the mortgage guarantees already considered in the LTV ratio.

406 Banco Sabadell Annual report 2018
FForbearance The outstanding balance of forborne and restructured loans as at 31 December 2018 and 2017 is as follows:

407Statutory information
The values of the collateral received to ensure collection associated with forborne and restructured loans, broken down into collateral and other guarantees, as at 31 December 2018 and 2017 year-end, are as follows: Thousand euro
GGuarantees received 22018 22017 Value of collateral 2,970,068 3,884,087
Of which: securing non-performing loans 1,566,700 2,040,788 Value of other guarantees 461,294 650,696
Of which: securing non-performing loans 223,528 205,177 TTotal value of guarantees received 33,431,362 44,534,783

408 Banco Sabadell Annual report 2018
Detailed movements of the balance of forborne and restructured loans during 2018 and 2017 are as follows: Thousand euro
22018 22017 Opening balance 6,842,793 9,263,705
(+) Forbearance (refinancing and restructuring) in the period 1,158,444 1,179,598
Memorandum item: impact recognised on the income statement for the period 162,060 96,622
(-) Debt amortisations (1,272,884) (1,529,500)
(-) Foreclosures (159,046) (295,542)
(-) Derecognised from the balance sheet (reclassified as write-offs) (314,447) (161,109)
(+)/(-) Other changes (*) (980,726) (1,614,359) BBalance at the end of the year 55,274,134 66,842,793
(*) Includes transactions no longer classified as forborne (refinanced or restructured) transactions, as they meet the requirements for their reclassification from underperforming (Stage 2) to performing (Stage 1) (see Note 1.3.4).
The table below shows the value of transactions which, after forbearance, have been classified as non-performing exposures during 2018 and 2017: Thousand euro
22018 22017 GGeneral governments -- 3394
OOther legal entities and individual entrepreneurs 1183,345 2244,101
Of which: Lending for construction and real estate development 12,419 52,155
OOther natural persons 2250,686 2205,198 TTotal 4434,031 4449,693
The average probability of default on current forborne and restructured loans broken down by activity as at 31 December 2018 and 2017 is as follows: %
22018 22017
GGeneral governments (*) -- -- OOther legal entities and individual entrepreneurs 88 88
Of which: Lending for construction and real estate development 7 7
OOther natural ppersons 110 110 (*) Authorisation has not been granted for the use of internal models in the calculation of capital requirements.
Average probability of default calculated as at September 2018.
The PD of forborne exposures is the same as in December 2017.

409Statutory information
Concentration risk Geographical exposure Global The breakdown of risk concentration by activity and at global level as at 31 December 2018 and 2017 is as follows: Thousand euro
2018
TOTAL Spain Rest of European
Union Americas Rest of the world
Central banks and Credit institutions 32,994,694 16,025,194 15,610,804 1,040,379 318,317
General governments 35,006,761 23,278,571 10,544,893 1,084,237 99,060
Central governments 8,425,792 8,368,772 8 6 57,006 Rest 26,580,969 14,909,799 10,544,885 1,084,231 42,054
Other financial corporations and individual entrepreneurs
4,224,633 2,315,023 1,326,271 546,351 36,988
Non--financial corporations and individual entrepreneurs 60,687,187 48,152,718 4,327,533 7,530,599 676,337
Construction and real estate d l
3,519,279 3,203,245 32,231 199,746 84,057 Civil engineering construction 985,364 939,397 35,508 8,218 2,241 Other purposes 56,182,544 44,010,076 4,259,794 7,322,635 590,039
Large enterprises 25,240,548 14,585,539 3,425,975 6,863,018 366,016 SMEs and individual entrepreneurs 30,941,996 29,424,537 833,819 459,617 224,023
Rest of households 72,533,041 35,540,676 35,569,469 509,518 913,378
Home loans 62,803,725 28,247,027 33,202,053 491,900 862,745 For consumption 7,459,329 5,487,623 1,932,427 8,937 30,342 Other purposes 2,269,987 1,806,026 434,989 8,681 20,291
TOTAL 205,446,316 125,312,182 67,378,970 10,711,084 2,044,080
Thousand euro
2017
TOTAL Spain Rest of EEuropean
Union Americas Rest of the world
Central banks and Credit institutions 33,301,907 18,525,878 13,118,641 1,121,174 536,214
General governments 32,278,166 17,848,223 13,076,483 1,265,606 87,854
Central governments 26,641,501 12,574,456 13,076,483 932,383 58,179 Rest 5,636,665 5,273,767 - 333,223 29,675
Other financial corporations and individual entrepreneurs
5,809,643 4,875,460 463,407 419,712 51,064
Non--financial corporations and individual entrepreneurs
65,104,090 54,883,648 3,657,830 5,966,646 595,966
Construction and real estate d l
6,341,800 5,688,532 17,564 548,302 87,402 Civil engineering construction 1,592,291 1,567,467 14,798 7,762 2,264 Other purposes 57,169,999 47,627,649 3,625,468 5,410,582 506,300
Large enterprises 24,907,996 17,064,563 2,873,635 4,730,518 239,280 SMEs and individual entrepreneurs 32,262,003 30,563,086 751,833 680,064 267,020
Rest of households 74,328,108 35,872,277 36,993,336 468,275 994,220
Home loans 61,810,885 27,296,622 33,519,587 154,087 840,589 For consumption 9,142,390 6,511,751 2,482,036 9,656 138,947 Other purposes 3,374,833 2,063,904 991,713 304,532 14,684
TOTAL 210,821,914 132,005,486 67,309,697 9,241,413 2,265,318

410 Banco Sabadell Annual report 2018
By autonomous communities The risk concentration broken down by activity and at the level of Spanish autonomous communities as at 31 December 2018 and 31 December 2017, respectively, is as follows:

411Statutory information

412 Banco Sabadell Annual report 2018
SSovereign risk exposure The breakdown, by type of financial instrument, of the exposure to sovereign risk, applying the criteria required by the European Banking Authority (EBA), as at 31 December 2018 and 31 December 2017, is as follows:
Exposure to construction and real estate development sector Details of lending for construction and real estate development and the relevant allowances are as follows: The loans and credits shown have been classified in terms of their intended purpose, and not by the debtor’s statistical classification of economic activities in the European Community (NACE). This implies, for example, that if a debtor is: (a) a real estate company, but uses the financing for a purpose other than construction or real estate development, it is not included in this table; or (b) a company whose primary activity is not construction or real estate, but where the loan is used for the financing of properties intended for real estate development, it is included in the table: Million euro
2018
Gross carrying amount Excess value of the collateral Adjustments due to impairment (*)
Lending for construction and real eestate development (including land) (business in Spain) 3,493 898 380
Of which: non-performing 719 291 354 (*) Allowances for the exposure for which the bank retains the credit risk. Does not include allowances for exposures with transferred risk.

413Statutory information
Million euro
22017
GGross
ccarrying aamount
OOf which: AAPS (*)
EExcess value of tthe collateral
OOf which: AAPS (*)
AAdjustments due tto impairment
((***))
LLending for construction and real estate development ((including land) (business in SSpain) 55,694 11,855 11,809 8882 6660
Of which: non-performing 1,363 - 579 - 641 (*) Exposure for which, by applying the Asset Protection Scheme (see Note 2), the credit risk has been transferred. Corresponds to 80% of the total value of the exposure.
(**) Allowances for the exposure for which the bank retains the credit risk. Does not include allowances for exposures with transferred risk.
Million euro
GGross carrying amount MMemorandum item 22018 22017
Write-offs (*) 251 208
Million euro
AAmount AAmount MMemorandum item:: 22018 22017
Loans to customers, excluding General Governments (business in Spain) (carrying amount) 87,296 89,686
Total assets (total business) (carrying amount) 222,322 221,348
Allowances and provisions for exposures classed as Stage 2 or Stage 1 (total operations) 373 525
(*) Refers to lending for construction and real estate development reclassified as write-offs during the year.
The breakdown of lending for construction and real estate development for transactions registered by credit institutions (business in Spain) is as follows: Million euro
GGross carrying aamount 2018
GGross carrying amount 22017 OOf which: APS
NNot secured with real estate 6645 11,124 2286
SSecured wwith real estate 22,848 44,571 11,570
Buildings and other finished constructions 1,467 2,451 860 Housing 942 1,715 646 Rest 524 736 214
Buildings and other construction in progress 988 891 116 Housing 877 785 100 Rest 111 106 15
Land 393 1,229 594 Consolidated urban land 373 1,061 475 Other land 20 169 119
TTotal 33,493 55,694 11,855
The figures shown do not show the total value of guarantees received, but rather the net carrying value of the associated exposure.

414 Banco Sabadell Annual report 2018
Guarantees received associated with lending for construction and real estate development are shown hereafter, for both periods: Million euro
GGuarantees received 22018 22017 Value of collateral 2,584 3,638
Of which: securing Stage 3 loans 307 632 Value of other guarantees 208 1,245
Of which: securing Stage 3 loans 22 38 TTotal value of guarantees received 22,792 44,883
The breakdown of lending to households for house purchase for transactions recorded by credit institutions (business in Spain) is as follows: Million euro
22018
GGross carrying aamount
OOf which: non--pperforming
LLending for house purchase 332,461 11,481 Not secured with real estate 1,032 145 Secured with real estate 31,429 1,336
Million euro
22017
GGross carrying aamount OOf which: APS OOf which: non--
pperforming LLending for house purchase 332,609 6619 11,786 Not secured with real estate 1,147 42 234 Secured with real estate 31,462 577 1,552
The tables below show mortgage-secured lending to households for house purchase broken down by the loan to value of transactions recorded by credit institutions (business in Spain): Million euro
22018
GGross amount OOf which: non--pperforming
LLTV ranges 331,429 11,336 LTV <= 40% 6,091 112 40% < LTV <= 60% 7,757 171 60% < LTV <= 80% 8,056 241 80% < LTV <= 100% 4,342 279 LTV > 100% 5,183 533
Million euro
22017
GGross amount OOf which: APS OOf which: non--pperforming
LLTV ranges 331,462 5577 11,552 LTV <= 40% 5,613 48 116 40% < LTV <= 60% 7,491 106 192 60% < LTV <= 80% 7,944 123 301 80% < LTV <= 100% 4,718 106 324 LTV > 100% 5,696 194 619

415Statutory information
Lastly, the table below gives details of foreclosed assets of the consolidated group entities for transactions recorded by credit institutions within Spain: Million euro
22018
GGross carrying aamount AAllowances GGross amount (*) AAllowances (*)
RReal estate assets acquired through lending for construction aand real estate development 66,694 33,258 11,210 5582
Finished buildings 2,934 794 650 201 Housing 1,609 273 397 120 Rest 1,325 521 253 80 Buildings under construction 503 201 24 14 Housing 476 183 21 12 Rest 27 18 3 2 Land 3,257 2,263 536 368 Building land 1,062 638 142 82 Other land 2,195 1,625 394 286
RReal estate assets acquired through mortgage lending to hhouseholds for house purchase 22,028 3379 5515 1185
RRest of real estate assets foreclosed or received in lieu of debt -- -- -- --
CCapital instruments foreclosed or rreceived in lieu of debt 55 55 -- --
CCapital instruments of institutions holding assets foreclosed or rreceived in lieu of debt -- -- -- --
FFinancing to institutions holding assets foreclosed or received iin lieu of debt -- -- -- --
TTotal rreal estate portfolio 88,727 33,642 11,726 7767 (*) Non-performing real estate assets including properties outside the national territory, considering the provision allocated in the original loan and the credit risk transferred upon application of the APS.

416 Banco Sabadell Annual report 2018
Million euro
22017
GGross carrying aamount AAllowances GGross amount (*) AAllowances (*)
RReal estate assets acquired through lending for construction aand real estate development 77,319 33,309 55,479 33,127
Finished buildings 3,063 892 2,681 1,119 Housing 1,596 360 1,302 505 Rest 1,467 533 1,379 614 Buildings under construction 568 197 289 165 Housing 514 173 245 137 Rest 54 24 44 28 Land 3,688 2,221 2,509 1,843 Building land 1,332 692 832 603 Other land 2,356 1,529 1,677 1,240
RReal estate assets acquired through mortgage lending to hhouseholds for house purchase 11,961 5584 11,914 8872
RRest of real eestate assets foreclosed or received in lieu of debt -- -- -- --
CCapital instruments foreclosed or received in lieu of debt 55 55 -- --
CCapital instruments of institutions holding assets foreclosed or rreceived in lieu of debt -- -- -- --
FFinancing to institutions holding assets foreclosed or received iin lieu of debt -- -- -- --
TTotal real estate portfolio 99,285 33,898 77,393 33,999 (*) Non-performing real estate assets including properties outside the national territory, considering the provision allocated in the original loan and the credit risk transferred upon application of the APS.
Given that in July 2018 an agreement was reached to transfer practically all of the problematic real estate exposures to a subsidiary of Cerberus Capital Management L.P., the table below shows the reconciliation against the value of foreclosed assets subsequent to the signing of the transaction, incorporating amounts from outside Spain. Million euro
22018
GGross Value AAllowances NNet carrying vvalue
TTotal operations national territory 88,723 33,637 55,086
Solvia Desarrollos Inmobiliarios business line ((1,303) ((602) ((701) Total operations outside the national territory and others 57 28 29 Provision allocated in original loan 1,317 1,317 - Credit risk transferred in portfolio sales (7,068) (3,613) (3,455)
TTotal 11,726 7767 9959
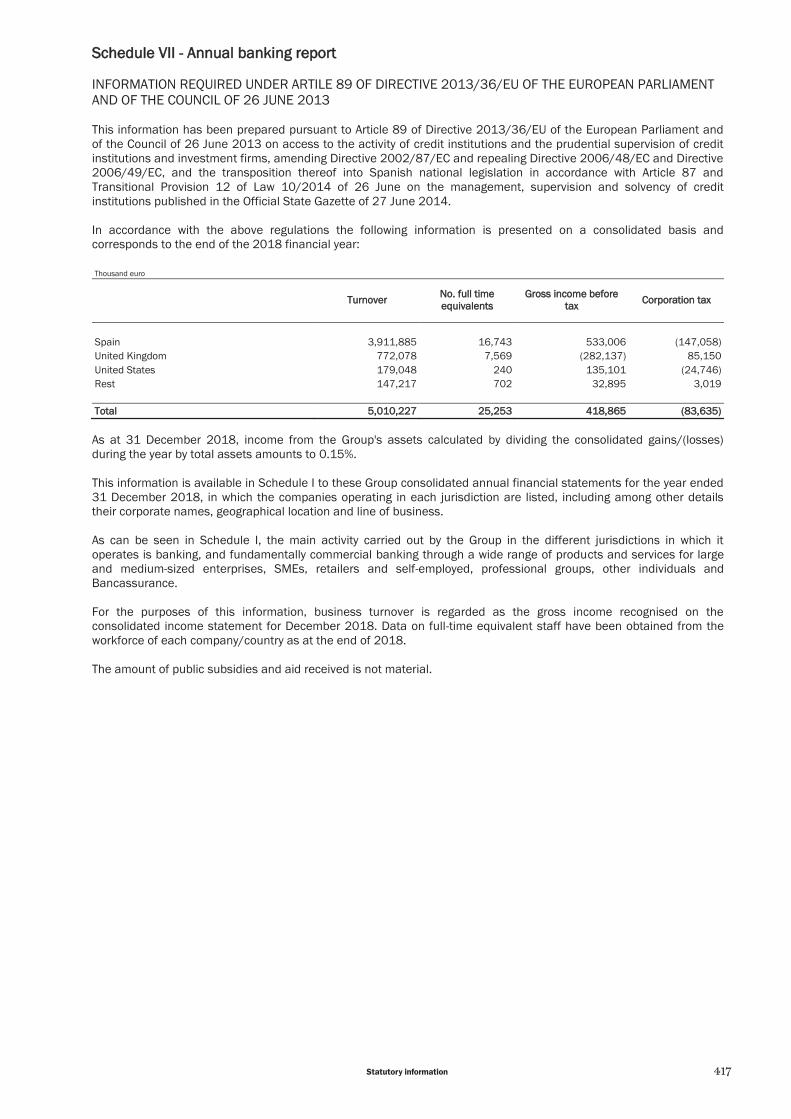
417Statutory information
SSchedule VII - Annual banking report INFORMATION REQUIRED UNDER ARTILE 89 OF DIRECTIVE 2013/36/EU OF THE EUROPEAN PARLIAMENT AND OF THE COUNCIL OF 26 JUNE 2013 This information has been prepared pursuant to Article 89 of Directive 2013/36/EU of the European Parliament and of the Council of 26 June 2013 on access to the activity of credit institutions and the prudential supervision of credit institutions and investment firms, amending Directive 2002/87/EC and repealing Directive 2006/48/EC and Directive 2006/49/EC, and the transposition thereof into Spanish national legislation in accordance with Article 87 and Transitional Provision 12 of Law 10/2014 of 26 June on the management, supervision and solvency of credit institutions published in the Official State Gazette of 27 June 2014. In accordance with the above regulations the following information is presented on a consolidated basis and corresponds to the end of the 2018 financial year: Thousand euro
Turnover No. full time
equivalents Gross income before
tax Corporation tax
Spain 3,911,885 16,743 533,006 (147,058) United Kingdom 772,078 7,569 (282,137) 85,150 United States 179,048 240 135,101 (24,746) Rest 147,217 702 32,895 3,019
Total 5,010,227 25,253 418,865 (83,635)
As at 31 December 2018, income from the Group's assets calculated by dividing the consolidated gains/(losses) during the year by total assets amounts to 0.15%. This information is available in Schedule I to these Group consolidated annual financial statements for the year ended 31 December 2018, in which the companies operating in each jurisdiction are listed, including among other details their corporate names, geographical location and line of business. As can be seen in Schedule I, the main activity carried out by the Group in the different jurisdictions in which it operates is banking, and fundamentally commercial banking through a wide range of products and services for large and medium-sized enterprises, SMEs, retailers and self-employed, professional groups, other individuals and Bancassurance. For the purposes of this information, business turnover is regarded as the gross income recognised on the consolidated income statement for December 2018. Data on full-time equivalent staff have been obtained from the workforce of each company/country as at the end of 2018. The amount of public subsidies and aid received is not material.

418 Banco Sabadell Annual report 2018
CCONSOLIDATED DIRECTORS ’REPORT FOR 2018
This report has been prepared in line with the recommendations contained in the Guidelines for the preparation of directors ’reports by listed companies (Guía para la elaboración del informe de gestión de las entidades cotizadas), published by the Spanish National Securities Market Commission in July 2013.
CONTENTS
1. Governance structure and strategy overview
2. Business performance and results
3. Liquidity and capital resources
4. Risks
5. Post balance sheet events
6. Expected future developments
7. Research, development and innovation
8. Acquisition and disposal of treasury shares
9. Other relevant information

419Statutory information
GGOVERNANCE STRUCTURE AND STRATEGY OVERVIEW 1.1. Organisational structure Banco de Sabadell, S.A., with registered office in Alicante, Avenida Óscar Esplá 37, engages in banking business and is subject to the standards and regulations governing banking institutions operating in Spain. The functions of prudential supervision of Banco Sabadell on a consolidated basis were taken on by the European Central Bank (ECB) in November 2014. The bank is the parent company of a group of entities whose activity it controls directly and indirectly and which comprise, together with the bank, Banco Sabadell Group. Banco Sabadell is comprised of different financial institutions, brands, subsidiaries and investees that cover all aspects of financial business, and it operates mainly in Spain, the United Kingdom, Mexico and Andorra. The Group is organised into the following business units:
Banking Business Spain includes the following customer-centric business units: Commercial Banking: this is the largest single business line in the Group; it focuses on offering financial
products and services to large and medium-sized enterprises, SMEs, retailers and self-employed, individuals and professional groups, consumer finance and bancassurance.
Sabadell is the reference brand which operates in the majority of the Spanish market. It also operates under the following brands; - SabadellHerrero in Asturias and Leon. - SabadellGuipuzcoano in Basque Country, Navarre and La Rioja. - SabadellGallego in Galicia. - SabadellSolbank in the Canary Islands, Balearic Islands, and coastal regions in the South and the
Levante region. - ActivoBank focuses its activity on customers who operate exclusively over the internet and/or by phone.
Corporate Banking: this unit offers products and services to large corporations and financial institutions, both
national and international. Its activities includes corporate banking, structured finance, and trade finance & IFI.
Markets and Private Banking: this unit offers savings and investment management services to Banco
Sabadell customers, including the analysis of investment options, market trading, active asset management and custody services. It comprises the following businesses, which are managed on an integrated basis: SabadellUrquijo Private Banking, the Investment, Products and Analysis unit, Treasury and Capital Markets, and Securities Trading and Custody.
Asset Transformation manages the bank’s real estate balance sheet with an overall perspective of the entire
transformation process, providing services to the real estate portfolio of the Group and of third parties, with a business vocation and added value.
Banking Business United Kingdom: the TSB franchise includes retail business conducted in the United Kingdom,
which includes current and savings accounts, personal loans, credit cards and mortgages. Other Geographies: this heading mostly comprises Mexico, foreign branches and representative offices that offer
all types of banking and financial services related to Corporate Banking, Private Banking and Commercial (Retail and Business) Banking. This activity is mainly carried out in Mexico through Sabadell Capital Sofom e Institución de Banca Múltiple, in the United States through Banco Sabadell Miami Branch and Sabadell Securities, and in EMEA in Banco Sabadell London, Banco Sabadell France, Banco Sabadell Casablanca and Banco Sabadell Andorra.
Banco Sabadell is the parent company of a group of companies which as at 31 December 2018 numbered a total of 162, of which 136 are considered part of the group and 26 are associates (as at 31 December 2017, they numbered 167, of which 143 were considered Group companies and 24 were associates).

420 Banco Sabadell Annual report 2018
The Board of Directors is the highest decision-making body of the company and its consolidated group, as it is responsible under the law and the Articles of Association for managing and representing the bank. The Board of Directors is essentially set up as an oversight and control instrument, delegating the management of ordinary business to the executive bodies and the management team. The Board of Directors is governed by clear-cut and transparent governance regulations, specifically the Articles of Association and the Regulations of the Board of Directors in accordance with corporate governance standards. Its responsibilities include: a) approving the company's general strategies; b) appointing and, if appropriate, discharging directors in the various subsidiaries; c) identifying the company's main risks and implementing and monitoring the appropriate internal control and reporting systems; d) setting policies on the reporting and disclosure of information to shareholders, the markets and the general public; e) setting policies on the treasury portfolio in accordance with any guidelines laid down at the Annual General Meeting; f) approving the Annual Report on Corporate Governance; g) authorising transactions between the company and its directors and significant shareholders that may pose a conflict of interest; and h) generally deciding on business and financial transactions that are of particular importance for the company. The composition of the Board of Directors at 31 December 2018 is as follows: Composition of the Board
PPosition
José Oliu Creus Chair José Javier Echenique Landiribar Deputy Chairman Jaime Guardiola Romojaro CEO Anthony Frank Elliott Ball Director Aurora Catá Sala Director Pedro Fontana García Director María José García Beato Director - General Secretary Maria Teresa Garcia-Milà Lloveras Director George Donald Johnston Director David Martínez Guzmán Director José Manuel Martínez Martínez Director José Ramón Martínez Sufrategui Director José Luis Negro Rodríguez Director - General Manager Manuel Valls Morató Director David Vegara Figueras Director Miquel Roca i Junyent Non - voting Secretary
The Board of Directors has implemented a series of clear-cut and transparent rules and regulations on corporate governance, which are in line with Spanish regulations on corporate governance. The majority of the Board members (11 of 15) are non-executive directors, including 10 independent directors.

421Statutory information
Banco Sabadell has an internal governance framework which was updated by the Board of Directors in its January 2019 meeting and which sets out, among other aspects, the shareholder structure, the governing bodies, the Group’s structure, the composition and operation of corporate governance, the internal control functions, key governance matters, the risk management framework and the Group’s policies. At present, there are five committees in operation, the meetings of which are also attended by members of the General Management. The Board Committees are:
The Executive Committee The Audit and Control Committee The Appointments Committee The Remuneration Committee The Risks Committee
The composition of these Committees as at 31 December 2018 is shown in the table below: Composition of Committees
PPosition EExecutive AAudit
AAppointments RRemuneration RRisk aand Control
Chair José Oliu Manuel Aurora Catá Aurora Catá David Vegara
Creus Valls Morató Sala Sala Figueras Member José Javier Echenique Pedro Fontana Anthony Frank Anthony Frank Maria Teresa
Landiribar García Elliott Ball Elliott Ball Garcia-Milà Lloveras Member Jaime Guardiola Maria Teresa Pedro Fontana Maria Teresa George Donald
Romojaro Garcia-Milà Lloveras García Garcia-Milà Lloveras Johnston Member José Manuel Martínez José Ramón Maria Teresa George Donald Manuel
Martínez Martínez Sufrategui Garcia-Milà Lloveras Johnston Valls Morató Member José Luis Negro - - - -
Rodríguez Secretary María José García Miquel Roca Miquel Roca María José García María José García non-member Beato i Junyent i Junyent Beato Beato
Number of meetings in 2018
35 12 12 12 15
EExecutive Committee The Executive Committee has the same duties as the Board of Directors. It is also responsible for coordinating the bank’s Executive Division, adopting to this end any resolutions and decisions within the scope of the powers conferred to it by the Board of Directors, and for monitoring the bank’s ordinary activity. Any decisions adopted during Committee meetings are reported to the Board of Directors, without prejudice to any other duties assigned to the Executive Committee in the Articles of Association and the Regulations of the Board of Directors. Audit and Control Committee The Audit and Control Committee is responsible for functions established by Law, including: a) reporting to the General Meeting on all issues raised by shareholders that are within its remit; b) monitoring the effectiveness of the Company’s internal controls, Internal Audits and risk management systems, including tax risk management systems, and discussing with statutory auditors or auditing firms any significant internal control weaknesses identified in the course of the audit; c) overseeing the preparation and presentation of statutory financial information;

422 Banco Sabadell Annual report 2018
d) making recommendations to the Board of Directors, for submission at the Annual General Meeting, on the appointment of external statutory auditors and their terms of engagement, the scope of their professional mandate and, if applicable, the renewal or non-renewal of their engagement; reviewing compliance with the auditing agreement and ensuring that the opinion on the annual accounts and the key findings of the auditor’s report are expressed in a clear and precise way; e) advising on the annual accounts and the quarterly and half-yearly financial statements and any prospectuses required to be filed with the regulatory or supervisory authorities; monitoring regulatory compliance and ensuring that generally accepted accounting principles have been correctly applied, and reporting on any proposed amendments to those principles; f) establishing the appropriate relations with external auditors to receive information about any issues that might jeopardise their independence, to be reviewed by the Committee, and any others related to the process of performing the audit functions or in the audit rules; g) advising on any issues referred to the Committee by the Board of Directors that are within its remit; h) any other matters for which the Committee is responsible by law or under the Articles of Association or any regulations made in accordance therewith, or under any generally applicable rules on corporate governance. Pursuant to its Regulations, the Audit and Control Committee performs functions related to the process of financial reporting and internal control systems, functions related to account auditing, functions related to economic and financial information, functions related to internal audit services and functions related to compliance with regulatory provisions, legal requirements and good governance codes, specifically: a) overseeing compliance with the law, internal regulations and regulatory provisions concerning Company activities; b) assessing the sufficiency and compliance of the Regulations of the Annual General Meeting, the Regulations of the Board of Directors, the Company’s Code of Conduct and, particularly, the Internal Code of Conduct relating to the Securities Market; c) reviewing compliance with the company’s rules on corporate governance and submitting recommendations for improvement to the Board as it sees fit; and d) supervising the corporate governance report to be approved by the Board of Directors and included in the annual report. AAppointments Committee The Appointments Committee shall have, as a minimum, the following basic responsibilities, without prejudice to any other functions assigned to the Appointments Committee by Law, in the Articles of Association, the Board of Directors and the Regulations of the Board of Directors: a) make recommendations to the Board of Directors on the appointment of independent directors for their appointment by co-optation or for their submission for decision at the Annual General Meeting, in addition to any proposals for re-electing or discharging these directors; b) submit proposals for the appointment of the remaining directors for their appointment by co-optation or for their submission for decision at the Annual General Meeting, in addition to any proposals for re-electing or discharging these directors; c) ensure compliance with the qualitative composition of the Board of Directors, in accordance with Article 53 of the Articles of Association; d) evaluate the suitability, skills, knowledge and experience necessary for members of the Board of Directors; e) submit proposals for the appointment and discharge of officers and of the Identified Staff; f) report on the basic terms of the contracts with executive directors and officers; g) examine and organise succession plans for the Chairman of the Board of Directors and of the bank’s chief executive and, as appropriate, make proposals to the Board; h) establish an objective for gender diversity in the Board of Directors and prepare ideas on how to reach this objective.

423Statutory information
RRemuneration Committee The Remuneration Committee shall have, as a minimum, the following basic responsibilities, without prejudice to any other functions assigned to the Remuneration Committee by Law, in the Articles of Association, the Board of Directors and the Regulations of the Board of Directors: a) propose to the Board of Directors the remuneration policy of the directors; b) propose to the Board of Directors the remuneration policy of the General Managers and those performing Senior Management duties who report directly to the Board, Executive Committee members or CEOs, and the individual remuneration and other contractual terms of the Executive Directors, ensuring their compliance; c) regularly review the remuneration policy; d) report on the schemes for remuneration in the form of shares and/or options; e) regularly review the general principles in matters of remuneration, and the remuneration schemes of all employees, weighing their alignment with these principles; f) ensure that remuneration is transparent; g) ensure that any potential conflicts of interest do not jeopardise the independence or impartiality of external consultants; h) verify the information on remuneration contained in the various corporate documents, including the Directors ’Remuneration Report. Risks Committee The Risks Committee shall have, as a minimum, the following basic responsibilities, without prejudice to any other functions assigned to the Appointments Committee by Law, in the Articles of Association, the Board of Directors and the Regulations of the Board of Directors: a) oversee the implementation of the Risk Appetite Framework; b) determine and make recommendations to the full Board on annual limits of investment in the real estate market, as well as criteria and volumes applicable to all different types of such investments; c) report to the full Board on the performance of its functions, in accordance with this Article and any other applicable legal or statutory provisions; d) make quarterly reports to the full Board on the levels of risks taken, investments carried out and on their evolution, as well as on any possible repercussions on the Group’s income caused by interest rate fluctuations and their adjustment to their VAR approved by the Board; e) monitor and detect any ruptures of the approved tolerance thresholds, ensuring the activation of the corresponding contingency plans established to this effect; f) report to the Remuneration Committee on whether the employees ’Remuneration Schemes are consistent with the bank’s risk, capital and liquidity levels. 1.2. Business model, main objectives achieved and actions implemented The Group's business is geared towards profitable growth that generates value for shareholders through a business diversification strategy based on profitability, efficiency and service quality, with a conservative risk profile within the framework of ethical and professional codes and taking into account the interests of the various stakeholders. The bank's management model is focused on long-term customer retention, through ongoing efforts designed to build customer loyalty by taking initiatives and being proactive in its relationship with customers. The bank has a comprehensive offering of products and services, a qualified work force, an IT platform that supports growth and a constant focus on the pursuit for quality. Since the onset of the financial crisis, Spain’s banking sector has been going through an unprecedented process of consolidation. Higher levels of capital, stricter provisioning requirements, the economic recession and pressure from capital markets are some of the factors that have driven Spanish entities to merge and thus gain scale, maximise efficiency and improve their balance sheets.

424 Banco Sabadell Annual report 2018
During the last decade, Banco Sabadell has expanded its geographical footprint and increased its market share in Spain through several acquisitions, the largest of which was Banco CAM in 2012, which enabled it to significantly increase the size of its balance sheet. In 2013 Banco Sabadell was able to undertake further corporate actions under economically acceptable terms in a context of banking sector restructuring. Following the acquisition of the Penedès branch network, Banco Gallego and Lloyds España in 2015, Banco Sabadell is well positioned to grow organically and to benefit from the economic recovery in Spain and a future interest rate hike. Acquisitions and organic growth in recent years have enabled Banco Sabadell to strengthen its position in some of Spain’s most prosperous regions (e.g. Catalonia, Valencian Community and the Balearic Islands) and to increase its market share in other key areas. Based on the most recent information available, Banco Sabadell’s market share in Spain stands at 8.0% in loans and 7.0% in deposits (October 2018). Furthermore, Banco Sabadell stands out in products such as trade credit, with a market share of 10.0% (October 2018), business loans with a market share of 11.6% (September 2018), mutual funds with a market share of 6.2% (December 2018), securities trading with a market share of 10.6% (December 2018) and POS turnover with a market share of 16.5% (September 2018). Banco Sabadell maintains its distinction in terms of quality with respect to the sector, and holds first place in the ranking that measures customer experience (net promoter score) for large enterprises and SMEs. In terms of international business, Banco Sabadell has always been exemplary. This has not changed in 2018 and Sabadell has continued being present in strategic areas and has helped companies in their international activity, reaching a market share of 15.2% in Swift transfers (in quarterly accumulated terms) (December 2018). Over the past few years, Banco Sabadell has expanded its international footprint, and its main milestones have been: the acquisition of British bank TSB and the entry into the Mexican market, after obtaining a licence to operate in this country as a commercial bank. As a result, as at December 2018, 31% of the Group's loans and credit was generated overseas (23% in the United Kingdom and 8% in the Americas and other geographies). TSB has focused, on one hand, on its IT migration and integration and, on the other hand, on resolving the incidents which occurred during migration. Going forward, the high market share of Banco Sabadell in the SMEs sector in Spain, together with its international experience, will be a sound value-added tool to support TSB in the provision of efficient and high-quality services for SMEs in the United Kingdom. In 2018, Banco Sabadell Group went to great lengths to reduce its problematic exposures and its efforts have resulted in two corporate transactions which improve the Group’s risk profile. On one hand, there has been a significant divestment from the portfolio of non-performing assets (non-performing assets sold amounted to a gross total of €12.2M), reducing the exposure to these types of assets and achieving an NPA coverage ratio of 52.1%. On the other hand, the Group has sold its real estate servicer, as this is not considered a core business line. Banco Sabadell carries out its business in an ethical and responsible manner, managing its commitment to society in such a way as to ensure that its activity has a positive impact on people and the environment. All of the people that form part of the organisation apply the principles and policies of corporate social responsibility, whilst also guaranteeing quality and transparency in customer service. In addition to complying with applicable rules, Banco Sabadell has a set of policies, internal rules and codes of conduct that guarantee this ethical and responsible behaviour throughout the organisation, and which address all of the Group’s activity. In accordance with the Risk Appetite Framework, the control and monitoring of these matters is carried out through two committees. The Corporate Ethics Committee, which ensures the Group’s compliance with all of the codes of conduct of the securities market and with the general code of conduct, the Internal Control Body, in which all of the Group’s companies are represented and are liable parties, and which ensures compliance with anti-money laundering and counter-terrorist financing regulations and the control of international sanctions.

425Statutory information
The mission of the Compliance Division is to promote and endeavour to reach the highest levels of compliance with the legislation in force and the professional ethics of the Group, minimise the possibility of non-compliance and ensure that any instances of non-compliance are identified, reported and diligently resolved and that the appropriate preventive measures are adopted in the event that these are not already in place. It is also directly responsible for the implementation of a number of processes that are classified as high risk, including anti-money laundering, counter-terrorist financing, the control of international sanctions, the control of market abuse practices, the oversight of compliance with the Internal Code of Conduct and the control of the investor protection regulation (MiFID) and consumer protection regulations. In addition to the foregoing, in 2016 the Corporate Social Responsibility Committee was set up, chaired by the Secretary General, which is responsible for promoting and coordinating the Group’s CSR strategy, policies and projects geared towards Banco Sabadell’s commitment to its customers, employees, the environment and society. The bank is a member of a number of international initiatives and has obtained multiple certificates and qualifications. 22 – BUSINESS PERFORMANCE AND RESULTS 2.1. Economic and financial environment In 2018, political and geopolitical events have once again been in the media spotlight. These events have increasingly affected financial markets throughout the year, in a context in which major central banks have continued with their withdrawal of monetary stimulus measures. Some key political events include the negotiations regarding the withdrawal of the United Kingdom (UK) from the European Union (EU), the actions taken by the new Italian government in relation to European tax rules, Trump’s protectionist policies and electoral results in certain emerging countries. In the UK, the political environment has been marked by the complexity of Brexit, both in terms of the negotiations with the EU and in terms of domestic politics, as a result of divisions that this aspect has generated in the government and within the main political parties. The main obstacle encountered during negotiations with the EU has been the search for a solution to avoid a hard border in Ireland. T. May’s government and the EU reached an agreement for a transition period which is due to run until the end of 2020, although it could be extended to the end of 2022, during which to negotiate the new bilateral relationship. The vote on this deal in the UK Parliament was postponed until January 2019. In Italy, the elections that took place on 4 March were a blow for traditional parties, leaving a fragmented Parliament. After several months of complex negotiations, which almost triggered an institutional crisis, the Five Star Movement and La Liga reached an agreement to form a coalition. The new government submitted its budget, whose public deficit targets were above those prescribed by Europe. This led the European Commission to reject national budgets for the first time in history. The discipline imposed by financial markets and the negative impact that the political situation has had on economic activity resulted in the Italian government adopting a more conciliatory tone with the European Commission and reducing its deficit target for 2019. In the United States (US), Trump has adopted an increasingly aggressive tone in relation to foreign policy. The US has applied tariffs to over half of its Chinese imports, and has threatened to increase these tariffs and apply them to all imports. The technology sector has also attracted a lot of attention in terms of the relationship between the two countries. The truce reached in May with EU has successfully prevented the adoption of protectionist measures. In terms of NAFTA, the relevant countries have finally agreed to renegotiate (and rename) the agreement to make it more favourable to the US. The assertive tone of the US in terms of foreign policy has also resulted in: (i) the declaration of the EU being a “strategic competitor”, in sharp contrast to decades of transatlantic cooperation, (ii) the imposition of sanctions on Iran, despite the opposition of other major powers and (iii) tensions with countries such as Turkey and North Korea. The mid-term elections that took place in the US in November led to the Democrats taking back the House, although the Republicans (Trump’s party) retained control in the Senate. The Democrats have shown their intention of using their majority to exert further legal pressure on Trump and limit some of his domestic policies. In Latin America, the political shift that has taken place in countries such as Mexico and Brazil in the elections that took place this year has been the focus of much attention. In Mexico, the victory of López Obrador in July’s presidential and parliamentary elections stoked the uncertainty surrounding the country's economic and institutional environment. The use of illegal public consultations in order to make major economic decisions has negatively affected investor confidence. Meanwhile, in Brazil, the victory of the former military officer Bolsonaro has been interpreted as a clear rejection by the population of the violence and corruption that has been taking place in the country.

426 Banco Sabadell Annual report 2018
In terms of economic activity, global GDP has continued to record relatively high growth rates, supported by factors such as the expansionary nature of the tax policy of countries such as the United States and China, and a monetary policy which is still accommodating in areas such as the Eurozone. In developed economies, the expansionary trend of activity in the euro area has continued, although the growth rate has been slightly lower than in the previous year, which was exceptionally good. Growth has been hindered by a worse performance of foreign demand, in a context of slightly weaker international trade. Certain one-off factors have also negatively affected activity, including new issuing standards, which have affected the automotive industry. In the United Kingdom, activity has recorded moderate growth, affected by the uncertainty surrounding Brexit. This uncertainty has particularly affected investment and some sectors including real estate. In the United States, the economy has performed well, supported by the expansionary nature of the tax policy, which has particularly benefited private consumption. Against this backdrop, unemployment rates have continued to fall, and remain at historic lows. In Japan, the economy has continued to gradually expand, supported by more lax funding conditions and by government spending. In emerging economies, China’s economic growth, though still fast, has slowed slightly, affected by regulatory tightening implemented by financial authorities. This effect has been made more pronounced by the trade war waged by the United States. However, the country’s economic expansion measures have helped to offset these negative effects. In other countries, the main focus has been on the more vulnerable economies, such as Argentina and Turkey, whose financial markets have slumped in a context of tightening international funding conditions. Lastly, in Mexico, the economy has maintained its moderate and relatively stable growth, which has been hindered by uncertainty regarding the NAFTA negotiations and domestic policy. Regarding inflation, in the euro area, the underlying component, which excludes energy and food, has remained at low levels, with no clear trend in any direction. Inflation in the UK has slowed as the effects of the pound’s devaluation following the Brexit referendum have dissipated, and at the end of the year it was close to the target set out in its monetary policy. Underlying inflation in the United States has grown to levels close to the target set by the Federal Reserve. Salaries have also increased and are practically back to normal. In Japan, inflation has been contained. Crude oil prices reached their highest levels since 2014, influenced by the OPEC’s production cuts, bottlenecks in US production and the announcement that the US would be reinstating sanctions on crude oil exports from Iran. Oil prices then dipped as a result of financial tensions, the temporary authorisations granted by the United States to import Iranian crude oil and the increase in production in Saudi Arabia, Russia and the United States. The Spanish economy has maintained its robust growth rates, exceeding the euro area average once more in 2018, although figures have been slightly lower than in previous years. The economy is still being supported by lower interest rates and the improved financial situation of the private sector. With respect to the labour market, the unemployment rate has continued to fall, and has remained at the historic lows of the end of 2008. The tourism industry has run out of steam, in a context in which tourists are starting to return to other countries in the Mediterranean. This, along with higher oil prices in the year, has resulted in a current account surplus for the sixth consecutive year, although it is slightly lower than in the preceding year. In terms of the real estate market, both housing prices and the volume of sales have continued to record substantial growth. New lending has recorded significant growth rates, in terms of both lending to enterprises and lending to households. As regards the evolution of public accounts, the published data suggest that the deficit will have stood below 3% of GDP. In political aspects, there was a change in government following the vote of no confidence tabled by PSOE. Financial markets have experienced a period of increasing volatility. Losses have been recorded on practically all risky assets worldwide, although the declines have been more pronounced for assets that benefited the most from the search for yield, such as corporate debt. Financial conditions have therefore become tighter, particularly at the end of the year, and market liquidity difficulties have become more pronounced. As a result, major international organisations have continued to warn of the growing risks in financial markets in terms of financial stability. Central banks have continued to take further steps in the normalisation of their monetary policies. The ECB, after reducing its rate of monthly asset purchases, ended its asset purchase programme at the end of the year, although it indicated that it would continue to reinvest assets maturing over a longer period of time. The ECB also indicated that its benchmark interest rates will remain unchanged until at least summer 2019. In the United Kingdom, the Bank of England raised its base rate to 0.75% in its August meeting, confirming the process of gradual and limited monetary normalisation that it had announced previously. Meanwhile, the Fed has continued with its gradual interest rate increases, against a backdrop of strong economic activity, inflation levels that are close to the target of its monetary policy and the normalisation of the labour market. The Fed funds rate ended the year at 2.25-2.50%, compared to 1.25-1.50% at the end of 2017. Lastly, the Bank of Japan has kept its benchmark interest rate at -0.10%, whilst at the same time gradually reducing its purchases of public debt. In July it introduced greater flexibility in its public debt purchases, allowing larger deviations from the target yield on 10-year bonds (from 0.00% to 0.20%).

427Statutory information
Yields on long-term government bonds have performed differently in the US and in Germany. The yield on US government bonds ended the year above 2017 year-end levels. This evolution is due to factors such as the Fed’s interest rate increases, the expansionary nature of the tax policy, the positive activity figures and the strong labour market. Yields were forced downwards in the final quarter of the year, affected by the poor performance of risky assets and the decline in crude oil prices. In the case of German government debt, yields declined from 2017 to very low levels. The political situation in Italy and the situation of financial markets at the end of the year have also been an influencing factor. The spread between the yield on both bonds reached the highest levels ever recorded in the history of the European Monetary Union. Sovereign risk premiums in Spain and Portugal ended the year at similar levels to the previous year. Credit rating upgrades and the expansionary cycle of both economies have exerted downward pressure on the risk premiums. Conversely, trade tensions and significant political uncertainty in Italy have worked to push them up. In Italy, the political environment led to a sharp upturn in the risk premium, which reached maximum levels last seen in 2013. This has been despite its reduction in the final quarter of the year as a result of the country’s greater commitment to fiscal rigour. In terms of foreign currencies, the dollar appreciated against the euro, after falling at the beginning of the year to levels not seen since 2014. The dollar was supported by widening interest rate spreads, political noise in Italy and uncertainty surrounding Brexit, as well as greater levels of risk aversion in light of trade disputes. The pound sterling did not follow any clear trend in its currency pair with the euro, and has mostly remained in the range of 0.87-0.90. In addition to Brexit, the pound has proven to be sensitive to expectations regarding the Bank of England’s base rate, as well as the instability of domestic politics. The yen ended the year at higher levels than at the end of the previous year in its quotation against the dollar. In the final quarter of the year, growing volatility and instability in financial markets have represented a supporting factor of the Japanese currency. Equity has been negatively affected, not only by tightening global funding conditions, but also by the trade war, particularly in the sectors most exposed to the latter, such as the automotive industry and the technology sector. A number of international companies have lowered their corporate earnings forecasts as a result of these trade tensions. In the euro area, political instability in Italy and a sharp upturn in this country’s risk premium have hindered the evolution of the banking sector. The IBEX 35 and the Italian MIB recorded the worst performance, together with the German DAX, which was affected given the size of its automotive industry. Financial markets in emerging economies have been particularly sensitive to episodes of risk aversion related to Argentina and Turkey. In the case of Turkey, the pronounced devaluation of the Turkish lira and the sharp increase in the corporate risk premium which took place in August even impacted, albeit temporarily, the financial assets of developed countries. In addition to the foregoing, other factors that have hindered emerging markets include: (i) domestic political instability in certain economies, (ii) the shift in approach of central banks in developed economies and (iii) the protectionism promoted by Trump. In this context, the aggregate risk premium for emerging countries has reached its highest levels since early 2016. In the particular case of Mexico, the peso has been subjected to high volatility and downward pressures as a result of political uncertainty. In this context, and with inflation figures above the target set out in its monetary policy, the central bank has continued to raise its official interest rate.

428 Banco Sabadell Annual report 2018
22.2. Key financial and non-financial indicators The key figures for the Group, including financial and non-financial data of critical importance for the management of the Group, are set out below:
2018 2017 Change (%) year--
on--year Income statement (million euro) (A)
Net interest income 3,675.2 3,802.4 (3.3) Gross income 5,010.2 5,737.3 (12.7) Pre-provisions income 1,736.8 2,612.1 (33.5) Profit attributed to the Group 328.1 801.5 (59.1)
Balance sheet (million euro) (B)
Total assets 222,322 221,348 0.4 Gross performing loans 139,366 137,522 1.3 Gross lending loans to customers 146,420 147,325 (0.6) On-balance sheet funds 161,678 159,095 1.6
Of which: on-balance sheet customer funds 137,343 132,096 4.0 Mutual funds 26,379 27,375 (3.6) Pension funds and insurance products sold by the Group 14,059 13,951 0.8 Funds under management 205,711 204,420 0.6 Equity 12,117 13,222 (8.4) Own funds 12,545 13,426 (6.6)
Profitability and efficiency (%) (C)
ROA 0.15 0.38 RORWA 0.41 1.03 ROE 2.60 6.10 ROTE 3.18 7.27 Cost-to-income 58.29 50.15
Risk management (D)
Non-performing loans (thousand euro) 6,554 7,925 Total non-performing assets (million euro) 8,279 15,318 NPL ratio (%) 4.22 5.14 NPL coverage ratio (covering risks classified as Stage 3 and excl. floor clauses) 54.1 45.7
NPA coverage ratio (%) (excl. floor clauses) 52.1 49.8 Capital management (E)
Risk-weighted assets (RWAs) (million euro) 80,279 77,505 Phase-in Common Equity Tier 1 (%) (1) 12.0 13.4 Phase-in Tier 1 (%) (2) 13.4 14.3 Phase-in total capital ratio (%) (3) 15.5 16.1 Phase-in leverage ratio (%) 4.87 4.97
Liquidity management (F)
Loan to deposit ratio (%) 101.6 104.3
Shareholders and shares (as at reporting date) (G)
Number of shareholders 235,523 235,130 Average number of shares (million) 5,565 5,570 Share price (euro) 1.001 1.656 Market capitalisation (million euro) 5,568 9,224 Net attributed earnings per share (EPS) (euro) 0.05 0.14 Book value per share (euro) 2.25 2.41 Price/book value 0.45 0.69 PER (share price / EPS) 20.11 11.85
Other data
Branches 2,457 2,473 Employees 26,181 25,845

429Statutory information
(A) This section sets out key components of the income statement for the last two years. (B) The purpose of these key figures is to provide a general overview of year-on-year changes in the main items on
the Group’s consolidated balance sheet, focusing particularly on data related to lending and customer funds. (C) These ratios have been included to give a meaningful indication of profitability and efficiency in the last two
years. (D) This section gives some key balances related to risk management within the Group, as well as the most
significant ratios related to risk. (E) These ratios have been included to give a meaningful indication of solvency in the last two years. (F) The aim of this section is to give a meaningful indication of liquidity in the last two years. (G) This section provides information related to the share price and other stock market indicators and ratios.
(1) Core capital / risk-weighted assets (RWA). (2) Tier 1 capital / risk-weighted assets (RWAs). (3) Total capital / risk-weighted assets (RWAs). 22.3. Financial review Balance sheet and income statement There have been certain one-off items in 2018 which have affected the results for the year, including: (1) extraordinary costs associated with TSB’s IT migration, (2) costs related to TSB post-migration incidents and (3) institutional portfolio sales. In 2017, the Group reached an agreement to sell 100% of its shares in Mediterráneo Vida, Sociedad Anónima de Seguros y Reaseguros, and it also reached an agreement to sell shares representing 100% of the share capital of the subsidiary Sabadell United Bank, N.A. to the US entity Iberiabank Corporation. 2017 also saw the early call of the mortgage enhancement portfolio (a segmented portfolio of mortgage assets that was assigned to TSB to drive profits), which was returned to Lloyds having served its purpose, as the success of TSB’s business model allowed it to terminate the deal one year earlier than agreed. These impacts have been excluded from 2017 figures to calculate changes in the income statement on a like-for-like basis. Banco Sabadell and its group ended 2018 with net attributed profit of 328.1 million euros (568.0 million euros excluding TSB), due to the impact of the one-offs. The positive performance of the ordinary business, together with the significant reduction of problematic assets, are the main factors behind Banco Sabadell’s business performance in 2018.

430 Banco Sabadell Annual report 2018
BBalance sheet As at the end of 2018, total assets for Banco Sabadell and its group amounted to 222,322 million euros (176,140 million euros excluding TSB), compared with the 2017 year-end figures of 221,348 million euros (173,203 million euros excluding TSB). Million euro
Change (%) 2018 2017 year--on--year Cash, cash balances at central banks and other demand deposits 23,494 26,363 (10.9) Financial assets held for trading 2,045 1,573 30.0
Non-trading financial assets mandatorily at fair value through profit or loss 141 40 257.5
Financial assets designated at fair value through profit or loss - - -- Financial assets at fair value through other comprehensive income 13,247 13,181 0.5 Financial assets at amortised cost 164,416 160,724 2.3
Debt securities 13,132 11,747 11.8 Loans and advances 151,284 148,977 1.5
Investments in joint ventures and associates 575 576 (0.1) Tangible assets 2,498 3,827 (34.7) Intangible assets 2,461 2,246 9.6 Other assets 13,445 12,821 4.9
Total assets 222,322 221,348 0.4
Financial liabilities held for trading 1,738 1,431 21.5 Financial liabilities designated at fair value through profit or loss - 40 (100.0) Financial liabilities at amortised cost 206,077 204,045 1.0
Deposits 179,878 177,326 1.4 Central banks 28,799 27,848 3.4 Credit institutions 12,000 14,171 (15.3) Customers 139,079 135,307 2.8
Debt securities issued 22,599 23,788 (5.0) Other financial liabilities 3,601 2,932 22.8
Provisions 466 318 46.9 Other liabilities 1,924 2,293 (16.1)
Total liabilities 210,205 208,127 1.0
Own funds 12,545 13,426 (6.6) Accumulated other comprehensive income (491) (265) 85.2 Minority interests (non-controlling interests) 64 61 3.9
Equity 12,117 13,222 (8.4)
Total equity and total liabilities 222,322 221,348 0.4
Financial guarantees given 2,041 1,983 2.9 Loan commitments given 22,646 20,906 8.3 Other commitments given 8,233 9,917 (17.0)
Total memorandum accounts 32,920 32,806 0.3
Gross performing loans amounted to 139,366 million euros as at 2018 year-end (105,732 million euros excluding TSB), representing a 1.3% growth year-on-year (3.5% excluding TSB). Mortgage-secured loans formed the largest single component of gross loans and receivables, amounting to 80,872 million euros as at 31 December 2018, representing over 58% of total gross performing loans.

431Statutory information
Million euro
CChange (%) EEx TSB EEx TSB CChange (%)
22018 22017 yyear--oon--yyear 22018 22017 yyear--oon--yyear Loans and credit secured with mortgages 80,872 84,267 (4.0) 49,833 52,259 (4.6) Loans and credit secured with other collateral 2,767 2,315 19.5 2,766 2,315 19.5 Trade credit 6,186 5,802 6.6 6,186 5,802 6.6 Finance leases 2,565 2,316 10.7 2,565 2,316 10.7 On-demand loans and other 46,976 42,822 9.7 44,383 39,427 12.6
GGross performing loans 1139,366 1137,522 11.3 1105,732 1102,119 33.5
Non-performing loans (customers) 6,472 7,867 (17.7) 6,024 7,723 (22.0) Accrual adjustments (13) (66) (79.7) (83) (100) (16.9)
GGross lending to customers excluding repos 1145,824 1145,323 00.3 1111,673 1109,742 11.8
Assets acquired under repurchase agreements 596 2,001 (70.2) 596 2,001 (70.2)
GGross lending loans to customers 1146,420 1147,325 ((0.6) 1112,269 1111,743 00.5 Allowances for loan losses and country risk (3,433) (3,727) (7.9) (3,211) (3,646) (11.9)
LLoans and advances to customers 1142,987 1143,598 ((0.4) 1109,058 1108,097 00.9
The evolution of non-performing assets has shown improvement throughout 2018. Quarter-on-quarter changes in these assets excl. TSB (assets classified as Stage 3 plus foreclosed assets not covered by the Asset Protection Scheme) were as follows: Million euro
22018 22017 QQ1 QQ2 QQ3 QQ4 QQ1 QQ2 QQ3 QQ4
Ordinary net inflows (58) (243) (14) (699) (261) (541) (203) (339) Change in real estate assets 23 (244) (136) (5,497) (67) (51) (154) (1,370) OOrdinary net inflows + properties ((35) ((487) ((150) ((6,196) ((328) ((592) ((357) ((1,709)
Write-offs 216 268 187 106 178 61 152 66
QQoQ ordinary change in balance of NPLs and foreclosed aassets
((251) ((755) ((337) ((6,302) ((506) ((653) ((509) ((1,775)
Net variance that considers the 20% exposure retained as it has not been transferred to the DGF as non-performing
The reduction in loans classified as Stage 3 was reflected in an NPL ratio of 4.22% as at the end of 2018, compared with 5.14% as at the end of 2017, representing a fall of -92 basis points. The NPL coverage ratio (covering risks classified as Stage 3) as at 31 December 2018 was 54.1%, compared with 48.3% one year earlier. As at 2018 year-end, on-balance sheet customer funds amounted to 137,343 million euros (104,859 million euros excluding TSB), compared with 132,096 million euros as at the end of 2017 (97,686 million euros excluding TSB), representing a 4.0% growth (7.3% excluding TSB).

432 Banco Sabadell Annual report 2018
Total off-balance sheet customer funds amounted to 44,034 million euros, a -2.8% decrease year-on-year. Within this heading, particularly worthy of note was the decline in assets in UCITS, which as at 31 December 2018 stood at 26,379 million euros, a -3.6% decrease compared to 2017 year-end, offset by the growth in insurance products sold, which amounted to 10,465 million euros, representing a 5.0% increase compared to 2017 year-end. Issued debt securities (borrowing operations and other marketable securities and subordinated liabilities) amounted to 22,599 million euros as at 2018 year-end (20,889 million euros excluding TSB), compared with 23,787 million euros (21,845 million euros excluding TSB) as at 31 December 2017. Total funds under management as at 31 December 2018 amounted to 205,711 million euros (170,285 million euros excluding TSB), compared with 204,420 million euros as at 31 December 2017 (166,447 million euros excluding TSB), representing an increase during 2018 of 0.6% (2.3% excluding TSB). Million euro
CChange (%) EEx TSB EEx TSB CChange (%) 22018 22017 yyear--oon--yyear 22018 22017 yyear--oon--yyear OOn--bbalance sheet customer funds (*) 1137,343 1132,096 44.0 1104,859 997,686 77.3
Customer deposits 139,079 135,307 2.8 105,353 99,277 6.1
Current and savings accounts 107,665 98,020 9.8 77,736 68,039 14.3
Deposits with agreed maturity 28,709 32,425 (11.5) 26,154 27,996 (6.6)
Assets sold under repurchase agreements
2,533 4,750 (46.7) 1,321 3,119 (57.7)
Accrual adjustments and derivatives hedging 172 113 52.3 142 123 15.7
Borrowing operations and other marketable securities 19,568 21,250 (7.9) 18,313 19,764 (7.3)
Subordinated liabilities (**) 3,031 2,537 19.4 2,586 2,081 24.3 OOn--bbalance sheet funds 1161,678 1159,095 11.6 1126,251 1121,122 44.2
Mutual funds 26,379 27,375 (3.6) 26,379 27,375 (3.6)
Equity investment funds 1,681 1,929 (12.9) 1,681 1,929 (12.9) Mixed investment funds 6,469 6,490 (0.3) 6,469 6,490 (0.3) Fixed income investment funds 4,027 4,488 (10.3) 4,027 4,488 (10.3) Guaranteed investment funds 4,074 3,829 6.4 4,074 3,829 6.4 Real estate investment funds 115 125 (8.3) 115 125 (8.3) Venture capital investment funds 46 38 21.1 46 38 21.1 Investment firms 1,886 2,192 (13.9) 1,886 2,192 (13.9)
UCITS sold but not managed 8,081 8,283 (2.4) 8,081 8,283 (2.4)
Assets under management 3,595 3,999 (10.1) 3,595 3,999 (10.1)
Pension funds 3,594 3,987 (9.8) 3,594 3,987 (9.8)
Private 2,168 2,476 (12.4) 2,168 2,476 (12.4) Corporates 1,416 1,498 (5.5) 1,416 1,498 (5.5) Funded by unions or other associations 11 13 (14.6) 11 13 (14.6)
Insurance products sold 10,465 9,965 5.0 10,465 9,965 5.0
OOff--bbalance sheet funds 444,034 445,325 ((2.8) 444,034 445,325 ((2.8)
FFunds under management 2205,711 2204,420 00.6 1170,285 1166,447 22.3
(*) Includes customer deposits (ex-repos) and other liabilities sold by the branch network: mandatory convertible bonds, Banco Sabadell straight bonds, commercial paper and others.
(**) These are subordinated liabilities of debt securities.

433Statutory information
IIncome statement Million euro
Change (%) Ex TSB Ex TSB Change (%)
2018 2017 year--on--year 2018 2017 year--on--year Interest and similar income 4,861.9 4,839.6 0.5 3,652.7 3,605.9 1.3 Interest and similar charges (1,186.8) (1,037.3) 14.4 (977.3) (837.1) 16.7
Net interest income 3,675.2 3,802.4 (3.3) 2,675.5 2,768.8 (3.4)
Return on capital instruments 8.2 7.3 12.8 8.0 7.1 13.8 Income and expense of entities accounted for using the equity method 56.6 308.7 (81.7) 56.6 308.7 (81.7)
Net fees and commissions 1,335.3 1,223.4 9.1 1,250.1 1,127.8 10.8 Gains or (-) losses on financial assets and liabilities, net 226.7 614.1 (63.1) 209.3 504.5 (58.5) Exchange differences (net) (1.3) 8.4 -- (1.6) 8.4 -- Other operating income and expenses (290.4) (227.0) 27.9 (230.1) (211.3) 8.9
Gross income 5,010.2 5,737.3 (12.7) 3,967.7 4,514.0 (12.1)
Staff expenses (1,590.6) (1,573.6) 1.1 (1,208.3) (1,178.9) 2.5
Recurring (1,529.6) (1,546.9) (1.1) (1,168.1) (1,163.0) 0.4 Non-recurring (61.0) (26.6) 129.2 (40.2) (15.8) 154.1
Other general administrative expenses (1,329.8) (1,149.4) 15.7 (652.6) (614.8) 6.1 Recurring (1,099.3) (1,116.7) (1.6) (652.6) (614.8) 6.1 Non-recurring (230.5) (32.7) -- - - --
Depreciation (353.1) (402.2) (12.2) (264.5) (329.6) (19.7) Pre--provisions income 1,736.8 2,612.1 (33.5) 1,842.3 2,390.8 (22.9)
Provisions for loan losses and other impairments (916.8) (1,225.2) (25.2) (685.8) (1,136.4) (39.7)
Other provisions and impairments (403.6) (971.1) (58.4) (403.6) (971.1) (58.4)
Capital gains on asset sales and other revenue 2.5 432.6 (99.4) 1.2 425.9 (99.7) Negative goodwill - - -- - - --
Profit or loss before tax 418.9 848.3 (50.6) 754.1 709.1 6.3
Corporation tax (83.6) (43.1) 94.2 (179.0) 5.8 --
Consolidated profit or loss for the year 335.2 805.2 (58.4) 575.2 714.9 (19.5)
Profit or loss attributed to minority interests 7.1 3.7 92.0 7.1 3.7 92.0
Profit attributed to the Group 328.1 801.5 (59.1) 568.0 711.2 (20.1)
Memorandum item:
Average total assets 217,168 214,356 1.3 170,502 168,418 1.2 Earnings per share (euro) 0.05 0.14 0.09 0.12
Net interest income in 2018 totalled 3,675.2 million euros, -3.3% below the net interest income obtained in the preceding year, which included Mediterráneo Vida, Sociedad Anónima de Seguros y Reaseguros, Sabadell United Bank, N.A. and the mortgage enhancement portfolio. 2018 was also affected by TSB’s remediation activities. Excluding TSB, net interest income amounted to 2,675.5 million euros as at 2018 year-end, a -3.4% decrease compared with the previous year. On a like-for-like basis, and excluding TSB’s remediation activities, net interest income increased year-on-year by 1.5% (1.1% excluding TSB).

434 Banco Sabadell Annual report 2018
The net interest margin as a percentage of average total assets declined due to the reduction in the customer spread following TSB’s remediation activities, the lower returns on the fixed-income portfolio due to asset rotations and an enhanced liquidity position. Consequently, the net interest margin as a percentage of average total assets stood at 1.69% in 2018 (1.77% in 2017).
Dividends charged and earnings from companies consolidated under the equity method together amounted to 64.7 million euros, compared to 315.9 million euros in 2017, which include the net fee charged by BanSabadell Vida for the reinsurance contract with Swiss Re Europe. These revenues are due mainly to income from the insurance and pension fund business. Income from net fees and commissions amounted to 1,335.3 million euros (1,250.1 million euros excluding TSB), increasing by 9.1% year-on-year (10.8% excluding TSB). On a like-for-like basis and excluding the impact of TSB’s overdraft fee waivers, fees and commissions income grew by 10.1% (11.3% excluding TSB) year-on-year. This growth was the consequence of the good performance of both service commissions and asset management fees. Gains or (-) losses on financial assets and liabilities, net and exchange differences amounted to 225.4 million euros (207.7 million euros excluding TSB), including the impairment of SAREB subordinated debt in the second quarter. In 2017, gains or (-) losses on financial assets and liabilities, net and exchange differences amounted to 622.5 million euros (512.9 million euros excluding TSB) and included the early call of TSB’s Mortgage Enhancement portfolio, as well as sales of fixed-income portfolios. Other operating income and expenses amounted to -290.4 million euros (-230.1 million euros excluding TSB), compared with -227.0 million euros (-211.3 million euros excluding TSB) in 2017. Particularly worthy of note in this heading are the contributions to the Deposit Guarantee Fund of -106.3 million euros (-98.3 million euros in the previous year), fraud losses in TSB amounting to -55.8 million euros, the contribution to the Single Resolution Fund of -49.7 million euros (-50.6 million euros in the previous year), the capital contributions associated with the conversion of deferred tax assets into credit eligible for the Spanish Tax Authority of -45.0 million euros (-54.7 million euros in the previous year) and the payment of the Tax on Deposits of Credit Institutions (Impuesto sobre Depósitos de las Entidades de Crédito, or IDEC) of -30.7 million euros (-28.1 million euros in the previous year). Operating expenses (staff and general) during 2018 amounted to -2,920.4 million euros (-1,860.9 million euros excluding TSB), of which -291.5 million euros are attributable to non-recurrent items (-40.2 million euros excluding TSB). During 2017, operating expenses amounted to -2,723.0 million euros (-1,793.6 million euros excluding TSB), and included -59.3 million euros in non-recurrent items (-15.8 million euros excluding TSB). This year-on-year increase mainly corresponds to the extraordinary migration and post-migration costs in TSB.

435Statutory information
The cost-to-income ratio in 2018 stood at 58.29% (46.90% excluding TSB), compared with 50.15% (42.10% excluding TSB) in 2017. This increase is due to the extraordinary costs incurred in TSB in 2018. As a result of the foregoing, pre-provisions income as at 2018 year-end amounted to 1,736.8 million euros (1,842.3 million euros excluding TSB), compared with 2,612.1 million euros in 2017 (2,390.8 million euros excluding TSB), representing a decline of -33.5% (-22.9% excluding TSB), mainly due to extraordinary gains or (-) losses on financial assets and liabilities, net and the net fee charged by BanSabadell Vida for the reinsurance contract with Swiss Re Europe in the preceding year, as well as the extraordinary impacts related to TSB’s migration and post-migration incurred during 2018. Total provisions and impairments amounted to -1,320.4 million euros (-1,089.4 million euros excluding TSB), compared with -2,196.4 million euros in 2017 (-2,107.6 million euros excluding TSB). It should be noted that this year includes the provision for customer remedies in TSB and the allowance for institutional portfolio sales. Gains on asset sales amounted to 2.5 million euros, compared to 432.6 million euros in the preceding year, as they included net gains on the sale of Sabadell United Bank, the sale of Mediterráneo Vida and the sale of 100% of the capital in HI Partners Holdco Value Added, S.A.U. by the subsidiary Hotel Investment Partners, S.L. (HIP). After deducting corporation tax and minority interests, net profit attributed to the Group amounted to 328.1 million euros as at the end of 2018, representing a -59.1% decrease compared with the previous year due to extraordinary impacts. Excluding TSB, net profit attributed to the Group amounted to 568.0 million euros as at 2018 year-end, a -20.1% decrease compared 2017 year-end. 22.4. Business review The key financial figures associated with the Group’s largest business units are shown hereafter, in line with the segment reporting described in Note 38 to these consolidated annual financial statements. Banking Business Spain Net profit as at the end of 2018 amounted to 955 million euros, representing a year-on-year decline of -39%, due to the smaller contribution of gains or (-) losses on financial assets and liabilities, net compared to the previous year. Excluding Mediterráneo Vida in the previous year and the capital gains generated on the sales of Sabadell United Bank and Mediterráneo Vida, the decline is 19.5%. Net interest income amounted to 2,445 million euros, a -3.3% decrease compared to 2017 year-end. Excluding Mediterráneo Vida, net interest income declined by -2.0%. Net fees and commissions income amounted to 1,202 million euros, 11.7% higher than in the previous year, driven by the positive performance of service commissions and asset management fees. Gains or (-) losses on financial assets and liabilities, net and exchange differences amounted to 193 million euros, representing a decline due to lower gains or (-) losses on financial assets and liabilities, net and the SAREB impairment in the year. Administrative and depreciation expenses amounted to -1,791 million euros, 2.0% higher than in the same period in the previous year, mainly explained by the increase in expenses associated with the transformation and digitalisation of the business and by new regulatory developments. Provisions and impairments amounted to -543 million euros, significantly less than in the previous year.
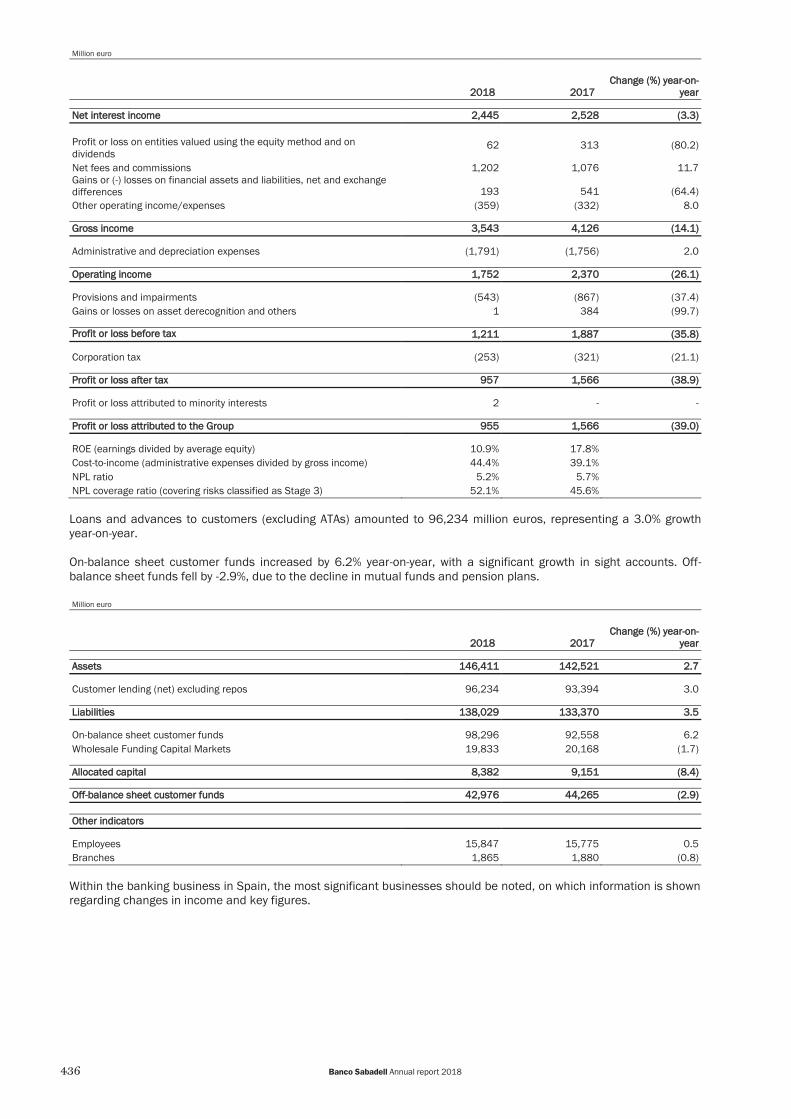
436 Banco Sabadell Annual report 2018
Million euro
CChange (%) year--oon--
yyear 22018 22017 NNet interest income 22,445 22,528 ((3.3)
Profit or loss on entities valued using the equity method and on dividends
62 313 (80.2)
Net fees and commissions 1,202 1,076 11.7 Gains or (-) losses on financial assets and liabilities, net and exchange differences 193 541 (64.4) Other operating income/expenses (359) (332) 8.0
GGross income 33,543 44,126 ((14.1)
Administrative and depreciation expenses (1,791) (1,756) 2.0 OOperating income 11,752 22,370 ((26.1)
Provisions and impairments (543) (867) (37.4) Gains or losses on asset derecognition and others 1 384 (99.7)
PProfit or loss before tax 11,211 11,887 ((35.8)
Corporation tax (253) (321) (21.1) PProfit or loss after tax 9957 11,566 ((38.9)
Profit or loss attributed to minority interests 2 - - PProfit or loss attributed to the Group 9955 11,566 ((39.0)
ROE (earnings divided by average equity) 10.9% 17.8% Cost-to-income (administrative expenses divided by gross income) 44.4% 39.1% NPL ratio 5.2% 5.7% NPL coverage ratio (covering risks classified as Stage 3) 52.1% 45.6%
Loans and advances to customers (excluding ATAs) amounted to 96,234 million euros, representing a 3.0% growth year-on-year. On-balance sheet customer funds increased by 6.2% year-on-year, with a significant growth in sight accounts. Off-balance sheet funds fell by -2.9%, due to the decline in mutual funds and pension plans. Million euro
CChange (%) year--oon--
yyear 22018 22017 AAssets 1146,411 1142,521 22.7
Customer lending (net) excluding repos 96,234 93,394 3.0 LLiabilities 1138,029 1133,370 33.5
On-balance sheet customer funds 98,296 92,558 6.2 Wholesale Funding Capital Markets 19,833 20,168 (1.7)
AAllocated capital 88,382 99,151 ((8.4)
OOff--bbalance sheet customer funds 442,976 444,265 ((2.9) OOther indicators
Employees 15,847 15,775 0.5 Branches 1,865 1,880 (0.8)
Within the banking business in Spain, the most significant businesses should be noted, on which information is shown regarding changes in income and key figures.

437Statutory information
CCommercial Banking The Group's largest business line is Commercial Banking, which focuses its activity on providing a range of financial products and services for large and medium-sized enterprises, SMEs and retailers, individuals (including private banking, personal banking and mass markets), non-residents and professional groups, with a degree of specialisation that enables tailored services to be offered to customers in line with their requirements, whether via experts throughout its multi-brand branch network or via other channels intended to support the customer relationship and give access to remote banking services. Net profit as at December 2018 amounted to 866 million euros, representing a -4.0% decrease year-on-year. Excluding the sales of Mediterráneo Vida and Exel Broker, and excluding the net fee charged by BanSabadell Vida for the reinsurance contract with Swiss Re Europe, the increase would be 34.7%. Gross income, standing at 3,054 million euros, declined by -5.3% and excluding the effects mentioned above, gross income increased by 3.1%. Core revenue of 3,166 million euros increased by 0.7%, and by 1.8% on a like-for-like basis (excluding Mediterráneo Vida and Exel Broker). Net interest income stood at 2,227 million euros, a -3.1% decline compared to 2017 year-end. On a like-for-like basis, this item decreased by -1.7%. Results on the equity method and dividends in 2017 include the net fee charged by BanSabadell Vida for the reinsurance contract with Swiss Re Europe. Net fees and commissions stood at 939 million euros, 11.3% higher than in the previous year due to the positive performance of service commissions and asset management fees. Gains or (-) losses on financial assets and liabilities, net and exchange differences in 2017 include the impacts of the sales of bad debt portfolios. Administrative and depreciation expenses amounted to 1,473 million euros, and remained in line with the same period in the previous year. Provisions and impairments amounted to -389 million euros, less than in the previous year due to the extraordinary provisions allocated this year. The gains and losses on derecognised assets and others heading in 2017 includes the capital gains on the sales of of Mediterráneo Vida and Exel Broker.

438 Banco Sabadell Annual report 2018
Million euro
22018 22017 CChange (%) year--oon--
yyear NNet interest income 22,227 22,299 ((3.1)
Profit or loss on entities valued using the equity method and on dividends
44 304 (85.5)
Net fees and commissions 939 844 11.3 Gains or (-) losses on financial assets and liabilities, net and exchange differences 6 (37) (116.2) Other operating income/expenses (162) (185) (12.4)
GGross income 33,054 33,225 ((5.3)
Administrative and depreciation expenses (1,473) (1,468) 0.3 OOperating income 11,581 11,757 ((10.0)
Provisions and impairments (389) (632) (38.4) Gains or losses on asset derecognition and others - 22 -
PProfit or loss before tax 11,192 11,147 33.9
Corporation tax (326) (245) 33.1 PProfit or loss after tax 8866 9902 ((4.0)
Profit or loss attributed to minority interests - - - PProfit oor loss attributed to the Group 8866 9902 ((4.0)
ROE (earnings divided by average equity) 17.1% 19.2% Cost-to-income (administrative expenses divided by gross income) 47.4% 45.0% NPL ratio 5.5% 6.4% NPL coverage ratio (covering risks classified as Stage 3) 48.4% 40.5%
Net lending increased by 6.5%, on-balance sheet funds grew by 5.7% and off-balance sheet funds increased by 1.8%, mainly due to the increase in mutual funds. Million euro
22018 22017 CChange (%) year--oon--
yyear AAssets 1170,249 1162,618 44.7
Customer lending (net) excluding repos 81,319 76,346 6.5 LLiabilities 1165,355 1157,994 44.7
On-balance sheet customer funds 86,822 82,172 5.7 AAllocated capital 44,894 44,624 55.8
OOff--bbalance sheet ccustomer funds 224,223 223,797 11.8 OOther indicators
Employees 11,336 11,427 - Branches 1,852 1,868 -

439Statutory information
CCorporate Banking Corporate Banking offers financial solutions and advisory services to large corporations and financial institutions, both national and international. Its activities includes corporate banking, structured finance, and trade finance & IFI. Net profit as at December 2018 amounted to 84 million euros, representing a -32.3% decrease year-on-year. Gross income, which stood at 240 million euros, recorded a decrease of -14%. Core revenue, which stood at 254 million euros, recorded a decrease of -11.2%. Net interest income, which stood at 145 million euros, declined year-on-year by -15.7%. Net fees and commissions income amounted to 109 million euros, -4.4% less than in the previous year. Gains or (-) losses on financial assets and liabilities, net and exchange differences declined, as extraordinary gains/(losses) on sales of loan portfolios were recognised in 2018. Administrative and depreciation expenses amounted to 41 million euros, increasing by 24.2% compared to the same period in the previous year. Provisions and impairments amounted to 79 million euros, representing an increase of 14.5%. Million euro
2018 2017 Change (%) year--on--
year Net interest income 145 172 (15.7)
Profit or loss on entities valued using the equity method and on dividends - - -
Net fees and commissions 109 114 (4.4) Gains or (-) losses on financial assets and liabilities, net and exchange differences (8) 3 (366.7) Other operating income/expenses (6) (10) (40.0)
Gross income 240 279 (14.0)
Administrative and depreciation expenses (41) (33) 24.2 Operating income 199 246 (19.1)
Provisions and impairments (79) (69) 14.5 Gains or losses on asset derecognition and others - - -
Profit or loss before tax 120 177 (32.2)
Corporation tax (36) (53) (32.1) Profit or loss after tax 84 124 (32.3)
Profit or loss attributed to minority interests - - - Profit or loss attributed to the Group 84 124 (32.3)
ROE (earnings divided by average equity) 10.9% 14.0% Cost-to-income (administrative expenses divided by gross income) 17.2% 12.0% NPL ratio 4.1% 4.7% NPL coverage ratio (covering risks classified as Stage 3) 91.2% 94.0%

440 Banco Sabadell Annual report 2018
Net lending declined by 7.5%, and on-balance sheet funds increased by 15.7% due to sight accounts and fixed-term deposits, while off-balance sheet funds decreased by 8.7%, mainly due to workplace pension plans. Million euro
22018 22017 CChange (%) year--oon--
yyear AAssets 111,020 111,958 ((7.8)
Customer lending (net) excluding repos 6,981 7,548 (7.5) LLiabilities 110,289 111,239 ((8.5)
On-balance sheet customer funds 3,306 2,857 15.7 AAllocated capital 7732 7720 11.7
OOff--bbalance sheet customer funds 4472 5517 ((8.7) OOther indicators
Employees 155 140 - Branches 2 2 -
MMarkets and Private Banking Markets and Private Banking offers and designs products and services with a high added value with a view to achieving a good rate of return for customers, increasing and diversifying the customer base and ensuring the consistency of investment processes through an in-depth analysis and with good-quality management, while taking the customer relationship model towards a multichannel level. Net profit as at December 2018 amounted to 98 million euros, representing a 2.1% increase year-on-year. Gross income, standing at 257 million euros, increased by 4.9% and core revenue, standing at 269 million euros, increased by 9.3%. Net interest income amounted to 74 million euros, and increased year-on-year by 27.6%, due to the good results obtained in Treasury and Capital Markets. Net fees and commissions income amounted to 195 million euros, 3.7% higher than in the previous year due to higher fees and commissions on mutual funds and securities. Administrative and depreciation expenses amounted to 113 million euros, increasing by 7.6%.

441Statutory information
Million euro
22018 22017 CChange (%) year--oon--
yyear NNet interest income 774 558 227.6
Profit or loss on entities valued using the equity method and on dividends - - -
Net fees and commissions 195 188 3.7 Gains or (-) losses on financial assets and liabilities, net and exchange differences 4 1 300.0 Other operating income/expenses (16) (2) 700.0
GGross income 2257 2245 44.9
Administrative and depreciation expenses (113) (105) 7.6
OOperating income 1144 1140 22.9
Provisions and impairments (1) (3) - Gains or losses on asset derecognition and others - - -
PProfit or loss bbefore tax 1143 1137 44.4
Corporation tax (45) (41) 9.8
PProfit or loss after tax 998 996 22.1
Profit or loss attributed to minority interests - - -
PProfit or loss attributed to the Group 998 996 22.1
ROE (earnings divided by average equity) 55.6% 31.6% Cost-to-income (administrative expenses divided by gross income) 43.5% 42.5% NPL ratio 0.1% 0.5% NPL coverage ratio (covering risks classified as Stage 3) 435.8% 71.0%
Net lending increased by 31.4%, concentrated in private banking customers jointly managed by commercial banking and private banking (hereinafter, jointly managed customers), while on-balance sheet customer funds grew by 30.2% and earnings on off-balance sheet funds declined by -5.2%, mainly due to the increase in Investment Funds. Million euro
22018 22017 CChange (%) year--oon--
yyear AAssets 111,523 88,858 330.1
Customer lending (net) excluding repos 2,859 2,175 31.4
LLiabilities 111,347 88,578 332.3
On-balance sheet customer funds 8,293 6,367 30.2
AAllocated capital 1176 2280 ((37.1)
OOff--bbalance sheet customer funds 116,324 117,213 ((5.2) OOther indicators
Employees 504 531 - Branches 10 10 -

442 Banco Sabadell Annual report 2018
BBanking Business United Kingdom Net profit in December 2018 amounted to -240 million euros, mainly due to -460 million euros in migration and post-migration extraordinary costs. Net interest income amounted to 1,000 million euros, declining by -3.3% year-on-year, impacted by TSB’s post-migration remediation activities. Net fees and commissions income fell by -10.9% year-on-year, mainly due to lower service commissions and remediation activities in TSB post-migration. Gains or (-) losses on financial assets and liabilities, net includes results of fixed-income sales. Administrative and depreciation expenses increased by 14.6% year-on-year to -1,148 million euros, including -195 million euros in non-recurrent costs related to migration and post-migration. Provisions and impairments amounted to -231 million euros and include a provision of -142.1 million euros for the total estimated amount of customer redress, including extraordinary costs of the process for managing complaints associated with the migration. Million euro
2018 2017 Change (%) year--on--
year Net interest income 1,000 1,034 (3.3)
Profit or loss on entities valued using the equity method and on dividends - - -
Net fees and commissions 85 96 (10.9) Gains or (-) losses on financial assets and liabilities, net and exchange differences 18 110 (83.8) Other operating income/expenses (60) (16) 283.2
Gross income 1,042 1,223 (14.8)
Administrative and depreciation expenses (1,148) (1,002) 14.6 Operating income (106) 221 (147.8)
Provisions and impairments (231) (89) - Gains or losses on asset derecognition and others 1 7 -
Profit or loss before tax (335) 139 (341.5)
Corporation tax 95 (49) (295.2) Profit or loss after tax (240) 90 (366.5)
Profit or loss attributed to minority interests - - - Profit or loss attributed to the Group (240) 90 (366.5)
ROE (earnings divided by average equity) - 5.8% Cost-to-income (administrative expenses divided by gross income) 101.6% 79.5% NPL ratio 1.3% 0.4% NPL coverage ratio (covering risks classified as Stage 3) 50.4% 55.9%

443Statutory information
Loans and advances to customers (excluding ATAs) amounted to 33,929 million euros, declining year-on-year by -4.4%. Considering a constant exchange rate, this item declined by -2.7% compared with the previous year. On-balance sheet customer funds amounted to 32,484 million euros, declining by -5.6% year-on-year (-4.7% considering a constant exchange rate). In the year, they mainly declined due to the maturity of fixed rate cash ISAs (FRISA) while personal current accounts (PCAs) increased. Million euro
22018 22017 CChange (%) year--oon--
yyear AAssets 446,182 448,145 ((4.1)
Customer lending (net) excluding repos 33,929 35,501 (4.4)
LLiabilities 444,596 446,597 ((4.3)
On-balance sheet customer funds 32,484 34,410 (5.6) Wholesale Funding Capital Markets 1,688 1,920 (12.1)
AAllocated capital 11,586 11,548 --
OOff--bbalance sheet customer funds -- -- -- OOther indicators
Employees 8,353 8,287 0.8 Branches 550 551 (0.2)
TSB Migration Project On 23 April 2018, TSB migrated to its new IT platform. Although the customer data transfer went according to plan, and the account management functionality, operating processes and processes to generate information on the new platform all began operating correctly, immediately after the migration some customers experienced problems in accessing digital channels, delays on the telephone helpline and slower transaction processing. The high repercussion of this situation saw an increase in fraud attempts against TSB customers. Following this, the bank immediately focused on resolving the service issues that were affecting customers and on identifying their causes. Initial analyses indicated that the platform design was robust and that the majority of errors had arisen when deploying the platform in the technology infrastructure. The institution launched a remediation programme, supervised by its Audit Committee. Under the framework of this plan, TSB’s Audit Committee has been notified of the pre and post-migration situation in relation to the financial reporting processes and the control framework, concluding that the financial reporting control framework provides guarantees as to its effectiveness both before and after the migration of TSB’s platform. The Group’s three lines of defence are involved in monitoring the situation of TSB’s financial reporting control framework, and the Audit Committee is informed of any relevant aspects. TSB’s Board of Directors also requested an independent investigation to be launched, which is being carried out by Slaughter and May. The investigation is currently ongoing and Slaughter and May will issue their report as soon as possible. UK regulators are also conducting their own investigation. Furthermore, TSB has undertaken a firm commitment to ensure that each customer affected is adequately compensated. To this end, a team has been set up dedicated specifically to resolving customer complaints, which has involved significant efforts in hiring and relocating staff. TSB intends to compensate all customers who experienced any financial losses, also taking into account situations in which customers were inconvenienced in any way by the events. This process is being carried out with a view to combining the speedy processing of complaints received with the need to ensure that each complaint is analysed and dealt with in line with regulatory requirements. At present, all major IT issues have been resolved, and the number of incidents has declined significantly to business-as-usual levels in the sector. Customers are therefore starting to see the benefits of the new technology that has been implemented, which provides an integrated platform that can be accessed faster by both employees and customers and which enables products to be acquired more quickly. Mortgage applications can be submitted in half the time compared with the old system, and the platform allows information to be attached in real time. At the end of 2018, TSB began its first post-migration launch of new products in the online channel and the number of calls received from customers in relation to the operation of the mobile app has fallen significantly, as it is now easier to use. Customers can also now open current accounts in TSB branches in half the time compared to before migration.

444 Banco Sabadell Annual report 2018
OOther geographies Net profit as at December 2018 amounted to 91 million euros, representing a 2.3% increase year-on-year. Excluding Sabadell United Bank, net profit increased by 47.9%. Net interest income stood at 259 million euros, declining by -11.6% year-on-year. Excluding Sabadell United Bank, this item has grown by 26.1%, mainly due to growth in Mexico and foreign branches in EMEA (Paris, London and Casablanca). Net fees and commissions income during the year declined by -6.6% year-on-year, mainly as Sabadell United Bank is no longer making any contributions. Excluding SUB, net fees and commissions income grew by 3.3%. Gross income amounted to 328 million euros, declining by -8.4% year-on-year. Excluding Sabadell United Bank, gross income grew by 24.5% due to the positive performance of Mexico, Miami and foreign branches in EMEA. Administrative and depreciation expenses declined by -4.9% year-on-year. Excluding the sale of Sabadell United Bank, they increased by 21.4%, due to expenses associated with expansion in Mexico. Provisions and impairments increased in relation to the previous year due to provisions associated with the increased investment in Mexico and Miami, and due to higher levels of provisions, mainly associated with one-offs. Million euro
Change (%) year--on--year 2018 2017
Net interest income 259 293 (11.6)
Profit or loss on entities valued using the equity method and on dividends 3 3 (17.6) Net fees and commissions 47 50 (6.6) Gains or (-) losses on financial assets and liabilities, net and exchange differences 10 9 8.7 Other operating income/expenses 10 3 -
Gross income 328 358 (8.4)
Administrative and depreciation expenses (195) (205) (4.9) Operating income 133 153 (13.0)
Provisions and impairments (27) (24) 9.4 Gains or losses on asset derecognition and others - 1 -
Profit or loss before tax 107 130 (17.9)
Corporation tax (11) (37) (70.4) Profit or loss after tax 96 92 3.3
Profit or loss attributed to minority interests 5 4 - Profit or loss attributed to the Group 91 88 2.3
ROE (earnings divided by average equity) 9.0% 8.8% Cost-to-income (administrative expenses divided by gross income) 56.0% 54.5% NPL ratio 0.3% 0.9% NPL coverage ratio (covering risks classified as Stage 3) 292.9% 113.0%

445Statutory information
Net lending amounted to 10,896 million euros, 23.3% higher than in the preceding year, mainly due to the growth of the business in Mexico and Miami. On-balance sheet customer funds amounted to 6,328 million euros and increased by 26.0% year-on-year. Off-balance sheet funds amounted to 1,023 million euros and remained in line with the previous year. Million euro
CChange (%) year--oon--yyear 22018 22017
AAssets 117,822 115,298 116.5
Customer lending (net) excluding repos 10,896 8,836 23.3 Real estate exposure (net) - 23 (100.0)
LLiabilities 116,789 114,431 116.3
On-balance sheet customer funds 6,328 5,024 26.0 AAllocated capital 11,033 8866 119.2
OOff--bbalance sheet customer funds 11,023 11,033 ((1.0)
OOther indicators
Employees 908 765 18.7 Branches 42 42 -

446 Banco Sabadell Annual report 2018
RReal Estate Asset Transformation Net profit as at December 2018 amounted to -478 million euros, increasing by 49.4% year-on-year, mainly due to the reduction of provisions and the positive results on real estate sales. Gains or (-) losses on financial assets and liabilities, net includes sales of real estate companies. Gross income amounted to 97 million euros, a far higher figure than in the previous year. Administrative and depreciation expenses declined by -14.1% year-on-year to -140 million euros. Provisions and impairments amounted to -520 million euros, 57.2% less than in the previous year due to the extraordinary provisions allocated in 2017. In the year, they include -177.1 million euros in provisions for institutional portfolio sales. Results on sales amounted to 95.6 million euros as at December 2018. Million euro
2018 2017 Change (%) year--on--
year Net interest income (28) (52) (45.4)
Profit or loss on entities valued using the equity method and on dividends
- (1) (100.0)
Net fees and commissions 1 2 (30.4) Gains or (-) losses on financial assets and liabilities, net and exchange differences 5 (37) - Other operating income/expenses 119 118 0.7
Gross income 97 30 220.9
Administrative and depreciation expenses (140) (163) (14.1) Operating income (43) (133) (67.5)
Provisions and impairments (520) (1,216) (57.2) Profit or loss on sales 96 (14) -
Gains or losses on asset derecognition and others - 41 (100.0) Profit or loss before tax (563) (1,307) (56.9)
Corporation tax 85 364 (76.5) Profit or loss after tax (478) (943) (49.4)
Profit or loss attributed to minority interests - - - Profit or loss attributed to the Group (478) (943) (49.4)
ROE (earnings divided by average equity) - - Cost-to-income (administrative expenses divided by gross income) - - NPL ratio 33.5% 32.2% NPL coverage ratio (covering risks classified as Stage 3) 83.4% 49.9%

447Statutory information
The good management of real estate assets continues, net lending declined by -65.5% year-on-year and net real estate exposures declined by -71.6%, due to the reclassification of institutional portfolios as non-current assets held for sale. Intra-group funding amounted to 10,281 million euros, -18.6% less than in the previous year. Million euro
22018 22017 CChange (%) year--oon--
yyear AAssets 111,907 115,384 ((22.6)
Customer lending (net) excluding repos 1,332 3,865 (65.5) Real estate exposure (net) 959 3,372 (71.6)
LLiabilities 110,791 113,728 ((21.4)
On-balance sheet customer funds 235 104 126.8 Intragroup financing 10,315 12,627 (18.3)
AAllocated capital 11,116 11,656 ((32.6)
OOff--bbalance sheet customer funds 335 227 332.0 OOther indicators
Employees 1,073 1,018 5.4 Branches - - -
33 – LIQUIDITY AND CAPITAL RESOURCES 3.1 Liquidity
The key aspects in the evolution of liquidity during the year at Group level were as follows: The institution has continued to generate a liquidity gap in its commercial business, reducing total funding in
wholesale markets. The Loan to Deposit (LtD) ratio of the Group at the end of December 2018 stood at 101.6%. The institution has made the most of its issuance windows in a market whose evolution in 2018 has been
determined by volatility and widening spreads. 2,165 million euros in capital market funding matured in the year. Banco Sabadell carried out public issues under the Fixed-Income Scheme in force amounting to a total of 436 million euros. Specifically, it carried out one issue of eight-year covered bonds in December of 390 million euros, which was fully subscribed by the European Investment Bank (EIB), 6 issues of preferred senior debt maturing between five and seven years and amounting to a total of 23 million euros and two issues of structured bonds, also amounting to 23 million euros. Under the EMTN Programme, on 7 September 2018 Banco Sabadell carried out one 5.5-year issue of preferred senior debt of 750 million euros, and on 12 December it carried out one subordinated Tier 2 issue of 500 million euros, maturing after 10 years, with an early call option in favour of Banco Sabadell in the fifth year.
Banco Sabadell sold a total of 455 million euros from tranche A of the asset securitisation IM Sabadell PYME 11 to
the EIB for the funding of two new lines. The positive trend in terms of rating upgrades has continued in 2018. On 19 September 2018 S&P Global Ratings
affirmed Banco Sabadell’s long-term credit rating of BBB, after raising it to BBB from BBB- on 6 April. In the same vein, both Moody’s and DBRS confirmed the long-term rating of Baa2 and BBB (high) respectively, raising the outlook to positive from stable in April and July 2018. Furthermore, with the bank’s rating upgrade, the rating of its covered bonds has also improved. Specifically, in April, Moody’s upgraded the rating to Aa1 from Aa2 and DBRS raised its rating to AAA from AA in July 2018.
The institution has maintained a liquidity buffer in the form of liquid assets to meet any eventual liquidity needs.
In terms of the LCR, as of 1 January 2018 the regulatory minimum LCR requirement is 100%. All of the institution’s
Liquidity Management Units (UGLs, for their acronym in Spanish) have comfortably surpassed this minimum. At Group level, the institution’s LCR has consistently been substantially above 100% throughout the year. As at December 2018, the LCR stood at 168% for the Group (excl. TSB) and at 298% in TSB. As regards the Net Stable Funding Ratio (NSFR), which is still pending its final definition, the institution has continued to maintain stable levels above 100%.

448 Banco Sabadell Annual report 2018
Key figures and basic liquidity ratios as at year-end were as follows: Million euro
22018 22017 EEx TSB
22018 EEx TSB
22017
Gross lending to customers excluding repos 145,824 145,323 111,673 109,742
Allowances for loan losses and country risk (3,433) (3,727) (3,211) (3,646) Brokered loans (2,808) (3,835) (2,426) (3,110)
AAdjusted net loans 1139,583 1137,761 1106,036 1102,986
On-balance sheet customer funds 137,343 132,096 104,859 97,686
AAdjusted lloan to deposit ratio (%) 1101.6 1104.3 1101.1 1105.4 The EUR/GBP exchange rate used for the balance sheet is 0.8945 at 31/12/18 and 0.8872 at 31/12/17.
The main sources of funding as at the end of 2018 are shown below according to the type of instrument and counterparty:
For further information regarding the Group’s liquidity management, strategy and evolution, see Note 4 on Risks, under the Liquidity Risk section, in the notes to the annual financial statements.

449Statutory information
33.2. Capital resources Note 5, “Own funds and capital management ”of the Group’s consolidated report contains a detailed report of its capital management (regulatory framework, detailed data and capital-related activity). The main figures related to capital management are shown below: Percentage / million euro
2018 2017
CET1 12.0 13.4 Tier 1 13.4 14.3 Tier 2 2.1 1.7 BIS ratio 15.5 16.1 Capital base 12,434 12,459 Minimum capital requirements 6,422 6,258 Risk weighted assets 80,279 77,505
Note 5 of the annual report explains the main changes compared with the previous year in terms of regulations, the evolution of risk-weighted assets (RWAs) and the main components of own funds. In recent years, Banco Sabadell has been actively managing its capital, which is a crucial aspect for the institution’s growth. In the past few years, the bank has increased its capital base through issues classed as core tier one capital, as shown in the table below: Million euro
Amount Impact on capital
February 2011 Debt-for-equity swap (equity through accelerated book building and buy-back of preference and subordinated stock) 411 +68 bp of core tier I
February 2012 Preference share swap for ordinary shares 785 +131 bp of core tier I March 2012 Capital increase 903 +161 bp of core tier I
July 2012 Swap of Banco CAM preferred debt instruments and subordinated debt instruments for shares
1,404 +186 bp of core tier I
September 2013 Accelerated bookbuilding and capital increase with rights 1,383 +178 bp of core tier I
October 2013 Issue of Mandatory Convertible Subordinated Bonds for B. Gallego hybrid swap
122 +17 bp of core tier I
April 2015 Capital increase with pre-emptive subscription rights – TSB 1,607 +181 bp of core tier I Note: The impact on capital (in basis points) is calculated using figures at each year-end reporting date; these figures have changed significantly due to the increase in the Group's consolidation scope in recent years.
4 – RISKS During 2018, Banco Sabadell Group has continued to strengthen its risk management framework by making improvements in line with best practices in the financial sector. For more details regarding the corporate risk culture, the risk appetite framework and the overall organisation of the risks function, as well as the main financial and non-financial risks, see Note 4 on Financial Risk Management in the consolidated annual financial statements for 2018. This year’s main milestones in terms of the Group’s risk management have been the improvement of the Group’s risk profile, with highlights including the Group's reduction of its non-performing assets as a result of its institutional portfolio sales in the second quarter of 2018, the strengthening of the risk management and control environment, as well as the improvement in the monitoring environment and the management of non-performing assets, as explained in greater detail in Note 4 of the annual report. 5 – POST-BALANCE SHEET EVENTS Since 31 December 2018, there have been no significant events worthy of mention.
450 Banco Sabadell Annual report 2018
66 – EXPECTED FUTURE DEVELOPMENTS Banco Sabadell adopts strategic plans in which it sets out its objectives for subsequent years in line with the macroeconomic, business and regulatory environment. Following the success of the Triple strategic plan, which covered the period between 2014 and 2016, Banco Sabadell began 2017 with a one-year strategic plan, as this year represented a year of transition, in which TSB’s IT platform was constructed, banking business was strengthened, the pace of NPAs reduction was increased, with a reduction of over 3.4 billion euros, and a number of corporate transactions were successfully closed (Sabadell United Bank, Hotel Investment Partners, etc.), which contributed to strengthening provisions and increasing capital. In 2018 Banco Sabadell presented its new three-year Strategic Business Plan, which sets the strategic pillars with which to take on the new economic cycle. The aims of this Plan are consistent with the values and objectives that have characterised the institution since its inception. Profitability, sustainability and the creation of value are the objectives based on which this Strategic Business Plan has been formulated. 2018 has also been a particularly important year for Banco Sabadell, as during the year it has achieved two major milestones, allowing it to begin a new chapter in which it will focus on improving profitability by growing the business, improving efficiency and normalising the cost of risk. These two milestones include the sale of foreclosed assets amounting to a gross value of 12 billion euros, along with the sale of 80% of the company managing such assets, Solvia Servicios Inmobiliarios, and the migration of TSB to a new IT platform, which will allow the institution to achieve operational independence and to become a bank with one of the most cutting-edge technological platforms in the United Kingdom, which is fully adapted to the challenges of the digital age. Similarly, during the year, the credit rating agency S&P Global Ratings upgraded the credit rating of Banco Sabadell from BBB- to BBB with a stable outlook. In 2019, Banco Sabadell will focus on improving its profitability and on continuing to grow and consolidate its position in the main markets in which it operates, improving efficiency whilst simultaneously continuing to reduce its problematic exposures and increase its level of solvency and liquidity. Banco Sabadell will also focus on continuing to develop the technological capabilities required to offer a value proposition, and to promote the attraction of all-round talent in order to undertake the institution’s commercial and digital transformation and its adaptation to a changing environment like the one that exists at present. Lastly, Banco Sabadell will continue to create value for all of its stakeholders, by distributing an attractive dividend among its shareholders, whilst offering a wide range of high-quality products and services to its customers and strengthening its human capital, addressing the professional concerns and expectations in terms of the motivation and recognition of its employees. The foregoing will be achieved without losing sight of Banco Sabadell’s commitment to society and the environment in all of the regions in which it operates, through the ethical and responsible performance of its business activity. 7 – RESEARCH, DEVELOPMENT AND INNOVATION In domestic terms: In Commercial Banking, the primary aspects of the transformation that has taken place in 2018 have been the consolidation of capabilities developed under the direct management model and the progress made in the new retail model, which focuses on management through a multi-channel vision of customers and the use of a single customer portfolio. This model has been coupled with a set of actions intended to simplify and centralise activities carried out by the portfolio manager together with an assessment of the model used for assigning incentives and for management control. During the year, the assisted management capabilities have been deployed to the branch network, providing managers with new tools, improving their usability and complementing the available product offering. The roll-out of the new portfolio (CRM) for direct management began in the final quarter of the year, and the plan is to launch the portfolio in Commercial Banking branches in the first half of 2019. Activity in relation to digital capabilities has achieved the challenges set out in the digital sales plan, with notable milestones including the 67% growth of online loans, the 27% increase in activations of the Expansión line, the 55% growth in instalment transactions paid for using credit cards and the 3.7% increase in instalment transactions paid for using debit cards. 35 new commercial events have also been launched. Within Sabadell Wallet, the number of connections has increased by 1.4x and downloads are up 55%. The roll-out of the insurance transformation plan has been completed, with a personalised fee for households and merchants, and new products and capital reduction simulations have also been included. Customer data systems have been adapted to the General Data Protection Regulation (GDPR), to enable the continuity of the model for commercial actions which was subject to the regulation. The initiatives envisaged in the Profit Margin Plan (‘Plan de Margen’) have been activated, and progress is being made in the direct debits management model.

451Statutory information
In terms of regulatory matters, we have been preparing ourselves for the first commitments of the Payment Services Directive (PSD2), achieving the milestones set for 2018 and preparing ourselves for its roll-out in 2019; we have completed our project to adjust to the new Insurance Distribution Directive (IDD) in order to ensure our business continuity. Within the area of Financial Markets and Private Banking, particularly in the area of Sabadell Inversor, we have launched an online reporting system, deploying a significant number of reports through BSOnline.The roll-out of Sabadell Móvil is scheduled for the first quarter of 2019. In Asset Management, we have completed the IT adjustment stage for the funds management firm in Luxembourg, and Sabadell Forex has been rolled out. In MiFID II, the areas of improvement detected following its launch have been implemented, and all of the regulatory requirements arising from the Securities Market reform have been deployed. In Treasury, we will end the year with the roll-out of MUREX VaR, which provides with a far simpler, more scalable and multi-entity solution with the integration of TSB’s activity, allowing us to prepare for the FRTB. In the opening of the FOREX books, the technological foundation for the sale of the FX products which will be launched in 2019 has been deployed. In terms of our foreign branches, we have opened a new branch in Lisbon, gradually and continuously deploying the resources required to operate the branch in order of priority. BSOnline Lisboa is scheduled to open in the first quarter of 2019. In terms of TSB: 2018 has been a year closely linked to the project to migrate TSB to the Proteo4UK platform. We have managed to develop a platform based on state-of-the-art architecture, offering multi-channel features across a shared environment and infrastructure. This functionality has been vital in providing online, mobile and telephone banking services and even in CRM, under a common layer made up of business components, thereby reducing the complexity of creating each new channel. Proteo4UK is built on an architecture that is clearly aimed at distributed services, and entails a renovation of IT systems, contributing greater scalability, cloud capabilities and making it easier to integrate external systems without coupling. Thus, the platform has an internal and external back-end layer, which adapts easily and quickly to the business needs of each unit involved. Systems such as payments, cards and fraud have benefited from strategic partnerships, contributing added value in a simpler and more direct way. The various channels, in addition to being fully integrated within internal systems, have benefited from a high level of personalisation. The web channel, which provides TSB with best-in-class digital capabilities and tools, also offers classic online banking options and new and much more automated application processes: any new TSB customer may apply for and acquire products and operate with them in just a few minutes, in a fully remote process. Mobile banking, which has traditionally included the most cutting-edge developments, has been consolidated in TSB as the main operating channel, as it is user-friendly and can be accessed at any time of day. Telephone banking has benefited from the integration with internal systems and can provide customers with a more personalised experience, and it has thus established itself as an alternative channel. It is also integrated with CRM which, based on one of the main market products, facilitates the work of TSB’s customer care services by offering a 360° vision of customers. Thanks to all of the developments that have taken place in the various areas, TSB has been able to consolidate its position in the digital world.

452 Banco Sabadell Annual report 2018
88 – ACQUISITION AND DISPOSAL OF TREASURY SHARES For information on the acquisition and disposal of treasury shares, see Note 23 to the consolidated annual financial statements. 9 – OTHER RELEVANT INFORMATION a) Shares and share price information A series of indicators relating to the bank’s share price performance are shown in the following table: Change (%) year--on--
year 2018 2017
Shareholders and buybacks Number of shareholders 235,523 235,130 0.2 Average number of shares (million) 5,565 5,570 (0.1) Average daily buybacks (millions of shares) 27 27 (0.1)
Share price (euro) Start date 1.656 1.323 - Maximum 1.945 1.960 - Minimum 0.950 1.295 - End date 1.001 1.656 - Market capitalisation (million euro) 5,568 9,224 -
Market ratios Net attributed earnings per share (EPS) (euro) 0.05 0.14 - Book value per share (euro) 2.25 2.41 - Price/book value 0.45 0.69 - PER (share price / EPS) 20.11 11.85 -
b) Dividend policy The bank’s shareholder remuneration policy, in accordance with the bank’s Articles of Association, is submitted to shareholders for approval on a yearly basis at the Annual General Meeting. In 2017, the bank compensated shareholders with 0.07 euros per share through 100% cash remuneration. This distribution was carried out through an interim dividend of 0.02 euros per share and a supplementary dividend of 0.05 euros per share. This amount represented returns on the quoted share price of 4.2%. On 25 October 2018, the Board of Directors agreed to distribute an interim dividend of 2018 earnings amounting to a total of 110,953 thousand euros (0.02 euros (gross) per share), paid on 28 December 2018. Furthermore, the Board of Directors will submit a proposal at the Annual General Meeting on the distribution of a gross dividend of 0.03 euros per share for 2018. Over the coming years, Banco Sabadell anticipates maintaining cash payments as remuneration to shareholders. c) Credit ratings management In 2018 the three agencies that assessed the credit quality of Banco Sabadell were S&P Global Ratings, Moody’s and DBRS. The current ratings, and the last dates on which they were affirmed, are as follows: Long--term Short--term Outlook Last updated
DBRS BBB (high) R-1 (low) Positive 16/07/2018 S&P Global Rating BBB A-2 Stable 19/09/2018 Moody´s Investors Service (*) Baa3 / Baa2 P-3 / P-2 Stable / Stable 19/09/2018
(*) Corresponds to senior debt and deposits, respectively.
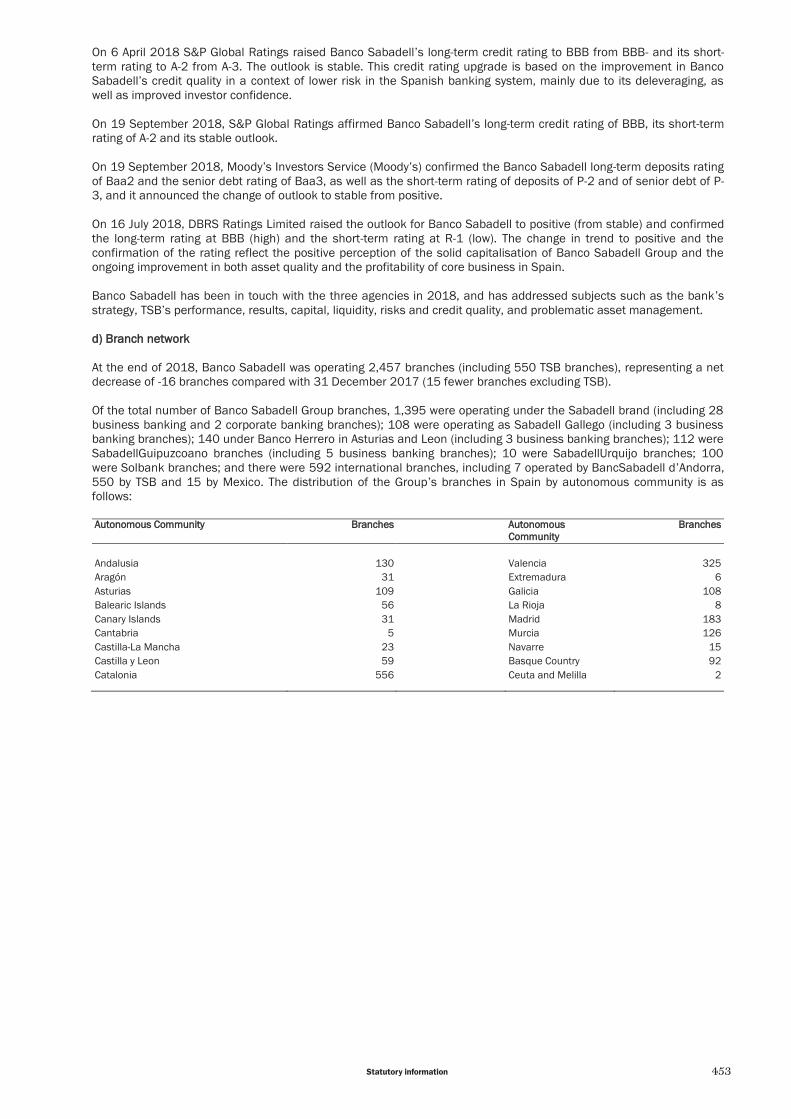
453Statutory information
On 6 April 2018 S&P Global Ratings raised Banco Sabadell’s long-term credit rating to BBB from BBB- and its short-term rating to A-2 from A-3. The outlook is stable. This credit rating upgrade is based on the improvement in Banco Sabadell’s credit quality in a context of lower risk in the Spanish banking system, mainly due to its deleveraging, as well as improved investor confidence. On 19 September 2018, S&P Global Ratings affirmed Banco Sabadell’s long-term credit rating of BBB, its short-term rating of A-2 and its stable outlook. On 19 September 2018, Moody’s Investors Service (Moody’s) confirmed the Banco Sabadell long-term deposits rating of Baa2 and the senior debt rating of Baa3, as well as the short-term rating of deposits of P-2 and of senior debt of P-3, and it announced the change of outlook to stable from positive. On 16 July 2018, DBRS Ratings Limited raised the outlook for Banco Sabadell to positive (from stable) and confirmed the long-term rating at BBB (high) and the short-term rating at R-1 (low). The change in trend to positive and the confirmation of the rating reflect the positive perception of the solid capitalisation of Banco Sabadell Group and the ongoing improvement in both asset quality and the profitability of core business in Spain. Banco Sabadell has been in touch with the three agencies in 2018, and has addressed subjects such as the bank’s strategy, TSB’s performance, results, capital, liquidity, risks and credit quality, and problematic asset management. dd) Branch network At the end of 2018, Banco Sabadell was operating 2,457 branches (including 550 TSB branches), representing a net decrease of -16 branches compared with 31 December 2017 (15 fewer branches excluding TSB). Of the total number of Banco Sabadell Group branches, 1,395 were operating under the Sabadell brand (including 28 business banking and 2 corporate banking branches); 108 were operating as Sabadell Gallego (including 3 business banking branches); 140 under Banco Herrero in Asturias and Leon (including 3 business banking branches); 112 were SabadellGuipuzcoano branches (including 5 business banking branches); 10 were SabadellUrquijo branches; 100 were Solbank branches; and there were 592 international branches, including 7 operated by BancSabadell d’Andorra, 550 by TSB and 15 by Mexico. The distribution of the Group’s branches in Spain by autonomous community is as follows: Autonomous Community Branches Autonomous
Community Branches
Andalusia 130 Valencia 325 Aragón 31 Extremadura 6 Asturias 109 Galicia 108 Balearic Islands 56 La Rioja 8 Canary Islands 31 Madrid 183 Cantabria 5 Murcia 126 Castilla-La Mancha 23 Navarre 15 Castilla y Leon 59 Basque Country 92 Catalonia 556 Ceuta and Melilla 2

454 Banco Sabadell Annual report 2018
The Group is present in the following countries:
CCountry BBranches RRepresentative Offices SSubsidiaries & Investees
EEurope Andorra • France • Poland • Portugal • United Kingdom • • Turkey • AAmericas Brazil • Colombia • • United States • • Mexico • Peru • United States • Venezuela • AAsia China • United Arab Emirates • India • Singapore • AAfrica Algeria • Morocco •

455Statutory information
NNon-financial disclosures report Pursuant to that set forth in Law 11/2018 of 28 December, on non-financial and diversity disclosures, Banco Sabadell Group has prepared its non-financial disclosures report for 2018, which forms part of this report, pursuant to Article 44 of the Spanish Code of Commerce, and is included herein as a separate document. Corporate Governance As required by Article 540 of the Spanish Capital Companies Act, Banco Sabadell Group has prepared an Annual Report on Corporate Governance for the year 2018, which, in accordance with Article 49 of the Spanish Commercial Code, forms part of this Directors ’Report, included herein as a separate document, and which includes a section on the extent to which the bank is following recommendations on corporate governance that currently exist in Spain. Information on Corporate Governance is available on the Group’s corporate website (www.grupobancosabadell.com), and can be accessed directly from the “Corporate Governance and remuneration policy ”link on this website’s homepage.

456 Banco Sabadell Annual report 2018
GGlossary of terms on performance indicators In the presentation of its results to the market, and for the purpose of monitoring the business and decision-making processes, the Group uses performance indicators pursuant to the generally accepted accounting regulations (EU-IFRS), and also uses other non-audited measures commonly used in the banking sector (Alternative Performance Measures, or “APMs”) as monitoring indicators for the management of assets and liabilities, and the financial and economic situation of the Group, which facilitates its comparison with other entities. Following the ESMA guidelines on APMs (ESMA/2015/1415es of October 2015), the purpose of which is to promote the use and transparency of information for the protection of investors in the European Union, the Group presents below, for each APM, the definition, calculation and reconciliation

457Statutory information
APM
s re
conc
iliat
ion
(dat
a in
mill
ion
euro
s, w
ith th
e ex
cept
ion
of th
ose
show
n in
per
cent
ages
).
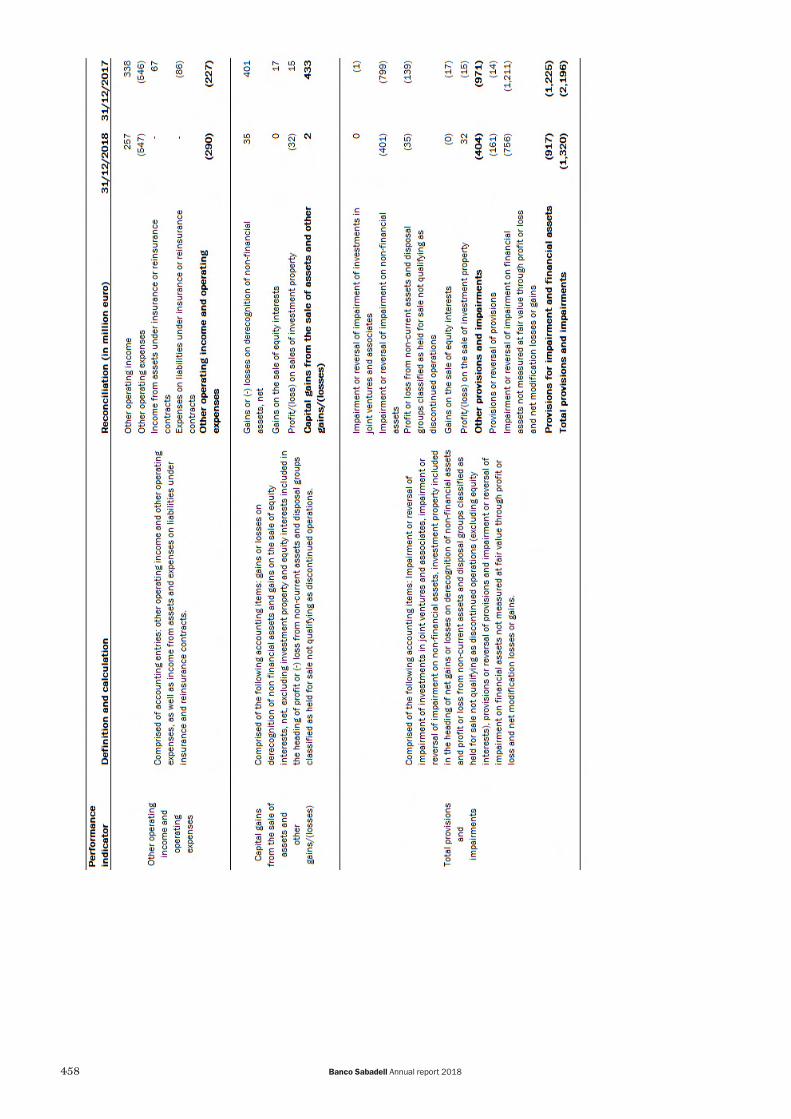
458 Banco Sabadell Annual report 2018

459Statutory information

460 Banco Sabadell Annual report 2018

461Statutory information

462 Banco Sabadell Annual report 2018
463Statutory information
BANCO SABADELL
NON-FINANCIAL DISCLOSURES REPORT
2018

464 Banco Sabadell Annual report 2018
CCONTENTS 1. Information regarding environmental matters
1.1. Pollution 1.2. Circular economy and waste prevention and management 1.3. Sustainable use of resources
1.3.1. Energy consumption 1.3.2. Water consumption 1.3.3. Paper consumption
1.4. Climate change 1.5. Other information regarding environmental matters
1.5.1. Environmental risk assessment 1.5.2. Financing and investment in renewable energies
2. Information regarding corporate and staff related matters 2.1. Employment
2.1.1. Banco Sabadell workforce information 2.1.2. Recruitment 2.1.3. Remuneration
2.2. Work organisation, health and safety 2.2.1. Leadership management 2.2.2. Work/life balance 2.2.3. Health and safety
2.3. Workplace Relations 2.3.1. Communication 2.3.2. Participation
2.4. Training 2.5. Equality 2.6. Universal accessibility for people with disabilities
3. Information regarding human rights
4. Information regarding the fight against corruption and bribery
5. Information regarding society 5.1. Commitment to sustainable development
5.1.1. Transparency, simplification and accessibility 5.1.2. Sustainable finance 5.1.3. Social housing management 5.1.4. Financial education 5.1.5. Corporate Volunteer Scheme 5.1.6. Social action and sponsorship
5.2. Consumers, outsourcing and suppliers 5.2.1. Consumers 5.2.2. Outsourcing and suppliers
5.3. Tax information
ANNEX 1 Corporate standards and institutional commitments ANNEX 2 Table of contents Law 11/2018

465Statutory information
Banco Sabadell S.A. (hereinafter, Banco Sabadell, the bank or the Group) is a financial institution which primarily carries out its activities in the Spanish market. It has a significant subsidiary in the United Kingdom, TSB, which is a British retail bank, as well as a banking institution in Mexico. The corporate information and subsidiaries forming part of the Group, as well as its business model, are listed in the Directors Report. The development of the Group's business is geared towards profitable growth that generates value for shareholders through a business diversification strategy based on profitability, efficiency and service quality, with a conservative risk profile within the framework of ethical and professional codes and taking into account the interests of the various stakeholders. The management model is focused on long-term customer retention, through ongoing activities intended to build customer loyalty based on taking initiatives and being proactive in the relationship with customers. The bank has a comprehensive offering of products and services, a qualified workforce, an IT platform that supports growth and a constant focus on the pursuit for quality. Banco Sabadell has an internal governance framework, which has been updated by the Board of Directors in its meeting in January 2019. This framework describes, amongst other aspects, the shareholder structure, governance bodies, the Group’s structure, the composition and functioning of corporate governance, internal control functions, key governance matters, the risk management framework and Group policies. Information on the organisation, markets, objectives and strategies, as well as the principal factors and trends which can impact the evolution of the business are described in detail in the Directors’ Report for the year. Banco Sabadell carries out its business in an ethical and responsible manner, managing its commitment to society in such a way as to ensure that its activity has a positive impact on people and the environment. Each and every person in the organisation has a part to play in applying the principles and policies of corporate social responsibility, thus also guaranteeing quality and transparency in customer service. In addition to complying with applicable regulations, Banco Sabadell has a set of policies, internal rules and standards and codes of conduct that guarantee this ethical and responsible behaviour throughout the organisation, and which address all of the Group’s activity. The bank has the necessary instruments in place to measure the outcome of these policies, the principal risks and the establishment of corrective measures, if necessary. Banco Sabadell has a Corporate Ethics Committee, to which the matters relating to Corporate Social Responsibility are reported, as well as a cross-cutting Corporate Social Responsibility Committee, which covers all matters related to corporate social responsibility throughout the organisation. It is formed of the various units responsible for such matters and coordinates all of the actions taken by the organisation in this regard. Since 2003, Banco Sabadell has published a report indicating all of the actions, policies and initiatives which, aside from its core mission to be a provider of financial products and services, constitute the responsible performance of its business activities, its commitment to its various stakeholders, to the environment and to society in all of the regions in which it operates. In 2018, this Non-Financial Disclosures Report, which forms part of the consolidated Directors’ Report for 2018 of Banco Sabadell Group, and which is annexed to this consolidated report as a separate document, complies with the general provisions published in Law 11/2018 of 28 December, amending Articles 44 and 49 of the Code of Commerce in relation to non-financial and diversity disclosures, using this Non-Financial Disclosures Report as a framework.

466 Banco Sabadell Annual report 2018
11. INFORMATION REGARDING ENVIRONMENTAL MATTERS As part of its Corporate Social Responsibility Policy, approved by the Board of Directors in 2003, and specifically, in its Environmental Policy approved by the Board of Directors in 2009, Banco Sabadell defines the framework of its commitment to environmental sustainability and to combat climate change. This framework focuses on minimising the environmental impacts of the processes, facilities and services inherent to the business, managing business-related risks and opportunities appropriately, and fostering the commitment to the environment of the people with whom the bank comes into contact. In this regard, the Bank is a signatory of the Equator Principles, the Carbon Disclosure Project (CDP) and its Water Disclosure programme. Nonetheless, it is worth highlighting that the activities carried out by the bank do not have a major negative impact on the environment. In terms of environmental training and awareness, the entire workforce has access to an online course, completion of which is compulsory for all employees in certified corporate buildings. Using the internal platform “BS Idea” employees can submit their proposals for the improvement of environmental aspects and of the organisation's actions to combat climate change. TSB follows an independent environmental management system which is in line with legislation in the United Kingdom. In this regard, the bank is committed to the responsible use of resources and implements measures to improve their environmental impact, such as, for example, a reduced use of vehicles, waste collection and a post service. All of this is reflected in the bank's Directors’ Report. It is also worth highlighting that the IT Migration Project carried out in 2018 shall lead to substantial energy consumption savings, and it will also facilitate the measurement and reporting of consumption. Furthermore, in new branch openings all of the computer systems comply with high energy efficiency standards. 1.1 Pollution Banco Sabadell is a signatory of the Carbon Disclosure Project, thus undertaking a commitment to actively combat climate change. In 2015, a new CO2 emissions reduction target of 3% was set for the 2015-2020 period in Spain. To do so, each year the bank implements energy efficiency measures in its installations, as well as in its services. These measures become particularly relevant with regards to the contracting of energy with a renewable source guarantee, which has enabled the bank to achieve a 99.85% reduction in scope 2 emissions in comparison to 2014. With regards to the impact related to business trips and travel, environmental and expenditure rationalisation criteria are applied, favouring the use of transport with the lowest level of CO2 emissions and for “in itinere” travel, the use of the internal car-pooling platform is encouraged. This information is shown in the table below.
1.2 Circular economy and waste prevention and management In all of the Group’s facilities in Spain, paper waste is treated as confidential documentation to be destroyed, and 100% of the waste is recycled by authorised waste managers. The corporate centres and branches are equipped with facilities for the collection of packaging, organic matter and batteries. Together with Ricoh and the HP Planet Partners programme, the collection and reuse of used toner cartridges is carried out, together with the management of electronic waste through authorised waste managers. Specific control mechanisms exist for waste management in branches due to be closed or merged. Surplus computer equipment and furniture in good condition at branches or work centres due to be closed or merged are donated by the bank to NGOs and local non-profit organisations.
CO22 ttn 2018 2017 2016 2015 2014
Scope 1 / Direct activities: emissions generated by company facilities and vehicles 1,151 763 648 600 552
Scope 2/Indirect activities: emissions due to electricity consumption in Spain 20 22 54 3,321 12,890 Scope 3/ Other indirect activities: emissions derived from business trips (plane, train and car) 3,940 3,337 3,477 3,862 3,143
Total CO22 eemissions generated by the Group in Spain 5,111 4,122 4,179 7,783 16,585 Total CO22 eemissions generated per employee 0.3 0.2 0.2 0.5 1.0

467Statutory information
1.3. Sustainable use of resources As regards the bank’s own infrastructure, Banco Sabadell has an environmental management system (EMS) that follows the international ISO 14001 standard and six certified corporate buildings in Spain. 16.22% of the Bank’s national workforce work in one of these certified buildings. In parallel, the environmental management system is being progressively rolled out in the rest of the work centres. 1.3.1. Energy consumption In 2018, Banco Sabadell’s total energy consumption in Spain amounted to 86,398 MWh. In 2018, electrical consumption in Spain reached 81,962MWh (compared to 82,824 MWh in the previous year) with 99.96% of energy deriving from renewable sources, mainly through Nexus Renovables, an energy supplier with 100% renewable source guarantee. Using 2014 as a baseline year, a reduction of 99.85% has been achieved in terms of CO2 emissions in electrical consumption (scope 2). With the objective of reducing its energy consumption, Banco Sabadell continuously develops measures to improve the eco-efficiency of its facilities and processes: - The majority of the branch network is equipped with a centralised low energy consumption HVAC and lighting
system, and light activation systems for billboard advertising adapted to daylight hours. Additionally, the majority of branches are equipped with Thin Client computers (central branch network infrastructure, whereby applications and software are virtually linked to servers) which consume 90% less energy. Since 2015 the implementation of these computers has also been initiated in corporate buildings.
- Additionally, the corporate buildings are equipped with motion sensitive lighting systems and LED (Light Emitting Diode) lamps. In these corporate buildings and larger offices, HVAC installations are equipped with energy recovery systems.
1.3.2. Water consumption Group water consumption in Spain is limited to sanitary use and for the watering of certain landscaped areas. 100% of the water consumed comes from the supply network. The Group’s headquarters are located in urban areas where the water collected and discharged is done so through the urban network. With regard to eco-efficiency, bathroom facilities and taps are fitted with water-saving mechanisms. In this regard, the Bank’s headquarters in Sant Cugat are fitted with a device that collects rainwater and greywater to reuse it as irrigation water. At the same time, the landscaped areas are comprised of native plants with low irrigation requirements.
TTotal eelectrical eenergy consumption 22018 22017 22016
Total energy consumption (MWh) 81,962 82,824 89,809 Electrical energy supplied by Nexus Renovables (100% renewable source guarantee) (% of supply of total electrical energy) 99.94% 99.93% 99.84%

468 Banco Sabadell Annual report 2018
Paper consumption in Spain in 2018 amounted to 1,047 tonnes. During the previous year, the bank has carried out the following actions to reduce the consumption of paper: - 24 hour service for customers through remote channels and digital platforms. - The use of tablets and digital systems in the branch network enables customers’ signatures to be captured, and
eliminates the use of pre-printed paper. - All of the Group’s printers are configured to print on both sides of paper by default. - The conventional paper used by the bank is certified by the quality and environmental management system ISO
9001/ISO 14001, and its production is chlorine-free under the criteria of the FSC (Forest Stewardship Council). It is worth highlighting that since July 2018 the exclusive use of recycled DINA4 paper has been extended to the entire branch network.
- Elimination of the automatic printing of a customer copy, unless a customer specifically requests a copy.
1.4. Climate Change In 2018 a Climate Change Task Force has been created and it is responsible for preparing the implementation of the TCFD (Task Force on Climate-related Financial Disclosures). Furthermore, the use of videoconferencing for meetings and one-to-one meetings, teleworking pilots as well as the use of virtual communities for areas such as learning and continuous training is also encouraged. Teleworking pilot schemes lay the foundations for the future availability of teleworking to a larger section of the workforce. There are multiple objectives and impacts of doing so, ranging from an enhanced work-life balance, to an obvious saving in time, energy and emissions. The bank has adopted measures to improve the reduction of CO2 emissions via its commercial offering of products. In terms of renting, the range of sustainable vehicles has been increased (with emissions equal to or less than 120gr CO2/km), and these currently make up 78% of the current fleet of vehicles, with a permanent offering of ECO vehicles. Additionally, Banco Sabadell has contributed to the sustainable movement of employees by encouraging rentals of 100% electrical vehicles by staff through its offering of 60 vehicles of this type. In order to provide a solution to traffic restrictions in the centre of large cities such as Madrid, a specific offering of low emission vehicles has been developed to guarantee access to this capital city, which will be extended in January to the rest of large Spanish cities. With regards to research, the Banco Sabadell Foundation Award for Economic Research has been awarded to Dr Díaz Anadón for her work in the area of climate change, which combines research with the development of public policies, quantifying the role that new energy technologies (solar, wind or nuclear) could play in reducing C02 emissions and sector costs. 1.5. Other information regarding environmental matters Beyond the responsible management of environmental sustainability with regard to the bank’s own infrastructures, consumption and emissions, certain business activities with regards to financing and investment also impact the environment, therefore the bank maintains a range of initiatives and commitments in the interest of sustainability.
PPaper consumption: 22018 22017 22016
Volume of paper (DIN4 format) used during the year (tonnes) 1,047 988 1,062 Use of recycled paper in branches and corporate buildings in relation to total paper consumption (white and recycled) in Spain (%)
52% 9% 9%
Use of recycled paper in 13 corporate buildings with a post service in relation to total paper consumption (white and recycled) in Spain (%)
87% 80% 84%

469Statutory information
1.5.1. Environmental risk assessment Since 2011, Banco Sabadell is a signatory of the Equator Principles, a voluntary international framework of policies, standards and guidelines coordinated by the International Finance Corporation (IFC), a sister organisation of the World Bank, which aims to determine, assess and manage environmental and social risks relating to structured finance projects for the amount of 10 million dollars or more, and corporate loans from 100 million dollars onwards. Under these standards, a social and environmental risk assessment of the possible impacts is carried out, addressing in some cases minimisation, mitigation and adequate offsetting, which is reviewed by an independent expert. Banco Sabadell publishes an annual report on its corporate website which includes detailed information of each one of the projects related to the Equator Principles.
In 2018, Banco Sabadell signed 20 projects which incorporate the Equator Principles, 85% of which relate to renewable energy projects. SSector NNumber of
pprojects CCategory CCountry RRegion DDesignated ccountry
IIndependent rreview
RRenewable eenergies
10 B Spain Europe YES YES 2 B U.S. Americas YES YES 1 B Canada Americas YES YES
1 B United Kingdom Europe YES YES
3 B Mexico Americas NO YES
OOil and gas 1 B U.S. Americas YES YES 1 B Mexico Americas NO YES 1 B Peru Americas NO YES
The entire branch network has access to information to assist them in assessing any environmental risk associated with the sector or activity of the companies analysed. This assessment is also included in the risk management record in which the credit risk of the transactions is assessed, and which influences the decision-making process. 1.5.2. Financing and investment in renewable energies With regards to the business, Banco Sabadell encourages the development of a more sustainable energy model through direct investment in projects and renewable energy financing. Thus, Banco Sabadell, through its subsidiary Sinia Renovables, has commenced a new investment round (2016-2019) in which it will allocate 150 million euros in capital to this type of asset. In line with the Bank’s internationalisation strategy, which considers investments in Spain, Mexico, the United Kingdom and a number of Latin American countries, the first capital investments in Mexico have been carried out, which is where Sinia is present in 247MW wind farms, of which 99MW are in use and 148MW are under construction for 2019. Sinia has an additional portfolio in Spain, comprised of its presence in 70MW in wind, 3MW in photovoltaic and 22.5MW in a hybrid thermosolar biomass plant. Based on these projects, renewable energy generation in Spain that is attributable to Sinia in 2018 totals 152 GWh, exceeding the electrical consumption of Banco Sabadell’s branches and corporate buildings. This renewable energy avoids the annual emission of almost 58 thousand tonnes of CO2. Equally, on a national scale, Banco Sabadell contributes to and participates in the Solar Forum (‘Foro Solar’), in which new developments and leadership in the Spanish photovoltaic industry are discussed. Another business line related to the environment is the financing of energy-efficient equipment and facilities by means of special-purpose renting and/or leasing products; these are used to finance projects in areas such as public lighting, biomass-fired boilers and cogeneration facilities.

470 Banco Sabadell Annual report 2018
22. INFORMATION REGARDING CORPORATE AND STAFF RELATED MATTERS Banco Sabadell’s Human Resources policy aims to support the transformation of the organisation, and focuses on the people forming part of the day-to-day business and its growth. The key objective is to maximise the value creation of the professionals who form part of Banco Sabadell through the development of their talent, the management of their expectations and making the most of their skills and abilities. During 2018 the management of Human Resources has been transformed, in order to strengthen its activity and ensure that such activity focuses on the significant challenges in the management of human capital as part of the next strategic plan: - Greater focus on talent development - Enhanced alignment between staff policies and business requirements - Focus on employee satisfaction Within the scope of TSB, actions related to supporting people and teams, before, during and after migration, particularly stand out. Furthermore, TSB’s effort to create an inclusive culture is also noteworthy, in which all TSB employees, independently of their gender, ethnicity, disability, sexual orientation, age or personal circumstances, can fulfil their potential. 2.1. Employment 2.1.1. Banco Sabadell workforce information
Total number and distribution of Group employees by: Gender 2018 2017
M 11,605 11,467 F 14,576 14,378 Total 26,181 25,845 Country 2018 2017
Algeria 3 3 Brazil 2 2 Colombia 6 6 Cuba 7 7 Arab Emirates 2 3 Spain 16,851 16,765 United States 240 229 France 20 22 India 4 4 Morocco 21 20 Mexico 462 312 Peru 6 5 Poland 3 3 Portugal 12 1 United Kingdom 8,388 8,319 Dominican Republic 4 2 Singapore 2 1 Turkey 3 3 China 6 6 Andorra 139 132 Total 26,181 25,845 Professional cllassification 2018 2017
Management 674 645 Middle Management 3,889 4,013 Specialists 16,991 16,701 Administrative staff 4,627 4,486 Total 26,181 25,845
The Management group includes executive directors, senior management, general management, corporate directors and TOP directors. ‘Middle Management’ includes directors not included in the definition of ‘Management Staff’.

471Statutory information
Age rrange 2018 2017
Younger than 31 3,255 2,986 Between 31 - 49 15,132 15,461 Older than 49 7,794 7,398 Total 26,181 25,845 Types of contracts held by the workforce in Spain:
2018 2017
Indefinite 16,681 16,621 Temporary 170 143 Total 16,851 16,764 Type of Contract -- AAverage contracts 2018 2017
Indefinite 16,706 16,622 Temporary 175 157 Total 16,881 16,779
Average Contracts -- GGender 22018 22017
M F Total M F Total
Indefinite 8,221 8,485 16,706 8,203 8,419 16,622 Temporary 82 93 175 84 72 157 Total 8,303 8,578 16,881 8,287 8,492 16,779
Average Contracts -- AAge raange 22018 22017
Indefinite Temporary Indefinite Temporary
Younger than 31 484 83 407 95 Between 31 - 49 10,869 80 11,272 54 Older than 49 5,353 12 4,943 7 Total 16,706 175 16,622 157
Average Contracts -- PProfessional category 22018 22017
Indefinite Temporary Indefinite Temporary
Management 474 - 441 - Middle Management 3,274 - 3,249 - Specialists 12,645 147 12,676 147 Administrative staff 313 28 256 10 Total 16,706 175 16,622 157 The Management group includes executive directors, senior management, general management, corporate directors and TOP directors. ‘Middle Management’ includes directors not included in the definition of ‘Management Staff’. The breakdown of part-time contracts is not provided, given that total part-time contracts in Spain in December 2018 amount to 20 (representing 0.12% of national contracts).

472 Banco Sabadell Annual report 2018
TTypes of contracts held by TSB workforce:
2018 2017
Indefinite 8,320 8,231 Temporary 33 56 Total 8,353 8,287 Type of contract -- AAverage contracts 2018 2017
Indefinite 8,198 8,335 Temporary 49 57 Total 8,247 8,392
Average contracts -- GGender 22018 22017
M F Total M F Total
Indefinite 2,737 5,461 8,198 2,760 5,575 8,335 Temporary 21 28 49 27 30 57 Total 2,758 5,489 8,247 2,787 5,605 8,392
Average Contracts -- AAge range 2018 2017
Indefinite Temporary Indefinite Temporary
Younger than 31 2,107 19 2,195 28 Between 31 - 49 3,977 28 4,049 26 Older than 49 2,114 2 2,091 4 Total 8,198 49 8,335 57
Average contracts -- PProfessional category 2018 2017
Indefinite Temporary Indefinite Temporary
Management 181 - 174 - Middle Management 297 8 295 5 Specialists 3,574 30 3,656 32 Administrative staff 4,146 11 4,210 21 Total 8,198 49 8,335 57
At TSB, there are currently no employees with part-time contracts. Number of employee dismissals in Spain by: Professional category 2018 2017
Management 5 3 Middle Management 25 22 Specialists 136 80 Administrative staff 4 22 Total 170 127
The Management group includes executive directors, senior management, general management, corporate directors and TOP directors. ‘Middle Management’ includes directors not included in the definition of ‘Management Staff’. Gender 2018 2017
M 102 74 F 68 53 Total 170 127 Age rrange 2018 2017
Younger than 31 5 4 Between 31 - 49 102 87 Older than 49 63 36 Total 170 127

473Statutory information
NNumber of employee dismissals at TSB by: Professional category 2018 2017
Management 4 Middle Management 7 Specialists 21 Administrative staff 56 Total 88 94 This information is not available by category in 2017 due to the change of system
Gender 2018 2017
M 28 40 F 60 54 Total 88 94
Age raange 2018 2017
Younger than 31 19 22 Between 31 - 49 35 33 Older than 49 34 39 Total 88 94
Employees with some form of disability in the Group by gender and professional classification:
22018 22017 M F M F
Management 3 - 10 3 Middle Management 13 3 18 12 Specialists 83 69 95 115 Administrative staff 4 13 - - Total 103 85 123 130
Group data as at 31/12/2018 ‘Management Staff’ includes executive directors, senior management, general management, corporate directors and TOP directors. ‘Middle Management’ includes directors not included in the definition of ‘Management Staff’. 2.1.2. Recruitment Banco Sabadell has a staff selection process which ensures that objective criteria based on professionalism and suitability are applied in finding the right person for each job and in relation to their potential career path at the entity. The Group seeks to ensure optimal professional development for its employees by encouraging them to excel and rewarding hard work. This mutual commitment is set out in the Banco Sabadell Group Code of Conduct and the internal mobility and recruitment policy.
Throughout 2018, a number of actions and projects have been initiated to strengthen and improve its procedures for attracting and recruiting talent to take on higher volumes of recruitment, new profiles and geographic dispersion. These are the factors that are making it necessary to redesign and update the procedures, skills, capabilities and technologies used to attract the best candidates and provide them with a professionally rewarding experience. In terms of external recruitment, digital capacities to attract talented persons have been reinforced through a new employment website (www.sabadellcareers.com) which has already received more than 38,000 visitors in the 5 months since it was launched, with the average visit time exceeding one and a half minutes, and with users visiting the site from Spain (+70%), USA (+13%) and Mexico (+4%). Furthermore, the editorial content and the reinforcement of digital capacities in our LinkedIn profile led to 20,000 new followers in the online community during 2018, ending the year with a total of 78,540 users.

474 Banco Sabadell Annual report 2018
This year the Data&Analytics Programme has been launched, which aims to incorporate professionals who have advanced data knowledge, to explore and analyse the information included in data, extracting maximum value for the purpose of personalising our products and services and to make strategic business decisions. 12 participants have joined through this Talent Incubator, with the bank ensuring the integration, participation and training of employees from this group of professionals, through systematic and continuous monitoring by their tutors and mentors. These actions have also led to a consolidation of our position as an employer in external reputation indicators. One notable achievement includes the attainment, once again, of a place in the Mercopersonas Top 25 (ranked number 21), a renowned Spanish corporate reputation monitor, which measures how attractive companies are as employers. The unique nature of the TSB project, TSB’s mission and the innovative nature of its employee initiatives have propelled TSB to be included in the Top 25 Best Places to Work in the United Kingdom, a ranking published in the prestigious Sunday Times. Specifically, it was included in the Top 5 in 2018. 2.1.3. Remuneration Banco Sabadell’s remuneration policies are consistent with the risk and business strategy objectives, corporate culture, the protection of shareholders, investors and customers, the Group's long term interests and values, as well as with customer satisfaction and the measures implemented to prevent conflicts of interest without incentivising excessive risk taking. In this regard, the Banco Sabadell Group Remuneration Policy is based on the following principles:
- Foster medium-long term business sustainability, as well as alignment with Group values. This entails:
- Aligning remuneration with shareholder interests and with the creation of long-term value. - Implementing rigorous risk management, considering measures to prevent conflicts of interest. - Aligning the Group's long-term business strategy, objectives, values and interests.
- Ensure the existence of a competitive and fair remuneration system (external competitiveness and internal
fairness):
- With the capacity to attract and retain best talent. - Which compensates professional experience and responsibility, independently of the employee’s gender. - That it is aligned with market standards, ensuring it is flexible to adapt to changes in the environment
and in the sector’s requirements.
- With regards to the Gender pay Gap, Banco Sabadell, when dealing with the same functions, responsibilities and seniority does not make any type of wage discrimination between genders when recruiting staff nor in its employees’ salary reviews.
In spite of this, in Spain, data has been analysed in an objective manner, carrying out a calculation of the total number of men and women, managing the different groups, managers, specialists and administrative staff without establishing any additional criteria, which results in a gap of 11.95%. During 2018 this gap has been reduced by 5.41%. This difference is primarily explained due to the lower seniority of females at the organisation. Additional measures have been specifically developed in addition to the measures mentioned earlier, in order to eliminate this gap:
- Increase in the representation of women in senior management roles. - 50% of promotions have been allocated to women (26% at management level) through a
focus/monitoring in the Performance Evaluation Committees, and unbiased candidate selection achieved through selection panels of 3 people in candidate shortlists.
- Equal salary action for women as well as for men and equal increase in total payroll. - Strict gender equality in the High Potential Development Scheme planned for 2019, which will provide a
pool of future managerial talent.

475Statutory information
These measures have resulted in the Bank receiving the Equality in the Workplace Seal of Distinction (“Distintivo de Igualdad en la Empresa”), awarded by the Ministry of the Presidency, Relations with the Cortes and Equality (Ministerio de Presidencia, relaciones con las cortes e Igualdad) of the Spanish Government. The Seal of Distinction recognises companies and other Spanish institutions which stand out in the development of Equality of Opportunities between women and men in the labour environment, through the implementation of equality plans and measures. The granting of this distinction is carried out through annual calls in which any company or entity can participate in, private as well as public, which stand out due to the application and results of equality between men and women in their organisation with regards to: working conditions, organisation models in other areas such as services, products and corporate publicity.
The gender pay gap at TSB is reported by following the methodologies and the calculations established by the Government of the United Kingdom at all times. The most recent study reflected a gender pay gap of 31%, based on the fixed remuneration of all employees as at 5 April 2018, and the variable remuneration of all employees in the previous year.
- Rewarding performance by aligning remuneration with individual results, and the level of risk assumed.
- Adequate balance between the various components of remuneration. - Consideration of risks and current and future results, whilst not incentivising risk taking that surpasses
the risk threshold tolerated by the Group. - Simple, transparent and clear remuneration scheme. This Policy shall be understandable and easily
communicated to all staff. All of these principles on which the Group Remuneration Policy comply with European Directives and Regulations and other regulations currently in force, particularly Law 10/2014 of 26 June, on the Regulation, Supervision and Solvency of Credit Institutions, Royal Decree 84/2015, of 13 February, implementing Law 10/2014, of 26 June, on the Regulation, Supervision and Solvency of Credit Institutions, EBA Guidelines EBA/GL/2015/22 of 27 June 2016, Guidelines on Sound Remuneration Policies under Articles 74(3) and 75(2) of Directive 2013/36/EU and the disclosure of information in virtue of Article 450 of Regulation (EU) 575/2013 (hereinafter, “ EBA/GL/2015/22 Guidelines”), EBA Guidelines on internal governance (GL 2017/11) of 26 September 2017, Bank of Spain Circular 2/2016 of 2 February, for Credit Institutions, on Regulation and Solvency, which completes the adaptation of Spanish law to Directive 2013/36/EU and Regulation (EU) no. 575/2013, Delegated Regulation (EU) 604/2014 of the Commission of 4 March 2014, supplementing Directive 2013/36/EU of the European Parliament and of the Council with regards to technical regulatory standards relating to suitable qualitative and quantitative criteria to determine staff categories whose professional activities have a significant impact on the risk profile of an entity and the Senior Managers and Certification Regime (SMR) in the United Kingdom. TTotal average remuneration at Banco Sabadell Spain by: Gender 2018 2017
M € 59,561 € 58,859 F € 44,932 € 44,390 Average € 52,098 € 51,532 The calculation of average total remuneration includes: Fixed Remuneration, Variable Remuneration (with 100% pay-out), personal and social benefits.
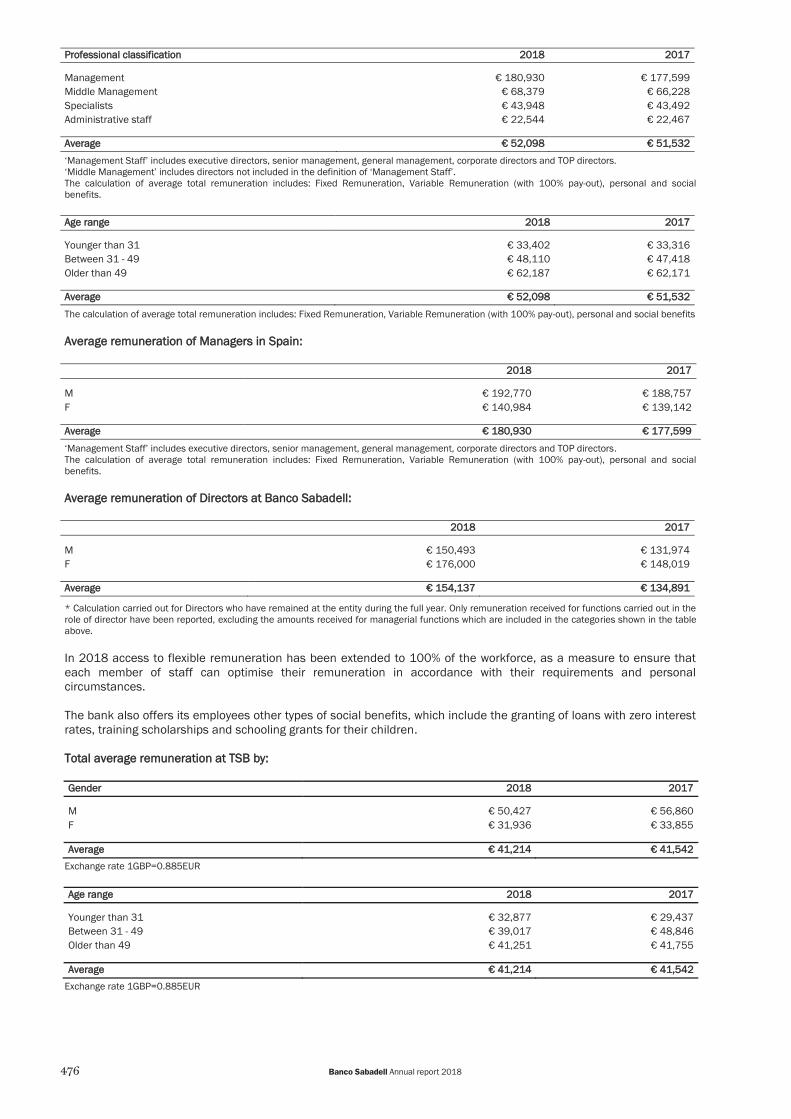
476 Banco Sabadell Annual report 2018
PProfessional cllassification 22018 22017
Management € 180,930 € 177,599 Middle Management € 68,379 € 66,228 Specialists € 43,948 € 43,492 Administrative staff € 22,544 € 22,467 AAverage €€ 52,098 €€ 51,532 ‘Management Staff’ includes executive directors, senior management, general management, corporate directors and TOP directors. ‘Middle Management’ includes directors not included in the definition of ‘Management Staff’. The calculation of average total remuneration includes: Fixed Remuneration, Variable Remuneration (with 100% pay-out), personal and social benefits. AAge raange 22018 22017
Younger than 31 € 33,402 € 33,316 Between 31 - 49 € 48,110 € 47,418 Older than 49 € 62,187 € 62,171 AAverage €€ 52,098 €€ 51,532
The calculation of average total remuneration includes: Fixed Remuneration, Variable Remuneration (with 100% pay-out), personal and social benefits AAverage remuneration of Managers in Spain:
2018 2017
M € 192,770 € 188,757 F € 140,984 € 139,142 Average € 180,930 € 1177,599
‘Management Staff’ includes executive directors, senior management, general management, corporate directors and TOP directors. The calculation of average total remuneration includes: Fixed Remuneration, Variable Remuneration (with 100% pay-out), personal and social benefits. Average remuneration of Directors at Banco Sabadell:
2018 2017
M € 150,493 € 131,974 F € 176,000 € 148,019 Average € 154,137 € 134,891
* Calculation carried out for Directors who have remained at the entity during the full year. Only remuneration received for functions carried out in the role of director have been reported, excluding the amounts received for managerial functions which are included in the categories shown in the table above. In 2018 access to flexible remuneration has been extended to 100% of the workforce, as a measure to ensure that each member of staff can optimise their remuneration in accordance with their requirements and personal circumstances. The bank also offers its employees other types of social benefits, which include the granting of loans with zero interest rates, training scholarships and schooling grants for their children. Total average remuneration at TSB by: Gender 2018 2017
M € 50,427 € 56,860 F € 31,936 € 33,855 Average € 41,214 €€ 41,542
Exchange rate 1GBP=0.885EUR Age raange 2018 2017
Younger than 31 € 32,877 € 29,437 Between 31 - 49 € 39,017 € 48,846 Older than 49 € 41,251 € 41,755 Average € 41,214 € 41,542
Exchange rate 1GBP=0.885EUR

477Statutory information
PProfessional cllassification 22018 22017
Management € 201,968 € 293,804 Middle Management € 99,341 € 66,228 Specialists € 44,046 € 43,492 Administrative staff € 21,827 € 22,467 AAverage €€ 41,214 €€41,542
Exchange rate 1GBP=0.885EUR AAverage remuneration of Managers at TSB: Average Management remuneration 2018 2017
M € 213,495 € 313,195 F € 180,689 € 250,633 Average € 201,968 € 293,804
Exchange rate 1GBP=0.885EUR 2.2 Work organisation, health and safety 2.2.1 Leadership management At Banco Sabadell it has always been people who have marked the difference throughout the history of the bank, and they will continue doing so in the future, with the aim of ensuring that Banco Sabadell is the best place in which to develop a professional career. The key element to achieve this is the people management model, which is based on meritocracy and on the development of talent. This model is based on 3 key pillars: the annual performance evaluation, accompaniment by managers and development actions in accordance with the requirements and potential of each person. During the year all of the bank’s staff undergo a performance evaluation. This evaluation takes into account what they have achieved and how they have achieved it. The evaluation is used to encourage meritocracy, for which reason it is critical to emphasise this in the evaluation. This year, the objectivity of the model has been improved, by including the possibility of comparing previous and functional managers. Just as important as the performance evaluation in the year is the evaluation of potential in the following year, to make the best decisions in terms of professional development (internal mobility, promotion, development programmes), align aspirations with professional opportunities and design the development agenda. Potential includes whether the person wants to, and can, assume more cross-cutting functions and/or responsibility and their readiness to take on the next level of responsibility. For this reason, a specific section has been included to highlight professional goals, and to enable the manager to evaluate these goals. Furthermore, managers have the responsibility of continuously providing feedback, thereby giving the necessary assistance for team-building. Their aptitude as team managers can be assessed through the evaluation. Based on the foregoing, Banco Sabadell makes tools and specific training programmes available to employees, always under an approach based on joint responsibility of the employee in the development of their career. In particular, a Programme for Management Development is available for Managers when they reach the role of Top Management or Corporate Director, with the objective of accompanying them during periods of transition within their careers and to prepare them for the changing environment of the business, with a special focus on the challenges of the new leadership role. The programme is presented within a ‘learning by doing’ model, and aims to create networks in the management group, offering networking and visibility opportunities. Additionally, Banco Sabadell has continued to develop the model in order to ensure it has the most up-to-date information on current talent, and their potential, to ensure appropriate decision making in terms of people, well as well as effective and efficient management of the development of directors and pre-directors.

478 Banco Sabadell Annual report 2018
This has ensured the continued use of the Personnel Evaluation Committee model by each General Management Committee (17 in total), which addresses the following matters:
- Current (and forecast) evolution of the workforce (profile and costs) and management results (remuneration, performance management - high and low performances-, environment).
- Update of the talent map (directors and pre-directors) and pool of potential talent. - Appointment of candidates to new management positions, and proposals for employees with high potential. - Proposals for workforce actions. 2.2.2. Work/Life balance The bank’s workforce has access to a pool of social benefits, agreed by the Group and union representatives in the agreement on measures to improve the balance between family and personal life with working life. All of these benefits have been communicated to the entire workforce, and they are published on the employee intranet, for which reason they are well-known by all employees, who have been requesting and enjoying these benefits for a considerable period of time. The benefits include: a reduction in working hours (remunerated, not remunerated, for breastfeeding), extended leaves of absence (for maternity leave, to care for family members), special permissions (for studies, personal reasons or international adoption), increase in leave for the birth of a child and flexible working hours. Furthermore, the Group offers a wide range of measures aimed at improving the work/life balance of its workforce, enabling them to contract services and purchase products via the employee portal, which does not only offer them economic savings, but also allows them to save time, as they receive these products at their workplace and save the time that would be spent on the journey, or having to run the errand outside of their working hours. In addition to these benefits, it is also worth mentioning the services offered to enable staff who work in central services to carry out personal errands. In 2018, new measures to promote flexibility and an improved work-life balance have also been implemented, which include the possibility of buying additional holidays and the gradual roll-out of teleworking. This last measure has had a very good reception in terms of satisfaction and productivity, and as at the end of 2018, 320 employees were making use of this measure. Lastly, a new position of work/life balance manager has been included, with the aim of managing and analysing requests and applications by employees relating to work/life balance, proposing creative and personalised solutions outside standard practices, in order to achieve a satisfactory balance between the requirements of the employee and those of the manager. 2.2.3. Health and safety The Group applies a preventive policy in order to continuously improve the working and health conditions of Group employees. In accordance with current legislation, the bank has a prevention plan which includes all of the preventative activities carried out in the company, which are published annually in a report that is available on the employee intranet and on the corporate website.
It also carries out an initial workplace hazard assessment for each new work centre, and in the event of reforms or modifications. Equally, when a certain period has elapsed since the assessment, individual work stations, as well as common areas, are assessed in all of the installations, as well as aspects such as temperature, lighting etc. The entire Group workforce and all new employees receive information on the prevention of occupational hazards and complete mandatory training relating to health and safety in the via an online course. The training is carried out through the use of publications, ergonomic guidelines and computer terminals and other equipment, all relating to the risks inherent to the bank’s activity. Absenteeism indicators: Absenteeism indicators in Spain 2018 2017
Total hours (accidents and non-work related illnesses) 836,153 807,752 Absenteeism indicators aat TSB 2018 2017
Total hours (non-work related illnesses) 399,409 433,412

479Statutory information
WWorkplace accidents:
Types of accident in Spain 2018 2017
M F Total M F Total
Work centre 44 75 119 28 52 80 In itinere 48 86 134 41 74 115 Travel during the work day 14 26 40 9 16 25 Other work centres 1 1 2 2 2 4 TOTAL 107 188 295 80 144 224
*2018 figures are provisional and do not include Solvia. Work related accidents in Spain 2018 2017
Total hours 22,170 19,590 Frequency index 5.61 3.82 Severity index 0.08 0.07 Figures are for Spain and do not include Solvia. The severity index refers to the severity of absenteeism (work days lost/ existing work days * 100). TSB, in compliance with the legal framework in the United Kingdom, does not maintain a record of accidents. Social Security does not define any occupational illnesses in the banking sector. 2.3. Workplace Relations 2.3.1. Communication Banco Sabadell has multiple channels for dialogue between different hierarchical levels of the organisation, with the aim of facilitating internal communication and involving employees in the bank’s projects and activities. The “BS Idea” platform enables employees to submit improvement proposals relating to all areas of the organisation. This platform constitutes an excellent communication channel in which employees can share their concerns and experiences regarding processes or products. Ideas which receive the most votes, as well as the ideas which contribute the most value to the entity, are analysed by the persons responsible for the processes concerned, as well as by the Decision Committee of the entity, which decides on the implementation of such proposals. The ideas which receive the highest number of votes also receive an economic reward. Banco Sabadell also has a whistle-blowing channel for employees, through which employees can anonymously submit their queries, complaints and suggestions. The information gathered through this channel is reported to the entity’s Corporate Ethics Committee. At TSB, the launch of a new digital work environment stands out, which includes a new extranet and the use of the collaboration platform ‘Yammer’, in addition to the enhancement of the TSB Careers website. This work environment shall continue to be developed, as it is one of the key digitalisation initiatives for employees. 2.3.2. Participation Banco Sabadell respects and guarantees the basic rights of employees in relation to freedom of association and collective bargaining, in accordance with Spanish law. These principles are set out in the human resources policy, specifically, Recursos Humanos 7305 – Normativa Laboral Básica Aplicable (Human Resources 7305 – Basic Applicable Labour Regulations), which refers to the Convenio Colectivo de Banca vigente (current Collective Banking Agreement). These rights are set forth in chapter twelve of this agreement, Union Rights, Articles 58, 59 and 60. The bank currently has 11 trade union sections, including the State and regional sections. The selection of the workers’ representatives is carried out via a vote every 4 years, in accordance with the guidelines set forth by the Spanish Banking Association (AEB, for its acronym in Spanish), together with the major State union sections in the Spanish banking sector. The results of the union elections determine the composition of the different Works Councils, as well as staff delegates who are the interlocutors representing the entity and the agents who participate in collective bargaining. In the absence of specific negotiations, they meet as and when required. The trade union representatives selected are allocated hours from their normal working hours to engage in their trade union activities. The Collective State Banking agreement covers the entire workforce forming part of Banco Sabadell in Spain. During 2018 multiple actions have been developed as a result of employees responses to the work environment survey carried out in 2017.

480 Banco Sabadell Annual report 2018
100% of employees are covered by agreement in Spain. In the rest of countries, the applicable legislation in each country is applied. Representation of employees in formal work-company health and safety committees in Spain (same data 2017 and 2018): - State Health and Safety committees created in companies:
- Banco de Sabadell S.A. - Sabadell Asset Management., S.A. - BS Securities Serv., S.L. - FONOMED Gest.Tel.Med.S.A.
- Workers prevention delegates (role envisaged in legislation that can be held by a maximum of 8 persons per company or work area)
WWorkers PPrevention Delegates OOn the Committee
Banco de Sabadell S.A. 24 6 Sabadell Asset Management., S.A. 3 3 BS Securities Serv., S.L. 2 2 FONOMED Gest.Tel.Med.S.A. 3 3 At TSB there is a fluid and direct relationship with employee representatives (24 meetings a year, equivalent to 2 meetings a month). There are currently 2 recognised unions (Unite the Union and Accord) and one which is not recognised (TBU) which are chosen in the participatory elections. From 2019 onwards, the elections process shall be managed by TSB. With regards to the unions, the guidelines set forth by ACAS (Advisory, Conciliation and Arbitration Association, a public government body in the United Kingdom) are followed. 2.4. Training Consolidation of Sabadell Campus In 2018, the Group has continued to promote the bank’s learning model, which was launched in 2016, with the consolidation of Sabadell Campus and its various schools and spaces. This is a project which embodies the pillars of the Banco Sabadell training model based on innovation, personalised training, business alignment and efficiency. Commercial School Training activities that focus on increasing the impact of key figures in the creation of business value have been prioritised, particularly for Managers of small and medium-sized enterprises and Business Banking Directors.

481Statutory information
MIFID. Trusted advisors In accordance with the guidelines set forth in MIFID regulations, and specifically, technical guidelines 4/2017 for the evaluation of the knowledge and skills of staff who inform and advise, published by the CNMV, intensive certification activity has been carried out and yielded excellent results, above the established targets. In this regard, 2,157 employees have been certified, 54.4% more than the 1,400 employees expected for 2018. As a result, a total of 4,061 managers were certified as at December 2018. Creation of the Digital School More than 3,500 employees already develop their digital potential in the 8 subjects offered by the Digital School (information management, networking, digital expertise, digital vision, digital communication, digital identity, continuous learning and security). Those employees who complete the “+ Digital” programme, can receive the Curso Superior de Digitalización en Banca qualification from EADA (Advanced Digitalisation Course in Banking), based on Blockchain technology, which will be awarded in June next year. Growth of the in-house tutoring team One of the main pillars of Banco Sabadell’s new training model is the group of in-house tutors. Tutors facilitate the management of knowledge and internal talent and they make it possible for training to be available in all regions where it is required. In 2018 this group has grown considerably, in terms of both size (470 members) and impact, offering support to critical processes, such as the aforementioned MIFID. These professionals have completed more than 50,000 hours of training, with each tutor dedicating an average of more than 19 hours per employee receiving training, to share their knowledge with the rest of the workforce.
TTraining in Spain 22018 22017
Employees who have received training (%) 94.1% 88.9%
TTotal hours of training and average per professional category in Spain 22018 22017
TTraining hhours AAverage hours TTraining hours AAverage hours
Management 22,180 52.31 23,864 58.04 Middle Management 150,306 48.11 137,345 41.98 Specialists 469,966 38.83 329,136 29.56 Administrative staff 6,864 34.67 2,386 20.93 TTotal 6649,316 440.97 4492,730 332.98
At TSB, the training plan related to the IT migration stands out, as it has included key groups in the migration process with the aim of preparing and aligning all capacities for the launch. This process forms part of wider monitoring, Human Factors, which measures the progress of training as well as other aspects of employees’ occupational health during the entire process. TTraining at TSB 22018 22017
Employees who have received training (%) 77.71% 99.59%
TTotal and average hours of training per pprofessional category at TSB 22018 22017
TTraining hours AAverage hours TTraining hours AAverage hours
Management 6,869 38.59 6,429 37.60 Middle Management 13,571 44.49 9,704 32.03 Specialists 258,701 72.36 510,926 140.06 Administrative staff 335,386 78.22 826,363 198.41 TTotal 6614,527 773.63 11,353,422 1163.32

482 Banco Sabadell Annual report 2018
2.5 Equality Banco Sabadell guarantees gender equality and equal opportunities in all areas of its activity affecting the workforce: recruitment, training, promotions and career development, salaries, work/life balance, etc. These principles are set out in the Banco Sabadell Group Equality Plan, Human Resources policy and Code of Conduct. One of the aims set out in Section E. Work-Life Balance of the Equality Pact signed in 2016 is to establish a flexi-time framework to enable employees to achieve a work/life balance, which is enforced equally between men and women. The key principles of this Pact therefore pursue: - The execution of a better alignment between people and the company, i.e. between the development of the
company’s staff and the company’s objectives. - The provision of assistance to the workforce to enable them to achieve a healthy work/life balance. - An increase in the organisational flexibility of the company, and its adaptation to changes in society, in relation to
family, social indicators, habits and behaviour. - Maternity protection, childcare protection and the protection of dependent people, favouring the full and smooth
integration of men and women within the company. In terms of diversity, Banco Sabadell has a solid track record when it comes to designing and implementing gender equality measures, focusing particularly on fostering female talent as a source of corporate wealth. To this end, it has carried out an in-depth assessment of indicators, broken down by gender, and it has also held workshops with management staff in order to better understand the current situation in terms of female talent within the bank. As a result of its efforts, a specific plan has been defined in order to continue making progress in terms of diversity and equality. The measures that have been adopted with a view to fostering equal treatment and opportunities between men and women relate to a number of areas of activity: staff selection and recruitment (gender-neutral language in in internal job postings, standardised interview scripts, communication of the principle of equality to consultancy firms); training (equal participation between men and women in training activities, respecting the scheduled start and end times for such training, and conducting training activities during working hours whenever possible, creation of the “Equal Opportunities” course); promotions and career development (objective criteria relating to the suitability for the role and meritocracy, improvement and development of skills, promotion of at least 300 women to Level VII and 150 women to Level V); salary (100% of the annual salary paid to women on leave for pregnancy, breast-feeding, maternity and paternity leave, individual targets adjusted to the time worked, maintenance of targets); work/life balance (flexi-time, unpaid leave options, paid and unpaid short-time working, extended leaves of absence, holidays, internal transfers, etc.); gender violence (restructuring of working hours, preference in requests for internal transfers, contract suspensions, etc.); sexual abuse or sexual harassment (action protocol). Banco Sabadell has had an Equality Plan, signed with the representatives of male and female employees, in place since 2010. The Plan was renewed in 2016 and it was published in the Official State Gazette, no. 191 of 11 August 2017. The main purpose of the Equality Plan is to prevent any type of labour discrimination between women and men at the company, as well as to prevent and penalise discriminatory behaviour due to gender, increasing the use of work/life balance measures, guaranteeing a balance between women and men at all levels, strengthening internal promotion and preventing and penalising sexual harassment and gender-based harassment. To do so, it establishes certain lines of action in different areas with specific objectives and commitments for each one of them: recruitment, training, development, wage, work/life balance, gender violence, sexual or gender-based harassment. The Equality Plan sets forth an action protocol for cases of sexual abuse, sexual harassment and workplace bullying. Through this protocol, when any such conduct is reported, a case file will be opened by an Investigation Committee in order to objectively assess the reported events. The Equality Plan Monitoring Committee meets twice a year to monitor the Plan. In 2017 Banco Sabadell fulfilled and even went beyond the commitment it made in 2014 when it signed a Cooperation Agreement with the Spanish Ministry of Health, Social Services and Equality that set a target that women should account for 18% of senior management roles by 2018.

483Statutory information
Furthermore the bank has a Board Members Recruiting Policy, approved by the Board of Directors in 2016, the aim of which is to establish the criteria which must be taken into account in the selection process of new members of the Board of Directors, as well as the re-appointment of the same. This Policy promotes compliance with the gender diversity target, under which the gender with the lowest representation must represent at least 30% of the total members of the Board of Directors in 2020. The Appointments Committee pays special attention to gender diversity in the Board of Directors, and in the assessment of the candidates selected, seeking to ensure the inclusion of women who comply with the requirements of the role sought. The next steps will be to continue promoting gender diversity in order to strengthen the bank’s commitment to this aspect, and to anticipate new regulatory disclosure requirements:
- Establish specific objectives and monitoring processes (incorporated into the Corporate Dashboard) - Active management of female talent: maintain policies whereby candidates to positions are selected/promoted by
a majority vote between three people and carry out forward-looking talent management (50% of women in the High Potential Development Scheme)
- Strengthen work/life balance measures - Communicate and promote a corporate culture that encourages diversity (role models and awareness-raising
sessions aimed at management staff)
DDistribution of Group employees by gender Gender 2018 2017
M 11,605 11,467 F 14,576 14,378 Total 26,181 25,845 % 2018 2017
Women in senior management positions 25.67% 24.34% Women in line management positions. 33.50% 34.61% Women in management positions 32.35% 33.19% % of promotions who are women 49.55% 50.35% Data calculated for the Group’s total workforce ‘Senior Management’ includes executive directors, senior management, general management, corporate directors and TOP directors. ‘Line Management’ includes directors not included in the definition of ‘Management Positions’.

484 Banco Sabadell Annual report 2018
2.6 Universal accessibility for people with disabilities The Group fosters all forms of diversity and seeks to ensure the integration of all of its employees in the workplace, through its application of non-discriminatory recruitment and career development processes. The Group establishes measures for the adjustment of roles where required in cases of functional diversity, which are in line with the occupational health and safety service’s procedures relating to sensitive risk groups. The institution also assists employees with paperwork and formalities at municipality, autonomous community and state level that help to improve these employees’ well-being beyond a strictly professional sense. Pursuant to the General Law on Persons with Disabilities (Ley General de Discapacidad), the bank implements the alternative supported employment measures set out in the aforementioned law by contracting services and supplies from special employment centres and by donating money to organisations that support people with disabilities; in 2018 it donated a total 600,000 euros to three such organisations (ONCE Foundation, Adecco Foundation and Cáritas). As at December 2018, the Group had 188 employees with some form of disability (253 as at the end of 2017). The decline in the number of disabled employees, both in average terms and as at year-end, is due mainly to the reduction of staff in TSB (-62 employees YoY). An in-depth study has been conducted of the distribution of the workforce by generation, identifying the variety and complexity of experience, skills, abilities and training in each of the generations in the workforce and formulating proposals for improvement that take into account their main interests, needs, expectations and concerns. 33. INFORMATION REGARDING HUMAN RIGHTS Banco Sabadell has a Code of Conduct and an Ethics and Human Rights Policy in place, both of which were approved by the Board of Directors in 2003. The bank has also implemented a Code of Conduct for Suppliers, through which it ensures that its own commitment to safeguarding human rights is also applied throughout its supply chain. Furthermore, the Group is a signatory a number of major national and international agreements relating to Human Rights: - The United Nations Global Compact, of which it became a signatory in 2005, officially undertaking to commit to
the ten principles, including the first and second principles on human rights and labour. - The Equator Principles, a risk management framework for determining, assessing and managing environmental
and social risk, which considers a number of aspects including the responsibility to respect human rights by undertaking due diligence in order to prevent, mitigate and manage adverse impacts.
These commitments aim to eliminate discrimination in respect of employment and occupation, uphold the freedom of association and recognise the right to collective bargaining pursuant to the legislation of the country in which the institution’s employees work (ILO Convention No. 87 on freedom of association and the right to organise and ILO Convention No. 98 on the right to organise and collective bargaining). They also aim to foster measures for improving the well-being of staff and helping them to achieve a work/life balance. The bank also encourages and maintains an environment in which all employees are treated with dignity and respect and where they are treated fairly, without any form of discrimination by reason of gender, race, skin colour, age, social background, religion, nationality, sexual orientation, political opinion, physical or psychological disability or membership of labour unions. It also prohibits all forms of forced and compulsory labour, servitude and labour under indentured labour contracts. It also does not hire any minors under the legal working age and in no case under the age of 15. Regarding customers and society in general, the bank offers products and services that contribute to generating a positive impact on people’s lives through responsible business practices: risk prevention through assessments of the risk of human rights violations in Project Finance, social housing management and financial inclusion. In 2017, the bank reiterated its commitment to the Code of Good Banking Practice, in order to limit the effects of over-indebtedness of people and families and thus enable the financial inclusion of debtors at risk of social exclusion. Regarding procurement management, the bank has procedures in place which guarantee that human rights are respected throughout the end-to-end supplier accreditation, selection and evaluation process, as described in the relevant section of this report.

485Statutory information
44. INFORMATION REGARDING THE FIGHT AGAINST CORRUPTION AND BRIBERY Banco Sabadell views ethics as one of its core corporate values, and it works to actively fight against corrupt practices. Banco Sabadell has been a signatory of the United Nations Global Compact since 2005, and as such it applies its Principles, thereby undertaking the express commitment to fight against all forms of corruption. In this respect, it has a Code of Conduct and a Conflicts of Interest Policy in place to which all Group employees are subject. As a financial institution, one of the pillars of Banco Sabadell’s activity relates to anti-money laundering and counter-terrorist financing. Both the bank and its subsidiaries have in place due diligence measures, rules and procedures for each type of risk to which they are exposed, and which they apply in both pre-onboarding processes and in the continuous monitoring of onboarded customers. They include the recommendations issued by international bodies and by the Financial Action Task Force (FATF). In each foreign branch and representative office, as well as in each domestic and international subsidiary, a person has been designated to be responsible for these matters, and a procedure has been established for reporting incidents related to corruption and money laundering. A training plan is in place for all Banco Sabadell employees in relation to anti-money laundering and counter-terrorist financing. The bank also pays particular attention to the supervision of loans and accounts held by political parties by following a rigorous customer onboarding procedure. Similarly, the bank does not make any contributions of any kind to political parties, politically exposed persons or related institutions. In terms of transparency, all donations to NGOs and foundations are analysed and assessed by the bank’s Sponsorship Committee or the Board of Trustees of the Foundation, in accordance with the principles laid down in the bank’s Social Action Policy. The accounts of the Banco Sabadell Foundation are also duly audited. It is also worth noting that Banco Sabadell’s Code of Conduct regulates the acceptance of gifts and inducements, expressly setting forth that staff must reject all such items, as well as any contributions from a counterparty or any personal benefit offered by a customer or supplier which may limit or otherwise affect their decision-making capacity. Lastly, as indicated in the section on Communication, the bank also has a whistle-blowing channel available to employees which they can use to anonymously submit queries, complaints and suggestions. Information received through this channel is reported to the institution’s Corporate Ethics Committee. 5. INFORMATION REGARDING SOCIETY Banco Sabadell enforces this commitment through transparency and accessibility, using specific products and management models which address different social matters. The bank also maintains a permanent dialogue to determine the concerns that it shares with society, based on which it takes part and promotes multiple initiatives relating to financial education, solidarity and other activities and partnerships with a social impact. The bank’s commitment to society is channelled through its corporate volunteer scheme, the initiatives pursued by the bank’s various divisions and through the Banco Sabadell Foundation.

486 Banco Sabadell Annual report 2018
5.1. Commitment to sustainable development Banco Sabadell contributes to sustainable development through the following initiatives: 5.1.1 Transparency, simplification and accessibility The bank has established mechanisms and arrangements to guarantee that all information provided to customers is transparent and that all of the products and services which it offers satisfy their requirements at all times. In 2018, the online savings and investment platform “Sabadell Inversor” was implemented in the branch network. This platform is used to offer an expanded advisory service to all of the institution’s customers, addressing their specific needs and characteristics, whilst also complying with the legal requirements of the mandatory MiFID II regulation. This platform also centralises other ranges of products and services which complement the savings and investment offering. Before selling a product or service, the products approval committee verifies that it meets the required transparency standards. The branch network is also given information about products and services through pre-contractual information sheets, which make it easier for relationship managers to give the necessary explanations to help customers and consumers understand the characteristics of the products which they acquire. At the same time, when advising customers on investments, relationship managers also carry out the necessary tests to ensure that the financial products are in line with their needs and requirements, and assess customers’ knowledge and experience in this regard. The bank has been a member of the Asociación para la Autorregulación de la Comunicación Comercial (the independent advertising self-regulatory organisation in Spain), more commonly known as “Autocontrol”, and through this membership it undertakes the commitment to offer responsible advertising that guarantees the accuracy of the information, acquisition process and operational characteristics of the advertised products. In 2018, Banco Sabadell has expanded its range of distance banking services, thereby enabling customers to carry out certain transactions without having to visit their local branch. Its new distance banking services include obtaining frequently used bank certificates and digitally signing for certain financial products. A system has also been launched which allows new accounts to be opened via video call or using a mobile app, and a feature has been enabled which allows individual customers who do not require any notarial intervention to apply for loans using distance banking. Banco Sabadell also offers the option to consult the prices of securities listed on Spain’s electronic market (mercado continuo) using Amazon’s voice service, Alexa, and it has expanded its voice services for the bank’s customers with iOS devices, allowing them to check their account balance and send or request money using a voice command. In order to help customers carry out more banking transactions, a pilot programme has been launched under which branches can assist customers (subject to receiving prior notification) in the evenings. 5.1.2 Sustainable finance Ethical and charitable investing Banco Sabadell encourages responsible investing by offering customers a number of savings and investment products which also contribute to humanitarian projects. Products in this area include Fondo de Inversión Sabadell Inversión Ética y Solidaria F.I., (a mutual fund), Sociedad de Inversión Sabadell Urquijo Cooperación, S.I.C.A.V, S.A., (an investment company), Plan de Pensiones BS Ético y Solidario, P.P. and Plan de Pensiones BanSabadell 21 F.P. (pension plans), as well as Fondo de Pensiones G.M. PENSIONES, F.P. (a pension plan for Group employees). In 2018 the Corporate Ethics Committees of Sabadell Urquijo Cooperación, Sicav, SA and Sabadell Inversión Ética y Solidaria, FI selected 35 humanitarian projects mostly aimed at addressing social exclusion risks, improving the living conditions of people with disabilities and meeting basic food and healthcare needs. Over €390,000 were granted to charitable organisations and projects in 2018. In the area of investment, both pension funds manager BanSabadell Pensiones EGFP SA and, since 2016, Aurica Capital, a venture capital enterprise that invests in Spanish companies with plans to expand in foreign markets, have adopted the Principles for Responsible Investment in the “investment manager” category. These principles include social, environmental and good governance criteria in management policies and practices.

487Statutory information
Sustainable bonds Green, social and sustainable bonds are debt securities which support environmental and/or social improvement projects by meeting certain eligibility criteria. The funds obtained from issuing these bonds are used to fund green/social projects (renewable energy, energy efficiency, water pollution and management, waste management, healthcare, social inclusion, etc.). They are rated by an external agency that verifies that the bonds identified as sustainable bonds qualify as such and also verifies that the funds obtained from issuing these bonds are used to fund environmental and/or social projects. Banco Sabadell has taken part in the placement of Iberdrola and Gas Natural green bonds, and has acted as the sole placement agent of 150 million euros of sustainable bonds issued by the Autonomous Community of Madrid in 2018. This role has enabled it to acquire investors interested in purchasing these products. 5.1.3 Social housing management Banco Sabadell manages social housing through Sogeviso, an institution wholly owned by the bank, in order to responsibly address situations of social exclusion faced by its vulnerable mortgage borrowers. As at 31 December 2018, Sogeviso managed 10,178 properties under social and affordable rent arrangements specifically aimed at these vulnerable customers. In 53% of these cases the “Social Contract” has been incorporated. The Social Contract is a service under which social workers offer specific assistance and which is based on three pillars: (i) putting these customers in touch with public services, (ii) implementing employment and labour market insertion actions, by managing a service which aims to increase customers’ employability through training, coaching and job interview practice, and (iii) cooperating with public and private institutions, particularly those involved in the Third Sector. Comprehensive rent management, together with the Social Contract (which currently provides services to 5,344 families and has been consolidated as an innovative model with which to manage vulnerable customers), has enabled 3,501 families, all of which had members who are Banco Sabadell customers, to overcome their situation of social exclusion. 2018 has also seen the consolidation of the JOBS programme (for employment and labour market insertion), which ended the year with 2,688 participants. 1,483 people have found employment under this programme since it began in 2016. It is important to note that over 33% of these were hired for over 100 days and more than 6% were hired for long-term positions, which will improve their long-term employability. Also during 2018, in order to limit the effects of over-indebtedness and facilitate the recovery of debts owed by debtors at risk of social exclusion, the bank has reiterated its commitment to the Code of Good Banking Practice, approving 167 mortgage loan restructuring operations. Since 2013, Banco Sabadell has been a participant of the Social Housing Fund (Convenio del Fondo Social de la Vivienda, or FSV), an initiative implemented by the government of Spain to strengthen the protection of mortgage debtors. Sabadell has contributed to this initiative with 400 properties primarily aimed at customers who have had to surrender their properties to settle their debt or who have lost their properties through foreclosure proceedings since January 2008. 90% of the bank’s housing stock is covered by social rent agreements currently in effect. Furthermore, the bank has assigned 92 properties to 46 non-profit institutions and foundations, intended to lend support to disadvantaged social groups. 5.1.4 Financial education Banco Sabadell continues to promote and take part in a number of financial education initiatives. From the institution’s perspective, this type of activity involves not only meeting the different training requirements of consumers and society in general, but also being by the side of consumers and society to help them develop their skills and decision-making abilities.

488 Banco Sabadell Annual report 2018
For children (up to age 13) The drawing competition “What is money for? (¿Para qué sirve el dinero?), at http://paraquesirveeldinero.com/ has been running since 2010 and includes a series of educational activities and educational materials, prepared in cooperation with teachers and educators, to encourage the development of creativity and the understanding of the importance of saving, the value of money and solidarity. This year, it includes a children’s economic dictionary that is linked to an educational guide, which helps children to become more familiar, word by word, with the uses of money and provides answers to their questions and concerns. Additionally, for each drawing submitted, Banco Sabadell makes a donation to a charitable cause. The drawings that receive the most votes on social media are also awarded a prize. More than 7,300 drawings were submitted in 2018. For adolescents Since its creation six years ago, Banco Sabadell has taken part in the annual Catalan Schools Financial Education programme (Educación Financiera de Escuelas de Cataluña, or EFEC). The programme is taught in over 350 academic centres, and more than 87,600 students take part. This is equivalent to approximately 30% of students in their final year of compulsory education (4º ESO) in Catalonia. The bank also participates in the “Your finances, Your future” programme (“Tus Finanzas, Tu Futuro”), in partnership with the Spanish Banking Association (Asociación Española de Banca, or AEB) and the Junior Achievement (JA) Foundation, which is offered at over 100 centres throughout Spain.
Banco Sabadell is also a signatory of the agreement signed between the Spanish Banking Association (AEB), the Spanish Securities Market Commission (CNMV) and Bank of Spain within the framework of the National Plan for Financial Education. This Plan, which was renewed in 2018 and which follows the recommendations of the European Commission and the OECD, is designed to improve public understanding of financial matters by providing citizens with basic knowledge and tools to enable them to manage their finances in a well-informed and responsible way. For SMEs For the last six years Banco Sabadell has worked in collaboration with AENOR, AMEC, Arola, CESCE, Cofides, Esade and Garrigues, and is the sponsor of the “Export to Grow” programme (“Exportar para crecer”) designed to help small and medium-sized enterprises to expand into foreign markets. It does this by offering them online tools and specialised information services and by arranging round table discussions throughout the country, in which close to 5,000 companies have already taken part. As part of its commitment to supporting and advising corporate customers, Banco Sabadell has launched the second edition of the Sabadell International Business Programme, a training programme organised together with the University of Barcelona (UB) which can be completed either in person or digitally by following the live streaming of training sessions held in cities including Barcelona, Madrid, Valencia, Bilbao, Vigo and Seville. In terms of the digitalisation of companies and the assistance given to them, the bank has launched a new programme and created a new role within the branch network: the Director de Digitalización de Empresas (Companies Digitalisation Director), who combines the duties of a professional consultant equipped with a good understanding of the unique characteristics of each customer together with the provision of personalised advice in relation to streamlining and transforming each business in areas such as e-commerce, data mining, digital marketing and cybersecurity. Another initiative designed to support and assist companies is Sabadell Link, an audiovisual channel which, among other features, facilitates contact with key management staff at the representative offices in Europe, Asia, Africa and America. The exporter kit, which is available on the International Business website, is a set of tools for engaging in foreign trade activities with the maximum guarantees, and it is therefore another frequently used resource when it comes to firms’ internationalisation processes. Under BStartup, Banco Sabadell’s entrepreneurship programme, the bank has organised around 40 informative chats for entrepreneurs about start-up funding. The topics addressed included both public and private funding options.
FFinancial education imparted by volunteers 22018 22017 22016
Number of volunteers EFEC 87 179 164
JA 32 32 34
Number of beneficiaries EFEC 17,200 9,082 4,736
JA 387 430 426

489Statutory information
For families/society In 2018 Banco Sabadell launched a new live debating programme, ‘Futuros’, under which it held debates on the Facebook Live platform regarding the day-to-day concerns of families as well as aspects that affect their household finances. These debates, led by influential people from the worlds of culture, engineering, education and sport, make it clear that there are as many possibilities for the future as there are people in the world, and Banco Sabadell explains its role as a guide to support and assist families and offer them solutions at key moments in their lives. This initiative offers families and society a chance to become involved by contributing to the debate and sharing a variety of opinions on matters such as: ‘Are we meant to live together?’ and ‘How should your children study?’. 5.1.5 Corporate Volunteer Scheme Banco Sabadell encourages employees to engage in community and volunteer work by providing them with the necessary means and resources. Through Sabadell Life, a consolidated internal portal in place since 2016 and which has over 11,000 users, more than 500 charitable initiatives and corporate volunteer activities have been proposed by the bank and its employees and registered on the portal. The more community-minded employees either donated directly or exchanged their prizes for donations, using gamification, to one of the charitable causes sponsored by Sabadell Life through the Actitud Solidaria platform: school meals grants (‘Becas Comedor’) provided by Educo (this campaign was selected through a majority vote by employees in a survey) and educational supplies for children at risk of social exclusion under Ayuda en Acción, among others. The institution has also sent aid to those in need following natural disasters, such as the 2018 tsunami in Indonesia. In addition to the financial education programmes mentioned above, some of the most popular volunteer initiatives included: - Programmes to leverage the knowledge and experience of current and former employees to favour
disadvantaged sectors and people at risk of social exclusion:
- The Exit Foundation’s “Coach” project, which mentors young people in vulnerable situations to help them find work. In 2018, 36 employees volunteered for a total of 1260 hours mentoring teenagers aged between 16 and 18 to help them improve their employability in the cities of Madrid, Barcelona, Valencia, Granada, Alicante and Palma.
- Transpirinenca Social Solidària (TSS) is a social and educational project in which the Banco Sabadell Foundation is a collaborating partner and which aims to promote social inclusion. 300 young people and 200 volunteers from a number of companies, including Banco Sabadell, take part in a hike over the Pyrenees to support social inclusion, walking 800km in different stages over 42 days.
- The second edition of BValue, a programme provided by the Banco Sabadell Foundation and the Ship2B
Foundation which is designed to help non-profit organisations develop professionalisation and sustainability models. Under the programme, 20 employees act as mentors for various social entities, assisting and advising them.
- Contributions and participation in fundraising campaigns:
- Trailwalker hike, in which over 40 teams took part with more than 100 volunteers, raising €65,000 for
Intermon Oxfam in support of a world without poverty.
- Inspiring Games, an online competition between companies in which the points earned by over 400 employees who took part in a number of different sports and activities led to the company being named the healthiest company of 2018. The bank donated the 1000 euro award to the 5p- Syndrome Foundation. 5p- Syndrome is a rare condition that affects 1 in 50,000 children.
- Over 230 employees gave blood in Barcelona, Valencia and Madrid.
- Collaboration with the ‘Reyes Magos’ Christmas campaign organised by the Magone Foundation. Over 470 Christmas presents were donated in response to letters to the Three Wise Men written by boys and girls at risk of social exclusion in regions such as Alicante, Barcelona, Bilbao, Madrid, Malaga, Oviedo, Galicia, Zaragoza and Valencia.

490 Banco Sabadell Annual report 2018
- Other activities included charitable gift-giving on Saint George’s Day (an event known as Diada de Sant Jordi Solidario) and the Charity Christmas Market in the Sant Cugat corporate centre, working together with various third sector organisations, including Obra Social San Juan de Dios, Proactiva Open Arms, Espigoladors, Sonrisas de Bombay and Mua Solidaris, among others.
- Projects aimed at labour integration and improving employability: - Partnership with Cáritas in the “Feina amb Cor” programme, aimed at people who are unemployed, have
family burdens and/or are over 40 and receive no financial income. Banco Sabadell is the only financial institution associated with the project, and it offers such persons an opportunity to work in its branches, carrying out administrative duties and working with Customer Services on a temporary basis, particularly during the holidays. Of the 25 people who have taken part in the Feina amb Cor programme since 2015, 5 continue to work in branches in the province of Barcelona, 6 have worked more than the 3000 hours established as the maximum hours in the programme and 5 have found stable employment, which is the primary aim of the programme.
It is also worth mentioning TSB’s extensive charitable work carried out in 2018 as part of the TSB Local Pride initiative, which pursues two objectives:
- Donate time, money and expertise, through the TSB Local Charity Partner programme, in which every branch supports a local cause that matters to their community. Also, help local sports clubs across the UK use the power of sport to make a positive difference to young people and their communities through its partnership with Sported, one of the leading Sport for Development charities in the UK.
- Share the stories of the unsung heroes helping people in their local communities. 5.1.6 Social action and sponsorship Banco Sabadell’s social action policy is based on the Group’s commitment to social development and the creation of value. The bank carries out most of its activities in this area through the Banco Sabadell Foundation, the Sponsorship Committee and the work carried out with the joint cooperation of all of its divisions. In 2018, the Banco Sabadell Foundation received 5 million euros from the bank to carry out its activities. Awards and recognition The activities of the Banco Sabadell Foundation are organised around talent, science, culture and social entrepreneurship. Some of the key initiatives undertaken by the Foundation include the Award for Biomedical Research, the Award for Science and Engineering, which was created in 2017 in partnership with the Barcelona Institute of Science and Technology (BIST), and the Award for Economic Research, all of which aim to recognise and support the achievements of Spanish researchers in these fields. Another testament to the Banco Sabadell Foundation’s commitment to science is its Scientific Research Grants, which it has been awarding for the past 24 years to pre-doctoral students, and its involvement in the Boards of Trustees of institutions such as the Pasqual Maragall Foundation. In terms of supporting young talent, the Sabadell Foundation has also cooperated with Celera this year, a programme that identifies young people in Spain with a wide range of profiles and who have outstanding talent in research, entrepreneurship and engineering. The programme gives the selected candidates the tools that they need to fully tap into their potential. Social innovation projects for social entities In 2018, the Ship2B Foundation, together with the Banco Sabadell Foundation, launched the second edition of the BValue programme, which aims to help professionalise, transform and improve the value proposition of non-profit organisations in all areas of activity. 10 finalist proposals are selected after the first stage, which then receive support to launch a crowdfunding campaign through which their proposals and shared and validated. The projects are then presented during a Demo Day, during which the Banco Sabadell Foundation grants a number of financial support packages. In 2017 a total of 40 social entities were selected to take part in the first edition of B-Value. 100 mentors specialising in different sectors took part in the programme. Thirty of them were Banco Sabadell employees who also participated in 4 face-to-face workshops held in Barcelona and Madrid.

491Statutory information
Young talent programme Since 2016, the Banco Sabadell Foundation and the Ship2B Foundation have worked together to detect and reward innovative projects which help to improve the coaching and employability of young people. With the B-Challenge programme, 20 groups of young people submit their projects to a selection, training and support process, at the end of which the 4 projects considered to have the most potential for success are selected. The crowdfunding campaign #YoCreoTalento is used to support the talent of the 4 winning projects of the B-Challenge programme. These are social projects which propose innovative solutions using self-sustainable business models. Community-minded attitude In 2018, through the IT platform provided by Worldcoo, a start-up partly owned by the bank thanks to the BStartup10 programme, Sabadell has been able to effectively respond to a number of emergency appeals, including the appeal to raise funds following the tsunami in Indonesia, with over 300 donations being made in less than 24 hours in order to help over 700 people in need, by providing medicine, specialised care, hygiene facilities, as well as clean water and food. 5.2 Consumers, outsourcing and suppliers 5.2.1 Consumers Banco Sabadell has a Customer Care Service which deals with complaints and claims. In 2018, 44,713 complaints and claims were received, 32,849 of which were accepted for processing. The number of cases handled, however, was 35,445, due to the resolution of issues pending from the previous year. By type, 5.9% were complaints and 94.1% were claims. The Group has a Customer Ombudsman, who is responsible for resolving the claims brought forward by the customers and users of the bank, both in the first and second instances, and for settling issues that are passed on to him by the Customer Care Service. TSB’s Customer Relations division received a total of 200,000 complaints and claims in 2018 (provisional data pending TSB’s official year-end figures). 5.2.2 Outsourcing and suppliers The challenges of competitiveness require the adoption of cooperative behaviour between Banco Sabadell and its suppliers and for suppliers to be viewed as strategic partners. Based on this principle, the bank established a series of protocols and standards in order to extend its commitment to socially responsible practices to the supply chain. The protocols and mechanisms indicated above cover the end-to-end relationship with the bank’s suppliers, from the supplier accreditation and evaluation process until the procurement process. Banco Sabadell also requires its suppliers to adhere to the Group’s environmental policy, thereby integrating environmental and social responsibility into its supply chain. The basic contracts with suppliers include clauses on respecting human rights and the ten principles of the United Nations Global Compact. Where required due to the activity involved, contracts also include environmental clauses. Supplier accreditation
The Procurement Division has a portal in which suppliers, prior to registering, must accept the Code of Conduct for Suppliers, which includes:
- The United Nations Universal Declaration of Human Rights. - International Labour Organisation agreements. - United Nations Convention on the Rights of the Child. - The principles of the United Nations Global Compact, of which the bank became a signatory in February 2005. The documentation requested in the supplier accreditation form includes the ISO Certifications (such as ISO 9001, ISO 14001 and other quality certificates), documents related to governance matters and the published information on the company’s CSR. Details of the characteristics of the products made available to the bank by the supplier (recycled, ecological and reusable products) may also be requested.

492 Banco Sabadell Annual report 2018
Before the accreditation process, suppliers are required to accept the general contractual terms and conditions and the code of conduct, which gives details about the bank’s environmental policies. In order to proceed with the accreditation process, suppliers must provide their legal documentation, financial information, quality certificates, proof that they are up to date with their social security payments and tax obligations, as well as their CSR policy. After reviewing the documentation submitted through the monitoring tool, Banco de Sabadell proceeds with the supplier accreditation process. Thereafter, when the documents provided by the supplier near the end of their validity period, the bank sends that supplier a reminder to update them. Once the updated documents have been submitted, they are reviewed and the accreditation status is updated.
Supplier evaluations
The Group’s major suppliers (i.e. those with a turnover of more than 250,000 euros) and those classed as critical (i.e. those engaging in areas in which there are limited market players) are assessed on an annual basis on environmental and quality matters, as well as labour criteria and the status of their Social Security payments.
Banco Sabadell regularly checks that the documentation submitted by suppliers is fully up to date in order to guarantee compliance with accreditation criteria, and establishes mechanisms for sending periodic alerts.
Unit managers are given discretions in certain services unrelated to the Procurement Division, as these services do not represent a risk and involve financial service firms and consultancies. All of these exceptions are included in a transparent manner in the organisation’s Procurement Manual. International network Supplier recruitment in the international network is decentralised, hiring only local suppliers and affecting only products for the sole use by the relevant branch or office in its daily activities. 5.3 Tax Information Banco Sabadell Group is firmly committed to promoting responsible taxation, maintaining a cooperative relationship with the Tax Authority and fostering transparency in communications relating to tax information sent to the various stakeholders. These commitments are embedded in the Group’s Tax Strategy, published on its corporate website, which lists and describes the Group’s principles of action in matters relating to taxation. These principles include the principle of efficiency, prudence, transparency and the mitigation of tax risk. The Group applies these principles in order to ensure that its overall tax contributions are in accordance with the law and the relevant international guidelines and principles established by the OECD.

493Statutory information
Consolidated profit after tax in each country as well as the taxes and public subsidies received, all of which correspond to Training activities, are shown below. Data in thousand euro
CCountry CConsolidated profit earned CCorporation tax paid
22018 22017 22018 22017
SPAIN 385,948 603,649 23,139 53,899 UNITED STATES 110,355 71,439 15,546 6,881 FRANCE 13,864 5,573 1,779 1,779 MEXICO 12,584 12,447 5,452 5,275 ANDORRA 8,307 8,005 357 1,072 CUBA 1,644 1,532 - - MOROCCO 1,256 1,965 896 1,484 LUXEMBOURG 86 74 - 76 BAHAMAS -40 -90 - - PORTUGAL -1,787 - - - UNITED KINGDOM -196,987 100,584 11,211 32,519 TTotal 3335,230 8805,178 558,380 1102,985 Subsidies received in Spain in 2018 (Training): 2 million euros.

494 Banco Sabadell Annual report 2018
AANNEX 1. CORPORATE STANDARDS AND INSTITUTIONAL COMMITMENTS
Beyond the actions and initiatives summarised in this Non-Financial Disclosures Report, Banco Sabadell has a series of codes, policies and standards in place which determine its commitment to the Group’s corporate purpose, and it is also a signatory of various national and international agreements which also enshrine this commitment. The policies and commitments listed below are those corresponding to the institution’s non-financial areas.
Non-Financial Principles and Policies
- Code of conduct: this applies to all persons who directly form part of the Group, whether through a professional association or through their membership of its governing bodies.
- Internal Code of Conduct relating to the securities market. - Code of Conduct for Suppliers. - Corporate Social Responsibility Policy. - Banco Sabadell Group policy on restrictions on financing and investment in activities associated with the arms
industry. - Ethics and Human Rights Policy. - Shareholders and Investors Policy. - Customers Policy. - Human Resources Policy. - Environmental Policy. - Suppliers Policy. - Social Action Policy. - Banco Sabadell Group Remuneration Policy. - Banco Sabadell Equality Plan. - Guidance for the use of social media. - Membership of AUTOCONTROL (the independent advertising self-regulatory organisation in Spain). - Signatory of the Code of Banking Practice. - Tax Strategy and Good Taxation Practices:
- Tax Strategy. - Tax Liability and Good Taxation Practices.

495Statutory information
PPacts, Agreements and Commitments
- Signatory of the United Nations Global Compact on human rights, labour, the environment and anti- corruption. - Signatory of the Equator Principles, which incorporate social and environmental criteria in the funding of large-scale
projects and corporate loans. - Integration of CSR into corporate practices following the ISO 26000 guidelines. - Signatory of the United Nations Principles for Responsible Investment in the “investment manager” category. - Renewal of its membership of the agreement signed between the Spanish Banking Association (AEB), the Spanish
Securities Market Commission (CNMV) and Bank of Spain for the pursuit of courses of action within the framework of the National Plan for Financial Education.
- Inclusion in sustainable indices FTSE4Good and FTSE4Good IBEX - Gold Seal of Excellence from the European Foundation for Quality Management (EFQM). - ISO 9001 certification in effect for 100% of the Group’s processes and activities in Spain. - ISO 14001 certification for the six corporate buildings. - Signatory of the Carbon Disclosure Project (CDP) for action against climate change and its Water Disclosure
programme. - Awarded the Workplace Seal of Distinction (“Distintivo de Igualdad en la Empresa”) by the Ministry of the Presidency,
Relations with the Cortes and Equality (Ministerio de Presidencia, relaciones con las cortes e Igualdad).

496 Banco Sabadell Annual report 2018
AANNEX 2. TABLE OF CONTENTS LAW 11/2018
Reference: Directors’ Report (DR)
AREA Content Response / ssection
GRI SStandards
GRI Description
BUSINESS MODEL
Brief description of the Group's business model, which shall include: 1.) its business environment, 2.) its organisation, 3.) its geographical presence, 4.) its targets, objectives and strategies, 5.) key factors and trends that could affect its future performance.
DR 1.1. Organisational structure
102-1 Company Name
DR 1.1. Organisational structure
102-2 Activities, brands, products and services
DR 1.1. Organisational structure
102-3 Location of headquarters
DR 1.1. Organisational structure; DR 1.2 Business model, main objectives achieved and actions implemented; DR 9.c Credit ratings management
102-4 Location of operations
DR 6. Expected future developments
102-6 Markets served
DR 6. Expected future developments
102-7 Size of the organisation
DR 1.1. Organisational structure
102-6 Markets served
POLICIES
A description of the policies applied by the Group in relation to such matters, which shall include: 1.) due diligence procedures applied for the identification, assessment, prevention and mitigation of risks and significant impacts 2.) verification and control procedures, including the measures that have been adopted.
2. Information regarding corporate and staff-related matters (introduction); 3. Information regarding human rights; Annex 1 - Principles and Policies
103 Management approach disclosures for each area, it will be necessary to highlight what internal policies are in place
RESULTS OF KPI POLICIES
The results of these policies, which must include the relevant non-financial key performance indicators to enable: 1.) monitoring and assessment of progress made, and 2.) the comparability between companies and sectors, in accordance with national, European and international frameworks of reference used for each subject matter.
5.1.3 Social housing management; 2.1. Employment; 2.2.3. Health and safety; 2.4 Training; 1.5.1. Environmental risk assessment; 1.1. Pollution; 1.3. Sustainable use of resources; 5. Information regarding society
103 Management approach disclosures for each area

497Statutory information
AAREA CContent RResponse / ssection
GGRI SStandards
GGRI DDescription
SSHORT TERM, MMEDIUM TERM AAND LONG TTERM RISKS
The main risks related to these matters linked to the Group’s activities, including, where relevant and proportionate, their business relationships, products and services which could have negative effects on these areas, as well as * the way in which the Group manages these risks, * explaining the procedures used to detect and assess such risks in accordance with national, European and international frameworks of reference applicable to each subject matter. * Information must be included on any impacts detected, providing a breakdown of such impacts, particularly in relation to the main short term, medium term and long term risks.
1.5.1 Environmental risk assessment; DR 4. Risks
102-15 Key impacts, risks and opportunities
NNON--FFINANCIAL KEY PPERFORMANCE IINDICATORS
Relevant indicators in relation to the existing corporate diversity and which meet comparability, materiality, significance and reliability criteria.
5.1.3. Social housing management; 5.1.2 Sustainable finance (Ethical and charitable investing); 1.5.2 Financing and investment in renewal energies; 5.1.4 Financial education; 1.4. Climate change
FS1,FS2
Financial services sector supplements: (FS1) Policies with specific environmental and social components applied to business lines; (FS2) Procedures for assessing and controlling social and environmental risks in business lines (FS2)

498 Banco Sabadell Annual report 2018
AAREA CContent RResponse / ssection
GGRI SStandards
GGRI DDescription
EENVIRONMENTAL MMATTERS
GGENERAL ENVIRONMENT
1.) Detailed information about the current and foreseeable effects of the company’s activities on the environment and, where applicable, on health and safety, environmental assessment or certification procedures; 2.) Resources dedicated to environmental risk prevention; 3.) Application of the precautionary principle, the amount of provisions and guarantees for environmental risks.
1. Information regarding environmental matters (Introduction)
103 Management approach disclosures for each area
1. Information regarding environmental matters (Introduction)
102-11 Precautionary principle or approach
CCUESTIONES MMEDIO-- AAMBIENTALES
PPOLLUTION
1.) Measures to prevent, reduce or be mindful of carbon emissions that sseverely affect the environment; 2.) Taking into account any form of atmospheric pollution caused by a specific activity, including noise and light pollution.
1.1. Pollution 103 Management approach disclosures – Emissions
CCIRCULAR ECONOMY AND WWASTE PREVENTION AND MMANAGEMENT
WWaste: Measures on the prevention, recycling, reuse and other forms of recovery and removal of waste;
1.2. Circular economy and waste prevention and management 103 Management approach disclosures – Effluents
and waste
AActions to combat food wwaste.
At the headquarters, which include a restaurant, the bank has a protocol in place designed to reduce food waste
103 Management approach disclosures – Effluents and waste
SSUSTAINABLE USE OF REESOURCES
Water consumption and water supply in accordance with local restrictions;
1.3.2 Water consumption 303-1 Water withdrawal by source
1.3.2 Water consumption 303-2 Water sources significantly affected by water
withdrawal
1.3.2 Water consumption 303-3 Recycled and reused water
Consumption of raw materials and measures adopted to make their use more efficient;
1.3.3 Paper consumption 103 Management approach disclosures – Materials
1.3.3 Paper consumption 301-1 Materials used by weight or volume
1.3.3 Paper consumption 301-2 Recycled consumables
Direct and indirect energy consumption, measures taken to improve energy efficiency and the use of renewable energy.
1.3.1. Energy consumption 103 Management approach disclosures – Energy
1.3.1. Energy consumption 302-1 Energy consumption within the organisation
1.3.1. Energy consumption 302-4 Reduction of energy consumption

499Statutory information
AAREA CContent RResponse / section GGRI Standards GGRI DDescription
EENVIRONMENTAL MMATTERS
CCLIMATE CHANGE
KKey aspects of greenhouse gas eemissions generated as a result of the company’s activity, including the use of the goods it produces and the services it provides;
1.1. Pollution 103 Management approach disclosures – Emissions
1.1. Pollution 305-1 Direct GHG emissions (scope 1)
1.1. Pollution 305-2 Energy indirect GHG emissions (scope 2)
1.1. Pollution 305-3 Other indirect GHG emissions (scope 3)
1.1. Pollution 305-4 GHG emissions intensity
1.1. Pollution 305-5 Reduction of GHG emissions
The mmeasures adopted to adapt the consequences of climate change;
1.4. Climate change 103 Management approach disclosures – Emissions
The voluntary reduction targets established for the medium and long term to reduce greenhouse gas emissions and the measures implemented for such purposes.
1.4. Climate change 103 Management approach disclosures – Emissions
PPROTECTION OF BIODIVEERSITY
Measures taken to preserve or restore biodiversity;
Banco Sabadell's activity does not have any significant impacts on biodiversity or on protected areas.
103 Management approach – Biodiversity
IImpacts caused by activities or operations in protected areas.
Not applicable. Banco Sabadell's activity does not have any significant impacts on biodiversity or on protected areas.
304-2 Significant impacts of activities, products and services on biodiversity

500 Banco Sabadell Annual report 2018
AAREA CContent RResponse / section GGRI Standards GGRI DDescription
CCORPORATE AND SSTAFF--RRELATED MMATTERS
EEMPLOYMENT
TTotal number and breakdown of employees by gender, age, country and professional classification;
2.1.1. Banco Sabadell workforce information 103 Management approach
disclosures – Employment 2.1.1. Banco Sabadell workforce information 102-8 Information on employees
and other workers 2.1.1. Banco Sabadell workforce information 405-1 Diversity of governance
bodies and employees
TTotal number and breakdown of types of employment contract;
2.1.1. Banco Sabadell workforce information 102-8 Information on employees
and other workers
AAnnual average of indefinite contracts, temporary contracts and contracts for part-time work by gender, age and professional category;
2.1.1. Banco Sabadell workforce information 102-8 Information on employees
and other workers
2.1.1. Banco Sabadell workforce information 405-1 Diversity of governance
bodies and employees
NNumber and breakdown of dismissals by gender, age and professional classification;
2.1.1. Banco Sabadell workforce information 401-1 New employee hires and
employee turnover
AAverage remuneration and its eevolution, broken down by gender, age and professional classification or its equivalent;
2.1.3. Remuneration 405-2 Ratio of basic salary and remuneration between men and women
GGender pay gap, remuneration for equal positions or average remuneration within the company;
2.1.3. Remuneration 103 Employment + Diversity and equal opportunity
2.1.3. Remuneration 405-2 Ratio of basic salary and remuneration between men and women
AAverage remuneration of ddirectors and management sstaff, including variable pay, subsistence allowances, severance pay, payments into long-term retirement plans or any other amounts received, bbroken down by gender;
2.1.3. Remuneration 102-35 Governance; Remuneration policies

501Statutory information
AAREA CContent RResponse / ssection GGRI Standards GGRI DDescription
CCORPORATE AND SSTAFF--RRELATED MMATTERS
Implementation of ppolicies ssafeguarding employees’ right to ddisconnect.
No specific policies on safeguarding employees’ right to disconnect are defined at corporate level.
103 Management approach disclosures – Employment
Employees with disabilities. 2.1.1. Banco Sabadell workforce information 405-1 Diversity of governance
bodies and employees
OOrganisation of working hours 2.2. Work organisation, health and safety 103 Management approach
disclosures – Employment
Number of hours of employee absence 2.2.3. Health and safety 403-2
Types of accident and incidence rates of accidents, occupational illnesses, days not worked, aabsenteeism and number of deaths per workplace accident and occupational illnesses
MMeasures aimed at facilitating the achievement of a work/life balance and encouraging the equal enjoyment of such measures by both parents.
2.2.2 Work/life balance 103 Management approach disclosures – Employment
HHEALTH AND SAFETY
Health and safety conditions in the workplace; 2.2.3. Health and safety 103
Management approach disclosures – Health and Safety management in the workplace
Workplace aaccidents, in particular their frequency and severity;
2.2.3. Health and safety 403-2
Types of accident and incidence rates of accidents, occupational illnesses, days not worked, absenteeism and number of deaths per workplace accident and occupational illnesses
OOccupational illnesses; broken down by gender. 2.2.3. Health and safety 403-3
Workers with a high incidence rate or at high risk of illnesses related to their activity
SSOCIAL MATTERS Organisation of social dialogue, including procedures for informing and consulting with staff and for negotiating with them;
2.3. Workplace relations 103
Management approach disclosures – Relationships between workers and the company
Percentage of eemployees ccovered by a collective bbargaining agreement, by country;
2.3. Workplace relations 102-41 Collective bargaining agreements
Status of collective bargaining agreements, particularly in relation to occupational health and safety.
2.3. Workplace relations 403-1
Representation of workers in formal committees between employees and employers on health and safety

502 Banco Sabadell Annual report 2018
AAREA CContent RResponse / section GGRI Standards GGRI DDescription
CCORPORATE AND SSTAFF--RRELATED MMATTERS
TTRAINING PPolicies implemented in relation to training;
2.4. Training 103 Management approach disclosures – Training and education
TTotal hours of training, broken down by professional category.
2.4. Training 404-1 Average hours of training per year per employee
UUniversal accessibility for people wwith ddisabilities
2.6. Universal accessibility for people with disabilities
103 Management approach
EEQUALITY MMeasures adopted to promote equal treatment and opportunities between men and women;
2.5. Equality
103
Management approach disclosures – Diversity and equal opportunity + Non-discrimination
EEquality Plans (Chapter III of Organic Law 3/2007, of 22 March, on effective equality between men and women), measures adopted to promote employment, protocols against sexual abuse and sexual harassment, integration and universal accessibility for people with disabilities;
2.5. Equality
PPolicy against all forms of discrimination and, where applicable, gender diversity management.
2.5. Equality
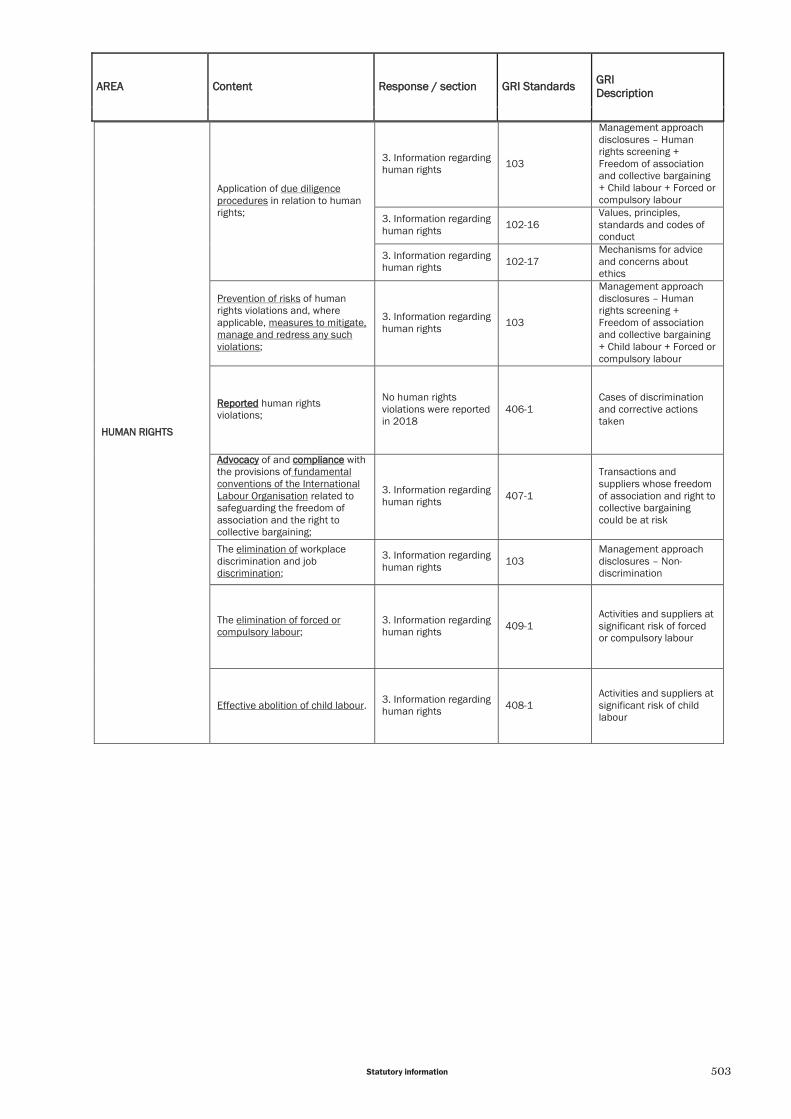
503Statutory information
AAREA CContent RResponse / section GGRI Standards GGRI DDescription
HHUMAN RIGHTS
Application of due diligence procedures in relation to human rights;
3. Information regarding human rights 103
Management approach disclosures – Human rights screening + Freedom of association and collective bargaining + Child labour + Forced or compulsory labour
3. Information regarding human rights 102-16
Values, principles, standards and codes of conduct
3. Information regarding human rights 102-17
Mechanisms for advice and concerns about ethics
Prevention of risks of human rights violations and, where applicable, measures to mitigate, manage and redress any such violations;
3. Information regarding human rights 103
Management approach disclosures – Human rights screening + Freedom of association and collective bargaining + Child labour + Forced or compulsory labour
RReported human rights violations;
No human rights violations were reported in 2018
406-1 Cases of discrimination and corrective actions taken
AAdvocacy of and ccompliance with the provisions of fundamental conventions of the International Labour Organisation related to safeguarding the freedom of association and the right to collective bargaining;
3. Information regarding human rights 407-1
Transactions and suppliers whose freedom of association and right to collective bargaining could be at risk
The elimination of workplace discrimination and job discrimination;
3. Information regarding human rights 103
Management approach disclosures – Non-discrimination
The elimination of forced or compulsory labour;
3. Information regarding human rights 409-1
Activities and suppliers at significant risk of forced or compulsory labour
Effective abolition of child labour. 3. Information regarding human rights 408-1
Activities and suppliers at significant risk of child labour
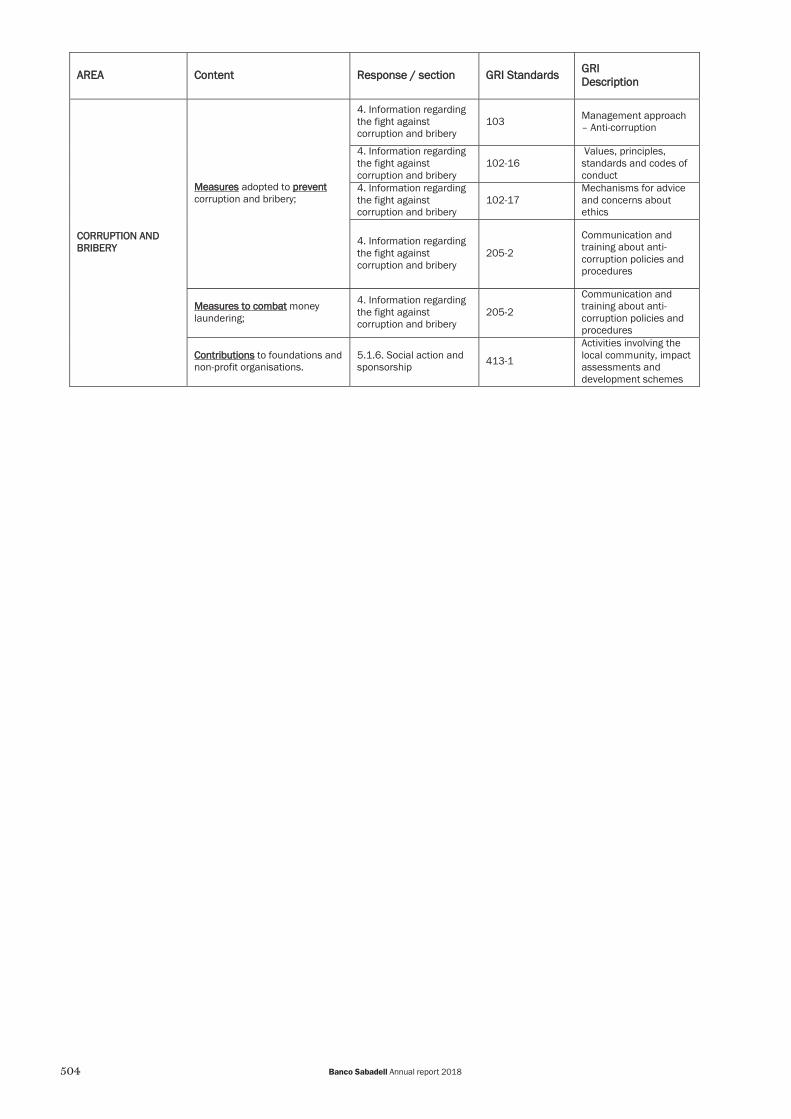
504 Banco Sabadell Annual report 2018
AAREA CContent RResponse / section GGRI Standards GGRI DDescription
CCORRUPTION AND BBRIBERY
MMeasures adopted to pprevent corruption and bribery;
4. Information regarding the fight against corruption and bribery
103 Management approach – Anti-corruption
4. Information regarding the fight against corruption and bribery
102-16 Values, principles, standards and codes of conduct
4. Information regarding the fight against corruption and bribery
102-17 Mechanisms for advice and concerns about ethics
4. Information regarding the fight against corruption and bribery
205-2
Communication and training about anti-corruption policies and procedures
MMeasures to combat money laundering;
4. Information regarding the fight against corruption and bribery
205-2
Communication and training about anti-corruption policies and procedures
CContributions to foundations and non-profit organisations.
5.1.6. Social action and sponsorship 413-1
Activities involving the local community, impact assessments and development schemes

505Statutory information
AAREA CContent RResponse / section GGRI Standards GGRI DDescription
SSOCIETY
TThe company’s commitments to sustainable development
The iimpact of the company’s activities on local employment and development;
5.1.3 Social housing management; 5.1.4. Financial education; 5.1.6 Social action and sponsorship
103
Management approach disclosures – Local communities + Indirect economic impacts
5.1.3 Social housing management; 5.1.4. Financial education; 5.1.6 Social action and sponsorship
203-1 Infrastructure investments and services supported
5.1.3 Social housing management; 5.1.4. Financial education; 5.1.6 Social action and sponsorship
203-2 Significant indirect economic impacts
5.1.3 Social housing management; 5.1.4. Financial education; 5.1.6 Social action and sponsorship
413-1
Activities involving the local community, impact assessments and development schemes
The iimpact of the company’s activities on local communities and in the area;
5.1.3 Social housing management; 5.1.4. Financial education; 5.1.6 Social action and sponsorship
203-1 Infrastructure investments and services supported
5.1.3 Social housing management; 5.1.4. Financial education; 5.1.6 Social action and sponsorship
413-1
Activities involving the local community, impact assessments and development schemes
The relationships with key members of local communities and the different forms of dialogue with the same;
5.1.3 Social housing management; 5.1.4. Financial education; 5.1.6 Social action and sponsorship
102-43
Approaches to encourage the involvement of stakeholders
5.1.3 Social housing management; 5.1.4. Financial education; 5.1.6 Social action and sponsorship
413-1
Activities involving the local community, impact assessments and development schemes
Association and sponsorship activities.
5.1.6. Social action and sponsorship 102-12 External initiatives
5.1.6. Social action and sponsorship 102-13 Membership of
associations

506 Banco Sabadell Annual report 2018
AAREA CContent RResponse / section GGRI Standards GGRI DDescription
SSOCIETY
OOUTSOURCING AND SUPPLLIERS
* Inclusion in the pprocurementppolicy of social, gender equalityand environmental matters; * Consideration in rrelationshipswwith suppliers andssubcontractors of their social and environmental responsibilities;
5.2.2. Outsourcing and suppliers 102-9 Supply chain
5.2.2. Outsourcing and suppliers 103
Environmental assessment of suppliers + Evaluation of suppliers’social matters
5.2.2. Outsourcing and suppliers 308-1 Environmental
assessment of suppliers
5.2.2. Outsourcing and suppliers 414-1 Evaluation of suppliers’
social matters
SSupervision and audit systems and their results.
5.2.2. Outsourcing and suppliers 103
Management approach disclosures – procurement practices
CConsumers
Consumer health and safety measures;
5.1.1 Transparency, simplification and accessibility; 5.1.4 Financial education
103
Management approach disclosures – Customer health and safety + Marketing and labelling + Client privacy
Whistle-blowing systems, complaints received and their resolution.
5.2.1. Consumers 103
Management approach disclosures – Customer health and safety + Marketing and labelling + Client privacy
TTax information
Country-by-country earnings obtained 5.3. Tax information 103
Management approach disclosures – Economic performance + Quantitative data on taxes and earnings
Corporation tax paid 5.3. Tax information 103
Management approach disclosures – Economic performance + Quantitative data on taxes and earnings
Public subsidies received 5.3. Tax information 201-4 Financial assistance received from government

507Statutory information
GGLOSSARY
The glossary includes a definition of the indicators included in the Non-Financial Disclosures Report and which have no equivalent GRI standard.
Social housing management
- Properties used as social housing: number of properties available for rent as social housing as at year-end forcustomers at risk of being in vulnerable circumstances, based on the bank’s internal criteria and obtained throughforeclosure orders, payment in kind (datio in solutum) or occupied by illegal occupants who have entered into a rentalagreement.
- Social contracts entered into over total properties available for social housing: number of social contracts enteredinto as a percentage of the total number of properties available for social housing as at year-end.
- Mortgage debt restructuring operations: total mortgage debt restructuring (change in repayment terms on an existingmortgage) operations carried out during the year.
- Payment in kind (datio in solutum): total number of payments in kind (where debtors surrender a property to the bankin repayment of their mortgage debt) carried out during the year.
- Indicators of contributions made to the Social Housing Fund (Fondo Social de la Vivienda, or FSV) under theframework of the latter’s Agreement, as a result of Royal Decree-Law 27/2012 of 15 November on urgent measuresto strengthen the protection of mortgage debtors; or Number of properties: total properties made available to the FSVby the bank.
- Occupancy rate: number of rental agreement entered into as a percentage of the total properties made available tothe FSV by the bank.
- Social contracts (JoBS programme) from the start of the programme in October 2016: number of participants in theemployment and labour market insertion programme (JoBS) under the framework of the bank’s social contracts (rentalagreements for social housing which include clauses on employment and labour market insertion programmes inwhich the signatory commits to take part), from the start of the programme in October 2016 and for the rentalagreements in effect as at year-end.
- Employment contracts: total employment contracts (employment contracts signed under the framework of theemployment and labour market insertion programmes indicated in social contracts) entered into as a result of theinsertion programme (in cumulative terms since the start of the programme in October 2016 and for the rentalagreements in effect as at year-end).
- Employment and labour insertion agreements signed: number of agreements in effect as at year-end signed withcompanies from different sectors under the framework of the JoBS employment and labour insertion programme.
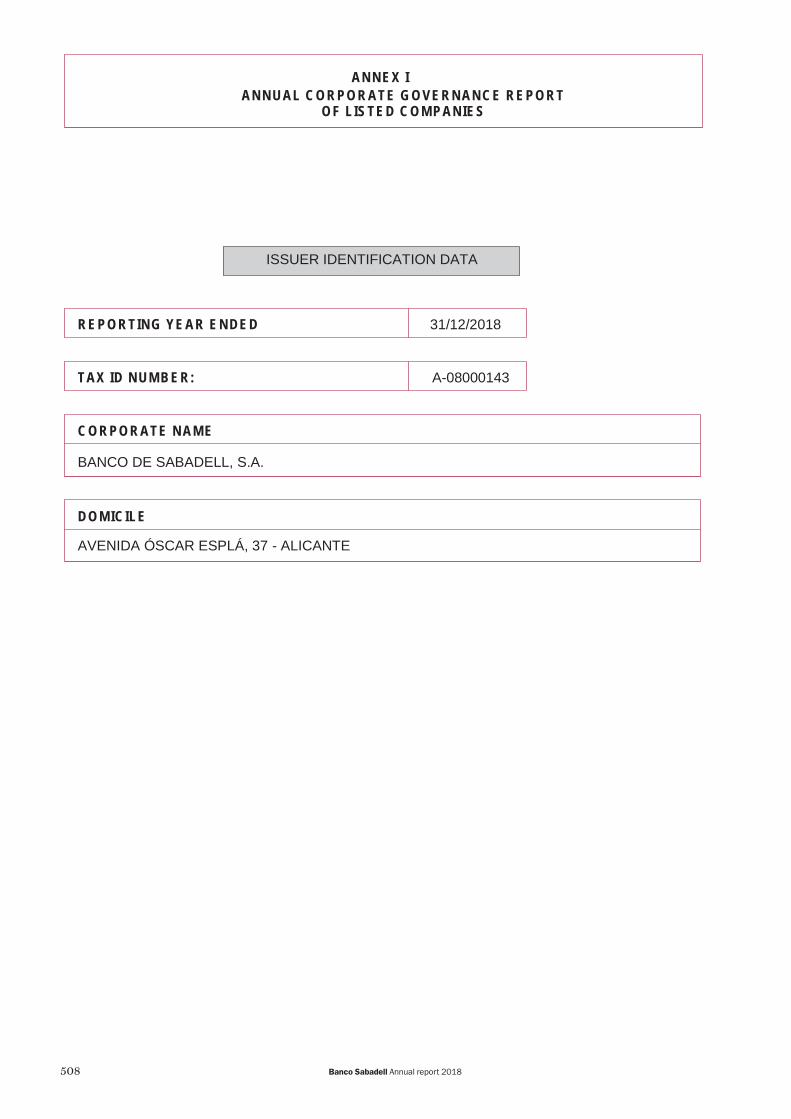
508 Banco Sabadell Annual report 2018
ANNEX I
ANNUAL CORPORATE GOVERNANCE REPORT
OF LISTED COMPANIES
ISSUER IDENTIFICATION DATA
REPORTING YEAR ENDED 31/12/2018
TAX ID NUMBER: A-08000143
CORPORATE NAME
BANCO DE SABADELL, S.A.
DOMICILE
AVENIDA ÓSCAR ESPLÁ, 37 - ALICANTE
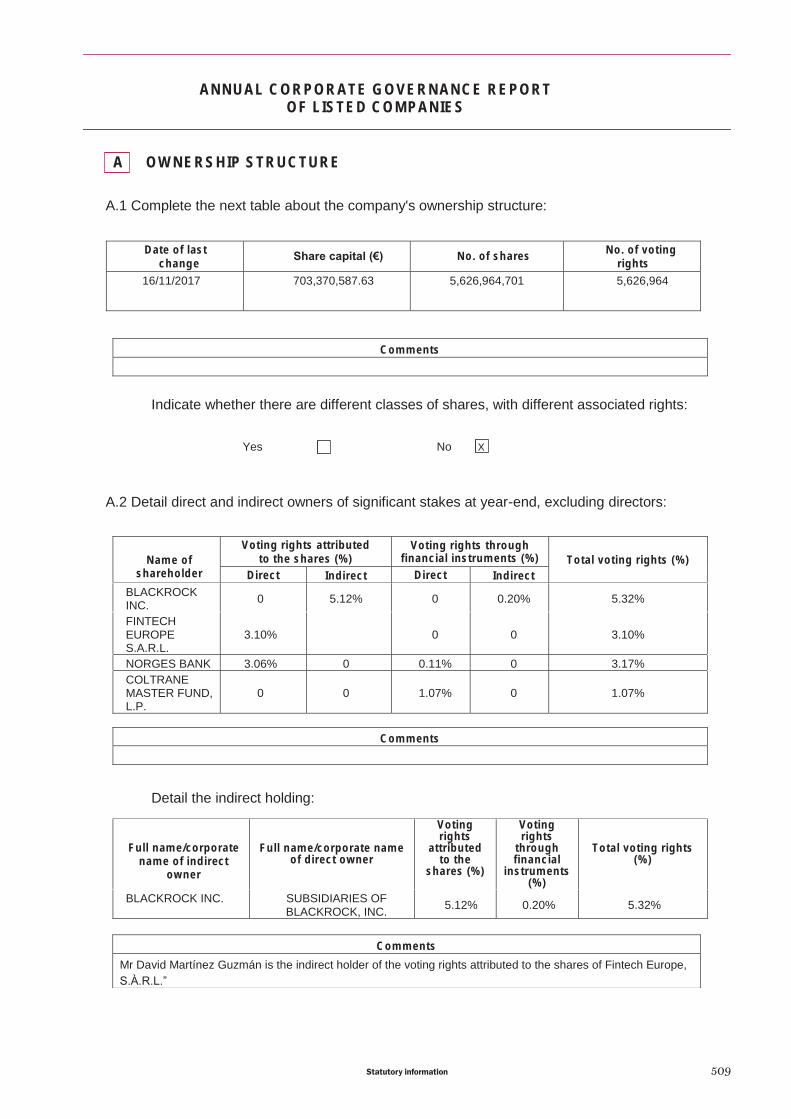
509Statutory information
ANNUAL CORPORATE GOVERNANCE REPORT
OF LISTED COMPANIES
A OWNERSHIP STRUCTURE
A.1 Complete the next table about the company's ownership structure:
Date of last
changeShare capital (€) No. of shares
No. of voting
rights
16/11/2017 703,370,587.63 5,626,964,701 5,626,964
Comments
Indicate whether there are different classes of shares, with different associated rights:
Yes No X
A.2 Detail direct and indirect owners of significant stakes at year-end, excluding directors:
Name of
shareholder
Voting rights attributed
to the shares (%)
Voting rights through financial instruments (%) Total voting rights (%)
Direct Indirect Direct Indirect
BLACKROCK INC. 0 5.12% 0 0.20% 5.32%
FINTECH EUROPE S.A.R.L.
3.10% 0 0 3.10%
NORGES BANK 3.06% 0 0.11% 0 3.17%COLTRANE MASTER FUND, L.P.
0 0 1.07% 0 1.07%
Comments
Detail the indirect holding:
Full name/corporate
name of indirect
owner
Full name/corporate name of direct owner
Voting rights
attributed to the
shares (%)
Voting rights
through financial
instruments (%)
Total voting rights (%)
BLACKROCK INC. SUBSIDIARIES OF BLACKROCK, INC. 5.12% 0.20% 5.32%
Comments
Mr David Martínez Guzmán is the indirect holder of the voting rights attributed to the shares of Fintech Europe, S.À.R.L.”

510 Banco Sabadell Annual report 2018
Indicate significant changes in the ownership structure in the year:
BLACKROCK INC. 23/03/2018 The stake fell below 5% of capital stock
BLACKROCK INC. 27/04/2018 The stake exceeded 5% of capital stock.
BLACKROCK INC. 01/05/2018 The stake fell below 5% of capital stock
BLACKROCK INC. 03/05/2018 The stake exceeded 5% of capital stock.
BLACKROCK INC. 04/05/2018 The stake fell below 5% of capital stock
NORGES BANK. 25/05/2018 Acquisition of 3.149% of capital
BLACKROCK INC. 31/05/2018 The stake exceeded 5% of capital stock.
BLACKROCK INC. 01/06/2018 The stake fell below 5% of capital stock
BLACKROCK INC. 04/06/2018 The stake exceeded 5% of capital stock.
BLACKROCK INC. 15/06/2018 The stake fell below 5% of capital stock
BLACKROCK INC. 25/07/2018 The stake exceeded 5% of capital stock.
BLACKROCK INC. 27/07/2018 The stake fell below 5% of capital stock
BLACKROCK INC. 30/07/2018 The stake exceeded 5% of capital stock.
BLACKROCK INC. 31/07/2018 The stake fell below 5% of capital stock
BLACKROCK INC. 03/08/2018 The stake exceeded 5% of capital stock.
BLACKROCK INC. 08/08/2018 The stake fell below 5% of capital stock
BLACKROCK INC. 09/08/2018 The stake exceeded 5% of capital stock.
BLACKROCK INC. 10/08/2018 The stake fell below 5% of capital stock
WINTHROP SECURITIES LTD. 23/08/2018 Attribution of its stake to Fintech Europe S.à.r.l.
BLACKROCK INC. 05/09/2018 The stake exceeded 5% of capital stock.
BLACKROCK INC. 07/09/2018 The stake fell below 5% of capital stock
BLACKROCK INC. 11/09/2018 The stake exceeded 5% of capital stock.
BLACKROCK INC. 12/09/2018 The stake fell below 5% of capital stock
BLACKROCK INC. 14/09/2018 The stake exceeded 5% of capital stock.
BLACKROCK INC. 02/10/2018 The stake fell below 5% of capital stock
BLACKROCK INC. 18/10/2018 The stake exceeded 5% of capital stock.
BLACKROCK INC. 22/10/2018 The stake fell below 5% of capital stock
BLACKROCK INC. 29/10/2018 The stake exceeded 5% of capital stock.
BLACKROCK INC. 3/12/2018 The stake fell below 5% of capital stock
BLACKROCK INC. 17/12/2018 The stake exceeded 5% of capital stock.
Main changes

511Statutory information
A.3 Complete the next tables regarding the members of the company's board of directors who holdvoting rights in the company:
Name of director
Voting rights attributed to
the shares (%)
Voting rights
through financial
instruments (%)Total
voting
rights (%)
Voting rights that
may be transferred
through financial
instruments (%)
Direct Indirect Direct Indirect Direct Indirect
Mr. JOSÉ OLIU CREUS 0.01% 0.11% 0.03% 0.00% 0.15% 0.00% 0.00%
Mr. JOSÉ JAVIER ECHENIQUE LANDIRIBAR
0.00% 0.00% 0.00% 0.00% 0.00% 0.00% 0.00%
Mr. JAIME GUARDIOLA ROMOJARO 0.02% 0.00% 0.03% 0.00% 0.05% 0.00% 0.00%
Mr. ANTHONY FRANK ELLIOTT BALL 0.00% 0.00% 0.00% 0.00% 0.00% 0.00% 0.00%
Ms. AURORA CATÁ SALA 0.00% 0.00% 0.00% 0.00% 0.00% 0.00% 0.00%
Mr. PEDRO FONTANA GARCIA 0.00% 0.00% 0.00% 0.00% 0.00% 0.00% 0.00%
Ms. MARÍA JOSÉ GARCÍA BEATO 0.00% 0.00% 0.01% 0.00% 0.01% 0.00% 0.00%
Ms. MARIA TERESA GARCIA-MILÀ LLOVERAS
0.00% 0.00% 0.00% 0.00% 0.00% 0.00% 0.00%
Mr. GEORGE DONALD JOHNSTON 0.00% 0.00% 0.00% 0.00% 0.00% 0.00% 0.00%
Mr. DAVID MARTÍNEZ GUZMÁN 0.00% 3.10% 0.00% 0.00% 3.10% 0.00% 0.00%
Mr. JOSÉ MANUEL MARTÍNEZ MARTÍNEZ 0.00% 0.00% 0.00% 0.00% 0.00% 0.00% 0.00%
Mr. JOSÉ RAMÓN MARTÍNEZ SUFRATEGUI
0.04% 0.01% 0.00% 0.00% 0.05% 0.00% 0.00%
Mr. JOSÉ LUIS NEGRO RODRÍGUEZ 0.04% 0.00% 0.02% 0.00% 0.06% 0.00% 0.00%
Mr. MANUEL VALLS MORATÓ 0.00% 0.00% 0.00% 0.00% 0.00% 0.00% 0.00%
Mr. DAVID VEGARA FIGUERAS 0.00% 0.00% 0.00% 0.00% 0.00% 0.00% 0.00%
Total % of voting rights held by the board of directors 3.36%
Comments
The percentage of voting rights through financial instruments reflects the rights attributed to the long-term supplementary incentives for the years 2016, 2017 and 2018, which have not vested.
Detail the indirect holding:
Name of
director
Full name/corporate name of direct owner
Voting rights
attributed to
the shares (%)
Voting rights
through financial
instruments (%)
Total
voting
rights (%)
Voting
rights that
may be
transferred
through
financial
instruments
(%)
Mr. DAVID MARTÍNEZ GUZMÁN
FINTECH EUROPE S.A.R.L.
3.10% 3.10%

512 Banco Sabadell Annual report 2018
Comments
A.4 Indicate any family, commercial, contractual or business relationships among owners ofsignificant stakes, insofar as they are known to the company, unless they are not material or are derived from ordinary commercial transactions, except those disclosed in section A.6.
A.5 Indicate any commercial, contractual or corporate relationships between owners of significantstakes and the company and/or its group, unless they are not material or are derived from ordinary commercial transactions:
A.6 Indicate any relationships between significant shareholders or shareholders with boardrepresentation and the directors, or their representatives, in the case of natural persons representing directors that are legal persons, except where such relations are non-material for the two parties.
Indicate how the significant shareholders are represented. Specifically, identify any directors who were appointed to represent significant shareholders, those whose appointment was proposed by significant shareholders, or who are related to significant shareholders and/or entities in their group, indicating the nature of the relationship. In particular, disclose the existence, identity and position of directors, or representatives of directors, of the listed company who are, in turn, members of the board, or their representatives, in companies that hold significant stakes in the listed company or in entities of such significant shareholders' group.
Full name/corporate name of related director or
representative
Name of related significant shareholder
Corporate name of the significant shareholder's
group company
Description of relationship/position
DAVID MARTÍNEZ GUZMÁN FINTECH EUROPE, S.À.R.L.
A.7 Indicate whether shareholders' agreements that affect the company have been notified to thecompany as provided in articles 530 and 531 of the Capital Companies Act. If so, briefly describe the agreements and list the shareholders involved:
Yes No X
Parties to shareholder agreement
% of share capital affectedBrief description of
agreement
Date of expiration
of the agreement,
if any
Comments
Comments
Fintech Europe S.A.R.L. is owned 100% by Fintech Investment Ltd., the investment fund managed by Fintech Advisory Inc. (FAI). FAI is owned 100% by Mr. David Martínez Guzmán.

513Statutory information
Indicate if the company is aware of any concerted actions among its shareholders. If so, give a brief description:
Yes No X
If the shareholders' agreements or concerted actions have been amended or terminated in the year, indicate this expressly.
On 24 December 2018, in regulatory disclosure no. 273.317, it was announced that the signatories of the shareholders' agreement dated 27 July 2006 had decided to cancel it.
A.8 Indicate if any natural or legal person exercises or can exercise control over the company inaccordance with article 5 of the Securities Market Act. If so, identify that person:
Yes No X
Comments
A.9 Complete the next tables about the company's own shares:
At year-end:
No. of direct shares No. of indirect shares (*) Total % of share capital
88,788,514 2,448,704 1.62%
(*) Through:
Name of direct owner of holding No. of direct shares
TSB Bank plc. 2,448,704Total: 2,448,704
Describe the main changes in the year:
Comments
Comments
Describe the main changes

514 Banco Sabadell Annual report 2018
See detail in table.
A.10 Detail the conditions and term of the current authorisation that the Shareholders' Meeting hasgiven to the Board of Directors to buy or sell own shares.
The current mandate was granted by a resolution of the General Meeting of Shareholders of Banco Sabadell, S.A. on 19 April 2018, under item 6 on the agenda, for five years, in the following terms:
"Revoke the delegation granted under resolution six adopted at the General Meeting on 30 March 2017 in the part not executed, and authorise Banco de Sabadell, Sociedad Anónima so that, either directly or through any of its subsidiaries, and within a maximum period of five years as from the date of this General Meeting, it may acquire, at any time and as often as it sees fit, shares of Banco de Sabadell, Sociedad Anónima by any of the means admitted by law, including against profit for the year and/or unrestricted reserves, and that it may subsequently sell or cancel any shares thus acquired or, as appropriate, deliver them to employees or directors of Banco de Sabadell, Sociedad Anónima as part of their remuneration or as a result of the exercise of stock options which they hold, all in accordance with the provisions of articles 146, 509 and matching articles of the Capital Companies Act.
Approve the limits or conditions of these acquisitions, as follows:
- The par value of the shares thus acquired, directly or indirectly, in addition to any shares already held by Bancode Sabadell, Sociedad Anónima and its subsidiaries, must not exceed, at any time, the legal limit established atany time by the legislation in force (currently ten per cent of share capital), complying in all cases with all thelimits for acquisition of treasury shares established by the stock market regulators in the markets on which theshares of Banco de Sabadell, Sociedad Anónima are listed.
- The acquisition, including any shares previously acquired by Banco de Sabadell, Sociedad Anónima (or by aperson acting in their own name but on the bank's behalf) and held by it, must not lead to equity being less thanthe amount of capital plus legal reserves and reserves that are designated as restricted under the Articles ofAssociation.
- The shares acquired must have been fully paid.- The acquisition price must be no less than par value and no higher than 20 per cent above the stock market
price or any other price whereby the shares may be valued as of the date of their acquisition. All acquisitions oftreasury shares must be made in accordance with general stock market rules and regulations."
A.11 Estimated free float:
%
Estimated free float 86.83
A.12 Indicate whether there are any restrictions (under the Articles of Association, the law or anyother type) on the transfer of securities and/or any restriction on voting rights. In particular, disclose the existence of any restrictions that might hamper the acquisition of control of the company by purchasing its shares in the market, and the requirements as to prior authorisation or disclosure of the acquisition or disposal of the company's financial instruments that are applicable in its industry.
Yes X No
Comments
Description of the restrictions

515Statutory information
A.13 State whether the General Meeting adopted measures to neutralise a takeover bid under theprovisions of Act 6/2007.
Yes No X
Detail any such methods that have been approved and the terms in which the restrictions will be rendered ineffective:
A.14 Indicate whether the company has issued securities that are not listed in a regulated market inthe European Union.
Yes No X
If so, state the classes of shares and, for each class of shares, their corresponding rights and obligations.
B GENERAL MEETING
B.1 Indicate whether there are differences with respect to the minimum requirements set out in theCapital Companies Act in connection with the quorum for a General Meeting of Shareholders, and describe any such differences.
Yes No X
B.2 Indicate whether there are differences with respect to the rules provided by the Corporations Lawfor the adoption of corporate resolutions, and describe any such differences:
Yes No X
Describe the differences with respect to the rules set out in the Capital Companies Act.
B.3 Describe the rules that apply to amendments of the company's Articles of Association. Inparticular, indicate the majorities required to amend the Articles of Association and any rules for safeguarding shareholders' rights in the event of an amendment of the Articles.
Amendments of the Bank's Articles of Association are governed by the Capital Companies Act and the Bank's own Articles of
The only existing restrictions are those derived from Spanish legislation applying to all credit institutions. There are no restrictions in the Articles of Association or of any other type. Act 10/2014, of 26, June, on ordering, supervision and solvency of credit institutions, establishes that in any acquisition of at least 10 percent of the capital or of the voting rights of the institution, or that, without attaining that percentage, enables significant influence to be exercised over the institution, as well as any increases such as to exceed 20%, 30% or 50%, or the acquisition of control of the institution, the purchaser must give advance notice to the Bank of Spain, which will process the request for approval or denial by the European Central Bank. The reduction of the stake below those thresholds must be notified by the seller to the Bank of Spain.

516 Banco Sabadell Annual report 2018
Association; where required by law, it is also necessary to obtain authorisation from the Bank of Spain under the powers assigned to it by article 10 of Royal Decree 84/2015, of 13 February, implementing Act 10/2014, of 26, June, on ordering, supervision andsolvency of credit institutions, without prejudice to the functions attributed to the European Central Bank in accordance with the provisions of Council Regulation (EU) No 1024/2013, of 15 October, conferring specific tasks on the European Central Bank concerning policies relating to the prudential supervision of credit institutions.
In accordance with the provisions of the Capital Companies Act, where amendments are approved by the General Meeting, the following requirements must be met:
The directors or shareholders proposing the amendment must provide a written report justifying the proposed amendment.The proposed amendments must be clearly set out in the notice of the General Meeting.The notice of the General Meeting must state that all shareholders are entitled to inspect the full text of the proposedamendment and accompanying explanations at the Company’s registered office and to request that those documents beprovided or sent to them free of charge.
The resolutions must be adopted by the Shareholders’ Meeting in accordance with Article 43 of the Articles of Association:
Article 43. In order for an Ordinary or Extraordinary Shareholders’ Meeting to validly adopt a resolution to issue bonds that are convert ible into shares or that grant entitlement to participate in the company's earnings, to reduce or increase the share capital, to change the legal form of the Company, to merge or de-merge the Company or, generally, to make any amendment to the Articles of Association, the Meeting, if at first call, must be attended, in person or by proxy, by shareholders holding not less than 50 per cent of the subscribed voting shares.
If at second call, 25 per cent of capital must suffice.
Where those present represent less than 50 per cent of the subscribed voting shares, any of the resolutions referred to in the preceding paragraph must require a majority of two-thirds of the capital in attendance, whether in person or by proxy.
B.4 Indicate the attendance at the shareholders' meetings held in the reporting year and the twopreceding years:
Date of General
Meeting
% in
attendance
% represented % remote votingTotal
Electronic voting Other
31/03/2016 0.84% 65.43% 0.00% 0.00% 66.27%
Of which free float: 0.62% 63.22% 0.00% 0.00% 63.84%
30/03/2017 0.68% 63.30% 0.00% 0.00% 63.98%
Of which free float: 0.55% 62.92% 0.00% 0.00% 63.47%
19/04/2018 0.78% 60.57% 0.00% 0.00% 61.35%
Of which free float: 0.66% 60.38% 0.00% 0.00% 61.04%
B.5 Indicate whether any item on the agenda of the general meetings held during the year was notapproved by the shareholders, for any reason.
Yes No X
Items on the agenda that were not
approved
% votes against (*)
(*) If non-approval is due to reasons other than votes against, provide details in the text section and, in the "% votes against" column, enter "n/a".
Comments
The percentage of free float may include significant holdings held through international custodians.

517Statutory information
B.6 Indicate whether there are any restrictions in the Articles requiring a minimum number of sharesto attend the General Meeting or to vote by distance means:
Yes X No
Number of shares required to attend the General
Meeting.
1,000
Number of shares required to vote by distance means -
B.7 Indicate whether there are rules requiring that certain decisions, other than those established bylaw, involving the acquisition, transfer, contribution to another company of essential assets or othersimilar corporate operations must be submitted for the approval of the general meeting.
Yes No X
Detail the decisions, other than those established by Law, that must be submitted to the general
meeting.
B.8 Give the address of the company's website and the way to access the information about corporategovernance and other information about General Meetings that must be placed at shareholders' disposal via the company's website.
The information about corporate governance is available on the Group's corporate website (www.grupobancosabadell.com) directly in the section entitled "Corporate governance and remuneration policy". The information about General Meetings is available on the Group's corporate website (www.grupobancosabadell.com) directly in the section entitled "Shareholder and investor information"
C THE COMPANY'S GOVERNANCE STRUCTURE
C.1 Board of Directors
C.1.1 Maximum and minimum number of directors envisaged in the Articles, and the numberestablished by the general meeting:
Maximum number of directors 15
Minimum number of directors 11
Number of directors established by the general meeting 15
C.1.2 Complete the next table with the members of the board:
Comments
Comments

518 Banco Sabadell Annual report 2018
Name of directorReprese
ntativeDirector
category
Board
position
First
appointe
d
Last
appointed
Election
procedure
Mr. JOSÉ OLIU CREUS EXECUTIVE CHAIRMAN 29/03/1990 28/05/2015 GENERAL MEETING DECISION
Mr. JOSÉ JAVIER ECHENIQUE LANDIRIBAR
INDEPENDENT DEPUTY CHAIRMAN
18/09/2010 28/05/2015 GENERAL MEETING DECISION
Mr. JAIME GUARDIOLA ROMOJARO
EXECUTIVE MANAGING DIRECTOR
27/09/2007 19/04/2018 GENERAL MEETING DECISION
Mr. ANTHONY FRANK ELLIOTT BALL
INDEPENDENT DIRECTOR 30/03/2017 30/03/2017 GENERAL MEETING DECISION
Ms. AURORA CATÁ SALA
INDEPENDENT DIRECTOR 29/01/2015 28/05/2015 GENERAL MEETING DECISION
Mr. PEDRO FONTANA GARCIA
INDEPENDENT DIRECTOR 27/07/2017 19/04/2018 GENERAL MEETING DECISION
Ms. MARÍA JOSÉ GARCÍA BEATO
EXECUTIVE DIRECTOR and VICE-SECRETARY
24/05/2018 24/05/2018 BOARD RESOLUTION
Ms. MARIA TERESA GARCIA-MILÀ LLOVERAS
INDEPENDENT LEAD INDEPENDENT DIRECTOR
29/03/2007 30/03/2017 GENERAL MEETING DECISION
Mr. GEORGE DONALD JOHNSTON
INDEPENDENT DIRECTOR 25/05/2017 19/04/2018 GENERAL MEETING DECISION
Mr. DAVID MARTÍNEZ GUZMÁN
PROPRIETARY DIRECTOR 27/03/2014 19/04/2018 GENERAL MEETING DECISION
Mr. JOSÉ MANUEL MARTÍNEZ MARTÍNEZ
INDEPENDENT DIRECTOR 26/03/2013 19/04/2018 GENERAL MEETING DECISION
Mr. JOSÉ RAMÓN MARTÍNEZ SUFRATEGUI
INDEPENDENT DIRECTOR 18/09/2010 28/05/2015 GENERAL MEETING DECISION
Mr. JOSÉ LUIS NEGRO RODRÍGUEZ
EXECUTIVE DIRECTOR 31/05/2012 30/03/2017 GENERAL MEETING DECISION
Mr. MANUEL VALLS MORATÓ
INDEPENDENT DIRECTOR 22/09/2016 30/03/2017 GENERAL MEETING DECISION
Mr. DAVID VEGARA FIGUERAS
INDEPENDENT DIRECTOR 28/05/2015 28/05/2015 GENERAL MEETING DECISION
Total number of directors 15
Indicate any directors who stepped down in the reporting period, due to resignation, removal or any other reason:
Name of director
Director's
category at
time of
removal
Date of last
appointmentDate of
removal
Specialised
committees of
which he/she
was a member
Indicate
whether the
director stepped
down before the
end of his/her
Mr. JOSÉ MANUEL LARA GARCÍA Other External 28/05/2015 24/05/2018 Audit and Control
Yes

519Statutory information
Reason for stepping down, and other comments
On 24 May 2018, Banco Sabadell released a regulatory disclosure to the effect that Mr. José Manuel Lara García had presented his resignation by means of a letter to all the directors in which he explained that his decision was due to the fact that he was no longer involved in managing Inversiones Hemisferio and Grupo Planeta.
C.1.3 Complete the next tables with the members of the board and their category:
EXECUTIVE DIRECTORS
Name of director:
Mr. JOSÉ OLIU CREUS
Position in the company's organisation chart
CHAIRMAN
Profile:
BANKING / RETAIL & CORPORATE BANKING / FINANCE / ACADEMIC / INTERNATIONAL
He holds a degree in economics from the University of Barcelona and a PhD in economics from the University of Minnesota (USA). He was appointed Managing Director of Banco Sabadell in 1990 and has been Chairman of Banco Sabadell since 1999. He is currently non-executive Chairman of Exea Empresarial and the latter's representative on the board of Puig, S.L. He is also a member of FEDEA (Fundación de Estudios de Economía Aplicada), and a member of the Board of Trustees of the Princess of Asturias Foundation and the Princess of Girona Foundation.
Name of director:
Mr. JAIME GUARDIOLA ROMOJARO
Position in the company's organisation chart
MANAGING DIRECTOR
Profile:
BANKING / RETAIL & CORPORATE BANKING / FINANCE
He graduated in Law from Barcelona University and holds a degree in Business and an MBA from ESADE. He commenced working at BBVA in 1990, where he reached the position of General Manager for Spain and Portugal (2006-2007). He has been managing director of Sabadell since 2007. He is a member of the Board of Trustees of Fundación ESADE, Chairman of the Economic Policy Committee of Barcelona Chamber of Commerce, and a member of the Board of Círculo de Economía.
Name of director:
Mr. JOSÉ LUIS NEGRO RODRÍGUEZ
Position in the company's organisation chart
Director - General Manager
Profile:
BANKING / FINANCE / RISKS
Diploma in General Management from IESE. In the course of his career at Banco Sabadell, he has held a number of positions, such as General Secretary - Control (2000-2001) and Controller General (2001-2012), and Vice-Secretary of the Board of Directors (2006-2012). Executive director of Banco Sabadell since 2012 and General Manager since 2013. He is currently a director of Sociedad Rectora de la Bolsa de Valores de Barcelona He is also Vice-Chairman of Barcelona Centro Financiero Europeo.
Name of director:
Ms. MARÍA JOSÉ GARCÍA BEATO

520 Banco Sabadell Annual report 2018
Position in the company's organisation chart
DIRECTOR and COMPANY SECRETARY
Profile:
BANKING / LAW / REGULATORY
Degree in Law and Diploma in Criminology. Spanish State Attorney since 1991. She was appointed Chief of Staff of the Minister of Justice in 2000, and Under-Secretary of Justice in 2002. General Counsel of Banco Sabadell (2005-2008). Company secretary of Banco Sabadell since 2008. Executive director of Banco Sabadell since 2018. She is currently an independent director at listed company Red Eléctrica Corporación, S.A. She is also a member of the Board of Trustees of Fundación Banco Sabadell, Fundación de la Asociación Española de Banca and Fundación Wolters Kluwer.
Total number of executive directors 4
% of total Board 26.67%
PROPRIETARY EXTERNAL DIRECTORS
Name of director:
Mr. DAVID MARTÍNEZ GUZMÁN
Name of the significant shareholder whom the director represents or who proposed his/her appointment:
FINTECH EUROPE S.À.R.L.
Profile:
BUSINESS / FINANCE / INTERNATIONAL
Degree in Electrical/Mechanical Engineering from the National Autonomous University of Mexico, and MBA from Harvard Business School. Founder in 1987 of Fintech Advisory, which manages the Fintech Investments Limited fund (New York and London). Proprietary director of Banco Sabadell since 2014. He is currently a director of listed companies Alfa, S.A.B., Vitro, S.A.B. and Cemex, S.A.B.
Total number of proprietary directors 1
% of total Board 6.67%
INDEPENDENT EXTERNAL DIRECTORS
Name of director:
Mr. JOSÉ JAVIER ECHENIQUE LANDIRIBAR
Profile:
Comments
Comments

521Statutory information
BANKING / RETAIL & CORPORATE BANKING / BUSINESS
Holds a degree in Economics and Actuarial Science from the University of the Basque Country. Formerly Director and General Manager of Allianz-Ercos (1982-1990), General Manager of BBVA Group (1992-2001) and Chairman of Banco Guipuzcoano (2009-2012). Formerly a director of many companies in the energy and construction industries and the media. Independent director of Banco Sabadell since 2010 and Vice Chairman of the Board since 2013. He is currently an independent director of listed company ACS, Actividades de la Construcción y Servicios, S.A. and of ACS, Servicios, Comunicaciones y Energía, S.L., both belonging to the same group, of listed company Ence, Energía y Celulosa, S.A., and of listedcompany Telefónica, S.A. and of Telefónica Móviles México, S.A. de C.V., both belonging to the samegroup. He is also a trustee of Fundación Novia Salcedo.
Name of director:
Mr. ANTHONY FRANK ELLIOTT BALL
Profile:
BUSINESS/INTERNATIONAL:
Chartered Engineer; MBA from Kingston Business School, Kingston University (London). Honorary Doctorate from the Kingston University Faculty of Business and Law. Formerly Chairman and CEO of Fox Sports International (1995-1996), CEO of Fox Liberty Networks LLC. (1996-1999), CEO of BSkyB Plc.(1999-2004) and Chairman of Kabel Deutschland GmbH (2005-2013), and independent director of BT Group (2009-2018). Independent director of Banco Sabadell since 2017. He is currently Chairman of Ambassadors Theatre Group Ltd and of Bité Group, both part-owned by Providence Equity Partners LLC.
Name of director:
Ms. AURORA CATÁ SALA
Profile:
BUSINESS / CONSULTING / FINANCE / HUMAN RESOURCES
Holds a degree in Industrial Engineering (major in Industrial Organisation) from the Polytechnic University of Catalonia and an MBA and PADE from IESE Barcelona. Formerly CFO of Nissan Motor Ibérica, S.A. (1991-1996), Managing Director of Planeta 2010 (1999-2002), Founder of ContentArena (2002-2003), General Manager of Audiovisual Media at Recoletos Grupo de Comunicación (2003-2008) and member of the Governing Board of Institut Català de Finances (2014). Formerly held a number of directorships. Independent director of Banco Sabadell since 2015. Currently partner of Seeliger y Conde, S.L., director of listed company Atresmedia Corporación de Medios de Comunicación, S.A., member of the Executive Committee of IESE and member of the Board of Barcelona Global.
Name of director:
Mr. PEDRO FONTANA GARCIA
Profile:
BANKING / RETAIL / BUSINESS
Degree in Business from Escuela Superior de Administración y Dirección de Empresas (ESADE), Barcelona, and MBA from Harvard Graduate School of Business Administration. General Manager of COOB’92 (1990-1993), General Manager of Turisme de Barcelona (1993-1994), Chairman of Banca Catalana (1994-1999), General Manager of BBVA Catalonia (2000-2009), Executive Chairman of AREAS (Elior Group) (2012-2017), and Deputy General Manager of Elior Group, S.A. (2017-2018). Independent director of Banco Sabadell since 2017. He is currently an independent director of Grupo Indukern, S.L. and representative of EMESA Corporación Empresarial, S.L. on the board of listed company Elior Group, S.A. He is also President of Asociación para el Progreso de la Dirección, Member of the Barcelona Chamber of Commerce, Member of the Board of Trustees of Fundació Privada Cercle d’Economía and of Fundación Barcelona Mobile World Capital, and a director of Fira Internacional de Barcelona.
Name of director:
Ms. MARIA TERESA GARCIA-MILÀ LLOVERAS
Profile:
ACADEMIC/AUDITING/FINANCE

522 Banco Sabadell Annual report 2018
She has a Degree in Economics from the University of Barcelona and a PhD in Economics from the University of Minnesota, and has been a senior lecturer at the Department of Economics and Business at Pompeu Fabra University since 1995. Formerly held a number of directorships. Independent director of Banco Sabadell since 2007, and Lead Director since April 2016. She is also the Director of the Barcelona Graduate School of Economics, and a researcher and Board member of the International Economics Research Centre (CREI).
Name of director:
Mr. GEORGE DONALD JOHNSTON
Profile:
BANKING / CORPORATE BANKING / INTERNATIONAL
BA in Political Science from Middlebury College, Vermont, MA in International Economics and Latin American Studies from Johns Hopkins University. Executive Director at Salomon Brothers (1979-1990), Director of Bankers Trust International and member of its Global Executive Committee (1992-1999), Group Head of M&A for Europe and Member of the Europe Executive Committee and of the Global Operating Committee within the investment banking division of Deutsche Bank (1999-2005), Chairman of the M&A Group for Europe of Deutsche Bank (2005-2010), Director of SCi Entertainment Plc (Eidos) (2007-2009). Independent director of Banco Sabadell since 2017. Currently an independent director of listed companies Acerinox, S.A. and Merlin Properties, SOCIMI, S.A.
Name of director:
Mr. JOSÉ MANUEL MARTÍNEZ MARTÍNEZ
Profile:
BUSINESS / RETAIL BANKING / INSURANCE / FINANCE / INTERNATIONAL
A Public Works Engineer, he obtained a degree in Economics and Actuarial Science at the University of Madrid. Formerly Chairman of MAPFRE (2001-2012), President of Fundación MAPFRE (2007-2012) and member of the Board of Directors of Consorcio de Compensación de Seguros and the International Insurance Society. Independent director of Banco Sabadell since 2013. Currently Honorary Chairman of MAPFRE.
Name of director:
Mr. JOSÉ RAMÓN MARTÍNEZ SUFRATEGUI
Profile:
BANKING / BUSINESS
An architect specialised in urban development, he holds an Executive MBA from IE Business School. Formerly director of Banco Guipuzcoano (1990-2010). Independent director of Banco Sabadell since 2010. Owner and Chairman of an extensive group of companies, he is currently Chairman of Centro Fuencarral, S.A., Comercial del Campo, S.A., Edificios Cameranos, S.A., Inversiete, S.A., Producción y Desarrollo, S.A., Títulos e Inversiones, S.A., and Villa Rosa, S.A.
Name of director:
Mr. MANUEL VALLS MORATÓ
Profile:
AUDITOR
Degree in Economics and Business Studies from the University of Barcelona and a post-graduate qualification in Business Administration from IESE/University of Navarra: he is a registered auditor and a member of Spain's official register of auditors since its creation. Partner of PwC (1988-2013), Head of the Audit Division at PwC (2006-2013) and Chairman of PwC Auditores (2006-2011). Independent member of the Governing Board of Institut Català de Finances (2015-2016). Independent director of Banco Sabadell since 2016. Currently an independent director of listed company Renta Corporación Real Estate, S.A.
Name of director:
Mr. DAVID VEGARA FIGUERAS

523Statutory information
Profile:
FINANCIAL / RISKS / ACADEMIC / REGULATORY
A graduate in Economics and Business Studies, Major in General Economics (Applied Economics) from the Autonomous University of Barcelona, he holds a Master in Economics, major in Capital Markets and Political Science, from London School of Economics. Formerly Secretary of State for the Economy in the Spanish government (2004-2009), Deputy Managing Director, Banking, European Stability Mechanism (ESM) (2012-2015), and Associate Professor in the Department of Economics, Finance and Accounting at ESADE (until 2018). Independent director of Banco Sabadell since 2015. Currently member of the Supervisory Board of Hellenic Corporation of Assets and Participations, S.A.
Total number of independent directors 10% of total number of Board members 66.67%
Indicate whether any director classified as independent receives, from the company or the same group, any amount or benefit under a heading other than director remuneration, or holds or has held, during the last year, a business relationship with the company or any other company in its group, either in his/her own name or as a significant shareholder, director or senior manager of an institution that holds or has held such a relationship.
None.
If yes, give the reasons why it is considered that the director qualifies as an independent director.
OTHER EXTERNAL DIRECTORS
Identify the other external directors and detail the reasons why they cannot be classified as proprietary or independent, and any relations they have with the company, its executives or its shareholders.
Name of director:
- Company, executive or shareholder to which he/she is related:
-
Reason:
-
Profile:
-
Total number of other external directors
% of total number of Board members
Comments
Comments

524 Banco Sabadell Annual report 2018
Indicate any changes in each director’s status in the period:
Name of director Date of changePrevious
category
Current
category
C.1.4 Complete the following table with information on the number of female directors in the last fouryears, and their category:
Number of female directors % of total directors in each category
2018 2017 2016 2015 2018 2017 2016 2015
Executive 1 0 0 0 25.00% 0.00% 0.00% 0.00%
Proprietary 0 0 0 0 0.00% 0.00% 0.00% 0.00%
Independent 2 2 2 2 20.00% 20.00% 28.57% 22.22%
Other external 0 0 0 0 0.00% 0.00% 0.00% 0.00%
Total: 3 2 2 2 20.00% 13.33% 14.29% 13.33%
C.1.5 Indicate whether the company has diversity policies in relation to the board of directors withregard to issues such as age, gender, ability, or professional training and experience. Small and medium-sized undertakings, as defined the Audit Act, must disclose at least the policy they have established in relation to gender diversity.
Yes x No Partial policies
If yes, describe the diversity policies, their objectives, the measures and the way in which they have been applied and their results in the year. Also disclose specific measures adopted by the Board of Directors and the Appointments and Remuneration Committee to achieve balance and diversity on the Board of Directors.
If the company does not apply a diversity policy, give the reasons.
Description of the policies, objectives, measures and manner in which they were applied, as well as the
results obtained
Banco Sabadell applies its diversity policy through the Banco Sabadell Policy for the Selection of Candidates for
Comments
Comments
Banco Sabadell appointed one female director in 2018, with the category of Executive Director, which, considering the two female independent directors, significantly strengthened the presence of women on the Board of Directors.
525Statutory information
Directorship, which was approved by the Board of Directors on 25 February 2016, and whose goal is to achieve an appropriate balance in the composition of the Board of Directors such as to have the overall effect of enriching decision-making and providing plural viewpoints in debates on matter under its remit.
In order to achieve this diversity objective, the Policy establishes the conditions that the Appointments Committee must vet in candidates for directorships in Banco Sabadell; candidates are required to have professional competence, provide diversity and meet the fitness and suitability requirements. To this end, in accordance with the Banco Sabadell Policy for the Selection of Candidates for Directorship, professional competence will be assessed in persons who have achieved recognition in their profession; particular value is attached to recognition or prominence in the business community, which enables the candidate to contribute a strategic and business vision. Candidates are also expressly required to have an academic background with the appropriate level and profile to comprehend the institution's main activities and risks. Diversity in the Board of Directors is achieved through a variety of professional profiles, experiences, origins, nationalities and, in particular, gender; fitness and suitability is evidenced by an appropriate track record and personal, commercial and professional conduct that shed no doubt as to the person's capacity to exercise healthy, prudent oversight of the institution.
Regarding the measures and manner in which the Banco Sabadell diversity policy is applied, the Appointments Committee fulfils its function of overseeing the qualitative composition of the Board of Directors, as set out in the Articles of Association and the Regulations of the Board of Directors; it oversees the application of and compliance with the Banco Sabadell Policy for the Selection of Candidates for Directorship, and by ensuring that the selection procedures, when filling vacancies on the Board or appointing new directors, favour a diversity of experience and knowledge, facilitate the selection of female directors and, in general, do not have any implicit biases that may entail discrimination of any kind.
The Appointments Committee ensures that the candidate selection process fulfils the parameters of professional competence, diversity of profiles, origins, experience and knowledge, and good repute and suitability; in assessing the selected candidates, it places special emphasis on ensuring gender diversity in the Board of Directors. To this end, where necessary during the director selection process, the Committee can call on the support of an external consulting firm in order to obtain a diversity of candidate profiles for analysis.
In addition, Banco Sabadell has a set of policies, internal rules and codes of conduct that guarantee ethical and responsible behaviour throughout the organisation and have an impact on diversity and that are equally applicable to the Board of Directors, both in the director selection procedure and in the day-to-day performance of their functions, in matters such as training and professional experience, age, ability and gender.
These policies are published on the Company's corporate website (www.grupobancosabadell.com), within the Corporate Social Responsibility (CSR) section. One of the primary guidelines of the Banco Sabadell Group Human Resources Policy is to ensure optimal professional development for its employees while providing a working environment free of any kind of discrimination on grounds of age, ability or gender. Additionally, the Banco Sabadell Group Ethics and Human Rights Policy requires that fairness, transparency, professional responsibility, respect for diversity and the rights of individuals and the non-discrimination and exploitation of the human being are values that are part of the way of being and way of doing of the Banco Sabadell Group. Likewise, the Ethics and Human Rights Policy enshrines the principle of equality of persons without any distinction on the basis of race, sex, religion or any other distinguishing characteristic, respecting their dignity and guaranteeing equality of opportunities. In the area of workplace safety, the Banco Sabadell Occupational Safety Plan has a specific procedure for the protection of particularly sensitive persons, including workers with a recognised disability, which applies equally to the Board of Directors.
C.1.6 Describe any measures adopted by the Appointments Committee to ensure that the selectionprocedure is free of any implicit bias that might prevent the selection of women, and that the company deliberately seeks female candidates with the necessary professional profile, enabling it to attain a balance of women and men:
Detail such measures
The Board of Directors has adopted active policies to promote gender equality within the institution. Specifically, at a meeting on 17 February 2016, the Appointments Committee issued a favourable report to the Board of Directors on the approval of the Banco Sabadell Policy for the Selection of Candidates for Directorship, in

526 Banco Sabadell Annual report 2018
compliance with Recommendation 14 of the Code of Good Governance for Listed Companies.
As indicated in section C.1.5 above, the Policy sets out the criteria to be applied in the process of selecting new members of the Board of Directors and in the re-appointment of directors, under the provisions of the applicable laws and recommendations, and establishes that those selection procedures must facilitate the selection of female directors and, generally, must not have any implicit biases that might hamper the appointment of female directors. The Policy goal is that the under-represented gender accounts for at least 30% of the Board by 2020.
In particular, the Appointments Committee ensures that the director selection process fulfils the requirements as to professional competency, integrity, suitability and diversity and, specifically, seeks to ensure that there is a sufficient number of female directors. To this end, during the director selection process, the Committee focuses particularly on ensuring gender diversity on the Board of Directors, ensuring that the candidates include women with the necessary professional profile, for which purpose it can be assisted by an external consulting firm in order to obtain a diversity of profiles for analysis.
At 2018 year-end, there were 3 female directors out of a total of 15, two of them independent directors and one of them an executive director. Since 2016, the Lead Independent director has been a woman, who is also a member of the Audit and Control Committee, the Appointments Committee, the Remuneration Committee and the Risk Committee. The other female independent director is the Chair of the Appointments Committee and of the Remuneration Committee. As a result, women account for 20% of the Company's Board of Directors, 20% of the independent directors and 25% of the executive directors; they also chair two of the Board's five sub-committees and are members of four of those five committees. Accordingly, female directors account for 25% of the Audit and Control Committee, 25% of the Risk Committee, and 50% of the Remuneration Committee and the Appointments Committee.
Where, despite such measures, there are few or no female directors, indicate the reasons for this situation:
Detail the reasons
C.1.7 Detail the conclusions reached by the Appointments Committee in assessing compliance withthe director selection policy. In particular, indicate how this policy promotes the objective that, by 2020, women account for at least 30% of the Board.
In compliance with the Banco Sabadell Policy for the Selection of Candidates for Directorship that was approved by the Board of Directors on 25 February 2016, the Appointments Committee has placed on record that it checked that the policy was complied with in the director appointments made in 2018, which conformed to the parameters and requirements of both the Policy and the existing regulations governing directorships at credit institutions. Specifically, in the appointment by the Board of Directors on 24 May 2018 of the new executive director, Ms. María José García Beato, whose banking, regulatory and legal profile complements the diversity of knowledge and experience of the Board of Directors. Ms. María José García Beato was appointed on the basis of the procedure described in the Banco Sabadell Policy for the Selection of Candidates for Directorship, in a transparent process that focused particularly on increasing gender diversity, in compliance with the mandate of the Board of Directors and of the Appointments Committee to enhance gender diversity on the Board.
C.1.8 Indicate any reasons for which proprietary shareholders were appointed at the proposal of ashareholder owning less than 3% of capital:
Name of shareholder Justification
- -
Disclose any rejection of a formal request for a board seat from shareholders whose equity stake is equal to or greater than that of others which applied successfully for a proprietary directorship. Detail the reasons for any such rejection:
Yes No X

527Statutory information
Name of shareholder Explanation
- -
C.1.9 Disclose any powers or faculties delegated by the Board of Directors to directors or committeesof the Board:
Name of director or committee: Brief description
Mr. JOSÉ OLIU CREUS He holds general powers to represent the institution, direct and promote the strategy and all those for the exercise of his functions as Chairman of the Board and Chairman of the Executive Committee; direct oversight and promote the establishment of risk control and management systems for the Bank and the Group, direct supervision of the Internal Audit services of the Bank and the Group; direct and promote the communication strategy of the Bank and the Group; and enter into strategic and collaborative agreements.
Mr. JAIME GUARDIOLA ROMOJARO All the powers of the Board, except those that may not by law be delegated, and those powers that are necessary for him to manage the institution effectively as its chief executive.
Mr. JOSÉ LUIS NEGRO RODRÍGUEZ The general powers that are necessary to perform his functions in the institution.
Ms. MARÍA JOSÉ GARCÍA BEATO The general powers that are necessary to perform her functions in the institution.
EXECUTIVE COMMITTEE It has been expressly delegated with all the powers corresponding to the Board of Directors, except the powers that the law or the Articles reserve exclusively for the Board.
C.1.10 Identify any board members who are directors, representatives of directors, or executives inother companies that form part of the listed company’s group:
Name of director Name of Group
companyPosition
Does he/she
have executive
functions?
Mr. JOSÉ OLIU CREUS SABADELL CONSUMER FINANCE, S.A.U.
CHAIRMAN No
Mr. JAIME GUARDIOLA ROMOJARO SABADELL CONSUMER FINANCE, S.A.U.
DIRECTOR No
Mr. JAIME GUARDIOLA ROMOJARO BANCO SABADELL, S.A. I.B.M. (MEXICO)
CHAIRMAN No
Mr. JAIME GUARDIOLA ROMOJARO SabCapital, S.A. de C.V., SOFOM, E.R.(MEXICO)
CHAIRMAN No
Mr. JOSÉ LUIS NEGRO RODRÍGUEZ SABADELL CONSUMER FINANCE, S.A.U.
DIRECTOR No
Mr. JOSÉ LUIS NEGRO RODRÍGUEZ BANSABADELL FINANCIACIÓN, E.F.C. S.A.
CHAIRMAN No
Mr. DAVID VEGARA FIGUERAS BANCO SABADELL, S.A. I.B.M. (MEXICO)
DIRECTOR No
Mr. DAVID VEGARA FIGUERAS SabCapital, S.A. de C.V., SOFOM, E.R. (MEXICO)
DIRECTOR No
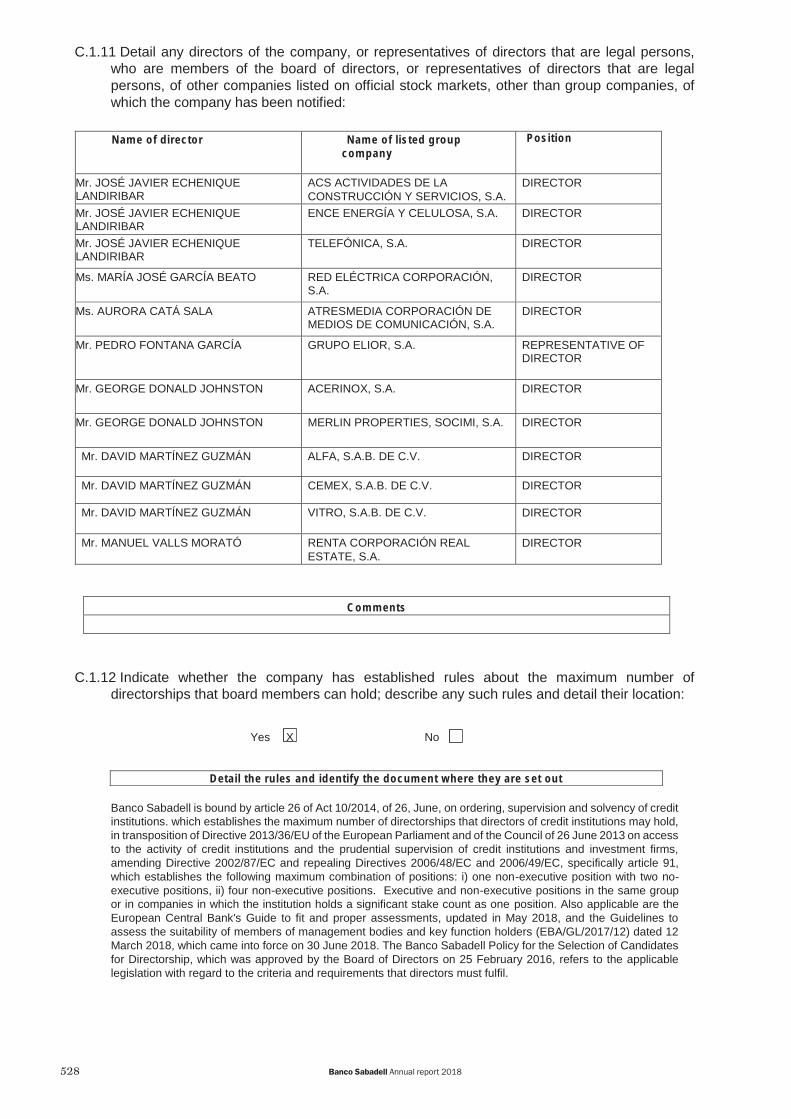
528 Banco Sabadell Annual report 2018
C.1.11 Detail any directors of the company, or representatives of directors that are legal persons,who are members of the board of directors, or representatives of directors that are legal persons, of other companies listed on official stock markets, other than group companies, of which the company has been notified:
Name of director Name of listed group
company
Position
Mr. JOSÉ JAVIER ECHENIQUE LANDIRIBAR
ACS ACTIVIDADES DE LA CONSTRUCCIÓN Y SERVICIOS, S.A.
DIRECTOR
Mr. JOSÉ JAVIER ECHENIQUE LANDIRIBAR
ENCE ENERGÍA Y CELULOSA, S.A. DIRECTOR
Mr. JOSÉ JAVIER ECHENIQUE LANDIRIBAR
TELEFÓNICA, S.A. DIRECTOR
Ms. MARÍA JOSÉ GARCÍA BEATO RED ELÉCTRICA CORPORACIÓN, S.A.
DIRECTOR
Ms. AURORA CATÁ SALA ATRESMEDIA CORPORACIÓN DE MEDIOS DE COMUNICACIÓN, S.A.
DIRECTOR
Mr. PEDRO FONTANA GARCÍA GRUPO ELIOR, S.A. REPRESENTATIVE OF DIRECTOR
Mr. GEORGE DONALD JOHNSTON ACERINOX, S.A. DIRECTOR
Mr. GEORGE DONALD JOHNSTON MERLIN PROPERTIES, SOCIMI, S.A. DIRECTOR
Mr. DAVID MARTÍNEZ GUZMÁN ALFA, S.A.B. DE C.V. DIRECTOR
Mr. DAVID MARTÍNEZ GUZMÁN CEMEX, S.A.B. DE C.V. DIRECTOR
Mr. DAVID MARTÍNEZ GUZMÁN VITRO, S.A.B. DE C.V. DIRECTOR
Mr. MANUEL VALLS MORATÓ RENTA CORPORACIÓN REAL ESTATE, S.A.
DIRECTOR
C.1.12 Indicate whether the company has established rules about the maximum number ofdirectorships that board members can hold; describe any such rules and detail their location:
Yes X No
Detail the rules and identify the document where they are set out
Banco Sabadell is bound by article 26 of Act 10/2014, of 26, June, on ordering, supervision and solvency of credit institutions. which establishes the maximum number of directorships that directors of credit institutions may hold, in transposition of Directive 2013/36/EU of the European Parliament and of the Council of 26 June 2013 on access to the activity of credit institutions and the prudential supervision of credit institutions and investment firms, amending Directive 2002/87/EC and repealing Directives 2006/48/EC and 2006/49/EC, specifically article 91, which establishes the following maximum combination of positions: i) one non-executive position with two no-executive positions, ii) four non-executive positions. Executive and non-executive positions in the same group or in companies in which the institution holds a significant stake count as one position. Also applicable are the European Central Bank's Guide to fit and proper assessments, updated in May 2018, and the Guidelines to assess the suitability of members of management bodies and key function holders (EBA/GL/2017/12) dated 12 March 2018, which came into force on 30 June 2018. The Banco Sabadell Policy for the Selection of Candidates for Directorship, which was approved by the Board of Directors on 25 February 2016, refers to the applicable legislation with regard to the criteria and requirements that directors must fulfil.
Comments
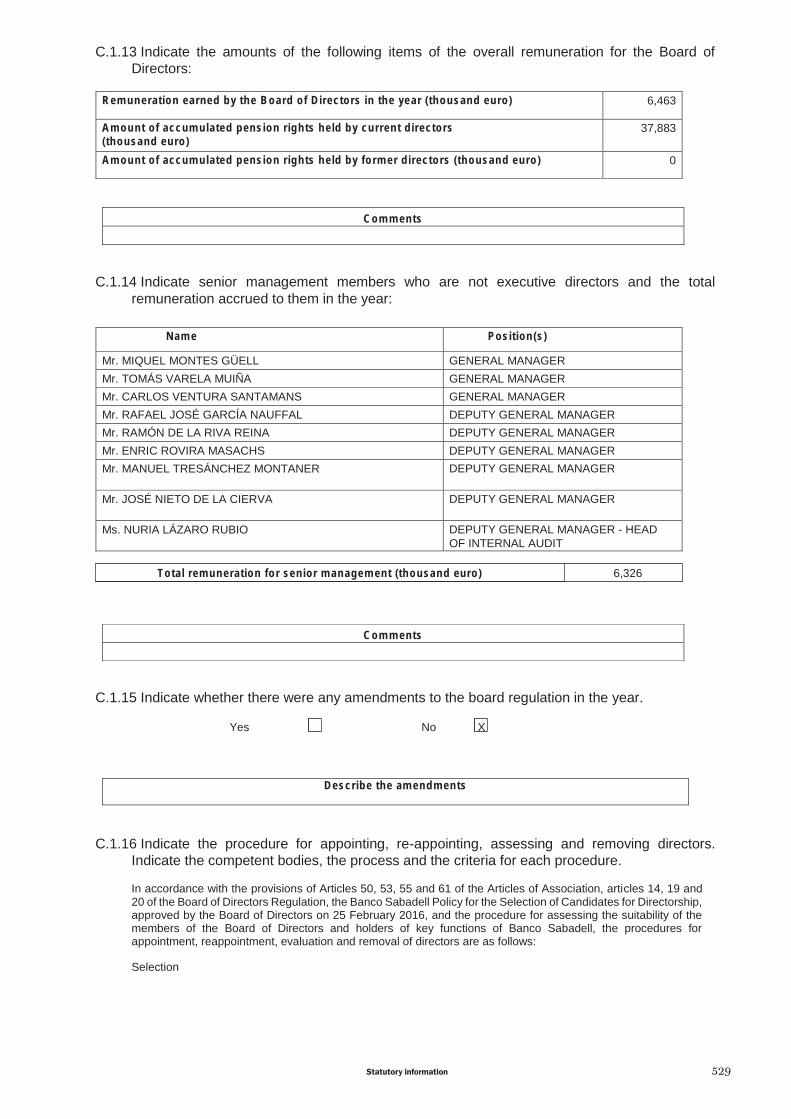
529Statutory information
C.1.13 Indicate the amounts of the following items of the overall remuneration for the Board ofDirectors:
Remuneration earned by the Board of Directors in the year (thousand euro) 6,463
Amount of accumulated pension rights held by current directors
(thousand euro)
37,883
Amount of accumulated pension rights held by former directors (thousand euro) 0
C.1.14 Indicate senior management members who are not executive directors and the totalremuneration accrued to them in the year:
Name Position(s)
Mr. MIQUEL MONTES GÜELL GENERAL MANAGER
Mr. TOMÁS VARELA MUIÑA GENERAL MANAGER
Mr. CARLOS VENTURA SANTAMANS GENERAL MANAGER
Mr. RAFAEL JOSÉ GARCÍA NAUFFAL DEPUTY GENERAL MANAGER
Mr. RAMÓN DE LA RIVA REINA DEPUTY GENERAL MANAGER
Mr. ENRIC ROVIRA MASACHS DEPUTY GENERAL MANAGER
Mr. MANUEL TRESÁNCHEZ MONTANER DEPUTY GENERAL MANAGER
Mr. JOSÉ NIETO DE LA CIERVA DEPUTY GENERAL MANAGER
Ms. NURIA LÁZARO RUBIO DEPUTY GENERAL MANAGER - HEAD OF INTERNAL AUDIT
Total remuneration for senior management (thousand euro) 6,326
C.1.15 Indicate whether there were any amendments to the board regulation in the year.
Yes No X
Describe the amendments
C.1.16 Indicate the procedure for appointing, re-appointing, assessing and removing directors.Indicate the competent bodies, the process and the criteria for each procedure.
In accordance with the provisions of Articles 50, 53, 55 and 61 of the Articles of Association, articles 14, 19 and 20 of the Board of Directors Regulation, the Banco Sabadell Policy for the Selection of Candidates for Directorship, approved by the Board of Directors on 25 February 2016, and the procedure for assessing the suitability of the members of the Board of Directors and holders of key functions of Banco Sabadell, the procedures for appointment, reappointment, evaluation and removal of directors are as follows:
Selection
Comments
Comments

530 Banco Sabadell Annual report 2018
The Appointments Committee is responsible for analysing the competencies and diversity of the Board of Directors in order to determine the profile of candidates for director of Banco Sabadell. In compliance with the Banco Sabadell Policy for the Selection of Candidates for Directorship, it is responsible for performing a prior assessment to ensure that candidates for director possess the necessary competencies, knowledge and experience; to that end, it is necessary to consider the balance of knowledge, skills, diversity and experience of the members of the Board of Directors and, for this purpose, to define the roles and capabilities required of the candidates to fill each vacancy and to evaluate the time and dedication needed for them to effectively perform their duties.
To select candidates, the Appointments Committee may, if deemed necessary, engage a prestigious consultant in the field of personnel selection to initiate a process of finding candidates that fit the desired profile. Additionally, any director may suggest candidates for director provided they meet the requirements of the Banco Sabadell Policy for the Selection of Candidates for Directorship.
Suitability assessment
Once a candidate has been selected, the procedure for assessing the suitability of Board members and key personnel must be applied; on this basis, the Appointments Committee will analyse the information about the candidates and the reports presented by the Board Secretary, drawn up by the Bank's Senior Counsel, as to their commercial and professional integrity, knowledge and experience and their willingness to provide good governance, by application of the requirements set out in Act 10/2014, of 26 June, on ordering, supervision and solvency of credit institutions, and having regard to the criteria for assessing the suitability of the members of the Board of Directors as set out in Royal Decree 84/2015, of 13 February, implementing the aforementioned Act 10/2014, of 26 June, and the European Central Bank guidelines on fit and proper assessments dated 15 May 2017, as well as the Guidelines to assess the suitability of members of management bodies and key function holders (EBA/GL/2017/12) dated 21 March 2018, which came into force on 30 June 2018. The Appointments Committee will check that candidates meet the requirements as to integrity, knowledge, experience and governance envisaged in the applicable legislation and will draw up a candidate suitability assessment report. In addition, candidates for directorships must be vetted by the European Central Bank.
The Appointments Committee is also entrusted with assessing director suitability on an ongoing basis, and evaluating the profile of the persons most suited to being members of the various committees, and making proposals in this regard to the Board of Directors; in particular, it must seek to ensure that the rules on the qualitative composition of the Board of Directors are complied with.
Appointment
After assessing the suitability of candidates for director, the Appointments Committee is entrusted, among its basic responsibilities in accordance with Article 61 of the Articles of Association, with making proposals to the Board for the appointment of independent directors either by co-optation or for submission to a vote at the General Meeting of Shareholders, and must advise on the proposals to appoint other director categories by co-optation or by referral to the General Meeting of Shareholders.
Ordinary members of the Board of Directors are appointed by the General Meeting of Shareholders. Any vacancies arising on the Board of Directors are filled by the General Meeting unless the Board decides, in the interests of the bank, to act in accordance with the Capital Companies Act. Directors appointed by co-optation hold office until the next General Meeting of Shareholders.
Re-appointment
Directors are appointed for a term of at most four years and they can be re-appointed one or more times for periods of the same maximum duration.
(This description continues in section H)
C.1.17 Describe the extent to which the annual evaluation of the Board led to significant changes inits internal organisation and the procedures applicable to its activities:
Description of changes
Each year since 2007, the Bank assesses the performance of the Board of Directors and of its sub-committees (Executive Committee, Audit and Control Committee, Appointments Committee, Remuneration Committee and Risk Committee). The assessment for the year 2017 was carried out with the help of an independent external consultant, Deloitte Legal, in compliance with the provisions of the Code of Good Governance of Listed Companies, whose Recommendation 36 establishes that, at least once every three years, the Board of Directors should be assisted in the assessment by an external consultant, whose independence should be vetted by the Appointments Committee.

531Statutory information
The report on the assessment by Deloitte Legal of the Board of Directors and the Committees of Banco Sabadell was approved by the Board of Directors at its meeting on 8 March 2018, after a favourable report from the Appointments Committee. The conclusions of the Report were positive: it found that the functioning of the Board of Directors is excellent, complying with the functions attributed to it by the Capital Companies Act, the Articles of Association of Banco Sabadell and its own terms of reference; the report highlighted the position and performance of the Chairman and the Managing Director, and no aspects of internal functioning were found that might affect the overall conclusion that performance is satisfactory.
Nevertheless, the Report established an Action Plan consisting of measures aimed at improving Banco Sabadell's corporate governance and the workings of both the Board of Directors and of its sub-committees.
In compliance with the measures contained in the Action Plan for 2018, the following actions were carried out:
An increase in the diversity of the composition of the Board of Directors through the appointment of a female executive director, which improves the gender balance in the Board of Directors.
Enhancement of the Director training programme. Training addressed specific needs of the directors, and the fact that the training was given by Banco Sabadell executives was considered to be a strength.
The Board worked further on the definition of strategy, with a high degree of director involvement, which resulted in meetings with the executive team to discuss the Strategic Plan.
With regard to sending documentation to directors sufficiently in advance, the technology systems provided to the directors were strengthened.
To encourage and monitor compliance with the specific action plans approved by the Committees for 2018, and by the Board itself, Banco Sabadell undertook measures in addition to those covered by the 2018 Action Plan, by approving a number of policies aimed at more effective control of such aspects as remuneration in the Group, risk control and management in Banco Sabadell, operational risk, privacy and data protection and the Group's scenarios.
Describe the evaluation process and the areas assessed by the Board of Directors with the assistance of an external consultant, if any, with regard to the performance and composition of the Board and its committees, and any other area or aspect that was assessed.
Description of the assessment process and the areas that were assessed
In accordance with article 529 nonies of the Capital Companies Act, the Code of Good Governance for Listed Companies and the Board of Directors Regulation, the Board of Directors assessed its own performance and that of its sub-committees in 2017 with the assistance of an independent external consultant, Deloitte Legal.
The methodology applied in the assessment is based on three main elements:
- Input from the directors. The perception of the members of the Board of Directors and its committees is a keycomponent of the analysis, since they know how it works and are a source of essential information for diagnosticpurposes. Directors' opinions on the various issues under assessment were gathered through personalinterviews with directors and by asking them all to complete the same questionnaires.
- Analysis of significant corporate documentation of Banco Sabadell relating to key aspects of the corporategovernance system. The documentation and information that were reviewed were the agendas and minutes ofthe Board of Directors and sub-committee meetings, as well as records of member attendance at meetings, theself-assessment report for 2016 and the action plan for 2017, the institution's internal regulations (Articles ofAssociation, Board of Directors Regulations, Regulations of the Audit and Control Committee, and the Code ofConduct in relation to the securities market), and the bank's policies and public disclosures, such as the AnnualCorporate Governance Report for 2016.
- Review of the 2017 Reports on the activities of the Appointments Committee, the Remuneration Committee andthe Risk Committee. Analysis of these documents provided greater insight into the actions of the committees in2017, giving a broader vision of their performance and the fulfilment of the duties assigned to them.
The analysis of director feedback, obtained through interviews and questionnaires, as well as the information contained in the activity reports and the analysis of the corporate information and other relevant documentation of Banco Sabadell, enabled the external advisor to acquire extensive knowledge of the performance of the Board of Directors, the degree of participation by its members and key position holders, the efficiency of its committees, the matters that were reported and debated, and other additional information that is germane to the performance assessment and the identification of potential areas for improvement on which to design the action plan for 2018.
In accordance with recommendation 36 of the Code of Good Governance, Deloitte Legal reviewed the quality and efficiency of the Board of Directors' performance; the performance and composition of its committees; the diversity in

532 Banco Sabadell Annual report 2018
the composition and competencies of the Board of Directors; the performance of the Chairman of the Board of Directors and the Chief Executive Officer; and the performance and contribution by each director. The review alsocovered fulfilment of the action plan for 2017 that arose from the assessment the Board of Directors' performance in 2016, and the action plan for 2018 was defined.
C.1.18 In years where the assessment was performed with the support of an external consultant,detail the business relations between the consultant and any company in its group with the company and any company in its group.
The year 2017 was the first year in which the performance assessment of the Board of Directors and its sub-committees was assisted by an external consultant, Deloitte Legal.
The business relations with the external consultant and any company in its group are within the ordinary course of business. Deloitte Legal has provided advice on matters of criminal liability. Other companies in the Deloitte group have provided advisory services to the Banco Sabadell group, particularly in the field of information technology and security.
C.1.19 Indicate the reasons for which directors may be forced to resign.
Under article 20 of the Banco Sabadell Board of Directors Regulation, directors may be removed: a) If they meet any of the conditions of incompatibility or prohibition envisaged in the law or the Articles of
Association.
b) If they are arraigned for a crime or are the subject of disciplinary proceedings by the supervisory authoritiesfor a serious or very serious violation.
c) Where their continuance on the Board may jeopardise the company's interests.
C.1.20 Do any decisions require a supermajority, other than the legal majority?
Yes No X
Describe the differences, if any.
Description of differences
C.1.21 Detail whether there are specific requirements, other than those relating to directors, forappointing the Chairman of the Board of Directors.
Yes X No
Description of requirements
Those established in the Succession Plan for the Chairman and Managing Director of Banco Sabadell, approved by the Board of Directors on 21 July 2016.
C.1.22 Indicate if the articles or board regulation establish an age limit for directors:
Yes No X

533Statutory information
C.1.23 Indicate if the articles or board regulation establish a term limit for independent directors orother requirements for them that are stricter than those provided by law, other than those provided in the regulations:
Yes No X
Additional requirements and/or maximum term
C.1.24 Indicate whether or not the Articles of Association or the Board Regulation set out specificrules for directors to grant proxy in Board of Directors meetings, the method of doing so and, more specifically, the maximum number of proxies that a director can hold, as well as whether or not a limitation has been set with regard to the categories to which proxy may be granted, above and beyond the limitations imposed by law. Give a brief description of any such rules.
Directors must attend Board of Directors meetings in person. However, when they can not attend in person, they may grant proxy to another director. Article 56 of the Articles of Association establishes that non-executive directors may grant proxy only to another non-executive director.
Additionally, the Director Remuneration Policy for 2018, 2019 and 2020, approved by the Shareholders' Meeting on 19 April 2018, which establishes the system of remuneration for directors for their functions as members of the Board of Directors, breaks down their fixed remuneration under this heading, establishing, in addition to the fixed remuneration for membership of the Board, per diems for meeting attendance, capped at 11 per diems for ordinary meetings; directors may collect per diems for up to two meetings per year missed for just cause provided that they grant proxy.
C.1.25 Indicate the number of board of directors meetings held in the year. Also, state the numberof times that the Chairman did not attend Board meetings. Proxies granted with specific instructions are not counted as absences:
Number of Board meetings 14
Number of Board meetings held without the chairman 0
Indicate the number of meetings held by the lead director with the other directors, without any executive director being present.
Number of meetings 2
Indicate the number of meetings held by board sub-committees in the year:
Committee No. of meetings
Number of Executive Committee meetings 35
Number of Audit and Control Committee meetings 12
Number of Appointments Committee meetings 12
Number of Remuneration Committee meetings 12
Comments
Comments

534 Banco Sabadell Annual report 2018
Number of Risk Committee meetings 15
C.1.26 Indicate the number of board of directors meetings held in the year, and give data onattendance by members:
Number of meetings which were attended in person by at least 80% of directors 14
Attendance in person as a % of the total number of votes during the year 97.58%
Number of meetings at which all the directors were present in person or for which they
granted proxy with specific instructions.
14
Votes cast with all directors actually present or having granted proxy with specific
instructions, as a % of total votes in the year
100%
C.1.27 Indicate whether the separate and consolidated financial statements that are presented forboard approval are certified beforehand:
Yes X No
Identify the person(s) that certified the company's separate and consolidated financial statements for board authorisation:
Name Position
Mr. JOSÉ OLIU CREUS CHAIRMAN
Mr. JAIME GUARDIOLA ROMOJARO MANAGING DIRECTOR
Mr. TOMÁS VARELA MUIÑA GENERAL MANAGER—CHIEF FINANCIAL OFFICER
C.1.28 Detail any mechanisms established by the Board of Directors to ensure that the separateand consolidated financial statements authorised by it are presented to the Shareholders' Meeting with an unqualified auditors' report.
The Bank's internal units draw up financial statements drafted clearly such as to present a true and fair view of the company's net worth, financial situation and results, to which end they must apply generally accepted accounting principles to all the financial and accounting information.
The Audit and Control Committee reviews the company's financial statements, both separate and consolidated, before referring them to the Board, and exercises vigilance to ensure compliance with the law and the proper application of generally-accepted accounting principles. To this end, it holds regular meetings with the external auditors in order to be informed punctually about the audit process and to be aware sufficiently in advance of any possible discrepancies or differences of opinion that might arise. In the event of any discrepancy that might lead to a qualification in the auditors’ report, the committee seeks to resolve it before the financial statements are authorised.
If the discrepancy cannot ultimately be resolved before the financial statements are authorised, the annual report of the Audit and Control Committee must expressly describe the discrepancies and its position in connection with them.
Comments
Comments
Comments

535Statutory information
The auditors’ reports on the separate and consolidation financial statements for 2018 were unqualified.
C.1.29 Is the board secretary a director?
Yes No X
If the secretary is not a director, complete the following table:
Name of secretary Representative
Mr. MIQUEL ROCA I JUNYENT (SECRETARY)
C.1.30 Describe the specific mechanisms established by the company to safeguard theindependence of the external auditors, and any mechanisms to safeguard the independence of financial analysts, investment banks and rating agencies, including details of how the legal requirements are implemented in practice.
In connection with the external auditors, article 60 of the Articles of Association provides that the Audit and Control Committee has the following competencies: (…)4. Proposing to the Board of Directors, for submission to the General Meeting, the appointment of the externalauditor, establishing the engagement conditions, the scope of the professional mandate, and revocation ornon-renewal, if appropriate; reviewing compliance with the audit contract, striving to ensure that the opinionon the financial statements and the main content of the auditors' report are drafted clearly and accurately.(…)6. Establishing the appropriate relations with external auditors to receive information about any issues thatmight jeopardise their independence, to be reviewed by the Committee, and any others related to the processof performing the audit functions and in the audit rules."
The Board of Directors Regulation expresses itself in similar terms: article 30 provides that: "Relations between the Board and the company's external auditors will be conducted through the Audit and Control Committee."
During 2018, the Audit and Control Committee was composed of four independent directors and one non-executive director until 24 May 2018, when the latter resigned from the Board of Directors of Banco Sabadell. That Committee's Regulation, which was current in 2018, includes the provisions of the Articles of Association and the Board of Directors Regulation; article 21.3 provides that, as directors and members of the Committee, those members must act with independence of opinion and action with respect to the rest of the organisation (…)
On 19 April 2016, in conformity with Act 22/2015, of 20 July, on Auditing, and Regulation (EU) No 537/2014, of 16 April, the Audit and Control Committee approved the Group policy for safeguarding auditor independence. The policy is implemented through procedures that contemplate measures to preserve the auditor's independence by monitoring possible incompatibilities arising from personal circumstances, prohibited services, rotation requirements and fee limits, as well as measures in the processes of auditor selection, appointment, reappointment or replacement, and processes for authorising all the auditor's services, particularly in connection with non-audit services that the auditor is not prohibited from providing.
Additionally, based on information received from the auditors, the Committee vetted the procedures and tools used by the firm to ensure compliance with the auditor independence requirements. Written confirmation of the firm’s independence with respect to the Banco Sabadell Group was received on 24 July 2018 and 28 January 2019. Based on the results of these checks, the Committee issued a report to the Board of Directors giving a favourable opinion on compliance with the auditor independence requirement before the auditor’s report on the accounts was issued, and it issued its annual report on that independence.
The institution complies with the principles of transparency and non-discrimination set out in the current legislation with respect to other market players. Specifically, the institution: i) takes care not to provide financial analysts with any information that might put them in a position of privilege with respect to other market participants, ii) regularly uses the services of three prestigious rating agencies, and iii) where the bank receives
Comments

536 Banco Sabadell Annual report 2018
advice from investment banks in certain transactions and, in the course of providing those services, such investment banks become privy to inside information, the institution includes the persons who become privy to such information in its internal control systems, and expressly notifies such persons of the obligation to fulfil their duty of confidentiality and ensure that it, and any trading restrictions, are fulfilled by others.
The institution also acts in accordance with the provisions of its General Policy on Conflicts of Interest, which is based essentially on identifying, logging, managing, avoiding or eliminating any conflicts of interest, and in line with the Banco Sabadell Group Policy on Outsourcing Services or Functions, approved in connection with credit institutions by the Board of Directors on 27 October 2016.
C.1.31 State whether the Company changed its external auditor during the year. If so, identify theincoming and outgoing auditor:
Yes No X
Outgoing auditor Incoming auditor
If there was a disagreement with the outgoing auditor, describe it:
Yes No X
C.1.32 Indicate whether the audit firm performs work for the company and/or its group other thanauditing and, if so, state the fees received for such work and those fees as a percentage of the total fees billed to the company and/or its group:
Yes X No
Company Group companies
Total
Fees for work other than auditing (thousand euro) 142 433 575
Fees for work other than auditing/Total audit fees (%) 10.91% 8.34% 8.86%
Comments
Based on a reasoned recommendation from the Audit and Control Committee, the Board of Directors resolved, at a meeting on 20 December 2018, as disclosed via regulatory disclosure no. 273.045, to appoint select KPMG Auditores, S.L. as auditor of the financial statements of Banco de Sabadell, S.A. and the consolidated financial statements of the Banco Sabadell group for the years 2020, 2021 and 2022. This decision was adopted in compliance with current legislation on auditor rotation and as a result of a selection process performed in accordance with the provisions of Regulation (EU) 537/2014 of 16 April, on specific requirements regarding statutory audit of public-interest entities. The Board will propose this appointment to the next Ordinary General Meeting of Shareholders.
Explanation of the disagreement

537Statutory information
C.1.33 State whether or not the auditors’ report on the previous year’s financial statements wasqualified. If it was, state the reasons given by the Chairperson of the Audit Committee to the shareholders at the General Meeting of Shareholders to explain the content and scope of the qualification or exception.
Yes No X
C.1.34 Indicate the number of consecutive years that the current audit firm has been auditing thefinancial statements of the company and/or the consolidated financial statements of its group. Also, indicate the number of years audited by the current audit firm as a percentage of the total number of years in which the financial statements have been audited:
Separate Consolidated
Number of consecutive years 36 34
No. of years audited by the current audit firm/No. of years that
the company has been audited (%)
94.74% 100.00%
C.1.35 State and detail any procedures in place to ensure that directors can obtain the informationthey need to prepare in good time for meetings of the Board and committees:
Yes X No
Detail the procedure
Article 17.1 of the Board of Directors Regulation establishes that the notice of meeting must always include the Agenda, which must contain, among other items, information about subsidiaries and Board sub-committees, and proposals and suggestions by the Chairman and other Board members and the bank's General Managers, to be received no less than five days in advance of the Board meeting; such proposals must be accompanied by the appropriate material for distribution to the directors.
Additionally, article 21 provides that:
1. Directors are vested with the broadest powers to be informed about any aspect of the company, to examine itsbooks, records, documents and other background information on the company's transactions and to inspect all ofits installations. The right to information extends to subsidiaries, both domestic and foreign.
2. So as not to disturb the ordinary running of the company, requests by directors for information must be channelledthrough the Chairman or the Secretary to the Board, who must attend to the director's requests by giving theinformation directly, providing appropriate access to individuals at the relevant level of the organisation, or providingthe means by which the director may carry out the desired formal examination and inspection on site.
Banco Sabadell has a procedure for providing the directors with the necessary material to prepare for meetings of
Comments
The amount of fees for non-audit work does not include audit-related services for a total of 659 thousand euros (486 thousand euros corresponding to the Company and 173 thousand euros corresponding to Group subsidiaries), since they are independent assurance services, some of which are required by law.
Description of the reasons
Comments

538 Banco Sabadell Annual report 2018
the Board of Directors and its sub-committees in a confidential and encrypted way, using the Diligent Boards software running on iPads. Information for Board meetings is circulated to the directors one week in advance, and it is elaborated upon or updated in the boardbook as needed; hence, they are duly informed.
C.1.36 State and detail any rules in place that oblige the directors to report any circumstances thatmight jeopardise the company’s credit and reputation and, if appropriate, resign:
Yes X No
Describe the rules
The rules in the Capital Companies Act, in the chapter on directors' duties, are applicable: Specifically, under article 50 of the Articles of Association and article 23 of the Board of Directors Regulation, and in compliance with the Banco Sabadell Group Code of Conduct and its Policy on Conflicts of Interest of Directors and Senior Executives, they must disclose any case where there might be a conflict of values or interests in order to enable the Bank to manage such situations appropriately.
Additionally, article 20 of the Board of Directors Regulation provides that directors will be removed:
a) When they fulfil any of the conditions of incompatibility or prohibition envisaged in the law or the Articlesof Association.
b) If they are arraigned for a crime or are the subject of disciplinary proceedings by the supervisory authoritiesfor a serious or very serious infringement.
c) Where their continuance on the Board may jeopardise the company's interests.
All the foregoing is without prejudice to the application of the rules on the fitness assessment to be performed by the bank in line with the procedure approved by the Board of Directors, which requires that any potential conflicts of interest or special situations be checked and assessed.
C.1.37 State whether any member of the Board of Directors has informed the company that he/shehas faced criminal charges or has been arraigned for any of the offences listed in Article 213 of the Capital Companies Act:
Yes No X
State whether the Board of Directors has analysed the case. If so, give a reasoned explanation of the decision taken as to whether or not the Director should remain in office or, where applicable, detail the actions taken by the Board of Directors until the date of this report or that it plans to take.
C.1.38 Detail any significant agreements entered into by the company which come into force, areamended or terminate in the event of a change of control of the company due to a takeover bid, and their effects.
-
C.1.39 Identify and detail, individually, in the case of directors, and in overall terms, in other cases,any agreements between the company and its directors and senior executives or employees that contain indemnities, guarantees or severance clauses in the event of their resignationor unfair dismissal or if the contractual relationship is terminated due to a takeover bid or other transaction.
Number of beneficiaries 45
Type of beneficiary Description of agreement

539Statutory information
Chairman Clause providing indemnity in the amount of 2 years' remuneration for cases of unfair dismissal and some limited cases of change of control.
Managing Director Clause providing indemnity in the amount of 2 years' remuneration for cases of unfair dismissal and some limited cases of change of control.
Director - General Manager Clause providing indemnity in the amount of 2 years' remuneration for cases of unfair dismissal and some limited cases of change of control.
Director and Company Secretary Clause providing indemnity in the amount of 2 years' remuneration for cases of unfair dismissal and some limited cases of change of control.
Other beneficiaries 25 executives have a clause providing indemnity in the amount of 2 years' remuneration for cases of unfair dismissal and some limited cases of change of control, and 16 executives have a post-contractual non-compete clause for a duration of 2 years from the date of unfair dismissal and some limited cases of change of control.
State whether, outside the cases provided for in the regulations, such contracts must be reported and/or approved by the decision-making bodies of the company or group. If so, specify the procedures, cases and nature of the bodies foreseen assumptions and the nature of the parties responsible for approving or disclosing:
Board of Directors General Meeting
Body that authorises the clauses Yes No
Yes No
Is the General Meeting informed of the clauses? X
C.2. Board of Directors sub-committees
C.2.1 Give details of all committees of the Board of Directors, their members, and the proportion ofexecutive, proprietary, independent and other non-executive directors in their composition:
Executive Committee
Name Position Category
Mr. JOSÉ OLIU CREUS CHAIRMAN Executive
Mr. JOSÉ JAVIER ECHENIQUE LANDIRIBAR MEMBER Independent
Mr. JAIME GUARDIOLA ROMOJARO MEMBER Executive
Mr. JOSÉ MANUEL MARTÍNEZ MARTÍNEZ MEMBER Independent
Mr. JOSÉ LUIS NEGRO RODRÍGUEZ MEMBER Executive
% executive directors 60.00%
% proprietary directors 0.00%
Comments

540 Banco Sabadell Annual report 2018
% independent directors 40.00%
% other external directors 0.00%
Detail the functions assigned or attributed to this committee other than those already described in section C.1.10 and describe its procedures and terms of reference. For each of these functions, describe the most salient actions during the year and how it fulfilled, in practice, each of the functions attributed to it, whether by the law, the Articles or other corporate resolutions.
Under article 59 of the Articles of Association and article 12 of the Board of Directors Regulation, the Executive Committee is responsible for the coordination of the Bank’s executive management, adopting any resolutions and decisions to this end under the scope of the powers granted to it by the Board of Directors, and overseeing the Bank's ordinary activities; it must report the decisions adopted at its meetings to the Board of Directors, without prejudice to the other functions attributed to it by the Articles of Association and the Board of Directors Regulation.
The Executive Committee must consist of a maximum of six directors, to be appointed by the Board with the favourable vote of two-thirds of its members, with a composition similar to that of the Board in terms of categories; the Chairman of the Board must act as its Chair. The resolutions of the Committee must be entered in a minutes book, and the minutes must be signed by the Chairman and the Secretary or, where applicable, by those who played those roles at the meeting in question.
It must meet whenever convened by its Chairman or by the Vice-Chairman standing in for the former, and its meetings may be attended by any person, whether related to the Company or otherwise, who is invited to attend, by a decision of the Committee itself or the Chairman of same, for the purposes to be determined on the basis of the matter in question; such persons may speak but not vote.
The Committee Secretary, who need not be a director, must be designated by the Board of Directors, which must also designate a substitute secretary for cases of illness or absence.
In 2018, the Executive Commission monitored the ordinary activities of the Bank, oversaw Bank management, adopted resolutions and decisions falling within the scope of the powers that the Board of Directors delegated to it, and analysed and reviewed other issues, providing favourable reports to the sub-committees with competency in those areas and to the Board of Directors for the adoption of the appropriate resolutions. The most salient actions undertaken in 2018 by the Executive Committee in carrying out its functions and discharging its responsibilities included tracking and analysing the financial information and results of the Bank and its group; analysing the reaction of markets and investors to the institution's results; being apprised of the strategic plan and tracking strategic issues appropriately; and tracking business performance and trends in treasury stock and the share price. The Committee also analysed and, as appropriate, approved transactions in connection with the Group's corporate development. It was informed of new developments in legislation, of relations with the supervisors and of regulatory matters, and adopted the pertinent decisions for action. It was also informed of the Group's risks, deciding on the risk operations that fell under its remit due to their amount or relevance. It issued favourable reports to the Board of Directors on the incorporation and/or dissolution and liquidation of subsidiaries and investees, as well as changes in capital and other amendments to articles of association; it informed the Appointments Committee and the Board of Directors of changes in the composition of such institutions' governing bodies. The Executive Committee also performed a self-assessment of its performance in 2017 with the assistance of an external consultant.
Audit and Control Committee
Name Position Category
Mr. MANUEL VALLS MORATÓ CHAIRMAN Independent
Mr. PEDRO FONTANA GARCÍA MEMBER Independent
Ms. MARIA TERESA GARCIA-MILÀ LLOVERAS MEMBER Independent
Mr. JOSÉ RAMÓN MARTÍNEZ SUFRATEGUI MEMBER Independent
% proprietary directors 0.00%
% independent directors 100.00%
Comments

541Statutory information
% other external directors 0.00%
Detail the functions assigned to this committee, including any that are additional to those established by law, and describe its procedures and terms of reference. For each of these functions, describe the most salient actions during the year and how it fulfilled, in practice, each of the functions attributed to it, whether by the law, the Articles or other corporate resolutions.
The Audit and Control Committee is expressly regulated by article 60 of the Articles of Association and article 13 of the Board of Directors Regulation, and it has its own terms of reference that regulate its organisation, functioning and governance.
The purpose of the Audit and Control Committee is to exercise oversight to ensure good banking and accounting practices in the various echelons of the organisation, as well as to ensure that suitable measures are taken to address improper conduct or methods. It is also a watchdog, ensuring that the measures, polices and strategies defined by the Board are duly implemented.
The Audit and Control Committee has the responsibilities established by law, including:
a) Reporting to the General Meeting on all issues raised by shareholders that are within its remit.
- When notice is given of a General Meeting of Shareholders, the Committee makes the report on its activitiesduring the year available to shareholders so as to inform them of the issues and actions under its area ofcompetence.
-b) Supervising the effectiveness of the company’s internal control, internal audit and risk management systems,
including those relating to tax risk, as well as discussing with the auditors or audit firms any significantweaknesses in the internal control system that were detected in the course of the audit.
- During the year, the Committee reviewed the Group’s risk management and control systems using reportsprepared by the Risk, Finance and Internal Audit Departments.
In compliance with the requirements as to disclosure to the markets in the framework of the provisions ofPart Eight: "Disclosure by Institutions" of Regulation (EU) 575/2013 of the European Parliament and theCouncil, of 26 June 2013, (hereinafter, the Capital Requirements Regulation - CRR), the Committee reviewedthe contents of the "Pillar III disclosures" and analysed the information in connection with the group'scomputable equity and capital and the degree to which it conformed to the criteria defined in the CRR andthe risk management and control objectives set out in group policies. The Committee also carried out adetailed review of all financial data to be relied on as a basis for characterising the group’s risk profile asconservative in the various categories of risk for which disclosure was required.
The Committee also reviewed the Internal Capital Adequacy Assessment Process (ICAAP) for 2017 inconnection with risk governance, management and control systems, and concluded that they conformed tothe institution's risk profile and reached a favourable conclusion as to the Banco Sabadell Group'sconsolidated capital, which assures coverage of the regulatory requirements. It also reviewed InternalLiquidity Adequacy Assessment Process (ILAAP). Based on the contents of the report, the Commission wasable to conclude that the Banco Sabadell Group has a liquidity position that enables it to meet paymentcommitments at a reasonable cost, either under normal conditions or in a situation of stress, that the grouphas a stable and balanced funding structure, in line with the risk appetite and the defined risk managementstrategy, and that a robust governance framework is in place for managing and controlling liquidity andfunding risk.
Regarding tax risks, the Committee reviewed the Tax Strategy policy with the objective of strengthening theBanco Sabadell Group's commitment to fiscal transparency and social responsibility in complying with taxobligations.
In accordance with the Board of Directors Regulation, the Audit and Control Committee is entrusted withoversight of Internal Audit. Additionally, the Audit and Control Committee's functions include approving theInternal Audit plan, assessing the outcome of each audit, and prioritising and tracking corrective measures.
In connection with its function of overseeing the internal audit units, on 24 May 2018, following a favourablereport by the Appointments Committee, the Board of Directors resolved unanimously to ratify that the InternalAudit Department reports directly to the Board of Directors' Audit and Control Committee. This reinforces itshierarchical and functional independence from the rest of the institution's departments and positions thefunction at an appropriate level of the organisation.
Comments
542 Banco Sabadell Annual report 2018
On the basis of its policy, which was approved by the Board of Directors, the functions of the Internal Audit Department include supporting the Audit and Control Committee in supervising the proper design, implementation, and effective functioning of the risk management and control systems.
The Overall Audit Plan that the Audit and Control Committee approved at a meeting on 30 January 2018 set out, inter alia, the actions to be implemented with respect to the areas or processes considered to have the highest residual risk on the basis of a risk assessment exercise. During 2018, the Commission received information about the execution of the planned actions; in some cases, it reviewed the control environment and, in particular, evaluated the proper identification of risks in processes, and the sufficiency, design, implementation and effective functioning of existing controls.
In 2018, the Committee also received information about the conclusions of the reports issued by the external auditors and the supervisory authorities and on the proper implementation of the improvement measures proposed by the regulatory bodies.
c) Overseeing the drafting and presentation of regulated financial information;
- During the year, the Audit and Control Committee supervised the internal control model established in theinstitution with respect to the process of preparing and presenting regulated financial and non-financialdisclosures. To this end, it received information from the Finance Department, the Internal Audit Departmentand the External Auditors regarding the risks relating to financial reporting processes and the adequacy andeffectiveness of the controls that mitigate them, as well as aspects that may give rise to changes in theinternal control model, including regulatory changes, the incorporation of new products or the modification ofBanco Sabadell's processes.
d) Proposing to the Board of Directors, for submission to the General Meeting, the appointment of the externalauditor, establishing the engagement conditions, the scope of the professional mandate, and revocation or non-renewal, if appropriate; reviewing compliance with the audit contract, striving to ensure that the opinion on thefinancial statements and the main content of the auditors' report are drafted clearly and accurately.
- With regard to the external auditor, the Committee reviewed the criteria and conditions of engagement and,as a result, proposed to the Board that the firm of PricewaterhouseCoopers Auditores, S.L. be re-appointedas auditors of the Bank’s separate and consolidated accounts for the year 2018. The Board of Directorsresolved to submit the Committee’s recommendation to the General Meeting of Shareholders, whichapproved it on 19 April 2018.
Additionally, on 30 January 2018, the Audit and Control Committee resolved to begin planning an orderlyprocess for selecting the auditor for the years 2020-2022. During 2018, the committee ensured that theselection process was conducted in accordance with the criteria established in Regulation (EU) 537/2014, of16 April, on specific requirements regarding statutory audit of public-interest entities. On the basis of thereasoned recommendation of the Audit and Control Committee, which contained two alternatives and inwhich it indicated its preference for the firm KPMG, the Board of Directors resolved on 20 December topropose this appointment to the General Meeting of Shareholders.
The Committee remained in contact with the external auditor constantly to ensure that it was kept informedof any significant accounting or financial reporting issues arising in the course of the auditor’s work. TheCommittee also reviewed in depth the contents of the audit report, as well as the Additional Report presentedby the auditors to the Audit and Control Committee in connection with the audit of the year ended 31December 2018, required to comply to the provisions of article 36 of Act 22/2015, of 20 July 2015, on Auditingand with article 11 of Regulation (EU) No 537/2014 of the European Parliament and of the Council of 16 April2014 on specific requirements regarding statutory audit of public-interest entities.
e) Advising on the annual, quarterly and half-yearly financial statements and the prospectuses that must besubmitted to the regulatory or supervisory bodies, exercising vigilance to ensure compliance with therequirements of the law and the proper application of generally accepted accounting principles, and advisingon proposals to amend those principles.
- In the course of the year, the Committee paid particular attention to reviewing the financial statements andthe quarterly and half-yearly trading and financial reports as well as other information disclosed to the market,including the Share Registration Document, before they were released for publication. In order to carry outthese reviews, the Finance Department and the External Auditor participated in meetings of the Committeeto present matters relating to the financial disclosures.
f) Establishing the appropriate relations with external auditors to receive information about any issues that mightjeopardise their independence, to be reviewed by the Committee, and any others related to the process ofperforming the audit functions and in the audit rules.
- In order to comply with the requirements for the engagement of non-audit services from audit firms and theirnetworks, as established in the Banco Sabadell Group Policy to safeguard auditor independence, approved

543Statutory information
by the Audit and Control Committee on 19 April 2016, the Audit and Control Committee reviewed the main non-audit services provided by PricewaterhouseCoopers during 2018. The objective of these reviews was to ensure that all that work fulfilled the independence requirements established in Act 22/2015, of 20 July, on Auditing and in Regulation (EU) No 537/2014 of the European Parliament and of the Council of 16 April 2014 on specific requirements regarding statutory audit of public-interest entities and repealing Commission Decision 2005/909/EC.
Additionally, based on information received from the auditor, the Committee reviewed the procedures and tools used by the firm in connection with the auditor independence requirements. Written confirmation of the firm’s independence with respect to the Sabadell Group was received on 24 July 2018 and 28 January 2019.
Based on the results of these checks, the Committee issued a report to the Board of Directors giving a favourable opinion on compliance with the auditor independence requirement before the auditor’s report on the accounts was issued.
g) Reporting on any issues referred to the Committee by the Board of Directors that are within its remit.
- In the course of its duties as assigned by the law, the Articles of Association and the Board of DirectorsRegulation and its own terms of reference, the Audit and Control Committee reviewed all the reports underits remit, including the annual assessment of its performance, as well as a report on the issues it dealt withand the activities it performed in discharging its duties.
h) Any other matters for which the Committee is responsible by law or under the Articles of Association or anyregulations made in accordance therewith, or under any generally applicable rules on corporate governance.
- In pursuit of good governance of the Bank's business, the Committee decided to recommend that the Boardof Directors give its approval to a report submitted by the Executive Committee on the corporate governancestructure and practices at Banco Sabadell, S.A. in the year.
The Committee also examined half-yearly reports from the Group’s Corporate Ethics Committee on actiontaken to ensure compliance with the Banco Sabadell Group Code of Conduct in relation to the securitiesmarket, the Group’s general Code of Conduct, initiatives undertaken in the area of Corporate SocialResponsibility and other key aspects.
By reviewing these reports, the Committee also received information on the performance of the complaintschannel, including the number of complaints received, their origin and types, the results of the investigationsand the proposals for action.
In connection with related party transactions as referred to in recommendation 6 of the Good GovernanceCode of Listed Companies approved by the Board of the National Securities Market Commission (CNMV) on18 February 2015, the Committee verified that the related-party transactions performed during the yearfulfilled the terms and conditions established in current legislation such as not to require authorisation fromthe governing bodies or had obtained such authorisation based on a recommendation by the Committee,after it had checked that the consideration and other proposed conditions were in line with marketparameters. The Committee also reviewed the information on related-party transactions that was disclosedin the financial statements.
Additionally, in conformity with the recommendations contained in a document published by the CNMV on18 July 2013 entitled "Recommendations by the Comisión Nacional del Mercado de Valores for securitiesissuers and financial intermediaries acting on their behalf in discretionary transactions with own shares", theAudit and Control Committee received regular briefings from the Director-General Manager and the head oftreasury share management on trading in the Bank’s own shares and on compliance with the regulator’srecommendations.
The Audit Committee must comprise at most five directors, appointed by the Board of Directors, none of whom may be an executive director; at least a majority of them must be independent directors, and one must be appointed on the basis of his/her knowledge and experience of accounting and/or auditing. The Board of Directors must appoint the committee's Chair from among the members who are independent directors, with the favourable vote of two-thirds of its members, and the committee secretary, who must not be a director. The Secretary must take minutes of every meeting, which must be approved at the end of the meeting itself or at the next meeting. The business transacted at Committee meetings must be reported to the Board of Directors at the next meeting by means of a reading of the minutes.
The Committee must meet at least once every three months, and whenever convened by the Chair at his/her own initiative or at the request of any Committee member, or at the request of the Chairman of the Board of Directors or of the external auditors, to discharge the duties assigned to it.
On 24 May, 2018, Mr. José Manuel Lara García stepped down as a member of the Audit and Control Committee as a result of his resignation as director.

544 Banco Sabadell Annual report 2018

545Statutory information
advising on the Board's proposals with respect to the other directors. It also verified compliance with the Banco Sabadell Policy for the Selection of Candidates for Directorship, in accordance with Recommendation 14 of the Code of Good Governance of Listed Companies, and analysed and advised the Board on the composition of the Board, the categories of directors, and the approval of the Annual Corporate Governance Report.
d) Checking that the members of the Board of Directors are suitable and possess the necessary competency,knowledge and experience.
- During 2018, it analysed the powers and diversity of the Board of Directors to determine the profiles of thecandidates for directorships and assessed the suitability of the directors presented for appointment and/orre-appointment. It also advised the Board of Directors on the director training programme for 2018.
e) Advising on proposals for the appointment and removal of senior executives and of the material risk takers.
- The Committee fulfilled its function of advising the Board of Directors on proposals for the appointment ofsenior executives, having assessed their suitability. It also reviewed the composition of the list of materialrisk takers of the Bank, the group and the subsidiaries, and advised the Board of Directors on proposals toamend the list of material risk takers.
f) Advising on the basic conditions of the contracts of executive directors and senior executives;
g) Examining and organising succession plans for the Chairman of the Board of Directors and the Bank's chiefexecutive and, as appropriate, making proposals to the Board.
- The Succession Plan for the Chairman and Managing Director of Banco Sabadell was approved by theBoard of Directors on 21 July 2016.
h) Setting a target for representation of the gender that is under-represented on the Board of Directors anddrawing up guidelines on how to achieve that target.
- That target is set in the Banco Sabadell Policy for the Selection of Candidates for Directorship, approved bythe Board of Directors at a meeting on 25 February 2016. The Appointments Committee verified compliancewith this Policy in the resolutions adopted in 2018 regarding the re-appointment, ratification and/orappointment of directors, which conformed to the diversity parameters and requirements set out in the Policyand in the current regulations governing directorships of credit institutions and, in particular, with a view toachieving the objectives as to the weighting in the Board of the under-represented gender.
In addition, the Appointments Committee approved the Report on the functions and activities of the Appointments Committee for the year 2017; it advised on the annual evaluation of the Appointments Committee's performance in 2017 and the evaluation of the Board of Directors' performance, as well as that of its Chairman, the Managing Director, the Lead Independent Director and the Secretary and the Vice-Secretary of the Board of Directors, all with the assistance of an independent external consultant. It also proposed that the Board of Directors make changes in the composition of the Board sub-committees.
The Appointments Committee must comprise at most five directors, appointed by the Board of Directors, none of whom may be an executive director; at least two of them must be independent directors. The Board of Directors appoints the committee's Chair from among the members who are independent directors, with the favourable vote of two-thirds of its members.
The Appointments Committee meets whenever the Board or its Chairman requests that it issue a report or adopt a proposal, and whenever it is advisable in order to properly discharge its duties. In any case, it must meet once per year to provide advice in advance on the Board's performance evaluation.
On 8 March 2018, Mr. Pedro Fontana García was appointed as a member of the Appointments Committee.
Remuneration Committee
Name Position Category
Ms. AURORA CATÁ SALA CHAIR Independent
Mr. ANTHONY FRANK ELLIOTT BALL MEMBER Independent
Ms. MARIA TERESA GARCIA-MILÀ LLOVERAS MEMBER Independent
Mr. GEORGE DONALD JOHNSTON MEMBER Independent
% proprietary directors 0.00%
% independent directors 100.00%

546 Banco Sabadell Annual report 2018
% other external directors 0.00%
Detail the functions assigned to this committee, including any that are additional to those established by law, and describe its procedures and terms of reference. For each of these functions, describe the most salient actions during the year and how it exercised, in practice, each of the functions attributed to it, whether by the law, the Articles or other corporate resolutions.
The Remuneration Committee is regulated in article 62 of the Articles of Association and article 14 bis of the Board of Directors Regulation. Without prejudice to the other duties assigned to it by law, the Articles of Association, the Board of Directors or the Board of Directors Regulation, the Remuneration Committee has the following basic duties:
a) Proposing, to the Board of Directors, the director remuneration policy;
- The Remuneration Committee issued a favourable report to the Board of Directors on the proposal to theOrdinary General Meeting of Shareholders to approve the Banco Sabadell Director Remuneration Policy forthe years 2018, 2019 and 2020, which was approved by the General Meeting of Shareholders on 19 April2018.
b) Proposing, to the Board of Directors, the remuneration policy for general managers and others performingsenior management functions who report directly to the Board of Directors, the Executive Committees or theManaging Directors, and the individual remuneration and other contractual conditions for executive directors,exercising oversight to ensure that they are complied with.
- To perform this function, it cross-checked the compensation benchmark for the executive directors andsenior management and internal audit with reports from external consultants; it issued a favourable reportto the Board of Directors in connection with the degree of fulfilment of the 2017 objectives for executivedirectors, senior management and internal audit, as well as their fixed and variable remuneration for 2018.
c) Regularly reviewing remuneration policy;
- In 2018, the Remuneration Committee analysed an independent report by an external consultant evaluatingremuneration policy and practices; and it reviewed the remuneration policies of Banco Sabadell and reportedfavourably on this matter to the Board of Directors.
d) Advising on remuneration programmes based on shares and/or options;
- The Commission analysed in detail the proposal for the long-term supplementary incentive programme for2018-2021 based on the appreciation by the shares of Banco Sabadell, for executive directors, seniormanagement and other executives who are part of the Group's list of material risk takers, and issued afavourable report to the Board of Directors on the proposal to be submitted to the Ordinary General Meetingof Shareholders on 19 April 2018, which approved it.
e) Periodically reviewing the general principles of remuneration and the remuneration programmes for allemployees, and considering whether they conform to those principles;
- It examined the independent report by an external consultant evaluating remuneration policy and practices,which analysed whether the remuneration policy and remuneration practices of Banco Sabadell compliedwith the requirements and recommendations of the supervisory bodies; it analysed the degree ofcompliance with the Group's objectives for the year 2017, and recommended that the Board of Directorsapprove the Group's objectives for 2018; it approved the percentages of compliance with the 2017 objectivesby the Group's material risk takers, the salary review for 2018 for the material risk takers, the amount ofvariable remuneration for 2017 and the 2018 variable remuneration target for the Group's material risktakers; it analysed the proposed amendment to the Articles of Association in relation to the remuneration towhich directors are entitled for performing their duties, the goal being to adapt the wording to currentlegislation and to best practices in the area of corporate governance, and it resolved to issue a favourablereport to the Board of Directors on the proposed amendments to the Articles; it reviewed the report producedeach year by the Human Resources Department in order to provide the Remuneration Committee with theessential information to enable it to perform the functions entrusted to it in relation to reviewing the generalprinciples of Banco Sabadell's remuneration policy and oversight of the remuneration of the bank's executivedirectors, senior management and other material risk takers; it reported favourably to the Board of Directors
Comments

547Statutory information
on the fixed remuneration for group's entire workforce and an increase in the total salary expense for the year 2018.
f) Ensuring that remuneration is transparent;
- It cooperated actively in the Corporate Governance Road Show held at the beginning of February 2018 forproxy advisors and the most significant shareholders, in which it detailed the most salient aspects of theremuneration policy.
g) Ensuring that any conflicts of interests are not detrimental to the independence of external advisors; and
h) Verifying the information on remuneration contained in the various corporate documents, including the Reporton Director Remuneration.
- It vetted and cleared the information on remuneration to be included in the Annual Corporate GovernanceReport, and recommended that the Board of Directors approve the Annual Report on Director Remuneration.
The Remuneration Committee also approved, and resolved to submit to the Board of Directors, the Report on the assessment of the Remuneration Committee for 2017 and the proposal for the action plan for 2018, which were drawn up with the help of an external consultant.
The Remuneration Committee must comprise at most five directors, appointed by the Board of Directors, none of whom may be an executive director; at least two of them must be independent directors. The Board of Directors appoints the committee's Chair from among the members who are independent directors, with the favourable vote of two-thirds of its members.
The Remuneration Committee meets whenever the Board or its Chair requests that it issue a report or adopt a proposal, and whenever it is advisable in order to properly discharge its duties. In any event, the Committee must meet once per year to prepare the information on directors' remuneration that the Board of Directors must approve and include in its annual public documentation.
Risk Committee
Name Position Category
Mr. DAVID VEGARA FIGUERAS CHAIRMAN Independent
Ms. MARIA TERESA GARCIA-MILÀ LLOVERAS MEMBER Independent
Mr. GEORGE DONALD JOHNSTON MEMBER Independent
Mr. MANUEL VALLS MORATÓ MEMBER Independent
% executive directors 0.00%
% proprietary directors 0.00%
% independent directors 100.00%
% other external directors 0.00%
Detail the functions assigned to this committee, and describe its procedures and rules of organisation and operation. For each of these functions, describe the most salient actions during the year and how it exercised, in practice, each of the functions attributed to it, whether by the law, the Articles or other corporate resolutions.
The Risk Committee is regulated in article 63 of the Articles of Association and article 15 of the Board of Directors Regulation. Its functions are focused on supervising and exercising oversight to ensure that all the risks of the bank and its consolidated group are accepted, controlled and managed appropriately, and reporting to the Board on the performance of the functions corresponding to it, in accordance with the law, the Articles of Association and the Board of Directors Regulation, which include:
a) Supervising implementation of the Risk Appetite Framework;
b) Determining and proposing, to the full Board, the annual limits on investment in the real estate market and the
Comments

548 Banco Sabadell Annual report 2018
criteria and amounts applicable to the various types of investment;
c) Reporting to the full Board regarding the performance of its functions under this article and other applicablelegislation and provisions of the Articles of Association;
d) Reporting each quarter to the full Board about the levels of risk assumed, investments made and theirperformance, and the potential repercussions on Group revenues of variations in interest rates, and the degreeto which they conform to the VAR levels approved by the Board of Directors;
e) Monitoring and detecting any excess above the approved tolerance thresholds, and overseeing the activationof the contingency plans established for this purpose;
f) Advising the Remuneration Committee as to whether the employee compensation programmes are coherentwith the Bank's levels of risk, capital and liquidity.
It comprises at most five directors, appointed by the Board of Directors, none of whom may be an executive director; they must have the appropriate knowledge, skill and experience to fully understand and oversee the Bank's risk strategy and risk appetite; at least two of them must be independent directors. The Board of Directors appoints its Chairman from among the members who are independent directors, with the favourable vote of two-thirds of its members.
In the exercise of its functions, the Risk Committee may directly request the information it sees fit from both the director who is Chief Risk Officer and the Risk Control Manager. At the end of 2018, it was decided to create the position of Chief Risk Office, reporting directly to the Risk Committee.
The Risk Committee must meet at least twice per month and whenever convened by its Chairman at his/her own initiative or at the request of any member of the Committee or of the Chairman of the Board of Directors.
For each of the functions of the Risk Committee listed in the preceding paragraphs, items a) through f), the most salient actions carried out by the Committee during the year were as follows:
In relation to Governance functions, as referred to in items a), b) and c) above, the Risk Committee analysed and reviewed matters that required it to issue a recommendation for subsequent approval by the Board of Directors, including the Risk Appetite Statement (RAS), ICAAP, ILAAP, Recovery Plan and IFRS9, as well as the Risk Policies, such as those relating to credit, concentration, market, liquidity and capital risk.
In connection with its function of advising the Remuneration Committee on the employee remuneration programmes' coherence with Bank's risk, capital and liquidity, as set out in f) above, the Risk Committee reviewed the external consultants' report on the degree to which the Banco Sabadell remuneration policy conforms to the regulatory parameters applicable to credit institutions, verifying that the remuneration policy is aligned with the risk, and it issued a favourable report to the Remuneration Committee about the analysis carried out of the objectives for the material risk takers with regard to the bank's risk, capital and liquidity and on the proposal for the 2018 objectives, itemised for each of the material risk takers; it also reviewed and reported favourably on the proposal to update the Policy on Conflicts of Interests for Directors and Key Position Holders, to be approved by the Board of Directors.
Regarding the functions referred to in items d) and e) of the list of functions, the Risk Committee regularly monitored the Risk Appetite Statement during the year, including the following actions:
Regular tracking, mainly of the Risk Committee scorecard and the Annex to the Risk Committee scorecard.Large Groups that are reviewed by the Executive Committee.Tracking of risk-adjusted pricing.Ad-hoc monitoring, including in particular this year regularly monitoring the TSB Migration Programme, NPA
reporting, and other monographic issues related to market risk, operational risk, cyber risk, outsourcing, countryrisk, and the risk relating to financial institutions and certain portfolios (SMEs and Corporate, among others).
The Risk Committee carried out actions related to IRB risk models, both for management and for capital and provisioning purposes, in accordance with the functions indicated in item e) of the list of functions. The implementation of Risk Models requires a favourable opinion from the Risk Committee in order for it to be approved subsequently by the Board of Directors. Notable action under this heading were related to the Group's Adjustment model and tracking of Remediation Plans under the Single Supervisory Mechanism (SSM) for the retail, shops and self-employed groups, as well as Loss Given Default (LGD) and credit risk models for subsidiaries, such as TSB.
Additionally, the Risk Committee analysed and reviewed ad-hoc monographs covering specific risks (IT Risk, Operational Risk, Outsourcing Risks), among others, as well as specific portfolios.
The Risk Committee also performed a self-assessment for 2017 with the assistance of an external consultant, and approved the report on the functions and activities of the Risk Committee for 2017.

549Statutory information
C.2.2 Complete the following table with information on the number of female directors in the Boardsub-committees at the end of the last four years:
Number of female
directors
2018 2017 2016 2015
Number % Number % Number % Number %
Executive Committee 0 0% 0 0% 0 0.00% 0 0.00%
Audit and Control Committee 1 25.00% 1 20.00% 1 33.33% 1 33.33%
Appointments Committee 2 50.00% 2 66.67% 1 33.33% 1 25.00%
Remuneration Committee 2 50.00% 2 50.00% 2 66.66% 1 25.00%
Risk Committee 1 25.00% 1 25.00% 1 33.33% 1 25.00%
C.2.3 Indicate if there are any Board sub-committee regulations, where they can be consulted, andamendments made in the year. Also, indicate if an annual report on each committee's activities has been drafted voluntarily.
Section C.2.1 details the articles of the Articles of Association and the Board of Directors Regulation that contain the rules governing the workings and competencies of the sub-committees.
The current texts of the Articles of Association and Board of Directors Regulation are available on the website (www.grupobancosabadell.com) in the section on "Corporate governance and remuneration policy".
The Audit and Control Committee has an Internal Regulation setting out its functions and procedures. This Regulation has been filed with the Mercantile Register and is accessible on the website (www.grupobancosabadell.com) – in the section entitled "Corporate governance and remuneration policy" - Board of Directors Regulation).
All the Board sub-committees draw up an annual self-assessment report on their activities, which is submitted to the Bank's Board of Directors for evaluation; the reports for 2017 were evaluated with the assistance of an independent external consultant. Additionally, the Audit and Control Committee, Appointments Committee, Remuneration Committee and Risk Committee draw up annual reports on their functions and activities, which are available on the website (www.grupobancosabadell.com) in the section on "Corporate governance and remuneration policy".
D RELATED-PARTY AND INTERCOMPANY TRANSACTIONS
D.1 State, where applicable, the procedure for the approval of related-party and intercompanytransactions, and the bodies empowered for this purpose.
Procedure for advising on the approval of related-party transactions.
The Audit and Control Committee vets any related-party transaction before it is approved by the Board of Directors.
D.2 Give details of any transactions that are material, because of their size or nature, between thecompany or any group undertakings and significant shareholders of the company:
Comments

550 Banco Sabadell Annual report 2018
Name of significant
shareholder
Name of group
company or institution
Nature of
relationship
Type of transaction Amount
(thousand euro)
D.3 Give details of any transactions that are material, because of their size or nature, between thecompany or any group undertakings and the company's directors or executives:
Name of director or executive
Name of related party Relationship Nature of relationship Amount (thousand
euro)
D.4 Detail the material transactions between the company and other companies in the group, exceptthose that are eliminated in consolidation and do not form part of the company's normal operations with regard to their purpose and conditions:
In any event, provide details of any intercompany transactions carried out with organisations based in countries or territories that are considered to be tax havens:
Name of the group institution Brief description of transaction Amount (thousand euro)
D.5 Give details of any material transactions between the company or any group undertakings andother related parties that are not disclosed in the preceding sections:
Name of related party Brief description of transaction Amount (thousand euro)
Comments
Comments
Comments
Comments
551Statutory information
D.6 Specify the mechanisms established to detect, identify and resolve possible conflicts of interestarising between the company and/or the group and its directors, senior managers or significant shareholders.
1. Under the Board of Directors Regulation, all Board members are bound by a duty of loyalty and confidentialityand are required to disclose any interest they may have in the company itself or in other companies outside thegroup.
Specifically, Article 25 of the Regulation states that a director may not provide professional services to Spanish companies whose corporate purpose coincides wholly or partly with that of the company. An exception is madefor offices they hold in companies in the group. Directors must notify the Appointments Committee before accepting any executive appointment in another company or institution.
Article 27 of the Board of Directors Regulation states that directors must inform the company of any company shares which they own directly or through companies in which they hold a significant stake. It is also necessary to disclose any shares held, directly or indirectly, by their close relatives. Directors must also inform the company of all positions that they hold and activities that they perform in other companies or entities and, generally, of any fact or situation that may be material in connection with their performance as directors of the company.
2. The Banco Sabadell Group's Code of Conduct provides a set of rules for the guidance of all persons employedby the group and its stakeholders (customers, suppliers, shareholders, authorities and the local community)based on principles which we consider fundamental to carrying on our business.
It expressly contemplates rules applicable to possible conflicts of interest with customers and suppliers and sets out guidelines for such cases.
3. Banco Sabadell Group’s Internal Rules of Conduct in connection with the securities markets (IRC), approvedby the Board of Directors on 24 May 2018, are applicable to the members of the Bank’s Board of Directors, andto all executives and employees whose work is directly or indirectly related to activities and services in the fieldof the stock markets or who have frequent or habitual access to price-sensitive information related to the Bankitself or group companies.
Section 4 of the IRC sets out the mechanisms for identifying, preventing and resolving possible conflicts of interest that are detected by persons concerned, who are obliged to declare any significant relations of a financial, family or other nature with customers of the Bank in connection with services related to the securities markets or to companies listed on the Stock Exchange, as well as any other relationships that, in the opinion of an external and neutral observer, might compromise the impartiality of the persons concerned.
4. The Banco Sabadell Group’s General Policy Regarding Conflicts of Interest is an internal set of regulationslaying down the criteria and procedures to be followed to guarantee that decisions taken within the Banco SabadellGroup with respect to the provision of investment services or other services that potentially create such conflictsof interest are made so as to avoid, eliminate or, in the final instance, disclose any conflict of interest to thecustomer. The Compliance Department is responsible for correctly applying the general conflicts of interest policyand, when necessary, it will urge the other departments in the group to which it applies to take the necessaryaction.
5. The Policy on Conflicts of Interest of Directors and Senior Executives, approved by the Board of Directors on28 January 2016 and amended by the Board of Directors on 8 March 2018, establishes the necessary measuresfor managing conflicts of interest of directors and senior executives and their related parties in connection withcorporate transactions or non-bank activities and also with ordinary banking business.The Credit Transactions Committee analyses all credit operations carried out by directors, senior executives andtheir related parties and makes proposals to the Board of Directors for their approval. Royal Decree 84/2005,implementing Act 10/2014, of 26 June, on Ordering, Supervision and Solvency of Credit Institutions, sets out therequirements in connection with disclosure of transactions by directors, senior executives and their related partiesto the competent authority and for authorisation by the latter.
6. The Banco Sabadell Group's Corporate Ethics Committee is responsible for fostering ethical conductthroughout the organisation and for making proposals and giving advice to the Board of Directors, via the Auditand Control Committee, and to the corporate and business units on decisions involving issues that might lead toconflicts of interest. The Committee is also responsible for overseeing the group's compliance with its obligationsas set out in the Code of Conduct and in the Internal Rules of Conduct in connection with the securities market.To achieve its objectives, the Corporate Ethics Committee can call upon the resources of the ComplianceDepartment, and has been given extensive powers by the Board to gain access to all the documents and

552 Banco Sabadell Annual report 2018
information it requires to perform its supervisory function.
D.7 Is more than one company in the Group listed in Spain?
Yes No X
Identify the other companies that are listed in Spain and their relationship to the company:
- Indicate whether the respective areas of activity and any business relationships between them have been defined publicly and accurately, as well as those of the listed subsidiary company with other companies in the group;
Yes No
Define any business relationships between the parent company and the listed subsidiary, and between
the latter and the rest of the group companies
Identify the mechanisms established to resolve any conflicts of interest between the listed subsidiary and the other companies in the group:
Mechanisms to resolve conflicts of interest
E RISK CONTROL AND MANAGEMENT SYSTEMS
E.1 Describe the scope of the company’s Risk Control and Management System, including thatrelating to tax risks.
The Banco Sabadell Group Risk Management system is based on the Risk Appetite Framework contained in the Risk Appetite Statement (RAS), the associated management policies and the reporting system and overall governance model for the risk function, which contemplate tax risk under the terms described below.
The system applies throughout the group, consolidating by area, business unit or activity, subsidiary and geography at corporate level.
The Banco Sabadell Group includes tax risk in its Risk Policy as a specific risk.
Additionally, the Board of Directors of Banco de Sabadell, S.A. has approved the group's tax strategy. That strategy is governed by the principles of efficiency, prudence, transparency and minimisation of tax risk, it is broadly aligned with the Banco Sabadell Group's business strategy, and it is applied in all the companies controlled by the group, regardless of their geographic location.
E.2 Identify the bodies of the company responsible for drawing up and executing the Risk Controland Management System, including tax risk.
The Board of Directors has indelegable responsibility for: (i) determining the tax strategy; (ii) approving investments or operations considered strategic by virtue of their amount or special characteristics, strategic nature or particular tax risks, unless their approval corresponds to the General Meeting; (iii) approving the creation special-purpose vehicles or entities resident in jurisdictions considered tax havens or the acquisition of shares in such undertakings; and (iv) the approval of any other transactions or operations of a comparable nature whose complexity might impair the transparency of Banco de Sabadell, S.A. and its group.
The Board of Directors is the body responsible for establishing the general guidelines on the organisational distribution of the risk management and control functions and for determining the main lines of strategy in this respect. Therefore, the Board is the body responsible for approving the Risk Appetite Framework and ensuring its consistency with the institution’s short- and long-term strategic objectives, together with the business plan, capital planning, risk-taking capacity and compensation schemes.

553Statutory information
Within the Board itself there is a Risk Committee which is responsible for ensuring compliance with the Risk Appetite Statement (RAS) approved by the Board and with the associated risk management policies, including those related to tax risk; its functions are described in section C.2.1. In addition, another three Board sub-committees participate in risk management and control: the Executive Committee, responsible for coordinating executive management of the Bank, for approving transactions and limits of risk groups that exceed the limits of the delegated powers and for approving asset allocation proposals within the Risk Appetite Framework; the Audit and Control Committee, which oversees the effectiveness of the risk management systems, and is the body responsible for the regular oversight of the tax risk management and control framework to validate its effectiveness and ensure that the main risks are properly identified, managed and communicated; and the Appointments and Remuneration Committee, which ensures that the Group’s remuneration practices are coherent with its risk profile, avoiding inappropriate risk-taking and promoting sound and effective risk management.
The departments involved in risk management and control, including tax risk, include, among others, the following:
- Risk Control Department, with the following functions: (i) proposing and implementing the Risk AppetiteFramework; (ii) systematically monitoring and analysing the evolution of all major risks and verifying the degreeto which they conform to the established policies; (iii) proposing the guidelines, methodology and strategy formanaging all risks; (iv) defining and establishing the risk monitoring and control model, developing internaladvanced measurement systems, in line with supervisory requirements, to enable risks to be quantified anddiscriminated, and activating their application in the business; (v) establishing procedures to optimise the creditapproval function, and (vi) promoting and standardising, with the assistance and advice of the Tax AdvisoryDepartment (within Legal), the management and control of tax risks within the group's risk control environment,systematically overseeing and analysing trends in tax risk and the degree to which the controls conform to thepolicy framework that is in place. At the end of 2018, it was decided to create the position of Chief Risk Office,reporting directly to the Risk Committee.
- Risk Management Department, with the following functions: (i) managing and integrating exposures inaccordance with the pre-determined levels of autonomy, via selective acceptance of risk to ensure its quality,achieve growth and optimise business profitability; (ii) aligning the priorities of the strategic plan and the visionof the Risk Management Department in all segments, identifying the initiatives to be implemented as regardsrisk.
- Finance Department, with the following functions: (i) supporting the Managing Director and Chief Risk Officerin implementing the Risk Appetite Framework; (ii) as part of the planning, budgeting and management controlprocesses, it calculates provisions and assigns capital in keeping with the Bank’s strategy, ensuring the riskvariable is taken into account in all decisions and overseeing the specific risk measurement models, ensuringtheir standardisation in terms of generally accepted principles and methodologies and particularly vis-à-vis thesupervisory authorities. Additionally, it develops and manages the stress test analysis framework within theinstitution's financial planning; and (iii) in relation to tax risk, it is the department responsible for implementingand complying with the tax obligations in relation to corporate income tax, value added tax and transfer pricing,implementing the tax principles and rules in this connection.
- Asset Transformation and Industrial and Real Estate Investees Department: Manages the group's entireexposure to real estate, the developer loan book and real estate assets on the Bank’s balance sheet togetherwith processes for recovering problematic assets.
- Treasury and Capital Markets Department: responsible for managing the Bank's liquidity, and managementand compliance with its regulatory coefficients and ratios. It also manages the risk of the proprietary trading book,interest rate and exchange rate risk and various books, basically due to operational flows with both internal andexternal clients, originating from the activity of the Distribution units and also the Finance Department and thenetwork of branches and offices.
- Compliance Department: promotes and seeks to ensure the highest possible level of compliance with thelegislation in force and with the group’s professional ethics, thereby mitigating compliance risk, which isunderstood as the risk of incurring legal or administrative sanctions, significant financial losses or reputationallosses due to non-compliance with laws, regulations, standards, self-regulations and codes of conduct applicableto banking activities.
- Internal Audit Department: (i) oversees the control system established for effective compliance withmanagement policies and procedures, assessing the adequacy and effectiveness of the management andcontrol activities of each functional and executive unit, reporting directly to the Audit and Control Committee; (ii)verifies the design and effectiveness of the Risk Appetite Statement and its alignment with the supervisoryframework; and (iii) provides assurance concerning the implementation of the RAS both in the documentationstructure (consistency between it and the RAS) and in the subsequent integration into the Bank’s managementpractices, verifying compliance with the established metrics and action plans.
- Tax Advisory Department (Legal Department): responsible for setting the tax approach in matters of importance

554 Banco Sabadell Annual report 2018
for tax reasons and for advising the Board of Directors and the group's divisions. It may also obtain advice from independent experts where it is considered necessary.
- The other divisions, areas and departments, including Human Resources and the Centralised Administration,must implement the tax strategy in all actions or operations that may have a tax impact.
(This description continues in section H)
E.3 Describe the main risks, including tax risks, and corruption-related risks, to the extent that theyare material (within the scope of Royal Decree-Act 18/2017), that may affect attainment of the business targets.
Credit and concentration risk
Credit risk is the possibility that losses may be incurred as a result of borrowers failing to meet their obligations or through losses in value due simply to deterioration in borrower quality. The following risks stand out because of their specific characteristics:
- Concentration risk
Complementary to credit risk, concentration risk refers to exposures that can potentially generate losses largeenough to threaten the institution's financial solvency or the viability of its ordinary business activity.- Counterparty risk
The regulations on bank capital risk use the term counterparty risk to refer to exposure to certain financial contracts(derivatives and repos) for which risk exposure does not match the notional value of the contract. This includescounterparty risk, settlement risk and delivery risk.- Country risk
Country risk is that arising in the debts of a country, taken as a whole, as a result of reasons inherent to thecountry's sovereignty and economic situation, i.e. for circumstances other than regular credit risk. It manifestsitself in a debtor's potential inability to honour their foreign currency payment obligations to external creditors due,among other reasons, to the country preventing access to foreign currency, the inability to transfer it, or the non-enforceability of legal action against borrowers for reasons of sovereignty, war, expropriation or nationalisation.Country risk affects not only debts contracted with a State or entities guaranteed by it but also all private debtorsthat belong to such State and who, for reasons outside their control and not at their volition, are generally unableto honour debts.- Non-performing asset (NPA) risk
NPA risk is defined as the risk of incurring higher costs or losses associated with managing doubtful assets and/orforeclosed assets.
Liquidity risk
Liquidity risk arises due to the possibility of losses being incurred as a result of the Bank being unable, albeit temporarily, to honour payment commitments due to a lack of liquid assets, or of it being unable to access the markets to refinance debts at a reasonable cost. This risk may be associated with factors of a systemic nature or specific to the institution itself.
Market risk
This risk is defined as arising from the possibility of loss in the market value of financial asset positions due to variations in risk factors with an impact on their market prices or volatility or the correlation between them.
Structural risks: Including, because of their special features:
- Interest rate risk
Structural interest rate risk (also known as Interest Rate Risk in the Banking Book, or IRRBB) is inherent to bankingand is defined as the possibility of incurring losses as a result of the impact of interest rate fluctuations on theincome statement (revenues and expenses) and on the entity’s equity structure (current value of assets, liabilitiesand off-balance sheet positions that are sensitive to interest rates).- Exchange rate risk
This risk arises from changes in the market exchange rates between currencies, which may generate losses infinancial investments or in permanent investments in overseas offices and subsidiaries which use currencies otherthan the euro.- Credit spread risk in the banking book
Credit spread risk in the banking book (CSRBB) refers to any risk with respect to the spread of credit instrumentsnot attributable to structural interest rate risk or to default risk.- Insurance risk
Defined as the risk arising from the institution's equity holdings in insurance companies, basically from actuarialrisks as well as other risks (market, counterparty, operational, etc.).
Operational risk

555Statutory information
Operational risk is defined as the risk of loss resulting from failures or inadequacies in people, processes, and systems or from unforeseen external events. This definition includes reputational, behavioural, technology, model and outsourcing risks. The following risks stand out because of their specific characteristics:
- Reputational risk
The possibility of losses arising from negative publicity related to the bank’s practices and activities, potentiallyleading to a loss of trust in the institution, with an impact on its solvency.- Conduct risk
The possibility of losses for the Institution derived from inadequate provision of financial services, including casesof malice or negligence.- Technology risk
Impact or effect on services to customers (both internal and external) in terms of service and quality, which maylead to data losses and/or integrity failures derived from improper management, operation, control and/or failureof information systems, of their resilience capabilities or of the teams that manage them.- Model risk
The possibility of losses arising from decision-making based on the use of inadequate models.- Outsourcing risk
The possibility of losses deriving from: failure by suppliers to provide subcontracted services or theirdiscontinuation, weaknesses in their systems’ security, disloyal conduct on the part of their employees or a breachof applicable regulations.
Business risk
The possibility of incurring losses as a result of adverse events with a negative impact on the capacity, strength and recurrence of the income statement.
Tax risk
Tax risk is defined as the probability of failing to comply with the objectives set out in Banco Sabadell's tax strategy from a dual perspective due to either internal or external factors:
On one hand, the probability of failing to comply with the tax obligations that may result in a failure to paytaxes that are due or the occurrence of any other event that impairs attainment of the Bank's goals.
On the other hand, the probability of paying taxes not actually due under tax obligations, thus impairing theposition of shareholders or other stakeholders.
Compliance risk
Compliance risk is defined as the risk of incurring legal or administrative penalties, significant financial losses or an impairment of reputation due to a breach of laws, regulations, internal rules or codes of conduct applicable to the Group's business.
E.4 Identify whether the institution has levels of tolerance to risk, including tax risk.
The chief element of the Risk Appetite Framework approved by the Board of Directors is the Risk Appetite Statement. The group understands the Risk Appetite Statement as expressing the quantity and diversity of risks that the Banco Sabadell Group seeks and tolerates in order to achieve its business objectives, maintaining a balance between returns and risk.
The RAS comprises the quantitative metrics and qualitative elements that together define the Bank's risk appetite levels, both globally and for each of the major risks assumed in the ordinary course of business.
As for tax risk, one of the main principles of the tax strategy referred to in section E1 above is to minimise tax risk.
This statement applies to all risks identified in section E3 above.
E.5 State what risks, including tax risks, materialised during the year.
The Group provides detailed information of the risks in the Annual Report, which is available on the corporatewebsite (www.grupobancosabadell.com – section Information for shareholders and investors – Financial information – Annual Reports), specifically under section 4 of the consolidated directors’ report.
E.6 Describe the response and supervision plans for the company’s main risks, including tax risks,as well as the procedures applied by the company to ensure that the Board of Directors responds to emerging challenges.
The Risk Appetite Framework establishes the monitoring systems for major risks. At the highest level, this monitoring is carried out by the Risk Committee. Additionally, the Risk Control Department and the Technical Risk Committee exercise more frequent and detailed oversight.
556 Banco Sabadell Annual report 2018
The Risk Committee seeks to ensure appropriate acceptance, management and control of the group's tax risks, ensuring compliance with the general principles of the tax strategy and advising on decisions that are within the brief of the Board of Directors.
Risk management is underpinned by solid procedures for checking that risks conform to pre-set limits, with clearly defined responsibilities for identifying and tracking indicators and early warnings, and an advanced risk measurement methodology.
The group has risk control systems that are appropriate to the commercial banking activities and businesses in which it operates and to the risk profile it wishes to assume. These control systems form part of the above-mentioned risk approval, monitoring, mitigation and recovery procedures and, in turn, are subject to supervision.
In this regard, the group has a framework for risk reporting and control intended to oversee compliance with the Risk Appetite Framework both group-wide and at a lower level for objectives set at Business Unit or Portfolio level.
The Risk Committee is in charge of coordinating oversight, although in this regard it relies on the various committees and areas, depending on the type and level of disaggregation of each risk.
The Risk Reporting and Control Framework, which includes tax risk, comprises: Drawing up and regularly updating a Scorecard that reflects trends in the main metrics and variablesassociated with the Risk Appetite Framework, and ensuring that they conform to the establishedframework and limits.Systematic oversight and analysis of trends in all significant risks, with detailed second-tier metrics.Reporting and proposing the appropriate action (activating protocols, changing guidelines, etc.) as aresult of analysing risk trends.There is a reporting procedure that includes the top-level metrics defined in the RAS, as well asadditional second-tier metrics for significant risks. This report is compiled, transmitted and presentedby the CRO to the various governing and control bodies (Technical Risk Committee, Risk Committee,Board of Directors). The report identifies warning or overshoot situations, and the metrics and theirperformance.The process of reporting in connection with the Risk Appetite Framework is headed by the Risk ControlDepartment, which defines the content of the Scorecard, including top-tier and second-tier metrics. Theprocess of monitoring the Group's metrics includes tracking Banco Sabadell's top-tier metrics.By agreement with the departments in charge, the Risk Control Department establishes a regularprocess for compiling information drawn from databases or processes with built-in controls that aresubject to review and audit procedures.
Also, in the event that the limits established for a given metric in the RAS are exceeded, a protocol of action is triggered that is linked to the group's Recovery Plan for the RAS metrics in question, in order to review, control and, as necessary, correct any deviation.
The protocol also includes monitoring the execution and outcome of the action plan once it has been approved and set in motion.
Risk assessment also forms part of the control system and is established through advanced measuring methodologies. In this regard, the Basel Committee on Banking Supervision has been working on a new capital adequacy framework for financial institutions, known as the New Basel Capital Accord, a fundamental principle of which is that banks’ regulatory capital requirements should be more closely related to the risks actually incurred, based on internal risk measurement models and parameters and internal estimates that have been validated beforehand.
The Bank has an advanced methodology in place to ensure that risks incurred can be assessed reliably and managed actively, following the guidelines defined by the Basel Committee in developing the components required to complete its risk measurement systems.
On the basis of the risk metrics provided by these new methodologies, the bank has developed a consolidated risk measurement model with a common internal unit of measurement — allocated capital — the purpose of which is to determine, on the basis of internal parameters, the amount of capital required to ensure a specified level of solvency. Evaluating risk in terms of allocated capital requirements means that the risk can be linked to returns, from individual customer up to business unit level. Banco Sabadell has also developed an analytical pricing system associated with the risk, which provides this assessment and incorporates it into the transaction pricing process.
(This description continues in section H)

557Statutory information
F INTERNAL CONTROL OVER FINANCIAL REPORTING (ICFR)
Describe the mechanisms that comprise the systems for Internal Control over Financial Reporting (ICFR).
F.1 The organisation’s control environment
Provide details, highlighting the main characteristics of, at least:
F.1.1. Which bodies and/or functions are responsible for: (i) the existence and maintenanceof an adequate and effective ICFR system; (ii) its implementation; and (iii) its supervision.
Article 5 of the Board of Directors Regulation states that the Board of Directors is an instrument of supervision and control whose responsibility is identifying the company’s and the consolidated group’s main risks and implementing and monitoring suitable internal control and reporting systems, as well as setting policies on the reporting and disclosure of information to shareholders, the markets and the general public.
In addition, as provided in Article 13 of its Regulation, the Board of Directors delegates supervision of internal control systems to the Audit and Control Committee.
The functions of the group’s Internal Audit Department include supporting the Audit and Control Committee in supervising the proper design and implementation and effective functioning of the risk management and control systems, which include ICFR.
The group's Finance Department contributes to implementing the general framework of the internal control systems that are rolled out across the entire organisation.
Part of that contribution materialises in the responsibility for designing and implementing internal control systems for financial information that ensure the accuracy of the financial information that is generated.
F.1.2. The following elements, if any, with regard to the process in which the financialreporting is formulated:
Departments and/or mechanisms entrusted with: (i) designing and reviewing the organisationalstructure; (ii) clearly defining the lines of responsibility and authority, with an appropriate distribution oftasks and functions; and (iii) ensuring that there are sufficient procedures for proper dissemination withinthe company.
The design and review of the organisational structure is the responsibility of the Global Organisationand Corporate Projects Department which, based on the Banco Sabadell Group Master Plan (whichnormally runs for three years), analyses and reviews the resources required by each division forcompliance. This review is carried out regularly and decides not only the necessary workforce butalso the structural organisation of each unit. Once an agreement has been reached, it is submittedto the Management Committee for approval and referral to each of the general divisions.
At the same time, the details of all the departments/units/offices are sent on a monthly basis to theHuman Resources Department showing all the modifications that have been made, so as to equipthem with the resources considered necessary to perform their duties.
The organisation chart of the Banco Sabadell Group arising from the above process addresses allthe departments, areas and divisions into which the Banco Sabadell Group is divided. Thisorganisation chart is supplemented by a “process map” giving greater details of the functions andresponsibilities assigned to each area of the Banco Sabadell Group, including details of thepresentation, analysis and review of financial reporting. The Banco Sabadell Group organisationchart and process map are accessible to all personnel on the corporate intranet.
Code of conduct, approval body, degree of distribution and instruction, principles and values (indicatingwhether there are specific references to the recognition of transactions and production of financialinformation), the body entrusted with analysing non-compliance and with proposing corrective actionsand sanctions.
The Banco Sabadell Group has a General Code of Conduct, approved by the Board of Directorsand available via the corporate intranet, whose fundamental principles include a commitment totransparency, particularly vis-à-vis shareholders, and a commitment to place all the financial andcorporate information at their disposal. The purpose is to comply strictly with the Banco SabadellGroup’s obligation to offer reliable financial reporting prepared in accordance with the applicable

558 Banco Sabadell Annual report 2018
regulations, presenting a true and fair view of the company. It also includes the responsibilities of its employees and executives to ensure this is so, via both proper discharge of their duties and notification to the governing bodies of any circumstance which might affect this commitment.
There is a Corporate Ethics Committee, whose functions include fostering ethical behaviour throughout the organisation, making proposals and advising both the Board of Directors and the various corporate and business units in connection with decisions that include aspects that may lead to conflicts of values.
Among the tasks carried out by the Corporate Ethics Committee is the analysis of compliance with the Code of Conduct or any other code or self-regulation that exists. In order to perform its functions, it has access to the human and material resources of the Compliance Department. If, as a consequence of exercising its functions, it detects any non-compliance, it must advise the Human Resources Department for the application of corrective actions and sanctions.
A whistleblowing channel, that allows reporting to the audit committee of any irregularities of a financialor accounting nature, as well as cases of non-compliance with the code of conduct and irregularactivities in the organisation, indicating if the matter is of a confidential nature.
The Banco Sabadell Group has, and encourages the use of, a whistle-blower channel to report alltypes of irregularities, particularly possible breaches of the General Code of Conduct. Any reportsreceived are treated confidentially and, once handled by the Corporate Ethics Committee(comprising a chairperson and six members appointed by the Board of Directors), are referred tothe Audit and Control Committee, if appropriate. This channel is managed internally and may becontacted by email at [email protected].
Training programmes and regular updating for staff involved in the preparation and review of financialinformation, as well as in the evaluation of ICFR, and which cover at least accounting standards,auditing, internal control and risk management.
As regards training and refresher programmes and particularly regarding the financial reportingprocess, the Banco Sabadell Group's Finance Department has an on-site training plan that basicallyaddresses areas such as the company's internal accounting/finance procedures, analysis of currentregulations and drafts of new domestic and international accounting standards, analysis of thedomestic and international economic situation, together with training in the use of software tofacilitate management and oversight of the financial reporting process.
These training sessions are programmed based on two criteria:
o Sessions scheduled at the start of the year by selecting the areas considered of greatest interestby the Finance Department.
o Sessions scheduled during the current year when an issue arises that is believed to warrantprompt distribution (drafts of new accounting standards, changes in the economic situation, etc.).
These training sessions are not only for Finance Department personnel but also for other departments (Audit, Risk Control, Asset Transformation, etc.), depending on the content.
The on-site training is taught chiefly by internal professionals of the Banco Sabadell Group and by external experts who are specialists in the subject area.
In addition, the Human Resources Department places at the disposal of Banco Sabadell Group employees a series of financial training courses which they can take online. The most notable courses refer to IAS-IFRS (International Financial Reporting Standards), financial mathematics, Spain's General Accounting Plan and general tax matters.
The Internal Audit Department has a training plan in place for all management professionals which includes a University Specialist Programme in Bank Internal Auditing (PSAI) at a prestigious academic institution. The course covers areas such as accounting principles and financial reporting, the basics of auditing, and financial risk monitoring and management. In the 2018-2019 academic year, ten audit professionals were taking this programme, and 65 members of the Internal Audit Department hold PSAI certificates. Additionally, during 2018, the members of the Internal Audit Department participated in workshops on new regulatory impacts, including new accounting and financial reporting.

559Statutory information
F.2 Evaluation of financial reporting risks
Provide information on, at least:
F.2.1. What are the chief characteristics of the process for identifying risk, including error orfraud, in relation to:
If the process exists and is documented.
The Banco Sabadell Group's process of identifying the risk of error or the probability of fraud infinancial reporting is documented in a procedure which sets out the frequency, methods, types ofrisks and other basic features of the process.
Whether the process covers all the financial reporting objectives (existence and occurrence; integrity;valuations; presentation, itemisation and comparability; and rights and obligations), and if it is updatedand how often.
The process covers all the financial reporting objectives (existence and occurrence; integrity;valuation; presentation, itemisation and comparability; and rights and obligations) and focuses onidentifying risks of material error based on transaction complexity, quantitative and qualitativemateriality, complexity of the calculations and application of judgements and estimations, updatedon an annual basis. If (i) circumstances not previously identified which reveal possible errors in thefinancial information, or (ii) material changes to the operations of the Banco Sabadell Group ariseduring the year, the Finance Department evaluates the risks to be added to those already identified.
The process is structured such that, on a half-yearly basis, an analysis is conducted to identify whichareas or processes and in which companies and locations material transactions arise.
Once they have been identified, they are reviewed so as to analyse the potential risks of error forthese types of transactions in each financial reporting objective.
The existence of a process for identifying the consolidation scope, taking into account, among others,whether there are complex corporate structures, instrumentality companies or special purpose vehicles.
The process for identifying the scope of consolidation is described in section F.3.1. of this document.
If the process takes into account the effects of other types of risks (operational, technology, financial,legal, reputational, environmental, etc.) insofar as they affect the financial statements.
In addition, the process considers the risk of error in certain processes not linked to specifictransaction types but which are especially important in view of their impact on drafting the financialreporting, such as the process of reviewing judgements and estimates, significant accountingpolicies and the closing and consolidation process. In this respect, and with a view to covering therisks of these processes, the Banco Sabadell Group has the control activities described in sectionF.3.1. of this document. It should also be noted that the risk identification process takes into accountthe possible effects of other types of risks (operational, technology, financial, legal, reputational,environmental, etc.), insofar as these may affect the financial statements.
What governing body of the institution supervises the process.
The aforementioned process is conducted and documented by the Banco Sabadell Group’s FinanceDepartment and is supervised ultimately by the Audit and Control Committee.
F.3 Control activities
State whether the company has at least the following, and describe their characteristics:
F.3.1. Review and authorisation procedures for financial reporting and description of theICFR, to be published in the securities markets, indicating those responsible, together withdocumentation describing the flows of activities and controls (including those related to therisk of fraud) of the various types of transactions that may have a significant effect on thefinancial statements, including the accounting close procedure and specific review of the

560 Banco Sabadell Annual report 2018
judgements, estimations, evaluations and major projections.
The procedure for reviewing and authorising the Banco Sabadell Group's financial reporting to the markets commences with a review by the Finance Department. In accordance with the Board of Directors Regulation, the separate and consolidated financial statements and half-yearly financial reports are reviewed by the Audit and Control Committee prior to being authorised by the Board of Directors. In accordance with the provisions of its Regulation, the Audit and Control Committee reads and discusses the information with the heads of the Finance and Internal Audit departments and with the external auditors prior to submission to the Board of Directors.
Once the Audit and Control Committee has vetted the information and either approved it or attached its comments, the CFO, the Chairman and the Managing Director of the Banco Sabadell Group sign the accounts and submit them to the Board of Directors for authorisation.
The Audit and Control Committee reviews the quarterly financial disclosures (income statement and trend of the main balance sheet items) before they are submitted to the Board of Directors.
With regard to the activities and controls directly relating to transactions that may have a significant impact on the financial statements, the Banco Sabadell Group has descriptions of the controls in place to mitigate the risk of material error (intentional or otherwise) in the information reported to the markets. For the critical areas of the Banco Sabadell Group, special emphasis is placed on developing solid descriptions of the flows of activities and controls, which cover, among others:
• Loans and advances• Fixed-income portfolio and issuance• Equity securities• Customer deposits• Derivatives• Foreclosed real estate
These descriptions contain information on what form the control activity should take, its purpose (risk to be mitigated), the party responsible for executing it and the frequency. The descriptions cover controls on the proper accounting, measurement, presentation and disclosure of these areas.
The Banco Sabadell Group also has procedures for mitigating the risk of error in processes not related to specific transactions. In particular, there are procedures defined for the accounting close which include the consolidation process and specific review procedures for material judgements and estimates, which are escalated to senior management when appropriate.
With regard to the consolidation process within the accounting close, procedures have been implemented to ensure proper identification of the consolidation scope. In particular, for example, the Banco Sabadell Group conducts a monthly analysis of the consolidation scope, requesting the necessary information from all the subsidiaries; the analysis covers all types of corporate structures.
The review of judgements and estimates is carried out at different levels by members of the Finance Department. In addition, in its financial statements the Banco Sabadell Group describes the most important areas in which judgements and estimates are made, together with the key assumptions made in this connection. It also has procedures for reviewing accounting estimates. The main estimates relate to impairment losses on certain financial assets, actuarial calculations of pension liabilities and obligations, the useful life of tangible and intangible assets, measurement of goodwill, and the fair value of unlisted financial assets and of real estate.
F.3.2. Internal control policies and procedures on security, the information systems (amongothers, access control, change control, operation, operational continuity and segregation offunctions) that support the institution’s major processes with regard to the formulation andpublication of financial reporting.
The Banco Sabadell Group uses information systems to maintain an adequate record and control of its operations and is, consequently, highly dependent on them working properly.
As part of the process to identify risks of error in financial reporting, the Banco Sabadell Group identifies which systems and applications are important in each of the areas or processes considered to be material. The identified systems and applications include those used directly in preparing the financial information and those that are important for ensuring that the controls to mitigate the risk of errors are effective.
The design and implementation of the applications define a methodological framework that establishes various points of control to ensure that the solution complies with user requirements and meets the

561Statutory information
required standards of reliability, efficiency and maintainability.
Any change regarding infrastructures or applications is handled via the change management service, which defines the change approval flow, which may be escalated to the Change Committee, with definition of the impact and the possibility of roll-back.
The Banco Sabadell Group Information Security and Operational Continuity Department has policies aimed at covering access security by segregating functions and defining virtual roles and resources, and the continuity of operations by creating BRS centres, and performing periodic operating tests.
F.3.3. Internal control policies and procedures for managing outsourced activities, andmeasurement, calculation or valuation services commissioned from independent experts,when these may materially affect the financial statements.
The Banco Sabadell Group regularly examines whether activities carried out by third parties are material to the financial reporting process or might indirectly affect its reliability. To date, the Banco Sabadell Group has not outsourced processes with a material impact on financial reporting. However, the Banco Sabadell Group regularly uses reports from independent experts for measuring transactions that may materially affect the financial statements.
In 2018, the activities outsourced to third parties (appraisals and calculations by independent experts) were connected with real estate valuations, measuring post-employment benefits for employees, and reviewing goodwill.
The units of the Banco Sabadell Group responsible for these operations exercise oversight on the work of the external experts to check their competence, skills, accreditation and independence together with the validity of the data and methods used and the reasonableness of the assumptions, applied as described in section F.3.1.
F.4 Information and reporting
State whether the company has at least the following, and describe their characteristics:
F.4.1. A specific function responsible for defining the accounting policies and keeping themup to date (accounting policies department or area) and for resolving doubts or conflictsarising from their interpretation, maintaining regular communication with the persons responsible for operations within the organisation, together with an updated accounting policies manual distributed to all the bank's operating units.
The Accounting Regulation and Financial Reporting Department (under the Financial Reporting Department) is the unit responsible for identifying and defining the accounting policies that affect the Banco Sabadell Group and for responding to queries concerning accounting from the subsidiaries and business units.
The Financial Reporting Department is responsible for informing Senior Management of the Banco Sabadell Group regarding new accounting standards, the results of their implementation and their impact on the financial statements of the Banco Sabadell Group.
The functions of the Technical Committee on Accounting and Financial and Non-Financial Disclosures include identifying transactions that, in accordance with established procedures, must be cross-checked by an independent accounting expert, identifying and review accounting issues to be referred to the Audit and Control Committee for approval, approving accounting procedures, and overseeing and checking the conclusions provided by the work groups that analyse one-off transactions, as well as any accounting treatment that has a material impact and involves a significant judgement and estimate component.
The Banco Sabadell Group has guides on accounting procedure that conform to the needs, requirements and dimension of the Banco Sabadell Group; they set out and explain the rules for preparing financial reporting and describe how to apply the rules to the bank's specific operations. These documents not only explicitly refer to the standards applied to each type of transaction but also elaborate upon and interpret them so as to adapt exactly to each transaction type.
These documents are updated regularly, and at least once per year. Significant modifications are notified to the dependent companies to which they are applicable.

562 Banco Sabadell Annual report 2018
F.4.2. Mechanisms using standard forms for gathering and preparing financial information, forapplication and use by all units in the bank or group, to support the main financial statements and notes as well as detailed disclosures on ICFR.
The chief IT systems and applications used in generating financial reporting by the Banco Sabadell Group are centralised and interconnected. There are procedures and controls that ensure proper development and maintenance of those systems, as well as their proper performance, continuity and security.
During the consolidation and preparation of the financial reporting, inputs such as the financial statements issued by the Group subsidiaries are used in the established formats, together with the rest of the financial information required both for accounting harmonisation and for meeting the disclosure requirements.
The Banco Sabadell Group has a number of software applications for consolidation, including a series of controls to ensure the reliability and proper processing of the information received from subsidiaries, notably checks to ensure consolidation entries were posted correctly, an analysis of variations in all balance sheet and income statement items, variations in the results obtained with respect to proper insertion of group undertakings' financial statements, the monthly and annual budget, and specific Bank of Spain checks on the financial statements, in which the balance sheet and profit and loss account items are cross-checked.
F.5 Supervision of system operation
Report on at least the following, giving details of their main features:
F.5.1. Supervision of ICFR by the Audit Committee, and whether the institution has aninternal audit function with the duty of supporting the committee in supervising the internalcontrol system, including ICFR. Also provide information on the scope of the evaluation ofICFR carried out during the year and the procedure by which the person assigned to performthe assessment reports the results, whether the institution has an action plan setting outcorrective measures and whether its impact on financial reporting has been considered.
At each financial close, the Financial Department assesses the internal control model, considering its frequency, the risks in the financial reporting processes, and the adequacy and effectiveness of the controls that mitigate them, and it produces and custodies evidence that each specific control was performed. The Finance Department also continuously evaluates aspects that may lead to changes in the internal control model, including regulatory changes, the introduction of new products and amendments to Banco Sabadell's processes, identifying the risks associated with them and designing controls to mitigate them; it also reviews the criticality of the controls and the changes in the materiality of processes with an accounting impact.
In accordance with the Board of Directors Regulation, the Audit and Control Committee is the body empowered with overseeing Internal Audit. Additionally, the Audit and Control Committee's functions include approving the Internal Audit plan, assessing the outcome of each audit, and prioritising and tracking corrective measures.
The Bank's Internal Audit Department reports directly to the Audit and Control Committee, which grants it hierarchical and functional independence from the rest of the institution's departments and positions the function at an appropriate level of the organisation.
On the basis of its policy, which was approved by the Board of Directors, the functions of the Internal Audit Department include supporting the Audit and Control Committee in supervising the proper design and implementation, and the effective functioning of the risk management and control systems.
The Overall Audit Plan that the Audit and Control Committee approved at a meeting on 30 January 2018 set out, inter alia, the actions to be implemented with respect to the areas or processes considered to have the highest residual risk on the basis of a risk assessment exercise. The actions set out in the plan were performed in 2018; in some cases, the control environment was reviewed and, in particular, the proper identification of risks in processes was assessed, along with the sufficiency, design, implementation and effective functioning of existing controls. The general controls on reporting systems indicated in section F.3.2 are reviewed every year.
In addition to the aforementioned supervisory activities carried out by the ICFR Department, the Audit and Control Committee and the Internal Audit Department, in 2018 the external auditor reviewed the

563Statutory information
information relating to the ICFR, with no adverse findings.
F.5.2. Is there a discussion procedure through which the auditor (in accordance with theprovisions of the Audit Technical Standards), the internal audit function and other expertscan report to senior management and to the audit committee or company directors on anysignificant internal control weaknesses identified during the review of the financialstatements, or any other entrusted to them? Also report on whether there is an action planto remedy or mitigate identified weaknesses.
The Audit and Control Committee meets at least once every three months (prior to the publication of the regulated disclosures) in order to obtain and analyse the necessary information to fulfil the functions entrusted to it by the Board of Directors.
These meetings carry out an in-depth review of the annual and half-yearly accounts and the interim financial statements of the company together with the rest of the information made available to the market. To carry out this process, the Audit and Control Committee first receives all the documentation and meets with the Director - General Manager, the Internal Audit Department and the external auditor (in the case of the annual and half-yearly accounts) in order to ensure proper application of the current accounting standards and the reliability of the financial reporting. In addition, this discussion process assesses any ICFR weaknesses that were identified, the proposals to correct them and the status of any actions that have been taken.
The group’s auditor has direct access to the group’s senior management and holds regular meetings to obtain the necessary information and to report on control weaknesses detected during the audit. With regard to the latter, each year the external auditor submits a report to the Audit and Control Committee detailing any internal control weaknesses that were detected or certifying that there were none. This report incorporates comments by group management and any action plans implemented to remedy internal control weaknesses.
F.6 Other material information
The Banco Sabadell Finance Department has implemented a software application that includes and formalises all the ICFR controls, while at the same time ensuring ongoing identification of new risks to be considered and updates to mitigating controls in each accounting close. This application enables the controls to be validated on time and properly with the aim of guaranteeing the reliability of the financial reporting. The software features are designed to take account of the recommendations in the CNMV's guide entitled "Internal Control over Financial Reporting in Listed Companies," based on the principles and good practices contained in the COSO report (Committee of Sponsoring Organisations of the Treadway Commission).
F.7 External auditor report
Report on:
F.7.1. State whether the ICFR information supplied to the market has been reviewed by theexternal auditor, in which case the corresponding report should be attached. Otherwise,give the reasons for the absence of this review.
The Banco Sabadell Group submitted the ICFR information supplied to the markets for 2018 to the external auditor for review. The report by the external auditor (PricewaterhouseCoopers), once it is available, will be attached as an annex to this annual report on corporate governance.
The scope of the auditor's review is determined by Circular E14/2013, dated 19 July 2013, of the Instituto de Censores Jurados de Cuentas de España.

564 Banco Sabadell Annual report 2018
G DEGREE OF ADHERENCE TO RECOMMENDATIONS ON CORPORATE
GOVERNANCE
Indicate the degree of compliance by the company with the recommendations of the Unified Good Governance Code for Listed Companies. If any recommendation is not followed or is followed only in part, give a detailed explanation of the reasons so that shareholders, investors and the market in general have sufficient information to be able to evaluate the company’s course of action. Explanations of a general nature will not be sufficient.
1. The bylaws of listed companies should not place an upper limit on the votes that can be cast by
a single shareholder, or impose other obstacles to the takeover of the company by means of share
purchases on the market.
Complies X Explain
2. When a dominant and a subsidiary company are both listed, the two should provide detaileddisclosure on:
a) The respective fields of business and any business relationships between them, as well as thosebetween the listed subsidiary and other companies in the group.
b) The mechanisms for settling any conflicts of interest that might arise.
Complies Partially complies Explain Not applicable X
3. During the Annual General Meeting, in addition to the written corporate governance annual report,the Chairman of the Board of Directors should verbally inform the shareholders, providing sufficientdetail, of the most significant aspects of the company’s corporate governance and, in particular:
a) Any changes since the last General Meeting.
b) The specific reasons for which the company does not follow one or more of therecommendations of the Code of Corporate Governance and, if any, alternative rules that are ofapplication in this matter.
Complies X Partially complies Explain
4. The company defines and promotes a communication and contact policy with shareholders,institutional investors and proxy advisors that fully complies with the standards to combat marketabuse and that gives similar treatment to shareholders in the same position. This policy should bedisclosed on the company’s website, complete with details of how it has been put into practice andthe identities of the relevant interlocutors or those entrusted with its implementation.
Complies X Partially complies Explain
5. The Board of Directors should not submit proposals to the General Meeting to grant powers toissue shares or convertible securities while overriding pre-emptive subscription rights for anamount greater than 20% of capital at the time of granting of these powers. Whenever the Board ofDirectors approves an issue of shares or convertible securities, with the exception of pre-emptivesubscription rights, the company should immediately publish on its website the reports required incompany law in connection with overriding pre-emptive rights.
Complies X Partially complies Explain
6. Although not expressly required by company law, listed companies that have prepared thereports listed below, either obligatorily or voluntarily, should publish them on their websitesufficiently in advance of the Ordinary General Meeting:
a) Report on the auditor’s neutrality.
b) Reports on the performance of the Audit Committee and the Appointments andRemuneration Committees.

565Statutory information
c) Report by the Audit Committee on related-party transactions.
d) Report on the company’s corporate responsibility policy.
Complies X Partially complies Explain
7. The company should broadcast its general meetings live on the corporate website.
Complies X Explain
8. The audit committee should strive to ensure that the board of directors can present thecompany’s accounts to the general meeting without limitations or qualifications in the auditor’sreport. In the exceptional case that qualifications exist, both the chairman of the audit committeeand the auditors should give a clear account to shareholders of their scope and content.
Complies X Partially complies Explain
9. The company should disclose its conditions and procedures for accrediting share ownership, theright to attend general meetings and the exercise or delegation of voting rights, and display thempermanently on its website. Such conditions and procedures should encourage shareholders toattend and exercise their rights and be applied in a non-discriminatory manner.
Complies X Partially complies Explain
10. When an accredited shareholder exercises the right to supplement the agenda or submit newproposals prior to the general meeting, the company should:
a) Immediately circulate the supplementary items and new proposals.
b) Re-issue the attendance card or proxy appointment or remote voting form in a duly modifiedform so that new agenda items and alternative proposals can be voted on in the same termsas those submitted by the board of directors.
c) Put all these items or alternative proposals to the vote applying the same voting rules as forthose submitted by the board of directors, with particular regard to presumptions ordeductions about the direction of votes.
d) After the general meeting, disclose the breakdown of votes on such supplementary itemsor alternative proposals.
Complies X Partially complies Explain Not applicable
11. In the event that a company plans to pay for attendance at the general meeting, it should firstestablish a general, long-term policy in this respect.
Complies Partially complies Explain Not applicable X
12. The Board of Directors should perform its duties with unity of purpose and independence,granting the same treatment to all shareholders in the same position. It should be guided at all timesby the company’s best interests, understood as the creation of a profitable business that promotesits sustainable success over time, while maximising its economic value.
In pursuing the corporate interest, it should not only abide by laws and regulations and conduct itself according to principles of good faith, ethics and respect for commonly accepted customs and good practices, but also strive to reconcile its own interests with the legitimate interests of its employees, suppliers, clients and other stakeholders, as well as with the impact of its activities on the broader community and the natural environment.
Complies X Partially complies Explain

566 Banco Sabadell Annual report 2018
13. The board of directors should have an optimal size to promote its efficient functioning and maximise
participation. The recommended range is between five and fifteen members.
Complies X Explain
14. The board of directors should approve a director selection policy that:
a) Is concrete and verifiable;b) Ensures that appointment or re-election proposals are based on a prior analysis of the
board’s needs; andc) Favours a diversity of knowledge, experience and gender.
The results of the prior analysis of board needs should be written up in the appointments committee’s explanatory report, to be published upon convening the general meeting that will ratify the appointment and re-election of each director.
The director selection policy should pursue the goal of having at least 30% of total board places occupied by women directors before the year 2020.
The appointments committee should run an annual check on compliance with the director selection policy and set out its findings in the annual corporate governance report.
Complies X Partially complies Explain
15. Proprietary and independent directors should constitute an ample majority on the board ofdirectors, while the number of executive directors should be as low as is practical bearing in mindthe complexity of the corporate group and the ownership interests they control.
Complies X Partially complies Explain
16. The percentage of proprietary directors out of all non-executive directors should be no greaterthan the proportion between the ownership stake of the shareholders they represent and theremainder of the company’s capital.
This criterion can be relaxed:
a) In large cap companies where few or no equity stakes attain the legal threshold forsignificant shareholdings.
b) In companies with a plurality of shareholders represented on the board but not otherwiserelated.
Complies X Explain
17. Independent directors should account for at least half of all board members. However, when thecompany does not have a large market capitalisation, or when a large cap company hasshareholders individually or concertedly controlling over 30 percent of capital, independentdirectors should occupy, at least, one-third of board places.
Complies X Explain
18. Companies should disclose the following director particulars on their websites and keep themregularly updated:
a) Background and professional experience.
b) Directorships held in other companies, listed or otherwise, and other remunerated activitiesthey engage in, of any type.
c) Statement of the director category to which they belong, indicating, in the case ofproprietary directors, the shareholder they represent or have links with.
d) Dates of their first appointment as a board member and subsequent re-elections.

567Statutory information
e) Shares held in the company, and any options on same.
Complies X Partially complies Explain
19. Following verification by the appointments committee, the annual corporate governance reportshould disclose the reasons for the appointment of proprietary directors at the instances ofshareholders controlling less than 3 percent of capital; and explain any rejection of a formal requestfor a board place from shareholders whose equity stake is equal to or greater than that of otherswho applied successfully for a proprietary directorship.
Complies Partially complies Explain Not applicable X
20. Proprietary directors should resign when the shareholders they represent dispose of theirownership interest in its entirety. If such shareholders reduce their stakes, thereby losing some oftheir entitlement to proprietary directorships, the number of the latter should be reducedaccordingly.
Complies X Partially complies Explain Not applicable
21. The board of directors should not propose the removal of independent directors before theexpiry of their tenure as mandated by the bylaws, except where there is just cause, based on aproposal from the appointments committee. In particular, just cause will be presumed whendirectors take up new posts or responsibilities that prevent them from allocating sufficient time totheir duties as board members, or are in breach of their fiduciary duties or come under one of thecases enumerated in the applicable legislation that disqualify a person from being classified asindependent. The removal of independent directors may also be proposed when a takeover bid,merger or similar corporate transaction alters the company’s capital structure, provided thechanges in board membership arise from the proportionality criterion set out in recommendation16.
Complies X Explain
22. Companies should establish rules obliging directors to disclose any circumstance that mightharm the organisation’s good name or reputation and, in particular, to inform the board if they areinvestigated by the police and, and the progress of any subsequent court proceedings.
As soon as a director is indicted or arraigned for any of the offences listed in company law, the board of directors should open an investigation and, in light of the particular circumstances, decide whether or not the director should be called on to resign. The Board of Directors should give a reasoned report on this in the annual report on corporate governance.
Complies X Partially complies Explain
23. Directors should express clear opposition when they feel a proposal submitted for the board’sapproval might be detrimental to the company's interests. In particular, independents and otherdirectors not subject to potential conflicts of interest should strenuously challenge any decisionthat might harm the interests of shareholders lacking board representation.
When the board makes material or reiterated decisions about which a director has expressed serious reservations, then he or she must draw the pertinent conclusions. Directors resigning for such causes should set out their reasons in the letter referred to in the next recommendation. The terms of this recommendation also apply to the secretary of the board, even if he or she is not a director.
Complies Partially complies Explain Not applicable X
24. Directors who step down before their tenure expires, through resignation or otherwise, shouldstate their reasons in a letter to be sent to all members of the board. Whether or not such resignationis disclosed in the form of a regulatory disclosure, the reasons should be set out in the annualcorporate governance report.
Complies X Partially complies Explain Not applicable

568 Banco Sabadell Annual report 2018
25. The appointments committee should ensure that non-executive directors have sufficient timeavailable to discharge their responsibilities effectively. The board of directors regulations shouldestablish the maximum number of company boards on which directors can serve.
Complies X Partially complies Explain
26. The board should meet with the necessary frequency to properly perform its functions, eighttimes a year at least, in accordance with a calendar and agendas set at the start of the year, to whicheach director may propose the addition of initially unscheduled items.
Complies X Partially complies Explain
27. Director absences should be kept to a strict minimum and quantified in the annual corporategovernance report. In the event of unavoidable absence, directors should grant proxy with theappropriate instructions.
Complies X Partially complies Explain
28. When directors or the secretary express concerns about a motion or, in the case of directors,about the company’s performance, and such concerns are not resolved at the meeting, they shouldbe entered in the minute book if the person expressing them so requests.
Complies Partially complies Explain Not applicable X
29. The company should provide suitable channels for directors to obtain the advice they need tocarry out their duties, extending if necessary to external assistance at the company’s expense.
Complies X Partially complies Explain
30. Regardless of the knowledge directors must possess to carry out their duties, they should alsobe offered refresher programmes when circumstances so advise.
Complies X Partially complies Explain
31. The agendas of board meetings should clearly indicate on which points directors must arrive ata decision, so that they can study the matter or gather the material they need beforehand. Forreasons of urgency, the chairman may wish to present decisions or resolutions for board approvalthat were not on the meeting agenda. In such exceptional circumstances, their inclusion will requirethe express prior consent, duly minuted, of the majority of directors present.
Complies X Partially complies Explain
32. Directors should be regularly informed of movements in share ownership and of the views ofmajor shareholders, investors and rating agencies on the company and its group.
Complies X Partially complies Explain
33. The chairman, as the person charged with the efficient functioning of the board of directors, inaddition to the functions assigned by law and the company’s bylaws, should prepare and submit tothe board a schedule of meeting dates and agendas; organise and coordinate regular assessmentsof the board and, where appropriate, the company’s chief executive officer; exercise leadership ofthe board and be accountable for its proper functioning; ensure that sufficient time is given to thediscussion of strategic issues, and approve and review refresher courses for each director, whencircumstances so advise.
Complies X Partially complies Explain
34. When a lead independent director has been appointed, the bylaws or board of directorsregulations should grant him or her the following powers over and above those conferred by law:chair the board of directors in the absence of the chairman or vice-chairmen; give voice to theconcerns of non-executive directors; maintain contacts with investors and shareholders to heartheir views and develop a balanced understanding of their concerns, especially related to thecompany’s corporate governance; and coordinate the chairman’s succession plan.
Complies X Partially complies Explain Not applicable
569Statutory information
35. The board secretary should strive to ensure that the board’s actions and decisions are informedby the recommendations of the Good Governance Code that are applicable to the company.
Complies X Explain
36. The board in full should conduct an annual assessment, adopting, where necessary, an actionplan to correct weaknesses detected in:
a) The quality and efficiency of the board’s operation.
b) The performance and membership of its committees.
c) The diversity of board membership and competences.
d) The performance of the chairman of the board of directors and the company’s chiefexecutive.
e) The performance and contribution of individual directors, with particular attention to thechairs of board committees.
The evaluation of board committees should start from the reports they send to the board of directors, while that of the board itself should start from the report of the appointments committee. Every three years, the board of directors should engage an external facilitator to aid in the evaluation process. This facilitator’s independence should be verified by the appointments committee. Any business dealings that the facilitator or members of its corporate group maintain with the company or members of its corporate group should be detailed in the annual corporate governance report. The process followed and areas evaluated should be detailed in the annual corporate governance report.
Complies X Partially complies Explain
37. When an executive committee exists, its membership mix by director class should resemble thatof the board. The secretary of the board should also act as secretary of the executive committee.
Complies Partially complies X Explain Not applicable
In accordance with article 59 of the Articles of Association, the Executive Committee will comprise at most 6 directors. At the end of 2018, the Executive Committee comprised 3 executive directors and 2 independent directors. The Chairman of the Board of Directors is a member and the Chair of the Executive Committee; the Secretary (not a director) of the Executive Committee is an Executive Director and Vice-Secretary of the Board of Directors, with the same faculties as the Secretary of the Board of Directors.
The Appointments Committee has sought to ensure that the composition of the Executive Committee is similar to that of the Board of Directors, with both executive directors and independent directors who, additionally, are not members of any of the other Board sub-committees. Consequently, Banco Sabadell understands that the composition of the Executive Committee in terms of the categories of directors who are represented is similar to that of the Board of Directors itself, in line with the principles of the Code of Good Governance.
Independent directors account for 66.67% of the Board of Directors and 40% of the Executive Committee.
38. The board should be kept fully informed of the business transacted and decisions made by theexecutive committee. To this end, all board members should receive a copy of the committee’sminutes.
Complies X Partially complies Explain Not applicable
39. All members of the audit committee, particularly its chairman, should be appointed on the basisof their knowledge and experience in accounting, auditing and risk management. A majority ofcommittee places should be held by independent directors.
Complies X Partially complies Explain
40. Listed companies should have a unit in charge of the internal audit function, under thesupervision of the audit committee, to monitor the effectiveness of reporting and control systems.This unit should report functionally to the board’s non-executive chairman or the chairman of theaudit committee.
Complies X Partially complies Explain

570 Banco Sabadell Annual report 2018
41. The head of the unit handling the internal audit function should present an annual workprogramme to the audit committee, inform it directly of any incidents arising during itsimplementation, and submit an activities report at the end of each year.
Complies X Partially complies Explain Not applicable
42. The audit committee should have the following functions over and above those assigned to itby law:
1. With respect to internal control and reporting systems:
a) Monitor the preparation and the integrity of the financial information relating to the companyand, as appropriate, the group, checking for compliance with legal provisions, accuratedemarcation of the consolidation perimeter, and proper application of accountingprinciples.
b) Monitor the independence of the unit handling the internal audit function; propose theselection, appointment, re-election and removal of the head of the internal audit service;propose the service’s budget; approve its priorities and work programmes, ensuring that itfocuses primarily on the main risks the company is exposed to; receive regular report-backson its activities; and verify that senior management are acting on the findings andrecommendations of its reports.
c) Establish and supervise a mechanism whereby staff can report, confidentially and, ifappropriate and feasible, anonymously, any significant irregularities that they detect in thecourse of their duties, in particular financial or accounting irregularities.
2. With regard to the external auditor:
a) Investigate the issues giving rise to the resignation of the external auditor, should this comeabout.
b) Ensure that the remuneration of the external auditor does not compromise its quality orindependence.
c) Ensure that the company notifies any change of external auditor to the CNMV as a regulatorydisclosure, accompanied by a statement of any disagreements arising with the outgoingauditor and the reasons for same.
d) Ensure that the external auditor holds an annual meeting with the full Board of Directors toreport on the work carried out and on the evolution of the accounting situation and thecompany’s risks.
e) Ensure that the company and the external auditor adhere to current regulations on theprovision of non-audit services, limits on the concentration of the auditor’s business andother requirements concerning auditor independence.
Complies X Partially complies Explain
43. The audit committee should be empowered to meet with any company employee or manager,even ordering their appearance without the presence of another senior executive.
Complies X Partially complies Explain
44. The audit committee should be informed of any fundamental changes or corporate transactionsthe company is planning, so that the committee can analyse the operation and report to the boardbeforehand on its economic conditions and accounting impact and, when applicable, the proposedexchange ratio.
Complies X Partially complies Explain Not applicable
45. Risk control and management policy should identify at least:
a) The types of financial and non-financial risk the company is exposed to (includingoperational, technology, financial, legal, social, environmental, political and reputationalrisks), with the inclusion under financial or economic risks of contingent liabilities and otheroff-balance-sheet risks.
b) The determination of the risk level the company sees as acceptable.

571Statutory information
c) The measures in place to mitigate the impact of identified risk events should they occur.
d) The internal control and reporting systems to be used to control and manage the aboverisks, including contingent liabilities and off-balance-sheet risks.
Complies X Partially complies Explain
46. Companies should establish a risk control and management function and assign it to one of thecompany’s internal department or units, reporting directly to the audit committee or anotherdedicated board committee. This function should be expressly charged with the followingresponsibilities:
a) Ensure that risk control and management systems are functioning correctly and, specifically,that major risks the company is exposed to are correctly identified, managed and quantified.
b) Participate actively in the preparation of risk strategies and in key decisions about theirmanagement.
c) Ensure that risk control and management systems are mitigating risks effectively in theframework of the policy drawn up by the board of directors.
Complies X Partially complies Explain
47. Appointees to the nomination and remuneration committee — or the appointments committeeand remuneration committee, if separate — should have the right balance of knowledge, skills andexperience for the functions they are called on to discharge. The majority of their members shouldbe independent directors.
Complies X Partially complies Explain
48. Large cap companies should have separate nomination and remuneration committees.
Complies X Explain Not applicable
49. The appointments committee should consult with the company’s chairman and chief executive,especially on matters relating to executive directors.
When there are vacancies on the board, any director may approach the appointments committee to propose candidates that it might consider suitable.
Complies X Partially complies Explain
50. The remuneration committee should operate independently and have the following functions inaddition to those assigned by law:
a) Propose to the board the standard conditions for senior executive contracts.
b) Monitor compliance with the remuneration policy set by the company.
c) Periodically review the remuneration policy for directors and senior executives, including share-based remuneration systems and their application, and ensure that their individualcompensation is proportionate to the amounts paid to other directors and senior executives inthe company.
d) Ensure that conflicts of interest do not undermine the independence of any external advisoryservices engaged by the committee.
e) Verify the information on director and senior executives’ remuneration contained in corporatedocuments, including the annual report on director remuneration.
Complies X Partially complies Explain
51. The remuneration committee should consult with the company’s chairman and chief executive,especially on matters relating to executive directors and senior executives.
Complies X Partially complies Explain
572 Banco Sabadell Annual report 2018
52. The terms of reference of supervision and control committees should be set out in the board ofdirectors regulations and aligned with those governing legally mandatory board committees asspecified in the preceding sets of recommendations. They should include at least the followingterms:
a) Committees should be formed exclusively by non-executive directors, with a majority ofindependents.
b) Committees should be chaired by an independent director.
c) The board should appoint the members of such committees on the basis of the directors'knowledge, skills and experience and each committee’s terms of reference; discuss theirproposals and reports; and provide report-backs on their activities and work at the first boardplenary following each committee meeting.
d) They may engage external advice, when they feel it necessary for the discharge of theirfunctions.
e) Meeting proceedings should be minuted and a copy made available to all board members.
Complies X Partially complies Explain Not applicable
53. The task of supervising compliance with corporate governance rules, internal codes of conductand corporate social responsibility policy should be assigned to one board committee or splitbetween several, such as the audit committee, the appointments committee, the corporate socialresponsibility committee, where one exists, or a dedicated committee established ad hoc by theboard under its powers of self-organisation, with at the least the following functions:
a) Monitor compliance with the company’s internal codes of conduct and corporategovernance rules.
b) Oversee the strategy for communication and relations with shareholders and investors,including small and medium-sized shareholders.
c) Periodically evaluate the effectiveness of the company’s corporate governance system, toconfirm that it is fulfilling its mission to promote the corporate interest and catering, asappropriate, to the legitimate interests of the other stakeholders.
d) Review the company’s corporate social responsibility policy, ensuring that it is geared tovalue creation.
e) Monitor corporate social responsibility strategy and practices and assess the degree ofcompliance.
f) Monitor and evaluate the company’s interaction with its stakeholders.
g) Evaluate all aspects of the non-financial risks the company is exposed to, includingoperational, technology, legal, social, environmental, political and reputational risks.
h) Coordinate non-financial and diversity reporting processes in accordance with applicablelegislation and international benchmarks.
Complies X Partially complies Explain
54. The corporate social responsibility policy should state the principles or commitments thecompany will voluntarily adhere to in its dealings with stakeholder groups, specifying at least:
a) The goals of its corporate social responsibility policy and the support instruments to bedeployed.
b) The corporate strategy with regard to sustainability, the environment and social issues.
c) Specific practices in matters relating to: shareholders, employees, clients, suppliers, socialwelfare issues, the environment, diversity, fiscal responsibility, respect for human rights and theprevention of illegal conduct.
d) The methods or systems for monitoring the results of the practices referred to above, andidentifying and managing related risks.
e) The mechanisms for supervising non-financial risk, ethics and business conduct.

573Statutory information
f) Channels for stakeholder communication, participation and dialogue.
g) Responsible communication practices that prevent the manipulation of information and protectthe company’s honour and integrity.
Complies X Partially complies Explain
55. The company should report on corporate social responsibility developments in its directors’report or in a separate document, using an internationally accepted methodology.
Complies X Partially complies Explain
56. Director remuneration should be sufficient to attract individuals with the desired profile andcompensate the commitment, abilities and responsibility that the post demands, but not so high asto compromise the independence of non-executive directors.
Complies X Explain
57. Variable remuneration linked to the company's and the director’s performance, the award ofshares, options or any other right to acquire shares or to be remunerated on the basis of shareprice movements, and membership of long-term savings schemes such as pension plans shouldbe confined to executive directors. The company may consider share-based remuneration for non-executive directors provided that they must retain such shares until the end of their mandate. Theabove condition will not apply to any shares that the director must dispose of to defray costs relatedto their acquisition.
Complies X Partially complies Explain
58. In the case of variable awards, remuneration policies should include limits and technicalsafeguards to ensure they reflect the professional performance of the beneficiaries and not simplythe general progress of the markets or the company’s industry, or circumstances of that kind. Inparticular, variable remuneration items should meet the following conditions:
a) Be subject to predetermined measurable performance criteria that factor the risk assumed toobtain a given outcome.
b) Promote the long-term sustainability of the company and include non-financial criteria that arerelevant for the company’s long-term value, such as compliance with its internal rules andprocedures and its risk control and management policies.
c) Be focused on achieving a balance between the delivery of short, medium and long-termobjectives, such that performance-related pay rewards ongoing achievement, maintained oversufficient time to appreciate its contribution to long-term value creation. This will ensure thatperformance measurement is not based solely on one-off, occasional or extraordinary events.
Complies X Partially complies Explain Not applicable
59. A major part of variable remuneration components should be deferred for long enough to ensurethat predetermined performance criteria have effectively been met.
Complies X Partially complies Explain Not applicable
60. Remuneration linked to company earnings should bear in mind any qualifications stated in theexternal auditor’s report that reduce their amount.
Complies X Partially complies Explain Not applicable
61. A major part of executive directors’ variable remuneration should be linked to the award ofshares or financial instruments whose value is linked to the share price.
Complies X Partially complies Explain Not applicable
574 Banco Sabadell Annual report 2018
62. Following the award of shares, share options or other rights on shares derived from theremuneration system, directors should not be allowed to transfer a number of shares equivalent totwice their annual fixed remuneration, or to exercise the stock options or other rights on shares, forat least three years after their award.
The above condition will not apply to any shares that the director must dispose of to defray costs related to their acquisition.
Complies X Partially complies Explain Not applicable
63. Contractual arrangements should include provisions that permit the company to reclaimvariable components of remuneration when payment was out of step with the director’s actualperformance or based on data subsequently found to be misstated.
Complies X Partially complies Explain Not applicable
64. Termination payments should not exceed a fixed amount equivalent to two years of the director’stotal annual remuneration and should not be paid until the company confirms that he or she hasmet the predetermined performance criteria.
Complies X Partially complies Explain Not applicable
H OTHER INFORMATION OF INTEREST
1. If there is any material issue relating to corporate governance at the company or any of thegroup companies that has not been disclosed in other sections of this report but whose disclosureis necessary to provide a more comprehensive and fully reasoned picture of the institution'sgovernance structure and practices, describe it briefly.
2. This section may be used to provide further information, clarifications or reservations in relationto the preceding sections of this report, which should be significant and not repetitive.
Specifically, indicate if the company is subject to corporate governance legislation of any jurisdiction other than Spain, and, if so, include the obligatory disclosures that differ from those required in this report.
3. The company may also indicate whether it has voluntarily adopted any other codes of ethicsor good practices, whether international, industry-wide or otherwise. Identify any such code andthe date on which it was adopted. In particular, disclose whether the company has adopted theCode of Good Tax Practices of 20 July 2010.
A.2
The information provided is based on communications sent by shareholders to the CNMV or directly to the bank.
B.6
In accordance with article 38 of the Articles of Association of Banco de Sabadell, S.A., in order to attend and vote at a General Meeting, shareholders must accredit that they possess or hold proxies for one thousand (1,000) shares. Shareholders holding less than that minimum amount of shares may group together to constitute the minimum and grant proxy to any one of them, or to another shareholder that is entitled to attend the General Meeting in accordance with the provisions of the Articles of Association.
C.1.2
Mr. Miquel Roca i Junyent was appointed as Secretary of the Board of Directors (not a director) on 13 April 2000.

575Statutory information
C.1.13
The amount of pension rights vested in directors includes the amounts accumulated since 2000 and, therefore, does not refer only to the amount contributed in the year.
C.1.14
In application of the standard, this section includes the 8 members of senior management, plus the Internal Auditor. There were changes in senior management in 2018: Mr. José Nieto de la Cierva was appointed as Deputy General Manager.
The total remuneration of senior management does not include the combined contributions to pension plans, structured through insurance policies, in the year 2018, which amounted to 2,124 thousand euro.
C.1.16(Continuation of disclosures in section C.1.16)
Removal
Directors must step down when their term ends if they are not re-appointed, or when the General Meeting of Shareholders or the Board of Directors so decides using the powers conferred on them by law or the Articles of Association. The Appointments Committee is empowered to make proposals for the removal of independent directors by the General Meeting of Shareholders, and to advise on proposals to remove directors in other categories. The Board does not currently have any powers in this respect under the law or the Articles of Association. The General Meeting of Shareholders may remove directors at any time, as provided in article 50 of the Articles of Association.
Restrictions
The following may not hold office as members of the Board of Directors:
a) Minors.b) Persons disqualified by law, undischarged bankrupts or insolvents, those under convictions involving
disqualification from holding public office, and those convicted of serious breaches of the Spanish CorporationsAct or Company regulations, or who are prevented from engaging in trade by reason of their office.
c) Government officials whose duties are related to, or have a bearing on, the business of the Bank.d) Those in default with respect to any obligation to the Bank.e) Persons in any of the situations of incompatibility or limitation on holding office as provided by law.
C.2.1
In addition to the information detailed in this point, the following persons form part of the Board sub-committees: • Executive Committee: Ms. María José García Beato, as Secretary (non-member).• Audit and Control Committee: Mr. Miquel Roca i Junyent, as Secretary (not a director).• Appointments Committee: Mr. Miquel Roca i Junyent, as Secretary (not a director).• Remuneration Committee: Ms. María José García Beato, as Secretary (non-member).• Risk Committee: Ms. María José García Beato, as Secretary (non-member).
D. Related-party and intragroup transactions
During the year, a transaction relating to Inversiones Hemisferio, S.L. began to be treated as a related-party transaction but it was ultimately not classified as such since it was approved after the director related to that company had resigned from the Board.
E.2(Continuation of disclosures in section E.2):
Additionally, the following committees have been created and have risk control and management functions within the Risk Appetite Framework:
o Technical Risk Committee, which holds meetings on a monthly basis and has the following functions: (i)supporting the Risk Committee in fulfilling its functions: determining, proposing, reviewing and tracking the RiskAppetite Framework; supervising the institution's risk on an overall level; tracking the tolerance thresholds of first-

576 Banco Sabadell Annual report 2018
and second-tier metrics, and adaptation plans; (ii) approving second-tier limits (including liquidity, interest rate and treasury metrics); (iii) approving minor changes in models, criteria and procedures as well as monitoring the use of models and autonomies in approving transactions; (iv) approving policy frameworks and debating asset allocation strategies (public sector, industry level, ...); (v) tracking and managing delinquency; (vi) performing ad hoc analysis of specific portfolio-related issues in order to integrate them into the management approach; and (vii) drafting and proposing policies and criteria for proper risk management.
o Credit Transactions Committee, which holds meetings on a weekly basis and has the following functions: (i)approval of credit transactions, including transactions/limits for countries and banks, and of specific criteria inline with the policies under the established delegation of powers; (ii) establishment of autonomies in accordancewith the established delegation of powers, monitoring their use, and referring proposals for changes to theExecutive Committee; and (iii) monthly reporting to the Executive Committee of the transactions approved andperformed in the previous month.
o Asset and Capital Transactions Committee (COAC), which holds meetings every two weeks and has the followingfunctions: (i) approval of asset management transactions in accordance with the established delegation ofpowers; (ii) monthly reporting to the Executive Committee of the transactions approved and performed in theprevious month.
o Real Estate Development Committee, which has the following functions: (i) setting action criteria and strategy inrelation to the Group’s real estate portfolio (analysis of trends in real estate exposure and real estate actionpolicies); (ii) taking the decisions that must be adopted by real estate subsidiaries (holding companies andservicer): proposal of investment transactions in real estate developments and land development; and (iii)monitoring the performance of Solvia Real Estate.
o Assets and Liabilities Committee (ALCO): this body defines criteria for the appropriate management of thestructural risk assumed in the Group’s balance sheet in its commercial activity and of market risk. It supervisesinterest rate, exchange rate, equity and liquidity risk and suggests commercial, market or hedging alternativesintended to achieve business targets based on the market and balance sheet situation.
o Operational Risk Committee, which meets every two months and defines the strategic guidelines and frameworkfor operational risk management and establishes operational priorities on the basis of the assessment of the riskexposure of the various business and corporate departments. Reputational risk is managed by the OperationalRisk Committee.
o Internal Control Body: Oversight and monitoring body which oversees compliance with the law on the preventionof money laundering and terrorist financing and the law to block terrorist financing; it comprises representativesof all the group companies that are bound by the legislation in this area, as well as areas of particular risk for theBank. The Compliance Department acts as secretary of this Body.
o Corporate Ethics Committee: Oversight and monitoring body which oversees the group’s compliance with thecode of conduct with regard to the securities market and with the general code of conduct.
There are other committees for specific risk types, notably the Models Committee, the Provisions Committee and the Liquidity Committee.
E.6(Continuation of disclosures in section E.6):
With regard to credit risk, the bank has implemented advanced measurement models based on internal data, tailored to particular counterparty segments and categories (businesses, retailers, individuals, mortgages and consumer credit, property developers, project finance, structured finance, financial institutions and countries), thus allowing transactions to be differentiated on the basis of risk and assessments to be made of the probability of default or the degree of severity in the event of default actually occurring.
The bank has a tax risk management policy whose objective is to ensure compliance with tax obligations while guaranteeing an appropriate return for our shareholders. The Tax department establishes criteria and advises on the taxation applicable to the departments responsible for the calculating and paying taxes. The departments are responsible for establishing procedures and controls to ensure that taxes are properly calculated and paid, which are subject to review by the Internal Audit department.
More information regarding the systems for controlling the risks to which the group is exposed can be found in the Annual Report, available on the corporate website: www.grupobancosabadell.com – Shareholder and Investor Information – Financial Information – Annual Reports.

577Statutory information
This annual corporate governance report was approved by the company's Board of Directors on 31 January 2019.
Indicate whether any board members voted against or abstained with respect to the approval of this report.
Yes No X

578 Banco Sabadell Annual report 2018

579Statutory information

580 Banco Sabadell Annual report 2018

581Statutory information
PricewaterhouseCoopers Auditores, S.L., C/ Ausó y Monzó, 16, 03006 Alicante, España Tel.: +34 965 980 350 / +34 902 021 111, Fax: +34 965 208 933, www.pwc.es
R. M. Madrid, hoja 87.250-1, folio 75, tomo 9.267, libro 8.054, sección 3ªInscrita en el R.O.A.C. con el número S0242 - CIF: B-79 031290
This version of our report is a free translation of the original, which was prepared in Spanish. All possible care has been taken to ensure that the translation is an accurate representation of the original. However, in all matters of interpretation of information, views or opinions, the original language version of our report
takes precedence over this translation.
AUDITOR´S REPORT ON “INFORMATION REGARDING THE INTERNAL CONTROL SYSTEM OVER FINANCIAL REPORTING (ICSFR)” OF BANCO DE SABADELL, S.A.
FOR THE 2018 FINANCIAL YEAR
To the Board of Directors of Banco de Sabadell, S.A.,
In accordance with the request of the Board of Directors of Banco de Sabadell, S.A. and its subsidiaries ("the Group") and our engagement letter dated 14 December 2018, we have applied certain procedures in respect of the attached "Information regarding the Internal Control System over Financial Reporting” ("ICSFR"), included in Annual Corporate Governance Report in section F for listed companies of Group Banco de Sabadell for the 2018 financial year, which includes a summary of the Group's internal control procedures relating to its annual financial information.
The Board of Directors is responsible for adopting the necessary measures to reasonably ensure the implementation, maintenance and supervision of an appropriate internal control system, and for developing improvements to that system and preparing and establishing the content of the accompanying Information regarding the ICSFR.
In this regard, it should be borne in mind that, regardless of the quality of the design and operating efficiency of the internal control system used by the Group in relation to its annual financial information, only a reasonable, but not absolute, degree of assurance may be obtained in relation to the objectives it seeks to achieve, due to the limitations inherent in any internal control system.
In the course of our audit work on the consolidated annual accounts and in accordance with Spanish Auditing Standards, the sole purpose of our evaluation of the Group's internal control system is to enable us to establish the scope, nature and timing of our audit procedures in respect of the Group's annual accounts. Accordingly, our internal control evaluation, performed for the purposes of our audit, is not sufficient in scope to enable us to issue a specific opinion on the effectiveness of such internal control over the regulated annual financial information.
For the purposes of the present report, we have exclusively applied the specific procedures described below, as indicated in the “Guidelines concerning the auditor's Report on the Information regarding the Internal Control System over Financial Reporting for listed entities” published by the National Securities Market Commission on its web site, which sets out the work to be performed, the scope of such work and the content of this report. In view of the fact that, in any event, the scope of the work resulting from these procedures is reduced and substantially less than the scope of an audit or review of the internal control system, we do not express an opinion on the effectiveness thereof, its design or operational efficiency, in relation to the Group's annual financial information for the 2018 financial year described in the accompanying Information regarding the ICSFR. Had we applied additional procedures to those determined by the aforementioned Guidelines, or had we performed an audit or review of the internal control system in relation to the regulated annual financial information, other matters could have come to light in respect of which you would have been informed.

582 Banco Sabadell Annual report 2018
In addition, provided that this special work neither constitutes an account audit it is not even submitted to the Law of Account audit, we do not express an opinion of audit in the terms foreseen in the mentioned regulation.
The procedures applied were as follows:
1. Reading and understanding the information prepared by the Group in relation to theICSFR – as disclosed in the Directors' Report – and the evaluation of whether suchinformation includes all the information required as per the minimum content set out inSection F regarding the description of the ICSFR, in the model of the Annual CorporateGovernance Report, as established in Circular nº 7/2015 of the National SecuritiesMarket Commission dated December 22, 2015 and in Circular nº 2/2018 of the NationalSecurities Market Commission dated June 12, 2018.
2. Making enquiries of personnel in charge of preparing the information mentioned in point1 above in order to: (i) obtain an understanding of the preparation process; (ii) obtaininformation that enables us to assess whether the terminology used is in line with theframework of reference; (iii) obtain information as to whether the control proceduresdescribed have been implemented and are functioning in the Group.
3. Review of supporting documentation explaining the information described in point 1above and which mainly comprises the information made directly available to the personsresponsible for preparing the information on the ICSFR. Such documentation includesreports prepared by the internal audit function, senior management and other internaland external specialists in support of the functions of the audit committee.
4. Comparison of the information described in point 1 above with our knowledge of theGroup´s ICSFR, obtained by means of the application of the procedures performed withinthe framework of the audit engagement on the consolidated annual accounts.
5. Reading the minutes of meetings of the board of directors, audit committee and othercommittees of the Group, for the purposes of evaluating the consistency between thematters dealt with therein in relation to the ICSFR and the information described in point1 above.
6. Obtaining a representation letter concerning the work performed, duly signed by thepersons responsible for the preparation and drafting of the information mentioned inpoint 1 above.
As a result of the procedures applied in relation to the Information regarding the ICSFR, no inconsistencies or incidents have been identified which could affect such information.
This report has been prepared exclusively within the framework of the requirements of article 540 of the revised Spanish Companies Act and Circular nº 5/2013 of the National Securities Market Commission, dated June 12, 2013, as modified by Circular nº 7/2015 of the National Securities Market Commission, dated December 22, 2015 and by Circular nº 2/2018 of the National Securities Market Commission dated June 12, 2018, for the purposes of describing the ICSFR in Annual Corporate Governance Reports.
PricewaterhouseCoopers Auditores, S.L.
Original in Spanish signed by Raúl Ara Navarro
31 January, 2019