Embed Size (px)
Citation preview
Stealth Compensation: Do CEOs Increase Their Pay
by Influencing Dividend Policy?
Kristina Minnick* Department of Finance
Bentley University 781-891-2941
Leonard Rosenthal Department of Finance
Bentley University 781-891-2516
*Corresponding Author Bentley University, 175 Forest St., Waltham, MA 02452 USA
© 2013 by Kristina Minnick and Leonard Rosenthal. All rights reserved.
We would like to thank the participants in the Bentley University Finance Department and the University of Stirling Accounting &Finance Department research seminars, at the 2011 meetings of the Midwest Finance Association and Financial Management Association and the 2012 European Conference of the Financial Management Association for a number of helpful comments. We would especially like to thank Nalinasksha Bhattacharyya, Alan Goodacre, Marcia Millon Cornett, Abe de Jong, Jayant Kale, Katherine Farrell, Melissa Frye, Jeff Netter, Ajay Patel, Kartik Raman, Chip Ryan, Hassan Tehranian, Mathijs van Dijk, Yulia Veld-Merloulova, and an anonymous referee for additional suggestions and insights.
1
Stealth Compensation: Do CEOs Increase Their Pay
by Influencing Dividend Policy?
Companies can increase executive compensation by allowing dividends to be paid on
unvested restricted stocks grants, also known as stealth compensation. Examining all S&P
500 firms over the period 2003-2007, we find that more than half of the dividend paying
firms allow this practice. We look at whether this form of compensation reduces agency
costs or decreases value for shareholders. We find that CEOs’ stealth compensation amounts
to an average $180,000 in additional income, which increases the CEOs’ cash compensation
and total compensation by 9% and 2% respectively. Firms engaging in stealth compensation
have higher dividend payout ratios than those not allowing stealth compensation. For all
firms using stealth compensation, there is a reduction in average ROA and Tobin’s Q over
the long run. However, stealth compensation companies with potential agency issues see a
meaningful improvement in their long run performance. For weakly governed companies,
stealth compensation may act as a bonding mechanism which may serve to reduce agency
costs and therefore increase shareholder value.
JEL classification: M41, M52, J33
Keywords: Executive Compensation; Payout Policy; Firm Performance; Corporate
Governance
2
Stealth Compensation: Do CEOs/Directors Increase Their Pay
by Influencing Dividend Policy?
1. Introduction
With the increased attention on executive compensation, particularly cash compensation,
directors have created alternative ways to enhance a CEO’s compensation (and their own)
without attracting shareholder attention. One such method is allowing management to receive
additional income from dividends on unvested restricted stock grants (RSGs). RiskMetrics
dubbed this type of compensation “stealth compensation” since companies are not required to
clearly report this additional dividend component as part of an executive’s compensation
package.1 It is not surprising that such hidden compensation exists at many firms, given
shareholder pressure to reduce or change how executives are compensated. Chidabaram and
Prabhala (2009) find that firms often engage in behavior to offset restrictions on compensation
by using substitutes that can increase costs to shareholders. In this paper, we examine the degree
to which firms engage in stealth dividend compensation, focusing on CEOs in particular,
whether it is a meaningful contributor to overall compensation packages, and if it creates agency
problems.
Stealth compensation could influence decisions involving dividend policy by creating
incentives for companies to increase their dividend payout, which could either reduce or
exacerbate agency issues. Shareholders of firms with cash flows exceeding their profitable
investment opportunities want excess free cash flow paid out as dividends to prevent wasteful
spending. Directors may use stealth compensation as a tool to motivate CEOs to push for
increased payouts, which ultimately may benefit shareholders. Shareholders would get a higher
current cash return, although at the possible cost of foregoing profitable projects. Additionally,
tax-exempt institutional investors would be attracted to stocks with high dividend payouts since
they are taxed at a lower rate than individual investors (Allen, Bernardo, and Welch, 2000). The
resulting increase in institutional ownership may lead to more active monitoring of the firm,
which could reduce agency issues.
Alternatively, agency issues could be magnified if the CEO, working with the board, uses
stealth compensation to maximize their own as well as the directors’ compensation.
3
Additionally, if the use of stealth compensation motivates managers to pay out cash to
shareholders rather than invest in potentially profitable investments, the overall value of the firm
can be negatively impacted. In particular, companies with risk averse managers or managers
who want to lead “the quiet life” might prefer stealth compensation (Bertrand and Mullainathan,
2003). This too may decrease value for shareholders.
We focus on dividend-paying S&P 500 firms that allow dividends to be paid on unvested
RSGs from 2003 through 2007 and compare them to dividend-paying S&P 500 firms that do not
allow stealth compensation. During this time period, tax preferences between dividends and
capital gains are minimal, which provides a unique opportunity to examine whether stealth
compensation affects dividend policy. We find that CEOs make an extra $180,200 a year on
average from dividends on unvested RSGs. This amounts to 9% of their total cash compensation
and 2% of their total compensation, both significantly greater than for CEOs of firms without
dividend compensation could have received if their firms allowed these payments. In order to
better understand the factors affecting the use and impact of stealth compensation, we
incorporate different measures of governance and institutional ownership into our analysis. We
find that companies that use stealth compensation have greater board independence, higher
institutional ownership, more entrenchment provisions, and lower governance transparency than
companies that do not follow this policy.
Our results are consistent with stealth compensation influencing payout decisions. Stealth
compensation firms have significantly higher dividend payout ratios and spend significantly less
on repurchases than firms that do not engage in this practice. We find that the more RSGs a
company has, the stronger the effect of stealth compensation. Interestingly, we see significantly
higher dividend and lower repurchase payouts in firms that have high institutional ownership and
offer stealth compensation. These results suggest that stealth compensation may act as a bonding
mechanism to ensure that institutional owners get higher dividends, and that entrenched
managers pay out excess free cash. We find a similar result for firms with poor governance and
stealth compensation. We incorporate several methods to deal with endogeneity and find our
overall results are similar.
1Risk Metrics used this term in a 2008 report on dividend compensation and we adopt it in this paper. Under SEC reporting rules, this income is not considered compensation, so firms are not required to include the exact dollar amount executives receives in their proxy statement.
4
Finally, we look at the operating performance of firms engaging in stealth compensation
and those which do not. Firms using stealth compensation experience significantly worse
operating performance, both in terms of ROA and Tobin’s Q, than firms not engaging in this
practice over the subsequent three-year period Interestingly, performance is significantly better
for poorly governed firms that use stealth compensation compared to firms with poor governance
but no stealth compensation. These results provide support for the possibility that stealth
compensation is used by firms with poor governance to reduce agency issues.
Our paper proceeds as follows: section 2 reviews related literature and our motivation,
section 3 describes the data, section 4 discusses our results, and section 5 presents our summary
and conclusions.
2. Literature and motivation
2.1. Literature
There is a vast literature on both dividend policy and executive compensation. Recent
evidence suggests that dividend payout ratios and the number of dividend-paying firms have
declined (Fama and French, 2001), and that share repurchases have become a preferred method
of payout for many firms (Grullon and Michaely, 2002). It has been suggested that one reason
that dividends have become less popular is the increased use of company stock options as a form
of compensation. These options are not protected against the decline in stock price when its goes
ex-dividend. Consequently, their expected value is a decreasing function of dividends payments.
Lambert, Lanen, and Larker (1989), Jolls (1998), Fenn and Liang (2001), and Kahle
(2002) find that the firms offering managers more stock options as compensation tend to pay
dividends to a lesser extent. Chetty and Saez (2005) and Brown, Liang, and Weisbenner (2007)
provide evidence of a negative relationship between executive stock options and the likelihood
of a dividend increase after the 2003 reduction of taxes on dividends. These papers all focus on
the role of options in setting dividend policy. We build on this literature by examining how
another form of compensation, namely stealth compensation, affects dividend policy.
Aboody and Kasznick (2008) assess the underlying rationale for shareholders to design
incentive contracts that induce managers to make payout choices that increase the value of their
stock-based compensation. They find that the 2003 reduction in taxes on dividends resulted in
greater alignment of the desires of individual (tax-paying) shareholders with those of
management by inducing the latter to switch to RSGs from options. Blouin, Raedy, and

5
Shakelford (2011) jointly test the impact of the 2003 tax reduction on individual investors and
management using 2001-2005 data and find that firms with the largest individual ownership
increased dividends relative to share repurchases starting in 2003. Moreover, they argue that
their results are consistent with officers and directors increasing their holdings in order to take
advantage of the reduced taxes on dividends.
Zhang (2013) also looks at the effects of dividend compensation on payout for S&P 500
stocks using the period from 2000 through 2009. She finds that dividend increases are more
likely after 2003 for firms that pay stealth compensation. We also examine stealth compensation
during this period, but focus on the role of governance and the role played by institutional
ownership in determining stealth compensation, as well as the impact of dividend compensation
on future profitability.
Our paper builds on the existing literature in three ways. First, we control for the choice
between stock and option compensation as well as for corporate governance while examining
which firms use dividend compensation, and how dividend compensation may affect a
company’s payout policy. Second. we add to the existing literature by examining whether
allowing executives to receive dividends on unvested RSGs reduces agency issues by providing
a bonding mechanism to motivate entrenched CEOs to pay out dividends. Finally, we examine
whether this form of stealth compensation may ultimately hurt or help shareholders.
2.2. Motivation
Agency issues in firms result from differing objectives between shareholders and the
executive officers of the company. The former want their wealth to be maximized, while the
latter want to maximize their own interests. Jensen (1986) identifies free cash flow as one source
of agency problems. Shareholders want excess cash flow to be used for their benefit through the
payment of dividends, while officers may view this as a reduction in resources they control. The
role of the board is to minimize this conflict through the firm’s compensation plan with
management, including stock based compensation. Thus, the quality of board governance plays
an important role in executive compensation. Since dividends on unvested restricted stock are a
form of compensation, its use can mitigate or exacerbate the agency problem created by free cash
flow.
In the compensation literature there are two views as to how compensation agreements
are reached: optimal contracting or managerial rent extraction. Under optimal contracting theory,
6
directors use executive compensation to help reduce the agency issues between executives and
shareholders, thereby maximizing shareholder wealth. Well-functioning markets for executive
labor should produce a set of contracts that optimally minimizes the expected cost of managers’
self-interest, given available information (Fama and Jensen (1983a, 1983b)). In accordance with
the incentive alignment view, Core and Guay (1999) show that firms award equity grants in a
manner that is consistent with agency and contracting theories.
Optimal contracting theory suggests that stealth compensation may reduce agency issues
by motivating managers to distribute excess cash flow to shareholders. By inducing a larger
payout, stealth compensation may be a mechanism to incentivize managers to attract institutional
investors, which may not be otherwise desired by managers who prefer not to be monitored.
Allen, Bernardo, and Welch (2000) show that firms that pay higher dividends attract more
institutional ownership, which should result in improved monitoring of the firm.
If managers engage in rent extraction, stock based compensation may have the opposite
effect. Goergen and Rennenboog (2011) review research on optimal contracts versus managerial
rent extraction and find more empirical support for the latter. For example, Denis, Hanouna, and
Sarin (2006) show that incentive compensation has a dark side that results in increased risk
taking, resulting in CEOs maximizing their own wealth, sometimes to the detriment of
shareholders. Bebchuk and Fried (2004) suggest that certain executive compensation contracts
can result in rent extraction from shareholders. Stealth compensation may be one form of rent
extraction by motivating managers to obtain additional benefits for themselves by increasing
dividend payouts instead of engaging in more value enhancing activities. Larger dividends
payouts will be detrimental to shareholders if these payments are not sustainable, and if
potentially positive, albeit risky, NPV projects are turned down instead of being funded. Finally,
paying dividends on restricted stock would be preferable to managers if they are entrenched (due
to weak governance), or risk averse because they are desirous of “the quiet life” (see Bertrand
and Mallainaithan (2003). It is worth noting that equity compensation (by itself) was developed
to minimize this kind of behavior. Based on this, we identify three specific research questions
below to try to determine whether stealth compensation alleviates or exacerbates agency issues
2.2.1 Individual Research Questions
The board of directors serves as the primary internal monitoring mechanism to protect the
interests of shareholders by aligning management interests with those of the shareholders. The
7
effectiveness of the board’s efforts can have a considerable effect on shareholder value,
depending on the quality of governance. As a result, studies have looked at factors affecting
governance quality. Among these are board size, share ownership structure, entrenchment
mechanisms and corporate social responsibility/transparency. All of these can bear on the use of
stealth compensation as an alignment mechanism.
With respect to board size, there are conflicting views as to how board composition
affects monitoring and thus performance. Earlier governance papers show that board
composition (the size of the board and percentage of insiders on the board) is related to the
degree of agency problems (Core, Holthausen, and Larcker (1999), Hermalin and Weisbach,
(1991), Yermack (1996)). The traditional literature implies that firms with small boards and a
higher percentage of outsiders will be more concerned about shareholder welfare and firm
performance. However, there is emerging literature which suggests that large boards may not
always be bad. Cheng (2008) finds that it takes more compromises for a larger board to reach
consensus, so decisions of larger boards are less extreme, leading to less variable corporate
performance. Larger boards also bring greater opportunity for more links to the external
environment, especially in unstable economic periods, and hence access to resources that may
improve corporate performance and reduce uncertainty (Korac-Kakabadse, Kakabadse, and
Kouzmin (2001), Platt and Platt (2012) find that larger boards are best positioned to help a firm
remain out of bankruptcy. Companies with more effective board monitoring based on board size
may offer stealth compensation to better align managers and shareholders. Conversely, weak
boards may allow the payment of this extra compensation which increases managers own private
benefits.
Research has shown that ownership structure, both institutional and insider, also plays a
role in the monitoring and governance of a firm. Institutional investors have a much stronger
incentive to monitor companies that they own than individual investors because of their larger
stakes in those companies. Hawley and Williams (2000) provide evidence that the institutional
investors’ fiduciary duty facilitates their attraction to companies with good governance
mechanisms. Bushee and Noe (2000) suggest that institutional investors prefer firms with better
disclosure rankings to reduce monitoring costs. Chung and Zhang (2011) find that institutional
investors will invest more in companies with fewer agency issues. Institutional investors have
problems with firms where economic and voting rights of insiders are not aligned. For example,
8
Giannetti and Simonov (2006) suggest that institutions are reluctant to hold shares of companies
where insiders have a high ratio of control to cash flow rights. Li, Ortiz-Molina, and Zhao (2008)
show that institutions avoid investing in companies with dual-class shares. This literature
suggests that when a discrepancy between the principal shareholder’s cash flow and control
rights exists, the outsiders may view their interests as not being aligned with those of insiders. By
encouraging management to increase dividend payouts, stealth compensation may be a tool used
by the board to try to align insiders’ and outsiders’ incentives.
A number of recent papers confirm the governance role of entrenchment and its effect on
firm performance/shareholder value. For example, Gompers, Ishii, and Metrick (2003) and
Bebchuk, Cohen, and Ferrell (2009) show that firms with relatively more anti-takeover
provisions or weaker shareholder rights have lower valuations. Firms with fewer entrenchment
mechanisms may view stealth compensation as a way to reduce the agency costs of excess free
cash. Conversely, firms with more anti-takeover measures may not care about shareholder
concerns from using the cash flow to pay stealth dividends.
In addition, there is evidence that corporate social responsibility (CSR) is connected to
the quality of corporate governance. Jo and Harjoto (2011) suggest that CSR is an extension of
firms’ efforts to foster effective corporate governance by promoting accountability and
transparency. This results in a positive link between CSR, firm governance and firm
performance. Firms that are more socially responsibly are likely to view stealth compensation as
reducing transparency and the quality of governance. On the other hand, the use of stealth
compensation would be consistent with firms with a lower commitment to CSR and
transparency. The various factors associated with governance quality discussed above lead to our
first research hypothesis:
Q1: Is the use of stealth compensation related to the quality of governance?
As noted earlier, under Jensen’s free cash flow argument (1986), increasing the dividend
or repurchase payout ratios should help reduce agency issues by making it less likely that excess
cash flow will be used on value-destroying projects. If stealth compensation exacerbates agency
issues, we would expect that the use of stealth compensation would be associated with an
increase in dividend payouts and a decrease in repurchase payouts. The former immediately
benefits managers through increased compensation, while the latter may not provide immediate
benefits. On the other hand, for firms with value reducing agency issues, stealth compensation

9
may push managers to favor larger dividend payouts that they otherwise would not want. From
the shareholders’ perspective, increasing dividends (which are difficult to rescind) compared to
repurchase programs, can be a better way to align their interests with those of management.
More formally stated:
Q2: Is the use of stealth compensation positively related to the dividend payout decision
and negatively related to the repurchase decision?
From an agency theory perspective, incorporating incentives such as restricted stock as
well as options into managerial compensation should have the desired effect of motivating
managers to maximize shareholder wealth (Murphy (1993)). Following this line of reasoning,
incentive compensation is driven by economic determinants that are aligned with shareholder
interests and not by poor governance that allows rent-seeking managerial behavior. If this is the
case, paying dividends on RSGs as a form of compensation should lead to a dividend payout
decision that maximizes shareholder wealth.
Q3: Does stealth compensation enhance shareholder wealth? 3. Data
In the annual proxy statement, compensation for the five highest-paid executives is
broken out by categories: cash, bonus/short-term incentive compensation, and long-term
incentive compensation. The latter includes stock awards, stock options, and other compensation.
Both stock awards and options are used to incentivize management to maximize long-term
shareholder value (at least in theory). From 1994 to 2003, boards of directors tended to use stock
options as the principal incentive for management. However, following excessive risk taking
during the late 1990s and the enactment of the Sarbanes-Oxley Act (SOX) in July 2002,
restricted stock grants have increased considerably. Restricted stock comes in two types:
outright grants and performance-related grants. Outright grants vest after a number of years,
while the performance-related grants require certain financial metrics to be met in order to vest.
Restricted stock is not transferable (i.e., saleable) until it vests.
Based on the SEC disclosure rules, public companies can hide information about the
payment of dividends on restricted stock in the fine print of the proxy statement. Instruction 4 to
Item 402(b)(2)(iii)(C) of Regulation S-K (1992) provides that when executives receive dividends
on restricted stock, the firm’s Summary Compensation Table will include a footnote to the

10
Restricted Stock Award column describing when the dividends are paid on restricted shares.2
Moreover, if they determine that this information is not material, they do not have to include it in
the narrative discussion accompanying the compensation tables. In a September 30, 2008 report,
RiskMetrics found that 32% of S&P 500 firms paid dividends on unvested restricted stock. They
noted that some companies interpret the disclosure rules as permitting them to avoid disclosing
the amount of dividends paid on restricted stock as part of executive compensation. As a result,
many firms do not report this compensation outright, although in footnotes they report the
number of RSGs, and how dividends (if any) are treated on those shares. The treatment of
dividends varies, even across dividend-paying firms. Some firms allow dividends to be paid as
soon as they are awarded, while others allow dividends to accumulate (in either cash or
additional restricted shares) and be paid when vesting occurs. Allowing dividends on restricted
stock becomes another form of compensation.
We identify a sample of S&P 500 companies over 2003 to 2007 that pay dividends on
unvested restricted stock. We use this time period for three reasons. First, there is no investor
tax preference between dividends and capital gains from stock repurchases. The enactment of the
Jobs and Growth Tax Relief Reconciliation Act of 2003 (JGTRRA) cut the personal tax rate on
dividend income from 38.6% to 15%, and reduced the top rate on long-term capital gains from
20% to 15%. The reduction of dividend income was retroactive to January 2003, while the
reduction in the capital gains tax applies to transactions after May 5, 2003. 3 Second, we end our
analysis in 2007 as a structural change in the economy occurs after that year. The intensification
of the financial crisis led some firms to cut dividends in response, so we don’t want the impact of
the crisis to affect our results. For those S&P 500 companies that pay dividends on unvested,
nonperformance-restricted stock, we determine the proportion of cash and bonus compensation,
and total compensation that these dividend payments represent. Since there is no threshold of
firm performance that has to be met, dividends on these RSGs are automatic. Given the weak
2See Securities and Exchange Commission, “Executive Computation Disclosure,” 57 FR 48126, October 21, 1992, and Securities and Exchange Commission, “Executive Compensation and Related Person Disclosure,”71 FR 53158, September 8, 2006. 3Under U.S. Tax Code, Section 83(b), the person granted restricted stock can elect to pay the tax on the grant up front (within 30 days of the grant). The advantage in doing this is that dividends are treated as dividend income (versus ordinary income without 83(b)) and any gain on the stock is taxed as a long-term capital gain (assuming the stock is held for more than a year and is sold after vesting). Since most firms do not outright report whether 83(b) is chosen, we assume that all the CEOs in our sample take the 83(b) election, which provides an outside estimate of the impact of stealth compensation.
11
reporting requirements, these dividends represent one form of stealth compensation. We also
examine this dividend compensation in relation to the quality of governance measures, the
degree of institutional ownership, and operating and stock market performance.
Using proxy statements, we hand collect information about restricted stock grants in
order to determine the following:
a. Are dividends paid on unvested RSGs for CEOs? (If a company has more than one CEO
in a particular year, we use the CEO who was in office for the greatest portion of the
year.)
b. Are there voting rights on unvested RSGs for CEOs?
c. Do the dividends accumulate on RSGs, and are they paid out when the RSG vests?
d. If the dividends accumulate, is interest paid on this amount? Does the company issue
more RSGs in lieu of cash?
e. Is the treatment of dividends for directors’ RSGs the same as for CEOs’?
f. Is the treatment of dividends for other named executives officers’ (NEOs’) RSGs the
same as for CEOs’?
g. How many years does it take for RSGs to vest?
We are able to collect this information for 482 S&P 500 companies. The number of
dividend-paying companies varies by year. In the few cases where there is ambiguity about
whether dividends are paid on unvested RSGs, we eliminate those observations from the sample.
If a firm does not pay dividends in any particular year, it is dropped from the sample for that
year.4 We refer to firms in our sample that pay stealth compensation to the CEO as stealth firms,
and to those firms that do not as non-stealth firms. Overall, our final sample has 1,834 firm
years for which we have full data.5
4. Results
4.1 Univariate estimations
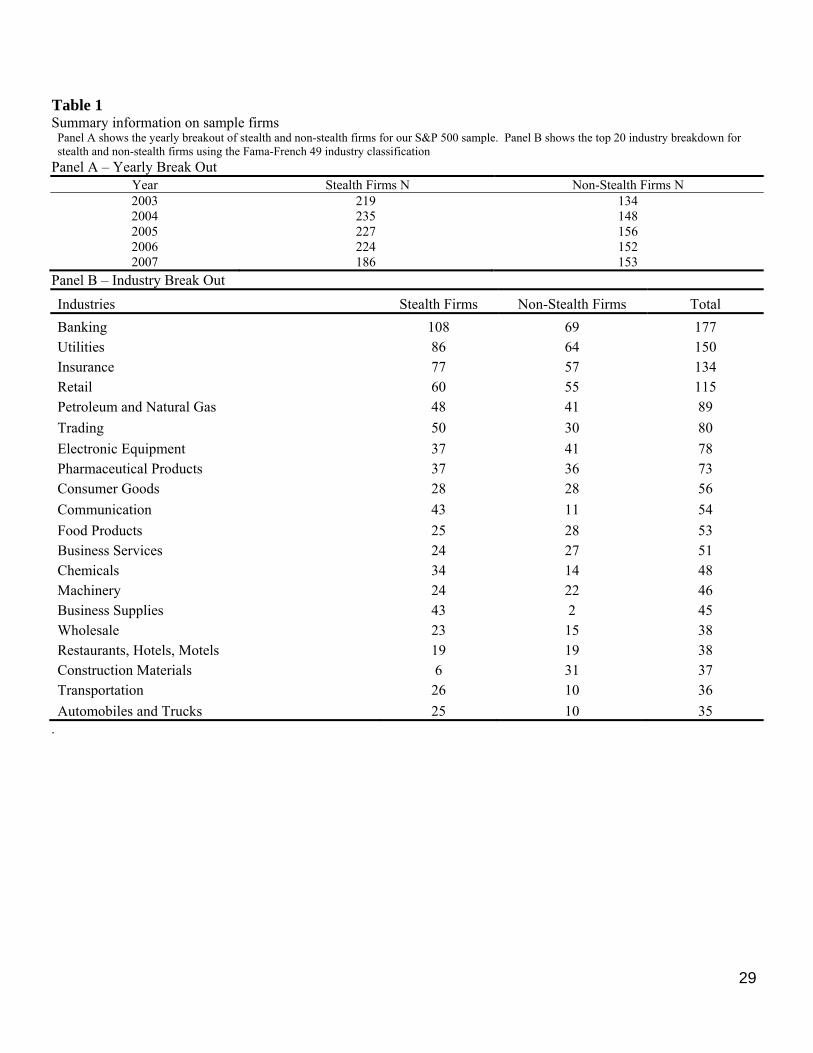
Table 1, Panel A shows the breakout of stealth and non-stealth firms by year. In 2003,
62% of the sample firms paid dividends on unvested RSGs, falling to 55% by 2007. Table 1,
Panel B shows the top 20 industry classifications for our sample using the Fama-French 49
4Our results remain qualitatively the same if we include all firms, including those that do not pay dividends. 5651 of the firm year observations do not have any CEO RSG holdings. Of the 651 observations, 444 are non- stealth firms.

12
industry classification. Our industry breakdown is similar to the general composition of the S&P
500 - the top industries in our sample are banking, utilities, insurance, energy, retail,
manufacturing and technology. Our results remain qualitatively unchanged if we exclude
financial service and utilities. Table 2 provides a summary of data that was hand collected from
proxy statements. Out of 1,091 firm years, 91% of the firms grant voting rights on RSGs, while
for the 743 non-stealth firms, 81% grant voting rights. Additionally, 12% of the stealth
companies allow dividends to be accumulated, which are then paid after vesting and 10% get
interest on the accumulated dividends. Note that 21% of the stealth firm CEOs receive more
RSGs instead of a cash dividend. We find that 80% of directors and 98% of other NEOs receive
the same treatment as the stealth firm CEOs with respect to dividends on RSGs. Finally, the
average time for restricted stock grants to vest is 4.76 years for stealth firms compared to 4.02
years for non-stealth firms; the typical vesting period is three years.6
Next, we examine payout variables, including DPS (dividends per share), PAYOUT (the
total amount of dividends paid divided by net income), DIV/MV and DIV/ASSETS (total
dividends paid divided by market value of equity and by book value of total assets, respectively),
and REPAMT (dollars spent on repurchases minus any decrease in the par value of preferred
stock, divided by the market value of equity). All measures are taken from COMPUSTAT.
Other firm-specific factors that may affect payout policy include G (the moving average
of earnings growth over 20 quarters, following Ferreira and Santa-Clara (2011)), CASHFLOW
(net income plus depreciation and amortization), DEBTRATIO (long-term debt as a percentage of
market value of equity), ASSETS (book value of total assets), SIZE (the logarithm of market
value of equity), WC (working capital scaled by market value of equity), CAPEX (capital
expenditures divided by market value of equity), ROA (net income scaled by total assets), and
BKMK (the ratio of book value of equity to market value of equity). Market value of equity is at
year end. Many of these variables are also employed by Aboody and Kasznik (2008). Table 3
summarizes firm characteristics for all firms over all time periods for our sample.
In Panel A, we show firm payout, operating and market-based characteristics. The first
group of columns represents stealth firms, while the second group is for non-stealth firms. We
find that for all of the dividend measures, the means are modestly significantly higher for stealth
6 http://www.mystockoptions.com/faq/index.cfm/catID/AE9F69E6-3097-43BD-B15BE00AA8F1761C/objectID/D943A157-30A9-11D4-B9080008C79F9E62
13
firms than for non-stealth firms (except for DIV/MV), where the mean is significantly higher at
the 5% level). For the repurchase measure, stealth firms spend modestly, significantly more than
non-stealth firms. Stealth firms have significantly lower mean earnings growth (1%) than non-
stealth firms (2.4%). We find stealth firms and non-stealth firms have similar cashflow, but
stealth firms have a higher debt ratio. Stealth firms are also significantly larger in terms of assets
and market value. Stealth firms have significantly lower working capital and capital
expenditures. Additionally, stealth firms are less profitable based on return on assets, and have
higher ratios of book to market value, indicating lower growth opportunities (both significant at
the 1% level). Overall, the results are consistent with what one would expect for firms with high
dividends.
Panel B summarizes CEO compensation characteristics for the sample of stealth firms
and non-stealth firms, including RSG$ (dollar amount of RSG holdings), RSGNEW$ (dollar
amount of newly granted RSGs), RSG# (the number of RSG shares held by the CEO),
NONRSG# (number of unrestricted share grants), OPTNEW# (the number of new options
granted), and OPTIONS# (the number of options). The results indicate that CEOs of stealth
firms have a significantly greater dollar amount of new grants, and more RSG holdings in both
dollar amount and number of shares. Since stealth firms have lower growth rates and fewer
growth opportunities, these firms may have an incentive to use restricted stock versus options to
reward management. Moreover, lower growth should result in lower stock price appreciation, so
boards can additionally augment their CEOs’ income by allowing stealth compensation. The
results also show that in lieu of RSGs, CEOs of non-stealth firms receive more unrestricted stock
grants and options (significant at the 1% level). Total cash compensation and total compensation
from all sources are similar for both types of firms.
In Panel C, data on governance characteristics is presented for stealth and non-stealth
firms, including PCTINDDIR (the percent of independent directors on the board), and BDSIZE
(the number of directors on the board). We also use two different measures of firm level
governance, the GINDEX and the KLD index. The GINDEX is computed from the Gompers,
Ishii, and Metrick (2003) index of 24 anti-takeover governance provisions (derived from
publications of the Investor Responsibility Research Center) which appear to be beneficial to
management and harmful to shareholders. The KLD index, provided by Kinder, Lydenberg,
Domini, & Co., has been shown by Hong and Kostovesky (2012) to be a good proxy for a

14
company’s corporate social responsibility (CSR). The KLD index also provides transparency
about past and likely future corporate governance performance in that there is a positive link
between CSR, firm governance and firm performance. In the index, corporate governance
concerns are subtracted from corporate governance strengths. Strengths include: Limited
Compensation, Ownership Strength, Transparency Strength, Political Accountability Strength
and Other Strengths. Concerns include High Compensation, Accounting Concern, Transparency
Concern, Political Accountability Concern, and Other Concerns. For each area of strength and
concern, a company gets a one if it is applicable and zero otherwise.
Finally, we look directly at several dimensions of ownership, including institutional
ownership, and insider ownership. We measure institutional ownership as the percent of shares
held by institutions scaled by the total shares outstanding from Thompson Financial 13D filings
(INSTPCT). Using the definition of blockholders in Buchanan, Netter, Poulsen, and Yang
(2012), we count the number of institutional owners in the firm who hold more than 1% of the
equity, and call this BLOCK (similar results are obtained using a 5% threshold). We measure
insider ownership, INSIDERPCT, as executive and director share ownership divided by total
shares outstanding.
The mean percentage of independent directors for stealth firms is 76.6% vs. 74.1% for
non-stealth firms (significant at the 10% level). Board size does not significantly differ between
the groups. However, when comparing various governance and entrenchment measures, we find
that stealth firms have significantly worse governance. On average, stealth firms have
significantly higher anti-takeover provisions compared to non-stealth firms. The KLD index is
also significantly worse for stealth and non-stealth firms (-0.66 versus -0.56). However, stealth
firms tend to have significantly higher institutional ownership and more block holders than non-
stealth firms. In answer to our first research question, these results suggest that the quality of
governance, as well as the make-up of shareholders plays a significant role in the use of stealth
compensation.
4.2 Logit estimations
We next run multivariate tests, so we first examine the correlations between our
independent variables. None of the governance variables are highly correlated, which suggests
that multicollinearity will not be a problem in our multivariate estimations (correlation tables are
available upon request). We are interested in seeing the particular firm, compensation, and
15
governance characteristics that increase the likelihood that a company will offer its executives
stealth compensation. We run the following logit estimation and report the marginal effects:
STEALTH = b0 + b1-8COMPVARS + b9-13GOVVARS + b14G + b15CASHFLOW +
b16DEBTRATIO + b17SIZE + B18LAGDIV + b19WC + b20CAPEX + ε (1)
where STEALTH is an indicator variable that is equal to one if the firm uses stealth compensation
and zero otherwise. Our firm-specific variables are detailed in Appendix A. COMPVARS are
RSGNEW$, RSG#, NONRSG#, OPTNEW#, OPTIONS#, and VEST (the number of years until
RSGs vest, on average). GOVVARS include the controls PCTINDDIR and BDSIZE. We also
create governance indicator variables, IBLOCK, IINSIDERPCT, IGINDEX and IKLD, that are
equal to one if the variable of interest is in the upper tercile based on the values in a particular
year, and zero otherwise. Additionally, we control for year and industry effects.
The results in Table 4 suggest that executive compensation plays a meaningful role in the
likelihood that stealth compensation is used. Firms which grant new options and which have
options outstanding are significantly less likely to offer stealth compensation to its executives.
The opposite is true for firms with restricted stock, in terms of new grants and restricted shares
held. In addition, the longer the vesting period of the RSGs, the greater the likelihood of stealth
compensation.
There appears to be a connection between stealth compensation and various governance
mechanisms. For example, companies with greater independent director representation have an
increased likelihood of using stealth compensation. Conversely, larger boards are less likely to
use this form of compensation, although only significant in estimation (1). Institutional
ownership also plays an important role in the use of stealth compensation. Companies with a
greater number of blockholders are less likely to engage in stealth compensation. Looking at the
first governance indicator variable, shown in Column 1, the predicted probability of using stealth
compensation is 0.13 greater for firms with high anti-takeover provisions (IGINDEX equal to one)
compared to those with low anti-takeover provisions. For the second indicator variable, shown in
column 2, firms with good governance (IKLD equal to one), the predicted probability of using
stealth compensation decreases by 0.182. (One has to keep in mind that there is a positive
relationship between KLD rating and good governance.)
16
Thus, we have mixed results regarding whether stealth compensation is associated with
agency issues. On one hand, companies with a board composition associated with good
governance are more likely to allow stealth compensation, suggesting that its use is associated
with reducing agency issues. On the other hand, companies with less outside monitoring, more
anti-takeover provisions, and worse social governance rankings are more likely to use stealth
compensation. These results suggest a positive association between agency issues and stealth
compensation. It may be that firms with good as well as with poor governance both use stealth
compensation for differing motivations. Smaller, more independent boards may use stealth
compensation as a way to motivate managers to disgorge excess cash. However, managers at
companies where there is low oversight by outside investors, whose hand may be tied by more
anti-takeover provisions or shareholder apathy, could use the stealth compensation as a way to
increase their own compensation.
Finally, there are some firm characteristics that are significantly associated with the use
of stealth compensation. Firms with high growth and high capital expenditures are less likely to
do so, while firms with high cash flow are more like to engage in stealth compensation.
4.3 Compensation Received from Stealth Compensation
From the univariate results, stealth firms appear to be different than non-stealth firms.
However, the choice to pay dividends on unvested RSGs is not important if the amount of money
that CEOs receive is not economically significant. In Table 5, we measure on a yearly basis how
much additional compensation CEOs of stealth firms receive from dividends versus how much
CEOs of non-stealth firms would have received if they were paid dividends on unvested RSGs
(calculated by multiplying the number of grants by the DPS). CEOs of stealth firms receive
$180,200 per year (on average) in additional income, whereas the CEOs of non-stealth firms
would have only received an additional $96,000. The maximum additional amount in dividends
is $4,340,000, which is not reported in the table. Over the period of this study, the average
amount of stealth compensation represents 9% of all cash compensation and 2% of total
compensation. Both of these percentages are significantly greater than what would have been
received by CEOs of non-stealth firms. The amount of dividends paid increases considerably
over the sample period. In 2003, stealth firms CEOs received almost $129,000 versus only
$52,000 for non-stealth firms. This increased to $263,000 for stealth firms and $238,000 for
non-stealth firms by 2007. It is particularly interesting to note the increased use and size of
17
stealth compensation over time. In 2003, dividend compensation was only 5% of cash
compensation, but rose to 20% by 2007 for stealth firms.
Dividends on unvested RSGs appear to be economically meaningful. In order to better
understand the economic significance and effect of agency issues that may arise from stealth
compensation, we run the following regression:
DIVCOMP =b0 + b1STEALTH + b2-7COMPVARS + b8-12GOVVARS + b13G +
b14CASHFLOW + b14CASHFLOW + b15DEBTRATIO + b16SIZE +
b15LAGDIV + b16WC + b17CAPEX + ε (2)
where DIVCOMP is either dividend compensation scaled by total cash compensation or TDC1.
COMPVARS are RSGNEW$, RSG#, NONRSG#, OPTNEW#, OPTIONS#, and VEST. GOVVARS
include PCTINDDIR, BDSIZE, IBLOCK, IINSIDER, IGINDEX, and IKLD.
The results in Table 5 show that controlling for firm characteristics, CEOs of stealth
firms receive more dividend compensation. For firms offering stealth compensation, there is a
9.6% and 2.1% increase in dividend compensation adjusted by total cash and total compensation,
respectively. We also find that an increase in option compensation (both existing and new
grants) decreases dividend compensation, while new restricted stock grants, and current RS
holdings increase dividend compensation. Examining governance characteristics, we find that
only block ownership and the governance quality indexes affect the amount of dividend
compensation. It is worth noting that although block ownership reduces the likelihood of
offering stealth compensation, there is a positive relation between block ownership and dividend
compensation. A higher GINDEX (where a high value can be interpreted as poor governance) is
also positively related to higher dividend compensation, while there is a negative relationship
between KLD (where a high value can be interpreted as good governance) and dividend
compensation. Based on these results, it is possible that companies with more institutional
ownership use increased dividend income (higher dividends) to reduce agency issues related to
free cash flow. However, CEOs along with the boards of companies with higher managerial
entrenchment and worse governance may also use stealth compensation to increase their own
compensation.
The results from Table 5 suggest that dividend compensation could influence decisions
with respect to dividend policy. As noted earlier, companies that use stealth compensation have
18
higher dividend payouts than companies that do not. Next, we use multivariate analysis to test
whether this result still holds when controlling for other firm characteristics.
4.4 Payout Estimations We use a model similar to Aboody and Kasznik, and regress two payout measures, on
variables related to stealth compensation, governance, and control variables:
PAYOUT = b0 + b1STEALTH + b2-7COMPVARS + b8-12GOVVARS + b13G +
b14CASHFLOW + b15DEBTRATIO + b16SIZE + b15LAGDIV +
b16WC + b17CAPEX + ε, (3)
where PAYOUT is either: total dividends scaled by market value of equity (DIV/MV) or the
dollar amount spent on repurchases minus any decrease in the par value of preferred stock,
divided by the market value of equity (REP/MV). All other variables are defined in Appendix A.
The results are shown in Table 6.7
The stealth variable is highly positively related to all of the dividend measures and highly
negatively related to repurchases (significant in all cases at the 1% level). Stealth firms pay 0.2%
more dividends and make 0.2% fewer repurchases. Considering the average dividend payout is
2.3%, and repurchase payout is 0.4% over our sample period, this result is economically
significant. Thus, in answer to our second research question, stealth firms pay higher dividends
and repurchase fewer shares.
New option grants as well as option holdings are positively and significantly related to
repurchases, but negatively related to dividend payouts. As Fenn and Liang (2001) suggest,
increases in repurchases may offset option-induced reductions in dividends so that total payouts
remain relatively constant. Firms where CEOs have larger non restricted grants pay significantly
lower dividends. Our results on RSGs are consistent with Aboody and Kasznik (2008). The
dollar amount of new RSGs is positively related to dividends measure and negatively related to
repurchases. The same relationship holds for the number of RSGs held by the CEO. Finally,
vesting is positively and significantly related to the dividend measures, but not related to
repurchases.
In examining board structure, we find that larger boards have a significant positive
relationship with dividends, while the percent of independent directors is significantly,
7 We use a Tobit model instead of a robust OLS model with qualitatively similar results. Additionally, we use dividend per share, payout ratio, and total dividends/assets as a dependent variable with qualitatively similar results.
19
negatively related to repurchases. A one standard deviation change in board size would increase
the dividend payout ratio by 0.065%, while a one standard deviation change in director
independence would reduce repurchases by 0.08%. An increase in institutional block holders
has a highly significant effect on payout, decreasing dividends by 0.2% while increasing
repurchases by 0.5%. These results are consistent with Grinstein and Michaely (2005) who find
that institutions do not prefer firms that pay high dividends but like firms that repurchase shares
more regularly. We also find that greater insider ownership reduces dividends by 0.1%, which is
consistent with Rozeff (1982), who finds that dividend payouts are negatively related to insider
stock holdings. He argues that insider stock ownership provides direct incentive alignment
between managers and shareholders, while dividends serve as a bonding mechanism to reduce
management's scope for making unprofitable investments using internal funds. Thus, insider
stock ownership and dividend policy can be viewed as substitute means of addressing potential
agency problems. Finally, the results from our governance indexes (both IGINDEX and IKLD)
show that poorer governance is associated with a 0.1% increase in dividend payouts and a 0.2%
decrease in repurchase payouts. This is consistent with Knyazeva (2007), who finds that weakly
governed managers make fewer dividend cuts and engage in more dividend smoothing.
The variables measuring firm-specific characteristics show the expected signs. Not
surprisingly, higher cash flow is positively and significantly related to both dividends and
repurchases. Jensen (1986) also contends that higher debt reduces the free cash flow problem,
suggesting that highly levered firms have less cash to pay out to shareholders, which we also
find. Firm debt ratio is positively related to repurchases, but only significant in one case. Firms
may be constrained by loan/bond covenants from raising dividends, but are known to borrow so
that they can repurchase shares, which would result in the signs of the coefficients we observe.
Similar to Fama and French (2001), firm size is positively and highly significantly related to all
dependent variables. Lagged dividends are significantly and positively related to current
dividend measures, but not related to the repurchase measure (except in one case). We find that
working capital is not related to dividend payout but is generally positively related to
repurchases. CAPEX is negatively related to dividends, but is positively related to repurchases. It
is possible that companies that want to conserve their cash flow for working capital investment
and capital expenditures may prefer to use repurchases over dividends.
20
Next, we examine the interactions of governance, ownership, and stealth compensation in
Table 7. From previous tests, we know that greater block ownership reduces the likelihood of
paying stealth compensation as well as the likelihood of dividend payouts. However, the
coefficient on the interaction between block ownership and stealth is positive. A company with
high block ownership, but no stealth compensation experiences a 0.2% decrease in dividend
payout and a 0.6% increase in repurchase payout (columns 1-2). On the other hand, if a firm has
high block ownership and stealth compensation, there is a 4.1% increase in dividend payout and
a 0.7% decrease in repurchases (based on adding the coefficients on STEALTH, IBLOCK, and
the interaction term). The higher payout for stealth firms which have block ownership may
possibly be the result of the block holders preferring dividends to counteract the agency issues
associated with high free cash flow. Since Rozeff (1982) suggests that insider ownership better
aligns managers and shareholders, we next examine whether this relationship holds in the
presence of stealth compensation. As before, we find that companies with stealth compensation
have significantly lower dividend payouts when there is high insider ownership (columns 3).
Finally, to determine whether stealth compensation potentially reduces or increases agency
issues by creating an incentive to increase payouts, we look at the interactions with GINDEX and
KLD (quality of governance indicators). From columns 5-8, we find that poorly governed
companies without stealth compensation increase their dividends by 0.1% to 0.2% (GINDEX and
KLD, respectively), while repurchases increase by 0.4%. However, poorly governed companies
that also have stealth compensation significantly increase their dividend payouts by as much as
2.5% (GINDEX) and 1.1% (KLD), respectively) and decrease their repurchase payouts by as
much as 3.0% (GINDEX) and 1.5% (KLD), respectively.
To better understand how all of these interactions relate to each other, in columns 9-12,
we look at joint estimations involving blockholding, inside ownership and quality of governance.
We find that the governance interactions, with both GINDEX and KLD when coupled with
stealth compensation, show the largest effect on dividend payout (in absolute terms) of all the
joint estimations, We run a Wald test to examine whether there is a significant difference
between the coefficients on STEALTH*IGINDEX (IKLD) and the other interaction terms, and
find that they are significantly different at the 1% level. Overall, the results, suggests that stealth
compensation may act as an important bonding mechanism to increase dividend payouts when
there may be greater agency issues within the firm.
21
4.5 Robustness Tests
The issue of causality may exist in that stealth compensation may affect dividend policy
or that dividend policy may drive the use of stealth compensation. We employ several different
robustness tests to try to deal with the potential endogeneity concerns. It is very difficult to
determine exogenous factors to control for the relationships being studied. Linck, Netter, and
Wintoki (2012) argue that governance studies often do not control for the dynamic endogeneity
of the data which is not strictly exogenous, and changes over time due to shocks to the firm at
various points in time. Since a firm’s historical decisions can proxy for important governance
attributes such as agency issues or managerial entrenchment, it is important to control for past
decisions, which may be a major determinant of future decisions and future governance
structures. Linck et al. (2012) suggest that the most appropriate method to control for this
endogeneity is a system GMM estimator controlling for historical factors in the form of lags in
the main variable of interest. Their results suggest that fixed effects models are biased because
these models ignore past performance and past governance choices. We test our hypotheses
using a system GMM estimator controlling for year and industry as well as the Windmeijer
(2005) correction. Since our regressor is predetermined, but may not be strictly exogenous, we
use lags of one and two years, which invokes instruments from t-3 and t-4, respectively
(Roodman (2006)). The results are shown in Table 8. We still find that companies with stealth
compensation increase their dividend payout and decrease their repurchase payout - by 0.9%
(significant at the 5% level) and by 0.2% (significant at the 10% level), respectively. The
coefficients on the compensation and governance variables are similar to what we find in Table
6, although we do lose some significance. This is consistent with Linck et al. (2012), who find
that after controlling for endogeneity, governance variables may lose their explanatory power.
We also report the results from tests of the exogeneity of our model. Our assumption is
that a firm’s historical payout policy is exogenous to changes in their current payout decisions.
We use several tests of exogeneity suggested by Arellano and Bond (1991) and Roodman (2006)
to see if our assumption of the exogeneity of payout policy is valid. First, we test for
autocorrelation, as the validity of the instrumental matrix in the Arellano-Bond (AB) estimator
depends on having no autocorrelation. The initial step in the AB estimator takes the first
difference between PAYOUTt-1 - PAYOUTt−2. We use AR (1) and AR (2) tests for first-order
and second-order serial correlation in the first-differenced residuals. Due to first-differencing in

22
the AB estimator, there can be mechanical first-order autocorrelation in the errors (thus, it is not
unusual if the AR (1) test has low p-values). The relevant test involves checking for second-order
autocorrelation in AR (2), where higher p-values are desired, as this shows there is no serial
correlation (Linck et al., 2012). The p-values reported in Table 8 for the AR tests suggest the
underlying conditional errors are not autocorrelated (the AR (1) test yields p-values between 0.00
and 0.07, and the AR (2) test yields p-values between 0.17 and 0.83).
The second step is to further check the exogeneity of the instruments by performing a
Hansen test of over-identifying restrictions. Since the dynamic panel GMM estimator uses
multiple lags as instruments, it is possible that our system is over-identified. The Hansen test has
a null hypothesis that the instruments as a group are exogenous. High p-values for the Hansen
test indicate that the null hypothesis cannot be rejected. Finally, we run two additional tests of
exogeneity of a subset of our instruments. By using a system GMM approach, we are able to
include the level equations in our GMM estimates and use lagged differences as instruments for
these levels. We test this assumption by using a difference in Hansen test of endogeneity. The
high p-values suggest we cannot reject the null hypothesis that these instruments are exogenous.
We also run a difference in Hansen test for the year IVs, and find similar p-values. The lack of
serial correlation suggests that endogeneity is not a significant concern in our approach.
Table 9 shows additional robustness checks. In columns (1-4), we show the results from
a two-stage least squares estimation; in the first stage we regress the percent of stealth firms in
the industry each year as the instrument. We follow the method employed by John and
Knyazeva (2006), where the logic is that industry structure is unique to each industry and
therefore is expected to be exogenous. This is based on the intuition that the percent of stealth
firms in the industry is positively associated with an individual firm’s decision to offer stealth
compensation, and not likely to have a direct impact on individual payout policy. Consistent
with this argument, the percent of firms using stealth in an industry is highly significant in a first
stage regression (untabulated) predicting stealth compensation (the coefficient is 3.36 with a p-
value of 0.00). Thus, identification does not reject the null hypothesis that the instruments are
valid.8 As the table shows, we continue to find a positive relation between dividend payout and
8 First stage F statistics are above 10. The Cragg-Donald test rejects the null hypothesis of weak instruments.

23
(predicted) stealth compensation, and a negative relation between repurchase payout and
(predicted) stealth compensation.
As a final robustness check, we look at the change in dividends around the 2003
dividend tax cut in Table 9, columns (5-8). Using a change-in-change approach, we measure the
change in the payout variables, as well as firm, compensation, and governance characteristics
from 2002 to 2004. We find that companies with stealth compensation the year before the tax
cut are more likely to increase the firm’s dividends the year after the tax cut, which supports the
idea that stealth compensation influences dividend payouts but not repurchases.
4.6 Performance and Stealth Compensation
Since the goal of management is to maximize long-term shareholder value, it would be
worthwhile to look at the impact of stealth compensation on long-term profitability. We do this
by first comparing the one- and three-year average of return on assets, and Tobin’s Q for both
groups of firms (we also use ROE but do not report it as results are qualitatively similar). Next,
to better understand whether stealth compensation improves or worsens agency issues, we
estimate the relationship between stealth compensation and subsequent firm financial
performance. Agency problems are usually associated with poorer financial performance, if not
in the short run, then in the longer run. Assuming that the use of stealth compensation reflects a
breakdown in the agency relationship, we expect to observe a negative relationship between its
use and subsequent performance. Following Core et al. (1999), we regress the one-and three-
year average of return on assets, return on equity, and Tobin’s Q on firm and governance
characteristics:
PERFORMANCE = b0 + b0 + b1STEALTH + b2-7COMPVARS + b8-13GOVVARS + b14G
+ b15CASHFLOW + b16DEBTRATIO + b17SIZE + b18LAGDIV + b19WC +
b20CAPEX + b21SDPERFORMANCE + ε (4)
where SDPERFORMANCE is the standard deviation of the performance measure (ROA or Q)
for the five years prior to when stealth compensation is paid (similar to Core et al. (1999)). In
addition to the governance variables from the other equations, we also include AGE (the age of
the CEO). All the other variables are defined following equation (3), and we control for year and
industry effects.
Table 10, Panel A, shows the univariate mean and median values of the performance
measures. It is evident that stealth firms have worse performance over the short term (one-year)
24
period as well as the longer term (three-year) period subsequent to paying stealth compensation.
Table 10, Panel B shows the results of Equation (4). We use two measures of growth. The first
measure (G) is EPS growth over the past five years. While the literature shows this to be a good
proxy for growth opportunities (see Ferreira and Santa-Clara (2011)), as a robustness check, we
also use a forward-looking measure (FUTURE G). In columns (2), (4), (6), and (8) we use the
Institutional Brokers’ Estimate System (IBES) long-term growth forecast as our second growth
variable. Note that growth is significantly positively related to performance whether historical or
forecasted growth is used. Stealth compensation is associated with a statistically significant
decline in ROA of 1.4% to 2% and a decline in Q of between 4.4% and 11% over a three-year
period. Since the average ROA for stealth firms is approximately 10%, the regression results
imply a loss of approximately 10% of the sample average ROA. We also find a negative
relationship between IGINDEX and performance, consistent with weak governance leading to
declining performance.
We include the interactions between stealth compensation and ownership, and stealth
compensation and governance. Interestingly, when a company has high block ownership but
does not have stealth compensation, the ROA declines by 1.6% (column 5). However when a
company with high block ownership offers stealth compensation, ROA increases by 0.6% and Q
increases by 1.9% (based on the net effect of STEALTH, IBLOCK and the interaction term). We
see similar results with the IGINDEX. Companies with poor governance and no stealth
compensation experience a 0.5% decline in ROA and a 21.1% decline in Q. On the other hand,
for poorly governed companies with stealth compensation, ROA and Q increase significantly by
0.2% and 12.2%, respectively (the net effect of STEALTH, IGINDEX and the interaction term).
The results suggest that the improvement in performance is markedly greater for poor
governance firms with stealth compensation than for poor governance firms without stealth
compensation. Stealth compensation may actually help alleviate some agency issues, resulting in
better long term performance.
5. Conclusion
We examine the degree to which firms pay dividends on unvested restricted stock grants
of CEOs (stealth compensation), whether it is a meaningful contributor to overall compensation
packages, if it create agency issues for shareholders and affects performance. Our sample
consists of S&P 500 firms over the period 2003-2007 that issue restricted stock and allow

25
dividends to be paid on unvested shares. This period provides a unique opportunity to examine
dividend policy since the tax treatments of dividends and share repurchases are very similar. As
a result, our results are not confounded by tax preferences of CEOs and/or directors.
Stealth firms seem to be different from non-stealth firms. The former have higher cash
flow and lower growth opportunities than the latter. Executives of firms paying dividends on
unvested restricted stock grants make an extra $180,200 a year on average from stealth
compensation, or almost 9% of cash compensation and 2% of total compensation. Stealth firms
pay significantly larger dividends than the non-stealth firms, but repurchase less. For companies
that have stealth compensation, more restricted stock grants result in higher dividend payouts,
which can result in the misalignment of management interests with those of the shareholders.
Several robustness checks on the effect of endogeneity provide overall similar results. In
analyzing the long-run effects of stealth compensation on firm performance, we find that the use
of stealth compensation is associated with a decline in performance. However, for firms with
potential agency problems, firms with stealth compensation have a meaningful improvement in
long-term performance. For firms with weak governance, stealth compensation may act as a
bonding mechanism by promoting increased dividend payouts. The results in this paper may
have policy implications for corporate decision makers. They suggest a possible means by which
weak corporate governance and agency issues arising from free cash flow can be improved by
using stealth compensation.

26
References
Aboody, D., Kasznik, R., 2008. Executive stock-based compensation and firms' cash payout: the role of shareholders' tax-related payout preferences. Rev. Account. Stud. 13, 216-251.
Allen, F., Bernardo, A., Welch, I., 2000. A theory of dividends based on tax clienteles. J. Finance 55, 2499-2536. Arellano, M., Bond, S. 1991. Some tests of specification for panel data: Monte Carlo evidence
and an application to employment equations. Rev. Econ. Stud. 58, 277-297. Bebchuk, L., Fried, J., 2004. Pay without performance: The unfulfilled promise of executive
compensation. Harvard University Press, Cambridge, MA. Bebchuk, L., Cohen A., 2005. The costs of entrenched boards. J. Financ. Econ.78, 409-433. Bebchuk, L., Cohen, A., Ferrell, A., 2009. What matters in corporate governance? Rev. Financ.
Stud. 22,783-827. Bertrand, M., Mullainathan, S., 2003. Enjoying the quiet life? Corporate governance and
managerial preferences. J. Pol. Econ. 111, 1043-1075. Bhagat, S., Black, B., 1999. The uncertain relationship between board composition and firm
performance. Bus. Lawyer 55,921-963. Blouin, J., Raedy, J., Shakelford, D., 2011. Dividends, share repurchases, and tax clienteles:
evidence from the 2003 reduction in shareholder taxes. Account. Rev. 86, 887-914. Brown, J., Liang, N., Weisbenner, N., 2007. Executive financial incentives and payout policy,
firm responses to the 2003 dividend tax cut. J. Finance62, 1935-1965. Buchanan, B., Netter, J., Poulsen, A., Yang, T, 2012. Shareholder proposal rules and practice:
Evidence from a comparison of the US and the UK. Am. Bus. Law. J. 49, 739-803. Bushee, B, 2001. Do institutional investors prefer near-term earnings over long-run value? Cont.
Account. R. 18,207–46. Bushee, B., Noe, C., 2000. Corporate disclosure practices, institutional investors, and stock return volatility. J. Account. R., 171-202. Cheng, S., 2008. Board size and the variability of corporate performance. J. Financ. Econ.87,
157–176. Chetty, R., Saez, E., 2005. Dividends, taxes and corporate behavior: evidence from the 2003
dividend tax cut. Q. J. Econ.120, 791-833. Chidambaran, N., Prabhala, N., 2009. Offsetting behavior and compensation reform. University
of Maryland working paper. Chung, K., Zhang, H., 2011. Corporate governance and institutional ownership. J. Financ. Anal. 46, 247-273. Coles, J., Daniel, N., Naveen, L., 2008. Boards: does one size fit all? J. Financ. Econ. 87, 329-
356. Core, J., Guay, W.,1999. The use of equity grants to manage optimal equity incentive levels. J.
Account. Econ. 28,151-184. Core, J., Holthausen, R., Larcker, D., 1999.Corporate governance, chief executive officer
compensation, and firm performance. J. Financ. Econ. 51, 371-406. Denis, D., Hanouna, P., Sarin, A., 2006. Is there a dark side to incentive compensation? J. Corp.
Finance 12, 467-488. Fama, E., French, K., 2001. Disappearing dividends: changing firm characteristics or lower
propensity to pay? J. Financ. Econ. 60, 3-44. Fama, E., Jensen, M.,1983a. Separation of ownership and control. J. Law Econ 26, 301-325. Fama, E., Jensen, M., 1983b. Agency problems and residual claims. J. Law Econ. 26, 326-350.

27
Fenn, G., Liang, N., 2001. Corporate payout policy and managerial stock incentives. J. Financ. Econ. 60, 45-72.
Ferreira, M., Santa-Clara, P., 2011. Forecasting stock market returns: the sum of the parts is more than the whole. J. Financ. Econ. 100, 514-537.
Giannetti, M., Simonov, A., 2006. Which investors fear expropriation? Evidence from investors’ portfolio choices. J. Financ. 61, 1507-1547.
Goergen, M., Renneboog, L., 2011. Managerial compensation. J. Corp. Finance. 17, 1068-1077. Gompers P., Ishii, J., Metrick, A., 2003. Corporate governance and equity prices. Q. J. Econ.
118, 107-155. Grinstein, Y., Michaely, R., 2005. Institutional holdings and payout policy. J. Financ.60, 1389–
426. Grullon, G., Michaely, R., 2002. Dividends, share repurchases, and the substitution hypothesis.
J. Financ. Econ. 57, 1649-1684. Hawley, J., Williams, A., 2000. The rise of fiduciary capitalism: How institutional investors can
make corporate America more democratic. Philadelphia, PA: University of Pennsylvania Press.
Heckman, J., 1979. Sample selection bias as a specification error. Econometrica 47, 153-161. Hermalin. B.,Weisbach, M., 1991. The effects of board composition and direct incentives on
firm performance. Financ. Manag. 20,101-112. Jagannathan, M., Stephens, C.P., Weisbach, M., 2000. Financial flexibility and choice between
dividends and stock repurchases. J. Financ. Econ 57,355-384. Jensen, M., 1983. Organization theory and methodology. Account. Rev. 58, 319-339. Jensen, M., 1986. Agency costs of free cashflow, corporate finance and takeovers. Am. Econ.
Rev.76, 323-339. Jensen, M., 1993.The modern industrial revolution, exit, and the failure of internal control
systems. J. Finance 48, 831-880. Jensen, M., Meckling, W.K., 1976. Theory of the firm: managerial behavior, agency costs and ownership structure. J. Financ. Econ. 3, 305-360. Jo, H., Harjoto, M., 2011. Corporate governance and firm value: The impact of corporate social
responsibility. J. Bus. Ethics. 103, 351-383. Jolls, C., 1998. Stock repurchases and incentive compensation. NBER Working Paper No. 6467. John, K., Knyazeva , A., 2006. Payout policy, agency conflicts and corporate governance. SSRN
Working Paper. Kahle, K., 2002. When a buyback isn’t a buyback: open market repurchases and employee
options. J. Financ. Econ. 63, 235-261. Knyazeva , A., 2007. Delivering on the dividend promise: corporate governance, managerial
incentives, and dynamic dividend behavior. Unpublished working paper. Korac-Kakabadse, N., Kakabadse A.K., and Kouzmin A., 2001. Board governance and company performance: any correlations? Corp. Gov. 1, 24-30. Lambert, R., Lanen, W., Larker, D., 1989. Executive stock option plans and corporate dividend
policy. J. Financ. Quant. Anal. 24, 409-425. Lamont, O.,1998. Earnings and expected returns. J. Finance. 531563-1587. Li, K., Ortiz-Molina, H., Zhao, X., 2008. Do voting rights affect institutional investment
decisions? Evidence from dual-class firms. Financ. Manage., 37, 713-745. Linck, J., Wintoki, M., Netter, J., 2012. Endogeneity and the dynamics of internal corporate
governance. J. Financ. Econ. 105,581-606.
28
Murphy, K., 1993. Executive compensation. In: Ashenfelter, O. and Card, D. (Eds.), Handbook of Labor Economics3. North-Holland. Amsterdam.
Platt, H. Platt, M., 2012. Corporate board attributes and bankruptcy, J. Bus. R. 65, 1139-1143. RiskMetrics Group. September 30, 2008. Stealth compensation continues in executive
compensation. Roodman, D. 2006. How to Do xtabond2: An introduction to difference and system GMM in
Stata, Center for Global Development, Washington. Rozeff, M., 1982. Growth, beta, and agency costs as determinants of dividend payout ratios. J.
Financ. R. 5, 249-259. Yermack, D., 1996. Higher market valuation of companies with a small board of directors. J.
Financ. Econ. 40, 185-202. Weisbach, M., 1988. Outside directors and CEO turnover. J. Financ. Econ. 20, 431-460. Windmeijer, F., 2005. A finite sample correction for the variance of linear efficient two-step
GMM estimators. J. of Economet. 126, 25-51. Zhang, Dan., 2013. Managerial dividend-paying incentives. Oslo University Working Paper.
29
Table 1 Summary information on sample firms Panel A shows the yearly breakout of stealth and non-stealth firms for our S&P 500 sample. Panel B shows the top 20 industry breakdown for stealth and non-stealth firms using the Fama-French 49 industry classification
Panel A – Yearly Break Out Year Stealth Firms N Non-Stealth Firms N 2003 219 134 2004 235 148 2005 227 156 2006 224 152 2007 186 153
Panel B – Industry Break Out
Industries Stealth Firms Non-Stealth Firms Total
Banking 108 69 177Utilities 86 64 150Insurance 77 57 134Retail 60 55 115Petroleum and Natural Gas 48 41 89
Trading 50 30 80
Electronic Equipment 37 41 78Pharmaceutical Products 37 36 73Consumer Goods 28 28 56
Communication 43 11 54
Food Products 25 28 53Business Services 24 27 51Chemicals 34 14 48Machinery 24 22 46Business Supplies 43 2 45Wholesale 23 15 38Restaurants, Hotels, Motels 19 19 38Construction Materials 6 31 37Transportation 26 10 36
Automobiles and Trucks 25 10 35.

30
Table 2 Summary data for sample firms This table presents summary data on the sample firms segmented by whether the firm uses stealth compensation. For variables that are specific to the use of stealth compensation, the details for non-stealth firms are not available. Appendix A describes the variables.
Stealth Firms Non-Stealth FirmsVoting Rights (VOTE) 0.91 0.81Dividends Paid on RSGs 1 0Accumulate Dividends, Pay on Vesting 0.12 N.A.Vesting Years (VEST) 4.76 4.02Directors Paid Dividends Same as CEO 0.8 N.A.Other Execs Paid Dividends Same as CEO 0.98 N.A.Pays Interest on Accumulated Dividends 0.1 N.A.Receives More RSGs Instead of Cash 0.21 N.A.N 1,091 743
31
Table 3 Univariate statistics for firm and governance characteristics This table presents statistics on firm financial, compensation, and governance characteristics. Appendix A defines the variables. Two-group unpaired mean-comparison t-tests and rank sum equality tests on unmatched data are used to examine whether there is a significant difference between the mean and median values of stealth and non-stealth firms.***, **, and * denote significance at the 1%, 5%, and 10% levels, respectively. Panel A: mean and median firm characteristics Stealth Firms (N=1,091) Non-Stealth Firms (N=743) SignificanceVariable Mean Median Mean Median Mean MedianDPS 0.23 0.2 0.21 0.18 * *PAYOUT 0.37 0.25 0.32 0.21 * *DIV/ASSETS 0.22 0.01 0.01 0.01 * *DIV/MV 0.03 0.02 0.02 0.02 ** **REPAMT 0 0 0 0 * *G 0.01 0.04 0.02 0.01 * *CASHFLOW 2,341 1,242 2,261 1,001 None NoneDEBTRATIO 0.66 0.67 0.64 0.64 *** ***ASSETS 65,314 16,623 49,584 12,885 ** **SIZE 9.8 9.72 9.57 9.46 *** ***WC 0.09 0.02 0.1 0.05 * *CAPEX 0.04 0.03 0.05 0.04 *** ***ROA 0.09 0.08 0.12 0.1 *** ***BKMK 0.45 0.4 0.39 0.35 *** ***
Panel B: Mean and median compensation measures
Stealth Firms (N=1,091) Non-Stealth Firms (N=743) SignificanceVariable Mean Median Mean Median Mean MedianRSG$ (000) 4,503 0 2,180 0 ** **RSG# (000) 95 0 63 0 *** ***RSGNEW$ (000) 2,329 332 1,487 0 *** ***NONRSG# (000) 1,507 218 3,740 93 *** ***AGE 56 56 57 57 *** ***CEOSHARES 2,180 466 6,785 899 *** ***OPTNEW # (000) 958 160 1,409 120 *** ***OPTIONS # (000) 960 0 1,560 720 *** ***TOTAL CASH (000) 2,740 1900 2,633 1786 None NoneTDC1 12,930 8,020 9,301 7,115 * None
Panel C: mean and median board characteristics Stealth Firms (N=1,091) Non-Stealth Firms (N=743) Significance Variable Mean Median Mean Median Mean Median PCTINDDIR 76.6 80 74.1 75 * None BDSIZE 10.28 11 10.57 11 None None GINDEX 9.9 10 8.98 9 * * BLOCK 21.35 21 19.67 20 ** ** INSIDER 0.04 0.01 0.04 0.01 None None INSTPCT 0.8 0.85 0.75 0.83 ** ** KLD -0.66 -1 -0.56 -1 *** *
32
Table 4 Logit Estimation on the likelihood of offering stealth compensation Logit estimations for the likelihood that firms use stealth compensation, where 1 = stealth compensation and 0 = all other cases. We control for year and industry effects. All of the variables are defined in Appendix A. For each variable, the marginal effect is on the first line and the t-statistic is on the second line. ***, **, and * denote significance at the 1%, 5% and 10% levels, respectively.
(1) (2) Compensation Characteristics
OPTIONS# -0.145*** -0.148*** (-4.84) (-4.94) OPTNEW$ -0.041*** -0.041*** (-5.81) (-5.85) NONRSG# -0.004 -0.004 (-0.87) (-0.99) RSGNEW$ 0.012*** 0.012*** (3.31) (3.28) RSG# 0.038*** 0.038*** (5.21) (5.27) VEST 0.002* 0.002** (1.81) (2.00)
Governance CharacteristicsPCTINDDIR 0.192** 0.194** (2.06) (2.08) BDSIZE -0.005** -0.004 (-2.42) (-1.13) IBLOCK -0.067** -0.067** (-2.30) (-2.28) IINSIDER 0.007 0.011 (0.25) (0.38) IGINDEX 0.130** (2.05)IKLD -0.182*** (-3.24)
Firm CharacteristicsG 0.022*** 0.002*** (2.98) (2.92) CASHFLOW 0.017*** 0.017*** (3.08) (3.05) DEBTRATIO -0.008 -0.007 (-0.09) (-0.08) SIZE 0.020 0.019 (1.01) (0.96) LAGDIV 0.035 0.013 (-0.49) (-0.18) WC -0.013 -0.021 (0.14) (0.22) CAPEX -0.721** -0.698** (-2.26) (-2.20) N 1,834 1,834PR2 0.186 0.191

33
Table 5 CEO stealth compensation received from dividend paying S&P 500 companies for 2003-2007 Panel A shows CEO dividend compensation relative to other compensation received. For stealth firms, dividends are those paid on unvested RSGs. For non-stealth firms, the amount shown is what the CEO would have received if they were paid dividends on unvested RSGs. Stealth compensation is in thousands, and all other variables are defined in Appendix A. Two-group unpaired mean-comparison t-tests and rank sum equality tests on unmatched data are used to examine whether there is a significant difference between the mean and median values of stealth and non-stealth firms. Panel B shows results from multivariate estimations for Stealth/Cash Comp and Stealth/TDC1, controlling for year and industry effects. All of the variables are defined in Appendix A. For each variable, the coefficient is on the first line and t-statistic are on the second line.***, **, and * denote significance at the 1%, 5%, and 10% levels, respectively.
Panel A: Univariate Stealth Dividend Compensation Stealth Firms Non-Stealth Firms Significance
Variable Year Mean Median Mean Median Mean MedianStealth Comp 2003 128.86 38.63 52.17 0 *** ***Stealth/Cash Comp 0.05 0.02 0.02 0 *** ***Stealth/TDC1 0.02 0.01 0.01 0 *** ***Stealth Comp 2004 157.15 34.75 61.4 0 *** ***Stealth/Cash Comp 0.06 0.02 0.02 0 *** ***Stealth/TDC1 0.01 0.01 0.01 0 *** ***Stealth Comp 2005 188.35 65.19 70.45 0 *** ***Stealth/Cash Comp 0.07 0.03 0.02 0 *** ***Stealth/TDC1 0.02 0.01 0.01 0 *** ***Stealth Comp 2006 163.43 58.28 59.12 0 *** ***Stealth/Cash Comp 0.10 0.04 0.04 0 *** ***Stealth/TDC1 0.010 0.01 0.01 0 * *Stealth Comp 2007 263.22 79.95 237.75 0 ** ***Stealth/Cash Comp 0.20 0.06 0.25 0 *** ***Stealth/TDC1 0.02 0.01 0.04 0 *** ***Stealth Comp All 180.2 60.4 96.18 0 *** ***Stealth/Cash Comp 0.09 0.03 0.07 0 *** ***Stealth/TDC1 0.02 0.01 0.01 0 *** ***
Panel B: Multivariate Stealth Dividend Compensation (Only showing variables of interest) (1) (2) (3) (4)
Stealth/Cash Comp Stealth/TDC1 Stealth/Cash Comp Stealth/TDC1CEO Compensation
STEALTH 0.096*** 0.021*** 0.095*** 0.024***(10.92) (10.45) (10.76) (10.99)
OPTIONS# -0.004*** -0.005** -0.004*** -0.001**(-2.73) (-2.28) (-2.72) (-2.22)
OPTNEW# -0.001*** -0.001*** -0.001*** -0.001***(-3.53) (-3.01) (-3.65) (-3.50)
NONRSG# 0.001*** 0.001 0.001*** 0.001(4.13) (0.49) (3.99) (0.03)
RSGNEW$ 0.001*** 0.001*** 0.001*** 0.001***(5.50) (5.66) (5.60) (4.14)
RSG# 0.003*** 0.001*** 0.003*** 0.001***(8.21) (8.80) (8.06) (8.35)
VEST 0.001** 0.001** 0.001** 0.001**(2.76) (2.07) (2.76) (2.19)
Governance CharacteristicsPCTINDDIR 0.005 0.005 0.006 0.001
(0.80) (0.24) (0.87) (0.77)BDSIZE 0.001 0.001 0.001 0.001
(0.16) (0.44) (0.03) (0.22)IBLOCK 0.003** 0.001** 0.003* 0.001** (2.14) (2.19) (1.91) (2.34)IINSIDER 0.001 0.001 0.001 0.001 (0.38) (0.26) (0.20) (0.15)IGINDEX 0.005*** 0.004***
(3.08) (3.66)IKLD -0.005* -0.002**
(-2.05) (-2.49)N 1,834 1,834 1,834 1,834Adj. R-sq. 0.38 0.308 0.379 0.302
34
Table 6 Multivariate estimation of payout decisions This table presents results from multivariate estimations for dividend and repurchase payouts, controlling for year and industry effects. All of the variables are defined in Appendix A. For each variable, the coefficient is on the first line and the t-statistic is on the second line.***, **, and * denote significance at the 1%, 5%, and 10% levels, respectively.
(1) (2) (3) (4) (5) (6)
DIV/MV REP/MV DIV/MV REP/MV DIV/MV REP/MVCEO Compensation
STEALTH 0.002*** -0.002*** 0.001*** -0.002** 0.001*** -0.002** (3.07) (-2.69) (2.73) (-2.30) (2.66) (-2.40)OPTIONS# -0.001* 0.001* -0.001** 0.001* -0.001** 0.001* (-1.91) (1.91) (-2.03) (1.91) (-2.09) (1.96)OPTNEW# -0.001* 0.001** -0.001** 0.001* -0.001** 0.001* (-1.95) (2.36) (-2.62) (1.94) (-2.59) (1.91)NONRSG# -0.001** 0.001 -0.001 0.001 -0.001 0.001 (-2.32) (0.93) (-1.11) (1.27) (-1.13) (1.32)RSGNEW$ 0.003** -0.001** 0.002** -0.001** 0.004** -0.001** (2.59) (-2.20) (2.31) (-2.89) (2.29) (-2.83)RSG# 0.002*** -0.001** 0.003** -0.001** 0.002* -0.001** (3.16) (-2.36) (2.43) (-2.43) (1.98) (-2.40)VEST 0.001** -0.001 0.001** -0.001 (2.78) (-0.79) (2.73) (-0.71)
Governance Characteristics
PCTINDDIR 0.002 -0.006** 0.002 -0.006** (-1.04) (-1.97) (-1.06) (-2.11)BDSIZE 0.001** -0.001 0.001** -0.001 (2.33) (-0.57) (2.41) (-0.81)IBLOCK -0.002*** 0.005*** -0.002*** 0.005*** (-3.88) (5.89) (-3.76) (5.67)IINSIDER -0.001*** -0.001 -0.001*** -0.001 (-3.77) (-1.29) (-3.90) (-1.13)IGINDEX 0.001** -0.002*** (2.58) (-2.73) IKLD -0.001* 0.002*** (-1.96) (3.55)
Firm Characteristics
G 0.001 0.001 0.001 0.001 0.001 0.001 (0.90) (1.29) (0.72) (1.19) (0.75) (1.21)CASHFLOW 0.001*** 0.005*** 0.001*** 0.004*** 0.001*** 0.004*** (3.82) (6.88) (4.74) (6.39) (4.78) (6.18)DEBTRATIO -0.006*** 0.005* -0.006*** 0.003 -0.006*** 0.003 (-3.95) (1.99) (-4.25) (1.06) (-4.24) (0.97)SIZE 0.001*** 0.005*** 0.001** 0.005*** 0.001** 0.005*** (3.15) (7.15) (2.78) (7.48) (2.76) (7.49)LAGDIV 0.040*** 0.007*** 0.044*** 0.001*** 0.044*** 0.001*** (38.81) (2.76) (39.36) (3.00) (39.22) (3.03)WC -0.001 -0.009*** -0.001 0.007** -0.001 0.007** (-0.19) (-2.71) (-0.69) (-2.49) (-0.63) (-2.36)CAPEX -0.012** 0.031*** -0.010* 0.022** -0.010* 0.022** (-2.30) (2.74) (-1.93) (2.19) (-2.02) (2.25)CONSTANT 0.004 -0.019** 0.009** -0.023*** 0.009** -0.023*** (1.20) (-2.51) (2.21) (-2.80) (2.20) (-2.75)N 1,834 1,834 1,834 1,834 1,834 1,834Adj. R-sq. 0.7430 0.226 0.746 0.241 0.746 0.23
35
Table 7 Multivariate estimation of payout decisions with interactions This table presents results from multivariate estimations for dividend and repurchases payouts, controlling for year and industry effects. The indicator variables IGINDEX, IKLD, IBLOCK, and IINSIDER are used to measure the quality of governance where the indicator is equal to one if the value is in the upper tercile, and zero otherwise. The STEALTH indicator variable is interacted with these governance variables. Results for the firm or CEO compensation control variables are untabulated and are available upon request. All of the other variables are defined in Appendix A. For each variable, the coefficient is on the first line and the t-statistic is on the second line.***, **, and * denote significance at the 1%, 5%, and 10% levels, respectively.
DIV/MV REP/MV DIV/MV REP /MV DIV/MV REP/MV DIV/MV REP/MV DIV/MV REP/MV DIV/MV REP/MV (1) (2) (3) (4) (5) (6) (7) (8) (9) (10) (11) (12)
Interactions STEALTH 0.002** -0.002* 0.002*** -0.003** 0.002*** -0.003** 0.002** -0.003** 0.003** -0.002** 0.003* -0.002*
(2.23) (-1.68) (2.82) (-2.00) (3.33) (-2.27) (2.76) (-2.22) (2.34) (-2.11) (1.96) (-1.93) STEALTH*IBLOCK 0.041*** -0.011** 0.005** -0.002** 0.004* -0.002**
(2.82) (-2.75) (3.17) (-2.31) (1.96) (-2.79) STEALTH*IINSIDER -0.002** 0.001 -0.003** 0.001 -0.002** 0.001
(-2.46) (-0.11) (-2.67) (0.34) (-2.63) (0.38) STEALTH*IGINDEX 0.022*** -0.023*** 0.014*** -0.013***
(3.24) (-3.38) (3.39) (-3.63) STEALTH*IKLD -0.011*** 0.014*** -0.015*** 0.014***
(-3.61) (3.10) (-3.89) (3.25) Governance Characteristics
PCTINDDIR -0.001 -0.005* -0.001 -0.010** 0.001 -0.005 -0.001 -0.005 0.002 -0.006** 0.002 -0.006** (-0.51) (-1.83) (-0.03) (-2.07) (-1.18) (-1.20) (-0.31) (-1.22) (0.05) (-1.99) (-0.04) (-2.03)
BDSIZE 0.001 0.001 0.001*** 0.001 0.001** 0.001 0.001** 0.001 0.001** -0.001 0.001** -0.001 (0.19) (0.89) (4.06) (0.76) (2.89) (0.08) (2.22) (0.08) (2.75) (-0.43) (2.72) (-0.66)
IBLOCK -0.002** 0.006*** -0.004** 0.006*** -0.004** 0.006*** (-2.23) (4.50) (-2.45) (4.71) (-2.37) (4.53)
IINSIDER -0.001** -0.001 -0.001 -0.001 -0.001 -0.001 (-2.83) (-0.63) (-0.48) (-1.08) (-0.52) (-0.98)
IGINDEX 0.001* -0.004*** 0.001** -0.004*** (1.97) (-3.63) (1.96) (-2.93)
IKLD -0.002* 0.004*** -0.001** 0.004* (-1954) (3.27) (-2.24) (1.93)
N 1,834 1,834 1,834 1,834 1,834 1,834 1,834 1,834 1,834 1,834 1,834 1,834 ADJ R2 0.472 0.214 0.528 0.29 0.525 0.201 0.534 0.199 0.194 0.212 0.193 0.209
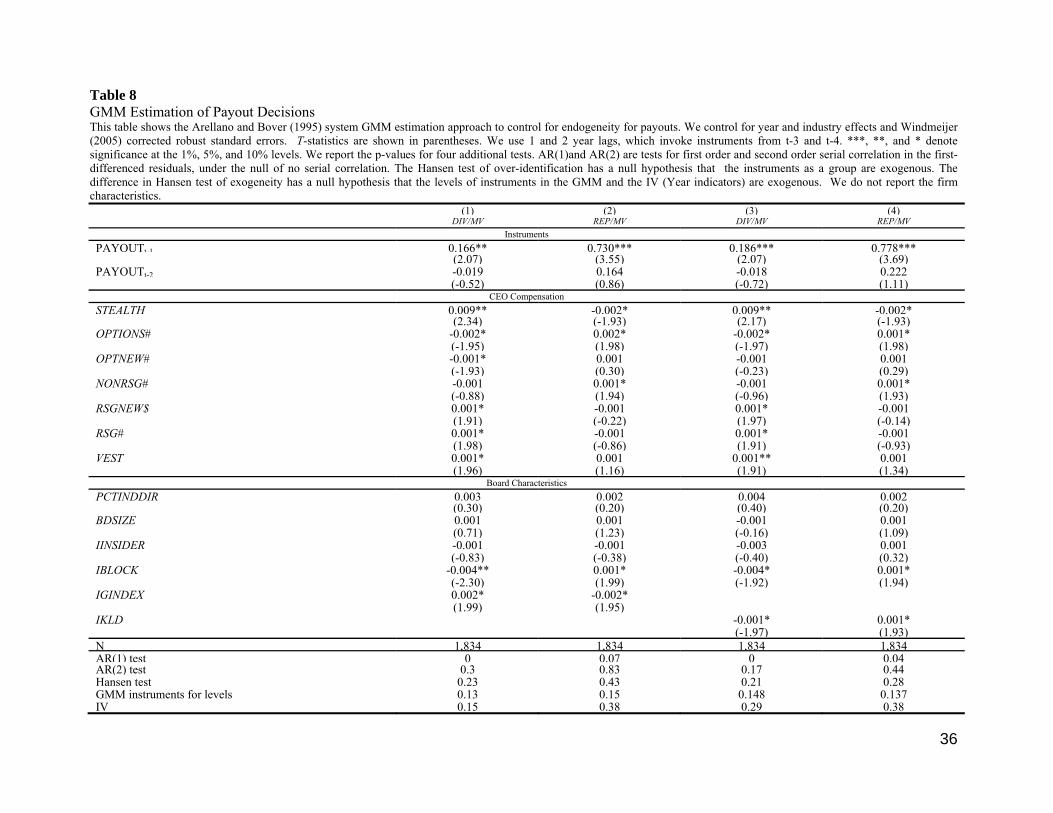
36
Table 8 GMM Estimation of Payout Decisions This table shows the Arellano and Bover (1995) system GMM estimation approach to control for endogeneity for payouts. We control for year and industry effects and Windmeijer (2005) corrected robust standard errors. T-statistics are shown in parentheses. We use 1 and 2 year lags, which invoke instruments from t-3 and t-4. ***, **, and * denote significance at the 1%, 5%, and 10% levels. We report the p-values for four additional tests. AR(1)and AR(2) are tests for first order and second order serial correlation in the first-differenced residuals, under the null of no serial correlation. The Hansen test of over-identification has a null hypothesis that the instruments as a group are exogenous. The difference in Hansen test of exogeneity has a null hypothesis that the levels of instruments in the GMM and the IV (Year indicators) are exogenous. We do not report the firm characteristics.
(1) (2) (3) (4) DIV/MV REP/MV DIV/MV REP/MV
Instruments
PAYOUTt-1 0.166** 0.730*** 0.186*** 0.778*** (2.07) (3.55) (2.07) (3.69)PAYOUTt-2 -0.019 0.164 -0.018 0.222 (-0.52) (0.86) (-0.72) (1.11)
CEO Compensation
STEALTH 0.009** -0.002* 0.009** -0.002* (2.34) (-1.93) (2.17) (-1.93)OPTIONS# -0.002* 0.002* -0.002* 0.001* (-1.95) (1.98) (-1.97) (1.98)OPTNEW# -0.001* 0.001 -0.001 0.001 (-1.93) (0.30) (-0.23) (0.29)NONRSG# -0.001 0.001* -0.001 0.001* (-0.88) (1.94) (-0.96) (1.93)RSGNEW$ 0.001* -0.001 0.001* -0.001 (1.91) (-0.22) (1.97) (-0.14)RSG# 0.001* -0.001 0.001* -0.001 (1.98) (-0.86) (1.91) (-0.93)VEST 0.001* 0.001 0.001** 0.001 (1.96) (1.16) (1.91) (1.34)
Board Characteristics
PCTINDDIR 0.003 0.002 0.004 0.002 (0.30) (0.20) (0.40) (0.20)BDSIZE 0.001 0.001 -0.001 0.001 (0.71) (1.23) (-0.16) (1.09)IINSIDER -0.001 -0.001 -0.003 0.001 (-0.83) (-0.38) (-0.40) (0.32)IBLOCK -0.004** 0.001* -0.004* 0.001* (-2.30) (1.99) (-1.92) (1.94)IGINDEX 0.002* -0.002* (1.99) (1.95) IKLD -0.001* 0.001* (-1.97) (1.93)N 1,834 1,834 1,834 1,834AR(1) test 0 0.07 0 0.04AR(2) test 0.3 0.83 0.17 0.44Hansen test 0.23 0.43 0.21 0.28GMM instruments for levels 0.13 0.15 0.148 0.137IV 0.15 0.38 0.29 0.38
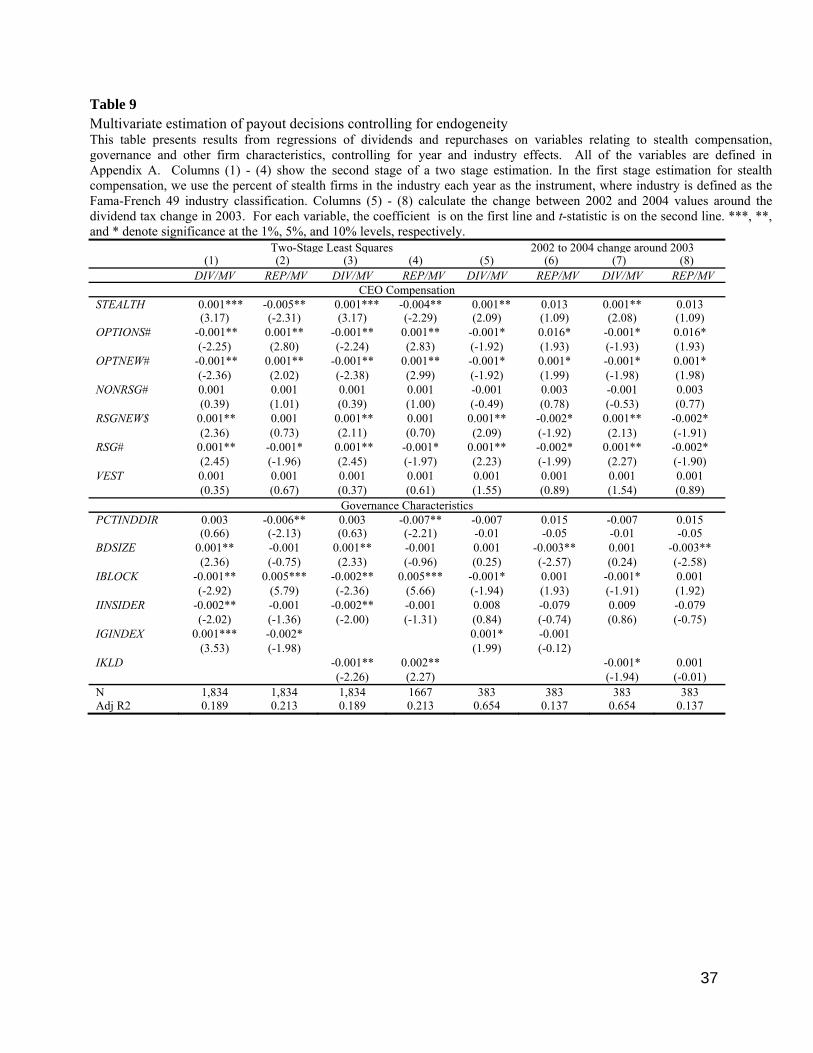
37
Table 9 Multivariate estimation of payout decisions controlling for endogeneity This table presents results from regressions of dividends and repurchases on variables relating to stealth compensation, governance and other firm characteristics, controlling for year and industry effects. All of the variables are defined in Appendix A. Columns (1) - (4) show the second stage of a two stage estimation. In the first stage estimation for stealth compensation, we use the percent of stealth firms in the industry each year as the instrument, where industry is defined as the Fama-French 49 industry classification. Columns (5) - (8) calculate the change between 2002 and 2004 values around the dividend tax change in 2003. For each variable, the coefficient is on the first line and t-statistic is on the second line. ***, **, and * denote significance at the 1%, 5%, and 10% levels, respectively.
Two-Stage Least Squares 2002 to 2004 change around 2003 (1) (2) (3) (4) (5) (6) (7) (8)
DIV/MV REP/MV DIV/MV REP/MV DIV/MV REP/MV DIV/MV REP/MVCEO Compensation
STEALTH 0.001*** -0.005** 0.001*** -0.004** 0.001** 0.013 0.001** 0.013(3.17) (-2.31) (3.17) (-2.29) (2.09) (1.09) (2.08) (1.09)
OPTIONS# -0.001** 0.001** -0.001** 0.001** -0.001* 0.016* -0.001* 0.016* (-2.25) (2.80) (-2.24) (2.83) (-1.92) (1.93) (-1.93) (1.93)
OPTNEW# -0.001** 0.001** -0.001** 0.001** -0.001* 0.001* -0.001* 0.001* (-2.36) (2.02) (-2.38) (2.99) (-1.92) (1.99) (-1.98) (1.98)
NONRSG# 0.001 0.001 0.001 0.001 -0.001 0.003 -0.001 0.003 (0.39) (1.01) (0.39) (1.00) (-0.49) (0.78) (-0.53) (0.77)
RSGNEW$ 0.001** 0.001 0.001** 0.001 0.001** -0.002* 0.001** -0.002* (2.36) (0.73) (2.11) (0.70) (2.09) (-1.92) (2.13) (-1.91)
RSG# 0.001** -0.001* 0.001** -0.001* 0.001** -0.002* 0.001** -0.002* (2.45) (-1.96) (2.45) (-1.97) (2.23) (-1.99) (2.27) (-1.90)
VEST 0.001 0.001 0.001 0.001 0.001 0.001 0.001 0.001 (0.35) (0.67) (0.37) (0.61) (1.55) (0.89) (1.54) (0.89)
Governance CharacteristicsPCTINDDIR 0.003 -0.006** 0.003 -0.007** -0.007 0.015 -0.007 0.015 (0.66) (-2.13) (0.63) (-2.21) -0.01 -0.05 -0.01 -0.05 BDSIZE 0.001** -0.001 0.001** -0.001 0.001 -0.003** 0.001 -0.003** (2.36) (-0.75) (2.33) (-0.96) (0.25) (-2.57) (0.24) (-2.58) IBLOCK -0.001** 0.005*** -0.002** 0.005*** -0.001* 0.001 -0.001* 0.001 (-2.92) (5.79) (-2.36) (5.66) (-1.94) (1.93) (-1.91) (1.92) IINSIDER -0.002** -0.001 -0.002** -0.001 0.008 -0.079 0.009 -0.079 (-2.02) (-1.36) (-2.00) (-1.31) (0.84) (-0.74) (0.86) (-0.75) IGINDEX 0.001*** -0.002* 0.001* -0.001
(3.53) (-1.98) (1.99) (-0.12) IKLD -0.001** 0.002** -0.001* 0.001
(-2.26) (2.27) (-1.94) (-0.01) N 1,834 1,834 1,834 1667 383 383 383 383Adj R2 0.189 0.213 0.189 0.213 0.654 0.137 0.654 0.137
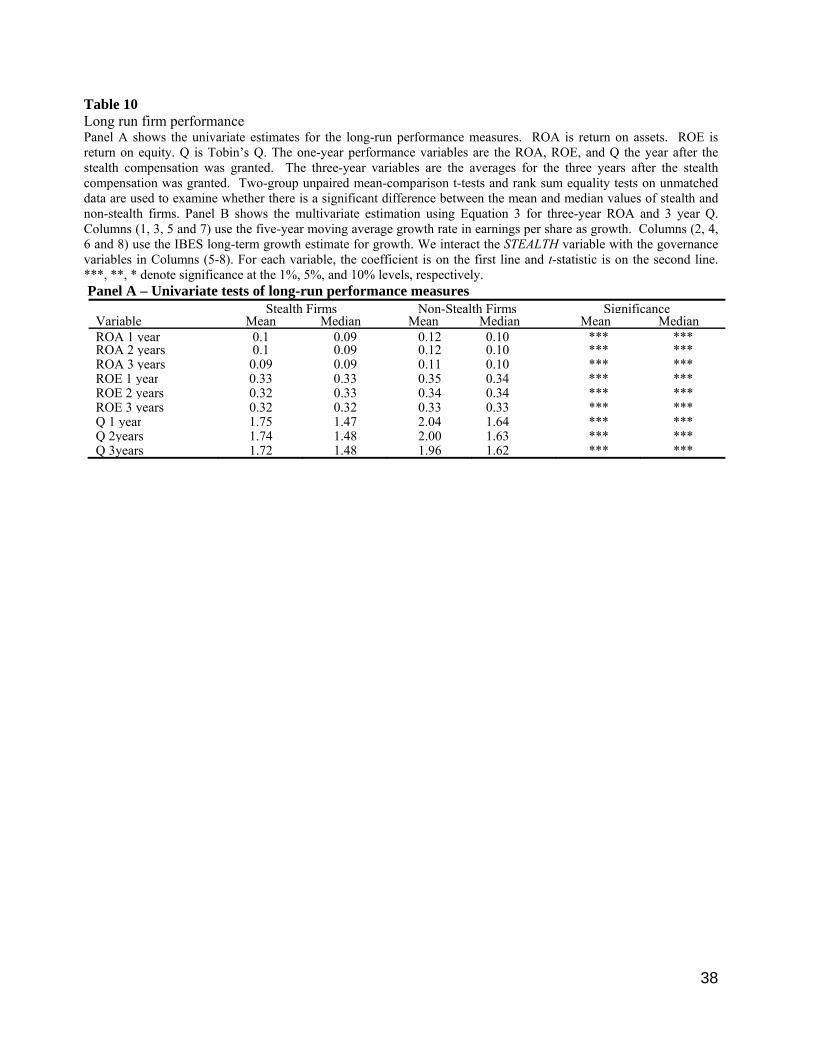
38
Table 10 Long run firm performance Panel A shows the univariate estimates for the long-run performance measures. ROA is return on assets. ROE is return on equity. Q is Tobin’s Q. The one-year performance variables are the ROA, ROE, and Q the year after the stealth compensation was granted. The three-year variables are the averages for the three years after the stealth compensation was granted. Two-group unpaired mean-comparison t-tests and rank sum equality tests on unmatched data are used to examine whether there is a significant difference between the mean and median values of stealth and non-stealth firms. Panel B shows the multivariate estimation using Equation 3 for three-year ROA and 3 year Q. Columns (1, 3, 5 and 7) use the five-year moving average growth rate in earnings per share as growth. Columns (2, 4, 6 and 8) use the IBES long-term growth estimate for growth. We interact the STEALTH variable with the governance variables in Columns (5-8). For each variable, the coefficient is on the first line and t-statistic is on the second line. ***, **, * denote significance at the 1%, 5%, and 10% levels, respectively. Panel A – Univariate tests of long-run performance measures
Stealth Firms Non-Stealth Firms SignificanceVariable Mean Median Mean Median Mean MedianROA 1 year 0.1 0.09 0.12 0.10 *** ***ROA 2 years 0.1 0.09 0.12 0.10 *** ***ROA 3 years 0.09 0.09 0.11 0.10 *** ***ROE 1 year 0.33 0.33 0.35 0.34 *** ***ROE 2 years 0.32 0.33 0.34 0.34 *** ***ROE 3 years 0.32 0.32 0.33 0.33 *** ***Q 1 year 1.75 1.47 2.04 1.64 *** ***Q 2years 1.74 1.48 2.00 1.63 *** ***Q 3years 1.72 1.48 1.96 1.62 *** ***
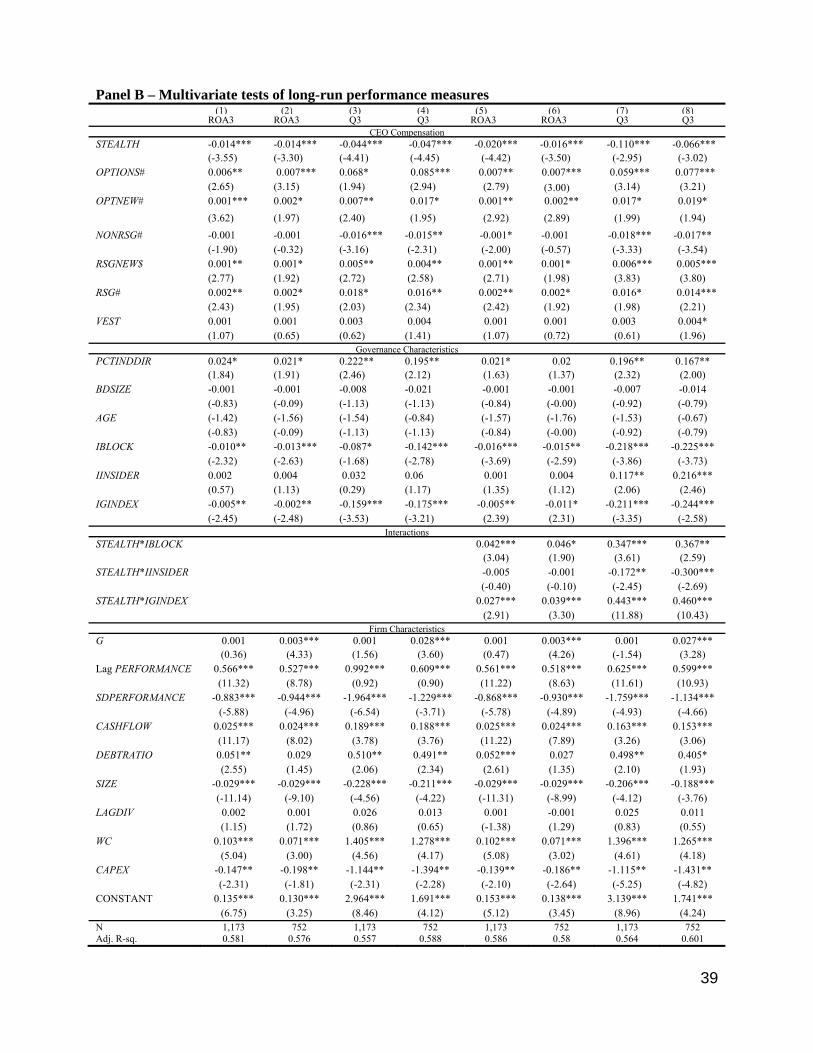
39
Panel B – Multivariate tests of long-run performance measures (1) (2) (3) (4) (5) (6) (7) (8) ROA3 ROA3 Q3 Q3 ROA3 ROA3 Q3 Q3
CEO CompensationSTEALTH -0.014*** -0.014*** -0.044*** -0.047*** -0.020*** -0.016*** -0.110*** -0.066***
(-3.55) (-3.30) (-4.41) (-4.45) (-4.42) (-3.50) (-2.95) (-3.02) OPTIONS# 0.006** 0.007*** 0.068* 0.085*** 0.007** 0.007*** 0.059*** 0.077***
(2.65) (3.15) (1.94) (2.94) (2.79) (3.00) (3.14) (3.21) OPTNEW# 0.001*** 0.002* 0.007** 0.017* 0.001** 0.002** 0.017* 0.019*
(3.62) (1.97) (2.40) (1.95) (2.92) (2.89) (1.99) (1.94)
NONRSG# -0.001 -0.001 -0.016*** -0.015** -0.001* -0.001 -0.018*** -0.017** (-1.90) (-0.32) (-3.16) (-2.31) (-2.00) (-0.57) (-3.33) (-3.54)
RSGNEW$ 0.001** 0.001* 0.005** 0.004** 0.001** 0.001* 0.006*** 0.005*** (2.77) (1.92) (2.72) (2.58) (2.71) (1.98) (3.83) (3.80)
RSG# 0.002** 0.002* 0.018* 0.016** 0.002** 0.002* 0.016* 0.014*** (2.43) (1.95) (2.03) (2.34) (2.42) (1.92) (1.98) (2.21)
VEST 0.001 0.001 0.003 0.004 0.001 0.001 0.003 0.004* (1.07) (0.65) (0.62) (1.41) (1.07) (0.72) (0.61) (1.96)
Governance CharacteristicsPCTINDDIR 0.024* 0.021* 0.222** 0.195** 0.021* 0.02 0.196** 0.167**
(1.84) (1.91) (2.46) (2.12) (1.63) (1.37) (2.32) (2.00) BDSIZE -0.001 -0.001 -0.008 -0.021 -0.001 -0.001 -0.007 -0.014
(-0.83) (-0.09) (-1.13) (-1.13) (-0.84) (-0.00) (-0.92) (-0.79) AGE (-1.42) (-1.56) (-1.54) (-0.84) (-1.57) (-1.76) (-1.53) (-0.67)
(-0.83) (-0.09) (-1.13) (-1.13) (-0.84) (-0.00) (-0.92) (-0.79) IBLOCK -0.010** -0.013*** -0.087* -0.142*** -0.016*** -0.015** -0.218*** -0.225*** (-2.32) (-2.63) (-1.68) (-2.78) (-3.69) (-2.59) (-3.86) (-3.73) IINSIDER 0.002 0.004 0.032 0.06 0.001 0.004 0.117** 0.216*** (0.57) (1.13) (0.29) (1.17) (1.35) (1.12) (2.06) (2.46) IGINDEX -0.005** -0.002** -0.159*** -0.175*** -0.005** -0.011* -0.211*** -0.244***
(-2.45) (-2.48) (-3.53) (-3.21) (2.39) (2.31) (-3.35) (-2.58) Interactions
STEALTH*IBLOCK 0.042*** 0.046* 0.347*** 0.367** (3.04) (1.90) (3.61) (2.59)
STEALTH*IINSIDER -0.005 -0.001 -0.172** -0.300*** (-0.40) (-0.10) (-2.45) (-2.69)
STEALTH*IGINDEX 0.027*** 0.039*** 0.443*** 0.460*** (2.91) (3.30) (11.88) (10.43)
Firm CharacteristicsG 0.001 0.003*** 0.001 0.028*** 0.001 0.003*** 0.001 0.027***
(0.36) (4.33) (1.56) (3.60) (0.47) (4.26) (-1.54) (3.28) Lag PERFORMANCE 0.566*** 0.527*** 0.992*** 0.609*** 0.561*** 0.518*** 0.625*** 0.599***
(11.32) (8.78) (0.92) (0.90) (11.22) (8.63) (11.61) (10.93) SDPERFORMANCE -0.883*** -0.944*** -1.964*** -1.229*** -0.868*** -0.930*** -1.759*** -1.134***
(-5.88) (-4.96) (-6.54) (-3.71) (-5.78) (-4.89) (-4.93) (-4.66) CASHFLOW 0.025*** 0.024*** 0.189*** 0.188*** 0.025*** 0.024*** 0.163*** 0.153***
(11.17) (8.02) (3.78) (3.76) (11.22) (7.89) (3.26) (3.06) DEBTRATIO 0.051** 0.029 0.510** 0.491** 0.052*** 0.027 0.498** 0.405*
(2.55) (1.45) (2.06) (2.34) (2.61) (1.35) (2.10) (1.93) SIZE -0.029*** -0.029*** -0.228*** -0.211*** -0.029*** -0.029*** -0.206*** -0.188***
(-11.14) (-9.10) (-4.56) (-4.22) (-11.31) (-8.99) (-4.12) (-3.76) LAGDIV 0.002 0.001 0.026 0.013 0.001 -0.001 0.025 0.011
(1.15) (1.72) (0.86) (0.65) (-1.38) (1.29) (0.83) (0.55) WC 0.103*** 0.071*** 1.405*** 1.278*** 0.102*** 0.071*** 1.396*** 1.265***
(5.04) (3.00) (4.56) (4.17) (5.08) (3.02) (4.61) (4.18) CAPEX -0.147** -0.198** -1.144** -1.394** -0.139** -0.186** -1.115** -1.431**
(-2.31) (-1.81) (-2.31) (-2.28) (-2.10) (-2.64) (-5.25) (-4.82) CONSTANT 0.135*** 0.130*** 2.964*** 1.691*** 0.153*** 0.138*** 3.139*** 1.741*** (6.75) (3.25) (8.46) (4.12) (5.12) (3.45) (8.96) (4.24) N 1,173 752 1,173 752 1,173 752 1,173 752Adj. R-sq. 0.581 0.576 0.557 0.588 0.586 0.58 0.564 0.601

40
Appendix A –Variable Definitions
Variable Description Source Measurement STEALTH Indicator variable equal to 1 for firms paying stealth
compensation Proxy
DPS Dividend per share. Compustat Ratio DIV/MV Ratio of the total dividends paid to market value of
equity Compustat Ratio
REP/MV Dollar amount spent on repurchases minus any decrease in the par value of preferred stock, divided by the market value of equity
Compustat Ratio
G Five year moving average growth rate in earnings per share
Compustat Decimal
FUTURE G Projected long-term growth estimate IBES Decimal CASHFLOW Net income plus depreciation and amortization Compustat MMs DEBTRATIO Ratio of long-term debt to total assets Compustat Ratio
ASSETS Assets on the balance sheet at year end Compustat MMs SIZE Log of market value of equity at year end Compustat Log(MMs)
LAGDIV Dividends lagged one year Compustat Ratio WC Working capital scaled by total assets Compustat Ratio MV End-of-year market value of equity Compustat MMs ROA Net income divided by total assets Compustat Ratio
CAPEX Capital expenditures divided by total assets Compustat Ratio BKMK Ratio of book value of equity to market value of equity Compustat Ratio
Q Market value of equity plus book value of short- and long-term debt divided by book value of assets
Compustat Ratio
RSG$ Dollar value of RSG holdings of the CEO Execucomp Thousands RSG# Number of RSG shares held by the CEO Execucomp Thousands
RSGNEW$ Dollar amount of newly granted RSGs to the CEO Execucomp Thousands NONRSG# Number of unrestricted shares owned by the CEO Execucomp Thousands OPTNEW# Number of new stock options granted to the CEO Execucomp Thousands OPTIONS# Number of options held by the CEO Execucomp Thousands
VEST The number of years until the RSGs vest Risk Metrics
AGE Age of the CEO Execucomp CEOSHARES Number of shares owned by the CEO Execucomp Thousands TOTAL CASH Sum of salary and bonus of CEO Execucomp Thousands
TDC1 Total compensation including cash, incentive, and other compensation
Execucomp Thousands
PCTINDDIR Percentage of directors who are independent Risk Metrics
Percentage
BDSIZE Number of people on the board Risk Metrics
INSIDERPCT The sum of executive and board share ownership divided by shares outstanding
Risk Metrics
Decimal
INSTPCT The sum of institutional ownership divided by shares outstanding
Thompson Financial
Decimal
BLOCK The total number of blockholders with more than 1% ownership in the firm
Thompson Financial
GINDEX Index of 24 governance provisions from Risk Metrics where 26 is poor governance and 0 is good governance.
Risk Metrics
KLD Index where the corporate governance concerns are subtracted from corporate governance strengths.
Strengths include: Limited Compensation, Ownership
KLD
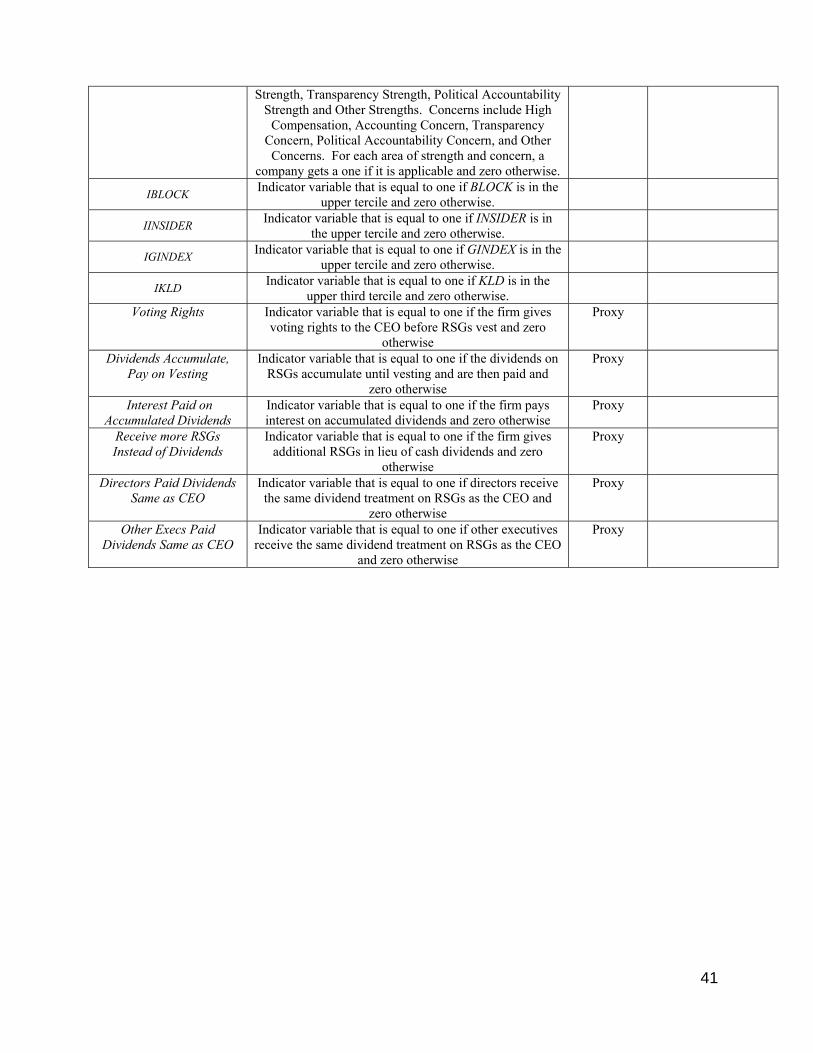
41
Strength, Transparency Strength, Political Accountability Strength and Other Strengths. Concerns include High
Compensation, Accounting Concern, Transparency Concern, Political Accountability Concern, and Other Concerns. For each area of strength and concern, a
company gets a one if it is applicable and zero otherwise.
IBLOCK Indicator variable that is equal to one if BLOCK is in the
upper tercile and zero otherwise.
IINSIDER Indicator variable that is equal to one if INSIDER is in
the upper tercile and zero otherwise.
IGINDEX Indicator variable that is equal to one if GINDEX is in the
upper tercile and zero otherwise.
IKLD Indicator variable that is equal to one if KLD is in the
upper third tercile and zero otherwise.
Voting Rights Indicator variable that is equal to one if the firm gives voting rights to the CEO before RSGs vest and zero
otherwise
Proxy
Dividends Accumulate, Pay on Vesting
Indicator variable that is equal to one if the dividends on RSGs accumulate until vesting and are then paid and
zero otherwise
Proxy
Interest Paid on Accumulated Dividends
Indicator variable that is equal to one if the firm pays interest on accumulated dividends and zero otherwise
Proxy
Receive more RSGs Instead of Dividends
Indicator variable that is equal to one if the firm gives additional RSGs in lieu of cash dividends and zero
otherwise
Proxy
Directors Paid Dividends Same as CEO
Indicator variable that is equal to one if directors receive the same dividend treatment on RSGs as the CEO and
zero otherwise
Proxy
Other Execs Paid Dividends Same as CEO
Indicator variable that is equal to one if other executives receive the same dividend treatment on RSGs as the CEO
and zero otherwise
Proxy


