Embed Size (px)
Citation preview
A Stochastic Version of the Brass PF Ratio Adjustment ofAge-Specific Fertility Schedules
Jack Baker*, Adelamar Alcantara, Xiaomin Ruan
Geospatial and Population Studies, University of New Mexico, Albuquerque, New Mexico, United States of America
Abstract
Estimates of age-specific fertility rates based on survey data are known to suffer down-bias associated with incompletereporting. Previously, William Brass (1964, 1965, 1968) proposed a series of adjustments of such data to reflect moreappropriate levels of fertility through comparison with data on children-ever-born by age, a measure of cohort-specificcumulative fertility. His now widely-used Parity/Fertility or PF ratio method makes a number of strong assumptions, whichhave been the focus of an extended discussion in the literature on indirect estimation. However, while it is clear that themeasures used in making adjusted age-specific fertility estimates with this method are captured with statistical uncertainty,little discussion of the nature of this uncertainty around PF-ratio based estimates of fertility has been entertained in theliterature. Since both age-specific risk of childbearing and cumulative parity (children ever born) are measured withstatistical uncertainty, an unknown credibility interval must surround every PF ratio-based estimate. Using the standardapproach, this is unknown, limiting the ability to make statistical comparisons of fertility between groups or to understandstochasticity in population dynamics. This paper makes use of approaches applied to similar problems in engineering, thenatural sciences, and decision analysis—often discussed under the title of uncertainty analysis or stochastic modeling—tocharacterize this uncertainty and to present a new method for making PF ratio-based fertility estimates with 95 percentuncertainty intervals. The implications for demographic analysis, between-group comparisons of fertility, and the field ofstatistical demography are explored.
Citation: Baker J, Alcantara A, Ruan X (2011) A Stochastic Version of the Brass PF Ratio Adjustment of Age-Specific Fertility Schedules. PLoS ONE 6(8): e23222.doi:10.1371/journal.pone.0023222
Editor: Enrico Scalas, Universita’ del Piemonte Orientale, Italy
Received February 14, 2011; Accepted July 14, 2011; Published August 4, 2011
Copyright: � 2011 Baker et al. This is an open-access article distributed under the terms of the Creative Commons Attribution License, which permitsunrestricted use, distribution, and reproduction in any medium, provided the original author and source are credited.
Funding: Funding for this research was provided by the State of New Mexico as part of an ongoing appropriation by the legislature to UNM’s Census DataDissemination and Demographic Analysis project. The funders had no role in study design, data collection and analysis, decision to publish, or preparation of themanuscript.
Competing Interests: The authors have declared that no competing interests exist.
* E-mail: [email protected]
Introduction
Population dynamics are driven by the often complex interplay
of demographic components of change including births, deaths,
immigration, and emigration [1,2,3]. Obviously, modeling popu-
lation change for purposes of either basic research or applied
demography (population estimation or projection) requires
adequate measures of these components [4,5,6]; however, their
estimation can be highly challenging in developing settings where
administrative infrastructures for capturing these data may be
lacking [7,8,10]. Given the importance of such models for both
public policy and basic scientific research on population, a strong
motivation exists to either improve administrative data capture or
develop methods for modeling population change with incomplete
data [1,8] In spite of its shortcomings, development of models is
much less problematic than reforming administrative data capture
and this reality has led to the development of numerous methods
for modeling population change with incomplete or missing data
[8,10,11,12]. Given its importance to both public policy as well as
short-term changes in population growth rates and age-structure
[1,12,13] methods for estimating age-specific and total fertility
rates (see glossary—Figure S1—for terms used in this paper) using
incomplete and clearly under-reported survey data have enjoyed
particular prominence in the literature on indirect estimation
[1,4,8,11,14,15,16,17].
As early as 1964, William Brass suggested the possibility that
given an assumption that underreporting is equivalent across age
groups, period measures of age-specific fertility could be adjusted
by leveraging information on cohort parity such as the average
number of children ever born to a woman of a given age [7]. Since
that time, Brass and others have developed a number of methods
for accomplishing such adjustments [10,15,16]. The proposed
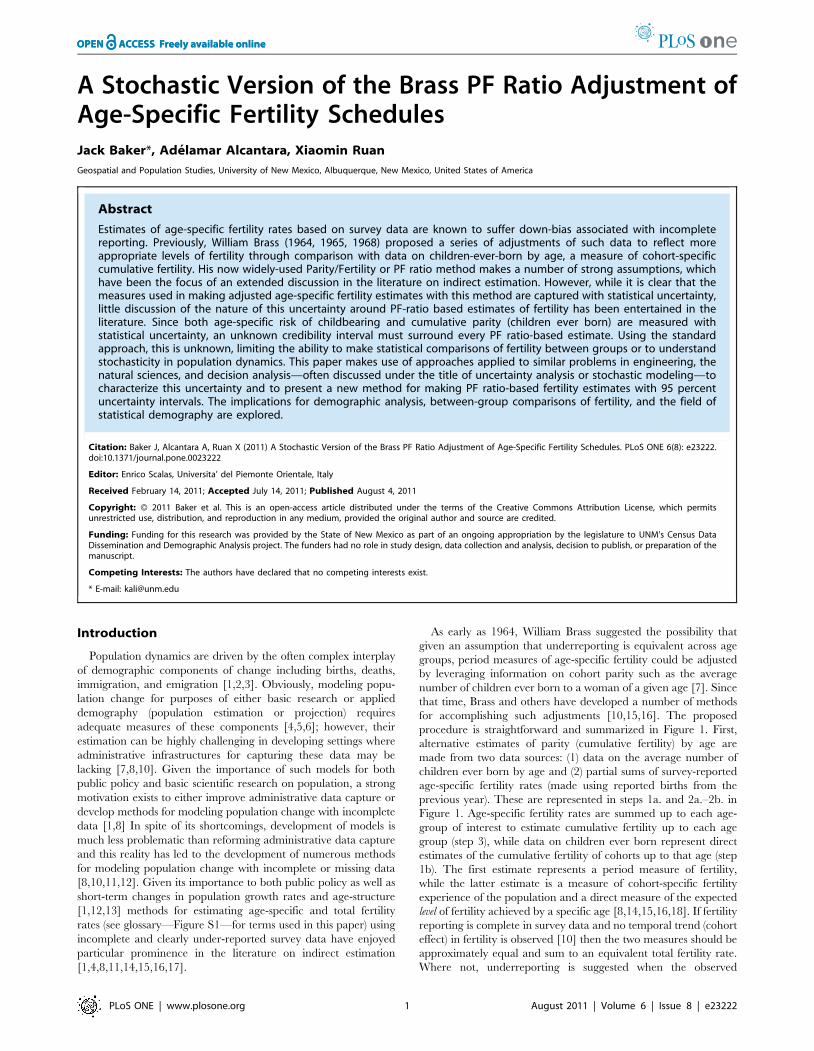
procedure is straightforward and summarized in Figure 1. First,
alternative estimates of parity (cumulative fertility) by age are
made from two data sources: (1) data on the average number of
children ever born by age and (2) partial sums of survey-reported
age-specific fertility rates (made using reported births from the
previous year). These are represented in steps 1a. and 2a.–2b. in
Figure 1. Age-specific fertility rates are summed up to each age-
group of interest to estimate cumulative fertility up to each age
group (step 3), while data on children ever born represent direct
estimates of the cumulative fertility of cohorts up to that age (step
1b). The first estimate represents a period measure of fertility,
while the latter estimate is a measure of cohort-specific fertility
experience of the population and a direct measure of the expected
level of fertility achieved by a specific age [8,14,15,16,18]. If fertility
reporting is complete in survey data and no temporal trend (cohort
effect) in fertility is observed [10] then the two measures should be
approximately equal and sum to an equivalent total fertility rate.
Where not, underreporting is suggested when the observed
PLoS ONE | www.plosone.org 1 August 2011 | Volume 6 | Issue 8 | e23222
cumulative fertility in the period data is less than the average
cohort parity in the age group of interest. Armed with these two
sources of information on cumulative fertility, parity/fertility ratios
(children ever born/survey-based estimate of parity by age) are
computed for each age-group (step 4 in Figure 1), one of which is
chosen to adjust observed estimates of age-specific fertility (Step 5).
The adjusted estimates are then made (Step 6), which have an
identical age-specific patterning of fertility (from the period data)
but a higher overall level of achieved fertility captured in the cohort
measures [1,8,14]. The method is presumed to remediate the
down-bias in the magnitude of fertility measures obtained in
survey data, given the assumption that children ever born data are
more reliably recalled in general [8].
While there is no set algorithm for determining which PF ratio
to use [12,18], most demographers have suggested that using the
PF ratio for younger age groups might tend to produce unreliable
estimates since a greater proportion of women will not have
experienced childbirth [1,8,18]. Likewise, since parity measures
include the cumulation of complete fertility histories, it has also
been suggested that use of later ratios might be biased by
incomplete recall of birth histories among older women [8]. The
United Nations’ Manual X [8] suggests the use of P2/F2 (20–24),
but a general guideline of choosing the P3/F3 (25–29) ratio as a
viable alternative has also been repeatedly entertained [1,8,9,14].
In practice, demographers often depend on review of the data to
choose a reasonable alternative when the ratio of adjustments
shows an age-specific patterning [10,18]. In spite of the lack of a
clear decision criteria, demographic intuition is often thought to
provide a reliable indicator upon which to choose an appropriate
PF ratio [1,18].
Table 1 provides an example of this procedure for the Bihar
Province of India, using a combination of data on age-specific
fertility risk from the Sample Registration System of India (1996–
1998 vintage) in conjunction with data on children-ever-born by
age from the Demographic and Health Survey conducted in the
province in 1998. The method corresponds to variant B3, reported
in the UN Manual X [8], which involves use of survey data from
two separate sources: one estimating age-specific fertility and the
other estimating children-ever-born (see p. 30). Column 1 reports
the SRS-based estimate of age-specific fertility, which corresponds
to step 2b. in Figure 1. Column 2 presents cumulative fertility by
age—an estimate of parity that corresponds to step 3 in Figure 1.
Column 3 presents the DHS-based estimate of children-ever-born
by age (Step 1b in Figure 1). Column 4 provides the PF ratio
estimates for each five-year age interval from 15–19 to 45–49 [8],
which are simply the ratios of column 2 values to column 3 values.
These correspond to step 4 in Figure 1. Column 5 presents each
ASFR from column 2, multiplied against the P3/F3 ratio (for ages
25–29) in column 4 to arrive at the PF-ratio adjusted estimate (step
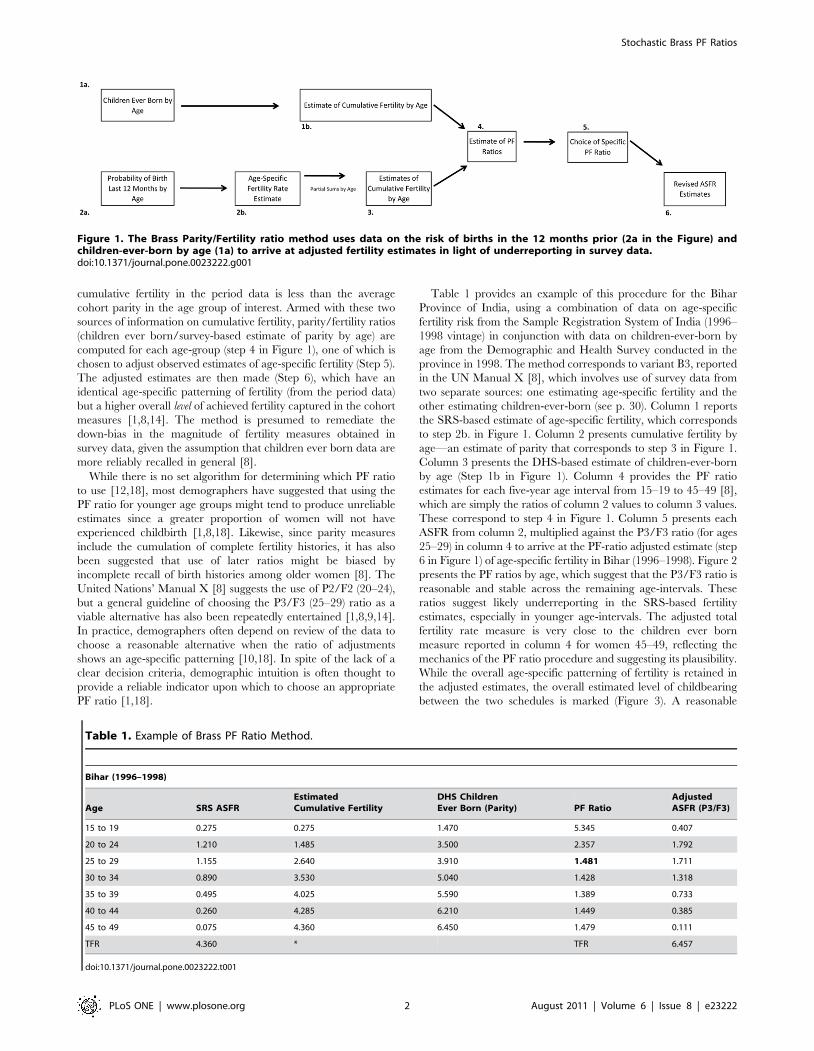
6 in Figure 1) of age-specific fertility in Bihar (1996–1998). Figure 2
presents the PF ratios by age, which suggest that the P3/F3 ratio is
reasonable and stable across the remaining age-intervals. These
ratios suggest likely underreporting in the SRS-based fertility
estimates, especially in younger age-intervals. The adjusted total
fertility rate measure is very close to the children ever born
measure reported in column 4 for women 45–49, reflecting the
mechanics of the PF ratio procedure and suggesting its plausibility.
While the overall age-specific patterning of fertility is retained in
the adjusted estimates, the overall estimated level of childbearing
between the two schedules is marked (Figure 3). A reasonable
Figure 1. The Brass Parity/Fertility ratio method uses data on the risk of births in the 12 months prior (2a in the Figure) andchildren-ever-born by age (1a) to arrive at adjusted fertility estimates in light of underreporting in survey data.doi:10.1371/journal.pone.0023222.g001
Table 1. Example of Brass PF Ratio Method.
Bihar (1996–1998)
Age SRS ASFR
Estimated
Cumulative Fertility
DHS Children
Ever Born (Parity) PF Ratio
Adjusted
ASFR (P3/F3)
15 to 19 0.275 0.275 1.470 5.345 0.407
20 to 24 1.210 1.485 3.500 2.357 1.792
25 to 29 1.155 2.640 3.910 1.481 1.711
30 to 34 0.890 3.530 5.040 1.428 1.318
35 to 39 0.495 4.025 5.590 1.389 0.733
40 to 44 0.260 4.285 6.210 1.449 0.385
45 to 49 0.075 4.360 6.450 1.479 0.111
TFR 4.360 * TFR 6.457
doi:10.1371/journal.pone.0023222.t001
Stochastic Brass PF Ratios
PLoS ONE | www.plosone.org 2 August 2011 | Volume 6 | Issue 8 | e23222
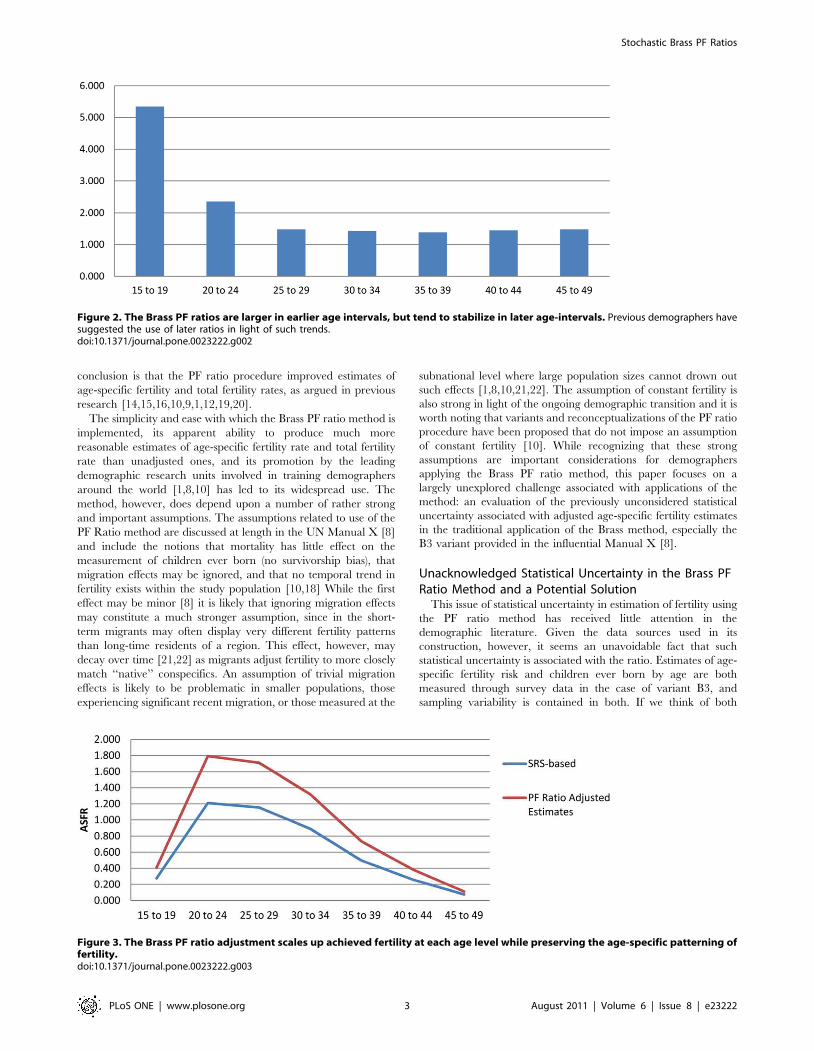
conclusion is that the PF ratio procedure improved estimates of
age-specific fertility and total fertility rates, as argued in previous
research [14,15,16,10,9,1,12,19,20].
The simplicity and ease with which the Brass PF ratio method is
implemented, its apparent ability to produce much more
reasonable estimates of age-specific fertility rate and total fertility
rate than unadjusted ones, and its promotion by the leading
demographic research units involved in training demographers
around the world [1,8,10] has led to its widespread use. The
method, however, does depend upon a number of rather strong
and important assumptions. The assumptions related to use of the
PF Ratio method are discussed at length in the UN Manual X [8]
and include the notions that mortality has little effect on the
measurement of children ever born (no survivorship bias), that
migration effects may be ignored, and that no temporal trend in
fertility exists within the study population [10,18] While the first
effect may be minor [8] it is likely that ignoring migration effects
may constitute a much stronger assumption, since in the short-
term migrants may often display very different fertility patterns
than long-time residents of a region. This effect, however, may
decay over time [21,22] as migrants adjust fertility to more closely
match ‘‘native’’ conspecifics. An assumption of trivial migration
effects is likely to be problematic in smaller populations, those
experiencing significant recent migration, or those measured at the
subnational level where large population sizes cannot drown out
such effects [1,8,10,21,22]. The assumption of constant fertility is
also strong in light of the ongoing demographic transition and it is
worth noting that variants and reconceptualizations of the PF ratio
procedure have been proposed that do not impose an assumption
of constant fertility [10]. While recognizing that these strong
assumptions are important considerations for demographers
applying the Brass PF ratio method, this paper focuses on a
largely unexplored challenge associated with applications of the
method: an evaluation of the previously unconsidered statistical
uncertainty associated with adjusted age-specific fertility estimates
in the traditional application of the Brass method, especially the
B3 variant provided in the influential Manual X [8].
Unacknowledged Statistical Uncertainty in the Brass PFRatio Method and a Potential SolutionThis issue of statistical uncertainty in estimation of fertility using
the PF ratio method has received little attention in the
demographic literature. Given the data sources used in its
construction, however, it seems an unavoidable fact that such
statistical uncertainty is associated with the ratio. Estimates of age-
specific fertility risk and children ever born by age are both
measured through survey data in the case of variant B3, and
sampling variability is contained in both. If we think of both
Figure 2. The Brass PF ratios are larger in earlier age intervals, but tend to stabilize in later age-intervals. Previous demographers havesuggested the use of later ratios in light of such trends.doi:10.1371/journal.pone.0023222.g002
Figure 3. The Brass PF ratio adjustment scales up achieved fertility at each age level while preserving the age-specific patterning offertility.doi:10.1371/journal.pone.0023222.g003
Stochastic Brass PF Ratios
PLoS ONE | www.plosone.org 3 August 2011 | Volume 6 | Issue 8 | e23222
estimates as inputs to the PF ratio estimate, then the adjusted age-
specific fertility schedules represent an output into which the
uncertainty associated with each input is propagated. This
uncertainty has not received an adequate amount of attention
within the demographic literature, perhaps because demographers
remain unfamiliar with potential solutions to the challenge and often
make little use of statistical theory in their work [23]. Analogous
problems, however, arise in engineering and applications of dynamic
modeling and a number of approaches have been developed to deal
with them under the label of uncertainty analysis or stochastic modeling
[24,25,26,27,28,29]. As is the case with the PF-ratio adjusted
estimates of fertility, often the challenge revolves around an
evaluation of how model inputs formulated with uncertainty affect
uncertainty in an output of interest [30]. This input/output
framework permits applications of monte carlo simulation in which
the probability distributions associated with inputs can be directly
related to the level and distribution of uncertainty associated with
output estimates [31,32,33,34,35,36,37,38]. This type of monte
carlo-based analysis of uncertainty has been undertaken in the
literature on animal demography [39,40,41,42,43], but to our
knowledge has not been previously applied to human demographic
studies. Here, monte-carlo resampling algorithms are employed to
estimate the uncertainty associated with estimates of age-specific
fertility rates made using PF-ratio (variant 3) adjustments and to
compute uncertainty intervals about the estimates.
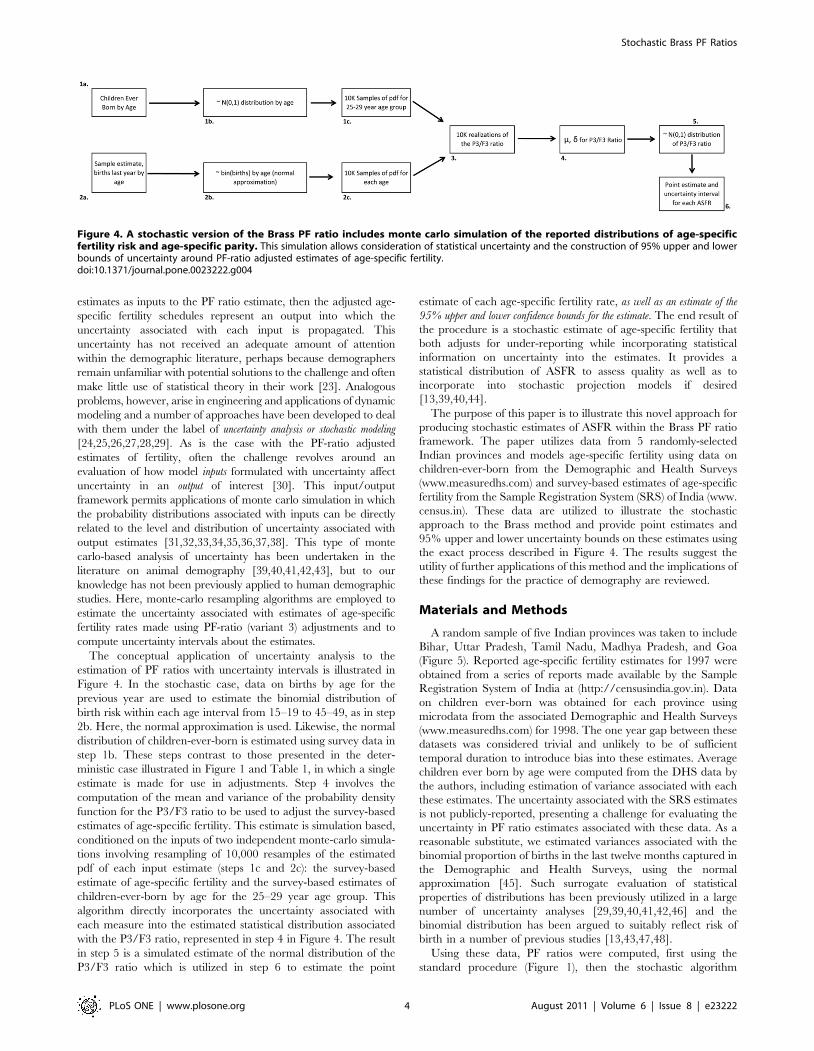
The conceptual application of uncertainty analysis to the
estimation of PF ratios with uncertainty intervals is illustrated in
Figure 4. In the stochastic case, data on births by age for the
previous year are used to estimate the binomial distribution of
birth risk within each age interval from 15–19 to 45–49, as in step
2b. Here, the normal approximation is used. Likewise, the normal
distribution of children-ever-born is estimated using survey data in
step 1b. These steps contrast to those presented in the deter-
ministic case illustrated in Figure 1 and Table 1, in which a single
estimate is made for use in adjustments. Step 4 involves the
computation of the mean and variance of the probability density
function for the P3/F3 ratio to be used to adjust the survey-based
estimates of age-specific fertility. This estimate is simulation based,
conditioned on the inputs of two independent monte-carlo simula-
tions involving resampling of 10,000 resamples of the estimated
pdf of each input estimate (steps 1c and 2c): the survey-based
estimate of age-specific fertility and the survey-based estimates of
children-ever-born by age for the 25–29 year age group. This
algorithm directly incorporates the uncertainty associated with
each measure into the estimated statistical distribution associated
with the P3/F3 ratio, represented in step 4 in Figure 4. The result
in step 5 is a simulated estimate of the normal distribution of the
P3/F3 ratio which is utilized in step 6 to estimate the point
estimate of each age-specific fertility rate, as well as an estimate of the
95% upper and lower confidence bounds for the estimate. The end result of
the procedure is a stochastic estimate of age-specific fertility that
both adjusts for under-reporting while incorporating statistical
information on uncertainty into the estimates. It provides a
statistical distribution of ASFR to assess quality as well as to
incorporate into stochastic projection models if desired
[13,39,40,44].
The purpose of this paper is to illustrate this novel approach for
producing stochastic estimates of ASFR within the Brass PF ratio
framework. The paper utilizes data from 5 randomly-selected
Indian provinces and models age-specific fertility using data on
children-ever-born from the Demographic and Health Surveys
(www.measuredhs.com) and survey-based estimates of age-specific
fertility from the Sample Registration System (SRS) of India (www.
census.in). These data are utilized to illustrate the stochastic
approach to the Brass method and provide point estimates and
95% upper and lower uncertainty bounds on these estimates using
the exact process described in Figure 4. The results suggest the
utility of further applications of this method and the implications of
these findings for the practice of demography are reviewed.
Materials and Methods
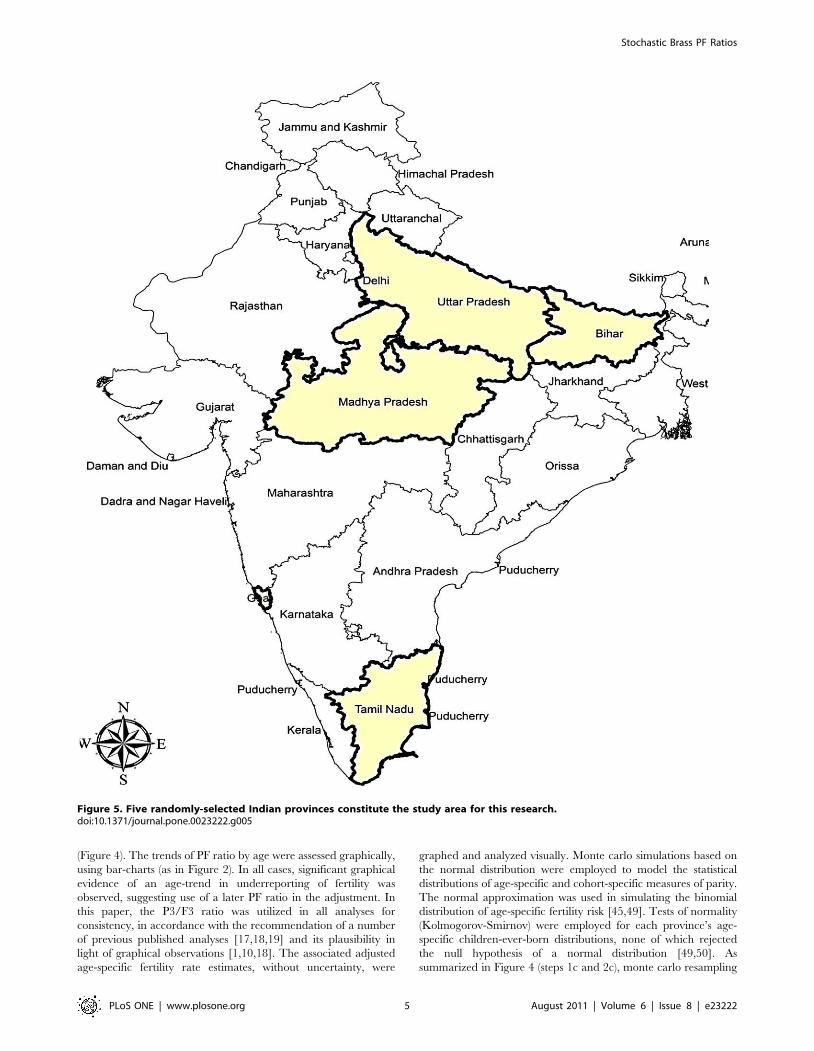
A random sample of five Indian provinces was taken to include
Bihar, Uttar Pradesh, Tamil Nadu, Madhya Pradesh, and Goa
(Figure 5). Reported age-specific fertility estimates for 1997 were
obtained from a series of reports made available by the Sample
Registration System of India at (http://censusindia.gov.in). Data
on children ever-born was obtained for each province using
microdata from the associated Demographic and Health Surveys
(www.measuredhs.com) for 1998. The one year gap between these
datasets was considered trivial and unlikely to be of sufficient
temporal duration to introduce bias into these estimates. Average
children ever born by age were computed from the DHS data by
the authors, including estimation of variance associated with each
these estimates. The uncertainty associated with the SRS estimates
is not publicly-reported, presenting a challenge for evaluating the
uncertainty in PF ratio estimates associated with these data. As a
reasonable substitute, we estimated variances associated with the
binomial proportion of births in the last twelve months captured in
the Demographic and Health Surveys, using the normal
approximation [45]. Such surrogate evaluation of statistical
properties of distributions has been previously utilized in a large
number of uncertainty analyses [29,39,40,41,42,46] and the
binomial distribution has been argued to suitably reflect risk of
birth in a number of previous studies [13,43,47,48].
Using these data, PF ratios were computed, first using the
standard procedure (Figure 1), then the stochastic algorithm
Figure 4. A stochastic version of the Brass PF ratio includes monte carlo simulation of the reported distributions of age-specificfertility risk and age-specific parity. This simulation allows consideration of statistical uncertainty and the construction of 95% upper and lowerbounds of uncertainty around PF-ratio adjusted estimates of age-specific fertility.doi:10.1371/journal.pone.0023222.g004
Stochastic Brass PF Ratios
PLoS ONE | www.plosone.org 4 August 2011 | Volume 6 | Issue 8 | e23222
(Figure 4). The trends of PF ratio by age were assessed graphically,
using bar-charts (as in Figure 2). In all cases, significant graphical
evidence of an age-trend in underreporting of fertility was
observed, suggesting use of a later PF ratio in the adjustment. In
this paper, the P3/F3 ratio was utilized in all analyses for
consistency, in accordance with the recommendation of a number
of previous published analyses [17,18,19] and its plausibility in
light of graphical observations [1,10,18]. The associated adjusted
age-specific fertility rate estimates, without uncertainty, were
graphed and analyzed visually. Monte carlo simulations based on
the normal distribution were employed to model the statistical
distributions of age-specific and cohort-specific measures of parity.
The normal approximation was used in simulating the binomial
distribution of age-specific fertility risk [45,49]. Tests of normality
(Kolmogorov-Smirnov) were employed for each province’s age-
specific children-ever-born distributions, none of which rejected
the null hypothesis of a normal distribution [49,50]. As
summarized in Figure 4 (steps 1c and 2c), monte carlo resampling
Figure 5. Five randomly-selected Indian provinces constitute the study area for this research.doi:10.1371/journal.pone.0023222.g005
Stochastic Brass PF Ratios
PLoS ONE | www.plosone.org 5 August 2011 | Volume 6 | Issue 8 | e23222
was employed, involving 10,000 draws from the estimated ASFR
distribution for ages 15–19, 20–24, and 25–29, then summation of
these rates as the period measure of cumulative fertility by 25–29
years, followed by monte carlo resampling from the distribution of
children ever born in the 25–29 age group. The associated
distribution of the P3/F3 ratio was estimated using these inputs,
recalculated at each round of the simulation, to 10 K draws. The
resulting PF ratios were then used to adjust the SRS ASFR
estimates and characterize the distribution of age-specific fertility
distributions in each age-group with a point estimate and 95
percent upper and lower bounds of the uncertainty interval. All
simulations were accomplished through original code written in
the R statistical package. An annotated sample of this code is
provided in Figure S2.
Results
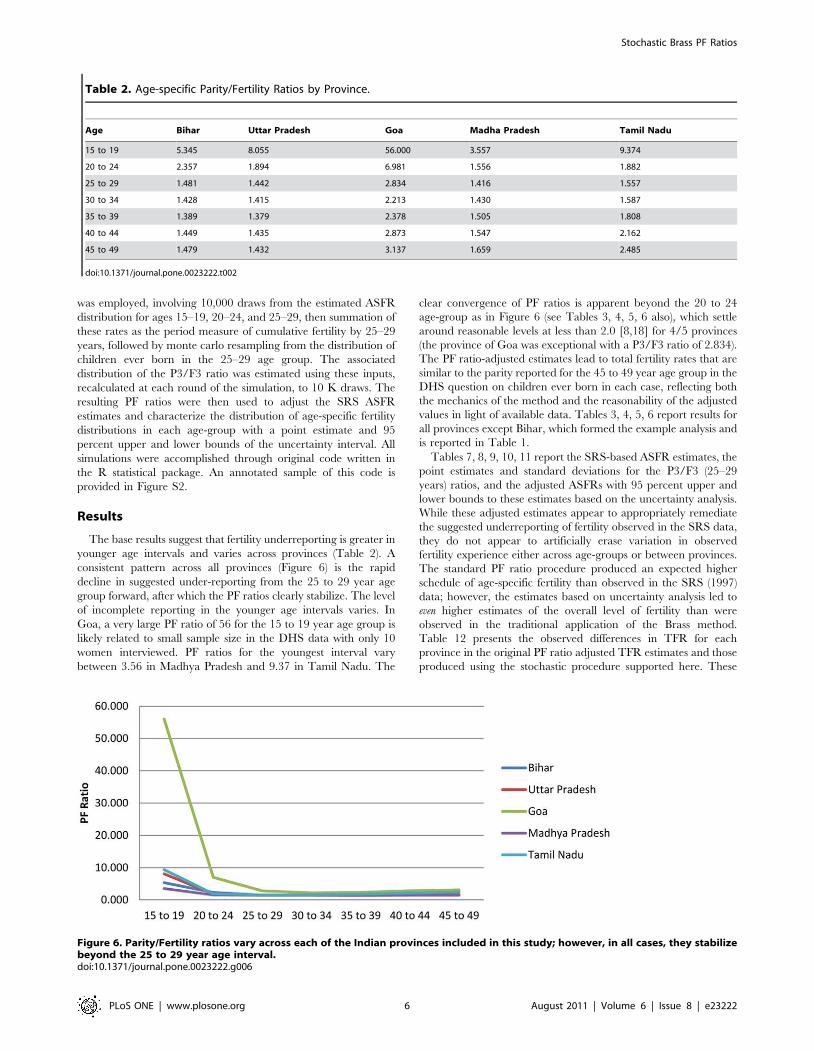
The base results suggest that fertility underreporting is greater in
younger age intervals and varies across provinces (Table 2). A
consistent pattern across all provinces (Figure 6) is the rapid
decline in suggested under-reporting from the 25 to 29 year age
group forward, after which the PF ratios clearly stabilize. The level
of incomplete reporting in the younger age intervals varies. In
Goa, a very large PF ratio of 56 for the 15 to 19 year age group is
likely related to small sample size in the DHS data with only 10
women interviewed. PF ratios for the youngest interval vary
between 3.56 in Madhya Pradesh and 9.37 in Tamil Nadu. The
clear convergence of PF ratios is apparent beyond the 20 to 24
age-group as in Figure 6 (see Tables 3, 4, 5, 6 also), which settle
around reasonable levels at less than 2.0 [8,18] for 4/5 provinces
(the province of Goa was exceptional with a P3/F3 ratio of 2.834).
The PF ratio-adjusted estimates lead to total fertility rates that are
similar to the parity reported for the 45 to 49 year age group in the
DHS question on children ever born in each case, reflecting both
the mechanics of the method and the reasonability of the adjusted
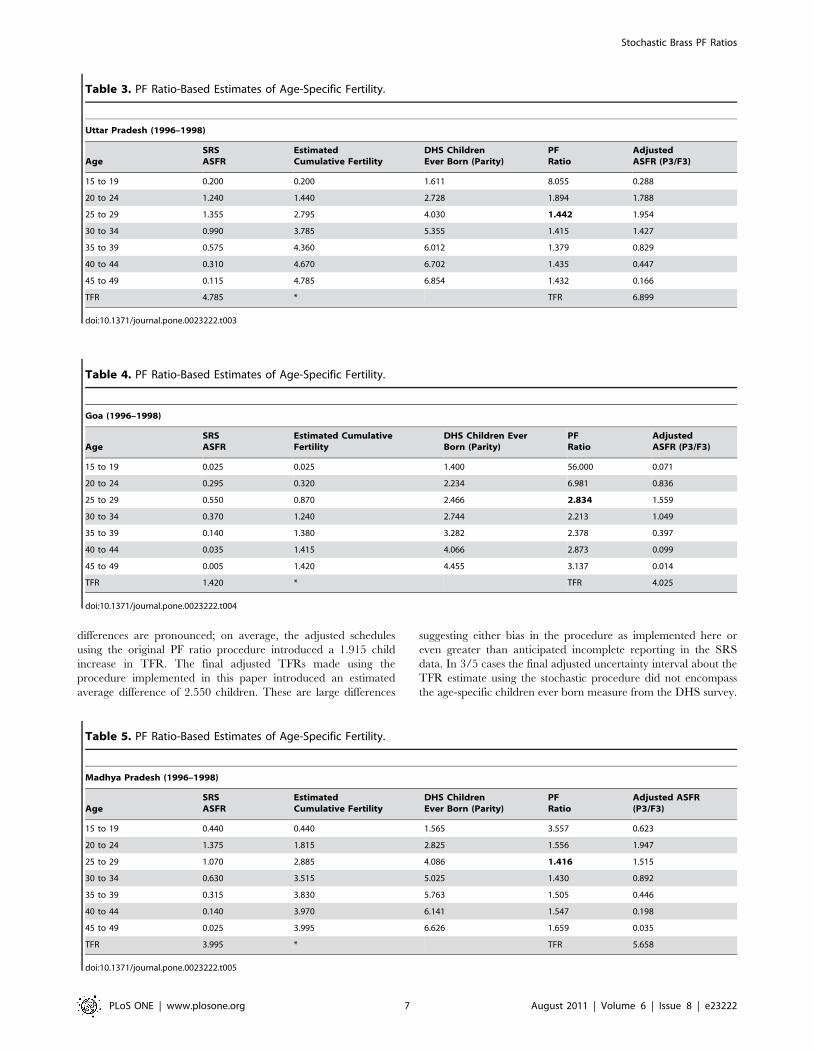
values in light of available data. Tables 3, 4, 5, 6 report results for
all provinces except Bihar, which formed the example analysis and
is reported in Table 1.
Tables 7, 8, 9, 10, 11 report the SRS-based ASFR estimates, the
point estimates and standard deviations for the P3/F3 (25–29
years) ratios, and the adjusted ASFRs with 95 percent upper and
lower bounds to these estimates based on the uncertainty analysis.
While these adjusted estimates appear to appropriately remediate
the suggested underreporting of fertility observed in the SRS data,
they do not appear to artificially erase variation in observed
fertility experience either across age-groups or between provinces.
The standard PF ratio procedure produced an expected higher
schedule of age-specific fertility than observed in the SRS (1997)
data; however, the estimates based on uncertainty analysis led to
even higher estimates of the overall level of fertility than were
observed in the traditional application of the Brass method.
Table 12 presents the observed differences in TFR for each
province in the original PF ratio adjusted TFR estimates and those
produced using the stochastic procedure supported here. These
Figure 6. Parity/Fertility ratios vary across each of the Indian provinces included in this study; however, in all cases, they stabilizebeyond the 25 to 29 year age interval.doi:10.1371/journal.pone.0023222.g006
Table 2. Age-specific Parity/Fertility Ratios by Province.
Age Bihar Uttar Pradesh Goa Madha Pradesh Tamil Nadu
15 to 19 5.345 8.055 56.000 3.557 9.374
20 to 24 2.357 1.894 6.981 1.556 1.882
25 to 29 1.481 1.442 2.834 1.416 1.557
30 to 34 1.428 1.415 2.213 1.430 1.587
35 to 39 1.389 1.379 2.378 1.505 1.808
40 to 44 1.449 1.435 2.873 1.547 2.162
45 to 49 1.479 1.432 3.137 1.659 2.485
doi:10.1371/journal.pone.0023222.t002
Stochastic Brass PF Ratios
PLoS ONE | www.plosone.org 6 August 2011 | Volume 6 | Issue 8 | e23222
differences are pronounced; on average, the adjusted schedules
using the original PF ratio procedure introduced a 1.915 child
increase in TFR. The final adjusted TFRs made using the
procedure implemented in this paper introduced an estimated
average difference of 2.550 children. These are large differences
suggesting either bias in the procedure as implemented here or
even greater than anticipated incomplete reporting in the SRS
data. In 3/5 cases the final adjusted uncertainty interval about the
TFR estimate using the stochastic procedure did not encompass
the age-specific children ever born measure from the DHS survey.
Table 3. PF Ratio-Based Estimates of Age-Specific Fertility.
Uttar Pradesh (1996–1998)
Age
SRS
ASFR
Estimated
Cumulative Fertility
DHS Children
Ever Born (Parity)
PF
Ratio
Adjusted
ASFR (P3/F3)
15 to 19 0.200 0.200 1.611 8.055 0.288
20 to 24 1.240 1.440 2.728 1.894 1.788
25 to 29 1.355 2.795 4.030 1.442 1.954
30 to 34 0.990 3.785 5.355 1.415 1.427
35 to 39 0.575 4.360 6.012 1.379 0.829
40 to 44 0.310 4.670 6.702 1.435 0.447
45 to 49 0.115 4.785 6.854 1.432 0.166
TFR 4.785 * TFR 6.899
doi:10.1371/journal.pone.0023222.t003
Table 4. PF Ratio-Based Estimates of Age-Specific Fertility.
Goa (1996–1998)
Age
SRS
ASFR
Estimated Cumulative
Fertility
DHS Children Ever
Born (Parity)
PF
Ratio
Adjusted
ASFR (P3/F3)
15 to 19 0.025 0.025 1.400 56.000 0.071
20 to 24 0.295 0.320 2.234 6.981 0.836
25 to 29 0.550 0.870 2.466 2.834 1.559
30 to 34 0.370 1.240 2.744 2.213 1.049
35 to 39 0.140 1.380 3.282 2.378 0.397
40 to 44 0.035 1.415 4.066 2.873 0.099
45 to 49 0.005 1.420 4.455 3.137 0.014
TFR 1.420 * TFR 4.025
doi:10.1371/journal.pone.0023222.t004
Table 5. PF Ratio-Based Estimates of Age-Specific Fertility.
Madhya Pradesh (1996–1998)
Age
SRS
ASFR
Estimated
Cumulative Fertility
DHS Children
Ever Born (Parity)
PF
Ratio
Adjusted ASFR
(P3/F3)
15 to 19 0.440 0.440 1.565 3.557 0.623
20 to 24 1.375 1.815 2.825 1.556 1.947
25 to 29 1.070 2.885 4.086 1.416 1.515
30 to 34 0.630 3.515 5.025 1.430 0.892
35 to 39 0.315 3.830 5.763 1.505 0.446
40 to 44 0.140 3.970 6.141 1.547 0.198
45 to 49 0.025 3.995 6.626 1.659 0.035
TFR 3.995 * TFR 5.658
doi:10.1371/journal.pone.0023222.t005
Stochastic Brass PF Ratios
PLoS ONE | www.plosone.org 7 August 2011 | Volume 6 | Issue 8 | e23222
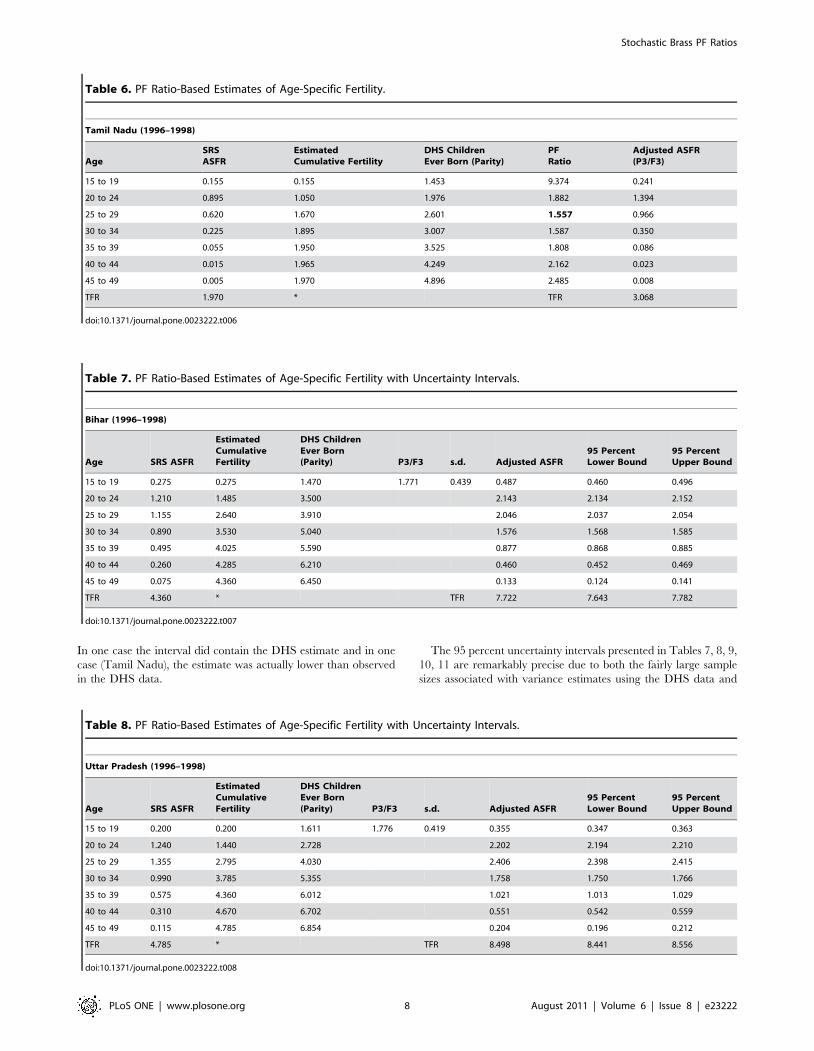
In one case the interval did contain the DHS estimate and in one
case (Tamil Nadu), the estimate was actually lower than observed
in the DHS data.
The 95 percent uncertainty intervals presented in Tables 7, 8, 9,
10, 11 are remarkably precise due to both the fairly large sample
sizes associated with variance estimates using the DHS data and
Table 6. PF Ratio-Based Estimates of Age-Specific Fertility.
Tamil Nadu (1996–1998)
Age
SRS
ASFR
Estimated
Cumulative Fertility
DHS Children
Ever Born (Parity)
PF
Ratio
Adjusted ASFR
(P3/F3)
15 to 19 0.155 0.155 1.453 9.374 0.241
20 to 24 0.895 1.050 1.976 1.882 1.394
25 to 29 0.620 1.670 2.601 1.557 0.966
30 to 34 0.225 1.895 3.007 1.587 0.350
35 to 39 0.055 1.950 3.525 1.808 0.086
40 to 44 0.015 1.965 4.249 2.162 0.023
45 to 49 0.005 1.970 4.896 2.485 0.008
TFR 1.970 * TFR 3.068
doi:10.1371/journal.pone.0023222.t006
Table 7. PF Ratio-Based Estimates of Age-Specific Fertility with Uncertainty Intervals.
Bihar (1996–1998)
Age SRS ASFR
Estimated
Cumulative
Fertility
DHS Children
Ever Born
(Parity) P3/F3 s.d. Adjusted ASFR
95 Percent
Lower Bound
95 Percent
Upper Bound
15 to 19 0.275 0.275 1.470 1.771 0.439 0.487 0.460 0.496
20 to 24 1.210 1.485 3.500 2.143 2.134 2.152
25 to 29 1.155 2.640 3.910 2.046 2.037 2.054
30 to 34 0.890 3.530 5.040 1.576 1.568 1.585
35 to 39 0.495 4.025 5.590 0.877 0.868 0.885
40 to 44 0.260 4.285 6.210 0.460 0.452 0.469
45 to 49 0.075 4.360 6.450 0.133 0.124 0.141
TFR 4.360 * TFR 7.722 7.643 7.782
doi:10.1371/journal.pone.0023222.t007
Table 8. PF Ratio-Based Estimates of Age-Specific Fertility with Uncertainty Intervals.
Uttar Pradesh (1996–1998)
Age SRS ASFR
Estimated
Cumulative
Fertility
DHS Children
Ever Born
(Parity) P3/F3 s.d. Adjusted ASFR
95 Percent
Lower Bound
95 Percent
Upper Bound
15 to 19 0.200 0.200 1.611 1.776 0.419 0.355 0.347 0.363
20 to 24 1.240 1.440 2.728 2.202 2.194 2.210
25 to 29 1.355 2.795 4.030 2.406 2.398 2.415
30 to 34 0.990 3.785 5.355 1.758 1.750 1.766
35 to 39 0.575 4.360 6.012 1.021 1.013 1.029
40 to 44 0.310 4.670 6.702 0.551 0.542 0.559
45 to 49 0.115 4.785 6.854 0.204 0.196 0.212
TFR 4.785 * TFR 8.498 8.441 8.556
doi:10.1371/journal.pone.0023222.t008
Stochastic Brass PF Ratios
PLoS ONE | www.plosone.org 8 August 2011 | Volume 6 | Issue 8 | e23222
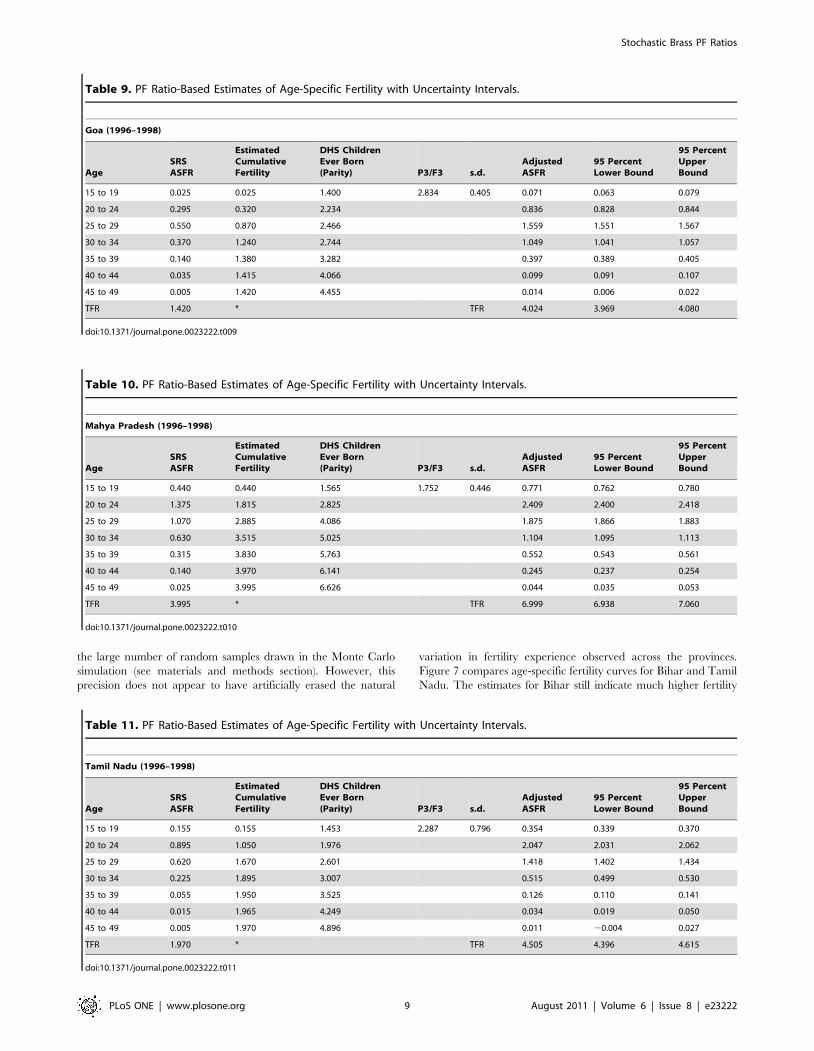
the large number of random samples drawn in the Monte Carlo
simulation (see materials and methods section). However, this
precision does not appear to have artificially erased the natural
variation in fertility experience observed across the provinces.
Figure 7 compares age-specific fertility curves for Bihar and Tamil
Nadu. The estimates for Bihar still indicate much higher fertility
Table 9. PF Ratio-Based Estimates of Age-Specific Fertility with Uncertainty Intervals.
Goa (1996–1998)
Age
SRS
ASFR
Estimated
Cumulative
Fertility
DHS Children
Ever Born
(Parity) P3/F3 s.d.
Adjusted
ASFR
95 Percent
Lower Bound
95 Percent
Upper
Bound
15 to 19 0.025 0.025 1.400 2.834 0.405 0.071 0.063 0.079
20 to 24 0.295 0.320 2.234 0.836 0.828 0.844
25 to 29 0.550 0.870 2.466 1.559 1.551 1.567
30 to 34 0.370 1.240 2.744 1.049 1.041 1.057
35 to 39 0.140 1.380 3.282 0.397 0.389 0.405
40 to 44 0.035 1.415 4.066 0.099 0.091 0.107
45 to 49 0.005 1.420 4.455 0.014 0.006 0.022
TFR 1.420 * TFR 4.024 3.969 4.080
doi:10.1371/journal.pone.0023222.t009
Table 10. PF Ratio-Based Estimates of Age-Specific Fertility with Uncertainty Intervals.
Mahya Pradesh (1996–1998)
Age
SRS
ASFR
Estimated
Cumulative
Fertility
DHS Children
Ever Born
(Parity) P3/F3 s.d.
Adjusted
ASFR
95 Percent
Lower Bound
95 Percent
Upper
Bound
15 to 19 0.440 0.440 1.565 1.752 0.446 0.771 0.762 0.780
20 to 24 1.375 1.815 2.825 2.409 2.400 2.418
25 to 29 1.070 2.885 4.086 1.875 1.866 1.883
30 to 34 0.630 3.515 5.025 1.104 1.095 1.113
35 to 39 0.315 3.830 5.763 0.552 0.543 0.561
40 to 44 0.140 3.970 6.141 0.245 0.237 0.254
45 to 49 0.025 3.995 6.626 0.044 0.035 0.053
TFR 3.995 * TFR 6.999 6.938 7.060
doi:10.1371/journal.pone.0023222.t010
Table 11. PF Ratio-Based Estimates of Age-Specific Fertility with Uncertainty Intervals.
Tamil Nadu (1996–1998)
Age
SRS
ASFR
Estimated
Cumulative
Fertility
DHS Children
Ever Born
(Parity) P3/F3 s.d.
Adjusted
ASFR
95 Percent
Lower Bound
95 Percent
Upper
Bound
15 to 19 0.155 0.155 1.453 2.287 0.796 0.354 0.339 0.370
20 to 24 0.895 1.050 1.976 2.047 2.031 2.062
25 to 29 0.620 1.670 2.601 1.418 1.402 1.434
30 to 34 0.225 1.895 3.007 0.515 0.499 0.530
35 to 39 0.055 1.950 3.525 0.126 0.110 0.141
40 to 44 0.015 1.965 4.249 0.034 0.019 0.050
45 to 49 0.005 1.970 4.896 0.011 20.004 0.027
TFR 1.970 * TFR 4.505 4.396 4.615
doi:10.1371/journal.pone.0023222.t011
Stochastic Brass PF Ratios
PLoS ONE | www.plosone.org 9 August 2011 | Volume 6 | Issue 8 | e23222
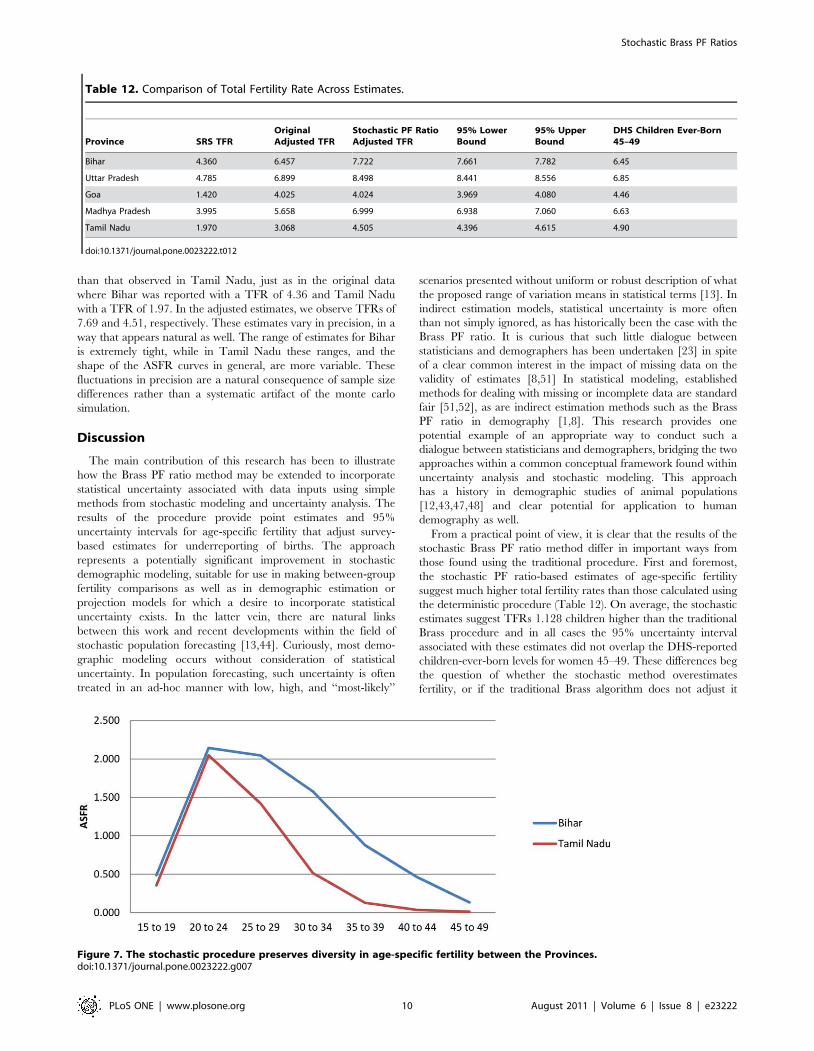
than that observed in Tamil Nadu, just as in the original data
where Bihar was reported with a TFR of 4.36 and Tamil Nadu
with a TFR of 1.97. In the adjusted estimates, we observe TFRs of
7.69 and 4.51, respectively. These estimates vary in precision, in a
way that appears natural as well. The range of estimates for Bihar
is extremely tight, while in Tamil Nadu these ranges, and the
shape of the ASFR curves in general, are more variable. These
fluctuations in precision are a natural consequence of sample size
differences rather than a systematic artifact of the monte carlo
simulation.
Discussion
The main contribution of this research has been to illustrate
how the Brass PF ratio method may be extended to incorporate
statistical uncertainty associated with data inputs using simple
methods from stochastic modeling and uncertainty analysis. The
results of the procedure provide point estimates and 95%
uncertainty intervals for age-specific fertility that adjust survey-
based estimates for underreporting of births. The approach
represents a potentially significant improvement in stochastic
demographic modeling, suitable for use in making between-group
fertility comparisons as well as in demographic estimation or
projection models for which a desire to incorporate statistical
uncertainty exists. In the latter vein, there are natural links
between this work and recent developments within the field of
stochastic population forecasting [13,44]. Curiously, most demo-
graphic modeling occurs without consideration of statistical
uncertainty. In population forecasting, such uncertainty is often
treated in an ad-hoc manner with low, high, and ‘‘most-likely’’
scenarios presented without uniform or robust description of what
the proposed range of variation means in statistical terms [13]. In
indirect estimation models, statistical uncertainty is more often
than not simply ignored, as has historically been the case with the
Brass PF ratio. It is curious that such little dialogue between
statisticians and demographers has been undertaken [23] in spite
of a clear common interest in the impact of missing data on the
validity of estimates [8,51] In statistical modeling, established
methods for dealing with missing or incomplete data are standard
fair [51,52], as are indirect estimation methods such as the Brass
PF ratio in demography [1,8]. This research provides one
potential example of an appropriate way to conduct such a
dialogue between statisticians and demographers, bridging the two
approaches within a common conceptual framework found within
uncertainty analysis and stochastic modeling. This approach
has a history in demographic studies of animal populations
[12,43,47,48] and clear potential for application to human
demography as well.
From a practical point of view, it is clear that the results of the
stochastic Brass PF ratio method differ in important ways from
those found using the traditional procedure. First and foremost,
the stochastic PF ratio-based estimates of age-specific fertility
suggest much higher total fertility rates than those calculated using
the deterministic procedure (Table 12). On average, the stochastic
estimates suggest TFRs 1.128 children higher than the traditional
Brass procedure and in all cases the 95% uncertainty interval
associated with these estimates did not overlap the DHS-reported
children-ever-born levels for women 45–49. These differences beg
the question of whether the stochastic method overestimates
fertility, or if the traditional Brass algorithm does not adjust it
Table 12. Comparison of Total Fertility Rate Across Estimates.
Province SRS TFR
Original
Adjusted TFR
Stochastic PF Ratio
Adjusted TFR
95% Lower
Bound
95% Upper
Bound
DHS Children Ever-Born
45–49
Bihar 4.360 6.457 7.722 7.661 7.782 6.45
Uttar Pradesh 4.785 6.899 8.498 8.441 8.556 6.85
Goa 1.420 4.025 4.024 3.969 4.080 4.46
Madhya Pradesh 3.995 5.658 6.999 6.938 7.060 6.63
Tamil Nadu 1.970 3.068 4.505 4.396 4.615 4.90
doi:10.1371/journal.pone.0023222.t012
Figure 7. The stochastic procedure preserves diversity in age-specific fertility between the Provinces.doi:10.1371/journal.pone.0023222.g007
Stochastic Brass PF Ratios
PLoS ONE | www.plosone.org 10 August 2011 | Volume 6 | Issue 8 | e23222
enough. Either eventuality is possible, but the higher TFRs
implied by the stochastic procedure in comparison to the DHS
data do raise the suspicion that this method might overstate
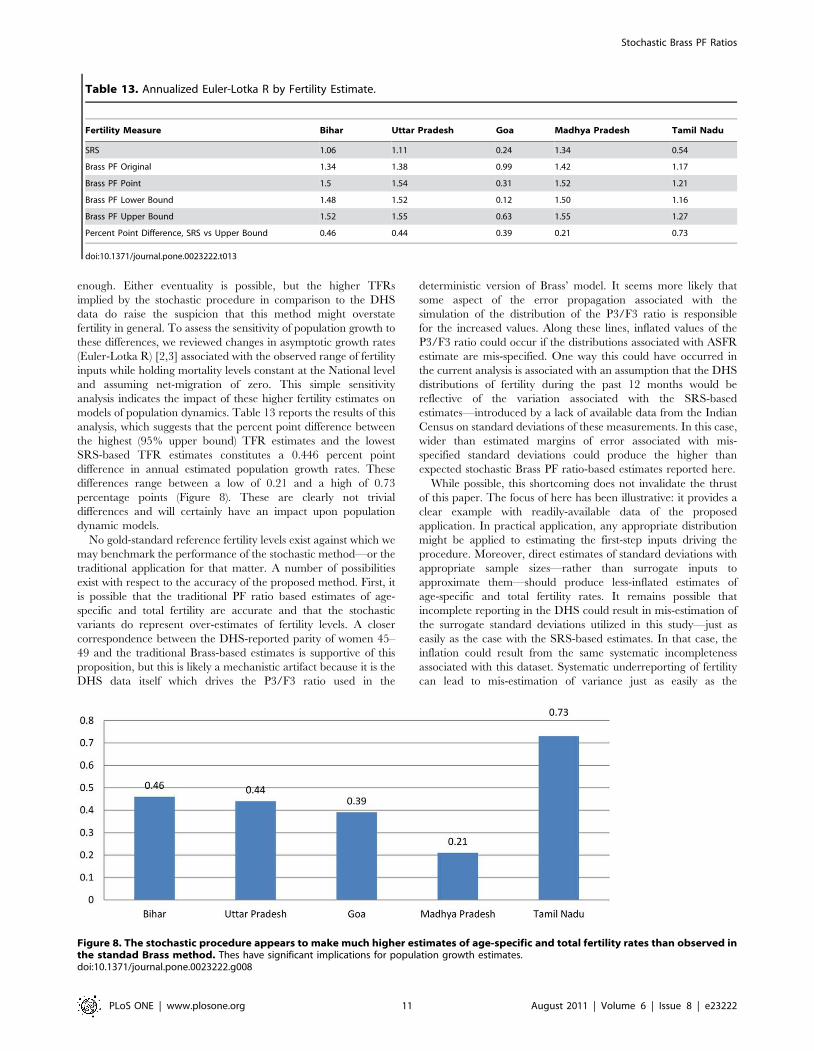
fertility in general. To assess the sensitivity of population growth to
these differences, we reviewed changes in asymptotic growth rates
(Euler-Lotka R) [2,3] associated with the observed range of fertility
inputs while holding mortality levels constant at the National level
and assuming net-migration of zero. This simple sensitivity
analysis indicates the impact of these higher fertility estimates on
models of population dynamics. Table 13 reports the results of this
analysis, which suggests that the percent point difference between
the highest (95% upper bound) TFR estimates and the lowest
SRS-based TFR estimates constitutes a 0.446 percent point
difference in annual estimated population growth rates. These
differences range between a low of 0.21 and a high of 0.73
percentage points (Figure 8). These are clearly not trivial
differences and will certainly have an impact upon population
dynamic models.
No gold-standard reference fertility levels exist against which we
may benchmark the performance of the stochastic method—or the
traditional application for that matter. A number of possibilities
exist with respect to the accuracy of the proposed method. First, it
is possible that the traditional PF ratio based estimates of age-
specific and total fertility are accurate and that the stochastic
variants do represent over-estimates of fertility levels. A closer
correspondence between the DHS-reported parity of women 45–
49 and the traditional Brass-based estimates is supportive of this
proposition, but this is likely a mechanistic artifact because it is the
DHS data itself which drives the P3/F3 ratio used in the
deterministic version of Brass’ model. It seems more likely that
some aspect of the error propagation associated with the
simulation of the distribution of the P3/F3 ratio is responsible
for the increased values. Along these lines, inflated values of the
P3/F3 ratio could occur if the distributions associated with ASFR
estimate are mis-specified. One way this could have occurred in
the current analysis is associated with an assumption that the DHS
distributions of fertility during the past 12 months would be
reflective of the variation associated with the SRS-based
estimates—introduced by a lack of available data from the Indian
Census on standard deviations of these measurements. In this case,
wider than estimated margins of error associated with mis-
specified standard deviations could produce the higher than
expected stochastic Brass PF ratio-based estimates reported here.
While possible, this shortcoming does not invalidate the thrust
of this paper. The focus of here has been illustrative: it provides a
clear example with readily-available data of the proposed
application. In practical application, any appropriate distribution
might be applied to estimating the first-step inputs driving the
procedure. Moreover, direct estimates of standard deviations with
appropriate sample sizes—rather than surrogate inputs to
approximate them—should produce less-inflated estimates of
age-specific and total fertility rates. It remains possible that
incomplete reporting in the DHS could result in mis-estimation of
the surrogate standard deviations utilized in this study—just as
easily as the case with the SRS-based estimates. In that case, the
inflation could result from the same systematic incompleteness
associated with this dataset. Systematic underreporting of fertility
can lead to mis-estimation of variance just as easily as the
Table 13. Annualized Euler-Lotka R by Fertility Estimate.
Fertility Measure Bihar Uttar Pradesh Goa Madhya Pradesh Tamil Nadu
SRS 1.06 1.11 0.24 1.34 0.54
Brass PF Original 1.34 1.38 0.99 1.42 1.17
Brass PF Point 1.5 1.54 0.31 1.52 1.21
Brass PF Lower Bound 1.48 1.52 0.12 1.50 1.16
Brass PF Upper Bound 1.52 1.55 0.63 1.55 1.27
Percent Point Difference, SRS vs Upper Bound 0.46 0.44 0.39 0.21 0.73
doi:10.1371/journal.pone.0023222.t013
Figure 8. The stochastic procedure appears to make much higher estimates of age-specific and total fertility rates than observed inthe standad Brass method. Thes have significant implications for population growth estimates.doi:10.1371/journal.pone.0023222.g008
Stochastic Brass PF Ratios
PLoS ONE | www.plosone.org 11 August 2011 | Volume 6 | Issue 8 | e23222
proportion, suggesting that this inflation could as easily be real as
artifactual. Without a gold-standard for comparison, this issue will
remain unresolved in the current research.
It is clear that the potential inflation of these estimates, however,
is not a basic shortcoming related to the use of monte carlo
simulation for fitting distributions, which has a long history in
statistics, uncertainty analysis, and decision modeling. It is
intimately associated with many forms of hypothesis testing in
these disciplines [46,53,54,55,56]. The exercise presented here is
largely one of distribution-fitting and monte carlo simulation has
been seen as an acceptable alternative to procedures such as jack-
knifing or boot-strapping, which involve resampling of an observed
distribution of values, when there is strong justification for
assuming a particular probability model [13,43,53]. These
procedures may be used to obtain valid hypothesis tests under
these conditions [54,57]. In the current study, Kolmogorov-
Smirnov tests of normality [49,50] for children-ever-born
distributions in each age interval indicated the appropriateness
of this distribution for the reported analysis. Given the lack of
available data on standard deviations for the age-specific fertility
data employed here, no goodness of fit tests could be utilized to
verify that the binomial distribution accurately reflects them;
however, no known distribution exists with greater conceptual
plausibility for capturing the risk of birth than the binomial.
Moreover, this distribution has been assumed in a number of other
previously-published studies of fertility probability in non-human
populations [13,43,47,48]. In spite of the possibility of some
inflation of estimates in the current study, there is every indication
that the method presented here should produce valid, robust, and
accurate estimates of age-specific and total fertility.
The approach presented in this research appears to be a fruitful
direction for further development of a stochastic methods for
indirect estimation in demography. The paper presents a valid
method for estimating the uncertainty associated with Brass PF
ratio-based age-specific and total fertility rates. Future evaluations
should explore the properties of this method across a larger variety
of settings and attempt, where possible, to investigate further
whether the method is prone to upward-biasing of these estimates
or, in fact, produces more accurate ones. In either case,
demographers in need of incorporation of statistical uncertainty
into indirect estimation procedures may find the described method
here to be a fruitful avenue for application.
Supporting Information
Figure S1 Glossary of Terms.
(DOCX)
Figure S2 Annotated Sample R Code to Perform the
Stochastic Brass PF Ratio Method
(DOCX)
Acknowledgments
Baker would like to acknowledge the the generous assistance of Peter
Johnson (US Census Bureau) in many discussions about the Brass PF ratio
method as well as Eddie Hunsiger (State Demographer, Alaska) and Webb
Sprague (Demographer, State of Washington) for their patient introduction
to the R statistical package that was used for modeling in this research.
Alcantara would like to acknowledge the inspiration provided by Griffith
Feeney to pursue methods of indirect demographic estimation. Helpful
encouragement from David Swanson (UC-Riverside), numerous colleagues
throughout the Federal-State Cooperative Program on Population
Estimates, Joe Salvo (City of New York) and Linda Gage (State of
California) were also appreciated. This research was supported by the State
of New Mexico, through an annual appropriation to the Census Data
Dissemination and Demographic Analysis program (House Bill 2). Last, we
would like to thank an anonymous reviewer for thoughtful comments that
greatly improved the final draft of this manuscript. In the end, any errors of
logic or content remain our own.
Author Contributions
Conceived and designed the experiments: JB AA XR. Performed the
experiments: JB. Analyzed the data: JB. Contributed reagents/materials/
analysis tools: JB. Wrote the paper: JB AA XR. Conceptual design: JB AA
XR.
References
1. Shyrock H, Siegel J (1980) The Methods and Materials of Demography. Volume2 US Department of Commerce.
2. Keyfitz N, Caswell H (2005) Applied Mathematical Demography. 2nd edition.New York: Springer.
3. Wilson EO, Bossert W (1971) A Primer of Population Biology. New York:Plenum.
4. Siegel J, Swanson D (2004) The Methods and Materials of Demography. 2nd
edition. New York: Elsevier.
5. Bryan T (2004) Population Estimates. In: The Methods and Materials ofDemography. 2nd edition Jacob S. Siegel, David Swanson, eds. New York:Elsevier. pp 523–560.
6. George MV, Smith SK, Swanson D, Tayman J (2004) Population Projections. In:The Methods and Materials of Demography. 2nd edition Jacob S. Siegel, DavidSwanson, eds. New York: Elsevier. pp 561–602.
7. Brass W (1964) Uses of Census and Survey Data for the Estimation of VitalRates. United Nations, E/CN.14/CAS/7. November.
8. United Nations (1983) UNM Manual X: Techniques for Indirect Estimation.New York.
9. Lee D (1969) An Estimation of Level of Fertility in Korea from SpecialDemographic Survey Data on Births and Children Ever Born. Yonsei MedicalJournal 10(1): 65–71.
10. Arriaga E, Johnson PD, Jamison E (1994) Population Analysis withMicrocomputers. US Census Bureau.
11. Coale AJ, Trussell J (1974) Model Fertility Schedules: Variations in the AgeStructure of Childbearing in Human Populations. Population Index 40(2):185–258.
12. Wachter K (2006) Essential Demographic Methods, Unpublished Manuscript.University of California, Berkeley.
13. Caswell H (2001) Matrix Population Models: Construction, Analysis, andInterpretation. New York: Sinauer.
14. Brass W (1964) Uses of Census and Survey Data for the Estimation of VitalRates. United Nations, E/CN.14/CAS/7. November.
15. Brass W (1965) Methods of Obtaining Basic Demographic Measures whereCensus and Vital Statistics Registration Systems are Lacking or Defective.United Nations, WPC/WP/409. September.
16. Brass W, Coale AJ, Demeny P, Heisel DF, Lorimer F, Romaniuk A, Van deWalle E (1968) The Demography of Tropical Africa. Princeton: PrincetonUniversity Press.
17. Lee D (1969) An Estimation of Level of Fertility in Korea from SpecialDemographic Survey Data on Births and Children Ever Born. Yonsei MedicalJournal 10(1): 65–71.
18. Feeney G (1983) Population Dynamics Based on Birth Intervals and ParityProgression. Population Studies 37(1): 75–89.
19. Yimamu E (1990) Problems of Selecting a Plausible Fertility Measure for AddisAbaba (Based on the 1984 Census Data). International Statistical Review 58(3):191–200.
20. Mturi A, Hinde A (2001) Fertility Levels and Differentials in Tanzania.Proceedings of the Workshop on Prospects for Fertility Decline in High FertilityCountries, United Nations, July, 2001.
21. Mitra S (1983) Generalization fo the Immigration the Stable Population Model.Demography 20(1): 111–115.
22. Cerone P (1987) On Stable Population Theory with Immigration. Demography24(3): 431–438.
23. Hogan H (2008) Measuring Population Change Using the AmericanCommunity Survey. In: Applied Demography in the 21st Century SH.Murdock, DA. Swanson, eds. pp 13–30.
24. Hornberger G, Spear R (1981) An Approach to the Preliminary Analysis ofEnvironmental Systems. Journal of Environmental Management 7: 7–18.
25. Kulkarni VG (2005) Introduction to the Modeling and Analysis of StochasticSystems. 2nd Edition. New York: Springer.
26. Sacks J, Welch W, Mitchell T, Wynn H (1989) Design and Analysis of ComputerExperiments. Statistical Science 4: 409–435.
27. Saltelli A, Tarantola S, Campolongo F, Ratto M (2004) Sensitivity Analysis inPractice: A Guide to Assessing Scientific Models. New York: Wiley.
Stochastic Brass PF Ratios
PLoS ONE | www.plosone.org 12 August 2011 | Volume 6 | Issue 8 | e23222
28. Saltelli A, Tarantola S, Chan K (1999) Quantitative Model-IndependentMethod for Global Sensitivity Analysis of Model Output. Technometrics 41(1):39–56.
29. Cox DC, Baybutt P (1981) Methods for Uncertainty Analysis: a ComparativeSurvey. Risk Analysis 1: 251–258.
30. Helton J, Johnson J, Sallaberry C, Storlie C (2006) Survey of Sampling-BasedMethods for Uncertainty and Sensitivity Analysis. Reliabilty Engineering &System Safety 91(10–11): 1175–1209.
31. Devroye L (1986) Non-Uniform Random Variate Generation. New York:Springer.
32. Gardiner CW (1983) Handbook of Stochastic Methods for Physics, Chemistry,and the Natural Sciences. New York: Springer.
33. Kalos MH, Whitlock PA (1986) Monte Carlo Methods: Basics. New York:Wiley.
34. Doll JD, Freeman DL (1986) Randomly Exact Methods. Science 234:1356–1360.
35. Fishman GS (1986) Monte Carlo: Concepts, Algorithms, and Applications. NewYork: Springer.
36. Rubinstein RY (1981) Simulation and the Monte Carlo Method. New York:Wiley.
37. Sobol IM (1994) A Primer for the Monte Carlo Method. London: CRC Press.38. Dong WM, Chiang WL, Wong FS (1987) Propagation of Uncertainties in
Deterministic Systems. Computers and Structures 26(3): 415–423.39. Goodman D (1984) Statistics of Reproductive Rate Estimates and Their
Implications for Population Projection. Reports of the International WhalingCommission, Special Issue 6: 161–173.
40. Barnthouse W, Suter G, Rosen A (1990) Risks of Toxic Contaminants toExploited Fish Populations: Influence of Life-History, Data Uncertainty, andExploitation Intensity. Environmental Toxicology and Chemistry 9: 297–311.
41. Ragen T (1995) Maximum Net Productivity Level Estimation for the NorthernFur Seal (Callorhinus ursinus) Population of St. Paul Island Alaska. MarineMammal Science 11: 275–300.
42. Powell RA, Zimmerman J, Seaman D, Gilliam J (1996) Demographic Analysisof a Hunted Black Bear Population With Access to Refuge. ConservationBiology 2: 224–234.
43. Caswell H, Brault S, Read A, Smith T (1998) Harbor Porpoise and Fisheries: An
Uncertainty Analysis of Incidental Mortality. Ecological Applications 8(4):
1226–1238.
44. Lee R, Tuljapurkar S (1994) Stochastic Population Forecasts of the US: Beyond
High, Medium, and Low. Journal of the American Statistical Association 89:
1175–1189.
45. Brown LD, Cai T, DasGupta A (2001) Interval Estimation for a Binomial
Proportion. Statistical Science 16(2): 101–133.
46. Smith J (1993) Moment Methods for Decision Analysis. Management Science
39(3): 340–358.
47. Jonzen N, Pople T, Knape J, Skold M (2010) Stochastic Demography and
Population Dynamics in the Red Kangaroo Macropus rufus. Journal of Animal
Ecology 79: 109–116.
48. Linstrom J, Reeve R, Salvidio S (2010) Bayesian Salamanders: Analyzing the
Demography of an Underground Population of the European Plethodontid
Speleomante sstrinatii With State-Space Modeling. BMC Ecology 10: 4–13.
49. Samuels M, Witmer J (1998) Statistics for the Life Sciences. New York: Prentice-
Hall.
50. Massey FT (1951) The Kolmogorov-Smirnov Test for Goodness of Fit. Journal
of the American Statistical Association 46(253): 68–78.
51. Little R, Rubin D (1987) Statistical Analysis with Missing Data. 2nd Edition.
New York: Wiley.
52. Schafer J (1999) Multiple Imputation: A primer. Statistical Methods in Medical
Research 8: 3–15.
53. Dwass M (1957) Modified Randomization Tests for Nonparametric Hypotheses.
Annals of Mathematical Statistics 28: 181–187.
54. Barnard GA (1963) Discussion of Professor Bartlett’s Paper. Journal of the Royal
Statistical Society. Series B (Methodological) 25: 294.
55. Jockel K (1986) Finite Sample Properties and Asymptotic Efficiency of Monte
Carlo Tests. The Annals of Statistics 14(1): 336–347.
56. Besag J, Clifford P (1989) Generalized Monte Carlo Significance Tests.
Biometrika 76: 633–642.
57. Ramberg J, Dudewicz E, Tadikamalla P, Mykytka E (1979) A Probability
Distribution and its Uses to Fitting Data. Technometrics 21(2): 201–216.
Stochastic Brass PF Ratios
PLoS ONE | www.plosone.org 13 August 2011 | Volume 6 | Issue 8 | e23222


