Embed Size (px)
Citation preview

Electronic copy available at: http://ssrn.com/abstract=1504712
DEPARTMENT OF MANAGEMENT RESEARCH PAPERS
STOCK MARKET REACT TO FOREIGN INVESTMENT: THE EFFECTS OF INVESTMENT PURPOSE, STOCK MARKET CHARACTERISTICS,
AND BUSINESS GROUP AFFILIATION
Byoung Youp Lee, Jenifer Piesse and Roger Strange
Research Paper XX
Subject area: International Business
To request a paper please contact: Corresponding Author: Jenifer Piesse Department of Management King’s College London Franklin-Wilkins Building 150 Stamford St London SE1 9NH United Kingdom Tel/Fax: 44 (0)207 848 4164 Email: [email protected]

Electronic copy available at: http://ssrn.com/abstract=1504712
2
STOCK MARKET REACT TO FOREIGN INVESTMENT: THE EFFECTS OF INVESTMENT PURPOSE, STOCK MARKET CHARACTERISTICS,
AND BUSINESS GROUP AFFILIATION
Byoung Youp Lee King’s College London
Department of Management 150 Stamford St, London SE1 9NH
Email: [email protected]
Jenifer Piesse King’s College London
Department of Management 150 Stamford St, London SE1 9NH
Tel: 44 (0)207 848 4164 Email: [email protected]
and University of Stellenbosch, South Africa
Roger Strange School of Business, Management and Economics
University of Sussex Mantell Building, Brighton BN1 9RH
Tel: 44 (0)207 848 4164 Email: [email protected]
Abstract This paper examines how the public announcement of foreign share acquisitions in listed companies affects the share prices of those companies. The dataset contains 422 public announcements of foreign share acquisitions in Korean listed companies over the period from March 2005 to June 2009. The empirical analysis builds upon the findings of previous studies, but also considers the moderating effects of three factors: the motivation of the foreign investor (management participation or pure investment); the characteristics of the stock exchange on which the domestic companies are listed; and the effects of group affiliation. Using event study methods, the abnormal returns are obtained and statistical tests are undertaken between the mean returns for the different sub-groups. A significant 21-day cumulative abnormal return of 1.1% is found for the total sample, and the statistical tests suggest that the factors investigated influence the size of the abnormal gains. JEL classification: G14, G32, G34 Keywords: Corporate governance; foreign investment; blockholders; business groups; event study; emerging markets

3
Stock Market React to Foreign Investment:
The Effects of Investment Purpose, Stock Market Characteristics,
and Business Group Affiliation
1. Introduction
There is a substantial literature investigating how the public announcement of foreign share
acquisitions in listed companies affects the share prices of those companies. These empirical
studies yield mixed results, with some reporting significant positive impacts whilst others find an
inconclusive response. This suggests that the local markets take into account other factors apart
from the simple fact of a foreign share acquisition. In this paper, we consider the possible effects
of investment purpose, stock market characteristics, and business group affiliation on the stock
market response to foreign share acquisitions.
We consider 422 public announcements of foreign share acquisitions in Korean listed
companies over the period from March 2005 to June 2009. The Korean context is particularly
appropriate for this study for a number of reasons. First, Korea is a large economy, has witnessed
substantial inflows of foreign investment since the millennium, and was perhaps the first country
in South East Asia to recover from the 1998 financial crisis. Second, the Korean Government
amended its regulations regarding the disclosure of block acquisitions in 2005 and, since March
2005, has required all investors making a block (5% or more of the total shares) acquisition to
reveal the purpose of their investments. We have thus been able to distinguish in our dataset
between acquisitions that were made with the express intention of the foreign investor
participating in the management of the domestic Korean company, and acquisitions that were
made for (portfolio) investment purposes only. In the former case, we would expect a significant
positive share price response to the announcement but in the latter an an insignificant response.
Third, some of the domestic companies are listed on the long-established Korean Stock Exchange
(KSE), whilst others are listed on the newer Korean Securities Dealers Automated Quotation
(KOSDAQ) exchange. We would expect there to be a much stronger stock market response to
acquisitions of shares in KOSDAQ listed companies than in those listed on the KSE. Fourth,
some of the domestic companies were members of chaebol, whilst others were not. We would

4
expect business group affiliation to have a dampening impact on any stock market reaction, as
participants would expect new investors to exercise little influence over affiliated companies.
The paper is structured as follows. We first review the extant literature on stock market
responses to announcements of foreign share acquisitions, and put forward three testable
hypotheses. We then explain the construction of our dataset, provide some descriptive statistics
for the sample, and explain the main elements of the event study methodology used in this paper.
The empirical results are then presented and discussed, and we conclude by considering briefly
possible avenues for the extension of the analysis in this paper.
2. Literature Review and Hypotheses
There is a considerable literature that examines the effects of the public announcements of
foreign share acquisitions in listed companies on the share prices of those companies. The
strategic importance of foreign investment, particularly in emerging markets, has led to a re-
evaluation of the financial strength of firms when an announcement of international expansion
becomes available to the stock market. This literature includes an enquiry into the motivation for
foreign ownership that is broadly consistent with investors’ internalisation needs (Morck &
Yeung, 1992); an analysis of the potential risk-sharing strategies to ally with multinational
partners in foreign investment (García-Canal & Sánchez, 2006), and a study of the investment
decisions to improve the long-run competitiveness of firms (Woolridge & Snow, 1990). The
appropriate timing of investments to gain future benefits from FDI was found to provide a
positive stock market response by Ding & Sun (1997) and Meschi & Cheng (2002).
Cheng & Fung (1998) examined the stock market response to joint venture
announcements between US and Chinese companies using US stock market data. The results of
this study (using 103 firms during the period 1973–1993) showed a significant 3-day abnormal
return around the event date. Although these results are based on the positive effect from the US
FDI firms, stock market reactions are confined to a few days only around the announcement.
Further regression analysis did not provide any evidence that firm-specific factors contributed to
the size of the abnormal gains. López-Duarte & García-Canal (2007) investigated the stock
market response to FDI announcements made by Spanish companies between 1990 and 2003.
Different categories of ownership and the extent of investors’ involvement were found to explain

5
the positive announcement response. The more engaged investments showed higher abnormal
returns when the announcements were made available to the market. Finally, in a study of the
Singapore stock market, Ding & Sun (1997) investigated whether FDI announcements provided
new information to investors, whether shareholder benefits were a product of their firms’ FDI
decisions, and whether abnormal returns were attainable by trading shares. Their results showed
that an average 2.73% additional return could be observed by investors buying and holding the
stock of an announcing firm 21 days around the announcement date.
This paper considers the stock market reactions to foreign acquisitions of blocks (5% or
more of the outstanding shares) of shares in domestic listed companies. We contend that this
response may well differ according to the intention of the foreign investor, in so far as this is
known to market participants. The foreign investors may well have made their acquisition
because they perceive the target company’s shares are undervalued and/or the company has good
growth prospects. In such cases, the market response is likely to be positive but small, though a
negative price reaction is also possible (Bishop, 1991). In contrast, the foreign investors may
indeed wish to participate in the management of the company. If block investors have the power
to influence the operating performance and corporate strategy of target companies, block
acquisition will trigger the probability of corporate control transfer; change of board members,
management turnover, and so on. Whenever the threat of external blockholders can be regarded
as credible, managers will devote more effort to reach decisions that are shareholder-friendly.
Outside blockholders’ monitoring thus promotes valuable internal control efforts for the
companies (Sudarsanam, 1996). In particular, foreign investors have a tendency to demand better
corporate governance in order to protect their investments. If they are the significant
blockholders, their need to secure their interests will only be amplified. Sometimes block
acquisition with management participation means that subsequent tender offers are imminent.
Mikkelson & Ruback (1985) reported that 26% of the block acquisition announcements were
eventually taken by the block acquirer or a third party within three years. Choi (1991) states that
takeover attempts increase when blockholders already own significant portions of the target
firms. Such foreign block acquisitions will thus have a positive impact on company value as
stock market participants usually expect foreign investors to undertake strong monitoring
activities. Our first hypothesis is thus:

6
H1: The stock market reaction to foreign share acquisitions made with the intention of
management participation will be greater than that to foreign share acquisitions made only for
investment purposes.
There are two competing stock exchanges in Korea: the Korea Stock Exchange (KSE) and
the KOSDAQ (Korean Securities Dealers Automated Quotation) exchange. KSE accounts for the
majority of market capital, as well as listing numerous well-known companies such as Samsung
Electronics and Hyundai Motors. KOSDAQ is mainly comprised of small-sized Korean
Information, Communication and Technology (ICT) and Manufacturing companies. Generally,
investors perceive the KSE market to be more stable than the KOSDAQ market (Shin, 2002), and
there is greater liquidity.
In many countries, foreign investors typically tend to focus on large companies listed on
established stock markets, which demonstrate relatively stable fluctuations in share prices and
trading volumes. Not only are such companies more reliable, but the trading volumes mean that
stocks will be relatively easy to sell if need be. Higher returns may well be possible from
investments in smaller, less liquid companies. Investors intending to acquire substantial blocks of
shares in such companies have the incentive to access information about their targets and to
undertake substantial market analysis. The knowledge that a foreign investor is considering an
acquisition and is carrying out such activities transmits a message about the company’s prospects,
and this information will be reflected in an increase in the company’s share price. Our second
hypothesis is thus:
H2: The stock market reaction to foreign share acquisitions will depend upon the nature of the
stock exchange, and will be greater on smaller, less liquid stock markets.
Business groups are a common feature of the corporate governance system in many
countries, and in Korea they are known as chaebol. Such groups are corporate organisations
which comprise various companies linked through cross-ownership and stock pyramids
(Claessens et al, 2006). Such groups typically make widespread use of internal factor markets,
particularly for finance. Affiliated companies can access the group’s capital and managerial
resources, and may be able to mobilise resources more readily or at a lower cost than in the
external capital market because of reputation benefits and privileged access. Such are the

7
potential benefits of group affiliation, but there are also costs, notably that the operations of the
affiliated companies have to accord with the interests of the group as a whole even if the
company’s objectives are not the same as group objectives. It is thus likely that new investors
will have little opportunity to influence let alone change radically the operations of any company
affiliated to a business group.
H3: The stock market reaction to foreign share acquisitions will be greater in independent
companies than in companies affiliated to business groups.
3. Data and Methodology
The objective of this paper is to consider the possible effects of investment purpose, stock market
characteristics, and business group affiliation on the stock market response to foreign share
acquisitions. In this section, we explain how the data were collected, provide some descriptive
statistics on the composition of the sample, and then outline the event study methodology that we
used to assess the stock market response.
3.1 Data
We constructed our dataset from the publicly accessible website provided by the Korean
Financial Supervisory Service (FSS). The FSS maintains the DART (Data Analysis, Retrieval
and Transfer System; http://dart.fss.or.kr) website for the financial disclosures of listed
companies, including those listed on both KSE and KOSDAQ. Data are available back to 2001.
The financial data and daily stock prices of individual companies were collected from the
database of KisValue. KisValue is maintained and updated by the Korea Information Service
(KIS), a subsidiary of a leading credit rating agency in Korea, which has provided comprehensive
corporate and financial information on all listed KSE and KOSDAQ companies since the early
1980s. Most Korean financial market studies depend on KisValue for its credibility and
expansive data coverage.
As we were interested in assessing the effects of investment purpose, we limited the
dataset to announcements of foreign share acquisitions of more than 5% of the outstanding shares
made between March 29 2005 and June 30 2009. We omitted acquisitions where the foreign
investor already owned more that 5% of the shares in the domestic Korean company and was

8
supplementing its original holding, and this left us with a total of 422 cases. As noted in the
Introduction, investors have to disclose the purpose of their investments: those intending to
participate in the management of the domestic Korean company have to report their
shareholdings using ‘the general form’, whilst those only making a (portfolio) investment fill out
‘the basic form’. We were thus able to distinguish between the 76 acquisitions made for
management purposes (MP) and the 346 acquisitions made for investment only (INV). Table 1
details the breakdown of the two groups over the period 2005-9. As is evident, there was a
marked drop in foreign acquisitions during 2008-09 on account of the global credit crisis.
Table 1
Almost 60% of the sample consisted of companies listed on the KSE (239 cases) with the
remaining 183 companies listed on the KOSDAQ exchange. Interestingly – see Table 2 – there
was a much higher proportion of MP cases amongst the KOSDAQ listed companies (45/183 ≈
25%) than among the KSE listed companies (31/239 ≈ 13%). About one-fifth (86) of the listed
companies were members of chaebol, with the remainder being independent. Very few (8) of the
MP cases were in group-affiliated companies.
Table 2
The mean share acquisition for the whole sample was 7.60%, with a median figure of
5.27% - see Table 3. The average (mean and median) figures for the acquisitions involving
management participation were markedly higher than those for the acquisitions for investment
only, as one might expect. Also, the average (mean and median) figures for the KOSDAQ listed
companies were higher than for the KSE listed companies, and the average figures for the
independent companies were higher than for the chaebol-affiliated companies.
Table 3
3.2 Methodology
The use of event study methodology (Fama et al, 1969) is commonplace in financial
studies assessing the impact of key corporate events such as mergers and acquisitions, the
appointment of new CEOs, major investment or divestments etc. The underlying theory is that an
efficient stock market will react to all publicly-available information. If the market views the
information in a favourable light, then the share price will rise; if the market perceives that the
news is bad for the company then the share price will fall. The stock market response, measured

9
in terms of the average abnormal return (AAR) and the cumulative abnormal return (CAR),
provides an indication of the expected impact of the event on the company.
The ‘event’ in this study is the public announcement of the foreign acquisition of shares
in the domestic Korean company, with the day of the announcement defined as the event day (t =
0). The estimation period is 90 days commencing (t – 120) days before the event day and ending
on (t – 31) days before the announcement. The event period is 61 days, from (t – 30) days before
the announcement to (t + 30) days after the announcement date. Thus, the total number of days
for the empirical study is 151.
t= -120 t= -30 t= 0 t= +30
Event period
Estimation period
Study period
Various approaches have been used in the literature to estimate the abnormal return for a
given stock. We adopt the market model to compute abnormal returns, and use Ordinary Least
Squares (OLS) as the estimation procedure. The market model is defined in Equation (1). The
benchmark index for stocks listed on the KSE is the Korea Composite Stock Price Index
(KOSPI), and the benchmark index for stocks listed on the KOSDAQ exchange is the KOSDAQ
index.
where = yield of an individual stock (i) on day t
= benchmark market index (KOSPI or KOSDAQ) on day t
= regression coefficients of the market model
= the error term for an individual stock (i) on day t

10
The market model computes the rates of return on a security over a particular holding period.
Equation (2) illustrates a basic formula which calculates the abnormal returns of an individual
sample for a day. During the event period [day (t – 30) through day (t + 30)], the daily abnormal
return for each firm, ARit, is calculated. Individual securities are aggregated into portfolios based
on time periods relative to the event date, not calendar time. The average daily abnormal return
(AAR) for a particular time period is calculated as the sum of the abnormal returns at that point
divided by the number of securities in the portfolio. The equation for deriving the AAR of a day
is seen in Equation (3).
are the estimated market model coefficients
The CAR (cumulative abnormal return) from t1 to t2 is the sum of the average abnormal
returns(AAR) for each day for the period and is defined in Equation (4). We estimate mean CARs
for various intervals surrounding the announcement: (t = 0, t = +1), (t = -5, t = +5), (t = -15, t =
+15), (t = -20, t = -1), (t = +1, t = +20) etc. Significance tests were undertaken for both the
average and the cumulative average abnormal returns. The test statistics for AARt and CAR(t1, t2)
are shown in Equation (5) and Equation (6) respectively.

11
4. Results
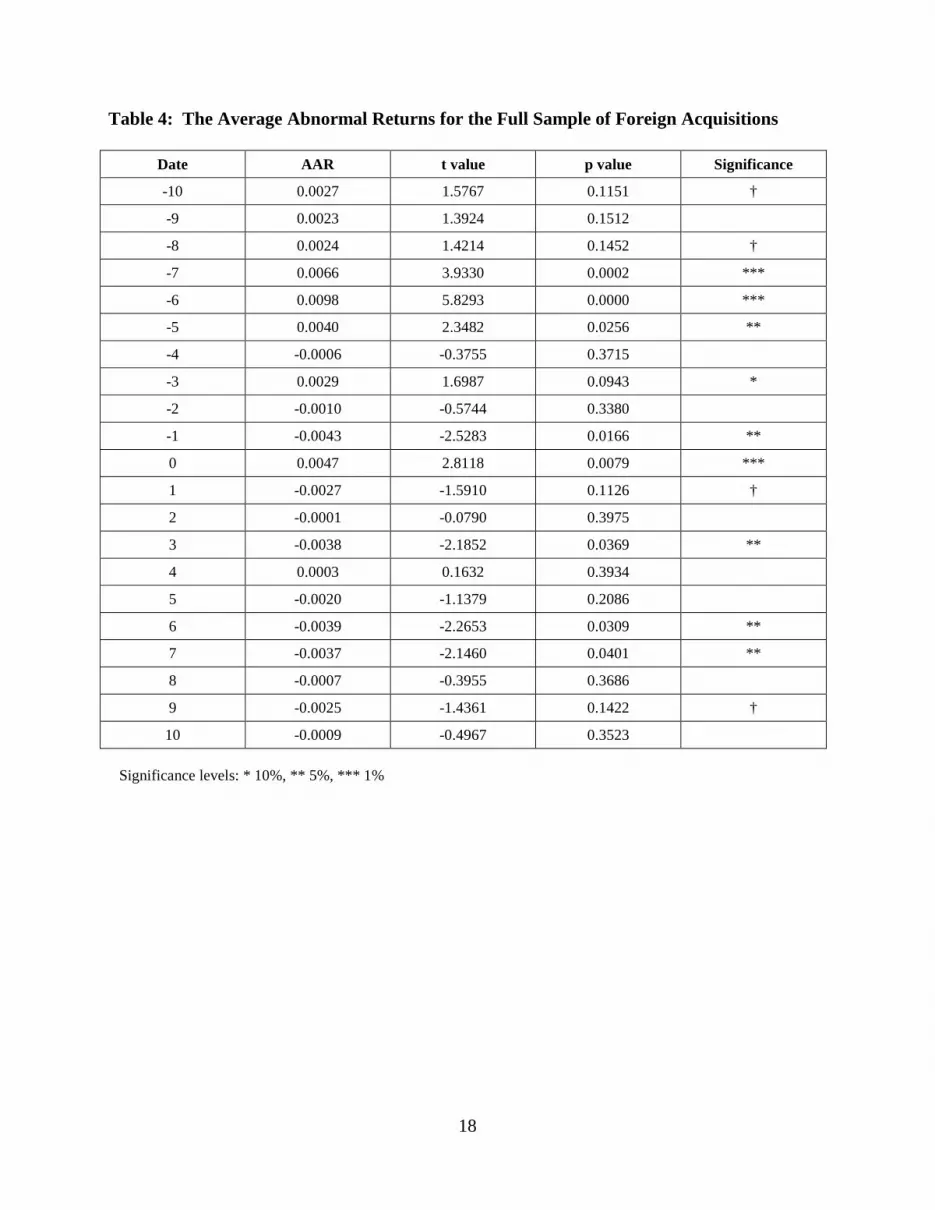
We first explored the stock market reaction using the whole sample of 422 announcements. We
observed a highly significant AAR on the event day (t = 0, AAR = 0.47%, p < 0.01), see Table 4.
Furthermore, the AARs on most days prior to the event are positive and significant, whilst those
on most days after the event are negative. These results suggest that there has been information
leakage regarding foreign block acquisitions. Prior to the disclosure, astute investors may have
had access to information on the block acquisition. They could be at an advantage and buy the
shares of target firms before the public announcement is made. Another explanation of positive
pre-announcement returns results from the natural process of consecutively increasing demand
for shares by foreign block holders. Prior to the disclosure of block acquisitions, foreign investors
buy and hold substantial amounts of shares. Usually, the process of block acquisition takes a
considerable amount of time, a couple of days at least. During the block acquisition, information
of a large investment will be passed to professional investors. Also, foreign investors
subconsciously reveal information about the target firms in the process of gathering information
on investment prospects. However, after the announcement an adverse adjustment of abnormal
price response is observed. Figure 1 shows the AARs and the CARs over the full event period.
The CARs before the event date are positive, but then decline steadily thereafter reflecting the
negative AARs after the event date.
Table 4 and Figure 1
The analysis is then repeated, but separately for acquisitions where management
participation (MP) was intended and where only investment (INV) was intended. The AARs for
both groups are in Table 5, and these show that the AARs for the MP group are generally more
positive than those for the INV group, plus the returns stay positive for longer after the event

12
date. These figures are reflected in the CARs in Figure 2, which show clearly that the average
stock market response to the MP acquisitions is both stronger and longer-lasting than that of the
INV acquisitions. The CARs for the two groups over various intervals were then compared using
t-tests, with interesting results. The CAR (-10, +10) shows a mean difference of +6.9% (p <
0.05), whilst CAR (-5, +5) shows a mean difference of +5.6% (p<0.1) and CAR (-15, +15) shows
a mean difference of +7.1% (p<0.1). The positive differences indicate a higher CAR for the MP
companies than for the INV companies. In conclusion, these results demonstrate that the stock
market takes into account the motivation of the foreign investors, and values investments made
for management participation significantly higher than those made for investment only.
Hypothesis 1 is thus strongly supported.
Table 5 and Figure 2
As noted above, KSE and KOSDAQ have distinct characteristics. KOSDAQ is usually
regarded as more volatile, and KSE has the more stable of the Korean stock markets. The
headlines of the Korean media frequently report news of market manipulations, corporate deceit
and private benefit transfers in KOSDAQ listed companies. The level of self regulation and
market monitoring is relatively low in KOSDAQ, although the standard in the KSE are not
regarded to be particularly high compared with long established stock exchanges such as New
York and London. The AARs for the companies listed on the KSE and on the KOSDAQ
exchange are shown in Table 6. There is a very significant positive AAR of 0.55% (p<0.01) for
the KSE listed companies, but the corresponding figure for the KOSDAQ companies is both
smaller and statistically insignificant. But there is evidence of large positive AARs on the
KOSDAQ exchange from early in the event period (t = -25), and then large negative AARs in the
days after the event date. This is reflected in the CARs in Figure 3, which show the greater
volatility in the KOSDAQ market. The CARs for the companies listed on the two exchanges over
various intervals were then compared using t-tests, with interesting results. The CAR (-15, +15)
shows a mean difference of +4.04% (p < 0.1), whilst CAR (-10, +10) shows a mean difference of
+0.85% (p>0.1) and CAR (-5, +5) shows a mean difference of +2.23% (p<0.1): the positive
figures indicate a higher CAR for the KOSDAQ companies than for the KSE companies. In
conclusion, these results demonstrate the differential responses of investors on the two stock
markets, though this finding is sensitive to the choice of interval. Hypothesis 2 is thus supported,
though with this caveat.

13
Table 6 and Figure 3
Finally, the analysis was again repeated, but separately for those companies that were
affiliated to chaebol and those that were independent. The AARs for both groups are in Table 7,
and these show that the AARs for the independent companies were generally more positive than
those for the affiliated companies, which are often negative though small and statistically
insignificant before the event date. However, the AARs for the independent companies were
often negative after the event date whilst those for the affiliated companies remain small. Neither
group shows a significant AAR on the event date, and very few AARs for the affiliated
companies throughout the event period were statistically significant. These observations are
reflected in the CARs in Figure 4. The plot for the affiliated companies is very flat throughout the
period, suggesting a lack of stock market reaction to the news of foreign share acquisitions. This
is probably because the market judges that foreign investors will have little scope for influencing
the operations of companies that are part of powerful chaebols. In contrast, the CAR plot for the
independent companies rises steeply before the event date, and then fall sharply afterwards. The
CARs for the two groups of companies over various intervals were then compared using t-tests.
The results for the major period CARs show slight differences between the two groups using a t
test although there is a clear difference in the CAR plots. CAR (-10, +10) shows a mean
difference of +2.3% (p > 0.1); CAR (-5, +5) shows a mean difference of +1.2% (p > 0.1); whilst
CAR (-15, +15) has a negative result with a mean difference of -0.45% (p > 0.1). However, the
pre announcement date CARs strongly support hypothesis 3. The CAR (-10, +1) and CAR (-30,
+1) show significant positive mean differences of +2.86% (p < 0.05), +4.64% (p < 0.1)
respectively between the two sample groups. The positive differences indicate a higher CAR for
the independent companies than for the group-affiliated ones. In conclusion, these results
demonstrate that the stock market takes into account the affiliation of the domestic target
companies, and values investment in independent companies significantly higher than that made
in companies affiliated to chaebol. Hypothesis 3 is supported, but careful interpretation would be
needed to extend this result.
Table 7 and Figure 4

14
4. Discussion and Conclusions
Previous studies of stock market reactions to announcement of foreign share acquisitions have
provided inconclusive results. In this paper we have since demonstrated that a possible reason for
this is that there are systematic differences in the market reactions to acquisitions by different
investors and in domestic companies with different organisational structures. In particular, we
have shown that the stock market reaction is greater when investors announce their intention to
participate in management, where markets are more volatile, and in domestic firms that are not
affiliated to business groups.
We have also replicated our analyses using different combinations of these three factors.
Space constraints space precludes reporting these results here in detail, but two results are worthy
of mention. The first is that the differential stock market response to MP and INV acquisitions is
only apparent in companies listed on the KSE and is both significant and long-lasting, whilst
there are no differences in the CARs for MP and INV acquisitions listed on the KOSDAQ
exchange. The higher volatility in the second may mask more subtle effects that result from a
new announcement. The second is that the differential stock market response to MP and INV
acquisitions is only apparent in independent companies, whilst there are no differences in the
CARs for MP and INV acquisitions of group-affiliated companies. This is a sensible result as
affiliated companies are much more difficult to influence.

15
References
Bishop, S. (1991). ‘Pre-bid acquisitions and substantial shareholder notices.’ Australian Journal
of Management, 16(1): 1-34.
Cheng, L & Fung, J (1998). 'An examination of the determinants of stock-price effects of US-
Chinese joint venture announcements.' International Business Review, 7(2): 151-161.
Choi, D. (1991). ‘Toehold acquisitions, shareholder wealth, and the market for corporate control.’
Journal of Financial and Quantitative Analysis, 26(3): 391-407.
Claessens, S., Fan, J. & Lang, L. (2006). ‘The benefits and costs of group affiliation: evidence
from East Asia.’ Emerging Markets Review, 7: 1-26.
Ding, K.D. & Sun, Q. (1997). 'The information content of FDI announcements: evidence from an
emerging market.' International Review of Financial Analysis, 6(1): 63-76.
Fama, E., Fisher, L., Jensen, M.C. & Roll, R. (1969). ‘The adjustment of stock prices to new
information.’ International Economic Review, 9(3): 1-21.
García-Canal, E. & Sánchez, P.L. (2006). ‘The number of partners and the stock market reaction
to domestic and international alliance formation in EU telecom firms.’ International
Business Review, 16(1): 83-108.
Kim, W.S. (2000). ‘Does FDI increase firm value in emerging markets? Harvard University,
Weatherhead Centre for International Affairs, Working Paper 00-03.
López-Duarte, C. & García-Canal, E. (2007). ‘Stock market reaction to foreign direct
investments: interaction between entry modes and FDI attributes.’ Management
International Review, 47(3): 393-422.
Meschi, P.X. & Cheng, L.T.W. (2002). ‘Stock price reactions to Sino-European joint ventures.’
Journal of World Business, 37(2): 119-126.
Mikkelson, W.H. & Ruback, R.S. (1985). ‘An empirical analysis of the interfirm equity
investment process.’ Journal of Financial Economics, 14: 523-553.
Morck, R. & Yeung, B. (1992). ‘Internalization: an event study test.’ Journal of International
Economics, 33(1-2): 41-56.
Sudarsanam, S. (1996). ‘Large shareholders, takeovers and target valuation.’ Journal of Business
Finance & Accounting, 23(2): 295-314.
Ueng, C & Kim, S (1996). ‘Foreign direct investment and shareholders’ wealth: evidence from
the newly industrialized countries (NICS)’ Multinational Business Review, 4(2): 79-85.

16
Woolridge, J.R. and Snow, C.C. (1990). ‘Stock market reaction to strategic investment
decisions.’ Strategic Management Journal, 11(5): 353-363

17
Table 1: Sample statistics - by year and investment purpose
Year Management Participation (MP) Investment Only (INV) Total 2005 10 123 133 (32%) 2006 21 120 141 (33%) 2007 19 83 102 (24%) 2008 20 15 35 (8%) 2009 6 5 11 (3%)
Total 76 346 422
Table 2: Sample statistics - by stock market and group affiliation
Management participation (MP) Investment only (INV) Total
Stock Market KSE 31 208 239
KOSDAQ 45 138 183 Total 76 346 422
Group affiliation Chaebol member 8 78 86
Independent 68 268 336 Total 76 346 422
Table 3: Sample Statistics - average share acquisitions Mean share
acquisition Median share
acquisition Investment purpose
Management participation (n=76) 14.98% 8.66% Investment only (n=346) 5.97% 5.19%
Stock Exchange
KSE (n=239) 6.57% 5.12% KOSDAQ (n=183) 8.93% 5.77%
Group affiliation
Chaebol member (n=86) 6.19% 5.11% Independent (n=336) 7.96% 5.41%
Whole sample (n=422) 7.60% 5.27%
18
Table 4: The Average Abnormal Returns for the Full Sample of Foreign Acquisitions
Date AAR t value p value Significance
-10 0.0027 1.5767 0.1151 †
-9 0.0023 1.3924 0.1512
-8 0.0024 1.4214 0.1452 †
-7 0.0066 3.9330 0.0002 ***
-6 0.0098 5.8293 0.0000 ***
-5 0.0040 2.3482 0.0256 **
-4 -0.0006 -0.3755 0.3715
-3 0.0029 1.6987 0.0943 *
-2 -0.0010 -0.5744 0.3380
-1 -0.0043 -2.5283 0.0166 **
0 0.0047 2.8118 0.0079 ***
1 -0.0027 -1.5910 0.1126 †
2 -0.0001 -0.0790 0.3975
3 -0.0038 -2.1852 0.0369 **
4 0.0003 0.1632 0.3934
5 -0.0020 -1.1379 0.2086
6 -0.0039 -2.2653 0.0309 **
7 -0.0037 -2.1460 0.0401 **
8 -0.0007 -0.3955 0.3686
9 -0.0025 -1.4361 0.1422 †
10 -0.0009 -0.4967 0.3523 Significance levels: * 10%, ** 5%, *** 1%

19
Table 5: The Average Abnormal Returns by Investment Purpose
Date MP (n=76) INV (n=346)
AAR t value AAR t value
-10 0.0051 0.8807 0.0021 1.3002
-9 0.0055 0.9484 0.0016 1.0142
-8 0.0096 1.6516 0.0008 0.4986
-7 0.0075 1.2877 0.0064 3.9574
-6 0.0121** 2.0860 0.0093*** 5.7261
-5 -0.0041 -0.7130 0.0057*** 3.5265
-4 0.0137** 2.3560 -0.0038** -2.3246
-3 0.0088 1.5062 0.0016 0.9631
-2 0.0051 0.8769 -0.0023 -1.4143
-1 -0.0049 -0.8500 -0.0041** -2.5265
0 0.0167*** 2.8750 0.0021 1.2945
1 0.0002 0.0365 -0.0027* -1.6834
2 -0.0010 -0.1739 -0.0001 -0.0679
3 0.0057 0.9859 -0.0056*** -3.4496
4 0.0092 1.5786 -0.0016 -0.9744
5 -0.0045 -0.7763 -0.0005 -0.3125
6 -0.0066 -1.1413 -0.0032* -1.9653
7 -0.0065 -1.1166 -0.0027 -1.6501
8 0.0008 0.1390 -0.0014 -0.8350
9 -0.0051 -0.8806 -0.0022 -1.3422
10 0.0001 0.0226 -0.0009 -0.5548
Significance levels: * 10%, ** 5%, *** 1%

20
Table 6: The Average Abnormal Returns by Stock Exchange
Date KSE (n=239) KOSDAQ (n=183)
AAR t value AAR t value
-10 0.0011 0.5925 0.0046 1.6116
-9 0.0006 0.3039 0.0046 1.6162
-8 0.0013 0.6581 0.0039 1.3438
-7 0.0059*** 3.0279 0.0076** 2.6569
-6 0.0067*** 3.4702 0.0139*** 4.8330
-5 0.0035* 1.7883 0.0046 1.6034
-4 -0.0024 -1.2607 0.0017 0.6011
-3 0.0042** 2.1560 0.0012 0.4014
-2 0.0006 0.2956 -0.0030 -1.0370
-1 -0.0010 -0.4980 -0.0086*** -2.9821
0 0.0055*** 2.8324 0.0038 1.3121
1 -0.0012 -0.6041 -0.0036 -1.2403
2 -0.0001 -0.0359 -0.0005 -0.1874
3 -0.0030 -1.5411 -0.0043 -1.5090
4 0.0010 0.5392(0.3444) -0.0005 -0.1903
5 0.0015 0.7810(0.2935) -0.0048 -1.6744
6 -0.0030 -1.5669(0.1169) -0.0048* -1.6857
7 -0.0022 -1.1303(0.2102) -0.0049* -1.7116
8 0.0012 0.6157(0.3295) -0.0038 -1.3188
9 -0.0040** -2.0770(0.0466) -0.0010 -0.3507
10 -0.0014 -0.7298(0.3051) 0.0002 0.0669
Significance levels: * 10%, ** 5%, *** 1%

21
Table 6: The Average Abnormal Returns by Group Affiliates
Date Group affiliates (n=86) Independent (n=336)
AAR t value AAR t value
-10 -0.0011 -0.3600 0.0036* 1.8810
-9 -0.0032 -1.0823 0.0038** 1.9611
-8 -0.0016 -0.5405 0.0034* 1.7805
-7 0.0053 1.8191 0.0069*** 3.6256
-6 0.0107*** 3.6546 0.0096*** 4.9975
-5 0.0027 0.9315 0.0043** 2.2253
-4 -0.0057* -1.9234 0.0007 0.3406
-3 0.0016 0.5294 0.0032* 1.6665
-2 -0.0049* -1.6763 0.0000 0.0242
-1 -0.0027 -0.9227 -0.0047** -2.4275
0 0.0035 1.1982 0.0050** 2.6322
1 -0.0002 -0.0815 -0.0027 -1.4132
2 -0.0051* -1.7299 0.0010 0.5003
3 -0.0008 -0.2765 -0.0043** -2.2281
4 0.0020 0.6887 -0.0001 -0.0386
5 -0.0012 -0.3963 -0.0012 -0.6498
6 -0.0001 -0.0225 -0.0048** -2.4904
7 0.0007 0.2475 -0.0044** -2.3042
8 -0.0002 -0.0700 -0.0012 -0.6064
9 -0.0050 -1.7087 -0.0021 -1.1056
10 -0.0024 -0.8258 -0.0003 -0.1449 Significance levels: * 10%, ** 5%, *** 1%

22
Figure 1: The Stock Market Response to Foreign Share Acquisitions (whole sample)
Figure 2: The Stock Market Response to Foreign Share Acquisitions: Comparison by Investment Purpose

23
Figure 3: The Stock Market Response to Foreign Share Acquisitions: Comparison by Stock Exchange
Figure 4: The Stock Market Response to Foreign Share Acquisitions: Comparison by Group Affiliation


