Embed Size (px)
Citation preview

MGT 4301 Business Policy & Corporate Strategy FALL 2015
In partial fulfillment of the Business Policy & Corporate
Strategy course
Supervised by Dr. Abderrahman Hassi

1
STRATEGIC MANAGEMENT TEAM

2
ACKNOWLEDGMENT
“On behalf of our capstone project team, about the company Accor-
Risma, we would like to thank all the people who helped us and without whom
the full realization of this report would not have been possible.
First, we would like to address our sincerest thanks to our professor Dr.
Abderrahman Hassi, for his guidance and advice throughout this semester.
Similarly, we would like to thank Dr. Nicolas Hamelin, Dr. Imad Jabbouri, Mr.
Driss El Moudni deputy manager of Nozidées, Mr. Ahmed Debbagh owner of
the Domotiqua franchise in Morocco, Mr. Hassan Smili and Gumbo Kibelloh,
affiliate managers at ad4Game, and Dr. Abdelhamid Bennani Bouchiba for their
assistance and support during our research and analyses.
We would also like to express our deep thanks to Mr. Hassan Lahlou,
regional sales manager at Accor, for giving us precious insights about the
company.
Finally, we would like to thank our families for their support and care
during our whole years at Al Akhawayn University, and especially for their
encouragements during this final period.”

3
EXECUTIVE SUMMARY
AccorHotels is a French adventure that began in 1967 and reached Morocco in 1993
through a consortium of eight founder organizations. With more than 37 hotels throughout the
kingdom, Accor Maroc or Accor-Risma is one of the major players of the country’s tourism
sector even with the current political instability in the MENA region.
Throughout this report, a thorough analysis of the company’s situation was realized.
With a definition of the current objectives, strategies and issues, internal and external
assessment tools were utilized in order to evaluate and clearly determine Accor-Risma’s
position in Morocco. Therefore, leading us to a clear establishment of the matters that needed
to be addressed through our strategy formulation phase.
Through our study and analysis, we noticed that Accor-Risma is facing management
problems as well as irregularities in its accounting operations without forgetting about the
crisis faced by the tourism industry this past years, therefore, our main goal was to
successfully implement three alternative strategies that could realistically be taken into
consideration in the professional setting of Accor-Risma. The application of the theoretical
knowledge of the “Business Policy & Corporate Strategy” course material helped us in the
realization of the necessary matrices indicating the right strategic management decisions to
undertake. In addition to the BCG, SPACE, Grand and I/E matrices, as well as clear and
concise financial evaluations, we used the QSPM matrix to narrow down the best direction
and the best means that had to be chosen for Accor-Risma sustainable performance.
Finally, we implemented the three strategies we think are most appropriate to Accor-
Risma’s current situation in Morocco based on our analyses of the micro and macro
environment of the organization. According to our team, the appropriate solutions would be to
implement a market penetration through a the opening of a new brand of Accor’s economic
range near the location of the new ESSEC business school in order to get more customer
engagement, a product development with the introduction of the artificial intelligence
Domotiqua Fibaro system in the luxurious range products of the brand, and finally a market
penetration through the opening of a new Ibis entity, nearby the upcoming international
airport of Rabat-Salé.

4
TABLE OF CONTENTS
STRATEGIC MANAGEMENT TEAM .................................................................................. 1
ACKNOWLEDGMENT ........................................................................................................ 2
EXECUTIVE SUMMARY ...................................................................................................... 3
TABLE OF CONTENTS ....................................................................................................... 4
TABLE OF FIGURES ........................................................................................................... 7
LIST OF ACRONYMS: ....................................................................................................... 11
I. COMPANY INTRODUCTION ..................................................................................... 12
1.1 HISTORY OF ACCORHOTELS: ............................................................................................................ 12
1.2 ACCOR-RISMA IN MOROCCO: ............................................................................................................ 13
Key Dates ......................................................................................................................... 14
1.3 ACCOR-RISMA’S BRANDS IN MOROCCO: .......................................................................................... 15
1.4 ACCOR-RISMA’S SHAREHOLDERS: ..................................................................................................... 17
1.5 ACCOR-RISMA’S SUBSIDIARIES: ......................................................................................................... 17
II. OBJECTIVES, STRATEGIES & ISSUES OF ACCOR-RISMA .................................... 18
2.1 CURRENT OBJECTIVES: ............................................................................................................................. 18
2.2 CURRENT STRATEGIES: ............................................................................................................................. 18
2.3 CURRENT ISSUES: ...................................................................................................................................... 19
III. MISSION & VISION ................................................................................................. 20
3.1 VISION STATEMENT: .................................................................................................................................. 20
3.2 MISSION STATEMENT: ............................................................................................................................... 20
3.3 RECOMMENDED VISION STATEMENT: ...................................................................................................... 20
3.4 RECOMMENDED MISSION STATEMENT: ................................................................................................... 21
IV. EXTERNAL AUDIT .................................................................................................. 22
4.1 INDUSTRY ANALYSIS: ................................................................................................................................ 22
Industry SWOT analysis ................................................................................................ 22
Forecasted International Tourism Arrivals ................................................................. 24
Forecasted Travel and Receipts ..................................................................................... 25
4.2 PEST ANALYSIS: ....................................................................................................................................... 27
Political Factors: ............................................................................................................. 27
Economic Factors: .......................................................................................................... 27
Social Factors: ................................................................................................................. 30
Technological forces: ...................................................................................................... 32
3.3 THE PORTER’S FIVE FORCES MODEL: ..................................................................................................... 32
Upscale and Luxury Range ............................................................................................. 33
Rivalry among existing firms: ........................................................................................ 33

5
Potential entry of new competitors: .............................................................................. 33
Bargaining power of suppliers: ...................................................................................... 34
Bargaining power of customers: .................................................................................... 34
Threat of substitute products: ....................................................................................... 34
Midscale and Economic Range ....................................................................................... 35
Rivalry among existing firms: ........................................................................................ 35
Potential entry of new competitors: .............................................................................. 35
Bargaining power of suppliers: ...................................................................................... 35
Bargaining power of customers: .................................................................................... 36
Threat of substitute products: ....................................................................................... 36
4.4 EXTERNAL FACTOR EVALUATION MATRIX ...................................................................................... 36
Opportunities: ................................................................................................................. 37
Threats: ............................................................................................................................ 38
4.5 COMPETITIVE PROFILE MATRIX .............................................................................................................. 39
V. INTERNAL AUDIT ...................................................................................................... 40
5.1 COMPANY IMAGE AUDIT ........................................................................................................................... 40
5.2 FINANCIAL ANALYSIS: ............................................................................................................................... 42
Growth Ratios: ................................................................................................................ 42
Profitability Ratios: ........................................................................................................ 43
Competitive Analysis: Accor vs Pierre&Vacances ...................................................... 44
Leverage Ratios: .............................................................................................................. 45
Liquidity Ratios: ............................................................................................................. 47
Latest Financial Updates: ............................................................................................... 49
5.6 INTERNAL FACTOR EVALUATION MATRIX............................................................................................... 49
Strengths .......................................................................................................................... 49
Weaknesses ...................................................................................................................... 50
VI. MAIN ISSUE ............................................................................................................ 52
VII. OBJECTIVES OF THIS REPORT ............................................................................ 52
7.1 SHORT TERM OBJECTIVES ......................................................................................................................... 52
7.2 LONG TERM OBJECTIVES ........................................................................................................................... 52
VIII. STRATEGY ANALYSIS & CHOICE ........................................................................ 53
8.1 THE MATCHING STAGE ............................................................................................................................. 53
Matching SWOT ............................................................................................................... 54
SPACE Matrix .................................................................................................................. 56
BCG Matrix ...................................................................................................................... 57
I/E Matrix .......................................................................................................................... 58

6
Grand Strategy Matrix ...................................................................................................... 59
8.2 DECISION STAGE ........................................................................................................................................ 60
QSPM ................................................................................................................................ 60
IX. STRATEGY IMPLEMENTATION ............................................................................ 62
9.1 STRATEGY I: PRODUCT DEVELOPMENT – FIBARO DOMOTIQUA ...................................................... 62
Product Description: ......................................................................................................... 63
Where to implement? ........................................................................................................ 65
Financial Evaluation ......................................................................................................... 66
9.2 STRATEGY II: MARKET PENETRATION – ADAGIO ACCESS .............................................................. 76
What is Adagio? ................................................................................................................ 76
Financial Evaluation ......................................................................................................... 81
Revenue’s Estimation: Scenario Analysis ........................................................................ 84
9.3 STRATEGY III: MARKET PENETRATION – IBIS HOTEL RABAT-SALÉ AIRPORT .............................. 89
When & where & why to implement this strategy ........................................................... 89
Financial Evaluation ......................................................................................................... 94
Revenue Estimation: Scenario Analysis ........................................................................... 97
X. RECOMMENDATIONS............................................................................................. 102
XI. CONCLUSION ....................................................................................................... 106
XII. REFERENCES ...................................................................................................... 107
XIII. APPENDICES ....................................................................................................... 113
APPENDIX A: CURRENT ORGANIZATIONAL CHART OF ACCOR-RISMA ...................................................... 113
APPENDIX B: SPACE MATRIX COMPONENTS ............................................................................................... 114
7
TABLE OF FIGURES
Figure 1. Accor In Morocco ..................................................................................................... 13
Figure 2- Accor's brands logos ................................................................................................. 16
Figure 3- Pie chart of Accor-Risma's main shareholders ......................................................... 17
Figure 4- Evolution of Total Arrivals to Morocco, 2002-2019 (BMI, 2015) .......................... 24
Figure 5- Top Markets by Arrivals in Morocco (BMI, 2015) .................................................. 24
Figure 6-Chart of the top markets in Morocco (BMI, 2015) ................................................... 25
Figure 7-Moroccan International Tourism and Receipt 2011-2018f (BMI, 2015) .................. 26
Figure 8-International Tourism Industry Receipt Evolution 2011-2018 f ............................... 26
Figure 9- Occupancy rate in registered accommodation establishments in August (OTM,
2015) ......................................................................................................................................... 28
Figure 10- Occupancy rates in registered accommodation establishments from January to
August (OTM, 2015) ................................................................................................................ 28
Figure 11- Moroccan Population Growth rate ( ....................................................................... 30
Figure 12- Porter’s Five Forces Model applied to luxury brands ............................................ 33
Figure 13-Porter’s Five Forces model applied to midscale & economic brands ..................... 35
Figure 14- External Factor Evaluation Matrix ......................................................................... 39
Figure 15- Accor-Risma's competitive profile matrix.............................................................. 40
Figure 16- Accor's indictors in social mention ......................................................................... 41
Figure 17- Number of Google searches of Accor in the UK and France (GoogleAdwords,
2015) ......................................................................................................................................... 41
Figure 18-Finacial Key Performance Indicators for Risma ..................................................... 42
Figure 19-Risma's revenue evolutions in MAD million from 2010 to 2014 ........................... 42
Figure 20- Risma's Net income evolution (2010-2014) ........................................................... 43
Figure 21- Risma's Profitability Ratios 2010-2014 .................................................................. 43
Figure 22-ROA - Risma's competitive Analyis ........................................................................ 44

8
Figure 23- Risma's competitive analysis: ROA Evolution (2010-2014) .................................. 44
Figure 24- Risma's competitive Analysis: ROE ....................................................................... 45
Figure 25- Risma's Competitive Analysis: ROE evolution (2010-2014) ................................. 45
Figure 26- Degree of Financial Leverage ................................................................................ 45
Figure 27- Degree of Financial Leverage Evolution (2010-2014) ........................................... 46
Figure 28- Debt to Equity Ratio ............................................................................................... 46
Figure 29- Debt To Asset Ratio Evolution ............................................................................... 46
Figure 30-Debt to Total Assets ................................................................................................ 47
Figure 31- Debt to total Asset Evolution ................................................................................. 47
Figure 32- Risma's current Ratio .............................................................................................. 48
Figure 33- Risma's quick Ratio evolution ................................................................................ 48
Figure 34- Risma's competitive analysis quick ratio ................................................................ 48
Figure 35-Risma's competitive analysis quick ratio evolution................................................. 49
Figure 36- Risma's IFE ............................................................................................................. 51
Figure 37- SWOT Matrix ......................................................................................................... 53
Figure 38- Matching Swot matrix ............................................................................................ 56
Figure 39- Accor-Risma's SPACE matrix ................................................................................ 57
Figure 40-Accor-Risma's BCG Matrix .................................................................................... 58
Figure 41-Accor-Risma's I/E Matrix ........................................................................................ 59
Figure 42- Accor-Risma's Grand Strategy Matrix ................................................................... 59
Figure 43-Accor-Risma's QSPM Matrix .................................................................................. 61
Figure 44- Risma's WACC for Strategy I ................................................................................ 67
Figure 45-Full Pack Cost per Unit ........................................................................................... 67
Figure 46-Sofitel Morocco and Rooms Available ................................................................... 68
Figure 47-Fibaro Domotiqua Initial Investment ...................................................................... 69
Figure 48-Full Pack Depreciation Expense Fibaro Domotiqua .............................................. 69
9
Figure 49-Sofitel RevAr 2014 ................................................................................................. 70
Figure 50-ARR Increase Scenario Strategy I ........................................................................... 71
Figure 51- Forecasted Revenue First Scenario ........................................................................ 71
Figure 52- Forecasted Operating Before Tax Revenue ............................................................ 72
Figure 53-: ARR Increase Second Scenario ............................................................................. 72
Figure 54- Forecasted Revenue Second Scenario Strategy I ................................................... 73
Figure 55- Forecasted Operating Before Tax Revenue ............................................................ 73
Figure 56-Table X: ARR Increase Third Scenario Strategy I .................................................. 74
Figure 57-Forecasted Revenue Third Scenario Strategy I ....................................................... 74
Figure 58-Forecasted Operating Before Tax Revenue Strategy I ............................................ 74
Figure 59-NPV and Scenario Analysis Strategy I .................................................................... 75
Figure 60-Discount Adagio Packages (adagio-city.com, 2015) .............................................. 80
Figure 61-Initial Investment and Budget Allocation Strategy II .............................................. 82
Figure 62-First Year Forecasted Revenue Strategy II .............................................................. 82
Figure 63-Forecasted Revenues: Optimistic Scenario Strategy II ........................................... 84
Figure 64- Payback Schedule Optimistic ScenarioStrategy II ................................................. 85
Figure 65- Forecasted Revenues: Realistic Scenario Strategy II ............................................. 86
Figure 66- Payback Schedule: Realistic Scenario Strategy II .................................................. 87
Figure 67- Forecasted Revenues: Pessimistic ScenarioStrategy II .......................................... 87
Figure 68- Payback Schedule: Pessimistic Scenario ................................................................ 88
Figure 69-Flow rate of passengers (Rabat-Salé, 2014) ............................................................ 93
Figure 70-Table X: Ibis Rabat-Salé Budget Allocation ........................................................... 94
Figure 71-Ibis Rabat-Salé Initial Investment ........................................................................... 95
Figure 72- Ibis Rabat-Salé Airport Forecasted RevAR (2018) ................................................ 96
Figure 73-Table X: Depreciation Table Ibis Rabat-Salé Airport ............................................. 97
Figure 74- Ibis Rabat-Salé Airport Revenue Optimistic Scenario ........................................... 98

10
Figure 75-Payback Period Schedule: Optimistic Scenario....................................................... 98
Figure 76-Ibis Rabat-Salé Airport Revenue Realistic Scenario ............................................... 99
Figure 77-Payback Period Schedule: Realistic Scenario ....................................................... 100
Figure 78-Ibis Rabat-Salé Airport Revenue Pessimistic Scenario ......................................... 101
Figure 79-Payback Period Schedule: Pessimistic Scenario ................................................... 101
Figure 80- (Statistica, 2015) ................................................................................................... 102
Figure 81-(Google Adwords, 2015) ....................................................................................... 102
Figure 82-Evolution of searches for Hotels in Morocco from the UK & France .................. 103
Figure 83-(World Bank Data, 2015) ...................................................................................... 104
Figure 84- World Bank Data, 2015 ........................................................................................ 105
Figure 85-Total Available Market in top 6 European countries ............................................ 105

11
List of Acronyms:
RISMA: Société d’Investissement & Propriétaire Hôtelier
ANIT: Association Nationale des Investisseurs touristiques
BCG: Boston Consulting Group
BMI: Business Monitor International
CPM: Competitive Profile Matrix
CRM: Customer Relationship Management
CIMR: Caisse Interprofessionnelle Marocaine de Retraite
EFE: External Factor Evaluation
FNIH: Fédération Nationale de l’Industrie Hôtelière
IFE: Internal Factor Evaluation
MAMDA: Mutuelle Agricole Marocaine d’Assurance
MCMA: Mutuelle Centrale Marocaine d’Assurance
ONA: Omnium Nord-Africain, now SNI: Société Nationale d’investissement
ONCF: Office Nationale des Chemins de Fer
OTM: Observatoire du Tourisme Marocain
QSPM: Quantitative Strategic Planning Matrix
SWOT: Strengths-Weaknesses-Opportunities-Threats
SPACE: Strategic Position and Action Evaluation
TOM: Top of Mind

12
I. Company introduction
With over than 3,700 hotels and 480,000 rooms in 92 countries in the five continents,
AccorHotels is considered as a world leader in the hotel industry. The French group with its
seventeen brands all over the world, ranging from luxury to small budget hotels, employing
more than 180,000 people, has made €5454 million in revenue last year.
1.1 History of AccorHotels:
It all began in 1967 with the opening of the first Novotel in Lille (France) by Gérard
Pélisson and Paul Dubrule who will create SIEH (Société d’Investissement et d’Exploitation
Hôteliers). The first hotel of the Ibis brand is launched in 1974 in Bordeaux. After what, SIEH
acquires the Courtepaille, Mercure and Sofitel brands. In 1983, Accor is born after the merger
of SIEH and Jacques Borel International. In 1985, Accor creates the Formula 1 brand, a new
concept in budget hotels and it continues its diversification and international expansion by the
takeover in 1990 of Motel 6 in the United States, the acquisition of the “Compagnie
Internationale des Wagons-Lits et du Tourisme” in 1991 and the creation of Accor Casinos in
1997 (Luc, 1997). 2010 constitutes a turning point in the group’s history: it decides to focus on
its hotel operations and separates from its Accor Services branch activities that will become
“Edenred” and separately publicly traded in the Paris stock exchange market (Blachez e.t. all,
2011). In 2011, the groups signs off its “LeNôtre” division for €75 Million. During the same
year, it also launched a unique study in the hotel industry; Accor launched a study measuring
its environmental impact, in order to have complete and reliable information to enhance its
strategy in this area. In 2013, AccorJobs.com gets 1st place for best business online recruitment
sites in Europe. Accor consolidates its leadership in Africa by signing the construction of 50
hotels in Angola in July 2015 (Accorhotels-group.com, 2015). Over the past 40 years, Accor
has gained expertise and stronger brands which basically position them as essential for all
market segments worldwide. They have been strengthening their performances in the fields of
operations effectiveness and hotels’ distribution. Their fidelity program, the “AccorHotels
Club” has over than 13 million members, including over two million in Asia. Sebastien Bazin,
named CEO of the group in 2013, gave a boost to the multinational company and redirected its
objectives towards a long-term vision. With a greater focus on the new threats challenging the
hotel industry and the means to utilize them to their advantage, AccorHotels is said to “open a
new hotel every two days” (Leymarie, 2015). AccorHotels is set to build the hotel business of

13
tomorrow based on a bold and innovative vision of their professions (AccorHotels-group,
2015).
1.2 Accor-Risma in Morocco:
Today, as an official member of the ANIT and FNIH associations, Accor-Risma
represents one of the major key players in the Moroccan hotel and services industry.
Risma was created by the French group Accor in 1993 as a private company, to first establish
their first two “holiday villages” under the name of Coralia in Agadir and Marrakech. In 1996,
Accor strengthens its position in Morocco by signing an agreement with the Moroccan
government with an objective to reach a capacity of 7000 rooms and becomes an incorporated
company. Three years later, Accor partners with a group of Moroccan institutions such as
Asma Invest, BMCE Bank, Nexity, RMA-Watanya, CFG Déceloppement and the MAMDA-
MCMA group, with the goal of creating a new tourism operator of reference in the kingdom.
Since 1999, Risma follows a constant and uninterrupted development of new units which
allowed them to establish a total of 27 hotels following the international standards and norms
in strategic locations of the kingdom. In 2006, Risma is the first Moroccan touristic company
to make its initial public offering at the Casablanca Stock Exchange (Risma.com, 2014). This
IPO allowed the group to acquire funds and finance the construction of its hotels. It was then
complemented by the creation of Accor Gestion Maroc that would become in charge of the
operations. In late December 2014, RMA-Watanya buying more shares reached a total of 30%
right behind Accor S.A (33%), and showing potential to supplant the French initial
shareholder. However, Accor remains the first shareholder and will continue to be linked to
Risma by a management contract through its subsidiary Accor Gestion Maroc (Ndiaye, 2014).
Amine Echcherki is the current chairman of the management board
succeeding to Azeddine Guessous and before him Marc Thépot, a key
figure of the fast growing development of the company over the past
decade. The latter undoubtedly marked the hotel industry in Morocco, by
leading the development of the Accor group since 200, he directly
participated in Risma’s IPO in 2006 (Challenge.ma, 2015). Please refer to
Appendix A.1 for the organizational structure of Accor- Risma. It even
achieved an occupancy rate of 60% of the overall Moroccan hotel industry
in 2011, despite the difficult regional context of political crises at that
time (Taleb, 2012). Headquartered in Casablanca, Accor-Risma seems to Figure 1. Accor In Morocco

14
have become the ultimate hub in Africa (A.J, 2014) and considered as a true success, the
Moroccan model of Accor is expected to be replicated elsewhere in Africa by investing in
hotels in Morocco and choosing to operate hotels it owns, Accor-Risma is set to be implanted
permanently on the Moroccan soil serving a diverse customer base, mainly European and
Moroccan and equally using their services while both on business trips and holidays
benefiting from the strong territorial coverage and smart locations in the cities (Marot, 2012).
Key Dates
1993: Accor creates Risma and opens Coralia Palmariva in Marrakech and Coralia La
Kasbah in Agadir.
1996: Risma becomes an incorporated company through the signature of the framework
agreement with the Moroccan government.
1997: ONA and ONCF acquire 66.66% of the Moussafir chain that will develop
subsequently under the brand Ibis Moussafir.
1998: Signature of the management rental agreement for a renewable period of twenty
years of the Palais Jamai as well as the the Almohades chain, but for a period of five
years, that would be managed under the Mercure brand in Agadir, Tangier and
Casablanca.
1999: Acquisition of the Scheherazade hotel in Rabat operating under the Mercure brand
as well. Risma opens capital for Moroccan investors.
2000: Opening of the Sofitel Mogador in Essaouira.
2001: Opening of two Ibis hotels in Meknes and Tangier.
2002: Acquisition of the remaining 60% of the Fastotel Company, owner of the Sofitel
Diwan. Opening of the Sofitel Marrakech and Ibis Moussafir in Fnideq.
2007: Acquisition of the Emirotel Company, owner of Rabat’s Hilton and its management
under the Sofitel name starting 2009.
2009: Opening of the first Suite Novotel in Morroco. Rebranding the Sofitel Diwan under
the M’Gallery signature.
2010: Change in governance with the setting up in March of a new board structure
composed of three members against five before then.

15
1.3 Accor-Risma’s Brands in Morocco:
Established in 13 cities, Accor-Risma offers an approximate number of 5179 rooms with
more than 35 hotels all over the kingdom’s territory. With a new Sofitel in Tetouan this year
and the potential opening of a second one in Casablanca (Barrahou, 2014), Accor-Risma is
benefiting from good brand awareness for most of its products and is planning to grow
accordingly.
1 Suite Novotel: Located in the Hivernage neighborhood of Marrakech, the Suite Novotel
offers travelers on medium stay a cozy atmosphere, modular suites of 30m², and
innovative services like free massages or the loan of a vehicle as well as a gourmet
boutique. Everything is designed to enable a client here for business or leisure to live a
stay in complete autonomy and freedom (AccorHotels -group, 2015).
16 Ibis: Present in Agadir, Marrakech, Ouarzazate, Casablanca, Rabat, El Jadida, Fes,
Meknes, Tangier, Fnideq, and Oujda, Ibis guarantees ultimate comfort with welcoming
and fully equipped rooms, modern reception arias and its new food offer Ibis Kitchen.
Attentive and efficient, Ibis offers the highest level of service within its class: reception
being open round the clock, breakfast being served from 4 am to midday, and a snacks’
bar, Ibis’ constant exigence has been rewarded by the ISO 9001 certification (AccorHotels
-group, 2015).
3 Mercure This midrange category of Accor’s is in harmony with every location it settles
in. Mercure hotels share the same uncompromising commitment to quality and are a real
alternative to standard or independent hotels would it be in Rabat, Nador or Al-Hoceima
(AccorHotels -group, 2015).
1 Novotel: The Novotel Casablanca city center offers its services in the heart of one of the
major cosmopolitan cities, near to business districts and touristic areas. Through a
consistent offer, Novotel contributes to the well-being of business and leisure travelers; a
welcoming and technophile atmosphere, spacious and adaptable rooms, balanced meals
around the clock, meeting and fitness rooms as well as spaces dedicated for children
(AccorHotels-group, 2015).
2 Pullman: Pullman reconciles business and leisure by offering its hyper-connected,
nomadic and cosmopolitan customers a fusion of efficiency and pleasure in their travels,
whether for business or personal reasons. Pullman embodies the “Work hard, play hard”
spirit and offers a new perception of the upscale hotel. With a warm and expert’s

16
welcome, and customized offers and services, the Pullman Mazagan Royal Golf & Spa as
well as the Pullman Marrakech Palmeraie Resort and Spa invite their clients to an
innovative and powerful experience (AccorHotels -group, 2015).
6 Sofitel: Sofitel offers contemporary hotels and resorts adapted to luxury hotels’ guests
of today in search of aesthetics, comfort and excellence. Located in the heart of a major
city or located in a more intimate and sumptuous place, every Sofitel offers a genuine
experience of the art of the French way of life with the best of local refinement. Sofitel
celebrates the design, gastronomy and culture in Agadir, Essaouira, Casablanca,
Marrakech, Rabat, Fez and more recently Tetouan (AccorHotels-group, 2015).
2 M’Gallery: M’Gallery is a unique collection of upscale hotels selected for their
authentic personalities and own characteristics. Its Heritage range brings together hotels
full of history. The Signature one reflects an aesthetic universe and the style a personality
that contributed to its creation or decoration. Finally, the Serenity range promises a safe
haven by the sea, in the countryside, or in the mountains. Rabat’s Diwan hotel and Al
Medina Essaouira Thalassa Sea & Spa invite travelers to experience memorable moments
(AccorHotels -group, 2015).
4 Ibis Budget: The reference brand of the low-cost segment is smart and casual. It
combines simplicity with the essential around a convivial atmosphere in Agadir, Fez, El
Jadida and Tangier for low prices. Ibis Budget is the ideal option for customers in search
of autonomy. It offers rooms for one to three people, free Wi-Fi and gourmet breakfast
(AccorHotels -group, 2015).
Figure 2- Accor's brands logos

17
1.4 Accor-Risma’s shareholders:
The main shareholders of Accor-Risma are: Accor S.A with 33.34% shares of the
company , followed by RMA WATANIYA with 29.59 % and BMCE Bank, Maghreb Siyaha
fund a subsidiary of FinanceCom, SIET, Accor’s direct subsidiary, T CAPITAL Group, the
CIMR and finally the MCMA-MAMDA group as shown in the figure bellow:
Figure 3- Pie chart of Accor-Risma's main shareholders
1.5 Accor-Risma’s subsidiaries:
Risma’s hotel perimeter is legally spread over several limited companies owned directly or
indirectly by Risma:
Moussafir hotels SA
Moussaf SA.
HCH SA. (Horizons Compétences Hôtellières)
Chayla SA.
Marrakech Plaza SA.
Fastotel SA.
Emirotel SA.
AGM, Accor Gestion Maroc has the mission of hotel management but also a mandate to
develop the interests of Risma. For efficiency and performance matters, AGM and Risma
have been taking their distances in terms of relationships between hotel manager and
owner, as an approach to accelerate growth and focus on the valuation of its brands and
hospitality expertise (Baazi, Fanion & Thiam, 2011).

18
II. Objectives, Strategies & Issues of Accor-Risma
2.1 Current Objectives:
Despite its pole position in the hotel industry worldwide, since the appointment of
Sébastien Bazin as CEO, the whole group has shifted directions. Accor-Risma’s new
objective is to become Morocco’s benchmark hotel operator based on the following new
principles:
A new name, a new identity, a new promise: AccorHotels, Feel Welcome.
Sustainably reinforce its strong position by acquiring more market shares and
empowering its loyalty program “AccorHotels Club”.
Enhance its corporate social responsibility through the Planer 21 program for
sustainable development.
The brands of the group were split into three distinct categories: Luxury & upscale, midscale
and economic; in order to enable the group to consolidate its expertise accordingly and secure
its leadership in each segment. Accor-Risma is looking forward to maximizing royalties,
improve its CRM and therefore loyalty by the implementation of strategies specific to each
brand of the different ranges present on the market.
2.2 Current Strategies:
Among Accor-Risma’s current strategies is to sustain the development of the economic
offer existing around the Ibis brand. Accor-Risma is also financially set to:
Reduce its short-term debt and consequently improve its solvency or solvability?
Financing a part of the investments for the necessary renovations needed to maintain
the competitiveness of certain strategic assets.
Maintaining its current assets.
Accor-Risma will continue to focus on its strategic assets and to work on an asset
management policy aiming for the optimization of its current assets. In other words Accor-
Risma is planning to invest if and only if good opportunities arise and do not unbalance its
financial structure (Dassouli, 2014).

19
2.3 Current Issues:
During the past decade, the success of Accor-Risma has been clearly noticed in
Morocco since the different hotels among the different ranges of the brand benefit from a
great brand awareness and has 8% market share of the country hotel industry (ALM, 2015).
However it has been facing financial and managerial issues as well as the impacts of the Arab
Spring and the recent tragic events in the neighboring region. The main issues Risma is facing
are:
The association of Morocco as a potentially dangerous country. The fact that
Morocco is categorized by 75% of the British population, as a country to avoid
among the other Muslim countries facing political instability (Bayo, 2015).
The concrete decrease of the foreign tourists coming to Morocco. At 2015’s first
trimester, travel revenues recorded in late April were 5.3% lower than last year’s
first trimester with a 16.3 billion MAD against 17.2 billion MAD previously
(Korso, 2015).
The French demand for hotels in Morocco has been decreasing by 9% in late April
2015 in comparison with the French amount of reservations in Morocco during the
same period during the last years (Berrada, 2015).
Accor-Risma focuses on debts to finance its investments (FinancialAfrik, 2015).
Accor-Risma is still behind in the digitalization phase of its commercialization
operations, since its website contains only few information about the hotels present
in the Kingdom’s territory.
Accor-Risma does not focus yet on its media, marketing coverage in Morocco.
Accor-Risma has not yet launched its own system of online reservation
(Khennach, 2015).
The managerial and financial roles are not well defined between AccorHotels-
group and Risma are not clearly defined which creates uncertainties within the
company’s workforce and its organizational structure seen as too blurred (Agence
Ecofin, 2015).
The distance Risma-Accor took from its core competencies by building and
opening a residence counting 34 villas named “Jardin des Roses”, which makes us
believe in a will of diversification instead of focusing on its principal objective that
is to be the leader of the hotel industry in Morocco (ALM, 2015).

20
III. Mission & Vision
The vision and the mission are statements that are exceptionally vital and necessary to the
setup of focused purposes and planning good methodologies in the elaboration of a firm’s
objectives and strategies.
3.1 Vision Statement:
Risma is a “hotel investor serving the Moroccan Tourism sector” (risma, 2015).
3.2 Mission Statement:
The mission statement is a key feature in the determination of the culture, objectives and
attitude of a company. Risma’s current mission statement is the following:
“Risma is the first tour operator in Morocco. Resolutely involved in the dynamic of a
continuous evolution, Risma aims to consolidate its role as leader in the tourism industry and
to support the national strategy of the touristic development “Vision 2020” in order to make of
Morocco one of the top 20 destinations in the world”
3.3 Recommended Vision Statement:
To become the kingdom’s leader in the tourism industry as Morocco’s exclusive
representative of AccorHotels-group.
We analyzed Accor’s old vision statement and we figured out that there was a lack of
transparency about their operations. Moreover, this innovative vision statement comprises their
desire to be the pioneers as franchisors and key player in the Moroccan tourism industry.
After analyzing Accor-Risma’s mission statement we figured out that it did not include the
consumers, nor the market, not the products or its services in detail which are essential to

21
illustrate the identity of the company to the public. Moreover, the company did not mention nor
refer to the technology, which is an essential point when it comes to the hotel industry nowadays
in the high and fast internet penetration witnessed worldwide. In addition to that, the company
did not mention no desire to grow nor it did contain the philosophy and values of the internal
organization, nor did it state the concern for employees. Furthermore, Accor-Risma did not
include their willingness to improve its corporate social responsibility.
Evaluation of Accor’s Mission Statement
3.4 Recommended Mission Statement:
To become Morocco’s first hotel company that aims to be a model of corporate citizenship
through its exclusive franchising of AccorHotels’ brands. With Sofitel, Pullman, M’Gallery,
Novotel, Ibis & Adagio, we aim to provide a shelter that will make all kind of travelers
comfortable and feel like home. Risma is keen to be in a constant improvement of its work
quality, perseverance and reactivity to enrich the experience of both our staff and clients. We
also aim to digitalize our processes for more precision and productivity while keeping in touch
with its Moroccan roots by involving the local talent pool.
Evaluation of the new mission statement:
Components Accor’s Mission Evaluation
1. Customers All kind of travelers
2. Products or services Luxury brands, Midscale, economic
3. Markets Low, middle and high income Moroccans and internationals
4. Technology Digitalize our processes
5. Concern for growth Constant improvement
6. Philosophy Aim to provide a shelter for all
7. Self-Concept Main world’s driving inn administrator
8. Concern for public image be a model of corporate citizenship
9. Concern for employees Involving the local talent pool

22
IV. External Audit
4.1 Industry Analysis:
The tourism industry is one of the most important contributors to the Moroccan
economy’s development. In fact, the total services contribute by 53% to the overall Moroccan
GDP with a 9% contribution from the tourism industry. The sector is expected to growth in
the four upcoming years. According to the World Travel & Tourism Council, the tourism
industry is a major focus of many international investments. It is important to mention that the
industry receipts totaled MAD 180 billion in 2014. The industry secures 871 000 jobs, which
represents 7.6% from the total employment.
Industry SWOT analysis
According to Business Monitor International’s report of 2015, the Moroccan tourism industry
includes has several strengths, weaknesses, opportunities, and threats:
Strengths
Morocco is a genuinely safe destination, which was not as seriously influenced as
different nations in the region by the Arab Spring and related challenges.
Morocco offers a wide range of sorts of tourism, from shoreline occasions to social
tourism in areas, for example, Marrakech.
The nation pulls in vacationers from distinctive parts of the world, with higher quantities
of Arab sightseers now supplementing effectively high quantities of guests from
Europe.
Gradually enhancing business environment empowering foreign investments.
Weaknesses
The Moroccan tourism market is still affected by the slow economic growth after the
world economic crisis
Transport facilities and infrastructure need more improvement, to pull in hoteliers and
luxury seeking tourists, especially in country regions.
More utilities infrastructure required with both water and power associations needing
improvement.

23
Opportunities
Large development potential in landings and enhancing inhabitance rates supporting
development.
Rise in travelers requires more hotels, crosswise over spending plan and top of the line
ranges. Smaller destinations outside principle urban areas, for example, the Atlas
Mountains, pulling in more tourists.
Increasing travel associations including low cost airline destinations.
Threats
Infrastructure and facilities like water could be put under weight by a quick increment
in tourism numbers and potential congestion in hotspots as Marrakech, particularly once
the full impacts of ease flights from Europe kick in.
Danger of terrorist attacks could hinder potential guests.
Disputable detainment of a British tourist in 2014 could impact entries from this key
market going ahead.
According to the same source, the report forecasted the Moroccan Tourism sector to be a
growing one after the low increase in 2011 and 2012:
“Morocco has recovered from disappointing growth in arrivals in 2011 and
2012 to an extent, when the tourism industry was affected by the economic
crisis in the Eurozone, which impacted upon arrivals from several major
source markets, such as France and Spain. Arrivals were also affected by the
after-effects of the April 2011 suicide bomb attack on a popular tourist café
in Marrakech, which killed 16 people, as well as uncertainty ahead of the
parliamentary election of November 2011 - a period marked by several
demonstrations across the country. The elections passed peaceably and, in
general, Morocco appears to have escaped the unrest that affected many of
its neighbors. Arrivals largely recovered in 2013 and 2014, and we are
expecting to see solid growth in the inbound tourism market moving forward;
by 2018, we expect arrivals to Morocco to reach 12.7mn, up from 11.1mn in
2015” (BMI, 2015).

24
The above graph shows a forecasted increase in Total arrivals in Morocco reaching 13
million tourists in 2019. In addition, the forecasted tourism receipt will reach $12.6
billion, which is around MAD126.6 billion. This proves that the Moroccan tourism
industry is a growing market, as it is expected to generate income. Mainly the income
from the international tourism in Morocco is generated using foreign country, which
increases the country reserve from foreign currencies mainly US Dollar and Euro.
Forecasted International Tourism Arrivals
The main markets contributing in the Morocco tourism industry are the European ones.
The following table shows the top 6 markets by arrivals in Morocco, with a forecasted
of arrivals up to 2018.
Figure 5- Top Markets by Arrivals in Morocco (BMI, 2015)
Figure 4- Evolution of Total Arrivals to Morocco, 2002-2019 (BMI, 2015)
25
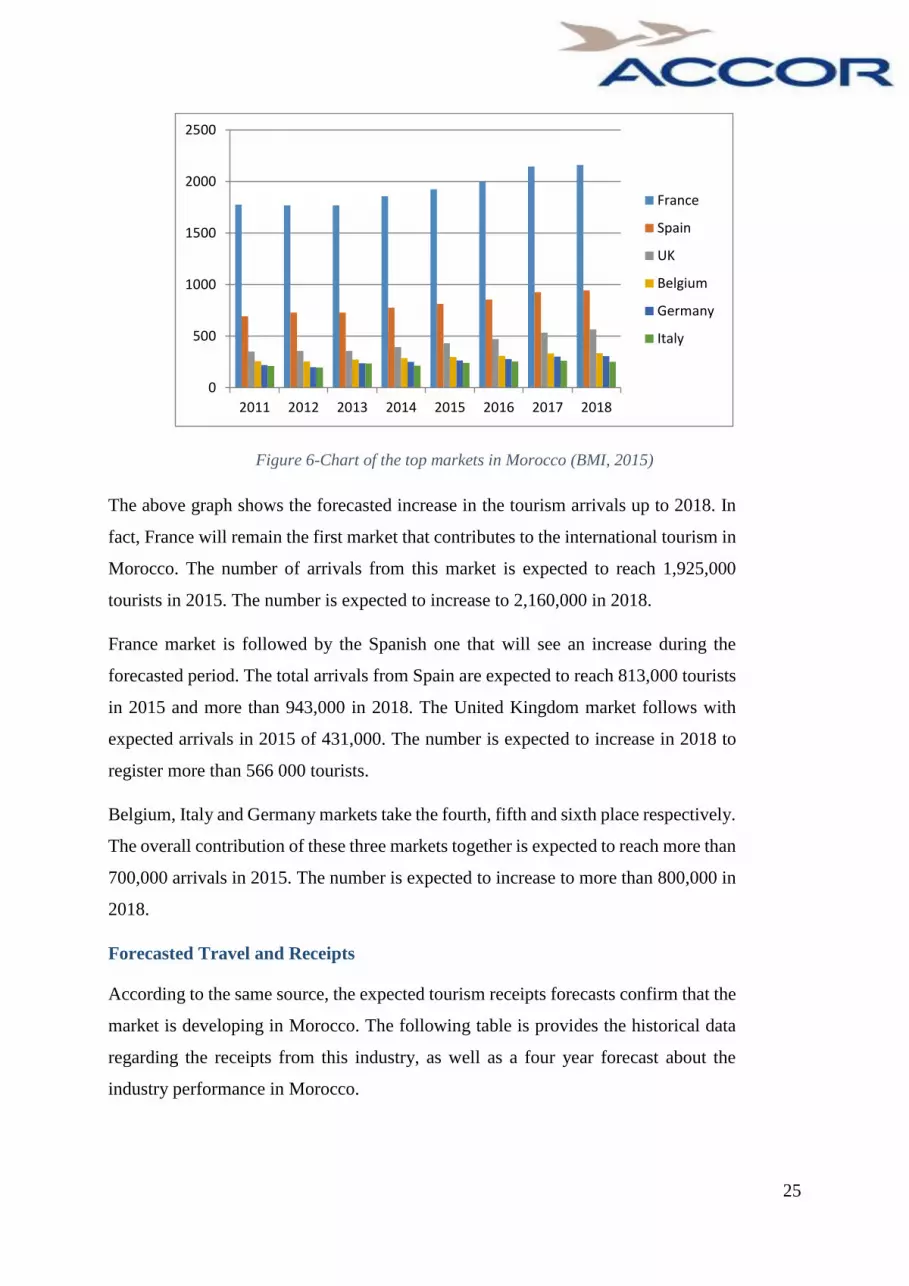
Figure 6-Chart of the top markets in Morocco (BMI, 2015)
The above graph shows the forecasted increase in the tourism arrivals up to 2018. In
fact, France will remain the first market that contributes to the international tourism in
Morocco. The number of arrivals from this market is expected to reach 1,925,000
tourists in 2015. The number is expected to increase to 2,160,000 in 2018.
France market is followed by the Spanish one that will see an increase during the
forecasted period. The total arrivals from Spain are expected to reach 813,000 tourists
in 2015 and more than 943,000 in 2018. The United Kingdom market follows with
expected arrivals in 2015 of 431,000. The number is expected to increase in 2018 to
register more than 566 000 tourists.
Belgium, Italy and Germany markets take the fourth, fifth and sixth place respectively.
The overall contribution of these three markets together is expected to reach more than
700,000 arrivals in 2015. The number is expected to increase to more than 800,000 in
2018.
Forecasted Travel and Receipts
According to the same source, the expected tourism receipts forecasts confirm that the
market is developing in Morocco. The following table is provides the historical data
regarding the receipts from this industry, as well as a four year forecast about the
industry performance in Morocco.
0
500
1000
1500
2000
2500
2011 2012 2013 2014 2015 2016 2017 2018
France
Spain
UK
Belgium
Germany
Italy
26
2011 2012 2013 2014
2015
f
2016
f
2017
f
2018
f
Tourism receipts, MADbn 91 84.9 88.9 95.9 101.8 107.3 116.7 123.1
Tourism receipts, MADbn, % y-o-y 11.3 -6.7 4.7 7.9 6.2 5.4 8.7 5.5
Tourism receipts, transport services, MADbn 14.41 15.5 13.2 14.31 15.45 16.46 18.04 19.12
Tourism receipts, transport services, MADbn, % y-o-y 16 7.5 -14.8 8.4 8 6.6 9.6 6
Tourism receipts, travel items, MADbn 59.27 57.84 61.42 65.87 70.56 74.7 81.07 85.43
Tourism receipts, travel items, MADbn, % y-o-y 4.97 -2.4 6.18 7.25 7.11 5.87 8.53 5.37
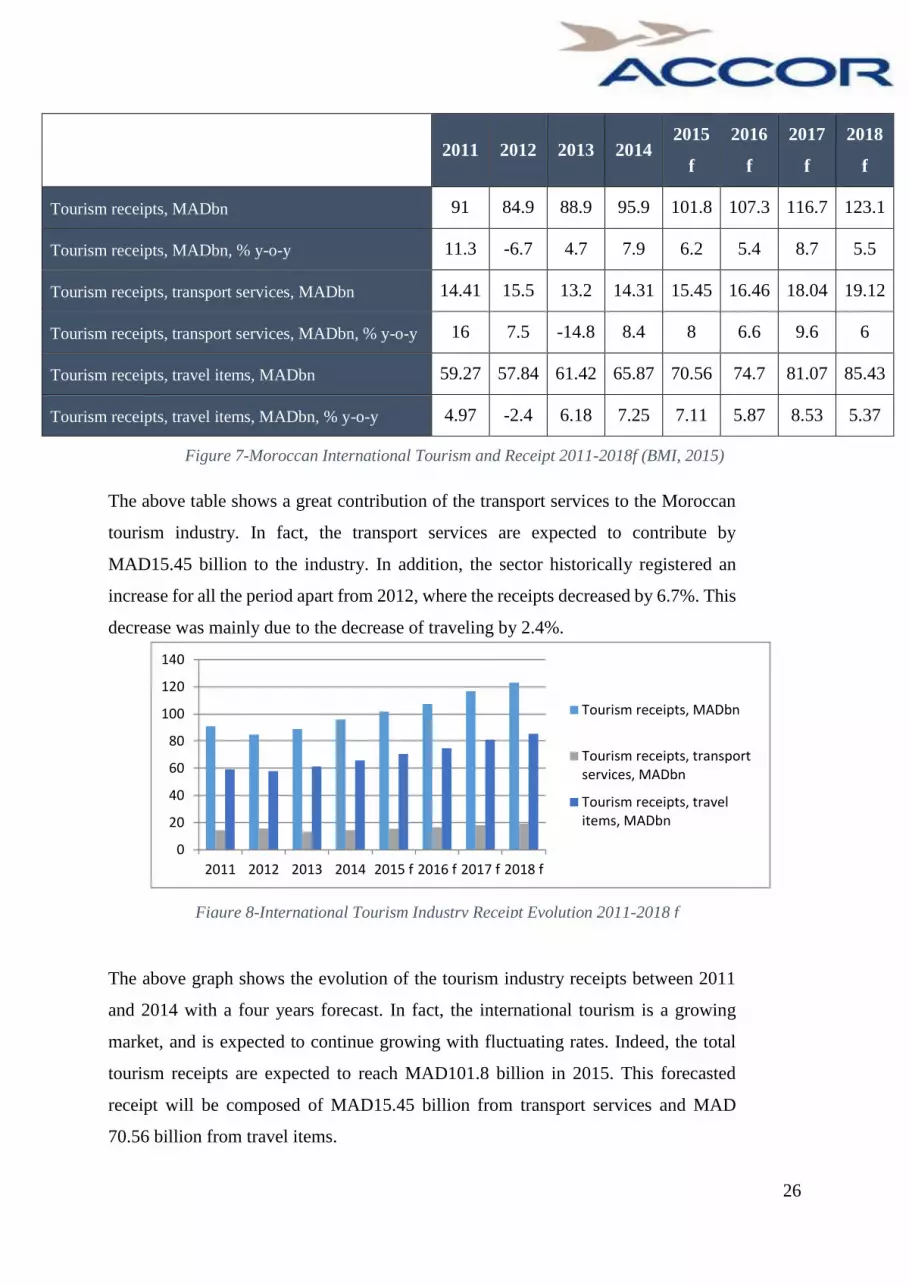
Figure 7-Moroccan International Tourism and Receipt 2011-2018f (BMI, 2015)
The above table shows a great contribution of the transport services to the Moroccan
tourism industry. In fact, the transport services are expected to contribute by
MAD15.45 billion to the industry. In addition, the sector historically registered an
increase for all the period apart from 2012, where the receipts decreased by 6.7%. This
decrease was mainly due to the decrease of traveling by 2.4%.
The above graph shows the evolution of the tourism industry receipts between 2011
and 2014 with a four years forecast. In fact, the international tourism is a growing
market, and is expected to continue growing with fluctuating rates. Indeed, the total
tourism receipts are expected to reach MAD101.8 billion in 2015. This forecasted
receipt will be composed of MAD15.45 billion from transport services and MAD
70.56 billion from travel items.
0
20
40
60
80
100
120
140
2011 2012 2013 2014 2015 f 2016 f 2017 f 2018 f
Tourism receipts, MADbn
Tourism receipts, transportservices, MADbn
Tourism receipts, travelitems, MADbn
Figure 8-International Tourism Industry Receipt Evolution 2011-2018 f

27
4.2 PEST ANALYSIS:
Political Factors:
Morocco is one of the oldest monarchies in the world. King Mohamed IV started his
reign in 1999. The Moroccan kingdom has been flexible with the changes needed by the
people, such as the new constitution implemented by the government in 2011 that aims to
give more transparency in the electoral sessions as well as more power to the people that were
seeking for dynamism within our society. In addition, Morocco has being investing in the
health care and educational system in order to improve those sectors as well as improve its
human development index. The Moroccan government has being putting a lot of efforts for
the sake of development of the country and the improvement of important sectors. In addition
the Moroccan kingdom is the most stable region in North Africa with a strategic position
giving access to both the Atlantic Ocean and the Mediterranean Sea. The Moroccan
government started to be more flexible to the people’s demands in order to avoid strikes and
misbehaviors. As we can notice, the Arab spring did not have a big impact on Morocco
compared to neighboring countries, thanks to the efforts made by the government in order to
make elections transparent for the public and in giving more power to the head of the
government that is chosen by the public.
Economic Factors:
The Moroccan economy has been experiencing a stable growth for the last decade. In
order to attract new investors and grow, the Moroccan government is offering subsidies and
financial help for some projects to boost the tourism sector (OTM, 2015). The number of
tourists coming to Morocco has been increasing for the last five years, recording an increase
of 7% compared to the previous year, nearly a million additional tourists in 2015. Also, we
can see in the table below the occupancy rate of accommodation establishment variation. The
table details the occupancy rate of hotels, specifying the region, the period of the stay and the
average duration of the stay in the Moroccan kingdom. The table is specific to the period from
January to August (Figure 9).
The second table of occupancy rate for accommodation establishment is specific to the period
of august. During this period of the year, Morocco has the largest inflow of tourists, which is
making the occupancy rate of the establishments higher (Figure 10).

28
Considering the negative variation of the occupancy rate, the Moroccan hospitality market
still has an estimated average of 43% occupancy rate.
The increase of inflow of tourists and the decrease in the occupancy rate can be explained by
the new threat for the Hospitality establishments that is Airbnb. Airbnb is website made to
list, find and rent apartments, villas, etc. The website’s network is already spread worldwide
reaching 190 countries, 34000 cities, and a total number of listings exceeding 1.5 million
announcements available on the website. The website allows different transactions for its
member, from renting to exchanging houses between members which is starting to be a threat
Figure 10- Occupancy rates in registered accommodation establishments from January to August (OTM, 2015)
Figure 9- Occupancy rate in registered accommodation establishments in August (OTM, 2015)

29
for the industry. In order to minimize the impact of this threat, Accor has launched its Ibis
Budget Hotels to stay competitive in the price and give a quality/price ratio convenient for
potential customers. In addition, Ibis hotels always beneficiate from strategic positioning in
big cities; a factor that impacts heavily the choice of potential customers.
Considering the decrease of the occupancy rate of accommodation establishment compared to
last year’s, Hotels present in the territory are making efforts to keep their customers by
sending promotional offers during holidays period. These promotional offers may give more
incentive to potential customers rather than switching to substitute services (Motels,
apartments, camping, etc.)
According to the “statistiques sur le tourisme au Maroc” report, the number of tourists arrived
in the territory has increased of 7% compared to five years ago, and investments in the
tourism sector has increased thanks to the government efforts to boost the tourism industry
through its vision “Morocco 2030”.
The main sectors of the Moroccan GDP are:
Agriculture 14.6%
Industry 27,3%
Services 58,1%
The Moroccan agricultural sector generated 11.56 billion USD in 2013 and expecting
to reach 17 billion USD within 2020. In order to achieve its objectives, the Moroccan
government is attracting investors by implementing a new strategy for the sector. A
completely new approach for investors, the Moroccan government is planning to lease
600,000 hectares to local & foreign investors.
The Moroccan industry sector is expected to grow based on the forecasts of the
different markets in the industry; textile, automotive and food processing industries. The
industry sector in Moroccan GDP is contributing from 25 to 35%, the variation of the Industry
sector contribution to the GDP can be explained by the performance of the agricultural sector
of the period. Since the agricultural sector is depending on the weather, its contribution to the
GDP is not fixed but highly variable. The Moroccan government is investing and putting a lot
of efforts in the industry sector, in order to attract new investors and grow its economy. The
contribution of the industry sector has grown from year to year, even to exceed the
agricultural sector’s contribution in the year 2010. (Agriculture: 14.7%/ Industry: 38.9%)

30
The Moroccan services sector contributes up to 58.1% in the GDP and employs more
than 35% of the local workforce. The sector is mainly composed of tourism,
telecommunication, transportation and IT industries. The tourism is considered as the main
source of inflow of foreign currencies, thanks to the increase of the number of tourists
arriving in the Moroccan frontiers. In order to grow and develop the Moroccan tourism, the
government has implemented a new project Morocco 2030. For its vision to 2030, Morocco
plans to create new hospitality establishment in order to form and train its workforce for the
tourism industry, also encourage accommodation establishment to get accreditations and
develop new qualifications during trainings. Those reforms are meant to attract new investors
by offering good infrastructures and a qualified local workforce.
Social Factors:
The Moroccan government has been very active in improving its current economy sectors.
However, in doing so the country must improve its educational as well as health care system
in order to offer a good primary education and take care of its population. As stated in the
objectives of the Morocco vision 2030, Morocco is planning the opening of numerous
formation establishments for the hospitality institutions as well as the improvement of
educational systems that will aim to form a qualified workforce.
The Moroccan population recorded an increase in its population from 19.8 million in 1980 to
33.01 million in 2014 with an expected population of 42.9 million in 2050 (ESCWA, 2012).
Period Population Growth Rate (%)
1980-1985 2.36
1985-1990 2.04
1990-1995 1.68
1995-2000 1.35
2000-2005 0.96
2005-2010 0.98
2010-2015* 1.41
Figure 11- Moroccan Population Growth rate (

31
For the Moroccan population age composition, the Moroccan population for the under 15
years old has been decreasing from 1980 and is expected to continue this movement in 2050.
However, the working age population (15-64) has been increasing from 1980 to 2010
recording an increase from 52.9% to 66.9%, with an expected forecast to be reaching 66.8%
in 2035. For the proportion of elderly population (+65), it has witnessed an increase from
1985 to 2005, recording a variation from 3% to 5% with forecasted growth until 2050 to be
reaching 15.2% (ESCWA, 2012).
For the population by gender, the HCP released a study in 2013 showing the gender
proportion in the Moroccan population with 50.34% for women and 49.64% for men.
In addition, a significant drop in the unemployment rate from 13.8% to 9% that is showing the
growth of the Moroccan’s economy, also the human development index that has been
improving thanks to the reforms implemented by the government concerning the health care
and educational system. Also, a study conducted by the HCP in 2011 indicates that 68% of
youngsters watch TV and listen to radio regularly while the remaining third claim to use
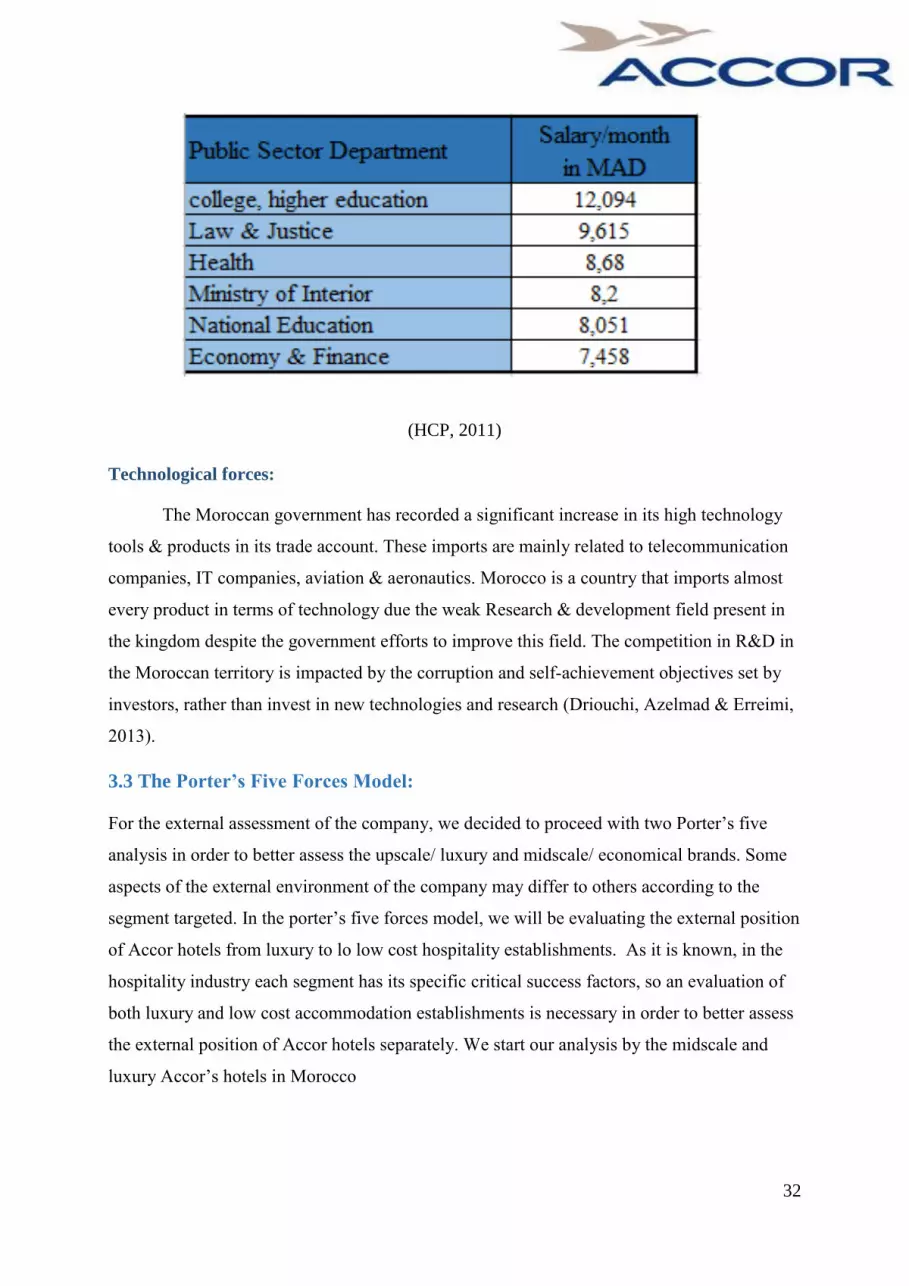
internet as a primary source of research, entertainment & information (HCP, 2011).
32
(HCP, 2011)
Technological forces:
The Moroccan government has recorded a significant increase in its high technology
tools & products in its trade account. These imports are mainly related to telecommunication
companies, IT companies, aviation & aeronautics. Morocco is a country that imports almost
every product in terms of technology due the weak Research & development field present in
the kingdom despite the government efforts to improve this field. The competition in R&D in
the Moroccan territory is impacted by the corruption and self-achievement objectives set by
investors, rather than invest in new technologies and research (Driouchi, Azelmad & Erreimi,
2013).
3.3 The Porter’s Five Forces Model:
For the external assessment of the company, we decided to proceed with two Porter’s five
analysis in order to better assess the upscale/ luxury and midscale/ economical brands. Some
aspects of the external environment of the company may differ to others according to the
segment targeted. In the porter’s five forces model, we will be evaluating the external position
of Accor hotels from luxury to lo low cost hospitality establishments. As it is known, in the
hospitality industry each segment has its specific critical success factors, so an evaluation of
both luxury and low cost accommodation establishments is necessary in order to better assess
the external position of Accor hotels separately. We start our analysis by the midscale and
luxury Accor’s hotels in Morocco
33
Upscale and Luxury Range
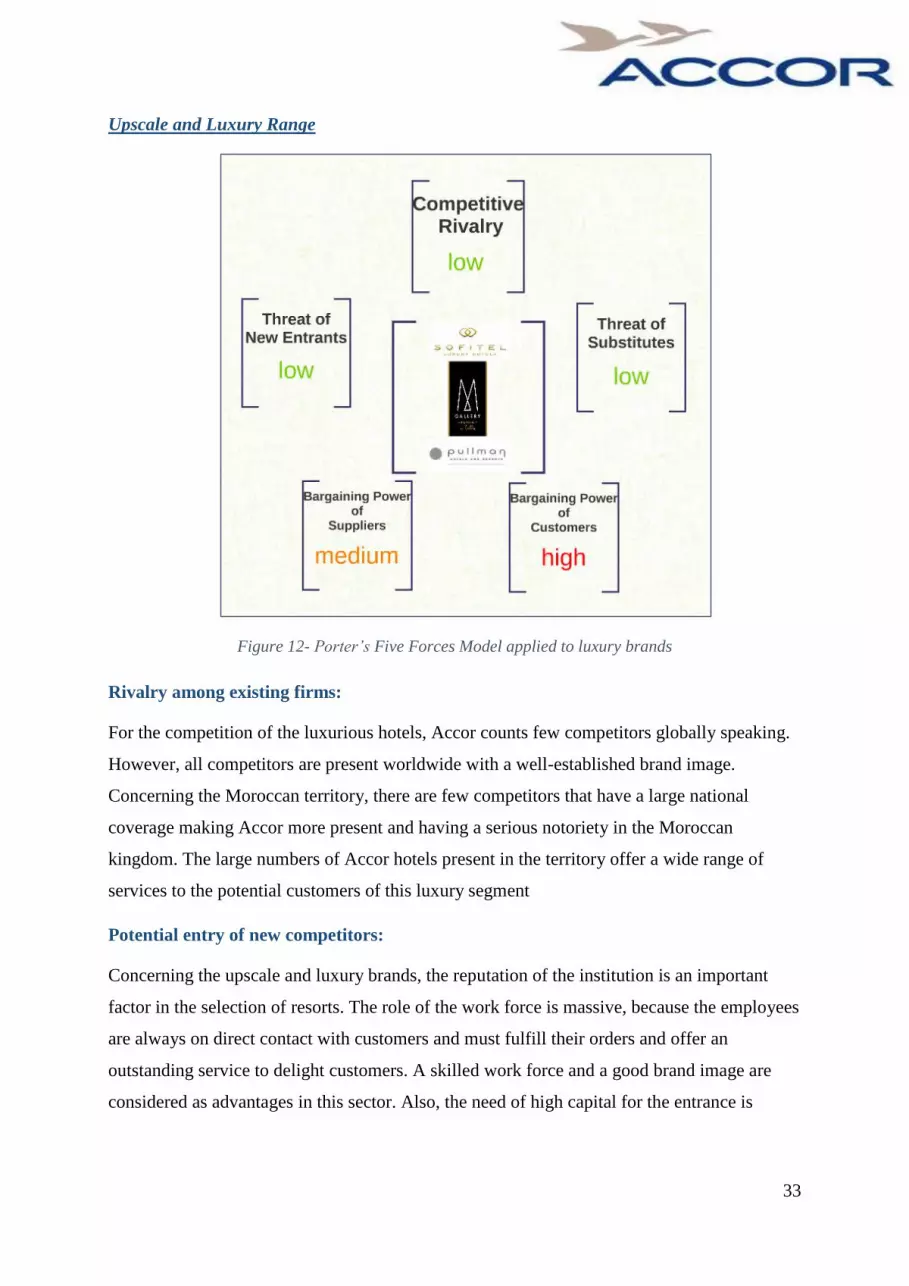
Figure 12- Porter’s Five Forces Model applied to luxury brands
Rivalry among existing firms:
For the competition of the luxurious hotels, Accor counts few competitors globally speaking.
However, all competitors are present worldwide with a well-established brand image.
Concerning the Moroccan territory, there are few competitors that have a large national
coverage making Accor more present and having a serious notoriety in the Moroccan
kingdom. The large numbers of Accor hotels present in the territory offer a wide range of
services to the potential customers of this luxury segment
Potential entry of new competitors:
Concerning the upscale and luxury brands, the reputation of the institution is an important
factor in the selection of resorts. The role of the work force is massive, because the employees
are always on direct contact with customers and must fulfill their orders and offer an
outstanding service to delight customers. A skilled work force and a good brand image are
considered as advantages in this sector. Also, the need of high capital for the entrance is

34
imperative in order to offer a high quality stay with the best furniture and entertainments for
customers.
Bargaining power of suppliers:
Hotel chains have many types of suppliers from services to goods. For the services, the hotels
outsource its maintenance of materials to external companies. For the goods, hotels have
contracts with furniture manufacturers (beds, tables, etc.) and get supplied on a daily basis of
food for the restoration services of the hotel chain. Given the notoriety of Accor and its wide
coverage globally, Accor has a certain power over customers because the company represents
big orders from suppliers making them one of their major customers.
Bargaining power of customers:
In the luxury sector, the customer is king. Customers have much higher expectations than the
budget brand’s customers. The customers expect a high quality service from the hotel as well
as devoted employees to ensure the satisfaction of customers. The high price of the stay must
be associated with an outstanding quality service that will make the customers come back to
the hotel. Also, customer loyalty is one of the key success factors in the luxury segment,
Hotels must keep track of their customers as well as send promotional offers to give them
more incentives to come back.
Threat of substitute products:
As mentioned earlier, the key success factors of the luxurious hotel industry are the
outstanding customer service, hygiene and strong brand name/ notoriety. The threat of
substitute product is low in this segment due differentiation strategies used by each resort and
high efforts to keep their customers loyal.

35
Midscale and Economic Range
Rivalry among existing firms:
The competition in the low budget hospitality market is high due to high potential alternatives
and high number of potential customers available in the Market. However, Accor
differentiates itself from competitors by offering a good customers service as well as high
hygiene standard of its institutions. In addition, the Accor chain is one of the few in the
hospitality industry to offer a free breakfast for all the types of formulas available in their
hotels, even for the low budget staying.
Potential entry of new competitors:
For future perspectives, the Moroccan government is working on the plan Maroc 2030 in
order to improve its tourism sector. In order to attract new investors in the Moroccan soil, the
government is giving financial help through the FDMT (Fond Marocain pour le development
touristique). The financial aid varies depending on each project, its location and the risk
associated to the project. According to invest In Morocco, a budget of 24 billion Moroccan
dirhams MAD has been allocated by banks for the Project Morocco 2030.
Bargaining power of suppliers:
As mentioned earlier, Accor’s suppliers are from different operating fields from service to
goods. From food supplies for restoration services to services for maintenance and furniture
for the hotels, Accor is dealing with a large number of suppliers. For the Moroccan soil,
Figure 13-Porter’s Five Forces model applied to midscale &
economic brands

36
Accor is largest hospitality chain with thirty-four hotels spread around the territory giving
them a high bargaining power over suppliers. In addition, the services provided to Accor are
available in the market, which give them more alternatives in their supplier selection.
Bargaining power of customers:
For the low-budget/economical hotels, Customers have less bargaining power compared to
upscale segment due to the price paid for the service offered. However, Accor is offering
extra free services for its customers that competitors fail to offer. The access to the Wi-Fi is
free for all the customers even in the rooms; the breakfast is offered for any formula chosen,
and clean and impeccable rooms for customers no matter the standing of the hotel chosen.
Threat of substitute products:
In opposition to the upscale/ luxurious segment, the low budget hospitality industry faces a
high threat regarding the substitute products present in the market. In the low budget industry,
the customers tend to think about the convenience of their choice, a price/quality ratio, rather
than staying loyal to one brand. For the substitute products, we can list low rated hotels, non-
rated hotels, apartments for rent and camping, etc. These substitutes may offer more space for
customers at an affordable price, the case of apartment rentals during holiday periods.
4.4 External Factor Evaluation Matrix
Accor scored 2.69 in the external factors evaluation assessing the strong external position
of the company, and its competitiveness in the hospitality market.
Opportunities:
Demand for more lodging supply
Morocco’s strategic geographic location
Growing urbanization
Increase of tourists arrivals
Demand for more lodging supply in France
Decrease of illiteracy rate
Threats:
Foreign currency exchange rate fluctuation
Rise of Airbnb
Political instability in the south region of Morocco

37
Rough competition in Morocco
Opportunities:
As stated earlier, the number of tourists’ arrival has recorded a 7% increase compared
to 2014; nearly an additional million tourists. Referring to the table of occupancy rate
of the different regions in Morocco, we can see that the regions of the kingdom with
most visits are Marrakech, Agadir & Casablanca respectively. Moreover, the majority
of the hotels belonging to Accor chain are located in those regions and are well spread
over the regions with different formulas offered to customers from different
purchasing buying power.
In 2016, France will be hosting the euro cup, which is considered as an opportunity
for Accor to exploit. In addition to that, the current strategies of Accor consist of
spread their hospitality establishment in Europe and flood the Moroccan market with
low cost/ economical accommodation establishment, such as ibis, ibis budget & ibis
style. We chose to give a rating of 3 to the opportunity because of the compatibility of
the opportunity with the current strategies of Accor, as well as the number of potential
customers targeted thanks to the European cup organized in France.
According to the HCP study, the urbanization rate has been increasing since 2010, to
record a 4% positive growth. The growing urbanization implies that more workforce
available in the market place, as well as a decreasing rate of unemployment. We
choose to put a rating of 2 because we believe that the growing urbanization has not a
big impact of the external position of Accor.
For the strategic positioning Opportunity, Morocco is enjoying a perfect geographic
position with an access to both the Atlantic Ocean & the Mediterranean Sea. In
addition to that, Accor is the largest hotels chains present in the Moroccan kingdom,
with 34-accommodation establishment spread over the territory with well-established
brand image & a variety of formulas to attract all potential customers. Thus, we
allocated a rating 3 to the strategic positioning of the Accor chain in the Moroccan
kingdom.
For the Morocco vision 2030, the Moroccan government is boosting its tourism sector
by opening new accommodation establishment forming institutions in order to create a
qualified local workforce for foreign investors, the subsidies offered by the
government for the hospitality industry are effective in attracting new foreign
investors and training programs for the workforce offered by the government. We

38
choose a rating of 4 for the first opportunity thanks to the help & assistance provided
by the government to investors (Maroc vision 2030, 2014).
For the decrease of the illiteracy rate, it is associated with the government effort made
to improving both the health care and educational system. By doing so, the public has
access to these resources and the social middle class is most likely expected to grow
which will create more potential customers to the Accor group and the hospitality
industry. We chose to allocate a rating of 2 to the opportunity because the opportunity
may exploitable on the long run and its impact also is for coming years, not on the
short run.
Threats:
The foreign currency exchange rate fluctuation is a factor to be considered by
investors in the selection of the country to invest in. The Moroccan MAD does not
have a significant variation, since the currency variation has reached a maximum of +-
0.06%. In addition, the Moroccan MAD is an attractive currency to foreign investors,
and the availability of opportunities in the hospitality sector since the industry is
growing.(Bank al Maghrib, 2010)
Airbnb is a website that aims to find and list lodging items. The website constitute a
real threat to the hospitality industry, since it can be considered as a substitute product
for potential customers. The website offers new services such as the exchange of
houses between the website members that is becoming a new trend and more spread
way to spend cheap holidays. This new service constitutes a real threat to the hotel
chains present in the territory and abroad. The website is offering its services
worldwide, and the service just stated to operate in Morocco. Moreover,
accommodation establishments are promoting their services through the website in
order to compete with individual’s listings present in the Moroccan kingdom. We
decided to put a rating of 2 to this threat, because the service offered by the website is
not well spread. The concept offered by Airbnb is still fresh and only people accessing
the internet may know it or already experience the service.
The political instability of the south region of the territory is constituting a threat for
the hospitality industry due to the Opportunities present to exploit in the south, as well
as the low number of hospitality institutions present in that region. A rating of 2 has
been allocated to this threat because the regions with the most visited rate in the south

39
record their high number of arrivals in summer; especially in August. (statistiques sur
le tourisme au Maroc, 2015)
The competition among hospitality establishments in Morocco is harsh because
Morocco counts numerous number accommodation establishments owned by few
hotel chains such as Accor, Atlas & Kenzi. However, Accor has the largest national
coverage of hotels in Morocco with 34 institutions, therefore having an advantage over
the competition. In addition to that, Accor is already using differentiation strategies
even for the midscale and economical hotels such as free WI-FI and breakfast.
However, the entrance of new competitors such as Four seasons hotels are dangerous
for Accor, since the upscale & luxury segment of Accor hotels are generating a high
percentage of their revenues.
Figure 14- External Factor Evaluation Matrix
4.5 Competitive Profile Matrix
The Competitive Profile Matrix (CPM) identifies a firm’s major competitors and its
particular strengths and weaknesses in relation to a sample firm’s strategic position, so the
company will be able to know which ranges it ought to enhance and, which zones it must secure
(David, Ali & Al-Aali, 2011).
The competitors in our case are Kenzi, Atlas, Four Seasons and Ryad Mogador. These 5
companies are going to be compared based on critical success factors that includes both internal
and external issues. In the Moroccan market, these four are the major competitors in the hotel
industry. Some are global whereas others stay local.

40
Atlas Hospitality Morocco is a chain that operates in 7 cities in Morocco (Casablanca,
Rabat, Marrakech, Agadir, Oujda, Tangier and Fez) with twelve entities. This group has a
capacity of 3000 beds in hotels ranked between 3 to 5 stars.
For Kenzi hotels, it is composed of 9 hotels spread in Errachidia, Ouarzazate, Agadir,
Marrakech, and Casablanca. The majority is five stars with six hotels. The three others are four
stars.
The evaluation of the CPM uncovers that Accor is the greatest performer in the business
with qualified strengths in the geographic location, the brand awareness, the brand image, and
the customer loyalty. Then again, Atlas succeeds in the quality of the service. Four seasons
prevails the quality of the service, the technological advancement, the brand image, the
customer loyalty, and the financial situation. Furthermore, Ryad Mogador achieves its strength
in the price competitiveness. Moreover, Kenzi is the scrawniest company of each one of them
and it doesn’t contain any qualified quality against its opponents. In addition to that, the
organizations have to build their procedures as per their main qualities and their main weakness
and also to enhance their main appraisals in the meaningful industry’s territories.
V. Internal Audit
5.1 Company image Audit
Risma is not necessarily known by the Moroccan population, however its brands are.
Even, with low marketing and communication efforts, the hotels owned by the consortium
Figure 15- Accor-Risma's competitive profile matrix

41
benefit from a large TOM recall by the Moroccan as well as the foreign consumers. Amine
Slimani, alumnus of the School of Science and Engineering at Al
Akhawayn University in Ifrane, was appointed in 2013, as head of the
marketing and commercial department at Accor Gestion Maroc (ALM,
2014). He became in charge of the brands commercial and marketing
planning in Morocco, under the supervision of the headquarters’
executives in Paris. We performed social listening using
socialmention.com and assessed the e-reputation of Accor. The indicators
of strength, sentiment, passion and reach are positive, since the strength is
“the likelihood of the brand being mentioned in social media”, sentiment is
“the ratio of positive mentions to those who are generally negative”. We
can also see how the brand Accor is associated with positive keywords
such as “award” and “delicious”. This tool also helped us to assess the
psychographics of people talking about Accor; they come mainly from the
U.K, Germany, Spain and France and they either share news about the
multinational group or share pictures of the hotels where they stayed.
However, the graph below shows a decline in British and French requests
for Accor on google over the past ten years with a slight increase in the
trends during this last month.
Figure 17- Number of Google searches of Accor in the UK and France (GoogleAdwords, 2015)
Figure 16- Accor's indictors
in social mention

42
5.2 Financial Analysis:
Growth Ratios:
Sales
Risma’s sales increased by an average of 12% between 2010 and 2014. In fact, in 2014 the
sales revenue reached MAD1 577 millions. However, the net income fluctuated throughout the
five years period registering the highest growth of 113% of the year 2014, and the highest
decrease in 2010 by 121%. This fluctuation can be explained by the high net working capital
that was needed for Risma to develop new hotels.
Figure 18-Finacial Key Performance Indicators for Risma
Revenues
Figure 19-Risma's revenue evolutions in MAD million from 2010 to 2014
The above figure shows the change in Risma’s sales from the year 2010 to 2014. In fact, using
the effective forecasting systems that secures in the increase of Sales, Risma succeeded in
keeping its sales growing for the period knowing that it coincided with the world economic
crisis.
0
200
400
600
800
1000
1200
1400
1600
1800
2010 2011 2012 2013 2014
Revenue Evolution 2010-2014 in Million MAD
Revenue Evolution 2010-2014

43
Net Income:
Figure 20- Risma's Net income evolution (2010-2014)
Risma’s net income recorded a deficit of MAD 199 million in 2012 and of MAD 46 million in
2013. This was due to the high investment that the company made to increase its hotel number
in Morocco. The investment required a huge capital expenditure that made the net income
display a red number. However, the net income reached MAD 6.04 million in 2014, as part of
the revenues generated from the previous investment that Risma headed for.
Profitability Ratios:
Regarding the profitability ratios, we decided to compare Risma with a French company
operating in the same industry. In fact, with the lack of information regarding the Moroccan
companies, we took this decision taking into consideration the financial characteristics of both
companies. The company name is Pierre&Vacances which is also operating in Morocco.
Figure 21- Risma's Profitability Ratios 2010-2014
The net profit margin recorded 0.39% for the year 2014, which is higher compared to the
negative performance for the previous year. The lowest performance came up in 2012 with -
15.37%, the year where the company recorded a high deficit regarding its net income.
Concerning the Return on Assets, there is a negative performance starting from the year 2012
to 2014, this can be explained by the grain capital required for building hotels and the high
-300
-200
-100
0
100
2010 2011 2012 2013 2014
Net income Evolution 2010-2014
Net incomeEvolution 2010-2014

44
period of payback. This is due to the investments Risma is making to increase the number of
hotels in Morocco to conserve its market share in the tourism industry. Regarding the Return
on Equity, the year 2014 recorded a 1% return, a positive performance, compared to the
previous year where it recorded -4%.
Competitive Analysis: Accor vs Pierre&Vacances
Return on Asset:
Concerning the ROA, Risma is recording lower percentages compared to Pierre&Vacances,
with -1.72% in 2014, compared to the French competitor that recorded -1.36%. The year 2012
recorded a huge difference between Risma and Pierre&Vacances, where the Moroccan
company recorded -4.47% compared to the French one that registered -1.74% in its ROA.
Figure 22-ROA - Risma's competitive Analyis
Figure 23- Risma's competitive analysis: ROA Evolution (2010-2014)
Return on Equity:
Concerning the Return on Equity, there is a fluctuation of returns during the period. Risma
recording a huge loss regarding the ROE in the year 2012 with -18% compared to
Pierre&Vacances with -6.09%. However, for the year 2013, Risma registered a lower loss
-5,00%
-4,00%
-3,00%
-2,00%
-1,00%
0,00%
1,00%
2,00%
2010 2011 2012 2013 2014Risma
Pierre&Vacances

45
compared to the competitor with -4% only. In addition, in 2014, Risma recorded a positive ROE
with 1%, whereas Pierre&Vacances recorded a loss of 6.26%. Overall, Risma is doing well
compared to the French competitor regarding the Return on Equity, which is an important
indicator concerning shareholders’ value maximization.
Figure 24- Risma's competitive Analysis: ROE
Figure 25- Risma's Competitive Analysis: ROE evolution (2010-2014)
Leverage Ratios:
Regarding the degree of financial leverage which is one of the leverage measures computed by
dividing the change in earning per share by the change in EBIT margin, the financing measure
recorded 209% in 2014, increasing from 202% in 2013. This proves that Risma is focusing on
debts in order to finance its investments. Also, this measure proves that the interest payment
has a high impact on the decrease of the net income available for shareholders.
Financial Leverage
Figure 26- Degree of Financial Leverage
-20,00%
-15,00%
-10,00%
-5,00%
0,00%
5,00%
2010 2011 2012 2013 2014
Risma
Pierre&Vacances

46
Figure 27- Degree of Financial Leverage Evolution (2010-2014)
Debt to Equity Ratio:
This second leverage ratio shows a value of.232.2% for Pierre&Vacances and 305% for Risma
in 2014. This proves the extent to which Risma is not able to meet its current liabilities using
its current assets. Relative to the industry, the payback period is high after building hotels which
are the source of revenues. These investments require a high capital that is leveraged in a long
period of time. Also, this proves that the debts are three times the shareholders equity value for
the case of Risma.
Figure 28- Debt to Equity Ratio
Figure 29- Debt to Asset Ratio Evolution
0,00
5,00
10,00
15,00
20,00
25,00
2010 2011 2012 2013 2014
Degree of Financial Leverage
Degree ofFinancial Leverage
0,00%
50,00%
100,00%
150,00%
200,00%
250,00%
300,00%
350,00%
2010 2011 2012 2013 2014
Risma
Pierre&Vacances

47
Debt to Total Asset Ratio:
Regarding the third leverage ratio, which mainly calculating by dividing the market value of
debt by the total assets’ market value, we can notice that the debt represent 64% of Risma’s
assets concerning the year 2014, compared to 50% regarding Pierre&Vacances. The value of
this ratio did not record a high change for the period 2010 to 2014. However, this proves the
extent to which Risma’s debts are high.
Figure 30-Debt to Total Assets
Figure 31- Debt to total Asset Evolution
Liquidity Ratios:
Concerning the liquidity ratios, we notice that Risma is not able to meet its current debts using
its current assets. Indeed, the current ratio recorded 0.6 in 2014 and 0.61 for the previous year.
Concerning Pierre&Vacances, there is a higher quick ratio which proves that the company is
able to meet 98% of its current debts using its current assets. Also, this proves that Risma is in
high debt bracket.
0%
10%
20%
30%
40%
50%
60%
70%
2010 2011 2012 2013 2014
Risma
Pierre&Vacances

48
Current Ratio:
Figure 32- Competitive Analysis: Risma's current Ratio
Figure 33- Competitive Analysis Risma's quick Ratio evolution
Quick ratio:
Concerning the quick ratio, which is another liquidity ratio, we can confirm that the Risma is
not able to meet its current liabilities using its current assets. The quick ratio deducts the amount
of inventory in order to assess the liquidity of a company using the most liquid assets. In fact,
in 2014 Risma’s quick ratio was 0.54 compared to Pierre&Vacances with 0.66. We can also
notice that the amount of Risma’s inventory did not evaluate. This is mainly due to the sales
forecasting strategy that the company adopts.
Figure 34- Risma's competitive analysis quick ratio
0
0,2
0,4
0,6
0,8
1
1,2
1,4
2010 2011 2012 2013 2014
Risma
Pierre&Vacances
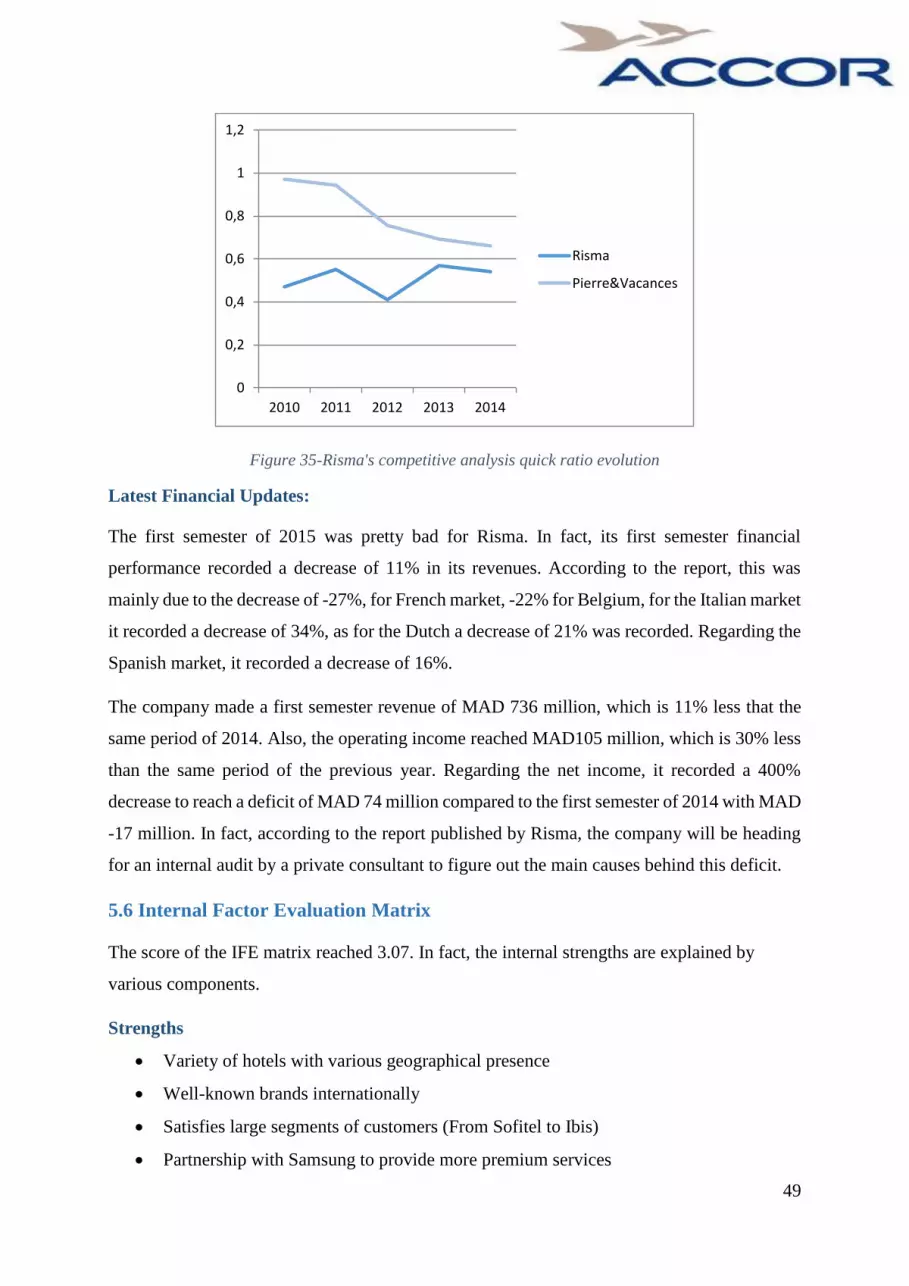
49
Figure 35-Risma's competitive analysis quick ratio evolution
Latest Financial Updates:
The first semester of 2015 was pretty bad for Risma. In fact, its first semester financial
performance recorded a decrease of 11% in its revenues. According to the report, this was
mainly due to the decrease of -27%, for French market, -22% for Belgium, for the Italian market
it recorded a decrease of 34%, as for the Dutch a decrease of 21% was recorded. Regarding the
Spanish market, it recorded a decrease of 16%.
The company made a first semester revenue of MAD 736 million, which is 11% less that the
same period of 2014. Also, the operating income reached MAD105 million, which is 30% less
than the same period of the previous year. Regarding the net income, it recorded a 400%
decrease to reach a deficit of MAD 74 million compared to the first semester of 2014 with MAD
-17 million. In fact, according to the report published by Risma, the company will be heading
for an internal audit by a private consultant to figure out the main causes behind this deficit.
5.6 Internal Factor Evaluation Matrix
The score of the IFE matrix reached 3.07. In fact, the internal strengths are explained by
various components.
Strengths
Variety of hotels with various geographical presence
Well-known brands internationally
Satisfies large segments of customers (From Sofitel to Ibis)
Partnership with Samsung to provide more premium services
0
0,2
0,4
0,6
0,8
1
1,2
2010 2011 2012 2013 2014
Risma
Pierre&Vacances
50
Effective booking system to optimize sales (Travel Accor Reservation System TARS)
Targeting sensitive high growth locations (Casa nearshore, Tangier free zone)
High quality of service
The company is geographically present, and is taking advantage from this strength. This is
why it is given a weight of 3.Regarding the brand, the company has various products that are
well known, such as Sofitel and Pullman. The company is taking advantage of these brand
names, and therefore a weight of 4 was assigned. Using its wide range of services provided,
the company satisfies a large number of customers, therefore a weight of 4 was assigned to
this component. The premium services offered by the company using a partnership with
Samsung are giving a high customer experience, and Accor is taking advantage of this
component. Accor is targeting more and more sensitive places of growth in Morocco and are
taking advantage from this economic growth, therefore the weight of 4 was given to this
component. In addition, Accor is known by its high quality services, and therefore a weight of
3 was given to this component as the company is taking advantage of it.
Weaknesses
Depends on the European tourists market in Morocco
High volatility of net income
High employee turnover
Low marketing investment in Morocco
Low liquidity
Low maximization of shareholders value
Regarding the weaknesses, the company still depends on the European market, and therefore a
weight of 2 was assigned to this component. In addition, the dependence in these markets
results in a high volatility of income, therefore a weight of 2 was given to this component.
Further, the company incurs a high employee turnover, and is not taking advantage of this;
therefore this component was assigned a weight of 1. Furthermore, the low marketing in
Morocco results in low brand recognition within the Moroccan perspective, and the company
is not taking advantage of this. Consequently, a weight of 2 was assigned to this component.
The high investment requirement results in a low liquidity of the company and a low
maximization of shareholders value. Therefore, these components were assigned a weight of 1

51
and 2 respectively.
Figure 36- Risma's IFE

52
VI. Main Issue
After the internal and external assessment of Accor-Risma, we narrowed down the current
issues the company is facing to the most critical one. According to our analyses, the issue that
needed to be addressed first by Accor-Risma is the financial irregularities that can partially be
explained by the lack of marketing investment in Morocco.
VII. Objectives of this report
7.1 Short term objectives
The strategies that we are going to elaborate in the following sections will tackle the main
problem that needs to be addressed by Accor-Risma. The means through which we intend to
improve Accor-Risma’s overall situation, will aim to:
Increase Accor-Risma’s market shares.
Be the TOM choice of hotel for Moroccan citizens as well as tourists.
Offer the appropriate service to the current demand.
Start to follow the path of AccorHotels group in the high-tech field.
7.2 Long term objectives
By achieving the cited short-term objectives, Accor-Risma will aim to start distributing
dividends to its shareholders, sustain its leadership position, shifting to exclusive e-marketing
campaigns and online reservations in the Moroccan territory progressively as the local
customers’ trust in e-commerce and online payment grows by the next decade. In the
framework of the “Maroc 2030” vision, it will also play a major role in the promotion of
Morocco as one of the top destinations in the world dissociating it from other North-African
and Middle-Eastern countries. Moreover, it will also aim to “go green” by putting more
efforts into using renewable energies, producing less waste (CO2) and using recyclable and
eco-friendly materials, since it is a matter that is of the outmost importance to most of the
European citizen nowadays. Developing its own talent pool, by training and developing its
teams, will reduce the employee turnover in the long run which will be cost efficient and
exceptionally socially responsible for a hotel franchise in Morocco. The ultimate goal to
achieve through our strategies would be to utilize AccorHotels group know how to the benefit
of purely Moroccan divisions taking care of the management and not only the acquisition of
hotels.

53
VIII. Strategy Analysis & Choice
8.1 The Matching stage
We first started by assessing the strengths, weaknesses, opportunities and threats of Accor-
Risma as follow:
Strengths
Variety of hotels with various
geographical presence
Well-known brands internationally
Satisfies large segments of customers
(From Sofitel to Ibis)
Partnership with Samsung to provide
more premium services
Effective booking system to optimize
sales (Travel Accor Reservation System
TARS)
Targeting sensitive high growth
locations (Casa nearshore, Tangier free
zone)
High quality of service
Weaknesses
Depends on the European tourists
market in Morocco
High volatility of net income
High employee turnover
Low marketing investment in Morocco
Low liquidity
Low maximization of shareholders value
Opportunities
Demand for more lodging supply of
200000 beds to meet the objectives of
Morocco 2030
Strategic geographic location of
Morocco
Growing urbanization by 4% compared
to 2010.
Increase of tourist arrival by 7%
compared to 2014
Decrease of illiteracy rate in Morocco by
25% compared to 2004
Threats
Foreign currency exchange rate
formulation
Rise of Airbnb
Political instability in the southern
region of Morocco
Rough competition due to new market
entrant luxury group 4 Season)
Figure 37- SWOT Matrix
54
Matching SWOT
For the SWOT Matrix, we are matching internal and external critical success factors in order
to generate feasible alternative strategies. We aim to select best strategies based on multiple
alignments. Yet not all of these strategies are going to be implemented.
This matrix is composed of four quadrants:
1. SO Strategies: These strategies are considered as the most appropriate one to exploit for
our strategy implementation.
Investing in artificial Intelligence Domotiqua. (Fibaro System) which is the leading
home intelligence Automation. This product is using the Z-wave Technology that
mainly allows you to connect and control all the domicile electric devices through a
smart interface without any interference. The tools used aren’t cumbersome and can
be monitored externally with extreme ease to emphasis the safety of customers and
enhance customer experience
Product development through the opening of an Adagio Access in “Plage des
Nations”. This little city is located in the center of Morocco, half an hour from
Rabat, it is known for its incredible Surf Spot. All over the year, surfers and tourists
come to this Eldorado looking for thrills. At the beginning of 2016, ESSEC Business
School is going to open a new Business College in the area which can be seen as a
niche target market.
Market penetration through opening an IBIS Budget next to the International
Airport of Rabat/Salé. This new airport has been inaugurated after a renewal in
2011. In 2014, the ONDA registered over 650000 passengers passing which can be
considered as a potential target market. ( ONDA,2014)
2. WO Strategies: In order to implement these strategies, the group must search for more
information in a way to take advantage of opportunities and overcome the weaknesses.
Market development: Opening Novotel in seaside resorts in Tanzania.
Enhancing the service and product provided through sustainability program. These
programs will be held to emphasis the sustainability of the brand and social
responsibilities engagement. In order to achieve this strategy, Accor Hotels will

55
increase the percentage of Eco labeled products used in the hotels, use more recycle
products, decrease the energy consumption and use renewable ones.
Product Development: travel Agencies and Booking sites. In order to increase the
number of sales, Accor might need to develop possible packages for the customers.
Concerning Morocco, Honeymoon packs couples, clubbing packages for young
adults. Yet, in order to do so, Accor must allocate more money to the advertising
media part to emphasis their online presence. This deals and packages will help
increase the occupancy rate of Moroccan Ibis Hotels. The infrastructures are there
but the envy must come with.
3. ST Strategies: (confront): a suggestion of potential strategies taking advantage of
strengths and avoiding any threats. For the strategy implementation, there are considered
as strategies to confront before considering any outcome.
Partnership with RAM through promoting in Social Media to target potential
customers in Morocco and Elsewhere. This strategy will aim to increase brand
awareness and customer engagement through heavy marketing campaign.
Innovation: changing the food suppliers of food for IBIS division. The restaurant ‘
La Table’ offers International and varied menu to the clients but the quality is meet
the standards. Food is an important factor for the hotel industry.
Real time Marketing Strategy (RTM): emphasis the user engagement through e-
marketing campaign.
4. WT Strategies (avoid): this last quadrant is mainly composed of strategies to avoid. The
return is not worth the risk.
Vertical Integration: Emphasis the ‘ Projet Femmes du Rif’

56
1. Product development: introducing the
artificial intelligence Domotiqua in the
Sofitel luxurious resorts
( S3, S7,O4,O5)
2. Market development: Opening Adagio
Access hotel in “Plage des Nations”.
( S1, S3, S7, O1,O2,O3, 04)
3. Market penetration through opening an
IBIS near the international airport or
Rabat (S01, S02, S07, O1, O2, O4)
1. Promoting in social media to target
potential customers in Morocco and
elsewhere (W1, W2, W5, O1, O5).
2. Product development: changing the food
supplier of IBIS
(W2, W5, O4).
3. Real Time Marketing RTM
(W4, O1, O3, O4)
1. Opening Novotel in seaside resorts
in Tanzania
(S1, S2, S5, T2).
2. Enhancing the service and product
provided through sustainability
program
(S1, S2, S5, T2, T3).
3. Product Development through the opening of an Adagio Access in
“Plage des Nations”. (S1, S2, S5,
T2, T4)
1. Vertical Integration: Emphasis the
“Projet Femmes du Rif”’
(W1, W4, T4)
Figure 38- Matching Swot matrix
SPACE Matrix
The action evaluation “Space Matrix” is a valuable assessment tool that enables you to
have a thought on the kind and the type of the procedure that will be the best accurate and
suitable for a fixed enterprise. Moreover, on the interpretation of the strategic position “space”
it indicates whether the organization ought to implement a conventional, forceful, protective
or focused methodology.
Furthermore, this action evaluation depends on four variables; the first two internal factors that
are: “the financial position” and “the competitive position”, in addition to the two external
factors that are: “the stability position” and “the industry position”. Please refer to Appendix B
to assess in detail these factors.As it is seen on the chart below, the evaluation of this matrix on
the organization in four variables: two internal measurements: money related quality “being
powerful financially” and the “competitive advantage”, plus two external measurements: “the
stability of the environment” and “the strength of the business”. At the point when processing
the scores in view of the standards credited to every hatchet, we acquired a result of “0.4” on
the inner strategic situation and a result of “0.2” on the outside strategic evaluation. Besides,
our main strategy has resulted in the “1” quadrant that is related to the aggressive key position.
This additionally resembles to techniques, for instance; the product improvement, the market
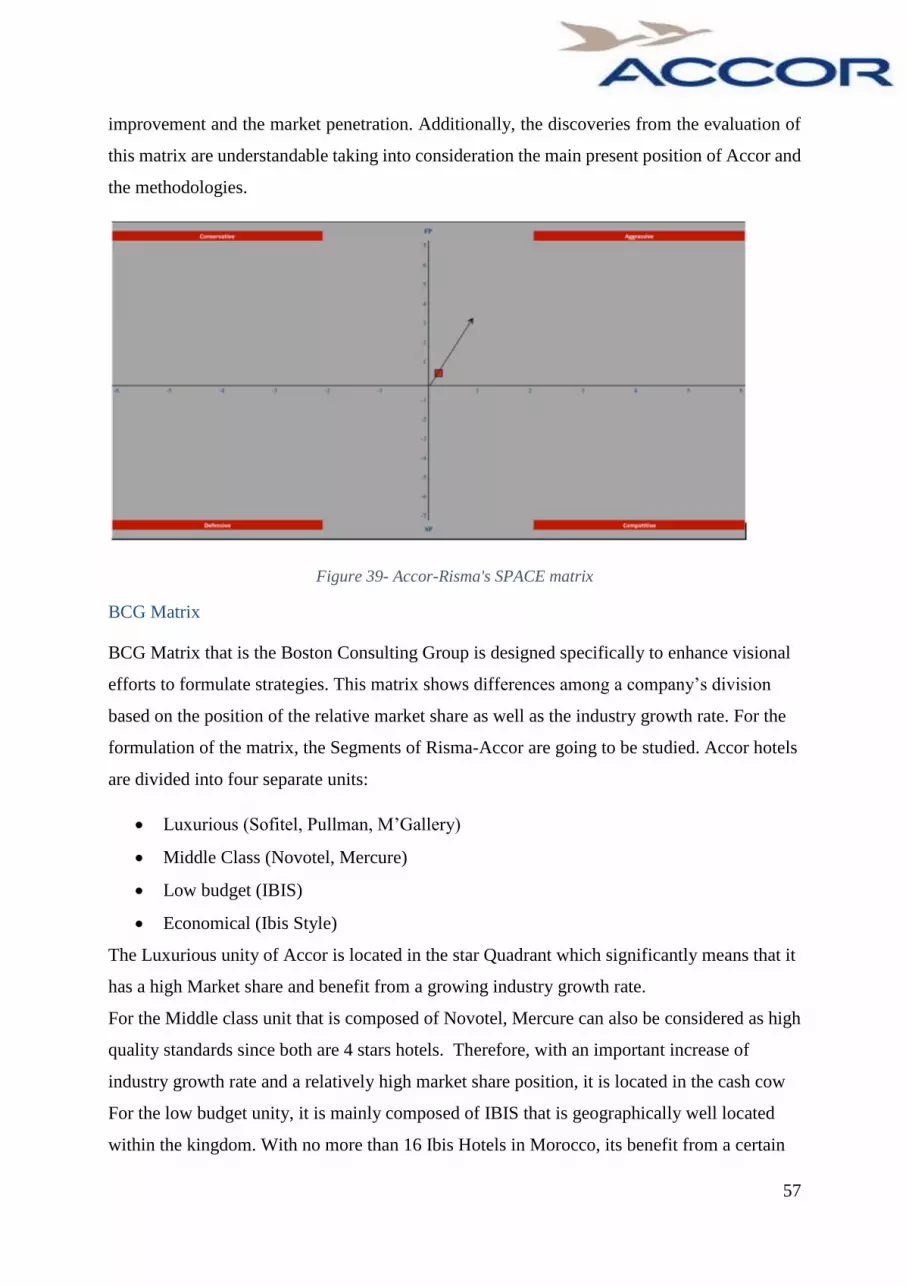
57
improvement and the market penetration. Additionally, the discoveries from the evaluation of
this matrix are understandable taking into consideration the main present position of Accor and
the methodologies.
Figure 39- Accor-Risma's SPACE matrix
BCG Matrix
BCG Matrix that is the Boston Consulting Group is designed specifically to enhance visional
efforts to formulate strategies. This matrix shows differences among a company’s division
based on the position of the relative market share as well as the industry growth rate. For the
formulation of the matrix, the Segments of Risma-Accor are going to be studied. Accor hotels
are divided into four separate units:
Luxurious (Sofitel, Pullman, M’Gallery)
Middle Class (Novotel, Mercure)
Low budget (IBIS)
Economical (Ibis Style)
The Luxurious unity of Accor is located in the star Quadrant which significantly means that it
has a high Market share and benefit from a growing industry growth rate.
For the Middle class unit that is composed of Novotel, Mercure can also be considered as high
quality standards since both are 4 stars hotels. Therefore, with an important increase of
industry growth rate and a relatively high market share position, it is located in the cash cow
For the low budget unity, it is mainly composed of IBIS that is geographically well located
within the kingdom. With no more than 16 Ibis Hotels in Morocco, its benefit from a certain
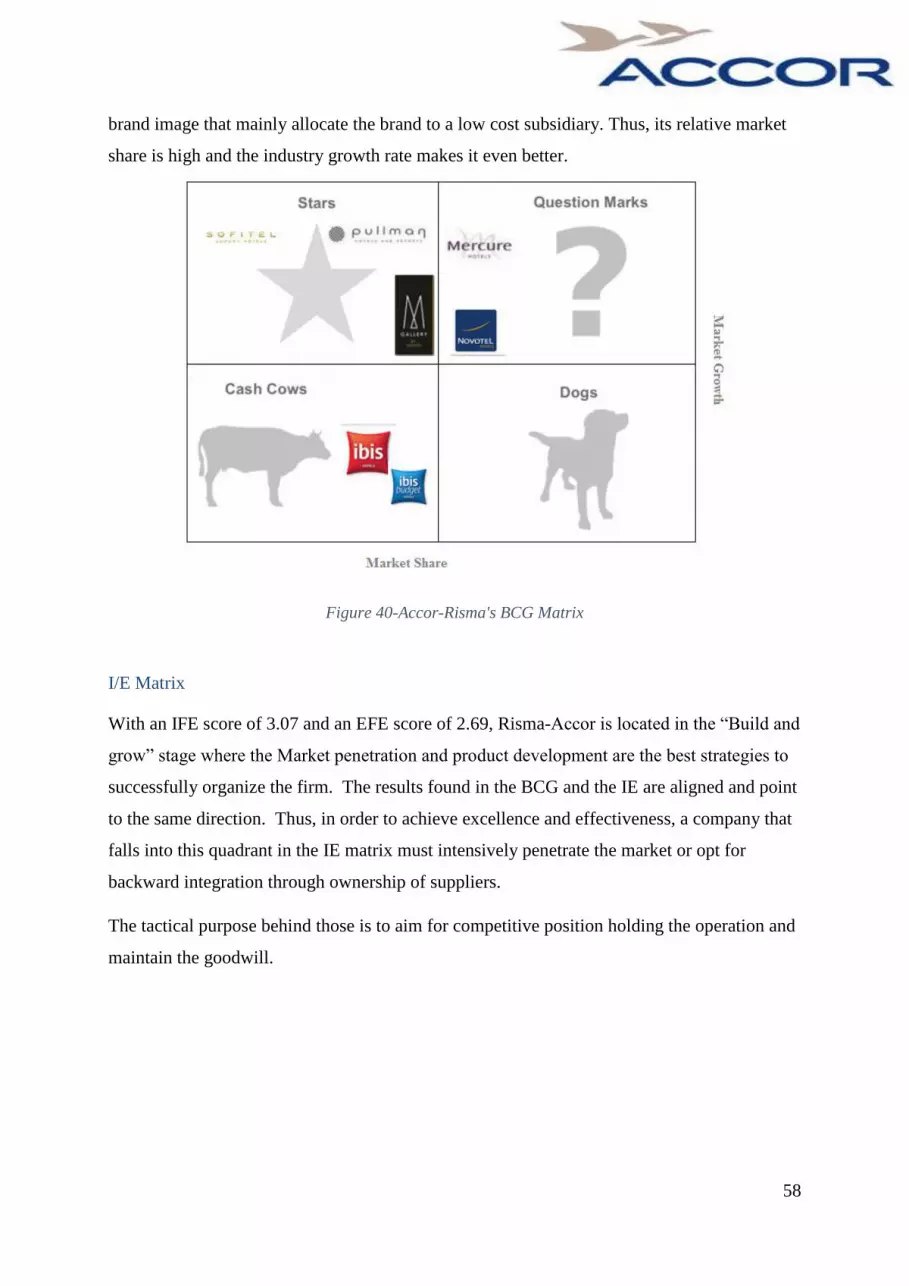
58
brand image that mainly allocate the brand to a low cost subsidiary. Thus, its relative market
share is high and the industry growth rate makes it even better.
Figure 40-Accor-Risma's BCG Matrix
I/E Matrix
With an IFE score of 3.07 and an EFE score of 2.69, Risma-Accor is located in the “Build and
grow” stage where the Market penetration and product development are the best strategies to
successfully organize the firm. The results found in the BCG and the IE are aligned and point
to the same direction. Thus, in order to achieve excellence and effectiveness, a company that
falls into this quadrant in the IE matrix must intensively penetrate the market or opt for
backward integration through ownership of suppliers.
The tactical purpose behind those is to aim for competitive position holding the operation and
maintain the goodwill.

59
Figure 41-Accor-Risma's I/E Matrix
Grand Strategy Matrix
Figure 42- Accor-Risma's Grand Strategy Matrix
According to the Grand Strategy Matrix and to the description of RISMA-Maroc, Accor is
enjoying the rapid Market Growth in the tourism industry with an annual growth rate in the
room occupancy of 8.3% and strong competitive position with its position as a leader in terms
of rooms, hotels, geographic location. Therefore, it is located in the First Quadrant. Which
means that the strategies that must be implemented must use their excessive resources then
choose from backward, forward integration or Market development as effective strategies. It
is the leader in the hotel industry. With over 8 different products, Suite Novotel, Ibis,
Mercure, Novotel, Pullman, Sofitel, M’Gallery and Ibis Budget, Risma-Maroc can afford to
take advantage of external Opportunities and thus take aggressive and intensive risks when
necessary.

60
8.2 Decision Stage
QSPM
Concerning the QSPM, it stands for Quantitative Strategic Planning Matrix and takes into
consideration the scores of other matrices as well as the formulation of the SWOT Matrix. In
our case, six strategies are going to be compared based on Strengths, Weaknesses,
Opportunities and Threats. The purpose of this matrix is to rate each strategy to finally choose
which one to implement and which one to avoid. The strategy that came up with the highest
Total Average Score of 3.07 is the Market Penetration through the introduction of an Adagio
in “ Plage des Nations” The second strategy that came up with the best score of 2.91 is the
Product Development through the installation of an Artificial Intelligence Fibaro Domotiqua.
The third most rated strategy with a score of 2.73 is the Market Development with the
expansion of Ibis in one of the major Moroccan metropolitan cities, more precisely near the
Rabat-Salé Airport.

61
Figure 43-Accor-Risma's QSPM Matrix

62
IX. Strategy Implementation
9.1 Strategy I: Product Development – Fibaro Domotiqua
Fibaro System (Domotiqua) is a set of artificial intelligence devices that will make possible
the automation of all the domicile devises. Thanks to the Z-wave technology used by the
products, it allows you to connect and control all the domicile electric devices through a smart
interface without any interference. The tools used aren’t cumbersome and can be monitored
externally with extreme ease to emphasis the safety of customers and enhance customer
experience.
According to the owner of the franchise in Morocco Ahmed Debbagh, this elaborated System
is distinguished by its non-invasive installation compared to competitors. Micro Modules can
be mounted sockets and switches wall, and are compatible with all electrical installation.
This system has been created with style and elegance to be as homogenous as possible. The
modules can be set and managed through an app that can be used with IOS or Android. This
application is user friendly and permit to secure and control a room or an office via a
Smartphone, Tablet or a computer anywhere in the world.

63
Product Description:
Home Center lite
Our product is composed mainly of a mainframe, which is the Home
Center Lite that can command over 200 modules; actuators and
detectors.
The Home center Lite is a small mainframe that is directly connected to router via cable link. It
is very efficient and will definitely enhance the living of the user. Affordable and useful, this
little tool will make it possible to control a place from anywhere in the world. Starting by an
innovation range of products that will enable the creation of an own world of convenience. By
itself, it is a compact little brain capable of restoring and storing all the data entered in the cloud
and thus work as a hub or engager for the modules registered in it.
Think if the domicile security wasn’t an issue anymore, life would be so much easier. This little
tool will notify the user for the discovery of a specific threat such as fire, flooding or gas leak.
Actuators:
Wall Plug
It is a Socket connected to the Electrical system. It
allows the devices connected to it to be controllable
via the Application Fibaro. It works as an adaptor
connected to a power outlet to command ideally
anything plugged to it. No need to any installation, a simple power outlet is all what is needed
no installation beforehand. It is considered as the most sophisticated electric socket in the
world. Through an innovative and smart design, it is directly related to the Home Center Lite
with no interference. The Z-wave technology detects the device and intuitively adds any
module.

64
Dimmer
It is a module that allows the variation of
light. It has been created to be compatible
with all the light installations and sources.
The Dimmer is fortified with an algorithm
that allows the variation of sources and
makes the configuration more proper.
A small installation with the wall plug is necessary to activate it.
RGBW Controller:
RGBW stands for Red, Green, Blue, and
White which are the primary colors. It is a
device that allows controlling special
Multicolor LED bulbs.
It is installed inside the electrical switch of
the plugs.
Roller Shutter
This module is a radio commanded tool that
function with blinds or other rolling devices.
It is installed inside the wall switch system or
via radio waves.

65
Universal Sensor
This is a wireless module that is directly
implemented in the AC or heaters. It is
composed of two binary sensors that permit
the wireless functioning and improve the
functionality of the device.
Detectors
Intrusion Detector
It is two magnetic sensors that allow a full
domicile security. If door closed the sensors
are touching one another. Once the door open
while sensors activated, a signal is sent to the
home center lite that sends a message to the
user notifying an intrusion.
Motion Detector
This module is a multi-motion sensor. It is
composed of light and temperature sensors. It
is also a wireless device that is directly
connected through Z-wave technology to the
Home Center Lite.
Where to implement?
For Risma-Accor, the implementation and installation of this artificial intelligence that will
take place in the luxurious division of Accor Sofitel. There are 6 Sofitel’s all across Morocco:

66
Rabat: Sofitel Jardin des Roses
Essaouira: Sofitel Mogador Golf and Spa
Casablanca: Sofitel Tour Blanche
Marrakech: Sofitel Palais Imperial
Fes: Sofitel Palais Jamai
Agadir: Sofitel Royal Bay Resort
These six hotels have a total number of rooms of 1135. The benefit behind this strategy is to
enhance customer experience through a secure and relaxing stay in the Sofitel. The upscale
clientele is looking for a comfortable and outstanding service. We aim to provide an
impeccable room fully furnished.
For a competitive perspective, this set of tools represents an added value to the entity. The
home center will be able generates infinite codes for each user. In addition to the installation,
an Android tablet is going to be available to the customer.
Concerning the Kits available, there are two: A starter kit and a Full Pack. We will implement
the full pack kit:
Financial Evaluation
WACC Calculation
The weighted average cost of capital was calculating via the following process:
Assumptions
Cost of Equity (Ke) 6.92%
Risk Free rate 2.60%
Market Return 7.40%
Beta 0.9
Cost of Debt (Kd) 7.38%
Corporate Bond Premium 3.27%
Marginal Cost of Debt 5.87%
Nominal Tax Rate 30%
WACC 5.69%
Weights

67
Total Debt (Current & Long Term) 2,847,000,000
Total Shareholder's Equity 1,225,749,910
We 0.30
Wd 0.70
Figure 44- Risma's WACC for Strategy I
Cost of Equity
The risk free rate was taken from a three years bond from Bank Al Maghrib that pays 2.6%
interest rate. The market return was mainly the highest return of the MADEX index. In fact,
using the three years revenues of this index would give a -0.52% revenue. Therefore, our
calculations will be meaningless. Consequently, we decided to take the highest return of this
liquid index. The beta of the company was calculated via the regression of the MADEX index
revenues with Risma’s revenues for the past five years. This gave us a beta of 0.9. This gave
us a total Cost of Equity of 6.92%.
Cost of Debt
The cost of debt was calculated via the corporate bond premium offered by Risma which pays
a premium of 3.27%. The marginal cost of debt is mainly the interest rate paid by Risma’s
bonds, which is 5.87%. The nominal tax rate was assumed 30% for high enterprises in
Morocco. This gave us a total after tax cost of debt of 7.38%
Ke and Kd Weights
The market value of Risma’s total debt reached MAD 2.847 billion. In addition, the market
value of Risma’s equity reached MAD 1.225 billion. Consequently, the weight of the cost of
equity is 30%, and the weight of the cost of debt is 70%.
WACC Value Using the WACC formula we came up with a value of 5.69%
Cost/Unit Price in MAD Home center lite 4,355 4x Wall plug 4,253 Motion Detector 923 Intrusion detector 804
Universal Sensor 708 Dimmer 974 RGWB Kit 974 Roller Shutter 974 Android Remote Tablet 1,000
Total Cost/Unit 14,966
Figure 45-Full Pack Cost per Unit
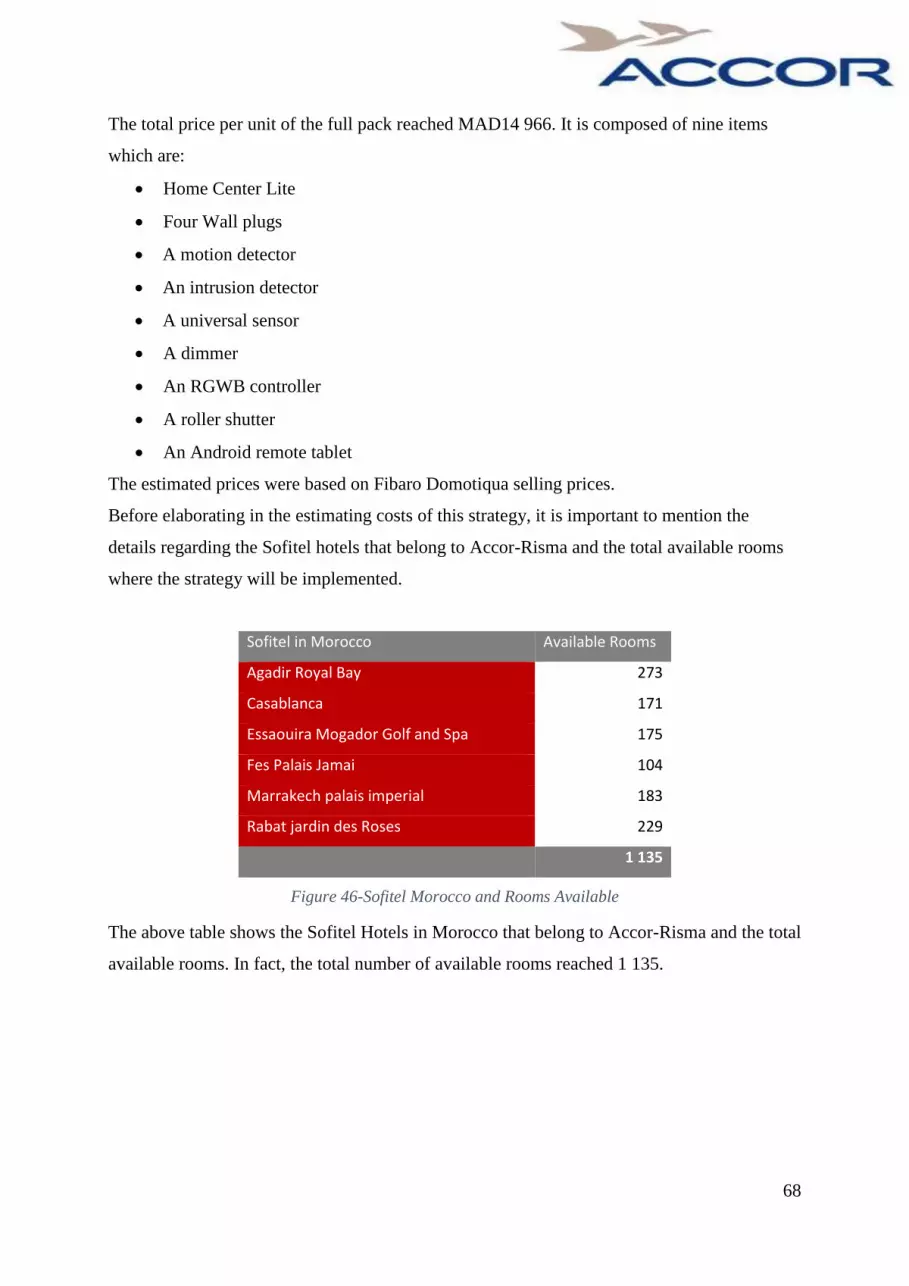
68
The total price per unit of the full pack reached MAD14 966. It is composed of nine items
which are:
Home Center Lite
Four Wall plugs
A motion detector
An intrusion detector
A universal sensor
A dimmer
An RGWB controller
A roller shutter
An Android remote tablet
The estimated prices were based on Fibaro Domotiqua selling prices.
Before elaborating in the estimating costs of this strategy, it is important to mention the
details regarding the Sofitel hotels that belong to Accor-Risma and the total available rooms
where the strategy will be implemented.
Sofitel in Morocco Available Rooms
Agadir Royal Bay 273
Casablanca 171
Essaouira Mogador Golf and Spa 175
Fes Palais Jamai 104
Marrakech palais imperial 183
Rabat jardin des Roses 229
1 135
Figure 46-Sofitel Morocco and Rooms Available
The above table shows the Sofitel Hotels in Morocco that belong to Accor-Risma and the total
available rooms. In fact, the total number of available rooms reached 1 135.

69
Initial Investment
Investment Price MAD
Total Units 1,135
Total Units Cost 16,985,956
Maintenance Costs 2,547,893
Application Costs 1,000,000
Implementation Costs 1,698,596
Total Initial Investment 22,232,445
Figure 47-Fibaro Domotiqua Initial Investment
The total cost of units is estimated to be MAD16 985 956. It is simply the cost per unit
multiplied by the number of available rooms where our strategy will be implemented.
The maintenance costs are calculated via the cost of defective units provided by the founder
of Fibaro Domotiqua which is 15% costs yearly. In addition, the application that will be
provided to each hotel with a Guest ID and password is estimated to cost MAD1 000 000. The
implementation of this full pack is estimated to be MAD1 698 596, which is MAD113.5 per
unit. This give a total initial investment of MAD22 232 445.
In addition, it is important to mention the depreciation costs and the useful life of this full
pack.
Cost/Unit Price Useful Life
Home center lite 4,355 3 1,452
4x Wall plug 4,253 3 1,418
Motion Detector 923 3 308
Intrusion detector 804 3 268
Universal Sensor 708 3 236
Dimmer 974 3 325
RGWB Kit 974 3 325
Roller Shutter 974 3 325
Android Remote Tablet 1,000 3 333
Depreciation Expense/Unit 4,989
Figure 48-Full Pack Depreciation Expense Fibaro Domotiqua
The estimated useful life of the full pack components is three years. Assuming that the ending
value will be MAD 0, as the parts will not be further sold and will be defective, the total
depreciation expense reached MAD4 989 per unit. This gives a total depreciation expense of
MAD5 661 986 yearly.

70
Forecasted Revenues
It is important to mention that the revenues calculation of hotels performance is performed
using the Revenue from Available Rooms (RevAR)
The following is the RevAR formula:
RevAR= Number of available rooms x Occupancy rate x Yearly nights x Average Room
Rate.
The Average Room Rate is calculated by dividing the revenue over the total room sold
Our strategy will be based on increasing the Average Room Rate, as the revenues will
increase due to an increase in the price of a night in Sofitel Hotels.
The following table shows the initial ARR with the initial RevAR provided by Risma:
Sofitel in Morocco Number of rooms ARR
Occupancy Rate RevAR
Agadir Royal Bay 273 1,108,968 68% 205,868,852
Casablanca 171 1,160,151 65% 128,950,820
Essaouira Mogador Golf and Spa 175 1,371,088 55% 131,967,213
Fes Palais Jamai 104 1,216,288 62% 78,426,230
Marrakech palais imperial 183 992,235 76% 138,000,000
Rabat jardin des Roses 229 1,346,604 56% 172,688,525
855,901,639
Figure 49-Sofitel RevAr 2014
The above table shows a total of MAD 855 901 639 from the operations of Sofitel in Morocco
for the year 2014. The occupancy rate varies from a hotel to another, giving an average
occupancy rate of 64%. In addition the room availability differs from a hotel to another.
The forecasted revenues of our strategy will be based on increasing the Average Room Rate
of each hotel using three different scenarios in order to generate revenues. We will not include
the revenues from total operations as this will not have a direct relation with our strategy. In
addition, our forecasts will be based on the actual occupancy rate provided by Accor-Risma,

71
with a 4% increase between the years 2016, 2017 and 2018 due to the industry forecasted
increase.
First Scenario:
The first scenario will be focusing on increasing 5% in the Average Room Rate to generate
revenues.
Sofitel in Morocco Number of rooms ARR Increase
Agadir Royal Bay 273 55448
Casablanca 171 58008
Essaouira Mogador Golf and Spa 175 68554
Fes Palais Jamai 104 60814
Marrakech palais imperial 183 49612
Rabat jardin des Roses 229 67330
1135
Figure 50-ARR Increase Scenario Strategy I
Forecasted Revenues: First Scenario
2016 2017 2018
Sofitel in Morocco Occupancy
Rate RevAR Occupancy
Rate RevAR Occupancy
Rate RevAR
Agadir Royal Bay 68% 10,293,443 71% 10,705,180 74% 11,133,388
Casablanca 65% 6,447,541 68% 6,705,443 70% 6,973,660
Essaouira Mogador Golf and Spa 55% 6,598,361 57% 6,862,295 59% 7,136,787
Fes Palais Jamai 62% 3,921,311 64% 4,078,164 67% 4,241,290
Marrakech palais imperial 76% 6,900,000 79% 7,176,000 82% 7,463,040
Rabat jardin des Roses 56% 8,634,426 58% 8,979,803 61% 9,338,995
42,795,082 44,506,885 46,287,161
Figure 51- Forecasted Revenue First Scenario
The total forecasted increase in revenue will reach MAD 42.8 million in 2016, and a MAD
44.5 million in 2017, with an increase to MAD46.3 million in 2018. The occupancy rate is
forecasted to increase by 4% in each hotel due to the expected industry growth.
The table below shows the revenues after expenses reduction:

72
2016 2017 2018
Increase in Revenue per Available Room 42,795,082 44,506,885 46,287,161
Increase in Cost of Revenue 15,577,410 16,200,506 16,848,526
Energy, Maintenance and Insurance 3,894,352 4,050,127 4,212,132
Depreciation 5,661,985 5,661,985 5,661,985
Before Tax Operating Revenue 17,661,334 18,594,267 19,564,517
Figure 52- Forecasted Operating Before Tax Revenue
The increase in cost of revenue is forecasted to be MAD 15.57 million in 2016, MAD16.2
million in 2017, and MAD16.84 million in 2018. The new full pack implemented will be
generating more customer experience. Yet, the costs of revenue are going to increase by an
estimated percentage of 36%. This increase is mainly due to the increase of corporate
overhead. We decided to include the cost of revenue as a percentage from the revenues to be
aligned with Risma’s cost of revenue which is 36% as well. This way, our forecasted revenues
will have a more realistic evaluation. The energy, maintenance and Insurance are also
expected to increase, as this pack will increase the energy consumption to provide more
customer satisfaction. We estimated the increase in this component to be 9%, according to
Fibaro Domotiqua founder research. In addition, the depreciation expense will remain the
same throughout the year, as we calculated the yearly estimated depreciation expense.
This will result in a before tax operating revenue of MAD 17.66 million in 2016, MAD 18.59
million and MAD 19.56 million for 2017 and 2018 respectively.
Second Scenario
The second scenario will be focusing on increasing 4% in the Average Room Rate to generate
revenues.
Sofitel in Morocco Number of rooms
ARR Increase
Agadir Royal Bay 273 44359
Casablanca 171 46406
Essaouira Mogador Golf and Spa 175 54844
Fes Palais Jamai 104 48652
Marrakech palais imperial 183 39689
Rabat jardin des Roses 229 53864
1135
Figure 53-: ARR Increase Second Scenario

73
Forecasted Revenues: Second Scenario
2016 2017 2018
Sofitel in Morocco Occupency Rate RevARR Occupency Rate RevARR
Occupency Rate RevARR
Agadir Royal Bay 68% 8,234,754 71% 8,564,144 74% 8,906,710
Casablanca 65% 5,158,033 68% 5,364,354 70% 5,578,928 Essaouira Mogador Golf and Spa 55% 5,278,689 57% 5,489,836 59% 5,709,430
Fes Palais Jamai 62% 3,137,049 64% 3,262,531 67% 3,393,032
Marrakech palais imperial 76% 5,520,000 79% 5,740,800 82% 5,970,432
Rabat jardin des Roses 56% 6,907,541 58% 7,183,843 61% 7,471,196
34,236,066 35,605,508 37,029,729
Figure 54- Forecasted Revenue Second Scenario Strategy I
The total forecasted increase in revenue will reach MAD 34.23 million in 2016, and a MAD
35.6 million in 2017, with an increase to MAD37.03 million in 2018. The occupancy rate is
forecasted to increase by 4% in each hotel due to the expected industry growth.
The table below shows the revenues after expenses reduction:
2016 2017 2018
Increase in Revenue per Available Room 34,236,066 35,605,508 37,029,729
Increase in Cost of Revenue 12,461,928 12,960,405 13,478,821
Energy, Maintenance and Insurance 3,115,482 3,240,101 3,369,705
Depreciation 5,661,985 5,661,985 5,661,985
Before Tax Operating Revenue 12,996,670 13,743,017 14,519,217
Figure 55- Forecasted Operating Before Tax Revenue
The increase in cost of revenue is forecasted to be MAD 12.46 million in 2016, MAD12.96
million in 2017, and MAD13.48 million in 2018. As for the previous scenario, the costs of
revenue are going to increase by an estimated percentage of 36%. The energy, maintenance
and Insurance are also expected to increase, as this pack will increase the energy consumption
to provide more customer satisfaction. We estimated the increase in this component to be 9%
for this scenario as well, according to Fibaro Domotiqua founder research. In addition, the
depreciation expense will remain the same throughout the year, as we calculated the yearly
estimated depreciation expense.
This will result in a before tax operating revenue of MAD 12.99 million in 2016, MAD 13.74
million and MAD 14.52 million for 2017 and 2018 respectively.
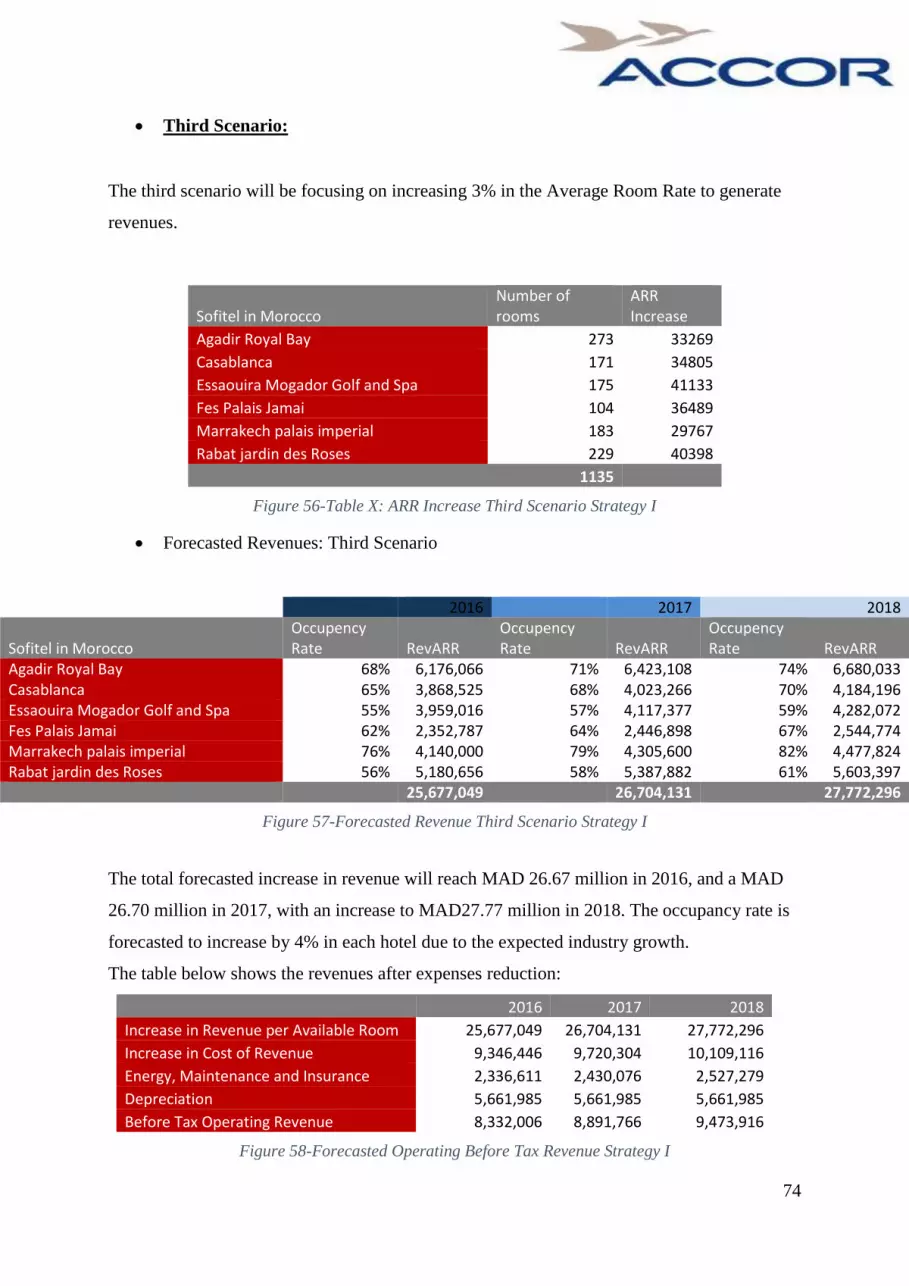
74
Third Scenario:
The third scenario will be focusing on increasing 3% in the Average Room Rate to generate
revenues.
Sofitel in Morocco Number of rooms
ARR Increase
Agadir Royal Bay 273 33269
Casablanca 171 34805
Essaouira Mogador Golf and Spa 175 41133
Fes Palais Jamai 104 36489
Marrakech palais imperial 183 29767
Rabat jardin des Roses 229 40398
1135
Figure 56-Table X: ARR Increase Third Scenario Strategy I
Forecasted Revenues: Third Scenario
2016 2017 2018
Sofitel in Morocco Occupency Rate RevARR
Occupency Rate RevARR
Occupency Rate RevARR
Agadir Royal Bay 68% 6,176,066 71% 6,423,108 74% 6,680,033 Casablanca 65% 3,868,525 68% 4,023,266 70% 4,184,196 Essaouira Mogador Golf and Spa 55% 3,959,016 57% 4,117,377 59% 4,282,072 Fes Palais Jamai 62% 2,352,787 64% 2,446,898 67% 2,544,774 Marrakech palais imperial 76% 4,140,000 79% 4,305,600 82% 4,477,824 Rabat jardin des Roses 56% 5,180,656 58% 5,387,882 61% 5,603,397 25,677,049 26,704,131 27,772,296
Figure 57-Forecasted Revenue Third Scenario Strategy I
The total forecasted increase in revenue will reach MAD 26.67 million in 2016, and a MAD
26.70 million in 2017, with an increase to MAD27.77 million in 2018. The occupancy rate is
forecasted to increase by 4% in each hotel due to the expected industry growth.
The table below shows the revenues after expenses reduction:
2016 2017 2018
Increase in Revenue per Available Room 25,677,049 26,704,131 27,772,296
Increase in Cost of Revenue 9,346,446 9,720,304 10,109,116
Energy, Maintenance and Insurance 2,336,611 2,430,076 2,527,279
Depreciation 5,661,985 5,661,985 5,661,985
Before Tax Operating Revenue 8,332,006 8,891,766 9,473,916
Figure 58-Forecasted Operating Before Tax Revenue Strategy I

75
The increase in cost of revenue is forecasted to be MAD 9.34 million in 2016, MAD9.72
million in 2017, and MAD10.20 million in 2018. As for the previous scenario, the costs of
revenue are going to increase by an estimated percentage of 36%. The energy, maintenance
and Insurance are also expected to increase, as this pack will increase the energy consumption
to provide more customer satisfaction. We estimated the increase in this component to be 9%
for this scenario as well, according to Fibaro Domotiqua founder research. In addition, the
depreciation expense will remain the same throughout the year, as we calculated the yearly
estimated depreciation expense.
This will result in a before tax operating revenue of MAD 8.33 million in 2016, MAD 8.89
million and MAD 9.47 million for 2017 and 2018 respectively.
Net Present Value with Scenario Analysis
The table below shows the NPV of the three scenarios with the four cash flows that include
the initial investment.
WACC 5.69%
Optimistic (5%) Realistic
(4%) Pessimistic
(3%)
NPV 26 204 777 13 876 259 1 547 741
IRR 64% 26% 10%
Figure 59-NPV and Scenario Analysis Strategy I
The net present value of the cash flows reached MAD 26.20 million on the optimistic scenario
with a 64% Internal Rate of Return. In addition the NPV reached MAD 13.87 million in the
realistic scenario with a 26% IRR. The last scenario which is the pessimistic one, registered a
MAD 1.55 million with a 10% IRR.
76
9.2 Strategy II: Market Penetration – Adagio Access
What is Adagio?
Our second strategy consists of opening a new Accor entity that is the Adagio Access.
It has been launched in October 2007 and represents tourist residences with different types of
rooms. This subsidiary of Accor is the leader of the urban tourism and provides over 11000
apparthotels in France and the European Union. It operates in 11 countries such as:
Adagio Brussel Centre Monnaie- Belgium
Adagio Basel City- Switzerland
Adagio Vienna City-Austria
Adagio Access Le havre Les Docks- France
Adagio Berlin- Germany
As stated, Adagio Access is considered the leader in the metropolitan accommodation market.
Very well located, it proposes contemporary designs for the rooms available, and can be
considered as the best quality to price ratio in the real estate. This strategy would emphasis
Accor’s strategic planning since thanks to it, the company would penetrate an existing market
with a new product/service. The implementation in the Moroccan market of this new product
aims to meet the increasing demand of domestic accommodation as well as international
clientele.
Concerning the AppartHotel, we will provide to different types of Apartments:
The first one being a studio with one room. It will differ from a 20 square meter up to
25 square meter. It has been built to support two people at an attractive price. These
apartments would be fully furnished; it will be composed of
o A fully equipped kitchen with a micro wave where families or couples can
enjoy a home-made meal and feel like at home
o A beautiful Bathroom
o Numerous Storage Places
o A desk with a LED TV screen
o A safe to store private and valuable items
o An Air conditioning
o Free WiFi

77
The second division would be apartments with two rooms that can support up to 4
people. The area would be from 30 to 35 square meter and it would mainly be
composed of the same furniture as the studios except for more distinguished furniture
that are:
o A Moroccan handmaid rug
o A Little Salon with a low table
o A dining room
The building would be a Ground+ Four floors and will be composed of 80 apartments; 60
studio with one Room and 20 Apartments with Two rooms. The aparthotel will provide a
specific care to disabled people and 4 apartments would be specially equipped for them.
Numerous services will be provided and available for renters such as a Buffet for the
breakfast and cleaning staff after 3 nights and a Laundromat.
Concerning the way of payment, the entity accepts all different kinds from the cash to the
coupons available and also from Club Accor Hotel. The price includes all the taxes (Water-
Electricity- Internet) and will differ based on the length of stay.
These entities are specially adapted for long term stays. In other words, the longer you stay
the less you pay. The discounts start from 15% to 45% depending on how many nights the
client stays. (AccorHotels-group, 2015)
From 1 to 3 nights, the price is fixed and will include all the taxes
From 4 to 9 nights, the discount can reach up to 15%
From 10 to 27 nights, the discount can reach 30%
From 28 to 90 nights, up to 40% discount

78
Finally, over 91 nights, the amount to pay will almost be divided by two with a
discount of 45%.
Moreover, Adagio reserves special offers for the stays that will exceed a month to welcome
the customers. The first Pack would be a Welcoming pack that will allow clients to prepare a
meal at any time with local and biological products (accorhotels-group, 2015). The second
pack is more elaborated and it is a serenity Kit. Through a partnership with local cosmetic and
accessory provider such as Yves Rocher, Les Domaines, Local Cooperatives and thus enjoy to
the fullest the stay.
Concerning the date of implementation of the project, we believe that starting 2016, the
construction of the building will start. So, two years from that, the entity will be ready to
receive customers in 2018. With a 90% of clients’ satisfaction, the Adagio access is working
to keep an outstanding customer satisfaction.
Why Adagio?
As mentioned earlier, Adagio access apartment hotels is present in eleven different countries
with a total of 101 apartment-hotels and 11025 rooms. The Apartment hotel chain is present
mainly in Europe and working on its expansion worldwide. We chose to open an Adagio
Access based on different reasons: ➢ Best quality/price ratio: with the discount offered,
Adagio Access will have the ability to attract young as well as mature people to the domain.

79
➢ High rate of customers ‘satisfaction: According to Accor Hotel, 90% of the customers are
satisfied of the service provided and they believe that it is the best quality price ratio in the
market for renting apartments.
➢ Accor membership advantages: there are four different fidelity memberships in the Accor
group; Classic, Silver, Gold and even more VIP.
• The Classic card gives access to Club Accor Hotel Customer Care with a online and fast
check-in and out a well as additional benefits and access to private sales. This card is given as
soon as the client joins the club. (Adagio-city, 2014)
• The Silver gives access to the same benefit of the Classic plus a welcoming drink and a late
check out. This card is given starting from the tenth night or with the accumulation of 2500
points (adagio-city, 2014)
• The Gold card benefit from a VIP treatment, a room upgrade, and a guarantee room
availability it is given from the 30th night or with 10000 points (adagio-city, 2014)
• The Even More VIP is the best offer possible. People that have it have the access to
executive lounge in the Hotels-yet not all of them have one- an early check in and a late check
out. People can benefit from it starting the 60th night or after accumulating 25000 points
(adagio-city, 2014)
Why “Plage des nations?” (Opportunities)
We chose to settle the adagio apartment hotel in “plage des nations” because of the opening of
the new Essec business school in the prestigia project as well as the high number of tourists
visiting the region during the summer.
The opening of the new Essec School constitutes a real opportunity for the hospitality
establishments. On average, the capacity of an Essec institution is 2600 students and 275
faculty members. Given the location of the institution, a ride of 25 minutes is required to get
to downtown. The settlement of the apartment hotel in plage des nations is considered as a
competitive advantage for Adagio Access, since it is only 5 minutes away from the Essec
business school by walk. In addition to that, there is only one hotel present next to the beach
and the academic institution named “Firdaous hotel”. The presence of the firdaous hotel in
plage des nations does not constitute a real threat for Adagio, since the hotel is offering a
midscale luxury service at higher prices than Adagio’s. Moreover, Faculty members and

80
students targeted by the apartment hotel Adagio are looking for convenience in terms of
quality/ price ratio rather than high quality standards offered by the 4 stars hotels. In addition
to that, the Adagio apartment hotels offer different formulas for its customers, in order to keep
them for a long-term rental.
Figure 60-Discount Adagio Packages (adagio-city.com, 2015)
In opposition to the existent apartment hotels in Morocco, Adagio apartment hotels are
offering free WI-FI, breakfast to their customers, as well as a free cleaning service every 3
days to customers. Adagio apartment hotels is using a differentiation approach in order to
distinguish itself from competitors and attract customers by higher added value perceived by
potential customers.
As discussed earlier, the Adagio apartment hotel that is going to be settled in plage des
nations will be bearing 60 studios of 25 m2 and 20 apartments of 35 m2. The accommodation
establishment will have ground flour and 4 upper floors over a total area of 1300 m2. Based
on a benchmark with other Adagio present in Europe, we estimated our prices to be 600 MAD
for the studio and 800 MAD for the apartments. Considering the fact that the studio are meant
for 2 people and the apartments are meant for 4, the average cost of long rental for a person
living in a studio would be nearly 5000 MAD per month and almost 3330 MAD for people
sharing an apartment. The prices of rental proposed above are specific the long term rental
condition, moreover the prices are bearing the WIFI, breakfast, cleaning and no additional
collective fees such as heating and electricity.
According to the “statistiques sur le tourisme au Maroc 2015” report, the region of rabat-
Kenitra has recorded a total number of arrivals of 419,445 tourists for the period of January to
August, making it the 6th region most visited of the Moroccan kingdom. In addition to that,
the number of tourists arriving in August is reaching 39,719 which constitutes almost 9,5% of

81
the overall tourists arrivals for the period of January to August. (Statistiques sur le toursime
au maroc, 2015) La plage des nation is a region that is known for its good weather and beach,
thus also attracting local surfers during summer periods and other local customers during
summer holidays. As mentioned earlier, the region suffers from a lack of hospitality
establishment that clearly makes the potential customers switch to potential substitute
products such apartment rental near the region or move to neighboring cities such as Rabat or
Kenitra. Also, the region is experiencing a high demand for lodging and the offer available is
not satisfying the demand present. Moreover, the region will be welcoming new sports events
that will be considered as an opportunity that can be taken advantage of. (BIM, 2015)
Financial Evaluation
Cost of Investment
Budget Allocation:
Our strategy will be financed according to Risma’s target capital structure of 70% debts and
30% equity. As mentioned above, the Adagio Access Hotel will comport 80 rooms in total,
including 60 studios and 20 two apartments.
We estimated the land price to be MAD9 000 according to the market price in the region. Out
Adagio Apartment hotel will be of an area of 1300 m². Therefore, the estimated cost of the
land reached MAD 11.7 million. In addition, we estimated building cost to be of the whole
investment 32%, reaching MAD 8.9 million. In addition, the costs of plumbing and electrical
materials were allocated 4%, which registers MAD 1.2 million. The architecture design was
allocated 4%, which is MAD 1.25 million.
Regarding the land registration, “La Conservation Foncière” fees are MAD 45 per square
meter. Therefore, the total cost of the land registration reached MAD 58 500.
The hotel furniture was allocated 3.4%, reaching MAD 3.9 million. The calculation of this
cost was based on estimating a furniture cost of MAD 9 000 per room for studios and MAD
13 000 for apartments. In addition, the technological supplies are estimated to reach MAD
760 000 with a 2.7% allocation.

82
The inventory supplies are estimated to be MAD 440 000, given a 1.4% allocation. In
addition, the technical supplies are estimated to reach MAD 720 000 with 2.6% allocation.
Further, the operating capital start is estimated to be MAD 1.73 million, with 6.2% allocation.
The total investment is estimated to reach MAD 28.08 million. The table below shows the
budget allocation with the estimated costs.
Investment Cost Budget Allocation
Land 11 700 000 42%
Building Costs 8 900 000 32%
Plumbing Electrical material fees 1 200 000 4%
Architecture design fees 1 250 000 4%
Land Registration (Legal Costs) 58 500 0,21%
Franchise fees 360 000 1%
Hotel Furniture 960 000 3,4%
Technology supplies 760 000 2,7%
Inventory supplies 440 000 1,6%
Technical services costs 720 000 2,6%
Operating capital start 1 730 000 6,2%
Total Investment 28 078 500 100%
Figure 61-Initial Investment and Budget Allocation Strategy II
Forecasted Revenue
The estimated revenues of this new made hotel will be based on an average Adagio Access
Hotel Average Room Rate. In addition, the estimated occupancy will be based on the overall
occupation of Accor hotels in Morocco. The following table shows the forecasted revenue of
the first year of operations.
Average Price Average Room Rate
Yearly Nights
Occupancy Rate RevAR
520 85 365 64% 10 325
120
Figure 62-First Year Forecasted Revenue Strategy II
The average price was calculated via a 25% weight of the apartment prices that cost MAD
800, and 75% weight of the studio price that is MAD 600. In addition, the occupancy rate is
64%, which is the average Accor’s low cost hotel in Morocco. Based on these calculations,
we were able to calculate the yearly Revenue per Available Room of MAD 10.32 million.

83
We estimated the revenues based on three scenarios that differ in terms of increase in sales. In
addition, we based our estimation on the payback period of our Adagio hotel. The estimations
included three different scenarios with an eleven (11) years’ forecast. The purpose of this
forecast is to reach the payback period of this investment. In fact, the revenues are estimated
to increase by 7%, 4.5% and 1% for the third scenarios respectively.
We will use the same cost structure as the previous strategy as there is no significant change
between the forecast methods. Indeed, the cost of revenue is estimated with a percentage of
36%. This percentage was based on Risma’s historical data regarding the cost of revenue. In
addition, the employee benefit was calculated via an average salary of MAD 3500 with 25
employees. We assumed a 2% increase in the salaries for each two years, for the benefit of the
employees.
As used in the previous strategy, the maintenance and repairs are estimated to reach 5.5%
from the revenue. The percentage estimation was based on Risma’s historical data in terms of
this cost. The other operating costs include the franchise expense that is 5% from the total
revenue. This amount is set by Accor in order to manage the hotel. In addition, the other
operating expense comport the purchase of new furniture and technological supplies in the
year 2025. This purchase will be due to the end of the useful life of these facilities in 2024.
Regarding the depreciation of the assets, we estimate the useful life of a building to be 50
years with a 20% salvage value. In addition, the furniture and the technological facilities’
useful life are estimated to be 7 years with a 20% salvage value as well. The following table
shows the details regarding the depreciation table of the assets.
Depreciation Useful Life
Cost of item
Depreciation Expense
Depreciable amount
Salvage Value
Building 50 8 900
000 142 400 80% 1 780 000
Furniture 7 960 000 109 714 80% 192 000
Technology Supplies 7 760 000 86 857 80% 152 000 Total Depreciation Expense 338 971
The depreciation expense is estimated to be MAD 338 917. This expense is constant
throughout the years, as we assume no new assets will be purchased. The depreciation
expense of the building is estimated to be MAD 142 400, the furniture depreciation expense is

84
estimated to reach MAD 109 714, and the technology supplies’ depreciation expense are
estimated to reach MAD 86 857.
Revenue’s Estimation: Scenario Analysis
First Scenario
The first scenario which is the optimistic one is based on an increase of sales with a 4.5%.
This percentage is the forecasted growth of the Moroccan economy. The following is the
revenue forecast in the optimistic scenario.
2018 2019 2020 2021 2022 2023 2024 2025 2026 2027 2028
Revenue
10 325 120
10 738 125
11 167 650
11 614 356
12 078 930
12 562 087
13 064 571
13 587 154
14 130 640
14 695 865
15 283 700
Cost of Revenue
3 613 792
3 758 344
3 908 677
4 065 025
4 227 626
4 396 731
4 572 600
4 755 504
4 945 724
5 143 553
5 349 295
Employee benefit
1 050 000
1 050 000
1 071 000
1 071 000
1 092 420
1 092 420
1 114 268
1 114 268
1 136 554
1 136 554
1 159 285
Energy, maintenance and repairs
567 882
590 597
614 221
638 790
664 341
690 915
718 551
747 293
777 185
808 273
840 603
Other operating expense
516 256
536 906
558 382
580 718
603 947
628 104
653 229
2 791 358
706 532
734 793
764 185
Depreciation 338 971
338 971
338 971
338 971
338 971
338 971
338 971
338 971
338 971
338 971
338 971
Before Tax Operating Revenue
4 238 219
4 463 307
4 676 398
4 919 852
5 151 625
5 414 946
5 666 951
3 839 759
6 225 673
6 533 721
6 831 360
Figure 63-Forecasted Revenues: Optimistic Scenario Strategy II
The forecasted revenues are expected to reach MAD 4.23 million in 2018. The revenues are
expected to growth to MAD 6.83 million in 2028.
In this scenario, the investment will reach its payback period in 2025. The following is the
payback schedule regarding the investment, the estimated NPV and IRR.

85
Year Beginning Balance Net Cash Flow NET PV Cash Flow Ending Balance
0 -28 078 500 -28 078 500 0 -28 078 500
1 -28 078 500 4 238 219 4 010 047 -24 068 453
2 -24 068 453 4 463 307 3 995 664 -20 072 789
3 -20 072 789 4 676 398 3 961 045 -16 111 744
4 -16 111 744 4 919 852 3 942 907 -12 168 838
5 -12 168 838 5 151 625 3 906 383 -8 262 455
6 -8 262 455 5 414 946 3 884 998 -4 377 457
7 -4 377 457 5 666 951 3 846 911 -530 546
8 -530 546 3 839 759 2 466 225 1 935 679
9 1 935 679 6 225 673 3 783 391 5 719 071
10 5 719 071 6 533 721 3 756 831 9 475 901
11 9 475 901 6 831 360 3 716 501 13 192 403
WACC 5,69%
Payback Period 7,22
NPV 12 482 167
IRR 13%
Figure 64- Payback Schedule Optimistic ScenarioStrategy II
The payback period will be reached in the eighth year, with a last negative beginning balance
of MAD 530 546. The estimated payback period is 7.22 years. The optimistic scenario’s NPV
is estimated to reach MAD 12.48 million, with an IRR of 13%.
Second Scenario
The second scenario which is the realistic one is based on revenues’ growth by 2%. This
percentage is the forecasted increase in occupancy rate. This growth gives a more realistic
forecast regarding Adagio Access’ hotel. The following table shows the forecasted revenues
in the realistic scenario.
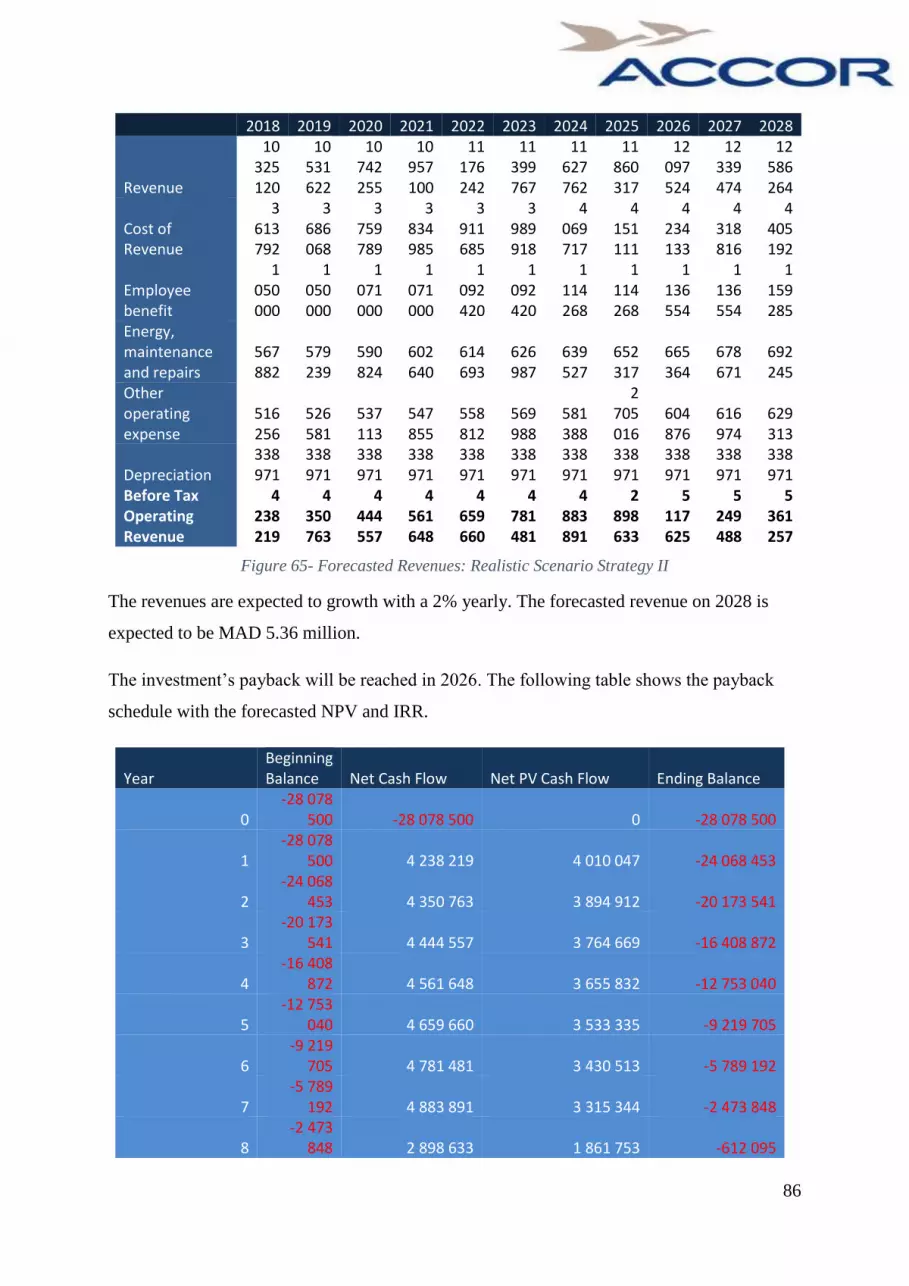
86
2018 2019 2020 2021 2022 2023 2024 2025 2026 2027 2028
Revenue
10 325 120
10 531 622
10 742 255
10 957 100
11 176 242
11 399 767
11 627 762
11 860 317
12 097 524
12 339 474
12 586 264
Cost of Revenue
3 613 792
3 686 068
3 759 789
3 834 985
3 911 685
3 989 918
4 069 717
4 151 111
4 234 133
4 318 816
4 405 192
Employee benefit
1 050 000
1 050 000
1 071 000
1 071 000
1 092 420
1 092 420
1 114 268
1 114 268
1 136 554
1 136 554
1 159 285
Energy, maintenance and repairs
567 882
579 239
590 824
602 640
614 693
626 987
639 527
652 317
665 364
678 671
692 245
Other operating expense
516 256
526 581
537 113
547 855
558 812
569 988
581 388
2 705 016
604 876
616 974
629 313
Depreciation 338 971
338 971
338 971
338 971
338 971
338 971
338 971
338 971
338 971
338 971
338 971
Before Tax Operating Revenue
4 238 219
4 350 763
4 444 557
4 561 648
4 659 660
4 781 481
4 883 891
2 898 633
5 117 625
5 249 488
5 361 257
Figure 65- Forecasted Revenues: Realistic Scenario Strategy II
The revenues are expected to growth with a 2% yearly. The forecasted revenue on 2028 is
expected to be MAD 5.36 million.
The investment’s payback will be reached in 2026. The following table shows the payback
schedule with the forecasted NPV and IRR.
Year Beginning Balance Net Cash Flow Net PV Cash Flow Ending Balance
0 -28 078
500 -28 078 500 0 -28 078 500
1 -28 078
500 4 238 219 4 010 047 -24 068 453
2 -24 068
453 4 350 763 3 894 912 -20 173 541
3 -20 173
541 4 444 557 3 764 669 -16 408 872
4 -16 408
872 4 561 648 3 655 832 -12 753 040
5 -12 753
040 4 659 660 3 533 335 -9 219 705
6 -9 219
705 4 781 481 3 430 513 -5 789 192
7 -5 789
192 4 883 891 3 315 344 -2 473 848
8 -2 473
848 2 898 633 1 861 753 -612 095
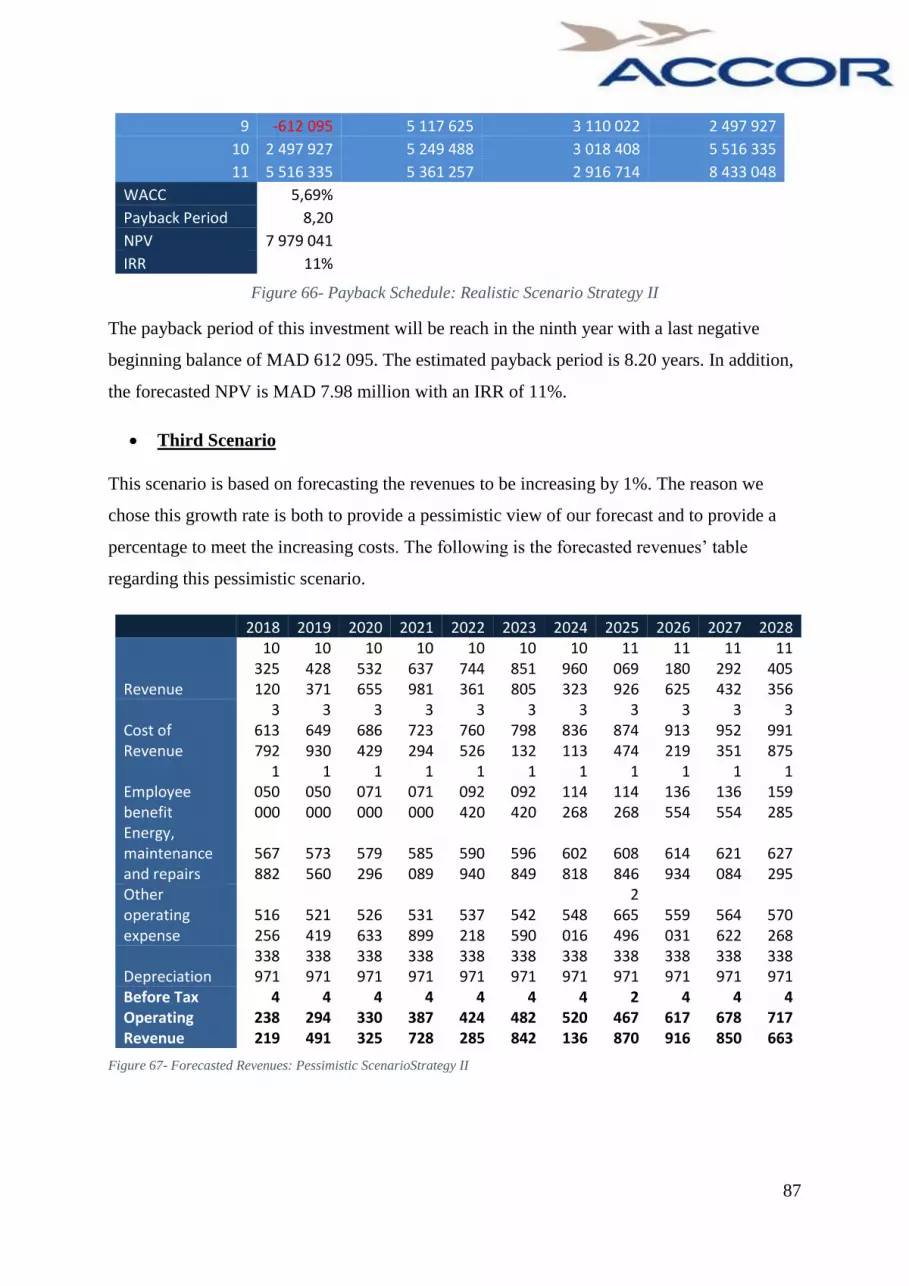
87
9 -612 095 5 117 625 3 110 022 2 497 927
10 2 497 927 5 249 488 3 018 408 5 516 335
11 5 516 335 5 361 257 2 916 714 8 433 048
WACC 5,69%
Payback Period 8,20
NPV 7 979 041
IRR 11%
Figure 66- Payback Schedule: Realistic Scenario Strategy II
The payback period of this investment will be reach in the ninth year with a last negative
beginning balance of MAD 612 095. The estimated payback period is 8.20 years. In addition,
the forecasted NPV is MAD 7.98 million with an IRR of 11%.
Third Scenario
This scenario is based on forecasting the revenues to be increasing by 1%. The reason we
chose this growth rate is both to provide a pessimistic view of our forecast and to provide a
percentage to meet the increasing costs. The following is the forecasted revenues’ table
regarding this pessimistic scenario.
2018 2019 2020 2021 2022 2023 2024 2025 2026 2027 2028
Revenue
10 325 120
10 428 371
10 532 655
10 637 981
10 744 361
10 851 805
10 960 323
11 069 926
11 180 625
11 292 432
11 405 356
Cost of Revenue
3 613 792
3 649 930
3 686 429
3 723 294
3 760 526
3 798 132
3 836 113
3 874 474
3 913 219
3 952 351
3 991 875
Employee benefit
1 050 000
1 050 000
1 071 000
1 071 000
1 092 420
1 092 420
1 114 268
1 114 268
1 136 554
1 136 554
1 159 285
Energy, maintenance and repairs
567 882
573 560
579 296
585 089
590 940
596 849
602 818
608 846
614 934
621 084
627 295
Other operating expense
516 256
521 419
526 633
531 899
537 218
542 590
548 016
2 665 496
559 031
564 622
570 268
Depreciation 338 971
338 971
338 971
338 971
338 971
338 971
338 971
338 971
338 971
338 971
338 971
Before Tax Operating Revenue
4 238 219
4 294 491
4 330 325
4 387 728
4 424 285
4 482 842
4 520 136
2 467 870
4 617 916
4 678 850
4 717 663
Figure 67- Forecasted Revenues: Pessimistic ScenarioStrategy II

88
The forecasted revenues are expected to reach MAD 4.71 million in 2028.
This investment will reach is payback in 2026. The following table shows the payback
schedule with the forecasted NPV and IRR.
Year Beginning Balance Net Cash Flow Net PV Cash Flow
Ending Balance
0 -28 078 500 -28 078 500 0 -28 078 500
1 -28 078 500 4 238 219 4 010 047 -24 068 453
2 -24 068 453 4 294 491 3 844 536 -20 223 917
3 -20 223 917 4 330 325 3 667 912 -16 556 006
4 -16 556 006 4 387 728 3 516 448 -13 039 558
5 -13 039 558 4 424 285 3 354 854 -9 684 704
6 -9 684 704 4 482 842 3 216 252 -6 468 452
7 -6 468 452 4 520 136 3 068 416 -3 400 036
8 -3 400 036 2 467 870 1 585 080 -1 814 956
9 -1 814 956 4 617 916 2 806 344 991 388
10 991 388 4 678 850 2 690 297 3 681 684
11 3 681 684 4 717 663 2 566 575 6 248 260
WACC 5,69% Payback Period 8,65
NPV 5 911 874
IRR 10%
Figure 68- Payback Schedule: Pessimistic Scenario
The investment will reach its payback in the ninth year. The last negative beginning balance
will be MAD 1.81 million. The forecasted payback period will be 8.65 years. The forecasted
NPV will reach MAD 5.91 million with a 10% IRR.

89
9.3 Strategy III: Market Penetration – Ibis hotel Rabat-Salé Airport
Ibis is a pioneer in economic hotels in Europe.
In 1974, Ibis was created, the setup of ibis has rapidly known an active development
and record nowadays “1,047” inns and“131,670” rooms in “61” nations.
The trademark has dispatched an improvement program extremely aspiring whose goal is to
fortify its situation/position as the main pioneer in the country of Europe and also to increase
its vicinity in developing the markets, especially the one in the region of Asia, and in the other
regions such as: “Eastern Europe”, “Latin America” plus in the full grown markets, for
instance; “Australia” and “New Zealand”, in 2007.
Ibis recorded its assurance in the system of what is called “Planet21” that is the practical
improvement platform of the hotels of Accor. “Ibis” hotel is the primary worldwide chain
occupied within the natural confirmation of “ISO 14001”, which introduces a constant
advancement through:
The perpetual consistence within the most recent guidelines and conventions.
The continuous change in which asserted inns are examined frequently to establish new
objectives.
The Ibis that we will build will contain “85” rooms and we will invest 14% from our
budget allocation in the land. Moreover, Ibis hotel will comprise “30” twin residence rooms
within “1” royal size bed and “40” twin inhabitance rooms within “2” distinct beds plus
“15” room suites. In addition to that, the Ibis hotel will contain “4” floors including “18”
twin lodgings, “4” room suites within “3” stages also “16” paired habitation
accommodations plus “3” room suites within the last floor. Consequently, the assessment
of our major staffs will represent “68” members.
When & where & why to implement this strategy
Ibis will be implemented within 2016 near to the airport of Rabat-Salé for the tourists
and arrivals to Rabat. Since, there is a deficiency of hotels near to the airport “Rabat-Salé” and
the airport is turning into an international one, we decided to implement it within this place

90
because our main objective is to host the national and international arrivals. Moreover, there
are many flights that arrive late at night and since the transportation is not very smooth then it
is an opportunity for us to open a new hotel.
The description of the esthetic of the rooms
First let’s start within the paired accommodation that is the “double room”: It is only one room
within one bed that is made for two persons.
Moreover, this accommodation that contains this type of bed includes as well a clean coverlet.
And a new television within a plasma screen that enables you to
have access to different channels plus to have access to internet,
Wi-Fi wireless connection is available too, and every room
contains two private bathrooms that has a shower. To add, the
architecture of the room is modern and it makes you feel relaxed
and perfectly comfortable. This room is mainly recommended for
couples and also for a single individual who wants to stay by his/her own. (Ibishotels, 2012)
Secondly, the twin accommodation is a room that
contains two single two single and particular beds that are
affordable for two individuals.
Furthermore, mainly this room includes covers and
towels within different sizes. Besides, it also comprises a
modern “TV”, a connection via Ibis’s free Wi-Fi, and two
independent toilets. This accommodation is basically
acclaimed for groups and families/colleagues (IbisHotels,
2012).
Lastly, the third room is a suit one that encompasses a
single paired bed. It offers comfort within a place where you
can sit plus a balcony. Of course, it includes as well a television,
a bathroom and a shower. It is suitable for couples and families
(Ibishotels, 2012).
The Main Concern
We established this technique in order to take advantage
from the arrival rate of the economical travelers’ tourism at the Airport of the region that is
called “Rabat-Salé-zemmour-zaer” that turned into an international one since Ibis will be
located near to this airport. Moreover, it is the perfect location where Ibis will be the best

91
destination for travelers. The region is mainly located in the northwestern of the Moroccan
country and it encompasses further than 2.3 million of its inhabitants. In addition to that, the
city of Rabat is not only the district’s capital but also the main capital of the Moroccan kingdom.
To add, this province insures “9580 square Km” plus it incorporates the major Rabat’s areas as
well as the zones of “Salé” and the main sectors of “Skhirat” and “Temara” and finally the
regions of the “Khemisset” and “Rommani”. Additionally, this province possesses a very rich
antiquity that is based across the main creation of the “Chellah” monument by Phoenicians and
subsequently Romans occupied this memorial. Nowadays, visitors and vacationers commonly
visit this ancient site. Besides, the city of Rabat is an admired touristic place that is known for
its main fascinations, for instance; the legislatorial constructions, the Tower of Hassan, and the
Mohammed five Mausoleums. It is a city where undoubtedly visitors are going to be left within
unforgettable memorials. To add, the city of Rabat is alike the city of Salé that represents a
merge of values, cultures, and philosophies. A lot of visitors visit the city in order to see the
ancient city and its monuments (Morocco.com, 1995).
It is a sunny and enlightened region that is widely irrigated. Also, it is advantageous
thanks to the diversification of its climatic features and a natural heritage that is environmentally
outstanding, namely a seaside over the Atlantic coast that stretches over more than 75 Km²,
natural hot sources especially the source of Oulmès, the lake Dait Roumi in Romani, forest area
that occupies 306.200 Ha in surface, a green chain, and countless sites having a leading role in
the preservation of biodiversity and eco systems (Présentation de la direction regional Rabat-
Salé-Zemmour-Zaer, 2011).
Contributing by 48.9% in the wealth conception at a national level, it is also
distinguished by its economic variety, where particularly innovative sectors such as
microelectronics, offshoring, or aeronautics coexist with more traditional sectors like textile
and agribusiness (Présentation de la direction regional Rabat-Salé-Zemmour-Zaer, 2011).
Welcoming evenly all the prodigious national and international institutions as well as
the diplomatic representations, it offers a pleasant living environment, modern infrastructures,
and favorable governance for businesses (Présentation de la direction regional Rabat-Salé-
Zemmour-Zaer, 2011).
Attractive by its rich historical and cultural heritage, the region constitutes a national
and international tourist destination especially with the launch of huge projects whose
objectives are refreshing the Atlantique coast and the borders of the river Bouregrag without

92
neglecting the countryside. (Présentation de la direction regional Rabat-Salé-Zemmour-Zaer,
2011)
We are aware of the fact that Accor is an organization that manages Risma and its main
objective is to finance the manufacturing of low-cost hotels throughout inaugurating the
opening of Ibis style/Ibis/Ibis budget. Subsequently, “Risma” will be the one that will carry this
major project of opening an Ibis in this region of “Rabat-Salé-zemmour-zaer” that will be
managed by Accor. (Morocco.com, 1995)
Additionally, concerning the evaluation of this approach we will demonstrate the budget
of investment, the assessed primary investment, and also the forecasted revenues.
(Morocco.com, 1995)
The Fundamental appealing advantages of the region of “Rabat-Salé-zemmour-
zaer”
It’s a judicious and comfortable localization having competitive charges. The closeness
to the airport facilitates the traveler’s movements by making it easy and fast. Moreover, it is a
mean to save time and obtain peace since it is located near the Atlantic coast. Thus, the visitors
will benefit from the activities and events offered there.
The table below shows the different companies that provide their services for the airport
along with their destinations.
Airline Companies: Destinations:
Air France Paris-Charles-de-Gaulle
Buraq Air Tripoli
Corendon Dutch Airlines Amsterdam
Etihad_Airways Abu Dhabi
Jetairfly
Charleroi
Paris-Orly
Brussels-
South

93
Royal Air Maroc Paris-Orly
Casablanca
London
Marseille
Madrid
Brussels
Jeddah (in the period of pilgrimage)
Ryanair Charleroi
Marseille
Madrid
paris Beauvais
London
Girona
Roma-Ciampino
Vueling Airlines Barcelona
The table above shows the flow rate of the passengers across the years. Moreover, in
2014, it registered 684 213 passengers.
The main Objectives
Actually, the creation of Ibis hotel near to the international airport of the region of Rabat-
Salé-Zemmour-Zaer will enable the main sequence of Accor to enhance its major existence
throughout the Moroccan kingdom by maintaining its compromise within the current market
development tendency that are focused progressively regarding the low-priced hotels.
Moreover, the new opening of Ibis hotel will enhance the entrance of such a unique hotel within
affordable prices inside the Moroccan country. Finally, the main regional diversification has a
great importance for the Moroccan tourism.
Figure 69-Flow rate of passengers (Rabat-Salé, 2014)

94
Financial Evaluation
Cost of investment
Budget Allocation
The following is our budget allocation to building Ibis Rabat-Salé. The budget allocation
model we chose is based on estimating the costs and setting percentages to determine the
allocation of each item.
Investment Budget Allocation
Land 49%
Building Costs 28%
Landscaping fees 1%
Plumbing Electrical material fees 3%
Architecture design fees 5%
Land Registration (Legal Costs) 0,28%
Franchise fees 1,61%
Hotel Fournitures 2,84%
Technology supplies 1,33%
Inventory supplies 0,57%
Technical services costs 2,84%
Operating capital start 3,92%
Total Investment 100,00%
Figure 70-Table X: Ibis Rabat-Salé Budget Allocation
The above table shows the budget allocation for the Ibis hotel to be built. In fact, the land is
given a 49% allocation, and the building costs are given 28% allocation. In addition, the
landscaping costs were given a 1% allocation. Further, the plumbing is allocated 3%, and the
architectural costs are given 5%.
The land registration is allocated MAD45/m², the price asked by “La Conservation Foncière”
in Morocco. In addition, the license fees according to Accor reach MAD8500 per room as
primary fees to get the license.
Concerning the hotel furniture, it is allocated a 2.84% from the whole budget, in addition to a
1.33% allocation for the technology supplies. In addition to that, the inventory supplies are
given a 0.57% allocation. The technical services costs reached 2.84%. The hotel needs a
minimum capital to operate that reaches 3.92%.

95
Estimated Initial Investment
Investment Cost
Land 22 165 000
Building Costs 12 760 000
Landscaping fees 440 000
Plumbing Electrical material fees 1 275 000
Architecture design fees 2 200 000
Land Registration (Legal Costs) 126 000
Franchise fees 722 500
Hotel Fournitures 1 275 000
Technology supplies 595 000
Inventory supplies 255 000
Technical services costs 1 275 000
Operating capital start 1 760 000
Total Investment 44 848 500
Figure 71-Ibis Rabat-Salé Initial Investment
The above table shows the investment allocation. In fact, the cost of land reached MAD22.16
million. In addition, the building costs are estimated to be MAD 12.76 million. The
landscaping fees are expected to reach MAD440 000. The plumbing and electrical materials
are estimated to reach MAD 1.2 million. In addition, the architecture fees are estimated to
reach MAD 2.2 million. The land registration fees are estimated to reach MAD 126 000. This
is simply the product of MAD 45 and 2800 m². In addition, the franchise fees reached MAD
722 500, that is MAD 8500 multiplied by the number of rooms which is 85.
Regarding the hotel furniture, the estimated cost reached MAD 1.27 million. The technology
supplies reached MAD 0.59 million. In addition to that, the inventories supplies are estimated
to cost MAD 0.25 million, the technical services are estimated to cost MAD 1.27 million, and
the initial capital is estimated to reach MAD 1.76 million.
The total initial investment is estimated to reach MAD 44 858 500. As mentioned, above, the
strategy is expected to be implemented in 2016, and the estimated amount of time to build the
hotel is 2 years. Therefore, the revenue generation will start until 2018.

96
As mentioned above, the total number of passengers in Rabat-Salé Airport in 2014 reached
684 213 according to l’économiste. According to the same source, the estimated capacity of
this airport is 1.5 million passengers. In addition, there is a lack of hotels near the airport.
Forecasted Revenue
The Ibis Rabat-Salé airport will be built on a 2800m² land. The total number of rooms is 85
room. It will include 30 double occupancy rooms with one king size bed, 40 double
occupancy room with two separate beds and 15 suites. The estimated price for the double
occupancy room is MAD 450, using a benchmark with other Ibis hotels in Morocco. In
addition, the price of a suite will be MAD 900. The hotel will comport four floors with 18
double room and 4 suites in the three flours, and 16 double occupancy rooms and 3 suites in
the fourth floor.
In this strategy, we used the same Weighted Average Cost of Capital of 5.69%, using 70%
debts and 30% equity, the target capital structure by Risma. In our calculation of revenues, we
applied the occupancy rate of an average Ibis hotel which is 69%. In addition, the Ibis hotel
will comport 85 rooms. According to the World Tourism Organization, the optimum number
of employees in a low cost hotel is eight employees per ten rooms. Therefore, the estimation
of our employees reached 68 employee.
The following table shows a first year forecasted Revenue per Available Room for Ibis Rabat-
Salé.
Average Room Rate
Yearly Nights
Occupancy Rate RevAR
107.88 365 69% 17 198 342
Figure 72- Ibis Rabat-Salé Airport Forecasted RevAR (2018)
The Average Room Rate was estimated via a benchmark with the average Ibis hotels.
Therefore, the estimated one year RevAR reached MAD 17.19 million.
We estimated the revenues based on three scenarios that differ in terms of increase in sales. In
addition, we based our estimation on the payback period of our hotel. The following three
scenarios comport different revenues estimation that will be generated starting from 2018 for
an eleven (11) years period. The rationale behind our eleven years forecasted is to reach the
payback period of this investment. In fact, the revenues are estimated to increase by 4%
yearly.

97
The cost of revenue is estimated with a percentage of 36%. This percentage was based on
Risma’s historical data regarding the cost of revenue. In addition, the employee benefit was
calculated via an average salary of MAD 3500 with 68 employee. We assumed a 2% increase
in the salaries for each two years, for the benefit of the employees.
Further, the energy, maintenance and repairs are estimated to reach 5.5% from the revenue.
The percentage estimation was based on Risma’s historical data in terms of this cost. The
other operating costs include the franchise expense that is 5% from the total revenue. This
amount is set by Accor in order to manage the hotel. In addition, the other operating expense
comport the purchase of new furniture and technological supplies in the year 2025. This
purchase will be due to the end of the useful life of these facilities in 2024.
The depreciation of the assets was based on a benchmark of the depreciable assets. The useful
life of a building is estimated to be 50 years with a 20% salvage value. In addition, the
furniture and the technological facilities’ useful life is estimated to be 7 years with a 20%
salvage value. The following table shows the details regarding the depreciation table of the
assets.
Depreciation Useful Life Cost of item
Depreciation Expense
Depreciable amount
Salvage Value
Building 50 12 760 000 204 160 80% 2 552 000
Furniture 7 1 275 000 145 714 80% 255 000
Technology Supplies 7 595 000 68 000 80% 119 000 Total Depreciation Expense 417 874
Figure 73-Table X: Depreciation Table Ibis Rabat-Salé Airport
The above table shows the depreciation expense that reached MAD 417 874. This expense is
expected to remain constant as there will not be any further purchase of new assets.
Revenue Estimation: Scenario Analysis
First Scenario
The first scenario, which is the optimistic one will comport a revenue estimation based on a
7% increase in sales. This forecasted increase in sales is generated based on the forecasted
growth in the industry.

98
2018 2019 2020 2021 2022 2023 2024 2025 2026 2027 2028
Revenue
17 198 343
18 402 227
19 690 383
21 068 710
22 543 519
24 121 566
25 810 075
27 616 780
29 549 955
31 618 452
33 831 744
Cost of Revenue
6 019 420
6 440 779
6 891 634
7 374 048
7 890 232
8 442 548
9 033 526
9 665 873
10 342 484
11 066 458
11 841 110
Employee benefit
2 856 000
2 856 000
2 913 120
2 913 120
2 971 382
2 971 382
3 030 810
3 030 810
3 091 426
3 091 426
3 153 255
Energy, maintenance and repairs
945 909
1 012 122
1 082 971
1 158 779
1 239 894
1 326 686
1 419 554
1 518 923
1 625 248
1 739 015
1 860 746
Other operating expense
859 917
920 111
984 519
1 053 435
1 127 176
1 206 078
1 290 504
3 492 839
1 477 498
1 580 923
1 691 587
Depreciation 417 874
417 874
417 874
417 874
417 874
417 874
417 874
417 874
417 874
417 874
417 874
Before Tax Operating Revenue
6 099 223
6 755 339
7 400 264
8 151 452
8 896 961
9 756 997
10 617 807
9 490 461
12 595 425
13 722 756
14 867 171
Figure 74- Ibis Rabat-Salé Airport Revenue Optimistic Scenario
The forecasted revenues are expected to reach MAD 6.01 million in 2018, growing to reach
MAD 14.86 million in 2028.
The investment will reach its payback period in 2026 for this scenario. The following table
shows the forecasted payback schedule with the Net Present Value Estimation.
Year Beginning Balance Net Cash Flow NET PV Cash Flow Ending Balance
0 -44 848 500 -44 848 500 0 -44 848 500
1 -44 848 500 6 099 223 5 770 861 -39 077 639
2 -39 077 639 6 755 339 6 047 549 -33 030 091
3 -33 030 091 7 400 264 6 268 239 -26 761 852
4 -26 761 852 8 151 452 6 532 801 -20 229 051
5 -20 229 051 8 896 961 6 746 402 -13 482 649
6 -13 482 649 9 756 997 7 000 237 -6 482 412
7 -6 482 412 10 617 807 7 207 714 725 302
8 725 302 9 490 461 6 095 595 6 820 897
9 6 820 897 12 595 425 7 654 340 14 475 237
10 14 475 237 13 722 756 7 890 461 22 365 698
11 22 365 698 14 867 171 8 088 267 30 453 964
Payback Period 6,90
NPV 28 814 424
IRR 15%
Figure 75-Payback Period Schedule: Optimistic Scenario

99
The estimated payback period of this investment is 6.90 years. In fact, the last beginning
balance will be in the year 2026 and will reach MAD 6 482 412. The first positive cash flow
will be generated starting from the same year. In the optimistic scenario, the NPV is estimated
to reach MAD 28.84 million, with an IRR of 15%
Second Scenario
In this scenario, the forecasted increase in sales is 4.5%. The rationale behind this percentage
is the forecasted growth in the Moroccan GDP.
2018 2019 2020 2021 2022 2023 2024 2025 2026 2027 2028
Revenue
17 198 343
17 972 268
18 781 020
19 626 166
20 509 344
21 432 264
22 396 716
23 404 568
24 457 774
25 558 374
26 708 501
Cost of Revenue
6 019 420
6 290 294
6 573 357
6 869 158
7 178 270
7 501 292
7 838 851
8 191 599
8 560 221
8 945 431
9 347 975
Employee benefit
2 856 000
2 856 000
2 913 120
2 913 120
2 971 382
2 971 382
3 030 810
3 030 810
3 091 426
3 091 426
3 153 255
Energy, maintenance and repairs
945 909
988 475
1 032 956
1 079 439
1 128 014
1 178 775
1 231 819
1 287 251
1 345 178
1 405 711
1 468 968
Other operating expense
859 917
898 613
939 051
981 308
1 025 467
1 071 613
1 119 836
3 282 228
1 222 889
1 277 919
1 335 425
Depreciation 417 874
417 874
417 874
417 874
417 874
417 874
417 874
417 874
417 874
417 874
417 874
Before Tax Operating Revenue
6 099 223
6 521 012
6 904 662
7 365 266
7 788 336
8 291 327
8 757 526
7 194 805
9 820 186
10 420 013
10 985 004
Figure 76-Ibis Rabat-Salé Airport Revenue Realistic Scenario
The forecasted operating before tax revenues are expected to reach MAD 10.98 million in
2028.
The investment will reach its payback period in 2024 for this scenario. The following table
shows the forecasted payback schedule with the Net Present Value Estimation

100
Year Beginning Balance Net Cash Flow Net PV Cash Flow Ending Balance
0 -44 848 500 -44 848 500 0 -44 848 500
1 -44 848 500 6 099 223 5 770 861 -39 077 639
2 -39 077 639 6 521 012 5 837 773 -33 239 866
3 -33 239 866 6 904 662 5 848 449 -27 391 417
4 -27 391 417 7 365 266 5 902 729 -21 488 688
5 -21 488 688 7 788 336 5 905 752 -15 582 936
6 -15 582 936 8 291 327 5 948 681 -9 634 256
7 -9 634 256 8 757 526 5 944 894 -3 689 361
8 -3 689 361 7 194 805 4 621 127 931 766
9 931 766 9 820 186 5 967 805 6 899 571
10 6 899 571 10 420 013 5 991 413 12 890 984
11 12 890 984 10 985 004 5 976 230 18 867 215 Payback Period 7,62
NPV 17 851 466
IRR 12%
Figure 77-Payback Period Schedule: Realistic Scenario
The estimated payback period of this investment is 7.92 years. In fact, the last beginning
balance will be in the year 2025 and will reach MAD 3 689 361. The first positive cash flow
will be generated starting from the same year. In the realistic scenario, the NPV is estimated
to reach MAD 17.85 million, with an IRR of 12%.
Third Scenario
In this scenario, the estimated revenues will be forecasted to increase by 1% to meet the
increased costs. In this scenario, we decided to come up with an inferior rate to develop the
pessimistic scenario. The following table is the forecasted revenues using 1% increase in
sales.
2018 2019 2020 2021 2022 2023 2024 2025 2026 2027 2028
Revenue
17 198 343
17 370 326
17 544 030
17 719 470
17 896 665
18 075 631
18 256 388
18 438 951
18 623 341
18 809 574
18 997 670
Cost of Revenue
6 019 420
6 079 614
6 140 410
6 201 814
6 263 833
6 326 471
6 389 736
6 453 633
6 518 169
6 583 351
6 649 185
Employee benefit
2 856 000
2 856 000
2 913 120
2 913 120
2 971 382
2 971 382
3 030 810
3 030 810
3 091 426
3 091 426
3 153 255
Energy, maintenance and repairs
945 909
955 368
964 922
974 571
984 317
994 160
1 004 101
1 014 142
1 024 284
1 034 527
1 044 872

101
Other operating expense
859 917
868 516
877 201
885 973
894 833
903 782
912 819
3 033 948
931 167
940 479
949 884
Depreciation 417 874
417 874
417 874
417 874
417 874
417 874
417 874
417 874
417 874
417 874
417 874
Before Tax Operating Revenue
6 099 223
6 192 954
6 230 502
6 326 117
6 364 425
6 461 962
6 501 047
4 488 544
6 640 420
6 741 917
6 782 601
Figure 78-Ibis Rabat-Salé Airport Revenue Pessimistic Scenario
The forecasted revenues are estimated to reach MAD 6.78 million in 2028.
The investment will reach its payback period in 2027 for this scenario. The following table
shows the forecasted payback schedule with the Net Present Value Estimation.
Year Beginning Balance Net Cash Flow Net PV Cash Flow
Ending Balance
0 -44 848 500 -44 848 500 0 -44 848 500
1 -44 848 500 6 099 223 5 770 861 -39 077 639
2 -39 077 639 6 192 954 5 544 087 -33 533 553
3 -33 533 553 6 230 502 5 277 416 -28 256 136
4 -28 256 136 6 326 117 5 069 926 -23 186 211
5 -23 186 211 6 364 425 4 826 027 -18 360 184
6 -18 360 184 6 461 962 4 636 188 -13 723 996
7 -13 723 996 6 501 047 4 413 123 -9 310 873
8 -9 310 873 4 488 544 2 882 931 -6 427 942
9 -6 427 942 6 640 420 4 035 436 -2 392 505
10 -2 392 505 6 741 917 3 876 542 1 484 036
11 1 484 036 6 782 601 3 689 975 5 174 011
WACC 5,69% Payback Period 9,59
NPV 4 895 459
IRR 8%
Figure 79-Payback Period Schedule: Pessimistic Scenario
The estimated payback period of this investment is 9.59 years. In fact, the last beginning
balance will be in the year 2027 and will reach MAD 2 332 505. The first positive cash flow
will be generated starting from the same year. In the pessimistic scenario, the NPV is
estimated to reach MAD 4.89 million, with an IRR of 8%.

102
X. Recommendations
Our recommendation would be to implement the three strategy with an appropriate e-
marketing campaign targeting the right target segments.
In order for Risma to get customer awareness about this new offer, the most effective
way to reach the maximum number of people is through online advertising and more
specifically through social media advertising focusing on Facebook. The choice of this
channel is not random, since as the third quarter of 2015, the number of Facebook’s monthly
active users reached 1.545 million people worldwide (Hope, 2015).
We first conducted a demand analysis using online tools such as google adwords,
social mention and google trends, in order to get more insights about the amount of people
interested in booking a hotel in Morocco. The results show that the majority of searches are
Figure 80- (Statistica, 2015)
Figure 81-(Google Adwords, 2015)

103
done by French and Italian citizens with 78.4% of the total searches on Moroccan hotels
among the six selected countries. In a period of two years, on average 4.225.910 internet users
were keen to find a hotel in Morocco.
During the past year, a peak has been noticed in the searches for hotels in Morocco,
and according to google trends the majority of this requests came from the United Kingdom,
France and Germany, during the summer period. The keywords associated with this inquiry
were; Marrakech, Agadir, holidays in Morocco and others related to hotel searching.
Afterward, we needed to assess the internet penetration in our key target markets, and
as you can notice from the screenshot above, according to World Bank’s data, 91.61% of
United Kingdom’s population has access to internet, followed by Germany with 86.19%,
Belgium with 85%, then France with 83.75% of its population being “connected”, and finally
Spain with 76.19% and Italy with a little more than 60% of its population having access to
internet.
Figure 82-Evolution of searches for Hotels in Morocco from the UK & France

104
Since our marketing campaign will be focused on facebook as intermediary through the Accor
official page, we had to assess the percentage of each country’s facebook users. By the end of
2015, it is expected for facebook to have reached 23.4 million French users with a forecasted
constant growth of subscriptions for the next three years (eMarketer, 2015). There are now 5.8
million facebook users in Belgium, which approximately represents half of the country’s
population (Cauderlier, 2015). As for Germans, 27.38 million of them are on facebook
(allfacebook.de, 2015), 17.6 million users in Spain, 18.3 million Italians and finally 30.3
million British people use facebook (statistica, 2015), please refer to Appendix X for
illustrative bar charts.
Since the objective of this campaign is not only to increase brand awareness but more
importantly to get customer engagement, which in our case means to book a room in one of
our hotels, we needed to narrow down the potential prospects according to the following
criteria; online payments. Digging more into our target segment which consists of middle to
upper class European citizens that would rather flight with Royal Air Maroc and stay in the
Sofitel, Pullman and M’Gallery range of hotels, we came up with the following findings about
their consumption habits and how we may take advantage of it, taking into consideration the
funnel concept of achieving customer engagement.
Therefore, utilizing secondary data gathered The World Bank website, we estimated some key
characteristics about our target segment which include their age, income and use of online
payments.
Figure 83-(World Bank Data, 2015)

105
(World Bank Data, 2015)
We therefore found that 72.8% of the British female population uses the internet to pay bills
or buy things, 50.9% of Belgium women, 50.4% of German women, 50.2% of Spanish
women, 38.7% of French women, and finally 28.8% of Italians did the same in 2014. The
percentages are somehow higher for males as shown in the table below:
For our communication strategy the total available market in each country will therefore be:
TAM = population * % internet users * % facebook users * % age (15-65+) * % online
payments users * % income.
Figure 84- World Bank Data, 2015
Figure 85-Total Available Market in top 6 European countries

106
XI. Conclusion
In a nutshell, this report was about the strategic management planning of Accor-
Risma, the corporation that operates in the hospitality industry. In fact, this industry is for
a great importance for the Moroccan economy. As stated above, this service industry
contributes by 9% to the Moroccan GDP. In addition, the forecasted growth of this sector
is promising. The forecasted growth in this industry is expected to reach 7%.
This leaded us to choose one of the top hotel service groups and the only one traded in
Casablanca Stock Exchange. In addition, we concentrated our thinking on innovative
strategies in order to cope with this growth and to take this opportunity to maximize
Risma’s shareholders’ value using profit generating strategies that we came up with after
analyzing different perspectives.
Accor-Risma is one of the main players in the tourism industry in Morocco. In fact, its
geographical presence in the country with its spread investments makes from it one of the
leaders in this domain. In addition, one of the most attracting characteristic of this
company is that it owns a variety of hotels that include the luxurious ones such as Sofitel
as well as the low cost ones such as Ibis budget.
Risma’s operations concentrate on financing the building and the related costs of hotels,
and purchase the license of the international group Accor in order to manage it. Our
financial analysis for Risma leads us to conclude that the corporation is financially
unhealthy. However, looking at the industry characteristics and the type of required
capital expenditure, with a comparison with other industry peers, we found out that these
negative numbers are not due to the core operations. However, these red key numbers are
due to the high payback period of the investments in this industry.

107
XII. References
AccorHotels-group.com. (2015). Groupe, Histoire, Chronologie. Retrieved on 11/10/2015
from : http://www.accorhotels-group.com/fr/groupe/histoire/chronologie.html
Accor Carnet des Marques. (n.d.). Retrieved November 8, 2015, from
http://www.accorhotels-group.com/fr/marques/carnet-des-marques/ibis.html
Aéroport Rabat-Salé. (n.d.). Retrieved November 17, 2015, from http://www.bourse-des-
vols.com/guide-aeroports/aeroport-de-rabat-sale.html
Aéroport Rabat-Salé Ouverture du nouveau terminal. (2012, January 24).L'économiste.
Retrieved November 14, 2015, from http://www.leconomiste.com/article/890640-
aeroport-rabat-salebrouverture-du-nouveau-terminal
A.J. (February 11th, 2014). Nouvelle Organisation pour Accor en Afrique et au Maroc.
TourismaPost.com. Retrieved 11/11/2015 from: http://www.tourismapost.com/nouvelle-
organisation-accor-en-afrique-au-maroc/
ALM. (December 31st, 2013). Une Nouvelle Nomination à Accor. Aujourd’hui le Maroc.
Retrieved 11/20/2015 from: http://www.aujourdhui.ma/maroc/finances/une-nouvelle-
nomination-a-accor-106962#.VlTp1diKHIU
Baazi, J., Fanion, F., & Thiam, B. (January 27th, 2011). Accor et Risma au club de
l’économiste. Les Territoires de Responsabilité Désormais Définis. L’économiste. Edition
n°3454. Retrieved 11/12/2015 from: http://www.leconomiste.com/article/accor-et-risma-
au-club-de-l-economistebrles-territoires-de-responsabilite-desormais-definis
Berrada, R. (2015, July 2). Terrorisme, marché français en berne, baisse des recettes... Le
tourisme marocain en perte de vitesse. Retrieved November 10, 2015, from
http://www.huffpostmaghreb.com/2015/07/02/baisse-tourisme-maroc_n_7709290.html

108
Berrahou, M. (August 20th, 2014). A Tetouan, un nouveau Sofitel ouvrira en 2015.
Médias24. Retrieved 11/11/2015 from:
http://www.medias24.com/ECONOMIE/ENTREPRISES/13815-A-Tetouan-un-nouveau-
Sofitel-ouvrira-en-2015.html
Blachez, A., et. al. (2011). Accor, L’aventure du possible. Le cherche midi.
BMI, Business Monitor International. (2015). Morocco Tourism Report 2015. World
Travel & Tourism Council. Retrieved 11/11/2015 from: http://www.wttc.org/-
/media/files/reports/economic%20impact%20research/country%20reports/morocco2014.p
df
Challenge.ma (January 14th, 2015). Actualités. Il fait l’Actu: Marc Thépot. Retrieved
11/10/2015 from : http://www.challenge.ma/il-fait-lactu-marc-thepot-41357/
Construction d'une résidence de luxe à Rabat, Risma se lance dans l'immobilier. (2015,
March 18). Aujourd'hui.ma. Retrieved November 10, 2015, from
http://www.aujourdhui.ma/une/immobilier/construction-d-une-residence-de-luxe-a-rabat-
risma-se-lance-dans-l-immobilier-117252
Dassouli, A. (April 4th, 2014). Entretien avec Amine Echcherki: “Risma Affichera un
Résultat Positif dès 2014. Le Blog Finance d’Afifa Dassouli. La Nouvelle Tribune.
Retrieved 11/10/2015 from : http://lnt.ma/blog/afifa-dassouli/entretien-avec-amine-
echcherki-president-du-directoire-risma-affichera-un-resultat-positif-des-2014/
David, F.R, Ali, A., & Al-Aali, A. (2011). Strategic Management. Concept & Cases. Arab
World Edition. Pearson Education Limited. England
Des "irrégularités comptables" poussent le groupe Risma à constituer une provision de 50
millions de dirhams. (2015, September 15). Huff Post Maghreb. Retrieved November 6,

109
2015, from http://www.huffpostmaghreb.com/2015/09/14/risma-crise-problemes-
gestion_n_8135202.html
Driouchi, E. Azelmad, A. Erreimi. (Fall 2003). L’indice de Réalisation Technologique au
Maroc (1995-2001). Revue Critique Economique. Retrieved November 23, 2014 from:
http://revues.imist.ma/?journal=CE&page=article&op=view&path%5B%5D=1471
ESCWA. (2012). the demographic profile of Morocco. Economic and Social Commission
for Western Asia. United Nations. Retrieved July 22, 2014 from:
www.escwa.un.org/popin/members/morocco.pdf
Khennach, K. (2015, June 9). Risma va-t-il se lancer dans la réservation en ligne? Media
24. Retrieved November 10, 2015, from
http://www.medias24.com/ECONOMIE/ENTREPRISES/155651-Risma-va-t-il-se-lancer-
dans-la-reservation-en-ligne.html
Korso, M. (2015, August 17). Tourisme au Maroc : Le bilan est morose pour Marrakech et
Agadir au 1er trimestre 2015. Retrieved November 10, 2015, from
http://www.maghrebemergent.info/economie/maroc/50417-tourisme-au-maroc-le-bilan-
est-morose-pour-marrakech-et-agadir-au-1er-trimestre-2015.html
Leymarie, J. (April 20th, 2015). Sébastien Bazin: “Accor ouvre un hotel tous les deux
jours”. L’interview Eco. FranceInfo. Retrieved 11/10/2015 from :
http://www.franceinfo.fr/emission/l-interview-eco/2014-2015/sebastien-bazin-accor-
ouvre-un-nouvel-hotel-tous-les-deux-jours-20-04-2015-19-55
Luc, V. (1998). Impossible n’est pas français, l’histoire inconnue de Accor, leader
mondial de l’hôtellerie. Albin Michel.

110
Marot, C. (2012). L’empire Accor. L’express. Retrieved 11/10/2015 from :
http://www.lexpress.fr/actualite/monde/afrique/maroc-l-empire-accor_1106838.html
Maroc : Incertitudes pour Risma après des changements au sein d’Accor. (2013,
September 2). Agence Ecofin. Retrieved November 11, 2015, from
http://www.agenceecofin.com/entreprises/0209-13317-maroc-incertitudes-pour-risma-
apres-des-changements-au-sein-d-accor
Maroc: Risma attendu sur les dividendes. (2015, January 9). Retrieved November 14,
2015, from http://www.financialafrik.com/2015/01/09/maroc-risma-attendu-sur-les-
dividendes/
Methodological Notes to the Tourism Statistic Database. (2012). Retrieved November 15,
2015, from http://dtxtq4w60xqpw.cloudfront.net/sites/all/files/docpdf/2012noteseng.pdf
Morchid, B., & Sekkat, K. (2012). MOROCCAN PASSENGER AIRLINES
FRAMEWORK AND PERFORMANCE. Economic Research Forum, (725), 27-27.
Retrieved November 14, 2015, from http://www.erf.org.eg/CMS/uploads/pdf/725.pdf
Ministry of finances, "Arrêté du ministre des finances n° 2166-98 réglementant le
coefficient relatif à la position de change", 1998.
Bank Al- Maghrib, "Recueil des textes législatifs et réglementaires régissant l’activité des
établissements de crédit et organismes assimilés", 2011, Retrieved Nomvember 22, 2015
from : www.bkam.ma
Morocco Tourism Report 2015. (2015). Business Monitor International. PRINT
Ndiye, M., B. (December 12th, 2014). RISMA: Benjelloun au coude à coude avec Accor.
Economie. Le360.ma. Retrieved 11/10/2015 from :
http://www.le360.ma/fr/economie/risma-benjelloun-au-coude-a-coude-avec-accor-27885
Présentation de la région de Rabat-Salé-Zemmour-Zaer. (n.d.). Retrieved November 17,
2015, from http://www.hcp.ma/region-rabat/Presentation-de-la-region-de-Rabat-Sale-
Zemmour-Zaer_a28.html

111
RAM cède sa filiale hôtelière Atlas Hospitality Morocco au Fonds H-Partners. (2012,
January 13). La Vie Eco. Retrieved November 15, 2015, from
http://lavieeco.com/news/economie/ram-cede-sa-filiale-hoteliere-atlas-hospitality-
morocco-au-fonds-h-partners-21134.html
Rabat-Salé-zemmour-zair. (n.d.). Retrieved November 17, 2015, from
http://www.morocco.com/rabat-sale-zemmour-zaer/
Risma Actionnariat. (n.d.). Retrieved November 2, 2015, from
http://www.risma.com/actionnariat/
Risma. (n.d). Retrieved October 27, 2015 from www.risma.com
Risma Bourse de Casablanca. (n.d). Retrieved November 2, 2015 from
http://www.casablanca-bourse.com/bourseweb/Societe-Cote.aspx?codeValeur=8700
Risma SA Market data. (n.d). Retrieved November 2, 2015, from
http://markets.ft.com/research/Markets/Tearsheets/Financials?s=RIS:CAS
Risma (RIS). (n.d). Retrieved November 2, 2015, from http://www.4-
traders.com/RISMA-1408729/financials/
Statistica. (2015). Internet Demographics & Use. Retrieved November 23, 2015 from :
http://www.statista.com/statistics/272365/age-distribution-of-internet-users-worldwide/
Taleb, S. (September 9th, 2012). Risma, La Belle Histoire du Groupe Accor au Maroc.
LesAfriques.ma. Retrieved 11/10/2015 from : http://www.lesafriques.com/entreprises-et-
marches/risma-la-belle-histoire-du-groupe-accor-au-2.html?Itemid=308?articleid=33149
Tchounand, R. (2015, June 29). Attentat en Tunisie: Les professionnels du tourisme
appellent les autorités à une meilleure promotion du Maroc pour éviter l'amalgame.
Retrieved November 10, 2015, from

112
http://www.yabiladi.com/articles/details/37066/attentat-tunisie-professionnels-tourisme-
appellent.html
Tourisme : Le Maroc souffre de la méfiance des vacanciers français. (2015, June 26). La
Tribune. Retrieved November 15, 2015, from http://www.latribune.fr/entreprises-
finance/services/tourisme-loisirs/tourisme-le-maroc-souffre-de-la-mefiance-des-
vacanciers-francais-487502.html
Thomson Reuters. (2011). Thomson Reuters Eikon. [Computer Software]
World Bank Data. (2015). World development indicators Retrieved November 21, 2015
from: http://wdi.worldbank.org/table/2.9
Other consulted URLs:
http://www.risma.com/histoire/
http://www.anit.ma/index.php/anit
http://www.fnih.ma/Chaines/Chaines-hotelieres.html
http://www.accorhotels-group.com/fr/groupe/accorhotels-dans-le-
monde.html#/area:AF/country:MAR/
http://www.accorhotels-
group.com/fileadmin/user_upload/Contenus_Accor/Finance/Documentation/2014/accor_d
rf2014_fr.pdf
https://www.google.com/trends/explore#q=AccorHotels&geo=FR%2C%20GB&cmpt=ge
o&tz=Etc%2FGMT
http://www.adagio-city.com/gb/aparthotel/concept.shtml

113
XIII. Appendices
Appendix A: Current Organizational Chart of Accor-Risma

114
Appendix B: Space Matrix Components


