Embed Size (px)
Citation preview
ORIGINAL
Strength grading of Norway spruce structural timber:revisiting property relationships used in EN 338classification system
Rene Steiger Æ Martin Arnold
Received: 21 December 2007 / Published online: 30 September 2008
� Springer-Verlag 2008
Abstract Solid timber for structural applications has to be strength graded prior to
its use. In order to remain economic the grading process usually focuses on the most
important physical and mechanical properties: density, modulus of elasticity (MOE)
and bending strength. Based on respective limits given in standards, the timber is
assigned to strength classes. Additional mechanical properties such as tensile and
compression strength parallel to the grain are derived from the basic property values
by empirical relationships. The objective of this study was to review some of these
property relationships based on recently compiled large data sets as a contribution
for a future revision of the grading standards. Based on mechanical tests of Norway
spruce structural timber with different cross-sections, the following characteristic
values and property relationships were evaluated: (a) strength and MOE in bending,
(b) in-grade characteristic values of bending strength, bending MOE and density, (c)
relationship of characteristic values of tension and compression strength parallel to
the grain with respect to the corresponding characteristic value of bending strength,
(d) ratio of fifth percentiles and mean values of density and MOE, as well as (e) the
ratio of MOE in bending, tension and compression. Mechanical tests were
accompanied by measurements of density and ultrasonic wave speed. Resulting
dynamic MOE was partly used as an indicator of timber quality.
R. Steiger (&) � M. Arnold
Empa, Swiss Federal Laboratories for Materials Testing and Research,
Wood Laboratory, Uberlandstrasse 129, 8600 Dubendorf, Switzerland
e-mail: [email protected]
M. Arnold
e-mail: [email protected]
123
Wood Sci Technol (2009) 43:259–278
DOI 10.1007/s00226-008-0221-6
EMPA20090115
Introduction
Solid timber for structural applications has to be strength graded prior to its use.
Grading standards provide strength class systems to assign timber samples to
specific strength classes. In order to remain simple and economic the grading
process usually focuses on the most important physical and mechanical properties:
density, modulus of elasticity parallel to the grain (MOE) and bending strength
(MOR). To account for the variation of mechanical properties, the classification is
based on so-called characteristic values, which are fifth percentile or mean values,
respectively.
In Europe, the classification of structural timber is carried out according to a set
of three linked standards:
• Test methods to determine mechanical properties as well as dimensions,
moisture content (MC) and wood density of test pieces are specified in EN 408
(2003). The methods apply to rectangular and circular shapes of solid unjointed
timber or finger-jointed timber and glued laminated timber with constant cross-
sections. The tests have to be carried out in dried conditions (20�C/65% relative
humidity).
• Characteristic values of mechanical properties and density are derived from the
test data according to EN 384 (2004). The standard provides rules for sampling,
analysing (e. g. calculating adjusted fifth percentiles weighted according to the
number of specimens in each sample) and adjusting test values to geometrical or
climatic properties differing from reference conditions given in EN 408.
• The timber is finally classified according to EN 338 (2003). This standard
defines 12 strength classes for softwoods, prefixed C: C14, C16, C18, C20, C22,
C24, C27, C30, C35, C40, C45, and C50 (Table 1). The numbers represent the
characteristic bending strength fm,k for each strength class. A specific population
can be assigned to a certain strength class if the characteristic values of density
rk and bending strength fm,k (both of them are 5th-percentiles) as well as MOE
(mean value, usually derived from bending tests) match or exceed the values of
the desired class. Additional mechanical properties needed for the design of
timber structures are derived from these basic values by empirical relationships.
Relationship of bending strength and bending MOE
Modulus of elasticity derived from bending tests correlates well with MOR.
Coefficients of correlation R up to 0.7–0.8 are reported in the literature (Glos 1995).
Since MOE can be derived by non-destructive tests, it is a very important parameter
for machine grading. Most grading machines make use of MOE as an indicator for
timber strength (Fewell 1982; Glos 1995). MOE can be determined either by static
bending or dynamic methods (vibration, ultrasound) (Hearmon 1966; Kollmann and
Krech 1960).
260 Wood Sci Technol (2009) 43:259–278
123
Simultaneous matching of in-grade characteristic values of MOR,
mean MOE and density
In practical design of timber structures, MOR andMOE are important parameters, the
latter being of even more importance since deformations of structural elements are
often decisive in the course of the design process (Thelandersson 1995). Compressive
strength parallel to the grain as well as embedding strength has been reported to
correlate with density (Ehlbeck and Werner 1992; Fewell 1982; Gindl and
Teischinger 2002; Kollmann and Cote 1968). Therefore, EN 338 assigns a timber
population to a strength class, if its characteristic values of bending strength and
density (fifth percentiles) and its characteristic mean modulus of elasticity in bending
equals or exceeds the limits for that respective strength class (Table 1). Hence, it is of
utmost importance that within all grades, these three basic values match as good as
possible. If, for example, a specific population which fulfils the criterion for MOR and
MOE has to be graded down to a lower class because the density values are not
reached, it has to be questioned if density limits are set correctly.
Ratio of tensile and compression strength parallel to the grain to bending
strength
Both parallel-to-the-grain tensile and compression strength are used when designing
axially loaded timber members. Respective characteristic values ft,0,k and fc,0,k in EN
338 (Table 1) are derived from characteristic MOR fm,k using empirical
relationships.
According to EN 384 (2004) the characteristic values of tensile strength parallel
to the grain ft,0,k for softwood species can be calculated with Eq. (1):
ft;0;k ¼ 0:6 fm;k ð1Þ
This constant ratio is used in most strength class systems for structural timber
(Green and Kretschmann 1990), although it was shown in several studies not to
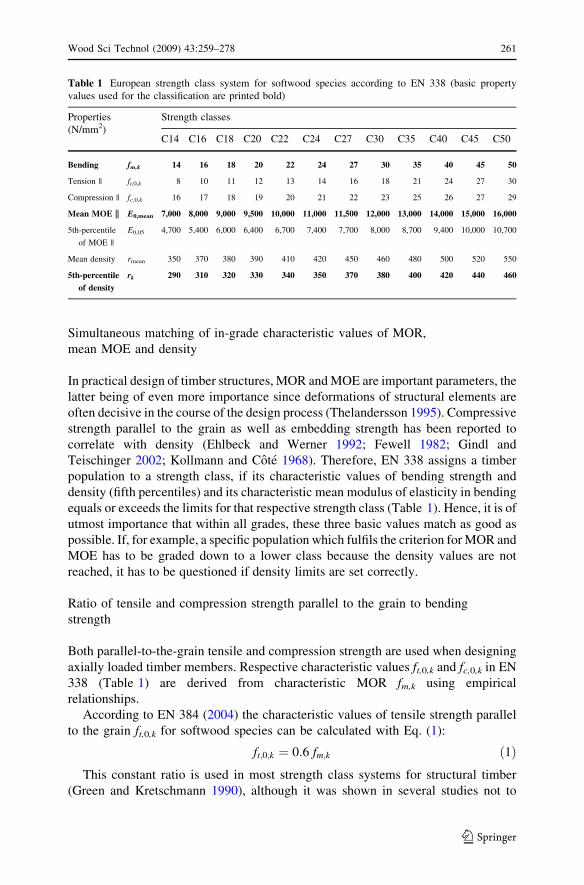
Table 1 European strength class system for softwood species according to EN 338 (basic property
values used for the classification are printed bold)
Properties
(N/mm2)
Strength classes
C14 C16 C18 C20 C22 C24 C27 C30 C35 C40 C45 C50
Bending fm,k 14 16 18 20 22 24 27 30 35 40 45 50
Tension || ft,0,k 8 10 11 12 13 14 16 18 21 24 27 30
Compression || fc,0,k 16 17 18 19 20 21 22 23 25 26 27 29
Mean MOE || E0,mean 7,000 8,000 9,000 9,500 10,000 11,000 11,500 12,000 13,000 14,000 15,000 16,000
5th-percentile
of MOE ||
E0,05 4,700 5,400 6,000 6,400 6,700 7,400 7,700 8,000 8,700 9,400 10,000 10,700
Mean density rmean 350 370 380 390 410 420 450 460 480 500 520 550
5th-percentile
of density
rk 290 310 320 330 340 350 370 380 400 420 440 460
Wood Sci Technol (2009) 43:259–278 261
123
be constant but rather to depend on timber quality. Burger and Glos (1997)
found a noticeable effect of both grading method and dimensions on the ft/fmratio. The ratio ft/fm rises with increasing timber quality and thus with increasing
strength. Burger and Glos (1997) reported a ft/fm ratio of 0.69 for the fifth
percentile level while the ratio on the 50th-percentile level was found to be 0.76.
In the course of their discussion of timber property relationships in Eurocode 5,
Green and Kretschmann (1989) compared ultimate bending strength and tensile
strength parallel to the grain for in-grade data resulting from tests of different
softwood species (Douglas fir, larch, Hemlock and Southern pine). For values of
ultimate tensile strength up to 55 N/mm2 the average ratio was ft,0,k/fm,k = 0.59.
Above that limit, the ratio increased slightly. The authors, however, suggested
retaining Eq. (1).
Furthermore, EN 384 gives Eq. (2) to derive the characteristic values of
compression strength parallel to the grain fc,0,k for softwood species from the
corresponding bending strength fm,k:
fc;0;k ¼ 5 fm;k� �0:45
ð2Þ
For in-grade tested Douglas fir-larch, Hem-fir and Southern pine, Green and
Kretschmann (1989) found the trend of the relationship to be virtually identical to
the data presented by Curry and Fewell (1977), which forms the basis of Eq. (2)
above. However, in earlier (Ylinen 1942) and recent (Ruli 2004) publications a
strong correlation between compression strength parallel to the grain and wood
density is reported.
Ratio of fifth percentiles and mean value of density and MOE
Since density correlates well with compression strength (parallel as well as
perpendicular to the grain) and embedding strength, respective characteristic values
can be derived from this basic property. Strength values normally are fifth
percentiles and thus these values have to be based in the fifth percentile of density.
In EN 338, the in-grade characteristic value of density is derived from the grade’s
mean value assuming a specific coefficient of variation (COV). The ratio of the
characteristic to the mean value of density given in EN 338 varies between 0.82 and
0.85 with an average of 0.84 (Table 1). This variation results from rounding. Former
versions of EN 384 explicitly assumed a constant ratio of 0.84 for softwood species,
which in case of a normally distributed sample is identical to a COV of 10%. Green
and Kretschmann (1989) reported an average ratio of 0.80 with a range of 0.78 to
0.83 for three major species groups (Douglas Fir-Larch, Hem-Fir and Southern
Pine). The average ratio for all species was 0.83.
Fifth percentile of MOE E0,05 is used in calculations where member stiffness
takes direct influence on member strength, e. g. overall structural stability, buckling
and lateral torsional stability. EN 384 and EN 338 assume a constant ratio of fifth
percentile (E0,05) and mean value (E0,mean) of MOE (Table 1):
262 Wood Sci Technol (2009) 43:259–278
123
E0;05=E0;mean ¼ 0:67 for softwood species ð3Þ
For infinite sized normally distributed samples, this fractile ratio corresponds to a
COV of 20%. Green and Kretschmann (1989) suggested to lower the ratio and to
make it a function of strength class.
Ratio of MOE in bending, tension and compression parallel to the grain
Most investigations on the ratio between the moduli of elasticity were carried out
with small clear specimens (Conners and Medvecz 1992). Clear specimens exhibit
identical tensile and compression MOE (Thunell 1941). Garfinkel (1973) developed
his wooden beam analysis on the assumption that the ratio of tension MOE to
compression MOE is between 1.00 and 1.05. Kollmann and Cote (1968) expected
the ratio to be approximately 1.00 for softwood. For sugar maple and basswood,
Schneider and Phillips (1991) found different parallel-to-the-grain MOE values in
bending, tension and compression. Burger and Glos (1995) showed that the MOE in
tension and in bending of full-size spruce structural timber, in contrast to small clear
specimens, depends on the type of load as well as on timber quality. The authors
evaluated test results of 147 European spruce specimens dimensioned 50/120 mm2
(54 specimens) and 60/105 mm2 (93 specimens). On average, bending MOE Em was
9% higher than the tensile MOE Et and the following regression Eq. (4) was
reported:
Em ¼ 90þ 1:077Et N=mm2� �
with R ¼ 0:94 ð4Þ
EN 338 does not make any difference in MOE depending on the type of loading
(bending, tension, compression) and gives one single value E0 (Table 1). If the
differences between Em, Et and Ec for timber in structural sizes actually are small,
assigning one single MOE value is a good solution, since the process of designing
timber structures can be kept simple.
Aim of the study
Correct property relationships are very important for the design of economic and
reliable timber structures. The objective of this study was to review some of these
property relationships based on recently compiled large data sets as a contribution
for a future revision of the grading standards. Based on several series of tests with
Norway spruce structural timber, the following property relationships were
analysed:
• relationship of bending strength and bending MOE,
• simultaneous matching of in-grade basic characteristic values MOR fm,k, mean
MOE (derived from bending tests) E0,mean and density rk,
• ratio of characteristic tensile and compression strength parallel to the grain ft,0,kand fc,0,k to characteristic bending strength fm,k,
• ratio of 5th-percentiles and mean values of density r and MOE E0,
• ratio of MOE in bending Em, tension Et,0 and compression Ec,0.
Wood Sci Technol (2009) 43:259–278 263
123
Materials and methods
Data sets
Three data sets from different extensive research projects, referenced (1) to (3)
served as data base:
1. In the early 1990s a test program was launched at the ETH Zurich, which aimed
to evaluate the mechanical properties of Swiss grown Norway spruce structural
timber (Steiger 1995a, b, 1996).
2. The second source of data is a research project started after the extraordinarily
violent winter storm ‘Lothar’ in Central Europe in December 1999, aiming at
collecting more information regarding the extent and location, the causes, the
detection, and the consequences of wind-induced compression failures (Arnold
and Steiger 2007). Property relationship analysis of this data source, however,
was only carried out using data resulting from reference tests on samples
without any storm damages.
3. A third source of data is a Ph.D. thesis (Mischler-Schrepfer 2000) dealing with
the influence of long-term log storage in the forest on the mechanical properties
of timber.
In order to get large sample sizes, the data taken from the above mentioned
studies were pooled for the different analysis steps (Tables 2, 3, 4):
(A) Data set (A) (Table 2) consisted of bending test data (MOE Em and MOR fm) of
696 specimens of cross-section b/h (mm): 60/120, 80/160, 100/160 and 95/110.
(B) In data set (B) (Table 3) results from 796 tension tests (MOE Et,0 and tension
strength ft,0) were pooled. The dimensions of the specimens covered a broad
range from plank-type specimens to squared timber.
(C) Due to the fact that compression tests were not treated with the same priority
within project (1), the compression data pool (C) (Table 4) was smaller
(ntot = 152) than data sets (A) and (B). However, since variation of test values
is smaller compared to the tension and bending tests, this is no problem for the
data analysis.
Table 2 Data pool (A): specimens tested in edgewise bending (see Fig. 2a)
Source Cross-section
b/h (mm)
Sample
size n
Span ‘ (mm) Distance between
loading points
‘ - 2a (mm)
Gauge length
‘1 (mm)
1 60/120 53 2,160 = 18h 720 = 6h 500 = 4.17h
80/160 and 100/160 244a 2,700 = 16.88h 900 = 5.62h 600 = 3.75h
80/160 36 2,760 = 17.25h 920 = 5.75h 600 = 3.75h
2 95/110 363 1,980 = 18h 660 = 6h 550 = 5h
ntot 696
EN 408 specifications 18h 6h 5h
a Proof loaded sample with 214 MOE and density values and 88 bending strength values
264 Wood Sci Technol (2009) 43:259–278
123
(D) The data needed for the comparison of MOE in bending, tension and
compression were collected in the course of interaction tests on 80/160 mm
beams simultaneously loaded by a bending moment and a normal (tension or
compression) force (Steiger and Fontana 2005) being part of project (1)
(Steiger 1995b). Sample size amounted to 109 pairs of values (Em; Et) and 81
pairs of values (Em; Ec). All specimens were cut according to the sawing
pattern shown in Fig. 1.
Table 3 Data pool (B): specimens tested in tension parallel to the grain (see Fig. 2b)
Source Cross-section b/h (mm) Sample size n Free length ‘F (mm) Gauge length ‘M (mm)
1 10/180 7 910–1,220 = 5.06–6.78h 900 = 5h
20/180 21 1,640 = 9.11h 900 = 5h
30/180 50 1,640 = 9.11h 900 = 5h
40/180 21 1,640 = 9.11h 900 = 5h
30/150 34 1,620 = 10.80h 900 = 6h
80/80 40 1,200 = 15h 900 = 11.25h
80/120 46 1,200 = 10h 900 = 7.50h
80/160 19 1,100 = 6.88h 900 = 5.63h
80/180 21 1,200 = 6.67h 900 = 5h
60/180 42 1,200 = 6.67h 900 = 5h
2 45/150 104 4,300 = 28.67h 750 = 5h
3 29/150 126 3,300 = 22h 750 = 5h
45/150 156 3,300 = 22h 750 = 5h
49/150 109 3,300 = 22h 750 = 5h
ntot 796
EN 408 specifications 9h 5h
Table 4 Data pool (C): specimens tested in compression parallel to the grain (see Fig. 2c)
Source Cross-section
b/h (mm)
Sample
size n
Length
‘ (mm)
Free length
0.5‘ (mm)
Gauge length
‘M (mm)
1 60/120 46 1,000 = 8.33h 500 = 8.33b 600 = 10b
80/160 19 1,500 = 9.38h 750 = 9.38b 900 = 11.25b
100/160 40 1,500 = 9.38h 750 = 7.50b 900 = 9b
140/240 47 1,500 = 6.25h 750 = 5.36b 700 = 5b
ntot 152
EN 408 specifications: – 6b 4b
Wood Sci Technol (2009) 43:259–278 265
123
Test procedures
All three studies (1)–(3) used similar test procedures (Tables 2, 3, 4). Testing was
carried out in accordance with EN 408 (2003) and the characteristic values were
determined according to EN 384 (2004). The critical section was always positioned
in such way that it was subjected to maximum load.
Moisture content was measured by the electric resistance method. Density was
determined from the mass and the volume of the whole specimen. The ‘‘global’’
density values were adjusted to the density of small defect-free prisms (ISO 3131
1975) by dividing by 1.05 given in EN 384.
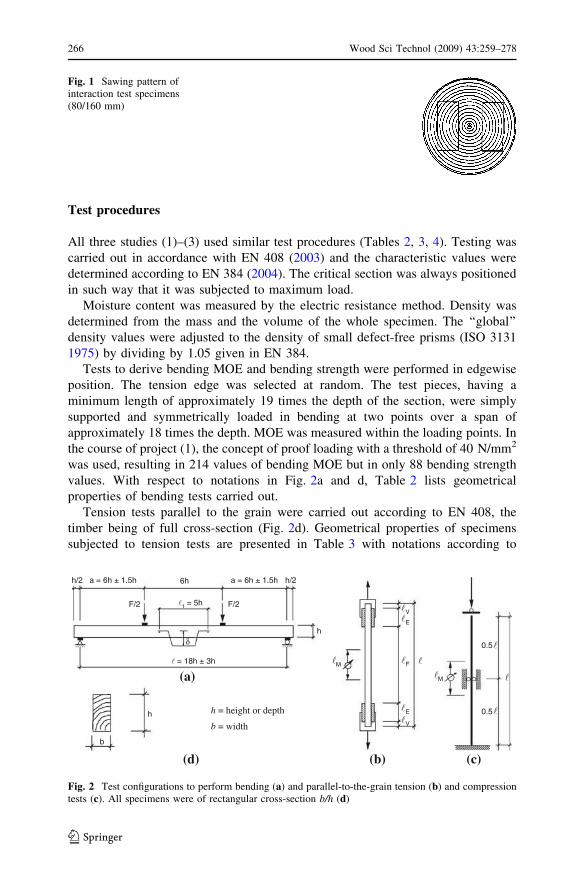
Tests to derive bending MOE and bending strength were performed in edgewise
position. The tension edge was selected at random. The test pieces, having a
minimum length of approximately 19 times the depth of the section, were simply
supported and symmetrically loaded in bending at two points over a span of
approximately 18 times the depth. MOE was measured within the loading points. In
the course of project (1), the concept of proof loading with a threshold of 40 N/mm2
was used, resulting in 214 values of bending MOE but in only 88 bending strength
values. With respect to notations in Fig. 2a and d, Table 2 lists geometrical
properties of bending tests carried out.
Tension tests parallel to the grain were carried out according to EN 408, the
timber being of full cross-section (Fig. 2d). Geometrical properties of specimens
subjected to tension tests are presented in Table 3 with notations according to
Fig. 1 Sawing pattern ofinteraction test specimens(80/160 mm)
a = 6h ± 1.5h 6h
l1 = 5h
δ
l = 18h ± 3h
h
h/2 h/2
F/2F/2
a = 6h ± 1.5h
(a)
b
h
(d)
h = height or depth
b = width
lV
lE
llM
lF
lE
lV
(b)
0.5l
l
0.5l
lM
(c)
Fig. 2 Test configurations to perform bending (a) and parallel-to-the-grain tension (b) and compressiontests (c). All specimens were of rectangular cross-section b/h (d)
266 Wood Sci Technol (2009) 43:259–278
123
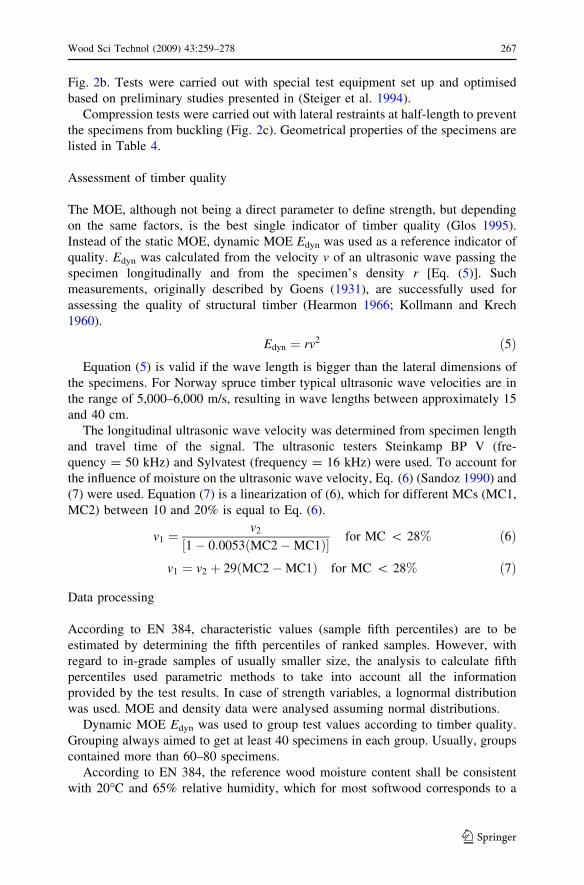
Fig. 2b. Tests were carried out with special test equipment set up and optimised
based on preliminary studies presented in (Steiger et al. 1994).
Compression tests were carried out with lateral restraints at half-length to prevent
the specimens from buckling (Fig. 2c). Geometrical properties of the specimens are
listed in Table 4.
Assessment of timber quality
The MOE, although not being a direct parameter to define strength, but depending
on the same factors, is the best single indicator of timber quality (Glos 1995).
Instead of the static MOE, dynamic MOE Edyn was used as a reference indicator of
quality. Edyn was calculated from the velocity v of an ultrasonic wave passing the
specimen longitudinally and from the specimen’s density r [Eq. (5)]. Such
measurements, originally described by Goens (1931), are successfully used for
assessing the quality of structural timber (Hearmon 1966; Kollmann and Krech
1960).
Edyn ¼ rv2 ð5Þ
Equation (5) is valid if the wave length is bigger than the lateral dimensions of
the specimens. For Norway spruce timber typical ultrasonic wave velocities are in
the range of 5,000–6,000 m/s, resulting in wave lengths between approximately 15
and 40 cm.
The longitudinal ultrasonic wave velocity was determined from specimen length
and travel time of the signal. The ultrasonic testers Steinkamp BP V (fre-
quency = 50 kHz) and Sylvatest (frequency = 16 kHz) were used. To account for
the influence of moisture on the ultrasonic wave velocity, Eq. (6) (Sandoz 1990) and
(7) were used. Equation (7) is a linearization of (6), which for different MCs (MC1,
MC2) between 10 and 20% is equal to Eq. (6).
v1 ¼v2
1� 0:0053 MC2�MC1ð Þ½ �for MC \ 28% ð6Þ
v1 ¼ v2 þ 29 MC2�MC1ð Þ for MC \ 28% ð7Þ
Data processing
According to EN 384, characteristic values (sample fifth percentiles) are to be
estimated by determining the fifth percentiles of ranked samples. However, with
regard to in-grade samples of usually smaller size, the analysis to calculate fifth
percentiles used parametric methods to take into account all the information
provided by the test results. In case of strength variables, a lognormal distribution
was used. MOE and density data were analysed assuming normal distributions.
Dynamic MOE Edyn was used to group test values according to timber quality.
Grouping always aimed to get at least 40 specimens in each group. Usually, groups
contained more than 60–80 specimens.
According to EN 384, the reference wood moisture content shall be consistent
with 20�C and 65% relative humidity, which for most softwood corresponds to a
Wood Sci Technol (2009) 43:259–278 267
123
MC of about 12%. For samples not tested at reference conditions but having a mean
MC in the range of 10 to 18%, adjustment of lower fifth percentile or mean values to
12% MC was made according to EN 384 as follows:
• for bending and tensile strength: no adjustment
• for compression parallel to the grain strength: 3% change for every percentage
point difference in MC
• for MOE: 2% change for every percentage point difference in MC
The adjustments were carried out in a way that the above-quoted properties
increase if the data are adjusted from a higher MC, and vice versa.
For bending strength, the reference dimensions correspond to a depth (height) h
of 150 mm and to the standard test set-up proportions of four point bending with
loads applied in the third points and an overall span of 18 times the specimen
depth h. Tensile strength is given for a reference width h of 150 mm. For samples
not tested at reference conditions, EN 384 gives adjustment factors. Size
adjustment to 150 mm depth or width can be made by dividing the fifth percentile
by kh [Eq. (8)]:
kh ¼150
h
� �0:2
ð8Þ
Tensile strength data resulting from tests with different lengths ‘et can be
adjusted to reference length ‘es by using Eq. (9) with an exponent of m‘ = 0.15.
k‘ ¼‘es‘et
� �m‘
ð9Þ
Results and discussion
Timber quality
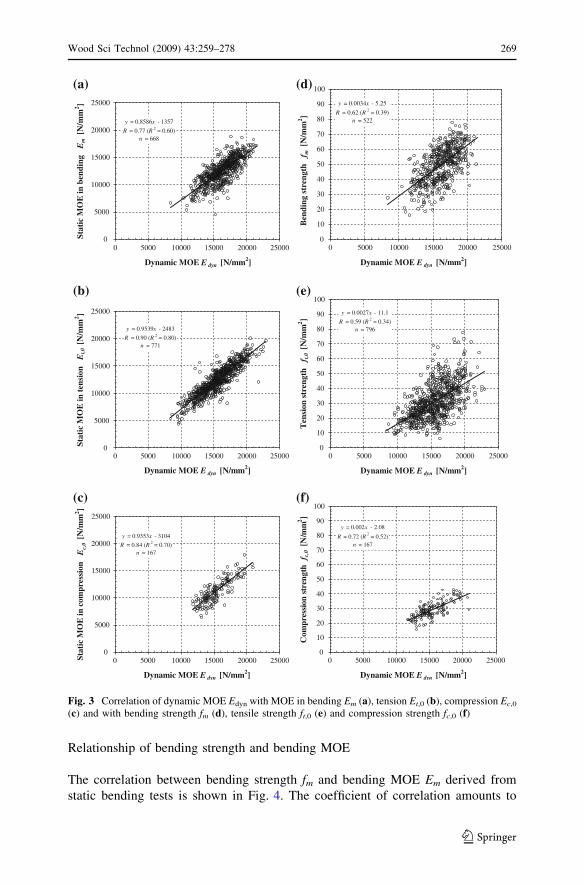
Dynamic MOE Edyn, which can be measured non-destructively, is a good
indicator of actual stiffness (MOE) and strength of timber in bending, tension
and compression as shown in Fig. 3. Figures 3a–c confirm a strong correlation
(R = 0.77–0.90) between static and dynamic MOE. Hence, it can be concluded
that MOE can be derived by a much simpler dynamic measurement together
with density instead of carrying out static bending tests. Regarding machine
grading, dynamically measuring MOE provides the only possibility of grading
timber members with thickness of more than 75 mm, since most stress grading
machines with static MOE measurements are limited to member thicknesses up
to 75 mm.
According to Fig. 3d–f the correlation between dynamic MOE and bending,
parallel-to-the-grain compression and tensile strength is weaker (R = 0.59–0.72).
However, the correlation still is strong enough to use dynamic MOE as one of the
indicators for timber strength when equipping grading machines or when assigning
experimental data to given strength classes.
268 Wood Sci Technol (2009) 43:259–278
123
Relationship of bending strength and bending MOE
The correlation between bending strength fm and bending MOE Em derived from
static bending tests is shown in Fig. 4. The coefficient of correlation amounts to
y = 0.8586x - 1357
R = 0.77 (R2 = 0.60)
n = 668
0
5000
10000
15000
20000
25000
Dynamic MOE E dyn [N/mm2]
Dynamic MOE E dyn [N/mm2]
Dynamic MOE E dyn [N/mm2] Dynamic MOE E dyn [N/mm
2]
Dynamic MOE E dyn [N/mm2]
Sta
tic
MO
E i
n b
end
ing
E
m [
N/m
m2]
(a)
y = 0.0034x - 5.25
R = 0.62 (R2 = 0.39)
n = 522
0
10
20
30
40
50
60
70
80
90
100
Ben
din
g s
tren
gth
f
m [
N/m
m2]
(d)
y = 0.9539x - 2483
R = 0.90 (R2 = 0.80)
n = 771
0
5000
10000
15000
20000
25000
Sta
tic
MO
E i
n t
ensi
on
E
t,0
[N
/mm
2]
(b)
y = 0.0027x - 11.1
R = 0.59 (R2 = 0.34)
n = 796
0
10
20
30
40
50
60
70
80
90
100T
ensi
on
str
ength
f
t,0
[N
/mm
2]
(e)
y = 0.9353x - 3104
R = 0.84 (R2 = 0.70)
n = 167
0
5000
10000
15000
20000
25000
Sta
tic
MO
E i
n c
om
pre
ssio
n
Ec,
0 [
N/m
m2]
(c)
y = 0.002x - 2.08
R = 0.72 (R2 = 0.52)
n = 167
0
10
20
30
40
50
60
70
80
90
100
0
Co
mp
ress
ion
str
eng
th
f c,0
[N/m
m2]
(f)
Dynamic MOE E dyn [N/mm2]
250002000015000100005000
0 250002000015000100005000 0 250002000015000100005000
0 250002000015000100005000
0 250002000015000100005000 0 250002000015000100005000
Fig. 3 Correlation of dynamic MOE Edyn with MOE in bending Em (a), tension Et,0 (b), compression Ec,0
(c) and with bending strength fm (d), tensile strength ft,0 (e) and compression strength fc,0 (f)
Wood Sci Technol (2009) 43:259–278 269
123
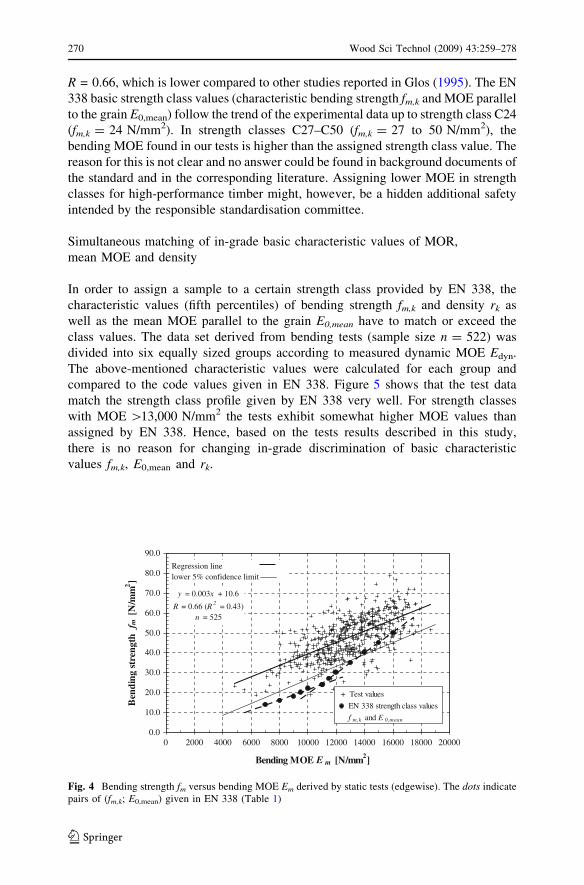
R = 0.66, which is lower compared to other studies reported in Glos (1995). The EN
338 basic strength class values (characteristic bending strength fm,k and MOE parallel
to the grain E0,mean) follow the trend of the experimental data up to strength class C24
(fm,k = 24 N/mm2). In strength classes C27–C50 (fm,k = 27 to 50 N/mm2), the
bending MOE found in our tests is higher than the assigned strength class value. The
reason for this is not clear and no answer could be found in background documents of
the standard and in the corresponding literature. Assigning lower MOE in strength
classes for high-performance timber might, however, be a hidden additional safety
intended by the responsible standardisation committee.
Simultaneous matching of in-grade basic characteristic values of MOR,
mean MOE and density
In order to assign a sample to a certain strength class provided by EN 338, the
characteristic values (fifth percentiles) of bending strength fm,k and density rk as
well as the mean MOE parallel to the grain E0,mean have to match or exceed the
class values. The data set derived from bending tests (sample size n = 522) was
divided into six equally sized groups according to measured dynamic MOE Edyn.
The above-mentioned characteristic values were calculated for each group and
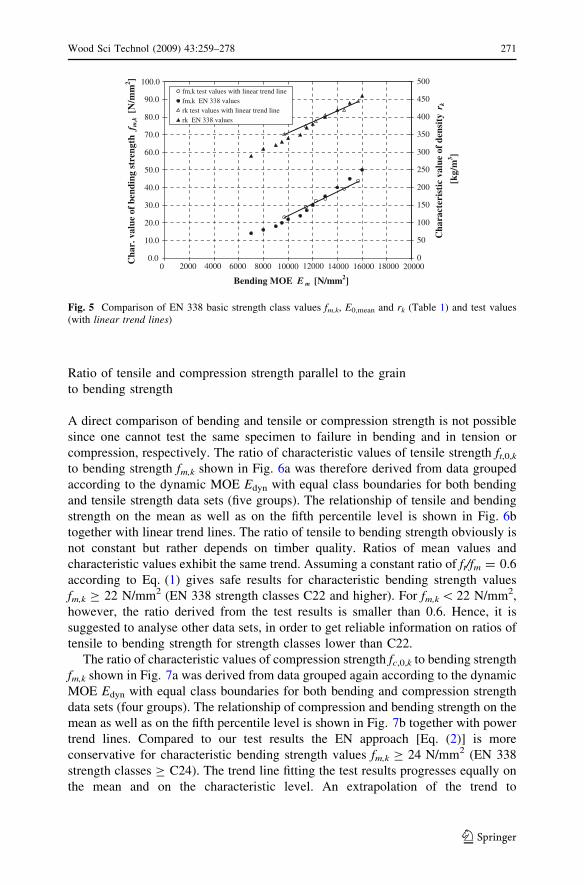
compared to the code values given in EN 338. Figure 5 shows that the test data
match the strength class profile given by EN 338 very well. For strength classes
with MOE [13,000 N/mm2 the tests exhibit somewhat higher MOE values than
assigned by EN 338. Hence, based on the tests results described in this study,
there is no reason for changing in-grade discrimination of basic characteristic
values fm,k, E0,mean and rk.
y = 0.003x + 10.6
R = 0.66 (R2
= 0.43)
n = 525
0.0
10.0
20.0
30.0
40.0
50.0
60.0
70.0
80.0
90.0
0
Bending MOE E m [N/mm2]
Ben
din
g s
tren
gth
f m
[N
/mm
2]
Regression line
lower 5% confidence limit
+ Test values
EN 338 strength class values
f m,k and E 0,mean
2000018000160001400012000100008000600040002000
Fig. 4 Bending strength fm versus bending MOE Em derived by static tests (edgewise). The dots indicatepairs of (fm,k; E0,mean) given in EN 338 (Table 1)
270 Wood Sci Technol (2009) 43:259–278
123
Ratio of tensile and compression strength parallel to the grain
to bending strength
A direct comparison of bending and tensile or compression strength is not possible
since one cannot test the same specimen to failure in bending and in tension or
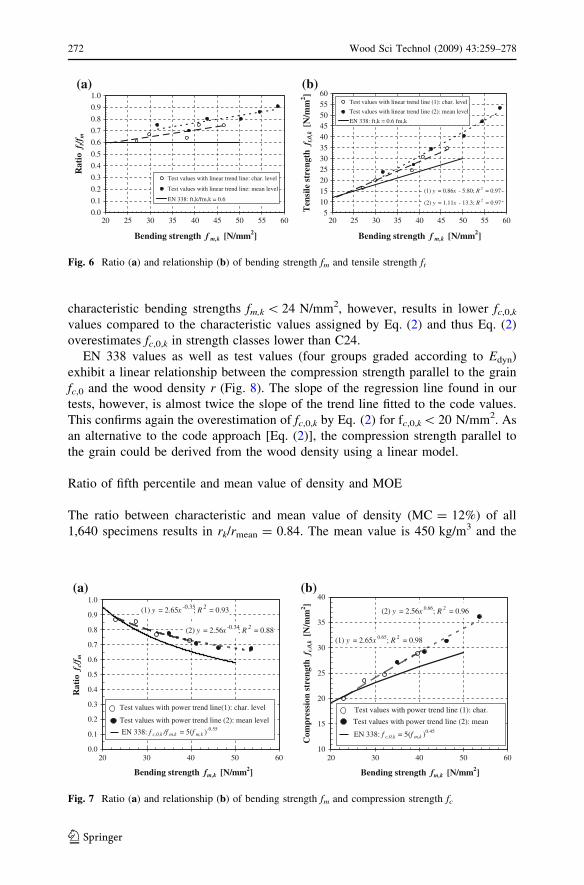
compression, respectively. The ratio of characteristic values of tensile strength ft,0,kto bending strength fm,k shown in Fig. 6a was therefore derived from data grouped
according to the dynamic MOE Edyn with equal class boundaries for both bending
and tensile strength data sets (five groups). The relationship of tensile and bending
strength on the mean as well as on the fifth percentile level is shown in Fig. 6b
together with linear trend lines. The ratio of tensile to bending strength obviously is
not constant but rather depends on timber quality. Ratios of mean values and
characteristic values exhibit the same trend. Assuming a constant ratio of ft/fm = 0.6
according to Eq. (1) gives safe results for characteristic bending strength values
fm,k C 22 N/mm2 (EN 338 strength classes C22 and higher). For fm,k\ 22 N/mm2,
however, the ratio derived from the test results is smaller than 0.6. Hence, it is
suggested to analyse other data sets, in order to get reliable information on ratios of
tensile to bending strength for strength classes lower than C22.
The ratio of characteristic values of compression strength fc,0,k to bending strength
fm,k shown in Fig. 7a was derived from data grouped again according to the dynamic
MOE Edyn with equal class boundaries for both bending and compression strength
data sets (four groups). The relationship of compression and bending strength on the
mean as well as on the fifth percentile level is shown in Fig. 7b together with power
trend lines. Compared to our test results the EN approach [Eq. (2)] is more
conservative for characteristic bending strength values fm,k C 24 N/mm2 (EN 338
strength classes C C24). The trend line fitting the test results progresses equally on
the mean and on the characteristic level. An extrapolation of the trend to
0.0
10.0
20.0
30.0
40.0
50.0
60.0
70.0
80.0
90.0
100.0
0
Bending MOE E m [N/mm2]
Ch
ar.
va
lue
of
ben
din
g s
tren
gth
f m
,k [
N/m
m2]
0
50
100
150
200
250
300
350
400
450
500
Ch
ara
cter
isti
c v
alu
e o
f d
ensi
ty r
k
[kg
/m3]
fm,k test values with linear trend line
fm,k EN 338 values
rk test values with linear trend line
rk EN 338 values
2000018000160001400012000100008000600040002000
Fig. 5 Comparison of EN 338 basic strength class values fm,k, E0,mean and rk (Table 1) and test values(with linear trend lines)
Wood Sci Technol (2009) 43:259–278 271
123
characteristic bending strengths fm,k\ 24 N/mm2, however, results in lower fc,0,kvalues compared to the characteristic values assigned by Eq. (2) and thus Eq. (2)
overestimates fc,0,k in strength classes lower than C24.
EN 338 values as well as test values (four groups graded according to Edyn)
exhibit a linear relationship between the compression strength parallel to the grain
fc,0 and the wood density r (Fig. 8). The slope of the regression line found in our
tests, however, is almost twice the slope of the trend line fitted to the code values.
This confirms again the overestimation of fc,0,k by Eq. (2) for fc,0,k\ 20 N/mm2. As
an alternative to the code approach [Eq. (2)], the compression strength parallel to
the grain could be derived from the wood density using a linear model.
Ratio of fifth percentile and mean value of density and MOE
The ratio between characteristic and mean value of density (MC = 12%) of all
1,640 specimens results in rk/rmean = 0.84. The mean value is 450 kg/m3 and the
0.0
0.1
0.2
0.3
0.4
0.5
0.6
0.7
0.8
0.9
1.0
20
Bending strength f m,k [N/mm2]
Ra
tio f t
/fm
Test values with linear trend line: char. level
Test values with linear trend line: mean level
EN 338: ft,k/fm,k = 0.6
(1) y = 0.86x - 5.80; R2
= 0.97
(2) y = 1.11x - 13.3; R2
= 0.97
5
10
15
20
25
30
35
40
45
50
55
60
Bending strength f m,k [N/mm2]
Ten
sile
str
ength
f t
,0,k
[N
/mm
2]
Test values with linear trend line (1): char. level
Test values with linear trend line (2): mean level
EN 338: ft,k = 0.6 fm,k
6055504540353025 20 6055504540353025
(a) (b)
Fig. 6 Ratio (a) and relationship (b) of bending strength fm and tensile strength ft
(2) y = 2.56x-0.34
; R2
= 0.88
(1) y = 2.65x-0.35
; R2
= 0.93
0.0
0.1
0.2
0.3
0.4
0.5
0.6
0.7
0.8
0.9
1.0
Ra
tio f c
/fm
EN 338: f c,0,k /f m,k = 5(f m,k )-0.55
Test values with power trend line(1): char. level
Test values with power trend line (2): mean level
(2) y = 2.56x0.66
; R2
= 0.96
(1) y = 2.65x0.65
; R2
= 0.98
10
15
20
25
30
35
40
20 30 40 50 6020 30 40 50 60
Bending strength fm,k [N/mm2]Bending strength fm,k [N/mm
2]
Co
mp
ress
ion
str
ength
f c
,0,k
[N
/mm
2]
EN 338: f c,0,k = 5(f m,k )0.45
Test values with power trend line (1): char.
Test values with power trend line (2): mean
(a) (b)
Fig. 7 Ratio (a) and relationship (b) of bending strength fm and compression strength fc
272 Wood Sci Technol (2009) 43:259–278
123
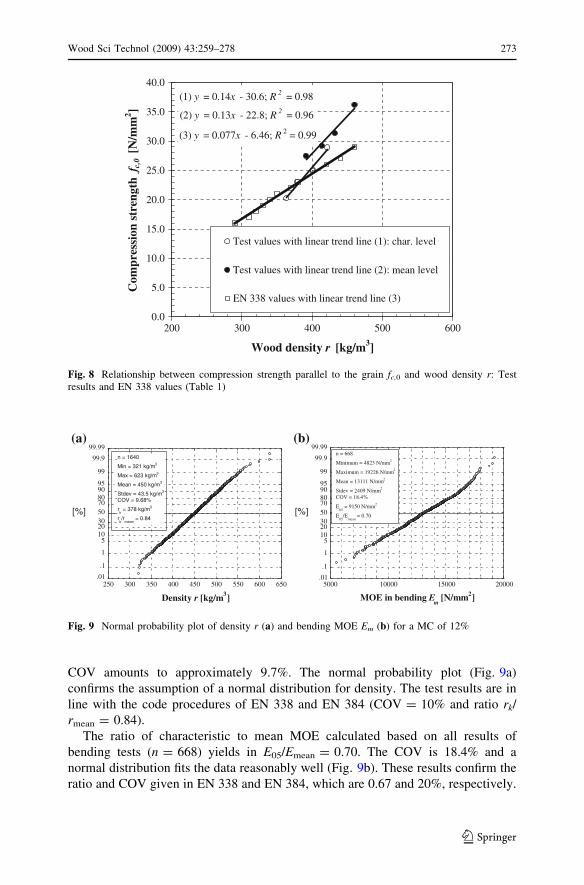
COV amounts to approximately 9.7%. The normal probability plot (Fig. 9a)
confirms the assumption of a normal distribution for density. The test results are in
line with the code procedures of EN 338 and EN 384 (COV = 10% and ratio rk/
rmean = 0.84).
The ratio of characteristic to mean MOE calculated based on all results of
bending tests (n = 668) yields in E05/Emean = 0.70. The COV is 18.4% and a
normal distribution fits the data reasonably well (Fig. 9b). These results confirm the
ratio and COV given in EN 338 and EN 384, which are 0.67 and 20%, respectively.
(3) y = 0.077x - 6.46; R2 = 0.99
(2) y = 0.13x - 22.8; R2
= 0.96
(1) y = 0.14x - 30.6; R2
= 0.98
0.0
5.0
10.0
15.0
20.0
25.0
30.0
35.0
40.0
200 300 400 500 600
Wood density r [kg/m3]
Co
mp
ress
ion
str
ength
f c
,0 [
N/m
m2]
Test values with linear trend line (1): char. level
Test values with linear trend line (2): mean level
EN 338 values with linear trend line (3)
Fig. 8 Relationship between compression strength parallel to the grain fc,0 and wood density r: Testresults and EN 338 values (Table 1)
250 300 350 400 450 500 550 600 650.01
.1
1
5102030
50
70809095
99
99.9
99.99
Density r [kg/m3]
[%]
n = 1640
Min = 321 kg/m3
Max = 623 kg/m3
Mean = 450 kg/m3
Stdev = 43.5 kg/m3
COV = 9.68%
rk = 378 kg/m
3
rk/r
mean = 0.84
5000 10000 15000 20000.01
.1
1
510
2030
50
7080
9095
99
99.9
99.99
MOE in bending Em
[N/mm2]
[%]
n = 668
Minimum = 4823 N/mm2
Maximum = 19226 N/mm2
Mean = 13111 N/mm2
Stdev = 2409 N/mm2
COV = 18.4%
E05
= 9150 N/mm2
E05
/Emean
= 0.70
(a) (b)
Fig. 9 Normal probability plot of density r (a) and bending MOE Em (b) for a MC of 12%
Wood Sci Technol (2009) 43:259–278 273
123
Ratio of MOE in bending, tension and compression
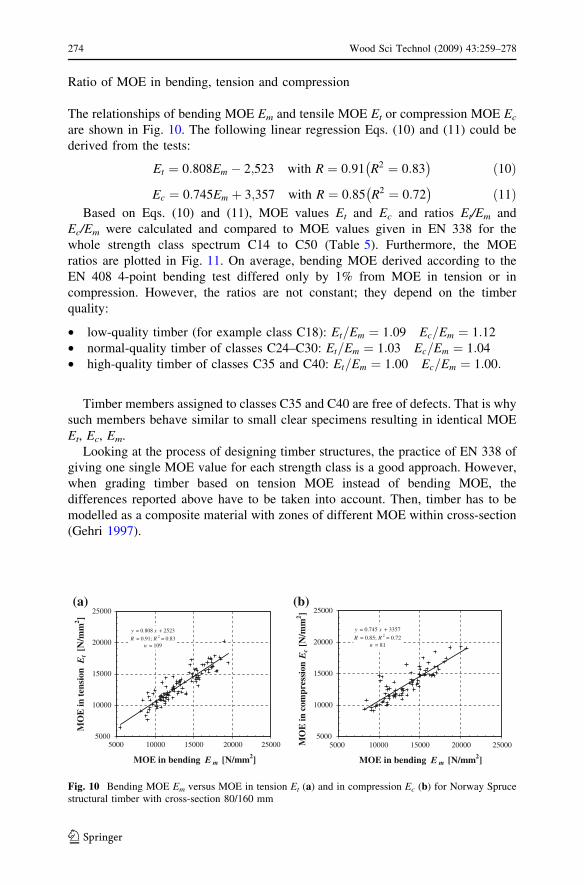
The relationships of bending MOE Em and tensile MOE Et or compression MOE Ec
are shown in Fig. 10. The following linear regression Eqs. (10) and (11) could be
derived from the tests:
Et ¼ 0:808Em � 2;523 with R ¼ 0:91 R2 ¼ 0:83� �
ð10Þ
Ec ¼ 0:745Em þ 3;357 with R ¼ 0:85 R2 ¼ 0:72� �
ð11Þ
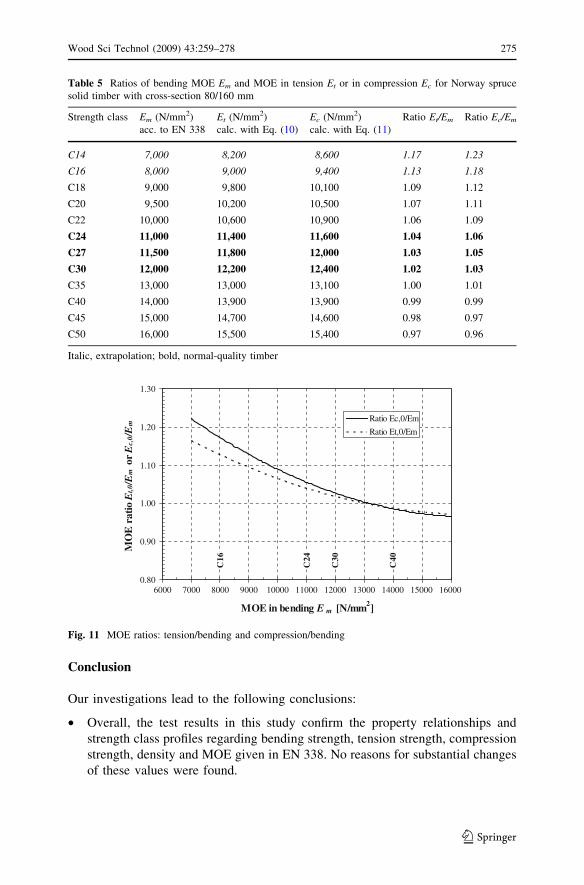
Based on Eqs. (10) and (11), MOE values Et and Ec and ratios Et/Em and
Ec/Em were calculated and compared to MOE values given in EN 338 for the
whole strength class spectrum C14 to C50 (Table 5). Furthermore, the MOE
ratios are plotted in Fig. 11. On average, bending MOE derived according to the
EN 408 4-point bending test differed only by 1% from MOE in tension or in
compression. However, the ratios are not constant; they depend on the timber
quality:
• low-quality timber (for example class C18): Et=Em ¼ 1:09 Ec=Em ¼ 1:12• normal-quality timber of classes C24–C30: Et=Em ¼ 1:03 Ec=Em ¼ 1:04• high-quality timber of classes C35 and C40: Et=Em ¼ 1:00 Ec=Em ¼ 1:00:
Timber members assigned to classes C35 and C40 are free of defects. That is why
such members behave similar to small clear specimens resulting in identical MOE
Et, Ec, Em.
Looking at the process of designing timber structures, the practice of EN 338 of
giving one single MOE value for each strength class is a good approach. However,
when grading timber based on tension MOE instead of bending MOE, the
differences reported above have to be taken into account. Then, timber has to be
modelled as a composite material with zones of different MOE within cross-section
(Gehri 1997).
y = 0.808 x + 2523
R = 0.91; R2 = 0.83
n = 109
5000
10000
15000
20000
25000
5000
MOE in bending E m [N/mm2]
MO
E i
n t
ensi
on
E
t[N
/mm
2]
MO
E i
n c
om
pre
ssio
n E
c[N
/mm
2]
y = 0.745 x + 3357
R = 0.85; R2 = 0.72
n = 81
5000
10000
15000
20000
25000
5000
MOE in bending E m [N/mm2]
2500020000150001000025000200001500010000
(a) (b)
Fig. 10 Bending MOE Em versus MOE in tension Et (a) and in compression Ec (b) for Norway Sprucestructural timber with cross-section 80/160 mm
274 Wood Sci Technol (2009) 43:259–278
123
Conclusion
Our investigations lead to the following conclusions:
• Overall, the test results in this study confirm the property relationships and
strength class profiles regarding bending strength, tension strength, compression
strength, density and MOE given in EN 338. No reasons for substantial changes
of these values were found.
Table 5 Ratios of bending MOE Em and MOE in tension Et or in compression Ec for Norway spruce
solid timber with cross-section 80/160 mm
Strength class Em (N/mm2)
acc. to EN 338
Et (N/mm2)
calc. with Eq. (10)
Ec (N/mm2)
calc. with Eq. (11)
Ratio Et/Em Ratio Ec/Em
C14 7,000 8,200 8,600 1.17 1.23
C16 8,000 9,000 9,400 1.13 1.18
C18 9,000 9,800 10,100 1.09 1.12
C20 9,500 10,200 10,500 1.07 1.11
C22 10,000 10,600 10,900 1.06 1.09
C24 11,000 11,400 11,600 1.04 1.06
C27 11,500 11,800 12,000 1.03 1.05
C30 12,000 12,200 12,400 1.02 1.03
C35 13,000 13,000 13,100 1.00 1.01
C40 14,000 13,900 13,900 0.99 0.99
C45 15,000 14,700 14,600 0.98 0.97
C50 16,000 15,500 15,400 0.97 0.96
Italic, extrapolation; bold, normal-quality timber
0.80
0.90
1.00
1.10
1.20
1.30
6000 7000 8000 9000 10000 11000 12000 13000 14000 15000 16000
MOE in bending E m [N/mm2]
MO
E r
ati
o E
t,0/E
m o
r E
c,0
/Em
Ratio Ec,0/Em
Ratio Et,0/Em
C1
6
C2
4
C3
0
C4
0
Fig. 11 MOE ratios: tension/bending and compression/bending
Wood Sci Technol (2009) 43:259–278 275
123
• The good correlation between dynamic MOE and static MOE (bending, tension,
compression) as well as strength (MOR, tension and compression parallel to the
grain) recommends using ultrasonic wave speed together with density as an
indicator of timber quality.
• The coefficient of correlation of bending strength and bending MOE derived
from static bending tests amounts to R = 0.66 and is consistent with other
studies and confirms limitation of strength prediction.
• Tensile to bending strength ratio was found not to be constant, but to depend on
timber quality. Ratios for characteristic bending strengths fm,k C 22 N/mm2 (EN
338 classes above C22) amounted to 0.6–0.75 but were\ 0.6 for lower quality
timber.
• The relationship between the characteristic values of compression and bending
strength parallel to the grain given in EN 384 [Eq. (2)] is more conservative for
higher quality timber than our test results indicate. As an alternative to the
existing approach, the compression strength parallel to the grain could be
derived from wood density using a linear model. Doing so, the importance of
density as a classification criterion would be increased.
• The calculated fractile ratios for density rk/rmean and for MOE parallel to the
grain E0,05/E0,mean were 0.84 and 0.70. These values correspond well to the
ratios given in EN 384 and EN 338 (0.84 and 0.67) assuming a COV of 10% and
20%, respectively.
• The ratios of MOE of Norway spruce structural timber with a cross-section of
80/160 mm in tension, compression and bending differ depending on timber
quality. Differences up to 9% between tensile and bending MOE were found.
Regarding compression MOE, the maximum difference to the bending MOE
was 12%. For normal-quality timber of classes C24–C30 (mainly used in
practice), the differences between Et, Ec and Em are not more than 6%. With
regard to a simple design process, the current practice of using one single MOE
value should therefore not be changed. However, when assigning timber
populations to strength classes based on tension MOE instead of bending MOE,
the differences have to be taken into account. In this case, timber must be
regarded as a composite material having zones of different MOE within cross-
section.
References
Arnold M, Steiger R (2007) The influence of wind-induced compression failures on the mechanical
properties of spruce structural timber. Mater Struct 40(1):57–68
Burger N, Glos P (1995) Relationship of moduli of elasticity in tension and in bending of solid timber.
Paper 28-5-2. In: Proceedings of CIB-W18 Meeting 28, April 1995, Copenhagen, Denmark
Burger N, Glos P (1997) Strength relationships in structural timber subjected to bending and tension.
Paper 30-6-1. In: Proceedings of CIB-W18 Meeting 30, August 1997, Vancouver, Canada
Conners TE, Medvecz PJ (1992) Wood as a bimodular material. Wood Fiber Sci 24(4):413–423
276 Wood Sci Technol (2009) 43:259–278
123
Curry WT, Fewell AR (1977) The relations between the ultimate tension and ultimate compression
strength of timber and its modulus of elasticity. Research Report CP22/77, Princes Risborough
Laboratory, Building Research Establishment BRE, Buckinghamshire
Ehlbeck J, Werner H (1992) Coniferous and deciduous embedding strength for dowel-type fasteners.
Paper 25-7-2. in: Proceedings of CIB-W18 Meeting 25, August 1992, Ahus, Sweden
EN 338 (2003) Structural timber–strength classes. Comite Europeen de Normalisation CEN
EN 408 (2003) Timber structures—structural timber and glued laminated timber—determination of some
physical and mechanical properties. Comite Europeen de Normalisation CEN
EN 384 (2004) Structural timber : determination of characteristic values of mechanical properties and
density. Comite Europeen de Normalisation CEN
Fewell AR (1982) Machine Stress Grading of Timber in the United-Kingdom. Holz Roh Werkst
40(12):455–459
Garfinkel G (1973) Wood engineering. Southern Forest Products Association, New Orleans
Gehri E (1997) Timber as a natural composite: Explanation of some peculiarities in the mechanical
behaviour. Paper 30-6-3. in: Proceedings of CIB-W18 Meeting 30, August 1997, Vancouver,
Canada
Gindl W, Teischinger A (2002) Axial compression strength of Norway spruce related to structural
variability and lignin content. Composites Part a. Appl Sci Manufact 33(12):1623–1628
Glos P (1995) Step A6: Festigkeitssortierung. In: Holzbauwerke nach Eurocode 5, Step 1: Bemessung und
Baustoffe, Informationsdienst Holz. Arbeitsgemeinschaft Holz e. V, Dusseldorf, Germany
Goens E (1931) The determination of the elasticity module of rods with the help of bending fluctuations.
Annalen der Physik 11(6):649–678
Green DW, Kretschmann DE (1989) A discussion of lumber property relationships in Eurocode 5. Paper
22-6-3. In: Proceedings of CIB-W18 Meeting 22, September 1989, Berlin, German Democratic
Republic
Green DW, Kretschmann DE (1990) Stress class systems: an idea whose time has come? Research Paper
FPL-RP-500. Forest Products Laboratory, Madison
Hearmon RFS (1966) Vibration testing of wood. Forest Prod J 16(8):29–40
ISO 3131 (1975) Wood; Determination of density for physical and mechanical tests. International
organization for standardization
Kollmann F, Krech H (1960) Dynamische Messung der elastischen Holzeigenschaften und der
Dampfung. Holz Roh-Werkst 18(2):41–54
Kollmann FFP, Cote WA Jr (1968) Principles of wood science and technology, vol 1: solid wood.
Springer, Berlin
Mischler-Schrepfer V (2000) Der Einfluss der Waldlagerung von Fichten-Rundholz auf die Langs-
Zugeigenschaften des Schnittholzes, Ph.D. thesis, ETH Zurich, Switzerland
Ruli A (2004) Determination of the compression strength of glulam - longitudinal and perpendicular to
the grain. Diploma thesis, Institute of Timber Engineering and Wood Technology, Graz University
of Technology, Austria
Sandoz J-L (1990) Triage et fiabilite des bois de construction validite de la methode ultrason, Lausanne,
Ph.D. thesis, EPF Lausanne, Switzerland
Schneider MH, Phillips JG (1991) Elasticity of wood and wood polymer composites in tension,
compression and bending. Wood Sci Technol 25(5):361–364
Steiger R (1995a) Biege-, Zug- und Druckversuche an Schweizer Fichtenholz, Institut fur Baustatik und
Konstruktion, ETH Zurich, Research Report Nr. 207, Birkhauser Verlag, Basel, Switzerland
Steiger R (1995b) Versuche an Fichten-Kantholzern: Biegemoment-Normalkraft-Interaktion, Institut fur
Baustatik und Konstruktion, ETH Zurich, Research Report Nr. 209, Birkhauser Verlag, Basel,
Switzerland
Steiger R (1996) Mechanische Eigenschaften von Schweizer Fichten-Bauholz bei Biege-, Zug-, Druck-
und kombinierter M/N-Beanspruchung, Research Report Nr. 221, Birkhauser Verlag, Basel,
Switzerland
Steiger R, Arm H, Gehri E (1994) Einspannvorrichtung fur Zugversuche an Holzproben grosseren
Querschnitts, Institut fur Baustatik und Konstruktion, ETH Zurich, Research Report Nr. 204,
Birkhauser Verlag, Basel, Switzerland
Steiger R, Fontana M (2005) Bending moment and axial force interacting on solid timber beams. Mater
Struct 38(279):507–513
Wood Sci Technol (2009) 43:259–278 277
123
Thelandersson S (1995) Step 3/11: Deformations in timber structures. In: Holzbauwerke nach Eurocode
5, Step 3: Grundlagen, Entwicklungen, Erganzungen, Informationsdienst Holz. Arbeitsgemeinschaft
Holz e. V, Dusseldorf
Thunell B (1941) Uber die Elastizitat schwedischen Kiefernholzes. Holz Roh- Werkst 4(1):15–18
Ylinen A (1942) Uber den Einfluss des Spatholzanteiles und der Rohwichte auf die Festigkeits- und
elastischen Eigenschaften des Nadelholzes. Acta forest. Fenn. 5:1. Cited In: Kollmann FFP, Cote Jr.
WA (Ed.): Principles of Wood Science and Technology, vol 1: Solid Wood, Springer, Berlin, 1968,
pp 346
278 Wood Sci Technol (2009) 43:259–278
123


