Embed Size (px)
Citation preview

STRESS EXPERIENCED
BY PARENTS
FROM THE
NEONATAL
INTENSIVE CARE UNIT
A thesis
submitted in partial fulfilment
of the requirements for the Degree
of
Master of Arts in Psychology
in the
University of Canterbury
by
Wendy Kate Steedman
University of Canterbury
2007

ii
CONTENTS
List of Abbreviations ................................................................................................................ v List of Tables ............................................................................................................................ vi List of Figures ......................................................................................................................... vii Acknowledgments .................................................................................................................. viii Abstract .................................................................................................................................... ix Preface ....................................................................................................................................... x 1. Introduction ..................................................................................................................... 1 1.1 Overview ........................................................................................................................... 1 1.2 General introduction .......................................................................................................... 1
1.2.1 The various definitions of stress ........................................................................... 1 1.2.2 The importance of researching stress ................................................................... 2 1.2.3 Parental stress and the Neonatal Intensive Care Unit ......................................... 3
1.2.4 The importance of researching parental stress from having an infant cared for in the NICU ................................................................................................... 4
1.3 A model of parental stress from the NICU ....................................................................... 5 1.3.1 Previous research evaluation of the Parental NICU Stress model ...................... 7 1.3.2 Conceptual framework of the current study ......................................................... 7
1.4 NICU environment stressors for parents ............................................................................ 8 1.4.1 The Parental Stressor Scale: Neonatal Intensive Care Unit (PSS:NICU) ............ 8 1.4.2 Findings of studies that utilised the PSS:NICU ................................................ 10
1.5 Limitations of previous literature utilising the PSS:NICU .............................................. 15 1.5.1 Under representation of fathers and lack of mother-father comparisons ........... 15 1.5.2 NICU infant characteristics poorly defined ....................................................... 16 1.5.3 Infants unrepresentative of the diverse range admitted to NICUs ..................... 17
1.5.4 Variation in time of administration of the PSS:NICU within and between studies ................................................................................................................. 17
1.6 Summary ......................................................................................................................... 18 1.7 NICU environment stressor: alteration to the parent-infant relationship ........................ 19 1.8 The link between parental stress from alterations to the parent-infant relationship
in the NICU and past experiences .................................................................................. 19 1.8.1 The link between the parent-infant relationship in the NICU and parents’
relationships with their own parents in childhood ............................................. 21 1.8.2 The link between the parent-infant relationship in the NICU and the
mother-father relationship .................................................................................. 23 1.9 Summary ........................................................................................................................ 25 1.10 Overall summary ............................................................................................................. 25 1.11 The current study: specific aims and hypotheses ............................................................ 26 2. Method ............................................................................................................................ 28 2.1 Setting .............................................................................................................................. 28 2.2 Participants and recruitment ............................................................................................ 28 2.3 Procedure ......................................................................................................................... 29

iii
2.4 Mothers’ and fathers’ background characteristics .......................................................... 29 2.5 Infants’ clinical characteristics ........................................................................................ 32 2.6 Self-report measures ....................................................................................................... 34
2.6.1 Parental Stressor Scale: Neonatal Intensive Care Unit (PSS:NICU) ................. 34 2.6.2 Hospital Anxiety and Depression Scale – Anxiety subscale (HADS-A) ........... 35 2.6.3 State-Trait Anxiety Inventory - Trait subscale (STAI-T) .................................. 37 2.6.4 Parental Bonding Instrument (PBI) ................................................................... 38 2.6.5 Dyadic Adjustment Scale (DAS) ...................................................................... 40
2.7 Data analyses ................................................................................................................... 41 3. Results and Discussion .................................................................................................. 43 3.1 Overview of the Results and Discussion chapter ............................................................ 43 Part A 3.2 Part A results: psychometric properties of the PSS:NICU ............................................. 44
3.2.1 Frequencies of responses by parents to each item on the PSS:NICU ................ 44 3.2.2 Factor structure of the PSS:NICU ...................................................................... 44 3.2.3 Interscale correlations of the PSS:NICU subscales and total scale .................... 47 3.2.4 Construct validity of the PSS:NICU according to anxiety measures ................ 49 3.2.5 Inter-item correlations for each PSS:NICU subscale ......................................... 50
3.3 Part A discussion ............................................................................................................. 51 Part B 3.4 Part B results: NICU environment stressors experienced by mothers and by fathers ..... 54 3.5 Part B discussion ............................................................................................................. 58
3.5.1 Overall stress level experienced by mothers and by fathers from the NICU ..... 58 3.5.2 Gender differences in experience of stress from the NICU ............................... 58 3.5.3 The most stressful aspect of the NICU for mothers and for fathers ................... 60
Part C 3.6 Part C results: the link between parents’ experience of stress from the parent-infant
relationship in the NICU and their past relationships .................................................... 61 3.6.1 PBI: comparison of means across mothers and fathers matched as couples ...... 61 3.6.2 Association between the PSS:NICU Parent-Infant Relationship subscale
and the PBI ......................................................................................................... 62 3.6.3 Association between parent-infant relationship stress according to
categories and the PBI subscales ........................................................................ 64 3.6.4 DAS: comparison of means across mothers and fathers matched as couples .... 66 3.6.5 Association between the PSS:NICU Parent-Infant Relationship subscale
and the DAS ....................................................................................................... 67 3.6.6 Association between parent-infant relationship stress according to
categories and the DAS ...................................................................................... 68 3.7 Part C discussion ............................................................................................................. 70
3.7.1 PBI: comparison of means across mothers and fathers matched as couples ..... 70 3.7.2 The link between the PSS:NICU Parent-Infant Relationship subscale
and the PBI ......................................................................................................... 70 3.7.3 Dyadic Adjustment Scale: comparison of means across mothers and
fathers matched as couples ................................................................................. 73

iv
3.7.4 The link between the PSS:NICU Parent-Infant Relationship subscale and the DAS ....................................................................................................... 73
General Discussion ................................................................................................................. 74 3.8 Strengths of the current study .......................................................................................... 74
3.8.1 The representative nature of the sample ............................................................. 75 3.8.2 Large sample size ............................................................................................... 75 3.8.3 Systematic data analyses .................................................................................... 76 3.8.4 Reliable and valid measures ............................................................................... 76 3.8.5 Representation of fathers and mother-father comparisons ................................ 77 3.8.6 Parents representative of the diverse range of infants admitted to NICUs ........ 77 3.8.7 Distinct time frame of administration of the PSS:NICU .................................... 77
3.9 Limitations of the current study ...................................................................................... 78 3.9.1 Descriptive design .............................................................................................. 78 3.9.2 Lack of contrast groups in the methodological design ....................................... 79 3.9.3 Self-report questionnaire measures .................................................................... 80
3.10 Summary and conclusions ............................................................................................... 80 3.11 Implications .................................................................................................................... 81 3.12 Suggestions for future research ....................................................................................... 82 Appendices .............................................................................................................................. 85 References ............................................................................................................................... 98

v
LIST OF ABBREVIATIONS
DAS Dyadic Adjustment Scale
FOOTPRINT Follow-up study of Neonatal Intensive Care Unit admissions
HADS-A Hospital Anxiety and Depression Scale – Anxiety subscale
NICU Neonatal Intensive Care Unit
PARENTS Canterbury Psychological Adjustment Related to Newborn Trauma or Stress
PBI Parental Bonding Instrument
PSS:NICU Parental Stressor Scale: Neonatal Intensive Care Unit
STAI-T State Trait Anxiety Inventory – Trait subscale

vi
LIST OF TABLES
1. Review of Methodological Characteristics and Findings of Studies using
the PSS:NICU .................................................................................................................... 11
2. Mothers’ and Fathers’ Background Characteristics .......................................................... 31
3. Four-factor Analysis of the PSS:NICU ............................................................................ 46
4. Intercorrelations of the PSS:NICU Subscales and Total Scale .......................................... 48
5. Intercorrelations between the PSS:NICU and Measures of Anxiety ................................. 49
6. Inter-item Correlations for each PSS:NICU Subscale ....................................................... 51
7. Comparison of PSS:NICU Means across Mothers and Fathers Matched as Couples ...... 55
8. Comparison of PBI Subscale Means across Mothers and Fathers Matched as Couples .... 62
9. Association between the PSS:NICU Parent-Infant Relationship subscale and each
PBI Subscale for Mothers and for Fathers ......................................................................... 63
10. Analyses of Variance between Categories of Parent-Infant Relationship Stress
according to each PBI Subscale for Mothers .................................................................... 65
11. Analyses of Variance between Categories of Parent-Infant Relationship Stress
according to each PBI Subscale for Fathers ....................................................................... 65
12. Comparison of DAS Subscale Means Across Mothers and Fathers Matched as Couples . 67
13. Association between the PSS:NICU Parent-Infant Relationship subscale and the DAS
for Mothers and for Fathers .............................................................................................. 68
14. Analyses of Variance between Categories of Parent-Infant Relationship Stress
according to the DAS for Mothers ..................................................................................... 69
15. Analyses of Variance between Categories of Parent Infant Relationship Stress
according to the DAS for Fathers ....................................................................................... 69
D1. Frequencies of Responses by Mothers and by Fathers to Individual Items
of the PSS:NICU ................................................................................................................ 95

vii
LIST OF FIGURES
1. The Parental NICU Stress model (Wereszczak, Miles, & Holditch-Davis, 1997) .............. 5
2. The conceptual framework of the current study, based on the Parental NICU Stress ........ 6
model proposed by Wereszczak, Miles, and Holditch-Davis (1997)
3. The distribution of infants according to gestational age ..................................................... 32
4. The distribution of infants according to birth weight category .......................................... 33
5. PSS:NICU Metric 1 mean stress scores for mothers and for fathers .................................. 56
6. PSS:NICU Metric 2 mean stress scores for mothers and for fathers ................................... 57

viii
ACKNOWLEGEMENTS
First and foremost, I would like to thank Janet Carter who shared her knowledge and expertise as
my primary supervisor. I deeply appreciate being allowed to use data from the PARENTS study in
my thesis. I am sincerely grateful to all those involved in the PARENTS study who spent their time
and energy setting up the study, recruiting participants, collecting data and compiling the database.
I would also like to thank the parents who participated in this study. In addition, I wish to
acknowledge the Sadie Balkind Award I received from the New Zealand Federation of Graduate
Women for this thesis.
I am deeply grateful for the invaluable input, support, and encouragement provided by: Mark
Byrd, Lianne Woodward, Chris Frampton, Stephen Murray, and Stephanie Day. Thank you to my
beautiful family and friends for their support, and loving me unconditionally. A special thank-you
to my friend and colleague Zoë Quick, who has helped me out of many a precarious situation!

ix
ABSTRACT
The psychometric properties of this Parental Stressor Scale: Neonatal Intensive Care Unit
(PSS:NICU) were assessed, before using the scale to describe stress experienced by parents in a
Neonatal Intensive Care Unit (NICU). The extent to which parental stress from the parent-infant
relationship in the unit was linked to parenting they received as a child, and adjustment to their
couple relationship, was also examined. The sample consisted of 182 mothers and 183 fathers, who
were in a cohabitating relationship, of infants from the NICU at Christchurch Women’s Hospital.
The self-report questionnaires included the PSS:NICU, Parental Bonding Instrument, and the
Dyadic Adjustment Scale, and were administered to parents within 2-3 weeks of their infant’s birth.
This study extends the finding of satisfactory psychometric properties of the PSS:NICU (Franck,
Cox, Allen & Winter, 2005; Miles, Funk & Carlson, 1993; Reid & Bramwell, 2003) to this New
Zealand sample. Mothers experienced significantly higher stress from the unit compared to fathers
(p < .01). A previous finding, for mothers, of the parent-infant relationship being the most stressful
aspect of the unit (Franck et al., 2005; Reid & Bramwell, 2003; Shields-Poe & Pinelli, 1997)
extends to the New Zealand sample. The most stressful aspect of the unit for fathers was sights and
sounds. Lack of evidence was found for associations between parental stress from the parent-infant
relationship in the unit and parenting received as a child, or adjustment to their couple relationship.
A weak but significant negative correlation was, however, found between stress from the mother-
infant relationship and maternal care received in childhood. It is unnecessary to provide all parents
with intervention further to what is already being practiced in the unit, as overall low levels of stress
were reported. Some parents, however, did find the unit more stressful, and they may benefit from
increased intervention.

x
PREFACE
The current study is based on data from a longitudinal study of parents of infants admitted to a
Neonatal Intensive Care Unit (NICU), and a comparison group of parents of full term infants. This
longitudinal study is known as the Canterbury Psychosocial Adjustment Related to Newborn
Trauma or Stress (PARENTS) study, and took place at Christchurch Women’s Hospital, Canterbury,
New Zealand. The PARENTS study was designed to examine predictors of stress levels for mothers
and fathers of NICU infants. The participants were 447 parents (242 mothers and 205 fathers) of
NICU infants, and 189 parents (100 mothers and 89 fathers) of full term comparison infants. The
PARENTS study was conducted between 2001 and 2003, with measures taken at baseline, 3
months, 9 months, and 2 years. The investigators are Dr Janet Carter, Associate Professor Roger
Mulder, and Professor Brian Darlow, of the Christchurch School of Medicine and Health Sciences.
Only baseline data from parents of infants admitted to the NICU were used in the present study. The
PARENTS study database has also been utilised in the following studies: Carter, Mulder, Bartram
and Darlow (2005); Carter, Mulder and Darlow (2007); and Carter, Mulder, Darlow, Frampton and
Darlow (2007).
The PARENTS study database included a small amount of data relating to the clinical
characteristics of the NICU infants, which were also used in the current study. These data were
obtained from a follow up study of NICU admissions, called the FOOTPRINT study, which was
conducted in conjunction with the PARENTS study. There were 266 NICU infants who participated
in the FOOTPRINT study. The investigators for this study are Professor Brian Darlow, and Mr
John Horwood, of the Christchurch School of Medicine and Health Sciences.
In the current study, I was responsible for summarising theoretical work on parental stress, and
reviewing empirical research that utilised the Parental Stressor Scale: NICU (PSS:NICU). I
contributed to the design of the study, developing the aims and hypotheses to address gaps in the
literature. In addition, I selected the participants and questionnaires to be included from the
PARENTS database, and reviewed the questionnaires. I undertook the data analyses in this study,
under consultation with Dr Chris Frampton, Biostatistician, and Dr Janet Carter. I was responsible
for interpretation of findings from the data analyses, and how the study contributed to the small
body of existing literature. Finally, I addressed the implications of the study for clinical practice, the
families of NICU infants, and for society as a whole.

1
1. INTRODUCTION
1.1 Overview
Everyone in the modern world experiences stress at least occasionally in life. Stress has been
conceptualised in multiple ways, and its various psychological definitions are discussed. Stress has
devastating effects on individual, interpersonal, and societal levels; therefore, it is important to
understand its nature to assist development of interventions to mitigate these effects. One
potentially stressful life event, which is the focus of this study, is the birth of an infant who is then
cared for in a Neonatal Intensive Care Unit (NICU). A NICU is “a unit of a hospital specialising in
the care of ill or premature newborn infants” (NICUs: definition, 2006).
In this chapter relevant models of parental stress from the NICU are reviewed, and one model is
adapted to provide a conceptual framework for the present study. Of particular interest in this study
is the role of NICU environment stressors, which have been measured using the Parental Stressor
Scale: NICU (PSS:NICU). The PSS:NICU is utilised in this study, but first its psychometric
properties are reviewed. The findings of studies that have used the PSS:NICU to describe sources of
stress, and the greatest source of stress, are considered. Limitations of this research are also
detailed, which provide reasons for inconsistencies in the literature and justification for the current
study. This study focuses specifically on one particular NICU environment stressor: alteration to the
parent-infant relationship. This factor is investigated in relation to parents’ personal characteristics,
more specifically, past experience of the relationships with their own parents and their partners.
This link has received insufficient attention in the previous literature.
1.2 General introduction
1.2.1 The various definitions of stress
Stress has been defined as “psychological and physical strain or tension generated by
physical, emotional, social, economic, or occupational circumstances, events, or experiences that are
difficult to manage or endure” (Colman, 2003, p. 711). This definition highlights the different

2
components of stress, including the psychological component that was the focus of this study.
However, the concept of stress is ambiguous; as a result, it has been defined in various ways. In a
stimulus-based definition it is conceptualised as a stimulus in a disturbing environment that acts on a
person to produce a response (Cox, 1978; Davison & Neale, 2001). As a result of stimulus-based
definitions of stress linking stress to a response, literature in this area contains unclear distinctions
among stress, distress, anxiety, depression, anger, adaptation, and adjustment (Appley & Trumbull,
1967; Cox, 1978; Lazarus, 1966). A major problem with this type of definition, identified by Cox
(1978), and Davison and Neale (2001), is lack of consideration of individual differences in response.
These authors argued that an environment that produces a response in one person does not
necessarily produce the same response in another. In contrast, a response-based definition
accommodates individual differences in response, defining stress as a person’s physiological or
psychological response to stimuli in a disturbing environment (Cox, 1978; Magnusson, 1982; Quick,
Quick, & Gavin, 2000). In this type of definition the stimuli are termed “stressors,” and stress is
treated as a dependent variable. Lastly, in an interactional-based definition, stress arises when the
relationship between an individual and the environment is perceived to exceed his or her resources
(Lazarus & Folkman, 1984). This type of definition extended the concept of individual differences
in response by introducing the concept of a bi-directional relationship between a person and the
environment (Cox, 1978). Furthermore, it integrated the stimulus-based and response-based
definitions (Cox, 1978); consequently, stress may be a stimulus or a response. The current study
adopted a response-based definition of stress, because of the aforementioned major problem with the
stimulus-based definition of stress. An interactional-based definition was not adopted due to the
descriptive design of the current study.
1.2.2 The importance of researching stress
Stress affects an individual positively or negatively by way of an evolutionary concept
named the fight or flight response (Schooler, Dougall & Baum, 2000). A threatening situation puts
stress on an individual, triggering the fight or flight response: an increase in metabolism and blood
flow throughout the body, increasing the capacity to protect one’s self or escape from the situation.
The fight or flight response is often accompanied by cognitive appraisal of the situation, leading to
emotions such as anger and fear (Gleitman, 1995). With regard to positive effect on an individual,
when the situation is immediately threatening, for example the presence of a predator, the fight or

3
flight response promotes survival. In contrast, negative effects occur when the situation is not
immediately threatening, for example threat to a person’s job, health, or important relationships,
which are common in the modern world. When changes in the body repeatedly occur from the fight
or flight response, it becomes susceptible to disease such as heart attack, stroke, hypertension, and
cancer (Gleitman, 1995; Schooler et al., 2000); and to mental illness such as anxiety and depression
(Cox, 1978; Davison & Neale, 2001). These deadly or disabling effects on an individual in turn
disturb others who are close to the individual. Furthermore, the monetary costs to society must
consequently be enormous: directly, in terms of health care, and indirectly, in terms of loss of
productivity. Therefore, it is important to research the nature of stress to assist the development of
interventions to mitigate its negative effects on individual, interpersonal, and societal levels.
1.2.3 Parental stress and the Neonatal Intensive Care Unit
One potentially stressful life event is the birth of a child. It is not surprising then that the birth
of a fragile child, who is then cared for in a NICU, can be particularly stressful for the parents
(Carter, Mulder, Bartram, & Darlow, 2005; Gennaro, 1988; Jeffcoate, Humphrey, & Lloyd, 1979;
Singer et al., 1999; Trause & Kramer, 1983). This response has been revealed by comparing parents
of infants who were cared for in a NICU with parents of full-term infants, at various points in time.
In the first week after their infant’s birth, parents of NICU infants were more upset, anxious, and
depressed compared with parents of full-term infants (Gennaro, 1988; Trause & Kramer, 1983).
Psychological distress experienced by parents of NICU infants also appears to persist beyond 1
week postpartum: in a study by Jeffcoate et al. (1979), mothers’ post-natal depression lasted longer
than 1 week for mothers of NICU infants, in contrast to less than 1 week for mothers of full-term
infants. In a study by Carter et al. (2005), a higher number of parents of NICU infants had clinically
relevant anxiety and depression when assessed within 3 weeks of infant admission, compared to a
control group of parents of full term infants. In the month following the birth of their infant,
mothers of NICU infants, when compared with control mothers, scored higher on measures of the
following: difficulty making decisions, depression, anxiety, and obsessive-compulsive behaviours
(Singer et al., 1999). Further, at 1-3 years after the birth of their infant, the amount of stress
experienced by parents of NICU infants was significantly higher compared with controls (Singer et
al., 1999).

4
1.2.4 The importance of researching parental stress from having an infant cared for in the NICU
It is imperative that parental stress from having an infant cared for in the NICU is examined and
understood, in terms of risk and protective factors, for a number of reasons. This is the case
particularly in New Zealand, where no studies have been published. One reason is that there are
substantial numbers of parents of infants who require care in NICUs who may be affected by stress.
There are over 1,500 NICUs in the USA (McGrath, n.d.), each treating approximately 600 infants
annually (Bell, 2004). In New Zealand there are nine NICUs (Ministry of Health, 2005), and
approximately 10% of all newborns are admitted to one of these units (Darlow & Mulder, 2001).
Moreover, due to an increase in premature births and survival rates, the number of infants requiring
care in NICUs is increasing (Ministry of Health, 2005). Another reason is that parental stress can be
detrimental to the parents’ relationship with each other (Affleck, Tennen & Rowe, 1991; Leifer,
Leiderman, Barnett & Williams, 1972). In the study by Leifer et al. (1972), there was a higher
frequency of divorce in parents of premature infants, compared to parents of full term infants, when
infants reached 1 year of age.
A further reason it is imperative to examine and understand parental stress from the NICU is
that it can affect infant development. One way to conceptualise this idea is Bronfenbrenner’s
Ecological Systems theory (Bronfenbrenner & Evans, 2000), whereby the infant is nested within
several levels of systems. The first level is the microsystem, which includes the infant’s immediate
family. The second level is the exosystem, which includes parents’ work, and community health
services such as the NICU. Another important concept in the model is that the systems are ever-
changing, with bi-directional interactions between components, so that the infant is both a product
and a producer of his or her environment.
The premise that parental stress from the NICU can affect infant development has been
supported by research. In a study by Singer et al. (1999), the severity of maternal depression was
linked to less favourable child cognitive development outcome for infants born with low birth
weights. In Assel et al. (2002), parental stress, even at low levels, was shown to disturb the
relationships of parents with their healthy infants. Moreover, a disturbed parent-infant relationship
has been implicated in infant behavioural problems, emotional problems, and abuse (Klaus &
Kennell, 1970). Promoting development is particularly pertinent for infants admitted to the NICU,

5
who have a higher risk of being born with physical (Bregman & Kimberlin, 1993; Theunissen et al.,
2001) and psychological difficulties (Sameroff & Chandeler, 1964; Theunissen et al., 2001),
compared to other infants.
1.3 A model of parental stress from the NICU
One way to conceptualise parental stress from the NICU is in terms of factors contributing to
this response (Holditch-Davis & Miles, 2000; Wereszckak, Miles & Holditch-Davis, 1997). The
Parental NICU Stress model (Wereszckak et al., 1997) identifies multiple factors in this response, as
shown in Figure 1. It is also the only model designed specifically for parents of NICU infants. It
was adapted from the Parental Intensive Care Unit Stress model (Miles & Carter, 1983), which was
developed from theories of stress and relevant research. Theories and research regarding the NICU
will be discussed in more detail in the proceeding sections, so will not be elaborated on in this
section. The Parental Intensive Care Unit Stress model was designed in relation to the Paediatric
Intensive Care Unit, as opposed to the NICU. Another comparable model is the Preterm Parental
Distress model (Holditch-Davis & Miles, 2000). This model, however, only considers pre-term
infants in the NICU, excluding other types of infants in the NICU such as low birth weight or
critically ill full term infants.
Figure 1. The Parental NICU Stress model (Wereszczak, Miles, & Holditch-Davis, 1997).
Personal characteristics NICU environment
stressors Stress response
Personal resources
Situational factors
Environment support

6
In the Parental NICU Stress model (Wereszczak et al., 1997), NICU environment stressors
directly influence parents’ stress response. Four major NICU environment stressors were identified
and described in detail by Miles, Funk, & Carlson (1993). First, the factor “sights and sounds” was
described as the physical environment, including the machines, equipment, lights, noises, infants,
and staff. Second, the factor “infant appearance and behaviour” was described as how a parent’s
infant looked and behaved, usually quite different to a healthy new born infant because of illness
and medical treatments. Third, the factor “parent-infant relationship” was described as alterations to
the normal parent-infant relationship and parental role, due to nurses being the primary caregivers.
Fourth, the factor “staff” was described as staff communication and behaviour towards the parents
about their infant’s condition or treatment. Figure 2 presents the conceptual framework of the
current study.
Figure 2. The conceptual framework of the current study, based on the Parental NICU Stress model
proposed by Wereszczak, Miles, and Holditch-Davis (1997).
Factors outlined in the Parental NICU Stress model (Wereszczak et al., 1997), as shown in
Figure 1, thought to influence a parent’s experience of NICU environment stressors are: (1) personal
characteristics of the parent, such as past experiences and concurrent life events; (2) situational
factors, such as severity of the infant’s illness and uncertainty about the illness; (3) personal
resources of the parent, such as family support, cognitive resources, and financial resources; and (4)
environmental support, such as support from staff or other parents in the NICU.
Personal characteristics -past experiences
NICU environment stressors -sights and sounds -infant appearance and
behaviour -parent-infant
relationship -staff
Level of stress response

7
1.3.1 Previous research evaluation of the Parental NICU Stress model
Wereszckak et al. (1997) conducted the only study to evaluate all the components of the
Parental NICU Stress model. A small number of mothers (n = 44) were interviewed about their
experiences of the NICU when their infant was 3 years old. The interview was semi-structured,
with open-ended questions, to enable mothers to recall any aspect of the NICU experience. Data
analyses were used to identify the salient aspects of the unit for mothers. These salient aspects,
which provided support for the model, included the environmental stressors identified by Miles et al.
(1993): sights and sounds, infant appearance and behaviour, parent-infant relationship, and staff.
Situational stressors identified included perceptions of severity and uncertainty about the infant’s
illness, and problems with a previous pregnancy. A personal resource stressor identified was lack of
family support. Lastly, environment supports identified were staff, and stress management
strategies. Personal characteristics, as outlined in the model, were not identified as salient to the
mothers’ NICU experience. A limitation of this study was that certain specific questions were not
asked in the interview. Therefore mothers may have not mentioned personal characteristics, because
they assumed this aspect was too far removed from their NICU experience.
1.3.2 Conceptual framework of the current study
The current study explored two factors implicated in the level of parental stress response
from the Parental NICU Stress model (Wereszczak et al., 1997): NICU environment stressors, and
personal characteristics. The exploration of situational factors, personal resources, and environment
support, as shown in Figure 1, was beyond the scope of this study. The major NICU environment
stressors identified by Miles et al. (1993) were investigated: sights and sounds, infant appearance
and behaviour, parent-infant relationship, and staff. The stressor of alterations to the parent-infant
relationship was further investigated in relation to parents’ personal characteristics, more
specifically, their past experiences. Further investigation of the other NICU environment stressors
was beyond the scope of this study. These two areas of investigation are reviewed in turn in the
following sections.

8
1.4 NICU environment stressors for parents
1.4.1 The Parental Stressor Scale: Neonatal Intensive Care Unit (PSS:NICU; Miles et al., 1993)
The four major NICU environment stressors identified by Miles et al. (1993), listed in Figure
2, provided the basis for the Parental Stressor Scale: NICU (Miles et al., 1993). Each corresponding
subscale measures the level of stress experienced from that particular stressor. The PSS:NICU was
developed from the Parental Stressor Scale: Paediatric Intensive Care Unit (Miles et al., 1993). The
scale was based on Magnusson’s (1982) stress theory, where stress is defined as an individual’s
reaction to demands that place pressure on his or her personal resources. Stressors were
conceptualised as the actual environment, consisting of physical and psychosocial elements, and
how the environment is perceived by an individual (Miles et al., 1993). An extensive literature
review, NICU observations, consultation with neonatal professionals, and interviews with parents
who had an infant admitted to a NICU also provided information for the development of the scale
(Miles et al., 1993).
The psychometric properties of the PSS:NICU were originally evaluated in USA and Canada
(Miles et al., 1993). Since then, studies with United Kingdom samples (Franck, Cox, Allen &
Winter, 2005; Reid & Bramwell, 2003) have also examined its psychometric properties. None of
these studies included use of the Staff subscale, however, because two thirds of parents had not
experienced any (Franck et al., 2005; Miles et al., 1993), or many (Reid & Bramwell, 2003), of the
items in this subscale.
Satisfactory validity for the PSS:NICU has been demonstrated by factor analyses, inter-
scale correlations, and measurements of construct validity. Factor analysis by Miles et al. (1993)
revealed six factors that collectively accounted for 71% of the variance in scale scores. Three major
factors were identified by Franck et al. (2005) and Miles et al. (1993), accounting for 58-66% of the
variance. These three factors corresponded to the Sights and Sounds, Infant Appearance, and
Parent-Infant Relationship subscales. Inter-scale correlations indicated a moderate percentage of
shared variance between the subscales (Miles et al., 1993; Reid & Bramwell, 2003). In Miles et al.
(1993), the subscales were shown to be strongly correlated with the total scale, sharing 49-82% of
the variance. In order to measure construct validity, correlation coefficients were obtained by Miles
et al. (1993) between scores on the PSS:NICU and the State-Trait Anxiety Inventory (STAI,

9
Spielberger, Gorsuch, Lushene,Vagg, & Jacobs, 1983). Coefficients between the PSS:NICU and the
State subscale of the STAI were shown to be statistically significant (p<.05): Sights and Sounds
(r=.20), Infant Appearance (r=.41), Parent-Infant Relationship (r=.40), and the total PSS:NICU
(r=.45). Similar correlations have been found by other authors between the total PSS:NICU and the
State subscale of the STAI (r=0.48-0.54, p< 0.001); and between the total PSS:NICU and the Trait
subscale of STAI (r=0.21-0.37, p< 0.001) (Franck et al., 2005; Miles, Funk, & Kasper, 1991).
Reliability, in the form of internal consistency, has been shown to be acceptable (>.70) for
the PSS:NICU (Franck et al., 2000; Miles, et al., 1993; Reid & Bramwell, 2003). Cronbach’s alpha
coefficients ranged from .73 to .81 for the Sights and Sounds subscale, .83 to .90 for the Infant
Appearance subscale, .83 to .90 for the Parent-Infant Relationship subscale, and .89 to 0.94 for the
total scale.
The PSS:NICU is a promising tool in this area of research for a number of reasons. First, it
systematically measures environmental stressors for parents from the NICU, and the level of stress
each engenders. Second, it is the only one of its kind, with the most comparable scale being the
Parental Stressor Scale: Paediatric Intensive Care Unit (Carter & Miles, 1989). Third, overall, it
appears to be valid and reliable, although these properties have only been assessed by a small
number of studies, and have not been assessed in New Zealand. Fourth, a consistent definition of
stress can be applied between studies, which has been lacking in the literature, aiding integration of
findings among studies. For these reasons the PSS:NICU was selected for use in the present study.
When using a questionnaire in a population, its psychometric properties with that population
should be evaluated. The current study utilised a sample from New Zealand, and the psychometric
properties of the PSS:NICU have not been evaluated in this country. New Zealand is most
comparable to the United Kingdom in terms of language and culture, but it is likely there are
differences in NICU practices, values, and interpretation of words that could affect responses, and
the psychometric properties of the scale (Frank et al., 2005). Therefore, psychometric properties of
the scale were analysed in the current study.

10
1.4.2 Findings of studies that utilised the PSS:NICU
Table 1 shows methodological characteristics and findings of studies that utilised the
PSS:NICU. Parental stress arising from NICU environment stressors, as measured by the mean of
the scale, has been reported to range from a little stressful (Dudek-Shriber, 2004; Franck et al.,
2005; Miles et al., 1991) to moderately stressful (Miles et al., 1993). There have also been
inconsistent findings in studies that have statistically compared mothers’ and fathers’ mean
PSS:NICU scores. In the United Kingdom study by Franck et al. (2005) and the Canadian study by
Perehudoff (1990), mothers were reported to experience more stress than fathers from the NICU
environment. In contrast, for the USA study by Franck et al. (2005) and the Canadian study by
Shields-Poe and Pinelli (1997), there were no significant differences in stress scores between
mothers and fathers. A limitation with both Perehudoff (1990) and Shields-Poe and Pinelli (1997)
were that the scoring method they used for the scale was not stated. In addition, a limitation with
the USA sample in Franck et al. (2005) was that the number of fathers was small (n = 10), which
reduces statistical power.

11
Table 1. Review of Methodological Characteristics and Findings of Studies using the PSS:NICU
Study
Sample
Definition of infant characteristics
Infant inclusion criteria
Time
PSS:NICU administered
PSS:NICU meana
PSS:NICU subscale with greatest meana
[1] Dudek-
Shriber (2004)
Mothers: 130 Fathers: 32
Gestational age categorised into: extremely
premature <28 weeks; premature 28 - 36 weeks; and full-term 37- 42 weeks
Birth weight categorised into: average >2,500g; low: 1,500 - 2,500g; very low: 1,000 - <1,500g; and extremely low <1,000g
Health status: Five diagnosis categories based on similarities, including prematurity with respiratory disorders Range of time infant in unit
NICU admission of
at least 7 days
Various points
during infant admission
2.36
Parent-Infant
Relationship: 3.22
[2] Franck, Cox, Allen and Winter (2005)
UK mothers: 133 UK fathers: 63 USA mothers: 51 USA fathers: 10
Gestational age: mean (SD) Birth weight: mean (SD) Health status:
Apgar score (5 mins) Clinical Risk Index for Babies (CRIB) score Diagnosis (five categories including prematurity) Mechanical ventilation (n and %) Surgery (n and %)
None Various points 2 days after infant admission
UK: 2.35 USA: 2.24 UK mothers:
2.44 UK fathers:
2.15 USA
mothers: 2.24
USA fathers: 2.22
UK: Parent-Infant Relationship, 2.98
USA: Parent-Infant Relationship, 2.75
UK mothers: Parent-Infant Relationship, 3.18
UK fathers: Parent-Infant Relationship, 2.58

12
USA mothers: Parent-Infant Relationship, 2.82
USA fathers: Parent-Infant Relationship and Infant Appearance equal, 2.40
[3] Miles (1989)
53 parents, mostly mothers (numbers of mothers and fathers not stated)
Gestational age: no information given Birth weight: no information given Health status:
Complications of prematurity (%) Parental perception of infant severity (5 point scale)
None Infants’ most critical period: various points 2 days after admission; majority close to discharge or transfer
Not stated Infant Appearance: 3.70
[4] Miles, Funk and Carlson (1993)
Mothers: 115 Fathers: 75
Gestational age: range and mean Birth weight: mean Health status:
Mean number of complications
Stable condition 1-7 days of infant admission
2.63 Parent-Infant Relationship: 3.10
[5] Miles, Funk and Kasper (1991)
Mothers: 79 Fathers: 43
Gestational age: range and mean Birth weight: range and mean Health status:
Respiratory assistance needed (%) Mean number of medical complications Parental perception of infant condition (5 point scale)
Premature Stable condition
1-5 days of infant admission
2.00 Parent-Infant Relationship: 2.50

13
[6] Perehudoff
(1990) 31 mother-father couples
Gestational age: range and mean Birth weight: range and mean Health status:
Prematurity complications Mean number of days in NICU
< 37 weeks gestation No congenital
abnormalities NICU admission <7
days
1-7 days of infant admission
Mothers: 1.85b Fathers: 1.31b
Mothers: Parent-Infant Relationship, 2.84b
Fathers: Sights and Sounds, 1.73b
[7] Reid and
Bramwell (2003)
40 mothers Gestational age: range and mean (SD) Birth weight: range and mean (SD) Health status variables included:
Length of NICU admission, range and mean (SD) Days on oxygen, range and mean (SD)
Premature (< 34 weeks) and no other complications defined as ventilated for less than 24 hours; Apgar score of greater than 7 at 5 minutes; no history of maternal substance abuse; no congenital abnormality
2-5 days of infant admission
Not stated Parent-Infant Relationship: 3.56b
[8] Seidman et al. (1997)
Mothers: 19 Fathers: 12
Gestational age: preterm, mean Birth weight: low birth weight Health status:
Mean length of stay in NICU Medical diagnosis
NICU admission of between 3 days and 3 months
Close to infant discharge
Not stated Parent-Infant Relationship (score not stated)

14
[9] Shields-
Poe and Pinelli (1997)
212 parents Balance of mothers and fathers (numbers not stated)
Gestational age: no information given Birth weight categorised into: < 1,500g;
1,500 - 2,499g; 2,500+g Health status:
Morbidity scale score, range and mean (SD)
Abnormality
NICU admission of at least 1 day
3 weeks after infant admission or just prior to discharge
Mothers: 1.86b Fathers: 1.74b
Mothers: Parent-Infant Relationship, 2.90
Fathers: Parent-Infant Relationship & Sights and Sounds equal, 2.20b
Notes a The PSS:NICU has three scoring methods: Metric 1, Metric 2, and Frequency (Miles & Funk, 1998). Metric 1 measures the level of stress experienced when a situation occurs. Metric 2 measures the overall stress experienced from the NICU environment. The Frequency method counts the number of items experienced by a parent. Metric 2 scores were reported in Table 1, because the focus in the present study was on the amount of overall stress experienced by a parent from the NICU. 1 = not at all stressful, 2 = a little stressful, 3 = moderately stressful, 4 = very stressful, 5 = extremely stressful b The scoring method used was not stated.

15
Another area of investigation has been to identify the greatest NICU environment stressor for
parents. Findings detailed in Table 1 show that parents found the most stressful aspect of the unit,
according to the PSS:NICU subscale means, to be alterations to their parent-infant relationship
(Dudek-Shriber, 2004; Franck et al. 2005; Miles et al. 1993; Miles et al.,1991; Seidman et al., 1997).
A small number of studies examined the greatest NICU environment stressor separately for mothers
and for fathers (Franck et al., 2005; Perehudoff, 1990; Reid & Bramwell, 2003; Shields-Poe &
Pinelli, 1997). These studies reported the most stressful aspect of the unit for mothers was the
parent-infant relationship (Franck et al., 2005; Reid & Bramwell, 2003; Shields-Poe & Pinelli,
1997), while the most stressful aspect for fathers varied (Franck et al., 2005; Perehudoff, 1990;
Shields-Poe & Pinelli, 1997). A limitation with the study conducted by Reid and Bramwell (2003)
was that the scoring method used for the PSS:NICU was not stated.
1.5 Limitations of previous literature utilising the PSS:NICU
Whilst previous literature utilising the PSS:NICU has been valuable in the investigation of
parents’ stress from the NICU, limitations are evident. In this section more limitations of the
literature are described. These limitations provide possible reasons for inconsistencies in findings,
and further justification for the present study, which addresses these limitations.
1.5.1 Under representation of fathers and lack of mother-father comparisons
The majority of studies in Table 1 have under represented fathers in their samples.
Unbalanced samples, with larger numbers of mothers compared to no or much smaller numbers of
fathers, are utilised (Dudek-Shriber, 2004; Frank et al., 2005; Miles, 1989, Miles et al., 1993; Miles
et al., 1991; Reid & Bramwell, 2003; Seidman et al., 1997). To make matters worse, the majority of
these studies combined the unbalanced number of mothers and fathers in their analyses, and refer to
their samples as “parents” (Dudek-Shriber, 2004; Miles, 1989; Miles et al., 1993; Miles et al, 1991;
Seidman et al., 1997).
The implication is that the literature is more representative of mothers’ experience as
opposed to fathers’ experience. This situation is inadequate considering first, the small amount of
16
PSS:NICU research that has considered fathers separately has shown that fathers also experience
stress from the unit (Frank et al., 2005; Perehudoff, 1990; Shields-Poe & Pinelli, 1997). Second,
theory and research has acknowledged the importance of the father (Levy-Shiff, Sharir & Mogilner,
1989). Furthermore, fathers of NICU infants have been shown to play an important role in
maintaining family stability during their infant’s admission (Affonso et al., 1992; Jeffcoate, et al.,
1979), which Levy-Shiff et al. (1989) suggested is due to the mother and infant being in different
hospitals, or the mother being physically incapacitated.
There has also been a lack of comparisons in this literature between mothers’ and fathers’
stress scores. Because mothers and fathers are not independent groups, as they share a relationship
with their infant, in order to statistically compare these groups it is most appropriate to use a
matched pair design. This design involves recruiting mother-father pairs. The only study in Table 1
that reported such a design is Perehudoff (1990). The other studies that compared mothers and
fathers (Frank et al., 2005; Shields-Poe & Pinelli, 1997) are, therefore, methodologically flawed.
Further research is needed comparing mothers’ and fathers’ stress scores, as this research gives
health providers important information for targeting resources.
1.5.2 NICU infant characteristics poorly defined
NICU infants’ characteristics have been poorly defined by some studies, as shown in Table
1. Studies have neglected to provide basic information such as gestational age and birth weight
(Miles, 1989; Shields-Poe & Pinelli, 1997), while others have stated the infants had to be “stable” to
be included in their study, but failed to define this term clearly (Miles et al., 1993; Miles et al.,
1991). Blumberg (1980) defined stability in terms of gestational age, birth weight, and medical
diagnosis. In addition, there is huge variation in the way infant health status has been defined, such
as by medical tests, diagnosis, treatment, parental perceptions, and length of time in the unit. These
factors make comparison across studies difficult, because it is unclear whether the parents and
infants being compared have similar characteristics. This limitation is particularly pertinent to
address given that units between regions and countries are thought to have different practices, such
as for admission based on infant characteristics (Ens-Dokkum et al., 1992; Franck et al., 2005; Reid
& Bramwell, 2003). In addition, the more severe parents perceived their infant’s illness was shown
by Shields-Poe and Pinelli (1997) to be a strong factor associated with higher stress from the NICU.

17
1.5.3 Infants unrepresentative of the diverse range admitted to NICUs
Infants sampled in previous studies have been unrepresentative of the diverse range admitted
to NICUs for two reasons. First, the majority of studies in Table 1 placed restrictions on their
samples in terms of infant characteristics. Restrictions include length of time infants were admitted
to the NICU. This restriction appears quite arbitrary because of the variability between studies: at
least 1 day (Shields-Poe & Pinelli, 1997), between 3 days and 3 months (Seidman et al., 1997), less
than 7 days (Perehudoff, 1990), and at least 7 days (Dudek-Shriber, 2004). In addition, the authors
gave no reasons for restricting their samples in this way. Other restrictions include infants having to
be in a stable condition (Miles et al., 1993; Miles et al., 1991), and premature (Miles et al., 1991;
Perehudoff, 1990; Reid & Bramwell, 2003). Second, parents of infants weighing less than 1,500 g
were more likely to refuse to participate in Shields-Poe and Pinelli (1997), therefore this may also be
true of other studies. The other studies cited in Table 1 did not provide parents’ reasons for refusal
to participate. Reid and Bramwell (2003), however, considered it unethical to provide reasons,
given that these parents did not consent to be in the study. Parent refusal rates of studies cited in
Table 1 range from 0-37% (M = 16%). It is possible that these percentages are indicative of parents
of infants with low or extremely low birth weights.
1.5.4 Variation in time of administration of the PSS:NICU within and between studies
Table 1 shows studies have a wide variation in the time of administration of the PSS:NICU,
which may explain inconsistencies in findings. The majority of these studies report wide within
study variation in the time of administration, rather than a more distinct time frame or point. These
times include various points during infant admission (Dudek-Shriber, 2004; Frank et al., 2005;
Miles, 1989), and around the time of infant discharge (Shields-Poe & Pinelli, 1997; Seidman, 1997).
Different times of administration of the scale are also reported between studies, including: within 1
week of infant admission (Miles et al., 1993; Miles et al., 1991; Perehudoff, 1990; Reid &
Bramwell, 2003), 3 weeks after infant admission (Shields-Poe & Pinelli, 1997), and at infant
discharge (Seidman et al., 1997).
Wide variation in time of administration of the PSS:NICU in studies is a limitation because
different events happen at particular times in the unit. In a study by Affonso et al. (1992),

18
interviews were conducted with mothers at four time points or frames, based on different events that
happen related to the infant: 96 hours after birth, when mothers had received news of NICU
admission (Time 1); within 2-3 weeks of life, when health status fluctuated between stable and
instable (Time 2); within 5-6 weeks of life, indicative of improved health status or continued
fluctuations in health stability (Time 3); and the week before discharge from the unit or hospital
(Time 4). Findings showed different frequencies and intensities of stressors for mothers at these
different times. The most common stressor and most intense stressor, respectively, at each time
was: (Time 1) separation from the infant, infant appearance and behaviour; (Time 2) emotional
issues, separation from the infant; (Times 3) financial issues, their partner or spouse; (Time 4)
financial issues, emotional issues. Time of administration of the PSS:NICU is therefore an
important factor to consider, and studies should only be compared with those that administered the
questionnaire at a similar time.
1.6 Summary
With a better understanding of stress, interventions can be developed to mitigate its negative
effects at individual, interpersonal, and societal levels. A potentially stressful life event is the birth
of a fragile infant who is then cared for in a NICU. This event is experienced by a substantial
number of parents, and the stress can affect not only their mental health, but also their partner
relationships and infants’ development. Multiple factors in the experience of parental stress from
the NICU were identified by Wereszckak et al. (1997), and incorporated into the Parental NICU
Stress model. The PSS:NICU (Miles et al., 1993) was selected in the current study to measure the
level of stress experienced from four NICU environment stressors: sights and sounds, infant
appearance and behaviour, parent-infant relationship, and staff. Previous research with the
PSS:NICU, as shown in Table 1, found first that the level of parental stress from the unit ranged
from a little to moderately stressful. Second, some studies found mothers were more stressed
compared to fathers, while other studies found no difference across genders. Third, the greatest
stressor in the unit for mothers was alterations to the parent-infant relationship, while for fathers it
varied. Limitations of the research included: under representation of fathers and lack of mother-
father comparisons, variation in time of administration of the questionnaire, poor definition of infant
characteristics, and biased representation of infants. These limitations provided explanations for
inconsistencies in findings and further justification for the present study. In addition, the

19
psychometric properties of the PSS:NICU had not been assessed with a New Zealand sample,
making this a pertinent additional focus of the current study.
1.7 NICU environment stressor: alteration to the parent-infant relationship
In this section, the NICU environment stressor of alteration to the “normal” parent-infant
relationship is further explained, as it is a focus of the current study. Possible alterations to the
parent-infant relationship were detailed by Griffin (1990): (1) physical separation of the parent and
infant, due to lack of space in the unit or hospital for parents; (2) mechanical barriers between the
parent and infant; (3) parents’ psychological barriers, such as feelings of helplessness and guilt; and
(4) nurses providing expert care for the infant that parents are unable to provide.
Only the Parent-Infant Relationship subscale of the PSS:NICU was investigated further, rather
than all the subscales, for three reasons. First, alteration to the parent-infant relationship was shown
by the majority of studies in Table 1 to be the greatest stressor for parents (Dudek-Shriber, 2004;
Franck et al., 2005; Miles et al., 1993). Second, investigating all the subscales of the PSS:NICU
was beyond the scope of the present study. Third, the Parent-Infant Relationship subscale is likely
to be related to parent’s past experiences of relationships with their own parents and partner, another
focus of the present study. This area of investigation is expanded further in the following sections.
1.8 The link between parental stress from alterations to the parent-infant relationship in the
NICU and past experiences
The link between parents’ level of stress from alterations to the parent-infant relationship in
the NICU and past experiences was not explained in detail in the Parental NICU Stress model
(Wereszczak et al., 1997, refer to Figure 2). Reasons for this situation are that the stress theories on
which the model was based were not specific to the NICU, and the paucity of research on the
personal characteristics of parents of NICU infants (Wereszczak et al., 1997). The current study is
particularly valuable because it attempts to describe the link between stress from alterations to the
parent-infant relationship in the NICU and past experiences. Due to the lack of specific theory and
research addressing this link, broad theory and research are reviewed in this section.

20
Literature in support of the link between parental stress and past experiences includes the
developmental theory of continuity, whereby past experiences and the individual’s adjustment to
these are thought to influence later psychological functioning (Belsky, 1984; Sroufe, 1979).
Positive past experiences are thought to promote later healthy functioning; conversely, aversive past
experiences are thought to increase an individual’s vulnerability to stress, such as from parenting.
Holditch-Davis and Miles (2000) provided empirical support for continuity theory that was specific
to the NICU. The authors utilised a small convenience sample of mothers (n = 31) of preterm
infants, who were cared for in the NICU until they were 6 months old. Mothers were asked about
their experiences of the unit in the form of a semi-structured interview, and responses were coded
into themes based on the Preterm Parental Distress model (Holditch-Davis & Miles, 2000). There
was some indication that past experience was a factor in the level of stress experienced from the
unit. Past experience was indirectly measured, however, so mothers may have assumed it was too
far removed from their experience of the unit to report.
One important kind of past experience in an individual’s life is relationships. Two major
relationships in individuals’ lives are those with their parents and their partner. Difficulties with
these relationships were theorised by Klaus and Kennell (1970) to disturb the normal mother-infant
relationship. Minde, Whitelaw, Brown and Fitzhardinge (1983) investigated this idea empirically in
the NICU environment. These authors sampled 184 mothers of premature, low birth weight infants
who had a wide variety of illnesses from a NICU in Canada. The mothers were given a semi-
structured interview, which included questions about relationships with their parents and the father
of their infant. This interview was conducted 3-4 weeks after infant NICU admission. A positive
association was found between mothers’ past relationships and mother-infant interactions, for
infants who were well or had short illnesses. In a similar study by Minde, Marton, Manning and
Hines (1980), a smaller number of mothers of pre-term infants were sampled (n = 32). Mothers’
high level of interaction with their infants, considered favourable, was associated with positive
relationships with their own mothers and the fathers of their infants.

21
1.8.1 The link between the parent-infant relationship in the NICU and parents’ relationships with
their own parents in childhood
One conceptualisation of relationship continuity is based on the quality or style of parenting
displayed by the individual’s parents. Two parental qualities have been consistently identified in the
literature: care and overprotection (Parker, Barrett & Hickie, 1992; Parker, Tupling & Brown,
1979). Care has been defined as “affection, emotional warmth, empathy and closeness” (Parker et
al., 1979, p. 8). Overprotection has been defined as control, “intrusion, excessive contact,
infantilisation, and prevention of independent behaviour” (Parker et al., 1979, p. 8; also Levey,
1970). Care appears to be the stronger construct of the two, as it accounted for more of the variance
in a factor analysis by Parker et al. (1979). In this analysis, over 500 adults were included, who
retrospectively identified their parents’ behaviours and attitudes in childhood. In a review by Parker
(1990), deficient care or high overprotection demonstrated by parents towards their children was
linked to children’s vulnerability to mental illness in adulthood.
A similar link was explored by Assel et al. (2002), but between parenting qualities an
individual received in childhood, stress experienced in adulthood, and parenting qualities the
individual employed with their own child. A large group of mothers (n = 180) of preterm infants
with no significant medical illnesses were recruited. Parenting received as a child was measured
using the Parental Acceptance Rejection Questionnaire, emotional stress was measured using the
Symptom Checklist 90, and parenting qualities demonstrated towards their own children were
observed in a structured manner. The constructs of “warm responsiveness” and “restrictiveness”
were assessed in the observations, which correspond to care and overprotection, respectively.
Structural equation modelling revealed significant pathways of influence: mothers who reported
harsh and neglecting parenting qualities of their parents reported higher levels of stress, and
displayed lower levels of warmth towards their own children. The pathway from maternal
emotional stress to maternal restrictiveness was not significant. A limitation with this study,
however, was the way maternal restrictiveness was defined. The definition allowed this quality to
be either positive or negative.
In another study by Carter, Mulder & Darlow (2007), early care and overprotection were
investigated specifically in relation to stress from the NICU. A sample similar to that used in the
present study was utilised: 172 mother-father couples of infants who were being cared for in a

22
NICU. The authors used multiple measures that included the Parental Bonding Instrument (PBI;
Parker et al., 1979), which retrospectively measured qualities of early parenting received during
childhood, and the PSS:NICU. A linear mixed model analysis included the PBI subscales of care
and overprotection as independent variables, and the PSS:NICU and its subscales as dependent
variables. Findings showed maternal care received as a child was negatively associated with the
total PSS:NICU. No significant effects were found, however, regarding the PSS:NICU Parent-
Infant Relationship subscale or the PBI Overprotection subscale.
Another conceptualisation of a parent’s relationships with his or her own parents in
childhood is in terms of a bond. Various definitions of a bond are described in the literature, such
as: feelings of love by a parent towards his or her infant (Bowlby, 1979; Gleitman, 1995; Sammons
& Lewis, 1985); or a long enduring tie to an important and unique individual, who can not be
replaced with any other individual (Ainsworth, 1991). Ainsworth (1991) theorised that an
affectional bond develops in the context of a relationship, becomes internally represented in an
individual, and exists after the relationship has finished. The definition of bond type used in the
present study was provided by Parker et al. (1979), and is stated in terms of care and overprotection
qualities demonstrated by a parent to his or her child. High care and low overprotection correspond
to an optimal bond; other combinations of care and overprotection, including high care and high
overprotection, low care and low overprotection or low care and high overprotection, correspond to
a distorted bond.
A theory related to the concept of a bond is attachment theory. Ainsworth (1991) defined a
secure attachment as the “experience of security and comfort in the relationship with the partner” (p.
38). In contrast, insecure attachment styles include anxious, dismissive-avoidant, and fearful-
avoidant (Rholes & Simpson, 2004). The terms bond and attachment have been used
interchangeably by some authors (Gleitman, 1995; Rholes & Simpson, 2004); whereas Ainsworth
(1991) used “affectional bond” as a broad term encompassing bond and attachment. An attachment
is generally thought of as operating in the direction of an infant towards his or her parent; in
contrast, a bond operates in the direction of a parent towards his or her infant.
The type or style of attachment an individual develops in childhood was theorised by
Bowlby (1979) to remain relatively unchanged into adulthood, and influence close relationships,
such as that with the individual’s child. In a secure attachment, the infant’s signs of distress are

23
responded to sensitively by the caregiver in a timely manner (Mikulincer & Florian, 1998), and an
internal working model is developed that allows the child to seek help from others in stressful
situations (Feeney, 2004). In contrast, in an insecure attachment, the infant’s distress is
inadequately regulated by the caregiver (Mikulincer & Florian, 1998), who is unavailable,
unresponsive, or unpredictable (Sroufe & Waters, 1977). Moreover, an internal working model is
formed where alternative, less efficient strategies to social support are implemented in stressful
situations (Feeney, 2004). The internal working model is thought to affect later behaviour and
emotional processes that are particularly triggered when attachment relevant stressors occur (Rholes
& Simpson, 2004), such as parenthood.
Mikulincer and Florian (1988) provided empirical support for attachment theory in two
separate, but similar, studies: the first investigated adjustment to parenting of a healthy child; the
second, investigated adjustment to parenting of a child with a mild mental handicap. The sample in
the first study consisted of 80 mothers who had given birth to their first child 2-3 months previously,
and 80 control women who had no children. The sample in the second study was smaller: 44
mothers who had a 4-5 year old child with a mild mental handicap, and 44 control mothers. The
measures utilised in both studies were the Attachment-Style Scale (Hazan & Shaver, 1987), and the
Mental Health Inventory (Veit & Ware, 1983). The findings across the two studies were similar:
mothers with secure attachment styles in the experimental group experienced a similar level of stress
to the control group. This level of stress was significantly lower than that seen in mothers in the
experimental group who had insecure attachment styles.
1.8.2 The link between the parent-infant relationship in the NICU and the mother-father
relationship
Attachment theory can also be used to conceptualise the link between the parent-infant
relationship in the NICU and the mother-father relationship. Although Bowlby (1979) took the
strict stance that early attachment models remain relatively unchanged into adulthood, later
attachment theorists were more lenient. These theorists posited that early models may be modified
through important relationships with others, such as a partner (Bartholomew, 1993; 1994; Rholes &
Simpson, 2004). The majority of principles, however, are the same in early and later versions of
attachment theory. One such principle is that adult attachment styles affect close relationships,

24
behaviour processes and emotional processes, particularly in stressful attachment relevant situations
(Rholes & Simpson, 2004), such as alteration to the parent-infant relationship in the NICU.
Feeney (2004) investigated the link between adult attachment style, in the context of the
couple relationship, and parent-infant relationship stress. In Study 1, the sample consisted of 92
married couples from Australia, who participated voluntarily. Questionnaires were used to measure
attachment style and stress during two time frames: Time 1, during the second trimester of the
women’s pregnancies; and Time 2, 4-6 weeks after the women gave birth. A structural equation
model provided partial support for the link between attachment style and parenting strain:
relationship anxiety predicted parenting being rated as stressful for men, but not for women. In
Study 2, the Australian sample consisted of 75 married couples with a child, and 75 married couples
who were childless. The study had a prospective design, with measures taken at the same time
frames as Study 1. Questionnaires tapping attachment security were utilised during Time 1, and a
measure of maternal depression was taken at Times 1 and 2. Regression analysis indicated that for
the wives with a child, controlling for depression at Time 1, relationship insecurity at Time 1
predicted depression at Time 2. This effect was not found for the childless (control) wives.
Attachment theory also allows the partner relationship to be conceptualised as a support.
Miles, Carlson and Funk (1996) defined support as interpersonal transactions perceived as helpful in
decreasing stress. In a study conducted by Doering, Moser and Dracup (2000), the link between
social support and decreased stress from the NICU was supported. These authors utilised a
convenience sample of 469 parents, which included 136 mother-father pairs. The parents completed
a set of questionnaires prior to their infants’ discharge from the unit. The questionnaires measured
anxiety, depression, hostility, adjustment to their infants’ illness, perceived social support, family
functioning, and perceived control of their infants’ health. In a stepwise multiple regression with
these variables, where anxiety, depression, hostility, and adjustment were treated as outcome
measures, 17-29% of the total variance was explained. Lower levels of social support were shown
to be significantly associated with higher levels of anxiety, depression, hostility, and poorer
adjustment to their infants’ illnesses.

25
1.9 Summary
Alteration to the parent-infant relationship in the NICU is a salient stressor for parents, and is
likely to be related to past experiences of relationships with their own parents and partner. This link
was not detailed in the Parental NICU Stress model (Wereszczak et al., 1997), probably due to lack
of specific theory and research. Care or overprotection in an individual’s childhood has been linked
to level of stress experienced when the individual becomes a parent (Assel et al., 2000; Carter,
Mulder & Darlow, 2007). The link was theorised to occur by way of an internalised attachment
style (Parker et al., 1979; Ainsworth, 1991). Similarly, attachment theory was used to conceptualise
the link between stress from alterations to the parent-infant relationship and the mother-father
relationship. This link has received empirical support, with partner relationship security predictive
of level of stress experienced by parents (Doering et al., 2000; Fenney, 2004).
1.10 Overall summary
To investigate the stresses to parents arising from having an infant admitted to a NICU, the
current study was conducted in three parts. The aim of Part A was to assess the psychometric
properties of the PSS:NICU with a New Zealand sample. Because a small number of studies in
different countries have found the scale to be valid and reliable (Franck et al., 2005; Miles et al.,
1993; Reid & Bramwell, 2003), it was hypothesised this would be the case in New Zealand.
The aim of Part B was to describe the level and sources of stress experienced by parents of
infants admitted to a New Zealand NICU using the PSS:NICU, as was done in previous studies
listed in Table 1. The findings of these studies can be summarised as follows. First, the level of
parental stress from the NICU ranged from a little stressful to moderately stressful. Second, some
studies found mothers were more stressed than fathers, while other studies found no difference
across genders. Third, the greatest stressor for mothers in the NICU was alterations to the parent-
infant relationship. It was therefore hypothesised that this would be the case for mothers in the
current study. For fathers, findings varied as to which stressor had the greatest impact. No other
hypotheses were formulated because of the inconsistencies in the findings of previous research.

26
The aim of Part C was to examine the extent to which parents’ stress from alterations to the
parent-infant relationship in the NICU is linked to relationships with: (1) their own parents in
childhood, and (2) their partners. Due to the lack of theory and research addressing these specific
links, only exploratory hypotheses were made in the current study. First, a hypothesis was made
regarding a link between stress from the parent-infant relationship in the unit and care parents
received from their own parents in childhood. No hypothesis was made regarding overprotection
received as a child, because it was the weaker of the two factors, care and overprotection. Second, a
hypothesis was made regarding a link between stress from the parent-infant relationship in the unit
and a parent’s adjustment to his or her partner relationship.
1.11 The current study: specific aims and hypotheses
The aims and hypotheses of the current study are detailed in this section according to three
parts: A, B, and C.
PART A
Aim 1
To assess the psychometric properties of the PSS:NICU using a sample of mothers and fathers
whose infants were being cared for in the NICU at Christchurch Women’s Hospital, New Zealand.
Hypothesis 1
Overall, the PSS:NICU will be valid and reliable when used with a sample of mothers and fathers
whose infants were being cared for in the NICU at Christchurch Women’s Hospital.
PART B
Aim 2
To describe and compare the level and sources of stress experienced by mothers and by fathers from
the NICU at Christchurch Women’s Hospital. Sources of stress include: sights and sounds of the
NICU, infant appearance and behaviour, alterations to the parent-infant relationship, and staff
communication.

27
Hypothesis 2
The greatest source of stress in the NICU at Christchurch Women’s Hospital for mothers will be
alterations to the parent-infant relationship.
PART C
Aim 3
To examine the extent to which mothers’ and fathers’ stress on the Parent-Infant Relationship
subscale of the PSS:NICU is associated with the parenting they received as children.
Hypothesis 3
The level of stress reported by mothers and by fathers from alterations to the parent-infant
relationship in the NICU will be negatively correlated with the level of care they received from their
parents as children.
Aim 4
To examine the extent to which mothers’ and fathers’ stress on the Parent-Infant Relationship
subscale of the PSS:NICU is associated with adjustment to their couple relationships.
Hypothesis 4
The level of stress reported by mothers and by fathers from alterations to the parent-infant
relationship in the NICU will be negatively correlated with level of couple adjustment.

28
2. METHOD
2.1 Setting
The setting for the current study was the NICU of Christchurch Women’s Hospital in
Canterbury, New Zealand. This unit services a wide geographical area that typically produces 7000
births annually. Infants in the area are admitted to the unit for a variety of reasons including a birth
weight of less than 1,800g, gestation of less than 34 weeks, or substantive illness. The NICU has
the facilities and expertise to cater for Level III or high dependency infants (from 24 weeks
gestation), including those needing ventilation or intravenous feeding (Ministry of Health, 2005).
2.3 Participants and recruitment
The participants in this study were mothers and fathers of infants who were admitted to the
NICU, and were recruited as part of the PARENTS study. There were 578 infants admitted to the
unit in the target year, from February 2001 to February 2002, and a selection of 296 of these infant’s
mothers were approached for recruitment into the PARENTS study. Of the 296 infants, the majority
(n = 290) were selected from the NICU admission register using random numbers. In the last 4
months of recruitment, owing to the number of admissions to the unit falling below the expected
number, all mothers of NICU admissions were approached to take part in the PARENTS study. Of
the 296 mothers, 242 (82%) provided informed consent to participate in the study. A father was
only asked to be a participant if he was cohabitating with the mother of the infant (n= 212). Of these
212 fathers, 205 (97%) provided informed consent to participate in the study. The most common
reason given by parents for refusal to participate was time constraint.
Of the recruited mothers (n = 242) and fathers (n = 205) in the PARENTS study, inclusion
criteria for the present study were as follows. First, the parent had to have returned their PSS:NICU,
which was necessary for all the main statistical analyses. This criterion excluded 30 mothers and 22
fathers. Second, the mother of the infant had to be in a cohabitating relationship with the father,
because Aim 4 focused on this cohabitating relationship, and fathers were only recruited if they
were cohabitating with the mother. This criterion excluded one mother who was living in a

29
homosexual de facto relationship, and 29 mothers whose marital status was either separated,
divorced, widowed, or single. Therefore, a total of 182 mothers and 183 fathers participated in the
current study.
2.3 Procedure
The PARENTS study was approved by the Canterbury Ethics Committee. Mothers and
fathers were approached by the PARENTS study researchers following their infant’s birth for
written informed consent to participate. Following consent, parents were asked to provide their
contact details within 24 hours, and self-report questionnaires were distributed to them. Participants
were asked to complete the questionnaires independently of their partner. Information regarding the
main variables of interest in the current study was provided by these questionnaires. The clinically
trained interviewer then made contact with consenting parents within 2-3 weeks (M = 17.63 days,
SD=11.81), to conduct a structured clinical interview and collect completed questionnaires.
Interviews with parents were carried out individually, at either Christchurch Women’s Hospital or
their family home. Information regarding mothers’ and fathers’ background characteristics in the
present study was obtained from these interviews. If this information was jointly applicable to the
couple, it was collected from only the mothers. Following the parents’ consent, information on their
infants’ clinical characteristics was obtained from the FOOTPRINT study.
2.4 Mothers’ and fathers’ background characteristics
Table 2 describes the background characteristics of the mothers and fathers who participated
in the current study. During the interview, a characteristic was recorded or coded into the most
applicable category. Marital status was coded into: 1=married, 2=de facto, 3=separated,
4=divorced, 5=widowed, or 6=never married. De facto was defined as a cohabitating relationship of
any length of time. Mothers who were separated, divorced, widowed, or never married were
excluded from the present study, according to the rationale described in Section 2.2. Mothers were
asked whether her current partner was the father of her baby, and the answer coded as yes or no.
Family income before tax for the last 12 months was coded as: 1= less than $15,000; 2= $15,000 –
less than $25,000; 3=$25,000 – less than $40,000; 4=$40,000 – less than $50,000; 5=$50,000 – less

30
than $70,000; 6=$70,000 and above. Age at last birthday was requested from each parent. Parent’s
qualifications or level of high school education were recorded or coded as follows: School
Certificate in one or more subjects (yes or no), Sixth Form Certificate (yes or no), seventh form (yes
or no), further qualification since leaving school (yes or no), type of further qualification if any.
Seventh form level is equivalent to what is presently called Year 13 in New Zealand. Qualifications
or education levels were combined in the current study, and overlapping information deleted, to
provide a more concise single variable. This new variable was termed highest qualification or
education level: 0=no School Certificate, 1=School Certificate in one or more subjects, 2=Sixth
Form Certificate, 3=seventh form, 4=trade or secretarial qualification, 5=professional qualification
with or without a degree. Parents also specified their ethnicity: 1=NZ European, 2=NZ Maori,
3=Other European, 4=Samoan, 5=Tongan, 6=Niuean, 7=Asian, or 8=Other.
Table 2 shows mothers’ and fathers’ characteristics analyzed according to means, standard
deviations, frequency counts, and percentages, as appropriate to the data. For relational status, the
majority of couples were married (68%), with the remaining in a de facto relationship (32%). All
mothers stated that their current partner was the father of their baby. Total family income was
relatively evenly spread among most of the income brackets, as each of these income brackets
contained around 20% of families: $25,000 – less than $40,000; $40,000 – less than $50,000;
$50,000 – less than $70,000; and $70,000+. According to their mean ages, fathers (M = 33.23, SD =
5.95) were older than mothers (M = 30.80, SD = 4.68). Moreover, a dependent samples t-test, using
matched couples, showed that fathers’ mean age was significantly higher than mothers’ mean age,
t(178) = 7.25, p < .000. Mothers appeared to obtain a similar highest qualification or education
level compared to fathers. Furthermore, regarding this variable, a Wilcoxin signed ranks test using
matched couples showed that mothers were not significantly different from fathers, Z(178) = -1.69,
p = .091. Lastly, the most frequently endorsed ethnicity was NZ European for both mothers (80%),
and fathers (82%).

31
Table 2
Mothers’ and Fathers’ Background Characteristics
Characteristic
Mothers N = 182 Mean (SD) or % (n)
Fathers N = 183 Mean (SD) or % (n)
Relational statusa
Married Defacto
68% (124) 32% (58)
Partner father of baby Yes No
100% (182)0% (0)
Total family income for previous year ab
<$15,000 $15,000 - < $25,000 $25,000 - < $40,000$40,000 - < $50,000 $50,000 - < $70,000 $70,000+
2% (3)11% (20)21% (38)20% (36)22% (40)24% (44)
Age (years) 30.80 (4.68) 33.23 (5.95)
Highest qualification or education level No School Certificate School Certificate (1+ subjects) Sixth Form Certificate Seventh form Trade or secretarial qualification Professional qualification
13% (24) 15% (28)
8% (14) 7% (12)
25% (45) 32% (59)
8% (15)13% (23)
5% (10)8% (14)
41% (75)25% (46)
Ethnicity New Zealand European New Zealand MaoriOther European Samoan Tongan Nieuan Asian Other
80% (145) 5% (10) 9% (16) 0% (0) 0% (0) 0% (0)2% (4)
4% (7)
82% (150)4% (7)8% (14)1% (2)0% (0)0% (0)0% (1)5% (9)
Note: aThe information for “relational status,” “partner father of baby,” and “total family income for previous year” was collected from only the mothers, but relates to the couple. bOne mother’s data point is missing.

32
2.5 Infants’ clinical characteristics
Infants’ clinical characteristics examined in the current study were: gestational age; birth
weight; whether the infant was a singleton or part of a multiple birth; and the primary reason a near
or full-term infant was admitted to the NICU. In the case of a multiple birth, the weight of the
smaller infant was recorded, and only live births were recorded. A descriptive profile was obtained
of the 183 infants, consisting of frequency counts, percentages, ranges, means, and standard
deviations.
Figure 3 shows the distribution of infants according to their number of weeks gestation.
According to the definitions used by Dudek-Shriber (2004), most of the infants (51%, n = 94) were
premature (28-36 weeks), a large number of infants (44%, n = 80) were full-term (37-42 weeks), and
a small number of infants (5%, n = 9) were extremely premature (less than 28 weeks). The mean of
infants’ gestational ages was 35.45 (SD = 3.73).
0
5
10
15
20
25
30
23 24 25 26 27 28 29 30 31 32 33 34 35 36 37 38 39 40 41 42
Gestation (weeks)
Num
ber
of in
fant
s
Figure 3. The distribution of infants according to gestational age.

33
Figure 4 shows infants’ birth weights, according to categories used by Dudek-Shriber
(2004). Most infants (54%, n = 98) had an average birth weight, a large number of infants (35%, n
= 64) had a low birth weight, and a small number of infants had a very low or an extremely low
birth weight (11%, n = 21). Infants’ birth weights ranged from 510 to 4850g, and the mean was
2577.93 (SD = 911.86).
0
20
40
60
80
100
120
extremely low: <1,000g very low: 1,000 - <1,500g low: 1,500 - 2,500g average: >2,500g
Birthweight
Num
ber
of in
fant
s
Figure 4. The distribution of infants according to birth weight category.
With regard to infants’ multiple birth status, 161 were singletons, and 22 were one of a set of twins.
In the PARENTS study, the primary reasons near or full term infants, defined as 36-42 weeks
gestation, were admitted to the unit were: respiratory distress (36%), hypoglycemia (16%),
suspected sepsis (9%), feeding difficulty (8%), possible hypoxic-ischaemic encephalopathy (7%),
jaundice treatment (6%), and surgical conditions (5%).
34
2.6 Self-report measures
The self-report questionnaires selected for use in the current study, from the PARENTS
study, were as follows: the PSS:NICU, the Hospital Anxiety and Depression Scale – Anxiety
subscale (HADS-A; Zigmond & Snaith, 1983), the State-Trait Anxiety Inventory – Trait subscale
(STAI-T; Spielberger, Gorsuch, & Lushene, 1970), the Parental Bonding Instrument (PBI; Parker et
al., 1979), and the Dyadic Adjustment Scale (DAS; Spanier, 1976). The PSS:NICU was the primary
measure selected in the current study, and was used in Parts A, B, and C. This scale enabled the
Part A and B aims (Aims 1 and 2) to be met. The HADS-A and STAI-T were selected to examine
their association with the PSS:NICU or the construct validity of the PSS:NICU, a component of
Aim 1. Anxiety measures were chosen for this purpose because anxiety and stress are thought to be
closely related constructs (Quick et al., 2000). The measures selected that enabled the Part C aims
to be met were: The Parent-Infant Relationship subscale of the PSS:NICU (Aims 3 and 4), the PBI
(Aim 3), and the DAS (Aim 4).
2.6.1 Parental Stressor Scale: Neonatal Intensive Care Unit (PSS:NICU)
The PSS:NICU contains 46 items, corresponding to four subscales and a general stress item.
The four subscales and their numbers of items are as follows: Sights and Sounds, 5 items; Infant
Appearance, 19 items; Parent-infant Relationship, 10 items; and Staff, 11 items. Permission was
obtained from the authors to use the scale, and it is reproduced in Appendix A. Participants were
asked to rate each item, according to how stressful the situation described in each item was for them:
1=not at all stressful, 2=a little stressful, 3=moderately stressful, 4=very stressful, and 5=extremely
stressful. Stress was defined as feeling anxious, upset or tense. If participants had not experienced a
particular situation, they were asked to indicate this by answering “not applicable”. If a participant
had multiple infants in the unit, questions on the scale relating to a single infant were requested to be
answered with regard to the most applicable infant.
The PSS:NICU allows three scoring methods: Metric 1 or Stress Occurrence Level, Metric 2
or Overall Stress Level, and Frequency or the number of situations experienced by a parent (Miles &
Funk, 1998). Metric 1 measures the level of stress experienced only when the situation(s) occur.

35
This scoring method only employs items that have been rated from 1-5 by a parent, so items rated
“not applicable” are treated as missing. The possible range of total scores, according to Metric 1
are: Sights and Sounds (0-25); Infant Appearance (0-95); Parent-Infant Relationship (0-50); Staff (0-
55); General Stress (0-5); and the whole scale (0-230). Metric 2 measures the overall stress
experienced from the NICU. In this scoring method, an item rated as “not applicable” by a
participant is given a score of one. The possible range of total scores, according to Metric 2, are:
Sights and Sounds (1-25); Infant Appearance (1-95); Parent-Infant Relationship (1-50); Staff (1-55);
General Stress (1-5); and the whole scale (1-230). For both Metric 1 and Metric 2, high scores
indicate high levels of stress. Lastly, the Frequency scoring method simply counts the number of
situations experienced by a parent, according to each subscale or the total scale. This method of
scoring was not used in the current study.
The scoring methods of Metric 1 and Metric 2 were used to meet Aims 1 and 2 in the current
study. Metric 2 was used to meet Aims 3 and 4, as recommended by Miles and Funk (1998),
because the focus was the amount of overall stress experienced by parents from the unit. The
psychometric properties of the PSS:NICU were not stated in this section, because they were
previously reported in the Introduction chapter.
2.6.2 Hospital Anxiety and Depression Scale – Anxiety subscale (HADS-A)
The Hospital Anxiety and Depression Scale (HADS) was designed to measure anxiety and
depression symptoms of individuals in a hospital setting (Zigmond & Snaith, 1983). Symptoms
relating to both anxiety and depression were not included in the scale, to achieve a more accurate
measure of each (Zigmond & Snaith, 1983). Hence, the HADS consists of two subscales: the
Anxiety subscale; and the Depression subscale. The current study used only the HADS Anxiety
subscale (HADS-A), which measures a transitory state of anxiety (Snaith & Zigmond, 1994). The
HADS-A has seven statements that participants were asked to rate according to the past week
(Zigmond & Snaith, 1983). The Likert-type rating scale ranges from 0-3, and refers to agreement,
frequency, or severity of each particular statement. The subscale takes only 1-3 minutes to complete
(Herrmann, 1996). With regard to scoring (Zigmond & Snaith, 1983), first the items 1, 3, 5, 11, 13
are reverse scored. The HADS-A items are then summed to obtain a subscale total for each

36
individual (Snaith & Zigmond, 1994). The possible range of the total subscale score is 0-21, with a
high score indicating a high level of anxiety (Zigmond & Snaith, 1983).
The HADS-A was developed from the Hamilton Anxiety Scale, and standardised on a
sample of non-psychiatric hospital outpatients (16-65 years old), who were compared to a control
group (Zigmond & Snaith, 1983). In a review of studies that utilised the HADS, Bjelland, Dahl,
Haug and Neckelmann (2002) concluded that the HADS was a valid and reliable measure when
used with physically ill patients, psychiatric patients, and the general population.
Validity information has been provided for the HADS-A, in the form of factor analyses and
construct validity. In the majority of studies reviewed by Bjelland et al. (2002) and Herrmann
(1997), a two factor structure was obtained corresponding to the Anxiety and Depression subscales.
With regard to construct validity, the HADS-A has been correlated with a psychiatric interview
rating of anxiety, r=.74, p<.001 (Zigmond & Snaith, 1983). In other construct validity analyses
(Bjelland et al., 2002), the HADS-A was compared to these other commonly used anxiety
questionnaires: the General Health Questionnaire, Spielberger State-Trait Anxiety Inventory; the
Clinical Anxiety Scale; the Symptom Checklist 90 scale; and the Hamilton Anxiety Scale.
Correlation coefficients between the HADS-A and these anxiety questionnaires were good, ranging
from .44 to .81.
Reliability information for the HADS-A has been provided in the forms of internal
consistency and test-retest reliability. Internal consistency was shown to range from r = .41 to r =
.93 (Bjelland et al., 2002; Hermann, 1996; Zigmond & Snaith, 1983). In three studies reviewed by
Herrmann (1996), test-retest reliability was r = 0.84 over a 2 week period, and r = 0.70 over a 6
week period.
The HADS-A was utilised in the current study to assess the construct validity of the
PSS:NICU for two reasons. First, it was designed specifically for use in a hospital setting (Zigmond
& Snaith, 1983), to minimize the effect of physical health condition on test scores. Second, lots of
research has supported its validity and reliability (Bjelland et al., 2002; Herrmann, 1996; Zigmond
& Snaith, 1983).

37
2.6.3 State-Trait Anxiety Inventory - Trait subscale (STAI-T)
The State Trait Anxiety Inventory (STAI), Form X, consists of two subscales designed to
separately measure trait and state anxiety (Spielberger et al., 1970). The present study utilised the
STAI Trait subscale (STAI-T), to measure the stable propensity of individuals to react to situations
perceived as threatening. Only the trait subscale was utilised, rather than both the subscales, as state
anxiety was measured with the HADS-A. The questions in the STAI-T were developed from other
trait anxiety measures, and standardised on more than 3,000 college students; 500 psychiatric or
medical patients; and approximately 200 prisoners (Spielberger et al., 1970).
In accordance with the STAI instruction, each participant was asked to rate 20 statements
according to how he or she generally felt (Spielberger, et al., 1970). The rating system uses a
Likert-type scale, whereby 1=almost never, 2= sometimes, 3= often, and 4=almost always. The
STAI-T takes approximately 8-10 minutes for a participant to complete.
With regard to scoring, first items that were positively worded were reverse scored: 1; 6; 7;
10; 13; 16; and 19 (Spielberger et al., 1970). There were 15 individuals who did not respond to a
minority of items in the STAI-T (one to three items per individual). For such an individual, the
mean of the items that had been completed was calculated and used to provide a score for items with
no responses. The total subscale score was then calculated by summing the item scores for each
individual (Spielberger et al., 1970). The possible range of the total subscale score is 20 to 80, with
high scores indicative of a high level of anxiety (Spielberger et al., 1970).
The validity of the STAI-T has been examined with factor analyses, interscale correlations,
and concurrent validity analyses. In a review of previous literature that examined the factor
structure of the STAI, Ramanaiah, Franzen & Schill (1983) concluded there were inconsistent
findings on the number and nature of factors in the STAI. Interscale correlations, between the STAI
Trait and State subscales, have been reported to range from .44 to .69 (Ramanaiah et al., 1983;
Spielberger et al., 1970). In concurrent validity analyses, correlations were calculated by
Spielberger et al. (1970), between the STAI-T and other measures of trait anxiety: the Institute for
Personality and Anxiety Testing Anxiety Scale; and the Taylor Manifest Anxiety Scale. These
correlations were high, ranging from .75 to .83.

38
Reliability of the STAI-T has been supported in the forms of internal consistency and test-
retest reliability. Good internal consistency was indicated with Cronbach’s alpha coefficients that
ranged from r = .86 to r = .92 (Knight, Waal-Manning & Spears, 1983; Ramanaiah et al., 1983;
Spielberger et al., 1970). Test-rest data for the STAI-T over one hour showed reasonably high
correlations that ranged from r = .73 to r = .86 (Spielberger et al., 1970).
The STAI-T was used in the present study to assess the construct validity of the PSS:NICU
for three reasons. First, this procedure ensures ease of comparison of the present study to earlier
studies that have utilised this procedure (Franck et al., 2005; Miles et al., 1991). Second, research
has supported the subscale’s psychometric properties (Knight et al., 1983; Ramanaiah et al., 1983;
Spielberger et al., 1970). Third, the validity of the STAI-T with a large New Zealand sample,
similar to the sample used in this study, has been supported (Knight et al., 1983).
2.6.4 Parental Bonding Instrument (PBI)
The PBI was designed by Parker et al. (1979) to retrospectively measure perceived parental
input to a parent-child bond. These authors stated a potential use of the scale as investigating the
influence of parents on the psychological and social functioning of an individual. There are two
subscales of the PBI, theoretically derived: (1) Care, pertaining to warmth, affection, and empathy,
as opposed to indifference or rejection; and (2) Overprotection, pertaining to parental control over a
child, intrusion and excessive contact, as opposed to allowance of autonomy and independence.
The PBI was typically administered to each participant twice, first regarding the mother, and
second regarding the father. Participants were requested to not answer the questionnaire if it was
not applicable to the particular parent, that is if the parent was absent from the participant’s
childhood. Participants were asked to retrospectively rate attitudes and behaviours of their parents,
during the participants’ first 16 years of life (Parker et al., 1979). There are a total of 25 items in the
scale: the Care subscale contains 12 items, and the Overprotection subscale contains 13 items.
Participants rated each item on a four point Likert-type scale, that ranged from 0=very like, to 1=
moderately like, to 2=moderately unlike, to 3=very unlike. The PBI is not copyrighted, and is shown
in Appendix B. Four measures for each participant were possible: maternal care, maternal
overprotection, paternal care, and paternal overprotection.

39
With regard to scoring, items that were negatively termed in the Care subscale (items 2, 4,
14, 16, 18, 24), and positively termed in the Overprotection subscale (items 3, 7, 15, 21, 22, 25)
were reverse scored (Parker et al., 1979). Individual’s subscale scores were then calculated by
summing the scores of items according to each subscale. The possible ranges of the subscale scores
are: 0-36 for the Care subscale, and 0-39 for the Overprotection subscale. A high score on the Care
subscale or Overprotection subscale indicates a high degree of care or overprotection, respectively.
Conversely, a low score on the Care subscale or Overprotection subscale indicates a low degree of
care or overprotection, respectively.
The validity of the Care and Overprotection subscales has been supported by factor analyses
in clinical and non-clinical samples (Mackinnon, Henderson, Scott & Duncan-Jones, 1989; Parker et
al., 1979; Parker, 1990). Two factors were found in these studies, the first indicative of care versus
indifference and/or rejection. The second factor was indicative of control and/or overprotection
versus allowance of autonomy and independence. These factors explained 28% and 17% of the
variance, respectively (Parker et al., 1979).
Reliability of the PBI has been demonstrated via split-half reliability, and test-retest
reliability. In the study by Parker et al. (1979), split-half reliability coefficients of r = 0.88 for the
Care subscale, and r = 0.74 for the Overprotection subscale were reported. In other studies, test-
retest reliability coefficients ranged from r = 0.63 to r = 0.95 for the Care subscale, and from r =
0.56 to r = 0.90 for the Overprotection subscale (Mackinnon et al., 1989; Wilhelm & Parker, 1990).
These test-retest coefficients were moderate when measured over yearly periods up to 10 years, and
high when measured over monthly periods.
There were three reasons the Parental Bonding Instrument (PBI) was used in the current
study. The primary reason was that the PBI is the only scale that retrospectively measures an adult’s
childhood relationship with his or her parents. The second reason was that the PBI was standardised
on an Australian sample (Parker et al., 1979), and subsequently used with other Australian samples
(MacKinnon et al., 1989; Wilheim & Parker, 1990). New Zealanders are most comparable to
Australians, as opposed to other ethnicities, due to similarities in language and culture. Finally, the
PBI appears to be valid and reliable (MacKinnon et al., 1989; Parker 1990; Parker et al., 1979;
Wilhelm & Parker, 1990).

40
2.6.5 Dyadic Adjustment Scale (DAS)
The Dyadic Adjustment Scale (DAS) was used in the present study, because it was designed
to measure the quality of adjustment of an individual to his or her couple relationship (Spanier,
1976). The scale was developed mainly from items of previous marital adjustment scales, and from
a few newly developed items. There are four subscales in the DAS. The Dyadic Satisfaction
subscale measures happiness or satisfaction, and includes items about the frequency of arguments,
and extent to which the individual has considered separation. The Dyadic Cohesion subscale
measures amount of time spent on interests and activities together, such as recreation, discussion,
and projects. The Dyadic Consensus subscale measures agreement on major issues in the
relationship, such as money, friends, religion, and household tasks. Lastly, the Affectional
Expression subscale measures agreement about and the expression of love, sex, and affection.
There are a total of 32 items in the DAS: Dyadic Satisfaction subscale, 10 items; Dyadic
Cohesion subscale, 5 items; Dyadic Consensus subscale, 13 items; and Affectional Expression
subscale, 4 items (Spanier, 1976). Participants, for the majority of items, were asked to rate each
item on a 6-point scale. The Likert-type scale was used, in conjunction with a particular item, as a
measure of agreement, frequency, happiness, or perception of the future of the relationship. The
DAS is reproduced in Appendix C, with permission from the author of the scale.
Participant’s scores on each item were summed according to the subscales, and all items
were summed to produce an overall dyadic adjustment score (Spanier, 1976). If a participant did
not respond to an item in a particular subscale, the subscale score was not calculated, and
consequently the overall DAS score was not calculated. The possible range of total scores for the
subscales, and overall scale are: Dyadic Satisfaction (0-50), Dyadic Cohesion (0-24); Dyadic
Consensus (0-65); Affectional Expression (0-12); and overall scale (0-151). Low scores are
indicative of poor adjustment, and high scores are indicative of good adjustment.
Validity information for the DAS has been provided in the forms of factor analyses, content
validity, and construct validity. Findings from factor analyses showed four factors, corresponding to
the subscales (Eddy, 1991; Spanier, 1976), or a single overall factor (Antill & Cotton 1982;
Sharpley & Cross, 1982). Content validity of the scale was examined by Spanier (1976).
Participants rated the importance of each item in the scale for evaluating marriage, and the majority

41
of items were rated as very important. Construct validity was also demonstrated in the same study:
the DAS was strongly correlated with the Locke-Wallace Marital Adjustment Scale (r = .86).
Reliability of the DAS has been supported in the forms of internal consistency, test-retest
reliability, inter-rater reliability, and analyses of different characteristics of participants and their
scale scores. Internal consistency coefficients were reported in a review by Spanier (2001): Dyadic
Consensus (r = .73 to r = .92); Dyadic Satisfaction (r = .77 to r = .94); Dyadic Cohesion (r = .72 to r
= .86); Affectional Expression (r = .58 to r = .73); and, the total scale (r = .84 to r = .96). Test-retest
reliability coefficients were high over two weeks: Dyadic Consensus r = .85, Dyadic Satisfaction r =
.81, Dyadic Cohesion r = .77, Affectional Expression r = .75, and the total scale r = .87 (Carey,
Spector, Lantinga, & Krauss, 1993). An acceptable amount of inter-rater reliability was shown by
Antill and Cotton (1982), by way of correlations between husband-wife ratings of their
relationships. In this study correlations were: Dyadic Consensus r = .44; Dyadic Satisfaction r =
.58; Dyadic Cohesion r = .53; Affectional Expression r = .58; and total scale r = .59. Lastly, DAS
scores did not differ as a function of participant gender, age, educational level, number of children,
relationship duration (Carey et al., 1993), or marital status (Spanier, 2001).
There were three reasons for utilising the DAS, as opposed to other dyadic scales. First, the
majority of other dyadic scales should only be used with married couples, while the DAS can be
used with married and unmarried cohabitating couples (Spanier, 2001). The current study’s sample
included married couples and de facto couples. Second, this scale is one of the most widely used
dyadic instruments (Spanier, 2001). It has four language translations, and has been used in over
1,000 studies. The DAS has been used with Australian samples (Antill & Cotton, 1982), which are
comparable to the New Zealand sample in this study, due to similarities in language and culture.
Third, the scale is brief compared to other dyadic scales, but is still a comprehensive measure
(Burnett, 1987).
2.7 Data analyses
All data were analysed using the computer software “Statistical Package for the Social
Sciences” (SPSS) for Windows (version 12.0.1). Missing data, for example if a questionnaire was
not returned or certain questions were not answered on a questionnaire, was handled using the

42
pairwise method, whereby missing values are excluded from the analysis. In the listwise method
participants with missing values are excluded from the analysis. The pairwise method was used, as
opposed to listwise, so that not too much participant data was lost (Stevens, 2002). The suitability
of t-tests or ANOVA analyses were considered by examining cell sizes, plots of the normality of each
variable, as well as the homogeneity of variances. Prior to correlation analyses being conducted,
scatter plots were examined to exclude a curvilinear relationship between the variables. All t-test p
values reported were two-tailed comparisons with a significance level of p < .05, unless stated
otherwise. Further detail of the data analyses is included in the Results and Discussion chapter.

43
3. RESULTS AND DISCUSSION
3.1 Overview of the Results and Discussion chapter
The Results and Discussion chapter is organised in order of Parts A, B and C, followed by a
general discussion. The results for Part A, B or C are presented together with the discussion for that
particular Part.
Part A examines the validity and reliability of the PSS:NICU with a sample of parents whose
infant was cared for in the NICU at Christchurch Women’s Hospital. The validity of the scale was
examined using factor analyses, inter-scale correlations, and construct validity analyses. The
reliability of the scale was assessed using inter-item correlations. The majority of these analyses
were calculated separately for mothers and for fathers.
Part B describes the sources of stress experienced by mothers and by fathers from the NICU
as measured by the four subscales of the PSS:NICU: Sights and Sounds of the unit, Infant
Appearance, Parent-Infant Relationship, and Staff Communication.
Part C examines the extent to which parents’ reported stress on the Parent-Infant
Relationship subscale of the PSS:NICU was associated with: (1) the parenting they received as a
child, and (2) parent’s adjustment to their couple relationship. These associations were examined
separately for mothers and for fathers.
The general discussion first describes the strengths of the current study, including in relation
to limitations with previous studies that utilised the PSS:NICU. Limitations of the current study, not
already discussed in the interpretation of each part of the results, are described. A summary and
integration of the Results and Discussion chapter thus far is provided with conclusions, before
considering the clinical and societal implications of the study. The chapter closes with suggestions
for future research.
44
PART A
3.2 Part A results: psychometric properties of the PSS:NICU
3.2.1 Frequencies of responses by parents to each item on the PSS:NICU
Table D1 in Appendix D shows the frequencies of responses by mothers and by fathers to
each PSS:NICU item calculated according to each rating: N/A= not applicable, 1=not at all stressful,
2=a little stressful, 3=moderately stressful, 4=very stressful, 5=extremely stressful. Items were
identified that more than two thirds of mothers had answered “not applicable”: items e, f, i, m, r, and
s from the Infant Appearance subscale in Table D1; and items g, i, j, and k from the Staff subscale in
Table D1. Items were then identified in the same manner for fathers: items e, f, i, m, n, o, and s
from the Infant Appearance subscale in Table D1; item e from the Parent-Infant Relationship
subscale in Table D1; and items j and k from the Staff subscale in Table D1. Item descriptions
presented in bold font in Table D1 indicate that the particular item was scored “not applicable” by
more than two thirds of mothers or fathers or both. These items were considered to be rarely
experienced; consequently, they were excluded from all further analyses. More than two thirds was
chosen as an exclusion criterion based on the premise that an item in a questionnaire should be
applicable to the majority of people who are tested with it. Similar criteria for item exclusion was
used in the original PSS:NICU validation study (Miles et al., 1993), and subsequent validation
studies (Reid & Bramwell, 2003; Franck et al, 2005). The same items were excluded for mothers
and fathers in this analysis, for ease of comparability between the genders in the proceeding
analyses.
3.2.2 Factor structure of the PSS:NICU
Principle component analysis with varimax rotation (Kaiser normalisation) was used as the
extraction method for factor analyses of PSS:NICU items. Participants’ raw data were used in the
factor analyses, because these analyses focused on the relationships among items. Mothers’ and
fathers’ ratings of items were combined for factor analyses. This procedure was done so that these
two groups could be more easily compared in proceeding analyses, which used modified PSS:NICU

45
subscales based on the factor analysis findings. The initial factor analysis identified seven factors
that together explained 62% of the variance.
A factor analysis forced to four factors was then performed, so that the result could be
compared to the four main subscales of the PSS:NICU: Sights and Sounds, Infant Appearance,
Parent-Infant Relationship, and Staff. Based on this four-factor solution, as shown in Table 3, all
items met the criterion used by Miles et al. (1993) for retaining an item on a factor: a loading of
more than 0.40. Together, these four factors explained 51% of the variance. Table 3 shows the
items generally group into the four main subscales, except for three items from the Infant
Appearance subscale, which load most strongly on the Sights and Sounds subscale. These three
items were “tubes and equipment on or near my baby,” “seeing needles and tubes put in my baby,”
and “my baby being fed by an intravenous line or tube.” Accordingly, all further analyses were
conducted with these items moved into the Sights and Sounds subscale. Further analyses in Part A
were also conducted without these items being moved, to examine whether this had any effect on
validity and reliability estimates. From this point onwards, to avoid confusion, the two original
subscales are referred to as Sights and Soundsa and Infant Appearancea. The two modified subscales
are referred to as Sights and Soundsb and ‘Infant Appearanceb.

46
Table 3.
Four-factor Analysis of the PSS:NICU Factor loading PSS:NICU item Factor 1 Factor 2 Factor 3 Factor 4 Sights and Sounds
(a) Monitors and equipment (b) Noises of monitors and equipment (c) Sudden monitor alarms (d) Other sick babies (e) Large number of staff
Infant Appearance
(a) Tubes and equipment (b) Bruises, cuts or incisions (c) Unusual colour (d) Breathing patterns (g) Small size (h) Wrinkled appearance (j) Needles and tubes put in (k) Intravenous feed line or tube (l) Pain (p) Limp and weak (q) Jerky or restless movements
Parent-Infant Relationship
(a) Separation (b) Can’t feed (c) Can’t provide care (d) Can’t hold (f) Can’t share baby with family (g) Feel helpless and can’t protect (h) Afraid of touching or holding (i) Feeling staff are closer to my baby then I am (j) Feeling helpless about how to help my baby
Staff
(a) Explaining things too fast (b) Words I don’t understand (c) Conflicting things about baby (d) Not enough info. about tests & treatments (e) Not talking to me enough (f) Too many different staff talking to me (h) Not sure will be called about changes in baby
.761 .797 .775 .616 .496
.687
.336
.307
.222
.006 -.097 .471 .496 .206 .070 .058
.265
.110
.129
.098
.209
.300
.181
.111
.396
.094
.070
.163
.134
.113
.227
.015
.017 .074 .087 .113 .123
.181
.544
.621
.509
.570
.620
.411
.224
.533
.490
.524
.138
.041
.047
.071
.154
.275
.211
.186
.137
-.018 .131 .059 .151 .120 .116 .202
.347 .232 .181 .117 .030
.322
.114 -.063 .094 .229 .009 .284 .349 .292 .148 .271
.720
.721
.747
.777
.635
.605
.499
.516
.602
.139
.081
.098
.123
.035
.172
.232
.085 .076 .024 .168 .269
.151
.079
.150 -.164 .091 .075 .188 .153 .218 .247 .209
.126
.174
.031
.042
.122
.107
.088
.253
.234
.720
.616
.695
.795
.787
.685
.625
Note: 182 mothers and 183 fathers were included in this analysis. PSS:NICU item statements have been abbreviated in the Table. Underlined figures indicate the factor on which an item loaded most strongly.

47
3.2.3 Interscale correlations of the PSS:NICU subscales and total scale
Table 4 presents interscale Pearson correlation coefficients computed from total scores for each
PSS:NICU subscale and the total scale. Correlations between the subscales were low to moderate,
and were all statistically significant at the p < .01 level. For these correlations, the lowest
correlation occurred for fathers: Metric 1 between the Sights and Soundsa subscale and the Staff
subscale, (r = .27). The highest correlation occurred for mothers: Metric 2 between the Sights and
Soundsb subscale and the Parent-Infant Relationship subscale (r = .67). Correlations between each
subscale and the total scale were moderate to high, ranging from r = .66 to r = .89, and were all
statistically significant at the p < .01 level. Although not statistically tested, each Sights and
Soundsb correlation appeared slightly higher than its corresponding Sights and Soundsa correlation.
In contrast, each Infant Appearanceb correlation appeared slightly lower than its corresponding
Infant Appearancea correlation.

48
Table 4. Intercorrelations of the PSS:NICU Subscales and Total Scale
PSS:NICU scale
PSS:NICU subscale
Sights & Soundsa
Sights & Soundsb
Infant Appearancea
Infant Appearanceb
Parental Role
Staff
Mothers: Metric 1
Infant Appearancea .49** Infant Appearanceb .38** .52** Parent-Infant .52** .63** .61** .52** Staff .37** .42** .40** .35** .36** Total scale
.69** .82** .84** .75** .85** .68**
Fathers: Metric 1 Infant Appearancea .53** Infant Appearanceb .42** .53** Parent-Infant .49** .56** .55** .48** Staff .27** .36** .48** .44** .47** Total scale
.66** .78** .87** .79** .82** .71**
Mothers: Metric 2 Infant Appearancea .53** Infant Appearanceb .42** .57** Parent-Infant .55** .67** .65** .57** Staff .43** .48** .44** .39** .40** Total scale
.72** .85** .86** .77** .87** .69**
Fathers: Metric 2 Infant Appearancea .61** Infant Appearanceb .49** .60** Parent-Infant .50** .58** .58** .51** Staff .29** .40** .51** .48** .48** Total scale
.70** .82** .89** .81** .83** .70**
Note: 182 mothers and 183 fathers were included in this analysis.
** p < .01

49
3.2.4 Construct validity of the PSS:NICU according to anxiety measures
Table 5 provides an examination of the construct validity of the PSS:NICU, by reporting its
associations with two separate measures of anxiety: the State Trait Anxiety Inventory Trait subscale
(STAI-T), and the Hospital Anxiety and Depression Scale Anxiety subscale (HADS-A). Pearson
correlation coefficients between respondents total score on each PSS:NICU subscale, the total scale,
and their total score on each anxiety measure were calculated. Numbers of mothers and fathers
included in the construct analyses varied depending on a small number of missing STAI or HADS
questionnaires.
Table 5.
Intercorrelations between the PSS:NICU and Measures of Anxiety Anxiety questionnaire
PSS:NICU
Sights & Soundsa
Sights & Soundsb
Infant Appearancea
Infant Appearanceb
Parent-Infant
Staff
Total scale
Mothers: Metric 1
STAI-T (n=180) HADS-A (n=180)
Fathers: Metric 1
STAI-T (n=182) HADS-A (n=181)
Mothers: Metric 2
STAI-T (n=180) HADS-A (n=180)
Fathers: Metric 2
STAI-T (n=182) HADS-A (n=181)
.24** .29** .19* .25** .24** .28** .20** .24**
.25** .29** .23** .28** .24** .29** .24** .29**
.27** .28** .35** .37** .26** .27** .35** .37**
.27** .26** .35** .36** .27** .26** .36** .37**
.26** .26** .25** .31** .26** .27** .27** .33**
.33** .32** .23** .24** .32** .30** .23** .28**
.36** .36** .35** .40** .34** .35** .35** .41**
Note: HADS-A = Hospital Anxiety and Depression Scale - Anxiety subscale STAI-T= Spielberger State Trait Anxiety Inventory - Trait subscale * p < .05
** p < .01

50
The results in Table 5 show that the correlations were all positive, significant at the p < .01
level, and small to moderate. The only exception was for fathers: Metric 1 on the Sights and
Soundsa subscale versus the STAI-T, which was significant at the p < .05 level. More specifically,
with regard to mothers’ STAI-T correlations, PSS:NICU Metric 1 correlations were reasonably
consistent with PSS:NICU Metric 2 correlations (ranging from r = .24 to r = .36). Likewise, for the
fathers’ STAI-T correlations, PSS:NICU Metric 1 correlations were reasonably consistent with
PSS:NICU Metric 2 correlations (ranging from r = .19 to r = .36).
With regard to mothers’ HADS-A correlations, PSS:NICU Metric 1 correlations were
reasonably consistent with PSS:NICU Metric 2 correlations (ranging from r = .26 to r = .36).
Likewise, for the fathers’ HADS-A correlations, again PSS:NICU Metric 1 correlations were
reasonably consistent with PSS:NICU Metric 2 correlations (ranging from r = .24 to r = .41).
Lastly, the correlations for Sights and Soundsa were similar to Sights and Soundsb (ranging from r =
.19 to r = .29); likewise, the correlations for Infant Appearancea were similar to Infant Appearanceb
(ranging from r = .26 to r = .37).
3.2.5 Inter-item correlations for each PSS:NICU subscale
Table 6 presents the Cronbach alpha coefficients produced from inter-item correlations
according to each PSS:NICU subscale. Generally, the correlations for each of the subscales were
high, ranging from r = 81 to r = .95. More specifically, the correlations were similar between
Metric 1 and Metric 2, and similar between mothers and fathers. Lastly, the correlations for Sights
and Soundsa were similar to Sights and Soundsb; likewise, the correlations for Infant Appearancea
were similar to Infant Appearanceb.
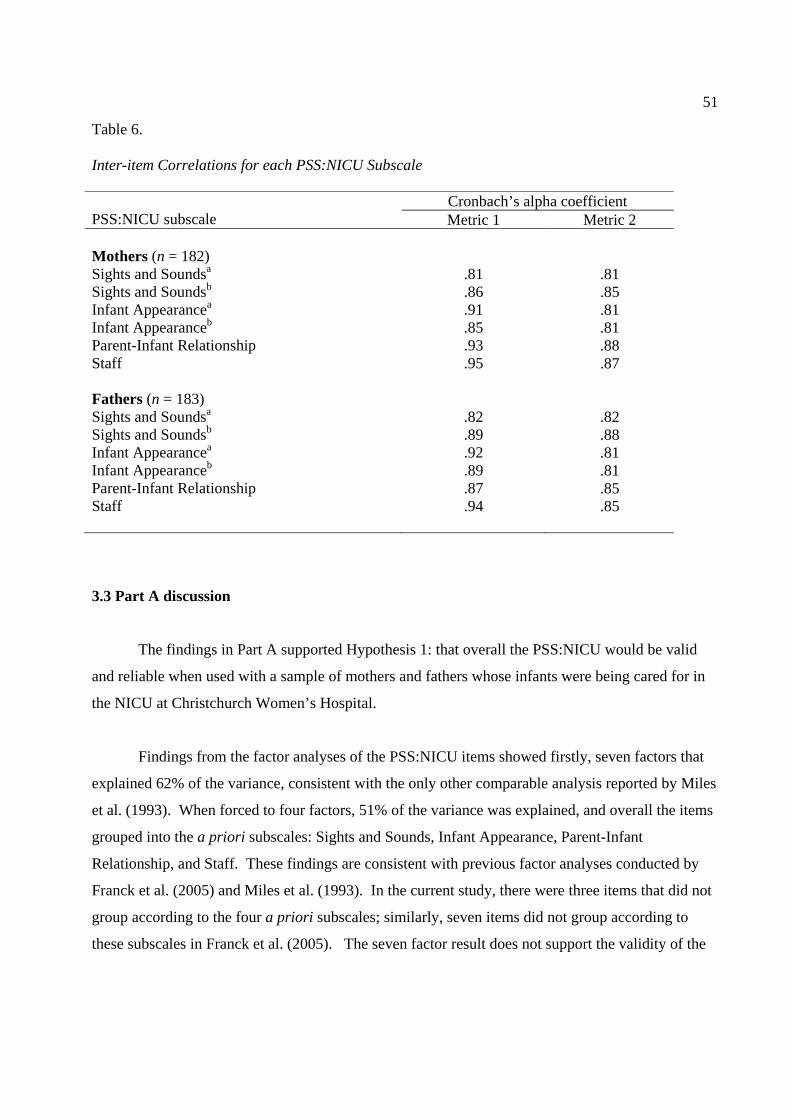
51
Table 6. Inter-item Correlations for each PSS:NICU Subscale PSS:NICU subscale
Cronbach’s alpha coefficient Metric 1 Metric 2
Mothers (n = 182) Sights and Soundsa Sights and Soundsb Infant Appearancea Infant Appearanceb Parent-Infant Relationship Staff Fathers (n = 183) Sights and Soundsa Sights and Soundsb Infant Appearancea Infant Appearanceb Parent-Infant Relationship Staff
.81
.86
.91
.85
.93
.95
.82
.89
.92
.89
.87
.94
.81
.85
.81
.81
.88
.87
.82
.88
.81
.81
.85
.85
3.3 Part A discussion
The findings in Part A supported Hypothesis 1: that overall the PSS:NICU would be valid
and reliable when used with a sample of mothers and fathers whose infants were being cared for in
the NICU at Christchurch Women’s Hospital.
Findings from the factor analyses of the PSS:NICU items showed firstly, seven factors that
explained 62% of the variance, consistent with the only other comparable analysis reported by Miles
et al. (1993). When forced to four factors, 51% of the variance was explained, and overall the items
grouped into the a priori subscales: Sights and Sounds, Infant Appearance, Parent-Infant
Relationship, and Staff. These findings are consistent with previous factor analyses conducted by
Franck et al. (2005) and Miles et al. (1993). In the current study, there were three items that did not
group according to the four a priori subscales; similarly, seven items did not group according to
these subscales in Franck et al. (2005). The seven factor result does not support the validity of the

52
subscales developed by Miles et al. (1993). The four factor result, however, provides an acceptable
amount of support for the validity of these subscales.
There were significant low to moderate correlations between the PSS:NICU subscales, and
moderate to high correlations between each subscale total and the total scale. These findings are
consistent with previous studies that conducted comparable analyses (Franck et al., 2005; Miles et
al., 1993; Reid & Bramwell, 2003). Hence, each subscale appeared to be measuring different
elements of parental stress, with every subscale important in making up the whole PSS:NICU.
Positive significant small to moderate correlations were found between the PSS:NICU and two
separate measures of anxiety: the STAI-T and the HADS-A. This finding is consistent with
previous studies that conducted comparable analyses (Franck et al., 2005; Miles et al., 1993; Miles
et al., 1991), and is indicative of satisfactory construct validity. Inter-item correlations according to
each PSS:NICU subscale were high, consistent with previous studies findings of correlations over
.70 (Franck et al., 2005; Miles et al.,1993; Reid & Bramwell, 2003). This finding indicates good
reliability of the PSS:NICU in the form of internal consistency.
Of the 46 items in the PSS:NICU, thirteen (28%) were rated “not applicable” by more than
two thirds of mothers or fathers or both; consequently, they were excluded from further analyses.
The numbers of items according to each subscale were as follows: Sights and Sounds (0), Infant
Appearance (8), Parent-Infant Relationship (1), and Staff (4). Of these items, two items from the
Infant Appearance subscale were of particular interest. “Having a machine breathe for my baby”
and “clapping on baby’s chest for chest drainage” indicated that the majority of infants were not ill
enough to require these medical treatments.
When individual items rated as not applicable by more than two thirds of parents were
compared with items of the same status from previous studies (Franck et al., 2005; Miles, 1989;
Miles et al., 1993; Miles et al., 1991; Reid & Bramwell, 2003), on the whole no matches were
found. Possible explanations for this finding are cultural differences in interpretation and
responding to the scale, or unit practices. These explanations further justified the psychometric
evaluation of the scale with this New Zealand sample. The four items from the Staff subscale

53
identified in the current study, however, did match with the majority of previous studies findings
(Franck et al., 2005; Miles et al., 1993; Miles et al., 1991; Reid & Bramwell, 2003). This finding is
suggests some staff practices in the NICU make these items irrelevant to the current study’s sample.
The Christchurch Women’s NICU, and other NICUs around the world, are beginning to adopt infant
developmental and family-centered care practices (Westrup, in press). Principles behind these
practices, which relate to Staff subscale items, include: (1) respect for the individuality of the infant
and his or her family, and (2) inclusion of the family as part of the health care team. It may,
therefore, be beneficial to revise the Staff subscale of the PSS:NICU for use in the Christchurch
Women’s NICU, and possibly in New Zealand.
Interestingly, the majority of items in the Staff subscale remained after removing items
scored as not applicable by more than two thirds of parents, in contrast to the majority of previous
studies (Franck et al., 2005; Miles et al., 1993; Miles et al., 1991; Reid & Bramwell, 2003). One
possible reason for this discrepancy is that the time frame the scale was administered varied between
this study and previous studies. The average time point of administration in the current study was
approximately 2 weeks after infant admission, compared to 2-7 days after infant admission (Miles et
al., 1993; Reid & Bramwell, 2003), and various times during infant admission (Franck et al., 2005).
In support of this idea is a study by Affonso et al. (1992), who found that mothers rated the negative
stressor of staff communication as low in frequency and intensity 4 days after their infant’s birth, but
higher in frequency and intensity 2-3 weeks after their infant’s birth. This finding was largely due
to the mothers’ perception of the staff providing incomplete and conflicting information regarding
their infant. This perception corresponds to two of the remaining items in the Staff subscale:
“telling me different (conflicting) things about my baby’s condition,” and “not telling me enough
about tests and treatments being done to my baby.”
Overall, the findings provide support for the psychometric properties of the PSS:NICU for
mothers and fathers, and for Metrics 1 and 2. In addition, when comparing the results between the a
priori and modified versions of the Infant Appearance and Sights and Sounds subscales, there
appeared to be little or no difference between them.

54
PART B
3.4 Part B results: NICU environment stressors experienced by mothers and by fathers
The aim of this section was to describe and compare the sources of stress experienced by
mothers and by fathers from the NICU. Sources of stress were measured using the four subscales of
the PSS:NICU: Sights and Sounds of the unit; Infant Appearance; Parent-Infant Relationship; and
Staff Communication. As demonstrated in Part A, the scale had satisfactory psychometric
properties when used with this sample.
Table 7 describes the sources of stress experienced by mothers and by fathers whose infant was
being cared for in the unit, according to means and standard deviations for each subscale and the
total scale. These analyses used the original version of the scale, and Metric 1 and Metric 2 scores.
The analyses were also conducted with three items moved from the Infant Appearance subscale into
the more appropriate Sights and Sounds subscale, based on the four-factor analysis in Part A.
These two modified subscales are referred to as Sights and Soundsb and Infant Appearanceb,
whereas Sights and Soundsa and Infant Appearancea refer to the original versions of the subscales.
Analyses were calculated separately for mothers and for fathers whose partner participated in this
thesis (n = 179 couples). This procedure was followed so that direct comparisons between mothers’
and fathers’ mean scores could be made within the couple dyad, using dependent samples t-tests.
The dependent samples t-test is the more appropriate test, as opposed to an independent samples t-
test, because mothers and fathers are linked by their couple status and their infant.
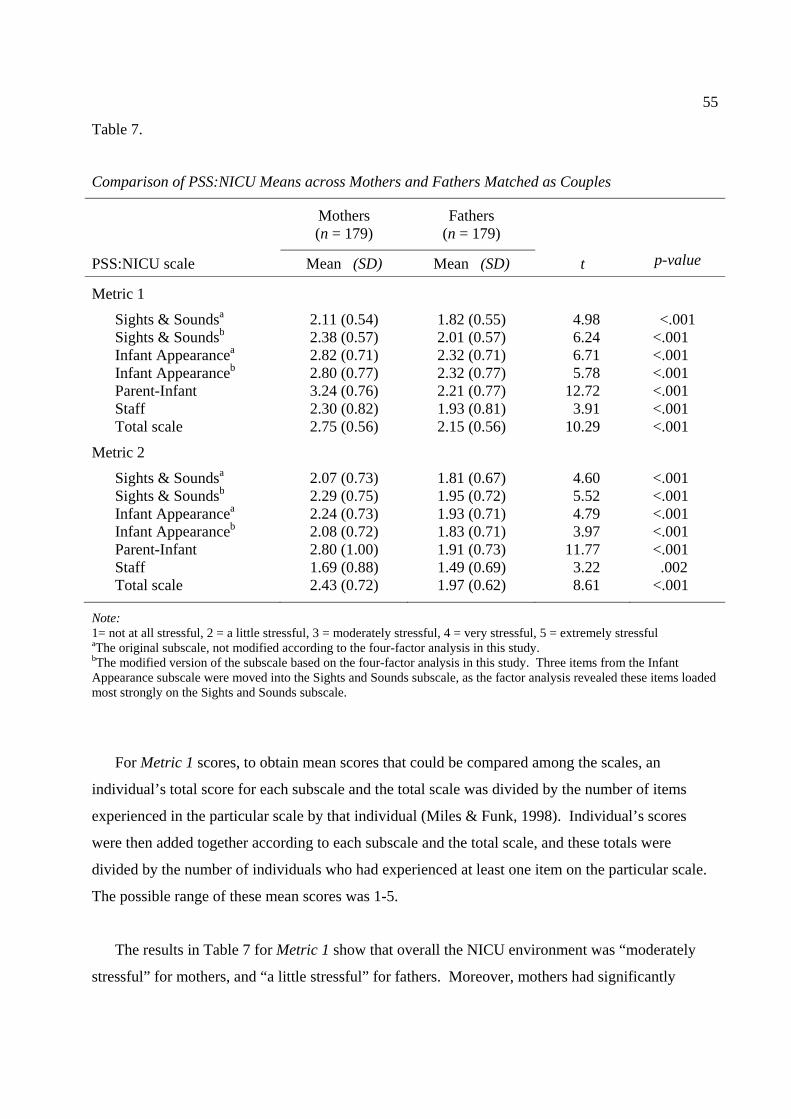
55
Table 7.
Comparison of PSS:NICU Means across Mothers and Fathers Matched as Couples
Mothers (n = 179)
Fathers (n = 179)
PSS:NICU scale Mean (SD) Mean (SD) t p-value
Metric 1
Sights & Soundsa 2.11 (0.54) 1.82 (0.55) 4.98 <.001 Sights & Soundsb 2.38 (0.57) 2.01 (0.57) 6.24 <.001 Infant Appearancea 2.82 (0.71) 2.32 (0.71) 6.71 <.001 Infant Appearanceb 2.80 (0.77) 2.32 (0.77) 5.78 <.001 Parent-Infant 3.24 (0.76) 2.21 (0.77) 12.72 <.001 Staff 2.30 (0.82) 1.93 (0.81) 3.91 <.001 Total scale 2.75 (0.56) 2.15 (0.56) 10.29 <.001
Metric 2 Sights & Soundsa 2.07 (0.73) 1.81 (0.67) 4.60 <.001 Sights & Soundsb 2.29 (0.75) 1.95 (0.72) 5.52 <.001 Infant Appearancea 2.24 (0.73) 1.93 (0.71) 4.79 <.001 Infant Appearanceb 2.08 (0.72) 1.83 (0.71) 3.97 <.001 Parent-Infant 2.80 (1.00) 1.91 (0.73) 11.77 <.001 Staff 1.69 (0.88) 1.49 (0.69) 3.22 .002 Total scale 2.43 (0.72) 1.97 (0.62) 8.61 <.001
Note: 1= not at all stressful, 2 = a little stressful, 3 = moderately stressful, 4 = very stressful, 5 = extremely stressful aThe original subscale, not modified according to the four-factor analysis in this study. bThe modified version of the subscale based on the four-factor analysis in this study. Three items from the Infant Appearance subscale were moved into the Sights and Sounds subscale, as the factor analysis revealed these items loaded most strongly on the Sights and Sounds subscale.
For Metric 1 scores, to obtain mean scores that could be compared among the scales, an
individual’s total score for each subscale and the total scale was divided by the number of items
experienced in the particular scale by that individual (Miles & Funk, 1998). Individual’s scores
were then added together according to each subscale and the total scale, and these totals were
divided by the number of individuals who had experienced at least one item on the particular scale.
The possible range of these mean scores was 1-5.
The results in Table 7 for Metric 1 show that overall the NICU environment was “moderately
stressful” for mothers, and “a little stressful” for fathers. Moreover, mothers had significantly

56
higher stress scores for each subscale and the total scale compared to fathers (p < .001). Mothers’
greatest subscale score occurred on the Parent-Infant Relationship subscale (M = 3.24, SD = 0.76).
Fathers’ greatest subscale score, on the other hand, occurred on both the Infant Appearancea (M =
2.32, SD = 0.71) and the Infant Appearanceb (M = 2.32, SD = 0.77) subscales. These findings are
further illustrated in Figure 5.
1.00
1.50
2.00
2.50
3.00
3.50
4.00
4.50
5.00
Sights &Soundsa
Sights &Soundsb
InfantAppearancea
InfantAppearanceb
Parent-infantRelationship
Staff Total scale
Stress factor
Stre
ss sc
ore
MothersFathers
Figure 5. PSS:NICU Metric 1 mean stress scores for mothers and for fathers.
For Metric 2 scores, to obtain mean scores that could be compared among the scales, an
individual’s total score for each subscale and the total scale were divided by the number of items in
the particular scale (Miles & Funk, 1998). Individuals’ scores were then added together according
to each subscale and the total scale, and divided by the number of individuals. The possible range of
these mean scores was 1-5.
The results in Table 7 for Metric 2 show that overall the NICU environment was “a little
stressful” for both mothers and fathers. Moreover, mothers had significantly higher stress scores for
each subscale and the total scale compared to fathers (p < .01). Finally, mothers’ greatest subscale

57
score occurred on the Parent-infant Relationship subscale (M = 2.80, SD = 1.00); whereas fathers’
greatest subscale score occurred on the Sights and Soundsb subscale (M = 1.95, SD = 0.72). These
findings are further illustrated in Figure 6.
1
1.5
2
2.5
3
3.5
4
4.5
5
Sights &Soundsa
Sights &Soundsb
InfantAppearancea
InfantAppearanceb
Parent-infantRelationship
Staff Total scale
Stress factor
Stre
ss sc
ore
MothersFathers
Figure 6. PSS:NICU Metric 2 mean stress scores for mothers and for fathers.
In summary, mothers experienced the NICU environment as moderately stressful or a little
stressful, depending on the scoring method. Fathers experienced the NICU environment as a little
stressful. Mothers experienced greater stress according to every aspect of the unit environment
compared to fathers. The most stressful aspect of the unit for mothers was alterations to the parent-
infant relationship. For fathers, on the other hand, the most stressful aspect was their infant’s
appearance and behaviour or the sights and sounds of the unit, depending on the scoring method.
58
3.5 Part B discussion
Interpretation of the Part B results focused on Metric 2 scores, rather than Metric 1 and
Metric 2 scores, because interest was on the amount of overall stress experienced (Miles & Funk,
1998).
3.5.1 Overall stress level experienced by mothers and by fathers from the NICU
The means of mothers’ and fathers’ total stress scores indicated that overall, they
experienced a low level of stress from having their infant cared for in the unit. This finding is
consistent with the one other study that investigated mothers and fathers separately (Franck et al.,
2005), and the majority of previous studies that investigated parents as a whole (Dudek-Shriber,
2004; Miles et al., 1991). There are a number of possible explanations for this finding. First, the
Christchurch Women’s NICU, as is common with many NICUs, implements a number of practices
related to parents designed to promote a warm atmosphere (Carter et al., 2005). These practices
include tours of the unit; information provision about their infant’s condition, treatment, and the
unit; no restriction on visiting hours; access to their infant’s medical record; inclusion in medical
decision making regarding their infant; early skin to skin contact with their infant; and having one
staff member as a main contact person. It may be that parents thought, especially because of these
practices, that their infant was being cared for in the best possible way. Another explanation is, as
Holditch-Davis and Miles (2000) suggest, parents did not want to rate the unit negatively while their
infant was reliant on care from the unit. This is a less plausible explanation as the confidentiality of
their answers was assured.
3.5.2 Gender differences in experience of stress from the NICU
Mothers experienced the NICU as significantly more stressful compared to fathers, as shown
by their respective means of the total scale. Furthermore, this finding was also true with regard to
each aspect of the unit, as shown by mothers’ and fathers’ means of each subscale of the PSS:NICU.
In general, these findings are consistent with the UK sample in Franck et al. (2005), and the
Canadian sample in Perehudoff (1990). These findings are also consistent with the Canadian sample

59
in Shields-Poe & Pinelli (1997), but only with regard to the sights and sounds of the NICU, and
alterations to the parent-infant relationship. In contrast, Franck et al. (2005) found no significant
differences between mothers and fathers in their USA sample. These comparisons indicate that the
New Zealand sample in the current study is most similar to a UK sample, supported by the fact that
New Zealand was colonised by England.
The finding of a gender difference in the experience of stress from the NICU in the current
study may reflect an actual difference, as supported by a similar, more robust finding in the area of
major depression. The estimated point prevalence rate of major depression for women is estimated
to be double that for men, with rates of 5-9% and 2-3% respectively (American Psychiatric
Association, 2000). A number of possible explanations for the gender difference have been
provided by Affleck et al. (1991). First, it may be due, in part, that fathers employ more effective
coping strategies to decrease stress. In a NICU study by these authors, mothers utilised more
escapist coping, which related to negative mood, whereas fathers utilised more minimisation and
instrumental coping, which related to positive mood. Second, mothers’ experience of greater stress
may be due to more negative appraisals of their infant’s difficulties. Mothers have been shown to
perceive their premature infant as more difficult compared to fathers, at admission and discharge
(Levy-Shiff et al., 1989). A similar result was found by Affleck et al. (1991), whereby more
mothers than fathers were worried about their infant’s future difficulties regarding health and
development at discharge. Last, a mother’s greater stress, early in her infant’s NICU admission,
may be due to mood disturbances from the birth of her baby through “baby blues,” postpartum mood
disorder, or obstetric procedures.
A final interpretation of the finding that mothers experienced more stress from the NICU
compared to fathers is artifactual. The items in the PSS:NICU may be more representative of the
experiences of mothers, as opposed to fathers. This is plausible, given that the sample the scale was
originally evaluated with in Miles et al. (1993) included slightly more mothers (n = 115) than fathers
(n = 75). In addition, it is unclear from their study, which developed the scale, whether mothers and
fathers were equally represented when using information from sources including: interviews, a self-
help group, a literature search, and a pilot group.
60
3.5.3 The most stressful aspect of the NICU for mothers and for fathers
For mothers, the aspect of the NICU experienced as the most stressful was alterations to the
parent-infant relationship, providing support for Hypothesis 2. This finding is consistent with
previous literature (Franck et al., 2005; Reid & Bramwell, 2003; Shields-Poe & Pinelli, 1997), and
can be interpreted in the context of evolutionary and socialisation theories. Evolutionary theory
posits that the biological makeup of females and males orientates them towards different activities,
because they serve an adaptive function in human survival (Berk, 2006). Females are orientated
towards rearing children; males are orientated towards competing for mates. Socialisation theory
posits that different orientations of each gender come about, at least in part, by parents’ teaching
their children (Gilligan, 1988). Parents’ focus on morality of care with regard to girls, whereas
instrumental or task orientated activities are reinforced for boys. Therefore, it would follow that
alterations to the parent-infant relationship in the unit is a great stressor for mothers.
Another possible reason that the greatest stressor in the NICU was alterations to the parent-
infant relationship for mothers, as opposed to fathers, is an extension of the artefact argument. It
may be that the PSS:NICU Parent-Infant Relationship subscale is more representative of mothers
than fathers. In support of this idea is a study of parents of preterm infants, who were interviewed
about the most important part of their parental role (Jeffcoate et al., 1979). The majority of mothers
perceived this to be either caring (for example, giving love or understanding), or nurturing (for
example, feeding, washing, changing nappies, or being there incase needed). In contrast, fathers’
perceptions were more varied, including either: caring, responsibility (for example, as provider and
protector), discipline (for example, setting and maintaining standards for the family), or teaching
(for example, socialisation). Nurturing was not commonly mentioned by fathers. Two items from
the Parent-Infant Relationship subscale could, therefore, be more representative of mothers as
opposed to fathers: “Not feeding my baby myself” and “Not being able to care for my baby myself
(for example, changing nappies, bathing)”.
No hypothesis was made regarding the most stressful aspect of the unit for fathers, because
of inconsistencies in the previous literature. Fathers experienced sights and sounds as the most
stressful aspect of the unit, which was found in two previous studies (Perehudoff, 1990; Shields-Poe
& Pinelli, 1997). It is suggested that the way the NICU was set up made the sights and sounds
particularly salient to fathers. Fathers may not have been as prepared for this experience, compared

61
to mothers, due to work commitments and staff being only available at certain times to orientate
them to the unit.
PART C
3.6 Part C results: the link between parents’ experience of stress from the parent-infant
relationship in the NICU and their past relationships
The purpose of Part C was to examine the extent to which mothers’ and fathers’ reported stress
on the PSS:NICU Parent-Infant Relationship subscale was associated with two measures of
relationship experiences. These two measures were: (1) parenting received as a child, and (2)
adjustment to the couple relationship. Metric 2 scores of the Parent-Infant Relationship subscale
were used in Part C, because the focus was the amount of overall stress experienced (Miles & Funk,
1998). The finding that mothers experienced the parent-infant relationship as a key stressor in the
NICU further justified the use of this subscale in Part C, at least regarding mothers. Parenting
received in childhood was measured using the Parental Bonding Instrument (PBI). Adjustment to
the couple relationship was measured using the Dyadic Adjustment Scale (DAS).
3.6.1 PBI: comparison of means across mothers and fathers matched as couples
Aim 3 was to examine the extent to which mothers’ and fathers’ reported stress on the
PSS:NICU Parent-Infant Relationship subscale was associated with parenting they received as a
child. To provide a context for these analyses, the PBI was used to measure respondents’
retrospective experiences of parenting they received as children. Table 8 shows means and standard
deviations calculated according to the PBI subscales, separately for mothers and for fathers. Only
parents of the NICU infants whose partner participated in this study were included in these analyses.
This procedure was followed so that direct comparisons between mothers’ and fathers’ mean scores
could be made within the couple dyad, using dependent samples t-tests. Findings showed that with
regard to the Maternal Care subscale, fathers’ scores were significantly higher than mothers’ scores,
(p = .015). There were no significant differences between mothers’ and fathers’ mean scores on the
other PBI subscales: Paternal Care, Maternal Overprotection, and Paternal Overprotection.

62
Table 8. Comparison of PBI Subscale Means across Mothers and Fathers Matched as Couples
Mothers Fathers
PBI subscale n Mean (SD) Mean (SD) t p
Care:
Maternal Paternal
Overprotection:
Maternal Paternal
170 151
170 151
26.44 (9.35) 24.15 (9.10)
12.04 (8.75) 11.26 (7.90)
28.50 (6.43) 23.93 (7.57)
11.90 (6.72) 10.01 (5.90)
-2.46 0.24
0.16 1.64
.015
.810
.871
.104
3.6.2 Association between the PSS:NICU Parent-Infant Relationship subscale and the PBI
The extent to which parents’ reported stress on the PSS:NICU Parent-Infant Relationship
subscale was associated with parents’ relationships with their own parents in childhood was
examined (Aim 3). Pearson correlations were calculated between the Parent-Infant Relationship
subscale Metric 2 total, as calculated in Part A, and the PBI subscale totals. These correlations, as
shown in Table 9, were calculated separately for mothers and for fathers.

63
Table 9.
Association between the PSS:NICU Parent-Infant Relationship subscale and each PBI Subscale for Mothers and for Fathers
PSS:NICU Parent-Infant Relationship subscale (Metric 2)
PBI subscale n
Correlation coefficient (r) p
Mothers
Care: Maternal 179 -0.21 .005 Paternal 169 -0.00 .956
Overprotection: Maternal 179 0.01 .903 Paternal 169 0.10 .188
Fathers
Care: Maternal 176 -0.08 .273 Paternal 165 0.04 .574
Overprotection: Maternal 176 0.13 .092 Paternal 165 0.05 .532
Findings showed a low, negative correlation between the PSS:NICU Parent-Infant
Relationship subscale and the PBI Maternal Care subscale for mothers, which was statistically
significant, r(179) = -0.21, p = .005. The rest of the correlation coefficients for mothers between the
PSS:NICU Parent-Infant Relationship subscale and each of the PBI subscales (Paternal Care,
Maternal Overprotection, and Paternal Overprotection) were not significant. The correlation
coefficients for fathers between the PSS:NICU Parent-Infant Relationship subscale and each of the
PBI subscales (Maternal Care, Paternal Care, Maternal Overprotection, and Paternal Overprotection)
were not significant.

64
3.6.3 Association between parent-infant relationship stress according to categories and the PBI
subscales
The extent to which parents’ reported stress on the Parent-Infant Relationship subscale of the
PSS:NICU was linked with parenting they received as a child is further examined in this section.
Table 10 shows associations between parent-infant relationship stress according to categories and
mothers’ perceptions of parenting they received during childhood. Table 11 shows the same
analyses for fathers. The Parent-Infant Relationship subscale Metric 2 mean scores, as calculated in
Part B, were categorised into three stress groups: low, moderate or high. These three groups were
formed based on corresponding PSS:NICU ratings. Ratings of 1=not at all stressful and 2=a little
stressful were categorised as “low stress”; ratings of 3=moderately stressful were categorised as
“moderate stress”; ratings of 4=very stressful and 5=extremely stressful were categorised as “high
stress”. This procedure was carried out separately for mothers’ and fathers’ scores. Of the 182
mothers, the number included in each stress group was: 75 in the low group, 63 in the moderate
group, and 44 in the high group. Because fathers had significantly lower Parent-Infant Relationship
mean stress scores compared to mothers, as shown in Part B, the numbers of fathers in the low,
moderate and high groups were less evenly distributed across the groups. Of the 183 fathers, the
number included in each stress group was: 148 in the low group, 31 in the moderate group, and four
in the high group. Any association between the stress groups and each PBI subscale was examined
using a one-way ANOVA, and if a significant association was found a test for linearity was
conducted. Differences between the stress groups were examined using a Games-Howell Post Hoc
Comparison test. This test was chosen, as opposed to other Post Hoc Comparison tests, because of
the unequal cell numbers.
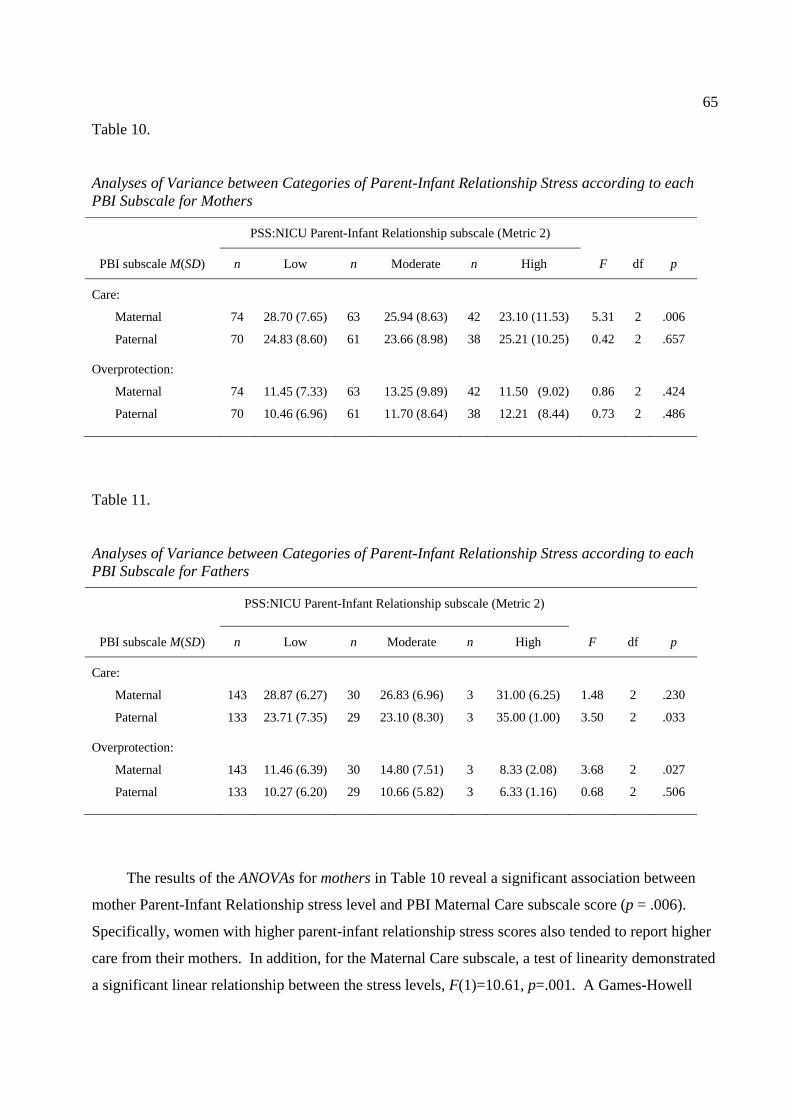
65
Table 10.
Analyses of Variance between Categories of Parent-Infant Relationship Stress according to each PBI Subscale for Mothers
PSS:NICU Parent-Infant Relationship subscale (Metric 2)
PBI subscale M(SD) n Low n Moderate n High F df p
Care:
Maternal
Paternal
Overprotection:
Maternal
Paternal
74
70
74
70
28.70 (7.65)
24.83 (8.60)
11.45 (7.33)
10.46 (6.96)
63
61
63
61
25.94 (8.63)
23.66 (8.98)
13.25 (9.89)
11.70 (8.64)
42
38
42
38
23.10 (11.53)
25.21 (10.25)
11.50 (9.02)
12.21 (8.44)
5.31
0.42
0.86
0.73
2
2
2
2
.006
.657
.424
.486
Table 11.
Analyses of Variance between Categories of Parent-Infant Relationship Stress according to each PBI Subscale for Fathers
PSS:NICU Parent-Infant Relationship subscale (Metric 2)
PBI subscale M(SD) n Low n Moderate n High F df p
Care:
Maternal
Paternal
Overprotection:
Maternal
Paternal
143
133
143
133
28.87 (6.27)
23.71 (7.35)
11.46 (6.39)
10.27 (6.20)
30
29
30
29
26.83 (6.96)
23.10 (8.30)
14.80 (7.51)
10.66 (5.82)
3
3
3
3
31.00 (6.25)
35.00 (1.00)
8.33 (2.08)
6.33 (1.16)
1.48
3.50
3.68
0.68
2
2
2
2
.230
.033
.027
.506
The results of the ANOVAs for mothers in Table 10 reveal a significant association between
mother Parent-Infant Relationship stress level and PBI Maternal Care subscale score (p = .006).
Specifically, women with higher parent-infant relationship stress scores also tended to report higher
care from their mothers. In addition, for the Maternal Care subscale, a test of linearity demonstrated
a significant linear relationship between the stress levels, F(1)=10.61, p=.001. A Games-Howell

66
Post Hoc Comparison test for the Maternal Care subscale revealed a significant difference between
the low and high stress groups (p = .018), no significant difference between the low and moderate
stress groups, (p = .124), and no significant difference between the moderate and high stress groups
(p = .366). There were no significant differences between the stress groups for the other PBI
subscales: Paternal Care, Maternal Overprotection, and Paternal Overprotection.
The results of the ANOVAs for fathers in Table 11 reveal a significant association between the
Parent-Infant Relationship stress groups and the PBI Paternal Care subscale (p = .033). In addition,
there was no significant linear relationship between the groups, F(1)=1.16, p = .284. A Games-
Howell Post Hoc Comparison test for the Paternal Care subscale revealed a significant difference
between the low and high stress groups (p = .000), a significant difference between the moderate
and high stress groups (p = .000), and no significant difference between the low and moderate stress
groups (p = .929). There was also a significant association between the stress groups and the PBI
Maternal Overprotection subscale (p = .027); in addition, this was not a significant linear
relationship, F(1)=2.65, p=.106. A Games-Howell Post Hoc Comparison test for the Maternal
Overprotection subscale revealed a significant difference between the moderate and high stress
groups (p = .014), no significant difference between the low and moderate stress groups (p = .073),
and no significant difference between the low and high stress groups (p = .192). There were no
significant associations for fathers between the stress groups and the other PBI subscales: Maternal
Care and Paternal Overprotection.
3.6.4 DAS: comparison of means across mothers and fathers matched as couples
Aim 4 was to examine the extent to which mothers’ and fathers’ reported stress on the
PSS:NICU Parent-Infant Relationship subscale was associated with adjustment to their couple
relationship. To provide a context for these analyses, the DAS was used to measure respondents’
experiences of their couple relationships. Table 12 shows the means and standard deviations
calculated according to the DAS subscales and total scale, separately for mothers and for fathers.
Only parents whose partner participated in this thesis were included in these analyses. This
procedure was followed so that direct comparisons between mothers’ and fathers’ mean scores could
be made within the couple dyad, using dependent samples t-tests. Low scores are indicative of poor
adjustment, and high scores are indicative of good adjustment (Spanier, 1976).

67
Table 12. Comparison of DAS Subscale Means Across Mothers and Fathers Matched as Couples
Mothers Fathers
Dyadic Adjustment Scale n Mean (SD) Mean (SD) t p
Dyadic Satisfaction
Dyadic Cohesion
Dyadic Consensus
Affectional Expression
Total scale
176
175
174
168
166
42.32 (4.73)
18.13 (3.68)
53.50 (6.63)
10.03 (1.93)
123.91 (13.57)
41.74 (5.23)
17.66 (3.59)
52.83 (7.09)
9.57 (2.11)
121.70 (14.64)
1.72
1.85
1.39
3.19
2.41
.087
.066
.168
.002
.017
Findings in Table 12 show that with regard to the Affectional Expression subscale, mothers
were significantly more adjusted than fathers (p =.002). According to the DAS total scale, mothers
were also significantly more adjusted than fathers (p = .017). There were no significant differences
between mothers’ and fathers’ mean scores on the other DAS subscales: Dyadic Satisfaction,
Dyadic Cohesion, and Dyadic Consensus.
3.6.5 Association between the PSS:NICU Parent-Infant Relationship subscale and the DAS
The extent to which parents’ reported stress on the PSS:NICU Parent-Infant Relationship
subscale was associated with parents’ perceptions of their couple relationships was examined (Aim
4). Pearson correlations were calculated between the Parent-Infant Relationship subscale Metric 2
total, as calculated in Part A, and each DAS subscale or the DAS total. These calculations were
carried out separately for mothers and for fathers. Findings of these analyses are presented in Table
13, and show that each coefficient is not statistically significant.

68
Table 13. Association between the PSS:NICU Parent-Infant Relationship subscale and the DAS for Mothers and for Fathers
PSS:NICU Parent-Infant Relationship subscale
Dyadic Adjustment subscale
n
Correlation coefficient (r)
p
Mothers
Dyadic Satisfaction 181 0.07 .355 Dyadic Cohesion 181 0.00 .961 Dyadic Consensus 179 -0.06 .462 Affectional Expression 177 -0.04 .628 Total scale 176 -0.01 .931
Fathers
Dyadic Satisfaction 180 0.00 .979 Dyadic Cohesion 179 0.00 .973 Dyadic Consensus 180 -0.07 .347 Affectional Expression 175 0.01 .913 Total scale 174 -0.04 .612
3.6.6 Association between parent-infant relationship stress according to categories and the DAS
The extent to which parents’ reported stress on the PSS:NICU Parent-Infant Relationship
subscale was linked with the couple relationship is further examined in this section. Table 14
describes the association between categories of parent-infant relationship stress and mothers’
perceptions of their couple relationships. Table 15 shows the same analyses for fathers. The Parent-
Infant Relationship subscale Metric 2 mean scores were categorised into low, moderate or high
stress, using the same procedure as the analogous PBI analyses. No significant associations were
found between stress levels and the DAS subscales or total scale using one-way ANOVAs.

69
Table 14. Analyses of Variance between Categories of Parent-Infant Relationship Stress according to the DAS for Mothers
PSS:NICU Parent-Infant Relationship subscale (Metric 2)
DAS
subscale
Mean (SD)
n Low n Moderate n High F df p
DS
DCoh
DCon
AE
Total scale
75
75
74
73
73
41.49 (5.87)
17.99 (4.16)
53.58 (7.27)
10.00 (1.90)
123.07 (16.31)
62
62
61
60
59
42.61 (3.60)
18.02 (3.13)
52.49 (6.01)
9.90 (1.84)
122.66 (10.79)
44
44
44
44
44
42.91 (4.19)
18.34 (3.82)
53.93 (6.85)
10.05 (2.23)
125.23 (13.27)
1.52
0.14
0.69
0.08
0.48
2
2
2
2
2
.221
.871
.502
.925
.619
Note: DS = Dyadic Satisfaction, DCoh =Dyadic Cohesion, DCon = Dyadic Consensus, AE = Affectional Expression
Table 15. Analyses of Variance between Categories of Parent Infant Relationship Stress according to the DAS for Fathers
PSS:NICU Parent-Infant Relationship subscale (Metric 2)
DAS
subscale
Mean (SD) n Low n Moderate n High F df p
DS
DCoh
DCon
AE
Total scale
145
144
145
140
139
41.81 (5.20)
17.70 (3.48)
52.92 (7.00)
9.60 (2.13)
121.99 (14.33)
31
31
31
31
31
41.52 (5.60)
17.52 (3.94)
52.13 (7.36)
9.68 (2.07)
120.84 (15.96)
4
4
4
4
4
42.00 (3.37)
16.25 (4.50)
54.75 (6.29)
10.25 (1.26)
123.25 (4.99)
0.04
0.34
0.32
0.20
0.10
2
2
2
2
2
.957
.712
.731
.823
.905
Note: DS = Dyadic Satisfaction, DCoh =Dyadic Cohesion, DCon = Dyadic Consensus, AE = Affectional Expression

70
3.7 Part C discussion
3.7.1 PBI: comparison of means across mothers and fathers matched as couples
Mothers’ mean scores on the PBI indicated that they perceived their parents demonstrated a
high degree of care, and a low degree of overprotection, towards them in their childhood. Similar
results, to these results for mothers, were found for fathers. The scores were generally comparable
to two previous Australian studies: the original normative study (Parker et al.,1979), and
MacKinnon et al. (1989).
In the current study, with regard to the Maternal Care subscale, fathers’ scores were
significantly higher than mothers’ scores. There were no significant differences between mothers’
and fathers’ scores on the other PBI subscales: Paternal Care, Maternal Overprotection, and Paternal
Overprotection. These findings are, overall, consistent with previous general population studies
cited in a review by Parker (1990), which found no effect of the test taker’s sex. Possible factors
contributing to the difference in findings are differences in study samples, including: culture (Parker,
1990); cohort (MacKinnon et al., 1989); and demographics such as marital status, or age
(MacKinnon et al., 1989).
3.7.2 The link between the PSS:NICU Parent-Infant Relationship subscale and the PBI
The findings from the analyses of the PSS:NICU Parent-Infant Relationship subscale and the
PBI partially supported Hypothesis 3: that the level of stress reported by parents from alterations to
the parent-infant relationship in the unit would be negatively correlated with the level of care they
received as a child from their parents. This was demonstrated by a weak, but significant negative
correlation for mothers between the Parent-Infant Relationship subscale and the PBI Maternal Care
subscale. The findings that did not support Hypothesis 3 were first, for mothers, no significant
correlation between the Parent-Infant Relationship subscale and the PBI Paternal Care subscale.
Second, for fathers, there were no significant correlations between the Parent-Infant Relationship
subscale and the PBI Care subscales. Last, regarding the PBI Overprotection subscales, there were

71
no significant correlations between these subscales and the Parent-Infant Relationship subscale, for
mothers or for fathers.
For mothers, the factors of stress from the infant relationship and parenting received as a
child were further examined using ANOVA analyses. The findings were consistent with those from
the corresponding correlation analyses. There was a significant difference for Maternal Care
between the low and high parent-infant relationship stress groups, and a test of linearity
demonstrated this was a linear relationship. Moreover, a low level of stress from the parent-infant
relationship in the unit was associated with a high level of maternal care in childhood. Conversely,
a high level of stress from alterations to the parent-infant relationship in the NICU was associated
with a low level of maternal care in childhood. There was not a significant difference for Maternal
Care between the moderate stress group and the low or high stress groups. Lastly, for mothers, there
were no significant associations between the stress groups and the other PBI subscales: Paternal
Care, Maternal Overprotection, and Paternal Overprotection.
For fathers, findings of similar ANOVA analyses to those conducted for mothers were
examined. Significant differences were found between the parent-infant relationship stress groups
for the Paternal Care and the Maternal Overprotection subscales, which were connected to the high
stress group. These findings contrasted those found in the corresponding correlation analyses, and
were discounted due to the small number of fathers (n = 4) in the high stress group reducing
statistical power (Meltzoff, 1998). There were no significant associations between the stress groups
and the other PBI subscales: Maternal Care and Paternal Overprotection, which was consistent with
the corresponding correlation analyses.
The finding of a link for mothers between parent-infant relationship stress and maternal care
is consistent with the majority of broad research in this area (Assel et al., 2000; Mikulincer &
Florian, 1998; Parker et al., 1990). This finding provides support for continuity theory (Belsky,
1984; Sroufe, 1979), and the Parental NICU Stress model (Wereszczak et al., 1997). Based on
theory the independent variable was maternal care, and the dependent variable was parent-infant
relationship stress. However, the direction of cause and effect between the variables could not be
determined, because of the correlational nature of the analyses.

72
Overall, the results for mothers and fathers revealed a lack of strong links between the
Parent-Infant Relationship subscale and the PBI subscales. No significant links to the
Overprotection subscale parallel past research (Assel et al. 2000; Parker et al., 1979), which
suggested this factor is the weaker of the two factors: care and overprotection. The lack of strong
significant findings can be interpreted in the context of contemporary attachment theory. An
individual’s internal working model, developed in childhood, is thought to be modifiable in later life
through important relationships (Bartholomew, 1993; 1994; Rholes & Simpson, 2004). Therefore,
individuals’ relationships with their parents in childhood may not be an important factor in later
experience of stress from the parent-infant relationship in the NICU.
Another possible explanation for the lack of strong, significant results is the retrospective
nature of the PBI. Given that about 15 years had lapsed between individuals’ childhoods and
administration of the scale, responses may have been subject to bias. One such bias is selective
recall of remembered information, due to memory loss. Another bias is changes in attitudes due to
events happening in the time that had lapsed (Parker et al., 1992; Parker et al., 1979; Mackinnon et
al., 1989), including development of the relationships with their parents (Halverson, 1988), and
becoming a parent themselves (Mackinnon et al., 1989). Support for this position has been provided
by test-retest coefficients, reported to decrease from high levels at a one month period to moderate
levels at a 10 year period (Mackinnon et al., 1989; Parker, 1990; Wilhelm & Parker, 1990). Ideally
a prospective measure, as opposed to a retrospective measure, would have been used in the current
study. The difficulties of employing this type of design, however, were unpractical: in terms of cost
and time to track an individual from childhood to having an infant admitted to the NICU.
Finally, a procedural limitation, which may have contributed to the potency of results for the
paternal version of the PBI, is the order of administration of the two versions of the scale. For all
individuals in the study, the maternal version was administered before the paternal version. There
may have been order effects, such as fatigue or boredom, due to similar questions across the two
versions. Balancing the order of administration, by presenting a randomised half of the sample with
the paternal version before the maternal version, would have controlled for any order effects.

73
3.7.3 Dyadic Adjustment Scale: comparison of means across mothers and fathers matched as
couples
The means calculated from the total DAS scores, for both mothers and fathers, were over 100,
indicating good dyadic adjustment (Spanier, 2001). The means were, in general, similar to those in
previous studies with heterosexual couples cited in a review by Spanier (2001). In the present study,
mothers were significantly more adjusted than fathers with regard to the Affectional Expression
subscale, and the DAS total scale. These gender differences are consistent with a minority of
previous research cited in a review by Spanier (2001). Belsky and Isbella (1985) found husband-
wife differences for individuals who reported their parents were cold and rejecting in childhood.
Based on mothers’ and fathers’ mean PBI scores in the current study, however, their parents were
not cold and rejecting in childhood. Another explanation for the gender differences is different
communication styles across genders about marital difficulties (Spanier, 2001). Lastly, the different
demographic variables of age and level of education across genders may have contributed to the
gender differences. This is unlikely, however, given that Carey, Spector, Lantinga & Krauss (1993)
found DAS scores did not differ as a function of these variables.
There were no significant differences between mothers’ and fathers’ mean scores on the other
DAS subscales: Dyadic Satisfaction, Dyadic Cohesion, and Dyadic Consensus. This finding is
consistent with the majority of studies reporting no significant differences on the DAS between men
and women of married couples or couples in therapy (Banmen & Vogel, 1985; Carey et al., 1993;
White, Speisman, Jackson, Bartis & Costos, 1986).
3.7.4 The link between the PSS:NICU Parent-Infant Relationship subscale and the DAS
The findings in Part C failed to support Hypothesis 4: that the level of stress reported by
parents from alterations to the parent-infant relationship in the NICU would be negatively correlated
with their level of couple adjustment. There were no significant correlations for mothers or for
fathers between the Parent-Infant Relationship subscale and the DAS. Likewise, further
examination using categories of Parent-Infant Relationship stress and the DAS revealed no
significant associations for mothers or for fathers. Findings regarding fathers in the high stress
group were, however, discounted due to the small number of fathers (n = 4) in this group reducing

74
statistical power (Meltzoff, 1998). These findings are inconsistent with the Parental NICU Stress
model (Wereszczak et al., 1997), continuity theory (Belsky, 1984; Sroufe, 1979), attachment theory
(Bartholomew, 1993; Bowlby, 1979; Rholes & Simpson, 2004), and broad research on the topic
(Doering et al., 2000; Feeney, 2004;). It could therefore be suggested that the Parental NICU Stress
model, attachment theory, and continuity theory should be discounted in relation to this area of
investigation. This would be premature, however, because of the exploratory nature of the analyses
and the limitations with the present study.
One major limitation with the whole of Part C is that the independent variables were
confounded by extraneous factors, which can lead to an under or over estimation of the actual
association between the target variables. One independent variable, such as relationship with a
parent or partner, is most likely insufficient to fully describe stress from the parent-infant
relationship. A variety of types of extraneous factors are depicted in the Parental NICU Stress
model (Wereszczak et al., 1997), including situational factors, personal resources, and environment
support. More specifically, extraneous factors previously examined and related to high stress on the
PSS:NICU are: low income, younger age, no previous NICU admission of an infant, high anxiety,
dysfunctional personality traits, unwanted pregnancy, seeing the infant for the first time in the unit,
seeing the infant one or more days after birth, severe infant illness, and low frequency of infant
visitation (Carter, Mulder & Darlow., 2007; Dudek-Shriber, 2004; Franck et al., 2005; Reid &
Bramwell, 2003; Shields-Poe & Pinelli, 1997).
Another possible reason for the lack of significant findings in Part C is that the theoretical
constructs of interest were not adequately captured by the PBI and DAS. Measures developed
specifically from attachment theory would have been more appropriate, because attachment theory
links the independent and dependent variables. The selection of measures in the current study was,
however, constrained due to the use of data previously collected as part of the PARENTS study.
GENERAL DISCUSSION
3.8 Strengths of the current study
General strengths of the current study, as well as strengths relative to previous studies that
utilised the PSS:NICU, are provided in this section. The vast majority of limitations of previous

75
literature that utilised the PSS:NICU, as described in the Introduction chapter, were addressed in this
study.
3.8.1 The representative nature of the sample
The sample in this study is argued, for several reasons, to be representative of mother-father
couples whose infant was admitted to the unit in the target year. First, the vast majority of the
infants whose parents were approached for recruitment were randomly selected (290 out of 296).
The six infants that were not randomly selected, due to the number of admissions to the unit being
lower than expected, is unlikely to have affected the representative nature of the sample. Second,
high percentages of parents who were approached consented to participate (82% of mothers and
97% of fathers). Third, a large proportion of the population was sampled: 182 mothers and 183
fathers of infants in the unit out of the 578 infants admitted in the target year.
On the other hand, it is unlikely that the findings from this study would generalise to other
national or international NICUs. This situation is because care practices are thought to vary
between NICUs (Ens-Dokkum et al., 1992; Franck et al., 2005; Reid & Bramwell, 2003). Given
that New Zealand is an international leader in survival rates of premature infants (Ministry of
Health, 2005), it is also unlikely that this study’s findings would generalise to NICUs in other parts
of the world.
3.8.2 Large sample size
A large sample of mothers (n =182) and fathers (n = 183) participated in this study. These
numbers provided sufficient power to detect statistically significant associations and differences
between groups (Meltzoff, 1998). The exception was in the Part C ANOVA analyses for fathers,
where there was a small number of fathers in the high stress group (n = 4). This small number was
due to fathers in general experiencing a low level of stress from the NICU.

76
3.8.3 Systematic data analyses
Another strength of the current study is its systematic data analyses. First, analyses clearly
detailed a range of parents’ and infants’ characteristics. The description of infant characteristics, in
terms of gestation and birth weight, was a particular strength because some previous PSS:NICU
studies (Miles, 1989; Shields-Poe & Pinelli, 1997) had poorly defined these basic characteristics.
Detailed descriptions of infants’ and parents’ characteristics aided consideration of: (1) the
appropriateness of making comparisons with previous findings, (2) the influence of these
characteristics, such as level of infant illness, on the target variables, and (3) the generalisability of
the findings.
In Part A, providing a table with the frequency of responses to each item on the PSS:NICU is
advantageous for ease of comparisons with other studies. Removal of items that were rarely
experienced by participants provided a more concise scale for use with this sample. In Parts A and
B, analyses were conducted with the a priori PSS:NICU subscales and the modified subscales
derived from factor analysis. This procedure allowed an assessment to be made as to which version
of the scale was more reliable and valid, and therefore more appropriate for future use in New
Zealand. In addition, both Metric 1 and Metric 2 scores were employed. These procedures
exercised in Parts A and B allow ease of comparisons between the current study’s findings and other
studies using the PSS:NICU. In Part C, correlations were used to examine the link between parents’
stress from the parent-infant relationship in the unit and past relationships. Additional analyses
included categorization of stress into three categories (low, moderate, and high), ANOVAs, tests for
linearity, and post hoc comparison tests, which provided more detail about the links.
3.8.4 Reliable and valid measures
Support was provided in the current study for various types of validity and reliability of the
measures. Further, the measures were well established and standardised previously in the literature;
several of the measures had been previously used with New Zealand or Australian samples. These
properties enabled more confidence to be held in the meaning and stability of the results in the
current study, and ease of comparisons between the current study and other studies.

77
3.8.5 Representation of fathers and mother-father comparisons
Strengths of this study, compared to previous studies using the PSS:NICU, were the
representation of fathers, and comparisons between mothers’ and fathers’ stress scores. Fathers
were represented fairly, with a large balanced sample of mothers and fathers, and these two groups
were considered separately in the majority of data analyses. In addition, a large number (n = 179) of
mother-father couples were recruited, which enabled appropriate comparisons across genders using
matched pair statistical analyses. The importance of representing the father in this type of research
was detailed in the Introduction chapter, and included: (1) evidence that fathers experience stress
from the unit (Franck et a., 2005; Perehudoff, 1990; Shields-Poe & Pinelli, 1997); and (2) theory
and research demonstrating that fathers play an important role in the family, particularly with
regards to the NICU (Affonso et al., 1992; Jeffcoate et al., 1979; Levy-Shiff et al., 1989).
3.8.6 Parents representative of the diverse range of infants admitted to NICUs
Another strength of the current study, in contrast to previous PSS:NICU studies (Dudek-
Shriber, 2004; Miles et al., 1993; Miles, et al., 1991; Perehudoff, 1990; Reid & Bramwell, 2003;
Seideman et al., 1997; Shields-Poe & Pinelli, 1997), is that the infants of parents sampled were
representative of the diverse range admitted to NICUs. First, parents were recruited from the
Christchurch Women’s NICU, which caters for low, moderate and high dependency infants. Parents
were not excluded by way of their infant’s gestational age, birth weight, or type of medical
condition, and these characteristics were described in detail. Reason for refusal to participate in the
study was asked of parents, and the most common reason given was time constraint. Therefore,
refusal of parents due to their infant having a low or extremely low birth weight was considered
unlikely.
3.8.7 Distinct time frame of administration of the PSS:NICU
The present study administered the PSS:NICU within a distinct time frame, of 2-3 weeks
after infant admission to the unit. In contrast, the majority of previous studies that utilised the scale

78
administered it at various points during infant admission (Dudek-Shriber, 2004; Franck et al., 2005;
Miles, 1989), or around the time of infant discharge (Seideman, 1997; Shields-Poe & Pinelli, 1997).
This variation in time point of administration within studies is a possible reason for inconsistencies
in the findings of these previous studies. Support for this idea has been provided by Affonso et al.
(1992), who found different frequencies and intensities of stressors at four different times during
infants’ NICU admissions. The different times, related to the infant, that these authors administered
the scale were: (1) 96 hours after birth, (2) within 2-3 weeks of birth, (3) within 5-6 weeks of birth,
and (4) a week before discharge. Therefore, the use of a distinct time frame of administration of the
PSS:NICU is a strength of the current study, because it helps control for the potential confound of
time point of administration of the scale.
3.9 Limitations of the current study
Various limitations of the current study have previously been discussed in relation to the
interpretation of the results of Parts A, B and C. This section describes more general
methodological limitations of the current study.
3.9.1 Descriptive design
Due to the descriptive nature of this study, the independent variables were not manipulated.
In Part B, sources of stress experienced by parents from the unit were described. Part C examined
the extent that stress from the parent-infant relationship in the unit was associated with past
relationships. Consequently, inferences of cause or effect and mechanisms of action, such as
attachment, could not be made. Only explanatory studies are able to make these types of inferences,
but these studies should only be conducted once findings have been established in the descriptive
literature. Hence, this study adopted a descriptive design because first, no prior research similar to
the present study had been conducted in New Zealand or in the case of Part C, internationally.
Second, inconsistencies existed among findings in the previous literature.
79
3.9.2 Lack of contrast groups in the methodological design
Another limitation of this study was the lack of contrast groups in its methodological design
(Meltzoff, 1998). Inclusion of a group of parents from Christchurch Women’s Hospital, whose
newborn infant was not admitted to the NICU, would have enabled stress from having an infant
cared for in the NICU to be distinguished from the stress of having a newborn infant. A difficulty,
however, is finding a stress measure to use with control parents that is comparable to the highly
specific PSS:NICU. Given that stress it thought to be a similar construct to anxiety or depression
(Cox, 1978; Quick et al., 2000), a measure of these states would likely be comparable. Carter et al.
(2005) conducted a study with a similar sample to this study and a control group, using the
Edinburgh Postnatal Depression scale and the Hospital Anxiety and Depression scale. Higher levels
of clinically relevant anxiety and depression were found in the NICU parents compared to the
controls.
The present study used a cross-sectional design, as opposed to a longitudinal design,
whereby the questionnaires were administered to parents during one time frame: within 2-3 weeks
of their infant’s NICU admission. Parents’ stress levels during the first 2 -3 weeks of their infant’s
admission could, therefore, not be distinguished from those prior to, at other times during, or after
their infant’s admission. Identifying parents prior to their infant’s NICU admission would, however,
require a large scale prospective study that would likely be impractical, due to the expense and time
needed. Follow-up research is being conducted by the PARENTS study to identify whether
psychological distress of parents of NICU infants continues over time. A disadvantage with
measuring parents’ stress at a time point long after their infant is discharged from the unit is that the
PSS:NICU is no longer applicable. Findings from one follow-up of the PARENTS study indicated
that psychiatric symptoms of parents who had an infant in the NICU decreased by 9 months, to
levels similar to parents of healthy infants (Carter, Mulder, Darlow & Frampton, 2007).
Furthermore, time point of measurement was a potential factor in the lack of significant associations
found in Part C. If the questionnaires were administered at a different time during infant’s
admission, significant associations may have been found. In support of this idea is a NICU study by
Affonso et al. (1992), of parental stressors including care giving and the partner relationship. These
stressors were rated as high in frequency and intensity 5-6 weeks after infant birth or close to infant
discharge, but were not rated as important stressors at earlier times during infant admission.

80
3.9.3 Self-report questionnaire measures
Although self-report questionnaires are a valuable type of measure in psychological research,
sole reliance on them is a limitation because of the potential for subjective report bias. For example,
social desirability refers to the tendency of individuals to present themselves in a positive light
according to social norms or values (Colman, 2003). Research with the PBI and corroborative
reports by siblings, twins and parents, however, has supported it as an accurate measure of parenting
(Parker, 1990). Utilisation of various types of measures of the target variables in this study, such as
parental interviews and observations, with involvement of family, friends, and NICU staff, would
have provided a more comprehensive measure of the variables.
3.10 Summary and conclusions
In Part A, overall, satisfactory psychometric properties of the PSS:NICU was demonstrated
when used with a large sample of parents whose infant was in the NICU at Christchurch Women’s
Hospital. Previous literature demonstrated reliability and validity of the scale in the United
Kingdom, USA and Canada (Franck et al., 2005; Miles et al., 1993; Reid & Bramwell, 2003); the
present study extends this finding to a New Zealand sample. Preliminary support for extension of
the reliability and validity of the PSS:NICU to mothers and to fathers is also provided in this study.
Although the modified subscales, based on the factor analysis, were used in Part B, findings from
Part A suggest there is little value in modifying the subscales for future use in the Christchurch
Women’s NICU.
In Part B, the level and sources of stress experienced by parents from the NICU were
described. First, it was shown that, overall, both mothers and fathers experienced a low level of
stress from having their infant cared for in the unit, consistent with the majority of previous
literature. Second, mothers experienced the unit as more stressful compared to fathers. This was
true for the overall NICU experience, and each aspect of the unit: sights and sounds, infant
appearance and behaviour, alterations to the parent-infant relationship, and staff communication.
Due to the mixed findings of previous studies regarding gender differences in experience of stress
from the NICU, the gender difference found in the present study needs replication. Third, the aspect

81
of the unit experienced as the most stressful by mothers was alterations to the parent-infant
relationship, extending this finding to a New Zealand sample. Lastly, the most stressful aspect of
the unit for fathers was sights and sounds of the unit and, given the inconsistencies in previous
studies regarding this finding, replication is needed.
In Part C, the extent to which parents’ stress from the parent-infant relationship in the unit
was associated with parenting they received as a child, and their couple relationship, was explored.
Lack of evidence was found for associations between these variables. The exception was for
mothers: a weak but significant negative correlation was found between level of stress from the
parent-infant relationship and level of maternal care received in childhood. Possible reasons for the
lack of strong significant findings were provided, including: the retrospective nature of the PBI,
potential confounding variables, and the theoretical constructs not being adequately captured by the
PBI or DAS. Given the paucity of previous literature in this area and limitations with the present
study, the findings from Part C are regarded as tentative.
3.11 Implications
The present study provides important information for health care professionals working with
parents in the NICU at Christchurch Women’s Hospital. This information can be used to prevent
stress or facilitate adaptation and coping with regard to stress. Because satisfactory psychometric
properties of the PSS:NICU was demonstrated in this unit, its future use in the unit for further
research and clinical assessment purposes is supported. Overall, parents appeared to achieve a
satisfactory level of adaptation to the unit during the early stage of their infant’s admission.
Therefore, it is unnecessary to provide a general intervention, further to what is already being
practiced in the unit, with all parents. There are, however, some parents that do find the NICU
environment more stressful, and they may benefit from increased clinical attention.
Justification was provided for specific clinical attention to be targeted to the following areas.
Priority should be given towards preparing the mother for, and supporting the mother concerning,
alterations to the normal relationship with her infant in the unit. The mother should to be educated
on her infant’s condition, treatment options, and ethical issues, so she can be involved as much as
possible in the decision making regarding her infant. Attention should be given to teaching the

82
mother specific NICU care skills and techniques for use with her infant. The mother should be
allowed to stay with her infant throughout the NICU admission. This would require provision of
beds beside infants in the unit, as at present mothers can only stay in the postnatal ward or nearby
accommodation (Ministry of Health, 2005). Visitation by friends and family should be considered.
All of these practices would work to promote mother-infant bonding. In addition, health care
professionals should be aware of the potential risk factor for mothers of low maternal care in
childhood. This factor could be identified in individual assessment, and addressed in treatment with
psychotherapy or social support. Priority should also be given to making staff available to prepare,
orientate, and support the father regarding the sights and sounds of the unit. Medical equipment
should be made as least invasive as possible. A staff member should be available outside fathers’
work hours to orientate them to the unit. These interventions correspond to family-centered and
infant developmental care principles (Harrison, 1993; Westrup, in press). The aim of these
principles is to shift the focus of care from traditional procedure based practices to processes and
relationships, including increased involvement of parents.
Efforts to lower parental stress has considerable advantages for a parent, his or her family,
and society as a whole, as outlined in Bronfenbrenner’s Ecological Systems theory (Bronfenbrenner
& Evans, 2000). On an individual level, physical health benefits include lower risk of heart attack,
stroke, hypertension, and cancer (Gleitman, 1995; Schooler et al., 2000); moreover, mental health
benefits include lower risk of anxiety and depression (Cox, 1978; Davidson & Neale, 2001). Lower
parental stress may transfer to lower rates of divorce in parents of NICU infants (Leifer et al., 1972).
Decreased parental stress can promote infant’s cognitive, behavioural, and emotional development
(Assel et al., 2002; Singer et al., 1999), particularly pertinent for infants admitted to the NICU who
are disadvantaged compared to other infants. Lastly, the monetary benefits to society are huge, in
terms of decreases in health care costs and increases in productivity.
3.12 Suggestions for future research
The findings from Part A indicate two directions for future research regarding the
PSS:NICU. First, further exploration of the scale with a view to decrease the number of items in the
scale and provide a more concise measure. This direction is justified because the initial factor
analysis did not provide support for the a priori subscales, and four items from the Staff subscale

83
were rarely experienced by parents in this study and previous studies. Second, further investigation
could determine whether the PSS:NICU fully represents the stress experience of fathers.
Investigation could take the form of qualitative information from fathers such as interviews,
consultation with self-help groups and pilot groups. Findings from this investigation may indicate
the scale would benefit from revision based on a balanced sample of mothers and fathers.
Further research is needed into differences in regional and geographical NICU care practices,
to determine their contribution to inconsistencies in the parental stress response literature, and the
generalisability of the findings of this literature. Inconsistencies include whether gender differences
exist in the level of stress experienced from particular aspects of the NICU, and the most stressful
aspect of the unit for fathers. NICUs in different cultural contexts should be sampled and their care
practices, such as those based on infant developmental care and family-centered care principles
(Westrup, in press), assessed in relation to parental stress. Based on the assessment of these
practices, development of the best universal care practices would undoubtedly be beneficial for
infants and their families (Harrison, 1993).
Research with a longitudinal design would allow any patterns in mothers’ and fathers’ stress
responses to be tracked over time. It could then be determined if parental stress during and after
infant’s NICU admission is for example, transient, wavering, or chronic. Time points or frames of
measurement should be distinct and systematic, such as those used by Affonso et al. (1992) based on
different events happening at the particular times. In addition, the PSS:NICU could be administered
during infant admission and retrospectively, at a short time after infant discharge. This type of
design would help to determine if parents tend to not rate the NICU negatively when their infant is
reliant on care from the unit.
A point for consideration in future research similar to the current study is regarding
measurement. Measures should be chosen that adequately capture the theoretical constructs of
interest, in order to test theory. Because attachment theory linked the independent and dependent
variables in this study, the Attachment Interviews (Bartholomew & Horowitz, 1991), appear to be a
more applicable measure, compared to the PBI and the DAS. The Attachment Interviews include
assessment of attachment styles in childhood and adult romantic relationships. A variety of types of
measures, such as interviews, questionnaires, and observations, with corroborating sources, such as

84
family, friends, and NICU staff, should also be utilised to provide a more comprehensive measure of
the target variables.
A large quantity of theoretical and empirical work is still required to achieve a
comprehensive understanding of the target variables in this study, extraneous variables, and the
mechanisms linking these variables. Extraneous variables have been described in the Parental
NICU Stress model, including personal characteristics, situational factors, personal resources, and
environment support (Wereszczak et al., 1997), and identified by research (Carter, Mulder &
Darlow, 2007; Dudek-Shriber, 2004; Franck et al., 2005; Reid & Bramwell, 2003; Shields-Poe &
Pinelli, 1997). The first step is to establish findings in the descriptive literature, and use complex
statistical analyses to incorporate the wide range of variables. Only then can studies be designed to
determine the mechanisms linking the variables.

85
APPENDIX A

86

87

88

89
APPENDIX B

90
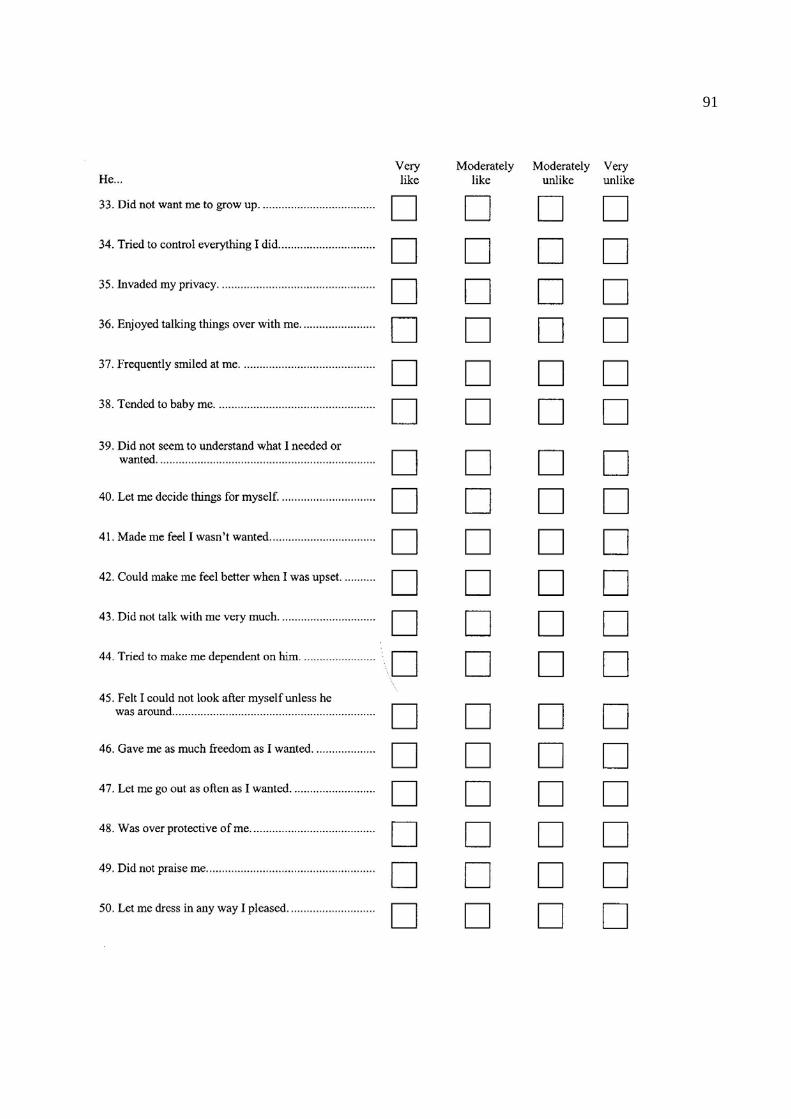
91

92
APPENDIX C

93

94

95
APPENDIX D
Table D1. Frequencies of Responses by Mothers and by Fathersa to Individual Items of the PSS:NICU Item(s) according to subscaleb
N/A M (F)
1 M (F)
2 M (F)
3 M (F)
4 M (F)
5 M (F)
1. Sights and Sounds
(a) Presence of monitors & equipment
5 (4) 41 (80) 75 (66) 41 (26) 17 (5) 3 (2)
(b) Presence of constant noises
5 (4) 40 (69) 76 (71) 42 (29) 13 (8) 6 (2)
(c) Sudden noises 13 (6) 15 (26) 49 (73) 66 (49) 27 (23) 12 (6)
(d) Other sick babies 10 (3) 65 (95) 66 (57) 30 (22) 8 (4) 3 (2)
(e) Large number of people working in the unit
6 (5) 137(145) 20 (22) 13 (8) 6 (2) 0 (1)
2. Infant Appearance
(a) Tubes and equipment 9 (9) 12 (34) 56 (75) 53 (41) 38 (19) 14 (5)
(b) Bruises, cuts or incisions 48 (63) 14 (17) 35 (38) 37 (38) 27 (17) 21 (10)
(c) Unusual colour 46 (51) 34 (36) 47 (54) 35 (23) 15 (14) 5 (5)
(d) Unusual breathing 66 (47) 7 (16) 24 (47) 40 (31) 24 (30) 21 (12)
(e) Suddenly changes colour
150(141) 3 (4) 4 (9) 3 (8) 13 (13) 9 (8)
(f) Stops breathing 151(148) 1 (0) 2 (3) 2 (7) 6 (15) 20 (10)
(g) Small size 77 (65) 23 (50) 29 (32) 32 (22) 17 (9) 4 (5)
(h) Wrinkled appearance 101 (77) 50 (79) 18 (19) 11 (4) 1 (2) 1 (2)
(i) Having a machine breathe for my baby
136(125) 8 (13) 13 (19) 11 (17) 7 (7) 7 (2)
(j) Needles and tubes 31 (34) 8 (19) 38 (62) 36 (30) 42 (19) 27 (19)
(k) Intravenous line or tube 26 (26) 36 (65) 53 (48) 33 (26) 22 (12) 12 (6)
(l) Baby seemed to be in pain 64 (83) 1 (8) 11 (23) 24 (30) 37 (25) 45 (14)
(m) Crying for long periods 127(133) 4 (2) 12 (14) 12 (22) 13 (7) 14 (5)
(n) Baby looked afraid 110(134) 6 (3) 16 (21) 19 (9) 13 (9) 18 (7)
(o) Baby looked sad 96(123) 6 (8) 26 (26) 14 (11) 19 (13) 21 (2)
(p) Limp and weak 115(100) 9 (21) 18 (28) 13 (18) 16 (12) 11 (4)
(q) Jerky movements 66 (76) 26 (45) 49 (33) 22 (13) 10 (11) 9 (5)
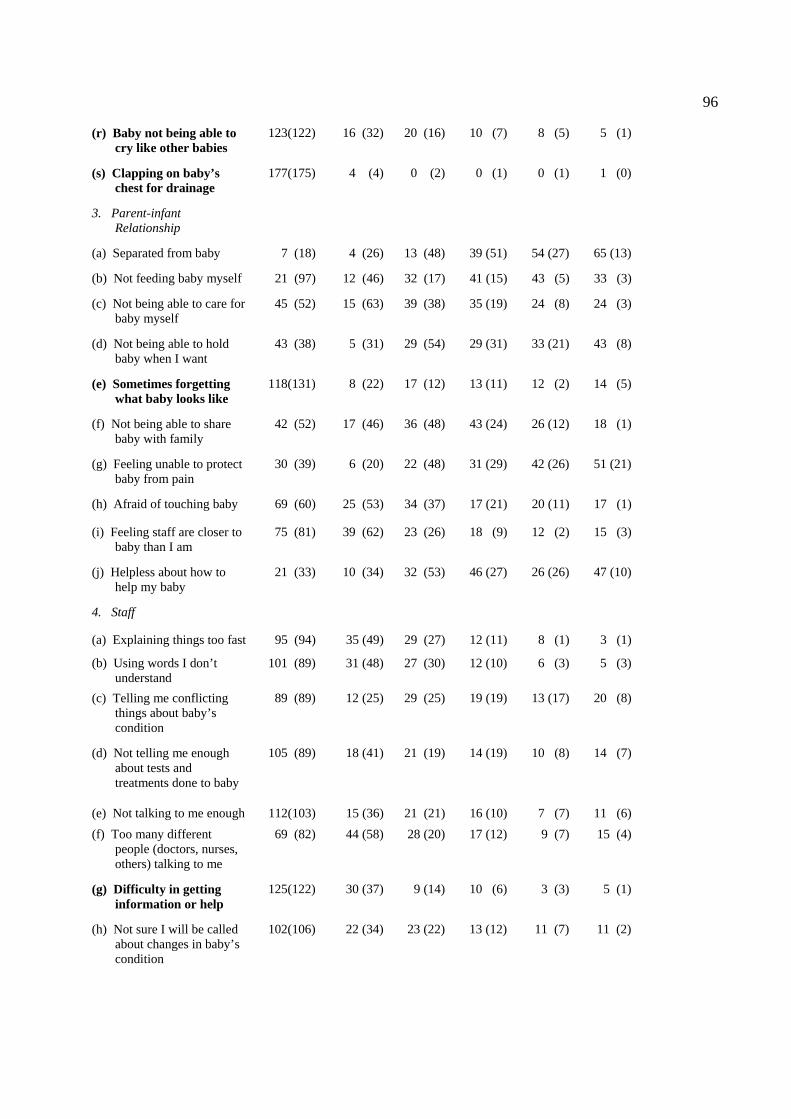
96
(r) Baby not being able to cry like other babies
123(122) 16 (32) 20 (16) 10 (7) 8 (5) 5 (1)
(s) Clapping on baby’s chest for drainage
177(175) 4 (4) 0 (2) 0 (1) 0 (1) 1 (0)
3. Parent-infant Relationship
(a) Separated from baby 7 (18) 4 (26) 13 (48) 39 (51) 54 (27) 65 (13)
(b) Not feeding baby myself 21 (97) 12 (46) 32 (17) 41 (15) 43 (5) 33 (3)
(c) Not being able to care for baby myself
45 (52) 15 (63) 39 (38) 35 (19) 24 (8) 24 (3)
(d) Not being able to hold baby when I want
43 (38) 5 (31) 29 (54) 29 (31) 33 (21) 43 (8)
(e) Sometimes forgetting what baby looks like
118(131) 8 (22) 17 (12) 13 (11) 12 (2) 14 (5)
(f) Not being able to share baby with family
42 (52) 17 (46) 36 (48) 43 (24) 26 (12) 18 (1)
(g) Feeling unable to protect baby from pain
30 (39) 6 (20) 22 (48) 31 (29) 42 (26) 51 (21)
(h) Afraid of touching baby 69 (60) 25 (53) 34 (37) 17 (21) 20 (11) 17 (1)
(i) Feeling staff are closer to baby than I am
75 (81) 39 (62) 23 (26) 18 (9) 12 (2) 15 (3)
(j) Helpless about how to help my baby
21 (33) 10 (34) 32 (53) 46 (27) 26 (26) 47 (10)
4. Staff
(a) Explaining things too fast 95 (94) 35 (49) 29 (27) 12 (11) 8 (1) 3 (1)
(b) Using words I don’t understand
101 (89) 31 (48) 27 (30) 12 (10) 6 (3) 5 (3)
(c) Telling me conflicting things about baby’s condition
89 (89) 12 (25) 29 (25) 19 (19) 13 (17) 20 (8)
(d) Not telling me enough about tests and treatments done to baby
105 (89) 18 (41) 21 (19) 14 (19) 10 (8) 14 (7)
(e) Not talking to me enough 112(103) 15 (36) 21 (21) 16 (10) 7 (7) 11 (6) (f) Too many different
people (doctors, nurses, others) talking to me
69 (82) 44 (58) 28 (20) 17 (12) 9 (7) 15 (4)
(g) Difficulty in getting information or help
125(122) 30 (37) 9 (14) 10 (6) 3 (3) 5 (1)
(h) Not sure I will be called about changes in baby’s condition
102(106) 22 (34) 23 (22) 13 (12) 11 (7) 11 (2)

97
(i) Staff looking worried about baby
127(119) 16 (27) 14 (14) 9 (10) 8 (10) 8 (3)
(j) Staff acting as if they did not want parents around
128(134) 23 (24) 7 (13) 5 (6) 11 (3) 8 (3)
(k) Staff acting as if they did not understand my baby’s behaviour or special needs
138(141) 18 (23) 12 (9) 7 (7) 4 (3) 3 (0)
5. General stress
(a) How stressful has the experience of having baby hospitalised been for you?
2 (5) 6 (20) 36 (62) 56 (47) 45 (35) 37 (14)
Note: M=mothers (n = 182), F=fathers (n = 183). N/A = not applicable, 1=not at all stressful, 2=a little stressful, 3=moderately stressful, 4=very stressful, 5=extremely stressful. aFathers’ responses are in parentheses. bPSS:NICU item statements have been shortened in the table. cBold font indicates items that were scored “not applicable” by more than two thirds of mothers or fathers or both.

98
REFERENCES
Affleck, G., Tennen, H., & Rowe, J. (1991). Infants in crisis: how parents cope with newborn
intensive care and its aftermath. New York: Springer-Verlag. Affonso, D. D., Hurst, I., Mayberry, L. J., Haller, L., Yost, K., & Lynch, M. E. (1992). Stressors
reported by mothers of hospitalized premature infants. Neonatal Network, 11, 63-70. Ainsworth, M. D. S. (1991). Attachment and other affectional bonds across the lifecycle. In C. M.
Parkes, J. Stevenson-Hinde & P. Marris (Eds.), Attachment across the life cycle. London: Routledge.
American Psychiatric Association (2000). Diagnostic and Statistical Manual of Mental Disorders,
Text Revision (4th ed.). Washington, DC: American Psychiatric Association. Antill, J. K., & Cotton, J. K. (1982). Spanier's dyadic adjustment scale: some confirmatory analyses.
Australian Psychologist, 17, 181-189. Appley, M. H., & Trumbull, R. (1967). On the concept of psychological stress. In M. H. Appley &
R. Trumbull (Eds.), Psychological stress: Issues in research. New York: Meredith Publishing Co.
Assel, M. A., Landry, S. H., Swank, P. R., Steelman, L., Miller-Loncar, C., & Smith, K. E. (2002).
How do mothers' childrearing histories, stress and parenting affect children's behavioural outcomes? Child: Care, Health & Development, 28, 359-368.
Banmen, J., & Vogel, N. A. (1985). The relationship between marital quality and interpersonal
sexual communication. Family Therapy, 17, 43-79. Bartholomew, K. (1993). From childhood to adult relationships: attachment theory and research. In
Duck, S. (Ed.), Learning about relationships. California: Sage Publications Inc. Bartholomew, K. (1994). Assessment of individual differences in adult attachment. Psychological
Inquiry, 5, 23-27. Bartholomew, K., & Horowitz, L. (1991). Attachment styles among young adults: A test of a four
category model. Journal of Personality and Social Psychology, 61, 226-244. Bell, E. F. (2004). What to look for in a Neonatal Intensive Care Unit. Retrieved 17 September,
2006, from http://www.pediatrics/neonatalintensivecareunit/index.html Belsky, J. (1984). The determinants of parenting: A process model. Child Development, 55, 83-96. Belsky, J., & Isabella, R. A. (1985). Marital and parent-child relationships in family of origin and
marital change following the birth of a baby: A retrospective analysis. Child Development, 56(Special issue: Family development), 342-349.

99
Berk, L. E (2006). Child Development (7th ed.). Boston: Pearson Bjelland, I., Dahl, A. A., Haug, T. T., & Neckelmann, D. (2002). The validity of the Hospital
Anxiety and Depression scale: an updated literature review. Journal of Psychosomatic Research, 52, 69-77.
Blumberg, N. L. (1980). Effects of neonatal risk, maternal attitude, and cognitive style on early
postpartum adjustment. Journal of Abnormal Psychology, 89, 139-150. Bowlby, J. (1979). The making and breaking of affectional bonds. London: Tavistock Publications. Bregman, J., & Kimberlin, L. V. S. (1993). Developmental outcome in extremely premature infants.
Pediatric Clinics of North America, 40, 937-953. Bronfenbrenner, U., & Evans, G. W. (2000). Developmental science in the 21st century: Emerging
questions, theoretical models, research designs and empirical findings. Social Development, 9, 115-125.
Burnett, P. (1987). Assessing marital adjustment and satisfaction: A review. Measurement and
Evaluation in Counseling and Development, 20, 113-121. Carey, M. P., Spector, I. P., Lantinga, L. J., & Krauss, D. J. (1993). Reliability of the Dyadic
Adjustment Scale. Psychological Assessment, 5, 238-240. Carter, J. D., Mulder, R. T., Bartram, A. F., & Darlow, B. A. (2005). Infants in a neonatal intensive
care unit: parental response. Archives of Disease in Childhood Fetal Neonatal Edition, 90, F109-F113.
Carter, J. D., Mulder, R. T. & Darlow, B. A. (2007). Parental stress in the NICU: the influence of
personality, psychological, pregnancy and family factors. Personality and Mental Health, 1, 40-50.
Carter, J. D., Mulder, R. T., Frampton, C. M. A. & Darlow, B. A. (2007). Infants admitted to a
neonatal intensive care unit: psychological status at 9 months. Acta Paediatrica, 96, 1286-1289.
Carter, M. C., & Miles, M. S. (1989). The Parental Stressor Scale: Pediatric Care Unit. Maternal
Child Nursing, 18, 187-198. Colman, A. M. (2003). Oxford Dictionary of Psychology. Oxford: Oxford University Press. Cox, T. (1978). Stress. Baltimore: University Park Press. Darlow, B., & Mulder, R. (2001). New Neonatal Intensive Care Unit Studies. Retrieved April 2,
2007, from http://www.otago.ac.nz/news/2001/01-02-01_press_release.html Davison, G. C., & Neale, J. M. (2001). Abnormal Psychology (8th ed.). USA: John Wiley & Sons.

100
Doering, L. V., Moser, D. K., & Dracup, K. (2000). Correlates of anxiety, hostility, depression, and psychosocial adjustment in parents of NICU infants. Neonatal Network, 19, 15-23.
Dudek-Shriber, L. (2004). Parent stress in the neonatal intensive care unit and the influence of
parent and infant characteristics. The American Journal of Occupational Therapy, 58, 509-520.
Eddy, M. J. (1991). An emperical evaluation of the dyadic adjustment scale: Exploring the
differences between marital "satisfaction" and "adjustment". Journal of Behavioral Assessment, 13, 199-220.
Ens-Dokkum, M. H., Schreuder, A. M., Veen, S., Verlooe-Vanhorick, S. P., Brand, R., & Ruys, J.
H. (1992). Evaluation of care for the preterm infant: review of literature on follow-up of preterm and low birthweight infants. Pediatric and Perinatal Epidemiology, 6, 434-459.
Feeney, J. A. (2004). Adult attachment and relationship functioning under stressful conditions:
understanding partners' responses to conflict and challenge. In W. S. Rholes & J. A. Simpson (Eds.), Adult attachment: theory, research, and clinical implications. New York: The Guilford Press.
Franck, L. S., Cox, S., Allen, A. & Winter, I. (2005). Measuring neonatal intensive care unit-related
parental stress. Journal of Advanced Nursing, 49, 608-615. Gennaro, S. (1988). Postpartal anxiety and depression in mothers of term and preterm infants.
Nursing Research, 37, 82-85. Gilligan, C. (1988). Remapping the moral domain: new images of self in relationship. In C.
Gilligan, J. V. Ward, J. M. Taylor, & B. Bardige (Eds), Mapping the moral domain (pp. 3-19). Cambridge: Harvard University Press.
Gleitman, H. (1995). Psychology (4th ed.). New York: Norton. Griffin, T. (1990). Nurse barriers to parenting in the special care nursery. Journal of Perinatal-
Neonatal Nursing, 4, 56-67. Halverson, C. F. (1988). Remembering your parents: reflections on the retrospective method.
Journal of Personality, 56, 436-443. Harrison, H. (1993). The Principles for Family-Centered Neonatal Care. Pediatrics, 92, 643-650. Hazan, C., & Shaver, P. (1987). Romantic love conceptualized as an attachment process. Journal of
Personality and Social Psychology, 52, 511-524. Herrmann, C. (1997). International experiences with the Hospital Anxiety and Depression scale - a
review of validation data and clinical results. Journal of Psychosomatic Research, 42, 17-41. Holditch-Davis, D., & Miles, M. S. (2000). Mothers' stories about their experiences in the neonatal
intensive care unit. Neonatal network, 19, 13-21.

101
Jeffcoate, J. A., Humphrey, M. E., & Lloyd, J. K. (1979). Role perception and response to stress in fathers and mothers following pre-term delivery. Social Science and Medicine, 13, 139-145.
Klaus, M. H., & Kennell, J. H. (1970). Mothers separated from their newborn infants. Pediatric
Clinics of North America, 17, 1015-1037. Knight, R. G., Waal-Manning, H. J., & Spears, G. F. (1983). Some norms and reliability data for the
State-Trait Anxiety Inventory and the Zung Self-Rating Depression scale. British Journal of Clinical Psychology, 22, 245-249.
Lazarus, R. S. (1966). Psychological stress and the coping process. New York: McGraw-Hill Book
Co. Lazarus, R. S., & Folkman, S. (1984). Stress, appraisal and coping. New York: Springer Publishing
Co. Leifer, A. D., Leiderman, P. H., Barnett, C. R., & Williams, J. A. (1972). Effects of mother-infant
separation on maternal attachment behavior. Child Development, 43, 1203-1218. Levy, D. M. (1970). The concept of maternal overprotection. In E. J. Anthony & T. Benedek (Eds.),
Parenthood: Its psychology and psychopathology (1st . ed.), (pp. 387-409). Boston: Little Brown.
Levy-Shiff, R., Sharir, H., & Mogilner, M. B. (1989). Mother- and father-preterm infant relationship
in the hospital preterm nursery. Child Development, 60, 93-102. Mackinnon, A. J., Henderson, A. S., Scott, R., & Duncan-Jones, P. (1989). The Parental Bonding
Instrument (PBI): An epidemiological study in a general population sample. Psychological Medicine, 19, 1023-1034.
Magnusson, D. (1982). Situational determinants of stress: an interactional perspective. In L.
Goldberg & S. Breznitz (Eds.), Handbook of stress: theoretical and clinical aspects. New York: Free Press.
McGrath, J. (n.d.). Neonatal Intensive Care Unit. Retrieved 17 September 2006, from
http://www.deathreference.com/Me-Nu/Neonatal-Intensive-Care-Unit.html Meltzoff, J. (1998). Critical Thinking about Research: Psychology and Related Fields. Washington:
American Psychological Association. Mikulincer, M., & Florian, V. (1998). The relationship between adult attachment styles and
emotional and cognitive reactions to stressful events. In J. A. Simpson & W. S. Rholes (Eds.), Attachment theory and close relationships. New York: Guilford Press.
Miles, M. S. (1989). Parents of critically ill premature infants: sources of stress. Critical Care
Nursing Quarterly, 12, 69-74. Miles, M. S., Carlson, J., & Funk, S. G. (1996). Sources of support reported by mothers and fathers
of infants hospitalized in a neonatal intensive care unit. Neonatal Network, 15, 45-52.

102
Miles, M. S., & Carter, M. C. (1983). Assessing parental stress in intensive care units. American
Journal of Maternal Child Nursing, 8, 354-359. Miles, M. S., & Funk, S. G. (1998). Parental Stressor Scale: Neonatal Intensive Care Unit.
Retrieved 12 December, 2005 from http://www.unc.edu/depts/crci/instruments/pssnicu. Miles, M. S., Funk, S. G., & Carlson, J. (1993). Parental Stressor Scale: Neonatal Intensive Care
Unit. Nursing Research, 42, 148-152. Miles, M. S., Funk, S. G., & Kasper, M. A. (1991). The neonatal intensive care environment:
sources of stress for parents. AACN Clinical Issues in Critical Care Nursing, 2, 346-354. Minde, K. K., Marton, P., Manning, D., & Hines, B. (1980). Some determinants of mother-infant
interaction in the premature nursery. Journal of the American Academy of Child Psychiatry, 19, 1-21.
Minde, K., Whitelaw, A., Brown, J., & Fitzhardinge, P. (1983). Effect of neonatal complications in
premature infants on early parent-infant interactions. Developmental Medicine & Child Neurology, 25, 763-777.
Ministry of Health (2005). A Review of Neonatal Intensive Care Provision in New Zealand.
Wellington: Ministry of Health. NICUs: definition. (2006). Retrieved September 13, 2006, from
http://www.en.wikipedia.org./wiki/NICU Parker, G. (1990). The Parental Bonding Instrument: A decade of research. Social Psychiatry and
Psychiatric Epidemiology, 25, 281-282. Parker, G. B., Barrett, E. A., & Hickie, I. B. (1992). From nurture to network: Examining links
between perceptions of parenting received in childhood and social bonds in adulthood. American Journal of Psychiatry, 149, 877-885.
Parker, G., Tupling, H., & Brown L. B. (1979). A Parental Bonding Instrument. British Journal of
Medical Psychology, 52, 1-10. Perehudoff, B. (1990). Parents' perceptions of environmental stressors in the special care nursery.
Neonatal Network, 9, 39-44. Quick, J. C., Quick, J. D., & Gavin, J. H. (2000). Stress: measurement. In A. E. Kazdin (Ed.),
Encyclopedia of Psychology (Vol. 7, pp. 484-487). New York: Oxford University Press. Ramanaiah, N. V., Franzen, M., & Schill, T. (1983). A psychometric study of the State-Trait
Anxiety Inventory. Journal of Personality Assessment, 47, 531-535. Reid, T., & Bramwell, R. (2003). Using the Parental Stressor Scale: NICU with a British sample of
mothers of moderate risk preterm infants. Journal of Reproductive and Infant Psychology, 21, 279-291.
103
Rholes, W. S., & Simpson, J. A. (2004). Attachment theory: basic concepts and contemporary
questions. In W. S. Rholes & J. A. Simpson (Eds.), Adult Attachment: theory, research, and clinical applications. New York: Guilford Press.
Sameroff, A. J., & Chandler, M. J. (1964). Reproductive risk and the continuum of caretaking
casualty. In E. M. Hetherington, F. D. Horowitz, S. Scarr-Salapatek & G. M. Seigel (Eds.), Review of child development research (Vol. 4, pp. 187-244). Chicago: University of Chicago Press.
Sammons, W. A. H., & Lewis, J. M. (1985). Premature babies: A different beginning. USA: Mosby. Schooler, T. Y., Dougall, A., & Baum, A. (2000). Stress: Impact on health. In A. E. Kazdin (Ed.),
Encyclopedia of psychology (Vol. 7, pp. 487-489). New York: Oxford University Press. Seideman, R. Y., Watson, M. A., Corff, K. E., Odle, P., Haase, J., & Bowerman, J. L. (1997). Parent
stress and coping in NICU and PICU. Journal of Pediatric Nursing, 12, 169-177. Sharpley, C. F., & Cross, D. G. (1982). A psychometric evaluation of the Spanier Dyadic
Adjustment Scale. Journal of Marriage & the Family, 44, 739-747. Shields-Poe, D., & Pinelli, J. (1997). Variables associated with parental stress in neonatal intensive
care units. Neonatal Network, 16, 29-37. Singer, L. T., Salvator, A., Guo, A., Collin, M., Lilien, L., & Baley, J. (1999). Maternal
psychological distress after the birth of a very low-birth-weight infant. Journal of the American Medical Association, 281, 799-805.
Snaith, R. P., & Zigmond, A. S. (1994). The Hospital Anxiety and Depression scale manual.
England: Nfer-Nelson. Spanier, G. B. (1976). Measuring dyadic adjustment: New scales for assessing the quality of
marriage and similar dyads. Journal of Marriage & the Family, 38, 15-28. Spanier, G. B. (2001). Dyadic adjustment scale (DAS) users manual. New York: Multi-health
systems. Spielberger, C. D., Gorsuch, R. L., & Lushene, R. E. (1970). Manual for the State-Trait Anxiety
Inventory. California: Consulting Psychologists Press. Spielberger, C. D., Gorsuch, R. L., Lushene, R., Vagg, P. R., & Jacobs, G. A. (1983). Manual for
the State-Trait Anxiety Inventory (Form Y). California: Consulting Psychologists Press. Sroufe, A. L. (1979). The coherence of individual development: early care, attachment and
subsequent developmental issues. American Psychologist, 34, 834-841. Sroufe, L. A., & Waters, E. (1977). Attachment as an organizational construct. Child Development,
48, 1184-1199.

104
Stevens, J. P. (2002). Applied Multivariate Statistics for the Social Sciences (4th ed.). Mahwah: Lawerence Erlbaum Associates.
Theunissen, N. C. M., Veen, S., Fekkes, M., Koopman, H. M., Zwinderman, K. A. H., Brugman, E.,
et al. (2001). Quality of life in preschool children born preterm. Developmental Medicine & Child Neurology, 43, 460-465.
Trause, M. A., & Kramer, L. I. (1983). The effects of premature birth on parents and their
relationship. Developmental Medicine & Child Neurology, 25, 459-465. Veit, C. T., & Ware, J. E. (1983). The structure of psychological stress and well-being in general
populations. Journal of Consulting and Clinical Psychology, 51, 730-742. Wereszczak, J., Miles, M. S., & Holditch-Davis, D. (1997). Maternal recall of the neonatal intensive
care unit. Neonatal Network, 16, 33-40. Westrup, B. (in press). Newborn Individualized Developmental Care and Assessment Program
(NIDCAP) - Family-centered developmentally supportive care. Early Human Development. White, K. M., Speisman, J. C., Jackson, D., Bartis, S., & Costos, D. (1986). Intimacy maturity and
its correlates in young married couples. Journal of Personality and Social Psychology, 50, 152-162.
Wilhelm, K., & Parker, G. (1990). Reliability of the Parental Bonding Instrument and Intimate Bond
Measure scales. Australian & New Zealand Journal of Psychiatry, 24, 199-202. Zigmond, A. S., & Snaith, R. P. (1983). The Hospital Anxiety and Depression Scale. Acta
Psychictria Scandnivaca, 67, 361-370.


