Embed Size (px)
Citation preview

J. Anat. (1999) 195, pp. 419–427 with 7 figures Printed in the United Kingdom 419
Structural abnormalities do not explain the early functional
abnormalities in the peripheral nerves of the streptozotocin
diabetic rat
DAVID WALKER1, ANNE CARRINGTON2, SUSAN A. CANNAN2, DIANE SAWICKI2,
JANET SREDY2, ANDREW J. M. BOULTON1 AND RAYAZ A. MALIK1
"Department of Medicine, Manchester Royal Infirmary, UK and #The Institute for Diabetes Discovery, Branford,
Connecticut, USA
(Accepted 25 May 1999)
The streptozotocin (STZ)-diabetic rat, the most commonly employed model of experimental diabetic
neuropathy, is characterised by a reduction in nerve conduction velocity, pain threshold and blood flow.
Whether or not structural abnormalities underlie these functional abnormalities is unclear. 10 adult male
Sprague–Dawley STZ-diabetic rats (diabetes duration 27 d) and 10 age-matched (23 wk) control animals
were studied. Motor nerve conduction velocity (m s−") was significantly reduced in diabetic (41.31³0.8)
compared with control (46.15³1.5) animals (P! 0.001). The concentration of sciatic nerve glucose (P!0.001), fructose (P! 0.001) and sorbitol (P! 0.001) was elevated, and myoinositol (P! 0.001) was reduced
in diabetic compared with control animals. Detailed morphometric studies demonstrated no significant
difference in fascicular area, myelinated fibre density, fibre and axon areas as well as unmyelinated fibre
density and diameter. Endoneurial capillary density, basement membrane area and endothelial cell profile
number did not differ between diabetic and control animals. However, luminal area (P! 0.03) was increased
and endothelial cell area (P! 0.08) was decreased in the diabetic rats. We conclude there is no detectable
structural basis for the reduction in nerve conduction velocity, pain threshold or blood flow, observed in the
streptozotocin diabetic rat.
Key words : Diabetes mellitus ; peripheral neuropathy; nerve conduction velocity; morphometry; microangiopathy.
Human diabetic polyneuropathy is characterised
functionally by a reduction in nerve conduction
velocity and action potential amplitude, an increase in
sensory thresholds and reduced intraneural oxygen
tension with altered nerve blood flow (Boulton &
Malik, 1998). These changes are accompanied struc-
turally both by myelinated and unmyelinated nerve
fibre degeneration and regeneration (Britland et al.
1990; Llewelyn et al. 1990; Bradley et al. 1995; Malik,
1997) and by endoneurial microangiopathy (Malik et
al. 1989, 1992, 1993; Giannini & Dyck, 1995).
Experimental animals have been employed exten-
sively to model human diabetic neuropathy to
Correspondence to Dr R. A. Malik, Department of Medicine, Manchester Royal Infirmary, Oxford Road, Manchester M13 , UK. Tel. :
44-161-276-8691; fax: 44-161-274-4740.
reproduce nerve conduction velocity deficits, abnor-
malities of nerve blood flow and altered pain
perception thresholds (Kennedy et al. 1982; Sharma
et al. 1983; Sharma & Thomas, 1987; Calcutt et al.
1996). Most studies on STZ-diabetic rats, have not
demonstrated myelinated fibre loss in a number of
peripheral nerves including the sural (Sharma &
Thomas, 1974; Brown et al. 1980; Sugimura et al.
1980), tibial (Sharma & Thomas, 1974; Sharma et al.
1981), sciatic (Wright & Nukada, 1994a) and peroneal
(Jakobson, 1976) nerves. Conflicting reports have
arisen on the detailed morphometric changes in
myelinated fibre size with some authors finding no
abnormalities (Sharma et al. 1981; Wright & Nukada,
1994a) and others who report a decrease in fibre size

(Jakobson, 1976; Bestetti et al. 1981a, b ; Zemp et al.
1981; Thomas et al. 1990; Thomas, 1990). A selective
reduction in axonal size in comparison with controls
has also been demonstrated in some (Sharma et al.
1983; Sharma & Thomas, 1987; Sima et al. 1987) but
not all (Sharma et al. 1980, 1981; Wright & Nukada,
1994a ; Malone et al. 1996) animal models. Both
myelinated and unmyelinated fibre pathology may
play a role in altered pain thresholds, however studies
on structural abnormalities of the latter group of fibres
have again been limited (Sharma & Thomas, 1987).
With regard to nerve blood flow, although controversy
exists as to whether nerve blood flow is reduced
(Cameron et al. 1991) or increased (Williamson et al.
1993) the consensus appears to be for the former.
Structural changes in the endoneurial vasculature are
not clearly described and require detailed study.
Thus in order to determine the structural changes
which may underlie the reduction in nerve conduction
velocity, pain threshold and blood flow in the STZ-
diabetic rat, we have conducted detailed morpho-
metric studies to quantify nerve fibre and endoneurial
capillary pathology, respectively.
Animals
Ten male Sprague–Dawley rats fasted for 24 h
received a single intraperitoneal injection of strepto-
zotocin (Sigma, St Louis, MO) 30 mg}kg body weight
in 0.03 citrate buffer at pH 4.5. Ten control animals
received 0.03 citrate buffer alone. At the time of
injection both control and diabetic animals were
19 wk of age with a mean body weight of 450 g. Blood
glucose levels and body weights were measured twice
weekly and after 27 d motor nerve conduction velocity
was measured under isoflurane anaesthesia. The
sciatic nerve was then removed and frozen for tissue
sugar and polyol estimation and the tibial nerve was
harvested and prepared for light and electron mi-
croscopy.
Electrophysiology
Motor nerve conduction velocity was measured
in the sciatic}tibial-interosseous system employing
previously defined methodology (Sharma & Thomas,
1974). The rats were anaesthetised with 4% isoflurane
in oxygen (1 l}min) for induction and subsequently
2.5% (control) and 2% (diabetic) (0.5 l}min) for
maintenance. Near-nerve temperature was recorded
and maintained at 37°C using a wire thermister and
thermometer (YSI Tele-thermometer, Model 4000A,
Yellow Springs Instrument Co., OH), heat therapy
system (Baxter K-MOD 100 pump and DUO Therm
pad, Baxter Healthcare, Deerfield, IL) and a source of
radiant heat. The left sciatic}tibial nerve was stimu-
lated at the sciatic notch and the Achilles tendon and
action potentials were recorded from the interosseous
muscle using needle electrodes (Sapphire II, 4ME
electrophysiological system, Teca Corp, Pleasantville,
NY). The nerve was stimulated by square wave pulses
(duration 0.1 ms, intensity 20 V) and the average of 10
action potential traces were measured and the nerve
length was measured after dissection. This was
repeated 3 times (after removal and replacement of
the electrodes) to obtain values for the coefficient of
variation.
Biochemistry
Rats were euthanised and cardiac puncture was
undertaken to obtain blood for later determination of
plasma glucose (hexokinase enzymatic method, Sigma
Diagnostica, St Louis, MO) and glycosylated hae-
moglobin (Glyc-Affin Ghb Kit, Isolab, Akron, OH).
Both sciatic nerves were weighed and frozen for
polyol estimation by capillary gas chromatography.
Frozen tissueswere homogenised in cold 5%trichloro-
acetic acid with Duall tissue grinder, and the de-
proteinised extracts were analysed as their aldonitrile
derivatives.
Nerve biopsy and histology
The distal portion of the tibial nerve was biopsied at
a constant site and immediately fixed by immersion in
2.5% glutaraldahyde in 0.2 sodium cacodylate
buffer (pH 7.3). After washing in the same buffer, the
nerve was postfixed in 1% cacodylate-buffered os-
mium tetroxide and following a second wash was
dehydrated through ascending concentrations of etha-
nol before embedding in TAAB Spurr’s resin using
propylene oxide as an intermediary.
Sections were cut on a Reichert-Jung Ultracut
ultramicrotome (Reichert-Jung, Eindhoven, The
Netherlands). Semithin (0.75 µm) transverse sections
prepared for light microscopy were stained with
thionin followed by acridine orange and examined
under a Leitz Laborlux SE light microscope (Leitz
Wetzler, Germany) with a Leica WILD MPS32
camera attachment (Leica, Heerbrugg, Switzerland).
For electron microscopy, ultrathin (80 nm) trans-
verse sections were transferred to 200-mesh formvar-
420 D. Walker and others

Table 1. Body weight, blood glucose, HbA1c, motor nerve
conduction velocity (MNCV) and sciatic nerve polyol levels in
control (n¯ 10) and diabetic (n¯ 10) animals (mean³S.E.M.)
Parameter Control Diabetic P value
Body weight (g) 479³5.0 391³8.0 ! 0.001
Blood glucose
(mmol}l)
4.1³0.2 20.4³1.0 ! 0.001
HbA1c (%) 5.1³0.1 13.8³0.4 ! 0.001
MNCV (ms−") 46.15³1.5 41.31³0.8 ! 0.001
Reproducibility 2.7³1.6 3.2³1.5 ns
MNCV (CV-%)
Glucose (nmol}mg) 2.37³0.14 7.43³0.37 ! 0.001
Fructose (nmol}mg) 0.87³0.04 6.17³0.41 ! 0.001
Sorbitol (nmol}mg) 0.18³0.02 1.32³0.19 ! 0.001
Myo-inositol
(nmol}mg)
2.49³0.09 1.62³0.06 ! 0.001
coated copper grids and contrasted with 2% uranyl
acetate in 70% ethanol followed by 0.3% sodium
citrate in 0.1 sodium hydroxide, before viewing in a
Philips EM400T transmission electron microscope
(Philips, Eindhoven, The Netherlands).
Morphometric procedures
One section}biopsy was chosen from each animal on
the basis of optimal preservation and technical quality
of staining. Light microscope photomontages of
whole nerve fascicles were produced from semithin
sections and direct counts were made of the number of
myelinated fibres, regenerative clusters (here defined
as 2 or more closely apposed small or medium sized
myelinated fibres) and endoneurial capillaries. The
fascicular area was measured and the density per mm#
was calculated.
A systematic random sampling technique was
employed to obtain electronmicroscope images of the
Fig. 1. Light photomicrographs of semithin transverse sections of the tibial nerve from control (a) and diabetic (b) rats. Bar, 30 µm.
nerve fibres for quantification (Mayhew & Sharma,
1984). The lattice-mesh of the copper support grid
provides an ideal basis for sampling. 24 images per
sample were taken of myelinated fibres (magnification
¬1700) and unmyelinated fibres (magnification
¬4600). Myelinated fibres sectioned in the paranodal
or perinuclear regions or at Schmidt-Lanterman
incisures were excluded and at least 200 fibres per
animal were assessed to determine the fibre and axon
areas. The density of unmyelinated fibres and
Schwann cell profiles was calculated by direct counts
from electronmicrographs and the axon diameter was
measured employing 2-point digitisation. In addition,
12 images of endoneurial capillaries were taken for
each animal at a magnification of ¬4600. The
luminal, endothelial cell and basement membrane
areas were measured and endothelial cell profile
number was counted directly. All measurements were
made using a hand-held digitiser linked to a micro-
computer system (Synoptics, Cambridge).
Statistical analysis
The results are presented as the mean³...
Functional and clinical data were assessed for stat-
istical difference using the 2-way ANOVA. All
morphometric data were assessed by the Mann–
Whitney U test (n ¯ 10 unless otherwise stated).
Clinical observations and electrophysiology
The values for body weight, blood glucose and
glycated haemoglobin levels (HbA1c) are shown in
Table 1. Prior to biopsy both blood glucose and
HbA1c levels were significantly (P! 0.001) elevated
Peripheral nerve pathology in STZ-diabetic rats 421

Table 2. Mean fascicular area (FA), myelinated fibre density
(MFd), regenerative cluster density (RCd), fibre and axon
area and g ratio plus unmyelinated axon density (UAd), axon
diameter and unassociated Schwann cell profile density
(USCPd) for the tibial nerve of control and diabetic animals
(mean³S.E.M.)
Parameter Control Diabetic P value
FA (mm#) 0.19³0.02 0.20³0.03 ns
MFd (no. mm−#) 10059³1190 10312³1235 ns
RCd (no. mm−#) 71.4³8.7 81.6³11.6 ns
Fibre area (µm#) 38.6³2.1 38.9³2.4 ns
Axon area (µm#) 17.9³3.1 17.8³1.5 ns
g ratio 0.46³0.02 0.46³0.03 ns
UAd (no. mm−#) 68800³4000 70500³10700 ns
Axon diameter (µm) 0.66³0.01 0.65³0.01 ns
USCPd (%) 10.3³2.1 11.3³2.5 ns
and body weights reduced (P! 0.001) in the diabetic
compared with control animals. Concentrations of
sciatic nerve glucose, fructose and sorbitol were
increased (P! 0.001) and myo-inositol decreased
(P! 0.001) in diabetic compared with control animals
(Table 1). Motor nerve conduction velocity (MNCV)
Fig. 2. Myelinated fibre area distribution in control (solid bars) compared with diabetic (hatched bars) rats.
was significantly reduced (P! 0.001) in the diabetic
animals compared with control animals (Table 1).
Morphometry
Myelinated fibres. Qualitative (Fig. 1) and quanti-
tative (Table 2) data on myelinated fibres in control
and diabetic animals are presented. There was no
significant difference in the mean fascicular area and
myelinated fibre and regenerative cluster density
between diabetic and control animals. Measures of
fibre and axon area as well as g ratio were almost
identical between the 2 groups. Both myelinated fibre
(Fig. 2) and axon (Fig. 3) size distributions were very
similar between control and diabetic animals.
Unmyelinated fibres. Qualitative (Fig. 4) and quan-
titative (Table 2) findings of the unmyelinated axons
in the control and diabetic rats are demonstrated.
Unmyelinated axon density and the density of
Schwann cell profiles show no significant difference
between control and diabetic animals. Unassociated
Schwann cell profile density and percentage exhibited
no difference between the 2 groups. When the number
422 D. Walker and others
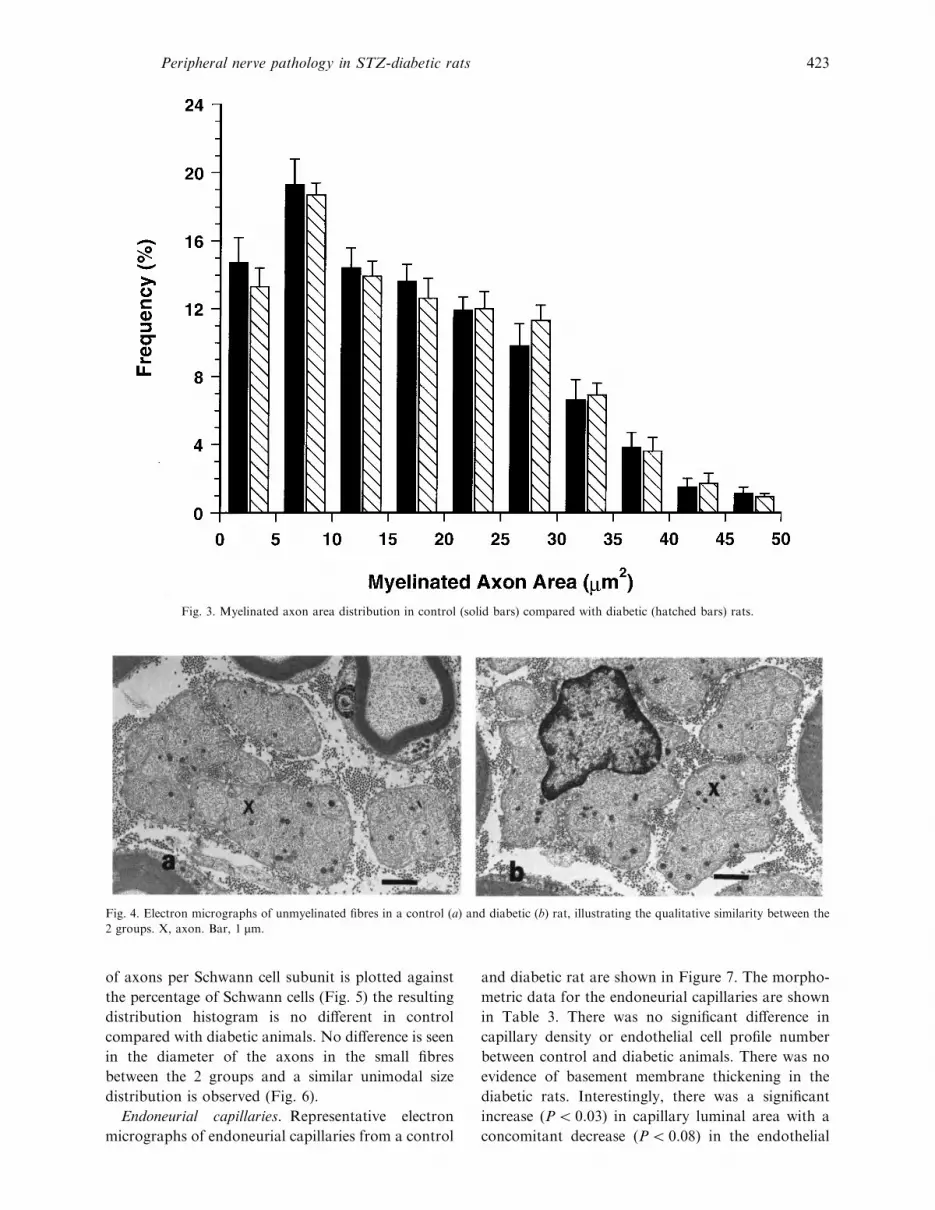
Fig. 3. Myelinated axon area distribution in control (solid bars) compared with diabetic (hatched bars) rats.
Fig. 4. Electron micrographs of unmyelinated fibres in a control (a) and diabetic (b) rat, illustrating the qualitative similarity between the
2 groups. X, axon. Bar, 1 µm.
of axons per Schwann cell subunit is plotted against
the percentage of Schwann cells (Fig. 5) the resulting
distribution histogram is no different in control
compared with diabetic animals. No difference is seen
in the diameter of the axons in the small fibres
between the 2 groups and a similar unimodal size
distribution is observed (Fig. 6).
Endoneurial capillaries. Representative electron
micrographs of endoneurial capillaries from a control
and diabetic rat are shown in Figure 7. The morpho-
metric data for the endoneurial capillaries are shown
in Table 3. There was no significant difference in
capillary density or endothelial cell profile number
between control and diabetic animals. There was no
evidence of basement membrane thickening in the
diabetic rats. Interestingly, there was a significant
increase (P! 0.03) in capillary luminal area with a
concomitant decrease (P! 0.08) in the endothelial
Peripheral nerve pathology in STZ-diabetic rats 423

Fig. 5. Percentage distribution of the number of unmyelinated axons per Schwann cell profile in control (solid bars) compared with diabetic
(hatched bars) rats.
Fig. 6. Unmyelinated axon-size distribution (based on axon diameter) in control (solid bars) compared with diabetic (hatched bars) rats.
424 D. Walker and others

Fig. 7. Electron micrographs of endoneurial capillaries taken from a control (a) and diabetic (b) rat. Bar, 1.5 µm
Table 3. Endoneurial capillary density (Cd), luminal area
(LA), endothelial cell area (ECA), basement membrane area
(BMA) and endothelial cell profile number (ECP no.) in the
tibial nerve of control and diabetic animals (mean³S.E.M.)
Parameter Control Diabetic P value
Cd (no. mm−#) 39.1³3.7 41.7³3.0 ns
LA (µm# ) 25.0³2.6 35.4³1.7 ! 0.03
ECA (µm#) 24.8³2.6 21.7³2.6 ! 0.08
BMA (µm#) 16.8³1.1 16.7³2.4 ns
ECP no. 5.3³0.7 5.1³0.3 ns
cell area when comparing diabetic with control
animals.
The present study has employed detailed light and
electron microscopic morphometric techniques to
assess the ultrastructure of the tibial nerve in a group
of adult STZ-diabetic rats compared with control
animals. The diabetic animals demonstrate a signifi-
cant reduction in motor nerve conduction velocity
and also abnormalities of the polyol pathway in
keeping with many previous studies in the STZ-
diabetic rat (Sharma & Thomas, 1987).
Although experimental animals have been
employed extensively to model human diabetic neur-
opathy, nerve fibre loss and extensive demyelination
sufficient to explain the reduction in nerve conduction
velocity have not been demonstrated in most animal
models (Sharma & Thomas, 1987). This study
demonstrates no significant reduction in myelinated
fibre density confirming previous studies conducted in
the STZ-diabetic rat (Sharma & Thomas, 1987), STZ-
diabetic monkey (Chopra et al. 1977), db}db mouse
(Sharma et al. 1983), Chinese hamster (Kennedy et al.
1982) and STZ}alloxan-diabetic dog (Walker et al.
1997). Only the BB Wistar rat (Sima et al. 1987) and
the spontaneously diabetic dog (Sharma et al. 1995)
have demonstrated a distal reduction in myelinated
fibre density. Axon diameter has been found to be
smaller in diabetic animals than in controls, the
difference being greater than for myelin thickness,
both in the STZ-diabetic rat (Sharma & Thomas,
1987), and the db}db mouse (Sharma et al. 1983), and
axonal atrophy has been claimed in the BB Wistar rat
(Sima et al. 1987). The present study did not
demonstrate axonal atrophy, in keeping with obser-
vations in the Chinese hamster (Kennedy et al. 1982)
and the spontaneous (Sharma et al. 1995) and
STZ}alloxan-diabetic dog (Walker et al. 1997).
Attenuated nerve fibre maturation may explain the
reduced axonal size in diabetic rats as nerve fibre
diameter continues to increase up until 9–12 months
of age. The majority of previously reported studies of
the effects of hyperglycaemia on nerve structure have
been conducted during this time and some have
claimed axonal atrophy. Two recent studies in the
STZ-diabetic rat, which have taken nerve maturation
into account, have failed to show a reduction in
axonal size (Wright & Nukada, 1994a ; Malone et al.
1996).
Regeneration is a vitally important process necess-
ary to repair damaged nerve. In this study, myelinated
fibre regenerative cluster density was no different in
diabetic animals compared to controls. Previous
studies have demonstrated impaired regeneration in
the STZ-diabetic rat, shown by a delay in myelination
(Sharma & Thomas, 1975) and axonal regeneration
(Longo et al. 1986; Vinik et al. 1995). Limitations of
assessing regenerative cluster density employing light
microscopy include the inability to detect myelinated
fibres that have a very thin myelin sheath. Despite this
difficulty, a recent study has employed light mi-
Peripheral nerve pathology in STZ-diabetic rats 425

croscopy in sural nerve biopsies from diabetic patients
(Bradley et al. 1995) and the results are comparable to
previous studies employing electron microscopy
(Britland et al. 1990).
Pain is a major clinical problem in diabetic patients
and several morphometric studies have demonstrated
abnormalities of the unmyelinated fibres in painful
neuropathy (Britland et al. 1990; Llewelyn et al. 1990;
Malik, 1997). Tactile allodynia and formalin hyper-
algesia have been used as indicators of painful
neuropathy in the diabetic rat (Calcutt et al. 1996).
Few studies have performed a detailed assessment of
unmyelinated fibres in experimental diabetes. Of those
that have, no morphological abnormalities have been
reported in the spontaneously (Sharma et al. 1995)
and STZ}alloxan (Walker et al. 1997) diabetic dog,
spontaneously diabetic mutant mice (Sharma et al.
1983) or the diabetic rat (Sharma & Thomas, 1974). In
this study we demonstrated no major abnormality
either in the Schwann cells or axons of unmyelinated
fibres in diabetic animals.
Endoneurial capillaries from diabetic patients with
neuropathy demonstrate basement membrane thick-
ening, endothelial cell hypertrophy and hyperplasia
with pericyte degeneration which relates to neuro-
pathic severity (Malik et al. 1989, 1992, 1993; Giannini
& Dyck, 1995). However, patients without evidence of
neuropathy display basement membrane thickening
and pericyte degeneration only (Giannini & Dyck,
1995). A 50% reduction in sciatic nerve perfusion in
the STZ-diabetic rat has been reported from studies
using invasive and noninvasive methods including
hydrogen clearance microelectrode polarography and
laser-Doppler flowmetry, with deficits becoming ap-
parent within 1 wk of diabetes induction (Cameron et
al. 1991; Wright & Nukada, 1994b). Few previous
studies have examined capillary morphology in animal
models. In this study, capillary basement membrane
area was not significantly increased in diabetic
animals. This contrasts with findings in diabetic
patients without (Giannini & Dyck, 1995) and with
mild (Malik et al. 1992) neuropathy. The STZ-diabetic
rat has been reported actually to show a thinner
basement membrane than in control animals
(Yagihashi et al. 1996). We did not observe endothelial
cell hyperplasia. Moreover we demonstrated a signifi-
cant increase in luminal area and a reduction in
endothelial cell size. An increase in luminal size has
been demonstrated previously in the STZ-diabetic rat
(Yagihashi et al. 1996) and diabetic patients with mild
(Malik et al. 1992) and established (Malik et al. 1989)
neuropathy. Such an increase in luminal size may
suggest an increase in blood flow. Alternatively, it
may represent a dilated endoneurial vascular bed due
either to an overall reduction in blood flow or
increased arteriovenous shunting (Kihara et al. 1994;
Tesfaye et al. 1996) which may in turn result in raised
back pressure in the endoneurial capillary bed, due to
increased flow in the postcapillary epineurial venules.
These detailed morphometric studies demonstrate
there is no structural basis for 3 commonly observed
functional abnormalities in the STZ-diabetic rat,
namely reduced nerve conduction velocity, nerve
blood flow and an altered pain threshold. Possible
reasons for the lack of pathology in this study may
include either the proximal site of biopsy (i.e. the tibial
nerve as opposed to the more distal sural) or
inadequate duration of diabetes. However, previous
studies in the sural nerve (Sharma & Thomas, 1974;
Brown et al. 1980; Sugimura et al. 1980) and after
prolonged diabetes duration (Sharma & Thomas,
1974; Wright & Nukada, 1994a) in the STZ-diabetic
rat also report limited morphological abnormalities.
Therefore, it seems likely that abnormalities of nerve
function in the early stages of diabetes occur due to
intrinsic, physiological abnormalities in axonal mem-
brane function (Quasthoff, 1998). Abnormalities of
nerve blood flow at this early stage are also likely to
be due to functional alterations derived from an
alteration in the neurohumoral control of blood flow
more proximally (Boulton & Malik, 1998).
BESTETTI G, ROSSI GL, ZEMP C (1981a) Changes in peripheral
nerves of rats four months after induction of streptozotocin
diabetes. Acta Neuropathologica (Berlin) 54, 129–134.
BESTETTI G, ZEMP C, PROBST D, ROSSI GL (1981b)
Neuropathy and myopathy in the diaphragm of rats after 12
months of streptozotocin-induced diabetes mellitus. A light,
electron microscopic and morphometric study. Acta Neuro-
pathologica (Berlin) 55, 11–20.
BOULTON AJM, MALIK RA (1998) Diabetic neuropathy.
Medical Clinics of North America 82, 909–929.
BRADLEY JL, THOMAS PK, KING RHM, MUDDLE JR,
WARD JD, TESFAYE S et al. (1995) Myelinated nerve fibre
regeneration in diabetic sensory polyneuropathy: correlation
with type of diabetes. Acta Neuropathologica (Berlin) 90, 403–410.
BRITLAND ST, YOUNG RJ, SHARMA AK, CLARKE BF
(1990) Association of painful and painless diabetic poly-
neuropathy with different patterns of nerve fibre degeneration
and regeneration. Diabetes 39, 898–908.
BROWN MJ, SUMNER AJ, GREENE DA, DIAMOND SM,
ASBURY AK (1980) Distal neuropathy in experimental diabetes
mellitus. Annals of Neurology 8, 168–178.
CALCUTT NA, JORGE MC, YAKSH TL, CHAPLAN SR (1996)
Tactile allodynia and formalin hyperalgesia in streptozotocin-
diabetic rats : effects of insulin, aldose reductase inhibition and
lidocaine. Pain 68, 293–299.
CAMERON NE, COTTER MA, LOW PA (1991) Nerve blood
flow in early experimental diabetes in rats : relation to conduction
deficits. American Journal of Physiology 261, E1–E8.
426 D. Walker and others

CHOPRA JS, SAWHNEY BB, CHAKRAVORTY RN (1977)
Pathology and time relationship of peripheral nerve changes in
experimental diabetes. Journal of the Neurological Sciences 32,
53–67.
GIANNINI C, DYCK PJ (1995) Basement membrane redupli-
cation and pericyte degeneration precede development of diabetic
polyneuropathy and are associated with its severity. Annals of
Neurology 37, 498–504.
JAKOBSON J (1976) Axonal dwindling in early experimental
diabetes. I. A study of cross sectioned nerves. Diabetologia 12,
539–546.
KENNEDY WR, QUICK DC, MIYOSHI T, GERRITSEN GC
(1982) Peripheral neurology of the diabetic Chinese hamster.
Diabetologia 23, 445–452.
KIHARA M, ZOLLMAN PJ, SMITHSON IL, LAGERLUND
TD, LOW PA (1994) Hypoxic effect of exogenous insulin on
normal and diabetic peripheral nerve. American Journal of
Physiology 266, E980–E985.
LLEWELYN JG, GILBY SG, THOMAS PK, KING RHM,
MUDDLE JR, WATKINS PJ (1990) Sural nerve morphometry
in diabetic autonomic and painful sensory neuropathy. Brain
114, 867–892.
LONGO FM, POWELL HC, LE BEAU J, GERRERO MR,
HECKMAN H, MYERS RR (1985) Delayed nerve regeneration
in streptozotocin-diabetic rats. Muscle & Nerve 9, 385–393.
MALIK RA (1997) The pathology of human diabetic neuropathy.
Diabetes 46 (Suppl. 2), S50–S53.
MALIK RA, NEWRICK PG, SHARMA AK, JENNINGS A,
AH-SEE AK, MAYHEW TM et al. (1989) Microangiopathy in
human diabetic neuropathy: relationship between capillary
abnormalities and the severity of neuropathy. Diabetologia 32,
92–102.
MALIK RA, VEVES A, MASSON EA, SHARMA AK, AH-SEE
AK, SCHADY W et al. (1992) Endoneurial capillary ab-
normalities in mild human diabetic neuropathy. Journal of
Neurology, Neurosurgery and Psychiatry 35, 557–561.
MALIK RA, TESFAYE S, THOMPSON SD, SHARMA AK,
BOULTON AJM, WARD JD (1993) Endoneurial localisation of
microvascular damage in human diabetic neuropathy.
Diabetologia 36, 454–459.
MALONE JI, LOWITT S, KORTHALS JK, SALEM A,
MIRANDA C (1996) The effect of hyperglycemia on nerve
conduction and structure is age dependent. Diabetes 45, 209–215.
MAYHEW TM, SHARMA AK (1984) Sampling methods for
estimating nerve fibre size. I. Methods for nerve trunks of mixed
fascicularity. Journal of Anatomy 139, 45–58.
QUASTHOFF S (1998) The role of axonal ion conductances in
diabetic neuropathy: a review. Muscle & Nerve 21, 1246–1255.
SHARMA AK, THOMAS PK (1974) Peripheral nerve structure
and function in experimental diabetes. Journal of the Neurological
Sciences 23, 1–15.
SHARMA AK, THOMAS PK (1975) Peripheral nerve regen-
eration in experimental diabetes. Journal of the Neurological
Sciences 24, 417–424.
SHARMA AK, BAJADA S, THOMAS PK (1980) Age changes in
the tibial and plantar nerves of the rat. Journal of Anatomy 130,
417–428.
SHARMA AK, BAJADA S, THOMAS PK (1981) Influence of
streptozotocin-induced diabetes on myelinated nerve fibre matu-
ration and on body growth in the rat. Acta Neuropathologica
(Berlin) 53, 257–265.
SHARMA AK, THOMAS PK, GABRIEL G, STOLINSKI C,
DOCKERY P, HOLLINS GW (1983) Peripheral nerve ab-
normalities in the diabetic mutant mouse. Diabetes 32,
1152–1161.
SHARMA AK, THOMAS PK (1987) Animal models : pathology
and pathophysiology. In Diabetic Neuropathy (ed. Dyck PJ,
Thomas PK, Asbury AK, Winegrad AI, Porte D Jr), pp.
237–252. Philadelphia: W. B. Saunders.
SHARMA AK, MALIK RA, DHAR P, MEHRA RD, AHMED
I, LOWRIE CT et al. (1995) Peripheral nerve abnormalities in
spontaneously diabetic dog. International Journal of Diabetes 3,
130–139.
SIMA AAF, BRISMAR T, YAGIHASHI S (1987) Neuropathies
encountered in the spontaneously diabetic BB Wistar rat. In
Diabetic Neuropathy (ed. Dyck PJ, Thomas PK, Asbury AK,
Winegrad AI, Porte D Jr), pp. 253–265. Philadelphia: W. B.
Saunders.
SUGIMURA K, WINDEBANK AJ, NATARAJAN V, LAM-
BERT EH, SCHMID H, DYCK PJ (1980) Interstitial hyper-
osmolarity may cause axis cylinder shrinkage in streptozotocin
diabetic nerve. Journal of Neuropathology and Experimental
Neurology 39, 710–721.
TESFAYE S, MALIK RA, HARRIS N, JAKUBOWSKI J,
MODY C, WARD JD (1996) Arterio-venous shunting and
proliferating new vessels in acute painful neuropathy of rapid
glycaemic control (insulin neuritis). Diabetologia 39, 329–335.
THOMAS PK (1990) The pathogenesis of diabetic neuropathy:
current problems and prospects. In Diabetic Neuropathy (ed.
Ward JD, Goto Y), pp. 3–14. Chichester : Wiley.
THOMAS PK, FRAHER JP, O’LEARY D, MORAN MA, COLE
M, KING RHM (1990) Relative growth and maturation of axon
size and myelin thickness in the tibial nerve of the rat. 2. Effect of
streptozotocin-induced diabetes. Acta Neuropathologica (Berlin)
79, 375–386.
VINIK AI, NEWTON PG, LOTTERY TJ, LUIS FJ, DEPT AS,
PITTENGER GL et al. (1995) Nerve survival and regeneration
in diabetes. Diabetes Review 3, 139–157.
WALKER D, MALIK RA, ANDERSON H, GARDINER TA,
BOULTON AJM (1997) The effects of Sulindac on peripheral
nerve morphology in the chemically induced diabetic dog.
Diabetologia 40 (Suppl. 1), A550.
WILLIAMSON JR, CHANG K, FRANGOS M et al., (1993)
Hyperglycemic pseudohypoxia and diabetic complications.
Diabetes, 42, 801–813.
WRIGHT RA, NUKADA H (1994a) Sciatic nerve morphology
and morphometry in mature rats with streptozotocin-induced
diabetes. Acta Neuropathologica (Berlin) 88, 571–578.
WRIGHT RA, NUKADA H (1994b) Vascular and metabolic
factors in the pathogenesis of experimental diabetic neuropathy
in mature rats. Brain 117, 1395–1407.
YAGIHASHI S, SUGIMOTO K, WADA R (1996) Endoneurial
vessel abnormalities in diabetic animal models. In Lessons from
Animal Diabetes VI (ed. Shafrir E, pp. 375–393). Boston:
Birkhauser.
ZEMP C, BESTETTI G, ROSSI GL (1981) Morphological and
morphometric study of peripheral nerves from rats with
streptozotocin–induced diabetes mellitus. Acta Neuropathologica
(Berlin) 53, 99–106
Peripheral nerve pathology in STZ-diabetic rats 427


