Embed Size (px)
Citation preview

Structural and Elemental Evidence for Edema in theRetina, Retinal Pigment Epithelium, and Choroid duringRecovery from Experimentally Induced Myopia
Helena Liang,1 Sheila G. Crewther,1,2 David P. Crewther,1,3 and Barbara M. Junghans1
PURPOSE. The purpose of this study was to monitor temporalchanges in the retina, retinal pigment epithelium (RPE), andchoroid of chick eyes using biometric, ultrastructural, andelemental microanalysis techniques as a means of visualizingmore detailed signs of the physiological processes underlyingchoroidal expansion and refractive normalization during recov-ery from form deprivation.
METHODS. Axial dimensions and refractions were measured onform-deprived and fellow eyes of 117 experimental chickensreared with monocular translucent occlusion from days 1 to 15and given different lengths of visual experience (T � 0–144hours) before death. Tissue was analyzed ultrastructurally byelectron microscopy and relative sodium (Na) and chloride (Cl)ion abundances, by using x-ray microanalysis to determinechanges in the presence of these indicators of tissue hydration.
RESULTS. Refractive error decreased from more than 20 D ofmyopia almost linearly over the first 144 hours after occlusion.Concurrent changes in thickness in the retina, RPE, and cho-roid were seen as a series of thickness increases and edema,which returned to normal thickness, first in the retina, and didnot reach maximum until 3 days after occluder removal in thechoroid. In freeze-dried tissue, Na and Cl ion concentrationswere greatest in the RPE photoreceptor outer segments andextravascular choroid at T � 0, decreasing toward fellow eyelevels by T � 48 in the RPE and choroid. Na and Cl ionabundances in the frozen lymph of choroidal lymphatics werenearly at control levels (T � 0) and increased later as thevessels became more distended after the extravascular edemabecame significant.
CONCLUSIONS. The results suggest that occluder removal in-duces edema across the retina and choroid and that this fluidmay be the vector eliciting choroidal expansion during recov-ery from form deprivation possibly driven by the hyperosmo-larity in the choroid, RPE, and photoreceptor outer segmentsthat accompanies deprivation. (Invest Ophthalmol Vis Sci.2004;45:2463–2474) DOI:10.1167/iovs.03-1009
Clinically significant refractive errors are the most commonform of visual disorder, with myopia affecting approxi-
mately one half of the world’s young adult population1–4 andhyperopia affecting another 20%. In several Asian countries,the prevalence of myopia is said to be approaching epidemicproportions.5 By comparison, the prevalence of myopia inprimary school children in the United States is considerablylower,6 and the prevalence in Australian children has recentlybeen shown to be significantly lower still.7 This suggests thatnot only do some populations show a genetic predisposition toaxial myopia but also that differences in environmental lifestylemay affect the development of refractive errors in humans.
Similarly, studies of many vertebrate groups, including hu-mans,8,9 monkeys,10 tree shrews,11 and chicks12 have demon-strated the presence of an environmental, visually mediatedactive emmetropization mechanism. This is achieved in thelong term by changes in ocular growth. However, attempts toidentify the neural signal driving such visually mediated refrac-tive development and the vector by which this signal is trans-lated into axial elongation have largely been unsuccessful,though it is usually accepted that the mechanisms responsiblefor such growth adaptations are predominantly local to theretina13–15 (although see Wildsoet C, et al. IOVS 2001;42:ARVOAbstract 326).
In the chick, removal of the occluder after form deprivation(FD) initiates a normalization of the induced refractive error16
with dramatic thickness changes in the retina and choroidwithin 30 minutes.17 Initial biometric descriptions of thesephenomena by Wallman et al.16 reported a threefold increasein choroidal thickness in the first 4 to 8 days of recovery after10 days of translucent occlusion and correlated this changewith the refractive error. It was hypothesized that the dilatedchoroid was “pushing” the retina back into focus,16 whileacknowledging that this cannot be the only mechanism ofre-emmetropization. The calculations of Wallman et al.16 indi-cated that the choroidally driven displacement of the retinawould contribute less than half of the refractive shift.
Currently, most recent theories seeking to explain thesource of choroidal expansion in recovery from FD are stillbased in some way on increased choroidal vascular perfusionafter occluder removal, though Wallman et al.16 suggested thatincreased synthesis of extracellular matrix (i.e., proteoglycans)and/or modulation of the smooth nonvascular muscle spanningthe choroid could be involved. Although both of these lattertwo hypotheses have since been supported by data, Pendrak et
From the 1School of Optometry, University of New South Wales,Sydney, New South Wales, Australia; the 2School of PsychologicalScience, La Trobe University, Melbourne, Victoria, Australia; and the3Brain Sciences Institute, Swinburne University of Technology, Mel-bourne, Victoria, Australia.
Presented in part at the annual meeting of the Association forResearch in Vision and Ophthalmology, Fort Lauderdale, Florida, May1996, and at the Ophthalmic Research Institute of Australia Conferencein Geelong, Australia, 1995.
Supported by National Health and Medical Research Council(NHMRC) Grant 970357 (DPC, SGC, BMJ), Dora Lush Scholarship (HL),and a University of New South Wales Gold Star Award (BMJ).
Submitted for publication September 11, 2003; revised February 1and March 14, 2004; accepted March 25, 2004.
Disclosure: H. Liang, None; S.G. Crewther, None; D.P.Crewther, None; B.M. Junghans, None
The publication costs of this article were defrayed in part by pagecharge payment. This article must therefore be marked “advertise-ment” in accordance with 18 U.S.C. §1734 solely to indicate this fact.
Corresponding author: Sheila G. Crewther, School of Psychologi-cal Science, La Trobe University, Melbourne, Victoria, Australia 3083;[email protected].
Investigative Ophthalmology & Visual Science, August 2004, Vol. 45, No. 8Copyright © Association for Research in Vision and Ophthalmology 2463
A R T I C L E S

al.,18 on the basis of biochemical studies, suggested that cho-riocapillaris leakage is the most likely primary source of thechoroidal swelling that occurs after occlusion. Such a theory isconsistent with our morphologic observations of an abnormal-ity of the choriocapillaris vessels during the first 48 hours.19
Shih et al.20 have also shown that, although choroidal bloodflow in the chick is significantly reduced in both eyes duringperiods of monocular occlusion, occluder removal leads to animmediate but relatively transient increase in blood flow21,22
that peaks at least 10 hours before the same researchers re-ported significant choroidal expansion. Fitzgerald et al.21 havehypothesized that the postocclusion increase in blood flowmay trigger the subsequent onset of choroidal expansion, butoffer no explanation as to why a bilateral increase in blood flowdoes not induce choroidal expansion in both eyes or whymonocular occlusion that initially induces bilaterally reducedblood flow results in choroidal thinning only in the occludedeye. Thus, questions remain as to what other normal mecha-nism(s) commonly associated with retinal physiology mightcontribute to changes in ocular growth or refractive normal-ization and whether the observed increase in choroidal thick-ness during recovery is an active or passive component of there-emmetropization process.
Normal Ocular Homeostasis
In general, fluid homeostasis in the various tissues throughoutthe body is under the control of epithelial cells. This is also thecase in the eye, with anterior chamber volume regulated byciliary epithelium and retinal edema regulated by the retinalpigment epithelium (RPE).23 Circadian oscillation in choroidalthickness and the complementary but antiphase change inaxial length and intraocular pressure, has been demonstratedin normal chicks,24,25 FD chicks,26 and marmosets,27 withNickla et al.25 arguing that intraocular pressure rhythms play arole in the regulation of the growth of the eye. Mammalsnormally show a net physiological flow of fluid from the retinaacross the RPE to the choroid during the day and a net increasein fluid movement into the vitreous during the night (seedetailed description in Ref. 28) which is consistent with theobservation of Nickla et al.25 of an increase in intraocularpressure and vitreous depth in the chick. In 1979, O’Leary andMillodot29 also observed a myopic shift in refraction witheyelid closure in humans.
Morphologic Responses to FD
Two weeks of either opaque or translucent occlusion in thechick eye induces abnormal ocular elongation, associated witha significant reduction (30%) in retinal thickness and choroidalthickness around the hemisphere.17,30–32 Our reports havealso noted that the thinning of the choroid is primarily due toconstriction, and even in some cases total collapse, of thelumen of the major blood vessels30 and lymphatic vessels33 andgreatly reduced density of the minor vessels of the choriocap-illaris.17 These structural changes can all be considered repre-sentative of perturbations of tissue hydration—that is, fluidbalance within the eye. The excessive vitreous elongation thataccompanies FD and the simultaneous thinning of the retinaand choroid are consistent with a net reduction in normaloutflow of fluid into the choroid.25
One expects that such changes should be reversible afterremoval of the occluder. In fact, as our earlier report17 men-tioned, changes in the vascular and lymphatic spaces of thechoroid are initiated within 30 minutes of occluder removal,17
despite the fact that choroidal blood flow is reduced for at least7 hours after occluder removal.21 Much of the rapid increase inchoroidal thickness appears to be due to the redilation of thelacunae of the suprachoroid16,33,34 and edema in the extravas-
cular space.17,19 The lacunae have recently been shown to betrue lymphatic sinusoids,33,35,36 and exhibit ultrastructural cor-relates of active and passive fluid movements.19 The frequencyof open junctions between lymphatic endothelial cells (ac-cepted as an anatomic indicator of passive fluid transfer) in-creased significantly over the first 72 hours after termination ofFD, whereas the density of lymphatic fenestrations (an indica-tor of active fluid transfer37) increased significantly in the first24 hours of recovery. However, there is still a need to explainthe source of the extra fluid that results in dilation of thelymphatics.
Thus, we hypothesize that the temporal change in refrac-tion after occluder removal is associated with anatomic evi-dence of increasing fluid retention in the retina-RPE-choroidcomplex. This edema should visible morphologically as a seriesof progressive changes in the thickness of the retina-RPE-choroid tissues associated with ultrastructural changes in thedensity and nature of RPE vesicular inclusions at the basalmembrane. Also, given that extravascular edema of all bodilytissues is associated with Na and Cl ion shifts, increases in therelative concentrations of these ions are expected in all regionsof the retina, photoreceptors, RPE, and choroid after removalof the occluder and the abrupt onset of normal illumination.
Hence, this article focuses on chicks recovering from FDand the temporal relationship between refractive changes andconcomitant changes in thickness of the retina, RPE (approx-imated by outer limiting membrane to Bruch’s membrane:OLM-BM) and choroid; ultrastructural evidence of changes influid movement in the basal membrane of the RPE; and ionicstatus of the ocular layers. The abundance of the key ionspecies related to extravascular tissue hydration in the choroidand retina was followed throughout the recovery period byscanning electron microscopy energy-dispersive x-ray micro-analysis. Preliminary reports of some of these findings havebeen published in brief in conference proceedings (Liang H, etal. IOVS 1998;39:ARVO Abstract 2306).17
MATERIALS AND METHODS
Hatchling meat chicks (N � 117) were raised in a controlled environ-ment in a 12-hour light–dark cycle, a restricted temperature range of29°C to 31°C, and unlimited availability of food and water. Monoculartranslucent occlusion was introduced on day 1 (the day after hatching)and maintained until day 15 in 96 animals. The occluders were heat-formed hemispheres molded from translucent white styrene sheetsand attached to the periocular feathers of the chicks with cyanoacry-late glue. Occluders were removed on day 15 and the chicks givenvarious lengths of unrestricted visual experience (T � 0, 2, 8, 24, 48,72, 96, 120, and 144 hours) before death. Three normal chickens wereincluded and killed on day 15 for qualitative comparison of ultrastruc-ture. Fellow eyes to experimental eyes across the first 96 hours ofrecovery formed the comparison group. Not all animals used forbiometric assessments were used for electron microscopy (describedlater). The T � 144 hour group (n � 4) were only assessed forrefractive status and are not included in the anatomic studies reportedherein.
Biometric Measurements
Biometric measurements (retinoscopy and ultrasonography) were col-lected from animals on day 1 before monocular occlusion, at occluderremoval on day 15 immediately before death. The refractive status ofthe eyes was determined with retinoscopy for the following experi-mental groups: T � 0 hours (n � 18); T � 2 hours (n � 5); T � 8 hours(n � 5); T � 24 hours (n � 12); T � 48 hours (n � 14); T � 72 hours(n � 14); T � 96 hours (n � 9); T � 120 hours (n � 6); and T � 144hours (n � 4). The refractive status of the fellow eyes was alwaysmeasured and results reported as the difference between the two eyes.
2464 Liang et al. IOVS, August 2004, Vol. 45, No. 8

For retinoscopy and ultrasonography, animals were lightly anesthe-tized with an intramuscular injection of a mixture of ketamine hydro-chloride and xylazine (30 mg/kg and 3 mg/kg, respectively).
Transmission Electron Microscopy
Animals were killed by barbiturate overdose, and the eyes were imme-diately prepared for light and electron microscopic examination. Al-though perfusion fixation has been suggested as the method of choicein some situations, pilot studies showed that immersion fixationyielded extremely good tissue preservation and, more important, didnot alter the physiological status or the dimensions of the lumina of thevascular tissue before investigation. Hence, eyeballs were immersionfixed in 2.5% glutaraldehyde and 2.0% paraformaldehyde in 0.1 Msodium cacodylate buffer. Tissue samples were obtained as 5-mmbuttons, trephined 3.5 mm from the end of the pecten at the centralposterior region of the eye cups to ensure consistent localization ofmorphologic analyses, then dissected to approximately 1 � 3 mm insize, postfixed in 2.0% osmium tetroxide, and dehydrated and embed-ded in Epon-araldite. Three tissue blocks were taken from each eye,and three sections were taken from each tissue block.
Semithin sections (0.5 �m) were stained with 1% toluidine blue forlight microscopic examination. Ten measurements of each of theanatomic regions specified were taken from the midregion of eachsection by moving the microscope stage 20 �m for each subsequentmeasurement. Choroidal thickness was measured by light microscopyas the distance from the basement membrane of the choriocapillaris tothe inner edge of the sclera in the following experimental groups: T �0 hours (n � 8 animals, 21 sections); T � 2 hours (n � 5, 12 sections);T � 8 hours (n � 5, 8 sections); T � 24 hours (n � 6, 6 sections); T �48 hours (n � 6, 6 sections); T � 72 hours (n � 6, 7 sections); T � 96hours (n � 6, 11 sections); T � 120 hours (n � 6, 14 sections); andnon-deprived fellow eyes from 16 animals taken evenly across therecovery period (37 sections; Fig. 1). Retinal thickness was measuredfrom the inner limiting membrane to Bruch’s membrane (thus includ-ing the RPE) and RPE thickness was measured as the region from theouter limiting membrane to the basal membrane of the RPE (OLM-BM)containing the subretinal space, in the following experimental groups:T � 0 hours (n � 8 animals, 8 sections); T � 24 hours (n � 6, 7sections); T � 48 hours (n � 6, 7 sections); T � 72 hours (n � 6, 10
sections); T � 96 hours (n � 6, 10 sections); T � 120 hours (n � 6,14 sections); and non-deprived fellow eyes (n � 16, 37 sections).
Ultrathin sections (60–90 nm thickness) were made on a mic-rotome (Pharmacia LKB, Gaithersburg, MD) and stained with 4% uranylacetate and 2% lead citrate before examination on a transmissionelectron microscope (model 7000; Hitachi Ltd., Tokyo, Japan). Thick-ness of Bruch’s membrane was measured in the experimental groupsT � 0 hours (n � 8 animals, 8 sections); T � 24 hours (n � 6, 7sections); T � 48 hours (n � 6, 7 sections); T � 72 hours (n � 6, 10sections); T � 96 hours (n � 6, 10 sections); and T � 120 hours (n �6, 6 sections) and in the control eyes (n � 16, 37 sections).
All eyes were exposed to exactly the same procedures, includingtime of death.
Energy-Dispersive X-ray Microanalysis
Seventeen chicks were given 0 hours (n � 4), 24 hours (n � 3), 48hours (n � 3), 72 hours (n � 4), and 96 hours (n � 3) of unrestrictedvisual experience after occlusion and killed for energy-dispersive x-rayspectral microanalysis to determine the abundance of particular ionspecies in the retina and choroid. Small sections of tissue dissectedfrom the posterior pole in the same manner as described for transmis-sion electron microscopy (TEM) were fixed immediately in liquidnitrogen slush and freeze dried for 12 hours. The dry tissue wasmounted as for routine scanning electron microscopy (SEM) of trans-verse sections of the retina-choroid-sclera and coated with approxi-mately 50 nm of carbon. For one eye at T � 48 hours, the remainderof the globe was embedded in Epon resin and sawed in half and the cutface highly polished and viewed by SEM32 to visualize the choroidalarchitecture in three dimensions.
Specimens were examined with a scanning electron microscope(S-360; Leica/Cambridge Ltd., Cambridge, UK) fitted with an x-raydetector (Kevex, Foster City, CA). The electron beam was set to across-sectional area of 37 �m (parallel with the internal limiting mem-brane) � 26 �m (transverse across retina) and 10 kV. The resultantspectra were analyzed on computer (Iridium, Arlington, VA), using theauto background compensation auto elemental peak identificationfeatures. All raw elemental counts were standardized by defining awindow in the background spectra that did not involve the elementsunder consideration, namely 5.0 to 7.0 KeV, and acquiring the spec-
FIGURE 1. Light micrographs of typ-ical transverse sections through theretina-RPE-choroid of chickens visu-ally deprived by monocular translu-cent occlusion for 2 weeks, thengiven a variable number of hours ofnormal visual experience (from theleft: control (fellow eye), after 0, 24,48, 72, 96, and 120 hours of recoveryfrom FD). Note the extremely rapidexpansion of the choroid, especiallythe appearance of thin-walled lym-phatic vessels away from the retinanearer the sclera and the lack of ma-terial in the edematous extravascularspaces. Red blood cells were seenonly in the thicker-walled vesselscloser to the choriocapillaris, whichwas well formed in the fellow eye ornormal tissue but displayed an abnor-mal appearance in FD and early re-covery. Seventy-two hours after oc-cluder removal the mean choroidthickness had expanded to almost300% of nondeprived thickness, withthe most obvious features being theextreme distension of the lumina ofthe lymphatic sinusoids. Stained withtoluidine blue. Scale bar, 50 �m.
IOVS, August 2004, Vol. 45, No. 8 Chorioretinal Edema after Experimental Myopia 2465

trum until 1000 counts had accumulated in the window. Data werecollected from five regions, but only the Na and Cl data from the twooutermost regions are reported herein (Fig. 2). Counts were repeatedin adjacent locations within each region three to seven times (mean4.0 � 1.1), to achieve a reliable estimate.
Because freeze-dried tissue is an open mesh, an estimate of thevolume of the tissue under analysis was calculated by running a MonteCarlo electron-scattering model for 10-kV electrons impacting solidcarbon. This showed that 10-kV x-rays emanate from a depth of 500 nmin carbon, which represents the thickness of approximately 25 cellmembranes.
Microanalysis of the contents of the lymphatic vessels cannot beascertained from freeze-dried material, and so for this elemental anal-ysis, a wet preparation (bulk-frozen tissue) was used.38 A further 13eyes from 13 chicks at various times of recovery (T � 0 hours, n � 3;T � 24 hours, n � 1; T � 48 hours, n � 3; T � 72 hours, n � 2; andcontrol, n � 4) were plunged into liquid nitrogen immediately afterenucleation. After freezing, the eyes were fractured under liquid nitro-gen, and segments of the eye demonstrating a clear cross section of thevitreous, retina, and choroid were quickly mounted in a cryotranssystem (Model E 7400; Polaron, Watford, UK) attached to the scanningelectron microscope (S-360; Cambridge). X-ray analysis was performedat 265� on the surface of the lumen of the lymphatic vessels atapproximately �150°C after sublimation of condensate from the sur-face of the specimen at �70°C. An 8.2-mM control solution with theelements Mg, S, Na, Cl, K, P, and Ca was prepared by adding equimolar
amounts of MgSO4 � 7H2O, NaCl, KH2PO4, Ca(NO3)2 � 4H2O to enablequantitative analysis of ions in choroidal lymph.38 Six replicates ofreadings from adjacent regions of choroidal lymph of each specimenwere obtained and the results averaged.
The animals were raised and killed in accordance with the regula-tions of the National Health and Medical Research Council of Australia,and procedures conformed to the NIH Guiding Principles in the Careand Use of Animals (1996) and the ARVO Statement for the Use ofAnimals in Ophthalmic and Vision Research.
Statistical Analysis
The influence of the duration of normal visual experience after oc-cluder removal on the relative thickness of the retina, OLM-BM, andchoroid were calculated with analysis of variance ANOVA (SPSS soft-ware; SPSS Science, Chicago, IL). Because the thickness of the regionswas expected to be independent of one another, Bonferroni correctionof the type I error rate was not applied across all analyses. The analysesfor each location represent separate and therefore independent fami-lies of comparisons. Changes in the thickness of the various tissuesmeasured at different times were analyzed using post hoc Student’sunpaired t-tests.
The influence of the time from occluder removal on the abundanceof ionic species was calculated using multivariate ANOVA (SPSS soft-ware) with three independent variables—namely, refractive category(FD or control eye), region of retina/choroid, and time.
RESULTS
Refractive Status
Refractive error was found to decrease with duration of unre-stricted visual experience after the removal of the occluder(Table 1). The difference in refractive error between the twoeyes in each group of chicks at any recovery stage was consis-tent, with standard errors typically less than 1 D. The rate ofchange in refraction was slower over the first 24 hours afteroccluder removal than in the period between 24 and 48 hours,but was basically linear over the first week (Fig. 3). Completerefractive recovery from myopia was achieved by the fouranimals examined at T � 144 hours (6 days) after occluderremoval, with the eyes showing complete re-emmetropizationand even a slight overcompensation resulting in a mild hyper-opia.
Light Microscopy
Consistent with earlier reports,16,17,19 the most marked ana-tomic change in the 120 hours after occluder removal was themassive choroidal expansion (Table 1) and the concomitant
FIGURE 2. Fractured face of freeze-dried normal ocular tissue seen bySEM indicating each of the six locations examined: region of ganglioncell layer (GC) and inner plexiform layer (IP), inner nuclear layer (IN),region of inner segments (IS), region of outer segments (OS) and RPE,choroidal lymphatics (LV).
TABLE 1. Comparison of Refractive Status and the Thickness of Choroid, Retina, OLM-BM, and Bruch’s Membrane of Deprived andNondeprived Control Eyes at various Times after Occluder Removal
Hours Visual ExperienceRefractive Difference
(D)Choroid
(�m)Retina(�m)
OLM-BM(�m)
Bruch’s Membrane(�m)
0 �22.15 � 0.74 21.52 � 1.41 194.50 � 5.29 47.00 � 0.66 0.34 � 0.0632 �20.20 � 1.11 43.11 � 3.35 — — —8 �19.20 � 1.02 88.75 � 3.08 — — —
24 �19.33 � 1.16 123.33 � 7.70 223.43 � 3.64 62.29 � 1.45 0.57 � 0.04448 �11.64 � 1.01 137.56 � 4.27 231.43 � 2.03 62.00 � 0.76 0.57 � 0.06772 �8.04 � 0.86 282.82 � 18.64 226.40 � 5.90 62.40 � 0.27 0.53 � 0.07396 �3.00 � 0.49 152.0 � 2.60 200.80 � 5.87 47.20 � 0.61 0.98 � 0.081
120 �1.17 � 0.25 128.7 � 3.22 192.80 � 4.53 46.60 � 1.04 0.95 � 0.064144 0.50 � 0.21 — — — —
Fellow eyes — 92.23 � 4.34 230.59 � 6.23 58.57 � 1.85 0.87 � 0.12
Refractive data for the FD eyes is shown as difference between the two eyes. The mean � SEM refraction of the group of fellow eyes was�1.14 � 0.39 D. Mean � SEM thickness comparison measurements for the fellow eye group are also shown.
2466 Liang et al. IOVS, August 2004, Vol. 45, No. 8

rapid and extensive dilation of the large, cell-lined supracho-roidal lymphatics (Fig. 1).
Compared with fellow nondeprived control eyes, the meanchoroidal thickness in experimental eyes progressed from a60% reduction in thickness at occluder removal, to a thicknesssimilar to that of the control nondeprived eyes after 8 hoursand then increased to approximately three times that of thecontrol thickness after 72 hours of visual experience (Fig. 3).Choroidal thickness decreased significantly (P � 0.0001) in theperiod between 72 and 96 hours after occluder removal. Cho-roidal thickness continued to decrease more slowly until 120hours after occlusion, by which time the choroid had notreturned to the control thickness level (Table 1, Fig. 1). At alltime points sampled after 8 hours after occluder removal, themean difference in choroidal thickness between FD and con-trol nondeprived eyes is significant (F � 224.4, df � 7; P �0.0001).
At occluder removal (T � 0), the extravascular elements ofthe choroid of the deprived eye were extremely close packedand the lumina of the lymphatic sinusoids appeared to becompressed relative to the choroidal tissue of the nondeprivedcontrol eyes. However, over the next 72 hours, the extravas-
cular tissue swelled significantly, giving an edematous appear-ance (characterized by a change in ultrastructural density andincreasing sparseness of extravascular connective tissue ele-ments between lymphatic vessels and the major blood ves-sels37,39; Fig. 1).
Retinal thickness in the formerly form-deprived eyes alsoshowed a significant increase (F � 11.4, df � 5, P � 0.0005)during the recovery period (Table 1, Fig. 3). When comparedwith the retinas of the fellow eyes, the FD retinas were initiallyreduced in thickness as a result of the 2 weeks of deprivation,but expanded rapidly (�10%) in the first 48 hours and thenthinned again after 72 hours. By 120 hours of recovery fromFD, the thickness of the FD retinas had returned to that of theFD eyes at the time of occluder removal. This was approxi-mately a 15% reduction in thickness compared with fellownondeprived eyes. As can be seen in Fig. 1, the inner nuclearlayer was approximately 12 to 13 cells thick in fellow eyes butwas only 6 to 8 cells thick in the experimental eyes (Fig. 4).
The transverse thickness of the region between the outerlimiting membrane and the RPE basal membrane (OLM-BM)was also measured by light and electron microscopy (Table 1,Figs. 3,4). This region contains the distal tips of the photore-ceptor outer segments, the subretinal space, and the RPE celllayer (Fig. 5).
The results suggest that changes in the OLM-BM regioncontribute substantially to the changes in retinal thickness(whose measure includes the RPE) during the first 120 hoursafter occluder removal, though largely in proportion and with
FIGURE 4. Scanning electron micrograph of the highly polished cutface of a resin-embedded chick eye 48 hours after recovery from 2weeks FD. The architecture of the lymphatic sinusoids was enhancedby poor infiltration of the resin. Note the comparison between thethick-walled blood vessels filled with erythrocytes and the large, ex-tremely thin-walled empty lymphatic sinusoids.
FIGURE 3. Temporal sequence of mean thickness measurements (inmicrometers with standard errors indicated) in the retina (includingRPE), RPE (OLM-BM), Bruch’s membrane (shown at �100 scale toallow representation on the same axes) ,and choroid of the form-deprived eyes (indicated by unfilled symbols) and fellow eyes (indi-cated by filled symbols, offset slightly to the left to aid visibility) duringthe first 120-hour period of normal visual experience after occluderremoval. It is clear that the retinal thickness measurements peakedearlier than did the choroidal thickness. The thickness of Bruch’smembrane showed some increase in the first 24 hours and thenstabilized until after the choroid had passed its maximum thickness andthe re-emmetropization was almost complete. The curves are smooth-ing spline fits,40 weighted by standard deviations, with a smoothingfactor of 1.0.
IOVS, August 2004, Vol. 45, No. 8 Chorioretinal Edema after Experimental Myopia 2467
the same time course as in the retina. The greatest rate ofretinal thickness increase occurred in the first 24 hours afteroccluder removal. Once the initial swelling had occurred, theexpansion was maintained for another 48 hours until T � 72hours, after which time a decrease in transverse thickness tothe level immediately after occluder removal was observed.Areas of detachment of the outer retina from the RPE appearedas opaque and edematous spaces around the subretinal spaceat 2 and 8 hours after occluder removal.
It is interesting to note that the RPE thickness (OLM-BM)attained after 24 hours of visual experience was comparable tothe average thickness in the fellow nondeprived eyes, but thatthis expansion of the RPE was not maintained beyond 72 hoursof recovery. This temporal sequence of thickness changesmimicked those observed in the transverse thickness of thewhole retina during recovery (Fig. 3).
Temporal Dynamics of Thickness Changesbetween Tissues
A major purpose of this study was to investigate temporalchanges in morphology that might suggest possible explana-tions for choroidal expansion during recovery from FD. Asshown in Figure 3, at T � 0, all tissue components werethinner than the corresponding fellow eye components. Theneural retina reached maximum thickness between 24 and 48hours after the resumption of normal visual experience, con-siderably earlier than maximum choroidal thickness, reachedat 72 hours. Choroidal thickness rapidly reduced on the fourthday, but less so on the fifth day. At this time, the choroid wasstill approximately one-third thicker than in fellow eyes,whereas the RPE had returned to fellow-eye thickness. Recov-ery from maximum swelling of the retina started at a timebetween 48 and 72 hours after removal. On the contrary,Bruch’s membrane displayed an early increase in thickness asin the retina, but rather than achieving maximum thickness inthe first day, this tissue remained at approximately 60% of finalthickness for the same duration as the retinal-RPE thicknessplateau, before rapidly regaining the thickness of fellow eyesby 96 hours.
Thus, this investigation of the temporal sequence of ana-tomic changes during recovery from FD indicates that, at agross level, the retina and RPE reach maximum thicknessbefore the choroid. Similarly, the recovery from maximumswelling is initiated in the retina before it occurs in the cho-roid.
Transmission Electron Microscopy
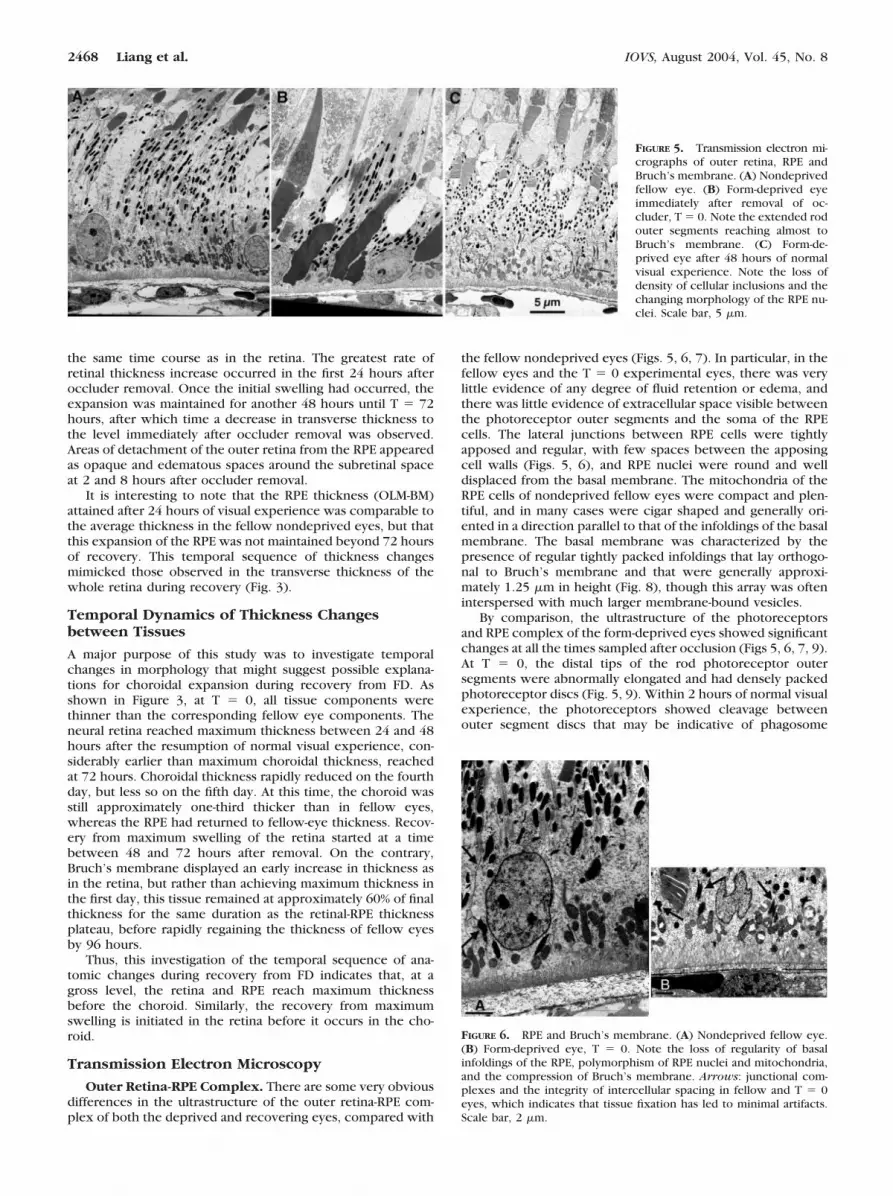
Outer Retina-RPE Complex. There are some very obviousdifferences in the ultrastructure of the outer retina-RPE com-plex of both the deprived and recovering eyes, compared with
the fellow nondeprived eyes (Figs. 5, 6, 7). In particular, in thefellow eyes and the T � 0 experimental eyes, there was verylittle evidence of any degree of fluid retention or edema, andthere was little evidence of extracellular space visible betweenthe photoreceptor outer segments and the soma of the RPEcells. The lateral junctions between RPE cells were tightlyapposed and regular, with few spaces between the apposingcell walls (Figs. 5, 6), and RPE nuclei were round and welldisplaced from the basal membrane. The mitochondria of theRPE cells of nondeprived fellow eyes were compact and plen-tiful, and in many cases were cigar shaped and generally ori-ented in a direction parallel to that of the infoldings of the basalmembrane. The basal membrane was characterized by thepresence of regular tightly packed infoldings that lay orthogo-nal to Bruch’s membrane and that were generally approxi-mately 1.25 �m in height (Fig. 8), though this array was ofteninterspersed with much larger membrane-bound vesicles.
By comparison, the ultrastructure of the photoreceptorsand RPE complex of the form-deprived eyes showed significantchanges at all the times sampled after occlusion (Figs 5, 6, 7, 9).At T � 0, the distal tips of the rod photoreceptor outersegments were abnormally elongated and had densely packedphotoreceptor discs (Fig. 5, 9). Within 2 hours of normal visualexperience, the photoreceptors showed cleavage betweenouter segment discs that may be indicative of phagosome
FIGURE 5. Transmission electron mi-crographs of outer retina, RPE andBruch’s membrane. (A) Nondeprivedfellow eye. (B) Form-deprived eyeimmediately after removal of oc-cluder, T � 0. Note the extended rodouter segments reaching almost toBruch’s membrane. (C) Form-de-prived eye after 48 hours of normalvisual experience. Note the loss ofdensity of cellular inclusions and thechanging morphology of the RPE nu-clei. Scale bar, 5 �m.
FIGURE 6. RPE and Bruch’s membrane. (A) Nondeprived fellow eye.(B) Form-deprived eye, T � 0. Note the loss of regularity of basalinfoldings of the RPE, polymorphism of RPE nuclei and mitochondria,and the compression of Bruch’s membrane. Arrows: junctional com-plexes and the integrity of intercellular spacing in fellow and T � 0eyes, which indicates that tissue fixation has led to minimal artifacts.Scale bar, 2 �m.
2468 Liang et al. IOVS, August 2004, Vol. 45, No. 8

formation as part of the shedding process41 (Fig. 9). As notedin our earlier reports, the nuclei of the RPE cells from thedeprived eye were generally smaller in profile, less compact,and more irregular in shape, frequently showing deep inden-tations and giving the appearance of recent direct contact withthe photoreceptor outer segments (Fig. 9, layer C).17,30 Themitochondria were also changed in shape (Figs 6, 7), oftenappearing rounder and with inclusions resulting in annulartransverse profiles.42 Although it is acknowledged that mito-chondria of RPE cells in birds show circadian changes inmorphology,43,44 the changes observed in the present studyare unlikely to be related to time of day, as the degree ofchange was greater than circadian changes reported, and all
animals were killed at the same time of day (early afternoon).A gradual increase in edema was obvious in the temporalprofile of changes in the electron density of the intracellularand extracellular spaces and the voids in the electron micro-graphs of eyes during recovery from FD (Figs 5, 6, 7, 9).
Basal Membrane of RPE. Notably, during recovery theheight and the packing density of the convoluted infoldings ofthe basal membrane of the RPE were less in the myopic eyethan in the nondeprived fellow eye (Fig. 7). This is indicative oflesser basal membrane area per unit length of Bruch’s mem-brane. The low linear density of infoldings at T � 0 (infoldingsper unit length along Bruch’s membrane) began to increase inthe first 24 hours after occluder removal (compare Fig. 7, 24
FIGURE 7. Electron micrographscomparing the morphology of a non-deprived fellow eye and recoveringeyes (T � 0, 24, 48, 72, 96, and 120hr) in the vicinity of the basal mem-brane of the RPE and Bruch’s mem-brane. Note, the dramatic changes inthe thickness of Bruch’s membraneand the structure of the basal mem-brane of the RPE cells in the deprivedeyes over the 120 hours. During theearly stages of refractive recovery theinner and outer collagenous layers ofBruch’s membrane, normally appear-ing as crisp dots (transverse sectionof collagen fibrils), were not readilyapparent until the membrane had be-gun to increase in thickness ataround 72 hours after occlusion.Likewise, the structure and regularityof the infoldings of the basal mem-brane of the RPE were dramaticallycompromised by form deprivation(compare Fig. 7, Control with T � 0hr) but improved substantially overthe recovery period, though therewas still evidence of edema in thecytoplasm at 120 hours. In all exam-ples of recovering eyes, the appear-ance of the basal membrane of theRPE of the deprived eyes was disor-dered with respect to the fellow eye.In particular at T � 0 hours there wasgreatly reduced density of infoldingof the basal membrane and little evi-dence of bilaminar membranous in-clusions, nor any well-formed vesi-cles expected in normal fluidmovement across the RPE. Short ar-row, 0-hr: a structurally abnormal mi-tochondrion that may infer impairedfunction. The micrograph at 72hours showed evidence of a largeamount of edema in the RPE cyto-plasm with many large disorganizedinfoldings on the basal membraneand an increased frequency of mem-brane-bound, fluid-filled inclusionstoward the inner region of the cell(long arrow). It is clear that the dis-organization of infoldings is not a re-sult of inadequate tissue preserva-tion, as there is an example of theelectron dense desmosome of a junc-tional complex between RPE cellsclearly visible in the 96-hour micro-graph (arrowhead). Fenestrations were evident on endothelial cells of the choriocapillaris in micrographs taken at 48, 72, and 96 hours(arrowheads). M, mitochondria; INF, infoldings of the basal membrane of an RPE cell; B, Bruch’s membrane; C, the choriocapillaris. Scale bar, 1�m.
IOVS, August 2004, Vol. 45, No. 8 Chorioretinal Edema after Experimental Myopia 2469

hours with 0 hours). Further visual experience led to greatirregularity of the infoldings on the basal membrane and anumber of unusual membrane-bound, fluid-filled structures ex-tending farther into the cytoplasm. This is usually interpretedas ultrastructural evidence of edema.37 The linear density ofinfoldings and the number of fluid-filled vesicles continued toincrease up to 96 hours. The most obviously swollen mem-branes were in the samples taken from animals given 72 hoursof normal visual experience (Fig. 7). In the T � 96 hoursgroup, fewer fluid vesicles were evident and by 120 hours afteroccluder removal, the basal membrane appeared to be regain-ing a more normal appearance.
Bruch’s Membrane. Bruch’s membrane is a five-layeredstructure that is contiguous with the basal membrane of theRPE on the retinal side and the basement membrane of thechoriocapillaris on the choroidal side, with an inner collage-nous zone, an (interwoven) elastic layer, and an outer collag-enous zone between, as shown in Figure 8. There was anobvious difference (F � 295.6, df � 6, P � 0.0001) in relativethickness of Bruch’s membrane between the deprived and thenondeprived fellow eyes (Table 1, Figs. 3, 6, 7). At the time ofoccluder removal, Bruch’s membrane in FD eyes showed agreatly altered morphology, with very few discrete collagenfibrils in the inner and outer collagenous layers, plus compres-sion of the elastic fibers. At T � 0 hours the average thicknessof Bruch’s membrane in the deprived eyes was less than 50% ofthe average thickness of that in the nondeprived fellow eyes(Figs. 6, 7). However, a rapid increase in thickness occurredduring the first 24 hours of visual experience, which plateauedbetween 24 hours and 72 hours. At this time, Bruch’s mem-
brane showed a separation of the collagen filaments, as wouldbe expected of edematous tissue. The architectural appearanceof Bruch’s membrane only began to approach normalcy at 96hours. During this period of recovery the thickness changedsignificantly (P � 0.001). Thickness comparable to the felloweye was not achieved until 120 hours.
An interesting feature of FD eyes, noted several times at 120hours after occluder removal when the basal infoldings werereturning to normal form and less frequently at other times,was the appearance of electron-dense material within mem-brane-bound vesicles between the RPE, Bruch’s membrane,and the choriocapillaris (Fig. 10). Further studies of serialsections are needed to confirm whether the circular bodies areindeed sections of spherical bodies and therefore possiblyindicative of the transfer of proteinaceous and/or lipid mate-rial, as their electron density suggests.
Edema
The most outstanding morphologic feature of tissue examined(by light and electron microscopy) from eyes recovering fromFD was morphologic evidence of edema. The increasing edemawas greatest in tissue taken 72 hours after occluder removal,where, in addition to the lessened clarity of electron-densematerial, there were also areas of lowered intracellular or-ganelle density. The edematous appearance was not related totissue preservation, as many of the same sections also showedareas of high electron densities indicative of intact junctionalcomplexes (Fig. 9C) and well-preserved tissue (e.g., Fig. 7, 96hr). Other evidence for edema was provided by the loosenessof the cytoplasm in the region of the apical membrane of theRPE (Figs. 5C, 9) with lowered transparency of interstitialspaces an ultrastructural sign of excess fluid. In addition, evi-dence was provided of a gradually increasing number of vesi-cles in the vicinity of the basal membrane of the RPE (Fig. 10).
Energy-Dispersive X-ray Microanalysis
Energy-dispersive x-ray microanalysis was performed on freeze-dried wholemount sections at five locations as indicated inFigure 2, at five times—T � 0, 24, 48, 72, and 96 hours—during recovery after occlusion. The microanalysis was alsoperformed on large fragments of fully hydrated material toenable x-ray examination of the fluid within lymphatic vessels(T � 0, 24, 48, and 72 hours of recovery). In this method, theelements that are detectable in large quantities, apart fromhydrogen, oxygen, and carbon, are Na, Cl, K, sulfur (S), andphosphorus (P), but only the relative concentrations of Na andCl ions in the outer retina-RPE-choroid are reported herein.The relative x-ray counts of these elements sampled at all timepoints during recovery in the freeze-dried photoreceptor outersegments, RPE and choroid are illustrated in Figures 11 and 12and are shown compared with the mean ionic concentrationfor the fellow eyes of the same animals. Figure 13 showsrelative changes in Na and Cl ions in the fluid within lymphaticsinusoids of the choroid of bulk frozen eyes.
At occluder removal, T � 0 hours, it is readily apparentfrom Figures 11 and 12 that the ionic abundances of Na and Clin choroid, RPE, and photoreceptor outer segments were sig-nificantly greater (P � 0.006) than those in the same areas inthe fellow eyes. However, the change in Na and Cl ion con-centrations was greater in the freeze-dried choroid than theRPE and outer segments, with the ionic abundances of the RPEand outer segments and choroid all returning toward normalrange within 48 hours (Cl ion more rapidly than Na ion). Thus,the outer retina and RPE demonstrated signs of hyperosmolar-ity.
In contrast, the relative ionic concentrations of Na and Cl inthe lymphatic vessels measured using frozen rather than freeze-
FIGURE 8. Electron micrograph of Bruch’s membrane in a normalchick. (A) Basal membrane of RPE composed of fine filaments extend-ing from basal surface of cells of RPE. (B) Inner collagenous zonecomposed of interwoven collagen filaments. (C) Noncontinuous elas-tic layer. (D) Outer collagenous zone. (E) Basement membrane ofchoriocapillaris. Note regularity of infoldings of the basal membrane ofRPE cell.
2470 Liang et al. IOVS, August 2004, Vol. 45, No. 8

dried samples (Fig. 13) was not significantly different (compar-ing FD and fellow eyes) over the recovery times from T � 0 toT � 48 hours, when it began to increase rapidly up to 72 hours.Data from times after 72 hours are not currently available.
DISCUSSION
The most important new finding of this study was the demon-stration of significant amounts of extravascular edema andrelative change in Na and Cl ion abundances related to durationof normal visual experience after occluder removal from form-deprived myopic chicks. The time of maximum tissue thick-ness was reached earliest in the retina and later in the RPE andchoroid—in particular, in the lymphatic vessels. Ultrastructur-ally, the surface area of the basal membrane of the RPE in-creased dramatically, contemporaneously with the change inion abundance and appearance of edema. We believe that suchresults have important implications for the understanding ofthe physiological mechanisms of ocular growth underlyingactive emmetropization.
Refractive normalization and choroidal thickening after FDhave been described extensively in chickens17,18,45 and to alesser extent in other mammalian species (Hung L-F, et al. IOVS1998;43:ARVO Abstract 2309),46 but the temporal sequence ofmorphologic, ultrastructural, and ionic changes that accom-pany restoration of a normal visual environment after removalof the occluder has received little attention. In addition, thisrepresents the first application of x-ray microanalysis to thestudy of the development of refractive error.
The use of energy-dispersive x-ray microanalysis to compareFD and fellow eyes provides further support for the existenceof altered tissue hydration. There was a significant difference inthe relative concentrations of Na and Cl ions in the outerretina, RPE, and choroid, between the FD myopic eyes at T �0 and fellow nondeprived eyes. This difference in concentra-tions of Na and Cl ions progressively decreased over the first 48hours in the freeze-dried samples in the outer segments andRPE and choroid, whereas the choroid expanded. This expan-
sion of the choroid over the first 72 hours and the consequentlowering of spatial density of membranes, increasing the stop-ping distance of the electron beam in the freeze-dried prepa-ration, has to be taken into account in interpreting the resultsin Figure 11. However, the similar progression of ionic abun-dances (Fig. 12) found in the RPE-outer segments (which doesnot show the 10-fold tissue expansion of the choroid) lendsweight to the notion that there is an increased concentration ofNa and Cl ions in the choroid immediately after FD and that theion excesses dissipate around the time that the choriocapillarisfenestrations return to normal range.30,47
The bulk-frozen X-ray microanalysis method was used togive an accurate measurement of molar concentrations of ionsdirectly in the lymphatic lumen under analysis. Because onlythe contents of the large choroidal lymphatics were sampled(through direct observation) and because the lumina of thevessels sampled were filled with frozen lymph, the electronbeam stopping distance was constant across the recovery pe-riod samples, with electron scattering confined to a surfacelayer. Under these conditions, the changes in molar concentra-tion of Na and Cl ions from the frozen lymphatics showed anopposite tendency to the freeze-dried choroidal preparation.Whereas in the T � 0 and T � 24 eyes, the ionic concentra-tions were only marginally different from the fellow eye values,a strong increase was observed at T � 48 and T � 72 hourswith concentrations of both species a factor of 2 greater thanin the fellow eyes. This supports our earlier work19 detailingthe increase in the number of passive endothelial junctions andactive fenestrations in lymphatic vessels over the first 72 hours.The freeze-dried approach involved sampling from the innerpart of the choroid and would have included blood vessels andextracellular matrix as well as some lymphatics. It appears thatthe lymphatics take up the Na and Cl ions from the extravas-cular space, increasing the luminal concentration in the lym-phatics as the extravascular abundances normalize.
Thus, both morphologic and elemental aspects of this worksuggest that occluder removal leads to edema across the retina,RPE, and choroid. The time sequences of thickness within
FIGURE 9. Electron micrographs ofthe distal tips of rod photoreceptorstaken from a nondeprived fellow eye(layer A) and a form-deprived myopicchick eye after 48 hours of unre-stricted visual experience (layers B,C). In the nondeprived eye the lamel-lae of the outer segments weretightly packed and integral with theabutting RPE cell. By contrast, theouter segment in the T � 48 hourschick showed evidence of edema—that is, less electron-dense organellesin the cytoplasm of the RPE cell anda large, fluid-filled gap at the base of the outer segment. In (layer B) the lamellae of the photoreceptor discs were not as densely packed as in layerA, and there was a phagosome nearby. In (layer C) there were indications of breaks in the discs that may indicate the beginning of the sheddingprocess and the formation of a phagosome. Note the close apposition of the RPE nucleus and the rod PR. Scale bar, 0.5 �m.
FIGURE 10. Electron micrographs ofRPE, Bruch’s membrane, and chorio-capillaris 120 hours after removal ofthe occluder. (A) Round vesicularstructures (arrows) were visible inthe basal infoldings of the RPE. Notethe apparent encapsulation of fluidin the proximal loops of the basalinfoldings. (B) Similar vesicular struc-tures within Bruch’s membrane. (C)Round structures in the lumen of thechoriocapillaris. Scale bars, 0.5 �m.
IOVS, August 2004, Vol. 45, No. 8 Chorioretinal Edema after Experimental Myopia 2471

tissue components indicates that the return toward final thick-ness (from maximum) starts earlier in the retina than in the RPEand choroid (or Bruch’s membrane) suggesting that fluid move-ment is a possible vector that could be used by the eye totransform rapidly the axial dimensions of the eye and its tunics.
Recovery from FD myopia in this breed of chickens, frommore than 20 D of myopia to emmetropia, took the same time(120–144 hours of normal visual experience) as normalizationof the occlusion-induced ultrastructural changes, thus furthersupporting the idea of physiological normalization and edemaplaying a central role in re-emmetropization.
The Implications of Biometrics andUltrastructural Analyses for UnderstandingRefractive Recovery
In 1995, Wallman et al.16 offered three possible sources ofchoroidal thickening: increased glycosaminoglycans in the ex-tracellular matrix followed by passive water movement, in-creased drainage of aqueous humor into the choroidal com-partment, and increased capillary permeability. Pendrak et al.18
concluded that the most likely of these possibilities for choroi-dal thickening is increased passive choroidal vessel permeabil-ity due to a choriocapillaris abnormality30,47 and a continuationof the deprivation-induced reduction in choroidal blood flow
in the first couple of days of recovery.20 However, a recentstudy found reduced vascular exchange at only 7 hours afteroccluder removal with a peak at 19 hours and a subsequentreturn to normal,21 although the question of flow in the felloweye is variable, with Jin and Stjernschantz22 reporting an in-crease of flow in all tissues.
It is thus difficult to explain the development of edema inthe choroid beyond this time (peaking at 72 hours) in terms ofthese transient flow changes. Pendrak et al.18 also note thatsince the choroidal glycosaminoglycans are least when thechoroid is thickest, the thickness increase cannot be simplyexplained by the tissue water’s tracking the sulfated glycosami-noglycans.
The hypothesis of drainage of aqueous humor into thechoroidal lymphatics as the cause of choroidal thicknesschanges is supported by reduced fluorescein dextran measuredin the lymphatics when injected into the aqueous chamber ofFD chick eyes and the observation of an increase during recov-ery.22
Another hypothesis involves intraocular pressure reductionduring recovery from FD and the consequent lowering ofresistance to blood flow, and such an increase in flow thencontributes to choroidal expansion. Possibly related is the ideaof van Alphen48 that the choroid could be considered as a solidsheet of smooth muscle able to resist intraocular pressure inpart and to regulate scleral stretch in the growing eye. Relax-ation in this sheath would allow choroidal expansion to occurmore readily.
Source of the Edema
Our morphologic observations of the reorganization of the RPEbasal lamina infoldings during recovery from FD are consistentwith the presence of hyperosmolarity at the time of occluderremoval and the rapid establishment of edema across the retinaand the RPE, gradually building in the choroid to peak 3 daysafter occluder removal. Two sources of fluid are possible: thechoroidal blood flow and the retinochoroidal flow from thevitreous chamber across the RPE. We favor the vitreous cham-ber as the likely source, as it is capable of delivering the volumeof fluid involved in the expansion of the choroid and the timingof transient changes in choroidal flow do not appear to corre-late with the timing of choroidal swelling. Such a hypothesis ofvitreous fluid excess under FD conditions is supported bystudies showing an increased amount of sol (liquid) vitreouswith normal hyaluronate in occluded chick eyes,49,50 whichwould be consistent with a reduction in retinochoroidal flowduring deprivation. In addition, alterations in electrolyte bal-
FIGURE 12. Relative abundances of Na and Cl ions in the outer seg-ments and RPE of the freeze-dried tissue from normal fellow eyescompared with that measured in eyes recovering from FD-inducedmyopia. Cl ionic abundances seemed to recover to mean fellow eyevalues by 48 hours, though Na ion values remained higher than that infellow eyes for considerably longer.
FIGURE 13. Molar concentration of Na and Cl ions in the lymph of thechoroidal lymphatics of bulk-frozen tissue from fellow eyes and atvarious times after occluder removal of the eyes with FD-inducedmyopia, up to 72 hours after occluder removal.
FIGURE 11. Relative abundances of Na and Cl ions measured in theinner choroid of freeze-dried tissue from fellow eyes compared withthat measured in eyes recovering from FD-induced myopia. The abun-dance of both ion species was three to four times that of fellow eyechoroid at eye-opening, but resolved to comparable levels by approx-imately 48 hours after occluder removal.
2472 Liang et al. IOVS, August 2004, Vol. 45, No. 8

ance have been observed in the vitreous of myopic eyes—namely, increased chloride, decreased potassium and phos-phate, and similar sodium and calcium compared with thecontrol.51 The increase we observed in sodium and chlorideions through x-ray microanalysis in the RPE and choroid isconsistent with the edema resulting from this hyperosmolarity,the decay in levels occurring over a time scale similar to that ofthe recovery of choroid.
CONCLUSION
Recovery from FD myopia may be interpreted as the reestab-lishment of normal physiological functions attenuated duringocclusion. Removal of occlusion results in the gradual recoveryof ultrastructural integrity and reestablishment of the normalappearance of the outer segments of the photoreceptors-RPEand the choroid. These refractive, ultrastructural, and ionicsequelae of occluder removal after FD have been demonstratedto occur concurrently with edema, which appears in the firstday after occluder removal and recovers first in the retina andreaches a peak in the choroid only 3 days after occluderremoval.
Acknowledgments
The authors thank Judith Beresford for undertaking the resin embed-ding of freeze-dried tissue and processing for the three dimensionalvisualization of the choroid.
References
1. Au Eong K, Taylor H, Lim M. Race, culture and myopia in 110,236Singaporean males. Singapore Med J. 1993;34:29–32.
2. Fledelius H. Myopia profile in Copenhagen medical students1996–98. Refractive stability over a century is suggested. ActaOphthalmol Scand. 2000;78:501–505.
3. Mavracanas T, Mandalos A, Peios D, et al. Prevalence of myopia ina sample of Greek students. Acta Ophthalmol Scand. 2000;78:656–659.
4. Villareal M, Ohlsson J, Abrahamsson M, Sjostrom A, Sjostrand J.Myopisation: the refractive tendency in teenagers. Prevalence ofmyopia among young teenagers in Sweden. Acta OphthalmolScand. 2000;78:17–81.
5. Seet B, Wong T, Tan D, et al. Myopia in Singapore: taking a publichealth approach. Br J Ophthalmol. 2001;85:521–526.
6. Zadnik K. The Glenn A. Fry Award Lecture. (1995). Myopia devel-opment in childhood. Optom Vision Sci. 1997;74:603–8.
7. Junghans BM, Crewther SG. The prevalence of myopia amongprimary school children in eastern Sydney. Clin Exp Optom. 2003;86:339–345.
8. Nathan J, Kiely PM, Crewther SG, Crewther DP. Disease-associatedvisual image degradation and spherical refractive errors in chil-dren. Am J Optom Physiol Opt. 1985;62:680–688.
9. Meyer C, Mueller M, Duncker G, Meyer H. Experimental animalmyopia models are applicable to human juvenile-onset myopia.Surv Ophthalmol. 1999;44:S93–S102.
10. Wiesel TN, Raviola E. Myopia and eye enlargement after neonatallid fusion in monkeys. Nature. 1977;266:66–68.
11. Norton TT, Essinger JA, McBrien NA. Lid-suture myopia in treeshrews with retinal ganglion cell blockade. Vis Neurosci. 1994;11:143–153.
12. Wallman J, Turkel J, Trachtman J. Extreme myopia produced bymodest change in early visual experience. Science. 1978;201:1249–1251.
13. Troilo D, Gottlieb MD, Wallman J. Visual deprivation causes myo-pia in chicks with optic nerve section. Curr Eye Res. 1987;6:993–999.
14. Wallman J, Gottlieb M, Rajaram V, Fugate-Wentzek L. Local retinalregions control local eye growth and myopia. Science. 1987;237:73–77.
15. Wildsoet CF, Pettigrew JD. Experimental myopia anomalous eyegrowth patterns unaffected by optic nerve section in chicks: evi-dence for local control eye growth. Clin Vision Sci. 1988;3:99–107.
16. Wallman J, Wildsoet C, Xu A, et al. Moving the retina: choroidalmodulation of refractive state. Vision Res. 1995;35:37–50.
17. Liang H, Crewther SG, Crewther DP, Pirie B. Morphology of therecovery from form deprivation myopia in the chick. Aust N Z JOphthalmol. 1996;24:41–44.
18. Pendrak K, Papastergiou GI, Lin T, Laties AM, Stone RA. Choroidalvascular permeability in visually regulated eye growth. Exp EyeRes. 2000;70:629–637.
19. Junghans B, Crewther S, Liang H, Crewther D. A role for choroidallymphatics during recovery from form deprivation myopia? OptomVis Sci. 1999;76:796–803.
20. Shih YF, Fitzgerald ME, Norton TT, Gamlin PD, Hodos W, Reiner A.Reduction in choroidal blood flow occurs in chicks wearing gog-gles that induce eye growth toward myopia. Curr Eye Res. 1993;12:219–227.
21. Fitzgerald ME, Wildsoet CF, Reiner A. Temporal relationship ofchoroidal blood flow and thickness changes during recovery fromform deprivation myopia in chicks. Exp Eye Res. 2002;74:561–70.
22. Jin N, Stjernschantz J. Regional blood flow in the myopic chick eyeduring and after form deprivation: a study with radioactively-labelled microspheres. Exp Eye Res. 2000;71:233–238.
23. Hamann S. Molecular mechanisms of water transport in the eye.Int Rev Cytol. 2002;215:395–431.
24. Nickla DL, Wildsoet C, Wallman J. Visual influences on diurnalrhythms in ocular length and choroidal thickness in chick eyes.Exp Eye Res. 1998;66:163–181.
25. Nickla DL, Wildsoet CF, Troilo D. Endogenous rhythms in axiallength and choroidal thickness in chicks: implications for oculargrowth regulation. Invest Ophthalmol Vis Sci. 2001;42:584–588.
26. Nickla DL, Wildsoet C, Wallman J. The circadian rhythm in intraoc-ular pressure and its relation to diurnal ocular growth changes inchicks. Exp Eye Res. 1998;66:183–193.
27. Nickla DL, Wildsoet CF, Troilo D. Diurnal rhythms in intraocularpressure, axial length, and choroidal thickness in a primate modelof eye growth, the common marmoset. Invest Ophthalmol Vis Sci.2002;43:2519–2528.
28. Marmor M, Wolfensberger T, eds. The Retinal PigmentEpithelium: Function and Disease. 2nd ed. Oxford, UK: OxfordUniversity Press; 1998.
29. O’Leary DJ, Millodot M. Eyelid closure causes myopia in humans.Experimentia. 1979;35:1478–1479.
30. Liang H, Crewther DP, Crewther SG, Barila AM. A role for photo-receptor outer segments in deprivation myopia. Vision Res. 1995;35:1217–1225.
31. Beresford J, Crewther S, Crewther D. Anatomical correlates ofexperimentally induced myopia. Aust N Z J Ophthalmol. 1998(suppl.);26:84–87.
32. Beresford JA, Crewther SG, Kiely PM, Crewther DP. Comparison ofrefractive state and circumferential morphology of retina, choroid,and sclera in chick models of experimentally induced ametropia.Optom Vis Sci. 2001;78:40–49.
33. Junghans BM, Crewther SG, Liang H, Crewther DP, Wareing L,Pirie B. Lymphatics in the chick choroid? Aust N Z J Ophthalmol.1996;24:47–49.
34. Wildsoet C, Wallman J. Choroidal and scleral mechanisms of com-pensation for spectacle lenses in chicks. Vision Res. 1995;35:1175–1194.
35. Junghans BM, Crewther S, Pirie B, Crewther D. Are the lymphaticsof the chick choroid an active storage reservoir? In: Rogers P, CookB, Andrews F, Knight K, eds. Progress in Microcirculation Re-search. Melbourne, Australia: Monash University Press; 1997:84–86.
36. De Stefano M, Mugnaini E. The fine structure of the avian choroid:the lymphatic system. Invest Ophthalmol Vis Sci. 1997;38:1241–1260.
37. Foldi M, Casley-Smith J. Lymphangiology. Stuttgart: FK SchattauerVerlag; 1983.
IOVS, August 2004, Vol. 45, No. 8 Chorioretinal Edema after Experimental Myopia 2473

38. Wadley R, Junghans B, Liang H, Dickson M. A quantitative cryo-scanning x-ray microanalysis protocol for the examination of theeye. Scanning. 2002;24:34–38.
39. Casley-Smith J. The functioning and interrelationships of bloodcapillaries and lymphatics. Experientia. 1976;32:1–12.
40. Reinsch C. Smoothing by spline functions. Numer Math. 1967;10:177–183.
41. Young RW. The daily rhythm of shedding and degradation of rodand cone outer segment membranes in the chick retina. InvestOphthalmol Vis Sci. 1978;17:105–116.
42. Liang H, Crewther SG, Crewther DP. A model for the formation ofring mitochondria in retinal pigment epithelium. Eye Science.1995;11:1–5.
43. Lauber JK. Retinal pigment epithelium: ring mitochondria andlesions induced by continuous light. Curr Eye Res. 1982;2:855–862.
44. Lauber JK. Diurnal mitochondrial changes in avian retinal pigmentepithelium: a search for correlation with thyroid state. Curr EyeRes. 1982;2:863–868.
45. Westbrook AM, Crewther SG, Liang H, et al. Formoguanamine-induced inhibition of deprivation myopia in chick is accompaniedby choroidal thinning while retinal function is retained. VisionRes. 1995;35:2075–2088.
46. Siegwart J, Norton T. The susceptible period for deprivation-induced myopia in tree shrew. Vision Res. 1998;38:3505–3515.
47. Hirata A, Negi A. Morphological changes of choriocapillaris inexperimentally induced chick myopia. Graefes Arch Clin ExpOphthalmol. 1998;236:132–137.
48. van Alphen GW. Emmetropization in the primate eye. Ciba FoundSymp. 1990;155:115–120; discussion 120–125.
49. Pickett-Seltner RL, Sivak JG, Pasternak JJ. Experimentally inducedmyopia in chicks: morphometric and biochemical analysis duringthe first 14 days after hatching. Vision Res. 1988;28:323–328.
50. Lauber JK. Review: avian models for experimental myopia. J OculPharmacol. 1991;7:259–276.
51. Seko Y, Shimokawa H, Pang J, Tokoro T. Disturbance of electrolytebalance in vitreous of chicks with form-deprivation myopia. Jpn JOphthalmol. 2000;44:15–19.
E R R A T A
Erratum in: “Pharmacokinetic and Toxicity Study of an Intraocular Cyclosporine DDS in theAnterior Segment of Rabbit Eyes” by Theng et al. (Invest Ophthalmol Vis Sci. 2003;44:4895–4899).
The name of the second author was inadvertently misprinted. The correct form of the nameis Seng-Ei Ti.
The online version of this article was corrected on June 17, 2004.
Erratum in: “Retinal Colocalization and In Vitro Interaction of the Glutamate TransporterEAAT3 and the Serum- and Glucocorticoid-Inducible Kinase SGK1” by Schniepp et al. (InvestOphthalmol Vis Sci. 2004;45:1442–1449).
In the title of this article, the word receptor was inadvertently used in place of the correctword, transporter. The title should read as given above.
2474 Liang et al. IOVS, August 2004, Vol. 45, No. 8


