Embed Size (px)
Citation preview

5th GRACM International Congress on Computational Mechanics Limassol, 29 June – 1 July, 2005-04-27
STRUCTURAL-CONCRETE BEHAVIOUR: SEPARATING
MYTHS FROM REALITY
Michael D. Kotsovos*, Milija N. Pavlović†, and Demetrios M. Cotsovos†
*Civil Engineering Department, National Technical University of Athens email: [email protected]
†Civil Engineering Department, Imperial College, London
Keywords: finite element nonlinear analysis; static and dynamic loading; structural concrete behaviour. Abstract. Most finite-element models of reinforced-concrete structures attribute to concrete material characteristics which are in conflict with true behaviour established from valid experimental information. As a result the constitutive models adopted are case-study dependent. The present work summarizes already published work which shows that the use of realistic concrete properties coupled with well-tried numerical techniques can yield a finite-element model characterised by both generality and objectivity. 1 INTRODUCTION
Most finite-element (FE) models of structural concrete rely on constitutive relationships which place emphasis on the description of post-peak concrete characteristics such as, for example, strain softening, tension stiffening, shear-retention ability, etc, coupled with stress- and/or strain-rate sensitivity when blast or impulsive types of loading are considered. However, the application of these models in practical structural analysis has shown that such constitutive relationships are case-study dependent, since the solutions obtained are realistic only for particular problems; in order to extend, therefore, the applicability of the models to a different set of problems requires modifications, sometimes significant, of the constitutive relationships.
The cause of the above apparent lack of generality is considered to relate on the one hand with the misinterpretation of the observed material behaviour and, on the other, with the use of experimental data of questionable validity for the calibration of the constitutive relationships. To this end, the work presented in the paper is intended to show that the use of valid experimental data can lead to the development of a model of concrete behaviour which enables FE analysis to yield realistic solutions for a wide range of practical problems covering both static and dynamic loading conditions. The fundamental material characteristics which underlie the development of such a model are first discussed and the FE results obtained from various already published case studies are presented as additional evidence of the validity of the material characteristics adopted. 2 FUNDAMENTAL CONCRETE CHARACTERISTICS
2.1 Brittle post-peak behaviour The experimental data on concrete behaviour used for the development of constitutive laws are obtained from
tests on specimens such as, for example, cylinders, prisms, cubes, etc. Such specimens are subjected to various load combinations, usually applied (at least in one of the three principal directions) through rigid steel platens; the resulting data are expressed in the form of stress-strain curves comprising a strain hardening branch followed by a strain softening one, widely considered to be essential in ultimate limit-state analysis and design.
And yet, it has been known since the early 80’s[11,21], and confirmed in the late 90’s[22], that only strain hardening may describe material behaviour under a definable state of stress; strain softening merely reflects the interaction between specimen and loading platens, which is effected through the development of indefinable frictional stresses at the end faces of the specimen. In fact, it has been shown that the rate of reduction of the residual concrete strength with increasing strain increases rapidly as the means to reduce the above frictional stresses becomes more effective (see Fig. 1)[11]. Such behaviour indicates that were the frictional stresses completely eliminated, concrete would be characterised by a complete and immediate loss of load-carrying capacity, as soon as the peak load level is attained. Therefore, attributing strain softening characteristics to the post-peak behaviour of concrete is in conflict with this material’s brittle nature. 2.2 Stress path independency
Decomposing the stress-strain behaviour of concrete under any state of stress into hydrostatic and deviatoric components yields stress-strain curves, which can be expressed in the form of normal and shear octahedral stresses (σο and το) and strains (γο and εο). Such curves show that, while σο yields only εο, το yields both γο and εο[12]. More importantly, however, it has been shown experimentally that the curves exhibit a statistically insignificant deviation from those obtained from tests on specimens subjected to either σο or το [12]. Such a small deviation indicates that concrete behaviour is essentially stress-path independent[15].

Michael D. Kotsovos, Milija N. Pavlovic and Demetrios M. Cotsovos _________________________________________________________________________________________________________________
A similar conclusion has also been drawn from experimental data on concrete strength. Such data form an open surface in stress space characterised by six-fold symmetry with respect to the space diagonal, with most of them having been obtained from tests on specimens under axisymmetric states of stress, and hence defining the meridians of the strength surface corresponding at σ1 = σ2 ≥ σ3 and σ1 ≥ σ2 = σ3. It is such experimental data that have also been found to be stress-path independent[7].
2.3 “Poisson’s ratio” effect The development of most constitutive relations of concrete behaviour published to date has been directly or
indirectly based on the assumption of a constant value of the Poisson’s ratio (PR). However, such an assumption is in conflict with experimental data which show that the variation of PR with the applied load exhibits a trend similar to that indicated in Fig. 2.[16] From the figure, it can be seen that PR is essentially constant up to a value of the applied load equal to between approximately 30% and 50% of the peak load level; beyond this load level, PR increases at an increasing rate and attains a value that becomes significantly larger than 0.5 when the peak load level is reached. Such behaviour clearly indicates that concrete ceases to be a continuum beyond a load level close to, but not beyond, the peak one, a fact consistent with the material’s brittle nature.
.
The above rapid increase of PR with increasing stress has a very significant, but rarely recognized effect on structural-concrete behaviour, since it has been shown to underlie the ultimate limit-state behaviour of structural members such as, for example, beams, columns, slabs, etc[16]. A typical such example is indicated in Fig. 3 which shows the transverse (lateral and vertical) deformation profile of the upper face of a reinforced-concrete (RC) beam designed to fail in flexure under two-point loading (2P in Fig. 3)[10].
From the figure, it is interesting to note the large transverse expansion which the beam (at its ultimate-limit state) undergoes within localised regions of its middle portion between the load points. This is because the above localised regions include primary flexural cracks which reduce the depth of the compressive zone and, hence, increase the intensity of the compressive stress field (developing due to the bending action) to a level significantly higher than that in adjacent regions where the depth of the compressive zone is larger. It is this difference in the intensity of the compressive stress field that causes the large variations in the transverse expansion profile of the upper face of the specimen (see Fig. 3), with the larger transverse expansion corresponding to the locations of peak stresses where, as indicated in Fig. 2, PR attains its largest value.
However, the regions exhibiting different degrees of transverse expansion interact, with the regions with the small expansion imposing a restrain to the large expansion of the adjacent regions; on the other hand, the latter regions tend to impose their rate of expansion to the former. Such an interaction leads to the development of transverse compressive-stress resultants (F in Fig. 3) in the regions exhibiting large transverse expansion and transverse tensile-stress resultants (F and F/2 in Fig. 3) in the adjacent regions where the transverse expansion is small (see Fig. 3). In fact, flexural failure eventually occurs due to horizontal cracking of the compressive zone in the regions where longitudinal compression is combined with transverse tension, rather than due to “crushing” of concrete at its post-peak state in the compressive zone of cross sections including a deep flexural crack as widely believed[10].
Figure 2. Typical variation of Poisson’s ratio with increasing stress established from tests on cylinders in uniaxial compression.
Figure 3. Transverse deformation profile of an RC beam under two-point loading.
Figure 1. Load-displacement curves of concrete inuniaxial compression tests on cylinders using various methods to reduce friction.

Michael D. Kotsovos, Milija N. Pavlovic and Demetrios M. Cotsovos _________________________________________________________________________________________________________________ 2.4 Cracking
An element of concrete in an RC structure cracks in order to relieve tensile stresses when the material strength in tension is attained. The crack faces coincide with the plane of the maximum and intermediate principal stresses (assuming compression as positive) and opens in the orthogonal direction (i.e. in the direction of the minimum principal compressive stress or maximum principal tensile stress), whereas its extension occurs in the direction of the maximum principal compressive stress[8,13]. Such a cracking mechanism precludes any shearing movement of the crack faces and, therefore, contrasts widely adopted mechanisms of shear resistance such as, for example, aggregate interlock and dowel action, which can only be effected through the “shearing” movement of the crack faces.
The cracking mechanism described above implies that an RC structural member suffers loss of load-carrying capacity before failure of concrete in compression anywhere within the member[15]. In fact, loss of load-carrying capacity is preceded by the initiation of cracking in regions where the state of stress is predominantly tensile with propagation into regions under a compressive state of stress occurring after one of the principal stress components of this state of stress becomes tensile. Eventually, failure occurs due to crack formation in regions where large transverse expansion causes transverse tension as described in the preceding section. 2.5 Loading-rate independency
The vast majority of existing constitutive models used for describing the behaviour of concrete under high rates of loading are based on the assumption that there is a link between the mechanical properties of concrete and the rate at which the loading is imposed. However, such a “loading-rate sensitivity” is based on an uncritical interpretation of the available experimental data, the validity of which has recently been questioned[3]. In the present work, the mechanical properties of concrete are considered to be independent of the loading rate, with the effect of the latter on the specimen behaviour being primarily attributed to the inertia effect of the specimen mass: this simple (and, arguably, obvious – though, at present, unorthodox) postulate was the subject of a numerical investigation which proved capable of reproducing the experimental data available from past tests[3]. Moreover, this numerical investigation confirmed the importance of the role that inertia plays in the specimen’s response when subjected to high rates of loading. 3. USE IN FINITE-ELEMENT ANALYSIS 3.1 Constitutive law of concrete behaviour
An analytical description of concrete behaviour may be based on an analysis of experimental stress-strain data expressed in the form of octahedral stress-strain curves. The variations of the secant and tangent values of the bulk (KS ,KT)) and shear (GS,,GT) modulae may easily be expressed as functions of σο and το from the σο-εο and το-γο curves, respectively, as fully described elsewhere[14]. The values of KT and GT at the origin of the normal and shear octahedral stress-strain curves have been shown to adequately describe material behaviour during unloading[12,15]. In order to allow for the coupling between the hydrostatic and deviatoric components of stress and strain expressed by the variation of εο with το for a given σο, the latter variation has been transformed into the variation of an internal hydrostatic stress σint with το for a given σο[12,14]. Having expressed KS (KT) and GS (GT) as functions of σο and το, respectively, and σint as a function of σο and το, the strains corresponding to a given state of stress is easily obtained from Hook’s law by adding σint to σο[15]. As for the case of the deformational properties, the analytical description of the strength surface may also be based on an analysis of experimental data expressed in the form of σο, το and θ (defining the direction of το on the deviatoric plane (plane normal to the space diagonal)). Such data were used for the analytical description of the strength-surface meridians corresponding to θ=0o (σ1 = σ2 ≥ σ3 ) and θ=60o (σ1 ≥ σ2 = σ3.)[9]. For meridians corresponding to 0o ≤ θ ≤ 60o an interpolation function derived elsewhere[23] is used. 3.2 Constitutive law for steel bars The constitutive model used to describe the behaviour of steel reinforcement is essentially an analytical description of the stress-strain curve of steel in compression or tension describing material behaviour under both monotonic and cyclic loading. Full details are provided elsewhere[3]. 3.3 Concrete-steel interaction
It is considered that the concrete-steel interaction is adequately described by the assumption of perfect bond. Three arguments may be adduced for such an approach: First, the notion of perfect bond is compatible with the thinking behind the smeared-crack model – in the sense the detailed description of localised effects is avoided – which spreads the effect of cracking to such an extent that integration points in bar elements represent, generally, bar lengths usually exceeding the localised regions where bond slip occurs, thus precluding a minute account of the local concrete-steel interaction. Secondly, experiments attempting to determine bond-stress against slip-displacement curves exhibit a large scatter of data, which precludes any refinement implicit in the departure from the perfect-bond condition. Thirdly, and most importantly, there are the actual values of the bond stress and

Michael D. Kotsovos, Milija N. Pavlovic and Demetrios M. Cotsovos _________________________________________________________________________________________________________________ corresponding slip themselves. From the experimental data, an order of magnitude for the maximum bond stress and corresponding slip of around 5 MPa and 0.005 cm, respectively, appears to be relevant. These values are larger that the values of 1 MPa and 0.0006 of the tensile strength and corresponding displacement resulting from the failure criterion incorporated in the FE model, by an order of magnitude. It is evident therefore that concrete in the vicinity of concrete-steel interface will usually have cracked before the maximum bond stress could be developed. 3.4 Finite-element solution technique
The implementation in structural analysis of a constitutive law of concrete behaviour with the above characteristics was achieved through the development of a finite-element (FE) package that is fully described elsewhere[3,15,17,18] and therefore will only briefly presented in the following.
The package is capable of performing not only static[15,17,18], but also dynamic[3] analysis, the latter being effected through the unconditionally stable average acceleration method of the implicit Newmark integration scheme[1,4,5]. Moreover, it uses three dimensional (3D) nonlinear (NL) analysis in order to allow for (a) the nonlinear behaviour of concrete under the triaxial stress conditions, which invariably develop prior to local failure (i.e. cracking), and (b) the introduction of non-homogeneity and stress redistribution after the occurrence of cracking. Concrete is modelled by using 27-node brick Lagrangian elements, whereas truss 3-node isoparametric elements are used to model the steel reinforcement.
The nonlinear analysis is based on an iterative procedure, known as the modified Newton-Raphson[15] which is used to calculate stresses, strains and residual forces. Every Gauss point is checked, at first, in order to determine whether loading or unloading takes place, and then in order to establish whether any crack closes or forms. Depending on the results of the previous checks, changes are introduced to the stress-strain matrices of the individual FE’s and, consequently, to the stiffness matrix of the structure. Based on these modified matrices, deformation, strain and stress corrections are evaluated. Convergence is accomplished once the above corrections become very small. It should be pointed out that the formation and closure of cracking is checked separately during each load step. 3.5 Crack formation and closure procedure
During the crack-closure procedure only Gauss points with cracks formed in previous load steps are checked. For a crack to close, the criterion that must be satisfied is that the strains normal to the plane of the crack be compressive. In the course of each iteration, the program singles out the crack with the largest compressive strain and closes it, as it has been observed that, after the closure of one crack, there is usually a drastic drop in the number of cracks that need to close next. The crack-closing procedure is repeated until all cracks that fulfil the crack-closure criterion close.
The crack-formation procedure commences after the completion of the crack-closure procedure. During each iteration of this procedure all Gauss points are checked in order to determine if any new cracks form. This is achieved by using the failure criterion since the opening of a crack corresponds to localized failure of the material. In order to avoid numerical instabilities during the solution of the problem, only a limited number of cracks (no more than three) are allowed to form per iteration. Should the number of cracks that need to open exceed this predefined number, then only the most critical cracks will be allowed to form. As for the case of crack closure, after the formation of the most critical cracks the number of cracks that need to form in the next iteration reduces rapidly due to the redistribution of stress achieved during this process.
Crack formation is modelled by using the smeared-crack approach and may occur up to three times at any given point. Failure is followed by immediate loss of load-carrying capacity in the direction normal to the plane of the crack. Concurrently, the shear stiffness is also considered to reduce drastically to a small percentage of its previous value (during the uncracked state). However, it is not set to zero in order to minimize the risk of numerical instabilities during the execution of the solution procedure, as explained elsewhere[15]. 4. FINITE-ELEMENT PREDICTIONS OF STRUCTURAL-CONCRETE BEHAVIOUR
The validity of the above NLFE package has been verified by comparing the numerical predictions with experimental data obtained from tests on a wide range of structural members subjected to various regimes of static and dynamic loading. Full details of these comparative studies are given elsewhere[3,6,15,17,18]. An indication of the predictive capabilities of the package is provided in the following in the form of load-displacement curves of typical RC structural members under loading regimes varying from static to dynamic and static to periodic. 4.1 Simply-supported beam with overhang under sequential static loading
The case discussed in the present section has been extracted from a research programme concerned with the study of the performance of RC beams exhibiting points of inflection[6]. All beams were simply supported with a span of 1600 mm and an overhang of 400 mm. Their total length was 2200 mm, with a rectangular cross-section of 230 mm (depth)x100 mm (width). The loading arrangement is shown in Fig. 4. The beams were under-reinforced using two 16 mm diameter high-yield deformed bars as both top and bottom reinforcement. The
Michael D. Kotsovos, Milija N. Pavlovic and Demetrios M. Cotsovos _________________________________________________________________________________________________________________ transverse reinforcement provided was in the form of 8 mm plain mild-steel bars. The average test values of yield and ultimate stresses were, respectively, 536 MPa and 626 MPa (16 mm bars) and 368 MPa and 480 MPa (8mm bars). The average concrete strength of all beams was around 30 MPa and the same mix was used throughout. Full details on the specimens and their production are reported in Ref. 6. Information on the test rig, instrumentation, loading and deflection measurement is also contained there.
The analytical load-deflection characteristics for a typical beam designed to the “compressive-force path” method[16] and subjected to sequential loading are compared with the experimental behaviour in Fig. 5. In the figure, the total load is plotted against the deflections corresponding to the locations of the two concentrated loads, namely the middle of the main span (deflection D1) and the end of the overhang (deflection D2). It can be seen that the analytical prediction of the peak load agrees well with its experimental counterpart. Similarly, the maximum deflection at both the main span and the overhang is realistically estimated by the NLFE analysis. 4.2 Structural-concrete wall under cyclic loading
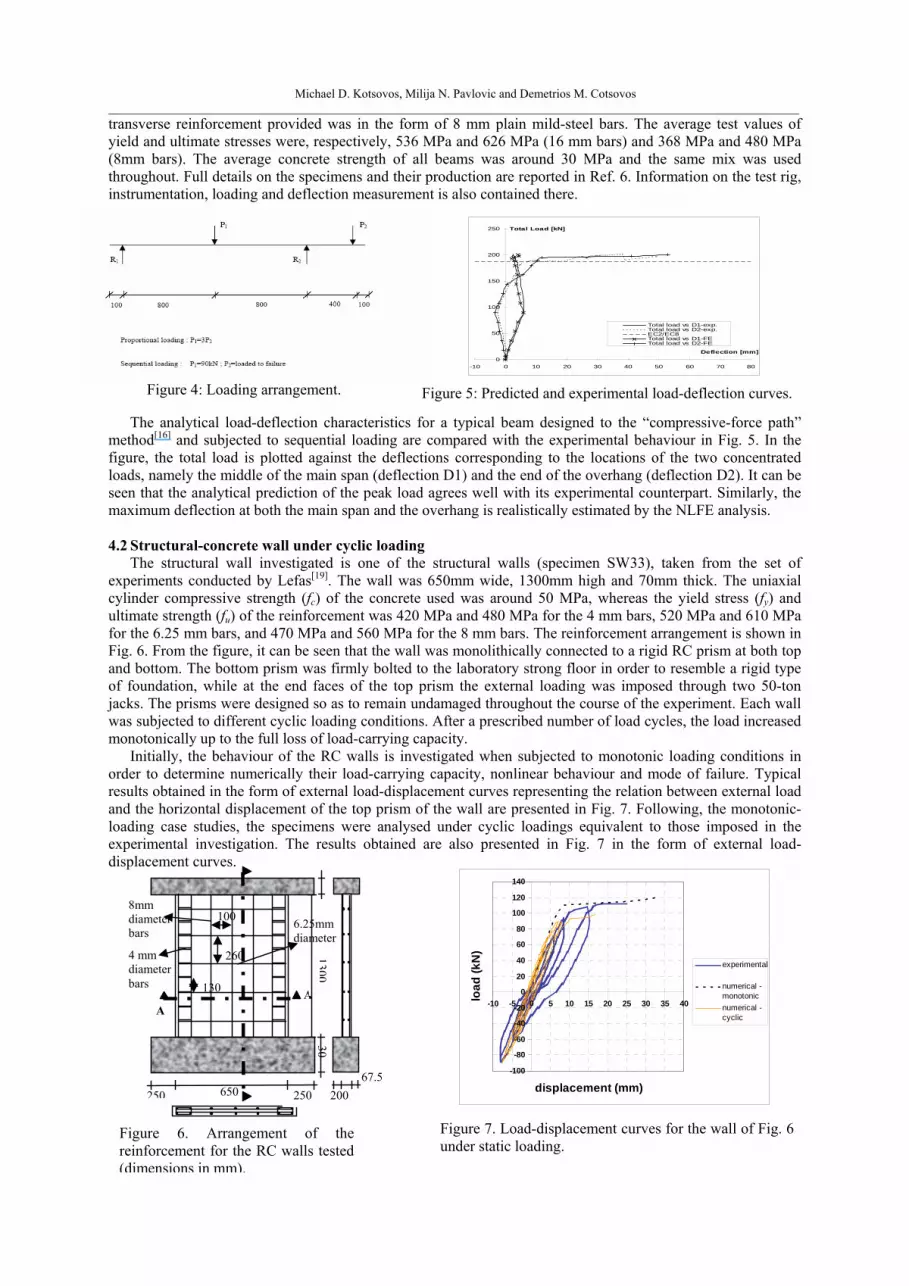
The structural wall investigated is one of the structural walls (specimen SW33), taken from the set of experiments conducted by Lefas[19]. The wall was 650mm wide, 1300mm high and 70mm thick. The uniaxial cylinder compressive strength (fc) of the concrete used was around 50 MPa, whereas the yield stress (fy) and ultimate strength (fu) of the reinforcement was 420 MPa and 480 MPa for the 4 mm bars, 520 MPa and 610 MPa for the 6.25 mm bars, and 470 MPa and 560 MPa for the 8 mm bars. The reinforcement arrangement is shown in Fig. 6. From the figure, it can be seen that the wall was monolithically connected to a rigid RC prism at both top and bottom. The bottom prism was firmly bolted to the laboratory strong floor in order to resemble a rigid type of foundation, while at the end faces of the top prism the external loading was imposed through two 50-ton jacks. The prisms were designed so as to remain undamaged throughout the course of the experiment. Each wall was subjected to different cyclic loading conditions. After a prescribed number of load cycles, the load increased monotonically up to the full loss of load-carrying capacity.
Initially, the behaviour of the RC walls is investigated when subjected to monotonic loading conditions in order to determine numerically their load-carrying capacity, nonlinear behaviour and mode of failure. Typical results obtained in the form of external load-displacement curves representing the relation between external load and the horizontal displacement of the top prism of the wall are presented in Fig. 7. Following, the monotonic-loading case studies, the specimens were analysed under cyclic loadings equivalent to those imposed in the experimental investigation. The results obtained are also presented in Fig. 7 in the form of external load-displacement curves.
67.5 200
A A
6.25mm diameter
8mm diameter bars
4 mm diameter bars 130
260
100
250 250
301300
650
Figure 6. Arrangement of the reinforcement for the RC walls tested (dimensions in mm).
-100
-80
-60
-40
-20
0
20
40
60
80
100
120
140
-10 -5 0 5 10 15 20 25 30 35 40
displacement (mm)
load
(kN
)
experimental
numerical -monotonicnumerical -cyclic
Figure 7. Load-displacement curves for the wall of Fig. 6 under static loading.
Figure 4: Loading arrangement.
0
50
100
150
200
250
-10 0 10 20 30 40 50 60 70 80
Deflection [mm]
Total Load [kN]
Total load vs D1-exp.Total load vs D2-exp.EC2/EC8Total load vs D1-FETotal load vs D2-FE
Figure 5: Predicted and experimental load-deflection curves.

Michael D. Kotsovos, Milija N. Pavlovic and Demetrios M. Cotsovos _________________________________________________________________________________________________________________
A comparison between the numerical predictions (cyclic and monotonic case studies) and experimental data is presented also in Fig. 7. From the figure, it can be seen that the value of the predicted load deviated from its experimental counterpart by around 20%. Such a deviation is comparable with the variability of the experimental data used for the derivation of the constitutive law of concrete and, hence, it is considered acceptable. On the other hand, the predicted deflections were similar to their experimental counterparts up to maximum load of the last load cycle (load cycle 5) when the specimen failed.
4.3 Three-storey structural wall under seismic excitation
Full details of the specimen and the test arrangement are provided elsewhere[20]. The RC wall had a cross-section of 900mm x 100mm and a height of 3 m. The wall corresponds to a three-story building and along its height three 12 ton masses were attached to it at approximately 1 m intervals as schematically shown in Fig. 8. Each mass (corresponding to the mass of a floor in the equivalent three-story building) was supported by a separate rigid steel three-story frame and was able to move only in the horizontal direction (so that the inertia of the masses affects only the horizontal motion of the structure). The wall was also subjected to uniaxial compressive loading, at approximately 30% of the axial compressive strength.
Full details of the FE modelling and numerical predictions are given elsewhere[3]. Only the main results are presented herewith in a graphical form. The dynamic load was applied in the form of an acceleration record, which is presented in Fig. 9. The full response of the specimen during the experimental investigation is presented in Figs 10 and 11 in the form of displacement-time, shear-time and base moment-time curves, respectively. It can be seen from the figures that the correlation between numerical predictions and measured values is very close in all cases.
360
4080
2720
1360 360
360
1000
1000
1000
N M V
P
P
P
N=25 kN
-0,25-0,2
-0,15-0,1
-0,050
0,050,1
0,15
0,20,25
0 2 4 6 8 10 12 14 16 18
time (sec)
acce
lera
tion
(g)
Figure 8. External loading and reactions on RC wall (dimensions in mm).
Figure 9. Acceleration record used for the analysis
-10-8-6
-4-2024
68
10
0 1 2 3 4 5 6
time (sec)
disp
(mm
)-1st
floo
r res
pons
e
experimental results
numerical results
(a)
-25-20-15
-10-505
10
152025
0 1 2 3 4 5 6
time (sec)
disp
(mm
)-2nd
floo
r re
spon
se
experimental results
numerical results
(b)
-40-35-30-25-20-15-10-505
10152025303540
0 1 2 3 4 5 6
time (sec)
disp
(mm
)-3rd
floo
r re
spon
se
experimental results
numerical results
(c)
Figure 10. Numerical and experimental displacement response of (a) the first floor (b) the second floor and (c) the third floor of the RC wall under seismic excitation.

Michael D. Kotsovos, Milija N. Pavlovic and Demetrios M. Cotsovos _________________________________________________________________________________________________________________ 4.4 Concrete behaviour under high rates of compressive loading
The structural form which provides the basis of this investigation is a concrete prism, similar to the concrete specimens used in various experimental investigations carried out to date on this subject[2]. The prism is assumed to be fixed at its bottom face, and to be subjected to an axial load applied at its upper face through a rigid plate element with the same cross-section (see Fig. 12) imposing a uniform displacement on the upper face of the concrete prism. It is assumed that concrete and the rigid plate on the top are fully bonded at their interface. The prism height is 253mm and its cross-section forms a square with a side of 100mm, whereas the rigid plate has a height of 200mm. The uniaxial compressive strength of concrete fc is assumed to be 30 MPa a fairly typical value in practice.
Both the concrete prism and the rigid plate are modelled by using the 27-node Lagrangian brick element.
Meshes consisting of 3 (vertically)x1x1 (horizontally) and a 1x1x1 elements are adopted in order to model the concrete prism and the rigid plate, respectively. The mass of the specimen is modelled as concentrated masses either located on the FE nodes situated along the longitudinal axis of symmetry of the specimen (model A) or distributed to all FE nodes (model B). In the case of model A, only mass displacement in the direction of the applied load (i.e. along the axis of symmetry) is allowed, whereas in the case of model B, the mass is allowed all three degrees-of-freedom of the nodes. The external load is imposed as a force incrementally at the beginning of each time step. In order to vary the rate of loading, the load increments are kept constant and the time step is varied. The numerical investigation consists of two case studies. Case study 1 adopts model A whereas case study 2 relies on model B.
.
The results obtained from case studies 1 and 2 show that the behaviour of the concrete specimen under high rates of uniaxial compressive loading differs considerably compared to that exhibited under static loading. A typical indication of such difference in behaviour is shown in Fig. R13, in which it can be seen that the specimen load-carrying capacity increases as the rate of loading becomes higher. What is important to note is that he above increase in load-carrying capacity is die to the development of inertia forces the magnitude of which increases with the rate of loading and not, as widely assumed, due to the loading-rate dependence of the properties of concrete.
100
Concrete prism
Steel platen 100
200
253
-80
-60
-40
-20
0
20
40
60
80
0 1 2 3 4 5 6
time (sec)
base
she
ar (k
N)
numerical resultsexperimental results
-200
-150
-100
-50
0
50
100
150
200
0 1 2 3 4 5 6
time (sec)ba
se m
omen
t (kN
)
numerical resultsexperimental results
(a) (b)
Figure 11. Numerical (for C = 5 kN·m/sec) and experimental (a) base shear and (b) base moment of the RC wall under seismic excitation.
Figure 12. The specimen used for the investigation.
0.5
1
1.5
2
2.5
3
3.5
1.E-04 1.E-02 1.E+00 1.E+02 1.E+04 1.E+06 1.E+08
stress rate (MPa/sec)
max
P d/m
axP s experimental data
case study 1case study 2
Figure 13. Variation of load-carrying capacity with the applied stress rate for concrete in uniaxial compression.

Michael D. Kotsovos, Milija N. Pavlovic and Demetrios M. Cotsovos _________________________________________________________________________________________________________________ 5. CONCLUSIONS It appears from the above that NLFEA incorporating a brittle, triaxial model of concrete behaviour, load-path and loading rate independent is capable of yielding realistic predictions for a wide range of structural-concrete configurations subjected to any type of static and dynamic loading.
6. REFERENCES 1. Bathe K. J. (1996) Finite Element Procedures, Prentice Hall, Upper Saddle River, New Jersey. 2. Bischoff P. H. & Perry S. H. (1995), “Impact behaviour of plain concrete loaded in uniaxial compression”.
J. Eng. Mechanics 24, 425-450. 3. Cotsovos D. M. (2004), “Numerical Investigation of Structural Concrete under Dynamic (Earthquake and
Impact) Loading”. PhD thesis, University of London, UK 4. Cook, R. D., Malkus, D. S. & Plesha, M. E. (1989), Concepts and applications of finite element analysis, J.
Wiley, New York, 2nd edition. 5. Hinton E. & Owen D. R. J. (1980), Finite elements in plasticity: Theory and application, Pineridge Press,
Swansea. 6. Jelic I., Pavlovic M.N., and Kotsovos M.D. (2004) “Performance of structural-concrete members under
sequential loading and exhibiting points of inflection”. Computers and Concrete, vol. 1, no. 1, February, pp. 99-113.
7. Kotsovos M.D. (1979a), "Effect of Stress Path on the Behaviour of Concrete under Triaxial Stress States," ACI Journal, Proceedings Vol. 76, No. 2, February, pp. 213-223.
8. Kotsovos M.D. (1979b), "Fracture Processes of Concrete under Generalised Stress States," Materials & Structures, RILEM, Vol. 12, No. 72, pp. 431-437.
9. Kotsovos M.D. (1979c), "Mathematical Description of the Strength Properties of Concrete under Generalised Stress," Magazine of Concrete Research, Vol. 31, No. 108, September, pp. 151-158.
10. Kotsovos M.D. (1982), "A Fundamental Explanation of the Behaviour of Reinforced Concrete Beams in Flexure Based on the Properties of Concrete under Multiaxial Stress," Materials & Structures, RILEM, Vol. 15, No. 90, pp. 529-537.
11. Kotsovos M. D. (1983), "Effect of Testing Techniques on the Post-Ultimate Behaviour of Concrete in Compression", Materials & Structures, RILEM, Vol. 16, No. 91, pp. 3-12.
12. Kotsovos M.D. (1984), "Concrete - A Brittle Fracturing Material," Materials & Structures, RILEM, Vol. 17, No. 98, pp. 107-115.
13. Kotsovos M.D. and Newman J.B. (1977), "Behaviour of Concrete under Multiaxial Stress," ACI Journal, Proceedings Vol. 74, No. 9, pp. 453-456.
14. Kotsovos M.D. and Newman J.B. (1978), "Generalised Stress-Strain Relations for Concrete," Journal of the Engineering Mechanics Division, ASCE, Vol. 104, No. EM4, August, pp. 845-856.
15. Kotsovos M. D. and Pavlovic M. N. (1995), Structural concrete: Finite-element analysis for limit-state design. Thomas Telford, 550pp.
16. Kotsovos M. D. and Pavlovic M. N. (1999), Ultimate limit-state design of concrete structures: A new approach. Thomas Telford, 164pp.
17. Kotsovos M.D. and Spiliopoulos K.V. (1998a), “Modelling of crack closure for finite-element analysis of structural concrete.” Computers and Structures, Vol. 69, pp. 383-398.
18. Kotsovos M.D. and Spiliopoulos K.V. (1998b), “Evaluation of structural-concrete design-concepts based on finite-element analysis.” Computational Mechanics, Vol. 21, pp. 330-338.
19. Lefas I. (1988), “Behaviour of reinforced concrete walls and its implementation for ultimate limit state design”, Ph.D. Thesis, University of London.
20. Lestuzzi P., Wenk T. and Bachmann H. (1999) “Dynamic Tests of RC Structural Walls on the ETH Earthquake Simulator”. IBK Report No. 240, Institüt für Baustatik und Konstruktion: ETH, Zurich.
21. van Mier J. G. M. (1986), “Multiaxial strain-softening of concrete”, Materials & Structures, RILEM. Vol. 19, No. 111, pp. 179-200.
22. van Mier J.G.M; Shah S.P.; Arnaud M.; Balayssac J.P.; Bassoul A.; Choi S.; Dasenbrock D.; Ferrara G.; French C.; Gobbi M.E.; Karihaloo B.L.; Konig G.; Kotsovos M.D.; Labnz J.; Lange-Kornbak D.; Markeset G.; Pavlovic M.N.; Simsch G.; Thienel K-C.; Turatsinze A.; Ulmer M.; van Vliet M.R.A.; and Zissopoulos D. (1997), (TC 148-SSC: Test methods for the strain-softening of concrete). “Strain-softening of concrete in uniaxial compression”. Materials & Structures RILEM, Vol. 30, No. 198, pp. 195-20.
23. Willam K. J. and Warnke E. P. (1974) “Constitutive model for the triaxial behaviour of concrete”. Seminar on Concrete Structures Subjected to Triaxial Stresses.Instituto Sperimentale Modeli e Strutture, Bergamo, May, Paper III-1.
24. Zienkiewicz O. C. (1971), The Finite Element Method in Engineering Science, McGraw-Hill, London, 2nd edition.


