Embed Size (px)
Citation preview
STRUCTURAL DETERMINANTS OF AMPA RECEPTOR KINETIC REGULATION
BY TRANSMEMBRANE AUXILIARY PROTEINS
By
Marika Colombe Arsenault
Department of Pharmacology & Therapeutics
McGill University
(Montreal, Canada)
August 2019
A thesis submitted to the Faculty of Graduate and Postdoctoral Studies
in partial fulfillment of the requirement of the degree of
MASTER OF SCIENCE
Copyright © 2019 Marika Colombe Arsenault
2
ABSTRACT
Ionotropic glutamate receptors (iGluRs) are the primary mediators of fast excitatory
neurotransmission in the mammalian central nervous system (CNS). Thus far, most structure-
function studies focused on characterizing the behavior of iGluRs as independent protein units. At
glutamatergic synapses however, it is now acknowledged that iGluRs operate in complex
association with an array of accessory proteins. For AMPA-type iGluRs (AMPARs), recent studies
suggest that some of their so-called ‘auxiliary subunits’, including members of the transmembrane
AMPAR auxiliary protein (TARP) and protein cornichon homolog (CNIH) families, can modulate
receptor kinetics and pharmacological properties, accounting for a previously reported mismatch
between AMPAR responses measured in heterologous vs native systems. The experiments
conducted in the context of this thesis were designed to explore the interplay between auxiliary
subunits and AMPAR behavior. More specifically, the outside-out patch-clamp
electrophysiological technique and site-directed mutagenesis were used to investigate the nature
of functional interactions between GluA2 homomers and two important auxiliary subunits of
AMPARs, namely the prototypical type-I TARP γ2 and CNIH3. First, this work shows that a
previously isolated ‘lysine-glycine-lysine’ (KGK, 718-720) motif conserved in the lower (D2) lobe
of GluA1-4 ligand-binding domains (LBD) plays a specific role in the modulation of AMPAR
decay kinetics, recovery from desensitization and equilibrium responses by γ2, but not CNIH3. An
additional residue (E665) in the vicinity of the KGK motif was then identified as a shared
interaction site for γ2 and CNIH3, contributing to the ability of both auxiliary subunits to slow
AMPAR decay kinetics and potentiate equilibrium currents. Importantly, this work highlights
protein-protein interactions involved in the modulation of AMPAR kinetics by auxiliary subunits
independently of their ability to alter other pharmacological properties of the receptors, such as
efficacy of the partial agonist kainate and sensitivity to voltage-dependent block by intracellular
polyamines. These findings also add to a growing body of evidence suggesting that the LBD is a
hotspot for the functional modulation of receptor kinetics by auxiliary subunits.
3
ABRÉGÉ
Les récepteurs glutamatergiques ionotropes (iGluRs) sont les principaux médiateurs de la
neurotransmission excitatrice rapide du système nerveux central (SNC) des mammifères. Au sein
de synapses glutamatergiques, il a été démontré que ces récepteurs forment des associations
complexes avec une variété de familles protéiques transmembranaires. Jusqu’à ce jour, la plupart
des études de structure-fonction portant sur les iGluRs de type AMPA se sont concentrées sur la
caractérisation des récepteurs en tant qu’unités protéiques indépendantes. Cependant, de récentes
études démontrent que certains membres des familles de protéines auxiliaires transmembranaires
des récepteurs AMPA (TARPs) et des protéines homologues de types cornichon (CNIHs)
modifient la cinétique d’inactivation et de désensibilisation ainsi que les propriétés
pharmacologiques des récepteurs. En effet, ces altérations seraient responsables de discordances
entre les réponses médiées par les récepteurs AMPA observées dans les systèmes hétérologues
versus physiologiques. Les expériences réalisées dans le cadre de cette thèse s’appuient sur des
travaux antérieurs menés dans le laboratoire de Dr. Bowie, portant sur l’étude des interactions
fonctionnelles entre les récepteurs AMPA et leurs protéines auxiliaires. Plus précisément, la
méthode électrophysiologique patch-clamp en configuration « outside-out » ainsi que la
mutagenèse dirigée furent utilisées en vue de mieux comprendre l’interaction entre les sous-unités
GluA2 et deux protéines auxiliaires importantes, soient la protéine TARP γ2 ainsi que CNIH3. Les
résultats démontrent d’abord qu’un motif ‘lysine-glycine-lysine’ (KGK, 718-720) conservé dans
le lobe inférieur (D2) du domaine de liaison du ligand (LBD) des sous-unités GluA1-4 joue un
rôle spécifique dans la régulation de la cinétique d’inactivation, de récupération et de la réponse à
l’équilibre des récepteurs AMPA par γ2, mais pas CNIH3. De plus, nous avons isolé un résidu
additionnel (E665) dans le voisinage du motif KGK qui serait potentiellement partagé par γ2 et
CNIH3 en tant que site d’interaction commun, contribuant au ralentissement de la cinétique des
récepteurs AMPA et à la potentialisation de leur réponse à l’équilibre. Ces résultats démontrent
l’existence de sites d’interactions fonctionnelles impliqués dans la régulation de la cinétique des
récepteurs AMPA par des protéines auxiliaires indépendamment de leurs effets sur d’autres
propriétés pharmacologiques, telles que l’efficacité de l’agoniste partiel kainate et le blocage
voltage-dépendant du pore central par les polyamines intracellulaires. De plus, ceux-ci s’ajoutent
à un regroupement grandissant d’évidences démontrant que le LBD est une cible d’interaction
centrale pour la régulation de la cinétique des iGluRs par les protéines auxiliaires.
4
TABLE OF CONTENTS
ABSTRACT .................................................................................................................................................. 2
ABRÉGÉ ...................................................................................................................................................... 3
TABLE OF CONTENTS .............................................................................................................................. 4
AKNOWLEDGEMENTS ............................................................................................................................. 6
CONTRIBUTION OF AUTHORS ............................................................................................................... 7
PART I: LITERATURE REVIEW ............................................................................................................... 8
1. Overview of ionotropic glutamate receptors ................................................................................ 9
Discovery of glutamate as a neurotransmitter ........................................................................... 9
The main excitatory neurotransmitter system ........................................................................... 9
Identification and classification of ionotropic glutamate receptor subtypes ........................... 11
Functional properties of ionotropic glutamate receptors......................................................... 13
Major structural features of AMPARs .................................................................................... 16
Molecular diversity of AMPAR subunits ............................................................................... 21
Subunit assembly and stoichiometry ....................................................................................... 22
Preferential subunit assembly in the CNS ............................................................................... 23
2. Principles of LGIC gating ............................................................................................................ 24
Electrophysiological correlates of ion channel behavior ........................................................ 24
State model of channel gating ................................................................................................. 24
Channel pharmacology: terminology ...................................................................................... 25
Concerted vs sequential models of receptor activation ........................................................... 26
Structural and biophysical correlates of AMPAR gating ........................................................ 27
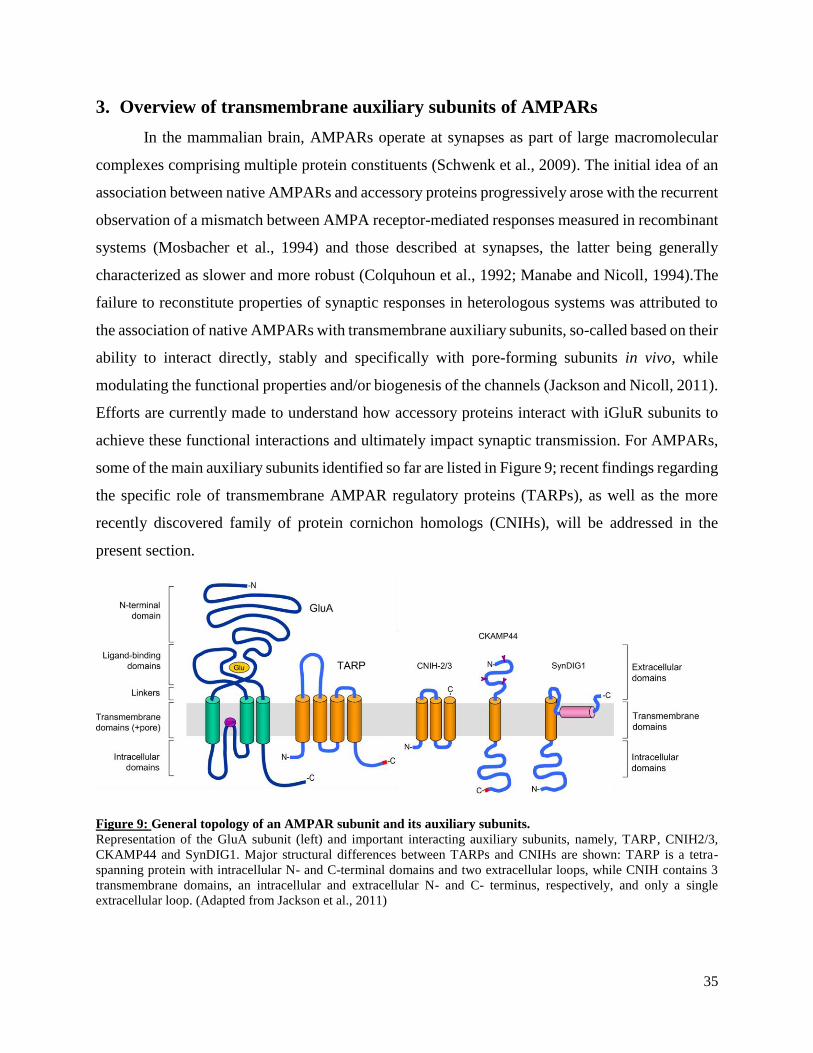
3. Overview of transmembrane auxiliary subunits of AMPARs .................................................. 35
Transmembrane AMPA receptor regulatory proteins (TARPs) ............................................. 36
Protein Cornichon Homologs (CNIHs) ................................................................................... 43
Physiological relevance of type-I TARPs and CNIH2/3 interactions with AMPARs ............ 47
Thesis aims ............................................................................................................................................. 49
PART II: METHODOLOGY...................................................................................................................... 51
1. Plasmid generation and site-directed mutagenesis .................................................................... 52
2. Cell culture and transfection ........................................................................................................ 54
3. Electrophysiology .......................................................................................................................... 55
3.1. electrophysiological solutions ................................................................................................. 55
3.2. Macroscopic electrophysiological recordings ......................................................................... 57
5
3.3. Analysis of electrophysiological data ..................................................................................... 62
4. Statistical methods ........................................................................................................................ 64
PART III: RESULTS .................................................................................................................................. 65
PART IV: GENERAL DISCUSSION & CONCLUSION ......................................................................... 89
Discussion .............................................................................................................................................. 90
1. Quantifying the ability of auxiliary subunits to modulate AMPAR kinetics and
pharmacology ............................................................................................................................. 90
2. Mutagenesis experiments on the AMPAR LBD reveal distinct sites for functional interaction
with TARPs and CNIHs .............................................................................................................. 93
Limitations and future directions ........................................................................................................ 96
Conclusion ............................................................................................................................................. 97
REFERENCE LIST .................................................................................................................................... 99
APPENDIX : SUMMARIZED AND SUPPLEMENTARY RESULTS .................................................. 109
6
AKNOWLEDGEMENTS
I should first address my sincerest gratitude to my supervisor, Dr. Derek Bowie, for
guiding me throughout this project, for his continuous support, his enthusiasm and for transmitting
his passion for the field of neuropharmacology. Dr. Bowie believed in my ability to succeed and
gave me the opportunity to create my own path in the scientific community, which I will always
be thankful for.
I also want to express my appreciation to the members of my graduate training committee:
Dr. Reza Sharif-Naeini, Dr. Lisa Marie Münter and Dr. David Stellwagen. Their thoughtful
feedback gave me new and broader perspectives on my research topic, helped me understand the
significance of my project and strengthened my preparation for public and departmental
presentations.
My experience in the Bowie lab would have never been the same without my laboratory
colleagues, who helped me grow as a scientist and as a person. A special thanks should be
addressed to Dr. Patricia M.G. E. Brown, Dr. G. Brent Dawe, Dr. Mark R.P. Aurousseau and
Dr. Bryan Daniels for sharing their scientific expertise and for their immense support throughout
my training in the challenging field of electrophysiology. I want to extend my thanks to other
members of the lab: Dr. Hugo McGuire, Dr. Michael Accardi, Ryan Alexander, Erik Larson,
Adamo Mancino, Amanda Perozzo, Martina d’Antoni and Edward Yan. All of them
contributed directly and indirectly to my integration and my evolution in the lab and maintained
an enjoyable environment to work in.
I also want to acknowledge the generosity of the Groupe d’Études des Protéines
Membranaires (GÉPROM), the Canadian Institute of Health Research (CIHR) and the
department of Pharmacology and Therapeutics for their financial support throughout this
project.
Last but not least, I want to thank my parents, Lynda Arbour and Claude Arsenault, for
their unconditional support and for continuously believing in my success. Thanks to my
pharmacology colleagues Fiona, Chris, and Anne-Sophie for their precious friendship and for
being inspirational scientists. I should not forget to mention my amazing friends and future
veterinarians Rose, May, Marine, Valérie, Jasmine, Charlyne and Sarah, who gave me
significant support as I went through the challenging task of writing a thesis while attending classes
in veterinary school.
7
CONTRIBUTION OF AUTHORS
This thesis is composed of one manuscript written as outlined in the McGill thesis
guidelines. The results generated during my graduate studies were included in one published article
and one manuscript currently under review.
Main thesis contributions
All the experiments included in this thesis were designed by Dr. Derek Bowie, Dr. Mark
Aurousseau and myself. Dr. Mark Aurousseau has been in charge of site-directed mutagenesis and
plasmid generation. I personally conducted all electrophysiological experiments, performed data
analysis, took charge of cell culture maintenance and wrote the current manuscript in its entirety.
A.M. Perozzo, M. Arsenault, P.M.G.E Brown, M.R.P Aurousseau and D. Bowie (2019).
Auxiliary subunits target distinct AMPA receptor gating modes through discrete
evolutionarily-conserved regulatory sites. Unpublished manuscript, McGill University,
Montreal, Canada.
This unpublished manuscript comprises the results for most of my thesis work, which was
taken over by Amada Perozzo (first author). As such, I contributed to the experiment designs,
electrophysiological data collection, data analysis and part of the editing process. My results
appear in main figures 1-3 and supplemental figure 4.
G.B. Dawe, M.F. Kadir, R. Venskutonyte, A.M. Perozzo, Y. Yan, R.P.D. Alexander, C.
Navarrete, E.A. Santander, M. Arsenault, C. Fuentes, M.R.P. Aurousseau, K. Frydenvang,
N.P. Barrera, J.S. Kastrup, J.M. Edwardson and D. Bowie (2019). Nanoscale Mobility of the
Apo State and TARP Stoichiometry Dictate the Gating Behavior of Alternatively Spliced
AMPA Receptors. Neuron, April 30 2019.
For this article, I performed control electrophysiological experiments to show that the
S775N mutation in GluA2(flip) subunits was required and sufficient to account for receptor
sensitivity to anion modulation of gating kinetics. I showed that the T765N and P766A mutations,
previously found to alter the distinctively fast gating kinetics of GluA2(flop), could not influence
anion sensitivity alone: the presence of the S775N mutation was required. I analyzed the data and
summarized my results in figure S3 of this article.
8
PART I:
LITERATURE REVIEW
9
1. Overview of ionotropic glutamate receptors
Discovery of glutamate as a neurotransmitter
Glutamate was first isolated from wheat in 1866 through hydrolysis of the so-called
“gluten-fibrin” protein (Vickery and Schmidt, 1931). Aside from its role as a protein building
block, glutamate is known today as the main excitatory neurotransmitter of the vertebrate central
nervous system (CNS) (Dingledine et al., 1999; Madden, 2002; Niciu et al., 2012). Early
indications of the important neurophysiological function of glutamate arose from the discovery of
its high relative abundance in the human cerebral cortex, its association with clonic convulsions
when diffusely applied over mammalian motor cortices and its ability to improve conditional
learning in dogs at small intravenous concentrations (Hayashi, 1954; Krebs et al., 1949). With
advances in electrophysiological techniques in the following years, measurements of glutamate-
mediated neuronal responses in mammalian cortices soon allowed the recognition of its rapid and
reversible excitatory action on neurons (Curtis et al., 1960; Krnjevic and Phillis, 1963). Despite
these evidences and the well-established concept of chemical neurotransmission at the time,
glutamate was not recognized as a functional neurotransmitter until over a century following its
initial isolation (López-Muñoz and Alamo, 2009). Given its apparent association with oxidative
reactions in the brain and retina, glutamate was rather thought to play a role in cell metabolism
(Krebs, 1935). Furthermore, the unusually ubiquitous activity of glutamate on all neuronal cell
types known at the time and the lack of a clear re-uptake mechanism that could rapidly terminate
this activity hampered the establishment of the neurotransmitter hypothesis (Root and Hofmann,
2016). This concept was progressively built over decades of investigations and culminated in the
1980s, where glutamate was finally recognized as an amino-acid that met all the major defining
criteria of a neurotransmitter (Fonnum, 1984). A key discovery was the identification of a very
specific uptake system of glutamate into synaptic vesicles in mammalian brain tissues (Logan and
Snyder, 1971). In fact, the vesicular uptake of glutamate would be a committing step where
cytosolic glutamate leaves its metabolic functions to now behave a neurotransmitter, accumulating
at nerve terminals and eventually being released into synaptic clefts by exocytosis (zkan and Ueda,
1998). Furthermore, the re-uptake of glutamate outside of synapses was found to mainly involve
glial cells rather than presynaptic transporters. The entry of glutamate into astrocytes would initiate
10
a glutamate-glutamine cycle accounting for most of the glutamate pool found within neurons
(Marx et al., 2015).
The main excitatory neurotransmitter system
When released from synaptic terminals, glutamate acts as the endogenous agonist of two major
classes of neurotransmitter-gated receptors, namely the metabotropic and ionotropic glutamate
receptors. Metabotropic glutamate receptors (mGluRs) use a secondary messenger signalling
cascade to induce long-lasting modulatory changes in synaptic transmission (Watkins, 2000). On
the other hand, ionotropic glutamate receptors (iGluRs) have an undisputed role in mediating the
vast majority of rapid excitatory neurotransmission in the brain. In fact, iGluRs contain a cation-
specific transmembrane ion channel that opens in response to agonist binding within the
extracellular ligand-binding pocket. iGluRs therefore link each pre-synaptic event of glutamate
release to a transient increase in the cation-permeability of the post-synaptic membrane, resulting
in a depolarizing current that may contribute to the generation of an action potential (Hammond,
2015b; Yan et al., 2013). iGluRs are known as fast-acting receptors in that they mediate their
excitatory responses on target cells within a millisecond time-scale. They share this property with
their inhibitory counterparts, type-A ionotropic γ-aminobutyric acid (GABAA)- gated receptors,
which similarly contribute to fast inhibitory neurotransmission by converting agonist binding into
the transient opening of an anion-selective channel (Hammond, 2015a). On the other hand, most
of the other neurotransmitter-gated receptors of the CNS, such as mGluRs, biogenic amine- and
neuropeptide-gated receptors, mediate their neuro-modulatory effects through complex
intracellular events over hundreds of milliseconds to minutes (Greengard, 2001). The generation
of rapid excitatory and inhibitory post-synaptic potentials (EPSPs and IPSPs) in the brain therefore
heavily relies on the presynaptic release of glutamate and GABA, respectively, and the fast action
of their target receptors (Cherubini, 2010; Meldrum, 2000; Wolszon et al., 1997). The contribution
of other ion-channels to fast neurotransmission, including cholinergic, glycine and serotoninergic
(5HT3) receptors, should not be denied. While nicotinic-cholinergic receptors play a central role
at neuromuscular junctions, they also contribute to a minor fraction of the fast-excitatory
neurotransmission in the CNS (Dani, 2001). 5HT3 receptors mediate excitatory neurotransmission
in distinct serotoninergic pathways across both the central and peripheral nervous systems
(Thompson and Lummis, 2006), and glycine receptors contribute to fast inhibitory transmission
11
primarily in the brainstem and spinal cord (Betz, 1992; Thompson and Lummis, 2006). The
GABAergic and glutamatergic systems distinguish themselves through their incredibly ubiquitous
nature. Glutamate is released from widely distributed neuron terminals across the entire brain,
making it the most abundant amino-acid in the CNS (Mustafa and Gazi, 2014). Similarly, iGluRs
themselves are expressed in neurons, astrocytes, glial cells and oligodendrocytes widely
distributed across the CNS (Steinhäuser and Gallo, 1996). The wide distribution of the
glutamatergic system also mirrors its implication in a variety of brain functions, which extend
beyond neuronal communication. In fact, iGluRs have been associated with almost all facets of
CNS development through major roles in synaptic plasticity mechanisms and neuromodulation,
which are biochemical correlates of learning and memory (Bliss and Collingridge, 1993; Kessels
and Malinow, 2009). Not surprisingly, dysfunctions in iGluRs can lead to large-scale impairments
in the brain and have been linked to a collection of neurophysiological and psychiatric disorders,
including temporal lobe epilepsy, aberrant nociceptive responses, Fragile X syndrome and stroke
damage (Bowie, 2008; Madden, 2002).
Identification and classification of ionotropic glutamate receptor subtypes
The identification of glutamate as a major excitatory neurotransmitter stimulated structure-
activity studies to better understand the nature of the targeted receptors. Initial pharmacology-
based investigations lead to the discovery of a group of compounds having an excitatory effect on
neurons, similar to the action of glutamate. These highly potent agonists included the naturally
occurring kainic and quisqualic acids, the L-glutamate analogue N-methyl-D-aspartate (NMDA)
as well as α-amino-3-hydroxy-5-methyl-4-isoxazolepropionic acid (AMPA), the latter being
synthetically derived from ibotenic acid. Glutamate receptors were initially classified as NMDA
and non-NMDA receptors based on the observation that a series of antagonists would specifically
block NMDA-mediated excitatory responses, while leaving the effect of kainate, quisqualate and
AMPA intact (J C Watkins and Evans, 1981; Watkins, 2000). Similarly, kainate receptors were
later distinguished from other non-NMDA receptors through the discovery of γ-glutamylglycine,
which had an antagonistic action restricted to NMDA- and kainate-activated responses (Davies
and Watkins, 1981). L-glutamate was then found to act on G-protein coupled receptors resistant
to the antagonists known at the time, which brought about the differentiation between iGluRs and
mGluRs. Quisqualate was associated with a dual action on some receptors included in either
12
categories. Among the quisqualate-sensitive receptors, AMPA had a specific action on those of
the ionotropic form, which were renamed AMPA receptors (Lodge, 2009; Nakanishi, 1992;
Nicoletti et al., 1986; Watkins, 2000). As a result of years of sinuous pharmacological
investigations, iGluRs are now classified in three main families, namely the NMDA, kainate and
AMPA receptors types.
Advances in molecular biology techniques in the 1990s, starting with the development of
cloning technologies, permitted the elucidation of the iGluR structure and molecular
characterization of its different subtypes (Watkins, 2000). iGluRs are large transmembrane protein
complexes composed of four subunits, each subunit being made of beyond 900 amino-acids
(Traynelis et al., 2010). The previously established pharmacology-based classification of iGluRs
has been validated through cloning of the receptor subunits, which co-assemble into functional
tetramers through exclusive associations with subunits of the same receptor family. As indicated
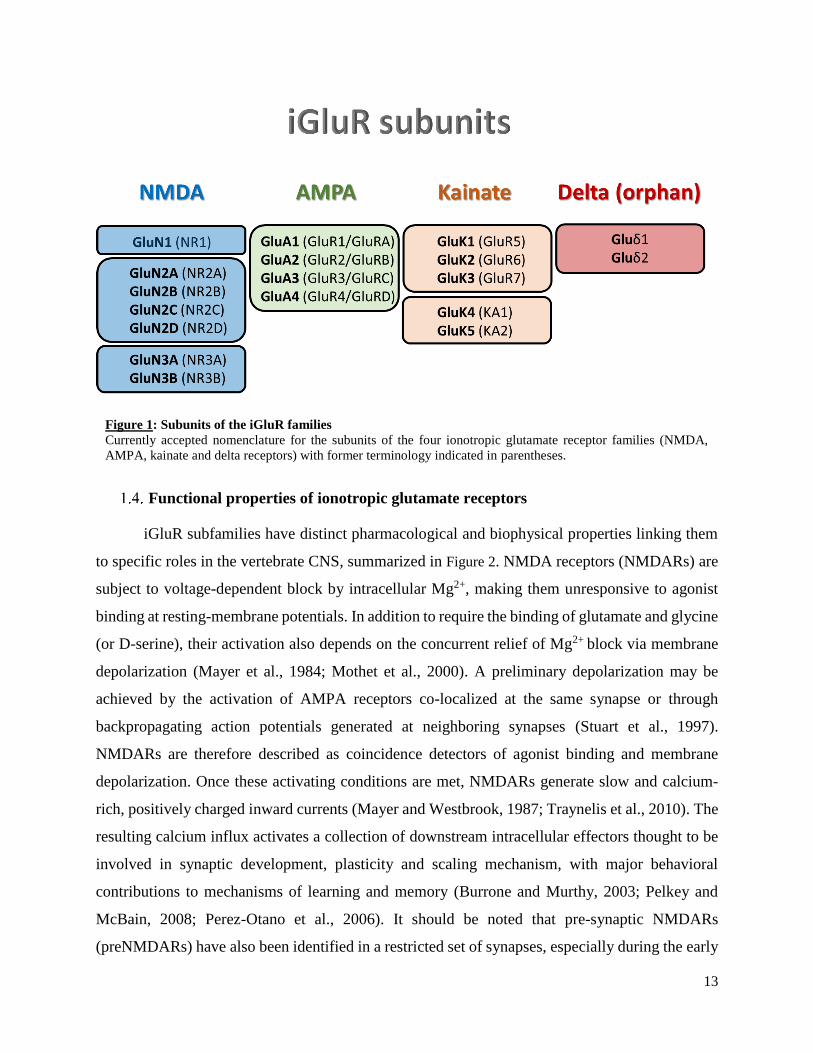
in Figure 1, NMDA receptors are encoded by 7 genes (GluN1, GluN2A-D and GluN3A-B); AMPA
receptors by 4 genes (GluA1-4) and kainate receptors by 5 genes (GluK1-5) (Collingridge et al.,
2009; Traynelis et al., 2010). Two additional proteins discovered in the 1990s, GluRδ1 and
GluRδ2, were classified as part of the iGluR family based on their 17-28% sequence identity with
other known subunits (Lomeli et al., 1993; Yamazaki et al., 1992). However, neither GluRδ1 nor
GluRδ2 has been shown to form functional receptors in heterologous systems and remain
unresponsive to classical iGluR agonists, such that they are currently categorized as orphan
receptors (Yuzaki, 2003). Nevertheless, recent investigations have demonstrated their roles in
various neurophysiological functions, which will be discussed shortly.
It is worth mentioning that the nomenclature of iGluR subunits underwent a series of
modifications following their initial identification (Collingridge et al., 2009). While this work uses
the most up-to-date nomenclature, previous appellations (listed in Figure 1) may still be found in
the literature.
13
Figure 1: Subunits of the iGluR families
Currently accepted nomenclature for the subunits of the four ionotropic glutamate receptor families (NMDA,
AMPA, kainate and delta receptors) with former terminology indicated in parentheses.
Functional properties of ionotropic glutamate receptors
iGluR subfamilies have distinct pharmacological and biophysical properties linking them
to specific roles in the vertebrate CNS, summarized in Figure 2. NMDA receptors (NMDARs) are
subject to voltage-dependent block by intracellular Mg2+, making them unresponsive to agonist
binding at resting-membrane potentials. In addition to require the binding of glutamate and glycine
(or D-serine), their activation also depends on the concurrent relief of Mg2+ block via membrane
depolarization (Mayer et al., 1984; Mothet et al., 2000). A preliminary depolarization may be
achieved by the activation of AMPA receptors co-localized at the same synapse or through
backpropagating action potentials generated at neighboring synapses (Stuart et al., 1997).
NMDARs are therefore described as coincidence detectors of agonist binding and membrane
depolarization. Once these activating conditions are met, NMDARs generate slow and calcium-
rich, positively charged inward currents (Mayer and Westbrook, 1987; Traynelis et al., 2010). The
resulting calcium influx activates a collection of downstream intracellular effectors thought to be
involved in synaptic development, plasticity and scaling mechanism, with major behavioral
contributions to mechanisms of learning and memory (Burrone and Murthy, 2003; Pelkey and
McBain, 2008; Perez-Otano et al., 2006). It should be noted that pre-synaptic NMDARs
(preNMDARs) have also been identified in a restricted set of synapses, especially during the early
14
stages of brain development. PreNMDARs would play important roles in regulating short- and
long-term plasticity mechanisms, enhancing presynatic neurotransmitter release and shaping the
circuitry of the developing brain (Banerjee et al., 2016).
AMPA receptors (AMPARs) co-localize with NMDARs at nearly all synapses in the CNS
to form the functional unit of excitatory synaptic transmission (Traynelis et al., 2010). AMPARs
activate at resting membrane potentials via the synaptic release and binding of glutamate, to
generate depolarizing membrane currents that rise and deactivate within a sub-millisecond
timescale (Mosbacher et al., 1994). Given these rapid gating properties, AMPARs contribute to
most of the fast neuronal communication in the mammalian CNS (Platt, 2007; Traynelis et al.,
2010). Moreover, they are key players in NMDAR-dependent plasticity mechanisms, since
calcium-mediated intracellular cascades resulting from NMDAR activity lead to downstream,
long-lasting changes in AMPAR surface expression at post-synaptic densities (Collingridge et al.,
2004; Lüscher and Malenka, 2012). Unlike NMDARs, the majority of AMPARs expressed in the
adult CNS are weakly permeable to calcium (Traynelis et al., 2010; Wright and Vissel, 2012).
Nevertheless, a role in synaptic maturation, synaptic plasticity and circuit development has been
attributed to more sparsely expressed calcium-permeable AMPA receptors (CP-AMPARs),
especially during early neonatal brain development (Isaac et al., 2007; Wiltgen et al., 2010)
While native kainate receptors (KARs) can also contribute to excitatory signals, their
activation and deactivation kinetics tend to be generally slower than those of AMPARs, and their
roles at synapses seem rather modulatory (Castillo et al., 1997; Lerma, 2003; Madden, 2002).
Given their slower gating properties, rapidly stimulated kainate receptors generate synaptic
currents that can temporally summate, causing changes in cell excitability and modulatory effects
on long-term potentiation (LTP) regulating synaptic plasticity (Contractor et al., 2011).
Furthermore, KARs are prominently expressed at presynaptic terminals, where they can alter the
strength of synaptic connections by inducing facilitation or depression of transmitter release
(Chittajallu et al., 1996; Cossart et al., 2001). A metabotropic action of KARs has also been
reported, involving a secondary messenger cascade leading to the activation of protein-kinase C
(PKC). This would explain the ability of KARs to downregulate GABA release in hippocampal
neurons, independently of an ionotropic mechanism (Rodríguez-Moreno and Lerma, 1998).
Finally, a distinguishing feature of KARs is the essential role of an ion-binding pocket in their
15
extracellular domain, which must be occupied in order to minimally stabilize the open
conformation of the channel and allow receptor gating (Wong et al., 2006; Wong et al., 2007).
As mentioned earlier, delta (orphan) receptor subunits do not form functional channels nor
respond to classic iGluR agonists, but knock-out and mutagenesis studies uncovered putative
physiological roles of the individual subunits. Notably, GluRδ2 subunits have been exclusively
found in cerebellar Purkinje cells, where their disrupted expression is associated with motor
coordination problems, impaired long-term depression (LTD) and defects in Purkinje cell
maturation (Kashiwabuchi et al., 1995). A gain-of-function mutation in GluRδ2 subunits has also
been linked to important motor deficits seen in the lurcher mutant mice (Zuo et al., 1997). On the
other hand, GluRδ1 subunits are mainly expressed in hippocampal neurons and cells of the inner,
where they play a role in auditory perception of high frequency signals (Gao et al., 2007).
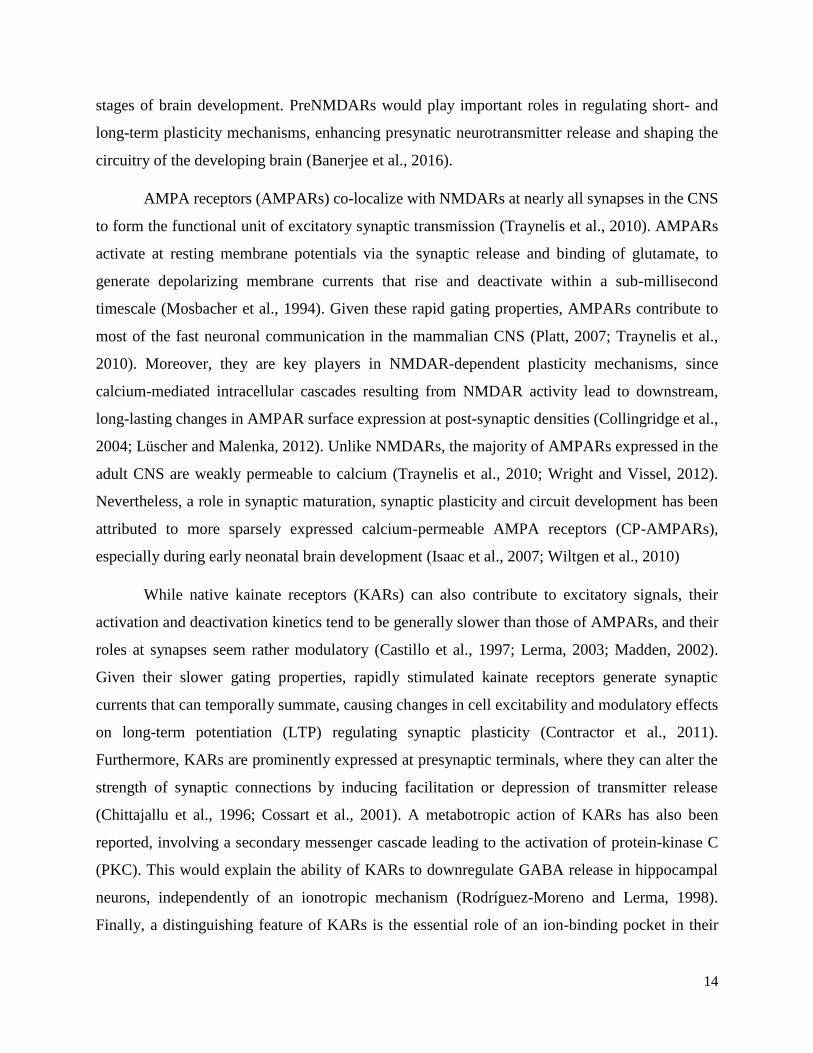
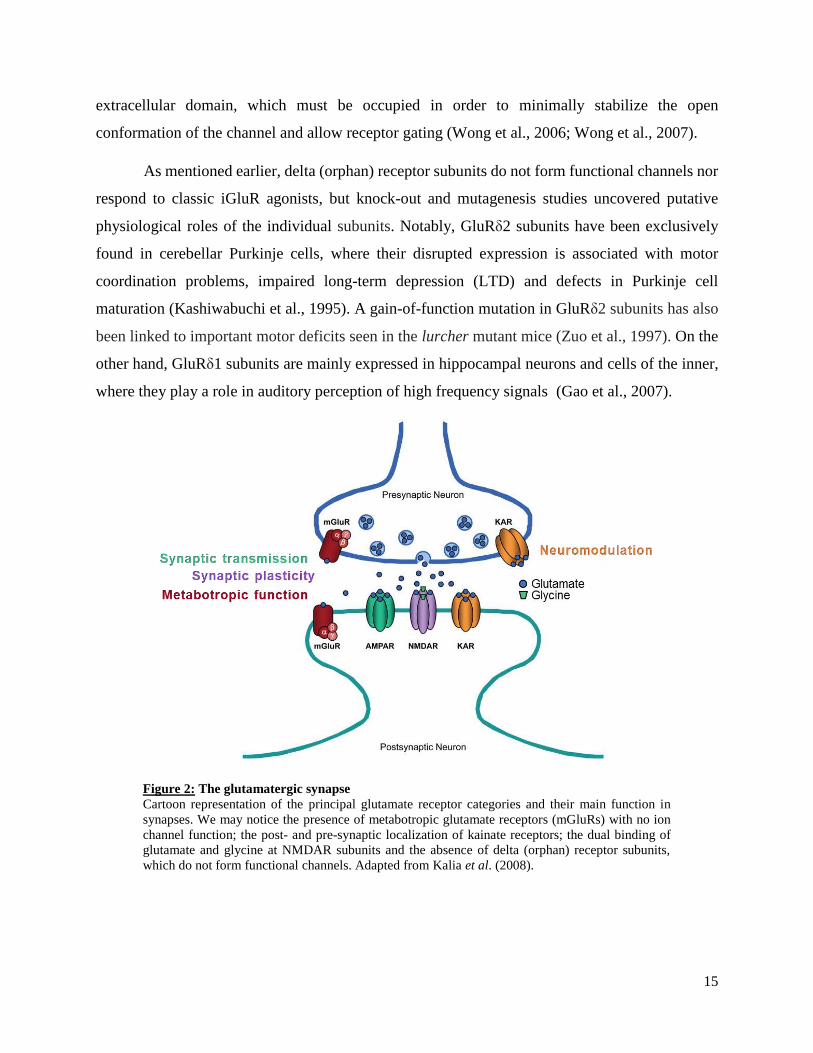
Figure 2: The glutamatergic synapse
Cartoon representation of the principal glutamate receptor categories and their main function in
synapses. We may notice the presence of metabotropic glutamate receptors (mGluRs) with no ion
channel function; the post- and pre-synaptic localization of kainate receptors; the dual binding of
glutamate and glycine at NMDAR subunits and the absence of delta (orphan) receptor subunits,
which do not form functional channels. Adapted from Kalia et al. (2008).
16
Major structural features of AMPARs
AMPARs are expressed in the CNS as homo- or hetero-tetramers composed of the subunits
GluA1-4, each being encoded by a single gene (GRIA1-4). The first iGluR subunit to be
successfully cloned was GluA1, which showed noticeable differences compared to other ligand-
gated ion channel (LGIC) subunits known at the time, starting with an unprecedently large
molecular weight (Hollmann et al., 1989). AMPAR subunits range from 894 (GluA3) to 906
(GluA1) amino-acids in length and share 54% sequence identity, conferring GluA1-4 similar
topological and architectural features while permitting a considerable degree of flexibility in terms
of receptor dynamics and signalling (Traynelis et al., 2010).
1.5.1. Receptor topology
Like all iGluRs, AMPAR subunits have a complex topological organization with four semi-
autonomous domains. A large extracellular region, accounting for ~85% of the total subunit mass,
comprises an amino-terminal domain (NTD) and a ligand-binding domain (LBD). The
transmembrane domain (TMD) contributes to the channel pore and is linked to a short intracellular
C-terminal domain (CTD). The NTD, TMD and CTD layers are inter-connected by linker
sequences, allowing the relatively independent motion of the three domains and the mechanical
flexibility required for the conformational changes associated with receptor gating (Greger et al.,
2017). This modular architecture distinguishes iGluR subunits from most other ligand-gaited ion
channels, such as receptors of the cys-loop superfamily (Sine and Engel, 2006).
1.5.2. The amino-terminal domain (NTD)
The extracellular NTD is 400-450 residues in length, encompasses ~50% of the subunit
sequence and is encoded by 9 of the 16 exons comprised in the subunit coding sequence
(Herguedas et al., 2013). This bulky domain has a bilobate conformation with two large segments
folded in a clamshell-like structure (Figure 3A) (Jin et al., 2009). The first 14-33 residues of the
NTD constitutes a membrane-targeting signal peptide, cleaved following membrane insertion, and
accounting for the critical role of the NTD in surface expression of AMPA receptors (Traynelis et
al., 2010). The same excisable signal peptide has also been associated with a role in subunit-
specific assembly of AMPARs. Notably, the nature of this sequence in GluA1 would dictate the
assembly pattern and spatial organization of heteromeric GluA1/GluA2 receptors (He et al., 2016).
17
In heterologous systems, GluA subunits lacking their NTD can assemble into functional ion
channels but have altered gating kinetics, suggesting that AMPAR NTDs are not required for
receptor function but play important modulatory roles (Pasternack et al., 2002). Furthermore, the
NTD contains binding sites for a vast array of extracellular interactors and plays a critical role in
synaptic targeting of the ion channels (Greger et al., 2017; Herguedas et al., 2013; Traynelis et al.,
2010;(Díaz-Alonso et al., 2017). iGluR NTDs were found to display a high degree of sequence
homology with the LBD of a metabotropic glutamate receptor (mGluR1a) and bacterial proteins
such as the leucine/isoleucine/valine binding protein (LIVBP), suggesting a putative role of the
NTD in providing a ligand-binding pocket for endogenous ligands (Traynelis et al., 2010)
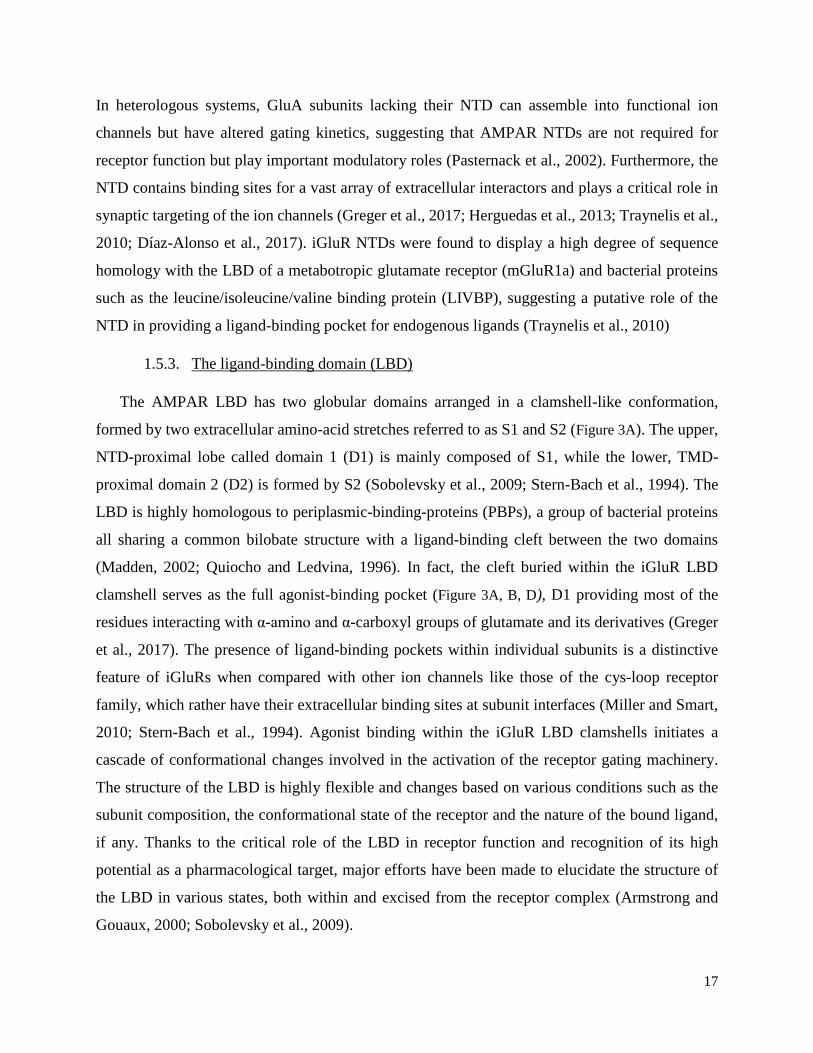
1.5.3. The ligand-binding domain (LBD)
The AMPAR LBD has two globular domains arranged in a clamshell-like conformation,
formed by two extracellular amino-acid stretches referred to as S1 and S2 (Figure 3A). The upper,
NTD-proximal lobe called domain 1 (D1) is mainly composed of S1, while the lower, TMD-
proximal domain 2 (D2) is formed by S2 (Sobolevsky et al., 2009; Stern-Bach et al., 1994). The
LBD is highly homologous to periplasmic-binding-proteins (PBPs), a group of bacterial proteins
all sharing a common bilobate structure with a ligand-binding cleft between the two domains
(Madden, 2002; Quiocho and Ledvina, 1996). In fact, the cleft buried within the iGluR LBD
clamshell serves as the full agonist-binding pocket (Figure 3A, B, D), D1 providing most of the
residues interacting with α-amino and α-carboxyl groups of glutamate and its derivatives (Greger
et al., 2017). The presence of ligand-binding pockets within individual subunits is a distinctive
feature of iGluRs when compared with other ion channels like those of the cys-loop receptor
family, which rather have their extracellular binding sites at subunit interfaces (Miller and Smart,
2010; Stern-Bach et al., 1994). Agonist binding within the iGluR LBD clamshells initiates a
cascade of conformational changes involved in the activation of the receptor gating machinery.
The structure of the LBD is highly flexible and changes based on various conditions such as the
subunit composition, the conformational state of the receptor and the nature of the bound ligand,
if any. Thanks to the critical role of the LBD in receptor function and recognition of its high
potential as a pharmacological target, major efforts have been made to elucidate the structure of
the LBD in various states, both within and excised from the receptor complex (Armstrong and
Gouaux, 2000; Sobolevsky et al., 2009).
18
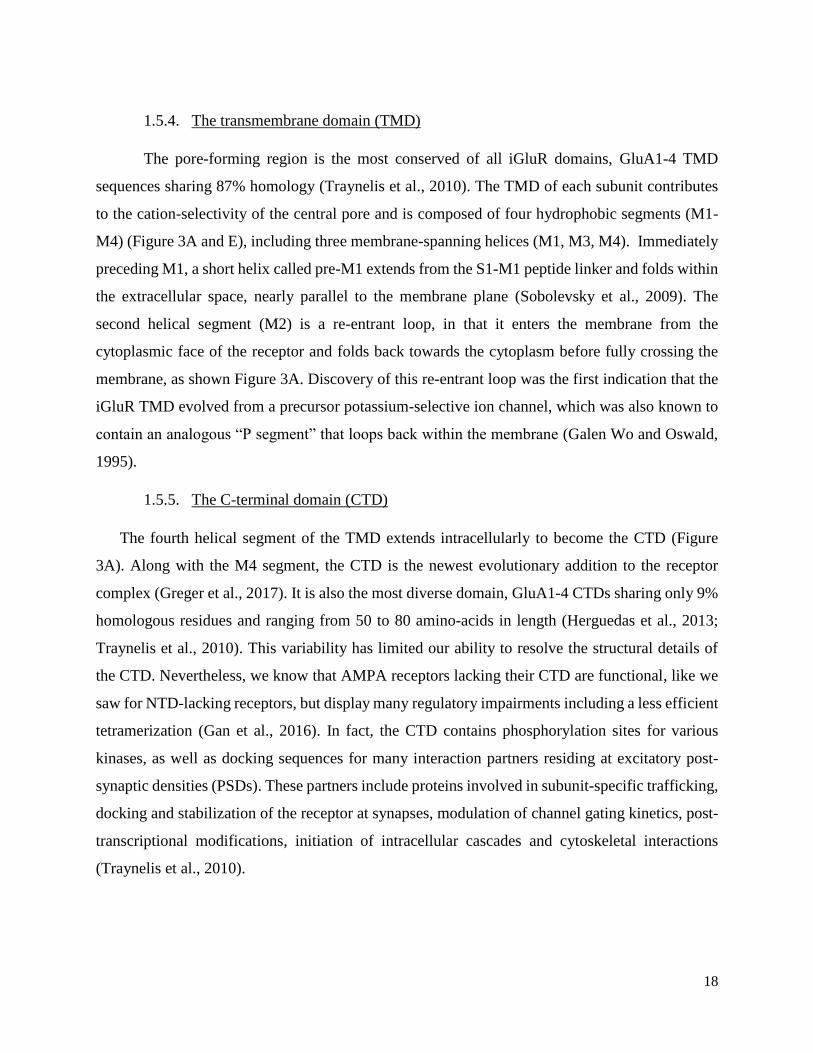
1.5.4. The transmembrane domain (TMD)
The pore-forming region is the most conserved of all iGluR domains, GluA1-4 TMD
sequences sharing 87% homology (Traynelis et al., 2010). The TMD of each subunit contributes
to the cation-selectivity of the central pore and is composed of four hydrophobic segments (M1-
M4) (Figure 3A and E), including three membrane-spanning helices (M1, M3, M4). Immediately
preceding M1, a short helix called pre-M1 extends from the S1-M1 peptide linker and folds within
the extracellular space, nearly parallel to the membrane plane (Sobolevsky et al., 2009). The
second helical segment (M2) is a re-entrant loop, in that it enters the membrane from the
cytoplasmic face of the receptor and folds back towards the cytoplasm before fully crossing the
membrane, as shown Figure 3A. Discovery of this re-entrant loop was the first indication that the
iGluR TMD evolved from a precursor potassium-selective ion channel, which was also known to
contain an analogous “P segment” that loops back within the membrane (Galen Wo and Oswald,
1995).
1.5.5. The C-terminal domain (CTD)
The fourth helical segment of the TMD extends intracellularly to become the CTD (Figure
3A). Along with the M4 segment, the CTD is the newest evolutionary addition to the receptor
complex (Greger et al., 2017). It is also the most diverse domain, GluA1-4 CTDs sharing only 9%
homologous residues and ranging from 50 to 80 amino-acids in length (Herguedas et al., 2013;
Traynelis et al., 2010). This variability has limited our ability to resolve the structural details of
the CTD. Nevertheless, we know that AMPA receptors lacking their CTD are functional, like we
saw for NTD-lacking receptors, but display many regulatory impairments including a less efficient
tetramerization (Gan et al., 2016). In fact, the CTD contains phosphorylation sites for various
kinases, as well as docking sequences for many interaction partners residing at excitatory post-
synaptic densities (PSDs). These partners include proteins involved in subunit-specific trafficking,
docking and stabilization of the receptor at synapses, modulation of channel gating kinetics, post-
transcriptional modifications, initiation of intracellular cascades and cytoskeletal interactions
(Traynelis et al., 2010).
19
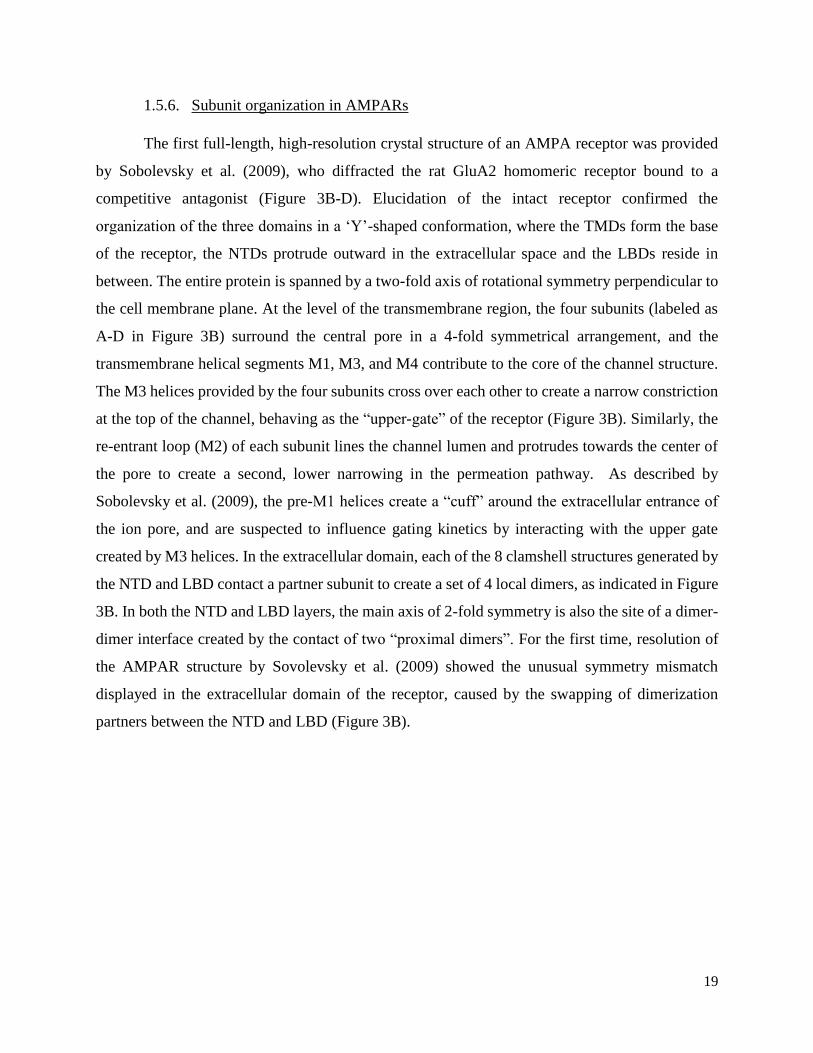
1.5.6. Subunit organization in AMPARs
The first full-length, high-resolution crystal structure of an AMPA receptor was provided
by Sobolevsky et al. (2009), who diffracted the rat GluA2 homomeric receptor bound to a
competitive antagonist (Figure 3B-D). Elucidation of the intact receptor confirmed the
organization of the three domains in a ‘Y’-shaped conformation, where the TMDs form the base
of the receptor, the NTDs protrude outward in the extracellular space and the LBDs reside in
between. The entire protein is spanned by a two-fold axis of rotational symmetry perpendicular to
the cell membrane plane. At the level of the transmembrane region, the four subunits (labeled as
A-D in Figure 3B) surround the central pore in a 4-fold symmetrical arrangement, and the
transmembrane helical segments M1, M3, and M4 contribute to the core of the channel structure.
The M3 helices provided by the four subunits cross over each other to create a narrow constriction
at the top of the channel, behaving as the “upper-gate” of the receptor (Figure 3B). Similarly, the
re-entrant loop (M2) of each subunit lines the channel lumen and protrudes towards the center of
the pore to create a second, lower narrowing in the permeation pathway. As described by
Sobolevsky et al. (2009), the pre-M1 helices create a “cuff” around the extracellular entrance of
the ion pore, and are suspected to influence gating kinetics by interacting with the upper gate
created by M3 helices. In the extracellular domain, each of the 8 clamshell structures generated by
the NTD and LBD contact a partner subunit to create a set of 4 local dimers, as indicated in Figure
3B. In both the NTD and LBD layers, the main axis of 2-fold symmetry is also the site of a dimer-
dimer interface created by the contact of two “proximal dimers”. For the first time, resolution of
the AMPAR structure by Sovolevsky et al. (2009) showed the unusual symmetry mismatch
displayed in the extracellular domain of the receptor, caused by the swapping of dimerization
partners between the NTD and LBD (Figure 3B).
20
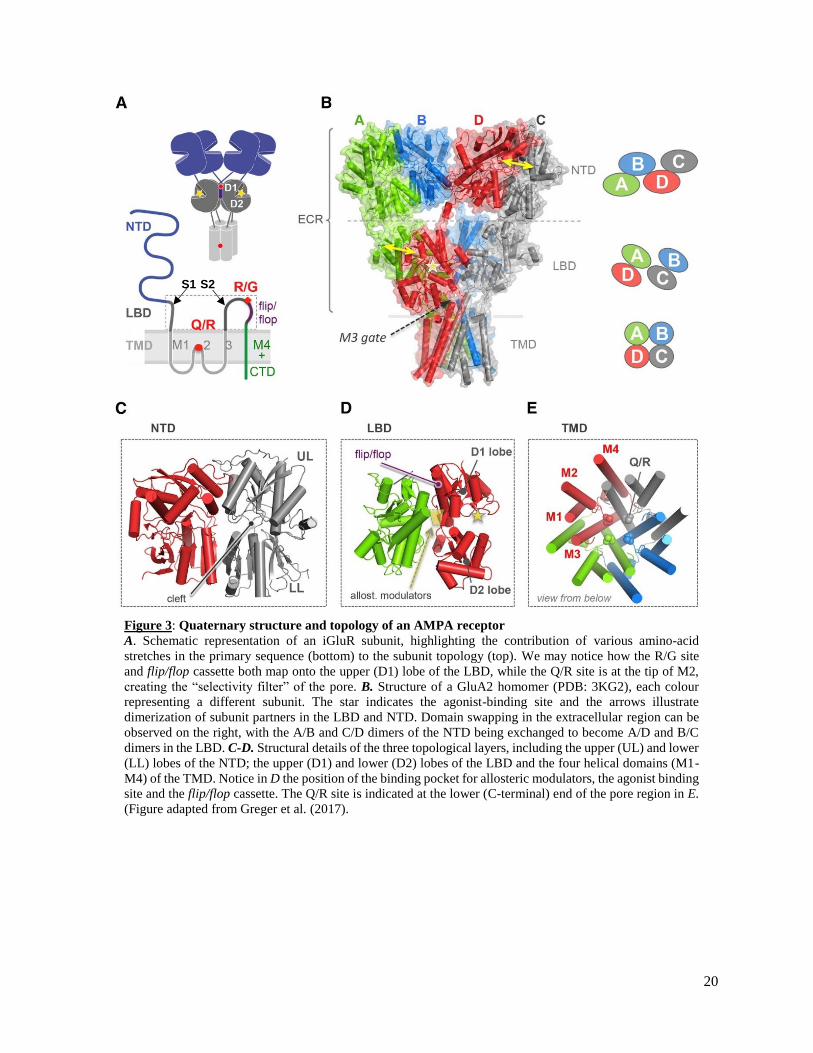
Figure 3: Quaternary structure and topology of an AMPA receptor
A. Schematic representation of an iGluR subunit, highlighting the contribution of various amino-acid
stretches in the primary sequence (bottom) to the subunit topology (top). We may notice how the R/G site
and flip/flop cassette both map onto the upper (D1) lobe of the LBD, while the Q/R site is at the tip of M2,
creating the “selectivity filter” of the pore. B. Structure of a GluA2 homomer (PDB: 3KG2), each colour
representing a different subunit. The star indicates the agonist-binding site and the arrows illustrate
dimerization of subunit partners in the LBD and NTD. Domain swapping in the extracellular region can be
observed on the right, with the A/B and C/D dimers of the NTD being exchanged to become A/D and B/C
dimers in the LBD. C-D. Structural details of the three topological layers, including the upper (UL) and lower
(LL) lobes of the NTD; the upper (D1) and lower (D2) lobes of the LBD and the four helical domains (M1-
M4) of the TMD. Notice in D the position of the binding pocket for allosteric modulators, the agonist binding
site and the flip/flop cassette. The Q/R site is indicated at the lower (C-terminal) end of the pore region in E.
(Figure adapted from Greger et al. (2017).
S1 S2
21
Molecular diversity of AMPAR subunits
AMPAR subunits are subject to post-transcriptional modifications that provide a major
contribution to their functional diversity. Once transcription is completed, pre-mRNA transcripts
undergo alternative splicing of exons 14 and 15, encoding a protein region immediately preceding
the M4 transmembrane helical segment (Figure 3A) (Sommer et al., 1990). The splicing event
results in two subunit isoforms called the flip (GluAi) and flop (GluAo) variants, which
functionally differ in many ways. Notably, the alternatively spliced region includes a portion of
the LBD intra-dimer interface, which plays a central role in the receptor gating machinery, and
comprises a binding site for allosteric modulators (Figure 3D). As a result, the two splice isoforms
have distinct gating kinetics and sensitivities to pharmacological compounds such as the positive
allosteric modulator cyclothiazide (Mosbacher et al., 1994; Partin et al., 1996). Alternative splicing
of the flip/flop cassette was also shown to influence of variety of processes including subunit
assembly and trafficking, and to regulate functional interactions between AMPARs and auxiliary
proteins at synapses (Greger et al., 2017; Kott et al., 2007).
The AMPAR GluA2 subunit is also subject to mRNA editing at the Q/R site, localized at
the apex of the M2 re-entrant loop (Figure 3A). As previously mentioned, the four M2 segments
create a narrow gate within the pore channel, constricting the ion-permeation pathway. The
glutamine (Q)-to-arginine (R) editing event at this site incorporates a positive charge that
electrostatically hinders the permeation of divalent cations such as Ca2+, thus acting as an ion-
selectivity filter (Higuchi et al., 1993; Sobolevsky et al., 2009; Twomey et al., 2017). Editing takes
place in the majority ( > 99%) of GluA2 transcripts expressed in the CNS, making most GluA2-
containing AMPARs calcium-impermeable (Sommer et al., 1990). GluA2(R) receptors were also
shown to have a reduced unitary conductance and sensitivity to channel block by positively
charged polyamines, compared with GluA2-lacking (or GluA2(Q)-containing) receptors (Bowie
and Mayer, 1995; Swanson et al., 1997). Interestingly, mRNA editing also takes place at the
equivalent site in KAR subunits (GluK1 and GluK2), but to a lesser degree and in a
developmentally regulated manner (Bernard et al., 1999).
Finally, the AMPAR subunits GluA2-4 are also subject to mRNA editing at the so-called
R/G site, which is adjacent to the alternatively spliced flip/flop site in the lower (D2) lobe of the
22
LBD (Figure 3A). R/G editing occurs in ~30% of both splice isoforms in a developmentally
regulated manner, and has a noticeable influence on gating kinetics (Lomeli et al., 1994).
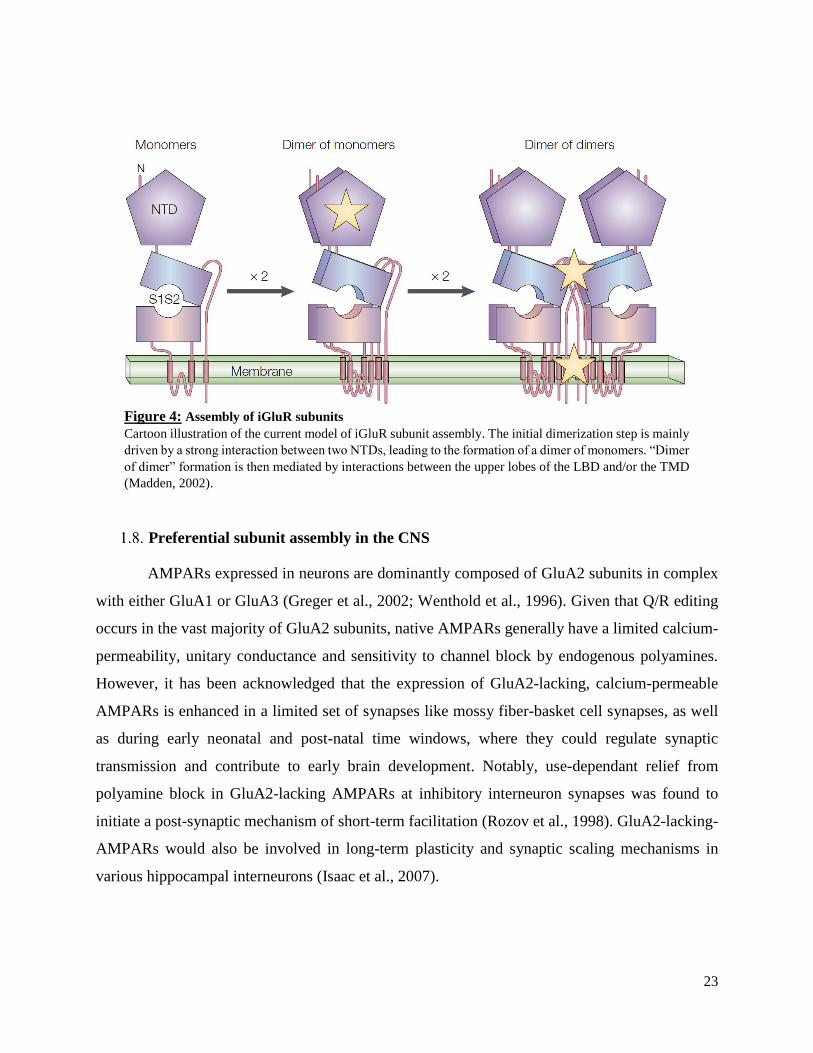
Subunit assembly and stoichiometry
iGluRs were initially thought to assemble as pentamers, like members of the cys-loop
receptor family (Blackstone et al., 1992; Changeux et al., 1987). Electrophysiological studies
provided the first evidences of their tetrameric conformation, which was then confirmed by the
low-resolution electron microscopy images of single AMPAR particles (Safferling et al., 2001),
followed by the first high resolution crystal structure of the full-length receptor (Sobolevsky et al.,
2009). The currently proposed mechanism of subunit assembly involves a defined role of the NTD,
LBD and TMD at different stages of biogenesis (Gan et al., 2015). According to this model, the
NTD mediates an initial dimerization step between two subunit monomers. The two LBDs are also
thought to form a transient interaction at this stage. Tetramerization occurs by the subsequent
pairing of two dimers via interaction of the TMDs and LBDs (Figure 4). At some point during the
process, the LBDs exchange their local dimerization partners while the NTDs remain unchanged,
creating the extracellular “domain swapping” observed by Sobolevsky et al. (2009) in the AMPAR
crystal structure. Like most other transmembrane receptors, this assembly process takes pace in
the endoplasmic reticulum (ER). Once the receptors assembled, a series of quality control
mechanisms and conformational rearrangements take place in the ER to ensure receptor integrity
before being fully exported and trafficked to the membrane (Traynelis et al., 2010). The role of
accessory proteins in regulating AMPAR trafficking and synaptic targeting will be discussed in
section 3.
23
Figure 4: Assembly of iGluR subunits
Cartoon illustration of the current model of iGluR subunit assembly. The initial dimerization step is mainly
driven by a strong interaction between two NTDs, leading to the formation of a dimer of monomers. “Dimer
of dimer” formation is then mediated by interactions between the upper lobes of the LBD and/or the TMD
(Madden, 2002).
Preferential subunit assembly in the CNS
AMPARs expressed in neurons are dominantly composed of GluA2 subunits in complex
with either GluA1 or GluA3 (Greger et al., 2002; Wenthold et al., 1996). Given that Q/R editing
occurs in the vast majority of GluA2 subunits, native AMPARs generally have a limited calcium-
permeability, unitary conductance and sensitivity to channel block by endogenous polyamines.
However, it has been acknowledged that the expression of GluA2-lacking, calcium-permeable
AMPARs is enhanced in a limited set of synapses like mossy fiber-basket cell synapses, as well
as during early neonatal and post-natal time windows, where they could regulate synaptic
transmission and contribute to early brain development. Notably, use-dependant relief from
polyamine block in GluA2-lacking AMPARs at inhibitory interneuron synapses was found to
initiate a post-synaptic mechanism of short-term facilitation (Rozov et al., 1998). GluA2-lacking-
AMPARs would also be involved in long-term plasticity and synaptic scaling mechanisms in
various hippocampal interneurons (Isaac et al., 2007).
24
2. Principles of LGIC gating
Electrophysiological correlates of ion channel behavior
As their name implies, ion channels facilitate the passage of ions across cell membranes in
a selective, transient and inducible manner. Historically, electrophysiological techniques have
been used to measure and characterize functional properties of ion channels at two major
conceptual levels: permeation and gating. Permeation relates to the influx of ions across the
channel pore, which can be quantified in units of electrical currents (the movement of charges per
unit of time unit, or Amperes). On the other hand, gating refers to the process by which an ion
channel enters and exits this permeating state, which may involve a series of conformational
changes (Horn, 1990). When studying the gating behavior of multiple channels in an isolated patch
of membrane, it is assumed that the measured macroscopic response results from the concerted
action of a population of ion channels that are functionally similar and independent from each
other. This assumption allows us to relate macroscopic currents of channel populations (I) to
microscopic, unitary currents of single channels (i) as followed: I = N*Po*i, where N is the number
of channels in the patch contributing to the response, and Po is the average probability of a channel
being open at any time (or the rate at which a channel accesses the open state) (Horn, 1990; W.
Aldrich, 1989).
State model of channel gating
In LGICs, the energy required to drive gating is provided by the binding of one or multiple
agonist molecules. Kinetic models used to describe the gating process arose from the early
comparison of LGICs to soluble enzymes, as we appreciated that they could similarly “catalyze”
the permeation of ions across lipid bilayers and displayed substrate specificity. As for enzymatic
processes, channels were believed to exist in one of multiple possible states, in a kinetic
equilibrium that could be modulated by ligand occupancy (Andersen and Koeppe, 1992). In this
regard, agonist binding would decrease the energy barrier required to achieve, or gate to, the open
conformational state. This principle implies a distinction between agonist binding and channel
activation. The fact that ion channels can generate measurable currents in the absence of ligands
confirms the idea that the agonist-bound and activated states are indeed separable from each other
(Auerbach, 2015; Tureček et al., 1997).
25
The concept of LGICs existing in various possible reversible states can be used as a
foundation to describe their basic gating behaviors and pharmacological properties. Receptor
activation involves the transition from a closed (ion-impermeable) state to an open (conducting)
state. This transition is reversible: ion channels can move back to the closed state through a process
called deactivation (Hinard et al., 2016). The transition from the open to the deactivated state is
driven or facilitated by the binding and unbinding of agonist molecules, respectively. Once
activated, LGICs can also transit to a paradoxical state where the channel gate is closed while the
agonist remains bound. This is the desensitized state, since the receptor is no longer sensitive to
the presence of bound ligands (Plested, 2016). While deactivation and desensitization both involve
the transition of the channel to a closed or non-conducting state, they are two distinct gating
processes involving different conformational changes. In an ensemble (macroscopic) response,
desensitization is manifested as a progressive attenuation in the peak current amplitude with a
prolonged agonist application (Keramidas and Lynch, 2013).
Channel pharmacology: terminology
Pharmacological ligands can modulate the transition of LGCIs across various states, and
agonists have the ability to push the state equilibrium towards the open conformation. The potency
of an agonist can be measured by the size of the channel response initiated after binding. Potency
must be defined in terms of two parameters: affinity, which is the strength of the ligand-receptor
association; and efficacy, or the ability of a drug to induce a response. By definition, partial
agonists have a low relative efficacy, in that they can only initiate submaximal responses at
saturating concentrations (controlling for affinity) compared to maximally efficacious agonists,
while antagonists have a null efficacy (Stephenson, 1956).
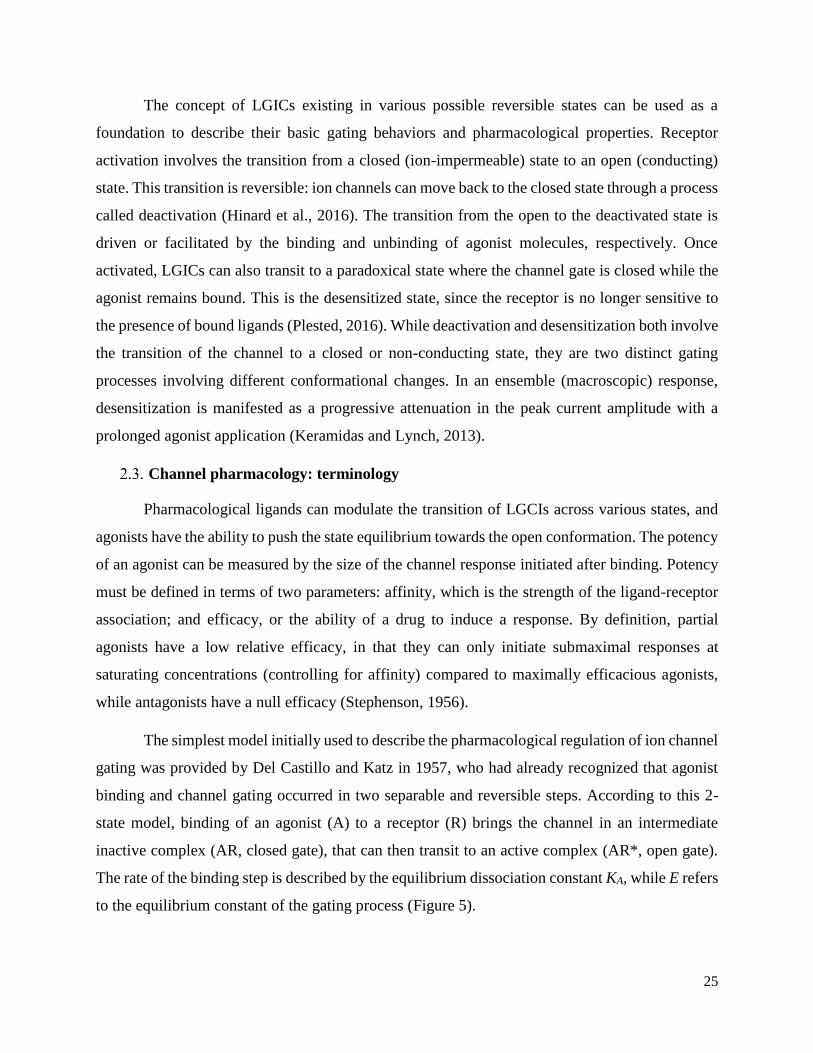
The simplest model initially used to describe the pharmacological regulation of ion channel
gating was provided by Del Castillo and Katz in 1957, who had already recognized that agonist
binding and channel gating occurred in two separable and reversible steps. According to this 2-
state model, binding of an agonist (A) to a receptor (R) brings the channel in an intermediate
inactive complex (AR, closed gate), that can then transit to an active complex (AR*, open gate).
The rate of the binding step is described by the equilibrium dissociation constant KA, while E refers
to the equilibrium constant of the gating process (Figure 5).
26
Figure 5
Two-state model proposed by Del Castillo and Katz (1957) to describe gating of LGICs (Colquhoun,
1998).
The same model can be used to conceptualize the principles of LGIC pharmacology.
Potency is the ability of an agonist (A) to bring a receptor in its active state (AR*). It is defined
both at the binding step through its affinity (KA), and at the gating step through its efficacy, or the
rate (E) at which it can make the receptor transit to the active state (Colquhoun, 1998).
Concerted vs sequential models of receptor activation
Given that iGluRs are made of multiple subunits, each containing an individual agonist-
binding site, a reasonable question to ask is whether the receptor complex has one or multiple
possible active states. Historically, these two alternative cases were described by the Monod-
Wyman-Changeux (MWC, or concerted) and the Koshlabnd-Nemethy-Filmer (KNF, or
sequential) models, respectively (Koshland et al., 1966; Monod et al., 1965). In the MWC model,
all subunits behave in a concerted manner while shifting between two possible states: active or
inactive. As agonist concentration and the ratio of subunit occupancy increase, the receptor
equilibrium is pushed towards the active state, which is accessed at an increasingly faster rate. In
the KNF model, the binding of an agonist molecule to each individual subunit induces a distinct
activated conformation. In the case of iGluRs, this implies that occupancy of the four subunits
leads to a maximal conductance state, while various degrees of partial occupancy generate
intermediate or sub-maximal conductance states. Evidence suggests that AMPA receptors follow
the second model. In fact, single-channel recordings on recombinantly expressed AMPA receptors
revealed the presence of at least two intrinsic sub-conductance levels in addition to one maximal
conductance state, which are progressively accessed with incremental subunit occupancies
(Rosenmund et al., 1998). Provided that a channel can have multiple active states, partial agonists
could have a lower efficacy by favoring intermediate states rather than the maximally conducting
27
one. This was demonstrated by Jin et al. (2003), who showed that partial agonists of AMPARs
have greater opening probabilities (Po) for submaximal states.
Structural and biophysical correlates of AMPAR gating
Various approaches have been used to study the gating machinery of AMPA receptors,
including structure-function studies that mainly focused on the core functional elements of the
receptor: the LBD and TMD. The mechanisms underlying the translation of agonist binding into
opening of the ion-channel pore will be discussed here.
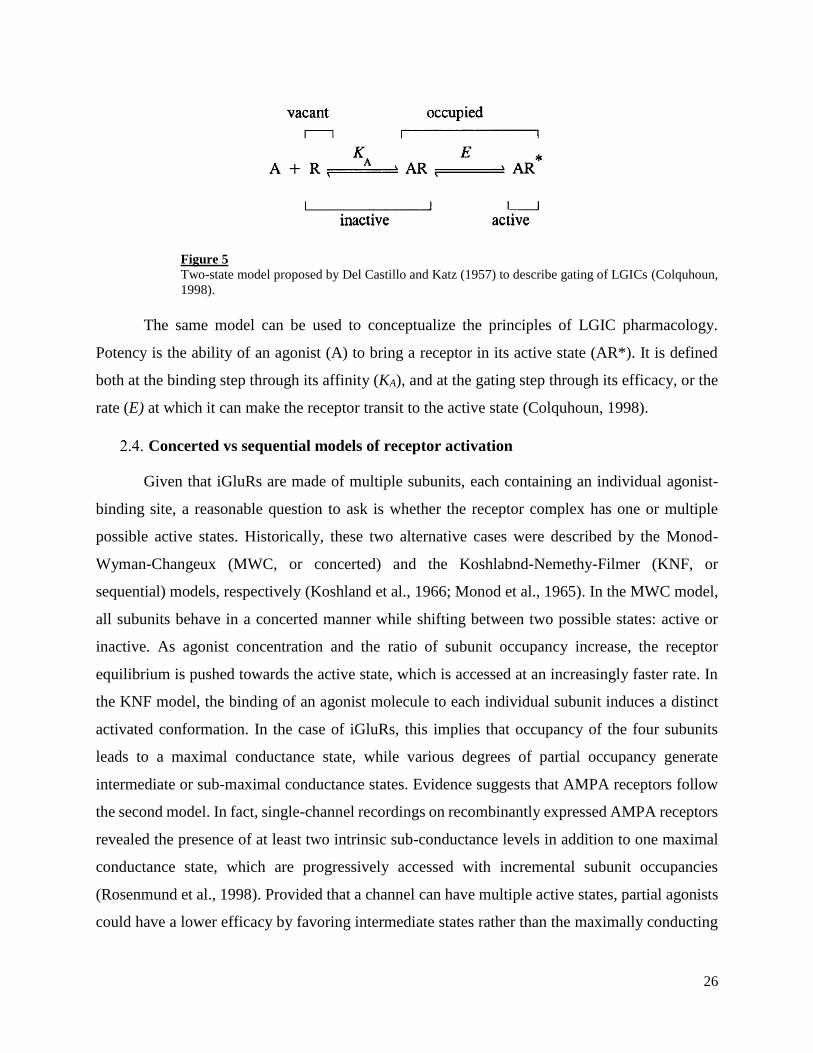
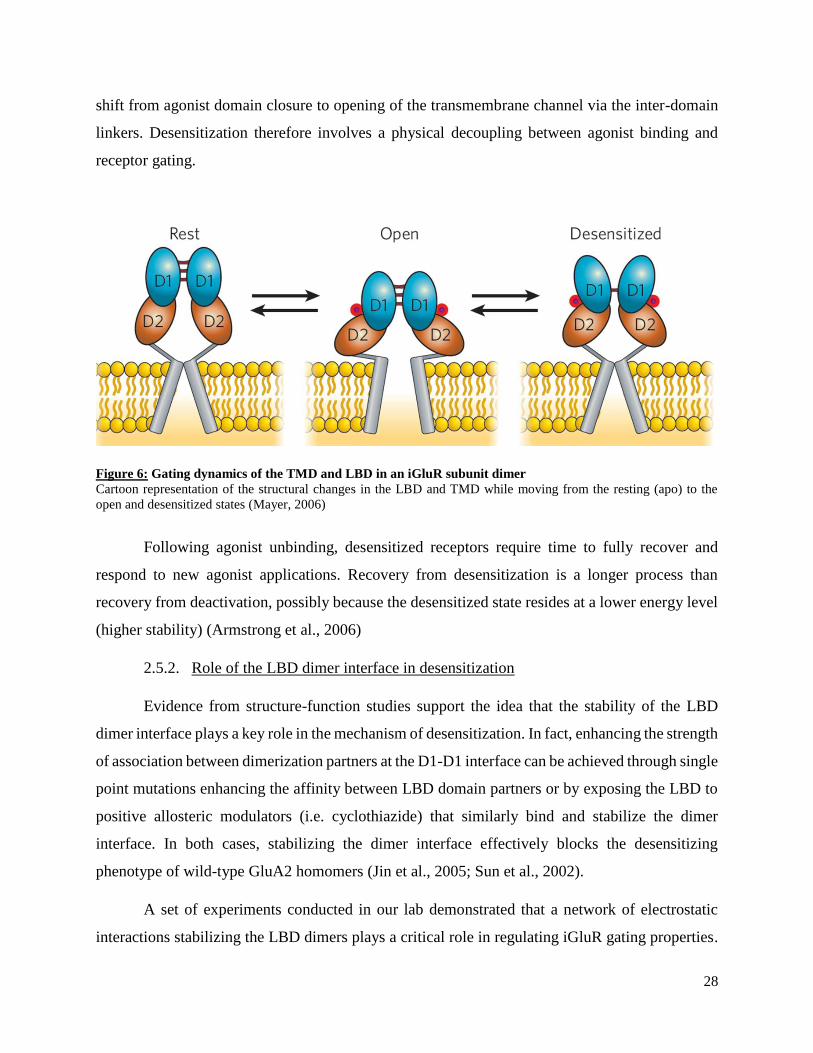
2.5.1. Mechanism of activation and desensitization
Like in members of the bacterial binding protein (PBP) family, agonist docking at the inter-
lobe cleft of an iGluR LBD triggers closure of the clamshell-like structure around the agonist in a
motion analogous to that of a ‘Venus flytrap’ (Quiocho and Ledvina, 1996). As mentioned earlier,
the assembly of AMPAR subunits involves the formation of two dimers, such that each LBD
interacts back-to-back with the LBD of an adjacent subunit. The dimer interface between the two
LBDs maps onto the upper (D1) lobes (Figure 3A), and is created by a network of hydrophobic
contacts, hydrogen bonds and salt bridges. Clamshell closure following agonist binding is thought
induce separation of the lower (D2) lobes, which are free to move, while the D1-D1 interfaces
remain intact. The motion of the lower lobes is then transduced in the opening of the channel gate
via a ‘scissors-like’, outward motion of the S2-M3 peptide linkers between the LBD and TMD
(Figure 6), (Mayer, 2006). Hypothetically, deactivation would occur following agonist unbinding,
triggering the reverse pathway and bringing the receptor back to a ligand-free, closed (though non-
desensitized) state (Sun et al., 2002).
With a prolonged exposure to extracellular agonists, the receptor moves from an open state
to an agonist-bound, non-conductive state in a process called desensitization. It is hypothesized
that desensitization involves structural rearrangement of the LBD dimer interfaces. Specifically, a
sustained agonist residency within the binding cleft decreases the stability of the dimer interface
between the D1 lobes of adjacent subunits. The D1 lobes would rotate away from each other,
relieving the strain imposed on the S2-M3 linkers between the LBD and TMD and closing the
upper gate of the channel (Figure 6), (Mayer, 2006). According to Sun et al. (2002), the structural
changes in the LBD of a desensitizing receptor prevent further transmission of a conformational
28
shift from agonist domain closure to opening of the transmembrane channel via the inter-domain
linkers. Desensitization therefore involves a physical decoupling between agonist binding and
receptor gating.
Figure 6: Gating dynamics of the TMD and LBD in an iGluR subunit dimer
Cartoon representation of the structural changes in the LBD and TMD while moving from the resting (apo) to the
open and desensitized states (Mayer, 2006)
Following agonist unbinding, desensitized receptors require time to fully recover and
respond to new agonist applications. Recovery from desensitization is a longer process than
recovery from deactivation, possibly because the desensitized state resides at a lower energy level
(higher stability) (Armstrong et al., 2006)
2.5.2. Role of the LBD dimer interface in desensitization
Evidence from structure-function studies support the idea that the stability of the LBD
dimer interface plays a key role in the mechanism of desensitization. In fact, enhancing the strength
of association between dimerization partners at the D1-D1 interface can be achieved through single
point mutations enhancing the affinity between LBD domain partners or by exposing the LBD to
positive allosteric modulators (i.e. cyclothiazide) that similarly bind and stabilize the dimer
interface. In both cases, stabilizing the dimer interface effectively blocks the desensitizing
phenotype of wild-type GluA2 homomers (Jin et al., 2005; Sun et al., 2002).
A set of experiments conducted in our lab demonstrated that a network of electrostatic
interactions stabilizing the LBD dimers plays a critical role in regulating iGluR gating properties.
29
In KARs, a dipole interaction established by binding of a cation (with a counter anion) at an
electronegative pocket buried within D1-D1 dimer interfaces is required for receptor activation.
This dipole interaction would be essential to minimally stabilize the open conformation of agonist-
bound receptors, making cations and anions co-activators of kainate receptors (Wong et al., 2006;
Wong et al., 2007). In other words, even in the presence of agonists, an ion-free dimer interface
collapses and brings the receptor into an agonist-bound, inactive (or desensitized) state before the
channel gate has any time to open. AMPA receptors do not share such requirement of external ions
to gate, since a positively charged residue (Lys759 in GluA2) extends in the vicinity of the
corresponding electronegative pocket where it acts as a tethered cation (Bowie, 2002).
Nevertheless, lithium ions were modeled at the same site in a high-resolution X-ray crystal
structure of the GluA2 LBD (Assaf et al., 2013), meaning that, being the smallest monovalent
cation, lithium could access the “KAR cation site’’ in GluA2 and interfere with receptor gating. In
fact, GluA2 homomers exposed to high extracellular concentrations of lithium display a nearly
non-decaying response. The same study showed that disrupting the electrostatic network
stabilizing the apex of the LBD dimer interface profoundly increases the rate of desensitization,
which can be reversed to a non-decaying phenotype by the “adhesive” effect of cyclothiazide
binding between two LBD partners (Dawe et al., 2016). The role of the LBD dimer interfaces in
regulating the time course of AMPA receptor activity is further highlighted by changes in
desensitization kinetics resulting from alternative splicing at the flip/flop cassette (Sommer et al.,
1990) and RNA editing at the R/G site (Lomeli et al., 1994), both of these editing events mapping
at D1-D1 contact points.
2.5.3. Structural basis of AMPA receptor subconductance states and agonist efficacy
As we saw, each receptor subunit has its own gating core structure, with a functional LBD
directly linked to the pore via the S2-M3 linker. We can therefore conceptualize how binding of
agonist in the LBD cleft of an individual subunit could induce partial opening of the channel, and
how activation of additional subunits could further increase the extent of channel opening,
resulting in multiple measurable conductance levels (Mayer, 2006). The fact that saturating
concentrations of different agonists do not all promote the same conductance states (Jin et al.,
2003) is an additional layer of complexity, since it implies that properties of the ligand itself can
influence the conductance state of the channel regardless of the number of subunits engaged. How
30
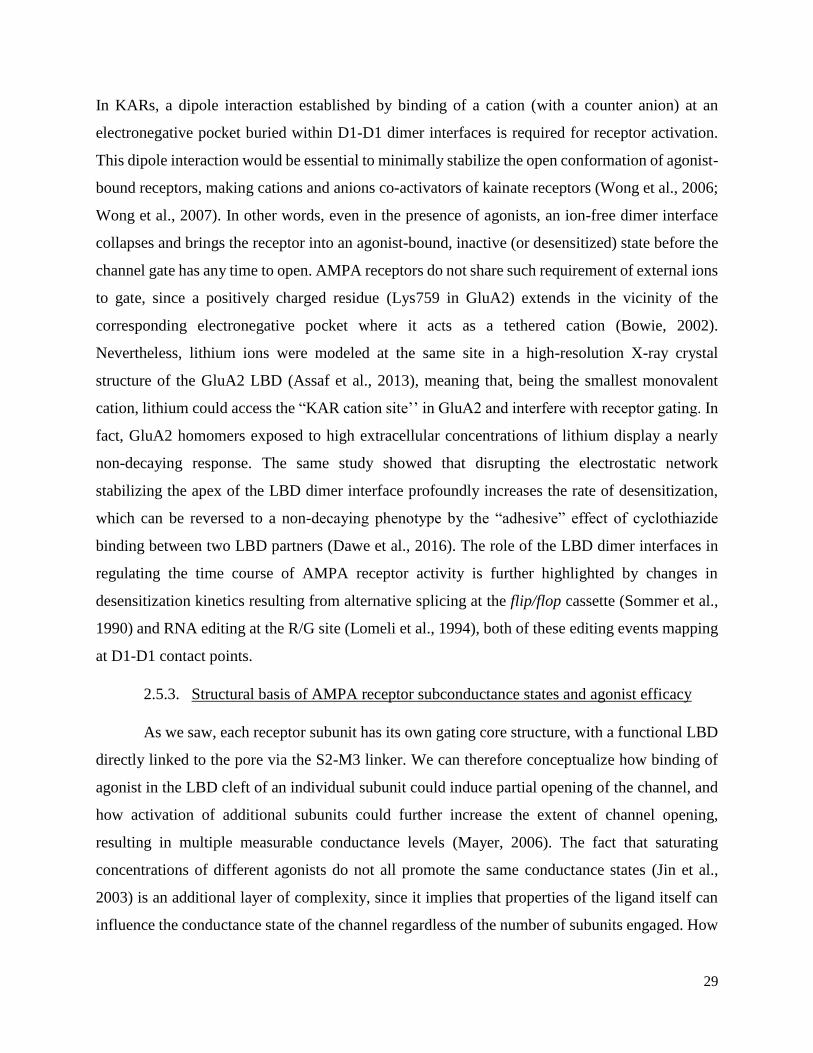
the nature of the agonist determines its efficacy in terms of transducing LBD cleft closure into the
opening of the channel gate is a currently puzzling question. It has been proposed that agonist
efficacy is associated with the degree of LBD cleft closure promoted by agonist binding, which
was supported by a series of structure-function studies and molecular dynamic analysis of AMPAR
LBD (Ahmed et al., 2011; Armstrong and Gouaux, 2000; Jin et al., 2003; Lau and Roux, 2011).
Notably, the neurotoxin kainate acts as a partial agonist in AMPARs by inducing submaximal and
nearly non-desensitizing currents at saturating concentrations (Figure 7) (Patneau and Mayer,
1991). Kainate was found to favor lower conductance states (Swanson et al., 1997) while inducing
a smaller degree of cleft closure (~12°) than full agonists like glutamate (~20°) (Figure 7, lower
panel) (Armstrong and Gouaux, 2000; Jin et al., 2003). An interesting relationship has also been
observed between the degree of LBD cleft closure and the extent of desensitization with a
prolonged exposure to various agonists. In fact, a larger cleft closure would increase the “tension”
at the LBD dimer interface, thus possibly priming the onset of desensitization (Traynelis et al.,
2010) which would explain why kainate-induced responses show little desensitization (Figure 7,
upper panel).
Figure 7: Relationship between LBD domain
closure and macroscopic responses.
Lower panel: isolated LBD domain structures
and degree of cleft closure associated with the
binding of kainate (left, PDB: 1FTK and 1FW0)
and glutamate (right, PDB: 1FTJ).
Upper panel: Typical macroscopic current
responses of AMPARs to kainate (left) and
glutamate (right). The lower degree of cleft
closure associated with kainate binding reduces
both the extent of activation (lowers the
macroscopic peak current amplitude) and
desensitization (Madden, 2002)
31
2.5.4. Determinants of macroscopic decay
Desensitization involves a reduction in the size of any response in the sustained presence
of a stimulus. For macroscopic responses generated by iGluRs, desensitization is described as the
reduction in the peak current amplitude of the ensemble response with a sustained agonist
application (Traynelis et al., 2010). In a typical recording, the response progressively decreases
over the time, to finally plateau at a residual and steady current amplitude that may persist until
the end of the agonist application period, as we can see in the two trace examples provided in
Figure 7 (Madden, 2002). The desensitization kinetics of a macroscopic response can be described
using exponential decay parameters and quantified with decay time constants (τ). The mean
amplitude of the residual (or steady-state) response relatively to the size of the initial peak response
before desensitization is also be used to describe the macroscopic equilibrium response. The size
of the relative equilibrium could given us an idea on the “extent” of macroscopic desensitization
(Sun et al., 2002). We should however keep in mind that, at the microscopic level, the mechanism
underlying the shift of individual receptors from a fully activated to a lower equilibrium state is
not fully elucidated and may involve structural changes that are independent from those governing
the process of desensitization.
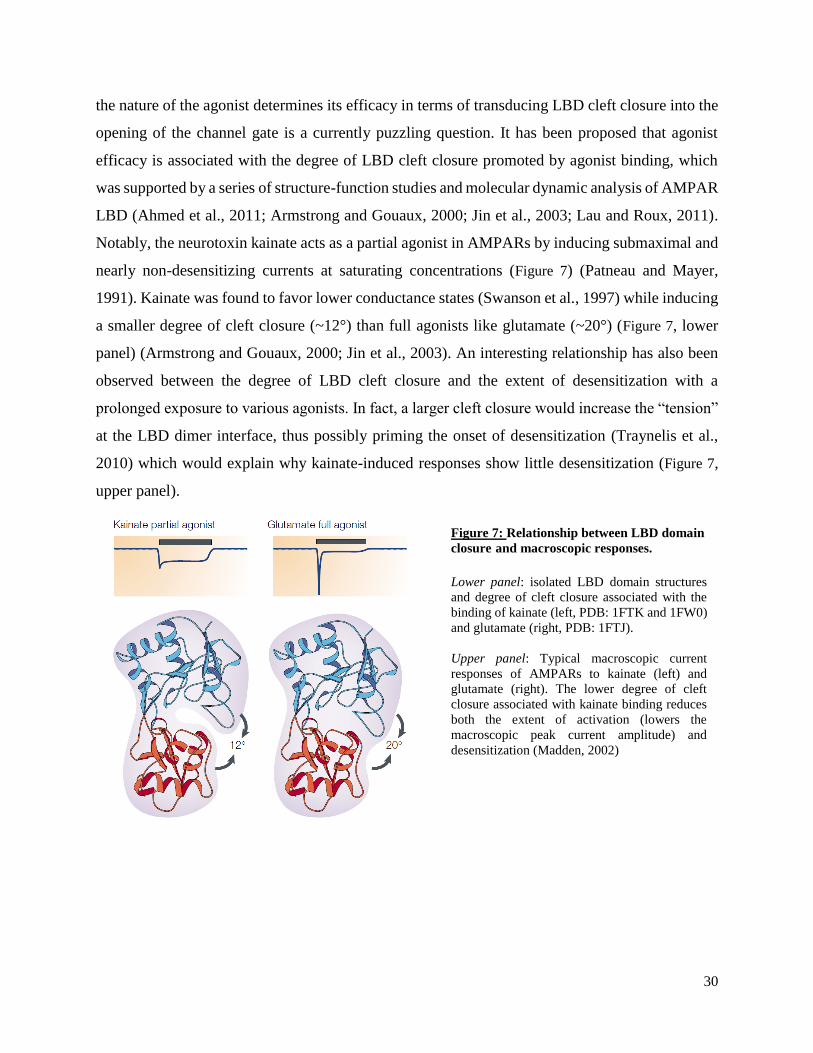
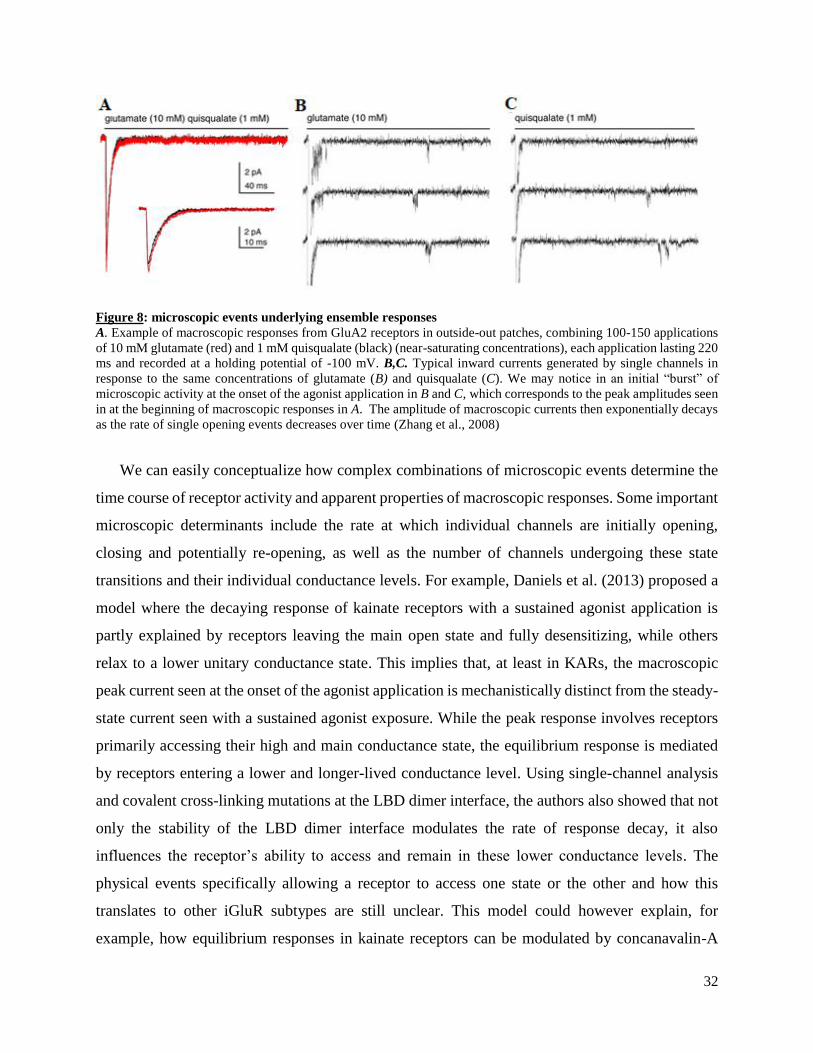
It should be mentioned that macroscopic desensitization combines a large number of
microscopic events in which individual channels are closing and re-opening at asynchronous times,
with different frequencies (Po) and at many possible conductance levels (i) (Traynelis and
Jaramillo, 1998). When studying the behavior of an individual GluA2 homomer in a heterologous
system (e.g. HEK 293 cells), we see a burst of openings near the onset of the agonist application
(Figure 8 B,C), each “burst” likely resulting from the sequential activation of individual subunits
and the rapid transition across multiple conductance states. The probability of activation of
individual channels (Po) is high at the beginning and progressively decreases until the end of the
agonist application (Zhang et al., 2008) which explains the exponentially decaying nature of
ensemble responses (Figure 8 A).
32
Figure 8: microscopic events underlying ensemble responses
A. Example of macroscopic responses from GluA2 receptors in outside-out patches, combining 100-150 applications
of 10 mM glutamate (red) and 1 mM quisqualate (black) (near-saturating concentrations), each application lasting 220
ms and recorded at a holding potential of -100 mV. B,C. Typical inward currents generated by single channels in
response to the same concentrations of glutamate (B) and quisqualate (C). We may notice in an initial “burst” of
microscopic activity at the onset of the agonist application in B and C, which corresponds to the peak amplitudes seen
in at the beginning of macroscopic responses in A. The amplitude of macroscopic currents then exponentially decays
as the rate of single opening events decreases over time (Zhang et al., 2008)
We can easily conceptualize how complex combinations of microscopic events determine the
time course of receptor activity and apparent properties of macroscopic responses. Some important
microscopic determinants include the rate at which individual channels are initially opening,
closing and potentially re-opening, as well as the number of channels undergoing these state
transitions and their individual conductance levels. For example, Daniels et al. (2013) proposed a
model where the decaying response of kainate receptors with a sustained agonist application is
partly explained by receptors leaving the main open state and fully desensitizing, while others
relax to a lower unitary conductance state. This implies that, at least in KARs, the macroscopic
peak current seen at the onset of the agonist application is mechanistically distinct from the steady-
state current seen with a sustained agonist exposure. While the peak response involves receptors
primarily accessing their high and main conductance state, the equilibrium response is mediated
by receptors entering a lower and longer-lived conductance level. Using single-channel analysis
and covalent cross-linking mutations at the LBD dimer interface, the authors also showed that not
only the stability of the LBD dimer interface modulates the rate of response decay, it also
influences the receptor’s ability to access and remain in these lower conductance levels. The
physical events specifically allowing a receptor to access one state or the other and how this
translates to other iGluR subtypes are still unclear. This model could however explain, for
example, how equilibrium responses in kainate receptors can be modulated by concanavalin-A
33
independently from peak responses (Bowie et al., 2003). Additionally, it highlights the concept
that macroscopic response decay should be treated as a complex combination of microscopic
events, including receptors exiting their main activated state and others re-opening to various
possible sub-conductance states.
2.5.5. Distinction between macroscopic deactivation and desensitization
AMPARs typically take somewhere between 1 ms (GluA2Q flop) and 5-10 ms (GluA2Q
flip) to fully desensitize following an initial agonist application (Koike et al., 2000; Priel et al.,
2005; Robert et al., 2005). Since desensitization is favored by the prolonged interaction of an
agonist in the LBD cleft, the probability that a receptor moves from the main open state to a
desensitized state increases over time. Macroscopic decay obtained from a very fast agonist
application (e.g. 1 ms on GluA2 flip) may therefore fail to accurately picture the behavior of
desensitizing channels, because the majority of receptors do not have time to do so by the end of
such a brief period. With brief “deactivating” pulses, macroscopic kinetics better reflect channel
inactivation caused by agonist unbinding (deactivation), which can vary based on agonist affinity.
In physiological systems, uniquantal synaptic release of glutamate triggers post-synaptic iGluR
activity that follows more closely recombinant responses to rapid deactivating pulses (1 ms) than
desensitizing pulses (250 ms) (Taschenberger et al., 1995). Despite the minimal desensitization
observable in such rapid pulses, we should not underestimate the impact of desensitization in
physiological systems. Many desensitization events are thought to occur after apparent agonist
removal, which is why it cannot be directly measured when taking each response individually
(Raman and Trussell, 1995). The accumulation of desensitized receptors becomes however
apparent with repeated pulses of agonists: when delivered at frequencies above 100 Hz, subsequent
responses display a progressively decreasing peak amplitude (Carbone and Plested, 2016)
2.5.6. Key kinetic parameters in AMPA receptors
AMPA receptors are characterized by fast gating kinetics as they undergo state transitions
within a 10 ms time-scale (Baranovic et al., 2016), contrasting with the slow gating properties of
NMDA receptors, which can take beyond a millisecond to activate and thousands of milliseconds
to deactivate (Traynelis et al., 2010). Reference values for some of the key kinetic parameters used
to describe the behavior of AMPA receptors have been reported across the literature and are listed
in table 1.
34
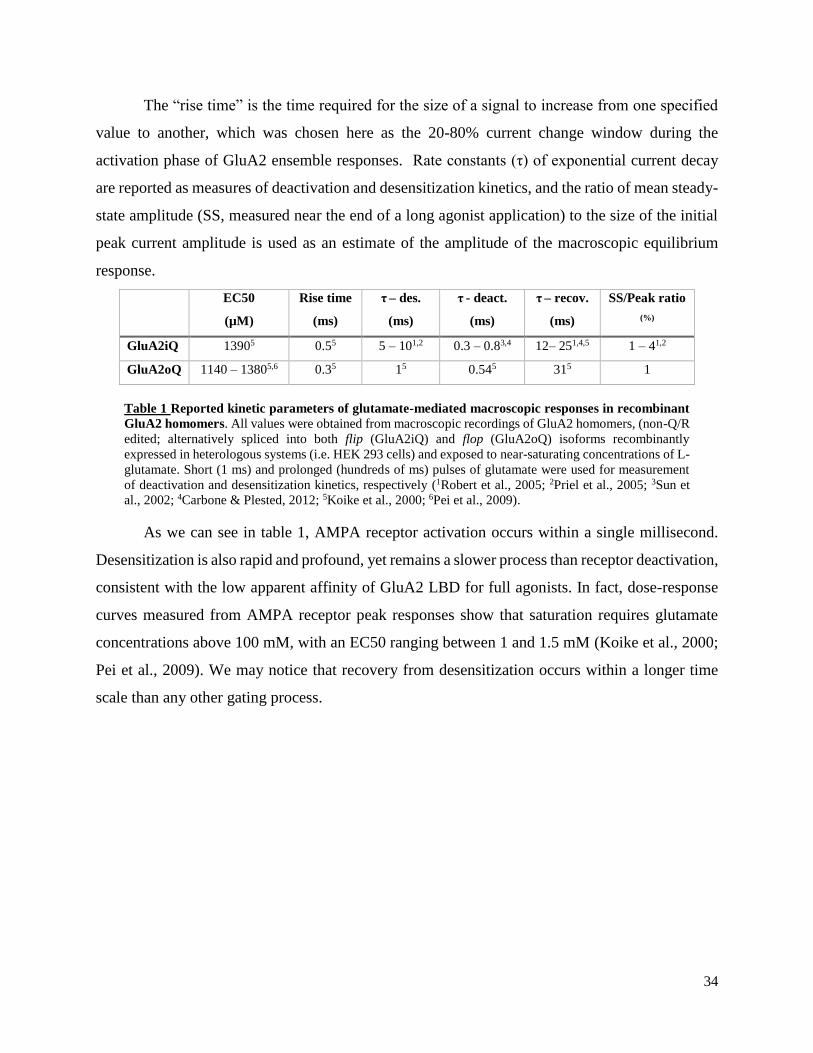
The “rise time” is the time required for the size of a signal to increase from one specified
value to another, which was chosen here as the 20-80% current change window during the
activation phase of GluA2 ensemble responses. Rate constants (τ) of exponential current decay
are reported as measures of deactivation and desensitization kinetics, and the ratio of mean steady-
state amplitude (SS, measured near the end of a long agonist application) to the size of the initial
peak current amplitude is used as an estimate of the amplitude of the macroscopic equilibrium
response.
Table 1 Reported kinetic parameters of glutamate-mediated macroscopic responses in recombinant
GluA2 homomers. All values were obtained from macroscopic recordings of GluA2 homomers, (non-Q/R
edited; alternatively spliced into both flip (GluA2iQ) and flop (GluA2oQ) isoforms recombinantly
expressed in heterologous systems (i.e. HEK 293 cells) and exposed to near-saturating concentrations of L-
glutamate. Short (1 ms) and prolonged (hundreds of ms) pulses of glutamate were used for measurement
of deactivation and desensitization kinetics, respectively (1Robert et al., 2005; 2Priel et al., 2005; 3Sun et
al., 2002; 4Carbone & Plested, 2012; 5Koike et al., 2000; 6Pei et al., 2009).
As we can see in table 1, AMPA receptor activation occurs within a single millisecond.
Desensitization is also rapid and profound, yet remains a slower process than receptor deactivation,
consistent with the low apparent affinity of GluA2 LBD for full agonists. In fact, dose-response
curves measured from AMPA receptor peak responses show that saturation requires glutamate
concentrations above 100 mM, with an EC50 ranging between 1 and 1.5 mM (Koike et al., 2000;
Pei et al., 2009). We may notice that recovery from desensitization occurs within a longer time
scale than any other gating process.
EC50
(µM)
Rise time
(ms)
τ – des.
(ms)
τ - deact.
(ms)
τ – recov.
(ms)
SS/Peak ratio
(%)
GluA2iQ 13905 0.55 5 – 101,2 0.3 – 0.83,4 12– 251,4,5 1 – 41,2
GluA2oQ 1140 – 13805,6 0.35 15 0.545 315 1
35
3. Overview of transmembrane auxiliary subunits of AMPARs
In the mammalian brain, AMPARs operate at synapses as part of large macromolecular
complexes comprising multiple protein constituents (Schwenk et al., 2009). The initial idea of an
association between native AMPARs and accessory proteins progressively arose with the recurrent
observation of a mismatch between AMPA receptor-mediated responses measured in recombinant
systems (Mosbacher et al., 1994) and those described at synapses, the latter being generally
characterized as slower and more robust (Colquhoun et al., 1992; Manabe and Nicoll, 1994).The
failure to reconstitute properties of synaptic responses in heterologous systems was attributed to
the association of native AMPARs with transmembrane auxiliary subunits, so-called based on their
ability to interact directly, stably and specifically with pore-forming subunits in vivo, while
modulating the functional properties and/or biogenesis of the channels (Jackson and Nicoll, 2011).
Efforts are currently made to understand how accessory proteins interact with iGluR subunits to
achieve these functional interactions and ultimately impact synaptic transmission. For AMPARs,
some of the main auxiliary subunits identified so far are listed in Figure 9; recent findings regarding
the specific role of transmembrane AMPAR regulatory proteins (TARPs), as well as the more
recently discovered family of protein cornichon homologs (CNIHs), will be addressed in the
present section.
Figure 9: General topology of an AMPAR subunit and its auxiliary subunits.
Representation of the GluA subunit (left) and important interacting auxiliary subunits, namely, TARP, CNIH2/3,
CKAMP44 and SynDIG1. Major structural differences between TARPs and CNIHs are shown: TARP is a tetra-
spanning protein with intracellular N- and C-terminal domains and two extracellular loops, while CNIH contains 3
transmembrane domains, an intracellular and extracellular N- and C- terminus, respectively, and only a single
extracellular loop. (Adapted from Jackson et al., 2011)
36
Transmembrane AMPA receptor regulatory proteins (TARPs)
3.1.1. Discovery and classification of TARPs
The first auxiliary subunit found to associate with a LGIC was discovered from a
spontaneous mutation underlying the pathological phenotypes of stargazer mutant mice, including
dyskinesia, ataxia, absence seizures and a characteristic head-tossing, or seemingly “star-gazing”
behavior (Letts et al., 1997; Noebels et al., 1990). Once isolated, the disrupted gene product was
named γ2 (stargazin) after its high sequence and topological homology to γ1 (Letts et al., 1998), a
then-known subunit of voltage-gated calcium channels expressed in skeletal muscles (Jay et al.,
1990). The first striking evidence of an association between γ2 and AMPARs was that despite
normal cerebellar GluA mRNA levels, stargazer mice displayed a near-complete loss of AMPAR-
mediated responses at cerebellar mossy fiber-granule cell synapses, which could be restored by
transfection of full-length recombinant stargazin (Chen et al., 2000). The role of stargazin in
AMPAR biogenesis was subsequently clarified through a series of findings highlighting its ability
to promote receptor export from the endoplasmic reticulum (ER) (Tomita et al., 2003;
Vandenberghe et al., 2005) to selectively enhance cell surface trafficking of GluA subunits (Chen
et al., 2003; Yamazaki et al., 2004) and to mediate anchoring of AMPAR at synapses through a
direct interaction with PDZ- domain-containing scaffolding proteins (Chen et al., 2000; Schnell et
al., 2002). Stargazin was found to be part of an extensive family of eight γ subunits initially
classified based on their sequence homology, with γ2, 3, 4 and 8 forming one main group, and γ5
and γ7, as well as γ1 and γ6 forming two additional sub-groups (Burgess et al., 1999; Burgess et
al., 2001). This original classification matched functional properties of gamma subunits uncovered
thereafter: subunits grouped with γ2 can also restore AMPAR-mediated currents in stargazer
through their ability to enhance AMPAR trafficking, in addition to positively modulate functional
properties of the receptors (Ben-Yaacov et al., 2017; Chen et al., 2003; Tomita et al., 2003). On
the other hand, γ5 and γ7 have limited and variable modulatory roles on AMPAR biogenesis and
function, while γ1 and γ6 make no functional association with AMPARs. The first (γ2, 3, 4, 8) and
second (γ5 and γ7) groups were thus recognized as primary (type-I) and secondary (type-II)
transmembrane AMPAR regulatory proteins (TARPs), respectively (Jackson and Nicoll, 2011). It
should be noted that all eight γ isoforms are also known auxiliary subunits of voltage-gated calcium
channels. This role is exclusive in the case of γ1 and γ6, both primarily expressed in skeletal
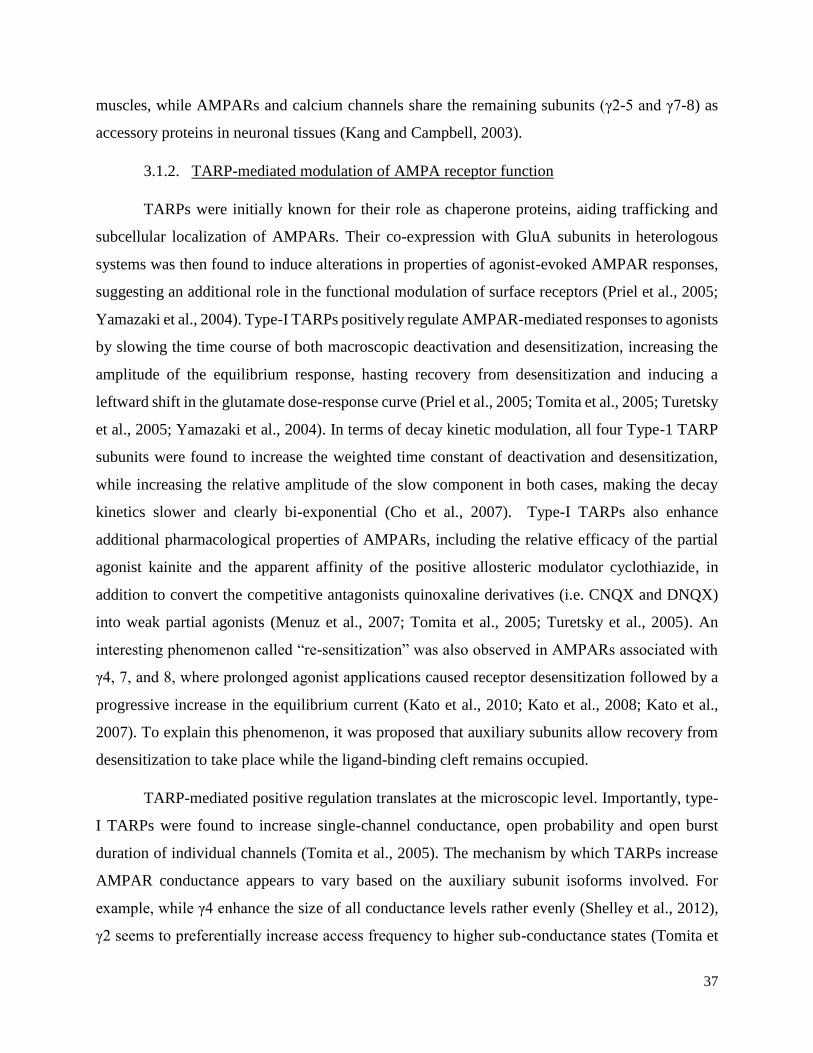
37
muscles, while AMPARs and calcium channels share the remaining subunits (γ2-5 and γ7-8) as
accessory proteins in neuronal tissues (Kang and Campbell, 2003).
3.1.2. TARP-mediated modulation of AMPA receptor function
TARPs were initially known for their role as chaperone proteins, aiding trafficking and
subcellular localization of AMPARs. Their co-expression with GluA subunits in heterologous
systems was then found to induce alterations in properties of agonist-evoked AMPAR responses,
suggesting an additional role in the functional modulation of surface receptors (Priel et al., 2005;
Yamazaki et al., 2004). Type-I TARPs positively regulate AMPAR-mediated responses to agonists
by slowing the time course of both macroscopic deactivation and desensitization, increasing the
amplitude of the equilibrium response, hasting recovery from desensitization and inducing a
leftward shift in the glutamate dose-response curve (Priel et al., 2005; Tomita et al., 2005; Turetsky
et al., 2005; Yamazaki et al., 2004). In terms of decay kinetic modulation, all four Type-1 TARP
subunits were found to increase the weighted time constant of deactivation and desensitization,
while increasing the relative amplitude of the slow component in both cases, making the decay
kinetics slower and clearly bi-exponential (Cho et al., 2007). Type-I TARPs also enhance
additional pharmacological properties of AMPARs, including the relative efficacy of the partial
agonist kainite and the apparent affinity of the positive allosteric modulator cyclothiazide, in
addition to convert the competitive antagonists quinoxaline derivatives (i.e. CNQX and DNQX)
into weak partial agonists (Menuz et al., 2007; Tomita et al., 2005; Turetsky et al., 2005). An
interesting phenomenon called “re-sensitization” was also observed in AMPARs associated with
γ4, 7, and 8, where prolonged agonist applications caused receptor desensitization followed by a
progressive increase in the equilibrium current (Kato et al., 2010; Kato et al., 2008; Kato et al.,
2007). To explain this phenomenon, it was proposed that auxiliary subunits allow recovery from
desensitization to take place while the ligand-binding cleft remains occupied.
TARP-mediated positive regulation translates at the microscopic level. Importantly, type-
I TARPs were found to increase single-channel conductance, open probability and open burst
duration of individual channels (Tomita et al., 2005). The mechanism by which TARPs increase
AMPAR conductance appears to vary based on the auxiliary subunit isoforms involved. For
example, while γ4 enhance the size of all conductance levels rather evenly (Shelley et al., 2012),
γ2 seems to preferentially increase access frequency to higher sub-conductance states (Tomita et
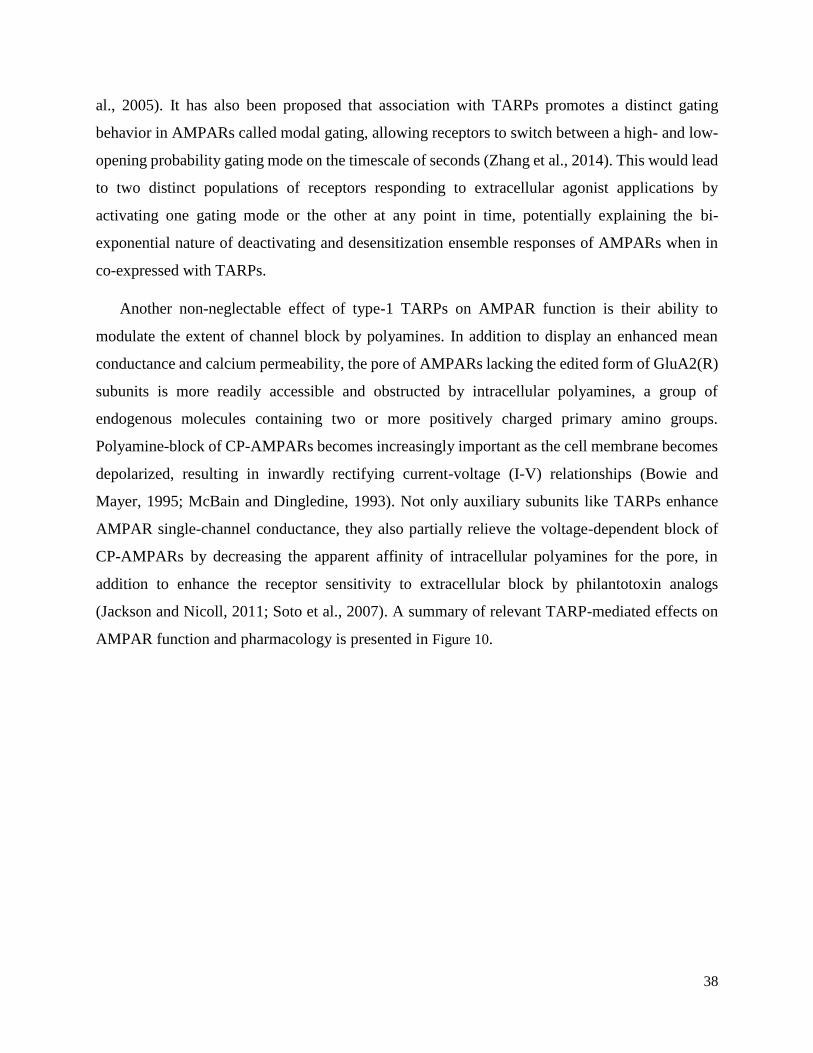
38
al., 2005). It has also been proposed that association with TARPs promotes a distinct gating
behavior in AMPARs called modal gating, allowing receptors to switch between a high- and low-
opening probability gating mode on the timescale of seconds (Zhang et al., 2014). This would lead
to two distinct populations of receptors responding to extracellular agonist applications by
activating one gating mode or the other at any point in time, potentially explaining the bi-
exponential nature of deactivating and desensitization ensemble responses of AMPARs when in
co-expressed with TARPs.
Another non-neglectable effect of type-1 TARPs on AMPAR function is their ability to
modulate the extent of channel block by polyamines. In addition to display an enhanced mean
conductance and calcium permeability, the pore of AMPARs lacking the edited form of GluA2(R)
subunits is more readily accessible and obstructed by intracellular polyamines, a group of
endogenous molecules containing two or more positively charged primary amino groups.
Polyamine-block of CP-AMPARs becomes increasingly important as the cell membrane becomes
depolarized, resulting in inwardly rectifying current-voltage (I-V) relationships (Bowie and
Mayer, 1995; McBain and Dingledine, 1993). Not only auxiliary subunits like TARPs enhance
AMPAR single-channel conductance, they also partially relieve the voltage-dependent block of
CP-AMPARs by decreasing the apparent affinity of intracellular polyamines for the pore, in
addition to enhance the receptor sensitivity to extracellular block by philantotoxin analogs
(Jackson and Nicoll, 2011; Soto et al., 2007). A summary of relevant TARP-mediated effects on
AMPAR function and pharmacology is presented in Figure 10.
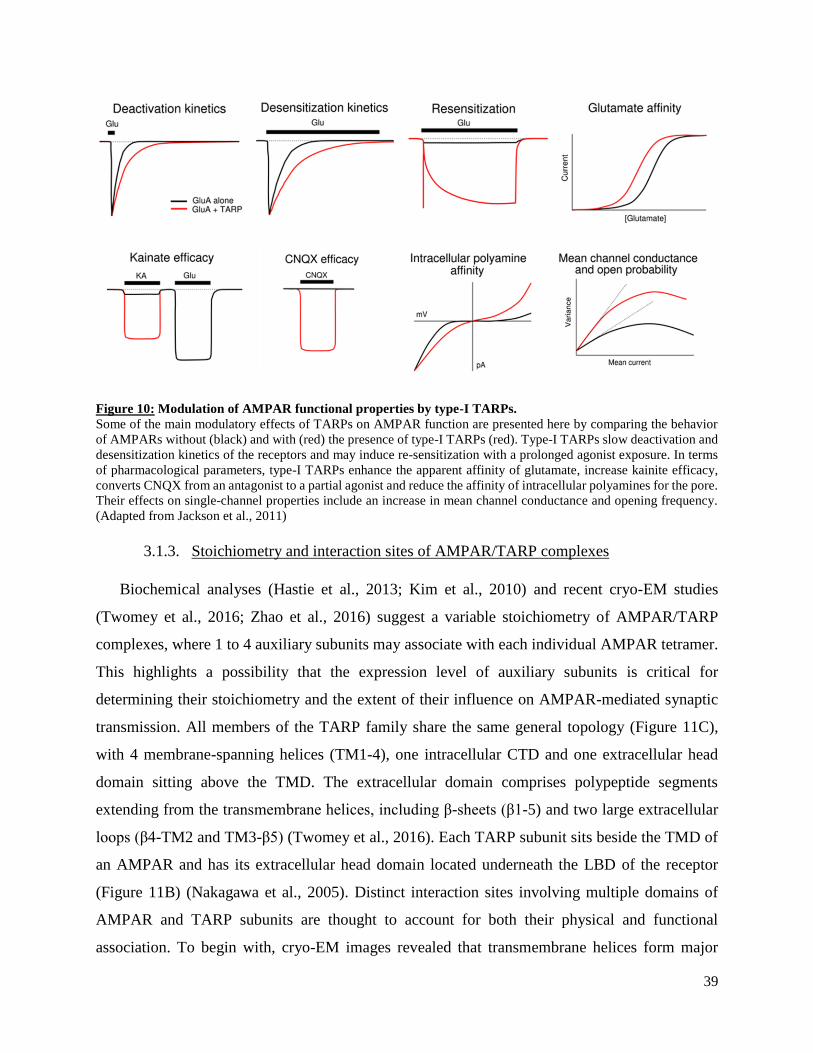
39
Figure 10: Modulation of AMPAR functional properties by type-I TARPs.
Some of the main modulatory effects of TARPs on AMPAR function are presented here by comparing the behavior
of AMPARs without (black) and with (red) the presence of type-I TARPs (red). Type-I TARPs slow deactivation and
desensitization kinetics of the receptors and may induce re-sensitization with a prolonged agonist exposure. In terms
of pharmacological parameters, type-I TARPs enhance the apparent affinity of glutamate, increase kainite efficacy,
converts CNQX from an antagonist to a partial agonist and reduce the affinity of intracellular polyamines for the pore.
Their effects on single-channel properties include an increase in mean channel conductance and opening frequency.
(Adapted from Jackson et al., 2011)
3.1.3. Stoichiometry and interaction sites of AMPAR/TARP complexes
Biochemical analyses (Hastie et al., 2013; Kim et al., 2010) and recent cryo-EM studies
(Twomey et al., 2016; Zhao et al., 2016) suggest a variable stoichiometry of AMPAR/TARP
complexes, where 1 to 4 auxiliary subunits may associate with each individual AMPAR tetramer.
This highlights a possibility that the expression level of auxiliary subunits is critical for
determining their stoichiometry and the extent of their influence on AMPAR-mediated synaptic
transmission. All members of the TARP family share the same general topology (Figure 11C),
with 4 membrane-spanning helices (TM1-4), one intracellular CTD and one extracellular head
domain sitting above the TMD. The extracellular domain comprises polypeptide segments
extending from the transmembrane helices, including β-sheets (β1-5) and two large extracellular
loops (β4-TM2 and TM3-β5) (Twomey et al., 2016). Each TARP subunit sits beside the TMD of
an AMPAR and has its extracellular head domain located underneath the LBD of the receptor
(Figure 11B) (Nakagawa et al., 2005). Distinct interaction sites involving multiple domains of
AMPAR and TARP subunits are thought to account for both their physical and functional
association. To begin with, cryo-EM images revealed that transmembrane helices form major
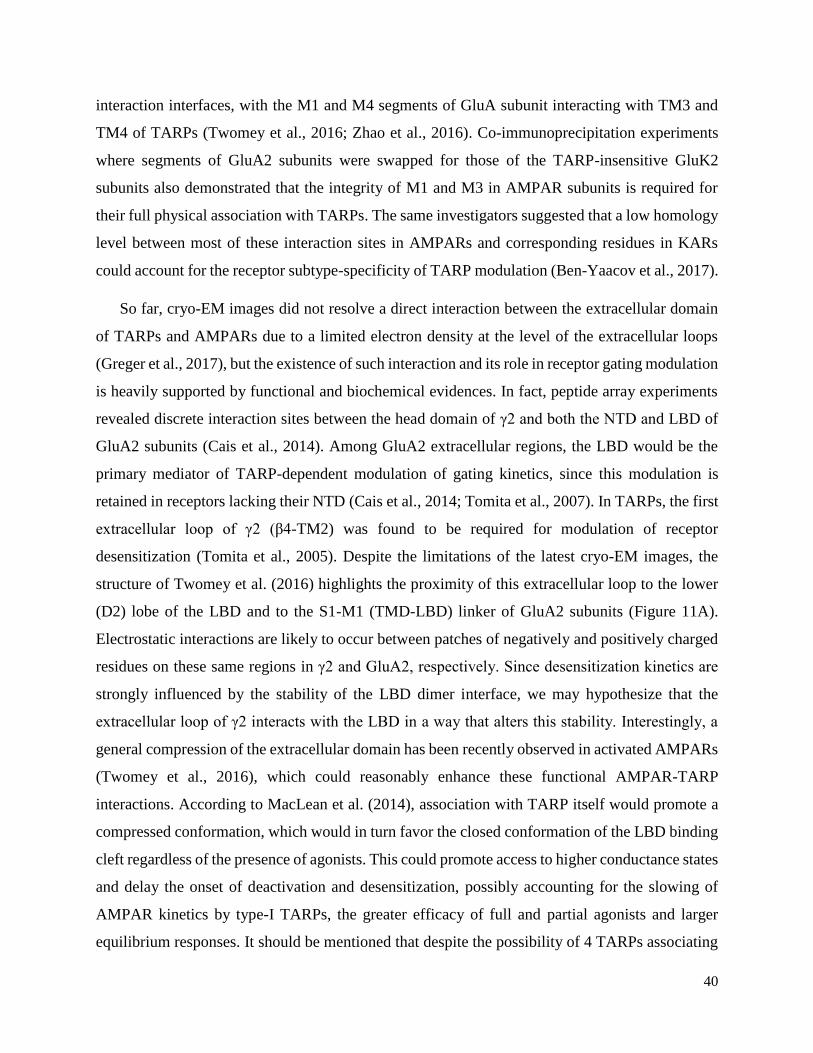
40
interaction interfaces, with the M1 and M4 segments of GluA subunit interacting with TM3 and
TM4 of TARPs (Twomey et al., 2016; Zhao et al., 2016). Co-immunoprecipitation experiments
where segments of GluA2 subunits were swapped for those of the TARP-insensitive GluK2
subunits also demonstrated that the integrity of M1 and M3 in AMPAR subunits is required for
their full physical association with TARPs. The same investigators suggested that a low homology
level between most of these interaction sites in AMPARs and corresponding residues in KARs
could account for the receptor subtype-specificity of TARP modulation (Ben-Yaacov et al., 2017).
So far, cryo-EM images did not resolve a direct interaction between the extracellular domain
of TARPs and AMPARs due to a limited electron density at the level of the extracellular loops
(Greger et al., 2017), but the existence of such interaction and its role in receptor gating modulation
is heavily supported by functional and biochemical evidences. In fact, peptide array experiments
revealed discrete interaction sites between the head domain of γ2 and both the NTD and LBD of
GluA2 subunits (Cais et al., 2014). Among GluA2 extracellular regions, the LBD would be the
primary mediator of TARP-dependent modulation of gating kinetics, since this modulation is
retained in receptors lacking their NTD (Cais et al., 2014; Tomita et al., 2007). In TARPs, the first
extracellular loop of γ2 (β4-TM2) was found to be required for modulation of receptor
desensitization (Tomita et al., 2005). Despite the limitations of the latest cryo-EM images, the
structure of Twomey et al. (2016) highlights the proximity of this extracellular loop to the lower
(D2) lobe of the LBD and to the S1-M1 (TMD-LBD) linker of GluA2 subunits (Figure 11A).
Electrostatic interactions are likely to occur between patches of negatively and positively charged
residues on these same regions in γ2 and GluA2, respectively. Since desensitization kinetics are
strongly influenced by the stability of the LBD dimer interface, we may hypothesize that the
extracellular loop of γ2 interacts with the LBD in a way that alters this stability. Interestingly, a
general compression of the extracellular domain has been recently observed in activated AMPARs
(Twomey et al., 2016), which could reasonably enhance these functional AMPAR-TARP
interactions. According to MacLean et al. (2014), association with TARP itself would promote a
compressed conformation, which would in turn favor the closed conformation of the LBD binding
cleft regardless of the presence of agonists. This could promote access to higher conductance states
and delay the onset of deactivation and desensitization, possibly accounting for the slowing of
AMPAR kinetics by type-I TARPs, the greater efficacy of full and partial agonists and larger
equilibrium responses. It should be mentioned that despite the possibility of 4 TARPs associating
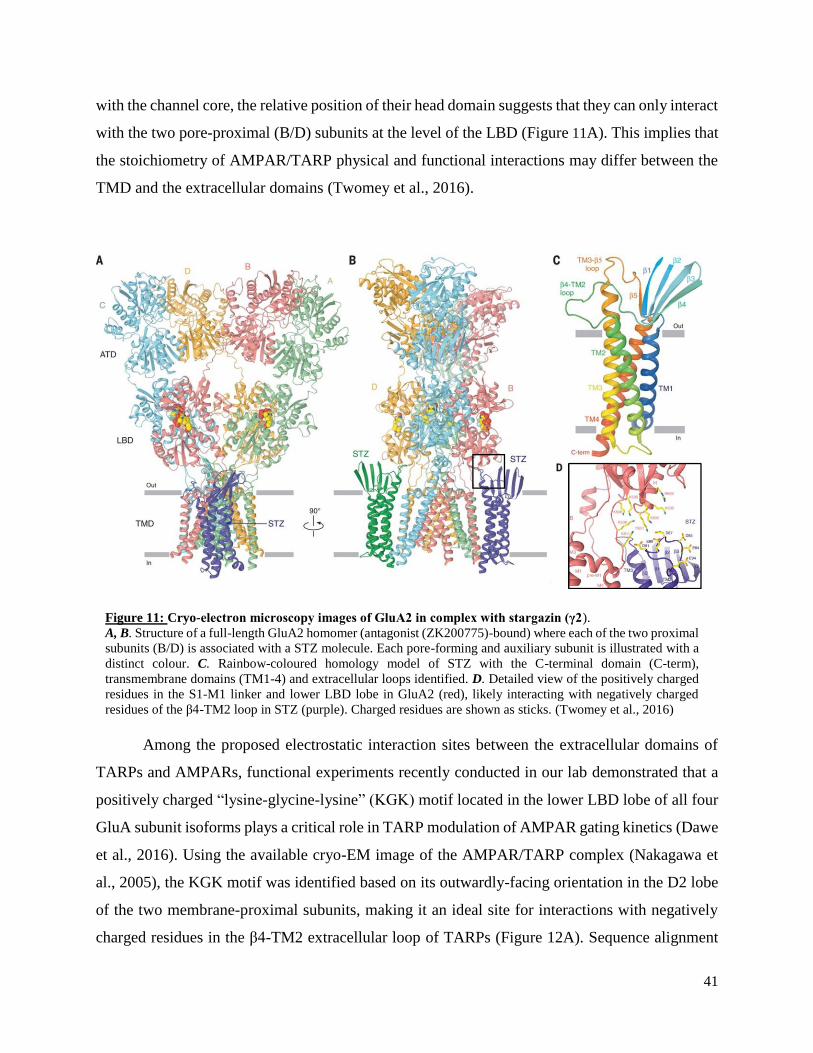
41
with the channel core, the relative position of their head domain suggests that they can only interact
with the two pore-proximal (B/D) subunits at the level of the LBD (Figure 11A). This implies that
the stoichiometry of AMPAR/TARP physical and functional interactions may differ between the
TMD and the extracellular domains (Twomey et al., 2016).
Figure 11: Cryo-electron microscopy images of GluA2 in complex with stargazin (γ2).
A, B. Structure of a full-length GluA2 homomer (antagonist (ZK200775)-bound) where each of the two proximal
subunits (B/D) is associated with a STZ molecule. Each pore-forming and auxiliary subunit is illustrated with a
distinct colour. C. Rainbow-coloured homology model of STZ with the C-terminal domain (C-term),
transmembrane domains (TM1-4) and extracellular loops identified. D. Detailed view of the positively charged
residues in the S1-M1 linker and lower LBD lobe in GluA2 (red), likely interacting with negatively charged
residues of the β4-TM2 loop in STZ (purple). Charged residues are shown as sticks. (Twomey et al., 2016)
Among the proposed electrostatic interaction sites between the extracellular domains of
TARPs and AMPARs, functional experiments recently conducted in our lab demonstrated that a
positively charged “lysine-glycine-lysine” (KGK) motif located in the lower LBD lobe of all four
GluA subunit isoforms plays a critical role in TARP modulation of AMPAR gating kinetics (Dawe
et al., 2016). Using the available cryo-EM image of the AMPAR/TARP complex (Nakagawa et
al., 2005), the KGK motif was identified based on its outwardly-facing orientation in the D2 lobe
of the two membrane-proximal subunits, making it an ideal site for interactions with negatively
charged residues in the β4-TM2 extracellular loop of TARPs (Figure 12A). Sequence alignment
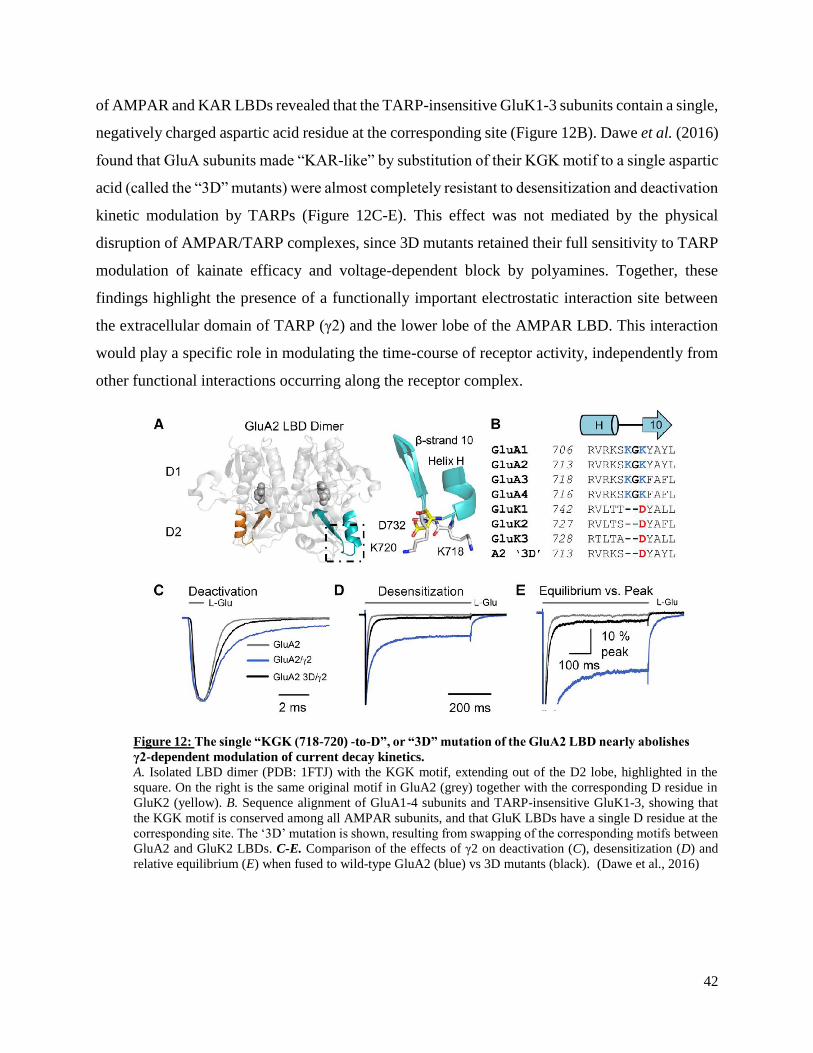
42
of AMPAR and KAR LBDs revealed that the TARP-insensitive GluK1-3 subunits contain a single,
negatively charged aspartic acid residue at the corresponding site (Figure 12B). Dawe et al. (2016)
found that GluA subunits made “KAR-like” by substitution of their KGK motif to a single aspartic
acid (called the “3D” mutants) were almost completely resistant to desensitization and deactivation
kinetic modulation by TARPs (Figure 12C-E). This effect was not mediated by the physical
disruption of AMPAR/TARP complexes, since 3D mutants retained their full sensitivity to TARP
modulation of kainate efficacy and voltage-dependent block by polyamines. Together, these
findings highlight the presence of a functionally important electrostatic interaction site between
the extracellular domain of TARP (γ2) and the lower lobe of the AMPAR LBD. This interaction
would play a specific role in modulating the time-course of receptor activity, independently from
other functional interactions occurring along the receptor complex.
Figure 12: The single “KGK (718-720) -to-D”, or “3D” mutation of the GluA2 LBD nearly abolishes
γ2-dependent modulation of current decay kinetics.
A. Isolated LBD dimer (PDB: 1FTJ) with the KGK motif, extending out of the D2 lobe, highlighted in the
square. On the right is the same original motif in GluA2 (grey) together with the corresponding D residue in
GluK2 (yellow). B. Sequence alignment of GluA1-4 subunits and TARP-insensitive GluK1-3, showing that
the KGK motif is conserved among all AMPAR subunits, and that GluK LBDs have a single D residue at the
corresponding site. The ‘3D’ mutation is shown, resulting from swapping of the corresponding motifs between
GluA2 and GluK2 LBDs. C-E. Comparison of the effects of γ2 on deactivation (C), desensitization (D) and
relative equilibrium (E) when fused to wild-type GluA2 (blue) vs 3D mutants (black). (Dawe et al., 2016)
43
The mechanisms underlying the ability of auxiliary subunits to relieve polyamine block
in CP-AMPARs and increase channel conductance are thought to be related to direct or indirect
changes in the ion permeation pathway. In terms of polyamine-block modulation, these changes
would lead to a reduction in the affinity of polyamines a pore-lining binding site (Soto et al., 2007),
which could either hinder the ability of polyamines to access the pore, or on the contrary, facilitate
polyamine permeation. The latter alternative has been supported in a recent study, showing that
the auxiliary proteins Neto1 and Neto2 alleviate intracellular polyamine block of KARs by
enhancing the outward flux of polyamines (Brown et al., 2016). Many lines of evidence point
towards a specific role of the C-tail of auxiliary proteins in the alleviation of polyamine block. In
fact, truncation of a membrane-proximal portion of the C-tail in γ2 reduces its ability to modulate
AMPAR sensitivity to polyamines, without affecting gating kinetic modulation (Soto et al., 2014).
Similarly, positively charged residues in the C-tail of Neto1 and Neto2 were reported as key
players in the alleviation of polyamine block in GluK2 homomers (Fisher and Mott, 2012). On the
other hand, it has been suggested that the TARP-mediated increase in channel conductance
involves a structural rearrangement of the pore near the Q/R site, and substituting a negatively
charged residue in this region reduces the ability of γ2 to increase channel conductance without
affecting polyamine block modulation (Soto et al., 2014). As mentioned earlier, additional contact
points between the extracellular domains of AMPAR and stargazin are thought to induce a more
extensive closure of the LBD cleft, which could not only account for the effect of TARPs on
AMPAR inactivation kinetics, but could also translates into a greater efficacy of full and partial
agonists such as kainate (MacLean et al., 2014).
Protein Cornichon Homologs (CNIHs)
3.2.1. A dual role as cargo proteins and AMPAR auxiliary subunits
The genetic locus cornichon (cni) was originally identified through a screen for mutations
causing phenotypic impairments in Drosophila oocytes (Ashburner et al., 1990). The gene product
was later identified as a cargo protein recruiting Gurken, a TGF-α growth factor, into COPII-coated
vesicles. This process was found to be required for export of the growth factor from the
endoplasmic reticulum and essential for adequate polarization of the oocyte during mid-oogenesis
in Drosophila (Bökel et al., 2006; Roth et al., 1995). In yeast and chick embryos, cni homologs
were identified, similarly serving as cargo proteins for the export of growth factors from the
44
endoplasmic reticulum, with an additional role in nerve connectivity in the chick cranial sensory
ganglia (Hoshino et al., 2007; Powers and Barlowe, 1998). Four mammalian cni homologs
(CNIH1-4) were then identified and found to associate with immature proteins of the EGF-α and
TGF-α families in the endoplasmic reticulum, to regulate their transport, processing and secretion
(Castro et al., 2007).
Aside from their obvious role in the secretory pathway of growth factors, CNIH2 and
CNIH3 were soon identified as auxiliary proteins of AMPAR subunits by affinity purification of
anti-GluA1 and GluA2 antibodies, as well as mass spectrometry analysis of their binding partners
complexes (Schwenk et al., 2009). In the same study, CNIH2 and CNIH3 were copurified with
virtually all subunits from whole rat brains. Using immunohistochemistry, a widespread
expression of both cni homologs was detected in multiple brain regions and various cell types,
including neurons and glial cells. Similar to TARPs, a strong body of evidence supports the role
of human/mammalian cni homologs in forward trafficking of AMPARs. In both recombinant and
native systems, CNIH2 and CNIH3 were found to enhance surface expression of GluA subunits
and to consistently increase AMPAR-mediated currents and EPSCs (Boudkkazi et al., 2014;
Harmel et al., 2012; Herring et al., 2013; Schwenk et al., 2009). CNIHs would do so by assisting
ER export of GluA subunits in a process involving the modulation of GluA glycosylation patterns.
This process would allow CNIHs to break from their ancestral ER-to-Golgi secretory cycle and
become surface transmembrane auxiliary subunits (Harmel et al., 2012)
Once in association with surface receptors, CNIHs have evolved the ability to modulate
channel function similarly to other reported auxiliary subunits. In recombinant systems, results
from whole-cell and outside-out recording experiments showed that CNIH2 and CNHI3 both slow
the time course of macroscopic deactivation and desensitization, and increase the steady-state
response of AMPARs composed of various subunits. The slowing effect of CNIH2/3 on AMPAR
deactivation and desensitization kinetics appears to be even larger than that of TARPs (Coombs et
al., 2012; Schwenk et al., 2009; Shanks et al., 2014; Shi et al., 2010). These modulatory properties
translate in native systems: overexpression of CNIH3 in oligodendrocyte precursor cells, where
they CNIHs are abundantly expressed along with CP-AMPARs, slow desensitization and increase
the weighted mean single-cannel conductance of AMPAR-mediated currents (Coombs et al.,
2012). Furthermore, Boudkkazi et al., (2014) found a significant contribution of CNIH2 to the
45
slow decaying properties of AMPAR EPSCs of hilar neurons in the rat dentate gyrus. At the
microscopic level, non-stationary noise analysis and single-channel experiments revealed that both
CNIH2 and CNIH3 increase the unitary conductance and mean opening time of CP-AMPARs,
with little effect on CI-AMPARs. Like TARPs, CNIHs do not appear to modulate the opening
probability of individual channels. CNIH2 and CNIH3 were shown to reduce inward rectification
of CP-AMPARs by decreasing the affinity of polyamines for the pore and alleviating channel
block to a more-or-less similar extent as TARPs, in addition to increase the relative calcium
permeability. Unlike TARPs however, the effect of CNIHs on kainate efficacy and on the action
of CNQX is negligible (Coombs et al., 2012; Shi et al., 2010). This suggests that, despite sharing
phenotypically similar effects on AMPAR kinetics and inward rectification, TARPs and CNIHs
could differ in the nature of their interaction with GluA subunits and/or in the structural
mechanisms underlying their ability to modulate channel function.
3.2.2. Interaction sites between AMPARs and CNIHs
CNIH1-4 all share the same general architecture. Their basic topology comprises an
intracellular amino-terminal domain, 3 transmembrane domains, one extra- and one intracellular
loop and an extracellular C-terminal domain (Roth et al., 1995). A major barrier in the elucidation
of AMPAR-CNIH interaction sites is the lack of a high-resolution structure of the protein complex.
Nevertheless, cryo-EM data reveals that both TARPs and CNIHs share a similar position relatively
to AMPARs, with auxiliary subunits localizing just underneath the LBD and contributing to the
transmembrane density (Nakagawa et al., 2005; Shanks et al., 2014). Because of their
phenotypically similar modulatory effects on AMPAR inactivation kinetics, TARPs and CNIHs
could be thought to have a common ability to interfere with the stability of the LBD dimer
interface, and/or with the coupling between LBD cleft closure and channel gating (Dawe et al.,
2016; MacLean et al., 2014; Sun et al., 2002). In the case of TARPs, the integrity of the KGK site
on the lower LBD lobe is necessary for the kinetic modulation of AMPARs, but it is unknown
whether CNIHs share a similar interaction site (Dawe et al., 2016). As mentioned earlier, subtle
differences in the functional interaction of CNIHS vs TARPs with AMPARs, such as contrasting
effects on kainate, CNQX and polyamine pharmacology, suggest that their interaction sites on
GluA subunits may differ. Functional experiments also demonstrated that CNIH2/3 can modulate
the kinetics of GluA1 homomers already saturated with four TARP subunits, highlighting the
46
likelihood of distinct bindings sites (Shi et al., 2010). An additional evidence is that while TARPs
most likely interact with positively charged residues on AMPAR LBDs, the opposite may be true
for CNIHs. In fact, all CNIH1-4 subunits can co-assemble with GluA subunits in vitro (Shanks et
al., 2014), but only CNIH2 and CNIH3 significantly slow AMPAR inactivation kinetics (Coombs
et al., 2012; Kato et al., 2010; Schwenk et al., 2009; Shi et al., 2010). Interestingly, it was also
noticed that recombinant co-expression of GluA2 with γ2 and CNIH3, but not CNIH1, induces a
cytotoxicity preventable by addition of the antagonist NBQX in the cell medium. This cytotoxicity
would result from an increase in surface expression and charge transfer of individual receptors in
response to glutamate present in the extracellular environment (Shanks et al., 2014). The common
feature of CNIH2 and CNIH3 is a unique sequence in their extracellular loop, which is absent in
CNIH1 and CNIH4 and carries a large relative number of positively charged residues (Figure 8).
Results from peptide array experiments demonstrate that the GluA LBD mainly interacts with the
extracellular loop of CNIH3, primarily at the level of this unique, positively charged sequence
(Shanks et al., 2014). The same investigators found that deletions in the last half of the CNIH2/3-
specific region result in a significant reduction in both the physical and modulatory interaction of
CNIHs with AMPARs. When a 3-residue-long, positively charged region of this segment is
mutated to neutral alanine residues (LRN64AAA mutation), CNIH2 and CNIH3 fully retain their
ability to physically interact with the receptor complex, but lose their modulatory potential on
AMPAR kinetics. These results indicate that a positively charged region in the extracellular loop
of CNIH2 and CNIH3 could account for the proteins’ ability to influence gating properties of the
receptor complex, by physically interacting with the LBD of GluA subunits. This functional
interaction would be structurally distinct from other interactions allowing the physical co-assembly
of CNIHs with AMPARs. In fact, two transmembrane-proximal segments conserved among all
CNIH1-4 subunits were found to be necessary for the physical interaction with GluA subunits.
While those results provide relevant information about functionally important segments of the
CNIH protein, distinct interaction sites on the receptor complex remains to be elucidated.
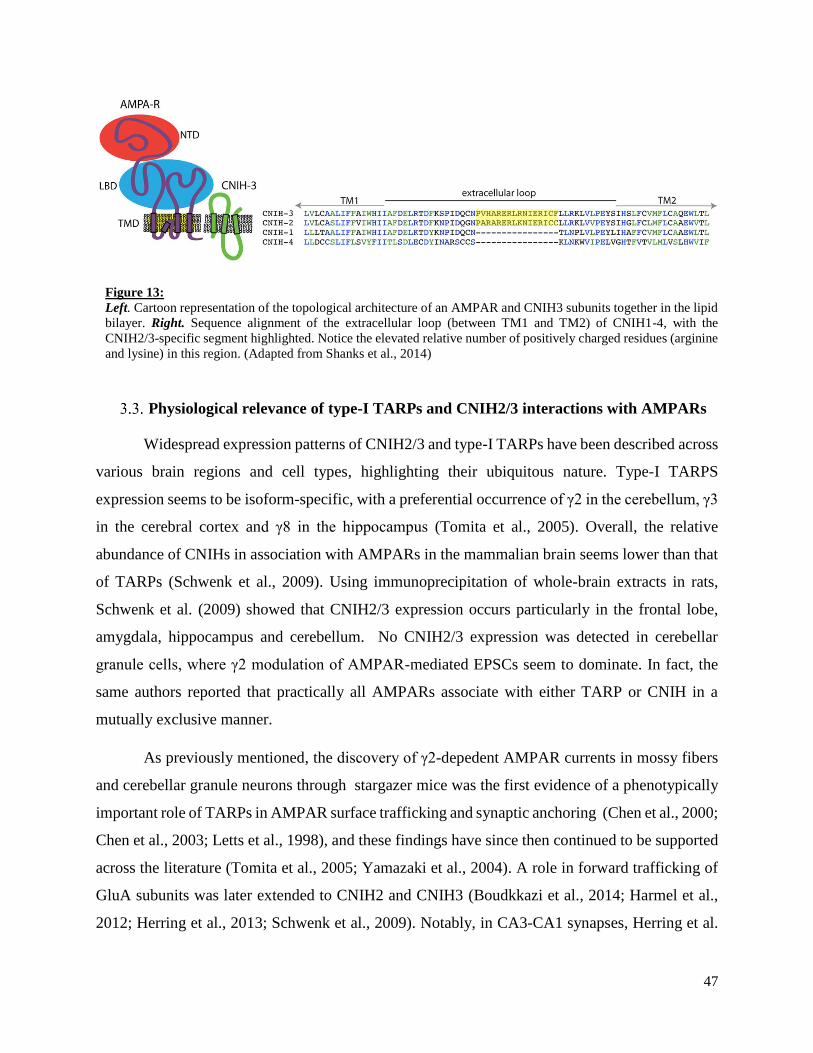
47
Figure 13:
Left. Cartoon representation of the topological architecture of an AMPAR and CNIH3 subunits together in the lipid
bilayer. Right. Sequence alignment of the extracellular loop (between TM1 and TM2) of CNIH1-4, with the
CNIH2/3-specific segment highlighted. Notice the elevated relative number of positively charged residues (arginine
and lysine) in this region. (Adapted from Shanks et al., 2014)
Physiological relevance of type-I TARPs and CNIH2/3 interactions with AMPARs
Widespread expression patterns of CNIH2/3 and type-I TARPs have been described across
various brain regions and cell types, highlighting their ubiquitous nature. Type-I TARPS
expression seems to be isoform-specific, with a preferential occurrence of γ2 in the cerebellum, γ3
in the cerebral cortex and γ8 in the hippocampus (Tomita et al., 2005). Overall, the relative
abundance of CNIHs in association with AMPARs in the mammalian brain seems lower than that
of TARPs (Schwenk et al., 2009). Using immunoprecipitation of whole-brain extracts in rats,
Schwenk et al. (2009) showed that CNIH2/3 expression occurs particularly in the frontal lobe,
amygdala, hippocampus and cerebellum. No CNIH2/3 expression was detected in cerebellar
granule cells, where γ2 modulation of AMPAR-mediated EPSCs seem to dominate. In fact, the
same authors reported that practically all AMPARs associate with either TARP or CNIH in a
mutually exclusive manner.
As previously mentioned, the discovery of γ2-depedent AMPAR currents in mossy fibers
and cerebellar granule neurons through stargazer mice was the first evidence of a phenotypically
important role of TARPs in AMPAR surface trafficking and synaptic anchoring (Chen et al., 2000;
Chen et al., 2003; Letts et al., 1998), and these findings have since then continued to be supported
across the literature (Tomita et al., 2005; Yamazaki et al., 2004). A role in forward trafficking of
GluA subunits was later extended to CNIH2 and CNIH3 (Boudkkazi et al., 2014; Harmel et al.,
2012; Herring et al., 2013; Schwenk et al., 2009). Notably, in CA3-CA1 synapses, Herring et al.
48
(2013) showed that CNIH2 and CNIH3 both play a role in GluA1 trafficking, contributing to EPSC
amplitudes and LTP mechanisms.
Because of the important contribution of AMPARs in fast EPSCs in the brain, we can
imagine how slowing AMPAR kinetics could alter the timescale of EPSCs themselves and enhance
cell excitability through temporal summation of synaptic events. In fact, A role of CNIH2 in
slowing EPSC decays in mossy cells and pyramidal neurons of the hippocampus has been reported,
thereby strengthening both excitatory and inhibitory synaptic outputs to granule cells and
interneurons, respectively (Boudkkazi et al., 2014; Herring et al., 2013). Additionally, native
CNIH2-3 co-localized with a significant population of CP-AMPARs were found in rat optic nerve
oligodendrocyte precursor cells (OPCs), and overexpressing CNIH2 and CNIH3 in these glial cells
lead to slower and pharmacologically altered AMPAR currents (Coombs et al., 2012).
Interestingly, AMPAR activity in murine OPCs elicited by active glutamatergic synapses has been
recently found to enhance oligodendrocyte survival, both in the developing and adult brain
(Kougioumtzidou et al., 2017), and to alter proliferation and differentiation of OPCs into mature
oligodendrocytes (Chen et al., 2018). Together, these findings suggest that by interacting with
AMPARs, CNIHs could regulate hippocampal-dependant behaviours and affect the development
and integrity of important neural circuits, such as visual pathways.
Finally, we could advance that alterations in the permeation pathway of individual ion
channels through their association with auxiliary subunits, including enhancement of unitary
conductance and calcium permeability, as well as alleviation of voltage-dependant block by
polyamines, could potentiate the overall charge transfer across cell membranes in response to
synaptic release of glutamate and further contribute to cell excitability. A larger calcium
permeation may also imply a greater risk of calcium-mediated cytotoxicity in the CNS, as noticed
in vitro by Shanks et al. (2014).
49
Thesis aims
AMPARs reliably and stably associate with auxiliary subunits in native systems, and little
is known about the molecular and structural mechanisms underlying these interactions. The
general purpose of my thesis was to investigate the nature of AMPAR functional interactions with
auxiliary subunits of the type-I TARP and CNIH families.
More specifically, the first objective was to obtain a comprehensive set of results describing
the modulatory effects of TARPs and CNIHs on wild-type AMPAR kinetic parameters and
pharmacological properties, including receptor desensitization and deactivation kinetics, kainate
efficacy and polyamine-dependent inward rectification. The resulting dataset would then be used
as a baseline for structure-function experiments assessing putative interaction sites in the GluA2
LBD that could play a specific role in modulation of AMPAR decay kinetics. Notably, I set out to
investigate whether the KGK (718-720) motif on the lower (D2) lobe of GluA subunits, previously
identified by Brent et al. (2016) as a critical site for TARP-dependent modulation of inactivation
kinetics, shared a similar role in CNIHs. Finally, since CNIH isoforms known to modulate
AMPAR kinetics share a positively charged sequence in their extracellular loop (Shanks et al.,
2014), the possibility of a functionally relevant electrostatic interaction with negatively charged
residues near the KGK site was also explored.
To ensure that protein expression and behavior occurred in a relatively controlled
environment, AMPARs and their auxiliary subunits were studied in isolation using HEK293T cells
as a mammalian recombinant system. Given their known ability to modulate AMPAR kinetics,
their robust expression levels in HEK cells and in the interest of consistency with previous
literature, the auxiliary subunits CNIH3 and the prototypical type-I TARP γ2 were chosen for my
experiments. For pore-forming subunits, I chose GluA2 based on its ubiquitous expression in the
mammalian brain and the availability of high-resolution crystal structures, which facilitates
structure-function analyses (Greger et al., 2002; Sobolevsky et al., 2009; Wenthold et al., 1996).
The same general approach has been used for all experiments, starting with the recombinant
expression of pore-forming and auxiliary subunits in HEK cells, either in their native or mutated
form following site-directed mutagenesis. The outside-out patch-clamp technique was then used
to record ensemble electrophysiological responses evoked by surface receptors transiently exposed
to extracellular agonist solutions. External solutions were applied using a fast perfusion system,

50
providing a clean solution exchange and precisely timed agonist applications, in attempt to mimic
the millisecond time-scale of AMPAR activity in native systems.

51
PART II:
METHODOLOGY
52
1. Plasmid generation and site-directed mutagenesis
All proteins were generated from cDNA constructs in mammalian expression plasmids,
including pRK5, pRK7 and pCMV-SPORT6, each containing an open reading frame (ORF) for
the corresponding gene of interest. For our experiments, we used wild-type expression plasmids
containing cDNA for GluA2 subunits (rat GRIA2 gene), as well as CNIH3 (human CNIH3 gene)
and γ2 (mouse CACNG2 gene) auxiliary subunits. GluA2 cDNA contained exons encoding the
flip (GluA2i) receptor isoform and carried the glutamine (unedited) and glycine (edited) codons at
the Q/R and R/G sites, respectively. Enhanced Green Fluorescent Protein (eGFP) was also
generated for co-expression with auxiliary and pore-forming subunits.
Site-directed mutagenesis (SDM) was used to introduce targeted changes in DNA sequences,
generating the various mutant subunits used in our experiments to study structure-function
relationships. Whole plasmid SDM was selected over other mutagenesis techniques for its simple
procedure and high efficiency. The general approach is based on the Quikchange protocol
originally described in 1996 (Braman et al., 1996). Briefly, the whole plasmid SDM technique
involves the synthesis of a pair of forward and reverse oligonucleotide primers carrying a desired
codon change, with DNA stretches complementary to the template DNA flanking either side of
the mutation. Both mutagenic primers are allowed to hybridize with a methylated template plasmid
and are extended along the entire length of the template by DNA polymerase until the 5’ end of
the initial primer is reached. Pyrococcus furiosus (Pfu) Ultra DNA polymerase (Stratagene) was
used due to its lack of strand-displacing activity, as required by SDM techniques, and its low error
introduction rate (Cline et al., 1996). After primer extension, newly synthesized plasmids have
incorporated the mutated primers and contain a nick: a strand break resulting from the inability of
DNA polymerase to create a phosphodiesterbond between the 3’ end of the new DNA stretch and
the 5’ end of the primer. The resulting DNA mixture is subjected to a restriction digest reaction
using the DpnI restriction endonuclease (New England Biolabs) which can only cleave DNA at
Dam methylated recognition sites. This allows the selective degradation of methylated parental
templates while preserving the new, unmethylated mutagenic plasmids. Finally, the isolated
plasmids are transformed in host DH5α Competent E. coli. The bacteria replicate the cDNA while
using their own DNA repair machinery to remove the nicks, leading to double-stranded,
methylated and circular plasmids.
53
The Single-Primer Reactions IN Parallel (SPRINP) technique (Edelheit et al., 2009) was used
as a whole-plasmid SDM protocol variant to generate the point mutations and deletions used in
our experiments. The main advantage of SPRINP is that it is initiated by the extension of the
forward and reverse mutagenic primers in two parallel, isolated reactions. This prevents the
possibility of complementary primers annealing to each other rather than the template DNA itself,
thereby increasing the success rate of each mutagenesis reaction (Edelheit et al., 2009). After
multiple rounds of individual primer extension, the two DNA mixtures are combined and
denatured, leading to a combination of single-stranded, circular parental templates and linear
mutagenic plasmids. The products are re-hybridized as double-stranded DNA in an annealing
phase, the parental DNA is selectively digested by DpnI and the remaining mutagenic plasmids
are transformed in E. coli. The QIAprep Spin Miniprep kit (Qiagen) was used to isolate the
plasmids from E. coli colonies. To confirm that the isolated clones successfully incorporated the
desired mutations, a restriction digest was done, with cleavage at unique, silent restriction sites
included in the mutagenic primer sequences. The digestion products were analyzed by agarose gel
electrophoresis, and the isolated plasmids were subjected to automated sequencing (McGill
University and Genome Quebec Innovation Center, Montreal) for additional validation. Bacterial
cultures transformed with either mutated or wild-type cDNA clones were inoculated using the
QIAfilter maxiprep kit (Qiagen), to generate large amounts of the cDNA of interest.
While all mutated receptors carrying point mutations and short deletions were generated
using the two-step, whole plasmid mutagenesis procedure described above, fusion proteins such
as GluA2/γ2 were produced by large-insert SDM (Geiser et al., 2001) in the context of experiments
previously performed in our lab (Dawe et al., 2016). The use of AMPA receptor subunits fused in
tandem with auxiliary proteins confers an optimal control over the stoichiometry of auxiliary
subunits decorating each receptor tetramer. Both AMPAR/γ2 and AMPAR/CNIH3 fusion proteins
were generated for this reason, but electrophysiological recordings revealed detectable membrane
currents only in cells transfected with γ2 fusions, suggesting a potential failure of AMPAR/CNIH3
surface expression. That being said, only AMPAR/γ2 fusion proteins could be used in our
experiments.
54
2. Cell culture and transfection
Human embryonic kidney cells (HEK293T/17) (ATCC, Manassas, VA, USA) expressing
the SV40 large T-antigen were used for all electrophysiological experiments. The cells were
maintained at 37 and 5% CO2 in Minimal Essential Medium (MEM) (Sigma-Aldrich, MO,
USA). MEM was enriched with 1.9 mM GlutaMAX©, providing the L-alanine-L-glutamine
dipeptide as a stable substitute for L-glutamine, and supplemented with 10 % Fetal Bovine Serum
(Invitrogen, Carlsbad, CA, USA). Passages were done biweekly (every 3-4 days) to maintain a
maximal confluency of 70-80%. In the process, the cells were washed with phosphate-buffered
saline (Sigma Aldrich, St-Louis, MO, USA) and exposed to trypsin-EDTA (0.25%) (Gibco) to
relieve their membrane adhesion from the flask. The reaction was quenched by the addition of
culture medium after 2 min of incubation with trypsin, after which the cells were sedimented (1100
RPM for 2 min), re-suspended in fresh medium and plated at a low density (1.5 - 2.0 x 10⁴ cells
ml-1) in 35 mm plastic dishes (Fischer Scientific). All dishes were pre-coated with 100 µg ml-1
poly-D-lysine (PDL) at least 1 hour prior to plating. PDL acts as a nonspecific attachment factor,
thereby enhancing cells surface adhesion to the plastic dishes.
HEK cells were subjected to a transient calcium phosphate transfection 20 to 28 hours after
plating. In short, the technique involves the combination of a BES-buffered saline solution
containing phosphate ions, with a calcium chloride solution containing the cDNA constructs to be
transfected. The solutions are mixed for 1-2 min, allowing the plasmids to be incorporated into
positively charged precipitates that can interact with negatively charged moieties at cell surfaces.
The solution mixture is added dropwise to plated cell monolayers, which are then incubated for 8-
16 hours at 37 in 5% CO2. The remaining precipitates are then washed away from the medium
with a phosphate-buffered saline (PBS) containing divalent cations (Ca2+ and Mg2+) and the
transfected cells are placed back into incubation conditions before experimental use. The pH of
the BES solution and the time of incubation with the CaCl2 solution are two critical determinants
of precipitate quality and of the probability of a successful transfection. To identify the optimal
transfection conditions, a “mock” transfection was done beforehand in dishes solely containing
culture medium, where precipitates generated at various pH conditions (6.9 – 7.05) and incubation
times (1-2 min) were compared. For our experiments, cDNA encoding either wild-type or mutant
GluA2i(Q) subunits were co-expressed with enhanced green fluorescent protein (eGFP) to
facilitate the identification of successfully transfected cells during electrophysiological
55
experiments. When receptor subunits were additionally co-transfected with auxiliary subunits
(CNIH3 or γ2), a cDNA molar ratio of 2:1 was used for GluA2:CNIH3 and GluA2:γ2. Since both
TARPs and CNIH proteins enhance cell surface expression of AMPARs and increase charge
transfer across individual channels (Schwenk et al., 2009; Shanks et al., 2014; Tomita et al., 2005),
their co-expression with AMPARs could induce activity-dependent cytotoxicity, likely due to a
larger baseline activity level in response to the glutamic acid present in culture medium. This can
lead to the selective survival of cells expressing a lower relative amount of auxiliary proteins and
bias experimental results. To minimize excitotoxicity, HEK cells co-transfected with AMPARs
and auxiliary proteins were incubated with 30 µM of the quinoxaline derivative 6,7-
dinitroquinoxaline-2,3-dione (DNQX) or 6-Cyano-7-nitroquinoxaline-2,3-dione (CNQX), both
acting as effective AMPAR antagonists.
3. Electrophysiology
3.1. electrophysiological solutions
Electrophysiological experiments required the preparation of a set of solutions that all
attempt to reproduce the physiological environment of mammalian cells, while creating optimal
experimental conditions. A bathing solution, in which cells were immersed for approximately 1
hour during each experiment, was prepared from a concentrated (20X) stock solution containing
150 mM NaCl, 3 mM KCl and 10 mM HEPES as a buffering agent. The 20X stock solution was
stored at 4 °C and diluted on the day of each experiment to achieve final concentrations of 7.5 mM
NaCl, 0.5 mM HEPES and 0.15 mM KCl. 1 mM of MgCl2 and CaCl2 were also added to the diluted
solution. For macroscopic recordings, excised patches of cell membrane were exposed to external
solutions flowing through a perfusion system. The control (agonist-lacking) external solution
contained 150 mM NaCl, 5 mM HEPES, 0.1 mM MgCl2 and 0.1 mM CaCl2, and was stored at
room temperature in the dark to prevent HEPES phototoxicity (Lepe-Zuniga et al., 1987).
Inclusion of divalent cations (Mg2+ and Ca2+) in the external solution helps the formation of a
stable seal between membrane phospholipids and the tip of glass electrodes (Coronado, 1985). It
should be mentioned that previous work conducted in our lab demonstrated that increasing
concentrations of external divalent ions cause a decrease in current amplitudes and increase the
rate of current decay in kainate receptors. However, these effects are minimal at divalent ion
concentrations of 0.1 mM compared to higher concentrations(Wong et al., 2007). Concentrated
56
stocks of kainate (KA) and L-glutamate (L-Glu) solutions were made by dissolving 100 mM L-
glutamic acid monosodium salt hydrate and 10 mM kainate in external solution. The two agonist-
containing solutions were stored in 1 ml aliquots at -20°C, then thawed as needed and diluted to
10 mM L-Glu and 1 mM KA on the day of each experiment. The latter concentrations were used
in a consistent manner across all experimental conditions. The choice of a 10 mM concentration
for L-Glu was mainly based on a desire of consistency with previous work published in the field.
This concentration was also shown to induce near-maximal responses in GluA2i(Q) AMPARs
(Traynelis et al., 2010). Similarly, responses generated by the partial agonist kainate (KA) plateau
with 1 mM KA (Holm et al., 2005). Note however that the glutamate concentration released
through individual synaptic events tends to be highly variable, as previously shown in postsynaptic
AMPARs of hippocampal cells (Liu et al., 1999).
Glass micropipettes used during patch-clamping experiments were filled with an internal
solution, physically continuous with the cytosolic environment in whole-cell configuration. The
internal solution was made of 115 mM NaCl, 10 mM NaF, 1 mM MgCl2, 0.5 mM CaCl2, 10 mM
Na2ATP and 5 mM Na4BAPTA (Invitrogen, Burlington, ON, Canada). It is worth mentioning that
BAPTA acts as a calcium-specific chelator, buffering any sudden increase in intracellular calcium
levels that could potentially arise during electrophysiological experiments. Furthermore, the
addition of Na2ATP allows chelation of endogenous intracellular polyamines, which could
otherwise block AMPAR-mediated membrane currents at depolarized membrane potentials (> -
50mV) (Bowie and Mayer, 1995; Watanabe et al., 1991). For polyamine-permeation experiments,
30 µM spermine was added (from a concentrated stock solution) to an ATP-lacking internal
solution. This concentration is within the range of free intracellular spermine concentrations
typically found in mammalian cells (Bowie and Mayer, 1995). Both ATP-lacking and ATP-
containing internal solutions were stored in 1 ml aliquots at -20 °C and thawed on ice on the day
of each experiment. The pH of all electrophysiological solutions was adjusted to 7.3-7.4 with
NaOH and HCl, and 2 % phenol red (1 ml phenol red/500 ml solution) was added to the external
and bathing solutions in order to roughly monitor pH changes over time. The osmolality of the
internal and external solutions was raised with inert sucrose, at matching values ranging between
290 and 300 mOsm.
57
3.2. Macroscopic electrophysiological recordings
The outside-out patch-clamping technique was used to obtain AMPAR-mediated
macroscopic responses. The technique involves the excision of outside-patches from cell
membranes, allowing the extracellular face of membrane-spanning proteins to be freely exposed
in the bathing environment. This technique is convenient to obtain current responses from
receptors having an extracellular activation domain and to study receptor behaviors when exposed
to various external conditions and pharmacological ligands. In the voltage-clamp configuration, a
feedback system detects variations in membrane potentials caused by the transient activation of
ion channels in the patch, using the set holding potential as a reference. The appropriate amount
of current required to “clamp” the membrane potential at the desired holding command is then
injected (Molleman, 2003). Finally, the size of the injected current is amplified and digitized for
computational analysis.
The procedure requires the use of an inverted microscope, in which the light source and
objectives are located above and bellow the cell preparation, respectively, providing enough space
for the manipulation of a micropipette in between. The microscope itself stands on an antivibration
table and is surrounded by a Faraday cage to shield undesirable electromagnetic fields away from
the preparation. The cells stand in a perfusion bath system, where a bathing solution is slowly and
continuously delivered by gravity while being drained from the surface by a vacuum system. This
allows fresh medium to be continuously replenished and prevents the buildup of exogenous
material delivered in the bath during experiments. External solutions are held above the
preparation and allowed to flow in the bath through a hand-made flow pipe. For our experiments,
the flow pipe was made from a borosilicate theta glass rod, allowing the simultaneous delivery of
a control (drug-free) and agonist-containing external solution from two separate exits naturally
generated by the septum of the glass. This perfusion system was directly connected to a piezo-
electric stack, which can trigger ultra-rapid (millisecond time-scale) lateral motions translated in
the flow pipe.
The patch excision technique requires the use of a glass micropipette filled with internal
solution and connected to a mouthpiece, allowing the controlled application of negative or positive
pressure at the opening of the micropipette. Using a fine manipulator, the pipette is first positioned
just above a selected cell. A high-resistance (GΩ-scale) is then generated between the micropipette
58
and the cell membrane (cell-attached configuration), and further negative pressure allows
perforation of the membrane (whole-cell configuration), at which point the internal solution
becomes continuous with the cytoplasm. As schematized in Figure 14 (left) the micropipette is
finally pulled upward to dissociate a piece of membrane, which folds back onto itself to create a
continuous patch of phospholipids interacting with the glass of the micropipette tip. In typical
experimental settings, the excised patch is placed in the flow of the control solution, and is then
transiently exposed to an agonist-containing solution in a precisely timed manner by activation of
the piezo-electric stack.
Two electrodes are required for an amplifier to monitor resulting changes in membrane
potentials. A silver-chloride wire placed within the solution-filled micropipette itself serves as the
electrode facing the cytosolic side of the membrane (the term “microelectrode” is sometimes
employed when referring to the combination of the micropipette and the conductive wire). On the
other hand, a ground electrode is submerged in bathing solution and maintained separate from the
main cell bath. Both electrodes form solid-liquid junction potentials, and are connected to each
other via a salt bridge to form a closed electrical circuit. A representation of the resulting circuit
formed by the microelectrode, the patch, the ground electrode and the probe (amplifier) is
illustrated in Figure 14 (right). The resistance generated by the membrane (Rpatch) is the resistance
imposed on ion fluxes; this resistance decreases with the activation of transmembrane ion
channels. Rpatch is held series with the resistance generated by the opening of the glass micropipette
(Rpipette), which depends on the size and shape of the tip. Both resistances are in parallel with a leak
resistance (Rleak), reflecting the quality of the seal between the patch and the pipette, and being
ideally maximized (megaohm (MΩ)-scale resistance) during patch excision to avoid current
leakages in the bath. In an outside-out patch configuration, Rpatch is significantly greater than
Rpipette. Since both electrodes face either side of the patch, the potential difference detected by the
probe essentially corresponds to the voltage drop generated by Rpatch - that is, the membrane
potential (Vm). The latter is monitored by the differential amplifier, which calculates its distance
from the desired holding potential (Vhold), as previously mentioned (Molleman, 2003).
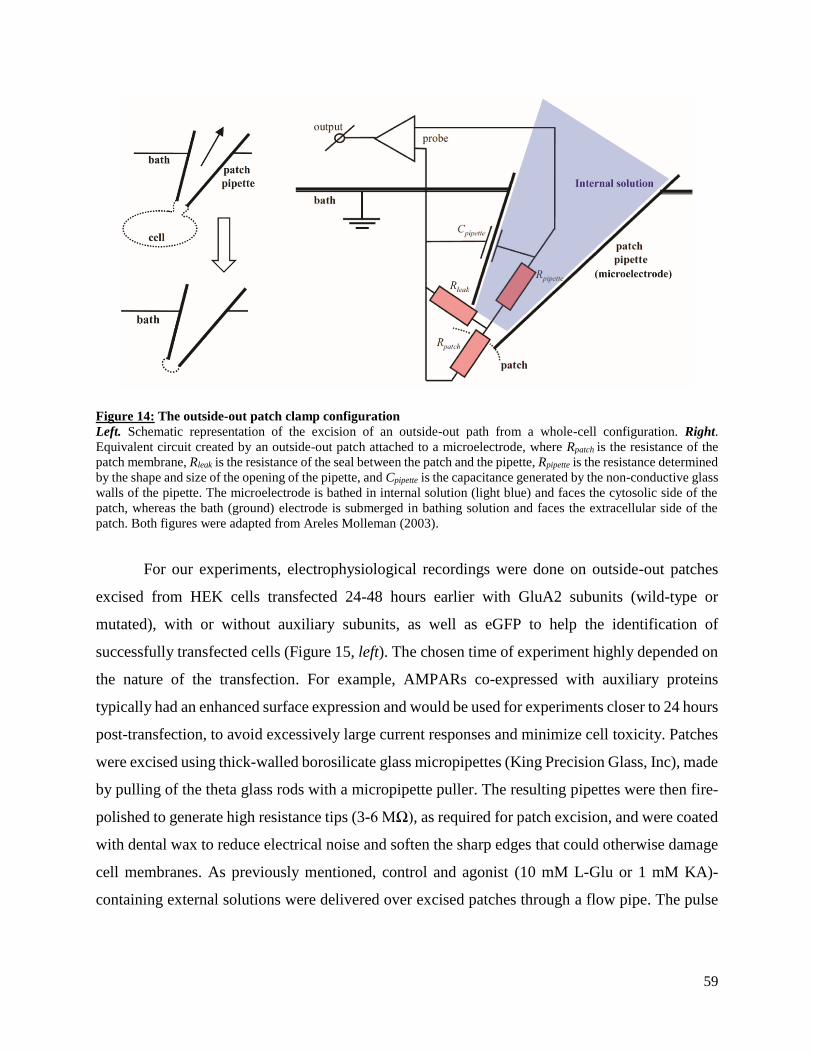
59
Figure 14: The outside-out patch clamp configuration
Left. Schematic representation of the excision of an outside-out path from a whole-cell configuration. Right.
Equivalent circuit created by an outside-out patch attached to a microelectrode, where Rpatch is the resistance of the
patch membrane, Rleak is the resistance of the seal between the patch and the pipette, Rpipette is the resistance determined
by the shape and size of the opening of the pipette, and Cpipette is the capacitance generated by the non-conductive glass
walls of the pipette. The microelectrode is bathed in internal solution (light blue) and faces the cytosolic side of the
patch, whereas the bath (ground) electrode is submerged in bathing solution and faces the extracellular side of the
patch. Both figures were adapted from Areles Molleman (2003).
For our experiments, electrophysiological recordings were done on outside-out patches
excised from HEK cells transfected 24-48 hours earlier with GluA2 subunits (wild-type or
mutated), with or without auxiliary subunits, as well as eGFP to help the identification of
successfully transfected cells (Figure 15, left). The chosen time of experiment highly depended on
the nature of the transfection. For example, AMPARs co-expressed with auxiliary proteins
typically had an enhanced surface expression and would be used for experiments closer to 24 hours
post-transfection, to avoid excessively large current responses and minimize cell toxicity. Patches
were excised using thick-walled borosilicate glass micropipettes (King Precision Glass, Inc), made
by pulling of the theta glass rods with a micropipette puller. The resulting pipettes were then fire-
polished to generate high resistance tips (3-6 MΩ), as required for patch excision, and were coated
with dental wax to reduce electrical noise and soften the sharp edges that could otherwise damage
cell membranes. As previously mentioned, control and agonist (10 mM L-Glu or 1 mM KA)-
containing external solutions were delivered over excised patches through a flow pipe. The pulse
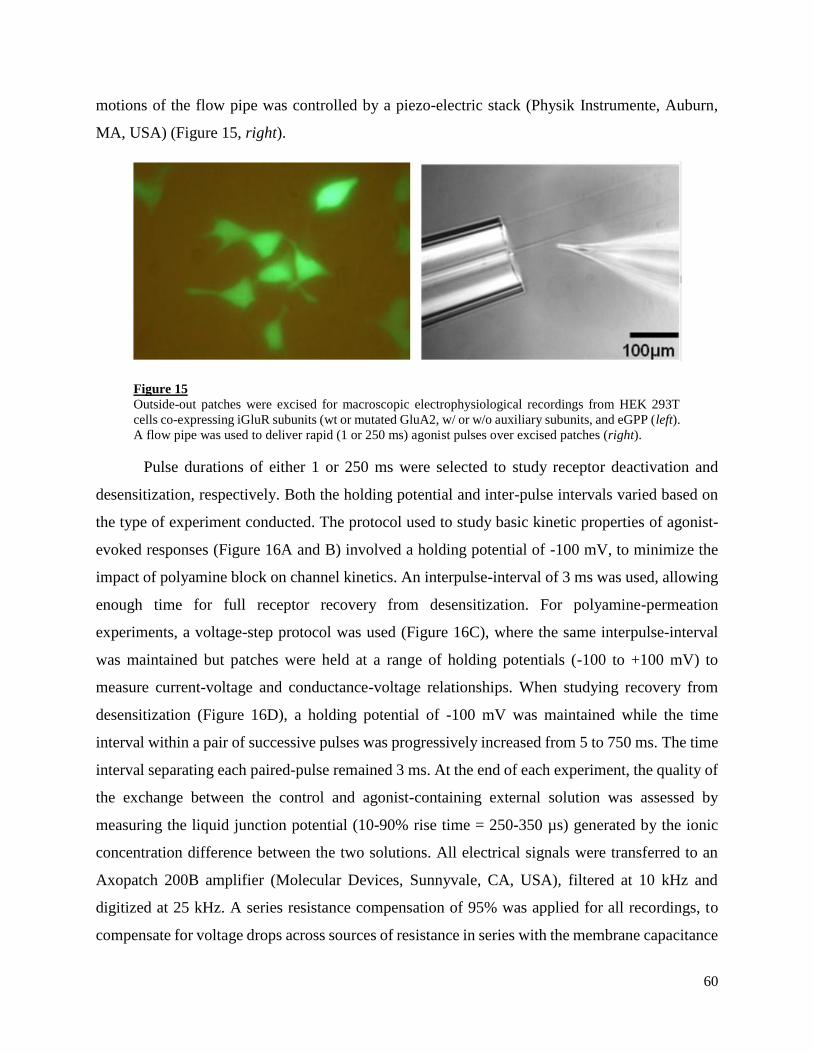
60
motions of the flow pipe was controlled by a piezo-electric stack (Physik Instrumente, Auburn,
MA, USA) (Figure 15, right).
Figure 15
Outside-out patches were excised for macroscopic electrophysiological recordings from HEK 293T
cells co-expressing iGluR subunits (wt or mutated GluA2, w/ or w/o auxiliary subunits, and eGPP (left).
A flow pipe was used to deliver rapid (1 or 250 ms) agonist pulses over excised patches (right).
Pulse durations of either 1 or 250 ms were selected to study receptor deactivation and
desensitization, respectively. Both the holding potential and inter-pulse intervals varied based on
the type of experiment conducted. The protocol used to study basic kinetic properties of agonist-
evoked responses (Figure 16A and B) involved a holding potential of -100 mV, to minimize the
impact of polyamine block on channel kinetics. An interpulse-interval of 3 ms was used, allowing
enough time for full receptor recovery from desensitization. For polyamine-permeation
experiments, a voltage-step protocol was used (Figure 16C), where the same interpulse-interval
was maintained but patches were held at a range of holding potentials (-100 to +100 mV) to
measure current-voltage and conductance-voltage relationships. When studying recovery from
desensitization (Figure 16D), a holding potential of -100 mV was maintained while the time
interval within a pair of successive pulses was progressively increased from 5 to 750 ms. The time
interval separating each paired-pulse remained 3 ms. At the end of each experiment, the quality of
the exchange between the control and agonist-containing external solution was assessed by
measuring the liquid junction potential (10-90% rise time = 250-350 µs) generated by the ionic
concentration difference between the two solutions. All electrical signals were transferred to an
Axopatch 200B amplifier (Molecular Devices, Sunnyvale, CA, USA), filtered at 10 kHz and
digitized at 25 kHz. A series resistance compensation of 95% was applied for all recordings, to
compensate for voltage drops across sources of resistance in series with the membrane capacitance
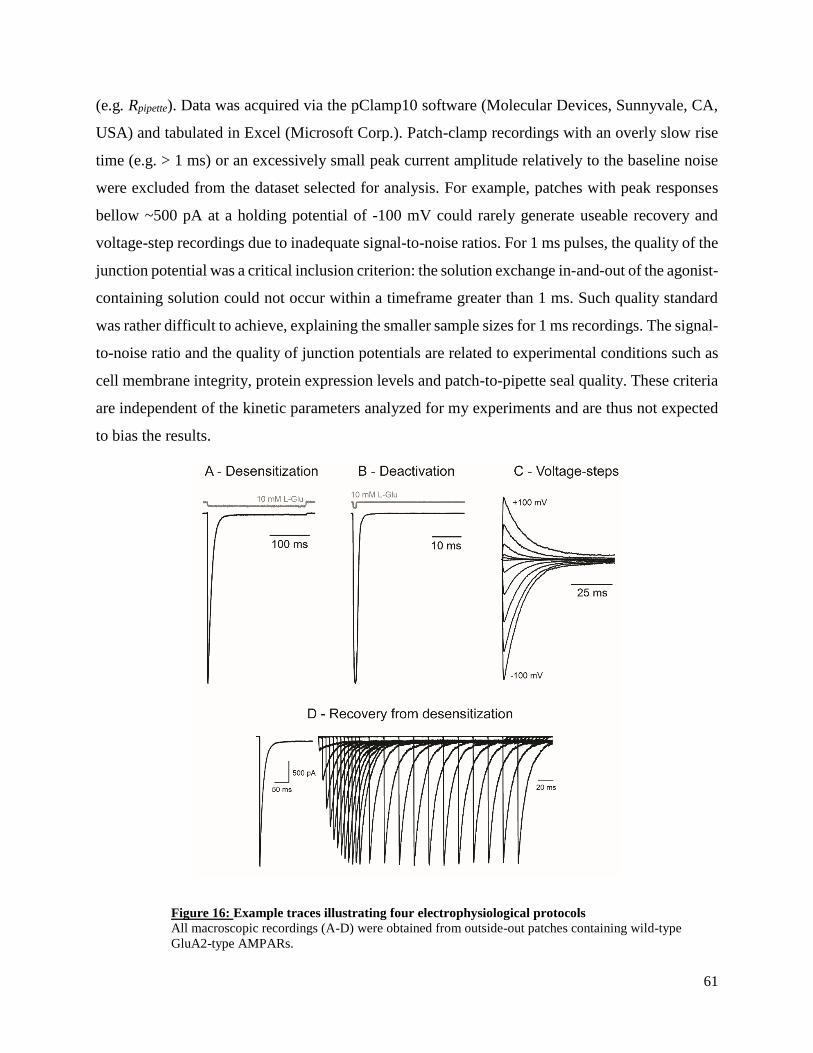
61
(e.g. Rpipette). Data was acquired via the pClamp10 software (Molecular Devices, Sunnyvale, CA,
USA) and tabulated in Excel (Microsoft Corp.). Patch-clamp recordings with an overly slow rise
time (e.g. > 1 ms) or an excessively small peak current amplitude relatively to the baseline noise
were excluded from the dataset selected for analysis. For example, patches with peak responses
bellow ~500 pA at a holding potential of -100 mV could rarely generate useable recovery and
voltage-step recordings due to inadequate signal-to-noise ratios. For 1 ms pulses, the quality of the
junction potential was a critical inclusion criterion: the solution exchange in-and-out of the agonist-
containing solution could not occur within a timeframe greater than 1 ms. Such quality standard
was rather difficult to achieve, explaining the smaller sample sizes for 1 ms recordings. The signal-
to-noise ratio and the quality of junction potentials are related to experimental conditions such as
cell membrane integrity, protein expression levels and patch-to-pipette seal quality. These criteria
are independent of the kinetic parameters analyzed for my experiments and are thus not expected
to bias the results.
Figure 16: Example traces illustrating four electrophysiological protocols
All macroscopic recordings (A-D) were obtained from outside-out patches containing wild-type
GluA2-type AMPARs.
62
3.3. Analysis of electrophysiological data
Kinetic properties of macroscopic AMPAR-mediated responses were analyzed using the
pClamp10 software (Molecular Devices). For each patch, kinetic parameters were studied on an
average trace, combining multiple sweeps obtained from the same protocol. The pClamp software
was used to measure estimates of the rise time (ms), peak and average equilibrium amplitudes
(pA). Current decay kinetics were fitted using the Chebyshev method on a standard equation
exponential decay:
𝑓(𝑡) = ∑ 𝐴𝑖 ∗ 𝑒−𝑡/τ𝑖 + 𝐶𝑛𝑖=1 (2.1)
where f(t) is the change in current over time, A is the current amplitude area under the curve, C is
current offset at t = 0, τ is the exponential time constant and the exponent n specifies the number
of terms. The value of τ was extracted for each recording as a comparative measure of decay
kinetics. The latter is inversely proportional to the decay rate, and can be seen as the time required
for the current amplitude to reach 1/e of its initial peak value. In most cases, current decay was
fitted using a second-order equation (n = 2), generating two time constants. Both values were
reported (τfast and τslow), and a weighted constant (τw) was calculated by multiplying each τ with its
relative amplitude contribution, as followed:
τ𝑤 = τ𝑓𝑎𝑠𝑡 ∗𝐴𝑓𝑎𝑠𝑡
(𝐴𝑓𝑎𝑠𝑡+𝐴𝑠𝑙𝑜𝑤)+ τ𝑠𝑙𝑜𝑤 ∗
𝐴𝑠𝑙𝑜𝑤
(𝐴𝑓𝑎𝑠𝑡+𝐴𝑠𝑙𝑜𝑤) (2.2)
where Afast and Aslow are the amplitude contributions to τfast and τslow, respectively. The choice of a
first- or second-order equation was based on the quality of the resulting fits (correlation coefficient
closest to 1). For patches containing AMPARs without auxiliary proteins, the relative contribution
of the slow component was sometimes too small for the software to discriminate an accurate
measure of τslow. On the other hand, virtually all auxiliary protein-containing patches generated
recordings that were best fitted with a second-order equation.
Polyamine-permeation experiments involved a voltage-step protocol in which peak-current
amplitudes were measured at holding membrane potentials ranging between -100 and +100 mV.
For each potential, the agonist (L-Glu)-evoked membrane conductance was calculated based on
the Ohm`s law principle, relating conductance (G), potential difference (V) and current (I) as G =
63
I/V. The reversal potential (Vrev) was measured for each recording and subtracted from the holding
potential (V), generating the following equation for membrane conductance:
𝐺 = 𝐼
(𝑉−𝑉𝑟𝑒𝑣) (2.3)
Relationships between conductance and voltage (G-V) were plotted and fitted using Origin7
(OriginLab, Northampton, MA, USA) with the equation:
𝐺 = 𝐺𝑚𝑎𝑥
1+ [𝑆𝑝𝑚]
𝑔∗𝑒𝑉 ℎ⁄ +𝐿∗𝑒𝑉 𝑘⁄
(2.4)
where Gmax is the maximal conductance and [Spm] is the spermine concentration in the internal
solution (fixed at 30 µM for all experiments) (Bowie et al., 1998). The polyamine dissociation
constant (Kd) was defined by the equation:
𝐾𝑑 = 𝑔 ∗ 𝑒𝑉 ℎ⁄ + 𝐿 ∗ 𝑒𝑉 𝑘⁄ (2.5)
where V is the holding potential and g, L, h, and k, are terms for binding, unbinding and permeation,
respectively (extensively described in Bowie et al. (1998). Notably, h and k relate to voltage
dependencies of the onset (binding) and relief (unbinding) of polyamine block, respectively. Kd
values were calculated and reported at 0 mV, at which equation 2.5 is simplified to:
𝐾𝑑(0 mV) = 𝑔 + 𝐿 (2.6)
As mentioned earlier, receptor recovery from desensitization was studied using a two-pulse
protocol, where the time interval between an initial and second (test) pulse was progressively
increased. The recovery ratio at each time interval was defined as the fraction of the peak amplitude
of the test pulse to that of the initial pulse, such that a ratio of 1 reflected complete recovery.
Recovery ratios were plotted over time and fitted using Origin7 with the following Hodgkin-
Huxley equation:
𝑅(𝑡) = 𝑁0 + (1 − 𝑁0) ∗ (1 − 𝑒−𝑘𝑟𝑒𝑐∗𝑡)𝑛 (2.7)
Here, R(t) is the recovery ratio at any time interval t, N0 is the recovery ratio at t=0 (calculated as
the mean equilibrium current amplitude measured at the end of the initial pulse, relatively to the
peak amplitude of that same pulse) and krec is the rate of recovery. The exponent n defines the
order of the exponential recovery equation, which functionally reflects the number of kinetic
64
processes by which recovery takes place over time. In the case of wild-type AMPA receptors,
recovery models were observed to deviate from a single-order process where the four subunits
interact in a concerted manner to mediate recovery (Bowie and Lange, 2002). Instead, an exponent
of n = 2 was found to be more suited for the fitting of recovery kinetics (Robert et al., 2005) and
was used here as a fixed value for all conditions. A time constant of recovery (τrec) was computed
as the inverse of the recovery rate:
τ𝑟𝑒𝑐 = 1 𝑘𝑟𝑒𝑐⁄ (2.8)
and used as the reported measure of recovery to be compared across experimental conditions. All
analyzed values were tabulated in Microsoft Excel (Microsoft corp.), where arithmetic means,
sample standard deviations and standard errors were calculated.
4. Statistical methods
Statistical analyses were performed using a custom program kindly provided by Dr. Joseph
Rochford. All data sets were subjected to normality tests before any pairwise comparison analysis.
The Student’s T-test and Mann-Whitney U-test was used for normally and abnormally distributed
data, respectively. A Bonferroni correction was applied in cases of multiple pairwise comparisons.
Results are expressed as means +/- standard error of the mean (S.E.M.), n being the number of
patches for each given condition. An alpha level of 0.05 was chosen for minimal significance, and
statistical results are identified as p < 0.05 (*) and p < 0.01 (**). Effect sizes were estimated in
some instances to evaluate the magnitude of a change from one condition to the other. Results
from F-tests for equality of variances indicated that Glass’s delta (∆) was an adequate measure of
effect size for the present dataset.

65
PART III:
RESULTS
66
1. Both γ2 and CNIH3 slow the time course of AMPAR desensitization and enhance the
equilibrium response
To obtain detailed comparative data on the effect of CNIHs vs TARPs on AMPAR
desensitization, patches of membrane expressing GluA2 homomers (flip, unedited), both alone and
in combination with CNIH3 or γ2 subunits, were excised from HEK cells and exposed to long
pulses (250ms) of an extracellular, full agonist (L-Glu) solution in the outside-out patch-clamp
configuration (figure 17A). For each experiment, the fast (τfast) and slow (τslow) components of
exponential current decay were measured from an average trace together with their relative
contribution (Afast and Aslow, respectively) to obtain weighted average (τw). The mean size of the
steady-state current was measured from the equilibrium response near the end of each agonist pulse
and converted into a percent of the peak current amplitude to obtain a relative equilibrium current
(Ieq).
As expected, GluA2 homomers desensitized rapidly, with a weighted time constant of 8.5
± 0.4 ms (n = 20), which is consistent with previously reported values measured in similar
conditions (Robert et al., 2005; Priel et al., 2005). Desensitization kinetics were dominated by the
fast component of exponential decay, τslow contributing to only 2% of the desensitizing traces on
average (2.3 ± 1.4 %, n = 20). As shown in figure 17 (A-C) the presence of both CNIH3 and γ2
auxiliary subunits slowed the process of desensitization, primarily by increasing the relative
contribution of the slow component (figure 17D), making desensitized responses markedly bi-
exponential. This slowing effect was more prominent in the presence of CNIH3 (τw = 44.0 ± 4.0
ms, n = 31; Aslow = 49.0 ± 3.2 %, n = 31) than γ2 (τw = 18.8 ± 1.3 ms, n = 23; Aslow= 29.3 ± 4.9 %,
n = 23). In fact, despite both auxiliary subunits generating a significantly larger weighted time-
constant of desensitization compared to GluA2 receptors alone, the effect size (Glass’s delta (∆)
of auxiliary proteins was much larger in the case of CNIH3-associated receptors (∆ = 22.7)
compared to γ2-associated receptors (∆ = 6.6). Furthermore, co-expression with CNIH3 raised the
absolute mean time constants of both the slow and fast components of decay kinetics (τfast = 8.2 ±
0.4 ms, n = 20 and τslow = 48.0 ± 5.4 ms, n = 13 for GluA2 alone; τfast = 17.8 ± 1.0 ms, n = 31 and
τslow = 70.6 ± 5.9 ms, n = 31 for GluA2 + CNIH3), while the effect of γ2 on these same parameters
was more subtle (τfast = 12.0 ± 0.7, n = 22 and τslow = 52.3 ± 10.9 ms, n = 21).
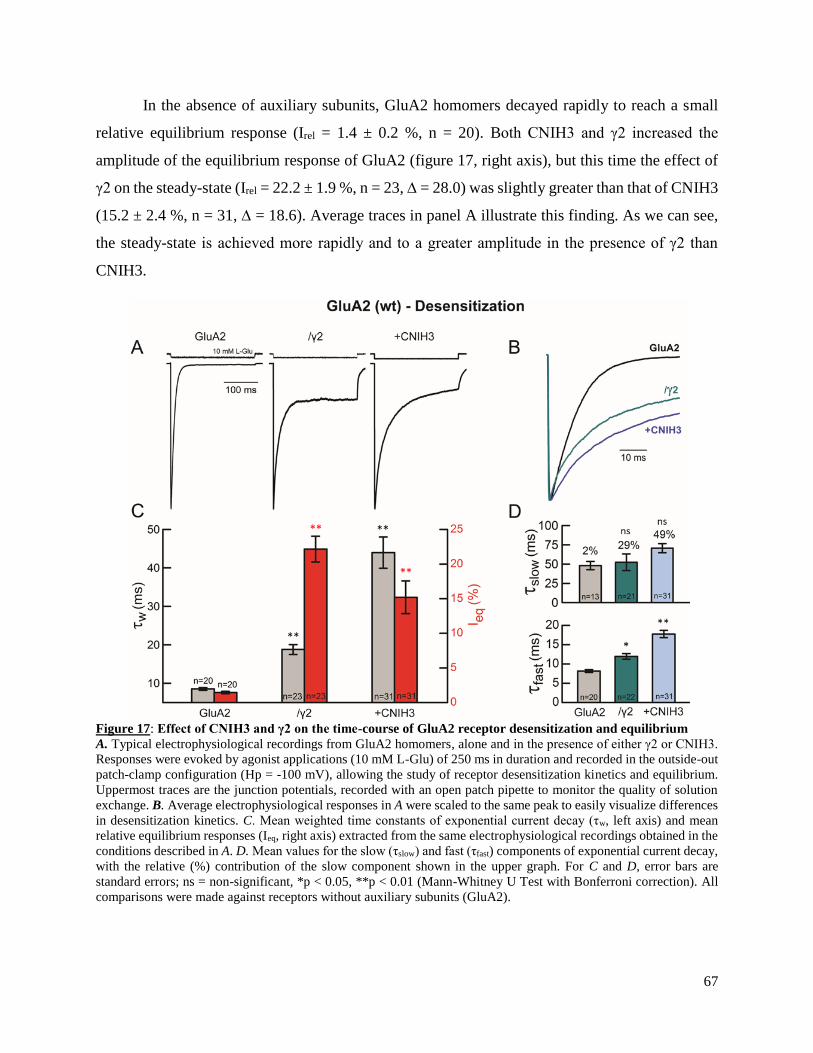
67
In the absence of auxiliary subunits, GluA2 homomers decayed rapidly to reach a small
relative equilibrium response (Irel = 1.4 ± 0.2 %, n = 20). Both CNIH3 and γ2 increased the
amplitude of the equilibrium response of GluA2 (figure 17, right axis), but this time the effect of
γ2 on the steady-state (Irel = 22.2 ± 1.9 %, n = 23, ∆ = 28.0) was slightly greater than that of CNIH3
(15.2 ± 2.4 %, n = 31, ∆ = 18.6). Average traces in panel A illustrate this finding. As we can see,
the steady-state is achieved more rapidly and to a greater amplitude in the presence of γ2 than
CNIH3.
Figure 17: Effect of CNIH3 and γ2 on the time-course of GluA2 receptor desensitization and equilibrium
A. Typical electrophysiological recordings from GluA2 homomers, alone and in the presence of either γ2 or CNIH3.
Responses were evoked by agonist applications (10 mM L-Glu) of 250 ms in duration and recorded in the outside-out
patch-clamp configuration (Hp = -100 mV), allowing the study of receptor desensitization kinetics and equilibrium.
Uppermost traces are the junction potentials, recorded with an open patch pipette to monitor the quality of solution
exchange. B. Average electrophysiological responses in A were scaled to the same peak to easily visualize differences
in desensitization kinetics. C. Mean weighted time constants of exponential current decay (τw, left axis) and mean
relative equilibrium responses (Ieq, right axis) extracted from the same electrophysiological recordings obtained in the
conditions described in A. D. Mean values for the slow (τslow) and fast (τfast) components of exponential current decay,
with the relative (%) contribution of the slow component shown in the upper graph. For C and D, error bars are
standard errors; ns = non-significant, *p < 0.05, **p < 0.01 (Mann-Whitney U Test with Bonferroni correction). All
comparisons were made against receptors without auxiliary subunits (GluA2).
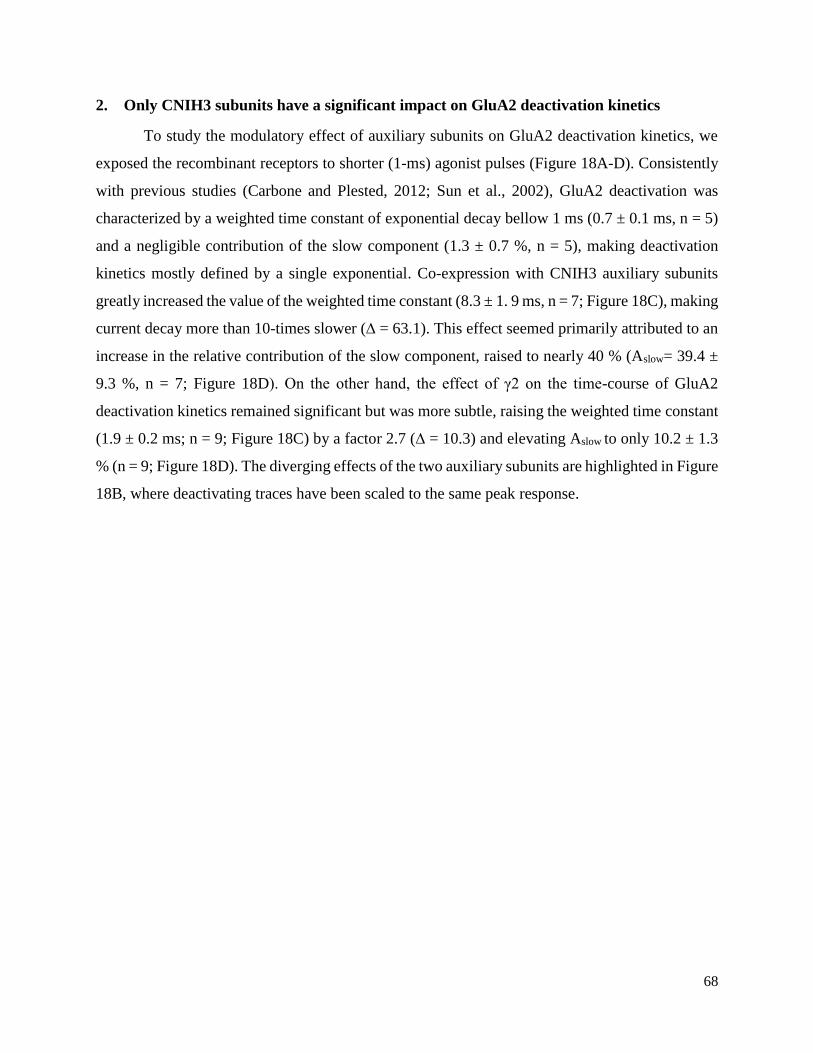
68
2. Only CNIH3 subunits have a significant impact on GluA2 deactivation kinetics
To study the modulatory effect of auxiliary subunits on GluA2 deactivation kinetics, we
exposed the recombinant receptors to shorter (1-ms) agonist pulses (Figure 18A-D). Consistently
with previous studies (Carbone and Plested, 2012; Sun et al., 2002), GluA2 deactivation was
characterized by a weighted time constant of exponential decay bellow 1 ms (0.7 ± 0.1 ms, n = 5)
and a negligible contribution of the slow component (1.3 ± 0.7 %, n = 5), making deactivation
kinetics mostly defined by a single exponential. Co-expression with CNIH3 auxiliary subunits
greatly increased the value of the weighted time constant (8.3 ± 1. 9 ms, n = 7; Figure 18C), making
current decay more than 10-times slower (∆ = 63.1). This effect seemed primarily attributed to an
increase in the relative contribution of the slow component, raised to nearly 40 % (Aslow= 39.4 ±
9.3 %, n = 7; Figure 18D). On the other hand, the effect of γ2 on the time-course of GluA2
deactivation kinetics remained significant but was more subtle, raising the weighted time constant
(1.9 ± 0.2 ms; n = 9; Figure 18C) by a factor 2.7 (∆ = 10.3) and elevating Aslow to only 10.2 ± 1.3
% (n = 9; Figure 18D). The diverging effects of the two auxiliary subunits are highlighted in Figure
18B, where deactivating traces have been scaled to the same peak response.
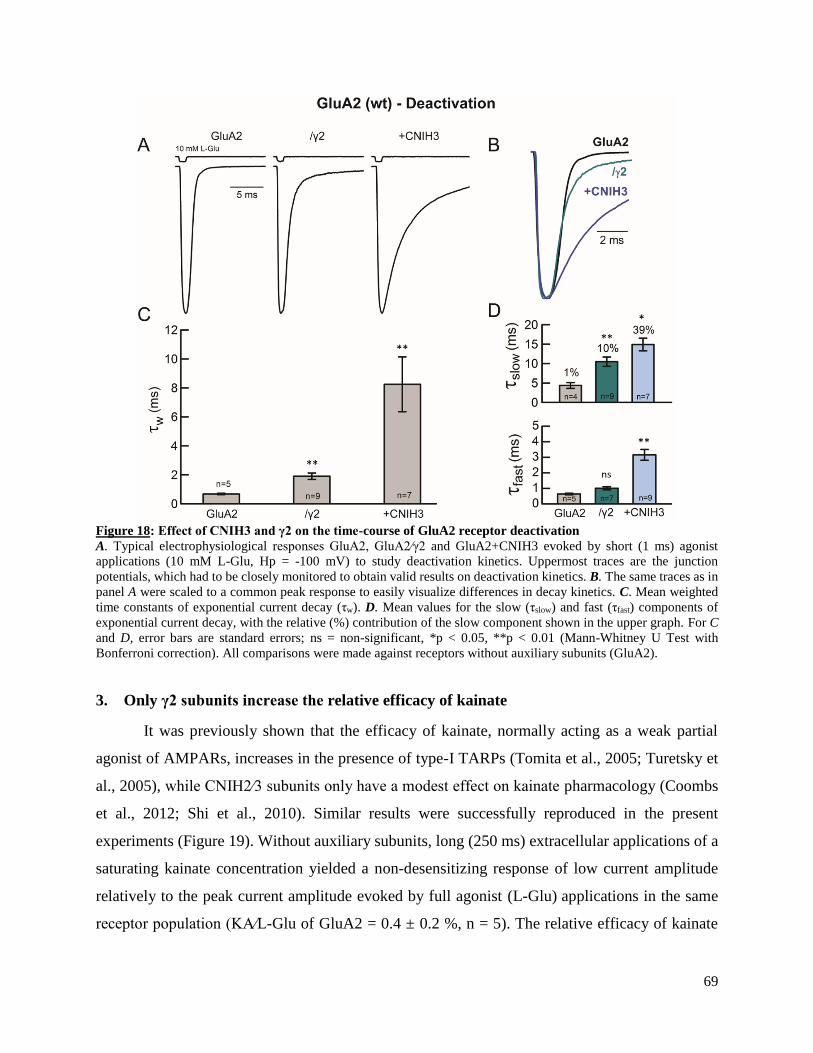
69
Figure 18: Effect of CNIH3 and γ2 on the time-course of GluA2 receptor deactivation
A. Typical electrophysiological responses GluA2, GluA2∕γ2 and GluA2+CNIH3 evoked by short (1 ms) agonist
applications (10 mM L-Glu, Hp = -100 mV) to study deactivation kinetics. Uppermost traces are the junction
potentials, which had to be closely monitored to obtain valid results on deactivation kinetics. B. The same traces as in
panel A were scaled to a common peak response to easily visualize differences in decay kinetics. C. Mean weighted
time constants of exponential current decay (τw). D. Mean values for the slow (τslow) and fast (τfast) components of
exponential current decay, with the relative (%) contribution of the slow component shown in the upper graph. For C
and D, error bars are standard errors; ns = non-significant, *p < 0.05, **p < 0.01 (Mann-Whitney U Test with
Bonferroni correction). All comparisons were made against receptors without auxiliary subunits (GluA2).
3. Only γ2 subunits increase the relative efficacy of kainate
It was previously shown that the efficacy of kainate, normally acting as a weak partial
agonist of AMPARs, increases in the presence of type-I TARPs (Tomita et al., 2005; Turetsky et
al., 2005), while CNIH2∕3 subunits only have a modest effect on kainate pharmacology (Coombs
et al., 2012; Shi et al., 2010). Similar results were successfully reproduced in the present
experiments (Figure 19). Without auxiliary subunits, long (250 ms) extracellular applications of a
saturating kainate concentration yielded a non-desensitizing response of low current amplitude
relatively to the peak current amplitude evoked by full agonist (L-Glu) applications in the same
receptor population (KA∕L-Glu of GluA2 = 0.4 ± 0.2 %, n = 5). The relative efficacy of kainate
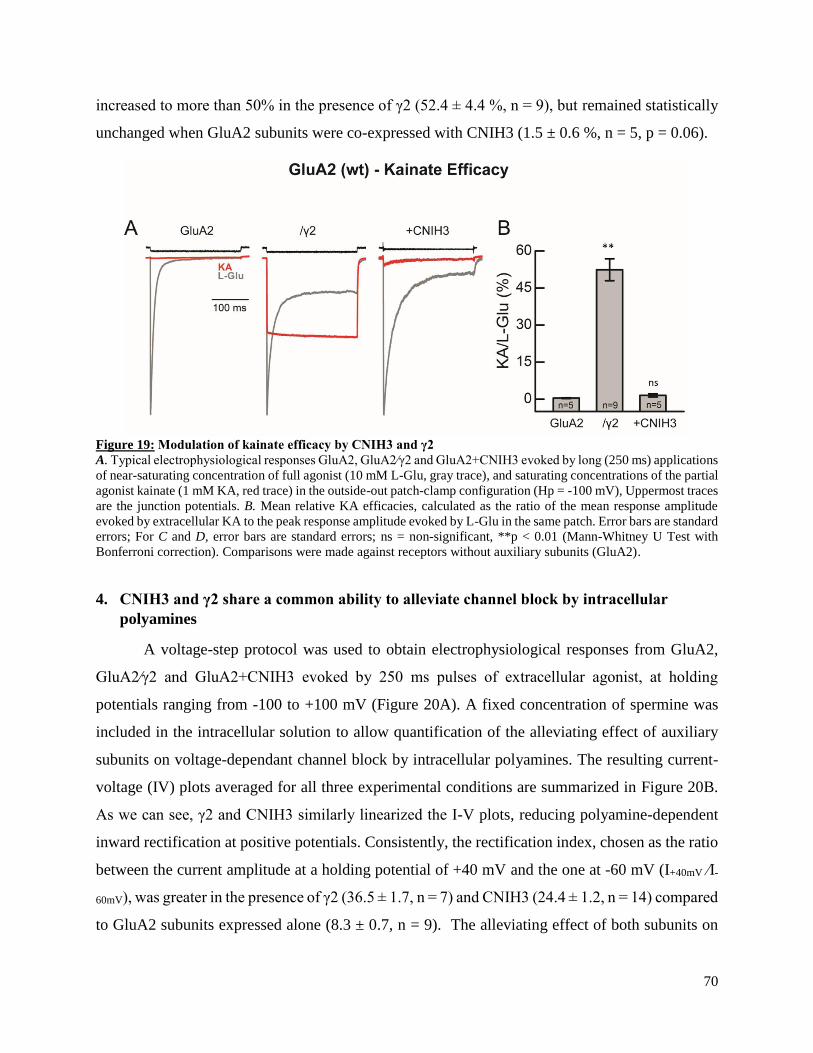
70
increased to more than 50% in the presence of γ2 (52.4 ± 4.4 %, n = 9), but remained statistically
unchanged when GluA2 subunits were co-expressed with CNIH3 (1.5 ± 0.6 %, n = 5, p = 0.06).
Figure 19: Modulation of kainate efficacy by CNIH3 and γ2
A. Typical electrophysiological responses GluA2, GluA2∕γ2 and GluA2+CNIH3 evoked by long (250 ms) applications
of near-saturating concentration of full agonist (10 mM L-Glu, gray trace), and saturating concentrations of the partial
agonist kainate (1 mM KA, red trace) in the outside-out patch-clamp configuration (Hp = -100 mV), Uppermost traces
are the junction potentials. B. Mean relative KA efficacies, calculated as the ratio of the mean response amplitude
evoked by extracellular KA to the peak response amplitude evoked by L-Glu in the same patch. Error bars are standard
errors; For C and D, error bars are standard errors; ns = non-significant, **p < 0.01 (Mann-Whitney U Test with
Bonferroni correction). Comparisons were made against receptors without auxiliary subunits (GluA2).
4. CNIH3 and γ2 share a common ability to alleviate channel block by intracellular
polyamines
A voltage-step protocol was used to obtain electrophysiological responses from GluA2,
GluA2∕γ2 and GluA2+CNIH3 evoked by 250 ms pulses of extracellular agonist, at holding
potentials ranging from -100 to +100 mV (Figure 20A). A fixed concentration of spermine was
included in the intracellular solution to allow quantification of the alleviating effect of auxiliary
subunits on voltage-dependant channel block by intracellular polyamines. The resulting current-
voltage (IV) plots averaged for all three experimental conditions are summarized in Figure 20B.
As we can see, γ2 and CNIH3 similarly linearized the I-V plots, reducing polyamine-dependent
inward rectification at positive potentials. Consistently, the rectification index, chosen as the ratio
between the current amplitude at a holding potential of +40 mV and the one at -60 mV (I+40mV ∕I-
60mV), was greater in the presence of γ2 (36.5 ± 1.7, n = 7) and CNIH3 (24.4 ± 1.2, n = 14) compared
to GluA2 subunits expressed alone (8.3 ± 0.7, n = 9). The alleviating effect of both subunits on
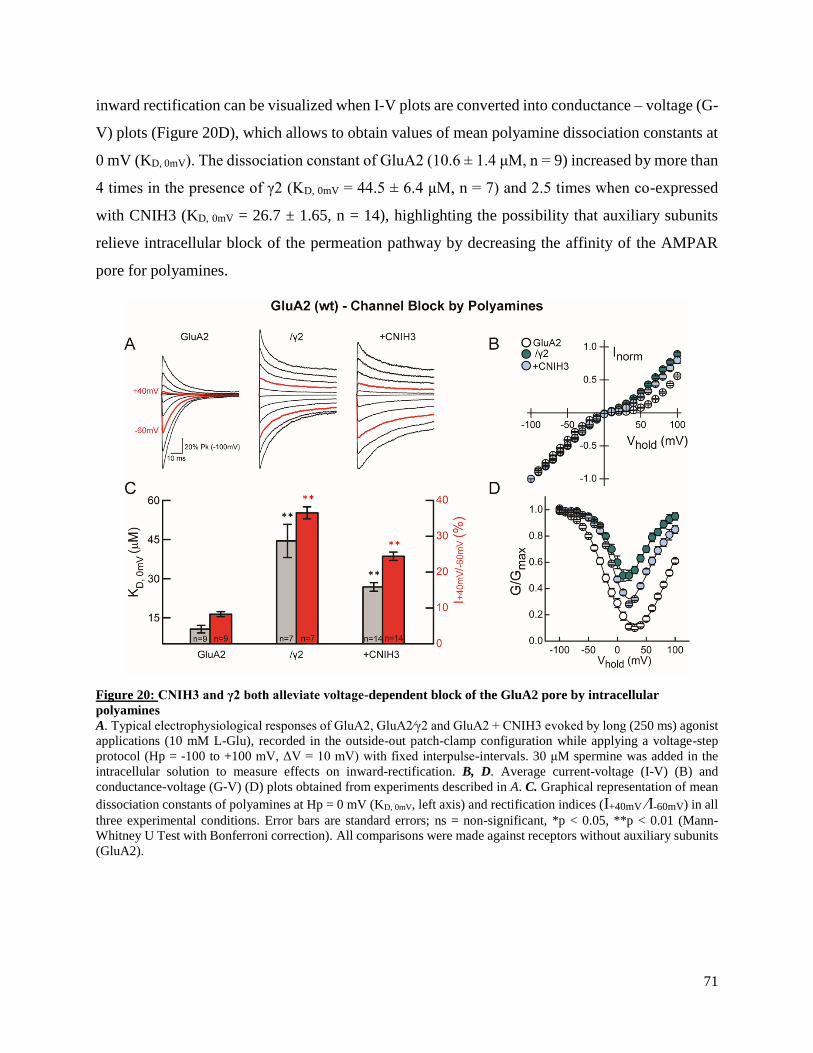
71
inward rectification can be visualized when I-V plots are converted into conductance – voltage (G-
V) plots (Figure 20D), which allows to obtain values of mean polyamine dissociation constants at
0 mV (KD, 0mV). The dissociation constant of GluA2 (10.6 ± 1.4 μM, n = 9) increased by more than
4 times in the presence of γ2 (KD, 0mV = 44.5 ± 6.4 μM, n = 7) and 2.5 times when co-expressed
with CNIH3 (KD, 0mV = 26.7 ± 1.65, n = 14), highlighting the possibility that auxiliary subunits
relieve intracellular block of the permeation pathway by decreasing the affinity of the AMPAR
pore for polyamines.
Figure 20: CNIH3 and γ2 both alleviate voltage-dependent block of the GluA2 pore by intracellular
polyamines
A. Typical electrophysiological responses of GluA2, GluA2∕γ2 and GluA2 + CNIH3 evoked by long (250 ms) agonist
applications (10 mM L-Glu), recorded in the outside-out patch-clamp configuration while applying a voltage-step
protocol (Hp = -100 to +100 mV, ΔV = 10 mV) with fixed interpulse-intervals. 30 μM spermine was added in the
intracellular solution to measure effects on inward-rectification. B, D. Average current-voltage (I-V) (B) and
conductance-voltage (G-V) (D) plots obtained from experiments described in A. C. Graphical representation of mean
dissociation constants of polyamines at Hp = 0 mV (KD, 0mV, left axis) and rectification indices (I+40mV ∕I-60mV) in all
three experimental conditions. Error bars are standard errors; ns = non-significant, *p < 0.05, **p < 0.01 (Mann-
Whitney U Test with Bonferroni correction). All comparisons were made against receptors without auxiliary subunits
(GluA2).
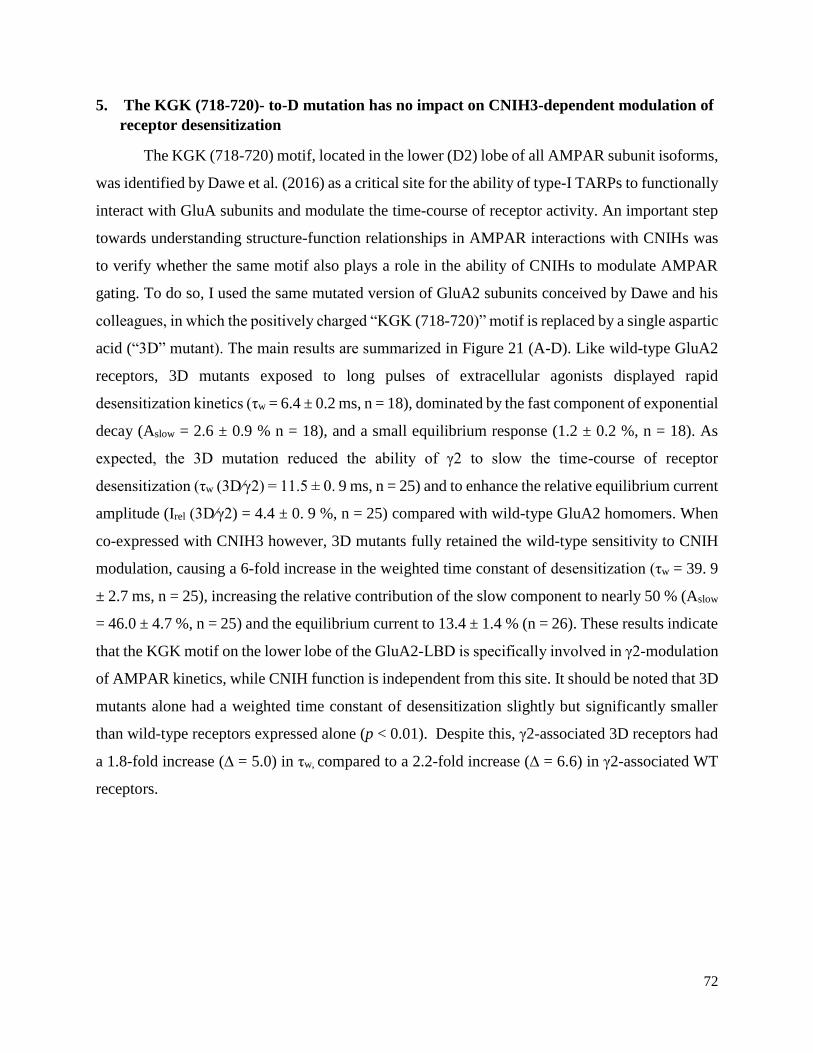
72
5. The KGK (718-720)- to-D mutation has no impact on CNIH3-dependent modulation of
receptor desensitization
The KGK (718-720) motif, located in the lower (D2) lobe of all AMPAR subunit isoforms,
was identified by Dawe et al. (2016) as a critical site for the ability of type-I TARPs to functionally
interact with GluA subunits and modulate the time-course of receptor activity. An important step
towards understanding structure-function relationships in AMPAR interactions with CNIHs was
to verify whether the same motif also plays a role in the ability of CNIHs to modulate AMPAR
gating. To do so, I used the same mutated version of GluA2 subunits conceived by Dawe and his
colleagues, in which the positively charged “KGK (718-720)” motif is replaced by a single aspartic
acid (“3D” mutant). The main results are summarized in Figure 21 (A-D). Like wild-type GluA2
receptors, 3D mutants exposed to long pulses of extracellular agonists displayed rapid
desensitization kinetics (τw = 6.4 ± 0.2 ms, n = 18), dominated by the fast component of exponential
decay (Aslow = 2.6 ± 0.9 % n = 18), and a small equilibrium response (1.2 ± 0.2 %, n = 18). As
expected, the 3D mutation reduced the ability of γ2 to slow the time-course of receptor
desensitization (τw (3D∕γ2) = 11.5 ± 0. 9 ms, n = 25) and to enhance the relative equilibrium current
amplitude (Irel (3D∕γ2) = 4.4 ± 0. 9 %, n = 25) compared with wild-type GluA2 homomers. When
co-expressed with CNIH3 however, 3D mutants fully retained the wild-type sensitivity to CNIH
modulation, causing a 6-fold increase in the weighted time constant of desensitization (τw = 39. 9
± 2.7 ms, n = 25), increasing the relative contribution of the slow component to nearly 50 % (Aslow
= 46.0 ± 4.7 %, n = 25) and the equilibrium current to 13.4 ± 1.4 % (n = 26). These results indicate
that the KGK motif on the lower lobe of the GluA2-LBD is specifically involved in γ2-modulation
of AMPAR kinetics, while CNIH function is independent from this site. It should be noted that 3D
mutants alone had a weighted time constant of desensitization slightly but significantly smaller
than wild-type receptors expressed alone (p < 0.01). Despite this, γ2-associated 3D receptors had
a 1.8-fold increase (∆ = 5.0) in τw, compared to a 2.2-fold increase (∆ = 6.6) in γ2-associated WT
receptors.
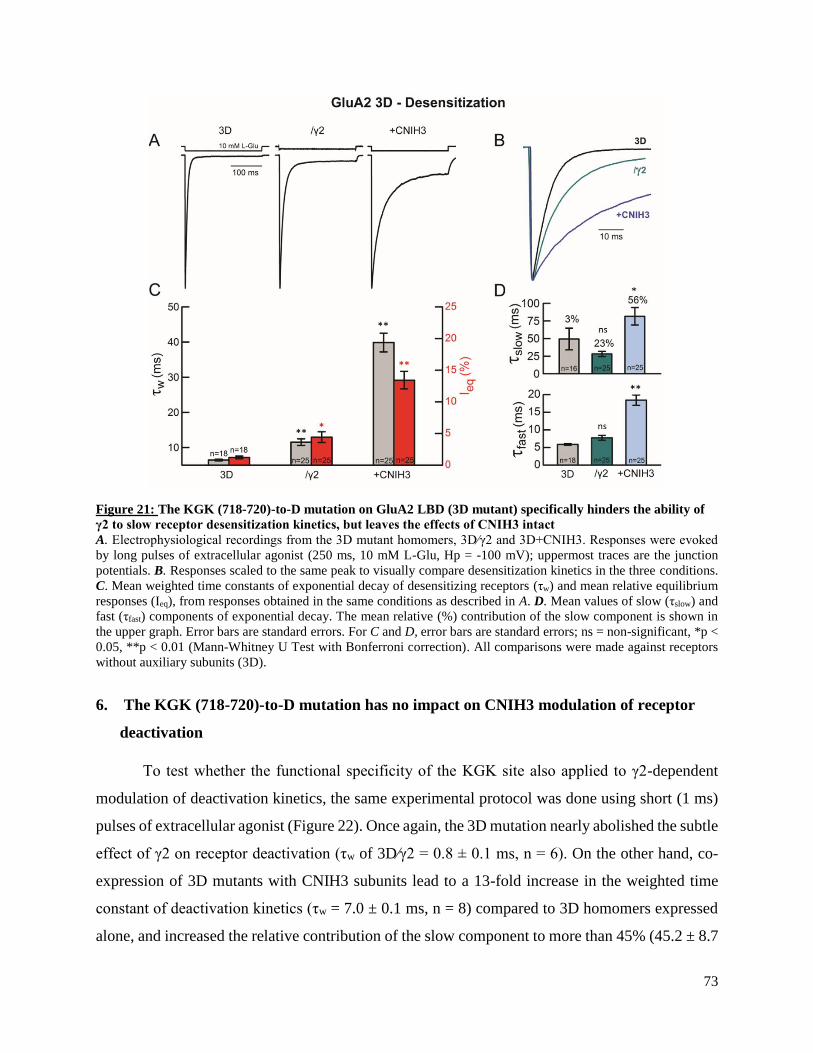
73
Figure 21: The KGK (718-720)-to-D mutation on GluA2 LBD (3D mutant) specifically hinders the ability of
γ2 to slow receptor desensitization kinetics, but leaves the effects of CNIH3 intact
A. Electrophysiological recordings from the 3D mutant homomers, 3D∕γ2 and 3D+CNIH3. Responses were evoked
by long pulses of extracellular agonist (250 ms, 10 mM L-Glu, Hp = -100 mV); uppermost traces are the junction
potentials. B. Responses scaled to the same peak to visually compare desensitization kinetics in the three conditions.
C. Mean weighted time constants of exponential decay of desensitizing receptors (τw) and mean relative equilibrium
responses (Ieq), from responses obtained in the same conditions as described in A. D. Mean values of slow (τslow) and
fast (τfast) components of exponential decay. The mean relative (%) contribution of the slow component is shown in
the upper graph. Error bars are standard errors. For C and D, error bars are standard errors; ns = non-significant, *p <
0.05, **p < 0.01 (Mann-Whitney U Test with Bonferroni correction). All comparisons were made against receptors
without auxiliary subunits (3D).
6. The KGK (718-720)-to-D mutation has no impact on CNIH3 modulation of receptor
deactivation
To test whether the functional specificity of the KGK site also applied to γ2-dependent
modulation of deactivation kinetics, the same experimental protocol was done using short (1 ms)
pulses of extracellular agonist (Figure 22). Once again, the 3D mutation nearly abolished the subtle
effect of γ2 on receptor deactivation (τw of 3D∕γ2 = 0.8 ± 0.1 ms, n = 6). On the other hand, co-
expression of 3D mutants with CNIH3 subunits lead to a 13-fold increase in the weighted time
constant of deactivation kinetics (τw = 7.0 ± 0.1 ms, n = 8) compared to 3D homomers expressed
alone, and increased the relative contribution of the slow component to more than 45% (45.2 ± 8.7
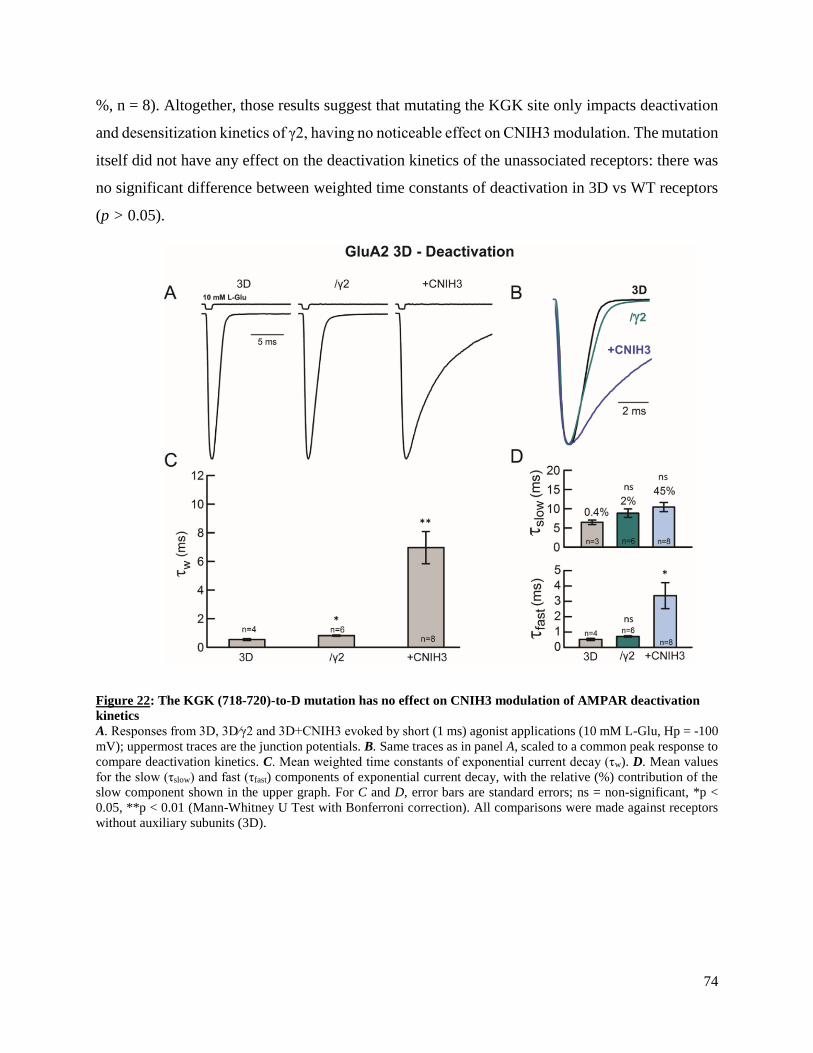
74
%, n = 8). Altogether, those results suggest that mutating the KGK site only impacts deactivation
and desensitization kinetics of γ2, having no noticeable effect on CNIH3 modulation. The mutation
itself did not have any effect on the deactivation kinetics of the unassociated receptors: there was
no significant difference between weighted time constants of deactivation in 3D vs WT receptors
(p > 0.05).
Figure 22: The KGK (718-720)-to-D mutation has no effect on CNIH3 modulation of AMPAR deactivation
kinetics
A. Responses from 3D, 3D∕γ2 and 3D+CNIH3 evoked by short (1 ms) agonist applications (10 mM L-Glu, Hp = -100
mV); uppermost traces are the junction potentials. B. Same traces as in panel A, scaled to a common peak response to
compare deactivation kinetics. C. Mean weighted time constants of exponential current decay (τw). D. Mean values
for the slow (τslow) and fast (τfast) components of exponential current decay, with the relative (%) contribution of the
slow component shown in the upper graph. For C and D, error bars are standard errors; ns = non-significant, *p <
0.05, **p < 0.01 (Mann-Whitney U Test with Bonferroni correction). All comparisons were made against receptors
without auxiliary subunits (3D).
75
7. Receptors carrying the KGK (718-720)-to-D mutation retain their full sensitivity to γ2
modulation in terms of kainate efficacy
To exclude the possibility that the reduced ability of γ2 to modulate 3D receptor kinetics
was a consequence of impaired subunit expression, impaired trafficking or reduced binding of
protein complexes, other non-kinetic properties of 3D mutants known to remain sensitive to γ2
modulation (Dawe et al., 2016) were tested, starting with the relative efficacy of kainate (KA∕L-
Glu). As we can see in Figure 23, the relative efficacy of the partial agonist was 1.4 ± 0. 9 % (n =
3) in 3D mutants expressed alone, and increased to 37.1 ± 4.7 % (n = 10, ~26-fold increase) in the
presence of γ2. This time, co-expression of 3D mutants with CNIH3 subunits created a very subtle
(~3-fold) but significant increase in kainate efficacy (4.1 ± 0.5 %, n = 9).
Figure 23: γ2 modulation of kainate efficacy is unaffected by the KGK (718-720)-to-D mutation
A. Typical electrophysiological responses of 3D mutant receptors, 3D∕γ2 and 3D+CNIH3 evoked by long (250 ms)
applications of near-saturating concentration of full agonist (10 mM L-Glu, gray trace), and saturating concentrations
of the partial agonist kainate (1 mM KA, red trace) in the outside-out patch-clamp configuration (Hp = -100 mV).
Uppermost traces are the junction potentials. B. Mean relative KA efficacies in the three experimental conditions,
studied as a ratio of the peak response amplitude evoked by L-Glu in the same patch. Error bars are standard errors;
ns = non-significant, *p < 0.05, **p < 0.01 (Mann-Whitney U Test with Bonferroni correction). All comparisons were
made against receptors without auxiliary subunits (3D).
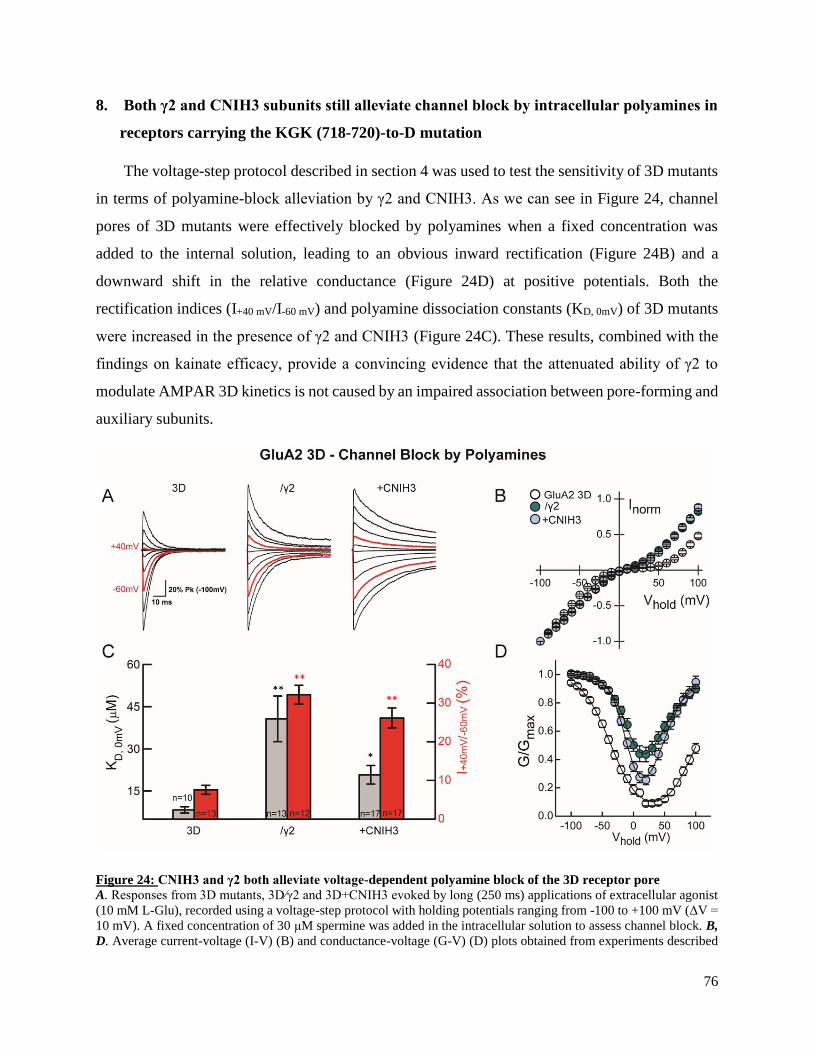
76
8. Both γ2 and CNIH3 subunits still alleviate channel block by intracellular polyamines in
receptors carrying the KGK (718-720)-to-D mutation
The voltage-step protocol described in section 4 was used to test the sensitivity of 3D mutants
in terms of polyamine-block alleviation by γ2 and CNIH3. As we can see in Figure 24, channel
pores of 3D mutants were effectively blocked by polyamines when a fixed concentration was
added to the internal solution, leading to an obvious inward rectification (Figure 24B) and a
downward shift in the relative conductance (Figure 24D) at positive potentials. Both the
rectification indices (I+40 mV/I-60 mV) and polyamine dissociation constants (KD, 0mV) of 3D mutants
were increased in the presence of γ2 and CNIH3 (Figure 24C). These results, combined with the
findings on kainate efficacy, provide a convincing evidence that the attenuated ability of γ2 to
modulate AMPAR 3D kinetics is not caused by an impaired association between pore-forming and
auxiliary subunits.
Figure 24: CNIH3 and γ2 both alleviate voltage-dependent polyamine block of the 3D receptor pore
A. Responses from 3D mutants, 3D∕γ2 and 3D+CNIH3 evoked by long (250 ms) applications of extracellular agonist
(10 mM L-Glu), recorded using a voltage-step protocol with holding potentials ranging from -100 to +100 mV (ΔV =
10 mV). A fixed concentration of 30 μM spermine was added in the intracellular solution to assess channel block. B,
D. Average current-voltage (I-V) (B) and conductance-voltage (G-V) (D) plots obtained from experiments described
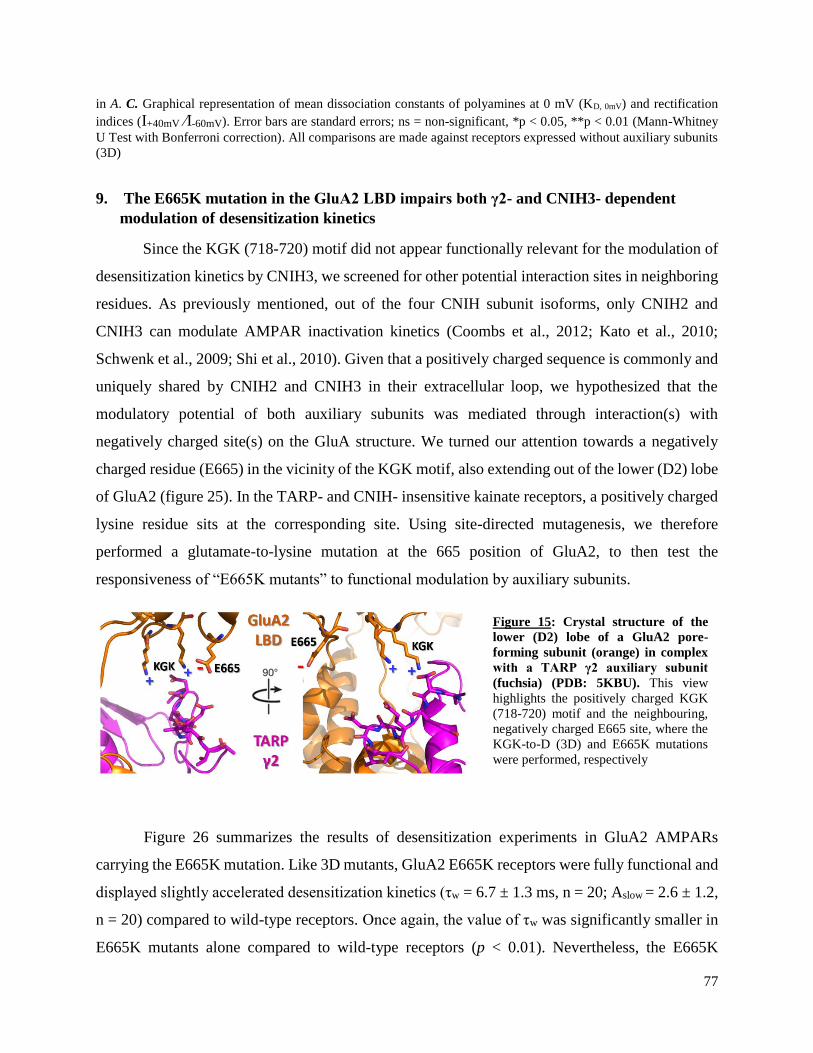
77
in A. C. Graphical representation of mean dissociation constants of polyamines at 0 mV (KD, 0mV) and rectification
indices (I+40mV ∕I-60mV). Error bars are standard errors; ns = non-significant, *p < 0.05, **p < 0.01 (Mann-Whitney
U Test with Bonferroni correction). All comparisons are made against receptors expressed without auxiliary subunits
(3D)
9. The E665K mutation in the GluA2 LBD impairs both γ2- and CNIH3- dependent
modulation of desensitization kinetics
Since the KGK (718-720) motif did not appear functionally relevant for the modulation of
desensitization kinetics by CNIH3, we screened for other potential interaction sites in neighboring
residues. As previously mentioned, out of the four CNIH subunit isoforms, only CNIH2 and
CNIH3 can modulate AMPAR inactivation kinetics (Coombs et al., 2012; Kato et al., 2010;
Schwenk et al., 2009; Shi et al., 2010). Given that a positively charged sequence is commonly and
uniquely shared by CNIH2 and CNIH3 in their extracellular loop, we hypothesized that the
modulatory potential of both auxiliary subunits was mediated through interaction(s) with
negatively charged site(s) on the GluA structure. We turned our attention towards a negatively
charged residue (E665) in the vicinity of the KGK motif, also extending out of the lower (D2) lobe
of GluA2 (figure 25). In the TARP- and CNIH- insensitive kainate receptors, a positively charged
lysine residue sits at the corresponding site. Using site-directed mutagenesis, we therefore
performed a glutamate-to-lysine mutation at the 665 position of GluA2, to then test the
responsiveness of “E665K mutants” to functional modulation by auxiliary subunits.
Figure 26 summarizes the results of desensitization experiments in GluA2 AMPARs
carrying the E665K mutation. Like 3D mutants, GluA2 E665K receptors were fully functional and
displayed slightly accelerated desensitization kinetics (τw = 6.7 ± 1.3 ms, n = 20; Aslow = 2.6 ± 1.2,
n = 20) compared to wild-type receptors. Once again, the value of τw was significantly smaller in
E665K mutants alone compared to wild-type receptors (p < 0.01). Nevertheless, the E665K
Figure 15: Crystal structure of the
lower (D2) lobe of a GluA2 pore-
forming subunit (orange) in complex
with a TARP γ2 auxiliary subunit
(fuchsia) (PDB: 5KBU). This view
highlights the positively charged KGK
(718-720) motif and the neighbouring,
negatively charged E665 site, where the
KGK-to-D (3D) and E665K mutations
were performed, respectively
78
mutation did attenuate the ability of γ2 to slow the time-course of desensitization compared with
wild-type receptors. In fact, co-expression of γ2 with E665K mutants gave rise to a new weighted
time constant of desensitization of 10.8 ± 0. 9 ms (n = 23) and a relative contribution of the slow
component of 15.2 ± 3.3 % (n = 23). Despite co-expression of γ2 still causing a significantly larger
τw relatively to receptors expressed alone, γ2-associated E665K receptors were only subjected to a
1.6-fold increase (∆ = 3.2) in τw, compared to a 2.2-fold increase (∆ = 6.6) in γ2-associated WT
receptors. Similarly, the relative equilibrium current amplitude underwent a more subtle increase
to 5.2 ± 0.7 % (n = 23) with γ2 subunits (7.3-fold increase, ∆ = 12.4) compared to γ2-associated
wild-type receptors (15.4- fold increase, ∆ = 28.0). Unlike 3D mutants however, E665K mutants
were markedly less sensitive to CNIH3 modulation of desensitization kinetics. While CNIH3 had
a large slowing effect on wild-type GluA2 exponential decay, causing a 5.0-fold increase in τw (∆
= 22.7) and 20-fold increase in Aslow, these same desensitization parameters were only modestly
affected by CNIH3 in the case of E665K mutants (τw = 15.3 ± 1.7 ms, n = 31; Aslow = 13.3 ± 2.5
%, n = 31). This time, co-expression of E665K mutants with CNIH3 only caused a 2.2-fold
increase in τw (∆ = 5.9) relatively to receptors expressed alone. Similarly, the relative equilibrium
current was only raised to 2.1 ± 0.4 % (n = 31).
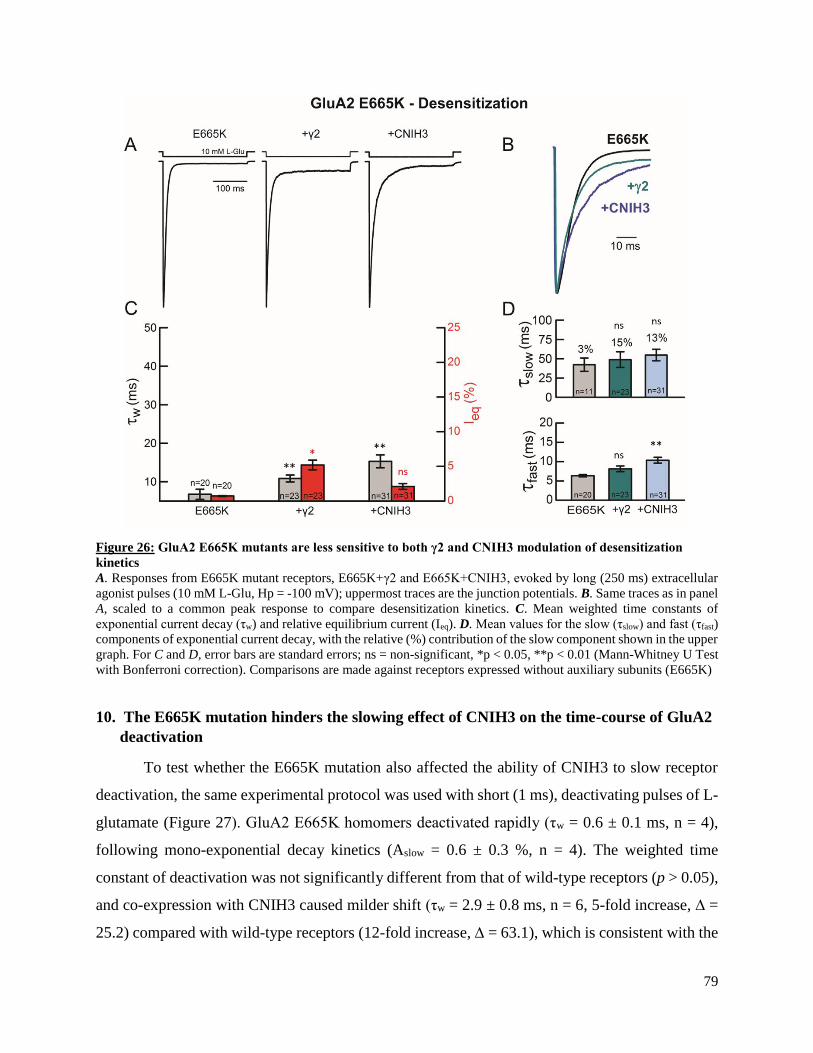
79
Figure 26: GluA2 E665K mutants are less sensitive to both γ2 and CNIH3 modulation of desensitization
kinetics
A. Responses from E665K mutant receptors, E665K+γ2 and E665K+CNIH3, evoked by long (250 ms) extracellular
agonist pulses (10 mM L-Glu, Hp = -100 mV); uppermost traces are the junction potentials. B. Same traces as in panel
A, scaled to a common peak response to compare desensitization kinetics. C. Mean weighted time constants of
exponential current decay (τw) and relative equilibrium current (Ieq). D. Mean values for the slow (τslow) and fast (τfast)
components of exponential current decay, with the relative (%) contribution of the slow component shown in the upper
graph. For C and D, error bars are standard errors; ns = non-significant, *p < 0.05, **p < 0.01 (Mann-Whitney U Test
with Bonferroni correction). Comparisons are made against receptors expressed without auxiliary subunits (E665K)
10. The E665K mutation hinders the slowing effect of CNIH3 on the time-course of GluA2
deactivation
To test whether the E665K mutation also affected the ability of CNIH3 to slow receptor
deactivation, the same experimental protocol was used with short (1 ms), deactivating pulses of L-
glutamate (Figure 27). GluA2 E665K homomers deactivated rapidly (τw = 0.6 ± 0.1 ms, n = 4),
following mono-exponential decay kinetics (Aslow = 0.6 ± 0.3 %, n = 4). The weighted time
constant of deactivation was not significantly different from that of wild-type receptors (p > 0.05),
and co-expression with CNIH3 caused milder shift (τw = 2.9 ± 0.8 ms, n = 6, 5-fold increase, ∆ =
25.2) compared with wild-type receptors (12-fold increase, ∆ = 63.1), which is consistent with the
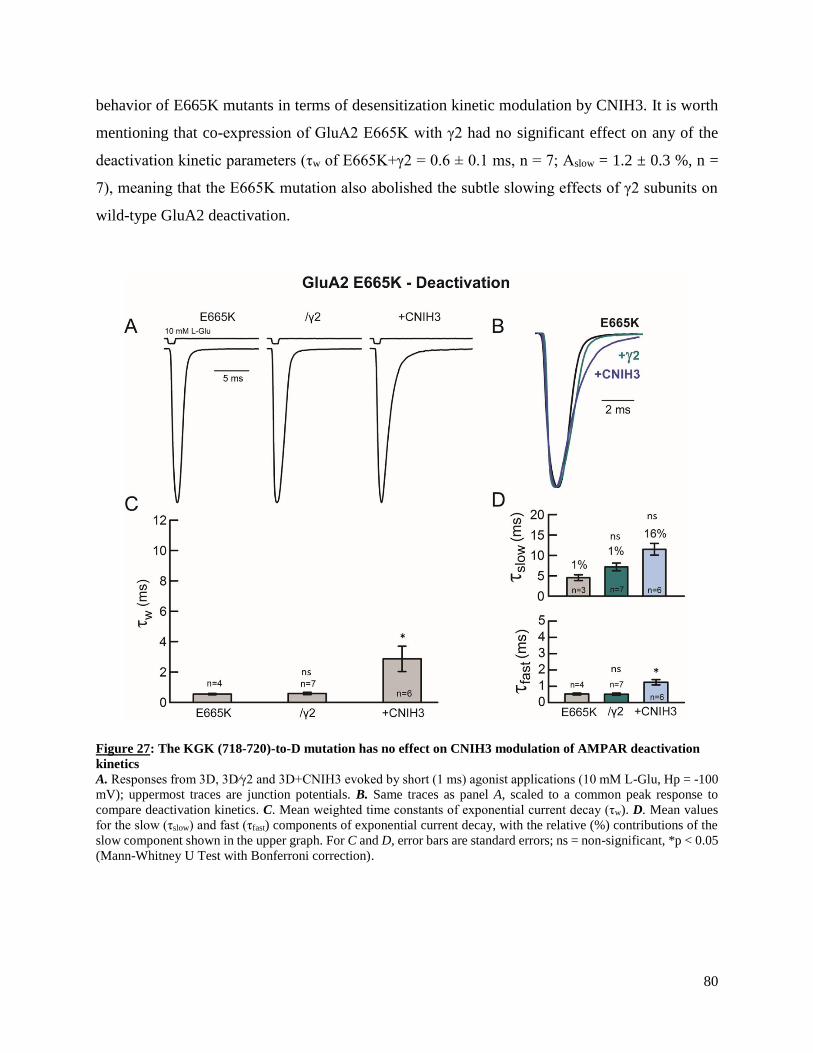
80
behavior of E665K mutants in terms of desensitization kinetic modulation by CNIH3. It is worth
mentioning that co-expression of GluA2 E665K with γ2 had no significant effect on any of the
deactivation kinetic parameters (τw of E665K+γ2 = 0.6 ± 0.1 ms, n = 7; Aslow = 1.2 ± 0.3 %, n =
7), meaning that the E665K mutation also abolished the subtle slowing effects of γ2 subunits on
wild-type GluA2 deactivation.
Figure 27: The KGK (718-720)-to-D mutation has no effect on CNIH3 modulation of AMPAR deactivation
kinetics
A. Responses from 3D, 3D∕γ2 and 3D+CNIH3 evoked by short (1 ms) agonist applications (10 mM L-Glu, Hp = -100
mV); uppermost traces are junction potentials. B. Same traces as panel A, scaled to a common peak response to
compare deactivation kinetics. C. Mean weighted time constants of exponential current decay (τw). D. Mean values
for the slow (τslow) and fast (τfast) components of exponential current decay, with the relative (%) contributions of the
slow component shown in the upper graph. For C and D, error bars are standard errors; ns = non-significant, *p < 0.05
(Mann-Whitney U Test with Bonferroni correction).
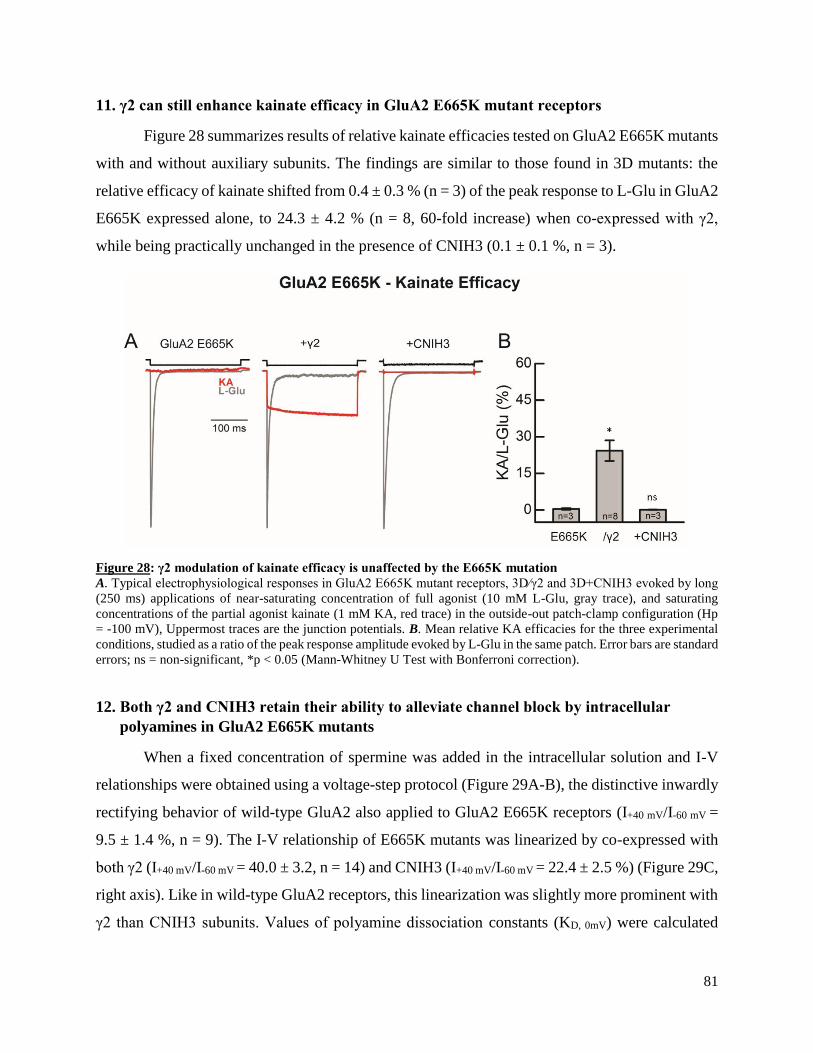
81
11. γ2 can still enhance kainate efficacy in GluA2 E665K mutant receptors
Figure 28 summarizes results of relative kainate efficacies tested on GluA2 E665K mutants
with and without auxiliary subunits. The findings are similar to those found in 3D mutants: the
relative efficacy of kainate shifted from 0.4 ± 0.3 % (n = 3) of the peak response to L-Glu in GluA2
E665K expressed alone, to 24.3 ± 4.2 % (n = 8, 60-fold increase) when co-expressed with γ2,
while being practically unchanged in the presence of CNIH3 (0.1 ± 0.1 %, n = 3).
Figure 28: γ2 modulation of kainate efficacy is unaffected by the E665K mutation
A. Typical electrophysiological responses in GluA2 E665K mutant receptors, 3D∕γ2 and 3D+CNIH3 evoked by long
(250 ms) applications of near-saturating concentration of full agonist (10 mM L-Glu, gray trace), and saturating
concentrations of the partial agonist kainate (1 mM KA, red trace) in the outside-out patch-clamp configuration (Hp
= -100 mV), Uppermost traces are the junction potentials. B. Mean relative KA efficacies for the three experimental
conditions, studied as a ratio of the peak response amplitude evoked by L-Glu in the same patch. Error bars are standard
errors; ns = non-significant, *p < 0.05 (Mann-Whitney U Test with Bonferroni correction).
12. Both γ2 and CNIH3 retain their ability to alleviate channel block by intracellular
polyamines in GluA2 E665K mutants
When a fixed concentration of spermine was added in the intracellular solution and I-V
relationships were obtained using a voltage-step protocol (Figure 29A-B), the distinctive inwardly
rectifying behavior of wild-type GluA2 also applied to GluA2 E665K receptors (I+40 mV/I-60 mV =
9.5 ± 1.4 %, n = 9). The I-V relationship of E665K mutants was linearized by co-expressed with
both γ2 (I+40 mV/I-60 mV = 40.0 ± 3.2, n = 14) and CNIH3 (I+40 mV/I-60 mV = 22.4 ± 2.5 %) (Figure 29C,
right axis). Like in wild-type GluA2 receptors, this linearization was slightly more prominent with
γ2 than CNIH3 subunits. Values of polyamine dissociation constants (KD, 0mV) were calculated
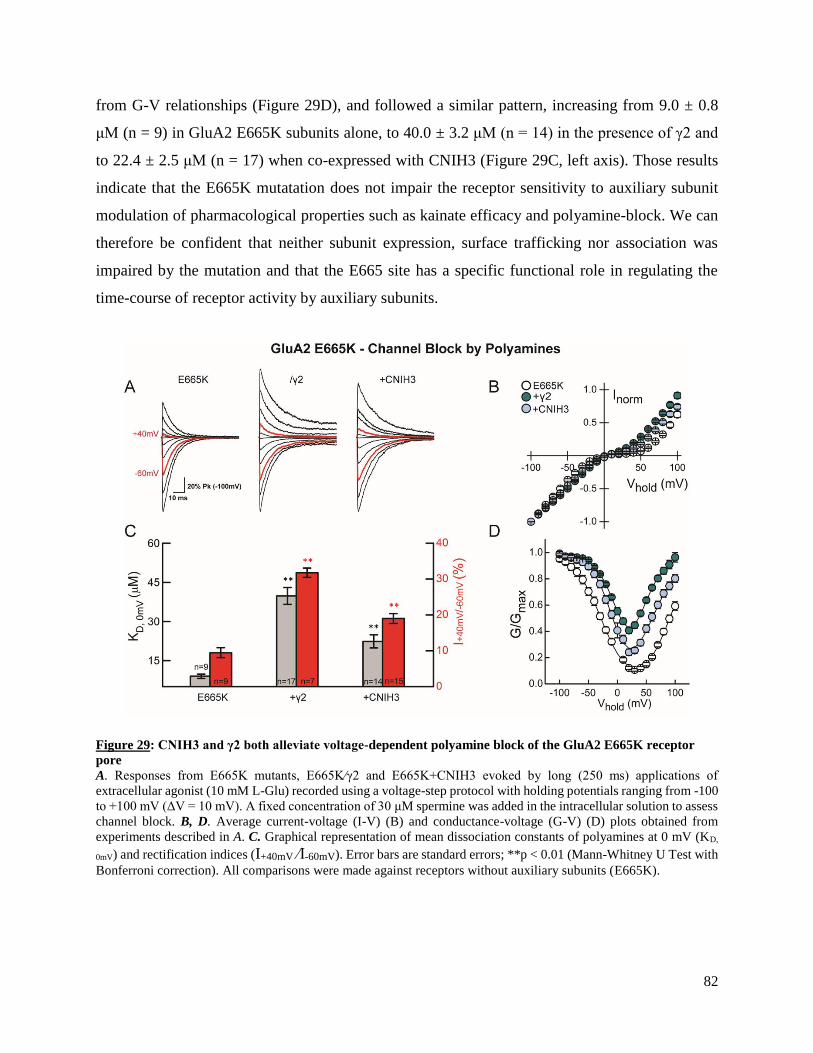
82
from G-V relationships (Figure 29D), and followed a similar pattern, increasing from 9.0 ± 0.8
μM (n = 9) in GluA2 E665K subunits alone, to 40.0 ± 3.2 μM (n = 14) in the presence of γ2 and
to 22.4 ± 2.5 μM (n = 17) when co-expressed with CNIH3 (Figure 29C, left axis). Those results
indicate that the E665K mutatation does not impair the receptor sensitivity to auxiliary subunit
modulation of pharmacological properties such as kainate efficacy and polyamine-block. We can
therefore be confident that neither subunit expression, surface trafficking nor association was
impaired by the mutation and that the E665 site has a specific functional role in regulating the
time-course of receptor activity by auxiliary subunits.
Figure 29: CNIH3 and γ2 both alleviate voltage-dependent polyamine block of the GluA2 E665K receptor
pore
A. Responses from E665K mutants, E665K∕γ2 and E665K+CNIH3 evoked by long (250 ms) applications of
extracellular agonist (10 mM L-Glu) recorded using a voltage-step protocol with holding potentials ranging from -100
to +100 mV (ΔV = 10 mV). A fixed concentration of 30 μM spermine was added in the intracellular solution to assess
channel block. B, D. Average current-voltage (I-V) (B) and conductance-voltage (G-V) (D) plots obtained from
experiments described in A. C. Graphical representation of mean dissociation constants of polyamines at 0 mV (KD,
0mV) and rectification indices (I+40mV ∕I-60mV). Error bars are standard errors; **p < 0.01 (Mann-Whitney U Test with
Bonferroni correction). All comparisons were made against receptors without auxiliary subunits (E665K).
83
13. Results from a series of mutations at the E665 position
Given that the positively charge KGK (718-720) site on the GluA2 LBD is known to play
a critical role in AMPAR-TARP functional association, it was surprising to find that mutating a
negatively charged residue (E665K) in a neighboring region hindered TARP function. One
hypothetical explanation was that the newly added, positively charged lysine residue attracted the
negative charges of γ2 extracellular domain, displacing γ2 from its functionally critical interaction
with the KGK (718-720) motif. To explore this hypothesis, I tested the behavior of γ2 and CNIH3
co-expressed with GluA2 subunits carrying residues with a polar and a hydrophobic side-chain at
the 665 position (E665Q and E665A, respectively). If this hypothesis was correct, the E665Q and
E665A mutations might still impair CNIH3 function, while at least partially restore the effects of
γ2 on decay kinetics by allowing its proper interaction with the KGK motif, given that the steric
hindrance of those side-chains was not a concern. Figure 30 summarizes the results for the
modulation of desensitization kinetics of GluA2 E665K, E665Q and E665A by auxiliary subunits.
The results did not match my expectation, since compared to E665K mutants, E665Q and E665A
mutants co-expressed with γ2 subunits did not cause any significant increase in desensitization
time constants and equilibrium currents. On the other hand, significantly slower desensitization
kinetics were seen in both GluA2 E665Q+CNIH3 (τw = 23.7 ± 3.4 ms, n = 1) and E665A+CNIH3
(τw = 49.0 ± 5.3 ms, n = 11) compared to GluA2 E665K + CNIH3 (τw = 15.3 ± 1.7 ms, n=31) and
to the same receptors expressed alone (τw (E665Q) = 6.7 ± 0.3 ms, n=13; τw (E665A) = 8.2 ± 0.3
ms, n = 16). The relative equilibrium currents of the E665Q and E665A mutants co-expressed with
CNIH3 (respectively: Irel = 5.1± 1.2%, n = 17 and 19.3 ± 3.1 %, n = 11) were also largely increased
compared to E665K + CNIH3 (Irel = 2.1± 0.4 %, n = 31) and to the E665Q and E665A mutants
expressed without auxiliary subunits (Irel (E665Q) = 1.3 ± 0.6 ms, n=13; Irel (E665A) = 0.7 ± 0.1
ms, n = 16).
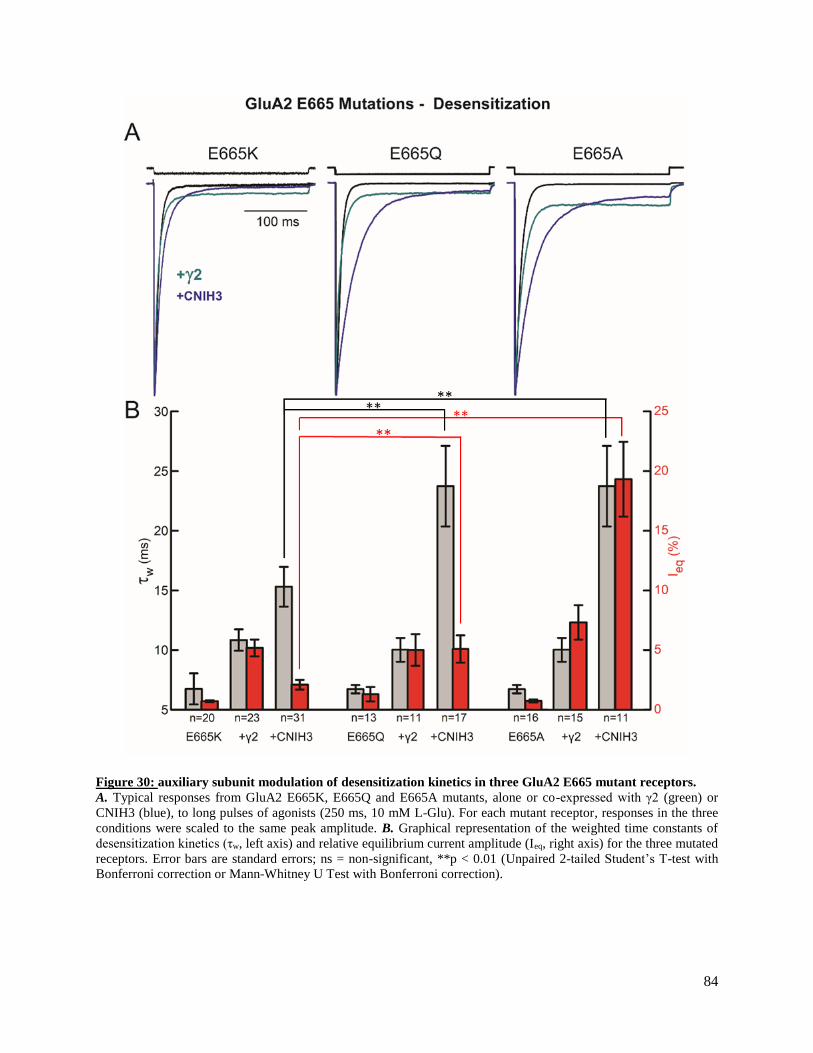
84
Figure 30: auxiliary subunit modulation of desensitization kinetics in three GluA2 E665 mutant receptors.
A. Typical responses from GluA2 E665K, E665Q and E665A mutants, alone or co-expressed with γ2 (green) or
CNIH3 (blue), to long pulses of agonists (250 ms, 10 mM L-Glu). For each mutant receptor, responses in the three
conditions were scaled to the same peak amplitude. B. Graphical representation of the weighted time constants of
desensitization kinetics (τw, left axis) and relative equilibrium current amplitude (Ieq, right axis) for the three mutated
receptors. Error bars are standard errors; ns = non-significant, **p < 0.01 (Unpaired 2-tailed Student’s T-test with
Bonferroni correction or Mann-Whitney U Test with Bonferroni correction).
85
14. Truncation of the second half of the CNIH2⁄3 specific extracellular region impairs all
modulatory effects of CNIH3 on GluA2 kinetics and pharmacology
The effect of truncating a portion of the CNIH2∕3-specific extracellular site was tested to
further explore the hypothesis that positively charged residues in this region interact with the
GluA2 LBD. Among all mutations performed by Shanks et al. (2014) in the CNIH2∕3-specific
region, deletions of 7 residues (E58 to L64) in the second half of this extracellular loop was the
most efficient in attenuating both the physical association of CNIH3 with GluA2 LBD and,
consequently, its ability to modulate AMPAR desensitization kinetics. Since this truncation did
not fully abolish the functional effects of CNIH3 on GluA2 activity, we assumed that other residues
could be in play. We therefore tested the effect of deleting 2 additional, positively charged residues
(R65 and K66) in the CNIH2∕3-specific site, resulting in an overall deletion of nine amino-acids
(E58 to K66). Figure 31 summarizes the results for the effect of co-expressing wild-type GluA2
subunits with CNIH3Δ(58-66) on desensitization kinetics and equilibrium current (A-B), as well
as channel block by intracellular polyamines (C-E). The weighted time constant of exponential
decay and relative equilibrium current of GluA2 co-expressed with CNIH3Δ(58-66) (τw = 12.5 ±
0.9 ms, n=12; Ieq = 3.3 ± 0.6 %, n = 12) were greatly reduced compared with those of GluA2
expressed alone (τw = 8.5 ± 0.4 ms, n = 20; Ieq = 1.4 ± 0.2, n = 20). The effect of this mutation on
desensitization kinetics seemed more profound than that of the 7-residue-long deletion reported by
Shanks and his colleagues (τw = 20.0 ± 1.4 ms, n = 6). Interestingly, the mutation also had a major
impact on polyamine block modulation (KD = 14.0 ± 2.2 μM, n = 10; I+40 mV/I-60 mV = 12.5 ± 2.1 %,
n = 10). The drastic effects of the Δ(58-66) deletion on both desensitization kinetics and polyamine
block indicate that the mutation was likely impairing the physical association between auxiliary
and pore-forming subunits, rather than having a specific effect on functional modulation of the
gating machinery.
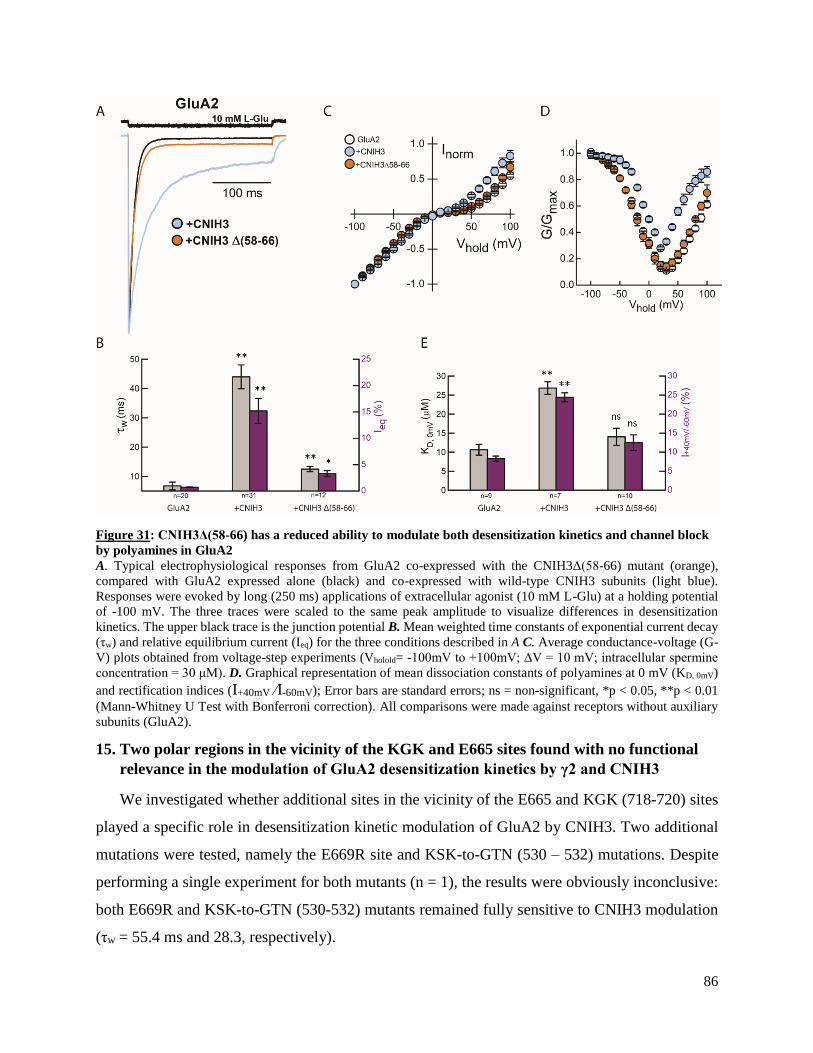
86
Figure 31: CNIH3Δ(58-66) has a reduced ability to modulate both desensitization kinetics and channel block
by polyamines in GluA2 A. Typical electrophysiological responses from GluA2 co-expressed with the CNIH3Δ(58-66) mutant (orange),
compared with GluA2 expressed alone (black) and co-expressed with wild-type CNIH3 subunits (light blue).
Responses were evoked by long (250 ms) applications of extracellular agonist (10 mM L-Glu) at a holding potential
of -100 mV. The three traces were scaled to the same peak amplitude to visualize differences in desensitization
kinetics. The upper black trace is the junction potential B. Mean weighted time constants of exponential current decay
(τw) and relative equilibrium current (Ieq) for the three conditions described in A C. Average conductance-voltage (G-
V) plots obtained from voltage-step experiments (Vholold= -100mV to +100mV; ΔV = 10 mV; intracellular spermine
concentration = 30 μM). D. Graphical representation of mean dissociation constants of polyamines at 0 mV (KD, 0mV)
and rectification indices (I+40mV ∕I-60mV); Error bars are standard errors; ns = non-significant, *p < 0.05, **p < 0.01
(Mann-Whitney U Test with Bonferroni correction). All comparisons were made against receptors without auxiliary
subunits (GluA2).
15. Two polar regions in the vicinity of the KGK and E665 sites found with no functional
relevance in the modulation of GluA2 desensitization kinetics by γ2 and CNIH3
We investigated whether additional sites in the vicinity of the E665 and KGK (718-720) sites
played a specific role in desensitization kinetic modulation of GluA2 by CNIH3. Two additional
mutations were tested, namely the E669R site and KSK-to-GTN (530 – 532) mutations. Despite
performing a single experiment for both mutants (n = 1), the results were obviously inconclusive:
both E669R and KSK-to-GTN (530-532) mutants remained fully sensitive to CNIH3 modulation
(τw = 55.4 ms and 28.3, respectively).
87
16. Both the 3D and E665K mutations impair the ability of γ2 to accelerate GluA2 recovery
from desensitization
I finally evaluated the ability of γ2 and CNIH3 to modulate AMPAR recovery from
desensitization in wild-type and mutated receptors. The time constant of recovery of wild-type
GluA2 homomers (τrecov = 14.7 ± 0.7 ms, n = 5) is within the range of values reported across the
literature and obtained in similar conditions (Carbone and Plested, 2012; Robert et al., 2005). As
previously observed, recovery occurs over a longer timescale than the desensitization process (τdes
= 8.5 ± 0.3 ms, n = 20). Type-I TARPs are known for their ability to hasten recovery of AMPAR
from desensitization (Priel et al., 2005). Accordingly, fusion of GluA2 with γ2 caused a subtle
acceleration in recovery (τrecov = 12.8 ± 1.0 ms, n = 7). Interestingly, CNIH3 had the opposite effect
of mildly slowing the recovery of wild-type GluA2 (τrecov = 22.2 ± 1.7 ms, n = 8), which has not
been previously highlighted in the literature. The slowing effect of CNIH3 was retained when co-
expressed with GluA2 3D (τrecov = 25.0 ± 1.3 ms, n = 10, p = 0.0009) and GluA2 E665K (τrecov =
27.1 ± 2.4 ms, n = 11) compared with the same receptors expressed without any auxiliary subunits
(τrecov (GluA2 3D) = 16.4 ± 1.2 ms, n = 6); τrecov (GluA2 E665K) = 18.9 ± 1.3, n = 9). On the other
hand, γ2 lost its ability to accelerate recovery when co-expressed with both mutants, as it failed to
decrease the recovery time constant of GluA2 3D and GluA2 E665K mutants (τrecov (GluA2 3D/γ2)
= 22 ± 3.0 ms, n = 15; τrecov (GluA2 E665K+γ2) = 21.9 ± 4 12) compared with the same receptors
expressed alone.
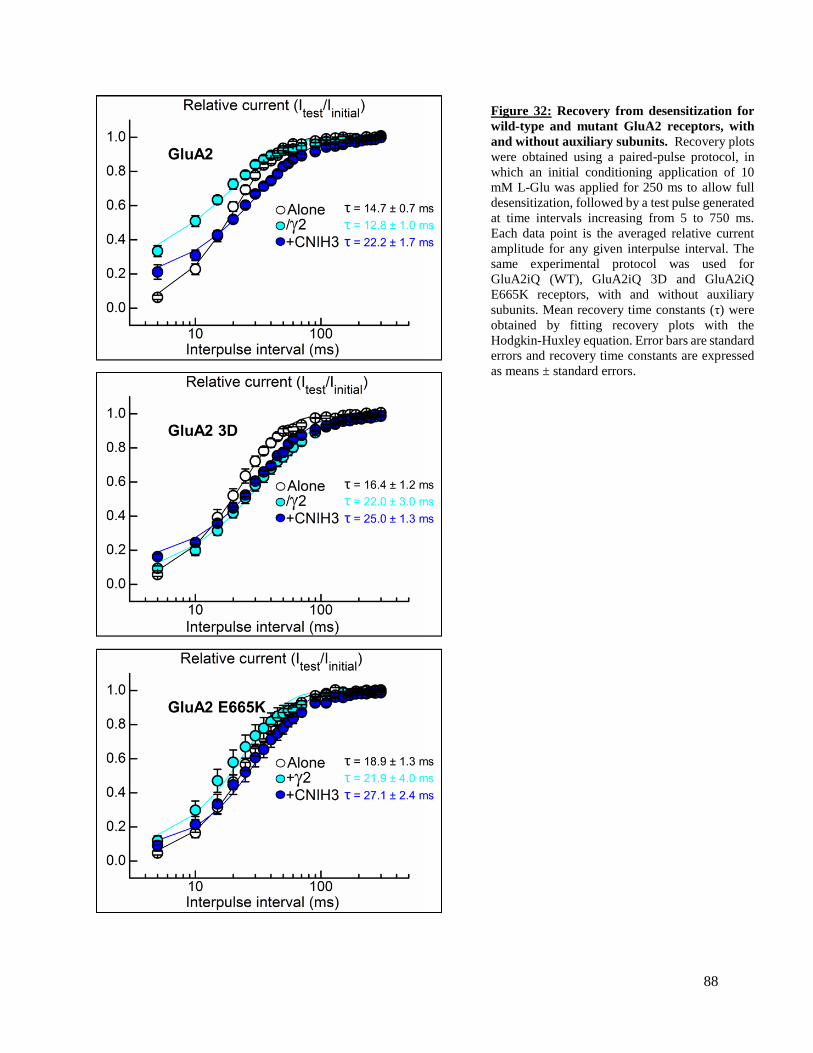
88
Figure 32: Recovery from desensitization for
wild-type and mutant GluA2 receptors, with
and without auxiliary subunits. Recovery plots
were obtained using a paired-pulse protocol, in
which an initial conditioning application of 10
mM L-Glu was applied for 250 ms to allow full
desensitization, followed by a test pulse generated
at time intervals increasing from 5 to 750 ms.
Each data point is the averaged relative current
amplitude for any given interpulse interval. The
same experimental protocol was used for
GluA2iQ (WT), GluA2iQ 3D and GluA2iQ
E665K receptors, with and without auxiliary
subunits. Mean recovery time constants (τ) were
obtained by fitting recovery plots with the
Hodgkin-Huxley equation. Error bars are standard
errors and recovery time constants are expressed
as means ± standard errors.

89
PART IV:
GENERAL DISCUSSION & CONCLUSION
90
Discussion
1. Quantifying the ability of auxiliary subunits to modulate AMPAR kinetics and
pharmacology
Among the collection of auxiliary subunits now known to reliably and stably interact with
AMPARs in the brain, type-I TARPs (γ2, 3, 4, 8), CNIH2 and CNIH3 have been well characterized
for their ability to modulate functional properties of the receptors in both physiological and
recombinant systems. While the physiological relevance of these auxiliary subunits in the nervous
system is established, the exact nature of their interactions with AMPARs and how they translate
into alterations in receptor function is unclear. A first and important step towards a better
understanding of the structure-function relationship in CNIH- and TARP-associated AMPARs was
to obtain a global picture of the modulatory effects of auxiliary subunits on receptor responses in
a controlled recombinant environment.
With long (250 ms) pulses of full agonists, both CNIH3 and γ2 raised the amplitude of the
equilibrium response and slowed the time-course of GluA2 macroscopic desensitization. As
previously reported, the effect of CNIH3 on desensitization kinetics was more prominent than that
of γ2 (Coombs et al., 2012; Schwenk et al., 2009; Shanks et al., 2014; Shi et al., 2010). The present
work shows that, in addition to induce a stronger increase in the relative contribution of the slow
component of exponential decay, co-expression of GluA2 with CNIH3 raises the absolute value
of both the fast and the slow components themselves, which did not apply to γ2. On the other hand,
modulation of the steady-state was stronger in the presence of γ2, causing the residual current to
equilibrate more rapidly and to a greater relative amplitude than CNIH3. Both auxiliary subunits
slowed the process of deactivation in receptors exposed to short (1 ms) pulses of full agonists,
consistent with previous literature (Cho et al., 2007; Coombs et al., 2012; Kato et al., 2010;
Schwenk et al., 2009; Shi et al., 2010). My experiments highlight a markedly larger effect of
CNIH3 on deactivation kinetics, greatly increasing the relative contribution of the slow component
of decay (30-fold increase) compared to γ2 (8-fold increase).
As mentioned earlier, macroscopic desensitization should be seen as a complex
combination of microscopic events, where receptors exit their main open state and possibly re-
open to lower, longer-lived sub-conductance levels, giving rise to a steady macroscopic
equilibrium current (Daniels et al., 2013). The marked increase in equilibrium currents seen in γ2-
91
associated GluA2 receptors implies that γ2 somehow potentializes these post-desensitization sub-
conductance states, consistent with results from single-channel experiments showing that γ2
preferentially increases access frequency to higher sub-conductance states (Tomita et al., 2005). It
could be hypothesized that while CNIH3 greatly delays the onset of receptor desensitization
(receptors leaving from their main, agonist-bound activated state), its ability to re-stabilize
receptors in high sub-conductance equilibrium states could be more limited than γ2.
The fact CNIH3 has such a distinct impact on the slow component of deactivation kinetics
also raises new questions. Once again, deactivation protocols mainly capture an inactivation
process where channels move back into a non-conducting state, a mechanism which is primarily
facilitated by agonist unbinding (Hinard et al., 2016). That being said, we may hypothesize that
increasing the affinity of the LBD for any agonist could substantially delay the onset of
deactivation, leading to slower decay kinetics at the macroscopic level. Interestingly, it has been
reported that γ2 causes a leftward shift in dose-response curves obtained by measuring peak current
amplitudes at various concentrations of L-glutamate (Priel et al., 2005; Tomita et al., 2005;
Turetsky et al., 2005; Yamazaki et al., 2004). Peak current amplitudes reflect agonist potency,
which depends on both the agonist’s ability to bind the receptor in its inactive state (affinity) and
to activate the gating process (efficacy) (Stephenson, 1956). The leftward-shift in dose-response
curves elicited by γ2 could therefore be partly explained by an increase in the affinity of the LBD
for L-glutamate, which could in turn explain the slightly slower deactivation kinetics observed in
the presence of γ2. A similar increase in L-glutamate potency has been described in GluA2
receptors co-expressed with CNIH2 subunits, but the resulting shift in the EC50 did not appear
greater than that of GluA2 co-expressed with γ2, and dose-response curves for GluA2 with CNIH3
were not measured (Coombs et al., 2012). The mechanism underlying the distinct impact of CNIH3
on the slow component of deactivation kinetics could also result from an interference purely at the
level of the gating process, without necessarily affecting agonist affinity. In fact, the interaction of
auxiliary subunits with the receptor core could somehow slow the sequence of events responsible
for the closing of the receptor gate, this interference being potentially amplified by CNIH3
relatively to γ2. If this interfering effect of CNIH3 is real, another question is whether the same
mechanism accounts for its distinctive ability to modulate the decay components of desensitization
kinetics.
92
At saturating concentrations, the partial agonist kainate generated submaximal and non-
desensitizing currents in wild-type GluA2 homomers. Co-expression of GluA2 with γ2 raised the
relative efficacy of kainate by over 50%, while CNIH3 had a negligible effect. These results
replicate established findings regarding the sensitivity of kainate pharmacology to modulation by
type-I TARPs (Tomita et al., 2005; Turetsky et al., 2005) and CNIHs (Coombs et al., 2012; Shi et
al., 2010). For AMPARs, it is hypothesized that efficacy depends on the ability of an agonist to
bring the receptor into a given conductance state at saturating concentrations (Jin et al., 2003),
which would depend on the degree of LBD cleft closure induced by binding of this same agonist
(Ahmed et al., 2011; Armstrong and Gouaux, 2000; Jin et al., 2003; Lau and Roux, 2011). In fact,
it has been proposed that kainate generates lower conductance states by inducing a smaller degree
of LBD cleft closure compared to full agonists (Armstrong and Gouaux, 2000; Jin et al., 2003;
Swanson et al., 1997). By interacting with the extracellular domain of AMPAR, TARPs induce
additional LBD closure, which is thought to account for its ability to increase full and partial
agonist efficacy while promoting access to high conductance and/or opening-probability (Popen)
states (MacLean et al., 2014). The distinct effect of TARPs on agonist efficacy therefore suggests
a unique interaction with the LBD which may not be shared by CNIHs.
Finally, I was able to experimentally reproduce the shared ability of CNIHs and TARPs to
alleviate voltage-dependent block of CP-AMPARs by intracellular polyamines, which had already
been described across the literature (Shi et al., 2010; Soto et al., 2007). Changes in rectification
indices (I+40mV ∕I-60mV) and in the apparent affinity of polyamines for the pore (KD, 0 mV) indicated
that this alleviating effect was slightly more important for γ2. Structural alterations in the ion-
permeation pathway have been proposed to explain the inwardly-rectifying properties of γ2-
associated receptors, including a reduction in the affinity of polyamines for pore-lining residues
and/or enhancement of the outward flux of polyamines across the pore, with a possible
involvement of the C-tail of γ2. These changes would occur independently from γ2’s ability to
increase AMPAR unitary conductance and slow receptor desensitization kinetics (Brown et al.,
2016; Fisher and Mott, 2012; Soto et al., 2014). The relatively milder effect of CNIHs on CP-
AMPARs inwardly rectifying properties compared to γ2 was previously reported for both CNIH2
and CNIH3 (Coombs et al., 2012; Soto et al., 2007). It has been suggested that CNIHs and TARPs
operate in a similar way to alleviate polyamine block, but the possibility of distinct mechanisms
93
should not be excluded. In fact, the hypothesized contribution of the long, intracellular C-tail of
TARPs would unlikely apply to CNIH2-3, which carry a short extracellular C-tail. It may be
interesting to eventually study the effect of auxiliary subunits on the hydrophobic environment
surrounding the receptor pore. In fact, TARPs and CNIHs could both reduce the interactions
between pore residues and surrounding lipids near critical points of the permeation pathway, such
as at the level of the Q/R site.
Overall, subtle discrepancies in how CNIH3 and γ2 affect GluA2 inward rectification,
desensitization, recovery from desensitization and deactivation kinetics highlight the likelihood of
distinct underlying structural mechanisms and interaction sites with the receptor core.
2. Mutagenesis experiments on the AMPAR LBD reveal distinct sites for functional
interaction with TARPs and CNIHs
The second part of my work focused on elucidating interaction sites on the AMPAR
structure specifically involved in functional modulation by CNIH3 and γ2. A special attention was
given to the LBD, being the starting point of the gating cascade in all iGluR subtypes. In TARPs,
evidence from structure-function studies support the presence of an interaction between negatively
charged residues in the first extracellular loop of type-I TAPRs (β4-TM2) and the LBD,
particularly at the level of the lower (D2) lobe and the S1-M1 linker between the LBD and TMD
of GluA2 subunits (Cais et al., 2014; Tomita et al., 2005; Tomita et al., 2007; Twomey et al.,
2016). Precisely, previous work in our lab revealed a specific role of a positively charged ‘KGK’
motif, extending outside of the plane of the D2 lobe in all GluA1-4 isoforms, in γ2-mediated
modulation of macroscopic deactivation, desensitization and equilibrium of GluA2 homomers
(Dawe et al., 2016). To build on this work, I investigated whether the KGK motif also played a
role in CNIH2-3 modulation of AMPAR decay kinetics and equilibrium. To do so, I used the same
mutant receptors designed by Dawe and his colleagues, in which the KGK (718-720) motif of
GluA2 subunits had been replaced by a single, negatively charged aspartic acid residue, mimicking
the corresponding site in TARP-insensitive GluK1-3 subunits. I was able to reproduce the nearly
abolishing effects of this ‘3D mutation’ on γ2-modulation of inactivation (deactivation and
desensitization) kinetics and equilibrium. On the other hand, co-expression of the same mutant
receptors had no impact on CNIH3-mediated modulation of receptor function, leaving the
weighted time constants of desensitization and deactivation, both the fast and slow components of
94
decay, the relative contribution of the slow component and the equilibrium response amplitude all
unchanged relatively to wild-type GluA2 co-expressed with CNIH3. These results therefore
highlight a novel idea about the specific role of the KGK motif in γ2-mediated modulation of
inactivation kinetics and equilibrium, a functional interaction which seemingly do not apply in
CNIHs. Once again, the differential effects of CNIHs and TARPs on AMPAR kinetic properties
and pharmacology mentioned earlier, coupled with previous work showing that CNIH2-3 can
modulate kinetics in AMPARs already saturated with TARP subunits (Shi et al., 2010), all support
this idea of TARPs and CNIHs having distinct interaction sites.
The next obvious step was to look for CNIH-specific interaction sites in GluA2 subunits.
Based on cryo-EM data, TARPs and CNIHs both contribute to the transmembrane density and
occupy a broadly similar position underneath the lower (D2) lobe of the LBD (Nakagawa et al.,
2005; Shanks et al., 2014). Since the only CNIH isoforms capable of modulating AMPAR kinetics
(CNIH2-3) share a unique sequence carrying multiple positively charged residues on their
extracellular loop, we focused on negatively charged residues in the vicinity of the KGK motif as
potential interaction sites. To our surprise, we found that a glutamate-to-lysine point mutation
(E665K) on the D2 lobe of the GluA2 LBD attenuated both CNIH2- and γ2-modulation of all the
parameters of deactivation and desensitization kinetics as well as the equilibrium response. If
positively charge residues in CNIH2-3 were responsible for functionally relevant electrostatic
interactions with AMPARs, it made sense that introducing a new positively charged residue in its
putative interaction site would hinder this same interaction. New questions were raised however
by the fact that the same mutation also affected γ2-modulation, which supposedly involves
negatively charged residues on the extracellular loop of the auxiliary protein. The hypothesis that
introducing a positive charge in the vicinity of the KGK motif attracted and displaced γ2 subunits
from their functionally important interaction site was rejected by the fact that introduction of polar
(E665Q) and hydrophobic (E665A) residues at the same site failed to restore γ2 modulation.
Clearly, the replacement of a glutamic acid by a positively charged lysine residue at the 665
position triggers structural disturbances that impair CNIH functional interactions with the LBD.
For γ2, it seems as if any alteration at the E665 site (positively charged, polar or hydrophobic
residue) is sufficient to generate such disturbances. Two other mutations in the vicinity of the KGK
motif and the E665 sites were attempted in hope to uncover additional interaction sites for CNIH3
95
and γ2 (KSK-to-GTN (530-532) and E669R mutations. None of these mutations altered receptor
kinetic modulation by either auxiliary subunits.
In addition to induce slower desensitization kinetics, the association of AMPARs with
type-I TARPs has been associated with a faster time-course of recovery form desensitization (Priel
et al., 2005). Accordingly, my results show that GluA2/γ2 chimeric receptors exhibit slightly
smaller recovery time constants than GluA2 alone. γ2 failed to hasten recovery of both GluA2 3D
and E665K mutants, indicating that the E665 site and the and KGK motif both play a role in γ2-
dependent regulation of the desensitization process itself and the speed at which receptors exit
their desensitized state. I also show that CNIH3 slow the time-course of recovery, therefore having
an opposite effect to that of γ2. In fact, CNIH3 significantly increased the mean recovery time
constant of wild-type GluA2 receptors, and this effect seemed to be retained in GluA2 3D and
E665K mutants. We can therefore hypothesize that while the E665 site and the KGK motif share
a role in hasting recovery from desensitization of GluA2 by γ2, the decelerating effect of CNIH3
on recovery is likely mediated by interactions localized at distinct and independent sites. The fact
that CNIH3 slows recovery kinetics is a novel finding that should be tested for reproducibility in
other experimental settings.
The ability of CNIH3 and γ2 to modulate other (non-kinetic) pharmacological properties
of mutated receptors has also been studied. As already shown by Dawe et al (2016), receptors
carrying the 3D mutation at the KGK site retained their sensitivity to γ2 modulation both in terms
of kainate efficacy and voltage-dependant block by intracellular polyamines. Similarly,
enhancement of kainate efficacy by γ2 and alleviation of polyamine block by both γ2 and CNIH3
remained intact in E665K mutants. These results show that the loss of CNIH- and TARP-
dependant modulation of AMPAR mutants cannot be the result of an impaired physical association
between pore-forming and auxiliary subunits. Interestingly, the fact that γ2 has dissociable effects
on agonist efficacy and decay kinetics excludes the previously suggested hypothesis that γ2
induction of a larger LBD cleft closure, supposedly responsible for its ability to enhance agonist
efficacy, is the same mechanism underlying the slower decay kinetics associated with γ2
(MacLean et al., 2014). Dawe et al. (2016) proposed that this slower kinetics could rather be the
result of type-I TARPs delaying structural changes associated with receptor desensitization,
including the rotational movement of the D2 lobes and subsequent weakening of the D1-D1
96
interface. The same authors showed that both CNIH3 and γ2 can partially restore receptor activity
when a set of electrostatic interactions critical for the stability of the D1-D1 dimer interface are
disrupted. We can therefore hypothesize that both auxiliary subunits delay desensitization by
enhancing this stability. The distinctly prominent effect of CNIH3 on the deactivation process
however, which has not been linked to a collapse in the LBD dimer interface, suggests that its
functional interaction with pore-forming subunits has additional layers of complexity.
Limitations and future directions
One of the main limitations of my experiments includes the lack of control over the
stoichiometry of CNIH3 proteins associated with AMPARs, due to a failure to generate fusion
proteins with GluA2 subunits. Realistically, the number of auxiliary subunits associated with each
tetramer could influence the extent of receptor functional modulation. In my experiments, this
would have created a significant source of variability across responses elicited by various receptor
constructs co-expressed with CNIH3. Since no such difference was noticeable compared with the
response variability in GluA2/γ2 tandem constructs, I speculate that an efficient co-expression of
CNIH constructs permitted a rather stable stoichiometry across my experiments. The issue of
stoichiometry raises another question that should be investigated in future experiments. In fact,
when GluA2/γ2 tandem subunits associate to form functional receptors, we may assume a 1:1 ratio
between pore-forming and auxiliary subunits. However, we should keep in mind that the number
of subunits contributing to functional modulation of each tetramer may be variable. To this day,
the stoichiometry of auxiliary subunits physically and functionally interacting with iGluRs in
physiological and recombinant systems is unknown. Another important limitation was the fact that
the chosen electrophysiological settings only allowed for the study of macroscopic responses,
which forced me to make indirect speculations about biophysical events occurring in individual
receptors. The use of single-channel recordings to study the effect of auxiliary subunits in
AMPARs would be a relevant addition to this work. For example, it could allow us to explore how
changes in opening probabilities and unitary conductance states account for the substantial impact
of CNIHs on the time-course of desensitization and deactivation kinetics versus the preferential
effect of TARPs on the equilibrium state. Notably, it could be relevant to investigate if the
enhancing effect of γ2 on access frequency to higher sub-conductance states, proposed by Tomita
et al. (2005), could explain its effect on macroscopic equilibrium, and how this relationship
97
translates to other type-I TARPs and CNIH2-3. To better understand the impact of auxiliary
subunits on deactivation kinetics and determine whether true agonist affinity is an important
player, I suggest realizing proper ligand-binding assays to obtain dissociation constants of agonists
interacting with LBDs in the presence of TARPs and CNIHs. The apparent affinity obtained from
electrophysiology experiments and commonly used to describe iGluR interactions with agonists is
rather a measure of potency, which depends on both agonist binding and receptor gating. Potency
therefore provides very indirect information regarding actual changes in the strength of association
between agonists and the LBD binding cleft.
Mutagenesis experiments should be pursued to uncover functional interaction sites
between AMPARs and auxiliary proteins. Exploring the vicinity of the E665 position and the KGK
(718-720) motif could eventually reveal sites that have a specific role in CNIH-dependant
modulation of AMPARs, analogous to the relationship between the KGK motif and γ2 function.
The same approach may be used to further investigate interaction sites across auxiliary protein
structures themselves. As for the KGK motif and the E665 site in GluA2, future experiments could
attempt to determine whether they influence functional interactions with other AMPAR auxiliary
proteins (CKAMP44 and SynDIG1) and investigate equivalent sites in other GluA subunits
(GluA1,3,4) and non-AMPAR subtypes. Furthermore, since the two mutations were made to
replicate the amino-acids found at corresponding sites in KARs, a valid question is whether these
same sites are responsible for the lack of sensitivity of KARs in terms of functional modulation by
TARPs and CNIHs. Dawe et al (2016) showed that incorporating the KGK motif in GluK2 was
insufficient to confer any degree of TARP modulation. It could be interesting to test whether
replacement of a lysine residue by a glutamic acid at the site corresponding to the 665 position in
GluA2 would similarly fail to induce TARP and/or CNIH modulation of KARs. Finally,
elucidation of high-resolution crystal structures of AMPARs in association with auxiliary subunits
will certainly ease the discovery process for functional interaction sites between pore-forming and
auxiliary subunits.
Conclusion
The recent discovery of strong associations between pore-forming and auxiliary subunits
in the CNS has challenged traditional approaches for structure-function studies of AMPARs. In
order to truly understand their roles in the mammalian physiology, a need to redefine AMPAR
98
behavior as part of protein complexes with auxiliary subunits is imposed. In this thesis, I present
preliminary results that could advance our understanding of functional interactions between
AMPARs, CNIHs and TARPs. Findings from my control experiments support the fact that despite
their phenotypically similar effects on AMPAR kinetics, γ2 and CNIH3 modulate individual
kinetic parameters differently. Notably, I highlighted a preferential effect of CNIH3 on exponential
decay components and on deactivation kinetics, versus a more prominent potentiation of
equilibrium responses by γ2. My results also suggest that contrary to γ2, CNIH3 slows recovery
from desensitization. In the second part of my experiments, I show that the KGK motif, critical for
the full modulation of AMPAR decay kinetics by γ2, is also involved in γ2-dependant modulation
of recovery from desensitization and forms no functional interaction with CNIH3. By additional
exploration of the lower (D2) lobe of GluA2 LBD, a glutamic acid (E665) in the vicinity of the
KGK motif was then found as an interaction site shared by both γ2 and CNIH3 for the functional
modulation of decay kinetics and equilibrium responses. Both the E665 site and the KGK motif
demonstrate functional specificity, as they are involved in modulation of AMPAR decay kinetics
by auxiliary subunits independently of other properties of the permeation pathway affected by
TARPs and CNIHs, such as voltage-dependent block by intracellular polyamines. These findings
highlight the role of the LBD in auxiliary protein modulation of iGluR kinetics, which should
continue to be explored to uncover additional interaction mechanisms. Given that the occurrence
of auxiliary subunits in the brain displays a considerable degree of specificity in terms of
anatomical regions, circuits and receptor subtypes, advancing our understanding about their
interactions with iGluRs may lead us towards more specific pharmacological targeting of
glutamatergic transmission.
99
Reference list
Ahmed AH, Wang S, Chuang H-H and Oswald RE (2011) Mechanism of AMPA receptor activation by partial agonists: disulfide trapping of closed lobe conformations. The Journal of biological chemistry 286:35257-35266.
Andersen OS and Koeppe RE (1992) Molecular determinants of channel function. Physiological Reviews 72:S89-S158.
Armstrong N and Gouaux E (2000) Mechanisms for Activation and Antagonism of an AMPA-Sensitive Glutamate Receptor. Neuron 28:165-181.
Armstrong N, Jasti J, Beich-Frandsen M and Gouaux E (2006) Measurement of Conformational Changes accompanying Desensitization in an Ionotropic Glutamate Receptor. Cell 127:85-97.
Ashburner M, Thompson P, Roote J, Lasko PF, Grau Y, el Messal M, Roth S and Simpson P (1990) The genetics of a small autosomal region of Drosophila melanogaster containing the structural gene for alcohol dehydrogenase. VII. Characterization of the region around the snail and cactus loci. Genetics 126:679-694.
Assaf Z, Larsen AP, Venskutonytė R, Han L, Abrahamsen B, Nielsen B, Gajhede M, Kastrup JS, Jensen AA, Pickering DS, Frydenvang K, Gefflaut T and Bunch L (2013) Chemoenzymatic Synthesis of New 2,4-syn-Functionalized (S)-Glutamate Analogues and Structure–Activity Relationship Studies at Ionotropic Glutamate Receptors and Excitatory Amino Acid Transporters. Journal of Medicinal Chemistry 56:1614-1628.
Auerbach A (2015) Agonist activation of a nicotinic acetylcholine receptor. Neuropharmacology 96:150-156.
Banerjee A, Larsen RS, Philpot BD and Paulsen O (2016) Roles of Presynaptic NMDA Receptors in Neurotransmission and Plasticity. Trends in neurosciences 39:26-39.
Baranovic J, Chebli M, Salazar H, Carbone Anna L, Faelber K, Lau Albert Y, Daumke O and Plested Andrew JR (2016) Dynamics of the Ligand Binding Domain Layer during AMPA Receptor Activation. Biophysical Journal 110:896-911.
Ben-Yaacov A, Gillor M, Haham T, Parsai A, Qneibi M and Stern-Bach Y (2017) Molecular Mechanism of AMPA Receptor Modulation by TARP/Stargazin. Neuron 93:1126-1137.e1124.
Bernard A, Ferhat L, Dessi F, Charton G, Represa A, Ben-Ari Y and Khrestchatisky M (1999) Q/R editing of the rat GluR5 and GluR6 kainate receptors in vivo and in vitro: evidence for independent developmental, pathological and cellular regulation. European Journal of Neuroscience 11:604-616.
Betz H (1992) Structure and function of inhibitory glycine receptors. Quarterly Reviews of Biophysics 25:381-394.
Blackstone CD, Moss SJ, Martin LJ, Levey AI, Price DL and Huganir RL (1992) Biochemical Characterization and Localization of a Non-N-Methyl-D-Aspartate Glutamate Receptor in Rat Brain. Journal of Neurochemistry 58:1118-1126.
Bliss TVP and Collingridge GL (1993) A synaptic model of memory: long-term potentiation in the hippocampus. Nature 361:31-39.
Bökel C, Dass S, Wilsch-Bräuninger M and Roth S (2006) <em>Drosophila</em> Cornichon acts as cargo receptor for ER export of the TGFα-like growth factor Gurken. Development 133:459-470.
Boudkkazi S, Brechet A, Schwenk J and Fakler B (2014) Cornichon2 Dictates the Time Course of Excitatory Transmission at Individual Hippocampal Synapses. Neuron 82:848-858.
Bowie D (2002) External anions and cations distinguish between AMPA and kainate receptor gating mechanisms. The Journal of Physiology 539:725-733.
100
Bowie D (2008) Ionotropic glutamate receptors & CNS disorders. CNS & neurological disorders drug targets 7:129-143.
Bowie D, Garcia EP, Marshall J, Traynelis SF and Lange GD (2003) Allosteric Regulation and Spatial Distribution of Kainate Receptors Bound to Ancillary Proteins. The Journal of Physiology 547:373-385.
Bowie D and Lange GD (2002) Functional Stoichiometry of Glutamate Receptor Desensitization. The Journal of Neuroscience 22:3392-3403.
Bowie D, Lange GD and Mayer ML (1998) Activity-Dependent Modulation of Glutamate Receptors by Polyamines. The Journal of Neuroscience 18:8175-8185.
Bowie D and Mayer ML (1995) Inward rectification of both AMPA and kainate subtype glutamate receptors generated by polyamine-mediated ion channel block. Neuron 15:453-462.
Braman J, Papworth C and Greener A (1996) Site-Directed Mutagenesis Using Double-Stranded Plasmid DNA Templates, in In Vitro Mutagenesis Protocols (Trower MK ed) pp 31-44, Humana Press, Totowa, NJ.
Brown PMGE, Aurousseau MRP, Musgaard M, Biggin PC and Bowie D (2016) Kainate receptor pore-forming and auxiliary subunits regulate channel block by a novel mechanism. The Journal of physiology 594:1821-1840.
Burgess DL, Davis CF, Gefrides LA and Noebels JL (1999) Identification of three novel Ca(2+) channel gamma subunit genes reveals molecular diversification by tandem and chromosome duplication. Genome research 9:1204-1213.
Burgess DL, Gefrides LA, Foreman PJ and Noebels JL (2001) A Cluster of Three Novel Ca2+ Channel γ Subunit Genes on Chromosome 19q13.4: Evolution and Expression Profile of the γ Subunit Gene Family. Genomics 71:339-350.
Burrone J and Murthy VN (2003) Synaptic gain control and homeostasis. Current Opinion in Neurobiology 13:560-567.
Cais O, Herguedas B, Krol K, Cull-Candy Stuart G, Farrant M and Greger Ingo H (2014) Mapping the Interaction Sites between AMPA Receptors and TARPs Reveals a Role for the Receptor N-Terminal Domain in Channel Gating. Cell Reports 9:728-740.
Carbone Anna L and Plested Andrew JR (2012) Coupled Control of Desensitization and Gating by the Ligand Binding Domain of Glutamate Receptors. Neuron 74:845-857.
Carbone AL and Plested AJR (2016) Superactivation of AMPA receptors by auxiliary proteins. Nature Communications 7:10178.
Castillo PE, Malenka RC and Nicoll RA (1997) Kainate receptors mediate a slow postsynaptic current in hippocampal CA3 neurons. Nature 388:182-186.
Castro CP, Piscopo D, Nakagawa T and Derynck R (2007) Cornichon regulates transport and secretion of TGFα-related proteins in metazoan cells. Journal of Cell Science 120:2454-2466.
Changeux J-P, Giraudat J and Dennis M (1987) The nicotinic acetylcholine receptor: Molecular architecture of a ligand-regulated ion channel. Trends in Pharmacological Sciences 8:459-465.
Chen L, Chetkovich DM, Petralia RS, Sweeney NT, Kawasaki Y, Wenthold RJ, Bredt DS and Nicoll RA (2000) Stargazin regulates synaptic targeting of AMPA receptors by two distinct mechanisms. Nature 408:936.
Chen L, El-Husseini A, Tomita S, Bredt DS and Nicoll RA (2003) Stargazin Differentially Controls the Trafficking of α-Amino-3-hydroxyl-5-methyl-4-isoxazolepropionate and Kainate Receptors. Molecular Pharmacology 64:703-706.
Chen T-J, Kula B, Nagy B, Barzan R, Gall A, Ehrlich I and Kukley M (2018) In Vivo Regulation of Oligodendrocyte Precursor Cell Proliferation and Differentiation by the AMPA-Receptor Subunit GluA2. Cell Reports 25:852-861.e857.
Cherubini E (2010) Phasic GABAA-mediated inhibition. Epilepsia 51:13-13.
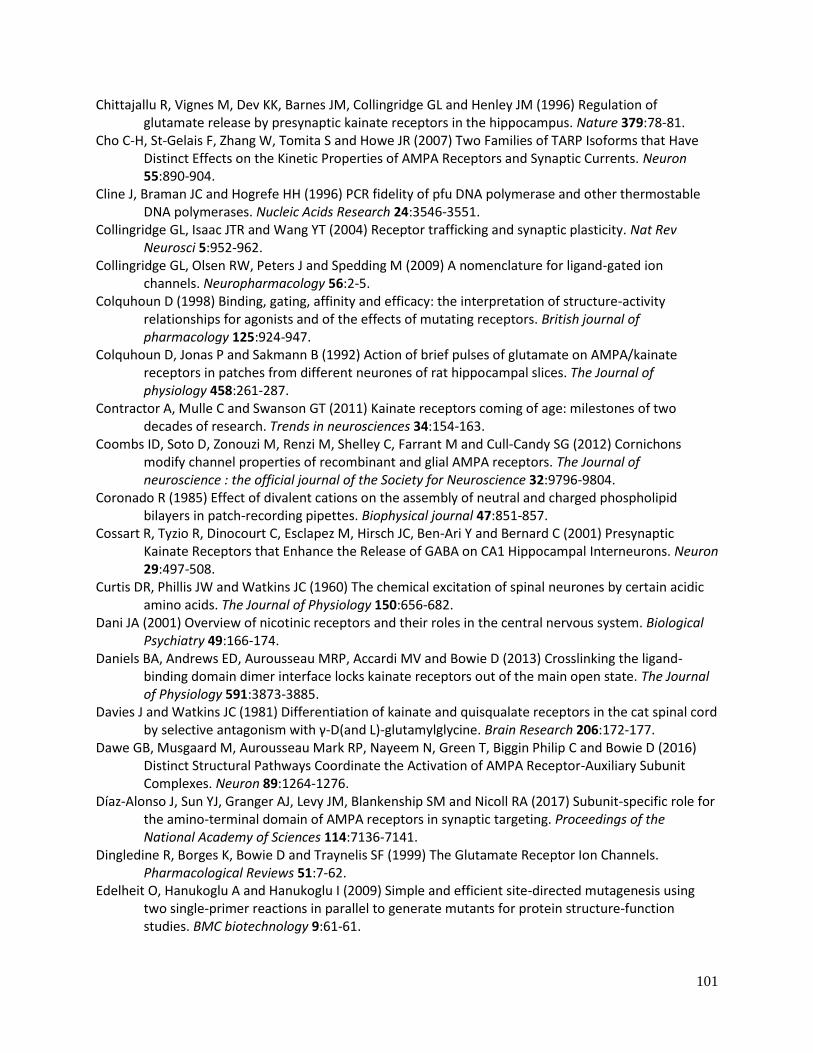
101
Chittajallu R, Vignes M, Dev KK, Barnes JM, Collingridge GL and Henley JM (1996) Regulation of glutamate release by presynaptic kainate receptors in the hippocampus. Nature 379:78-81.
Cho C-H, St-Gelais F, Zhang W, Tomita S and Howe JR (2007) Two Families of TARP Isoforms that Have Distinct Effects on the Kinetic Properties of AMPA Receptors and Synaptic Currents. Neuron 55:890-904.
Cline J, Braman JC and Hogrefe HH (1996) PCR fidelity of pfu DNA polymerase and other thermostable DNA polymerases. Nucleic Acids Research 24:3546-3551.
Collingridge GL, Isaac JTR and Wang YT (2004) Receptor trafficking and synaptic plasticity. Nat Rev Neurosci 5:952-962.
Collingridge GL, Olsen RW, Peters J and Spedding M (2009) A nomenclature for ligand-gated ion channels. Neuropharmacology 56:2-5.
Colquhoun D (1998) Binding, gating, affinity and efficacy: the interpretation of structure-activity relationships for agonists and of the effects of mutating receptors. British journal of pharmacology 125:924-947.
Colquhoun D, Jonas P and Sakmann B (1992) Action of brief pulses of glutamate on AMPA/kainate receptors in patches from different neurones of rat hippocampal slices. The Journal of physiology 458:261-287.
Contractor A, Mulle C and Swanson GT (2011) Kainate receptors coming of age: milestones of two decades of research. Trends in neurosciences 34:154-163.
Coombs ID, Soto D, Zonouzi M, Renzi M, Shelley C, Farrant M and Cull-Candy SG (2012) Cornichons modify channel properties of recombinant and glial AMPA receptors. The Journal of neuroscience : the official journal of the Society for Neuroscience 32:9796-9804.
Coronado R (1985) Effect of divalent cations on the assembly of neutral and charged phospholipid bilayers in patch-recording pipettes. Biophysical journal 47:851-857.
Cossart R, Tyzio R, Dinocourt C, Esclapez M, Hirsch JC, Ben-Ari Y and Bernard C (2001) Presynaptic Kainate Receptors that Enhance the Release of GABA on CA1 Hippocampal Interneurons. Neuron 29:497-508.
Curtis DR, Phillis JW and Watkins JC (1960) The chemical excitation of spinal neurones by certain acidic amino acids. The Journal of Physiology 150:656-682.
Dani JA (2001) Overview of nicotinic receptors and their roles in the central nervous system. Biological Psychiatry 49:166-174.
Daniels BA, Andrews ED, Aurousseau MRP, Accardi MV and Bowie D (2013) Crosslinking the ligand-binding domain dimer interface locks kainate receptors out of the main open state. The Journal of Physiology 591:3873-3885.
Davies J and Watkins JC (1981) Differentiation of kainate and quisqualate receptors in the cat spinal cord by selective antagonism with γ-D(and L)-glutamylglycine. Brain Research 206:172-177.
Dawe GB, Musgaard M, Aurousseau Mark RP, Nayeem N, Green T, Biggin Philip C and Bowie D (2016) Distinct Structural Pathways Coordinate the Activation of AMPA Receptor-Auxiliary Subunit Complexes. Neuron 89:1264-1276.
Díaz-Alonso J, Sun YJ, Granger AJ, Levy JM, Blankenship SM and Nicoll RA (2017) Subunit-specific role for the amino-terminal domain of AMPA receptors in synaptic targeting. Proceedings of the National Academy of Sciences 114:7136-7141.
Dingledine R, Borges K, Bowie D and Traynelis SF (1999) The Glutamate Receptor Ion Channels. Pharmacological Reviews 51:7-62.
Edelheit O, Hanukoglu A and Hanukoglu I (2009) Simple and efficient site-directed mutagenesis using two single-primer reactions in parallel to generate mutants for protein structure-function studies. BMC biotechnology 9:61-61.
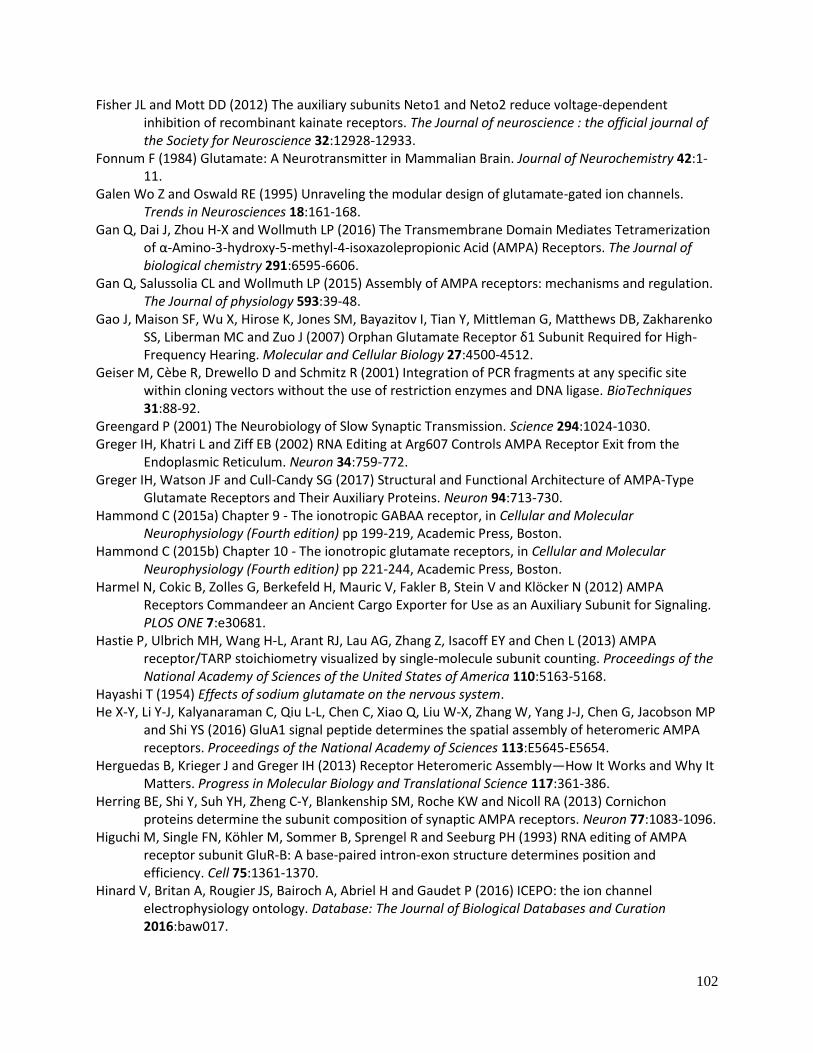
102
Fisher JL and Mott DD (2012) The auxiliary subunits Neto1 and Neto2 reduce voltage-dependent inhibition of recombinant kainate receptors. The Journal of neuroscience : the official journal of the Society for Neuroscience 32:12928-12933.
Fonnum F (1984) Glutamate: A Neurotransmitter in Mammalian Brain. Journal of Neurochemistry 42:1-11.
Galen Wo Z and Oswald RE (1995) Unraveling the modular design of glutamate-gated ion channels. Trends in Neurosciences 18:161-168.
Gan Q, Dai J, Zhou H-X and Wollmuth LP (2016) The Transmembrane Domain Mediates Tetramerization of α-Amino-3-hydroxy-5-methyl-4-isoxazolepropionic Acid (AMPA) Receptors. The Journal of biological chemistry 291:6595-6606.
Gan Q, Salussolia CL and Wollmuth LP (2015) Assembly of AMPA receptors: mechanisms and regulation. The Journal of physiology 593:39-48.
Gao J, Maison SF, Wu X, Hirose K, Jones SM, Bayazitov I, Tian Y, Mittleman G, Matthews DB, Zakharenko SS, Liberman MC and Zuo J (2007) Orphan Glutamate Receptor δ1 Subunit Required for High-Frequency Hearing. Molecular and Cellular Biology 27:4500-4512.
Geiser M, Cèbe R, Drewello D and Schmitz R (2001) Integration of PCR fragments at any specific site within cloning vectors without the use of restriction enzymes and DNA ligase. BioTechniques 31:88-92.
Greengard P (2001) The Neurobiology of Slow Synaptic Transmission. Science 294:1024-1030. Greger IH, Khatri L and Ziff EB (2002) RNA Editing at Arg607 Controls AMPA Receptor Exit from the
Endoplasmic Reticulum. Neuron 34:759-772. Greger IH, Watson JF and Cull-Candy SG (2017) Structural and Functional Architecture of AMPA-Type
Glutamate Receptors and Their Auxiliary Proteins. Neuron 94:713-730. Hammond C (2015a) Chapter 9 - The ionotropic GABAA receptor, in Cellular and Molecular
Neurophysiology (Fourth edition) pp 199-219, Academic Press, Boston. Hammond C (2015b) Chapter 10 - The ionotropic glutamate receptors, in Cellular and Molecular
Neurophysiology (Fourth edition) pp 221-244, Academic Press, Boston. Harmel N, Cokic B, Zolles G, Berkefeld H, Mauric V, Fakler B, Stein V and Klöcker N (2012) AMPA
Receptors Commandeer an Ancient Cargo Exporter for Use as an Auxiliary Subunit for Signaling. PLOS ONE 7:e30681.
Hastie P, Ulbrich MH, Wang H-L, Arant RJ, Lau AG, Zhang Z, Isacoff EY and Chen L (2013) AMPA receptor/TARP stoichiometry visualized by single-molecule subunit counting. Proceedings of the National Academy of Sciences of the United States of America 110:5163-5168.
Hayashi T (1954) Effects of sodium glutamate on the nervous system. He X-Y, Li Y-J, Kalyanaraman C, Qiu L-L, Chen C, Xiao Q, Liu W-X, Zhang W, Yang J-J, Chen G, Jacobson MP
and Shi YS (2016) GluA1 signal peptide determines the spatial assembly of heteromeric AMPA receptors. Proceedings of the National Academy of Sciences 113:E5645-E5654.
Herguedas B, Krieger J and Greger IH (2013) Receptor Heteromeric Assembly—How It Works and Why It Matters. Progress in Molecular Biology and Translational Science 117:361-386.
Herring BE, Shi Y, Suh YH, Zheng C-Y, Blankenship SM, Roche KW and Nicoll RA (2013) Cornichon proteins determine the subunit composition of synaptic AMPA receptors. Neuron 77:1083-1096.
Higuchi M, Single FN, Köhler M, Sommer B, Sprengel R and Seeburg PH (1993) RNA editing of AMPA receptor subunit GluR-B: A base-paired intron-exon structure determines position and efficiency. Cell 75:1361-1370.
Hinard V, Britan A, Rougier JS, Bairoch A, Abriel H and Gaudet P (2016) ICEPO: the ion channel electrophysiology ontology. Database: The Journal of Biological Databases and Curation 2016:baw017.
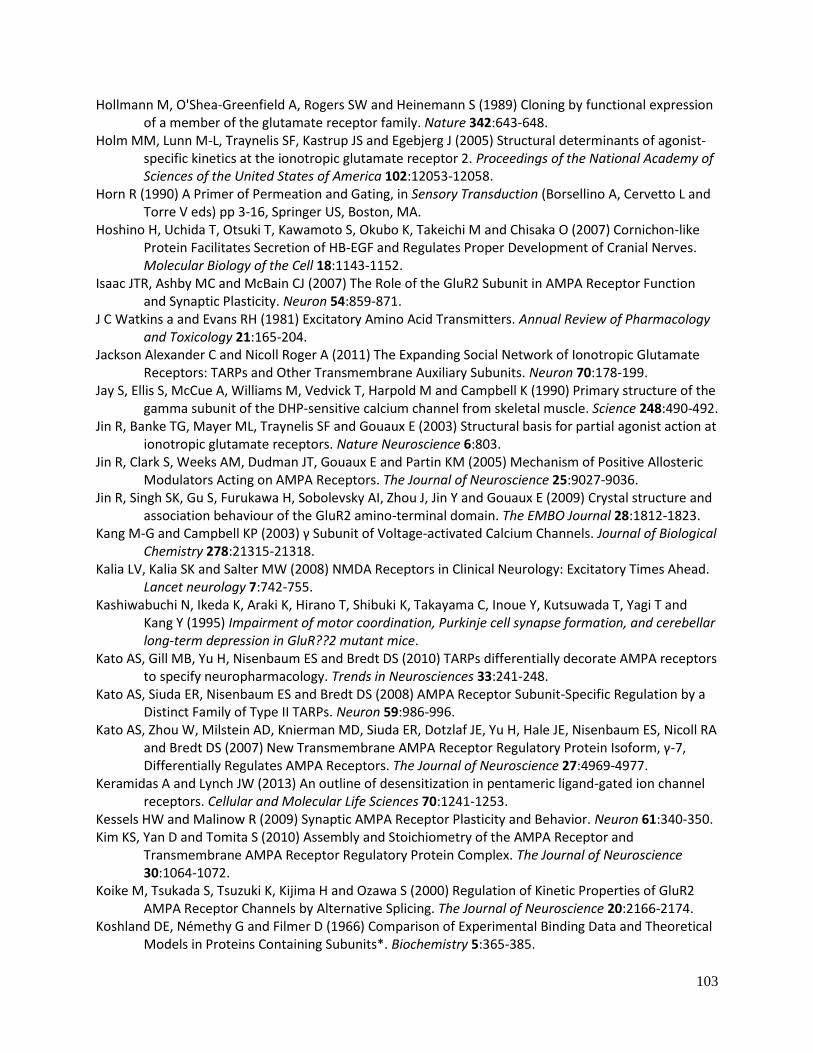
103
Hollmann M, O'Shea-Greenfield A, Rogers SW and Heinemann S (1989) Cloning by functional expression of a member of the glutamate receptor family. Nature 342:643-648.
Holm MM, Lunn M-L, Traynelis SF, Kastrup JS and Egebjerg J (2005) Structural determinants of agonist-specific kinetics at the ionotropic glutamate receptor 2. Proceedings of the National Academy of Sciences of the United States of America 102:12053-12058.
Horn R (1990) A Primer of Permeation and Gating, in Sensory Transduction (Borsellino A, Cervetto L and Torre V eds) pp 3-16, Springer US, Boston, MA.
Hoshino H, Uchida T, Otsuki T, Kawamoto S, Okubo K, Takeichi M and Chisaka O (2007) Cornichon-like Protein Facilitates Secretion of HB-EGF and Regulates Proper Development of Cranial Nerves. Molecular Biology of the Cell 18:1143-1152.
Isaac JTR, Ashby MC and McBain CJ (2007) The Role of the GluR2 Subunit in AMPA Receptor Function and Synaptic Plasticity. Neuron 54:859-871.
J C Watkins a and Evans RH (1981) Excitatory Amino Acid Transmitters. Annual Review of Pharmacology and Toxicology 21:165-204.
Jackson Alexander C and Nicoll Roger A (2011) The Expanding Social Network of Ionotropic Glutamate Receptors: TARPs and Other Transmembrane Auxiliary Subunits. Neuron 70:178-199.
Jay S, Ellis S, McCue A, Williams M, Vedvick T, Harpold M and Campbell K (1990) Primary structure of the gamma subunit of the DHP-sensitive calcium channel from skeletal muscle. Science 248:490-492.
Jin R, Banke TG, Mayer ML, Traynelis SF and Gouaux E (2003) Structural basis for partial agonist action at ionotropic glutamate receptors. Nature Neuroscience 6:803.
Jin R, Clark S, Weeks AM, Dudman JT, Gouaux E and Partin KM (2005) Mechanism of Positive Allosteric Modulators Acting on AMPA Receptors. The Journal of Neuroscience 25:9027-9036.
Jin R, Singh SK, Gu S, Furukawa H, Sobolevsky AI, Zhou J, Jin Y and Gouaux E (2009) Crystal structure and association behaviour of the GluR2 amino-terminal domain. The EMBO Journal 28:1812-1823.
Kang M-G and Campbell KP (2003) γ Subunit of Voltage-activated Calcium Channels. Journal of Biological Chemistry 278:21315-21318.
Kalia LV, Kalia SK and Salter MW (2008) NMDA Receptors in Clinical Neurology: Excitatory Times Ahead. Lancet neurology 7:742-755.
Kashiwabuchi N, Ikeda K, Araki K, Hirano T, Shibuki K, Takayama C, Inoue Y, Kutsuwada T, Yagi T and Kang Y (1995) Impairment of motor coordination, Purkinje cell synapse formation, and cerebellar long-term depression in GluR??2 mutant mice.
Kato AS, Gill MB, Yu H, Nisenbaum ES and Bredt DS (2010) TARPs differentially decorate AMPA receptors to specify neuropharmacology. Trends in Neurosciences 33:241-248.
Kato AS, Siuda ER, Nisenbaum ES and Bredt DS (2008) AMPA Receptor Subunit-Specific Regulation by a Distinct Family of Type II TARPs. Neuron 59:986-996.
Kato AS, Zhou W, Milstein AD, Knierman MD, Siuda ER, Dotzlaf JE, Yu H, Hale JE, Nisenbaum ES, Nicoll RA and Bredt DS (2007) New Transmembrane AMPA Receptor Regulatory Protein Isoform, γ-7, Differentially Regulates AMPA Receptors. The Journal of Neuroscience 27:4969-4977.
Keramidas A and Lynch JW (2013) An outline of desensitization in pentameric ligand-gated ion channel receptors. Cellular and Molecular Life Sciences 70:1241-1253.
Kessels HW and Malinow R (2009) Synaptic AMPA Receptor Plasticity and Behavior. Neuron 61:340-350. Kim KS, Yan D and Tomita S (2010) Assembly and Stoichiometry of the AMPA Receptor and
Transmembrane AMPA Receptor Regulatory Protein Complex. The Journal of Neuroscience 30:1064-1072.
Koike M, Tsukada S, Tsuzuki K, Kijima H and Ozawa S (2000) Regulation of Kinetic Properties of GluR2 AMPA Receptor Channels by Alternative Splicing. The Journal of Neuroscience 20:2166-2174.
Koshland DE, Némethy G and Filmer D (1966) Comparison of Experimental Binding Data and Theoretical Models in Proteins Containing Subunits*. Biochemistry 5:365-385.
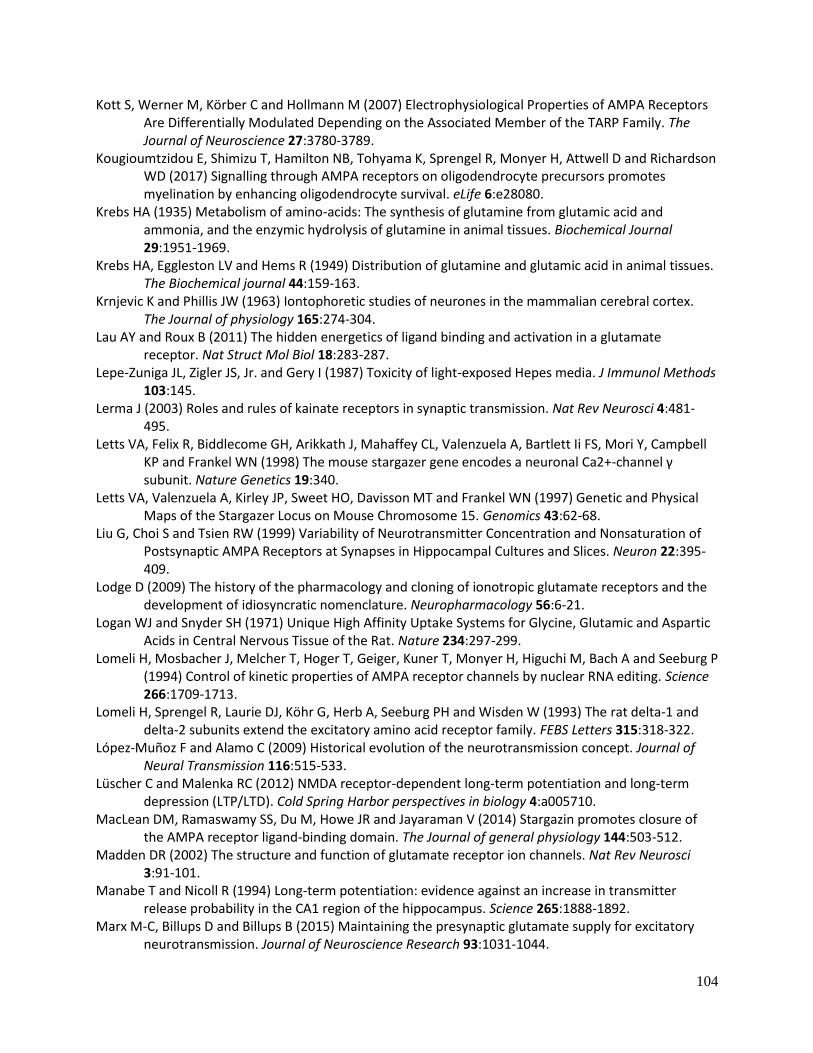
104
Kott S, Werner M, Körber C and Hollmann M (2007) Electrophysiological Properties of AMPA Receptors Are Differentially Modulated Depending on the Associated Member of the TARP Family. The Journal of Neuroscience 27:3780-3789.
Kougioumtzidou E, Shimizu T, Hamilton NB, Tohyama K, Sprengel R, Monyer H, Attwell D and Richardson WD (2017) Signalling through AMPA receptors on oligodendrocyte precursors promotes myelination by enhancing oligodendrocyte survival. eLife 6:e28080.
Krebs HA (1935) Metabolism of amino-acids: The synthesis of glutamine from glutamic acid and ammonia, and the enzymic hydrolysis of glutamine in animal tissues. Biochemical Journal 29:1951-1969.
Krebs HA, Eggleston LV and Hems R (1949) Distribution of glutamine and glutamic acid in animal tissues. The Biochemical journal 44:159-163.
Krnjevic K and Phillis JW (1963) Iontophoretic studies of neurones in the mammalian cerebral cortex. The Journal of physiology 165:274-304.
Lau AY and Roux B (2011) The hidden energetics of ligand binding and activation in a glutamate receptor. Nat Struct Mol Biol 18:283-287.
Lepe-Zuniga JL, Zigler JS, Jr. and Gery I (1987) Toxicity of light-exposed Hepes media. J Immunol Methods 103:145.
Lerma J (2003) Roles and rules of kainate receptors in synaptic transmission. Nat Rev Neurosci 4:481-495.
Letts VA, Felix R, Biddlecome GH, Arikkath J, Mahaffey CL, Valenzuela A, Bartlett Ii FS, Mori Y, Campbell KP and Frankel WN (1998) The mouse stargazer gene encodes a neuronal Ca2+-channel γ subunit. Nature Genetics 19:340.
Letts VA, Valenzuela A, Kirley JP, Sweet HO, Davisson MT and Frankel WN (1997) Genetic and Physical Maps of the Stargazer Locus on Mouse Chromosome 15. Genomics 43:62-68.
Liu G, Choi S and Tsien RW (1999) Variability of Neurotransmitter Concentration and Nonsaturation of Postsynaptic AMPA Receptors at Synapses in Hippocampal Cultures and Slices. Neuron 22:395-409.
Lodge D (2009) The history of the pharmacology and cloning of ionotropic glutamate receptors and the development of idiosyncratic nomenclature. Neuropharmacology 56:6-21.
Logan WJ and Snyder SH (1971) Unique High Affinity Uptake Systems for Glycine, Glutamic and Aspartic Acids in Central Nervous Tissue of the Rat. Nature 234:297-299.
Lomeli H, Mosbacher J, Melcher T, Hoger T, Geiger, Kuner T, Monyer H, Higuchi M, Bach A and Seeburg P (1994) Control of kinetic properties of AMPA receptor channels by nuclear RNA editing. Science 266:1709-1713.
Lomeli H, Sprengel R, Laurie DJ, Köhr G, Herb A, Seeburg PH and Wisden W (1993) The rat delta-1 and delta-2 subunits extend the excitatory amino acid receptor family. FEBS Letters 315:318-322.
López-Muñoz F and Alamo C (2009) Historical evolution of the neurotransmission concept. Journal of Neural Transmission 116:515-533.
Lüscher C and Malenka RC (2012) NMDA receptor-dependent long-term potentiation and long-term depression (LTP/LTD). Cold Spring Harbor perspectives in biology 4:a005710.
MacLean DM, Ramaswamy SS, Du M, Howe JR and Jayaraman V (2014) Stargazin promotes closure of the AMPA receptor ligand-binding domain. The Journal of general physiology 144:503-512.
Madden DR (2002) The structure and function of glutamate receptor ion channels. Nat Rev Neurosci 3:91-101.
Manabe T and Nicoll R (1994) Long-term potentiation: evidence against an increase in transmitter release probability in the CA1 region of the hippocampus. Science 265:1888-1892.
Marx M-C, Billups D and Billups B (2015) Maintaining the presynaptic glutamate supply for excitatory neurotransmission. Journal of Neuroscience Research 93:1031-1044.
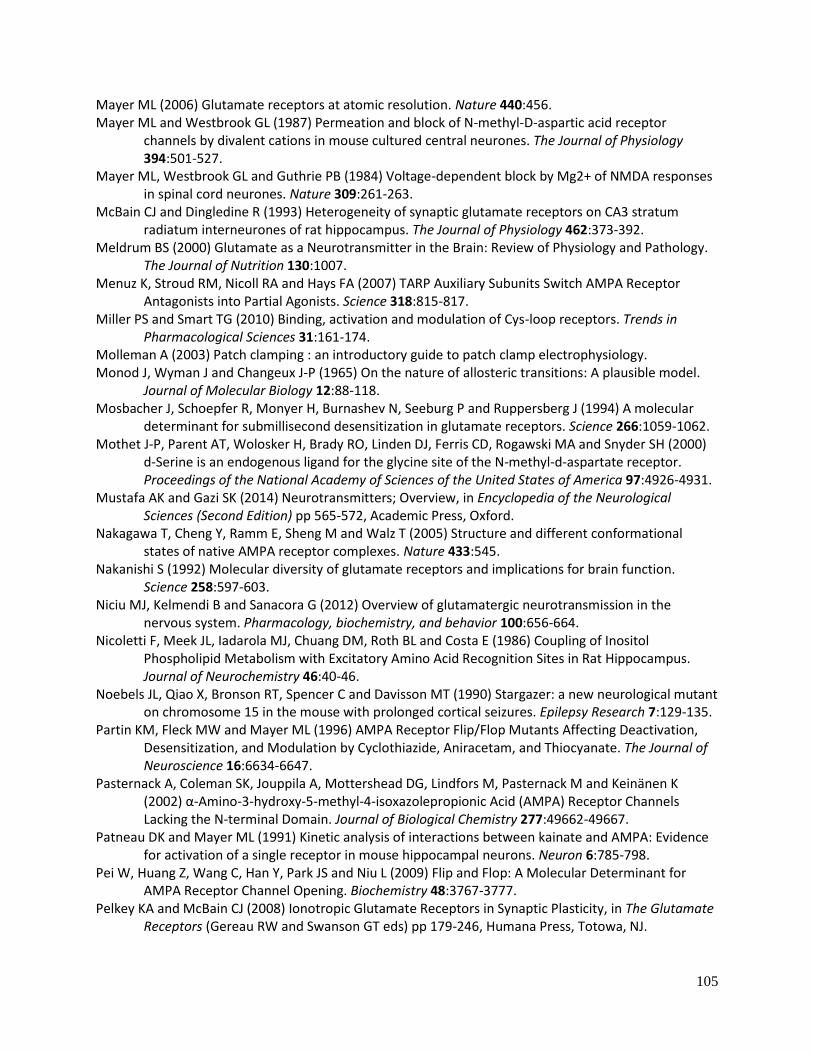
105
Mayer ML (2006) Glutamate receptors at atomic resolution. Nature 440:456. Mayer ML and Westbrook GL (1987) Permeation and block of N-methyl-D-aspartic acid receptor
channels by divalent cations in mouse cultured central neurones. The Journal of Physiology 394:501-527.
Mayer ML, Westbrook GL and Guthrie PB (1984) Voltage-dependent block by Mg2+ of NMDA responses in spinal cord neurones. Nature 309:261-263.
McBain CJ and Dingledine R (1993) Heterogeneity of synaptic glutamate receptors on CA3 stratum radiatum interneurones of rat hippocampus. The Journal of Physiology 462:373-392.
Meldrum BS (2000) Glutamate as a Neurotransmitter in the Brain: Review of Physiology and Pathology. The Journal of Nutrition 130:1007.
Menuz K, Stroud RM, Nicoll RA and Hays FA (2007) TARP Auxiliary Subunits Switch AMPA Receptor Antagonists into Partial Agonists. Science 318:815-817.
Miller PS and Smart TG (2010) Binding, activation and modulation of Cys-loop receptors. Trends in Pharmacological Sciences 31:161-174.
Molleman A (2003) Patch clamping : an introductory guide to patch clamp electrophysiology. Monod J, Wyman J and Changeux J-P (1965) On the nature of allosteric transitions: A plausible model.
Journal of Molecular Biology 12:88-118. Mosbacher J, Schoepfer R, Monyer H, Burnashev N, Seeburg P and Ruppersberg J (1994) A molecular
determinant for submillisecond desensitization in glutamate receptors. Science 266:1059-1062. Mothet J-P, Parent AT, Wolosker H, Brady RO, Linden DJ, Ferris CD, Rogawski MA and Snyder SH (2000)
d-Serine is an endogenous ligand for the glycine site of the N-methyl-d-aspartate receptor. Proceedings of the National Academy of Sciences of the United States of America 97:4926-4931.
Mustafa AK and Gazi SK (2014) Neurotransmitters; Overview, in Encyclopedia of the Neurological Sciences (Second Edition) pp 565-572, Academic Press, Oxford.
Nakagawa T, Cheng Y, Ramm E, Sheng M and Walz T (2005) Structure and different conformational states of native AMPA receptor complexes. Nature 433:545.
Nakanishi S (1992) Molecular diversity of glutamate receptors and implications for brain function. Science 258:597-603.
Niciu MJ, Kelmendi B and Sanacora G (2012) Overview of glutamatergic neurotransmission in the nervous system. Pharmacology, biochemistry, and behavior 100:656-664.
Nicoletti F, Meek JL, Iadarola MJ, Chuang DM, Roth BL and Costa E (1986) Coupling of Inositol Phospholipid Metabolism with Excitatory Amino Acid Recognition Sites in Rat Hippocampus. Journal of Neurochemistry 46:40-46.
Noebels JL, Qiao X, Bronson RT, Spencer C and Davisson MT (1990) Stargazer: a new neurological mutant on chromosome 15 in the mouse with prolonged cortical seizures. Epilepsy Research 7:129-135.
Partin KM, Fleck MW and Mayer ML (1996) AMPA Receptor Flip/Flop Mutants Affecting Deactivation, Desensitization, and Modulation by Cyclothiazide, Aniracetam, and Thiocyanate. The Journal of Neuroscience 16:6634-6647.
Pasternack A, Coleman SK, Jouppila A, Mottershead DG, Lindfors M, Pasternack M and Keinänen K (2002) α-Amino-3-hydroxy-5-methyl-4-isoxazolepropionic Acid (AMPA) Receptor Channels Lacking the N-terminal Domain. Journal of Biological Chemistry 277:49662-49667.
Patneau DK and Mayer ML (1991) Kinetic analysis of interactions between kainate and AMPA: Evidence for activation of a single receptor in mouse hippocampal neurons. Neuron 6:785-798.
Pei W, Huang Z, Wang C, Han Y, Park JS and Niu L (2009) Flip and Flop: A Molecular Determinant for AMPA Receptor Channel Opening. Biochemistry 48:3767-3777.
Pelkey KA and McBain CJ (2008) Ionotropic Glutamate Receptors in Synaptic Plasticity, in The Glutamate Receptors (Gereau RW and Swanson GT eds) pp 179-246, Humana Press, Totowa, NJ.
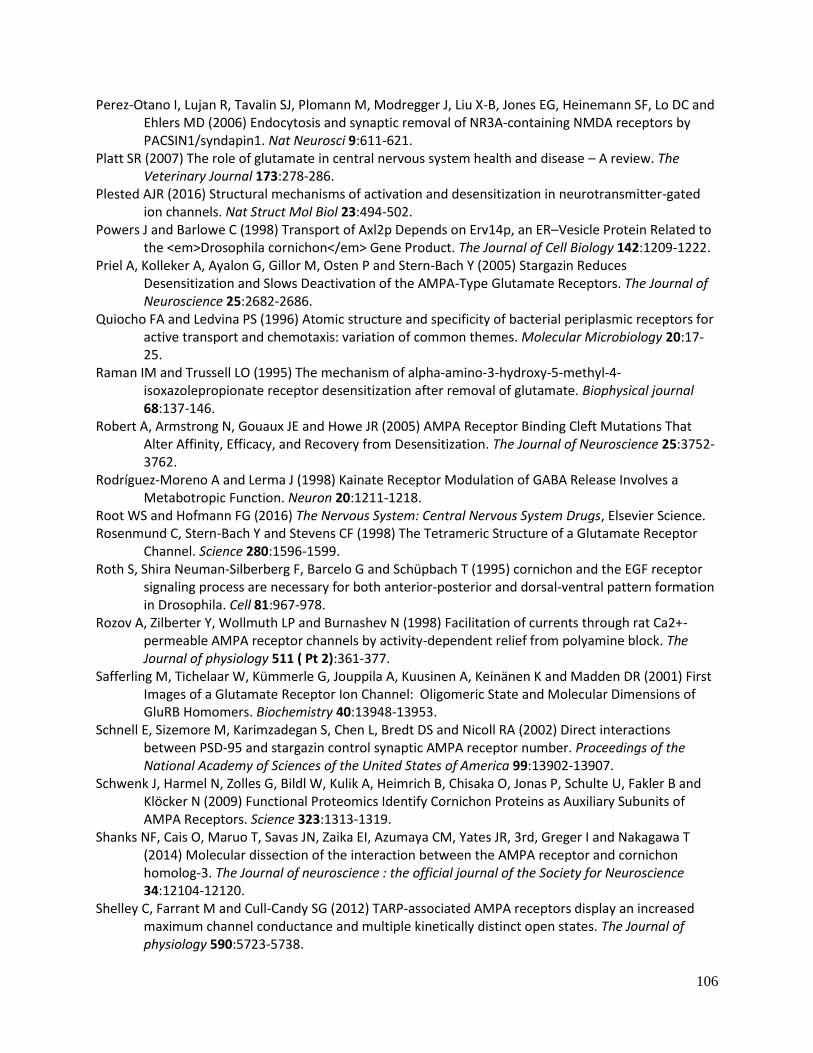
106
Perez-Otano I, Lujan R, Tavalin SJ, Plomann M, Modregger J, Liu X-B, Jones EG, Heinemann SF, Lo DC and Ehlers MD (2006) Endocytosis and synaptic removal of NR3A-containing NMDA receptors by PACSIN1/syndapin1. Nat Neurosci 9:611-621.
Platt SR (2007) The role of glutamate in central nervous system health and disease – A review. The Veterinary Journal 173:278-286.
Plested AJR (2016) Structural mechanisms of activation and desensitization in neurotransmitter-gated ion channels. Nat Struct Mol Biol 23:494-502.
Powers J and Barlowe C (1998) Transport of Axl2p Depends on Erv14p, an ER–Vesicle Protein Related to the <em>Drosophila cornichon</em> Gene Product. The Journal of Cell Biology 142:1209-1222.
Priel A, Kolleker A, Ayalon G, Gillor M, Osten P and Stern-Bach Y (2005) Stargazin Reduces Desensitization and Slows Deactivation of the AMPA-Type Glutamate Receptors. The Journal of Neuroscience 25:2682-2686.
Quiocho FA and Ledvina PS (1996) Atomic structure and specificity of bacterial periplasmic receptors for active transport and chemotaxis: variation of common themes. Molecular Microbiology 20:17-25.
Raman IM and Trussell LO (1995) The mechanism of alpha-amino-3-hydroxy-5-methyl-4-isoxazolepropionate receptor desensitization after removal of glutamate. Biophysical journal 68:137-146.
Robert A, Armstrong N, Gouaux JE and Howe JR (2005) AMPA Receptor Binding Cleft Mutations That Alter Affinity, Efficacy, and Recovery from Desensitization. The Journal of Neuroscience 25:3752-3762.
Rodríguez-Moreno A and Lerma J (1998) Kainate Receptor Modulation of GABA Release Involves a Metabotropic Function. Neuron 20:1211-1218.
Root WS and Hofmann FG (2016) The Nervous System: Central Nervous System Drugs, Elsevier Science. Rosenmund C, Stern-Bach Y and Stevens CF (1998) The Tetrameric Structure of a Glutamate Receptor
Channel. Science 280:1596-1599. Roth S, Shira Neuman-Silberberg F, Barcelo G and Schüpbach T (1995) cornichon and the EGF receptor
signaling process are necessary for both anterior-posterior and dorsal-ventral pattern formation in Drosophila. Cell 81:967-978.
Rozov A, Zilberter Y, Wollmuth LP and Burnashev N (1998) Facilitation of currents through rat Ca2+-permeable AMPA receptor channels by activity-dependent relief from polyamine block. The Journal of physiology 511 ( Pt 2):361-377.
Safferling M, Tichelaar W, Kümmerle G, Jouppila A, Kuusinen A, Keinänen K and Madden DR (2001) First Images of a Glutamate Receptor Ion Channel: Oligomeric State and Molecular Dimensions of GluRB Homomers. Biochemistry 40:13948-13953.
Schnell E, Sizemore M, Karimzadegan S, Chen L, Bredt DS and Nicoll RA (2002) Direct interactions between PSD-95 and stargazin control synaptic AMPA receptor number. Proceedings of the National Academy of Sciences of the United States of America 99:13902-13907.
Schwenk J, Harmel N, Zolles G, Bildl W, Kulik A, Heimrich B, Chisaka O, Jonas P, Schulte U, Fakler B and Klöcker N (2009) Functional Proteomics Identify Cornichon Proteins as Auxiliary Subunits of AMPA Receptors. Science 323:1313-1319.
Shanks NF, Cais O, Maruo T, Savas JN, Zaika EI, Azumaya CM, Yates JR, 3rd, Greger I and Nakagawa T (2014) Molecular dissection of the interaction between the AMPA receptor and cornichon homolog-3. The Journal of neuroscience : the official journal of the Society for Neuroscience 34:12104-12120.
Shelley C, Farrant M and Cull-Candy SG (2012) TARP-associated AMPA receptors display an increased maximum channel conductance and multiple kinetically distinct open states. The Journal of physiology 590:5723-5738.
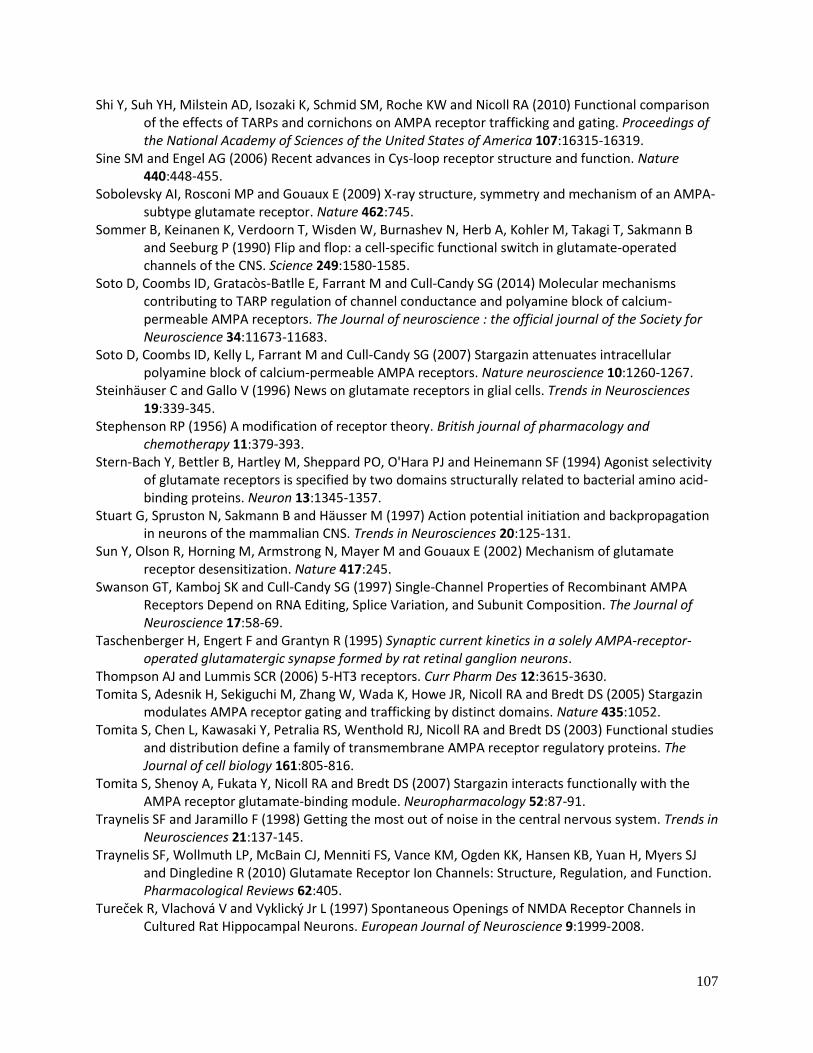
107
Shi Y, Suh YH, Milstein AD, Isozaki K, Schmid SM, Roche KW and Nicoll RA (2010) Functional comparison of the effects of TARPs and cornichons on AMPA receptor trafficking and gating. Proceedings of the National Academy of Sciences of the United States of America 107:16315-16319.
Sine SM and Engel AG (2006) Recent advances in Cys-loop receptor structure and function. Nature 440:448-455.
Sobolevsky AI, Rosconi MP and Gouaux E (2009) X-ray structure, symmetry and mechanism of an AMPA-subtype glutamate receptor. Nature 462:745.
Sommer B, Keinanen K, Verdoorn T, Wisden W, Burnashev N, Herb A, Kohler M, Takagi T, Sakmann B and Seeburg P (1990) Flip and flop: a cell-specific functional switch in glutamate-operated channels of the CNS. Science 249:1580-1585.
Soto D, Coombs ID, Gratacòs-Batlle E, Farrant M and Cull-Candy SG (2014) Molecular mechanisms contributing to TARP regulation of channel conductance and polyamine block of calcium-permeable AMPA receptors. The Journal of neuroscience : the official journal of the Society for Neuroscience 34:11673-11683.
Soto D, Coombs ID, Kelly L, Farrant M and Cull-Candy SG (2007) Stargazin attenuates intracellular polyamine block of calcium-permeable AMPA receptors. Nature neuroscience 10:1260-1267.
Steinhäuser C and Gallo V (1996) News on glutamate receptors in glial cells. Trends in Neurosciences 19:339-345.
Stephenson RP (1956) A modification of receptor theory. British journal of pharmacology and chemotherapy 11:379-393.
Stern-Bach Y, Bettler B, Hartley M, Sheppard PO, O'Hara PJ and Heinemann SF (1994) Agonist selectivity of glutamate receptors is specified by two domains structurally related to bacterial amino acid-binding proteins. Neuron 13:1345-1357.
Stuart G, Spruston N, Sakmann B and Häusser M (1997) Action potential initiation and backpropagation in neurons of the mammalian CNS. Trends in Neurosciences 20:125-131.
Sun Y, Olson R, Horning M, Armstrong N, Mayer M and Gouaux E (2002) Mechanism of glutamate receptor desensitization. Nature 417:245.
Swanson GT, Kamboj SK and Cull-Candy SG (1997) Single-Channel Properties of Recombinant AMPA Receptors Depend on RNA Editing, Splice Variation, and Subunit Composition. The Journal of Neuroscience 17:58-69.
Taschenberger H, Engert F and Grantyn R (1995) Synaptic current kinetics in a solely AMPA-receptor-operated glutamatergic synapse formed by rat retinal ganglion neurons.
Thompson AJ and Lummis SCR (2006) 5-HT3 receptors. Curr Pharm Des 12:3615-3630. Tomita S, Adesnik H, Sekiguchi M, Zhang W, Wada K, Howe JR, Nicoll RA and Bredt DS (2005) Stargazin
modulates AMPA receptor gating and trafficking by distinct domains. Nature 435:1052. Tomita S, Chen L, Kawasaki Y, Petralia RS, Wenthold RJ, Nicoll RA and Bredt DS (2003) Functional studies
and distribution define a family of transmembrane AMPA receptor regulatory proteins. The Journal of cell biology 161:805-816.
Tomita S, Shenoy A, Fukata Y, Nicoll RA and Bredt DS (2007) Stargazin interacts functionally with the AMPA receptor glutamate-binding module. Neuropharmacology 52:87-91.
Traynelis SF and Jaramillo F (1998) Getting the most out of noise in the central nervous system. Trends in Neurosciences 21:137-145.
Traynelis SF, Wollmuth LP, McBain CJ, Menniti FS, Vance KM, Ogden KK, Hansen KB, Yuan H, Myers SJ and Dingledine R (2010) Glutamate Receptor Ion Channels: Structure, Regulation, and Function. Pharmacological Reviews 62:405.
Tureček R, Vlachová V and Vyklický Jr L (1997) Spontaneous Openings of NMDA Receptor Channels in Cultured Rat Hippocampal Neurons. European Journal of Neuroscience 9:1999-2008.
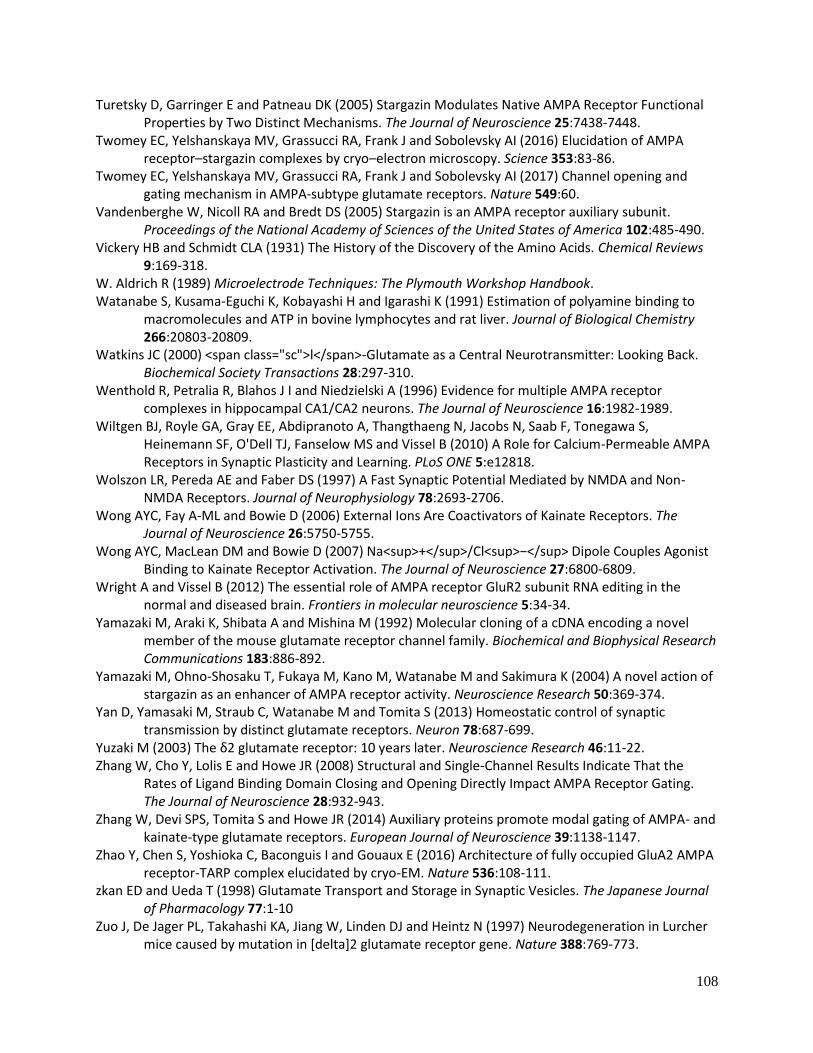
108
Turetsky D, Garringer E and Patneau DK (2005) Stargazin Modulates Native AMPA Receptor Functional Properties by Two Distinct Mechanisms. The Journal of Neuroscience 25:7438-7448.
Twomey EC, Yelshanskaya MV, Grassucci RA, Frank J and Sobolevsky AI (2016) Elucidation of AMPA receptor–stargazin complexes by cryo–electron microscopy. Science 353:83-86.
Twomey EC, Yelshanskaya MV, Grassucci RA, Frank J and Sobolevsky AI (2017) Channel opening and gating mechanism in AMPA-subtype glutamate receptors. Nature 549:60.
Vandenberghe W, Nicoll RA and Bredt DS (2005) Stargazin is an AMPA receptor auxiliary subunit. Proceedings of the National Academy of Sciences of the United States of America 102:485-490.
Vickery HB and Schmidt CLA (1931) The History of the Discovery of the Amino Acids. Chemical Reviews 9:169-318.
W. Aldrich R (1989) Microelectrode Techniques: The Plymouth Workshop Handbook. Watanabe S, Kusama-Eguchi K, Kobayashi H and Igarashi K (1991) Estimation of polyamine binding to
macromolecules and ATP in bovine lymphocytes and rat liver. Journal of Biological Chemistry 266:20803-20809.
Watkins JC (2000) <span class="sc">l</span>-Glutamate as a Central Neurotransmitter: Looking Back. Biochemical Society Transactions 28:297-310.
Wenthold R, Petralia R, Blahos J I and Niedzielski A (1996) Evidence for multiple AMPA receptor complexes in hippocampal CA1/CA2 neurons. The Journal of Neuroscience 16:1982-1989.
Wiltgen BJ, Royle GA, Gray EE, Abdipranoto A, Thangthaeng N, Jacobs N, Saab F, Tonegawa S, Heinemann SF, O'Dell TJ, Fanselow MS and Vissel B (2010) A Role for Calcium-Permeable AMPA Receptors in Synaptic Plasticity and Learning. PLoS ONE 5:e12818.
Wolszon LR, Pereda AE and Faber DS (1997) A Fast Synaptic Potential Mediated by NMDA and Non-NMDA Receptors. Journal of Neurophysiology 78:2693-2706.
Wong AYC, Fay A-ML and Bowie D (2006) External Ions Are Coactivators of Kainate Receptors. The Journal of Neuroscience 26:5750-5755.
Wong AYC, MacLean DM and Bowie D (2007) Na<sup>+</sup>/Cl<sup>−</sup> Dipole Couples Agonist Binding to Kainate Receptor Activation. The Journal of Neuroscience 27:6800-6809.
Wright A and Vissel B (2012) The essential role of AMPA receptor GluR2 subunit RNA editing in the normal and diseased brain. Frontiers in molecular neuroscience 5:34-34.
Yamazaki M, Araki K, Shibata A and Mishina M (1992) Molecular cloning of a cDNA encoding a novel member of the mouse glutamate receptor channel family. Biochemical and Biophysical Research Communications 183:886-892.
Yamazaki M, Ohno-Shosaku T, Fukaya M, Kano M, Watanabe M and Sakimura K (2004) A novel action of stargazin as an enhancer of AMPA receptor activity. Neuroscience Research 50:369-374.
Yan D, Yamasaki M, Straub C, Watanabe M and Tomita S (2013) Homeostatic control of synaptic transmission by distinct glutamate receptors. Neuron 78:687-699.
Yuzaki M (2003) The δ2 glutamate receptor: 10 years later. Neuroscience Research 46:11-22. Zhang W, Cho Y, Lolis E and Howe JR (2008) Structural and Single-Channel Results Indicate That the
Rates of Ligand Binding Domain Closing and Opening Directly Impact AMPA Receptor Gating. The Journal of Neuroscience 28:932-943.
Zhang W, Devi SPS, Tomita S and Howe JR (2014) Auxiliary proteins promote modal gating of AMPA- and kainate-type glutamate receptors. European Journal of Neuroscience 39:1138-1147.
Zhao Y, Chen S, Yoshioka C, Baconguis I and Gouaux E (2016) Architecture of fully occupied GluA2 AMPA receptor-TARP complex elucidated by cryo-EM. Nature 536:108-111.
zkan ED and Ueda T (1998) Glutamate Transport and Storage in Synaptic Vesicles. The Japanese Journal of Pharmacology 77:1-10
Zuo J, De Jager PL, Takahashi KA, Jiang W, Linden DJ and Heintz N (1997) Neurodegeneration in Lurcher mice caused by mutation in [delta]2 glutamate receptor gene. Nature 388:769-773.
109
APPENDIX:
SUMMARIZED AND SUPPLEMENTARY RESULTS
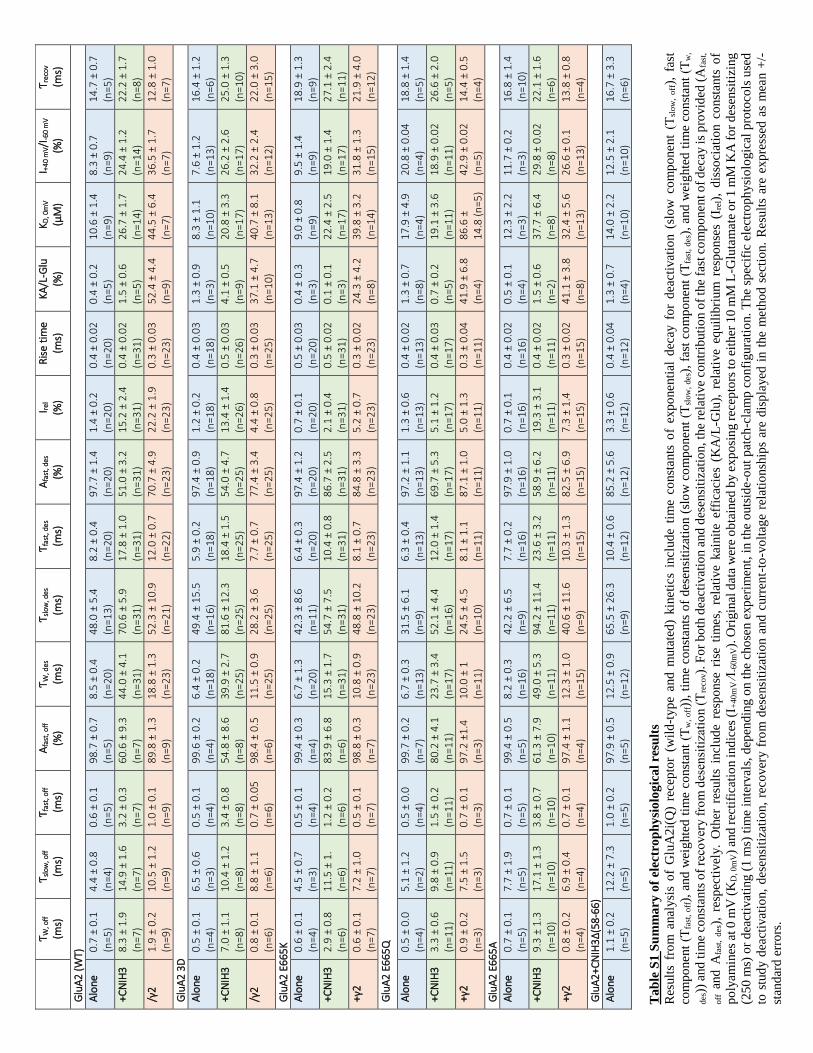
110
Ƭ W
, off
(ms)
Ƭ s
low
, off
(ms)
Ƭ f
ast,
off
(ms)
A
fast
, off
(%)
Ƭ W, d
es
(ms)
Ƭ s
low
, des
(ms)
Ƭ f
ast,
des
(ms)
A
fast
, des
(%)
I rel
(%)
Ris
e ti
me
(ms)
KA
/L-G
lu
(%)
K D, 0
mV
(μM)
I +4
0 m
V/I
-60
mV
(%)
Ƭ rec
ov
(m
s)
Glu
A2
(W
T)
Alo
ne
0.7
± 0
.1
(n=5
) 4
.4 ±
0.8
(n
=4)
0.6
± 0
.1
(n=5
) 9
8.7
± 0
.7
(n=5
) 8
.5 ±
0.4
(n
=20
) 4
8.0
± 5
.4
(n=1
3)
8.2
± 0
.4
(n=2
0)
97
.7 ±
1.4
(n
=20
) 1
.4 ±
0.2
(n
=20
) 0
.4 ±
0.0
2
(n=2
0)
0.4
± 0
.2
(n=5
) 1
0.6
± 1
.4
(n=9
) 8
.3 ±
0.7
(n
=9)
14
.7 ±
0.7
(n
=5)
+CN
IH3
8.3
± 1
.9
(n=7
) 1
4.9
± 1
.6
(n=7
) 3
.2 ±
0.3
(n
=7)
60
.6 ±
9.3
(n
=7)
44
.0 ±
4.1
(n
=31
) 7
0.6
± 5
.9
(n=3
1)
17
.8 ±
1.0
(n
=31
) 5
1.0
± 3
.2
(n=3
1)
15
.2 ±
2.4
(n
=31
) 0
.4 ±
0.0
2
(n=3
1)
1.5
± 0
.6
(n=5
) 2
6.7
± 1
.7
(n=1
4)
24
.4 ±
1.2
(n
=14
) 2
2.2
± 1
.7
(n=8
)
/γ2
1.9
± 0
.2
(n=9
) 1
0.5
± 1
.2
(n=9
) 1
.0 ±
0.1
(n
=9)
89
.8 ±
1.3
(n
=9)
18
.8 ±
1.3
(n
=23
) 5
2.3
± 1
0.9
(n
=21
) 1
2.0
± 0
.7
(n=2
2)
70
.7 ±
4.9
(n
=23
) 2
2.2
± 1
.9
(n=2
3)
0.3
± 0
.03
(n
=23
) 5
2.4
± 4
.4
(n=9
) 4
4.5
± 6
.4
(n=7
) 3
6.5
± 1
.7
(n=7
) 1
2.8
± 1
.0
(n=7
)
Glu
A2
3D
Alo
ne
0.5
± 0
.1
(n=4
) 6
.5 ±
0.6
(n
=3)
0.5
± 0
.1
(n=4
) 9
9.6
± 0
.2
(n=4
) 6
.4 ±
0.2
(n
=18
) 4
9.4
± 1
5.5
(n
=16
) 5
.9 ±
0.2
(n
=18
) 9
7.4
± 0
.9
(n=1
8)
1.2
± 0
.2
(n=1
8)
0.4
± 0
.03
(n
=18
) 1
.3 ±
0.9
(n
=3)
8.3
± 1
.1
(n=1
0)
7.6
± 1
.2
(n=1
3)
16
.4 ±
1.2
(n
=6)
+CN
IH3
7.0
± 1
.1
(n=8
) 1
0.4
± 1
.2
(n=8
) 3
.4 ±
0.8
(n
=8)
54
.8 ±
8.6
(n
=8)
39
.9 ±
2.7
(n
=25
) 8
1.6
± 1
2.3
(n
=25
) 1
8.4
± 1
.5
(n=2
5)
54
.0 ±
4.7
(n
=25
) 1
3.4
± 1
.4
(n=2
6)
0.5
± 0
.03
(n
=26
) 4
.1 ±
0.5
(n
=9)
20
.8 ±
3.3
(n
=17
) 2
6.2
± 2
.6
(n=1
7)
25
.0 ±
1.3
(n
=10
)
/γ2
0.8
± 0
.1
(n=6
) 8
.8 ±
1.1
(n
=6)
0.7
± 0
.05
(n
=6)
98
.4 ±
0.5
(n
=6)
11
.5 ±
0.9
(n
=25
) 2
8.2
± 3
.6
(n=2
5)
7.7
± 0
.7
(n=2
5)
77
.4 ±
3.4
(n
=25
) 4
.4 ±
0.8
(n
=25
) 0
.3 ±
0.0
3
(n=2
5)
37
.1 ±
4.7
(n
=10
) 4
0.7
± 8
.1
(n=1
3)
32
.2 ±
2.4
(n
=12
) 2
2.0
± 3
.0
(n=1
5)
Glu
A2
E6
65K
Alo
ne
0.6
± 0
.1
(n=4
) 4
.5 ±
0.7
(n
=3)
0.5
± 0
.1
(n=4
) 9
9.4
± 0
.3
(n=4
) 6
.7 ±
1.3
(n
=20
) 4
2.3
± 8
.6
(n=1
1)
6.4
± 0
.3
(n=2
0)
97
.4 ±
1.2
(n
=20
) 0
.7 ±
0.1
(n
=20
) 0
.5 ±
0.0
3
(n=2
0)
0.4
± 0
.3
(n=3
) 9
.0 ±
0.8
(n
=9)
9.5
± 1
.4
(n=9
) 1
8.9
± 1
.3
(n=9
)
+CN
IH3
2.9
± 0
.8
(n=6
) 1
1.5
± 1
. (n
=6)
1.2
± 0
.2
(n=6
) 8
3.9
± 6
.8
(n=6
) 1
5.3
± 1
.7
(n=3
1)
54
.7 ±
7.5
(n
=31
) 1
0.4
± 0
.8
(n=3
1)
86
.7 ±
2.5
(n
=31
) 2
.1 ±
0.4
(n
=31
) 0
.5 ±
0.0
2
(n=3
1)
0.1
± 0
.1
(n=3
) 2
2.4
± 2
.5
(n=1
7)
19
.0 ±
1.4
(n
=17
) 2
7.1
± 2
.4
(n=1
1)
+γ2
0.6
± 0
.1
(n=7
) 7
.2 ±
1.0
(n
=7)
0.5
± 0
.1
(n=7
) 9
8.8
± 0
.3
(n=7
) 1
0.8
± 0
.9
(n=2
3)
48
.8 ±
10
.2
(n=2
3)
8.1
± 0
.7
(n=2
3)
84
.8 ±
3.3
(n
=23
) 5
.2 ±
0.7
(n
=23
) 0
.3 ±
0.0
2
(n=2
3)
24
.3 ±
4.2
(n
=8)
39
.8 ±
3.2
(n
=14
) 3
1.8
± 1
.3
(n=1
5)
21
.9 ±
4.0
(n
=12
)
Glu
A2
E6
65Q
Alo
ne
0.5
± 0
.0
(n=4
) 5
.1 ±
1.2
(n
=2)
0.5
± 0
.0
(n=4
) 9
9.7
± 0
.2
(n=7
) 6
.7 ±
0.3
(n
=13
) 3
1.5
± 6
.1
(n=9
) 6
.3 ±
0.4
(n
=13
) 9
7.2
± 1
.1
(n=1
3)
1.3
± 0
.6
(n=1
3)
0.4
± 0
.02
(n
=13
) 1
.3 ±
0.7
(n
=8)
17
.9 ±
4.9
(n
=4)
20
.8 ±
0.0
4
(n=4
) 1
8.8
± 1
.4
(n=5
)
+CN
IH3
3.3
± 0
.6
(n=1
1)
9.8
± 0
.9
(n=1
1)
1.5
± 0
.2
(n=1
1)
80
.2 ±
4.1
(n
=11
) 2
3.7
± 3
.4
(n=1
7)
52
.1 ±
4.4
(n
=16
) 1
2.0
± 1
.4
(n=1
7)
69
.7 ±
5.3
(n
=17
) 5
.1 ±
1.2
(n
=17
) 0
.4 ±
0.0
3
(n=1
7)
0.7
± 0
.2
(n=5
) 1
9.1
± 3
.6
(n=1
1)
18
.9 ±
0.0
2
(n=1
1)
26
.6 ±
2.0
(n
=5)
+γ2
0.9
± 0
.2
(n=3
) 7
.5 ±
1.5
(n
=3)
0.7
± 0
.1
(n=3
) 9
7.2
±1
.4
(n=3
) 1
0.0
± 1
(n
=11
) 2
4.5
± 4
.5
(n=1
0)
8.1
± 1
.1
(n=1
1)
87
.1 ±
1.0
(n
=11
) 5
.0 ±
1.3
(n
=11
) 0
.3 ±
0.0
4
(n=1
1)
41
.9 ±
6.8
(n
=4)
86
.6 ±
1
4.8
(n
=5)
42
.9 ±
0.0
2
(n=5
) 1
4.4
± 0
.5
(n=4
)
Glu
A2
E6
65A
Alo
ne
0.7
± 0
.1
(n=5
) 7
.7 ±
1.9
(n
=5)
0.7
± 0
.1
(n=5
) 9
9.4
± 0
.5
(n=5
) 8
.2 ±
0.3
(n
=16
) 4
2.2
± 6
.5
(n=9
) 7
.7 ±
0.2
(n
=16
) 9
7.9
± 1
.0
(n=1
6)
0.7
± 0
.1
(n=1
6)
0
.4 ±
0.0
2
(n=1
6)
0.5
± 0
.1
(n=4
) 1
2.3
± 2
.2
(n=3
) 1
1.7
± 0
.2
(n=3
) 1
6.8
± 1
.4
(n=1
0)
+CN
IH3
9.3
± 1
.3
(n=1
0)
17
.1 ±
1.3
(n
=10
) 3
.8 ±
0.7
(n
=10
) 6
1.3
± 7
.9
(n=1
0)
49
.0 ±
5.3
(n
=11
) 9
4.2
± 1
1.4
(n
=11
) 2
3.6
± 3
.2
(n=1
1)
58
.9 ±
6.2
(n
=11
) 1
9.3
± 3
.1
(n=1
1)
0.4
± 0
.02
(n
=11
) 1
.5 ±
0.6
(n
=2)
37
.7 ±
6.4
(n
=8)
29
.8 ±
0.0
2
(n=8
) 2
2.1
± 1
.6
(n=6
)
+γ2
0.8
± 0
.2
(n=4
) 6
.9 ±
0.4
(n
=4)
0.7
± 0
.1
(n=4
) 9
7.4
± 1
.1
(n=4
) 1
2.3
± 1
.0
(n=1
5)
40
.6 ±
11
.6
(n=9
) 1
0.3
± 1
.3
(n=1
5)
82
.5 ±
6.9
(n
=15
) 7
.3 ±
1.4
(n
=15
) 0
.3 ±
0.0
2
(n=1
5)
41
.1 ±
3.8
(n
=8)
32
.4 ±
5.6
(n
=13
) 2
6.6
± 0
.1
(n=1
3)
13
.8 ±
0.8
(n
=4)
GluA2+C
NIH3Δ(58
-66
)
Alo
ne
1.1
± 0
.2
(n=5
) 1
2.2
± 7
.3
(n=5
) 1
.0 ±
0.2
(n
=5)
97
.9 ±
0.5
(n
=5)
12
.5 ±
0.9
(n
=12
) 6
5.5
± 2
6.3
(n
=9)
10
.4 ±
0.6
(n
=12
) 8
5.2
± 5
.6
(n=1
2)
3.3
± 0
.6
(n=1
2)
0.4
± 0
.04
(n
=12
) 1
.3 ±
0.7
(n
=4)
14
.0 ±
2.2
(n
=10
) 1
2.5
± 2
.1
(n=1
0)
16
.7 ±
3.3
(n
=6)
Ta
ble
S1
Su
mm
ary
of
elec
tro
ph
ysi
olo
gic
al
res
ult
s
Res
ult
s fr
om
anal
ysi
s o
f G
luA
2i(
Q)
rece
pto
r (w
ild
-typ
e and
muta
ted
) kin
etic
s in
clud
e ti
me
con
stants
of
exp
onenti
al d
ecay
fo
r d
eact
ivat
ion (
slo
w c
om
po
nent
(Ƭsl
ow
, off),
fas
t
com
po
nent
(Ƭfa
st,
off),
and
wei
ghte
d t
ime
const
ant
(Ƭw
, o
ff))
, ti
me
const
ants
of
des
ensi
tiza
tio
n (
slo
w c
om
po
nent
(Ƭsl
ow
, des
), f
ast
com
po
nent
(Ƭfa
st,
des
), a
nd w
eig
hte
d t
ime
const
ant
(Ƭw
,
des
)) a
nd
tim
e co
nst
ants
of
reco
ver
y f
rom
des
ensi
tiza
tio
n (
Ƭre
cov).
Fo
r b
oth
dea
ctiv
atio
n a
nd
des
ensi
tiza
tio
n, th
e re
lati
ve
contr
ibuti
on o
f th
e fa
st c
om
po
nent
of
dec
ay i
s p
rovid
ed (
Afa
st,
off a
nd
Afa
st,
des
), r
esp
ecti
vel
y.
Oth
er r
esult
s in
clud
e re
spo
nse
ris
e ti
mes,
rel
ativ
e kai
nit
e e
ffic
acie
s (K
A/L
-Glu
), r
elat
ive
equil
ibri
um
res
po
nse
s (I
rel)
, d
isso
ciat
ion c
onst
ants
of
po
lyam
ines
at 0
mV
(K
D, 0
mV)
and
rec
tifi
cati
on ind
ices
(I +
40
mV ∕I
-60m
V).
Ori
gin
al d
ata
wer
e o
bta
ined
by e
xp
osi
ng r
ecep
tors
to
eit
her
10
mM
L-G
luta
mate
or
1 m
M K
A f
or
des
ensi
tizi
ng
(25
0 m
s) o
r d
eact
ivat
ing (
1 m
s) t
ime
inte
rval
s, d
epen
din
g o
n t
he
cho
sen e
xp
erim
ent,
in t
he
outs
ide-o
ut
pat
ch-c
lam
p c
on
figura
tio
n.
The
spec
ific
ele
ctro
ph
ysi
olo
gic
al p
roto
cols
use
d
to s
tud
y d
eact
ivat
ion,
des
ensi
tiza
tio
n,
reco
ver
y f
rom
des
ensi
tiza
tio
n a
nd
curr
ent-
to-v
olt
age
rela
tio
nsh
ips
are
dis
pla
yed
in t
he
meth
od
sec
tio
n.
Resu
lts
are
exp
ress
ed a
s m
ean +
/-
stan
dar
d e
rro
rs.


