Embed Size (px)
Citation preview
Biophysical Journal Volume 72 April 1997 1818-1827
Structural Mapping of the e-Subunit of Mitochondrial H+-ATPaseComplex (F1)
Edi Gabellieri,* Giovanni B. Strambini,* Alessandra Baracca,# and Giancarlo Solaini§*Consiglio Nazionale delle Richerche, Istituto di Biofisica, 56127 Pisa, Italy, #Dipartimento di Biochimica "G. Moruzzi," Universita diBologna, 40126 Bologna, Italy, and 5Scuola Superiore di Studi Universitari e di Perfezionamento S. Anna, 56127 Pisa, Italy
ABSTRACT Phosphorescence and fluorescence energy transfer measurements have been used to locate the e-subunitwithin the known structural frame of the mitochondrial soluble part of F-type H+-ATPase complex (F1). The fluorescenceprobe 2'-O-(trinitrophenyl)adenosine-5'-triphosphate was bound to the nucleotide binding sites of the enzyme, whereas theprobe 7-diethylamino-3'-(4'-maleimidylphenyl)-4-methylcoumarin was attached to the single sulfhydryl residue of isolatedoligomycin sensitivity-conferring protein (OSCP), which was then reconstituted with F1. Fluorescence and phosphorescenceresonance energy transfer yields from the lone tryptophan residue of F1 present in the e-polypeptide and the fluorescencelabels attached to the F, complex established that tryptophan is separated by 3.7 nm from Cys-1 18 of OSCP in thereconstituted OSCP-F1 complex, by 4.9 nm from its closest catalytic site and by more than 6.4 nm from the two other catalyticsites, including the lowest affinity ATP site. These separations together with the crystallographic coordinates of the F1complex (Abrahams, J. P., A. G. W. Leslie, R. Lutter, and J. E. Walker. 1994. Structure at 2.8 A resolution of F1-ATPase frombovine heart mitochondria. Nature. 370:621-628) place the e-subunit in the stem region of the F1 molecule in a uniqueasymmetrical position relative to the catalytic sites of the enzyme.
INTRODUCTION
The FAF0-ATPase (ATP synthase) of energy-coupling mem-branes is the enzyme responsible for the synthesis of ATPfrom ADP and inorganic phosphate. The reaction is drivenby the electrochemical potential of protons establishedacross the membrane by photo or respiratory oxidativeprocesses. Homologous ATP synthase complexes are lo-cated in the inner membrane of mitochondria, thylakoydmembrane of chloroplasts, and plasma membrane of bacte-ria. These multisubunit complexes are composed of twosectors: Fo and Fl. Fo is the membrane-embedded part andis capable of proton transport, whereas F1 is the water-exposed, hydrophilic, catalytic sector (for reviews, seeBoyer, 1993; Senior, 1988; Penefsky and Cross, 1991; Ca-paldi, 1995). A stalk 4-5 nm long, first evidenced byFernandez-Morian (1962), joins these two lobes and is in-volved in the energy transmission from Fo to F1, probablythrough long-range conformational changes induced by pro-ton transport (Boyer, 1989). The stalk contains severalsubunits, mostly components of Fo, among which are sub-unit b and, in mitochondrial ATP synthase, the oligomycin
Received for publication 7 October 1996 and in final form 24 January1997.Address reprint requests to Giancarlo Solaini, Scuola Superiore di StudiUniversitari e di Perfezionamento S. Anna, via G. Carducci 40, 56127 Pisa,Italy. Tel.: 39-50-88-33-20; Fax: 39-50-88-32-15, E-mail: [email protected] abbreviations used are: F,, soluble part of F-type H+-ATPases (ATPsynthases); Fo, membrane sector of ATP synthase; OSCP, oligomycinsensitivity-conferring protein; CPM, 7-diethylamino-3-(4'-maleimidylphe-nyl)-4-methylcoumarin; TNP-ATP, 2'-O-(trinitrophenyl)adenosine-5'-triphosphate; MOPS, 4-morpholinepropanesulfonic acid; SDS, sodium do-decyl sulfate.© 1997 by the Biophysical Society0006-3495/97/04/1818/10 $2.00
sensitivity-conferring protein (OSCP). Isolated OSCP iscapable of forming a stable binary complex with F1 (Dupuiset al., 1985; Collinson et al., 1994). The F1 sectors of allknown species contain five different subunits with the stoi-chiometry of a3933y6E in order of decreasing molecularweight (Walker et al., 1985). However, the only a, 13, and yfrom the different species are homologous, whereas the 5from Escherichia coli corresponds to the mitochondrialOSCP, E from E. coli corresponds to the mitochondrial 6subunit, and finally, the E of mitochondria has no counter-part in subunits from other species (Walker et al., 1985).Recent crystallographic structures of the mitochondrial en-zyme up to 0.28 nm resolution (Abrahams et al., 1993;Abrahams et al., 1994; Bianchet et al., 1991) have shownthat the a- and 13-subunits are arranged alternately in aroughly spherical agglomerate with a central cavity occu-pied in large part by the rod-shaped y-subunit. F1 containssix nucleotide binding sites at the interface between a- and,B-subunits, of which only three are considered catalytic innature (Cross and Nalin, 1982; Issartel et al., 1986). Thecatalytic sites display differential affinity for Mg-coordi-nated adenine nucleotides (Gresser et al., 1982; Weber etal., 1993), an asymmetry in structure possibly associatedwith the asymmetric positioning of the y-subunit relative tothe a3133 subassembly. The crystal structure could not showthe location of the smaller 8- and E-subunits, because thesemight be substoichiometric in the crystal. However, anincreased local variation of the electron density suggestedthat the two subunits are probably in the stem region of F1.The functions of these subunits are also largely unknown,but because in other sources there is evidence placing themin the stalk region joining the two lobes of ATP synthase, itis commonly believed that they play a role in signal trans-duction from Fo to Fl.
1818
Mitochondrial Fl-ATPase e-Subunit
The ambiguity in the location of the E-subunit withinmitochondrial F1 prompted us to investigate proximity re-lationships with other components of the multisubunit as-sembly by the method of resonance energy transfer, amethod that proved to be successful in determining thedistance between several specific sites in the chloroplastcoupling factor (chloroplast F1) selectively labeled withfluorescence probes (reviewed in McCarty and Hammes,1987). Unlike chloroplast F1, the E-subunit of the mitochon-drial enzyme possesses no reactive side chain that could belabeled with fluorescence probes. However, in the lattercase, advantage is taken of the fact that F1 contains a singleTrp residue (Trp-4), and this probe is located in the E-sub-unit. Fluorescence and phosphorescence energy transferfrom this intrinsic chromophore are exploited to obtaindistance relationships between the E-subunits and fluores-cence labels bound to either the nucleotide binding sites orto the OSCP peptide complexed to F1. In the first case theacceptor chromophore is 2'-O-(trinitrophenyl)adenosine-5'-triphosphate (TNP-ATP), whereas in the second case itis 7-diethylamino-3-(4'-maleimidylphenyl)-4-methylcou-marin (CPM) linked to Cys-1 18 of recombinant OSCP. Thedistances derived from energy transfer experiments stronglysuggest that the E-subunit is indeed in the stem region of thecomplex placed asymmetrically with respect to the catalyticnucleotide binding sites.
MATERIALS AND METHODSThe fluorescent sulfhydryl reagent (CPM) and the fluorescent nucleotideanalogue (TNP-ATP) used in the present work were purchased fromMolecular Probes (Eugene, OR). ATP, phosphoenolpyruvate, Hepes, Tris,reduced nicotinamide-adenine dinucleotide, pyruvate kinase, and lactatedehydrogenase in glycerol-containing buffer were obtained from SigmaChemical Co. (St. Louis, MO). Diethylaminoethyl-Sephadex A-50, blueSepharose CL-6B, Sephadex G-50, Sephacryl S-300, and standard markerproteins were obtained from Pharmacia Biotech Inc. (Uppsala, Sweden).
Enzyme preparationF1 was extracted from sonicated beef heart submitochondrial particles andpurified by diethylaminoethyl-Sephadex A-50 ion exchange chromatogra-phy according to the method of Penefsky (1975). To remove from the F,preparation any contaminant, the enzyme was further chromatographedfirst on blue Sepharose CL-6B and then on Sephacryl S-300 as recentlydescribed (Baracca et al., 1995). The enzyme solution was stored at 5°C asa suspension at 60% ammonium sulfate saturation in the presence of 4 mMATP (pH 8); the enzyme activity was stable for several weeks in this state.The F, preparation to be used was obtained daily from the above suspen-sion by centrifugation. Essentially, the sedimented enzyme was dissolvedat 4-6 ,AM in a buffer containing 150 mM sucrose, 1 mM KH2PO4, 1 mMMgSO4, and 10 mM K+-Hepes (pH 8); it was desalted on a Sephadex G-50centrifuge column (Penefsky, 1975) equilibrated with the same buffer.
Preparation of the OSCP-CPM/F1 complexThe recombinant OSCP was a generous gift from Dr. J. E. Walker and M.J. van Raaij (Medical Research Council, Laboratory of Molecular Biology,Cambridge, UK). The OSCP labeling was performed by incubating thepolypeptide (180 AM) with a fivefold excess of CPM (900 ,AM) in 20 mMMOPS (pH 7) for 15 h at 4°C in the dark. Unreacted probe was separatedfrom the labeled protein by filtration and centrifugation through a Seph-adex G-50 column equilibrated in 20 mM MOPS and 100 mM KCI (pH 7)(Duszynsky et al., 1988). The OSCP-CPM/Fl complex was preparedaccording to a modified procedure of Dupuis et al. (1985). The OSCP-CPM adduct (30 ,uM) was incubated with F, (6 AM) in 0.5 mM EDTA, 15mM KHSO4, 0.02% Tween 20, 0.2-0.4 mM ATP, and 20 mM MOPS (pH7) for 30 min at room temperature. The excess OSCP-CPM was separatedfrom the OSCP-CPM/Fl complex by ultrafiltration on Centricon 100(Amicon). The complex comprising the label had the polypeptide compo-sition shown in Fig. 1 as resolved by SDS-gel electrophoresis. It had anOSCP-CPM:F, molar ratio of 1:1 as evaluated both by scanning the geldensity as reported previously (Baracca et al., 1995) and according to themethod of Duszynsky et al., (1988) calculating the ratio between the probeconcentration, evaluated spectrophotometrically, and the protein concen-tration. The OSCP-CPM/Fl preserved the functional properties of theOSCP/F, complex according to the following two criteria (Collinson et al.,1994; Duszynsky et al., 1988): 1) the inactivation by exposure to cold ofthe OSCP-CPM/Fl complex was lower than that of the sole F,; and 2) thereconstituted FIFO complex resulting by the addition of both F,- and
A B C D E F
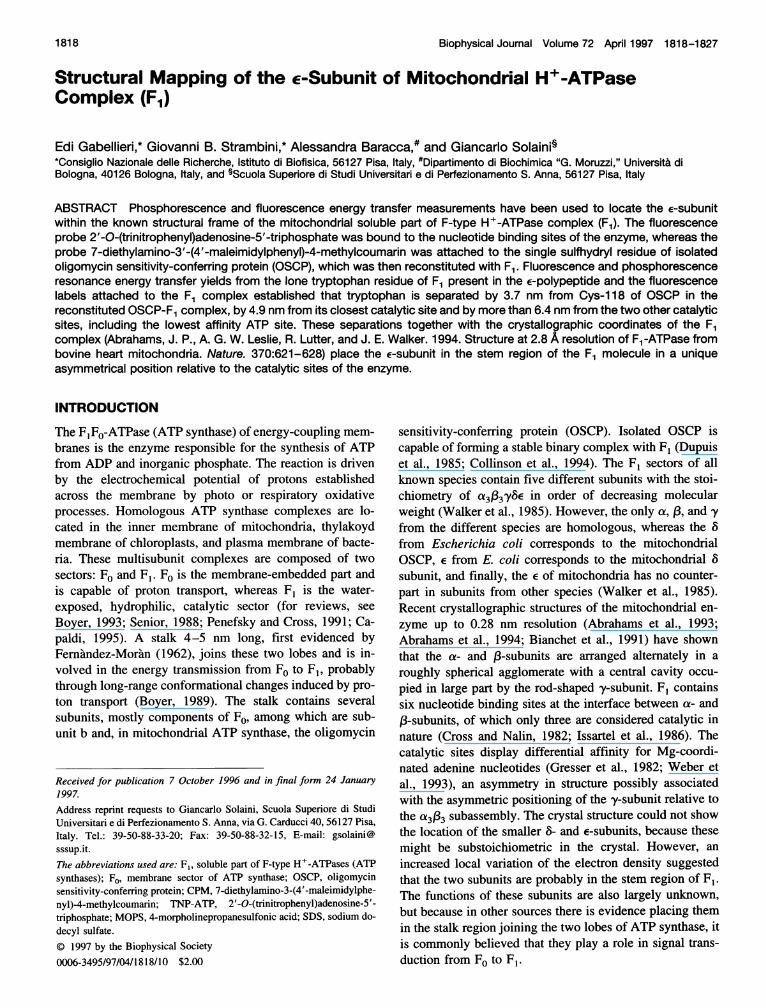
FIGURE 1 Polypeptide composi-tion of the OSCP-CPM/Fl complex.Lane A, molecular size marker pro-teins (Pharmacia): rabbit musclephosphorylase b (94.0 kDa), bovineserum albumin (67.0 kDa), egg whiteovalbumin (43.0 kDa), bovine eryth-rocyte carbonic anhydrase (30.0kDa), soybean trypsin inhibitor (20.1kDa), and bovine milk a-lactalbumin(14.4 kDa); lanes B and C, 10 and 50,jg F,, respectively; lanes D and E,15 and 35 ,ug OSCP-CPM/F1, respec-tively; lane F, 2 ,ug OSCP. The po-sitions of the F, subunits are indi-cated at the right.
94.0
67.0
43.0
30.0
20.1
14.4
OC
7
OSCP
6
....
Gabellieri et al. 1819
Volume 72 April 1997
OSCP-depleted submitochondrial particles (Tzagoloff et al., 1968) with F,proved to be oligomycin sensitive when the reconstitution was performedin the presence of OSCP-CPM (not shown). Incidentally, it has to be notedthat the activity of both isolated F, and OSCP-CPM/F, in 50% (v/v)glycerol was unaffected after the solution had been taken to 180 K duringthe time required for energy transfer measurements (nearly 1 h for eachsample).
Binding of TNP-ATP to F1Binding the nucleotide derivative TNP-ATP to F, was conducted accord-ing to the procedure of Grubmeyer and Penefsky (1981) modified to takeinto account that the study of energy transfer has to be performed at lowtemperature in buffer containing 50% (v/v) glycerol. The binding ofTNP-ATP to F1 was evaluated by exploiting the enhancement of fluores-cence emission of TNP-ATP at 550 nm (Akx = 436 nm) when it binds toF, (Grubmeyer and Penefsky, 1981; Tiedge and Schafer, 1986). Analysisof the fluorescence enhancement as a function of TNP-ATP concentration(0.01-50 jiM), taking into account different factors for fluorescence en-hancement due to the occupation of different sites (Tiedge and Schafer,1986), yields nearly three (2.7 ± 0.15) binding sites: one of high affinity,of which it was not possible to calculate the KD, and two of lower affinity,exhibiting KD values of 0.34 and 0.48 ,uM (at 22°C), values slightly higherthan those reported in the absence of glycerol by other groups (Muratalievand Boyer, 1994; Muneyuki et al., 1994; Weber and Senior, 1996). To testthe possible effects of low temperature on KD, the binding isotherm wasalso repeated at 5'C. At this temperature, the KD values for the loweraffinity sites increased to 0.40 and 0.67 AM, indicating a significant loss inaffinity at lower temperatures. When 1 mM Mg-ATP was added to the F,solution containing TNP-ATP, the amplitude of the fluorescence enhance-ment decreased, reaching the amplitude corresponding to that observed forthe 1:1 F1:TNP-ATP molar ratio. This confirms a very tight binding of thenucleotide derivative to its highest affinity binding site. It should be notedthat the highest affinity TNP-ATP site corresponds to the lowest affinitycatalytic site for ATP (Murataliev and Boyer, 1994). For this reason, thelabeled nucleotide that is tightly bound to F, is not displaced by Mg-ATP.
Fluorescence andphosphorescence measurements
A conventional homemade instrument was used for all fluorescence andphosphorescence intensity and decay measurements (Cioni and Strambini,1989). The samples were placed in cylindrical spectrosil cuvettes (4 mminside diameter). Continuous excitation, provided by a Cermax xenon lamp(LX 15OUV; ILC Technology, Sunnyvale, CA), was selected by a 0.25-mgrating monochromator with a 10-nm bandpass. The emission collectedthrough another 0.25-m grating monochromator (H25; Jobin-Yvon,Longjumeau, France) with a 3-mm bandwidth, was detected with an EMI9635 QB photomultiplier. All the phosphorescence decay signals weredigitized and averaged by a computer scope system (EGAA; RC Electron-ics, Santa Barbara, CA). Subsequent analysis of decay curves in terms ofdiscrete exponential components was carried out by a nonlinear leastsquare fitting algorithm, implemented by the program Global Analysis. Allthe intensity and decay data reported here were averages obtained fromthree or more independent measurements.
Other methods
SDS-polyacrylamide gel electrophoresis was carried out according to themethod of Laemmli (1970) using a polyacrylamide gradient from 14 to25% containing 0.1% SDS. The procedure has been described in detailpreviously (Baracca et al., 1992).
The ATPase activity was determined with an ATP-regenerating systemby following the decrease of reduced nicotinamide-adenine dinucleotideabsorption at 340 nm in a Jasco (Tokyo, Japan) model 7850 spectropho-
(steady state) as previously reported (Solaini et al., 1993). The specificactivity of the enzyme was 80-100 units/mg protein at 20°C.
Protein concentrations of enzyme solutions were determined by themethod of Lowry et al. (1951).
RESULTS
Fluorescence and phosphorescence resonanceenergy transfer from Trp of the e-subunit tocoumarin-labeled OSCP bound to F1
Forster type singlet-singlet fluorescence energy transferfrom the lone Trp residue (donor) of the E-subunit of F, andthe coumarin (CPM) probe (acceptor) attached to OSCPentails a decrease in both the fluorescence yield and lifetimeof the donor as well as an enhancement of the fluorescenceyield of the acceptor. Unfortunately, direct quantitativemeasurements of the transfer efficiency from the extent ofdonor fluorescence quenching or acceptor fluorescence sen-sitization turned out to be problematic with the F, complex.The reason is that in the F1 oligomer, there are nearly 100Tyr residues (Walker et al., 1985) to 1 Trp residue, andselective detection of Trp fluorescence is virtually impossi-ble, especially if one or more Tyr is in the ionized state. Thissupposition was confinned by the phosphorescence spec-trum of F1 in that it shows a distinct Tyr contribution (Fig.2, Aem' 400 nm) even when the sample is excited at the rededge of Trp absorption (295 nm). For the same reason, theextent of sensitization of coumarin fluorescence cannot beused to derive the transfer efficiency from Trp, because anyexcited Tyr could also take part in the sensitization process.In addition to these difficulties, the large size of F1 causes
considerable scattering of the excitation, and the relativelyweak fluorescence signal is partly submerged by a relativelyhigh scattering background.
These difficulties in quantifying the extent of Trp fluo-rescence quenching were overcome by using the phospho-rescence emission of Trp in low-temperature glycerol/bufferglasses. Under these conditions the phosphorescence spec-trum of Trp is clearly distinguishable from that of Tyr inthat it is shifted about 50 nm to the red and exhibits a
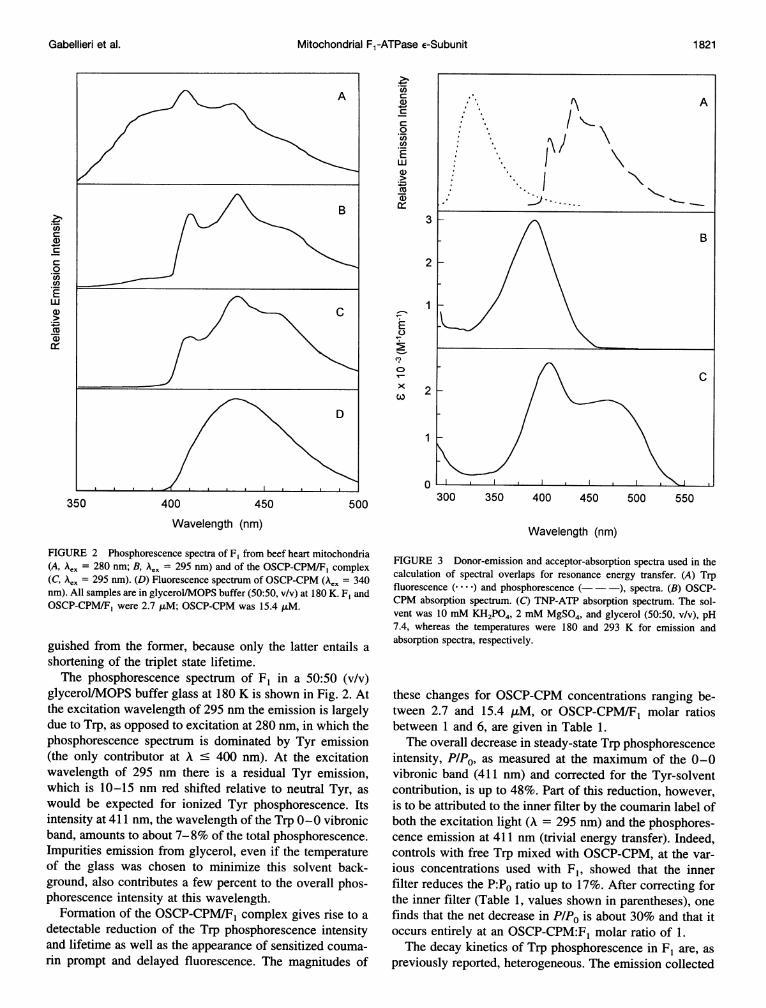
pronounced vibronic structure (Fig. 2, A and B). Because theexcited singlet state is a precursor of the triplet state, anyquenching of fluorescence will result in a proportionalquenching of phosphorescence. Another advantage of mon-itoring the phosphorescence is that dipole-dipole endrgytransfer to coumarin is also possible from the excited tripletstate of Trp, thus providing an additional and independentestimate of donor-acceptor separation (Kellogg, 1967;Stryer, 1968; Galley and Stryer, 1969; Strambini et al.,1992). As shown in Fig. 3, A and B, the coumarin absorptionspectrum overlaps the fluorescence and phosphorescencespectrum of Trp and thus satisfies the requisite of donor-emission/acceptor-absorption spectral overlap for both sin-glet-singlet and triplet-singlet resonance energy transfer totake place. Although both singlet and triplet energy transfercause a reduction of the phosphorescence intensity, the
tometer. The assay was carried out at a substrate saturating concentration
1820 Biophysical Journal
extent of quenching by the latter process can be distin-
Mitochondrial F1-ATPase e-Subunit
Z).?4acna)
0CO)
wa)
a)
350 400 450
Wavelength (nm)
.-?
a)
.-6
.cn0
111al)
U1)co
3
2
1
0
0
xCO
500
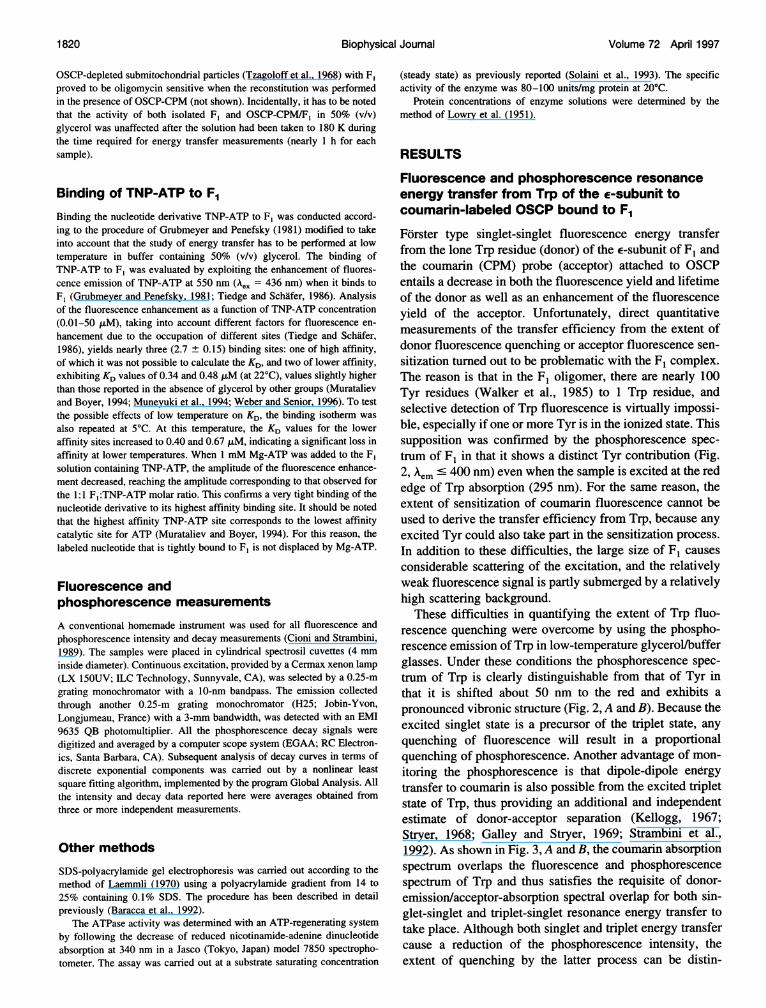
FIGURE 2 Phosphorescence spectra of F1 from beef heart mitochondria(A, Aex = 280 nm; B, AeK = 295 nm) and of the OSCP-CPM/F, complex(C, Aex = 295 nm). (D) Fluorescence spectrum of OSCP-CPM (Aex = 340nm). All samples are in glycerol/MOPS buffer (50:50, v/v) at 180 K. F, andOSCP-CPM/F, were 2.7 ,uM; OSCP-CPM was 15.4 ,uM.
guished from the former, because only the latter entails ashortening of the triplet state lifetime.The phosphorescence spectrum of F1 in a 50:50 (v/v)
glycerol/MOPS buffer glass at 180 K is shown in Fig. 2. Atthe excitation wavelength of 295 nm the emission is largelydue to Trp, as opposed to excitation at 280 nm, in which thephosphorescence spectrum is dominated by Tyr emission(the only contributor at A ' 400 nm). At the excitationwavelength of 295 nm there is a residual Tyr emission,which is 10-15 nm red shifted relative to neutral Tyr, aswould be expected for ionized Tyr phosphorescence. Itsintensity at 411 nm, the wavelength of the Trp 0-0 vibronicband, amounts to about 7-8% of the total phosphorescence.Impurities emission from glycerol, even if the temperatureof the glass was chosen to minimize this solvent back-ground, also contributes a few percent to the overall phos-phorescence intensity at this wavelength.
Formation of the OSCP-CPM/F1 complex gives rise to adetectable reduction of the Trp phosphorescence intensityand lifetime as well as the appearance of sensitized couma-rin prompt and delayed fluorescence. The magnitudes of
2
0300 350 400 450 500 550
Wavelength (nm)
FIGURE 3 Donor-emission and acceptor-absorption spectra used in thecalculation of spectral overlaps for resonance energy transfer. (A) Trpfluorescence ( ) and phosphorescence --- ), spectra. (B) OSCP-CPM absorption spectrum. (C) TNP-ATP absorption spectrum. The sol-vent was 10 mM KH2PO4, 2 mM MgSO4, and glycerol (50:50, v/v), pH7.4, whereas the temperatures were 180 and 293 K for emission andabsorption spectra, respectively.
these changes for OSCP-CPM concentrations ranging be-tween 2.7 and 15.4 ,uM, or OSCP-CPM/F1 molar ratiosbetween 1 and 6, are given in Table 1.The overall decrease in steady-state Trp phosphorescence
intensity, PIPO, as measured at the maximum of the 0-0vibronic band (411 nm) and corrected for the Tyr-solventcontribution, is up to 48%. Part of this reduction, however,is to be attributed to the inner filter by the coumarin label ofboth the excitation light (A = 295 nm) and the phosphores-cence emission at 411 nm (trivial energy transfer). Indeed,controls with free Trp mixed with OSCP-CPM, at the var-ious concentrations used with Fl, showed that the innerfilter reduces the P:PO ratio up to 17%. After correcting forthe inner filter (Table 1, values shown in parentheses), onefinds that the net decrease in P/PO is about 30% and that itoccurs entirely at an OSCP-CPM:Fl molar ratio of 1.The decay kinetics of Trp phosphorescence in F1 are, as
previously reported, heterogeneous. The emission collected
Gabellieri et al. 1821
1
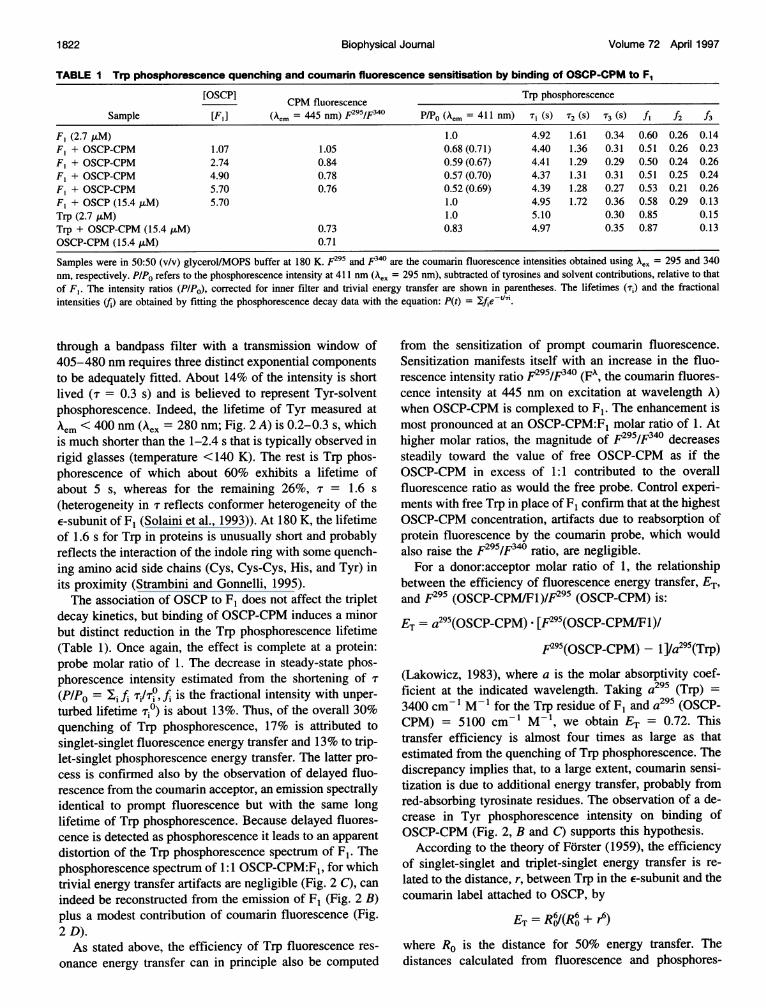
TABLE I Trp phosphorescence quenching and coumarin fluorescence sensitisation by binding of OSCP-CPM to F,[OSCP] CPM fluorescence Trp phosphorescence
Sample [FI] (Aem = 445 nm) F295/F340 P/PO (A, = 411 nm) T, (s)T2 (S) 3 (S) fl f2 f3
F, (2.7 t,M) 1.0 4.92 1.61 0.34 0.60 0.26 0.14F, + OSCP-CPM 1.07 1.05 0.68 (0.71) 4.40 1.36 0.31 0.51 0.26 0.23F, + OSCP-CPM 2.74 0.84 0.59 (0.67) 4.41 1.29 0.29 0.50 0.24 0.26F, + OSCP-CPM 4.90 0.78 0.57 (0.70) 4.37 1.31 0.31 0.51 0.25 0.24F, + OSCP-CPM 5.70 0.76 0.52 (0.69) 4.39 1.28 0.27 0.53 0.21 0.26F, + OSCP (15.4 ,LM) 5.70 1.0 4.95 1.72 0.36 0.58 0.29 0.13
Trp (2.7 ,uM) 1.0 5.10 0.30 0.85 0.15Trp + OSCP-CPM (15.4 ,uM) 0.73 0.83 4.97 0.35 0.87 0.13OSCP-CPM (15.4 ,uM) 0.71
Samples were in 50:50 (v/v) glycerol/MOPS buffer at 180 K. F295 and F340 are the coumarin fluorescence intensities obtained using A,, = 295 and 340nm, respectively. PIPO refers to the phosphorescence intensity at 411 nm (Aex = 295 nm), subtracted of tyrosines and solvent contributions, relative to thatof F,. The intensity ratios (PIPO), corrected for inner filter and trivial energy transfer are shown in parentheses. The lifetimes (Ti) and the fractionalintensities (fi) are obtained by fitting the phosphorescence decay data with the equation: P(t) = Xf,e-t'.
through a bandpass filter with a transmission window of405-480 nm requires three distinct exponential componentsto be adequately fitted. About 14% of the intensity is shortlived (T = 0.3 s) and is believed to represent Tyr-solventphosphorescence. Indeed, the lifetime of Tyr measured atAem < 400 nm (Aex = 280 nm; Fig. 2 A) is 0.2-0.3 s, whichis much shorter than the 1-2.4 s that is typically observed inrigid glasses (temperature <140 K). The rest is Trp phos-phorescence of which about 60% exhibits a lifetime ofabout 5 s, whereas for the remaining 26%, T = 1.6 s(heterogeneity in T reflects conformer heterogeneity of theE-subunit of F1 (Solaini et al., 1993)). At 180 K, the lifetimeof 1.6 s for Trp in proteins is unusually short and probablyreflects the interaction of the indole ring with some quench-ing amino acid side chains (Cys, Cys-Cys, His, and Tyr) inits proximity (Strambini and Gonnelli, 1995).The association of OSCP to F1 does not affect the triplet
decay kinetics, but binding of OSCP-CPM induces a minorbut distinct reduction in the Trp phosphorescence lifetime(Table 1). Once again, the effect is complete at a protein:probe molar ratio of 1. The decrease in steady-state phos-phorescence intensity estimated from the shortening of T
(P/PO = i fi Ti/Ti°, fi is the fractional intensity with unper-turbed lifetime Tir) is about 13%. Thus, of the overall 30%quenching of Trp phosphorescence, 17% is attributed tosinglet-singlet fluorescence energy transfer and 13% to trip-let-singlet phosphorescence energy transfer. The latter pro-cess is confirmed also by the observation of delayed fluo-rescence from the coumarin acceptor, an emission spectrallyidentical to prompt fluorescence but with the same longlifetime of Trp phosphorescence. Because delayed fluores-cence is detected as phosphorescence it leads to an apparentdistortion of the Trp phosphorescence spectrum of Fl. Thephosphorescence spectrum of 1:1 OSCP-CPM:Fl, for whichtrivial energy transfer artifacts are negligible (Fig. 2 C), canindeed be reconstructed from the emission of F1 (Fig. 2 B)plus a modest contribution of coumarin fluorescence (Fig.2 D).As stated above, the efficiency of Trp fluorescence res-
onance energy transfer can in principle also be computed
from the sensitization of prompt coumarin fluorescence.Sensitization manifests itself with an increase in the fluo-rescence intensity ratio F295/F340 (FA, the coumarin fluores-cence intensity at 445 nm on excitation at wavelength A)when OSCP-CPM is complexed to Fl. The enhancement ismost pronounced at an OSCP-CPM:Fl molar ratio of 1. Athigher molar ratios, the magnitude of F295/F340 decreasessteadily toward the value of free OSCP-CPM as if theOSCP-CPM in excess of 1:1 contributed to the overallfluorescence ratio as would the free probe. Control experi-ments with free Trp in place of F1 confirm that at the highestOSCP-CPM concentration, artifacts due to reabsorption ofprotein fluorescence by the coumarin probe, which wouldalso raise the F295/F340 ratio, are negligible.
For a donor:acceptor molar ratio of 1, the relationshipbetween the efficiency of fluorescence energy transfer, ET,and F295 (OSCP-CPM/F1)/F295 (OSCP-CPM) is:
ET = a295(OSCP-CPM) . [F295(OSCP-CPM/F1)/F295(OSCp-CpM) - 1]/a295(Trp)
(Lakowicz, 1983), where a is the molar absorptivity coef-ficient at the indicated wavelength. Taking a295 (Trp) =
3400 cm- MW- for the Trp residue of F1 and a295 (OSCP-CPM) = 5100 cm-' M-1, we obtain ET = 0.72. Thistransfer efficiency is almost four times as large as thatestimated from the quenching of Trp phosphorescence. Thediscrepancy implies that, to a large extent, coumarin sensi-tization is due to additional energy transfer, probably fromred-absorbing tyrosinate residues. The observation of a de-crease in Tyr phosphorescence intensity on binding ofOSCP-CPM (Fig. 2, B and C) supports this hypothesis.
According to the theory of Forster (1959), the efficiencyof singlet-singlet and triplet-singlet energy transfer is re-lated to the distance, r, between Trp in the E-subunit and thecoumarin label attached to OSCP, by
ET = RJ(R6 + r4)where Ro is the distance for 50% energy transfer. Thedistances calculated from fluorescence and phosphores-
Volume 72 April 19971 822 Biophysical Journal
Mitochondrial F1-ATPase e-Subunit
cence energy transfer yields assuming a random and fixeddonor-acceptor orientation (Table 2) are 3.7 and 3.8 nm,respectively. Alternatively, distances may be estimatedfrom the rates, kT, [kT = (RJr)6/T0] of triplet-singlet energytransfer derived from the shortening of the triplet lifetimecomponents, (kT = 1/T - 1/To). The distances calculatedfrom the reduction of the 4.9- and 1.6-s components are 3.9and 3.5 nm, respectively. Of course, discrepancies in rbetween the conformers of the E-polypeptide with differentTrp lifetimes (1.6 and 4.9 s) may result from a combinedchange of distance and average orientation. The agreementin the distances determined by fluorescence and phospho-rescence energy transfer is quite good if one considers theuncertainties associated with the correction for inner filtereffects and the assumption of randomized donor and accep-tor orientations.
Phosphorescence resonance energy transferfrom Trp of the e-subunit of F1 to boundTNP-ATP
TNP-ATP has been used in several laboratories to carry outstudies on the catalytic mechanism of F-type ATPases(Grubmeyer and Penefsky, 1981; Murataliev and Boyer,1994; Weber and Senior, 1996; Weber et al., 1993; Shapiroet al., 1991). From these studies, information on binding ofthe nucleotide derivative to nucleotide binding sites of F1from different sources has been obtained. It has been estab-lished that under our experimental conditions, that is, nativeF1 (i.e., enzyme-containing endogenous adenine nucleo-tides) in the presence of Mg2+, TNP-ATP binds selectivelyto the catalytic sites. The number of TNP-ATP moleculesbound to the F1 complex is three for the E. coli enzyme,slightly less than three on our mitochondrial preparations.
Fig. 3 C shows the absorption spectrum of the TNP probelinked to ATP. Clearly, donor-emission/acceptor-absorptionspectral overlap is highly favorable with Trp phosphores-cence but rather poor with Trp fluorescence. As a conse-quence, the overlap integral is large and the critical distancelong range (Ro = 3.9 nm) only for triplet-singlet energy
transfer. For this reason, spectroscopic measurements wereconcerned exclusively with changes in Trp phosphorescence.
Table 3 reports phosphorescence intensity and the life-time of the TNP-ATP/F, complex at various degrees ofnucleotide saturation. Increasing concentrations of TNP-ATP lead to a considerable reduction in the P/PO (411 nm)intensity ratio. However, control experiments in which F1 isreplaced by free Trp show that inner filter of the excitationand trivial transfer of phosphorescence account for most ifnot all of the change (Table 3, see corrected P/PO in paren-theses). Only at TNP-ATP concentrations greater than25-30 ,uM is there a moderate decrease in PIPO, reachingabout 20 ± 3% at 60 ,uM. Further evidence of triplet-singletenergy transfer is provided by the shortening of the phos-phorescence lifetime (Table 3). The reduction in intensitypredicted from the lifetime shortening is in agreement withintensity data, and again T decreases only at relatively largenucleotide concentrations. Significantly, both phosphores-cence intensity and lifetime are promptly restored when 1mM Mg-ATP is added to these solutions. This suggests thatthe sites at which TNP-ATP is weakly bound are specificfor the nucleotide rather than for the TNP moiety. Theaverage distance calculated for this transfer efficiency is 4.9nm, whereas transfer rates yield 4.2 and 5.0 nm for the 1.6-and 4.9-s lifetime components, respectively (Table 2).
It must also be recognized that the shortening of thetriplet lifetime could in principle be due to a change inconformation of the E-subunit bringing Trp closer to aquenching moiety; a change elicited by TNP-ATP but notby ATP binding. Although this possibility cannot be ruledout, it seems unlikely, because in a conformational change,the lifetime heterogeneity is generally not preserved. Table3 shows that the relative amplitude of the 1.6- and 4.9-slifetime components remains invariant on TNP-ATP bind-ing, and, moreover, the shortening of each component iscommensurate with a similar rate of energy transfer in thetwo conformations of E.
It should be noted that the concentration of TNP-ATP atwhich energy transfer is observed is sensibly larger thanwould be expected from the dissociation constant of the
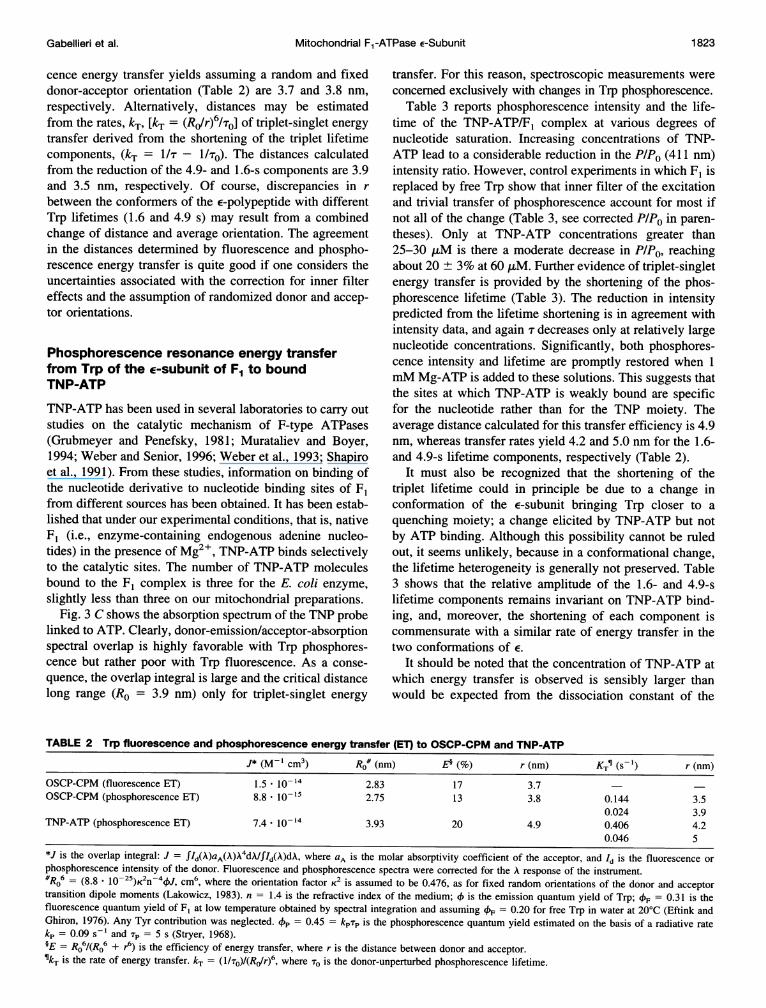
TABLE 2 Trp fluorescence and phosphorescence energy transfer (ET) to OSCP-CPM and TNP-ATPJ* (M- cm3) Ro# (nm) E§ (%) r (nm) KT" (s-') r (nm)
OSCP-CPM (fluorescence ET) 1.5 . 10-14 2.83 17 3.7OSCP-CPM (phosphorescence ET) 8.8 * 10-15 2.75 13 3.8 0.144 3.5
0.024 3.9TNP-ATP (phosphorescence ET) 7.4 - 10-'4 3.93 20 4.9 0.406 4.2
0.046 5
*J is the overlap integral: J = fId(A)aA(A)A4dA/fld(A)dA, where aA is the molar absorptivity coefficient of the acceptor, and Id is the fluorescence orphosphorescence intensity of the donor. Fluorescence and phosphorescence spectra were corrected for the A response of the instrument.*RO6 = (8.8 * 10-25)K2n-44J, cm6, where the orientation factor K2 is assumed to be 0.476, as for fixed random orientations of the donor and acceptortransition dipole moments (Lakowicz, 1983). n = 1.4 is the refractive index of the medium; 4) is the emission quantum yield of Trp; OF = 0.31 is thefluorescence quantum yield of F, at low temperature obtained by spectral integration and assuming OF = 0.20 for free Trp in water at 20°C (Eftink andGhiron, 1976). Any Tyr contribution was neglected. 4p = 0.45 = kpTp is the phosphorescence quantum yield estimated on the basis of a radiative ratekp = 0.09 s- 1 and Tp = 5 s (Stryer, 1968).§E = R06/(Ro6 + r6) is the efficiency of energy transfer, where r is the distance between donor and acceptor.qkT is the rate of energy transfer. kT = (l1T0)/(R0/r)6, where To is the donor-unperturbed phosphorescence lifetime.
Gabellieri et al. 1823
Volume 72 April 1997
TABLE 3 Trp phosphorescence quenching by TNP-ATP bound to F1
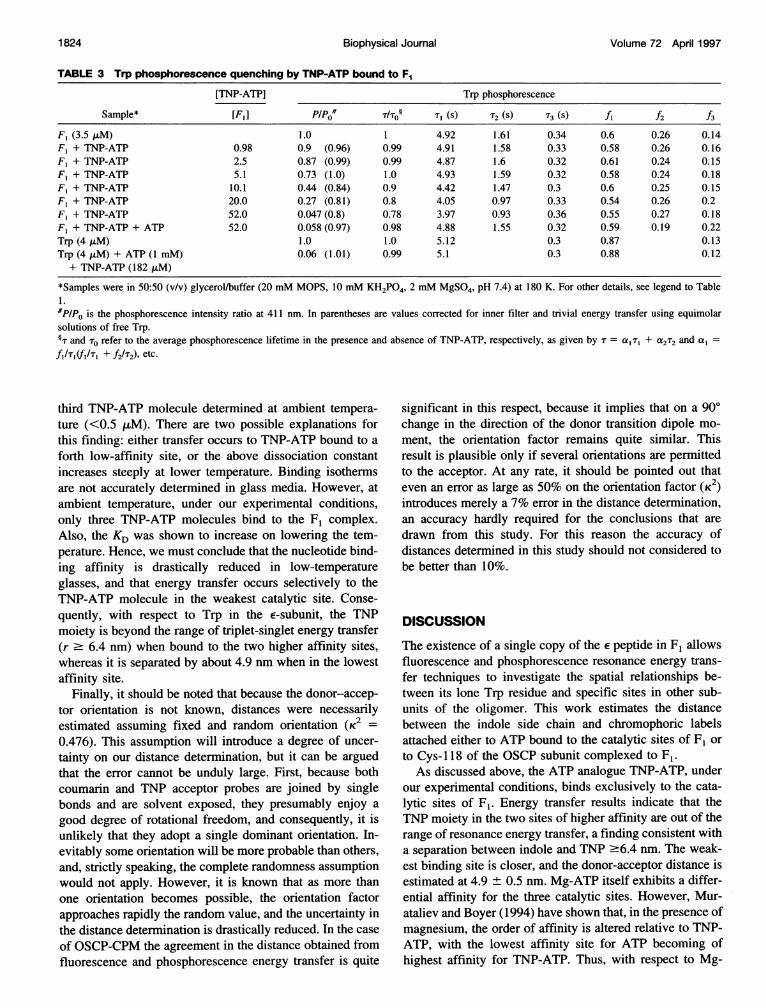
[TNP-ATP] Trp phosphorescence
Sample* [F,] PlPo /To§ T, (s) 2 (S) T3 (S) f, f2 f3
F, (3.5 ,AM) 1.0 1 4.92 1.61 0.34 0.6 0.26 0.14F, + TNP-ATP 0.98 0.9 (0.96) 0.99 4.91 1.58 0.33 0.58 0.26 0.16F, + TNP-ATP 2.5 0.87 (0.99) 0.99 4.87 1.6 0.32 0.61 0.24 0.15F, + TNP-ATP 5.1 0.73 (1.0) 1.0 4.93 1.59 0.32 0.58 0.24 0.18F, + TNP-ATP 10.1 0.44 (0.84) 0.9 4.42 1.47 0.3 0.6 0.25 0.15F, + TNP-ATP 20.0 0.27 (0.81) 0.8 4.05 0.97 0.33 0.54 0.26 0.2F, + TNP-ATP 52.0 0.047 (0.8) 0.78 3.97 0.93 0.36 0.55 0.27 0.18F, + TNP-ATP + ATP 52.0 0.058 (0.97) 0.98 4.88 1.55 0.32 0.59 0.19 0.22Trp (4 ,uM) 1.0 1.0 5.12 0.3 0.87 0.13Trp (4 ,uM) + ATP (1 mM) 0.06 (1.01) 0.99 5.1 0.3 0.88 0.12+ TNP-ATP (182 ,uM)
*Samples were in 50:50 (v/v) glycerol/buffer (20 mM MOPS, 10 mM KH2PO4, 2 mM MgSO4, pH 7.4) at 180 K. For other details, see legend to Table1.#PP/o is the phosphorescence intensity ratio at 411 nm. In parentheses are values corrected for inner filter and trivial energy transfer using equimolarsolutions of free Trp.§T and To refer to the average phosphorescence lifetime in the presence and absence of TNP-ATP, respectively, as given by T = a, T, + a2T2 and a,f,I'T(f,/', + f21T2), etc.
third TNP-ATP molecule determined at ambient tempera-ture (<0.5 ,tM). There are two possible explanations forthis finding: either transfer occurs to TNP-ATP bound to aforth low-affinity site, or the above dissociation constantincreases steeply at lower temperature. Binding isothermsare not accurately determined in glass media. However, atambient temperature, under our experimental conditions,only three TNP-ATP molecules bind to the F1 complex.Also, the KD was shown to increase on lowering the tem-perature. Hence, we must conclude that the nucleotide bind-ing affinity is drastically reduced in low-temperatureglasses, and that energy transfer occurs selectively to theTNP-ATP molecule in the weakest catalytic site. Conse-quently, with respect to Trp in the e-subunit, the TNPmoiety is beyond the range of triplet-singlet energy transfer(r - 6.4 nm) when bound to the two higher affinity sites,whereas it is separated by about 4.9 nm when in the lowestaffinity site.
Finally, it should be noted that because the donor-accep-tor orientation is not known, distances were necessarilyestimated assuming fixed and random orientation (K2 =
0.476). This assumption will introduce a degree of uncer-tainty on our distance determination, but it can be arguedthat the error cannot be unduly large. First, because bothcoumarin and TNP acceptor probes are joined by singlebonds and are solvent exposed, they presumably enjoy agood degree of rotational freedom, and consequently, it isunlikely that they adopt a single dominant orientation. In-evitably some orientation will be more probable than others,and, strictly speaking, the complete randomness assumptionwould not apply. However, it is known that as more thanone orientation becomes possible, the orientation factorapproaches rapidly the random value, and the uncertainty inthe distance determination is drastically reduced. In the caseof OSCP-CPM the agreement in the distance obtained fromfluorescence and phosphorescence energy transfer is quite
significant in this respect, because it implies that on a 900change in the direction of the donor transition dipole mo-ment, the orientation factor remains quite similar. Thisresult is plausible only if several orientations are permittedto the acceptor. At any rate, it should be pointed out thateven an error as large as 50% on the orientation factor (K2)introduces merely a 7% error in the distance determination,an accuracy hardly required for the conclusions that aredrawn from this study. For this reason the accuracy ofdistances determined in this study should not considered tobe better than 10%.
DISCUSSION
The existence of a single copy of the E peptide in F1 allowsfluorescence and phosphorescence resonance energy trans-fer techniques to investigate the spatial relationships be-tween its lone Trp residue and specific sites in other sub-units of the oligomer. This work estimates the distancebetween the indole side chain and chromophoric labelsattached either to ATP bound to the catalytic sites of F1 orto Cys-1 18 of the OSCP subunit complexed to F1.As discussed above, the ATP analogue TNP-ATP, under
our experimental conditions, binds exclusively to the cata-lytic sites of Fl. Energy transfer results indicate that theTNP moiety in the two sites of higher affinity are out of therange of resonance energy transfer, a finding consistent witha separation between indole and TNP '6.4 nm. The weak-est binding site is closer, and the donor-acceptor distance isestimated at 4.9 ± 0.5 nm. Mg-ATP itself exhibits a differ-ential affinity for the three catalytic sites. However, Mur-ataliev and Boyer (1994) have shown that, in the presence ofmagnesium, the order of affinity is altered relative to TNP-ATP, with the lowest affinity site for ATP becoming ofhighest affinity for TNP-ATP. Thus, with respect to Mg-
1 824 Biophysical Journal
Mitochondrial F1-ATPase e-Subunit
ATP, a high-affinity site is at about 4.9 nm, whereas theother two sites are beyond 6.4 nm from the E subunit Trp.
Fluorescence and phosphorescence energy transfer fromindole to the coumarin label attached to OSCP indicate thatthe interaction is effective only for the first molecule ofOSCP-CPM bound to F1 and yields a separation of 3.7 ±0.5 nm between the chromophores. Furthermore, the obser-vation that OSCP-CPM in excess of the molar ratio of 1:1 isout of the range of energy transfer (r ' 4.6 nm) implies thatthe low-affinity sites described by Dupuis et al. (1985) arefarther removed. Apparently, these weaker associations ofOSCP to F1 are not functionally relevant for conferring theoligomycin sensitivity to the enzyme, because F1 com-plexed to stalk proteins containing a single copy of OSCPwas fully competent (Collinson et al., 1994).
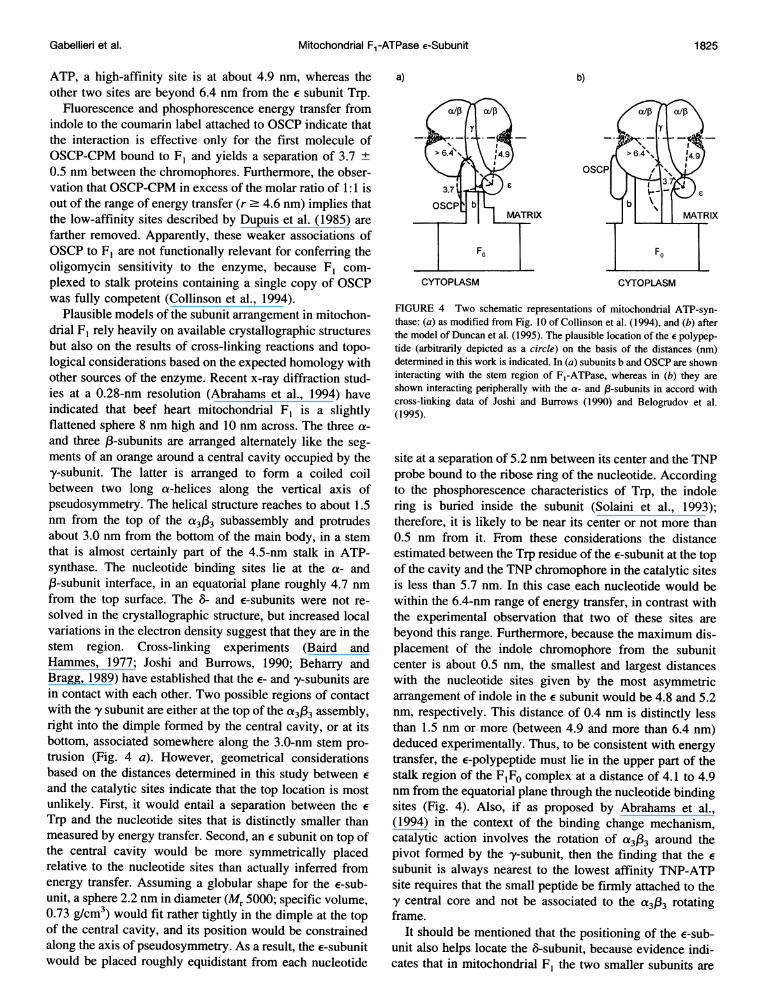
Plausible models of the subunit arrangement in mitochon-drial F1 rely heavily on available crystallographic structuresbut also on the results of cross-linking reactions and topo-logical considerations based on the expected homology withother sources of the enzyme. Recent x-ray diffraction stud-ies at a 0.28-nm resolution (Abrahams et al., 1994) haveindicated that beef heart mitochondrial F1 is a slightlyflattened sphere 8 nm high and 10 nm across. The three a-and three /3-subunits are arranged alternately like the seg-ments of an orange around a central cavity occupied by the'y-subunit. The latter is arranged to form a coiled coilbetween two long a-helices along the vertical axis ofpseudosymmetry. The helical structure reaches to about 1.5nm from the top of the a3f3 subassembly and protrudesabout 3.0 nm from the bottom of the main body, in a stemthat is almost certainly part of the 4.5-nm stalk in ATP-synthase. The nucleotide binding sites lie at the a- and,/-subunit interface, in an equatorial plane roughly 4.7 nmfrom the top surface. The 6- and E-subunits were not re-solved in the crystallographic structure, but increased localvariations in the electron density suggest that they are in thestem region. Cross-linking experiments (Baird andHammes, 1977; Joshi and Burrows, 1990; Beharry andBragg, 1989) have established that the E- and 'y-subunits arein contact with each other. Two possible regions of contactwith the y subunit are either at the top of the a3f33 assembly,right into the dimple formed by the central cavity, or at itsbottom, associated somewhere along the 3.0-nm stem pro-trusion (Fig. 4 a). However, geometrical considerationsbased on the distances determined in this study between Eand the catalytic sites indicate that the top location is mostunlikely. First, it would entail a separation between the ETrp and the nucleotide sites that is distinctly smaller thanmeasured by energy transfer. Second, an E subunit on top ofthe central cavity would be more symmetrically placedrelative to the nucleotide sites than actually inferred fromenergy transfer. Assuming a globular shape for the E-sub-unit, a sphere 2.2 nm in diameter (Mr 5000; specific volume,0.73 g/cm3) would fit rather tightly in the dimple at the topof the central cavity, and its position would be constrainedalong the axis of pseudosymmetry. As a result, the E-subunitwould be placed roughly equidistant from each nucleotide
a) b)
Fo
CYTOPLASMCYTOPLASM
FIGURE 4 Two schematic representations of mitochondrial ATP-syn-thase: (a) as modified from Fig. 10 of Collinson et al. (1994), and (b) afterthe model of Duncan et al. (1995). The plausible location of the E polypep-tide (arbitrarily depicted as a circle) on the basis of the distances (nm)determined in this work is indicated. In (a) subunits b and OSCP are showninteracting with the stem region of F1-ATPase, whereas in (b) they areshown interacting peripherally with the a- and /3-subunits in accord withcross-linking data of Joshi and Burrows (1990) and Belogrudov et al.(1995).
site at a separation of 5.2 nm between its center and the TNPprobe bound to the ribose ring of the nucleotide. Accordingto the phosphorescence characteristics of Trp, the indolering is buried inside the subunit (Solaini et al., 1993);therefore, it is likely to be near its center or not more than0.5 nm from it. From these considerations the distanceestimated between the Trp residue of the E-subunit at the topof the cavity and the TNP chromophore in the catalytic sitesis less than 5.7 nm. In this case each nucleotide would bewithin the 6.4-nm range of energy transfer, in contrast withthe experimental observation that two of these sites arebeyond this range. Furthermore, because the maximum dis-placement of the indole chromophore from the subunitcenter is about 0.5 nm, the smallest and largest distanceswith the nucleotide sites given by the most asymmetricarrangement of indole in the E subunit would be 4.8 and 5.2nm, respectively. This distance of 0.4 nm is distinctly lessthan 1.5 nm or more (between 4.9 and more than 6.4 nm)deduced experimentally. Thus, to be consistent with energytransfer, the E-polypeptide must lie in the upper part of thestalk region of the FIFO complex at a distance of 4.1 to 4.9nm from the equatorial plane through the nucleotide bindingsites (Fig. 4). Also, if as proposed by Abrahams et al.,(1994) in the context of the binding change mechanism,catalytic action involves the rotation of a3/33 around thepivot formed by the -y-subunit, then the finding that the Esubunit is always nearest to the lowest affinity TNP-ATPsite requires that the small peptide be firmly attached to the-y central core and not be associated to the a3f33 rotatingframe.
It should be mentioned that the positioning of the E-sub-unit also helps locate the 6-subunit, because evidence indi-cates that in mitochondrial F1 the two smaller subunits are
Gabellieri et al. 1 825
1826 Biophysical Journal Volume 72 April 1997
closely associated (Baird and Hammes, 1977; Penin et al.,1990; Orriss et al., 1996).
It is interesting to note that the position of the E-subunitderived here for mitochondrial F1 is strikingly similar to thelocation of the E-subunit in the chloroplast coupling factor,although sequence homology suggests that in the latter thispolypeptide corresponds to the 6- rather than to the E-sub-unit of the mitochondrial complex (Walker et al., 1985).Thus, in the chloroplast enzyme, the distances obtainedfrom energy transfer between fluorescence labels attachedto the sulfhydril of the E-subunit and the TNP probe in thecatalytic sites are 6.2 and 6.6 nm for the high-affinity sitesand 4.9 nm for the low-affinity site. Also, the separation ofE from the membrane surface is 4.0 nm (Richter et al.,1985), which again is consistent with its location in thehigher part of the stalk region.
Another important aspect of the FOF1 enzyme complex isthe topological arrangement of the subunits linking thefragments Fo and Fl. Presently, there are two models cred-ited to represent the architecture of the FOF1 complex. In one(Fig. 4 a) F1 is bound to the membrane sector through thecentral stalk that includes subunits b and OSCP, the pair,according to cross-linking data being closely associatedwith each other (Belogrudov et al., 1995; Joshi and Bur-rows, 1990). In the alternative model (Duncan et al., 1995)subunits b and OSCP connect the membrane domain bybinding to one side of the F1 globule (Fig. 4 b). The distanceof 3.7 nm determined between the indole ring of the E Trpand Cys- 118 of OSCP places the two polypeptides in prox-imity, if not in direct contact, with each other. Indeed,assuming that they adopt a spherical shape, the molecularmass of 21,000 Da for OSCP yields molecular diameters of3.6 nm, so that the maximum distance between indole andCys-1 18 compatible with a contact complex is 5.3 nm;therefore, purely geometrical considerations cannot rule outa juxtaposition of the two polypeptides. Clearly, this prox-imity of E to OSCP does not support the FoF1 modelrepresented in Fig. 4 b, in which OSCP is placed at aconsiderable distance from the protruding stem of the,y-subunit. Furthermore, in the model of Fig. 4 b, OSCP anda3/33 assembly have fixed positions relative to each otherbut not relative to the y- or E-subunit, which is firmlyattached to it (see above). Hence, in the binding changemechanism the rotation of y relative to a3f33 would producethree equally probable but vastly different OSCP/E-subunitspatial arrangements, each one characterized by a markedlydifferent Trp4-Cysl 18 separation and, therefore, energytransfer efficiency. However, the agreement between theextent of energy transfer as determined by the decrease inphosphorescence intensity and by the reduction in phospho-rescence lifetime implies homogeneous energy transfer ef-ficiencies within the F1 population, which in turn are con-sistent with a uniform OSCP/E-subunit geometricalarrangement, as found in the model in Fig. 4 a.
We are grateful to Dr. J. E. Walker, and M. J. van Raaij (Medical ResearchCouncil, Cambridge, UK) for providing OSCP. We acknowledge the
kindness of Prof. G. Lenaz (University of Bologna), in whose laboratorythe enzyme was prepared.
This research was supported by Ministero dell'Universita e della RicercaScientifica e Tecnologica (Rome) and by the Italian Consiglio Nazionaledelle Ricerche.
REFERENCES
Abrahams, J. P., A. G. W. Leslie, R. Lutter, and J. E. Walker. 1994.Structure at 2.8 A resolution of FI-ATPase from bovine heart mitochon-dria. Nature. 370:621-628.
Abrahams, J. P., R. Lutter, R. J. Todd, M. J. van Raaij, A. G. W. Leslie, andJ. E. Walker. 1993. Inherent asymmetry of the structure of F,-ATPasefrom bovine heart mitochondria at 6.5 A resolution. EMBO J. 12:1775-1780.
Baird, B. A., and G. G. Hammes. 1977. Chemical cross-linking studies ofbeef heart mitochondrial coupling factor 1. J. Biol. Chem. 252:4743-4748.
Baracca, A., M. Degli Esposti, G. Parenti-Castelli, and G. Solaini. 1992.Purification and characterization of adenosine triphosphatase from eelliver mitochondria. Comp. Biochem. Physiol. 11B:421-426.
Baracca, A., E. Gabellieri, S. Barogi, and G. Solaini. 1995. Conformationalchanges of the mitochondrial F,-ATPase e-subunit induced by nucleo-tide binding as observed by phosphorescence spectroscopy. J. Biol.Chem. 270:21845-21851.
Beharry, S., and P. D. Bragg. 1989. Conformational change in beef heartmitochondrial F1 ATPase to ATP synthesis mode induced by dimethyl-sulfoxide and ATP revealed by sulfhydryl group labeling. FEBS Lett.253:276-280.
Belogrudov, G. I., J. M. Tonich, and Y. Hatefi. 1995. ATP synthasecomplex. Proximities of subunits in bovine submitochondrial particles.J. Bio. Chem. 270:2053-2060.
Bianchet, M., S. Ysern, J. Hullihen, P. L. Pedersen, and L. M. Anzel. 1991.Mitochondrial ATP synthase. J. Biol. Chem. 266:21197-21201.
Boyer, P. D. 1989. A perspective of the binding change mechanism forATP synthesis. FASEB J. 3:2164-2178.
Boyer, P. D. 1993. The binding change mechanism for ATP synthase:some probabilities and possibilities. Biochim. Biophys. Acta. 1140:215-250.
Capaldi, R. A. 1995. F1-ATPase in a spin. Nature Struct. Biol. 1:660-663.Cioni, P., and G. B. Strambini. 1989. Dynamical structure of glutamate
dehydrogenase as monitored by tryptophan phosphorescence. J. Mol.Biol. 207:237-247.
Collinson, I. R., M. J. van Raaij, M. J. Runswick, I. M. Fearnley, M.Skehel, G. L. Orriss, B. Miroux, and J. E. Walker. 1994. ATP synthasefrom bovine heart mitochondria. J. Mol. Biol. 242:408-421.
Cross, R. L., and C. M. Nalin. 1982. Adenine nucleotide binding sites onbeef heart F,-ATPase. J. Biol. Chem. 257:2874-2881.
Duncan, T. M., V. V. Bulygin, Y. Zhou, M. L. Hutcheon, and R. L. Cross.1995. Rotation of subunits during catalysis by Escherichia coli F,-ATPase. Proc. Natl. Acad. Sci. USA. 92:10964-10968.
Dupuis, A., J. Lunardi, J.-P. Issartel, and P. V. Vignais. 1985. Interactionsbetween the oligomycin sensitivity conferring protein (OSCP) and beefheart mitochondrial FI-ATPase. 1. Study of the binding parameters witha chemically radiolabeled OSCP. Biochemistry. 24:734-739.
Duszynsky, J., A. Dupuis, B. Lux, and P. V. Vignais. 1988. Spectralproperties of fluorescent derivatives of the oligomycin sensitivity con-ferring protein and analysis of their interaction with the F1 and Fo sectorsof the mitochondrial ATPase complex. Biochemistry. 27:6288-6296.
Eftink, M. R., and C. A. Ghiron. 1976. Exposure of tryptophan phospho-rescence residues in proteins. Quantitative determination by fluores-cence quenching studies. Biochemistry. 15:672-680.
Fernnadez-Moran, H. 1962. Cell-membrane ultra-structure. Low tempera-ture electron microscopy and X-ray diffraction studies of lipoproteincomponents in lamellar systems. Circulation. 26:1039-1065.
Forster, T. 1959. Transfer mechanisms of electronic excitation. Discuss.Faraday Soc. 27:7-17.
Galley, W. C., and L. Stryer. 1969. Triplet-singlet energy transfer inproteins. Biochemistry. 8:1831-1838.
Gabellieri et al. Mitochondrial F1-ATPase E-Subunit 1827
Gresser, M. J., J. A. Myers, and P. D. Boyer. 1982. Catalytic site cooper-ativity of beef heart mitochondrial F1 adenosine triphosphatase. J. Biol.Chem. 257:12030-12038.
Grubmeyer, C., and H. S. Penefsky. 1981. Presence of two hydrolytic siteson beef heart mitochondrial adenosine triphosphatase. J. Bio. Chem.256:3718-3727.
Issartel, J. P., J. Lunardi, and P. V. Vignais. 1986. Characterization ofexchangeable and nonexchangeable bound adenine nucleotides in F,-ATPase from Escherichia coli. J. Biol. Chem. 261:895-901.
Joshi, S., and R. Burrows. 1990. ATP synthase complex from bovine heartmitochondria. J. Biol. Chem. 265:14518-14525.
Kellogg, R. E. 1967. Kinetics of energy transfer from the triplet state inrigid solutions. J. Chem. Phys. 47:3403-3406.
Laemmli, U. K. 1970. Cleavage of structural proteins during the assemblyof the head of bacteriophage T4. Nature. 227:680-685.
Lakowicz, J. R. 1983. Energy transfer. In Principles of FluorescenceSpectroscopy. Plenum Publishing Corp., New York. 303-339.
Lowry, 0. H., N. J. Rosebrough, A. L. Farr, and R. J. Randall. 1951.Protein measurement with the Folin phenol reagent. J. Biol. Chem.193:265-275.
McCarty R. E., and G. G. Hammes. 1987. Molecular architecture ofchloroplast coupling factor 1. Trends Biochem. Sci. 12:234-237.
Muneyuki, E., T. Hisabori, W. S. Allison, J.-M. Jault, T. Sasayama, and M.Yoshida. 1994. Catalytic cooperativity of beef heart mitochondrial Fr-ATPase revealed by using 2',3'-O-(2,4,6-trinitrophenyl)-ATP as asubstrate; an indication of mutually activating catalytic sites. Biochim.Biophys. Acta. 1188:108-116.
Murataliev, M. B., and P. D. Boyer. 1994. Interaction of mitochondrialF,-ATPase with trinitrophenyl derivatives of ATP and ADP. J. Bio.Chem. 269:15431-15439.
Orriss, G. L., M. J. Runswick, I. R. Collinson, B. Miroux, I. M. Feamley,J. M. Skehel, and J. E. Walker. 1996. The S- and E-subunits of bovineF,-ATPase interact to form a heterodimeric subcomplex. Biochem. J.314:695-700.
Penefsky H. S. 1975. Preparation of beef heart mitochondrial ATPase.Methods Enzymol. LV:304-308.
Penefsky, H. S., and R. L. Cross. 1991. Structure and mechanism ofFIFO-type ATP synthases and ATPases. Adv. Enzymol. 64:173-214
Penin, F., G. Del6age, D. Gagliardi, B. Roux, and D. C. Gautheron. 1990.Interaction between 6 and E subunits of F1-ATPase from pig heart
mitochondria. Circular dichroism and intrinsic fluorescence of purifiedand reconstituted SE complex. Biochemistry. 29:9358-9364.
Richter, M. L., B. Snyder, R. E. McCarty, and G. G. Hammes. 1985.Binding stoichiometry and structural mapping of the E polypeptide ofchloroplast coupling factor 1. Biochemistry. 4:5755-5763.
Senior, A. E. 1988. ATP synthesis by oxidative phosphorylation. Physiol.Rev. 68:177-23 1.
Shapiro, A. B., K. D. Gibson, H. A. Scheraga, and R. E. McCarty. 1991.Fluorescence resonance energy transfer mapping of the fourth of sixnucleotide-binding sites of chloroplast coupling factor 1. J. Bio. Chem.266:17276-17285.
Solaini, G., A. Baracca, G. Parenti-Castelli, and G. B. Strambini. 1993.Tryptophan phosphorescence as a structural probe of mitochondrialF,-ATPase E-subunit. Eur. J. Biochem. 214:729-734.
Strambini, G. B. and M. Gonnelli. 1995. Tryptophan phosphorescence influid solution. J. Am. Chem. Soc. 117: 7646-765 1.
Strambini, G. B., P. Cioni, A. Peracchi, and A. Mozzarelli. 1992. Charac-terization of tryptophan and coenzyme luminescence in tryptophan syn-thase from Salmonella typhimurium. Biochemistry. 31:7527-7434.
Stryer, L. 1968. Fluorescence spectroscopy of proteins. Science. 162:526-533.
Tiedge, H., and G. Schiifer. 1986. Site-site interaction on mitochondrialFI-ATPase. Biol. Chem. Hoppe-Seyler. 367:689-694.
Tzagoloff A., D. M. MacLennan, and K. H. Byington. 1968. Studies on themitochondrial adenosine triphosphatase system. III. Isolation from theoligomycin-sensitive adenosine triphosphatase complex of the factorswhich bind F1 and determine oligomycin sensitivity of bound Fl. Bio-chemistry. 7:1596-1602.
Walker, J. E., I. M. Fearnley, N. J. Gay, B. W. Gibson, F. D. Northrop, S.J. Powell, M. J. Runswick, M. Saraste, and V. L. J. Tybulewicz. 1985.Primary structure and subunit stoichiometry of ATPase from bovinemitochondria. J. Mol. Biol. 184:677-701.
Weber, J., and A. E. Senior. 1996. Binding and hydrolysis of TNP-ATP byEscherichia coli F,-ATPase. J. Biol. Chem. 271:3474-3477.
Weber, J., S. Wilke-Mounts, R. S.-F. Lee, E. Grell, and A. E. Senior. 1993.Specific placement of tryptophan in the catalytic sites of Escherichiacoli F1-ATPase provides a direct probe of nucleotide binding: maximalATP hydrolysis occurs with three sites occupied. J. Biol. Chem. 268:20126-20133.


