Embed Size (px)
Citation preview
Structural Shifts of Gut Microbiota as Surrogate Endpoints for Monitoring Host Health Changes Induced by Carcinogen Exposure By: Hua Wei, Li Dong, Tingting Wang, Menghui Zhang, Weiying Hua, Chenhong Zhang, Xiaoyan Pang, Minjun Chen, Mingming Su, Yunping Qiu, Mingmei Zhou, Shengli Yang, Zhu Chen, Mattias Rantalainen, Jeremy K. Nicholson, Wei Jia, Dazheng Wu, and Liping Zhao Wei, H., Dong, L., Wang, T.T., Zhang, M.H., Hua, W.Y., Zhang, C.H., Pang, X.Y., Chen, M.J.,
Su, M.M., Qiu, Y.P., Zhou, M.M., Yang, S.L., Chen, Z., Rantalaninen, M., Nicholson, J.K., Jia, W., Wu, D.Z., Zhao, L.P. (2010). Structural shifts of gut microbiota as surrogate endpoints for monitoring host health changes induced by carcinogen exposure. FEMS Microbiology Ecology, 73(3), 577-586.
***Note: This version of the document is not the copy of record. Made available courtesy of Blackwell Publishing. The definitive version is available at www.blackwell-synergy.com. Abstract: This study monitored structural shifts of gut microbiota of rats developing precancerous mucosal lesions induced by carcinogen 1,2-dimethyl hydrazine (DMH) treatment using PCR-denaturing gradient gel electrophoresis (DGGE) and 454 pyrosequencing on the 16S rRNA gene V3 region. Partial least square discriminant analysis of DGGE fingerprints showed that the gut microbiota structure of treated animals was similar to that of the controls 1 and 3 weeks after DMH treatments, but significantly different 7 weeks after DMH treatments, when a large number of aberrant crypt foci (ACF) developed in their colons. Martens' uncertainty test, followed by anova test (P<0.05) identified Ruminococcus-like and Allobaculum-like bacteria as key variables for discrimination of DMH-treated rats from controls. Real-time PCR confirmed the significant increase of the Ruminococcus obeum and the Allobaculum-like bacteria in DMH-treated rats. UniFrac analysis based on V3 pyrosequencing further validated that the gut microbiota structures of treated and control animals were similar at an early stage, but segregated after ACF formation. Thirteen operational taxonomic units including Ruminococcus-like and Allobaculum-like bacteria were identified as key variables for the discrimination of DMH-treated rats from controls. Dynamic analysis of gut microbiota may become a noninvasive strategy for monitoring host health changes induced by carcinogen exposure. Article: INTRODUCTION The human and animal gastro-intestinal tract harbors a complex microbial community, which plays important roles in the host's physiology and pathology (Nicholson et al., 2005). Patients with inflammatory bowel disease, obesity, diabetes and colorectal cancer (CRC) have different gut microbial structural patterns compared with healthy populations (Guarner & Malagelada, 2003; Ley et al., 2006; Cani et al., 2007; Turnbaugh et al., 2008).
Dynamic monitoring of structural shifts of gut microbiota associated with disease predisposition and progression may lead to a deeper understanding of the relationship between gut microbiota and host health status and the discovery of new tools for early diagnosis and prevention (McGarr et al., 2005). Aberrant crypt foci (ACF) induced by 1,2-dimethyl hydrazine (DMH) has been established as a model for precancerous lesion formation in CRC development (McLellan & Bird, 1991). A previous study suggested that members of gut microbiota participated in the carcinogenic process by releasing conjugated DMH metabolites (Pozharisski et al., 1975; Likhachev et al., 1985). The mean number of aberrant crypts per focus in germ-free rats was less than conventionalized rats and activities of fecal bacterial enzymes such as β-glucuronidase and mucinase increased in rats with ACF, but decreased, followed by the reduced number of ACF after dietary modulation such as caraway treatment, suggesting that gut microbiota is related to ACF formation induced by DMH (Onoue et al., 1997; Deeptha et al., 2006). In this study, we use this model to study the dynamic structural shifts of gut microbiota in association with host health changes at different time points after DMH treatment in an attempt to develop novel health monitoring methods with gut microbiota as the primary target. MATERIALS AND METHODS Animal treatment and DNA extraction All of the animal studies were performed under relevant national legislation and local guidelines. Twelve Wistar rats (male, 90±10 g) were purchased from Shanghai Laboratory Animal Co. Ltd, China, and kept in an SPF barrier system with controlled temperature (20.0±0.5 °C) and humidity (60±10%), and fed with a certified standard rat chow and tap water ad libitum. After 1 week of acclimatization, the rats were divided randomly into two groups: the model group (n=6) received a subcutaneous injection with a DMH (Sigma, St. Louis, MO) solution at a dose of 30 mg kg−1 body weight, on the first day and 1 week after acclimatization separately. The DMH solution was prepared in 25 mM EDTA/137 mM NaCl carrier (pH 6.4) and the control group (n=6) received a subcutaneous injection with the same volume of EDTA/NaCl carrier. Fresh feces were collected 1 week (T1), 3 weeks (T2) and 7 weeks (T3) after the second injection and stored at −20 °C for further analysis. Animals' food consumption was monitored during the entire experiment. On the first day of the 10th week, all animals were weighed and sacrificed by decapitation after halothane anesthesia, the spleen was weighed and the entire colon was removed for ACF counting (Onoue et al., 1997). The identification of ACF was based on a method described previously (Deeptha et al., 2006). Briefly, fixed colons (10% buffered formalin) were stained in a 0.2% solution of methylene blue and then examined under a microscope for ACF counting. Food consumption, and the final body and spleen weights of each group were compared using Student's t-test. DNA was extracted from each fecal sample based on the bead-beating method as described previously (Zoetendal et al., 2002). Primers and PCR amplification The V3 region of the 16S rRNA gene from each DNA sample was amplified with universal primers P3 (5′-
CGCCCGCCGCGCGCGGCGGGCGGGGCGGGGGCACGGGGGGCCTACGGGAGGCAGCAG-3′) and P2 (5′-ATTACCGCGGCTGCTGG-3′), using the hot-start touchdown protocol described before (Muyzer et al., 1993) for denaturing gradient gel electrophoresis (DGGE) analysis. Each 25 μL PCR reaction mixture contained 1.5 U of rTaq DNA polymerase, 2 mM MgCl2, 2.5 μL of the corresponding 10 × buffer (Takara, Dalian, China), 200 μM each dNTP, 12.5 pmol of each primer and 20 ng of total DNA template, and was conducted in a thermocycler PCR system (PCR Sprint, Thermo electron, UK). A five-cycle reconditioning PCR method was performed in order to decrease heteroduplex formation (Thompson et al., 2002). DNA extracted from fecal samples collected at T1 and T3 were used in 454 pyrosequencing. The same gene fragment was amplified with the forward primer 5′-NNNNNNNNATTACCGCGGCTGCT-3′ and the reverse primer 5′-NNNNNNNNCCTACGGGAGGCAGCAG-3′. The NNNNNNNN was the unique eight base barcode used to distinguish PCR product from different samples and the underlined texts meant the nucleotide sequences of both primers. Each of the primer pairs contained a sample-unique barcode. PCR reactions were performed as described before (Zhang et al., 2010). DGGE analysis of the 16S rRNA gene V3 region DGGE was performed using a Dcode System apparatus (Bio-Rad, Hercules, CA). PCR products (200 ng) were separated on 8% w/v polyacrylamide gels with a 26.5–52% denaturant gradient (100% denaturant was 7 M urea and 40% deionized formamide). Electrophoresis was performed in 1 × Tris-acetate-EDTA buffer at 200 V (constant voltage) and 60 °C for 4 h. The gels were stained with SYBR Green I (Amresco, Solon, Ohio) and were photographed using a UVI gel documentation system (UVItec, Cambridge, UK). The intensity and mobility of each band were analyzed using the software quantity one® v4.4 (Bio-Rad, Herts, UK). Important DGGE bands were excised from the gel under UV illumination and incubated in 100 μL of Tris-EDTA buffer (pH 8.0) overnight at 4 °C. Supernatant (1 μL) was used as a template for reamplication of the sequence with primers P2 and P3 as described above. The PCR products were purified using the PCR clean-up kit (V-gene, Hangzhou, China), ligated into the pGEM-T Easy Vector (Promega, Madison, WI) and electrotransformed into competent Escherichia coli DH5α cells. Positive clones were picked out randomly, and inserts were reamplified and screened by DGGE to verify their migration positions. Clones that migrated to the same positions as the original DGGE bands were sequenced (Invitrogen, Shanghai, China). Pyrosequencing of the 16S rRNA gene V3 region The PCR product from each sample was purified using the Gel/PCR DNA Fragments Extraction Kit (Geneaid, UKAS). Thirty nanogram of each purified PCR product was mixed and purified from a 1.2% agarose gel using the Gel/PCR DNA Fragments Extraction Kit (Geneaid, UKAS) and used as the DNA library for pyrosequencing with a GS20 platform (Roche) (Margulies et al., 2005). Good-quality sequences were selected using the same protocol as described previously (Zhang et al., 2010) and were used in the following analysis.
Bioinformatic and statistical analysis of DGGE and pyrosequencing All unique sequences from pyrosequencing were aligned using the NAST multi-aligner with a minimum template length of 100 bases and a minimum percent identity of 75% (DeSantis et al., 2006). The resulting alignments were imported into the arb (Ludwig et al., 2004) to calculate the distance matrix. The distance matrix was then imported into dotur for phylotype binning (Schloss & Handelsman, 2005) and operational taxonomic units (OTUs) were defined using a threshold of 97% identity (Huse et al., 2007). The rarefaction curve (Hammer et al., 2001) and the Shannon Diversity Index (http://www.r-project.org/) were calculated for each library. One sequence randomly selected from each OTU was inserted into pre-established phylogenetic trees of full-length 16S rRNA gene sequences' database from GreenGenes using arb (hypervariable regions masked with the lanemaskPH filter) to construct a neighbor-joining tree (Ludwig et al., 2004). This phylogenetic tree was then used for online UniFrac (http://bmf2.colorado.edu/unifrac/index.psp) with abundance weighting. Principal component analysis (PCA) based on digitized DGGE patterns was used to compare the gut microbiota of treated rats and the controls at different time points, and partial least square discriminant analysis (PLS-DA) established by related DGGE patterns or OTU abundance (X) to their corresponding treatment index (Y) (Wold et al., 1983) were used to discriminate two groups at T3. Leave-one-out cross-validation (LOOCV) was used to evaluate the correct classification rate of PLS-DA models (Osten, 1988) and Martens' uncertainty test, followed by one-way anova was used to select stable and significant X-variables (Westad & Martens, 2000). All statistical analyses were implemented under a matlab® (Version 7.1, The MathWorks Inc. Natick, MA) environment. Sequences of important DGGE bands and one sequence randomly selected from each important OTU were aligned to the Ribosomal Database Project (RDP, release 9.33) database to determine their closest phylogenetic relatives. A neighbor-joining phylogenetic tree based on these sequences was constructed using the Jukes–Cantor algorithm (Kumar et al., 2004) by mega 3.1 software. Bootstrap resampling analysis based on 500 replicates was performed in order to estimate the degree of confidence in the tree topology. Real-time quantitative PCR (RT-qPCR) Plasmids containing the Ruminococcus obeum 16S rRNA gene fragment and the fragment recovered from the V3-28 DGGE bands were prepared separately using the QIAGEN Plasmid Mini Kit (Qiagen, Hilden, Germany) and diluted from 1.23 × 10³ to 1.23 × 10⁹ (copies μL−1) separately to construct standard curves. RT-qPCR targeting R. obeum was performed with the species-specific primers ROB3 (5′-TGAGGAGACTGCCAGGGA-3′) and ROB2 (5′-CTCCTTCTTTGCAGTTAGGT-3′) (Wang et al., 1997). The 25 μL reaction mixture contained 1.5 U rTaq DNA polymerase (Takara), 12.5 μL of 2 × SYBR Green I mix (Shanghai Biocolour BioScience & Technology Company), 12.5 pmol of each primer and 20 ng of DNA from each sample or 1 μL of standard plasmid. The reaction was performed using a DNA Engine Opticon 3 system (MJ Research) with the following program: an initial denaturation step at 94 °C for 3 min; 40 cycles of 94 °C for 30 s, 59 °C for 30 s and 72 °C for 30 s; and a final extension at 72 °C for 10 min. At the end of each cycle, the fluorescent signal was measured at 82 °C. The melting curves were obtained by slow heating at
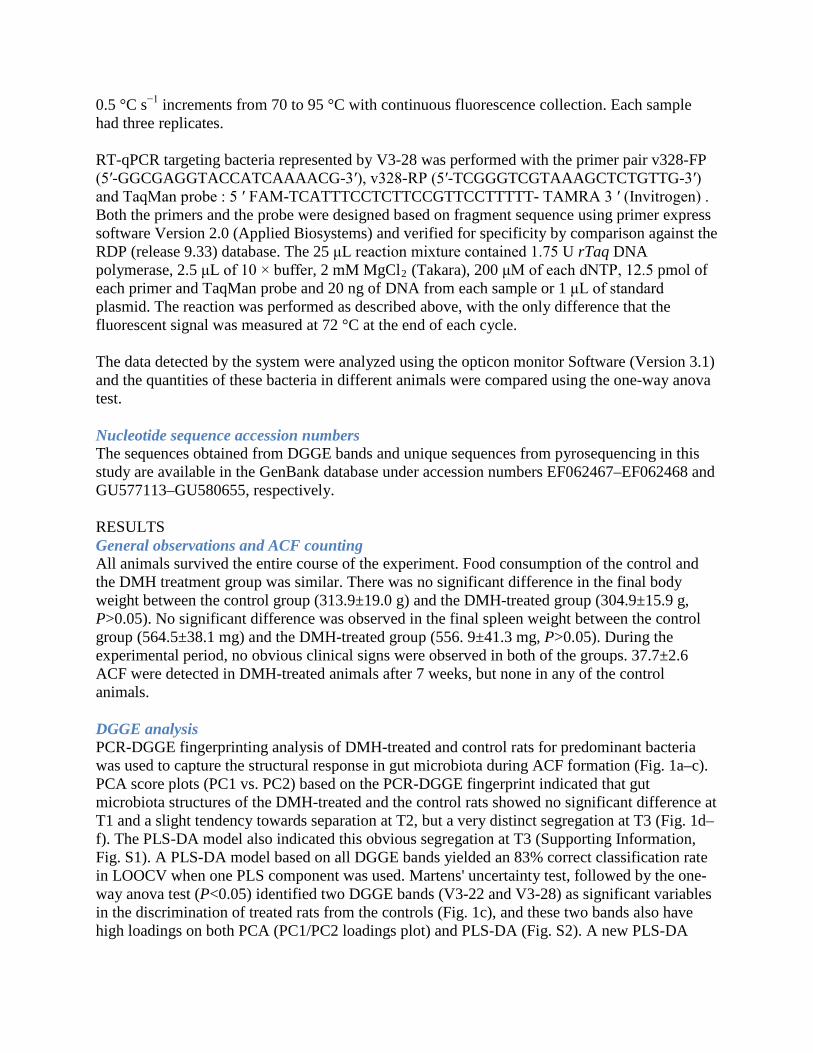
0.5 °C s−1 increments from 70 to 95 °C with continuous fluorescence collection. Each sample had three replicates. RT-qPCR targeting bacteria represented by V3-28 was performed with the primer pair v328-FP (5′-GGCGAGGTACCATCAAAACG-3′), v328-RP (5′-TCGGGTCGTAAAGCTCTGTTG-3′) and TaqMan probe : 5 ′ FAM-TCATTTCCTCTTCCGTTCCTTTTT- TAMRA 3 ′ (Invitrogen) . Both the primers and the probe were designed based on fragment sequence using primer express software Version 2.0 (Applied Biosystems) and verified for specificity by comparison against the RDP (release 9.33) database. The 25 μL reaction mixture contained 1.75 U rTaq DNA polymerase, 2.5 μL of 10 × buffer, 2 mM MgCl2 (Takara), 200 μM of each dNTP, 12.5 pmol of each primer and TaqMan probe and 20 ng of DNA from each sample or 1 μL of standard plasmid. The reaction was performed as described above, with the only difference that the fluorescent signal was measured at 72 °C at the end of each cycle. The data detected by the system were analyzed using the opticon monitor Software (Version 3.1) and the quantities of these bacteria in different animals were compared using the one-way anova test. Nucleotide sequence accession numbers The sequences obtained from DGGE bands and unique sequences from pyrosequencing in this study are available in the GenBank database under accession numbers EF062467–EF062468 and GU577113–GU580655, respectively. RESULTS General observations and ACF counting All animals survived the entire course of the experiment. Food consumption of the control and the DMH treatment group was similar. There was no significant difference in the final body weight between the control group (313.9±19.0 g) and the DMH-treated group (304.9±15.9 g, P>0.05). No significant difference was observed in the final spleen weight between the control group (564.5±38.1 mg) and the DMH-treated group (556. 9±41.3 mg, P>0.05). During the experimental period, no obvious clinical signs were observed in both of the groups. 37.7±2.6 ACF were detected in DMH-treated animals after 7 weeks, but none in any of the control animals. DGGE analysis PCR-DGGE fingerprinting analysis of DMH-treated and control rats for predominant bacteria was used to capture the structural response in gut microbiota during ACF formation (Fig. 1a–c). PCA score plots (PC1 vs. PC2) based on the PCR-DGGE fingerprint indicated that gut microbiota structures of the DMH-treated and the control rats showed no significant difference at T1 and a slight tendency towards separation at T2, but a very distinct segregation at T3 (Fig. 1d–f). The PLS-DA model also indicated this obvious segregation at T3 (Supporting Information, Fig. S1). A PLS-DA model based on all DGGE bands yielded an 83% correct classification rate in LOOCV when one PLS component was used. Martens' uncertainty test, followed by the one-way anova test (P<0.05) identified two DGGE bands (V3-22 and V3-28) as significant variables in the discrimination of treated rats from the controls (Fig. 1c), and these two bands also have high loadings on both PCA (PC1/PC2 loadings plot) and PLS-DA (Fig. S2). A new PLS-DA
model established using these two important variables further yielded a 91% correct classification rate in LOOCV when one PLS component was used. Figure 1: Structural segregation analysis of gut microbiota in precancerous and healthy control rats.
(a–c) 16S rRNA gene V3 region PCR-DGGE profiles of fecal samples obtained from healthy rats (control group) and DMH-treated rats (model group) at 1 week (T1), 3 weeks (T2) and 7 weeks (T3) after DMH treatments; (d–f) PC1 vs. PC2 scores plots of the PCR-DGGE profiles at T1, T2 and T3 between the control (open circle) and the model (solid circle) groups. M represents the marker for DGGE analysis. The DGGE marker was created by mixing 11 sequenced V3 fragments using the same primers. The identities of these 11 sequences are listed in Table S3. These two bands were identified by sequencing the eluted DNA as having 98% similarity to R. obeum (X85101) and 95% similarity to Allobaculum stercoricanis (AJ417075), respectively (Table 1). Table 1: Sequence identity of the discriminating DGGE bands between healthy control and DMH-induced precancerous rats Clone no.
Accession no.
Closely identified phylogenetic relatives (nearest or the next validly described taxon)
Population trend in DMH-treated rats compared with control rats
Similarity (%)
V3-22 EF062467 Ruminococcus obeum (X85101) ↑ 98 V3-28 EF062468 Allobaculum stercoricanis (AJ417075) ↑ 95 ↑, Bacteria represented by this DGGE band were more abundant in DMH-treated rats.
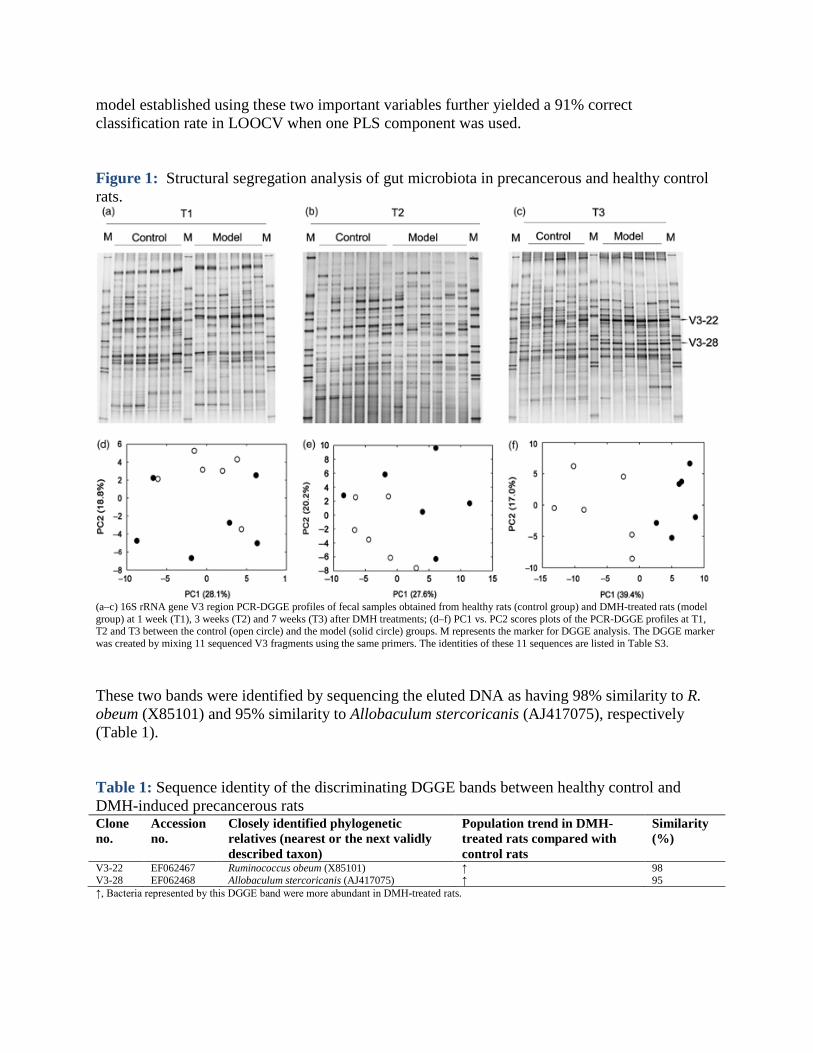
454 Pyrosequencing A total of 21 150 useable sequencing reads and 3543 unique sequences were obtained in all samples. The average number of reads of all samples was 881, with two samples having <500 reads (Table S1). OTUs (509) were obtained under 97% identity (Table S2). The Shannon Diversity Index curves of all samples reached stable values, while all rarefaction curves still did not plateau with the current sequencing (Fig. 2). Figure 2:
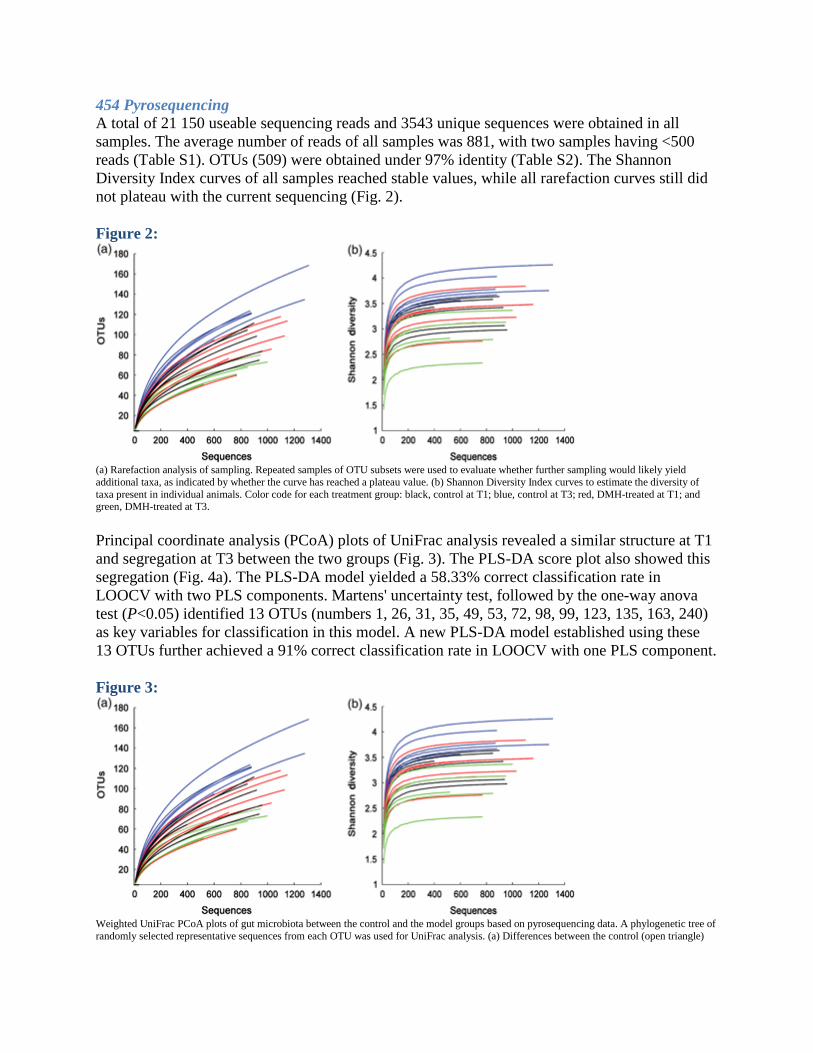
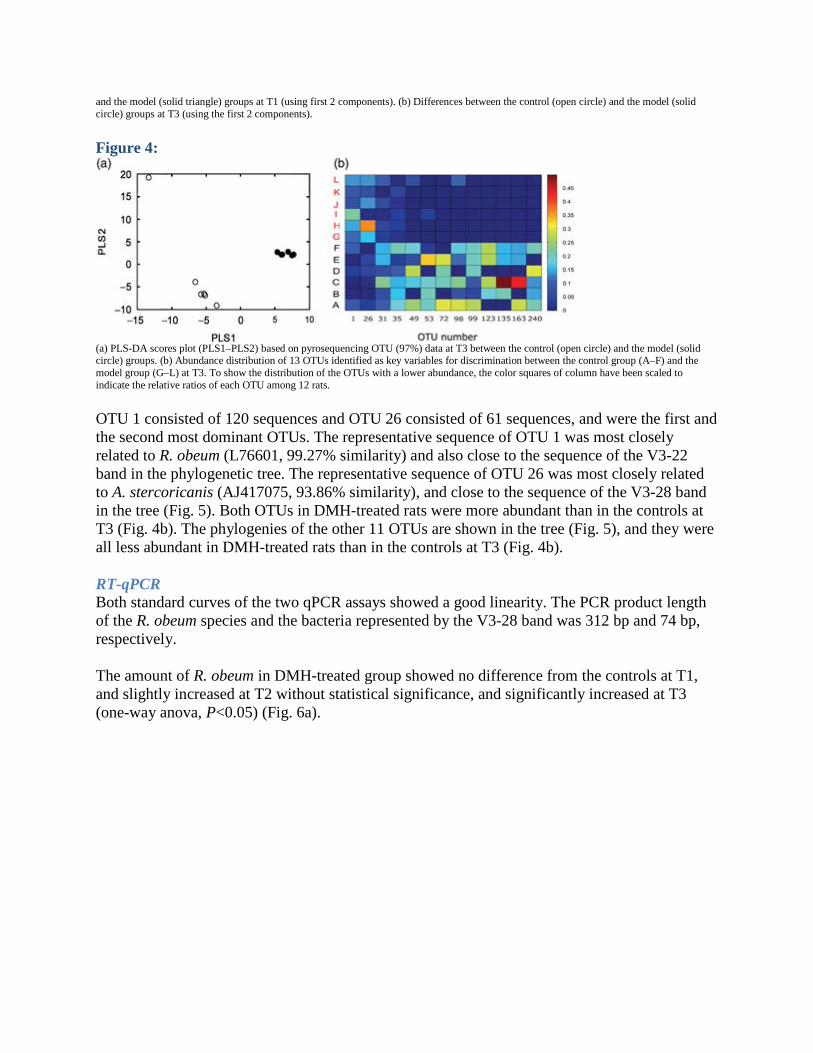
(a) Rarefaction analysis of sampling. Repeated samples of OTU subsets were used to evaluate whether further sampling would likely yield additional taxa, as indicated by whether the curve has reached a plateau value. (b) Shannon Diversity Index curves to estimate the diversity of taxa present in individual animals. Color code for each treatment group: black, control at T1; blue, control at T3; red, DMH-treated at T1; and green, DMH-treated at T3. Principal coordinate analysis (PCoA) plots of UniFrac analysis revealed a similar structure at T1 and segregation at T3 between the two groups (Fig. 3). The PLS-DA score plot also showed this segregation (Fig. 4a). The PLS-DA model yielded a 58.33% correct classification rate in LOOCV with two PLS components. Martens' uncertainty test, followed by the one-way anova test (P<0.05) identified 13 OTUs (numbers 1, 26, 31, 35, 49, 53, 72, 98, 99, 123, 135, 163, 240) as key variables for classification in this model. A new PLS-DA model established using these 13 OTUs further achieved a 91% correct classification rate in LOOCV with one PLS component. Figure 3:
Weighted UniFrac PCoA plots of gut microbiota between the control and the model groups based on pyrosequencing data. A phylogenetic tree of randomly selected representative sequences from each OTU was used for UniFrac analysis. (a) Differences between the control (open triangle)
and the model (solid triangle) groups at T1 (using first 2 components). (b) Differences between the control (open circle) and the model (solid circle) groups at T3 (using the first 2 components).
Figure 4:
(a) PLS-DA scores plot (PLS1–PLS2) based on pyrosequencing OTU (97%) data at T3 between the control (open circle) and the model (solid circle) groups. (b) Abundance distribution of 13 OTUs identified as key variables for discrimination between the control group (A–F) and the model group (G–L) at T3. To show the distribution of the OTUs with a lower abundance, the color squares of column have been scaled to indicate the relative ratios of each OTU among 12 rats. OTU 1 consisted of 120 sequences and OTU 26 consisted of 61 sequences, and were the first and the second most dominant OTUs. The representative sequence of OTU 1 was most closely related to R. obeum (L76601, 99.27% similarity) and also close to the sequence of the V3-22 band in the phylogenetic tree. The representative sequence of OTU 26 was most closely related to A. stercoricanis (AJ417075, 93.86% similarity), and close to the sequence of the V3-28 band in the tree (Fig. 5). Both OTUs in DMH-treated rats were more abundant than in the controls at T3 (Fig. 4b). The phylogenies of the other 11 OTUs are shown in the tree (Fig. 5), and they were all less abundant in DMH-treated rats than in the controls at T3 (Fig. 4b).
RT-qPCR Both standard curves of the two qPCR assays showed a good linearity. The PCR product length of the R. obeum species and the bacteria represented by the V3-28 band was 312 bp and 74 bp, respectively. The amount of R. obeum in DMH-treated group showed no difference from the controls at T1, and slightly increased at T2 without statistical significance, and significantly increased at T3 (one-way anova, P<0.05) (Fig. 6a).
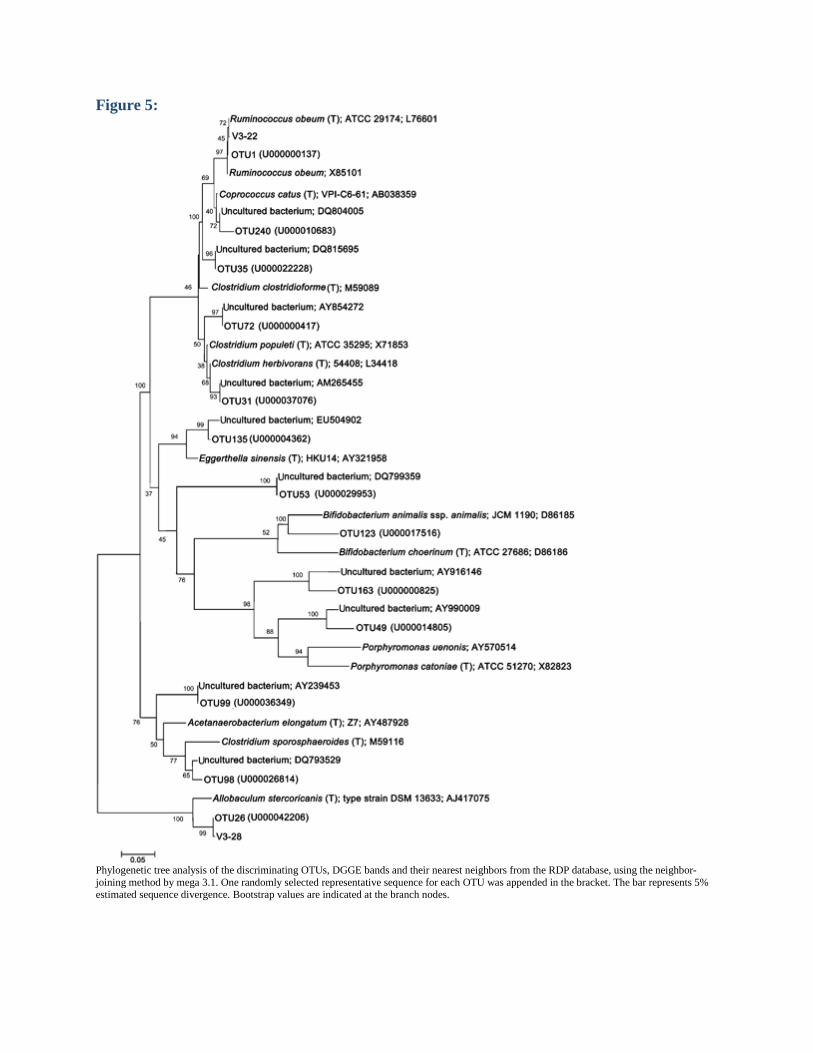
Figure 5:
Phylogenetic tree analysis of the discriminating OTUs, DGGE bands and their nearest neighbors from the RDP database, using the neighbor-joining method by mega 3.1. One randomly selected representative sequence for each OTU was appended in the bracket. The bar represents 5% estimated sequence divergence. Bootstrap values are indicated at the branch nodes.
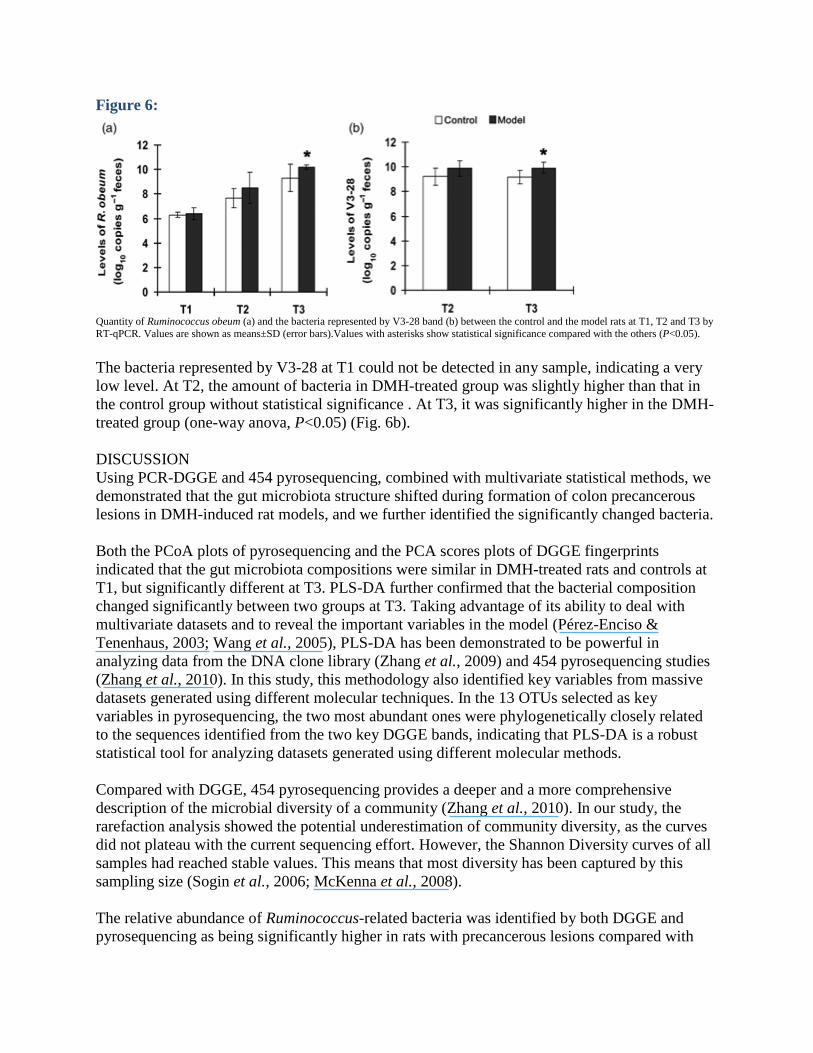
Figure 6:
Quantity of Ruminococcus obeum (a) and the bacteria represented by V3-28 band (b) between the control and the model rats at T1, T2 and T3 by RT-qPCR. Values are shown as means±SD (error bars).Values with asterisks show statistical significance compared with the others (P<0.05). The bacteria represented by V3-28 at T1 could not be detected in any sample, indicating a very low level. At T2, the amount of bacteria in DMH-treated group was slightly higher than that in the control group without statistical significance . At T3, it was significantly higher in the DMH-treated group (one-way anova, P<0.05) (Fig. 6b). DISCUSSION Using PCR-DGGE and 454 pyrosequencing, combined with multivariate statistical methods, we demonstrated that the gut microbiota structure shifted during formation of colon precancerous lesions in DMH-induced rat models, and we further identified the significantly changed bacteria. Both the PCoA plots of pyrosequencing and the PCA scores plots of DGGE fingerprints indicated that the gut microbiota compositions were similar in DMH-treated rats and controls at T1, but significantly different at T3. PLS-DA further confirmed that the bacterial composition changed significantly between two groups at T3. Taking advantage of its ability to deal with multivariate datasets and to reveal the important variables in the model (Pérez-Enciso & Tenenhaus, 2003; Wang et al., 2005), PLS-DA has been demonstrated to be powerful in analyzing data from the DNA clone library (Zhang et al., 2009) and 454 pyrosequencing studies (Zhang et al., 2010). In this study, this methodology also identified key variables from massive datasets generated using different molecular techniques. In the 13 OTUs selected as key variables in pyrosequencing, the two most abundant ones were phylogenetically closely related to the sequences identified from the two key DGGE bands, indicating that PLS-DA is a robust statistical tool for analyzing datasets generated using different molecular methods. Compared with DGGE, 454 pyrosequencing provides a deeper and a more comprehensive description of the microbial diversity of a community (Zhang et al., 2010). In our study, the rarefaction analysis showed the potential underestimation of community diversity, as the curves did not plateau with the current sequencing effort. However, the Shannon Diversity curves of all samples had reached stable values. This means that most diversity has been captured by this sampling size (Sogin et al., 2006; McKenna et al., 2008). The relative abundance of Ruminococcus-related bacteria was identified by both DGGE and pyrosequencing as being significantly higher in rats with precancerous lesions compared with
healthy ones. RT-PCR further confirmed that the amount of R. obeum was higher in rats with precancerous lesions. This is consistent with a previous study on human commensal Ruminoccocus species, showing that Ruminoccocus species were more frequently isolated from high-risk populations with CRC (Moore & Moore, 1995). The underlying mechanisms are yet to be elucidated. Some OTUs closely related to Clostridium species and Coprococcus catus were identified as key variables in distinguishing rats with precancerous lesions from healthy ones. The Clostridium herbivorans-, Clostridium populeti- and Clostridium sporosphaeroides-related OTUs (OTU 31, 35, 98) and C. catus-related OTU 240 were demonstrated to be less abundant in the DMH-treated rats with precancerous lesions compared with controls. A few Clostridium and Coprococcus species are known to play positive roles in host health by producing butyrate, acetate and other short-chain fatty acids (SCFAs) (Pryde et al., 2002). SCFAs have long been known to play important roles in maintaining colonic health (Mortensen & Clausen, 1996), with butyrate having the most noticeable effects on protecting colonic epithelial health and preventing colorectal carcinogenesis. Butyrate has been demonstrated to influence gene expression, induce apoptosis in cancer cell lines and inhibit the genotoxic effect of nitrosamides and hydrogen peroxide in human colon cells (Wollowski et al., 2001; Pryde et al., 2002). In this study, the lack of these bacteria in DMH-treated rats with precancerous lesions may result in less protection against colon cancer. Various Bifidobacterium species have been shown to exert a probiotic action against the occurrence of colon cancer (Ljungh & Wadström, 2006). The abundance of Bifidobacterium choerinum-related OTU 123 was also lower in DMH-treated rats with precancerous lesions. Bifidobacterium choerinum was indicated as a potential probiotic (Maxwell et al., 2004). The lower abundance of B. choerinum-like bacteria in rats with precancerous lesions may also lead to less protection from colon cancer. The structural divergence of gut microbiota in DMH-treated animals away from healthy controls over time may be resulting from a direct effect of DMH on gut bacteria or from DMH-induced changes in the host during the formation of precancerous lesions in the colon. The half-life of DMH and its metabolites in the host were about several hours (Pozharisskiǐet al., 1976). Thus, the amount of DMH and its metabolites may become negligible in the host at T1 and T2. Previous studies based on similar DMH-induced precancerous rat models showed that epithelial hyperplasia of colonic mucosal glands (Decaens et al., 1983), and increased apoptosis and mitosis in colonic crypt epithelium (Smith et al., 2003) were observed at the time point similar to T1 in our experiment. Another study showed that ACF formation in rat colon was observed at the time point similar to T2 in our experiment (Ishizuka et al., 1996). In our study, gut microbiota in DMH-treated rats showed no difference from controls at T1, a slight difference at T2 and significant segregation at T3. Gut microbiota does not change significantly when the host begins to show the physiological changes induced by DMH. The structural segregation of gut microbiota concomitant with ACF formation may be a result of DMH-induced changes of the host rather than a direct toxicity effect of DMH on gut microbiota. ACF is widely accepted as precancerous lesions in the colon of animals and humans (Pretlow et al., 1991; Bird & Good, 2000). However, animals with a large number of ACF in their colon are
still apparently healthy, while global profiling of their fecal microbiota revealed that, compared with healthy animals, significant segregation of gut microbial composition already occurred in their gut. This is an indication that gut microbiota structure may be a sensitive surrogate endpoint for host health. In addition, monitoring of the gut microbiota structure is easy and noninvasive to the host. Dynamic monitoring of the structural segregation of gut microbiota away from the healthy majority may become a useful tool for pinpointing individuals whose health status indicates underlying significant, but still early changes such as the development of precancerous lesions of CRC induced by environmental perturbations. ACKNOWLEDGEMENTS This study was supported by grants: 2006BAI11B08 from the National Science and Technology Supporting Programme of China, 05DJ14009 for Key Basic Research Program from Shanghai Government, 2008AA02Z315 from the High Tech Development Program of China (863), 2009ZX10004-601 from National Science and Technology Major Project, 30800155 from the National Natural Science Foundation of China, J50305 from the Project of Shanghai Leading Academic Discipline, Shanghai Education Committee, and E03008 from the E-Institutes of Traditional Chinese Medicine Internal Medicine, Shanghai Municipal Education Commission. AUTHORS’ CONTRIBUTION H.W., L.D. and T.W. contributed equally to this work. REFERENCES Bird RP & Good CK (2000) The significance of aberrant crypt foci in understanding the
pathogenesis of colon cancer. Toxicol Lett 112–113: 395–402. Cani PD, Amar J, Iglesias MA et al. (2007) Metabolic endotoxemia initiates obesity and insulin
resistance. Diabetes 56: 1761–1772. Decaens C, Bara J, Rosa B, Daher N & Burtin P (1983) Early oncofetal antigenic modifications
during rat colonic carcinogenesis. Cancer Res 43: 355–362. Deeptha K, Kamaleeswari M, SengottuvelanM& Nalini N (2006) Dose dependent inhibitory
effect of dietary caraway on 1,2-dimethylhydrazine induced colonic aberrant crypt foci and bacterial enzyme activity in rats. Invest New Drug 24: 479–488.
DeSantis TZ Jr, Hugenholtz P, Keller K, Brodie EL, Larsen N, Piceno YM, Phan R & Andersen
GL (2006) NAST: a multiple sequence alignment server for comparative analysis of 16S rRNA genes. Nucleic Acids Res 34: W394–W399.
Guarner F & Malagelada JR (2003) Gut flora in health and disease. Lancet 361: 512–519. Hammer Ø, Harper DAT & Ryan PD (2001) PAST: paleontological statistics software package
for education and data analysis. Palaeontol Electron 4: 1–9. Huse SM, Huber JA, Morrison HG, Sogin ML &Welch DM (2007) Accuracy and quality of
massively parallel DNA pyrosequencing. Genome Biol 8: R143.
Ishizuka S, Nagai T & Kasai T (1996) Administration of antiasialo GM1 serum increases
aberrant crypt foci induced by 1,2-dimethylhydrazine in the large bowel of rats. J Nutr Sci Vitaminol 42: 603–608.
Kumar S, Tamura K & Nei M (2004) MEGA3: integrated software for molecular evolutionary
genetics analysis and sequence alignment. Brief Bioinform 5: 150–163. Ley RE, Turnbaugh PJ, Klein S & Gordon JI (2006) Microbial ecology: human gut microbes
associated with obesity. Nature 444: 1022–1023. Likhachev A, Anisimov V, Parvanova L & Pozharisski K (1985) Effect of exogenous beta-
glucuronidase on the carcinogenicity of 1,2-dimethylhydrazine in rats: evidence that carcinogenic intermediates form conjugates and act through their subsequent enzymatic release. Carcinogenesis 6: 679–681.
Ljungh A &Wadström T (2006) Lactic acid bacteria as probiotics. Curr Issues Intest Microbiol
7: 73–89. Ludwig W, Strunk O, Westram R et al. (2004) ARB: a software environment for sequence data.
Nucleic Acids Res 32: 1363–1371. Margulies M, Egholm M, Altman WE et al. (2005) Genome sequencing in microfabricated high-
density picolitre reactors. Nature 437: 376–380. Maxwell FJ, Duncan SH, Hold G & Stewart CS (2004) Isolation, growth on prebiotics and
probiotic potential of novel bifidobacteria from pigs. Anaerobe 10: 33–39. McGarr SE, Ridlon JM & Hylemon PB (2005) Diet, anaerobic bacterial metabolism, and colon
cancer: a review of the literature. J Clin Gastroenterol 39: 98–109. McKenna P, Hoffmann C, Minkah N, Aye PP, Lackner A, Liu Z, Lozupone CA, Hamady M,
Knight R & Bushman FD (2008) The macaque gut microbiome in health, lentiviral infection, and chronic enterocolitis. PLoS Pathog 4: e20.
McLellan E & Bird RP (1991) Effect of disulfiram on 1,2-dimethylhydrazine- and
azoxymethane-induced aberrant crypt foci. Carcinogenesis 12: 969–972. Moore WE & Moore LH (1995) Intestinal floras of populations that have a high risk of colon
cancer. Appl Environ Microb 61: 3202–3207. Mortensen PB & Clausen MR (1996) Short-chain fatty acids in the human colon: relation to
gastrointestinal health and disease. Scand J Gastroentero 216 (suppl): 132–148.
Muyzer G, de Waal EC & Uitterlinden AG (1993) Profiling of complex microbial populations by denaturing gradient gel electrophoresis analysis of polymerase chain reactionamplified genes coding for 16S rRNA. Appl Environ Microb 59: 695–700.
Nicholson JK, Holmes E & Wilson ID (2005) Gut microorganisms, mammalian metabolism and
personalized health care. Nat Rev Microbiol 3: 431–438. Onoue M, Kado S, Sakaitani Y, Uchida K & Morotomi M (1997) Specific species of intestinal
bacteria influence the induction of aberrant crypt foci by 1,2-dimethylhydrazine in rats. Cancer Lett 113: 179–186.
Osten DW (1988) Selection of optimal regression models via cross-validation. J Chemometr 2:
39–48. Pérez-Enciso M & Tenenhaus M (2003) Prediction of clinical outcome with microarray data: a
partial least squares discriminant analysis (PLS-DA) approach. Hum Genet 112: 581–592.
Pozharisski KM, Kapustin YM, Likhachev AJ & Shaposhnikov JD (1975) The mechanism of
carcinogenic action of 1,2-dimethylhydrazine (SDMH) in rats. Int J Cancer 15: 673–683. Pozharisskiǐ KM, Shaposhnikov IAD, Petrov AS & Likhachev ALA (1976) Distribution and
mechanism of the carcinogenic action of 1,2-dimethylhydrazine in rats. Vop Onkol 22: 48–53.
Pretlow TP, Barrow BJ, Ashton WS, O’Riordan MA, Pretlow TG, Jurcisek JA & Stellato TA
(1991) Aberrant crypts: putative preneoplastic foci in human colonic mucosa. Cancer Res 51: 1564–1567.
Pryde SE, Duncan SH, Hold GL, Stewart CS & Flint HJ (2002) The microbiology of butyrate
formation in the human colon. FEMS Microbiol Lett 217: 133–139. Schloss PD & Handelsman J (2005) Introducing DOTUR, a computer program for defining
operational taxonomic units and estimating species richness. Appl Environ Microb 71: 1501–1506.
Smith TK, Mithen R & Johnson IT (2003) Effects of Brassica vegetable juice on the induction of
apoptosis and aberrant crypt foci in rat colonic mucosal crypts in vivo. Carcinogenesis 24: 491–495.
Sogin ML, Morrison HG, Huber JA, Mark Welch D, Huse SM, Neal PR, Arrieta JM & Herndl
GJ (2006) Microbial diversity in the deep sea and the underexplored ‘rare biosphere’. P Natl Acad Sci USA 103: 12115–12120.
Thompson JR, Marcelino LA & Polz MF (2002) Heteroduplexes in mixed-template amplifications: formation, consequence and elimination by ‘reconditioning PCR’. Nucleic Acids Res 30: 2083–2088.
Turnbaugh PJ, Bäckhed F, Fulton L & Gordon JI (2008) Dietinduced obesity is linked to marked
but reversible alterations in the mouse distal gut microbiome. Cell Host Microbe 3: 213–223.
Wang C, Kong H, Guan Y, Yang J, Gu J, Yang S & Xu G (2005) Plasma phospholipid metabolic
profiling and biomarkers of type 2 diabetes mellitus based on high-performance liquid chromatography/electrospray mass spectrometry and multivariate statistical analysis. Anal Chem 77: 4108–4116.
Wang RF, Cao WW & Cerniglia CE (1997) PCR detection of Ruminococcus spp. in human and
animal faecal samples. Mol Cell Probe 11: 259–265. Westad F & Martens H (2000) Variable selection in near infrared spectroscopy based on
significance testing in partial least squares regression. J Near Infrared Spec 8: 117–124. Wold S, Martens H &Wold H (1983) The multivariate calibration problem in chemistry solved
by the PLS method. Matrix pencils. Lecture Notes in Mathematics, Vol. 973 (Ruhe A & Kågström B, eds), pp. 286–293. Springer, Heidelberg.
Wollowski I, Rechkemmer G & Pool-Zobel BL (2001) Protective role of probiotics and
prebiotics in colon cancer. Am J Clin Nutr 73 (suppl 2): 451S–455S. Zhang C, Zhang M,Wang S et al. (2010) Interactions between gut microbiota, host genetics and
diet relevant to development of metabolic syndromes in mice. ISME J 4: 232–241. Zhang M, Zhang M, Zhang C, Du H,Wei G, Pang X, Zhou H, Liu B & Zhao L (2009) Pattern
extraction of structural responses of gut microbiota to rotavirus infection via multivariate statistical analysis of clone library data. FEMS Microbiol Ecol 70: 21–29.
Zoetendal EG, vonWright A, Vilpponen-Salmela T, Ben-Amor K, Akkermans AD & de Vos
WM (2002) Mucosa-associated bacteria in the human gastrointestinal tract are uniformly distributed along the colon and differ from the community recovered from feces. Appl Environ Microb 68: 3401–3407.


