Embed Size (px)
Citation preview

research papers
Acta Cryst. (2006). D62, 1413–1421 doi:10.1107/S0907444906035712 1413
Acta Crystallographica Section D
BiologicalCrystallography
ISSN 0907-4449
Structural studies on peanut lectin complexed withdisaccharides involving different linkages: furtherinsights into the structure and interactions of thelectin
S. Kundhavai Natchiar,a
O. Srinivas,b Nivedita Mitra,a
A. Surolia,a N. Jayaramanb and
M. Vijayana*
aMolecular Biophysics Unit, Indian Institute of
Science, Bangalore 560012, India, andbDepartment of Organic Chemistry, Indian
Institute of Science, Bangalore 560012, India
Correspondence e-mail: [email protected]
# 2006 International Union of Crystallography
Printed in Denmark – all rights reserved
Crystal structures of peanut lectin complexed with Gal�1-
3Gal, methyl-T-antigen, Gal�1-6GalNAc, Gal�1-3Gal and
Gal�1-6Glc and that of a crystal grown in the presence of
Gal�1-3Gal�1-4Gal have been determined using data
collected at 100 K. The use of water bridges as a strategy for
generating carbohydrate specificity was previously deduced
from the complexes of the lectin with lactose (Gal�1-4Glc)
and T-antigen (Gal�1-3GalNAc). This has been confirmed by
the analysis of the complexes with Gal�1-3Gal and methyl-T-
antigen (Gal�1-3GalNAc-�-OMe). A detailed analysis of
lectin–sugar interactions in the complexes shows that they are
more extensive when the �-anomer is involved in the linkage.
As expected, the second sugar residue is ill-defined when the
linkage is 1!6. There are more than two dozen water
molecules which occur in the hydration shells of all structures
determined at resolutions better than 2.5 A. Most of them are
involved in stabilizing the structure, particularly loops. Water
molecules involved in lectin–sugar interactions are also
substantially conserved. The lectin molecule is fairly rigid
and does not appear to be affected by changes in temperature.
Received 27 June 2006
Accepted 4 September 2006
PDB References: peanut
lectin, Gal�1-3Gal complex,
2dv9, r2dv9sf; methyl-T-
antigen complex, 2dva,
r2dvasf; Gal�1-6GalNAc
complex, 2dvb, r2dvbsf;
Gal�1-3Gal complex, 2dvd,
r2dvdsf; Gal�1-6Glc
complex, 2dvg, r2dvgsf;
crystals grown in the presence
of Gal�1-3Gal�1-4Gal, 2dvf,
r2dvfsf.
1. Introduction
Lectins, which specifically bind various carbohydrates, are
found in plants, animals, bacteria and viruses (Bettler et al.,
2006; Lis & Sharon, 1998; Loris et al., 1998; Vijayan &
Chandra, 1999). Peanut lectin is among the most thoroughly
studied plant lectins. It was the first tetrameric protein to be
shown to have an open quaternary structure without fourfold
or 222 symmetry (Banerjee et al., 1994). The structure deter-
mination of peanut lectin indicated that the variability in the
quaternary association of legume lectins (Delbaere et al., 1990,
1993; Shaanan et al., 1991) is caused by factors intrinsic to the
protein. It also led to the demonstration that legume lectins
are a family of proteins in which small alterations in essentially
the same tertiary structure lead to widely different quaternary
structures (Dessen et al., 1995; Hamelryck et al., 1996; Olsen et
al., 1997; Prabu et al., 1998, 1999; Chandra et al., 2001). The
sugar binding of peanut lectin has been characterized through
the X-ray analysis of several lectin–carbohydrate complexes
(Banerjee et al., 1996; Ravishankar et al., 1997, 1998, 1999;
Natchiar et al., 2006). In particular, it has been shown that the
substantially higher affinity of the lectin for the tumour-
associated T-antigen disaccharide Gal�1-3GalNAc compared
with that for lactose is caused by additional water bridges,
thereby establishing the use of water bridges as a strategy for
generating ligand specificity (Ravishankar et al., 1997).
Furthermore, through a comparative study of the structures of
peanut lectin crystals grown at different pH values, using

different buffers and in the presence of different additives, the
invariant and variable regions of the lectin molecule have
been delineated (Natchiar et al., 2004).
Although the investigations referred to above have
provided a wealth of information, further work is required to
complete and fill in the gaps in our understanding of the
structure and interactions of peanut lectin. The role of addi-
tional water bridges involving the acetamido group in
substantially enhancing the affinity of T-antigen for the lectin
was elucidated on the basis of a comparison of its complex
with peanut lectin and a complex involving lactose. Ideally, the
comparison should have been with a complex involving
Gal�1-3Gal which differs from T-antigen only in the absence
of the acetamido group. The role of the water bridge as a
strategy for generating carbohydrate specificity was deduced
from one structure determination (Ravishankar et al., 1997). It
is desirable to confirm it from at least one more structure
determination, perhaps of a complex involving a derivative of
T-antigen. It turns out that peanut lectin complexes of only
disaccharides involving �1!3 and �1!4 linkages have been
analyzed so far. It is of interest to examine the effect of the
more flexible 1!6 linkage on complex formation. The
complexation of �-linked disaccharides to the lectin is also yet
to be examined. In view of all these reasons, the
crystal structures of peanut lectin in complex with
Gal�1-3Gal, Gal�1-3GalNAc-�-OMe (methyl-T-antigen),
Gal�1-6GalNAc, Gal�1-3Gal and Gal�1-6Glc have been
determined. Also analyzed is the crystal of an uncomplexed
lectin grown in the presence of a trisaccharide. All these
structures have been determined at low temperature, while
those reported earlier were determined at room temperature.
A comparison of the two sets of structures would serve to
elucidate the temperature-dependent changes, if any, in the
structure and the interactions of peanut lectin. The structures
determined at low temperature are also expected to provide
an improved picture of hydration.
2. Materials and methods
2.1. Materials
The protein was isolated and purified using affinity chro-
matography as described previously (Majumdar & Surolia,
1978). Methyl-T-antigen synthesized earlier in our laboratory
(Mahanta et al., 1992) was used. All other sugars used in the
investigation except Gal�1-3Gal were obtained commercially
from Dextra Laboratories Ltd. Gal�1-3Gal was synthesized
using the procedure described below.
2.1.1. Synthesis of b-D-galactopyranosyl-(1!3)-b-D-galacto-pyranose. To a stirred suspension of benzyl 2,6-di-O-benzoyl-
�-d-galactopyranoside (Lin & Roy, 2001; 0.200 g, 0.418 mM),
Hg(CN)2 (0.105 g, 418 mM), HgBr2 (0.075 g, 0.209 mM) and
molecular sieves (4 A) in CH2Cl2 (15 ml), a solution of
benzobromogalactose (0.271 g, 0.411 mM) in CH2Cl2 (2 ml)
was added dropwise over a period of 10 min. The mixture was
stirred for 12 h until TLC analysis (3:2 petroleum ether:
EtOAc) showed complete disappearance of the sugar
bromide. The mixture was filtered through celite, washed with
CH2Cl2 and the combined organic layer was treated with
aqueous Na2S2O4 (10%; 2 � 20 ml) and H2O (2 � 20 ml). The
CH2Cl2 layer was then dried (Na2SO4), filtered, concentrated
in vacuo and purification of the crude residue (SiO2; 7:3
petroleum ether:EtOAc) afforded benzyl 2,3,4,6-tetra-O-
benzoyl-�-d-galactopyranosyl-(1!3)-2,6-di-O-benzoyl-�-d-
galactopyranoside (0.317 g, 73%) as a colourless viscous syrup.
TLC: Rf 0.65 (7:3 petroleum ether:EtOAc). [�]d
+ 52.00� (c 1.0,
CHCl3). 1H NMR (300 MHz, CDCl3): � 8.09–8.00 (band, 6H),
7.69–7.02 (band, 29H), 5.93 (d, 1H, J = 3.0 Hz), 5.77 (dd, 1H,
J = 8.1, 10.5 Hz), 5.58 (dd, 1H, J = 8.1, 9.6 Hz), 5.48 (dd, 1H,
J = 3.6, 10.8 Hz), 4.95 (d, 1H, J = 8.1 Hz), 4.76 (d, 1H,
J = 12.3 Hz), 4.65–4.41 (band, 6H), 4.33 (t, 1H, J = 5.7 Hz), 4.24
(app. s, 1H), 3.92 (dd, 1H, J = 3.3, 9.9 Hz), 3.76 (app. t, 1H),
3.11 (s, 1H). 13C NMR (75 MHz, CDCl3): � 166.2, 165.9, 165.6,
165.4, 164.7, 164.6, 136.7, 133.8, 133.5, 133.3, 133.2, 132.8, 132.7,
130.0–128.0, 127.9, 127.6, 101.7, 98.7, 81.2, 72.0, 71.8, 71.3, 70.5,
69.4, 69.2, 68.4, 67.8, 63.7, 62.1. ESI–MS: calculated for
C61H52O17, m/z = 1079.3102 [M + Na]+; found, 1079.3510
[M + Na]+.
A suspension of benzyl 2,3,4,6-tetra-O-benzoyl-�-d-galac-
topyranosyl-(1!3)-2,6-di-O-benzoyl-�-d-galactopyranoside
(0.071 g, 0.067 mM) in MeOH was mixed with NaOMe–
MeOH (0.5 M, 0.3 ml) and left stirring for 12 h; it was then
neutralized with Amberlite IR-120 resin (H+ form), filtered
and the filtrate concentrated in vacuo. The resulting solid was
titrated with diethyl ether and dried thoroughly to afford a
white solid. A suspension of this solid in MeOH (20 ml) and
Pd/C (10%; 0.015 g) was subjected to hydrogenolysis for 12 h.
Filtration and removal of the solvent in vacuo afforded �-d-
galactopyranosyl-(1!3)-�-d-galactopyranose (0.037 g, 80%)
as a white powder. 1H NMR [300 MHz, D2O]: � 5.09 (d, 1H,
J = 3.3 Hz), 4.52 (d, 1H, J = 6.9 Hz), 4.45–4.39 (m, 2H), 4.07–
3.35 (band, 10H). 13C NMR (75 MHz, D2O): � 105.1, 96.9, 83.2,
75.8, 75.7, 75.5, 73.2, 71.8, 71.7, 69.3, 69.2, 68.1, 61.7.
2.2. Crystallization
A solution of 6.3 mg ml�1 protein and a 10–15-fold molar
excess of the appropriate sugar in 0.025 M sodium cacodylate
buffer pH 6.5 containing 7.5% PEG 8000 and 0.5 M ammo-
nium sulfate was used for crystallization using the hanging-
drop method. 0.1 M cacodylate buffer pH 6.5 containing 30%
PEG 8000 and 2 M ammonium sulfate was used as the preci-
pitant. Crystals suitable for X-ray diffraction appeared within
a week.
2.3. Data collection
X-ray data were collected at 100 K using a MAR Research
MAR 300 image plate mounted on a Rigaku RU-200
generator and a MAR 345 detector mounted on an UltraX18
X-ray generator. All the crystals belonged to the same space
group and had similar unit-cell parameters to the previously
studied orthorhombic crystals of the PNA–sugar complexes at
neutral pH (Banerjee et al., 1996; Ravishankar et al., 1997,
1998, 1999). A solution of 40% PEG 400 in the mother liquor
research papers
1414 Natchiar et al. � Peanut lectin Acta Cryst. (2006). D62, 1413–1421

employed for crystallization was used as cryoprotectant. The
soaking time before freezing was optimized at 12–15 h for
good diffraction quality. The frozen crystals often exhibited
high mosaicity. An oscillation range varying between 1 and
2.5� per frame was used depending upon the mosaicity. The
crystal-to-detector distance was varied between 155 and
205 mm. The data were processed using DENZO and scaled
using SCALEPACK from the HKL program suite (Otwi-
nowski, 1993). The collected data were truncated using
TRUNCATE from the CCP4 program suite (Collaborative
Computational Project Number 4, 1994). Data-collection
statistics are given in Table 1.
2.4. Structure solution and refinement
As indicated earlier, the unit-cell parameters and space
group of the crystals were similar to those reported earlier for
other PNA–sugar complexes (Banerjee et al., 1996; Natchiar et
al., 2004). However, the unit-cell parameters had shrunk
slightly on account of cooling. All the same, the molecular-
replacement program AMoRe (Navaza, 1994) yielded solu-
tions uneventfully. All the structures were refined in a similar
manner using CNS (Brunger et al., 1998). The ‘mlf’ target was
used throughout. Model building was carried out using
FRODO (Jones, 1978). 2Fo � Fc and difference Fourier maps
were carefully examined for electron density corresponding to
the sugar when R was in the range 24.1–28.9% (Rfree = 26.6–
30.0%). The coordinates of sugar molecules, where present,
were added in further calculations. The coordinates of sugar
atoms in Gal�1-3Gal, methyl-T-antigen and Gal�1-6Glc were
constructed using the appropriate lectin–sugar complexes
analyzed in our laboratory (PDB code 2tep, Ravishankar et al.,
1997; PDB codes 1ugx, 1ugy, Jeyaprakash et al., 2003). The
program SWEET (Bohne et al., 1998, 1999) was used to obtain
the coordinates of the other sugars. In subsequent cycles of
refinement, water O atoms were placed at locations where the
electron density was greater than 3� in Fo � Fc maps and
greater than 1� in 2Fo � Fc maps. The limits were reduced to
research papers
Acta Cryst. (2006). D62, 1413–1421 Natchiar et al. � Peanut lectin 1415
Table 1Data-collection statistics.
Values in parentheses refer to the last resolution shell.
Gal�1-3Gal Methyl-T-antigen Gal�1-6GalNAc Gal�1-3Gal Gal�1-3Gal�1-4Gal Gal�1-6Glc
Space group P21212 P21212 P21212 P21212 P21212 P21212Unit-cell parameters
a (A) 127.77 126.59 125.74 126.44 125.81 126.19b (A) 124.91 124.62 124.33 124.64 124.06 124.66c (A) 76.28 75.78 75.50 75.69 75.40 75.74
Resolution range (A) 20.0–2.48 (2.57–2.48) 20.0–2.20 (2.28–2.20) 20.0–2.25 (2.33–2.25) 20.0–2.25 (2.33–2.25) 20.0–2.74 (2.84–2.74) 20.0–2.78 (2.88–2.78)No. of observations 244927 (23090) 512657 (49985) 362290 (33934) 555424 (50909) 146967 (13704) 154203 (15299)No. of unique reflections 43062 (4298) 60730 (6059) 55769 (5510) 55690 (5368) 31035 (1530) 29220 (2865)Reflections with I � 0 2207 (519) 2041 (512) 1307 (312) 1332 (336) 1530 (337) 1455 (356)Completeness (%) 98.0 (99.6) 98.8 (99.8) 98.2 (98.5) 97.0 (95.0) 98.1 (98.6) 95.2 (95.1)Rmerge (%) 14.7 (49.6) 9.2 (49.4) 9.3 (34.0) 10.5 (44.3) 14.2 (48.3) 16.7 (49.8)Multiplicity 5.7 (5.4) 8.4 (8.2) 6.5 (6.2) 10.0 (9.5) 4.7 (4.5) 5.3 (5.3)
Table 2Refinement statistics.
Gal�1-3Gal Methyl-T-antigen Gal�1-6GalNAc Gal�1-3Gal Gal�1-3Gal�1-4Gal Gal�1-6Glc
No. of protein atoms 6951 6920 6934 6953 6910 6932No. of sugar atoms 92 108 62 92 — 59No. of solvent atoms 798 1009 985 1043 448 466No. of ions
Calcium 4 4 4 4 4 4Manganese 4 4 4 4 4 4Sulfate 2 2 4 4 4 2
R factor (%) 20.4 19.7 21.4 18.4 20.0 19.8Rfree (%) 25.7 25.0 26.6 23.2 26.3 27.4No. of reflections used 40925 57687 52944 52914 29489 28594Average B value (A2)
Protein atoms 34 36 33 33 39 33Sugar atoms 57 40 43 45 — 46
R.m.s. deviations from ideal valuesBond lengths (A) 0.006 0.006 0.006 0.006 0.006 0.006Bond angles (�) 1.4 1.4 1.4 1.4 1.3 1.4Dihedral angles (�) 27.1 27.3 27.2 27.3 27.4 25.9Improper angles (�) 0.78 0.75 0.77 0.75 0.76 1.89
Ramachandran plot statisticsMost favoured region (%) 87.5 90.6 89.2 90.0 89.0 84.2Additionally allowed region (%) 12.3 9.4 10.7 10.0 10.8 15.8Generously allowed region (%) 0.3 0.0 0.1 0.0 0.1 0.0Disallowed region (%) 0.0 0.0 0.0 0.0 0.0 0.0

2.5� and 0.8�, respectively, in later cycles. A sulfate ion could
also be located in 18 of the 24 subunits in the six structures. R
and Rfree were carefully monitored during the addition of
water O atoms. In each case, no further atoms were added
once Rfree stopped decreasing. NCS restraints were used in the
initial stages of refinement. The restraints were gradually
decreased and were abandoned altogether in the final cycles of
refinement. The refinement statistics are given in Table 2. The
hydrogen bonds were delineated using CONTACT from the
CCP4 program suite. Superpositions were carried out using
ALIGN (Cohen, 1997). Figures were prepared using PyMOL
(DeLano, 2005) and MOLSCRIPT (Kraulis, 1991). Average B
factors were calculated using the web-based program PDB
GOODIES (Hussain et al., 2002).
3. Results and discussion
3.1. General features
PNA is a homotetrameric protein (Fig. 1) with a subunit
made up of 236 residues. Except for the five C-terminal resi-
dues, the polypeptide chain is defined in all the structures
reported here. Residue 232 is also defined in most of the
structures. Except for a handful of atoms, all the side chains
are also clearly defined in all the structures. Each subunit has
the well known legume-lectin fold and consists of a flat six-
stranded back �-sheet, a curved seven-stranded front �-sheet
research papers
1416 Natchiar et al. � Peanut lectin Acta Cryst. (2006). D62, 1413–1421
Figure 2A PNA monomer with invariant water molecules and the two metal ions.See text for details.
Figure 1Structure of PNA with bound Gal�1-3Gal in van der Waals representa-tion. The four subunits are indicated by A, B, C and D. Magenta and cyanballs represent Mn and Ca ions, respectively, in this and in subsequentfigures.
Table 3Direct protein–sugar interactions.
The distances (A) are averaged over all subunits. In Gal�1-3Gal, Tyr125 OH interacts with Gal O20.
Protein atom Sugar atom Gal�1-3Gal Methyl-T-antigen Gal�1-6GalNAc Gal�1-3Gal Gal�1-6Glc
Asp83 OD1 GalO3 2.72 2.58 2.66 2.56 2.90Gly104 N GalO3 3.02 3.09 2.92 3.02 3.09Asn127 ND1 GalO3 2.94 2.90 2.94 3.05 3.16Asp83 OD2 GalO4 2.75 2.64 2.73 2.74 2.92Ser211 OG GalO4 2.67 2.69 2.57 2.66 2.69Ser211 OG GalO5 3.09 2.94 3.38 3.14 3.59Asp80 OD2 GalO6 3.07 3.09 3.07 2.85 3.28Ser211 OG GalO40 3.47 3.20 — — —Leu212 N GalO40 3.43 3.19 — - —Gly213 N GalO40 2.74 2.72 — — —
and a small five-stranded top �-sheet, interconnected by loops
of varying length (Banerjee et al., 1996; Fig. 2). The main
hydrophobic core of the subunits is between the two major
sheets. A secondary hydrophobic core exists between the
concave surface of the curved �-sheet and the loops
protruding from both ends of this sheet. The back �-sheet is
primarily involved in oligomerization. The sugar-binding site
is made up of four loops located on the top of the curved
�-sheet. As in other legume lectins, a calcium ion and a
manganese ion are involved in orienting interacting groups
appropriately for sugar binding. The tetrameric molecule
(Fig. 1) has an unusual open quaternary structure devoid of
fourfold or 222 symmetry.
Of the six structures reported here, that grown in the
presence of Gal�1-3Gal�1-4Gal did not have any density in
the sugar-binding sites. This is the only structure of PNA in
which all the binding sites are completely empty. However, the
sugar has had some influence on crystallization. No ortho-
rhombic crystals had previously been grown except in the
presence of sugar in the medium. In all other cases, the crystals
contained bound sugar. For reasons which are not apparent,
Gal�1-3Gal�1-4Gal does not bind to the protein in a coherent
manner. However, it facilitates the growth of PNA crystals. All
four subunits in all of the remaining structures have bound
sugars at the combining sites.
3.2. Lectin–sugar interactions
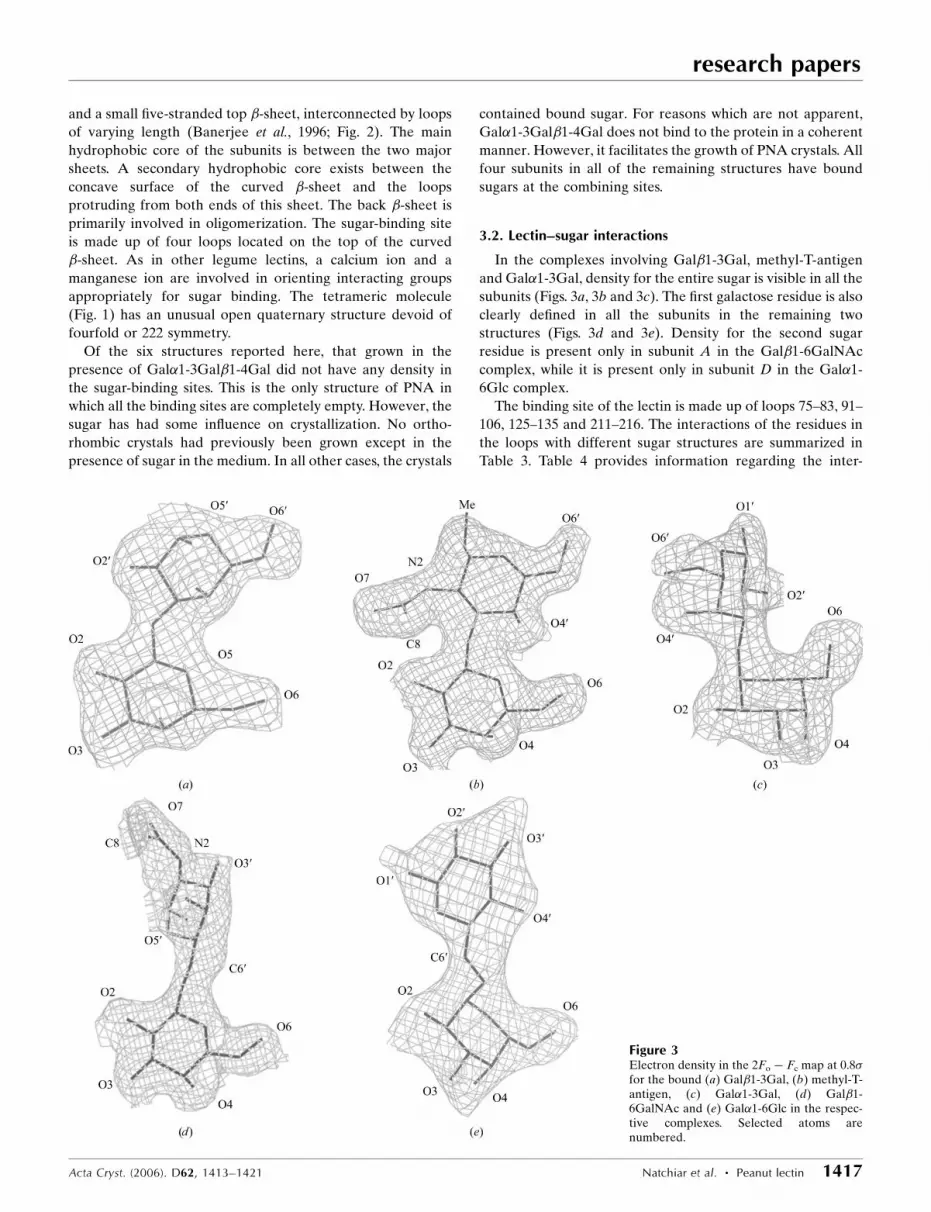
In the complexes involving Gal�1-3Gal, methyl-T-antigen
and Gal�1-3Gal, density for the entire sugar is visible in all the
subunits (Figs. 3a, 3b and 3c). The first galactose residue is also
clearly defined in all the subunits in the remaining two
structures (Figs. 3d and 3e). Density for the second sugar
residue is present only in subunit A in the Gal�1-6GalNAc
complex, while it is present only in subunit D in the Gal�1-
6Glc complex.
The binding site of the lectin is made up of loops 75–83, 91–
106, 125–135 and 211–216. The interactions of the residues in
the loops with different sugar structures are summarized in
Table 3. Table 4 provides information regarding the inter-
research papers
Acta Cryst. (2006). D62, 1413–1421 Natchiar et al. � Peanut lectin 1417
Figure 3Electron density in the 2Fo � Fc map at 0.8�for the bound (a) Gal�1-3Gal, (b) methyl-T-antigen, (c) Gal�1-3Gal, (d) Gal�1-6GalNAc and (e) Gal�1-6Glc in the respec-tive complexes. Selected atoms arenumbered.

actions of water molecules in the binding site. Lectin–sugar
interactions in two representative structures are illustrated in
Fig. 4. The four hydrogen bonds found in all complexes of
legume lectins (Sharma & Surolia, 1997) are observed in the
complexes reported here. All of them involve the first sugar
residue. As in other complexes involving galactose-specific
lectins, the side chain of Tyr125 stacks against the galactose
ring. The additional interactions involving the first sugar
residue found in the present structures are the same as those
observed in the PNA–sugar complexes reported previously
(Banerjee et al., 1996; Ravishankar et al., 1997, 1998, 1999).
The same is true in relation to the second sugar residue in
complexes with sugars involving the �1!3 linkage. When the
linkage is 1!6 or if it involves the �-anomer, direct inter-
actions of the lectin with the second sugar residue are almost
absent. The only exception is the Tyr125 OH� � �Gal O20
hydrogen bond observed in two subunits in the Gal�1-3Gal
complex. As in other PNA–sugar complexes, the sugar
hydroxyls of the first sugar residue are linked to Gly104 N and
Glu129 OE1/OE2 by water bridges (Table 4). In the methyl-T-
antigen complex, additional bridges invol-
ving two water molecules between the O
atom of the acetamido group and protein
atoms exist exactly as in the T-antigen
complex reported earlier (Ravishankar et
al., 1997).
The lectin–sugar interactions in the
methyl-T-antigen complex are almost iden-
tical to those observed earlier in the corre-
sponding T-antigen complex. The same is
true in relation to the Gal�1-3Gal complex
and the previously reported PNA complex
of lactose (Gal�1-4Glc). In view of the
difference in the linkage of the two disac-
charides, it was previously assumed that O40
of the second ring in Gal�1-3Gal (also T-
antigen) could occupy the same position as
O30 of the second sugar residue of lactose.
This formed the basis of a direct comparison
between the lactose and the T-antigen
complexes and the conclusion that the direct
lectin–sugar interactions are the same in
them. The structure of the Gal�1-3Gal
complex reported here confirms the
assumption. When the structures are super-
posed, the distance between O40 in the
Gal�1-3Gal complex and O30 in the
previously reported lectin–lactose complex
only varies between 0.59 and 1.03 A in the
research papers
1418 Natchiar et al. � Peanut lectin Acta Cryst. (2006). D62, 1413–1421
Table 4Occurrence of water molecules at the sugar-binding site.
The maximum possible number in each case is four, corresponding to the four subunits.
Water Interacting atoms Gal�1-3Gal Methyl-T-antigen Gal�1-6GalNAc Gal�1-3Gal Gal�1-3Gal�1-4Gal Gal�1-6Glc
W1 Glu129 OE1/OE2,Asn127 ND2
GalO2 2 4 4 3 3 1
W2 Gly104 N GalO2/O3 4 4 3 4 3 2W3 Ile101 O, Gly103 N GalNAcO7 2 4 4 4 3 3W4 Asn41 ND2 GalNAcO7 4 4 4 4 1 3W4 Leu212 N GalNAcO7 4 4 4 4 3 1W5 Tyr130 OH,
Glu129 OE1W2 3 4 4 3 2 1
W6 W4 W9 2 4 3 2 — —W7 W3 W4 3 — 3 2 — —W8† Ser211 OG, Gly213 N,
Leu212 NGlycosidic O,
GalO5— — 4 4 3 2
W9 W6 — 2 1 — — —
† In Gal�1-3Gal and methyl-T-antigen, O4 occupies the position of W8.
Figure 4Stereoview of lectin–sugar interactions in (a) the methyl-T-antigen and (b) the Gal�1-3Galcomplexes. Water molecules in the active site are shown as yellow balls.

four subunits. In addition, the O atoms have the same inter-
actions with the lectins. Thus, the work reported here confirms
that the nearly 20-fold enhancement of the affinity of the
lectin for T-antigen compared with that for lactose is essen-
tially caused by the water bridges involving W3 and W4, which
are the only additional interactions present in the T-antigen
and the methyl-T-antigen complexes. Thus, PNA indeed
employs water bridges as a strategy for generating carbohy-
drate specificity.
The structure of the Gal�1-3Gal complex is almost as well
defined as that of the methyl-T-antigen complex and has been
determined to a better resolution than the Gal�1-3Gal
complex. In this complex also, the sugar is well defined in all
the four subunits, although the second sugar residue points
well into the solvent region. The residue assumes two different
conformations generated by a rotation about the O1/O30—C30
bond in the glycosidic linkage. As illustrated in Fig. 5, the
orientation of the ring observed in subunits A and B is nearly
perpendicular to that observed in C and D. In the former, the
anomeric O atom is linked through a hydrogen bond to the
hydroxyl group of Tyr125. When the linkage is 1!6, as in
Gal�1-6GalNAc and Gal�1-6Glc, the second sugar residue is
relatively ill-defined. This is to be expected in view of the
higher flexibility of the 1!6 linkage compared with the other
possible linkages. In both cases, the second sugar residue
points into the solvent. In each case, it is seen only in one of
the four subunits. All these observations appear to suggest
that PNA prefers �-linked disaccharides to �-linked disac-
charides. Furthermore, in both cases there is a lower prefer-
ence for 1!6 linkages.
3.3. Hydration
The hydration of peanut lectin has been discussed
previously using structures determined at room temperature
(Natchiar et al., 2004). Water molecules in the structures
determined at 100 K and reported here are expected to be
better defined than those in crystals investigated at room
temperature. Admittedly, water positions derived from
medium-resolution data need to be treated with extreme
caution. Therefore, only structures analyzed at a resolution
better than 2.5 A have been used in the analysis here.
Furthermore, the conclusions are based on the best defined
water molecules which occur in all the structures examined.
As in the previous work on protein hydration reported from
this laboratory (Madhusudan & Vijayan, 1991; Radha Kishan
et al., 1995; Sadasivan et al., 1998; Biswal et al., 2000), a water
molecule at a distance of 3.6 A or less from a protein N or O
atom of a subunit was considered to be part of its hydration
shell. When two subunits are superposed along with their
hydration shell, a water molecule in the hydration shell of one
and a water molecule in that of the other are considered to be
equivalent if the two water molecules have at least one
common interaction with the same protein atom and if the two
are within 1.8 A of each other on superposition. The above
criterion led to the identification of 27 invariant water mole-
cules in the 16 subunits considered (Fig. 2). The ten invariant
water molecules derived from a previous
study involving room-temperature struc-
tures form a subset of these 27. Four of these
(CW1–CW4) are involved in coordination
to the calcium and manganese ions. These
four and a water molecule which is involved
in the 142–148 �-bulge (CW5) and another
found in a hairpin bend (CW6) were
previously found to be invariant in all
legume lectin structures available at that
time (Loris et al., 1994). As reported earlier
(Natchiar et al., 2004), one of the remaining
four (CW7) interconnects strands 162–168
and 173–179 in the back �-sheet, while the
other three (CW8–CW10) are involved in
research papers
Acta Cryst. (2006). D62, 1413–1421 Natchiar et al. � Peanut lectin 1419
Figure 6Stereoview of water bridges involving invariant water molecules in the metal- and sugar-binding region.
Figure 5Superposition of the two different conformations of the bound Gal�1-3Gal in subunit A (blue) and subunit C (raspberry).

stabilizing a local feature made up of four separate stretches of
polypeptide chain (see Fig. 3 in Natchiar et al., 2004).
Of the 17 additional invariant water molecules identified on
the basis of the low-temperature structures, as many as five
(CW11, CW12, CW13, CW14 and CW15) are involved in
stabilizing the carbohydrate-binding loops along with the four
which coordinate to the metal ions (Fig. 6). Another invariant
water molecule CW16 connects the long 50–63 loop to the
C-terminal region by forming a water bridge between Val62 O
and Ile230 N. Another water molecule (CW17) interacts with
Glu2 OE2 and Arg53 N, thus serving as a bridge between the
loop and the N-terminus. CW18 interconnects two strands in
the back �-sheet by interacting with Glu2 O on one and O and
OG of Ser227 on the other. It also provides a link between the
N- and C-terminal regions in addition to bridging a main-chain
atom and a side-chain atom of the same (Ser227) residue.
CW19 is involved in interconnecting adjacent strands in the
small top �-sheets. Another water molecule (CW20) inter-
connects the two main sheets. The same water molecule, along
with another (CW21), forms a double water bridge
(Thr187 O� � �W� � �W� � �Ala189 N/O) between two residues on
the same strand in the �-sheet. CW22 interacts with
Thr150 OG1 in all the subunits. It also interacts with Pro152 N
in 14 of the 16 subunits, thus providing a link between two
residues in the same strand. An interesting arrangement
occurs at the 169–172 bend in the back �-sheet. Here, the side
chain of Asp168 is involved in a specific interaction with
CW23. CW24, in addition to interacting with the Asp side
chain, bridges the peptide N atom and OG of Ser169. CW25
interacts with the peptide N atom of Glu200 in all the subunits.
In many of them, it also interacts with the side-chain
carboxylate of the same residue, thus providing a bridge
between the main chain and the side chain. CW26 and CW27
interact essentially with only one protein atom each, the
former with Val43 O and latter with Ile185 O.
In the carbohydrate-binding region there are two water
molecules (W1 and W2) which bridge the lectin to the Gal
residue at the primary site. W3 and W4 form water bridges
between the lectin and the acetamido group in methyl-
T-antigen. W5 interacts with Glu129 OE1, Tyr130 OH and
W2. These five water molecules are therefore involved in
protein–sugar interactions. (W8 is also involved in protein–
sugar interactions, but only when the linkage is not �1!3.) Of
these, W4 (CW15 in the list of invariant water molecules) is
also involved in stabilizing the carbohydrate-binding region in
all the structures. Each of the remaining four water molecules
occurs at least in 13 of the 16 subunits. They are clearly not
involved in stabilizing the protein structure. Their relative
invariance is perhaps related to functional significance in
terms of protein–sugar interactions.
3.4. Location of the sulfate ion
As mentioned in x2.4, a sulfate ion could be unambiguously
located in association with 18 of the 24 subunits in the six
structures. It occurs at nearly identical location in all 18
subunits. The interactions of the ion associated with one of
them are illustrated in Fig. 7. The most crucial of these
interactions are perhaps those involving Arg53. Interaction
with Ser56 OG also occurs in all18 subunits, while Thr231 O
interacts through a water bridge or directly or both in a
majority of these subunits. Thus, although the sulfate ion is
primarily anchored on the ‘bottom’ loop 49–63 (Fig. 2), it can
also serve to connect the loop to the C-terminal region. The
available evidence does not suggest any biological or crucial
structural role of the sulfate ion.
3.5. Effect of temperature
Previous studies at room temperature on the structure of
PNA complexed with various sugars and using crystals grown
under different environmental conditions indicated the
molecule to be fairly rigid with a substantially preformed
binding site. However, with the availability of the low-
temperature structures reported here, it is appropriate to
explore systematic changes, if any, in the molecular structure
associated with the lowering of the temperature. The differ-
ences among the four subunits within a given tetramer, which
give a measure of the intrinsic flexibility of the subunit, were
used as a framework for exploring these
changes. Differences greater than 1 A in
main-chain atoms and C� atoms when pairs
of subunits in each tetrameric molecule
were superposed were listed in the case of
all the six structures. Such changes predo-
minantly occur in residues 1, 11–16, 38, 37,
57, 58, 76–80, 179–183, 231 and 232. The
room-temperature structure of the PNA–
lactose complex (Banerjee et al., 1996) and
the low-temperature structure of the Gal�1-
3Gal complex are directly comparable.
Subunit A of the former was superposed on
the same subunit of the latter and differ-
ences in main-chain atoms and C� atoms
were looked for. The same calculations were
also carried out in the case of the other three
subunits. The residues in which differences
research papers
1420 Natchiar et al. � Peanut lectin Acta Cryst. (2006). D62, 1413–1421
Figure 7Stereoview of interactions involving the sulfate ion in subunit B of the Gal�1-6GalNAccomplex. The S atom is in yellow. Orange spheres represent water molecules. Interactions inother subunits with which a sulfate ion is associated exhibit minor variations.

greater than 1 A occur almost form a subset of the residues
which showed substantial positional variation among the four
subunits of the same structure. A similar result was obtained
when the room-temperature T-antigen complex (Ravishankar
et al., 1997) and the low-temperature methyl-T-antigen
complex were compared. Thus, no systematic change appears
to occur as a function of temperature in these structures
involving PNA.
The data were collected at the X-ray facility for Structural
Biology supported by the Departments of Science and Tech-
nology (DST), Government of India. Computations were
carried out at the Supercomputer Education Research Center
and the Graphics Facility supported by the Department of
Biotechnology (DBT). Financial support from DST is
acknowledged. MV is supported by DBT through a Distin-
guished Biotechnologist Award.
References
Banerjee, R., Das, K., Ravishankar, R., Suguna, K., Surolia, A. &Vijayan, M. (1996). J. Mol. Biol. 259, 281–296.
Banerjee, R., Mande, S. C., Ganesh, V., Das, K., Dhanaraj, V.,Mahanta, S., Suguna, K., Surolia, A. & Vijayan, M. (1994). Proc.Natl Acad. Sci. USA, 91, 227–231.
Biswal, B. K., Sukumar, N. & Vijayan, M. (2000). Acta Cryst. D56,1110–1119.
Bettler, E., Loris, R. & Imberty, A. (2006). Lectines. http://www.cermav.cnrs.fr/lectines.
Bohne, A., Lang, E. & von der Leith, C. W. (1998). J. Mol. Model. 4,33–43.
Bohne, A., Lang, E. & von der Leith, C. W. (1999). Bioinformatics, 9,767–768.
Brunger, A. T., Adams, P. D. & Rice, L. M. (1998). Curr. Opin. Struct.Biol. 8, 606–611.
Chandra, N. R., Prabu, M. M., Suguna, K. & Vijayan, M. (2001).Protein Eng. 14, 857–866.
Collaborative Computational Project, Number 4 (1994). Acta Cryst.D50, 760–763.
Cohen, G. E. (1997). J. Appl. Cryst. 30, 1160–1161.DeLano, W. L. (2005). Drug Discov. Today, 10, 213–217.Delbaere, L. T. J., Vandonselaar, M., Prasad, L., Quail, J. W., Spohr, U.
& Lemieux, R. U. (1990). Can. J. Chem. 68, 116–121.Delbaere, L. T. J., Vandonselaar, M., Prasad, L., Quail, J. W., Wilson,
K. S. & Dauter, Z. (1993). J. Mol. Biol. 230, 950–965.
Dessen, A., Gupta, D., Sabesan, S., Brwere, C. F. & Sacchettini, J. C.(1995). Biochemistry, 34, 4933–4942.
Hamelryck, T. W., Dao-Thi, M.-H., Poortmans, F., Chrispeels, M. J.,Wyns, L. & Loris, R. (1996). J. Biol. Chem. 271, 20479–20485.
Hussain, A. S. Z., Shanthi, V., Sheik, S. S., Jeyakanthan, J., Selvarani,P. & Sekar, K. (2002). Acta Cryst. D58, 1385–1386.
Jeyaprakash, A. A., Katiyar, S., Swaminathan, K., Sekar, K., Surolia,A. & Vijayan, M. (2003). J. Mol. Biol. 332, 217–228.
Jones, T. A. (1978). J. Appl. Cryst. 11, 268–272.Kraulis, P. J. (1991). J. Appl. Cryst. 24, 946–950.Lin, B. & Roy, R. (2001). Perkin Trans. 1, 773–779.Lis, H. & Sharon, N. (1998). Chem. Rev. 98, 637–674.Loris, R., Hamelryck, T., Bouckaert, J. & Wyns, L. (1998). Biochim.
Biophys. Acta, 1383, 9–36.Loris, R., Stas, P. P. & Wyns, L. (1994). J. Biol. Chem. 269, 26722–
26733.Madhusudan & Vijayan, M. (1991). Curr. Sci. 60, 165–170.Mahanta, S. K., Sanker, S., Rao, N. V., Swamy, M. J. & Surolia, A.
(1992). Biochem. J. 284, 95–101.Majumdar, T. & Surolia, A. (1978). Prep. Biochem. 8,119–131.Natchiar, S. K., Jeyaprakash, A. A., Ramya, T. N. C., Thomas, C. J.,
Suguna, K., Surolia, A. & Vijayan, M. (2004). Acta Cryst. D60,211–219.
Natchiar, S. K., Sirinivas, O., Nivedita, M., Surolia, A., Jayaraman, N.& Vijayan, M. (2006). Curr. Sci. 90, 1230–1237.
Navaza, J. (1994). Acta Cryst. A50, 157–163.Olsen, L. R., Dessen, A., Gupta, D., Sabesan, S., Sacchettini, J. C. &
Brewer, C. F. (1997). Biochemistry, 36, 15073–15080.Otwinowski, Z. (1993). Proceedings of the CCP4 Study Weekend.
Data Collection and Processing, edited by L. Sawyer, N. Isaacs & S.Bailey, pp. 56–62. Warrington: Daresburry Laboratory.
Prabu, M. M., Sankaranarayanan, R., Puri, K. D., Sharma, V., Surolia,A., Vijayan, M. & Suguna, K. (1998). J. Mol. Biol. 276, 787–796.
Prabu, M. M., Suguna, K. & Vijayan, M. (1999). Proteins, 35, 58–69.Radha Kishan, K. V., Chandra, N., Sudarsanakumar, C., Suguna, K. &
Vijayan, M. (1995). Acta Cryst. D51, 703–710.Ravishankar, R., Ravindran, M., Suguna, K., Surolia, A. & Vijayan,
M. (1997). Curr. Sci. 72, 855–861.Ravishankar, R., Suguna, K., Surolia, A. & Vijayan, M. (1999). Acta
Cryst. D55, 1375–1382.Ravishankar, R., Surolia, A., Vijayan, M., Lim, S. & Kishi, Y. (1998).
J. Am. Chem. Soc. 120, 11297–11303.Sadasivan, C., Nagendra, H. G. & Vijayan, M. (1998). Acta Cryst.
D54, 1343–1352.Shaanan, B., Lis, H. & Sharon, N. (1991). Science, 254, 862–866.Sharma, V. & Surolia, A. (1997). J. Mol. Biol. 267, 433–445.Vijayan, M. & Chandra, N. (1999). Curr. Opin. Struct. Biol. 9,
707–714.
research papers
Acta Cryst. (2006). D62, 1413–1421 Natchiar et al. � Peanut lectin 1421


