Embed Size (px)
Citation preview

Structure and dynamics of amorphous carbonates
related to biomineralization
A neutron diffraction study
Max-Planck-Institut für Kolloid- und Grenzflächenforschung
Department of biomaterials
Univ.-Diss.
zur Erlangung des akademischen Grades
"doctor rerum naturalium"
(Dr. rer. nat.)
in der Wissenschaftsdisziplin physikalische Chemie
eingereicht an der
Mathematisch-Naturwissenschaftlichen Fakultät
der Universität Potsdam
von
Anders Christian Solberg Jensen
Potsdam, den 03.01.2018

Published online at the Institutional Repository of the University of Potsdam: URN urn:nbn:de:kobv:517-opus4-421691 https://nbn-resolving.org/urn:nbn:de:kobv:517-opus4-421691
i | P a g e
Table of content
Table of content ....................................................................................................................................... i
Abstract (English)..................................................................................................................................... iii
Abstract (Deutsch) .................................................................................................................................... v
Curriculum Vitae ...................................................................................................................................... vi
Publication list ........................................................................................................................................ vii
Outline ................................................................................................................................................... viii
Abbreviations .......................................................................................................................................... ix
1 General introduction ....................................................................................................................... 1
1.1 Biomineralization .................................................................................................................... 1
1.2 ACC in biomineralization ......................................................................................................... 2
1.3 Structure and stability of synthetic ACC .................................................................................. 3
1.3.1 Structure of ACC .............................................................................................................. 3
1.3.2 Stability of ACC ................................................................................................................ 7
1.4 The role of Mg in ACC and its effect on calcium carbonate formation ................................... 8
1.5 Structural analysis of amorphous materials .......................................................................... 10
1.5.1 The big box approach .................................................................................................... 13
1.6 Open questions on the structure and water dynamic of ACC and ACMC ............................. 14
2 Principles behind methods ............................................................................................................ 16
2.1 The pair distribution function: theory and experiment ........................................................ 16
2.1.1 From diffraction experiment to the pdf ........................................................................ 16
2.1.2 Choice of neutron beamline .......................................................................................... 19
2.2 Empirical potential structural refinement ............................................................................. 20
2.3 Neutron spectroscopy ........................................................................................................... 25
2.3.1 Incoherent inelastic neutron scattering (IINS) .............................................................. 26
2.3.2 Quasi elastic neutron scattering (QENS) ....................................................................... 27
3 Results and discussion ................................................................................................................... 29
3.1 Synthesizing ACC for neutron experiments ........................................................................... 29
3.1.1 Additives and the structural effect they may have on ACC ........................................... 33
3.2 Local structure in amorphous calcium carbonate and the effect of dehydration ................ 35
3.2.1 Sample characterization ................................................................................................ 35
3.2.2 EPSR fitting of amorphous calcium carbonate .............................................................. 36

ii | P a g e
3.2.3 Vibrational spectroscopy of amorphous calcium carbonate......................................... 46
3.2.4 Discussion ...................................................................................................................... 49
3.2.5 Conclusion ..................................................................................................................... 51
3.2.6 Materials and methods ................................................................................................. 52
3.3 The effect of Mg as an additives on the structure of ACC ..................................................... 53
3.3.1 Sample characterization ................................................................................................ 53
3.3.2 EPSR fitting of amorphous magnesium and calcium/magnesium carbonate ............... 55
3.3.3 Vibrational spectroscopy of amorphous calcium carbonate......................................... 73
3.3.4 Discussion ...................................................................................................................... 75
3.3.5 Conclusion ..................................................................................................................... 77
3.3.6 Materials and methods ................................................................................................. 77
3.4 Dynamics of hydrous species in ACC and AMC ..................................................................... 79
3.4.1 Results ........................................................................................................................... 79
3.4.2 Discussion ...................................................................................................................... 82
3.4.3 Conclusion ..................................................................................................................... 83
3.4.4 Materials and methods ................................................................................................. 83
4 Summary and Conclusion .............................................................................................................. 85
5 Outlook .......................................................................................................................................... 89
5.1 Possible for future parametric studies based on neutron diffraction ................................... 89
5.2 Translational diffusion of water in ACC ................................................................................. 90
6 Acknowledgements ....................................................................................................................... 91
7 References ..................................................................................................................................... 92
8 Appendix ...................................................................................................................................... 101

Abstract (English)
iii | P a g e
Abstract (English)
Amorphous calcium carbonate(ACC) is a wide spread biological material found in many
organisms, such as sea Urchins and mollusks, where it serves as either a precursor phase for
the crystalline biominerals or is stabilized and used in the amorphous state. As ACC readily
crystallizes, stabilizers such as anions, cations or macromolecules are often present to avoid or
delay unwanted crystallization. Furthermore, additives often control the properties of the
materials to suit the specific function needed for the organism. E.g. cystoliths in leaves that
scatter light to optimize energy uptake from the sun or calcite/aragonite crystals used in
protective shells in mussels and gastropods. Lifetime of the amorphous phase is controlled by
the kinetic stability against crystallization. This has often been linked to water which plays a
role in the mobility of ions and hence the probability of forming crystalline nuclei to initiate
crystallization. However, it is unclear how the water molecules are incorporated within the
amorphous phase, either as liquid confined in pores, as structural water binding to the ions or
as a mixture of both. It is also unclear how this is perturbed when additives are added,
especially Mg2+
, one the most common additives found in biogenic samples. Mg2+
are
expected to have a strong influence on the water incorporated into ACC, given the high
energy barrier to dehydration of magnesium ions compared to calcium ions in solution.
During the last 10-15 years, there has been a large effort to understand the local environment
of the ions/molecules and how this affects the properties of the amorphous phase. But only a
few aspects of the structure have so far been well-described in literature. The reason for this is
partly caused by the low stability of ACC if exposed to air, where it tends to crystallize within
minutes and by the limited quantities of ACC produced in traditional synthesis routes. A
further obstacle has been the difficulty in modeling the local structure based on experimental
data. To solve the problem of stability and sample size, a few studies have used stabilizers
such as Mg2+
or OH- and severely dehydrated samples so as to stabilize the amorphous state,
allowing for combined neutron and x-ray analysis to be performed. However, so far, a clear
description of the local environments of water present in the structure has not been reported.
In this study we show that ACC can be synthesized without any stabilizing additives in
quantities necessary for neutron measurements and that accurate models can be derived with
the help of empirical-potential structural refinement. These analyses have shown that there is
a wide range of local environments for all of the components in the system suggesting that the
amorphous phase is highly inhomogeneous, without any phase separation between ions and
water. We also showed that the water in ACC is mainly structural and that there is no
confined or liquid-like water present in the system. Analysis of amorphous magnesium
carbonate also showed that there is a large difference in the local structure of the two cations
and that Mg2+
surprisingly interacts with significantly less water molecules then Ca2+
despite
the higher dehydration energy. All in all, this shows that the role of water molecules as a
structural component of ACC, with a strong binding to cat- and anions probably retard or
prevents the crystallization of the amorphous phase.

Abstract (English)
iv | P a g e
Abstract (Deutsch)
v | P a g e
Abstract (Deutsch) Amorphes Calciumcarbonat (ACC) ist ein weit verbreitetes biologisches Material, das in vielen
Organismen zu finden ist, beispielsweise in Seeigeln und Mollusken, wo es als Präkursorphase für
kristalline Biomaterialien dient oder stabilisiert wird und im amorphen Zustand genutzt wird. Da ACC
leicht kristallisiert, sind oft Stabilisatoren wie Anionen, Kationen und Makromoleküle zugegen, die
eine ungewollte Kristallisation verzögern oder verhindern können. Zusätzlich kontrollieren Additive
oftmals die Materialeigenschaften, um spezielle Funktionen erfüllen zu können, die der Organismus
benötigt. Z.B. Zystolithen in Blättern, die das Licht streuen, um die Energieaufnahme durch das
Sonnenlicht zu optimieren oder den Calcit-/Aragonitkristallen, die in den schützenden Schalen von
Muscheln und Schnecken verwendet werden. Die Lebensdauer der amorphen Phase ist kontrolliert
von der kinetischen Stabilität gegenüber der Kristallisation. Dies wurde oft mit Wasser verbunden,
welches eine Rolle spielt für die Mobilität der Ionen und demzufolge für die Wahrscheinlichkeit der
Bildung von Kristallisationskernen, die eine Kristallisation einleiten. Es ist jedoch unklar, wie die
Wassermoleküle in die amorphe Phase integriert sind, ob als Flüssigkeit eingeschlossen in Poren, als
strukturiertes Wasser gebunden an Ionen oder als Mischung aus beidem. Es ist ebenfalls unklar, wie
dies gestört wird durch die Zugabe von Additiven, insbesondere Mg2+
, eines der häufigsten Additive in
biogenen Proben. Von Mg2+
wird ein starker Einfluss auf das in ACC integrierte Wasser vermutet,
vergleicht man die hohe Energiebarriere gegen Dehydration von Magnesiumionen gegenüber
Calciumionen in Lösung.
Im Verlauf der letzten 10-15 Jahre wurden große Anstrengungen unternommen, um die lokale
Umgebung der Ionen/Moleküle zu verstehen und wie diese die Eigenschaften der amorphen Phase
beeinflusst. Jedoch wurden bisher nur wenige Aspekte der Struktur gut in der Literatur beschrieben.
Dies wird zum Teil von der geringen Stabilität von ACC verursacht, wenn es der Luft ausgesetzt wird,
wo es nach wenigen Minuten zur Kristallisation neigt und zum Teil von den begrenzten Mengen an
ACC, welches auf traditionellen Synthesewegen produziert wird. Ein weiteres Hindernis stellte die
Schwierigkeit dar, die lokale Struktur anhand von experimentellen Daten zu modellieren. Um das
Problem der Stabilität und der Probenmenge zu beheben, haben einige Studien Stabilisatoren wie Mg2+
oder
OH- und hochgradig dehydrierte Proben verwendet und dadurch den amorphen Zustand
stabilisiert, welches eine kombinierte Neutronen- und Röntgenanalyse ermöglichte. Dennoch liegt bis
jetzt keine klare Beschreibung der lokalen Umgebung von Wasser in der Struktur vor.
In dieser Arbeit zeigen wir, dass ACC ohne stabilisierende Additive in Mengen hergestellt werden
kann, wie sie für Neutronenmessungen benötigt werden und dass akkurate Modelle durch empirical-
potential structural refinement abgeleitet werden können. Diese Analysen haben gezeigt, dass es eine
große Bandbreite lokaler Umgebungen für alle Systemkomponenten gibt, was zu der Vermutung führt,
dass die amorphe Phase hochgradig imhomogen ist ohne Phasentrennung zwischen Wasser und Ionen.
Wir konnten ebenfalls zeigen, dass das Wasser in ACC hauptsächlich strukturiert ist und dass kein
eingeschlossenes oder flüssigkeitsähnliches Wasser im System vorliegt. Die Analyse von amorphem
Magnesiumcarbonat zeigte ebenfalls, dass es große Unterschiede in den lokalen Strukturen der beiden
Kationen gibt und dass Mg2+
überraschenderweise mit signifikant weniger Wassermolekülen als Ca2+
interagiert, trotz der höheren Dehydrationsenergie. Zusammenfassend zeigt dies, dass die
Wassermoleküle in der Rolle als strukturelle Komponenten von ACC, mit einer starken Bindung zu
Kat- und Anionen wahrscheinlich die Kristallisation der amorphen Phase verzögern oder verhindern.
Curriculum Vitae
vi | P a g e
Curriculum Vitae Anders Christian Solberg Jensen
Email: [email protected]
Orchid id: 0000-0003-2366-6051
Born: 05.10.1988
Education:
July 2007 – general student exam of Horsens Gymnasium (mathematic major) with
chemistry A and Mathematics A. Grade average: 8.6(Danish 13 scale, ECTS grade: C)
September 2009-september 2012: B. Sc. Chem. Kemisk Institut, Aarhus Universitet.
Grade Average: 8.6(Danish 12 scale, ECTS grade: C)
o Bachelors (group of Henrik Birkedal) project grade: 7(Danish 12 scale, ECTS
grade: C)
Title: Transparent aggregates of nanocrystalline hydroxyapatite that
self-assemble under evaporation
September 2012-December 2014: MSc. Chem, Kemisk Institut, Aarhus Universitet:
Grade Average: 11.25 (Danish 12 scale, ECTS grade: A)
o Chemical project (group of Henrik Birkedal) project grade: 12 (Danish 12
scale, ECTS grade: A)
Title: Citrate mediated self-assembly of hydroxyapatite nanoparticles
o Master thesis September 2013-December 2014(group of Henrik Birkedal)
project grade: 12 (Danish 12 scale, ECTS grade: A)
Title: Bio-inspired Crystal Design: Modifying inorganic materials
using polymer additives
January 2015-present: PhD student at Max Planck institute of colloids and interfaces,
Potsdam Germany, Department of Biomaterials( Group of Peter Fratzl)
Summer schools:
Oxford school of Neutron science, September 2015
Niels Bohr international academy workshop on ESS Science, November 2015
Science related work:
Student aid at Aarhus University: October 2013-December 2014
o Teaching high school student in practical and theoretical exercises
Student aid at teknologisk institut: October 2013-September 2014
o Assisting the development of surface coatings for industrial applications
Awards:
Science as Art at iNANO 2014: 3ed
Place
Science Slam, Tag der Wissenshaft Potsdam 2017: 2nd
Place
Excellent Oral presentation at the Fifth Annual Niels Bohr International Academy
Presentations:
Number of articles published: 4published and 3 in prep at the moment of writing
Number of Poster presentations at conferences: 12
Number of Oral presentations: 5

Publication list
vii | P a g e
Publication list Published based on my bachelor thesis:
Transparent aggregates of nanocrystalline hydroxyapatite, Cryst, Growth. Des. 2014,
A.C.S. Jensen, CJS Ibsen, D. Sutherland, H. Birkedal
Published based on my Master thesis:
Calcite nucleation on the surface of PNIPAM–PAAc micelles studied by time resolved in situ
PXRD, Crystengcomm. 2015
A.C.S. Jensen, M. Hinge, H. Birkedal
Morphology-preserving transformation of minerals mediated by a temperature-responsive
polymer membrane: calcite to hydroxyapatite, Crystengcomm. 2016
A.C.S. Jensen, A. Brif, B. Pokroy, M. Hinge, H. Birkedal
Published based on my doctoral thesis:
Calcite nucleation on the surface of PNIPAM–PAAc micelles studied by time resolved in situ
PXRD, Chem. Mater. 2015
Z. Zou, ACS. Jensen, Y. Politi, S. Weiner, L. Addadi, P. Fratzl, WJEM, Habraken
Hydrogen Bonding in Amorphous Calcium Carbonate and Molecular Reorientation Induced
by Dehydration, In review
ACS. Jensen, S. Imberti, S. Parker, E. Schneck, Y. Politi, P. Fratzl, L. Bertinetti, WJEM.
Habraken
Mobility of hydrous species in amorphous calcium/magnesium carbonate, In preparation
ACS. Jensen, I. Rodriguez, Y. Politi, WJEM. Habraken, P. Fratzl, L. Bertinetti
On the structure of amorphous magnesium carbonate and mixed calcium/magnesium
carbonate, In preparation
ACS. Jensen, S. Imberti, I. Rodriguez, Y. Politi, WJEM. Habraken, P. Fratzl, L. Bertinetti

Outline
viii | P a g e
Outline The thesis has been organized into five main chapters covering the following areas:
Chapter 1 General introduction: The first chapter contains a short literature review
covering the known structural information on the amorphous carbonate phases and compares
some of the short coming of previous attempts to describe the structure.
Chapter 2 Principles behind Methods: This chapter covers the underlying principles behind
the EPSR method and both the inelastic and elastic neutron scattering techniques used in this
study.
Chapter 3 Results and discussion: This chapter covers the synthesis and structural analysis
of ACC, ACMC and AMC from pdf analysis and a dynamic analysis based on inelastic
neutron scattering, it also cover the discussion putting the results into context of the current
literature on the subject.
Chapter 4 Summary and conclusion: Here the results are summaries and a concise final
conclusion is given.
Chapter 5 Outlook: This chapter discusses some of the future prospects of structural analysis
of amorphous carbonates using neutron diffraction and the opportunities now available from
the high yield synthesis reported in this work.
Abbreviations
ix | P a g e
Abbreviations
ACC Amorphous calcium carbonate
ACMC Amorphous calcium magnesium carbonate
AMC Amorphous magnesium carbonate
CW constant wavelength
EPSR Empirical potential structural refinement
EXAFS Extended X-ray absorption fine structure
FTIR Fourier transformed infrared spectroscopy
FWHM Full with at half maximum
HWHM half with at half maximum
ICP-OES inductively couples plasma-optical emission spectroscopy
IINS Incoherent inelastic neutron scattering
NMR nuclear magnetic resonance
n-pdf Neutron pair distribution function
pdf Pair distribution function
ppdf Partial pair distribution function
QENS Quasi elastic neutron scattering
SDF Spherical density function
TGA/DSC Thermogravimetric analysis/differential scanning calorimetry
TOF Time of flight
x-pdf X-ray pair distribution function


General introduction
1 | P a g e
1 General introduction
In this chapter the general literature relating to this study is reviewed and key findings
reported in the literature are presented in more detail. The first part gives a short introduction
into the field of biomineralization and described the main materials and control mechanisms
reported for in the biogenic systems. Emphasis is placed on the calcium carbonate systems as
this is the main focus of this study. The second part highlights the role of amorphous calcium
carbonate (ACC) in biogenic systems and the roles it plays in both biomineral formation and
as a biomineral in itself. After this we delve into the literature regarding the structure and
stability of synthetic ACC and the role of magnesium ions as an additive in ACC. Special
interest should be given to chapter 1.3.1 as this deals with the structure of ACC which will be
elaborated on in chapter 3 where the results of this study are presented. Finally a brief
discussion is given on the structural analysis of disordered material.
1.1 Biomineralization
Biomineralization involves the formation of minerals in various organisms. It is described by
Mann1 as the selective extraction and uptake of elements from the local environment and
subsequent incorporation into functional materials, with the whole process controlled by the
organism. The biominerals found in nature are mainly composed of a small group of highly
abundant minerals e.g. calcium phosphate1 (vertebrates skeleton), silica
1 (plants, sponges,
algae2), iron oxides (bacteria
3, limpet teeth
4) and the main focus of this work calcium
carbonate, found in the protective shells of many mollusks5 and snails
6, in plants leaves
7, ear
stones8-9
and more. However, more exotic biominerals such as gold10
and uranyl11
minerals
also exists. The high degree of biological control exerted on the crystallization process has
allowed the organism to tailor crystals with specific polymorphs, morphology and
composition to suit the needs of that specific species1. The ability to produce specific
polymorphs is seen in several animal that can produce ACC12
, vaterite13
or aragonite14
instead
of the thermodynamically stable polymorph calcite15
. More detailed control can also be
observed were several polymorphs are produces in close proximity of each other, e.g. in
otolith of lake trout which is composed of a mixture of vaterite and aragonite9 or in the
attachment of the bivalve anomia simplex where the byssus is made of calcite and aragonite
with a complex three dimensional architecture5. Morphological control is exhibited by most
organism producing calcium carbonate minerals as seen in figure 1.1. The habitus of
geological calcite is defined by the 104 crystal plane forming a rhombohedral shape whereas
aragonite naturally forms needles (figure 1.1). This is in sharp contrast to the morphology of
biogenic calcite as seen in the sea urchin (figure 1.1), where the teeth16
and spines17
of the sea
urchin are mainly composed of calcite. The teeth are composed of highly aligned calcite
crystal18
and each spine is a single crystal with clearly different morphology from the
naturally thermodynamically favored one seen in the geological calcite19
. This is also seen in

General introduction
2 | P a g e
nacre (biogenic aragonite) where the aragonite crystals are plates20
rather than needles as
observed for geological samples (figure 1.1).
The high performances of these materials are a result of the highly controlled formation
mechanism performed by the organism during mineralization. How these minerals are formed
is still a highly debated field, but it has been shown that ACC is commonly associated with
calcium carbonate formation21-23
and several formation mechanism involving amorphous
phases have been suggested24-25
.
Figure 1.1 On the left the two most common geological calcium carbonate minerals calcite
and aragonite are shown. On the right are two examples of biogenic mineral from the sea
urchin, showing the inner tooth, the shell and spines all made from calcite, and nacre from a
blue mussel showing the plate shaped aragonite crystals.
1.2 ACC in biomineralization
As mentioned in the previous section ACC plays a central role in biogenic calcium carbonate
formation1, 21-22, 26
. The amorphous nature of ACC gives several advantages over the
crystalline counterpart of the calcium carbonate phase21
. Amorphous phases often show an
increased solubility27
over the crystalline phases, making them easier to dissolve and
reprecipitate when needed or to use as a precursor material that can easily be transported and
crystallized at a desired site21
. This transport can takes place with the ACC granules encased
in a membrane to avoid unwanted mineralization28
. The amorphous phase is also isotropic
resulting in no preferred growth orientation or high energy facets making molding presumably
easier for the ACC phase compared to the crystalline phases21
.
The biogenic ACCs are generally divided into two groups transient and stable biogenic
ACC21
. The transient form is rare in adult animals, but higher purity samples (i.e. non-
crystalline) can be found in e.g. early stages of the sea urchin29
. Several transformation
mechanisms have been suggested for transient ACC6. The earlier studies suggested that the
crystalline structure was premade in the amorphous phase based on extended x-ray absorption
fine structure (EXAFS) measurements6. More recent studies have suggested that these
minerals form via a particle accretion mechanism25
, here ACC particles are attached to the
parent mineral and transforms via epitaxial growth25
. In this case the parent crystal determines

General introduction
3 | P a g e
the orientation and polymorph of the final mineral. Evidence for this mechanism has been
seen in several calcium carbonate forming organisms25, 30
. Stable biogenic ACC on the other
hand remains ACC presumably indefinitely if kept under the right conditions21
. It is especially
well known from gastroliths12
and cystoliths7, the former functioning as calcium storage in
crustaceans and the latter a light scatterer found in plant leaves31
. This type of ACC has been
shown to be structurally very similar to the synthetic ACC32
, although there are minor
structural differences in the varies biogenic ACC's depending on the species33
.
The stability of both groups of biogenic ACC is suspected to arise from the multitude of
additives associated with the amorphous phase and while there are many additives described
for different species producing ACC, two additives are commonly used, namely magnesium
and phosphate ions21
.
1.3 Structure and stability of synthetic ACC
The structure and stability of ACC have been extensively studied and several reviews have
been published on the subject15, 21-22, 34
. However, they all come to the conclusion that the
structure is still not particularly well understood, nor is the role of additives. One review
points out that the local environment and dynamics of water are especially poorly described as
neutron scattering experiments are difficult to carry out on ACC34
. The lack of consistent
composition of the ACC reported in literature further complicates these types of studies.
1.3.1 Structure of ACC
Much like the biogenic ACC the synthetic counterparts have been grouped into two main
types, disordered and proto-structured. The proto structured ACC has been described as
having a local environment similar to one of the crystalline polymorphs15, 35
, while the
disordered ACC does not show any resemblances to the crystal phases36-37
. In this study the
focus has been placed on the disordered ACC for several reasons:
This type of ACC has been shown to be very similar to the stable biogenic ACC32
.
It has been widely used in various studies on the effects of additives, especially
magnesium38-44
.
Finally it is possible to scale the synthesis to produce the large amounts of materials
needed for neutron scattering experiments which are necessary in order to understand
the role of water in this system (see chapter 1.5).
Henceforth the notation ACC will refer to the synthetic disordered ACC phase unless
otherwise stated.
The early structural studies on ACC have relied heavily on the Ca-EXAFS measurements6, 29,
33, 45-49. These studies have mainly revealed the calcium-oxygen bond distance of 2.2-2.44 Å
and mean coordination numbers around 7. The bond distance here strongly resembles that
found in the crystalline polymorphs of 2.36-2.65 Å50-54
. The range of mean coordination
numbers reported in literature is quite wide. However, most studies suggest a coordination

General introduction
4 | P a g e
number ~7 with a few studies suggesting a coordination number as low as 3.855
and the
highest number reported is 9.06, 49
. The coordination number in the crystalline calcium
carbonates range from six (calcite)50
to nine (aragonite)51
making a mean coordination
number of ~4 in the amorphous phase unlikely given the size of the calcium cationa.
The role of water has so far been studied using solid state 1H-neuclear magnetic resonance
(NMR) spectroscopy36, 56-59
. This has suggested that the hydrous species in ACC consists of a
mixture of rigid, mobile and fluid-like water and hydroxides59
. However, the NMR spectra
seems to differ significantly depending on the synthesis conditions at which the ACC was
made, with two sharp features present for some samples56-58
and a broad feature present for all
samples36, 59
. All the NMR spectroscopy studies agree that several hydrogen species are
present in the sample and that they show different mobility. However, it is not clear if this
indicates that the water exhibits confined motion (i.e. water rotating or reorientation in its
local environment) or translational motion (i.e. long range diffusion) and on what time scale
this occurs. 13
C-NMR measurements on ACC have also been reported that mainly rely on
comparing with the spectrum of the crystalline calcium carbonate phases. This has shown a
broad peak with a chemical shift between that of the calcite and vaterite phases suggesting a
highly disordered system as expected from an amorphous phase36-37
.
While EXAFS and NMR spectroscopy have provided significant insight into the structure of
ACC, it is highly specific and lack the more holistic view provided by pair distribution
function (pdf) analysis60-62
, especially when both neutron and x-ray pdfs are used in
combination. However, the pdf is notoriously difficult to interpret and even when this is done
well, a unique structural solution can only be made for simple systems60
(see chapter 1.5).
This is also reflected in the studies that have reported on the x-ray pdf32, 36, 38, 43, 63-66
of ACC
and even on the few reporting on the neutron pdf43, 66
that so far have not provided a clear
picture of the local structure of ACC. However, several important aspects have been
described. Using a combination of pdf analysis, EXAFS, XANES and NMR spectroscopy
Michel et al.36
compared the structure of ACC with the known crystalline polymorphs of
CaCO3 and the hydrated mineral monohydrocalcite (CaCO3.H2O). Figure 1.2A shows the
comparison of the peaks found in the pdf of ACC with those of the crystalline compounds.
This showed that three peaks at 2.3, 4 and 6 Å are present in all the pdfs, these correspond to
the first calcium to oxygen distance, first and second calcium to calcium distances (taken from
the calcite crystal structure50
). The peaks at 2.9, 9 and 12 Å are less frequent in the crystalline
phases, but still present in several of the pdfs. Based on the pdf analysis and the other
mentioned techniques Michel et al. concluded that ACC could not distinctly be described by
anyone of the known crystalline structure of calcium carbonate36
. The work of Michel et al.36
showed that a more advanced data analysis method was needed to better understand the pdf of
ACC. This was attempted by Goodwin et al.63
using the big box approach Reverse Monte-
Carlo (RMC, for details on RMC, see chapter 1.5.1) on the x-ray pdf (x-pdf) of ACC. To
validate the RMC method for calcium carbonate system Goodwin et al.63
showed that they
could successfully determine the structure of calcite from experimental data and has at the
moment of writing published the best fit to the experimental data of ACC. This study revealed
a Not saying that four coordinated Ca cannot exist in the amorphous phases but that a mean coordination number
of four is unlikely as Ca seems to prefer higher coordination number at least in the crystalline phases.

General introduction
5 | P a g e
a high degree of disorder in ACC with a wide range of coordination numbers from 3 to 9 for
oxygen coordinating to calcium (figure 1.2B) consistent with the amorphous nature of ACC.
However the RMC method also produced large scale structures in the system, specifically a
charged separated system with adjacent calcium and carbonate rich pores with a diameter of
~1 nm. This of course violates the need for charge neutrality that one would expect to be
present even on the nanometer scale and indeed the structure was shown to be highly unstable
using molecular dynamics simulation64
.
Figure 1.2: A) comparison of the pdf of ACC with the pdf of calcite (CaCO3), vaterite
(CaCO3), aragonite (CaCO3) and monohydrocalcite (CaCO3.H2O) taken from Michel et al.
36.
B) Distribution of coordination number for oxygen around calcium (a) and examples of local
environments for calcium from low to high coordination number (b-e) extracted from RMC
analysis of the x-ray pdf of ACC. Taken from Goodwin et al.63
. Permissions to reprinting
these figures can be found in Appendix I.
To overcome the problems with the RMC method Cobourne et al.43
used the empirical
potential structural refinement (EPSR) routine on both x-pdf and neutron pdf (n-pdf) of ACC.
Since the EPSR method relies on a reference potential it can avoid high energy structure like
that reported by Goodwin et al63
. Given that neutron diffraction requires a large sample size
and low exposure time they used magnesium substituted ACC with 5% Mg/(Ca+Mg) and
dehydrated the sample to a hydration level of 0.25 H2O/(Ca+Mg) to avoid crystallization.

General introduction
6 | P a g e
Despite the addition of the neutron data and the more sophisticated analysis the pdf was not
reproduced very well beyond the 2.4 Å peak of the Ca-O nearest neighbor distances and even
here the position and intensity are slightly off (figure 1.3). As a result the model suggested
some unlikely interatomic distances such as a hydrogen bond distance of 1.2 Å. Unfortunately
the interatomic potentials used for this study was not published so it is unclear why EPSR did
not fit the structure in this case, but as seen in chapter 3.2 EPSR is capable of reproducing the
pdf and structure factor (for details on the structure factor see chapter 2.2) of ACC given the
right reference potential.
Figure 1.3: EPSR fit to the structure factor (a) and pdf (b) of ACC using both neutrons and x-
rays sources taken from Cobourne et al.63
. Permissions to reprinting these figures can be
found in Appendix I.
Despite the large effort to describe the structure of ACC, most structural aspects are still
unknown and the attempts to describe the pdf have so far produced models involving
unrealistic structural motifs43, 63
. However, three main results are in agreement with most
structural studies mentioned above34
:
Nearest neighbor calcium to oxygen distance is 2.2-2.44 Å.
Mean coordination number of oxygen around calcium in the first coordination sphere
ranges from 6 to 8.
Multiple binding sites exist for hydrous species with different mobility.
To further elucidate the structure of ACC several theoretical studies have been made64, 67-71
dealing with both proto-structured ACC67-68, 71
and disordered ACC64, 69-70
. Two theoretical
studies69-70
are highlighted here as they deal with the role of water in disordered ACC, which
is a key aspect of the results given in chapter 3. Malini et al70
used molecular dynamic
simulations to generated a model for ACC (CaCO3.H2O) with a density in the range of 2.54-
2.63 g/cm3 and the structure was in agreement with the three main results from experimental
work as mentioned above. They reported that the Ca-O mean coordination number is
composed of 1.2-1.7 oxygen from water (Ow) and 5.9-6.2 oxygen from carbonate (Oc) with a
Ca-C mean coordination number of 5.2-5.5. They also reported on the diffusion constant of
the water molecules, but found that it depends highly on the starting configuration of the
model, giving a wide range of diffusion constants ranging from 10-12
to 10-15
m2.
s-1
based on
four different starting configurations.

General introduction
7 | P a g e
This was elaborated on by Bushuev et al.69
who studied the hydration level of ACC by
varying the n=H2O/Ca ratio from 0 to 6. They found that above a hydration level of 0.9
percolations started to appear (figure 1.4). However, this was determined by the Ow-Ow
distance being below a cut off value set to 3.8 Å, not taking hydrogen bonding into account.
They showed that this was correlated to an increase in the water and ion mobility (figure 1.4)
linking the water percolations to the stability of the amorphous phase.
It’s clear that even with the addition of the theoretical studies there are still several important
features that are still poorly described in the literature, especially moving from the qualitative
results presented in many pdf studies32, 36
to the quantitative results available from the more
advanced analysis methods if reliable models can be produced43, 63
. It’s also clear that not only
is the structure of ACC important but also the dynamics of the system are crucial to
understand as these are likely to be paramount to the stability of the ACC.
Figure 1.4: Example of percolations described by the molecular dynamics simulations and the
diffusion constant for water and ions (i.e. Ca2+
and CO32-
) in the ACC above and below the
percolation threshold of 0.9 H2O/Ca taken from Bushuev et al.69
Permissions to reprinting
these figures can be found in Appendix I.
1.3.2 Stability of ACC
The stability of ACC generally refers to the fact that ACC is the thermodynamically least
stable phase of calcium carbonate with calcite being the thermodynamically favored phase at
ambient conditions38
. However, it is also used to refer to the propensity of ACC to crystalize
either in solution27, 39-40, 65, 72-73
, humidity74
, temperature27, 59, 65, 75
or pressure76-77
i.e. kinetic
stabilization. Pure ACC (CaCO3.nH2O) is kinetically highly unstable and will crystallize
within a few minutes in solution or at relatively low temperatures (~130 °C) if exposed to
heat27
. Immediately after extraction it has to be washed with ethanol in order to remove any
surface water that could initiate crystallization27, 78
, but if stored under vacuum ACC will
remain amorphous for several months74
.
There are many chemical and physical changes to the ACC phase that can influence the
stability of the amorphous phase. Zou et al.27
reported on the effect of particle size on the
stability of ACC and found that smaller particle increased the crystallization temperature to
300 °C for the smallest particle size measured. In solution the particle size had the opposite

General introduction
8 | P a g e
effect leading to faster crystallization due to an increased solubility of the ACC with
decreasing particle size. The incorporation of hydroxide, often referred to as basic ACC, can
also increase both the crystallization time in solution and the crystallization temperature
(figure 1.5)65, 75
. This method is especially popular for structural studies of ACC56-58, 66
, which
may lead to some differences when comparing pure and basic ACC.
Figure 1.5: A) Nucleation time for calcite from ACC with increasing pH determined from
turbidity measurements, the sudden drop in absorbance indicates crystallization, taken from
Tobler et al. 65
and B) crystallization temperature of ACC with increasing pH of the carbonate
solution prior to precipitation determined from differential scanning calorimetry (DSC)
measurements, the exothermic peak in the DSC indicates crystallization. Taken from Koga et
al.75
Permissions to reprinting these figures can be found in Appendix I.
Similar to the hydroxide the incorporation of many organic79-81
and inorganic compounds39-40,
79, 81 or surface coating
56, 82 of the ACC particle will also greatly increase the stability of ACC
both in solution and during heating. Of special interest to this is the effect of Mg2+
which is
near omnipresent in the biogenic ACC samples and covered in the following section.
1.4 The role of Mg in ACC and its effect on calcium carbonate formation
The role of magnesium in calcium carbonate formation has mainly focused on synthetic
samples38-43, 83-87
. It has been shown that this follows a simple reaction scheme depending on
the ratio of Magnesium to calcium given here as the Mg/(Mg+Ca) ratio.
At 0% Mg the following reaction occur72-73
:
𝑁𝑎2𝐶𝑂3(𝑎𝑞) + 𝐶𝑎𝐶𝑙2(𝑎𝑞) → 𝐴𝐶𝐶(𝑠) → 𝑣𝑎𝑡𝑒𝑟𝑖𝑡𝑒(𝑠) → 𝑐𝑎𝑙𝑐𝑖𝑡𝑒(𝑠)
Increasing the Mg concentration to 10 % inhibits the vaterite formation and Mg substituted
calcite is formed directly from amorphous calcium/magnesium carbonate (ACMC)39
:
𝑁𝑎2𝐶𝑂3(𝑎𝑞) + 𝐶𝑎𝐶𝑙2(𝑎𝑞) + 𝑀𝑔𝐶𝑙2(𝑎𝑞) → 𝐴𝐶𝑀𝐶(𝑠) → 𝑐𝑎𝑙𝑐𝑖𝑡𝑒(𝑠)

General introduction
9 | P a g e
At 15%-25% Mg, calcite and vaterite formation is inhibited and the nucleation time is
increased from ~5-10 min to ~2 hours given the following reaction40, 83
:
𝑁𝑎2𝐶𝑂3(𝑎𝑞) + 𝐶𝑎𝐶𝑙2(𝑎𝑞) + 𝑀𝑔𝐶𝑙2(𝑎𝑞) → 𝐴𝐶𝑀𝐶(𝑠) → 𝑚𝑜𝑛𝑜ℎ𝑦𝑑𝑟𝑜𝑐𝑎𝑙𝑐𝑖𝑡𝑒(𝑠)
Above 25% Mg, hydromagnesite (Mg5(CO3)4(OH)2.4H2O) starts to form after
monohydrocalcite formation, presumably via an amorphous magnesium carbonate (AMC)
phase40, 83
:
𝑁𝑎2𝐶𝑂3(𝑎𝑞) + 𝐶𝑎𝐶𝑙2(𝑎𝑞) + 𝑀𝑔𝐶𝑙2(𝑎𝑞) → 𝐴𝐶𝑀𝐶(𝑠)
→ 𝑚𝑜𝑛𝑜ℎ𝑦𝑑𝑟𝑜𝑐𝑎𝑙𝑐𝑖𝑡𝑒(𝑠) + 𝐴𝑀𝐶(𝑠) → 𝑚𝑜𝑛𝑜ℎ𝑦𝑑𝑟𝑜𝑐𝑎𝑙𝑐𝑖𝑡𝑒(𝑠) + ℎ𝑦𝑑𝑟𝑜𝑚𝑎𝑔𝑛𝑒𝑠𝑖𝑡𝑒(𝑠)
As evident from the above reaction equations, Mg2+
has a complex interaction as inhibitor for
the various calcium carbonate polymorphs. A more elaborate study by Nishiyama et al.41
showed that this can be further complicated by varying the ratio of Ca/CO3 (figure 1.6). It is
unclear if the complex chemistry of the mixed calcium/magnesium carbonate systems
originate in structural changes in the amorphous phase67
or simply from crystal growth and
nucleation inhibition of the calcite and vaterite phases85, 88
. However, the ability of Mg to
stabilize the ACC is clear40, 81
, which also plays a major role in the biogenic ACCs47
and has
been linked to the higher dehydration energy of magnesium compared to calcium47, 87, 89
.
Figure 1.6: Distribution of various calcium carbonate minerals formed after 24 hours in
solution by varying the Ca/CO3 ratio and the magnesium concentration taken from Nishiyama
et al41
with references to Kimura et al.83
and Munemoto et al.90
Permissions to reprinting these
figures can be found in Appendix I.
In the amorphous phases the local environment of magnesium is still poorly understood.
EXAFS studies have shown that the Mg-O distance is ~2.1 Å with a coordination number
around ~647
similar to what has been reported for the crystalline magnesium carbonates which
all have a coordination number of 6 with a octahedral coordination50, 91-94
. Detailed

General introduction
10 | P a g e
Thermogravimetric analysis (TGA) and pdf analysis of amorphous Ca1-xMgxCO3.nH2O (0 < x
<1; 0.25 < n < 1.8) suggested a solubility limit of 50% Mg in ACC with higher concentration
resulting from a mix of AMC and ACMC with 50% Mg38
, although this has been disputed by
NMR spectroscopy studies42
. The pdf of AMC and ACMC did not reveal any insight into the
structure as the pdf was too difficult to analyze beyond 2.3 Å of the Ca-O bond distance,
without a detailed structural model of ACC and AMC38
. The first detailed structural study of
AMC was reported by White et al.84
on MgCO3.3H2O, which showed a distribution of
coordination environments of Mg ranging from 4 to 6. They also found that small water pores
were present in the structure but did not quantify the size or dynamic nature of the water in
the pores.
The available structural information on AMC and ACMC are equivalent to that of ACC with
the cation to nearest neighboring oxygen distance and coordination number well known, but
structural details beyond the first cation-O coordination sphere have not been well-described.
Only the study of White et al.84
present some insight into the role of water in AMC, where
they find small water pores at elevated hydration level (3 H2O/Mg). Also, while for the ACC
the ratio of Ca/CO3 has been thoroughly investigated27, 65
, in the case of AMC, the actual
composition of the solid has not been discussed in literature, as in most of these studies a
rigorous stoichiometric analysis is absent. For example, at least two works report TGA
measurements showing a CO3/Mg ratio ~0.838, 95
, while the composition is still indicated as
MgCO3.nH2O. In other studies the TGA analysis has either not been performed or not
reported. The cause of this low CO3/Mg ratio is discussed in chapter 3 were it is shown that
magnesium ions do not coprecipitate with carbonate ions alone but also coprecipitates with
hydroxide ions and that this has to be taken into account for both AMC and ACMC.
1.5 Structural analysis of amorphous materials
We now changed gears a bit and move away from the structural studies that have already been
published on the amorphous carbonates and instead discuss the methods which are available
for performing structural analysis on disordered systems. Any structural study relating to an
amorphous or crystalline material is faced with the same problem, how to represent the
structure of the ~1023
atoms that make up a material as simple and clear as possible62
. For the
crystalline sample this is done very efficiently by the construction of the unit cell, where only
the relative position of the unique atoms needs to be determined and the symmetry of the
crystal. From this the entire crystal can be described via point and translational symmetry96
.
E.g in the case of calcite only the relative positions of one Ca, one O and one C are necessary
to describe the entire structure (figure 1.7)50
.

General introduction
11 | P a g e
Figure 1.7: The three unique atoms of the calcite structure shown on the left (Ca=blue,
O=red, C=Brown), via the space group R-3c the whole unit cell can be filled with
atoms(middle) and then the translational symmetry, known from the unit cell dimensions, can
generate the entire crystal, a subsection of which is shown on the right.
For an amorphous material this is more difficult as point and translational symmetries are
absent. However, we still need to condense the structure down to the unique elements or to be
more precise the statistically most likely structural motifs as every atom in an amorphous
system are in principle unique compared to all other atoms62
. For this there are three main
techniques: EXAFS, NMR spectroscopy and pdf analysis. EXAFS analyses are specific to a
given element and can provide bond distances and coordination numbers for the element in
question. However, only the first few coordination spheres can generally be measured and for
ACC only the first Ca-O coordination sphere has been well described using this method29, 33,
45. Similarly NMR spectroscopy is element specific, but unlike EXAFS works well for H and
C. However, it is difficult to get quantitative information from NMR spectroscopy, but not
impossible as shown by Singer et al.64
who determined the Ca-O distance in ACC from 43
Ca-
NMR spectroscopy. In contrast pdf analysis is in principle sensitive to all the elements at once
and is a direct measurement of the interatomic distances62
. Furthermore using advanced
analysis techniques quantitative information can be extracted based on a computer model60, 62,
97.
Several ways of interpreting the pdf of ACC have been attempted, the most common of which
has been the comparison between the pdf of ACC and that of the crystalline compounds
(figure 1.2A)32, 36, 65
. This approach, while simplistic, has a high risk of misinterpreting the
data as with the work of Tobler et al.65
who reported an increase in a peak at 3.8 Å when
adding hydroxide to ACC and correlated it with the Ca-Ca pair of vaterite present at ~4 Å54
but could just as easily originate from the Ca-OH-Ca motif in Ca(OH)2 with a Ca-Ca distance
of 3.6 Å98
. The other major drawback of this approach is that it is inherently qualitative.
To get quantitative results a more mathematical approach is needed60, 62
. This involves
deconvoluting the pdf into the partial pdfs (ppdf) of which there are:
𝑁𝑝𝑝𝑑𝑓 =𝑁𝛼(𝑁𝛼+1)
2 (1.1)

General introduction
12 | P a g e
Where Nppdf is the number of ppdfs and Nα is the number of unique atoms in the system. For
small Nα, it is possible to precisely determine the ppdfs by measuring Ne number of pdfs with
different contrasts if Ne > Nppdf99
. Measuring the pdf with several contrasts can be done either
by neutron diffraction with isotope substitution (NDIS) due to the change in the neutron
scattering length of different isotopes and by anomalous x-ray diffraction (AXD) taking
advantage of the change in x-ray scattering length close to an absorption edge. However,
NDIS requires a large difference between the scattering length of different isotopes for the
same element and AXD is only possible for element heavier then zinc in the periodic table as
the diffraction pattern has to be measured to at least 10 Å-1
which is limited by the energy
associated with the absorption edge of the element in question60
. As evident from equation 1.1
the number of pdf measurement needed to deconvolute the pdf for systems with Nα > 2 is in
practice difficult if not impossible as the number of NDIS experiments that can be made is
limited by the availability of suitable isotopes and AXD will not be suitable for pdf analysis
for many light elements60
.
Figure 1.8: Example of a Small box model for amorphous TiO2 precursor for anatase. With
the proposed structure (A) and the fit to the experimental data (B). Taken from Mi et al.100
Permissions to reprinting these figures can be found in Appendix I.
To overcome this challenge atomistic models are necessary62
. These models all involve
generating a box of atoms to represent the structure of the system using various methods to
refine the structure against experimental data. These come in two forms, small box and big
box approaches62
. The small box approach is best known from PDFfit101
which is essentially
equivalent to a rietveld refinement as the atomic position, unit cell, atomic displacement
parameters and more can be refined in a non-linear least square method to achieve the best fit
to the experimental pdfb. This approach has been very successful when combined with time
resolved pdf data measuring the crystallization process and extrapolating the structure of the
crystal into the amorphous systems. This has mainly been performed for metal oxides100, 102-
103. However, it does have several disadvantages, since the systems has to be very
homogenous so that the structure can be represented by a unit cell sized model (a few cubic
nanometers at the most, see figure 1.8). In order to utilize the time resolved data the system
has to go from an amorphous to crystalline state in a homogenous manner and not via a point
b But using the total scattered signal (i.e. the pdf) and not just the Bragg peaks as in rietveld refinement

General introduction
13 | P a g e
nucleation and growth process. For ACC104
it is unclear if this is valid especially taking into
account that ACC can crystallize in several ways27, 72, 74, 76
, none of which are clearly favored
in the natural systems. Therefore this approach was deemed unfit for this study and a big box
approach was preferred.
1.5.1 The big box approach
The Big box approach uses a large box of atoms, typically several thousand atoms, to
represent the structure of the material (figure 1.9). The key of this method is to constrain the
system as much as possible using data from additional techniques. The main constrain in any
such method is the hard sphere assumption, insuring that atoms do not overlap. Experimental
data can further constrain the system, especially density and composition are key constrains
that must be placed on the model.
Figure 1.9: A typical big box size, in this case ACC with a composition of CaCO3.1.1H2O
containing 4150 atoms within a cube with a side length of 3.52 nm.
For reverse Monte-Carlo (RMC) these are the only constraints needed, the method then relies
on the data to constrain the refinement to reach the correct solution105
. The RMC method uses
a standard Monte-Carlo approach to move atoms around in the box, i.e. random
motion/rotation of a single particle/molecule. The move is then accepted if the χ2 (goodness of
fit) is lowered or if the move increases the χ2 it may be rejected or accepted with a probability
P given by:
For a regular Monte-Carlo:
𝑃 = exp (−𝛥𝑈
𝑘𝑇) (1.2)
And for RMC:
𝑃 = exp (−𝛥χ
𝑘𝑇) (1.3)

General introduction
14 | P a g e
Where U is the energy of the system kT is the Boltzmann constant times the temperature and
here determines how many “bad” moves are accepted and in RMC is usually set by the user to
avoid local minima. This process is done iteratively and eventually the χ2
becomes stable at
the best possible fit given the constraints105
. The strong reliance on the data in the RMC
method makes it unbiased in its results. However, this strength is also a major weakness since
unphysical results can be produced especially if the data is insufficient to constrain the
refinement, which is especially the case when Nα in equation 1.1 is high63-64
. To avoid
unphysical results the model can be run alternatingly through a molecular dynamics or density
function theory simulation and an RMC program to ensure that the system is minimizing both
the energy and goodness of fit84
.
The most successful big box approach for liquids106-108
and glasses97, 109-110
is likely the
empirical potential structural refinement program (EPSR)61, 110-114
. EPSR works much like
RMC, except that it uses equation 1.2 instead of 1.3 to accept or reject changes to the
structure, described in detail in chapter 2.3. This introduces an extra constraint via the
inter/intra-atomic potential insuring that the structural motifs present in the model are low
energy structures (e.g. no direct contact between cations). Since the RMC introduces the data
via equation 1.3 the EPSR program need an alternative route to refine the model against the
data. This is done by generating an empirical potential via comparison of the structure factor
S(Q) of the calculated structure and the experimentally determined S(Q), the math behind how
this is done is explained in chapter 2.3. The main advantage of this is that all the refinement
takes place in the same program at the same time, instead of generating a model that is first
minimized in χ and then in energy, where the two methods may not converge on the same
structure. However, this is not without disadvantages, since several significantly different
structures may give equally good fits to the same data109, 112
and comply with the same
constraints making it is difficult to determine which one is the better model. At this point
supporting information may be needed such as NMR or vibrational spectroscopy to determine
if one is more valid compared to the other109
. In any case supporting data should, when
possible, be considered before drawing conclusions from big box models of any type. Since
the EPSR model is used extensively in this study more details are presented in chapter 2.3 and
will not be discussed further in this chapter.
1.6 Open questions on the structure and water dynamic of ACC and ACMC
The structural studies that have so far been made on ACC have left a large amount of
unanswered questions, especially concerning the light elements such as hydrogen that are
essential for hydrogen bonding and will be essential to adequately describe the water
environment in the system. Given the large amount of stabilizers present in biogenic samples
it is also important to understand how common additives such as magnesium ions affect the
local structure of the ACC.

General introduction
15 | P a g e
To address this problem combined neutron and x-ray total scattering with computer modeling
was used. This allowed for a full deconvolution of the pdf into the partial pair distribution
functions, making it possible to retrieve qualitative and quantitative information concerning
the structure of ACC for all elements. A similar analysis was made for amorphous magnesium
carbonate and a mixed amorphous calcium magnesium carbonate phase elucidating the effect
of magnesium on the ACC structure and providing a clearer picture of the magnesium-water
interaction that has been suspected to be responsible for the stabilizing effect of magnesium
ions.
However, the pdf represents the time averaged structure and as such is only related to the
structure of the material and not to the dynamics present in the structure. This can instead be
addressed using the dynamic structure factor which is available for hydrous species from
inelastic neutron scattering, revealing the timescale and geometry of motion on the ps time
scale where atomic diffusion takes place. Using both the time averaged structure and the
dynamic structure factor the state of water molecules in the system can be described in much
greater detailed compared to only using one of the approaches.
Before these questions could be addressed some technical problems had to be resolved. Most
importantly: is it possible to make large quantities of ACC needed for neutron diffraction
without the addition of stabilizers and at a hydration level relevant to biogenic samples (i.e. 1
H2O/Ca2+
)? It turns out that this can be done with some optimization to existing protocols27, 75
as described in chapter 3.1. The second problem we were faced with was: can big box models
be used to describe the local structure without the presence of unphysical bond distance or
charge separation that have been present in previous attempts to model this system? Using the
ESPR program this turned out to be the case with an excellent fit to the experimental data of
ACC comparable to the goodness of fit reported from the RMC analysis63
.

Principles behind methods
16 | P a g e
2 Principles behind methods
This chapter covers the theoretical background behind the methods used in this thesis. The
first section is devoted to the pair distribution function (pdf) and describes the necessary steps
to obtain the pdf from the diffraction measurement. Chapter 2.1.2 shortly discusses the
difference between the available instruments for neutron pdf measurements and emphasis why
time of flight neutron diffraction is preferable for the samples under investigation in this
study. We then delve into the analysis routine EPSR and the routines used to extract results
from the final structure. Finally the fundamentals behind the neutron spectroscopy techniques
IINS and QENS are explained and the method to analysis these data is briefly discussed.
2.1 The pair distribution function: theory and experiment
Pdf analysis has become increasingly popular during the last decades, especially after the
development of rapid acquisition x-pdf62, 115
. The next two sections are dedicated to the theory
behind pdf analysis, the definition used in this study and to the choice of beam line, which has
little meaning for x-pdf but is very important for n-pdf.
2.1.1 From diffraction experiment to the pdf
Figure 2.1: A) Plots of the total intensity (I(Q)) in black and background (Inonsample) in red
from equation 2.1 for ACC measured at the x-ray beamline ID11(ESRF). B) Isample of ACC
after subtraction of the background.
The data reduction transforming the data from the diffraction signal to the pdf varies between
the available software116
, in this study the software GUDRUN117
was used, since this is
essential for data reduction for the SANDALS instrument which was used for the neutron
experiments. The data reduction is described in detail by Hannon et al.118
and Keen116
, the
main steps are described in the following section

Principles behind methods
17 | P a g e
Any pdf measurement will always begin with a diffraction experiment, where the intensity I
must be measured as a function of the scattering vector Q and is given byc (figure 2.1A):
𝐼(𝑄) = 𝐼𝑠𝑎𝑚𝑝𝑙𝑒(𝑄) + 𝐼𝑛𝑜𝑛𝑠𝑎𝑚𝑝𝑙𝑒(𝑄) (2.1)
And:
𝑄 =4𝜋𝑠𝑖𝑛𝜃
𝜆 (2.2)
Here λ is the wavelength of the neutron or x-ray beam and θ is the scattering angle. Since any
type of matter will diffract neutrons or x-ray, including air in the beam path, it is important to
remove the background (Inonsample(Q)) before any further data reduction can be performed.
This leaves Isample(Q) (figure 2.1B) which can be written as equation 2.3 using the static
approximation.
Figure 2.2: A) plot of the total scattered intensity Isample from ACC and the incoherent term
from equation 2.3. B) The final structure factor or S(Q) from equation 2.6 obtained by
subtracting the incoherent term from the total scattering intensity shown in A. The S(Q) here
is normalized to ⟨𝑏2⟩. Note that the S(Q) is oscillating around zero, while the incoherent term
is always positive.
Here the differential scattering cross section (figure 2.1B) is separated into the incoherent
scattering term 𝑆𝑖𝑆(𝑄) and the coherent scattering term 𝑆𝑖𝑗 (𝑄), which is the part that relates
to the pdf.
𝐼𝑠𝑎𝑚𝑝𝑙𝑒(𝑄) =1
𝑁
𝑑𝜎
𝑑Ω= ∑ (𝑏𝑖
2̅̅ ̅ − 𝑏�̅�2
) 𝑆𝑖𝑠(𝑄)𝑛
𝑖=1 + ∑ 𝑏�̅�𝑛𝑖,𝑗=1 𝑏�̅�𝑆𝑖𝑗(𝑄) (2.3)
Where N is the number of atoms in the material, σ is the scattering cross section, Ω is the solid
angle, bi is the scattering length of the ith
atom, 𝜎𝑖𝑐𝑜ℎ = 4𝜋𝑏�̅�
2 and 𝜎𝑖 = 4𝜋𝑏𝑖
2̅̅ ̅ is the coherent
and total scattering cross section respectively with 𝜎𝑖𝑖𝑛𝑐 = 𝜎𝑖
𝑡𝑜𝑡 − 𝜎𝑖𝑐𝑜ℎ, 𝑆𝑖
𝑆(𝑄) is equal to the
proportion of the ith
species in the material ci and the coherent scattering term can be written
as:
c In theory I(Q) should be measured to infinitely high Q. However, in practice the I(Q) has to be measured to at
least 10 Å-1
, but higher is preferable.

Principles behind methods
18 | P a g e
𝑆𝑖𝑗(𝑄) = 𝑐𝑖𝑐𝑗[𝐴𝑖𝑗(𝑄) − 1] + 𝑐𝑖𝛿𝑖𝑗 (2.4)
Where Aij(Q) are the partial structure factors and δij is a dirac delta function. Equation 2.3 can
then be rewritten as:
1
𝑁
𝑑𝜎
𝑑Ω= ∑ 𝑐𝑖𝑐𝑗𝑏�̅�
𝑛𝑖,𝑗=1 𝑏�̅�[𝐴𝑖𝑗(𝑄) − 1] + ∑ 𝑐𝑖𝑏𝑖
2̅̅ ̅𝑛𝑖=1 (2.5)
If ci and bi are known, the incoherent term (∑ 𝑐𝑖𝑏𝑖2̅̅ ̅𝑛
𝑖=1 ) can be corrected for (figure 2.2A) and
this leaves the coherent scattering term also known as the total scattering structure factor
(figure 2.2B).
𝑆(𝑄) = ∑ 𝑐𝑖𝑐𝑗𝑏�̅�𝑛𝑖,𝑗=1 𝑏�̅�[𝐴𝑖𝑗(𝑄) − 1] (2.6)
S(Q) can then be converted into the pdf, G(r) via Fourier transform and vice versa.
𝑆(𝑄) = 𝜌0 ∫ 4𝜋𝑟2𝐺(𝑟)sin(𝑄𝑟)
𝑄𝑟
∞
0𝑑𝑟 (2.7)
and
𝐺(𝑟) =1
(2𝜋)3𝜌0∫ 4𝜋𝑄2𝑆(𝑟)
sin (𝑄𝑟)
𝑄𝑟
∞
0𝑑𝑄 (2.8)
The pdf is related to the ppdf, gij(r) as
𝐺(𝑟) = ∑ 𝑐𝑖𝑐𝑗𝑏�̅�𝑛𝑖,𝑗=1 𝑏�̅�[𝑔𝑖𝑗(𝑟) − 1] (2.9)
with
𝑔𝑖𝑗(𝑟) =𝑛𝑖𝑗(𝑟)
2𝜋𝑟2𝑑𝑟𝜌𝑗 (2.10)
Where nij is the number of atoms of type j between distance r and r+dr from an atom of type i
and ρj=cjρ0, with ρ0 being the atomic density of the material.
The ppdf is essential for any pdf analysis as interpretation of the pdf at distances above 2-3 Å
is exceedingly difficult due to overlapping pair correlations. Equation 2.1-2.10 summerize the
data reduction needed for converting the I(Q) to G(r) for the elastic scattering and is similar
for both x-ray and neutrons, except that the b values are different for the twod. However, there
are several corrections that must be made for inelastic effects for both neutrons and x-rays60,
117, 119, but since these are not important for this study they will not be discussed here.
d The scattering length b for x-ray is Q and λ dependent, whereas b for neutrons is mostly independent of Q and
λ.
Principles behind methods
19 | P a g e
2.1.2 Choice of neutron beamline
The choice of beam line may seem trivial; a beam line capable of performing a pdf
measurement should give the same result as any other beam line. While this is generally true
the quality of the n-pdf can vary significantly depending on the instrument. This is mainly due
to the incoherent scattering length of H which is an order of magnitude more intense than
most other scattering lengths coherent or incoherent (see table 2.1 for scattering lengths for
the elements relevant for this study).
Table 2.1: scattering lengths for the elements relevant for this study
Table 2.1: scattering lengths for the elements relevant for
this study
b H C O Mg Ca
Neutron Coherent -
3.739
6.646 5.803 5.375 4.7
Neutron Incoherent 80.26 0 0 0 0
X-ray* 1 6 8 12 20
*given as the number of electrons as 𝑏𝑥−𝑟𝑎𝑦 ∝ 𝑛𝑢𝑚𝑏𝑒𝑟 𝑖𝑓 𝑒𝑙𝑒𝑐𝑡𝑟𝑜𝑛𝑠
The first choice to make when planning a neutron total scattering experiment is to decide to
use constant wavelength (CW) or time-of-flight (TOF) diffraction (figure 2.3).
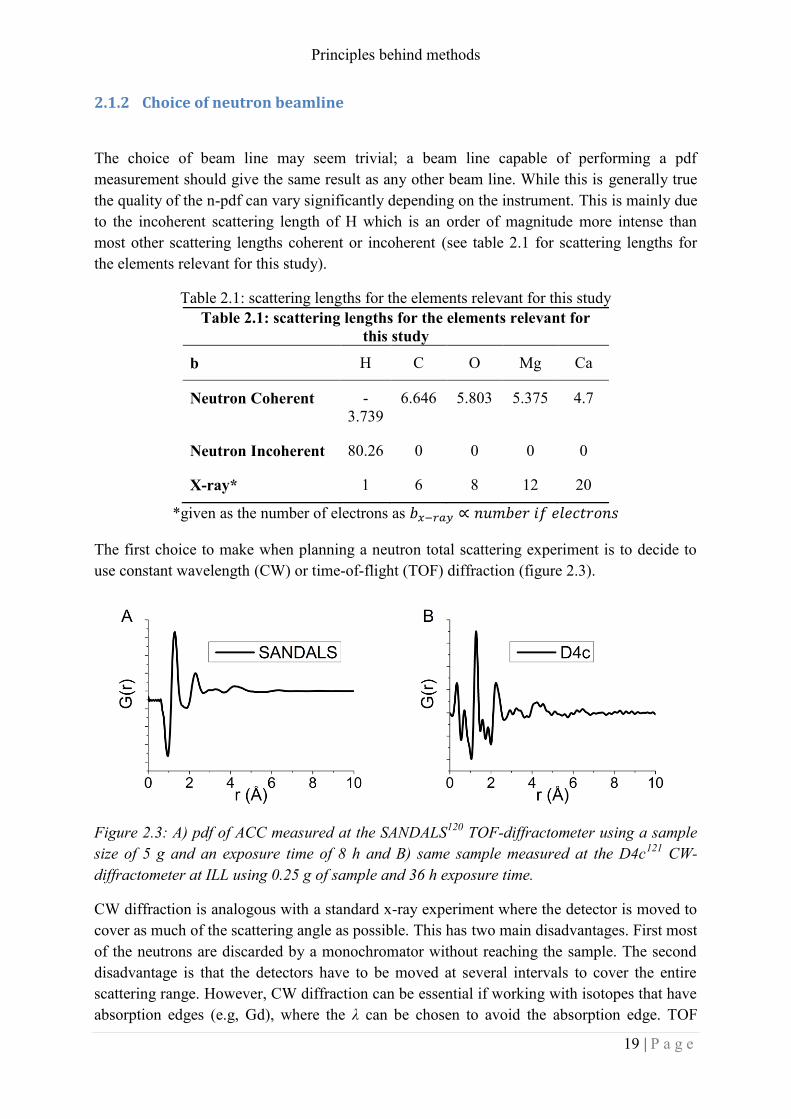
Figure 2.3: A) pdf of ACC measured at the SANDALS120
TOF-diffractometer using a sample
size of 5 g and an exposure time of 8 h and B) same sample measured at the D4c121
CW-
diffractometer at ILL using 0.25 g of sample and 36 h exposure time.
CW diffraction is analogous with a standard x-ray experiment where the detector is moved to
cover as much of the scattering angle as possible. This has two main disadvantages. First most
of the neutrons are discarded by a monochromator without reaching the sample. The second
disadvantage is that the detectors have to be moved at several intervals to cover the entire
scattering range. However, CW diffraction can be essential if working with isotopes that have
absorption edges (e.g, Gd), where the λ can be chosen to avoid the absorption edge. TOF

Principles behind methods
20 | P a g e
diffraction offers several advantages, especially for hydrogen containing samples. If the
instrument is placed on a pulsed neutron source such as ISIS, all of the neutrons can be used
as Q can be probed by varying λ in equation 2.2 at a known angle. Several detectors are then
be placed at different angles and combined to increase counting rates. This results in a Q
range of 0.1-50 Å-1
for the SANDALS120
instrument which is nearly impossible to reach using
a CW diffractometer. The other main advantage is that the inelastic (energy dependent) and
elastic scattering (Q dependent) can be deconvoluted since a given λ will have the same
energy but different Q for each detector. This is especially important for hydrogen containing
samples, where the inelastice scattering can be comparable to the elastic scattering
60. For the
SANDALS instrument the diffraction data can also be normalized on an absolute scale using
a vanadium standard, if the sample density and composition is known117
. This results in the
S(Q) being in the units of barns/steradian/atom, meaning that any fit to the data has to fit the
shape and the intensity of the S(Q). Figure 2.3 shows the pdf of ACC measured at the CW
D4c instrument at ILL and at the TOF SANDALS instrument at ISIS. The quality of the pdf
measured at SANDALS is clearly superior. However, this instrument also allowed for bigger
sample size compared to the D4c.
2.2 Empirical potential structural refinement
Figure 2.4: Flow chart showing the necessary steps in an EPSR analysis
The EPSR analysis follows a simple flow chart as shown in figure 2.4. This is explained in
detail by Soper61, 110-114
and the main points are summarized in the following. The first step is
to define an atomistic box to represent the sample in question. This requires significant
previous knowledge of the sample, specifically density, molecular structure and composition.
e The inelastic scattering is mainly dependent on the incoherent scattering length as therefore can be very high
for hydrogen containing samples

Principles behind methods
21 | P a g e
In this study the molecular structure is rather simple as carbonate, water and hydroxide
molecules have well known geometries. The composition was determined in this study by
ICP-OES to determine the calcium and magnesium content and TGA to determine the water,
hydroxide and carbonate levels. The density is significantly more difficult to determine,
requiring a gas-pycnometer and significant volumes of samplef. The second step involves a
Monte Carlo simulation based on a usual metropolis condition for move acceptance (equation
1.2). The simulation is based on an intramolecular reference potential (figure 2.5A), defined
as follows.
𝑈𝑖𝑛𝑡𝑟𝑎 = 𝐶 ∑ ∑(𝑟𝛼𝑖𝛽𝑖
−𝑑𝛼𝛽)2
2𝑤𝛼𝛽2𝛼𝛽>𝛼𝑖 (2.11)
Figure 2.5: The atomic potentials used by the EPSR program: A) The intra-molecular
potential plotted at three different wαβ values from equation 2.11, notice that with increasing
wαβ (i.e. decreasing weight, equation 2.12) the energy penalty for molecular vibration is
decreased (i.e. lighter elements vibrate at a higher frequency than heavier elements). B)
Attractive and repulsive inter-atomic/molecular potential composed of a Lennard-Jones
potential (C) and a coulomb potential (D, only shown for a repulsive pair) as shown in
equation 2.13. Here the attractive potential in B is given by the LJ potential in C and a
negative coulomb potential (from particle of opposite charge) while the repulsive potential
has a positive coulomb potential as shown in D (particle of like charge).
f Luckily not a problem in this study due to the large quantities already prepared for the neutron experiment.

Principles behind methods
22 | P a g e
Where 𝑟𝛼𝑖𝛽𝑖is the actual separation between α and β atoms, dαβ is the average distance
between the atoms, C is a constant set to 65 Åamu0.5
, 𝑤𝛼𝛽2 is a broadening function replacing
the Debye Waller factors (i.e. intramolecular vibrations) given by:
𝑤𝛼𝛽2 =
𝑑𝛼𝛽
√𝑀𝛼𝑀𝛽/𝑀𝛼+𝑀𝛽 (2.12)
The interatomic potential (figure 2.5 B-D) is given by a Lennard jones potential with a point
charge given as:
𝑈𝛼𝛽𝑟𝑒𝑓
(𝑟𝑖𝑗) = 4𝜖𝛼𝛽 [(𝜎𝛼𝛽
𝑟𝑖𝑗)
12
− (𝜎𝛼𝛽
𝑟𝑖𝑗)
6
] +𝑞𝛼𝑞𝛽
4𝜋𝜖0𝑟𝑖𝑗 (2.13)
with
𝜖𝛼𝛽 = (𝜖𝛼𝜖𝛽)1
2 (2.14)
and
𝜎𝛼𝛽 =1
2(𝜎𝛼 + 𝜎𝛽) (2.15)
Where 𝑈𝛼𝛽𝑟𝑒𝑓
(𝑟𝑖𝑗) the inter-atomic potential between α and β atoms, ε is the well depth
parameter and σ is the range parameter, q is the elemental charge, ε0 is the vacuum
permittivity and rij is the interatomic distance. These potentials are used in the Monte-Carlo
simulation to obtain the energy minimized structure. After a minimum energy structure is
obtained the data can be introduced via the empirical potential.
Figure 2.6: Example of an empirical potential derived using EPSR. Notice that the
oscillations are dampened with increasing r mimicking the shape of an atomic potential.
The empirical potential (figure 2.6) is implemented in the form of a series of power
exponential function given by:

Principles behind methods
23 | P a g e
𝑈𝐸𝑃(𝑟) = 𝑘𝑇 ∑ 𝐶𝑖𝑃𝑛𝑖(𝑟, 𝜎𝑟)𝑖 (2.16)
with
𝑃𝑛(𝑟, 𝜎𝑟) =1
4𝜋𝜌𝜎𝑟3(𝑛+2)!
(𝑟
𝜎𝑟)
𝑛
exp (−𝑟
𝜎𝑟) (2.17)
Where Ci is the fitting parameter and must be real, σr is a width function set by the user and ρ
is the atomic density. This formulation insures that the empirical potential varies rapidly at
short r and slowly at long distances as expected from an interatomic potential. Given that
equation 2.17 has an exact three dimensional Fourier transform into Q space, equation 2.16
can be expressed in Q rather than r. The Q space formulation can then be fitted to the
difference between the experimental structure factor and the simulated structure factor
determined from the energy minimized model. This is then done iteratively until a stable
potential is reached. To control this process the user can set the amplitude of the empirical
potential to determine how large an effect it can have on the total potential. If the amplitude is
set too high the empirical potential may dominate the reference potential and result in semi
arbitrary configurations. If it is set too low it will not have any effect. Therefore the amplitude
must be gradually increased until a satisfactory fit is achieved. Once this is achieved the
simulation can produce several configurations consistent with the data and the potential.
These configurations are averaged to give the final result which can be extracted via separate
routines.
Four main analysis routines were used in this study to extract ppdf, coordination number
distributions, angular distribution and spherical density function (SDF). The first was the
extraction of the ppdfs using equation 2.10 (figure 2.7).
Figure 2.7: Example ppdf of calcium and oxygen (from carbonate) in ACC with the range of
the first coordination sphere marked of in grey.
The ppdfs were then used to determine the ranges of interest for the e.g. mean coordination
number, normally given by:
𝑚𝑒𝑎𝑛 𝑐𝑜𝑜𝑟𝑑𝑖𝑛𝑎𝑡𝑖𝑜𝑛 𝑛𝑢𝑚𝑏𝑒𝑟 = ∫ 4𝜋𝑟2𝑐𝑗𝜌0𝑔𝑖𝑗(𝑟)𝑑𝑟𝑟𝑚𝑎𝑥
𝑟𝑚𝑖𝑛 (2.18)

Principles behind methods
24 | P a g e
Figure 2.8: Coordination number distribution for the marked area in figure 2.7showing the
number of oxygen around calcium (black) and the number of calcium around oxygen (red).
Both are calculated from the grey area in figure 2.7and as is clear the mean coordination
number and distributions are very different for oxygens around calcium and calcium around
oxygen in the same range.
However, since the distribution of coordination numbers are of interest, a routine is set up to
count the number of neighboring atoms in the range of a given coordination sphere as shown
in figure 2.7 for each pair of interest, avenging over all configuration probed by the EPSR
program (figure 2.8).
Figure 2.9: Angular distribution of oxygen from water around magnesium in AMC showing
two clearly preferred angles at 90° and 180° characteristic of octahedral coordination.
The third routine extracts the angular distribution (figure 2.9), given by the angle of two
atoms coordinating to a central atom within a range similar to the first coordination sphere as
shown in figure 2.7. This is especially important for analyzing the coordination geometry122
of
spherical ions such as magnesium as shown in figure 2.9. The last routine involves the sdf,
this routine is based on a spherical harmonic representation and involves extensive
mathematical expressions, which will not be covered here but can be found in the EPSR

Principles behind methods
25 | P a g e
manualg. However, it is important to note that the sdf is plotted as an isosurface and will be
dependent on the value set for that isosurface. In figure 2.10 the sdf of Ca around carbonate is
plotted with three different values (n) for the isosurface. As see from figure 2.10 the sdf can
be somewhat misleading if n is chosen at random, therefore when comparing sdfs it is
important to use the same n for all sdfs.
Figure 2.10: sdf of Ca coordinating to carbonate with three different isosurface values (n),
taken from the EPSR model of ACC.
2.3 Neutron spectroscopy
Figure 2.11: Schematic geometry for an indirect neutron spectrometer. The sample is
irradiated with a white beam, the scattered beam is then monochromated by a pyrolytic
graphite (PC) monochromator and the energy shift can be determined by the time of flight
since L1, L2 and L3 are known. Several analyzer are placed at different Q to determine the
S(Q,ω) in IRIS while TOSCA measures ω at a fixed angle.
Neutron spectroscopy123
is closely related to neutron scattering, the main difference is that the
scattering is inelastic instead of elastic i.e. ω≠0, ω being the dynamic parameter given by:
g The EPSR manual is available to anyone for free from the disordered materials group Facebook page known as
delight in disorder: https://www.facebook.com/disord.matt/?ref=br_rs

Principles behind methods
26 | P a g e
𝜔 = 𝐸𝑖 − 𝐸𝑓 (2.19)
Here Ei is the energy of the incoming neutron beam and Ef is the energy of the neutron beam
after hitting the sample. This technique is also relying on the incoherent scattering length
instead of the coherent scattering length (see table 2.1) making it very sensitive to hydrous
species. The two spectrometers used in this study are TOSCA124
(IINS) and IRIS125
(QENS)
both of which are indirect geometry spectrometer as shown schematically in figure 2.11.
2.3.1 Incoherent inelastic neutron scattering (IINS)
IINS, when performed on an instrument as TOSCA, provides information analogous to
infrared (FTIR) or RAMAN spectroscopy. The energy of a vibration is measured through
inelastic scattering of a neutron rather than a photon as in RAMAN spectroscopy. This has
several advantages and disadvantages. The disadvantages are mainly inherent to inelastic
neutron experiments, large sample size (5+ grams), long measurement time (~8 hours), low
resolution (1% ΔE/E) and low temperature (10 °K). However, IINS is mainly sensitive to
vibrations involving hydrogen due to its large incoherent scattering length (see table 2.1) and
there are no selection rules making all vibrational modes in principle measurable.
Figure 2.12: IINS spectrum of low density amorphous ice126
and Ca(OH)2127
showing the X-
Owater translational vibration (red, X being any atom binding to the oxygen though its lone
pair), collective vibration of a hydrogen bonded network (blue) and librational vibration
(yellow). The vibrations are sketched in the top with the color of the arrows representing the
band of the same color on the spectrum. The atomic structure here are represented by a
hydrated calcium carbonate (i.e. monohydrocalcite53
).
Like most vibrational spectroscopy IINS spectra are difficult to simulate and therefore the
analysis was performed by comparison to reference samples. Luckily TOSCA provides an

Principles behind methods
27 | P a g e
extensive library of compoundsh previously measured on this instrument and its predecessors
TFXA. Since the hydrous species of interest here are water and hydroxide ions, plenty of
reference spectra are available from the database126-134
. In figure 2.12 two spectra are shown
of low density amorphous ice126
and Ca(OH)2127
showing the assignment of vibration in the
spectrum. These vibrational modes have been extensively studied in various minerals128-129
to
assess how ion-water interaction affect the band and therefore can be used to substantiate the
result available from ESPR analysis.
2.3.2 Quasi elastic neutron scattering (QENS)
The QENS measurements are very similar to that of the IINS measurement, except that the
analyzer and detector (see figure 2.11) are now placed so that the beam is diffracted from the
monochromator as close to 180° as possible to increase the resolution of ω. At the IRIS125
instrument the 002 reflection of pyrolytic graphite analyzers are used, resulting in a resolution
of 17.5 μeV with a analyzing energy of 1.84 meV. The resolution is given by the full width at
half maximum (FWHM) of the elastic line at ω=0 (figure 2.13).
Figure 2.13: Example QENS spectrum of ACC measured on the IRIS instrument at 5 °K
(black) and room temperature (blue).
The high resolution is used to measure very low energy transfer where translational and
rotational motion are probed rather than the vibrational modes investigated by the TOSCA
instrument. The energy transfer is then measured as the FWHM of a lorentzian peak
convoluted with a resolution function measured at 5 °K where translational motion is
negligible. ω can then be converted in to a residence time τ (the time between diffusive
events) given as135
:
𝜏 =2ℏ
Γ (2.20)
Where ℏ is the reduced Planck’s constant and Γ the half width at half maximum (HWHM).
The change in ω with Q can then be used to determine the geometry of the diffusion. In this
h The data base is available from the ISIS web site: https://www.isis.stfc.ac.uk/Pages/INS-database.aspx

Principles behind methods
28 | P a g e
study two types of diffusion were considered, confined motion and translational diffusion. For
confined motion the FWHM is independent of Q135
and translational diffusion has a Q
dependent motion given by136
:
Γ(𝑄) =𝐷𝑄2
1+𝐷𝑄2𝜏 (2.21)
with
𝐷 =⟨𝑙2⟩𝑎𝑣
6𝜏 (2.22)
Where D is the diffusion constant and l is the jump distance. As evident by equation 2.20-2.22
the residence times and jump distances measurable is hugely dependent on the Q and ω
resolution and range of the instrument. Therefore, the IRIS instrument was chosen since this
instrument covers the residence times reported for bulk water136
and confined water
systems137-138
, as the main question in this study was if liquid or liquid like diffusion of water
was present in ACC.

Results and discussion
29 | P a g e
3 Results and discussion
In this chapter we discuss the main experimental results that make up the bulk of this thesis.
This chapter is divided into four subchapters with the first part dealing with the initial
experiments and modification to the synthesis route that had to be made to facilitate the
neutron diffraction experiments described in section 3.2-3.4. Here the compositional analysis
of ACC is also described, and shows that the sample composition of ACC as described by
Zou et al.27
can still be reproduced when producing ACC in larger quantities. In addition, this
part also covers an extensive analysis of the composition of AMC and ACMC as it was found
that hydroxide ions coprecipitates with magnesium ions in the amorphous carbonate phase.
Finally the initial n-pdf and IINS measurements of pure ACC and ACC with minor levels of
commonly found additives are shown. These were used to design the further experiments
where it was necessary to use high concentrations of additives to get a clear structural picture.
In the second part, the local structure of ACC is discussed followed by a part covering the
local structure of ACMC and AMC, based on pdf analysis and corroborate by vibrational
spectroscopy measurements. The final part of this chapter concerns the dynamics of water in
ACC/AMC as measured with quasi elastic neutron scattering. The last three parts of this
chapter on ACC/AMC present a consistent description of water in the amorphous phase as
structural water interacting with the ions through cation to oxygen coordination bonds and H
to O hydrogen bonding. The pdf analysis of the amorphous phases also shows the material
consist of a highly disordered phase with broad distribution of binding sites for all species. By
studying two hydration levels for ACC/ACMC/AMC it was found shown that ACC and
ACMC undergoes structural rearrangements upon dehydration which are related to a
reorientation of the carbonate ions. In particular, the amount of oxygen from carbonates
coordinating to each cation increases to compensate for the loss of water binding directly to
the cations. In the AMC this effect was minimal and the loss of water mainly affects the
amount of hydrogen bonds to the anions.
3.1 Synthesizing ACC for neutron experiments
Producing enough ACC for a neutron scattering experiment is difficult due to the large
quantity of material needed and the high instability of ACC. Therefore the synthesis route
used in this study was developed to maximize yield and to ensure that the composition could
be reproduced consistently among different batches. The amorphous carbonate samples used
in this study were produced in a modified version of the synthesis originally reported by Koga
et al.75
and later refined by Zou et al27
(reaction equation is shown below). This synthesis route
has also been shown to produce samples that are structurally similar to the biogenic samples32
.
𝐶𝑎𝐶𝑙2(𝑎𝑞) + 𝑁𝑎2𝐶𝑂3(𝑎𝑞) → 𝐶𝑎𝐶𝑂3 ∙ 1.1𝐻2𝑂(𝑠, 𝐴𝐶𝐶) + 𝑁𝑎𝐶𝑙(𝑎𝑞)
In the original synthesis Zou et al.27
added 2 mL 1M CaCl2 to a 48 mL Na2CO3 solution to
give a Ca/CO3 ratio of one and an initial concentration of 40 mM for both calcium and
carbonate salts after mixing. The samples were extracted by vacuum filtration followed by an

Results and discussion
30 | P a g e
ethanol wash and dried in a desiccator. Using this method a yield of 100-200 mg of sample
was obtained, requiring 25-50 batches for the 5 g of sample needed for a single neutron
diffraction measurement. With 30 min per batch this would require up to 3 days of synthesis
to produce. The main obstacle in producing more ACC was identified as the filtering process
as the filters would get clogged if the concentration was increased. Also, if the reaction
volume was increased, the sample would crystallize before it could be extracted. Therefore a
larger filter was used (13 cm in diameter) with a cellulose acetate filter (0.45 µm pore size).
Figure 3.1: Left) Sample drying rack, holds six samples for drying in a desiccator. Each
sample is placed on a 13 cm wide watch glass. The whole rack fits into a desiccator. Right)
travel desiccator for amorphous samples, holds 10 sample vials at a time each containing ~5
grams of sample.
Figure 3.2: A) Three TGA measurement of ACC showing highly consistent mass loss at 100
°C and 700 °C indicating a consistent hydration level between different batches of the same
synthesis. B) FTIR spectrum of ACMC after 24 hours in a desiccator (red) and a sample
measured after a few hours in a desiccator (black) showing C-H stretching of the CH3 and
CH2 groups from ethanol and a significant overlap between the symmetric stretch of the
carbonate ion and the C-O stretch of ethanol at ~1075 cm-1
.
This allowed for the reaction volume to be increased to 0.5 L giving a yield of 2-2.5 grams of
sample reducing the time to produce enough sample for 1 neutron experiment down to 1 h

Results and discussion
31 | P a g e
plus 24 hours in the desiccator. The bottleneck now became drying the samples to remove the
excess ethanol (figure 3.2B), since this takes 24 h and only one sample could be made per day
per desiccator (of which we only had one). To overcome this problem, a rack was made to fit
six samples in a desiccator at the same time (figure 3.1 left) resulting in a production rate of
~15 grams of sample per day or enough sample for three neutron measurements. This meant
that several sample could be made in the week prior to the neutron measurements taking
place, making multiple measurements possible for a single beam time facilitating limited
parametric studies, such as studying the effect of dehydration and the structural change when
incorporating additives (i.e. Mg2+
). The next challenge was transporting the ACC samples to
the neutron and x-ray facilities as the ACC samples will start crystallizing if remove from the
desiccator for extended periods of time (a few hours).
Figure 3.3: A) amount of magnesium added in solution compared to the amount incorporated
into the ACMC solid. B) O-H stretch and bend regions of AMC measured by FTIR at different
hydration levels obtained via thermal dehydration. A peak maximum at 3300 cm-1
and a
bending mode at 1650 cm-1
at high hydration levels for H2O can be observed. After
dehydration both the stretching and bending motion of water was gone and a peak at 3600
cm-1
remains indicating the presence of OH-. C) TGA measurements of ACC, AMC and
ACMC with 50% Mg/(Mg+Ca). The mass loss at ~100 °C results from evaporation of water,
while at 400°C the loss is due to MgCO3 and Mg(OH)2 decomposition. The final mass loss at
700 °C results from decomposition of CaCO3. D) Hydroxide incorporation in ACMC as a
function of magnesium content showing a linear incorporation of OH- with Mg
2+. The OH
-
content was determined from TGA measurements using equation 3.6.

Results and discussion
32 | P a g e
For this reason, we designed and built a travel desiccator in the rather simple design of a steel
box with a lid and a valve (figure 3.1 right)i holding up to 10 samples of 5 grams each, for
extra security a vial of desiccant was often placed together with the samples to avoid high
humidity which might initiate crystallization. After having addressed the transport and
production issues, it was still necessary to control the composition of the samples produced,
that had to be highly consistent between different batches. Since several samples had to be
made for the same measurement and the sample could not be tested rigorously individually
before the neutron/x-ray measurements due to time constraints, requiring the composition of
the samples to be highly consistent between samples. Furthermore, to ensure a successful
experiment at the neutron source the samples had to be amorphous with no crystal
contaminants. In this respect, the reaction procedure mentioned above had a success rate of
95% (i.e. only 1 in 20 sample showed signs of crystallization) high enough to be considered
acceptable and any crystallized samples could be measured via an express measurement as
offered by the ISIS facility if beam time was available.
To test the composition of the powders, several samples were measured with TGA/DSC
(figure 3.2 A) showing a highly consistent hydration level of 1.10(5) H2O/Ca and a Ca/CO3
ratio of one. FTIR measurements revealed that the samples contained significant amounts of
ethanol directly after extraction and had to be kept in the desiccator for 24 to remove all the
ethanol (figure 3.2 B). This is especially important for samples measured at the TOSCA and
IRIS instruments as ethanol contains a lot of hydrogen. For this reason all the samples were
measured with FTIR prior to the beam time. For ACMC and AMC (see Chapter 3.3 and 3.4
which deal with the structure and dynamic of these materials) the same synthesis procedure as
that for ACC was used, but replacing the CaCl2 with MgCl2 while ensuring that the
(Ca+Mg)/CO3 ratio remained one to one. However, since magnesite139
(MgCO3) is
significantly less soluble compared to calcite140
, calcium is preferentially incorporated in to
the amorphous phase as shown in figure 3.3 A. To correct for this ACMC was synthesized
with an Mg/(Mg+Ca) ratio range from 0 to 1. For each Mg/(Mg+Ca) ratio the synthesis was
performed three times and the magnesium content was shown to be reproducible within ~2%
(figure 3.3A). Infrared analysis indicated the presence of hydroxide in AMC (figure 3.3B).
This is to be expected as Mg(OH)2141
is significantly less soluble than calcite, magnesite and
Ca(OH)2142
. To quantify the amount of hydroxide ion that got incorporated TGA
measurements were used. However, MgCO3 and Mg(OH)2 decompose at the same
temperature and the following derivation was made to determine the ratio of carbonate to
hydroxide.
From charge neutrality, ICP and the FTIR measurements we can assume a composition of:
𝐶𝑎1−𝑥𝑀𝑔𝑥(𝐶𝑂3)1−𝑦(𝑂𝐻)2𝑦 ∙ 𝑛𝐻2𝑂 (3.1)
where x is known from ICP measurements and the mass losses after dehydration (above 250
°C) observed in the TGA measurement originate from the following reaction occurring
between 250 °C and 800 °C:
i The desiccator had to be checked in for the flight, due to the somewhat “bomb like” appearance, resulting in a
rather nerve racking flight time to see if the luggage had arrived with the flight.

Results and discussion
33 | P a g e
𝐶𝑎1−𝑥𝑀𝑔𝑥(𝐶𝑂3)1−𝑦(𝑂𝐻)2𝑦 → 𝐶𝑎1−𝑥𝑀𝑔𝑥𝑂 + (1 − 𝑦)𝐶𝑂2 + 𝑦𝐻2𝑂 (3.2)
From TGA mf and Δm can be determined as the final mass of the remaining oxide and the
mass loss from 250-800 °C respectively, i.e. loss of water and carbon dioxide. Then y in
equation 3.1 can be determined from the ratio between Δm and mf assuming as follows:
Δ𝑚
𝑚𝑓= (1 − 𝑦)
𝑀𝐶𝑂2
𝑀𝑜𝑥+ 𝑦
𝑀𝐻2𝑂
𝑀𝑜𝑥 (3.4)
Here MCO2 and MH2O is the molar mass of CO2 and H2O respectively and Mox is the molar
mass of the calcium/magnesium oxide given by:
𝑀𝑜𝑥 = (1 − 𝑥)𝑀𝐶𝑎 + 𝑥𝑀𝑀𝑔 + 𝑀𝑂 (3.5)
Rewriting equation 3.4 gives:
𝑦 =(
Δ𝑚
𝑚𝑓−
𝑀𝐶𝑂2𝑀𝑜𝑥
)
(𝑀𝐻2𝑂
𝑀𝑜𝑥−
𝑀𝐶𝑂2𝑀𝑜𝑥
) (3.6)
Several samples with 0 ≤ x ≤ 1 were measured and 2y=OH/(Ca+Mg) was plotted as a
function of x in figure 3.3D. A linear correlation was observed between x and 2y of
2y=0.64(8)x giving a composition of:
𝐶𝑎1−𝑥𝑀𝑔𝑥(𝐶𝑂3)1−0.32(4)𝑥(𝑂𝐻)0.64(8)𝑥 ∙ 𝑛𝐻2𝑂 𝑤𝑖𝑡ℎ 𝑛 = 1.1 − 1.2
As seen from figure 3.3 D the amount of hydroxide ions incorporated varies between
syntheses and despite several outliers a linear correlation is observed with a R2=0.97.
However, this variation between syntheses may result in minor errors when analyzing the
ACMC and AMC samples as n, x and y in equation 3.1 all contribute to determining the
composition of the sample which is used as an input parameter for the EPSR modelling. This
is less of a problem with ACC as n is the only varying parameter and as seen in figure 3.2 A
the hydration level is near constant in these samples.
3.1.1 Additives and the structural effect they may have on ACC
As mentioned in chapter 1.3.2 and 1.4 there are many additives that can stabilize ACC and
several were measured to investigate if any of these affected the structure of ACC (figure 3.4).
Focus was placed on the inorganic additives and four of the most common ones were chosen.
Sodium and hydroxide ions are common impurities in synthetic ACC and are found in 0-5%
compared to calcium27, 65
. In biogenic samples magnesium and phosphate ions are the most
commonly found impurities21, 38
, with Mg2+
generally found in the range of 0-20%
Mg/(Ca+Mg), while phosphate containing samples come in both ACC12, 32
and amorphous
calcium phosphate132
versions and compositions in between21
. As seen from figure 3.4 A and
B the n-pdf of the samples with minor concentrations of impurities (~5% impurity/Ca2+
) are
very similar, the main difference is found in the n-pdf of phosphate stabilized ACC (figure 3.4
B) were two peaks appear at 1.6 Å and 2.4 Å. However, these two peaks originate from the P-
O and O-O intra molecular distances and do not give significant information on how it affects
the general structure. IINS spectra were also performed on the same samples and again no

Results and discussion
34 | P a g e
difference was found between the samples (figure 3.4 C). The density of all samples was also
measured and gave the same result within 2% of the pure ACC. Given the small difference in
composition, density and pdf, it was deemed that the structural changes that may occur from
small amount of additives are confined to the local environment of the additives itself and
does not propagate throughout the sample. Therefore, larger concentrations were needed to
understand the local environment of around these common additives. This was done for both
magnesium and phosphate as additives with samples that were one-to-one mixtures of
calcium/magnesium and carbonate/phosphate. However, at the time of writing only the
magnesium samples have been fully analyzed (see chapter 3.3).
Figure 3.4: Neutron pdf measured at ISIS (A), ILL (B) and IINS spectra(C) of ACC with
various additives present in small amounts (~5% relative to calcium). X-pdf of these samples
was not measured as significant n-pdf and IINS beam time was available during the first year
of my thesis while x-pdf did not become available until the second year. The four samples
were chosen to highlight the effects of the most common additives on the structure of ACC.

Results and discussion
35 | P a g e
3.2 Local structure in amorphous calcium carbonate and the effect of dehydration
As mentioned in chapter 1.3 there has been several structural studies on ACC reported in the
literature, but so far only a handful of structural details have been elucidated, namely the Ca-
O nearest neighbor distance and coordination number and the presence of multiple hydrogen
binding sites. But this leaves several key structural aspects poorly understood, e.g. the
distribution of hydrogen bonding as ACC contains two hydrogen bond acceptors, oxygen
from carbonate and water and how the calcium and carbonate ions interact. It is also unclear
how this changes with the hydration level and if the water is located in pores63
as confined
water or as structural water143
coordinated to the ions. To answer this we present here an
atomistic model of ACC derived from empirical potential structural refinement (EPSR)61, 111,
113 based on simultaneous fitting of X-ray and neutron total scattering data. To elucidate the
effect of hydration a ACC sample was thermally dehydrated at 100 °C for 90 min to give a
hydration level of n=H2O/Ca=0.50(5) giving a total of two samples; n=1.1 and n=0.5. Neutron
and optical vibrational spectroscopy was used to support the findings of the EPSR model.
3.2.1 Sample characterization
Figure 3.5: Example TGA measurements of ACC with n=1.1(left) and n=0.5 (right).
Measurements were made for three samples at each hydration level and gave a hydration
level of 1.1±0.05 and 0.5±0.05 and a Ca/CO3 ratio of 0.99±0.01 for both samples.
The ACC as prepared had the composition CaCO3·nH2O with n = 1.1±0.05 and a partially
dehydrated sample with n = 0.5±0.05 was prepared by heat treatment. The composition was
determined by TGA (figure 3.5). Using Ar-gas pycnometry the mass densities were
determined to be 2.282(2) and 2.428(2) g/cm3 for the samples with n = 1.1 and n = 0.5,
revealing a densification during dehydration.
The neutron and X-ray structure factors and pdfs of both samples are shown in figure 3.6. In
the pdfs all correlations below 2.3 Å originate from the intramolecular distances in the
carbonate ions and water molecules, with the peak below 1 Å in the x-pdf originating from
truncation errors in the fourier transform62
. The first intermolecular correlation peak
corresponds to the Ca-O bond at 2.4 Å (figure 3.6 B). The high intensities of the peaks at 4 Å

Results and discussion
36 | P a g e
and 6 Å in the X-ray pdfs compared to the neutron pdfs can be attributed to the Ca-Ca
correlations, to which the X-ray measurements are particularly sensitive. Given the high
similarity between the pdf and structure factors of the two samples (figure 3.6) it is difficult to
determine if there is a structural difference based on the pdf alone and a full deconvolution of
the pdf is needed taking density and composition into account.
Figure 3.6: A) Structure factor of ACC measured using x-rays and neutron sources and B) the
corresponding pdf.
3.2.2 EPSR fitting of amorphous calcium carbonate
For the EPSR model a cubic box was made with the following specification:
Table 3.1: model parameters for ACC modeling
Sample Number of
Ca
Number of
CO3
Number of
H2O
Total
number of
atoms
box side
length
(nm)
Atomic
density
(atoms/Å3)
n=1.1 200 200 220 1660 2.59 0.095
n=0.5 200 200 100 1300 2.46 0.087
The box size was made to ensure that it was large enough to avoid finite size effects and the
model parameters (table 3.1) was chosen to reproduce the composition and density
determined for the samples. To ensure the right internal structure of the carbonate and water
molecules the following constraints was made:
Table 3.2: Intra-molecular constraints
H2O
O-H distance: 0.976 Å
H-O-H angle: 104.5°
CO3
C-O distance: 1.2905 Å
O-C-O angle: 120°

Results and discussion
37 | P a g e
These constraints defined the intra molecular potential (equation 2.11). The angles were taken
from literature50, 107
and the distances were determined from the peaks around ~1 Å (O-H
distance in the water molecule) and ~1.3 Å (C-O distance in the carbonate ion) in the pdf
(figure 3.6 B). The model was energy minimized via a Monte Carlo simulation using the
following potentials (equation 2.13-2.15):
Table 3.3: Interatomic/molecular potentials
Atom ε [kJ/mole] σ [Å] Charge [e]
Ca 0.175 3.1 1.86
O 0.1625 3.6 -1.113
C 0.5021 3.742 1.479
Owater 0.65 3.166 -0.8476
Hwater 0 0 0.4238
The potentials used here are based on the work of Coung et al.144
for the calcium and
carbonate ions while the water potential is taken from the work of Imberti et al107
. The
structure factor computed from the energy minimized model was compared to the
experimental data and refined via addition of empirical potentials until optimal agreement was
achieved.
To gain sufficient statistics in order to accurately describe the structure of ACC, an ensemble
of at least 10.000 box configurations obtained with the refined potentials was averaged. The
final fit is shown in figure 3.7, where all the main features are reproduced in both the structure
factors (figure 3.7 A and C) and in the pdfs (figure 3.7 B and D). A mismatch at very low Q
(figure 3.7 C) is observed in the neutron structure factor and is caused by the high sensitivity
to the inelastic scattering correction in this range. A slight mismatch is found in the intensity
of the negative peak at ~1 Å in the neutron data suggesting that the water content might be
overestimated. However, the low r region in the pdf is highly susceptible to experimental
noise and if the water level was incorrect a mismatch of the high Q region in the structure
factor should also be present, as this is dominated by intra-molecular distances62
. Since the
structure factor is well reproduced at high Q and the TGA analysis consistently confirmed the
hydration level it is assumed that this mismatch is caused by errors in the Fourier transform
and not due to errors in the assessment of the composition. It also has little effect on the fitting
procedure as this is performed on the structure factor and not on the pdf. From the final model
the pdf can be deconvoluted into the 15 ppdfs as shown in figure 3.8. For clarity, the different
types of oxygen will be referred to as Oc, Ow and O for oxygen from carbonate, water and
both respectively.
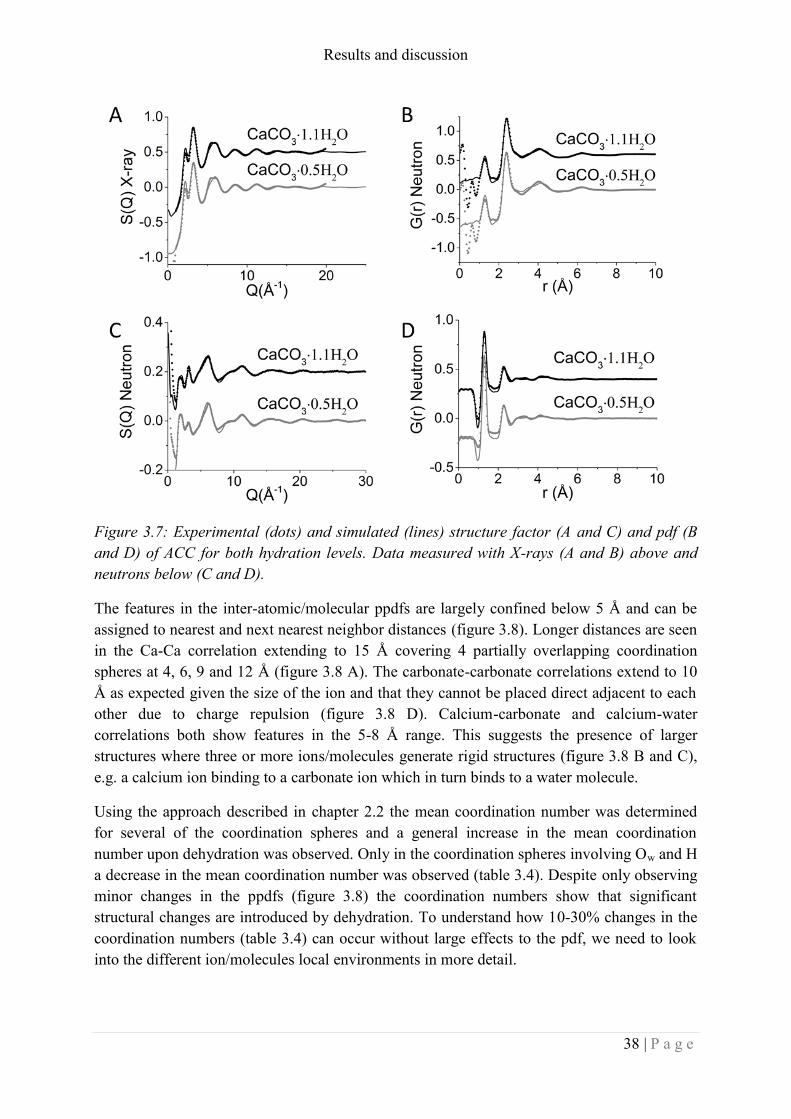
Results and discussion
38 | P a g e
Figure 3.7: Experimental (dots) and simulated (lines) structure factor (A and C) and pdf (B
and D) of ACC for both hydration levels. Data measured with X-rays (A and B) above and
neutrons below (C and D).
The features in the inter-atomic/molecular ppdfs are largely confined below 5 Å and can be
assigned to nearest and next nearest neighbor distances (figure 3.8). Longer distances are seen
in the Ca-Ca correlation extending to 15 Å covering 4 partially overlapping coordination
spheres at 4, 6, 9 and 12 Å (figure 3.8 A). The carbonate-carbonate correlations extend to 10
Å as expected given the size of the ion and that they cannot be placed direct adjacent to each
other due to charge repulsion (figure 3.8 D). Calcium-carbonate and calcium-water
correlations both show features in the 5-8 Å range. This suggests the presence of larger
structures where three or more ions/molecules generate rigid structures (figure 3.8 B and C),
e.g. a calcium ion binding to a carbonate ion which in turn binds to a water molecule.
Using the approach described in chapter 2.2 the mean coordination number was determined
for several of the coordination spheres and a general increase in the mean coordination
number upon dehydration was observed. Only in the coordination spheres involving Ow and H
a decrease in the mean coordination number was observed (table 3.4). Despite only observing
minor changes in the ppdfs (figure 3.8) the coordination numbers show that significant
structural changes are introduced by dehydration. To understand how 10-30% changes in the
coordination numbers (table 3.4) can occur without large effects to the pdf, we need to look
into the different ion/molecules local environments in more detail.

Results and discussion
39 | P a g e
Figure 3.8: ppdfs of the 15 atomic pair in ACC. with pairs between A) calcium and calcium,
B) calcium and carbonate, C) calcium and water, D) carbonate and carbonate, E) carbonate
and water and between water molecules(F).

Results and discussion
40 | P a g e
Table 3.4: Coordination number of specific pair given as number of atom 2 around atom 1.
Atom 1 Atom 2 Rmin
(Å)
Rmax
(Å)
CN
n=1.1
esd
n=1.1
CN
n=0.5
esd
n=0.5
Change
%
Ca Ca 2.5 5.1 5.7 1.5 6.8 1.3 19
Ca Ca 5.1 7.2 11.5 2.3 13.2 2.2 15
Ca Oc 2.0 3.1 5.8 1.2 6.3 1.1 10
Oc Ca 2.0 3.1 1.9 0.7 2.1 0.7 10
Ca C 2.0 3.0 1.1 0.9 1.2 0.9 8
C Ca 2.0 3.0 1.1 0.8 1.2 0.8 8
Ca C 3.0 4.1 3.7 1.3 4.1 1.4 12
C Ca 3.0 4.1 3.7 1.2 4.1 1.2 12
Ca Ow 2.0 3.2 1.4 1.1 0.9 0.9 -40
Ow Ca 2.0 3.2 1.3 0.7 1.7 0.7 32
Ca H 2.0 3.8 5.1 3.0 3.0 2.2 -41
H Ca 2.0 3.8 2.3 1.0 3.0 0.9 29
Oc Ow 2.0 3.9 2.7 1.7 1.5 1.2 -41
Ow Oc 2.0 3.9 7.3 2.1 9.3 1.8 28
Oc H 1.2 2.2 0.5 0.7 0.3 0.5 -41
H Oc 1.2 2.2 0.7 0.6 0.9 0.5 29
Ow Ow 2.0 3.9 4.1 2.0 2.0 1.5 -51
Ow H 1.2 2 0.4 0.6 0.2 0.5 -51
H Ow 1.2 2 0.2 0.4 0.1 0.3 -51
3.2.2.1 Calcium and carbonate environment
The local environment of calcium is shown in figure 3.8 A-C. Figure 3.8 A shows the Ca-Ca
ppdf, where four coordination spheres are observed with almost no difference between the
two samples. However, when the mean coordination number is calculated for the first two
coordination sphere at 4 and 6 Å and increase of 19% and 15% in the number of calcium
around calcium is observed respectively for the first and the second sphere (Table 3.4). As
shown in Figure 3.9 A, the distribution of coordination numbers in these coordination spheres
are characterized by a broad distribution for both spheres. In the dehydrated sample (n=0.5)
the distribution is shifted to higher numbers, as expected, but the width of the distribution
remain nearly the same, indicating that there is no increased order in the system. The Ca-O
correlation are shown in figure 3.8 B and C, in both the Ca-Oc and Ca-Ow ppdf a sharp peak is
seen at ~2.4 Å assigned to direct bonding between calcium and oxygen. By analyzing the

Results and discussion
41 | P a g e
coordination numbers it can be observed that all calcium ions are bonded to carbonate ions
and vice versa, as expected. However, only 77% of the calcium ions bind to water molecules
and they drop to 59% after dehydration. Similarly, 10% of the water is not binding directly to
any calcium ions dropping to 3% after dehydration. In both samples a mean coordination
number of oxygen around calcium is 7.2. For n=1.1 there are 5.8 oxygens from Oc and 1.4
from Ow while for n=0.5 there are 6.3 oxygens from Oc and 0.9 from Ow. As seen in figure 3.9
B this comes from a shift in the distribution of coordination numbers to lower numbers for Ow
while the distribution for Oc goes to higher numbers, suggesting that the binding site left
behind by Ow is taken over by Oc.
As mentioned in chapter 2.2 the angle between ligands binding to the same cation is very
sensitive to the local geometry and in figure 3.9 C and D the angular distributions for Oc and
Ow around calcium are shown. In the angular distribution of Oc (figure 3.9 C) two preferred
angles are observed at ~50° and 70°. Comparing with the structure of monohydrocalcite53
these can be assigned to oxygens from the same carbonate ion binding to the same calcium
ion (i.e. bidentate binding) and oxygens from adjacent carbonate ions binding to the same
calcium (i.e. monodentate binding) respectively.
Figure 3.9: A) distribution of coordination numbers for the first two Ca-Ca coordination
spheres at 4 and 6 Å (figure 3.8 A). B) Distribution of coordination number for the first
coordination sphere of Ow and Oc around Ca at 2.4 Å (figure 3.8B and C). Angular
distribution showing the angle between oxygens binding to the same calcium ion for Ow (C)
and Oc (D).

Results and discussion
42 | P a g e
The lack of any peak above 100° reflects the broad distribution of coordination number
(figure 3.9 B) since averaging all the different types of coordination spheres smears out any
correlations at higher angles. For the angular distribution of Ow (figure 3.9 D) two preferred
angles are also present at ~70° and ~140° from adjacent and next nearest neighbor water
molecules binding to the same calcium ion. Comparing this with the local structure of calcium
ions in solution the two angles are characteristic of an 8-fold square antiprism coordination145
,
suggesting a correlation between the structure in the amorphous phase and the hydration of
the ion in solution. However, this angular distribution can only be calculated for calcium ions
with two or more water molecules binding to Ca2+
directly, 43% and 21% of the calcium
centers for n=1.1 and n=0.5 respectively. The peak between 2.5 and 5 Å in the ppdf relating to
calcium and carbonate (figure 3.8 B) reveals how the carbonate is binding to the calcium. The
split peak in the Ca-C ~3 Å can be assigned to bidentate (2.9 Å) and monodentate(3.6 Å)
binding in a ratio of roughly 20% bi- and 80% mono-dentate (table 3.4). This is also present
in the shape of second peak of the Ca-Oc ppdf although to a lesser extent. In the Ca-H ppdf
(figure 3.8 C) one broad peak is shown with a significant overlap with the first peak in the Ca-
Ow ppdf, showing that while the H generally points away from the cation it is free to
coordinate oxygen in any direction away from the calcium ion. To view this in 3D the sdf is
plotted for calcium binding to carbonate and water in figure 3.10.
Figure 3.10: SDF of the Ca (yellow) coordinating to the carbonate ion (A and C) and the
water molecule (B and D) for both n=1.1(A and B) and n=0.5 (C and D). In B and D the SDF
of carbonate (red) is also shown for clarity. The Surface is plotted here in the range 2-5 Å
away from the C and O atom in carbonate and water respectively using an isosurface value of
0.15.

Results and discussion
43 | P a g e
The sdf of the carbonate ion shows that there are two distinct binding site bidentate and
monodentate as seen in the ppdfs as well (figure 3.8 B), it also shows that the site are
anisotropic in shape (figure 3.10 A and C). The sdf is spread out towards the normal to the
molecular plane suggesting that there is some freedom to bind to the carbonate at different
angles in this direction. In the plane of the carbonate ion there is little spread in the sdf
suggesting that the Ca has to bind in either bidentate or monodentate positions with some
spread in the monodentate binding site which is expected as this site is more open. For
calcium binding to water only one site is observed. This site is located on the side where the
oxygen is exposed, as expected. The sdf is anisotropic with some spread towards the lone pair
positions on the Ow (figure 3.10 B and D). In both cases the dehydration only has a small
effect leading to a minor increase in the anisotropy of the sdf.
3.2.2.2 Hydrogen-bonding in amorphous calcium carbonate
Figure 3.11: A) distribution of coordination numbers for the first Ow-Ow coordination sphere
at 2.7 Å (figure 3.8 F). B) Distribution of coordination number for the two hydrogen bonding
peaks at 1.8 Å in the O-H ppdf (figure 3.8 E and F). Angular distribution showing the angle of
the hydrogen bond between water and carbonate ions(C) and between water molecules (D).
Hydrogen bonding between water and carbonate/water is the second attractive interaction in
ACC, the other and stronger one being the calcium to oxygen bonding. The ppdf related to
hydrogen bond are shown in figure 3.8 E and F. The hydrogen bond is evident by the peak at
1.8 Å in the O-H ppdfs and the peak at 2.7 Å in the O-O ppdfs. Although the O-O distance of
2.7 Å is not unique to oxygens in close proximity due to hydrogen bonding. Analyzing the
coordination numbers of the 1.8 Å peak in the O-H ppdfs showed that only 10% of the water

Results and discussion
44 | P a g e
molecules are hydrogen bonded with other water molecules, while all water molecules are
hydrogen bonded to a carbonate ion via at least one hydrogen bond. The coordination number
for Ow around Ow for n=1.1 is 4.1 consistent with the tetrahedral coordination found in liquid
water108
(table 3.4). However, when looking at the distribution of coordination numbers, the
coordination number ranges from 0 to 10 (figure 3.11 A) and while 10 is a high number is it
similar to what is found for ikaite52
for the same Ow-Ow distances (table 3.4). The mean
coordination number of Ow binding to H (i.e. hydrogen not on the same water molecule) is 0.2
suggesting that while water molecules are in close proximity to each other there are little
direct interactions between them. Also, this can be inferred from the distribution of
coordination numbers for Ow around H, where 80% (n=1.1) to 90% (n=0.5) of the hydrogen
are not forming hydrogen bonds to any Ow (figure 3.11 B). The 1.8 Å peak in the Oc-H ppdf is
more prominent compared to the one in the Ow-H ppdf (figure 3.8 E and F), indicating a
preferred hydrogen bond between water and carbonate compared to hydrogen bonds between
water molecules. This is also seen in the distribution of coordination number for Oc binding to
H (figure 3.11B) where 63% (n=1.1) and 78% (n=0.5) of the hydrogens are hydrogen bonded
to Oc. In figure 3.11 C and D the angle of the hydrogen bond are shown. The water-carbonate
hydrogen bond is highly linear similar to what is found in ikaite and monohydrocalcite52-53
(figure 3.11 C). The water-water hydrogen bonds although also mostly linear, exhibits a
shoulder on the angular distribution at 120° (figure 3.11 D), suggesting a weaker hydrogen
bond.
Figure 3.12: SDF of the water (dark green) coordinating to the carbonate ion (A and C) and
the water molecule (B and D) for both n=1.1(A and B) and n=0.5 (C and D). The isosurface
is plotted here in the range 2-5 Å away from the C and O atom in carbonate and water
respectively using an isosurface value of 0.15 for the carbonate sdfs and 0.05 for the water
sdfs. The isosurface value for the water-water sdf was lowered as the correlations between
water molecules are weak and was not distinguishable at higher values.

Results and discussion
45 | P a g e
In figure 3.12 the sdf of water around carbonate and water are shown. The sdf of water around
carbonate (figure 3.12 A and C) show that water preferentially binds between the Oc
(bidentate bonding). However, as evident from the double peak in the ppdf (figure 3.8 E), part
of the water will also bind on the outside of the carbonate molecule. The bidentate binding is
unexpected as this binding site is absent in both hydrated calcium carbonate minerals52-53
. The
sdfs of hydrogen bonding to water (figure 3.9 B, D and figure 3.12 B, D) show that the Oc are
placed in a narrow binding site directly on top of the H (figure 3.9 B and D). In contrast to
this the water-water sdf does not show a clear binding site given the weak correlation between
the water molecules, although there is a correlation on top of the H from the limited hydrogen
bonding between water molecules present in the structure (figure 3.12 B and D).
3.2.2.3 Large scale structure in amorphous calcium carbonate
Figure 3.13: Cluster size distribution for the two ACC sample with n=1.1 and n=0.5 with
water molecules considered to be in the same cluster if: A) water molecules share a hydrogen
bond. B) Water molecule shares a hydrogen bond with a carbonate C) Ow-Ow distances are
within rcut as given by Bushuev et al. The large population of clusters at ~200 reflects that the
box contains 220 water molecules and these clusters are in principle infinite, due to the
periodic boundary conditions. D: cumulative sum of water molecules in a cluster as a
function of the cluster size distribution shown in C.
Given the extensive attention to large scale structure involving water pores or water
percolation, the EPSR model was used to analyze the presence of confined water pockets and
inter connected water pockets43, 63, 69
. To scrutinize the presence of water percolation, water
molecules were counted as being in the same cluster if the Ow-Ow distance is smaller than rcut

Results and discussion
46 | P a g e
(figure 3.12 C and D, rcut=3.55-3.8 Å as defined by Bushuev et al.69
). A second definition of
percolation was also used to determine not just if the water molecules are in close proximity
but also if they are linked together by hydrogen bonding, allowing only hydrogen bonds to
connect water molecule (figure 3.13 A) and allowing water molecules to be connected via
hydrogen bonding to same carbonate ion (figure 3.13 B). With this definition, percolation
would result in clusters containing ≈220 or ≈100 water molecules for n = 1.1 and n = 0.5,
respectively (i.e. almost all of the water molecules in the box). Based on the rcut values
percolations were found in the sample with n = 1.1, where approximately 80 – 90 % of the
water molecules (≈ 220) are found in clusters, while no clusters with more than 40 molecules
are found for the sample with n = 0.5 as expected from the work of Bushuev et al.69
(figure
3.13 C and D). However, if the water cluster is defined by hydrogen bonding between water
molecules, no clusters with more than 25 molecules are found (figure 3.13 A). For hydrogen
bonding between water and carbonate ions no clusters with more than 50 molecules are found
(figure 3.13 B). This reveals that no long-range hydrogen bonded networks are present in
either sample (figure 3.13 A and B). The identification of a water percolated structure, then,
critically depends on the definition: samples with n = 1.1 resides above the percolation if
defined by Bushuev et al.69
, but water molecules inside these clusters are only infrequently
linked by hydrogen bonds between each other and, in this sense; we find no confined “liquid”
water structures in any of the samples.
3.2.3 Vibrational spectroscopy of amorphous calcium carbonate
To substantiate the findings of the x-ray and neutron total scattering measurements analyzed
through the EPSR model, vibrational spectroscopy was used. Particular focus was put on the
change in the carbonate environment using FTIR and the interactions between water and the
ions using FTIR and IINS. To emphasis the shift in the vibrational band a third hydration
level was added with an n=H2O/Ca ratio of 0.2 (only measured with FTIR). The vibrational
modes of the carbonate and their changes with hydration were investigated with infrared
(FTIR) and Raman spectroscopy (figure 3.14). The ν1 (symmetric stretch) and ν3 (asymmetric
stretch) bands shift to higher frequencies upon dehydration (figure 3.14 B and F, very small
shift for the ν1 band) and the intensity of the ν2 (out-of-plane bending) band increases relative
to the ν3 band (figure 3.14 D), confirming a change in the local environment of the carbonate
ions. On the ν1 band, a shoulder at 1050 cm-1
decreasing with dehydration is observed (figure
3.14 E) while the splitting of the ν3 band increases at lower hydration levels (figure 3.14 F).
This band is sensitive to carbonate-related hydrogen bonding and an increase in the splitting
indicates a decrease in hydrogen bonding146
, in agreement with the X-ray and neutron
scattering results. The vibrational modes of water were compared to liquid water and to a
saturated solution of Na2CO3. The broad O-H stretching band at 3300 cm-1
of H2O in ACC
samples and in the Na2CO3 solution show a longer tail towards the low frequency side
compared to pure water, suggesting strong hydrogen bonding between carbonate ions and
water molecules147
. This is confirmed by a shift in the bending mode at 1650 cm-1
found in
both the ACC and carbonate solution spectrum (figure 3.15).
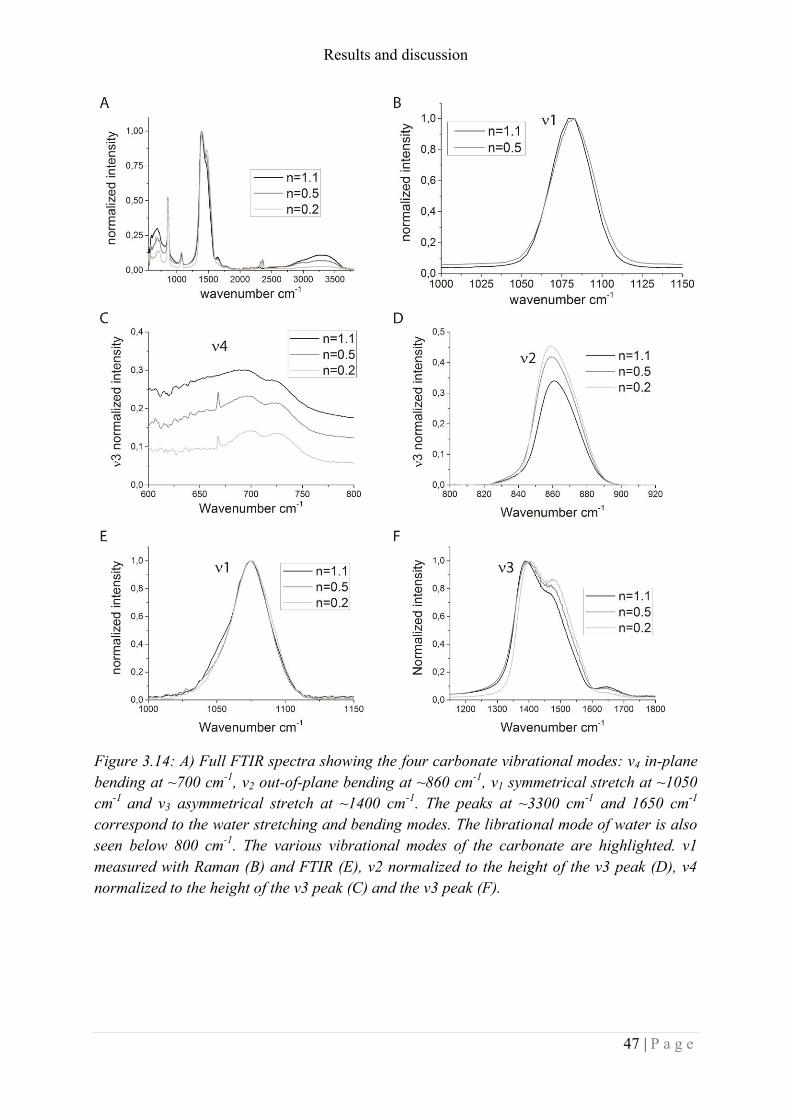
Results and discussion
47 | P a g e
Figure 3.14: A) Full FTIR spectra showing the four carbonate vibrational modes: ν4 in-plane
bending at ~700 cm-1
, ν2 out-of-plane bending at ~860 cm-1
, ν1 symmetrical stretch at ~1050
cm-1
and ν3 asymmetrical stretch at ~1400 cm-1
. The peaks at ~3300 cm-1
and 1650 cm-1
correspond to the water stretching and bending modes. The librational mode of water is also
seen below 800 cm-1
. The various vibrational modes of the carbonate are highlighted. ν1
measured with Raman (B) and FTIR (E), ν2 normalized to the height of the ν3 peak (D), ν4
normalized to the height of the ν3 peak (C) and the ν3 peak (F).

Results and discussion
48 | P a g e
Figure 3.15: FTIR spectra of ACC, H2O and a saturated Na2CO3 solution. Showing the water
bending mode at ~1650 cm-1
and the O-H stretch mode at ~3250 cm-1
. The spectra have been
rescaled to obtain comparative intensities in the O-H stretch bands.
The vibrational modes at very low frequencies, measured by IINS (figure 3.16 A), are
assigned to vibrations of inter molecular bonds involving H, in this case between water and
the ions. The ACC spectra were compared to the spectra of several compounds available from
the online TOSCA database. The spectra show two regions of interest; the translational region
(20-400 cm-1
) and the librational region (400-1000 cm-1
). The low frequency edge of the
librational bands is at 400 cm-1
typical of water binding to a single cation128
, as expected from
the total scattering analysis where ~40% of the water molecules coordinate to one Ca. The
translational band shows a sharp Ca-OH2 stretch band at 85 cm-1
, indicating that the Ca-OH2
bond is weaker in ACC than in MHC where the Ca-OH2 stretch is located at 157 cm-1
(figure
3.16 B).
Figure 3.16: IINS spectra of ACC with n=1.1 and n=0.5 performed at <30 °K (A) and
comparison of ACC (n=1.1), monohydrocalcite (MHC), low density amorphous ice (LDA ice)
and water on a PdO catalyst (B). The band seen at 20-400 cm-1
originate from the
translational modes and the bands at 400-1000 cm-1
originate from librational modes of the
water molecules as explained in chapter 2.3.1128
.

Results and discussion
49 | P a g e
The absence of a peak in the 200-400 region rules out any large scale hydrogen bond network
as found in both amorphous (e.g. low density amorphous ice126
) or crystalline (e.g. MHC)
compounds containing hydrogen bonded networks (figure 3.16 B). The IINS spectra show
considerable similarity to that of disordered water bound to the surface of a PdO catalyst133
and to that of water in amorphous calcium phosphate, in which local hydrogen bonding
interactions exist but there is no extended hydrogen bonded network132
.
3.2.4 Discussion
The EPSR model was compared to the previously published structural analysis of ACC and it
was found that the Ca-O distances of ~2.4 Å similar to that found by previous EXAFS6, 29, 33,
45-46, 48-49, 55, 148, NMR spectroscopy
64 and diffraction studies
43, 63. The mean coordination
number of oxygen binding to calcium reported in literature for both biogenic and synthetic
ACC ranges from 4 to 8, with most studies reporting values around 6-7, with values for
synthetic ACC29, 43, 70
close to the coordination number of 7.2 found in this study. The broad
distribution in coordination numbers (figure 3.9 B) is similar to what was reported by
Goodwin et al.63
(figure 1.2 B). The percolation analysis showed that water percolation may
exist similar to what was described by Bushuev et al69
, but that water in these percolation are
only infrequently hydrogen bonded together. Unlike the previous studies that have used
EPSR43
and RMC63
we found no unphysical bond distance in our model, nor were there any
charge separation present. All the direct bond distances found in the model, i.e. calcium to
oxygen bond and hydrogen to oxygen bonds were very similar to what has been reported for
the crystalline phases50-54
. We also found that the nearest neighbor coordination numbers were
within the range reported for the crystalline calcium carbonates50-54
. The comparison with the
previously published experimental data and with the known crystalline phases show that the
model may indeed be accurate as nothing was found to contradict the model.
The deconvolution of the pdf into the various ppdfs showed correlation up to 5 Å for most of
the pairs originating from direct interactions between ion/molecules (figure 3.8). The pairs
that showed longer correlation lengths (up to 15 Å) were the pairs related to the carbonate
molecules or the highly charged Ca ion, indicating that order beyond the first coordination
sphere is introduced by the strong repulsion between highly charged atoms or via sterical
constrains generated by rigid molecular structure. This correlation can reach long distances
when these are combined as seen in the carbon-carbon ppdf related to adjacent carbonate ions
that reaches >10 Å, since this correlation is caused by multiple carbonate ions sharing the
same calcium ions to form a rigid structure. The coordination number distributions were
calculated for all coordination spheres mentioned in table 3.4 but only shown for a few
coordination spheres (figure 3.9 A, B and 3.11 A, B). These showed a broad distribution for
all coordination spheres, except the ones where sterical constrains limited the coordination
number as seen in the first coordination sphere of O around H (figure 3.11 B). This reflects
that there is a wide diversity of binding site in ACC caused not only by the amorphous nature
of ACC but also by the numerous combinations of Ow and Oc making up the local
environment of the calcium ions. The diversity in binding site for the various ion/molecules
making up ACC placed a huge requirement for any structural analysis of ACC as simplistic
models149-150
such as the small box models mentioned in chapter 1.5 cannot fully describe this
disorder.

Results and discussion
50 | P a g e
The dehydration process resulted in a general increase in the mean coordination number (table
3.4). This is likely caused by the removal of water molecules from the calcium ions,
generating oxygen “vacancies” on the calcium ion (figure 3.9 B) evident from the shift of the
distribution of coordination numbers for oxygen from water around calcium to lower
numbers. This in turn induced a reorientation of the carbonate molecule to remove the
vacancy and maintain the same mean coordination number of oxygen around calcium causing
an increased mean number of calcium ions binding to each carbonate ion and vice versa
(figure 3.9 B and table 3.4). Consistent with the increase mass density of the dehydrated
sample (n=0.5) compared to the as prepared sample (n=1.1).
The angular distribution of oxygen from carbonate around calcium only showed preferred
angles below 100° indicating that the angle between adjacent carbonates (Oc) in most the
calcium sites are close to 70° (figure 3.9 C). The lack of preferred angle above 100° reflects
that these angles are strongly dependent on the coordination number50-54
and is averaged out
by the wide distribution of coordination numbers (figure 3.9 B). The two preferred angles
(figure 3.9 D) of 65° and 140° between oxygens from water binding to Ca are reminiscent of
the values observed for the square antiprism coordination of the Ca ion in solution145
, but the
combination of angles is not present in any of the known hydrated minerals nor do they show
the squared antiprism coodination52-53
, suggesting that the hydration shell of the ion may be
partially preserved during the precipitation event. This is further corroborated by the high
similarity of the O-H stretch bands in the FTIR spectra of the ACC sample and that of the
saturated Na2CO3 solution. Our model indicates that water is highly important to the structure
of ACC as it adopts conformations that are comparable to the average structure of water
interacting with ions in solution. Although the water in ACC are likely to be highly static,
while water bound to ions in solution is highly labile151
. No evidence was found for
conformations close to those found in any of the crystalline compounds. This is in good
agreement with ACC forming via spinodal decomposition152-154
, where precipitation occurs
instantly by instability of the solution and where dissolution/reprecipitation of ions is very
limited causing the hydration water associated with the ions to get trapped during the
precipitation event.
Several binding sites for water were found in ACC, with hydrogen bonding occurring mainly
between water and carbonate and less frequently water hydrogen bonded to other water
molecules. However, all the water molecules were found to bind to the carbonate molecule
through at least one hydrogen bond. The water was also found to coordinate calcium for over
90% of the water molecules. Since all the water molecules were found to have water-anion
bonds and most binding to both calcium and carbonate ions, the water can best be described
as structural rather than a mixture of structural, mobile and liquid like as have been suggested
by previous studies56, 59
. The different hydrogen bonding environments could explain the fact
that NMR studies57-59
report multiple mobility’s for hydrogen. However, the model presented
here is purely structural, making dynamical considerations only possible at a speculative
level. Moreover, our results suggest that the observation of different dehydration rates in
ACC, as measured by TGA, is related to a gradual change in local structure upon dehydration
rather than originating from an initial state with distinct water species59
. This also implies that

Results and discussion
51 | P a g e
molecular rearrangement, at least to some extent, takes place at much lower temperature than
the crystallization temperature.
The addition of vibrational spectroscopy corroborated the findings in the EPSR model. The
FTIR analysis showed that hydrogen bonding to the carbonate ion was lowered during
dehydration as evident by a splitting of the asymmetric stretch of the carbonate ion (figure
3.14 F) as suggested by the EPSR model (table 3.4). The change in the intensity of the in-
plane bending compared to the asymmetrical stretch band (figure 3.14 D) also show a change
in the local environment of the carbonate ion155
, likely caused by a change in the number of
calcium ions coordinating to the carbonate ion (table 3.4). The IINS spectrum (figure 3.16)
showed that the water molecule was bound to calcium by the position of the translational
mode, consistent with the EPSR where 90% of the water molecules are bound to calcium.
Consistent with the EPSR analysis of the hydrogen bonding in ACC, the lack of a peak in the
200-400 cm-1
range further indicated that no extended hydrogen bonded network was
present128, 132
as one would expect from any liquid-like water present in the sample130
. Finally
the low energy of the libration band suggested that the water molecules mainly bind to a
single calcium ion, again supporting the EPSR model that suggested that 40% of the water
molecules bind to a single calcium ion.
3.2.5 Conclusion
We produced an atomistic model of ACC based on X-ray and neutron scattering data
analyzed by the EPSR program. This model is in excellent agreement with analyses of
vibrational spectroscopy data and in good agreement with the previous reported structural
information on ACC. Furthermore no unphysical structural motifs were found in the model as
have plagued previous attempts to model the structure of ACC43, 63
. Herein, we described
several structural features beyond that of the Ca-O distance and average coordination number
that have so far not been available from literature. E.g. the ratio between bidentate(~20%) and
monodentate(80%) binding, fraction of hydrogens participation in hydrogen bonding with
water(~10 %) and carbonate (~70%), amount of water molecules interacting with
carbonates(100%) and Ca ions(~90%). We found that the dehydration of ACC by heating
results in a densification of the material and in a change of its local structure. This change is
mainly associated to a rearrangement of the carbonate ions induced by the removal of water.
Analysis of large scale structure in the model reveal that water percolation may exist, but
there is no evidence for long-range hydrogen bonded networks (i.e. water pores but without
any hydrogen bonding between water molecules in the pore). We also find that the local
structure of ACC studied here is related to the structure of the ions in solution prior to
precipitation, which seems to support recent observations suggesting that ACC forms by rapid
precipitation in unstable solutions. Although, to better understand the formation of ACC, a
more detailed structural understanding of the ions in solution is likely needed, our results
provide detailed insight into the structure of ACC and how dehydration leads to reorientation
of the ions far below the crystallization temperature.
Furthermore the deconvolution of the pdf into the ppdfs showed correlation up to 15 Å with
the four calcium-calcium coordination spheres originally reported by Michel et al36
. This
could essentially be used to assess changes to the local structure of ACC in future studies

Results and discussion
52 | P a g e
given that the pdf of a purely amorphous sample can be measured and the ppdf of interest has
a high enough intensity in the data. However it should be noted that the correlations in the pdf
above 8 Å are very small and may not be experimentally accessible unless a full
deconvolution is performed.
3.2.6 Materials and methods
Synthesis: ACC samples was made by a modified version of the procedure reported by Zou et
al27
. 20 mL of 1 M CaCl2 solution (>99% CaCl2.2H2O Sigma Aldrich) was added to 480 mL
Na2CO3 solution (99.999% Na2CO3.10H2O Sigma Aldrich) to a final concentration of 40 mM.
The suspension was filtered through cellulose acetate filters with 0.45 µm pore size. The
samples were washed with cold ethanol and dried in a desiccator under vacuum. Each batch
yielded 2-2.5 grams of sample. To make the dehydrated sample, ACC was placed on a watch
glass and heated in a muffle oven at 100 °C for 90 min. The samples were transported in a
desiccator for both x-ray and neutron pdf measurements.
ICP-OES: Sodium impurity levels was checked by ICP-OES (optima 8000 ICP-OES
spectrometer, PerkinElmer, Waltham, MA)
TGA/DSC: hydration levels were determined by TGA/DSC (SENSYS evo TGA-DSC,
SETARAM instrumentation, Caluire, France). The samples (>10 mg) were heated in alumina
crucibles to 800 °C at 2 °C/min under argon gas flow.
Pdf measurements: x-ray pdf was measured at ID11 at the ESRF (Grenoble, France) using a
0.14088 Å beam and a Frelon2K detector. Neutron PDF was measured at the SANDALS
Instrument120
at ISIS (STFC Rutherford Appleton Laboratory, Didcot, UK). ~5 g of sample
was placed in a 12 mm thick sample can with vanadium windows. The thick sample can was
chosen due to the low sample packing fraction of ~ 10%. Each sample was measured for ~ 8
hours. Data reduction for both x-ray and neutron measurement was performed in Gudrun117
.
Incoherent inelastic neutron scattering(IINS): IINS was performed at the TOSCA instrument
at ISIS (STFC Rutherford Appleton Laboratory, Didcot, UK). Samples were mounted in
aluminum envelopes and placed in 6 x 6 cm aluminium cans of 5-10 mm thickness and sealed
with indium wire. Samples were cooled to <30 °K before measuring and kept at ~10 °K
during the measurement. Spectra were measured in energy loss mode from -20 cm-1
to 4000
cm-1
. The spectra are only displayed to 2000 cm-1
due to high peak overlap at high energy
transfer, as is common for spectrometers of this design.
Pycnometry: Pycnometer measurement was performed on a Ultrapycnometer 1200e MUPY-
31-T (Quantachrome Instruments, Boynton Beach, Florida, US). ~ 1 g was place in a ~4 mL
sample holder and measured using Ar gas. 18 measurements were performed of which the last
5 were averaged for the final measurement.
FTIR: FTIR-ATR was performed on a Nicolet IS5 (Thermo Fisher scientific, Waltham, MA,
US) with an ID5 ATR module. Spectra was measured from 550 to 4000 cm-1
and averaged
over 64 spectra.

Results and discussion
53 | P a g e
3.3 The effect of Mg as an additives on the structure of ACC
As mentioned in chapter 1.4 Mg2+
is one of the most common additives found in biogenic
ACC21
acting as a kinetic stabilizer. However, it is unclear what the local structure around
magnesium is in the amorphous phase and how it affects the local environment of the other
ions, especially when mixed with calcium in ACMC. The only extensive structural model of
AMC available is of MgCO3.3H2O
84. However, this compound contains three times the water
compared to biogenic ACC and a structural model of comparable hydration level is required.
Moreover the coprecipitation of hydroxide with magnesium in both ACMC and AMC (see
chapter 3.1) makes it important to take hydroxides into account as this ion by itself is also
known to stabilize the ACC phase. Here we present a atomistic model of ACMC and AMC
based on combined x-ray and neutron total scattering analyzed using empirical potential
structural refinement (EPSR)110-111
, substantiated with vibrational spectroscopy. This has
revealed that magnesium places significant constraints on its local environment by adopting
near octahedral coordination in the first coordination sphere. During dehydration the local
environment of calcium in ACMC showed significant more change then the one of
magnesium, whereas almost no change is observed in the local environment of magnesium in
AMC. Finally the incorporation of hydroxide ions significantly change the hydrogen bonding
from primarily occurring between water and carbonate in ACC (see chapter 3.2) and ACMC
to a mix of hydrogen bonding occurring between water, hydroxide and carbonate in AMC.
3.3.1 Sample characterization
Samples were made with two Mg/(Ca+Mg) ratios of 100% and 52%. Given a composition for
AMC of (see chapter 3.1):
𝑀𝑔(𝐶𝑂3)0.68(𝑂𝐻)0.64 ∙ 𝑛𝐻2𝑂
And for ACMC:
𝐶𝑎0.48𝑀𝑔0.52(𝐶𝑂3)0.84(𝑂𝐻)0.32 ∙ 𝑛𝐻2𝑂
Partially dehydrated samples were prepared for both AMC and ACMC. TGA measurements
showed a water content of n=1.1 and 0.5 for ACMC and 1.2 and 0.7 for AMC. Fully
dehydrated samples were also prepared for FTIR analysis. He gas pycnometric measurements
showed that the density of AMC was 1.924(4) and 1.933(4) g/cm3
for n=1.2 and n=0.7 and for
ACMC the density was determined to be 2.032(3) and 2.158(2) g/cm3
for n=1.1 and n=0.5
respectively. The structure factors and pdfs of AMC and ACC are shown in figure 3.17.
Given the low scattering power of the magnesium samples, the x-ray measurement are
inherently noisy and for the ACMC measured at I15 the background measurement contributed
with ~90%j of the total signal, making background subtraction difficult for these samples
j We were advised to used fused silica capillaries with a wall thickness of ~1mm at the I15 which turned out to
scatter x-rays 10 times more than the sample, while the samples measured at the ESRF were mounted in kapton
capillaries with <0.1 mm wall thickness where capillary scattering was less of a problem.

Results and discussion
54 | P a g e
(explained in chapter 2.1.1). The intra molecular distances for all samples are found at 1Å
(negative peak only observed in n-pdf), 1.3Å and 2.2Å from O-H, C-O and O-O
intramolecular distances in water/hydroxides and carbonates (figure 3.17 B and C). In the pdf
from the AMC samples (figure 3.17 B) interatomic/molecular peaks are seen at 2.2, 3, 4, 5, 6
and 7 Å in the n-pdf and at 2.2, 3 and 4 Å with several overlapping minor peaks in the range
between 5 and 8 Å for the x-pdf. The first peak at 2.2 Å originate from the Mg-O distance as
expected when compared with magnesite50
. The correlation at 3 Å is more difficult to assess
as this distance is characteristic of O-O91, 93
, Mg-Mg156
, Mg-C50
and O-H91
distances. The
correlation from 4 Å to 8 Å become more obscure and given the similar scattering lengths of
the elements in both x-rays and neutrons it is nearly impossible to assign pairs to each of these
correlations without using computer modeling.
Figure 3.17: Structure factor of AMC (A) and ACMC (C) measured using x-rays and neutron
sources and the corresponding pdf (B and D). The minor peaks in the X-ray pdf of ACMC are
caused by the high background of the measurements taken at I15.
For the ACMC samples (figure 3.18 D) a broad peak is present between 2.2 and 2.4 Å
originating from the Mg-O and Ca-O nearest neighbors distances and the O-O intramolecular
distance in the carbonate ion. In the x-pdf most of the peaks from 5-8 Å are overlapping with
truncation ripples and cannot be discerned although a weak broad peak may be present at 6 Å.
The shorter distances at 3 and 4 Å are present as expected since these are also present in AMC
and ACC. In the n-pdf the peaks at 3 and 4 Å are also present but again the peaks at larger
distances are missing. The loss of peaks at larger distances is expected as the number of ppdf
increases as mentioned in equation 1.1 giving 28 ppdfs for AMC and 36 ppdfs for ACMC,

Results and discussion
55 | P a g e
with so many ppdf it is likely that several of the long range correlations are hidden in the pdf.
However, given the right density, molecular structure and potentials they can be estimated
using the EPSR method61, 112
.
3.3.2 EPSR fitting of amorphous magnesium and calcium/magnesium carbonate
For the ESPR model cubic boxes were made with the following specifications:
Table 3.5: model parameters for AMC and ACMC modeling
Sample Number
of Mg
Number
of Ca
Number
of CO3
Number
of OH
Number
of H2O
Total
number
of
atoms
box
side
length
(nm)
Atomic
density
(atoms/Å3)
AMC
n=1.2 4000 0 2800 2400 4800 34.400 6.97 0.102
n=0.7 4000 0 2800 2400 2800 28.400 6.74 0.0927
ACMC
n=1.1 104 96 168 64 220 1660 2.57 0.098
n=0.5 104 96 168 64 100 1300 2.44 0.089
The very large box size for the AMC samples were chosen as there was a suspicion of finite
size effects coming from the box size, fortunately no box size effect was found when
comparing the larger (4000 formula units) and smaller box (200 formula units). However, the
larger box had accumulated significantly more statistics on the structure and was therefore
used for the analysis. The same intra molecular constraints were used here as for the ACC
samples (table 3.2) with the added constrain of a 0.976 Å O-H distance for the hydroxide ion.
The intermolecular potentials from the ACC model was again used for the calcium, carbonate
and water ion/molecule (table 3.3) and for the magnesium145
and hydroxide107
ions the
following potentials were added.
Table 3.6: Interatomic/molecular potentials
Atom Ε [kJ/mole] σ [Å] Charge [e]
Mg 0.175 2.3 1.86
Ohydroxide 0.251 3.5 -1.3538
Hhydroxide 0 0 0.4238

Results and discussion
56 | P a g e
Given the high number of partial pairs, the minimum number of configuration for the final fit
was increased to 50.000k to ensure a minimum level of noise in the ppdf. Especially the ppdfs
related to hydroxides suffered from low statistics as this is the component with the lowest
concentration. The fit to the AMC samples are shown in figure 3.18. The x-ray structure
factor (figure 3.18 A) for both samples is reproduced fairly well by the model except the
region around 5 Å-1
with a corresponding region around 3 Å in the x-pdf (figure 3.18 B)
where the largest difference between the calculated and experimental measurements are seen.
The fit to the neutron pdfs (figure 3.18 D) and structure factors (figure 3.18 C) also show a
difference at ~3 Å and ~5 Å-1
suggesting that this is a real correlation present in the system
that is not described well by the model. However, the difference is minor and could be caused
by error in the compositional analysis, inherent when so many molecule/atom are present in
the same sample. The poorly fitted area below 2 Å-1
(figure 3.18 C) is caused by the
correction for the incoherent scattering that is an inherent problem with samples with high
hydrogen content.
Figure 3.18: Experimental (dots) and simulated (lines) structure factor (A and C) and pdf (B
and D) of AMC for both hydration levels. Data measured with X-rays (A and B) above and
neutrons below (C and D).
The fit to the ACMC sample is shown in figure 3.19. The poor background subtraction for the
x-ray structure factor makes it difficult to determine if the model reproduces the fine details of
the x-ray pdf. However, the major components of the pdf is clearly reproduced well by the
model (figure 3.19 A). Fortunately the formulation of the empirical potential (equation 2.16)
k Configurations were accumulated for 5+ days per sample on a desktop computer.

Results and discussion
57 | P a g e
does not allow the program to fit the sharp peaks at high Q present in the x-pdf (figure 3.19
A). The x-pdf shows that the peaks are at 1.3, 2.3, 3 and 4 are all described by the model,
since the peaks at longer distances are not present in the pdf, deconvoluting them will depend
mainly on the potentials and the constrains placed on the model by the shorter distance
correlations. The fit to the neutron structure factor show that the model describes the data well
with only minor differences, mainly present in the low Q due to the correction for the inelastic
scattering (figure 3.19 C). However, this was less of a problem in these samples compared to
the AMC samples (figure 3.18 C). The n-pdfs also show a good fit to the experimental data
with the four main peaks described well. From the final model the pdf was deconvolute into
the 28 and 36 ppdfs from AMC and ACMC respectively as shown in figure 3.20 and 3.25. For
clarity the three types of oxygen will be referred to as Oc, Oh, Ow and O for oxygen from
carbonate, hydroxide, water and all respectively and the two types of hydrogen will be
referred to as Hw, Hh and H for hydrogen from hydroxide ions, water molecules and both
respectively.
Figure 3.19: Experimental (dots) and simulated (lines) structure factor (A and C) and pdf (B
and D) of AMC for both hydration levels. Data measured with X-rays (A and B) above and
neutrons below (C and D). The x-ray data was weighted less than the neutron data in these
samples due to the high noise and poor background subtraction.
3.3.2.1 Ppdf and coordination number of AMC
Similar to the ACC most of the features in the ppdf (figure 3.20) are confined to the region
below ~5 Å and can be assigned to nearest and next nearest neighbor distances. However,
several of the ppdf show broad peaks above 5 Å indicating a broad diffuse third coordination
sphere. The Mg-Mg ppdf (figure 3.20 A) shows three coordination spheres at 3.6, 5.7 and 8.3

Results and discussion
58 | P a g e
Å with a splitting of the 3.6 Å peak and no correlations above 10 Å. The split peak at 3.6 Å
can be assigned to an Mg-Oh-Mg motif with an expected distance of 3.2 Å91
and an Mg-Oc/w-
Mg motif with a distance of 3.6 Å91
. Only three correlation spheres are seen compared to the
four observed in the Ca-Ca ppdf in ACC (figure 3.8 A). The intense peak at 2.2 Å in the Mg-
O ppdfs show that carbonate, hydroxides and water ion/molecules all bind directly to the
magnesium ion (figure 3.20 B-D). In the Mg-Ow ppdf (figure 3.20 D) a second and third
coordination sphere is observed, this is also observed in the Mg-Oh ppdf (figure 3.20 C) where
a fourth coordination sphere is also present.
Figure 3.20: Intermolecular ppdfs of the 28 atomic pair in ACC. with pairs between A)
magnesium and magnesium, B) magnesium and carbonate, C) magnesium and hydroxide, D)
magnesium and water, E) carbonate and carbonate and between carbonate and hydroxide
ion(F). The figure is continued on the next page.

Results and discussion
59 | P a g e
Figure 3.20 continued: Intermolecular ppdfs of the 28 atomic pair in ACC. with pairs
between G) carbonate and water, H) hydroxide and hydroxide, I) hydroxide and water and
between water molecules (F).
For the Mg-Oc ppdf (figure 3.20 B) no sharp third peak is observed, but the second peak is
significantly different in shape then what was observed for Ca-Oc ppdf in ACC (figure 3.8 B).
Combining this with the single peak in the Mg-C ppdf (figure 3.20 B) at 3.6 Å suggests that
magnesium prefers monodentate binding to the carbonate more so than calcium. In all the O-
O ppdfs, (figure 3.20 F-J) peaks are seen at ~4.2 Å this would correspond to a linear O-Mg-O
motif50
suggesting a well-defined first coordination sphere.
Hydrogen bonding can be assessed from the 1.8 Å peak in the O-H ppdfs (figure 3.20 F-J).
Comparing the O-Hw and the O-Hh ppdfs it is clear that the peaks in O-Hw ppdfs at 1.8 Å are
more pronounced, suggesting that Hw is the main hydrogen bond donor with hydrogen
bonding between Hw and Oh being the most favored hydrogen bond (figure 3.20 I). Similar
comparison can be made between Oc-H, Oh-H and Ow-H ppdfs and here it is clear that the 1.8
Å peak in the Oh-H ppdfs are more pronounced (figure 3.20 F-J), suggesting that Oh is the
main hydrogen bond acceptor followed by Oc and Ow being the least favored. Mean
coordination numbers were calculated for 83 coordination spheres from the ppdfs shown in
figure 3.20, some selected mean coordination numbers are shown in table 3.7. Most
coordination spheres showed an increased mean coordination number with an average
increase of 25 %(median 8%) and the coordination spheres related to water molecules
generally showed a decreased mean coordination number with an average of -30%(median -
32%). The coordination number of O around Mg was determined to be 5.0 for both samples
with minor increases in the number of Oh and Oc around magnesium with dehydration (table

Results and discussion
60 | P a g e
3.7) similar to what was seen for ACC (table 3.4). Analysis of the Mg-Ow direct binding peak
at 2.2 Å (figure 3.20 D) showed that 66% and 77% of the water molecules bind directly to the
magnesium ion for n=1.2 and 0.7 respectively. Since there is no clear minimum between the
monodentate and bidentate peak in the Mg-C ppdf the ratio could not be directly estimated
and the number of carbonates (i.e. number of C around Mg) coordination to Mg of 2.9 (table
3.7) includes both binding types. However, using Mg-C distances taken from the
nesquehonite92
(MgCO3.3H2O) and magnesite
50 the ratio of monodentate/bidentate binding
was roughly estimated to be 10% bidentate binding and 90% monodentate binding for both
samples. However, this is highly sensitive to the distances chosen. The relative change to
number of magnesium around magnesium in AMC is roughly one third of what was seen for
the first two coordination spheres in the Ca-Ca ppdf (table 3.4), indicating that there is less
structural change, relating to the ions, occurring in AMC compared to the ACC during
dehydration. However, some of this is also attributed to the smaller change in hydration level
between the two AMC samples compared to the two ACC samples. Analysis of the Hw-O
binding peaks at 1.8 Å (figure G, J and I) shows that nearly all the water molecules are
interacting with either hydroxide or carbonate through hydrogen bonding and 21% of the
water is hydrogen bonded together for n=1.2.
Table 3.7: Mean coordination number from AMC of specific pair given as number of atom
2 around atom 1.
Atom 1 Atom 2 Rmin
(Å)
Rmax
(Å)
CN
n=1.1
esd
n=1.1
CN
n=0.5
esd
n=0.5
Change
%
Mg Mg 1 4.3 3.4 1.4 3.6 1.3 7.6
Mg Mg 4.3 6.55 10.8 2.5 11.3 2.4 4.2
Mg Oc 1 2.65 2.9 1.2 3 1.2 3
Oc Mg 1 2.65 1.4 0.6 1.4 0.6 3
Mg C 1 3.75 2.9 1 2.9 1 1
C Mg 1 3.75 4.1 0.9 4.2 0.8 1
Mg Oh 1 2.75 1.3 1 1.4 1 4
Oh Mg 1 2.75 2.2 0.6 2.3 0.6 4
Mg Ow 1 2.75 0.8 0.8 0.6 0.7 -30
Ow Mg 1 2.75 0.7 0.6 0.8 0.5 19
Hh Oc 1 2.2 0.4 0.5 0.4 0.6 6
Hw Oc 1 2.2 0.3 0.5 0.4 0.5 39
Hh Oh 1 2.2 0.2 0.4 0.6 0.6 312
Hw Oh 1 2.2 0.2 0.4 0.2 0.4 8
Hh Ow 1 2.2 0.1 0.3 0.1 0.3 22
Hw Ow 1 2.2 0.2 0.4 0.5 0.6 157

Results and discussion
61 | P a g e
After dehydration around half of the water is hydrogen bonded together, but nearly all the
water molecules still show hydrogen bonding to the anions.
3.3.2.2 Magnesium and carbonate environment in AMC
In figure 3.21 (A and B) the distribution of coordination numbers for the most relevant pairs
around magnesium is shown. The distributions of number of nearest and next nearest
neighbor magnesium around magnesium in the first two coordination spheres (figure 3.20 A)
are both broad distributions, comparable to what was shown for calcium pairs in ACC (figure
3.9 A). Similar to ACC a shift is observed to higher coordination numbers (figure 3.21 A).
However, the shift is significantly smaller compared to that of ACC indicating that the overall
structural changes related to the ions in the system are minor.
Figure 3.21: A) distribution of coordination numbers for the first two Mg-Mg coordination
spheres at 3.6 and 5.7 Å (figure 3.20 A). B) Distribution of coordination number for the first
coordination sphere of Oc, Oh and Ow around Mg at 2.2 Å (figure 3.20 B-D). Angular
distribution showing the angle between oxygens binding to the same magnesium ion for Oc
(C), Oh (D) and Ow (E).

Results and discussion
62 | P a g e
The distribution of coordination numbers of oxygen around magnesium shows that Oc is the
main ligand to magnesium followed by Oh and Ow (figure 3.21 B), but all showing very broad
distributions. Again almost no change is observed upon dehydration. The number of Ow
coordination to magnesium goes down as expected and is mainly compensated for by an
increased number of Oc binding to magnesium. The coordination geometry of the magnesium
ions are shown in the angular distributions of oxygen binding to magnesium (figure 3.21 C-
E). The angular distribution of Oc around magnesium shows three peaks at 60°, 90° and 180°,
the first two peak are characteristic of adjacent oxygen from bidentate and monodentate
binding respectively. The peak 180° is characteristic of octahedral geometry as expected for
magnesium as this is the only geometry reported in several magnesium minerals of oxides157
,
carbonates50, 92, 94
, basic carbonates91, 93
and hydroxides156
as well as magnesium ions in
solution145
. The angular distributions of Oh and Ow around magnesium both show two peaks
with the 90° and 180° angles expected from the octahedral coordination, which is strongly
preferred. For all the angular distribution shown in figure 3.21 (C-E) angles between 90° and
180° are also present caused by the disordered octahedral coordination and non-octahedral
coordination related to 4 and 5 fold coordination which are also present in the structure.
Figure 3.22: SDF of the Mg (green) coordinating to the carbonate ion (A and C) and the
water molecule (B and D) for both n=1.2(A and B) and n=0.7 (C and D). In B and D the SDF
of carbonate (red) is also shown for clarity. The Surface is plotted here in the range 2-5 Å
away from the C and O atom in carbonate and water respectively using an isosurface value of
0.15. In the sdf of Oc around the water (red) molecule a minor population is seen adjacent to
the magnesium population (green) originating from Oc-Mg-Ow motif with a 90° angle and is
not caused by direct interaction between the carbonate ions and water molecules.

Results and discussion
63 | P a g e
The sdf of magnesium coordination to carbonate (figure 3.22 A and C) shows the
monodentate binding between the carbonate and magnesium ions. Given the low population
of bidentate binding this coordination is not visible in the sdf for this isosurface value. For
both samples the sdf shows three isotropic binding sites directly on top of the Oc, unlike
calcium which showed anisotropy towards the normal to the molecular plane of the carbonate
ion (figure 3.10). The water/magnesium sdf (figure 3.22 B and D) show a very confined
binding site of magnesium on the oxygen side of the water molecules with an anisotropy
spread towards the lone pairs of the oxygen. The narrow binding site of the magnesium ion
around both the carbonate ion and the water molecule compared with the sdf related to
calcium in ACC (figure 3.10) indicate that the magnesium environment is better defined and
hence more constrained. The preferred octahedral coordination geometry of the magnesium
ion is also seen in the carbonate/water sdf where there is a second small binding site on the
oxygen side, in addition to the hydrogen bond population, this is caused by a Ow-Mg-Oc motif
with a 90° angle between the two bonds (figure 3.22 B and D).
3.3.2.3 Hydrogen-bonding in AMC
Hydrogen bonding in AMC is more complex compared to ACC given that there are three
hydrogen bond acceptors (Oc, Oh and Ow) and two donors (Hh and Hw). The peaks related to
hydrogen bonding at 1.8Å in the O-H ppdfs are analyzed in this section (figure 3.20). The
coordination number distribution of oxygen hydrogen bonded to Hh is shown in figure 3.23 A.
There is no clear preference observed in contrast to what was seen for the hydrogen bonding
in ACC, although there is some preference for hydrogen bonding of the hydroxide with the
anions.
Figure 3.23: A) distribution of coordination numbers for the first Hh-O coordination sphere at
1.8 Å related to hydrogen bonding from the Hh (figure 3.20 F, H and I). B) Distribution of
coordination numbers for first the Hw-O coordination sphere at 1.8 Å related to hydrogen
bonding from the Hw (figure 3.8 F, I and J). Angular distribution showing the angle of the
hydrogen bond related to hydroxide hydrogen (C) and water hydrogen (D).

Results and discussion
64 | P a g e
A large change is observed in the hydrogen bonding between hydroxides upon dehydration
(figure 3.23 A), it is unclear if this is an artifact in the model or an accurate description given
the relative low concentration of the hydroxide ion and hence the relative low signal in the
data (figure 3.19). The hydrogen bonding related to Hw show a similar mix of hydrogen
bonding between Hw and the various oxygens with a slight preference towards the anion
oxygens. Despite the hydroxides only making up 25% of the anion oxygens present in the
system, they make up 40% of the anion oxygens hydrogen bonded to the water molecule
(table 3.7), which is likely the cause of the mixed hydrogen bonding observed in this system.
The hydrogen bonds in AMC tend to be linear with the Hw-O hydrogen bonds being highly
linear and the Hh-O bonds showing a shoulder in the angular distribution at 140° suggesting a
weaker hydrogen bond. The sdfs of water and hydroxide around carbonate and water is shown
in figure 3.24 and the sdf of hydrogen bonding between carbonate and water is shown in
figure 3.22. The water molecules and hydroxide ions tend to coordination carbonate above
and below the molecular plane of the carbonate and in between the Oc. The
hydroxide/carbonate sdf shows a second binding site directly in front of the Oc and a smaller
population above and below the molecular plane compared to water. The two populations for
the hydroxide are similar to the monodentate/bidentate binding seen for the cations binding to
carbonate.
Figure 3.24: SDF of the water (dark green) coordinating to the carbonate ion (A and E) and
the water molecule (B and F) for both n=1.2(A and B) and n=0.7 (D and E). SDFs of the
hydroxide ion coordinating to water (D and H) and carbonate (C and G). The Surface is
plotted here in the range 2-5 Å away from the C and O atom in carbonate and water
respectively using an isosurface value of 0.15 for the water/carbonate and hydroxide/water
sdfs and 0.05 for the water sdfs. The isosurface value for the water-water sdf was lowered as
the correlations between water molecules are weak and was not distinguishable at higher
values.
Comparison of the Oh-C and Ow-C ppdfs (figure 3.20 F and G) with the H-C ppdfs (figure
3.20 F and G) indicate that these two sites are related to the oxygens in water and hydroxides

Results and discussion
65 | P a g e
by the split peak in the O-C ppdfs at ~3.8 Å that is not seen to the same extent in the H-C
ppdfs, suggesting that the oxygens preferentially occupy one of these two sites while the
hydrogen can orientate to optimize the hydrogen bonding. The sdf of water coordination to
water (figure 3.24 B and F) shows several populations similar to that of water/water sdf of
ACC (figure 3.10 B and D), despite the higher frequency of water-water interaction in the
AMC model compared to ACC the water/water correlation related to hydrogen bonding is still
very weak in AMC compared to Ow-Ow correlation between water molecules not hydrogen
bonded together. The hydroxide/water sdf shows three populations; two are placed directly in
front of the Hw and correlate to Hw-Oh hydrogen bonding and the third population is placed on
the oxygen side of the water molecule originating from Hh hydrogen bonding to the oxygen
lone pairs. In all of the sdfs there are only minor changes observed upon dehydration,
suggesting that the structural change is mainly quantitative (i.e. change in the coordination
number), while the geometric correlation between the components remain more or less the
same.
3.3.2.4 Ppdf and coordination number of ACMC
Figure 3.25: ppdfs of the 36 atomic pairs in ACC. with pairs between A) magnesium/calcium
and magnesium/calcium, B) magnesium/calcium and carbonate, C) magnesium/calcium and
hydroxide, D) magnesium/calcium and water, E) carbonate and carbonate, F) carbonate and
hydroxide, G) carbonate and water, H) hydroxide and hydroxide, I) hydroxide and water and
between water molecules (J).

Results and discussion
66 | P a g e
We now move on to the EPSR model derived for the ACMC samples. From the fits shown in
figure 3.19 the pdfs of the ACMC samples were deconvoluted into the 36 ppdfs related to
ACMC (figure 3.25). Most of the ppdf are very similar to the corresponding ppdfs described
for ACC (figure 3.8) and AMC (figure 3.20) below 8 Å with most of the longer range
correlation missing. As the interatomic pairs of these ppdfs have already been assigned in the
previous section they will not be discussed further here.
Table 3.8: Mean coordination number from ACMC of specific pair given as number of
atom 2 around atom 1.
Atom 1 Atom 2 Rmin
(Å)
Rmax
(Å)
CN
n=1.1
esd
n=1.1
CN
n=0.5
esd
n=0.5
Change
%
Ca Ca 1 5.1 2.9 1.5 3.4 1.5 17
Ca Ca 5.1 7.2 5.9 2.1 6.7 2.2 14
Ca Mg 1 4.8 2.3 1.4 2.8 1.4 23
Mg Ca 1 4.8 2.1 1.3 2.6 1.4 23
Ca Mg 4.8 6.8 5.3 2.1 6.1 2.2 15
Mg Ca 4.8 6.8 4.9 1.9 5.7 2 15
Ca Oc 1 3.3 5.2 1.5 5.9 1.5 13
Ca C 2 3 0.8 0.8 0.9 0.9 20
Ca C 3 4.1 3.2 1.3 3.5 1.3 10
Ca Oh 1 3.3 0.7 0.9 0.8 0.9 12
Ca Ow 1 3.2 1.5 1.1 0.8 0.9 -46
Mg Mg 1 4.5 2.2 1.5 2.5 1.4 12
Mg Mg 4.5 6.5 5.2 2 5.8 2.1 13
Mg Oc 1 2.75 3.7 1.3 4.1 1.2 11
Mg C 1 3.75 3.3 1 3.7 1 12
Mg Oh 1 2.75 0.9 1 0.9 1 -2
Mg Ow 1 2.72 0.8 0.8 0.4 0.6 -49
Hh Oc 1 2.2 0.5 0.6 0.5 0.6 14
Hw Oc 1 2.2 0.6 0.6 0.6 0.6 -1
Hh Oh 1 2.2 0.2 0.4 0.2 0.4 -10
Hw Oh 1 2.2 0.1 0.3 0.1 0.3 47
Hh Ow 1 2.2 0.2 0.4 0.1 0.3 18
Hw Ow 1 2.2 0.3 0.5 0.2 0.4 -45

Results and discussion
67 | P a g e
The ppdfs with no equivalent in ACC and AMC are the Ca-Mg, Ca-Oh and Ca-Hh ppdfs
(figure 3.25 A and C). The Ca-Mg ppdf shows three coordination spheres similar to the Ca-Ca
and Mg-Mg ppdfs but at 3.8, 6 and 8.7Å. The Ca-Oh and Ca-Hh show that the hydroxides are
binding directly to calcium via the oxygen as expected. The O-H ppdfs show a similar
hydrogen bonding as in AMC with Hw being the preferred hydrogen bond donor and Oh the
preferred acceptor (figure 3.25 F-J). The various peaks in the ppdfs were analyzed for their
coordination number (84 peaks in total, table 3.8) and an increase was found for most of the
pairs related to the ions (average increase 18%, median 17%), while the ones related to water
showed a decrease (average decrease -31%, median -40%). The change in the coordination
number of the Ca-Ca first coordination sphere is very similar to what was seen in ACC (17%
in ACMC and 19% in ACC) while the Mg-Mg coordination number for the first coordination
sphere is almost twice of what was observed in AMC (12% in ACMC and 7.6% in ACC). The
number of Oc around the cations in the first coordination sphere increased by ~10% similar to
what was observed for ACC and three times what was observed in AMC. Almost no change is
observed for the coordination number of Oh coordinating to magnesium and a minor change is
observed for Oh coordinating to Ca from 0.7 to 0.8. The overall coordination of oxygen
around Ca and magnesium was determined to be 7.4 and 5.4 for Ca and Mg respectively for
both hydration levels, similar to the coordination number determined for the cations in AMC
and ACC. The hydroxide ions seem to preferentially bind to magnesium as Oh constitute 10%
and 16% of the total number of oxygens around the calcium and magnesium respectively. The
coordination number of oxygen around hydrogen show that the majority hydrogen bonds are
formed between H and Oc despite the Oc-H 1.8 Å peaks in the ppdfs are less pronounced then
the Oh-H peaks (figure 3.25 F-I), indicating that the Oh are the preferred hydrogen bond
acceptor but the sheer number of Oc present in the system makes it the most common
hydrogen bond acceptor.
3.3.2.5 Calcium, magnesium and carbonate environment in ACMC
The mean coordination number of nearest and next nearest neighboring cations showed that
dehydration induces a larger change in the local environment of the ions ACMC compared to
AMC (table 3.8) and the shift of the coordination number distributions show a similar trend
(figure 3.26 A-D). The four cation-cation pairs all show a shift to higher coordination
numbers, with a slightly larger shift in the number of cations around calcium compared to
cation around magnesium. There also seems to be no preference for the type of neighboring
cations around calcium/magnesium, although there are calcium and magnesium ions that only
have nearest neighbor cations of the same type, as seen by the non-zero population of calcium
ions with 0 magnesium ions in the first coordination sphere (figure 3.26 C) and similar for
magnesium (figure 3.26 D). However, there are also calcium ions that only have magnesium
ions in the first coordination sphere as seen by the non-zero population of calcium ions having
0 calcium ions in the first cation coordination sphere (figure 3.26 A) and again similar for Mg
(figure 3.26 B). All four coordination number distributions peak around 2-3 neighboring
cations (figure 3.26 A-D) indicating a well-mixedl amorphous phase given that the expected
l But given the very broad distribution a very heterogeneous phase

Results and discussion
68 | P a g e
coordination number of nearest neighboring cation around calcium and magnesium is
expected to be 6 (table 3.4) and 4 (table 3.7) respectively. The distribution of coordination
numbers of oxygen around calcium and magnesium are shown in figure 3.26 E and F.
Figure 3.26: A) distribution of coordination numbers for the first two Ca-Ca coordination
spheres at 4 and 6.2 Å, the first two Mg-Mg coordination spheres at 3.6 and 5.7 Å and
distribution of coordination number of magnesium around calcium (C) and calcium around
magnesium (D) in the first two Ca-Mg coordination spheres at 3.8 and 5.9 Å. In E and F the
distribution of coordination number of oxygen binding to calcium (E) and magnesium (F) is
shown.
As expected from the ppdfs (figure 3.25) both calcium and magnesium show a mix of the
three types of oxygen in the first coordination sphere. For calcium the first coordination
sphere is mainly composed of Oc, with Ow being the second most common and Oh being the

Results and discussion
69 | P a g e
least favored as expected since this is the oxygen with the lowest concentration in the system.
A similar trend is seen for magnesium in the dehydrated sample with Oh being the second
most favored and Ow the least, but in the fully hydrated sample the distributions for Oh and Ow
around magnesium are very similar. This is quite unexpected given the low concentration of
Oh in the system, but shows a clear preference for Mg-OH binding. Analysis of the number of
magnesium ions around Oh also showed that all Oh are coordinating directly to at least one
magnesium ion with the majority coordinating two, consistent with the magnesium ion being
responsible for the hydroxide ion incorporation. For both cations a shift to higher coordination
number for the anion oxygen are seen similar to what was shown for ACC.
Figure 3.27: Angular distribution showing the angle between oxygens binding to the same
calcium ion for Oc (A), Oh (C) and Ow (E) and for oxygen binding to the same magnesium ion
for Oc (B), Oh (D) and Ow (F). Notice the strong preference for 90° and 180° in the angular
distributions related to magnesium indicating a preference for octahedral coordination of the
magnesium ion.

Results and discussion
70 | P a g e
However, the shift to higher coordination numbers is mainly seen for Oc with the
accompanying shift in the Ow distribution to lower coordination number, showing that the
dehydration process removes a significant part of the cation coordinating Ow accompanied
with a reorientation of the anions, mainly the carbonate ion. The local environment of the
calcium ions is very similar to what is found in ACC (figure 3.9 A) with an angular
distribution for Oc (figure 3.27 A) around calcium with two low angle peaks at 50° and 75°
between adjacent Oc from bidentate and monodentate binding respectively and no peaks at
higher angles. The distribution for Oh (figure 3.27 C) shows a peak at 75° from adjacent Oh
and a minor peak at 150°. The Ow distribution (figure 3.27 E) show two peaks at 75° and 140°
comparable to what has been found for calcium ion in solution145
. The angular distribution of
oxygen around magnesium (figure 3.27 B, D and F) all show two peaks at 90° and 180°
characteristic of octahedral coordination with an additional peak at 60° in the Oc angular
distribution (figure 2.27 B) between adjacent Oc from carbonate with bidentate binding to
magnesium.
The angular distribution from AMC all showed a similar probability of the 90° and 180°
peaks (figure 3.21 C-E), while the angular distribution related to magnesium in ACMC (figure
3.27) show a higher probability for the 90° peak over the 180° peak indicating that the local
environment of magnesium in ACMC is slightly more disordered compared to AMC.
Figure 3.28: SDF of the Ca (yellow) coordinating to the carbonate ion (A and E) and the
water molecule (B and F) for both n=1.1(A and B) and n=0.5 (E and F). SDF of the Mg
(green) coordinating to the carbonate ion (C and G) and the water molecule (D and H) for
both n=1.1(C and D) and n=0.5 (G and H). In B, D, F and H the SDF of carbonate (red) is
also shown for clarity. The Surface is plotted here in the range 2-5 Å away from the C and O
atom in carbonate and water respectively using an isosurface value of 0.15.
The sdfs of calcium and magnesium around carbonate and water (figure 3.28) in ACMC are
again very similar to what has been shown for ACC (figure 3.10) and AMC (figure 3.22). For
the sdfs related to calcium (figure 3.28 A, B, E, F) virtually no difference is seen compared to

Results and discussion
71 | P a g e
the sdf from ACC and will not be discussed further here as they have already been described
in chapter 3.2.2.1. The sdfs related to magnesium shows minor differences compared to what
was shown for AMC (figure 3.22). The monodentate binding site of magnesium on carbonate
shows a very slight anisotropy towards the normal to the molecular plane of the carbonate for
both samples. The magnesium binding site to Ow is broadened compared to AMC, resembling
more the shape of calcium coordinating to Ow, but still strongly confined behind the Ow
compared to calcium. The second coordination site (figure 3.22 B and D) of the carbonate
coordinating to the Ow is not present in the ACMC (figure 3.28 D and H) consistent with a
more disordered local geometry of the magnesium compared to AMC and since a smaller
fraction of the water molecules bind to magnesium in ACMC compared to AMC since there is
less magnesium in ACMC and the water is shared between both calcium and magnesium ions.
3.3.2.6 Hydrogen-bonding in ACMC
The hydrogen bonding in ACMC resembles that of AMC when comparing the O-H ppdfs of
ACMC (figure 3.25) with those determined for ACC (figure 3.8) and AMC (figure 3.20),
showing that the strength of the hydrogen bond acceptors are in the order of Oh>Oc>Ow and
the hydrogen bond donor are in the order of Hw>Hh in both samples.
Figure 3.29: A) distribution of coordination numbers for the first Hh-O coordination sphere at
1.8 Å related to hydrogen bonding from the Hh (figure 3.20 F, H and I). B) Distribution of
coordination numbers for first the Hw-O coordination sphere at 1.8 Å related to hydrogen
bonding from the Hw (figure 3.8 F, I and J). Angular distribution showing the angle of the
hydrogen bond related to hydroxide hydrogen (C) and water hydrogen (D).

Results and discussion
72 | P a g e
Comparing the coordination numbers gives a different pictures here it is clear that the most
common hydrogen bonding are between hydrogen and Oc followed by Ow and Oh(figure 3.29
A and B) similar to the situation in ACC. While this may seem contradictive it is caused by
the normalization of the ppdf by the fraction of the species in question (equation 2.10).
Meaning that the ppdf will indicate what pairs are preferred relative to the fraction of the
molecules in question present in the system, while the mean coordination number (table 3.8)
will show what type of hydrogen bonding is most common in the system regardless of how
many oxygen atoms are present from the molecule/ion of interest. From the coordination
number distribution of oxygen around hydrogen it is clear that nearly half of the hydrogens
are binding to Oc. The low amount of hydrogen bonding to Oh (figure 3.29 A and B) is caused
by the low concentration of hydroxides in the system and analysis of the number of hydrogen
around Oh show that 40% of the hydroxides are coordinating to Hw and 15% to Hh, both of
which compete with the magnesium ion for space on the oxygen exposed side of the
hydroxide ion. Almost no change is seen upon dehydration indicating that the hydrogens can
reorientate with the ions upon dehydration to optimize the hydrogen bonds and that this is
determined by the amount of available oxygen in the local vicinity. The angular distribution
(figure 3.29 C and D) show a similar pictures of what was seen in AMC with highly linear
hydrogen bonds for Hw-O hydrogen bonding and slightly bended hydrogen bonded Hh-O
bond with an angle of 160°, indicating a weaker hydrogen bond between oxygens and Hh
compared to Hw.
Figure 3.30: SDF of the water (dark green) coordinating to the carbonate ion (A and E) and
the water molecule (B and F) for both n=1.1(A and B) and n=0.5 (D and E). SDFs of the
hydroxide ion coordinating to water (D and H) and carbonate (C and G). The Surface is
plotted here in the range 2-5 Å away from the C and O atom in carbonate and water
respectively using an isosurface value of 0.15 for the water/carbonate and hydroxide/water
sdfs and 0.05 for the water sdfs. The isosurface value for the water-water sdf was lowered as
the correlations between water molecules are weak and was not distinguishable at higher
values.

Results and discussion
73 | P a g e
The sdf of water around water and carbonate (figure 3.30) again looks very similar to the sdf
determined for both ACC and AMC, indicating that the cations do not influence how the
water molecules interact with the carbonate and water molecules. The sdf related to the
hydroxide ions are qualitatively very similar to those of AMC (figure 3.24). The main
difference is found in the population of hydroxide (figure 3.30 C and G) above and below the
carbonate molecular plane; these are likely caused by indirect correlations (e.g. a carbonate
coordinating to a cation that is also coordinating to a hydroxide) rather than direct correlation
as the hydroxides cannot form hydrogen bonding from this position. The increased presence
of this population may simply arise from the lowered fraction of hydroxide ions in these
models compared to the models of AMC.
3.3.3 Vibrational spectroscopy of amorphous calcium carbonate
Similar to the approach used for ACC (chapter 3.2.3) FTIR and neutron vibrational
spectroscopy was used to corroborate the finding of the EPSR model. Due to the limited beam
time at the TOSCA instrument it was not possible to measure the IINS spectra of ACMC and
it was decided that second TOSCA beam time would not be applied for given the high
similarity between the AMC (figure 3.32 F) and ACC (figure 3.16) IINS spectra and that of
ACMC with low Mg concentrations (figure 3.4 C). For the FTIR spectra a fully dehydrated
sample could be made for both AMC and ACMC as these samples do not crystallize during
heat treatmentm
. The full FTIR spectra of AMC and ACMC are shown in figure 3.31. The
spectra shown all four expected vibrational band from carbonate: in-plane bending vibration
mode at ~700 cm-1
, out-of-plane bending at ~860 cm-1
, symmetrical stretch at ~1050 cm-1
and
asymmetrical stretch at ~1400 cm-1
, with the in-plane bending mode overlapping with the
librational mode of water/hydroxides. The bending mode of water is present at ~1650 cm-1
for
the hydrated samples and the O-H stretching band is present in all the samples at ~3400 cm-1
,
the last mode is the librational mode ~600 cm-1
related to both hydroxide and water molecules
and is significantly larger in AMC compared to the ACC and ACMC samples.
Figure 3.31:FTIR spectra of AMC (A) and ACMC (B)showing the in-plane bending vibration
mode at ~700 cm-1
, out-of-plane bending at ~860 cm-1
, symmetrical stretch at ~1050 cm-1
and
asymmetrical stretch at ~1400 cm-1
from the carbonate ion. The peaks at ~3300 cm-1
and 1650
cm-1
correspond to the water stretching and bending modes. After full dehydration a mode is
present at 3600 cm-1
characteristic of hydroxide O-H stretching vibration. The asymmetrical
stretching mode from carbonate and the O-H stretching mode from water/hydroxide are
shown in more detail in figure 3.32.
m Crystallization occurs after simultaneous decomposition of carbonate and hydroxide to MgO at 400 °C

Results and discussion
74 | P a g e
Close up of the asymmetrical stretch of the carbonate ion and O-H stretch from
water/hydroxide are shown in figure 2.32, these band were chosen to analysis as they proved
the most informative from the analysis of ACC in chapter 3.2. For both AMC (figure 3.3A)
and ACMC (figure 3.32 D) a splitting of the asymmetric stretch band of the carbonate ion is
observed. This increased splitting with increasing dehydration indicates a change in the local
environment of carbonate similar to what was observed for ACC (chapter 3.2.3). This
splitting is also related to hydrogen bonding to the carbonate ion146
and indicates that the
water molecules that are being removed have been hydrogen bonded to the carbonate ion as
described by the EPSR model. The O-H stretch band of water and hydroxides in the AMC
(figure 3.32 B) and ACMC samples (figure 3.32 E) show no sign of a hydroxide band at high
hydration level due to the overlapping of the water and hydroxide stretching band at ~3300
and ~3600 cm-1
. However, after dehydration the broad peak at 3600 cm-1
characteristic of
hydroxides becomes visible. The broadening of this peak also indicates that the hydroxides
are acting as a hydrogen bond donors as expected from the pdf analysis.
Figure 3.32: FTIR spectrum of AMC (A,B) and ACMC (D,E) from figure 3.31 showing
splitting with increasing dehydration of the asymmetric stretching mode from the carbonate
ion(A,D) and the O-H stretching mode of water/hydroxide where the hydroxide band is clear
seen in the fully dehydrated samples (B,E). C) Comparison of the O-H stretching mode ACC,
AMC and ACMC showing a very similar band in all samples, indicating strong water-
carbonate/hydroxide hydrogen bonding as shown in figure 3.15. F) IINS of AMC at both
hydration levels showing two band in the translational region at 90 and 260 cm-1
and a broad
librational band from 350 cm-1
to 1000 cm-1
. The ACMC sample was not measured during the
initial beam time at the TOSCA instrument and a second beam time was not available for
measuring these samples.
Comparison of the low frequency tail of the O-H stretch band show a high similarity between
ACC, ACMC and AMC indicating that hydrogen bonding mainly occur between water and
carbonate/hydroxides as shown for ACC (figure 3.15). The low frequency part of the
vibrational spectrum was measured using IINS (figure 3.32 F) showing three features, a broad
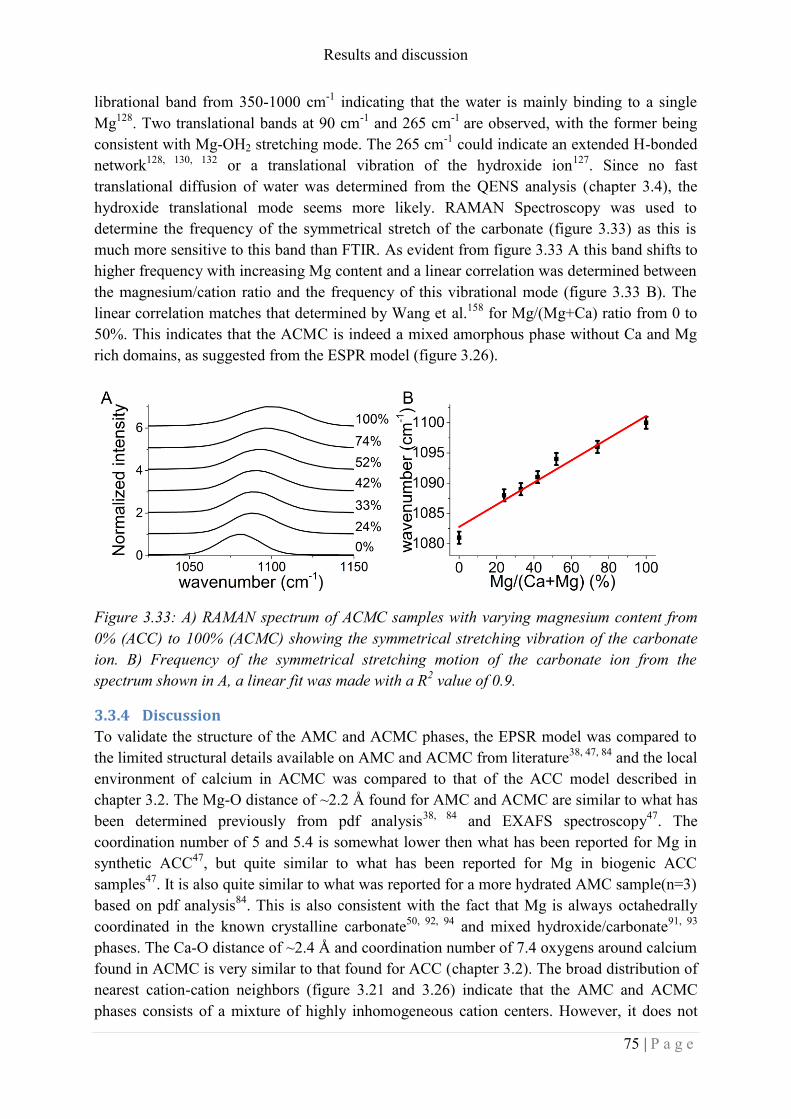
Results and discussion
75 | P a g e
librational band from 350-1000 cm-1
indicating that the water is mainly binding to a single
Mg128
. Two translational bands at 90 cm-1
and 265 cm-1
are observed, with the former being
consistent with Mg-OH2 stretching mode. The 265 cm-1
could indicate an extended H-bonded
network128, 130, 132
or a translational vibration of the hydroxide ion127
. Since no fast
translational diffusion of water was determined from the QENS analysis (chapter 3.4), the
hydroxide translational mode seems more likely. RAMAN Spectroscopy was used to
determine the frequency of the symmetrical stretch of the carbonate (figure 3.33) as this is
much more sensitive to this band than FTIR. As evident from figure 3.33 A this band shifts to
higher frequency with increasing Mg content and a linear correlation was determined between
the magnesium/cation ratio and the frequency of this vibrational mode (figure 3.33 B). The
linear correlation matches that determined by Wang et al.158
for Mg/(Mg+Ca) ratio from 0 to
50%. This indicates that the ACMC is indeed a mixed amorphous phase without Ca and Mg
rich domains, as suggested from the ESPR model (figure 3.26).
Figure 3.33: A) RAMAN spectrum of ACMC samples with varying magnesium content from
0% (ACC) to 100% (ACMC) showing the symmetrical stretching vibration of the carbonate
ion. B) Frequency of the symmetrical stretching motion of the carbonate ion from the
spectrum shown in A, a linear fit was made with a R2 value of 0.9.
3.3.4 Discussion
To validate the structure of the AMC and ACMC phases, the EPSR model was compared to
the limited structural details available on AMC and ACMC from literature38, 47, 84
and the local
environment of calcium in ACMC was compared to that of the ACC model described in
chapter 3.2. The Mg-O distance of ~2.2 Å found for AMC and ACMC are similar to what has
been determined previously from pdf analysis38, 84
and EXAFS spectroscopy47
. The
coordination number of 5 and 5.4 is somewhat lower then what has been reported for Mg in
synthetic ACC47
, but quite similar to what has been reported for Mg in biogenic ACC
samples47
. It is also quite similar to what was reported for a more hydrated AMC sample(n=3)
based on pdf analysis84
. This is also consistent with the fact that Mg is always octahedrally
coordinated in the known crystalline carbonate50, 92, 94
and mixed hydroxide/carbonate91, 93
phases. The Ca-O distance of ~2.4 Å and coordination number of 7.4 oxygens around calcium
found in ACMC is very similar to that found for ACC (chapter 3.2). The broad distribution of
nearest cation-cation neighbors (figure 3.21 and 3.26) indicate that the AMC and ACMC
phases consists of a mixture of highly inhomogeneous cation centers. However, it does not

Results and discussion
76 | P a g e
suggest that ACMC is a micro separated compound with adjacent magnesium and calcium
rich domains, as previous suggested34
.
The coordination numbers of oxygen around the cation are near constant for all the samples
before and after heating. This suggests that the anions have to reorientate to compensate for
the loss of water, similar to what was found for ACC (chapter 3.2). This effect is quite clear
for Ca in both ACC (chapter 3.2) and ACMC and less so for Mg in ACMC (figure 3.26).
However, there is almost no change around magnesium in AMC (figure 3.21). It is also clear
in ACMC that the carbonate molecule compensates for the loss of water, whereas the
hydroxides show little to no change in the coordination number distributions. The small
change in the Mg-Ow coordination number in AMC is caused by the large amount of water
not interacting with magnesium (33% of the total water). This contradicts the notion that
magnesium stabilizes ACC by the strong interaction with water, since the lower coordination
number of magnesium (compared to calcium) leaves a larger portion of the water that is
bound only by hydrogen bonds47, 89
. However, the strong interaction between magnesium and
water may still have an effect at lower hydration levels.
The smaller radii of the magnesium ion put significant constraints on the local environment.
This is seen in the sdf of magnesium around carbonate (figure 3.22 And 3.28) where
magnesium has a strong preference for monodentate binding with the carbonate ion and a
very confined binding site to Ow. It is also seen in the angular distributions (figure 3.21 and
3.27) that magnesium adopts an octahedral coordination sphere, whereas calcium seems to
adopt a wider range of coordination geometries as seen by the lack of high angle peaks in the
angular distribution (figure 3.27). This all indicates that magnesium may provide a stabilizing
effect by acting as points of order in an otherwise disordered material. Another stabilizing
effect from magnesium may arise from the coprecipitation of hydroxides with magnesium.
The lack of a change in the coordination number distribution(figure 3.21 and 3.26) involving
Oh indicate that hydroxide ions are less flexible then carbonate ions, making remodeling more
difficult leading to a stabilizing effect as have also been reported for hydroxides in ACC39, 75
.
This also indicates that large scale phase separation has to take place prior to any
crystallization as the composition of AMC and ACMC does not match any of the known
crystalline phases. However, it is not clear if the basic magnesium carbonates
hydromagnesite91
[Mg5(CO3)4(OH)2.4H2O] and artinite
93 [Mg2(CO3)(OH)2
.3H2O] can
incorporate calcium or form directly from amorphous materials that do not have the same
hydration level or the same carbonate to hydroxide ratio.
The pdf analysis, FTIR spectra and IINS all indicate that the water in all the samples is of a
structural nature. The pdf analysis shows that the majority of the water is interacting with both
the cation and anions, with a smaller population of the water interacting only with anions
through hydrogen bonding. The ratio between these two populations seems to be linked to the
ratio of Mg/Ca with an increased amount of cation free water environments with decreasing
calcium content. The splitting of the asymmetric stretch band of the carbonate ion (figure
3.32) is related to hydrogen bonds involving carbonate and indicates a loss of carbonate-
water/hydroxide hydrogen bonds146
. This is substantiated by the low frequency tail of the O-H
stretch of the amorphous phases (figure 3.32) compared to liquid water (3.15). The IINS

Results and discussion
77 | P a g e
spectrum furthermore showed that the water is directly binding to magnesium by the 90 cm-1
band observed in the IINS spectrum and the presence of hydroxides by the translational
vibration band of the Mg-OH bond at 265 cm-1
.
3.3.5 Conclusion
Through our analysis we have shown that magnesium places significant constraint on its local
environment compared to calcium. This is seen in the form of an increase ratio of
monodentate/bidentate binding for carbonate to magnesium (roughly 90%/10% respectively).
Mg also strongly favors octahedral coordination whereas calcium shown no clear preferred
coordination geometry. The main stabilizing effect of magnesium seems not to come from the
cation itself but from coprecipitation of hydroxides with magnesium that greatly reduces the
molecular reorientation during dehydration. Analysis of the cation-cation nearest and next
nearest neighbors also showed that the ACMC phase is highly inhomogeneous but did not
show any evidence for a phase separated system
Analysis of the hydrogen bonding in AMC and ACMC suggests that hydroxide is the
strongest hydrogen bond acceptor in the system. However, most hydrogen bonding occurs
between carbonate and water molecules due to the sheer number of oxygen from carbonate
ions. Pdf analysis and vibrational spectroscopy both suggests that the water in the samples is
of a structural nature, but distributed between many different binding site, i.g. bonding to
cation and anions, only binding to anions split between hydrogen bonded to carbonate and
hydroxide and bonded to water and ions at the same time. But no evidence was found for
water molecules only binding to other water molecules.
3.3.6 Materials and methods
Sample were made by rapid mixing of 20 mL 1 M (Ca/Mg)Cl2 (CaCl2∙2H2O ≥99%,
MgCl2∙6H2O 99-102%, Sigma Aldrich) solution with 480 mL Na2CO3 (Na2CO3∙10H2O
99.999%, Sigma Aldrich) to get an initial concentration of 40 mM of both the
carbonate and Ca/Mg ion. The solution was filtered, after which the solid was washed
with cold ethanol (99.8%, Sigma Aldrich) and dried in a vacuum desiccator for a
minimum of 24 hours to remove all ethanol.
IINS: IINS was performed at the TOSCA124
instrument at ISIS (STFC Rutherford
Appleton Laboratory, Didcot, UK). Samples were mounted in aluminium cans and
sealed with indium wire. Samples were cooled to <30 °K before measuring and kept at
~10 °K during the measurement.
FTIR: FTIR-ATR was performed on a Nicolet IS5 (Thermo Fisher scientific, Waltham,
MA, US) with an ID5 ATR module. Spectra was measured from 550 to 4000 cm-1
and
averaged over 64 spectra.
Pdf measurement and analysis: x-ray pdf was measured at ID11 at the ESRF
(Grenoble, France) using a 0.14088 Å beam and a Frelon2K detector and at I15 at the
diamond light source (Didcot, UK) using a 0.16 Å beam and a Perkin Elmer detector.
Neutron PDF was measured at the SANDALS Instrument120
at ISIS (STFC Rutherford
Appleton Laboratory, Didcot, UK). 5-6 g of sample was placed in a 12 mm thick
sample can with vanadium windows. The thick sample can was chosen due to the low

Results and discussion
78 | P a g e
sample packing fraction of ~10%. Each sample was measured for ~8 hours. Data
reduction for both x-ray and neutron measurement was performed in Gudrun117
.
He-Pycnometry: Pycnometer measurement was performed on a Ultrapycnometer 1200e
MUPY-31-T (Quantachrome Instruments, Boynton Beach, Florida, US). ~ 1 g was place in a
~4 mL sample holder and measured using He gas. Five measurements were averaged for the
final result
ICP-OES: Sodium impurity levels was checked by ICP-OES (optima 8000 ICP-OES
spectrometer, PerkinElmer, Waltham, MA)
TGA/DSC: hydration levels were determined by TGA/DSC (SENSYS evo TGA-DSC,
SETARAM instrumentation, Caluire, France). The samples (>10 mg) were heated in alumina
crucibles to 800 °C at 2 °C/min under argon gas flow.

Results and discussion
79 | P a g e
3.4 Dynamics of hydrous species in ACC and AMC
In the previous two sections we have discussed the structure of amorphous calcium and
magnesium carbonates using pdf analysis and while this techniques is excellent for structural
investigation it is only sensitive to the time averaged structure, meaning that it cannot look
into the fast dynamics occurring in the system. For this the dynamic structure factor S(Q,ω) is
needed. Much like the Q range in a diffraction experiment determines what length scales a
measurement can probe; the dynamic range (ω) determines what time scale can be probed
from the dynamic structure factor. This has already been seen in the IINS spectrums shown
for ACC and AMC in the previous sections were the time characteristic of inter-molecular
vibrations were probed on the femtosecond time scale (figure 3.16 and 3.32). Using QENS we
look into atomic/molecular motion on the picosecond time scale. Similarly to the IINS
measurement this technique is 100 times more sensitive to motion related to hydrous species
over any other species. From the dynamic structure factor confined motion and the possibility
of diffusional motion of hydrous species in ACC and AMC on the picosecond time scale can
be investigated (specifically <75 ps, determined by the resolution of instrument). This
approach was chosen given the multiple studies suggesting mobile or liquid like water56, 59
and the presence of water confined in pores present in ACC63, 69
, which contradict the
description of structural water we have just made based on the pdf analysis and the vibrational
spectroscopy analysis.
The IRIS125
instrument was chosen given its wide dynamic range, where translation diffusion
is found for bulk and confined water in many hydrated mineral systems136-138, 159
. This range
also covers the time scales for confined motion (i.e. non-translational motion) of the hydrogen
as found in both clays and zeolites135, 159
. The samples studied here range from ACC to AMC
with a composition of Ca1-xMgx(CO3)1-0.32x(OH)x0.64*nH2O. Five Samples were chosen for
analysis with x=0, 0.22, 0.52, 0.73 and 1, with n=1.1-1.2.
3.4.1 Results
Two types of measurements were performed at the IRIS instrument: A fixed elastic window
scan (FEWS) and a quasi-elastic neutron scattering (QENS) measurements. The FEWS
measurement can reveal phase (freezing of water) transitions typically found for liquid or
confined water and the short exposure time (20 min) allows the measurement to be conducted
over a wide temperature range with decent resolution (5-300 °K with 5 °K resolution in this
case). The QENS measurement takes significantly longer (6 hours) but allows for the Q
resolved dynamic structure to be measured, from which the geometry of the motion can be
determined.
3.4.1.1 Fixed elastic window scan
Figure 3.34 A shows the QENS measurement after 20 min exposure with the elastic
line marked in gray. The elastic line is determined by the resolution of the instrument,
17.5 µeV (FWHM of the elastic line for a static sample, i.e. vanadium at 5 °K). This
line can be integrated and plotted against the temperature to determine changes in
dynamics in the system (figure 3.34 B). Since any diffusion occurring faster than the

Results and discussion
80 | P a g e
resolution limit of the instrument results in a decrease of the intensity of the elastic
line, by following the variation of this intensity phase transition can be determined.
Such as the melting of any bulk or confined water138
. For ACC a steady decrease in the
intensity is observed from 5 °K to 300 °K with no apparent phase transition. For AMC
the same steady decrease is observed from 5 °K to ~240 °K after which a drop in
intensity is observed indicating a change in dynamics. However, the drop here is
significantly smaller and at higher temperatures compared to what has been reported
for freezing transition of water confined in pores as small as 1.5 nm138
.
Figure 3.34: A) single temperature spectrum measurement integrated for all Q with the
elastic line marked in grey. B) Fixed elastic window scan (FEWS) of ACC and AMC
obtained from the integrated area of the elastic line (grey area in A) normalized to the
integrated intensity of the elastic line at 5 °K.
3.4.1.2 Quasi Elastic Neutron scattering
The IRIS spectrometer features 50 detector/analyzer pairs given 50 Q values in a range of
0.42-1.85 Å-1
. To compare the broadening of the elastic line between the samples, the spectra
were averaged over all detectors to give a single spectrum for each sample (Figure 3.35). The
samples were measured at 5 °K to determine the resolution function of the sample, assuming
negligible line broadening from diffusion or confined motion in the sample at this
temperature. The ACC and AMC samples were planned to be measured at three elevated
temperatures to determine the activation energy of the motion.
Figure 3.35: Q integrated QENS spectra of ACC (A) and AMC(B) at 5, 250 and 300
°K and QENS spectra at 300 °K for all samples.
However, problems during the beam time meant that only two elevated temperatures
could be measured for these samples. ACC and AMC samples both show line
Results and discussion
81 | P a g e
broadening with increasing temperature (figure 3.35 A and B). However, most of the
elastic line is still present, showing that most of the H is not mobile on a time scale
below the 75 ps resolution limit of the instrument. For ACC (Figure 3.35 A) and AMC
(Figure 3.35 B) the line broadening increases with temperature as expected since
molecular mobility generally increases with temperature. For AMC the increase from
250 °K to 300 °K is significantly higher than for ACC as expected from the FEWS
measurement (Figure 3.34). To compare the line broadening between the samples the
spectra were normalized to the height of the elastic line. Since this is proportional to
the scattering power of the sample and the amount of sample in the beam this is
essentially equivalent to normalizing to the amount of hydrogen as H is by far the
strongest scatterer in the system. From the normalized spectra (Figure 3.35 C) it is
clear that the ACC and ACMC samples have similar line broadening while the AMC
sample has significantly more line broadening, indicating faster motion of the
hydrogen and a higher fraction of hydrogen exhibiting this motion in AMC compared
to the other samples.
To determine the geometry of the hydrogen motion, the Q dependent QENS spectra
was used. The 50 detector banks were grouped into 10 groups to increase the statistics
of the weak QENS signal. The FWHM of the line broadening was determined by a
convolution of the elastic line and a single lorentzian peak. A fit using two lorentzian
peaks was also done but without any improvement to the fit, indicating that only a
single type of motion is observed in all samples. This was done for each Q value for all
samples (Figure 3.36 A). In the case of translational diffusion an increased FWHM
with Q136
is expected according to equation 2.21, while for confined motion the
FWHM should be independent of Q135
. Despite the noise in the data (Figure 3.36 A) it
is clear that there is no increase in line broadening for ACC and the three ACMC
samples with Q indicating that the motion observed is confined. A small increase is
observed in the AMC sample for Q values from 0.5 to 1 Å-1
. By fitting the FWHM(Q)
with a jump diffusion model (equation 2.21)136
, a jump distance of 6.4 Å was found.
Given that the longest jump distance we found in literature is 3.9 Å for confined water
in Li-montmorillonite159
, this distance is considered too large to be physically
meaningful. It is likely that the two low Q point are outliers and, like for the other
samples, the motion found in AMC is also confined. From the FWHM, the residence
time(t) for this confined motion was calculated for each sample as 𝑡 = 2ℏ/𝐻𝑊𝐻𝑀.
Where HWHM is the half width as half maximum and ℏ is the reduced Planck
constant. The resulting residence time vs. magnesium concentration is shown in figure
3.36 B.

Results and discussion
82 | P a g e
Figure 3.36: A) FWHM of the lorentzian used to fit the QENS spectra as a function of
Q for all samples. B) The residence time of the confined motion of H calculated from
the FWHM shown in A.
3.4.2 Discussion
The confined motion probed by the QENS measurement of the water molecules and
possibly the hydroxides is most likely a reorientation of the O-H bond between
hydrogen bonding sites (i.e. with the hydrogen pointing towards oxygen from water,
carbonate or hydroxides) in the local environment. This confined motion implies that
hydrous species keep bound for ~10-20 ps to one of the available oxygens in its near
vicinity before switching to an adjacent site. The residence time of 10-20 ps found for
confined motion in ACC/AMC is similar to the reported values for reorientational
motion of water in other hydrated minerals (e.g. clays159
and zeolites135
) and an order
of magnitude slower then what is found in liquid water at room temperature136
. The
shorter residence time found in AMC is surprising, as the residence time for ACC and
the three ACMC samples are all very similar. We have not been able to unequivocally
determine the cause of the difference between AMC and ACC/ACMC samples.
However, it can be speculated that this is likely to be caused by a difference in the
hydrogen bonding strength or geometry, as the reorientational motion of the H involves
breaking a hydrogen bond and reforming it with an acceptor in a neighboring site. The
difference between the AMC and the ACC/ACMC samples seems to occur in the range
between 0.73 < x ≤ 1. At low Mg2+
contents, HW are likely to be preferentially
hydrogen bonded to carbonate molecules as we have previously shown for ACC
(chapter 3.2). At higher Mg2+
contents this situation could be perturbed: once enough
CO32-
are replaced by OH-, because the different sizes and electronic properties of
these two anions, the distance between bonding sites and/or the strength of the H-bond
interactions can change significantly. The existence of liquid like water in amorphous
carbonates has been suggested by several NMR studies56, 59
. The presence of this kind
of water within the materials studied here seems however unlikely. Residence times
and jump distances for confined H2O molecules in clays and mesoporous compounds
have been reported between 2 and 43 ps between 1.1 and 3.9 Å, respectively 137, 159
.
Bulk liquid water has much faster diffusion with a residence time of 1.25 ps and a
jump distance of 1.29 Å136
. Translational diffusion of water in ACC/AMC has
residence times >75 ps (the resolution limit of the IRIS instrument). This indicates that

Results and discussion
83 | P a g e
the large majority of water in these materials is structural. Although structural, water
can still slowly diffuse through the material, as it has been predicted by MD
simulation70
. Assuming a long jump distances as high as 4 Å (the highest jump
distance reported in literature to the best of our knowledge159
) and using equation 2.21
one can calculate an upper limit for the diffusion coefficient(D) of 3.56∙10-10
m2
s-1
, and
MD simulations have suggested that it may be as much as 5 orders of magnitude
lower70
. Given the relatively slow diffusion of water in these systems it is unlikely that
mobility of the internal water plays a large role in initiating ACC crystallization
compared to the much higher mobility of bulk water at the surface of the ACC that
may be present. Consistent with the long life time of ACC in vacuum (>6 months)74
or
in confinement56
compared to the lifetime in solution (minutes)72, 80
.
3.4.3 Conclusion
We have shown that the motion of hydrous species in ACC/AMC is spatially confined
in the time range below 75 ps ruling out motion characteristic of liquid or confined
water as have been suggested to be present in ACC59
. We determined that fast mobility
of hydrogen arise from a reorientation of H between different hydrogen bonding sites
occurring with a residence time around 20 ps for ACC and ACMC (with 0 ≤ x ≤ 0.73)
while this occurs faster in AMC with a residence time of 12 ps. Since no translational
diffusion was found we could only determine an upper limit for the diffusion
coefficient for all samples of Dmax=3.56∙10-10
m2
s-1
based on the instrument resolution
and assuming a maximum jump distance of 4 Å, indicating that the water diffusion
coefficient for these amorphous phases are at least an order magnitude lower than that
of bulk water136-137
. Consistent with molecular dynamics simulation that suggests a
diffusion coefficient as low as 42∙10-15
m2
s-1
.
3.4.4 Materials and methods
Materials synthesis: ACC/AMC was synthesized by rapid mixing of 20 mL 1 M
(Ca/Mg)Cl2 (CaCl2∙2H2O ≥99%, MgCl2∙6H2O 99-102%, Sigma Aldrich) solution with
480 mL Na2CO3 (Na2CO3∙10H2O 99.999%, Sigma Aldrich) to get an initial
concentration of 40 mM of both the carbonate and Ca/Mg ions. The solution was
filtered, after which the solid was washed with cold ethanol (99.8%, Sigma Aldrich)
and dried in a vacuum desiccator for a minimum of 24 h.
QENS: Quasi elastic neutron scattering was performed on the IRIS instrument125
at
ISIS-TS1 using a pyrolytic graphite 002 analyser (STFC Rutherford Appleton
Laboratory, Didcot, UK). The samples were measured from -0.4 to 0.4 meV in ω and
from 0.42 to 1.85 Å-1
in Q. ~2 grams of sample was place in a annular aluminium can
with 2 mm sample thickness. ACC and AMC was measured at 5 K, 250 K and 300 K
for 6 hours while ACMC with Mg/(Ca+Mg)=0.22, 0.52 and 0.73 was measured at 300
K for 6 hours. Fixed elastic window scan was performed on ACC and AMC from 5 K

Results and discussion
84 | P a g e
to 300 K with 5 K resolution and 20 min exposure per step. Data reduction and
analysis was performed in Mantid160
.

Summary and Conclusion
85 | P a g e
4 Summary and Conclusion
In chapter 3.1 it was shown that ACC and AMC samples can be made in quantities necessary
for neutron diffraction studies and even for inelastic neutron diffraction experiments. The
synthesis route was optimized to obtain samples with a high reproducibility in composition
and equipment was designed to ensure that samples could remain stable for the time necessary
to travel to the neutron sources and to perform the measurements (approximately 2-3 weeks).
With a production rate of ~15 grams/day this opens the opportunity perform parametric
studies on ACC covering a large number of samples, potentially as many as 20 samples for a
full week of beam time, although the maximum reached in this study was 13 samples in 5
days at the sandals instrument. We also showed that magnesium coprecipitates with hydroxide
ions when synthesizing AMC or ACMC by a combined analysis using FTIR, ICP-OES and
TGA given a composition of:
𝐶𝑎1−𝑥𝑀𝑔𝑥(𝐶𝑂3)1−0.32(4)𝑥(𝑂𝐻)0.64(8)𝑥 ∙ 𝑛𝐻2𝑂 𝑤𝑖𝑡ℎ 𝑛 = 1.1 − 1.2
In chapter 3.2 an EPSR model of ACC was presented with a hydration level of n=1.1 and 0.5.
This showed that dehydration does not cause large changes to the pdf for both neutron and x-
ray measurements. However, a detailed EPSR structural analysis showed that large structural
changes did take place during dehydration, but without changing the interactions between the
molecules/ions and without increasing the order of the system. The structural analysis showed
that there is a high diversity in the binding site available in ACC for all the components
evident by the broad distribution of coordination numbers for the various atomic pairs (figure
3.9 and 3.11). By comparing the coordination number distribution before and after the
dehydration a shift was seen to higher coordination numbers in most of the distributions. Of
special interest was the distribution of nearest neighbouring oxygen around calcium. This
showed that during dehydration, water molecules are stripped off the calcium ion and that the
carbonate ions reorientate to compensate for the loss of water oxygens giving a mean
coordination number of 7.2 oxygens around calcium for both hydration levels. Analysis of the
angular distribution of oxygens around calcium showed that the wide range of coordination
number result in no preferred angle above 100° and with a 70° angle between adjacent
oxygens indicating that there is no preferred coordination geometry, consistent with the wide
range of reported coordination geometries present in the crystalline calcium carbonate
minerals50-54
. The angular distribution of oxygens from water around calcium showed two
preferred angles of 70° and 140°, characteristic of the local environment of calcium ions in
solution, suggesting that the hydration shell of the ion in solution may be partially preserved
during the precipitation reaction. The addition of the n-pdf allows for the evaluation for the
hydrogen related ppdfs and showed that the water molecules are highly structural in ACC.
This is seen by the large fraction of water molecules binding to the ions, 90% and 100% of the
water molecules binding to calcium and carbonate respectively while only 10% of the water
molecules form hydrogen bonds with other water molecules. The presence of large pores in
the ACC structure was also evaluated as this has been discussed in several previous studies43,
59, 63, 69. This showed that water molecules are in close proximity of other water molecules but

Summary and Conclusion
86 | P a g e
that they are only infrequently hydrogen bonded together and as such may match the
definition of water percolation as stated by Bushuev et al69
.
In chapter 3.3 the analysis of the local structure in AMC and ACMC was presented with the
following composition for AMC:
𝑀𝑔(𝐶𝑂3)0.68(𝑂𝐻)0.64 ∙ 𝑛𝐻2𝑂 𝑛 = 1.2 & 0.7
And for ACMC:
𝐶𝑎0.48𝑀𝑔0.52(𝐶𝑂3)0.84(𝑂𝐻)0.32 ∙ 𝑛𝐻2𝑂 𝑛 = 1.1 & 0.5
Similar to the ACC pdfs only small changes were observed in the pdfs of ACMC and AMC
upon dehydration.
For the AMC sample, the EPSR analysis showed that there was almost no change in the local
coordination geometry of the magnesium upon dehydration. This is consistent with more of
the water in AMC not coordinating to the cation compared to the ACC, suggesting that the
water is mainly being removed from binding sites related only to the anions in the AMC. Only
2/3 of the water in the AMC are binding to the cation compared to the 90% in ACC, but they
are all forming hydrogen bonds to either carbonate or hydroxide ions. The coordination
number distributions show similar broad distribution as seen in ACC (figure 3.21), indicating
a high diversity in the various binding sites. From the first peak in the cation-C ppdf also
showed that magnesium is less inclined to form bidentate binding with carbonate compared to
calcium. Analyses of the angular distribution of nearest neighbouring oxygens to the
magnesium showed a high probability for forming 90° and 180° angles between oxygens,
indicating a strong preference for octahedral coordination geometry in the first coordination
sphere of magnesium. Consistent with the structure reported for magnesium in the various
crystalline phases that all show octahedral coordination of magnesium50, 91-94, 156
with
monodentate binding to the carbonate except for nesquehonite that show a mixture of
bidentate and monodentate92
. Analysis of the hydrogen bonding showed that both hydrogen
from water and hydroxide contribute to hydrogen bonding as is also evident from the FTIR
measurements (figure 3.32). It was also clear that all three types of oxygen contribute as
hydrogen bond acceptors. By comparing the peak at 1.8 in the O-H ppdfs a ranking for the
preferred hydrogen donors and acceptors could be made for donors:
𝐻𝑤 > 𝐻ℎ
And for hydrogen bond acceptors:
𝑂ℎ > 𝑂𝑐 > 𝑂𝑤
The ACMC model showed that the local environment of calcium and magnesium is very
similar to the local environment for the cations in ACC and AMC with the addition of
hydroxide ions also binding to the calcium ion. Analysis of the cation-cation nearest and next
nearest neighbour showed that there was no preference for magnesium to be near other
magnesium ions over other calcium ions and vice versa (figure 3.26) indicating a well-mixed
but highly inhomogeneous phase as evident by the broad distribution of coordination

Summary and Conclusion
87 | P a g e
numbers. Dehydration of the ACMC phase also showed that magnesium can undergo
structural changes upon dehydration similar to what was observed for calcium in ACC with a
lowering of the coordination number of water binding to the cation compensated for by a
reorientation of the carbonate ion to coordination more cations on average, keeping the same
mean coordination number for the cation before and after dehydration. However, the
hydroxide ion does not seem to take part in this reorientation event as seen by both the lack of
change for the coordination number distribution of Oh around calcium and magnesium before
and after dehydration (figure 3.26). Despite the O-H ppdf in ACMC indicating a similar
ranking of the hydrogen bond donor and acceptors as seen in the AMC, the sheer number of
carbonate present in the system result in most of the hydrogen bonds forming between water
and carbonate ions.
In chapter 3.4 the dynamics of hydrous species in ACC, AMC and ACMC are investigated
this analysis confirmed the results of the EPSR analysis that water is highly structural and
therefore does not show translational diffusion on the timescale expected for bulk or confined
water as have been postulated in previous studies59, 63
. Instead a confined motion was
observed indicating that the hydrous species can reorientate between sites where the hydrogen
atoms can form bonds to oxygen from hydroxide, carbonate or water molecules/ions with a
residence time of 10-20 ps. Some difference was found between the AMC and ACMC(x=0 to
0.73) samples, indicating a faster confined motion in AMC, likely connected to the more
mixed hydrogen bonding present in AMC caused by the high concentration of hydroxide ions.
In conclusion we have shown that amorphous carbonate samples can be formed in quantities
allowing for neutron measurements to be made without the presence of stabilizing additives
that have been used in previous studies43, 66
. We have also showed that EPSR can be used to
generate physically relevant structure to interpret the local environment of the amorphous
phase given that accurate reference potentials, composition and density can be determined.
The structural analysis showed that the amorphous phases are well mixed but highly
inhomogeneous phase with a broad distribution in coordination numbers around the various
species. We have shown that the hydrogen bonding mainly occur between carbonate and
water for samples containing ≤ 50 % magnesium (maybe ≤ 72% magnesium as indicated from
the QENS analysis) and in AMC the main hydrogen bond acceptors are carbonate and
hydroxide ions resulting in faster confined motion for the hydrous species. The lack of
translational diffusion at the fast time scales and the hydrogen bond analysis from ESPR
showed that water in ACC/ACMC and AMC is highly structural.
Analysis of the local environment of the cations showed that the calcium environment is
highly flexible and can adopt many different local geometries, while magnesium strongly
favours the octahedral geometry making the local structure of magnesium highly constrained
compared to calcium. However, this constraint does not translate to the calcium environment
in the mixed phase ACMC as there is enough flexibility in the carbonate/hydroxide
environment to accommodate both the diverse calcium centres and the highly ordered
magnesium centres at the same time without requiring a phase separated system of
magnesium and calcium rich domains. By analysing the local structure both before and after
partial dehydration it was shown that the main structural change arise from the stripping of

Summary and Conclusion
88 | P a g e
water molecules away from the cations compensated for by a rearrangement of the carbonate
ions that results in a fixed mean coordination number of ~7.3 for Ca and ~5.2 for Mgn for both
hydration levels. However, this effect is much smaller for magnesium compared to calcium
and in AMC this effect is almost absent as a large amount of the water molecules do not
interact directly with the cation and hence the dehydration mainly affects the hydrogen
bonding to the anions.
n The mean coordination number here is taking from the average found in ACC, ACMC and AMC

Outlook
89 | P a g e
5 Outlook
The optimization of the ACC synthesis now allows for a relatively large number of samples to
be prepared for a single neutron diffraction experiment. This gives some new opportunities to
perform parametric neutron diffraction studies both in pdf analysis that are highly sensitive to
local structure and in inelastic measurements that is more sensitive to hydrous species.
5.1 Possible for future parametric studies based on neutron diffraction
In this study magnesium and hydration level has been the main focus, but there are several
other important additives that warrant this more elaborate analysis (i.e. EPSR fitting). A larger
number of samples for each parameter would also greatly help to get a better understanding of
the local structure as ACMC studied in this work:
𝐶𝑎1−𝑥𝑀𝑔𝑥(𝐶𝑂3)1−0.32(4)𝑥(𝑂𝐻)0.64(8)𝑥 ∙ 𝑛𝐻2𝑂
we have only studied three x values and two n for each x in the pdf analysis, which is very
minimal compared to what could be possible if instruments of a higher intensity was used (i.e.
shorter measurement times). This could be either INOVA at J-PARC (Tokai, Japan) or
NIMROD at ISIS (Oxford, UK) but could also be done at SANDALS if enough time is
available. This would also place more pressure on computation time and data treatment, but if
several models can be analyzed in parallel this would be possibleo.
The other inorganic additives that would be of interest could be the Strontium and barium if
amorphous samples can be made. The other divalent ions would also be of great interest as the
relationship between cation size and structural parameters could then elucidated similar to
what has been available for decades for the crystalline phases. Anions of different geometry
and charge would also be interesting to study, to deconvolute how the different parameters
affect the local environment. E.g. perchlorate (ClO4-), sulfate (SO4
2-) and phosphate (PO4
3-)
all have a tetrahedral geometry but different charges. However, it is not clear if all of the
interesting anions will form an amorphous phase with calcium or if it possible to get similar
hydration level for each phase, which would be a prerequisite for any comparison. Given the
biological relevance for the amorphous phase, structural studies including proteins, sugars,
lipids and small organic molecules are also relevant to study, but extensive deuteration may
be necessary to gain enough sensitivity in the experimental data to perform the EPSR
modeling without relying too much on the reference potential alone. If e.g. proteins become
too large there may also be limitations in the computation time it would take to fully analyze
the structure. Another drawback of this approach is the sensitivity of the pdf to additives of
low concentration as seen in figure 3.4, making analysis of mixed phases at low
concentrations difficult without access to additional data from techniques that are more
selective, such as NMR, vibrational spectroscopy or EXAFS.
o The disordered materials group also host a EPSR workshop at their annual user meeting which is highly
recommended for anyone wanting to learn how to use ESPR

Outlook
90 | P a g e
5.2 Translational diffusion of water in ACC
In the QENS study that is described in chapter 3.4, the main drawback was that the
translational diffusion was not measured as evident by the high intensity of the elastic peak
even at room temperature of the QENS measurement (figure 3.35). This was a result of a
choice that had to be made about which instrument to use, either a spectrometer that could
have covered the time scale suggested by Malini et al. from MD simulation70
or as was chosen
a spectrometer that was sensitive to the time scale reported for translational motion in liquid
water and confined liquid water as had been suggested to be present based on NMR studies59
.
The IRIS instrument clearly showed that the internal water in ACC is not in a liquid state and
that magnesium only has a minor effect on the confined motion of hydrous species in ACC,
but it does not tell us anything about how the diffusion occurs in the system or the effect that
magnesium may have on the diffusion mechanics. But there are several other high resolution
inelastic spectrometers available to analysis the longer time scale such as the IN16B
instrument at the ILL (Grenoble, France) which can probe time scale from ~40 ps to 1.7 ns.
Even longer time scale are accessible using spin echo neutron spectroscopy (SENS) at e.g.
IN15 which has a very wide energy transfer range of 0.2 neV to 200 µeV. However, the
measurement time necessary for such an experiment may make it difficult to analyze several
samples using SENS.
The argument can also be made that if the dynamics of the water is very slow, the diffusion of
water may not be relevant for ACC crystallizes and as such would provide only a limited
insight into the properties of the amorphous phase. In that case it may not warrant the use of
such expensive analysis techniques as SENS.

Acknowledgements
91 | P a g e
6 Acknowledgements
I would like to thanks all the people who have contributed to the work presented in this thesis.
Especially I would like to thanks my supervisors Peter Fratzl, Wouter Habraken and Luca
Bertinetti who have spent many hours discussing results, reviewing manuscripts and
providing helpful input for my work. I would also like to thank the local collaborator and
mentors at the MPIKG Marcus Antonietti, Damien Faivre, Yael Politi and Emmanuel
Schneck for valuable discussion and help with finishing manuscripts for publications. Several
students, Post. Docs and technicians at the MPIKG have helped with valuable discussion and
experiment assistance, especially Jeannette Steffens, Zhaoyong Zou, Marie Alberic and
Sebastian Ehrig. I am also very grateful for the help of Luca Bertinetti and Sebastian Ehrig for
recommendation on how to improve my thesis. Special thanks also goes to everyone at the
MPIKG for making the three years I have spent in Golm a very pleasant and memorable time
of my life.
My project also took me away for the institute in Golm and I spent several weeks at various
large scale facilities. Here I am grateful for all the assistance I received from various beam
line scientists but in particular I am very grateful for the help of Silvia Imberti (the beamline
scientist at the SANDALS instrument) who have been a tremendous help in introducing me to
the EPSR program, the neutron community in general and have played a key role in several of
the publication that I expect to publish from the work presented here.
Finally I would like to thank the German Research Foundation grant within the framework of
the Deutsch−Israelische Projektkooperation DIP which has funded my work at the MPIKG.
Also minor funding for conferences were provided by ISIS neutron and muon source for the
annual user meeting which I attended in 2016 and 2017 and the disordered materials user
meeting in 2017. Funding was also provided by the Niels Bohr International Academy for the
Fifth Annual Niels Bohr International Academy Workshop-School on ESS Science which I
attended in 2015.

References
92 | P a g e
7 References
1. Mann, S., Biomineralization: principles and concepts in bioinorganic materials
chemistry. Oxford University Press: 2001; Vol. 5.
2. Swann, G. E. A.; Leng, M. J., A review of diatom δ18O in palaeoceanography.
Quaternary Science Reviews 2009, 28 (5), 384-398.
3. Blakemore, R. P., Magnetotactic bacteria. Science 1975, 190 (4212), 377-379.
4. Mann, S.; Perry, C. C.; Webb, J.; Luke, B.; Williams, R. J. P., Structure, Morphology,
Composition and Organization of Biogenic Minerals in Limpet Teeth. Proceedings of the
Royal Society of London. Series B. Biological Sciences 1986, 227 (1247), 179-190.
5. Leemreize, H.; Almer, J. D.; Stock, S. R.; Birkedal, H., Three-dimensional distribution
of polymorphs and magnesium in a calcified underwater attachment system by diffraction
tomography. Journal of The Royal Society Interface 2013, 10 (86), 20130319.
6. Hasse, B.; Ehrenberg, H.; Marxen, J. C.; Becker, W.; Epple, M., Calcium carbonate
modifications in the mineralized shell of the freshwater snail Biomphalaria glabrata. Chem.
Eur. J. 2000, 6 (20), 3679-3685.
7. Setoguchi, H.; Okazaki, M.; Suga, S., Calcification in Higher Plants with Special
Reference to Cystoliths. In Origin, Evolution, and Modern Aspects of Biomineralization in
Plants and Animals, Crick, R. E., Ed. Springer US: Boston, MA, 1989; pp 409-418.
8. Carlstr; xf; m, D., A Crystallographic Study of Vertebrate Otoliths. Biological Bulletin
1963, 125 (3), 441-463.
9. Gauldie, R. W.; Sharma, S. K.; Volk, E., Micro-raman spectral study of vaterite and
aragonite otoliths of the coho salmon, Oncorhynchus kisutch. Comparative Biochemistry and
Physiology Part A: Physiology 1997, 118 (3), 753-757.
10. Reith, F.; Lengke, M. F.; Falconer, D.; Craw, D.; Southam, G., The geomicrobiology
of gold. The ISME Journal 2007, 1 (7), 567.
11. Macaskie, L. E.; Empson, R. M.; Cheetham, A. K.; Grey, C. P.; Skarnulis, A. J.,
Uranium Bioaccumulation by a Citrobacter sp. as a Result of Enzymically Mediated Growth
of Polycrystalline HUO$_2$PO$_4$. Science 1992, 257 (5071), 782-784.
12. Habraken, W. J. E. M.; Masic, A.; Bertinetti, L.; Al-Sawalmih, A.; Glazer, L.; Bentov,
S.; Fratzl, P.; Sagi, A.; Aichmayer, B.; Berman, A., Layered growth of crayfish gastrolith:
About the stability of amorphous calcium carbonate and role of additives. Journal of
Structural Biology 2015, 189 (1), 28-36.
13. Kabalah-Amitai, L.; Mayzel, B.; Zaslansky, P.; Kauffmann, Y.; Clotens, P.; Pokroy,
B., Unique crystallographic pattern in the macro to atomic structure of Herdmania momus
vateritic spicules. Journal of Structural Biology 2013, 183 (2), 191-198.
14. Weiss, I. M.; Tuross, N.; Addadi, L.; Weiner, S., Mollusc larval shell formation:
amorphous calcium carbonate is a precursor phase for aragonite. Journal of Experimental
Zoology 2002, 293 (5), 478-491.
15. Cartwright, J. H. E.; Checa, A. G.; Gale, J. D.; Gebauer, D.; Sainz-Díaz, C. I., Calcium
Carbonate Polyamorphism and Its Role in Biomineralization: How Many Amorphous
Calcium Carbonates Are There? Angew. Chem. Int. Ed. 2012, 51 (48), 11960-11970.
16. Robach, J. S.; Stock, S. R.; Veis, A., Mapping of magnesium and of different protein
fragments in sea urchin teeth via secondary ion mass spectroscopy. Journal of Structural
Biology 2006, 155 (1), 87-95.
17. Politi, Y.; Arad, T.; Klein, E.; Weiner, S.; Addadi, L., Sea urchin spine calcite forms
via a transient amorphous calcium carbonate phase. Science 2004, 306 (5699), 1161-1164.
18. Killian, C. E.; Metzler, R. A.; Gong, Y. U. T.; Olson, I. C.; Aizenberg, J.; Politi, Y.;
Wilt, F. H.; Scholl, A.; Young, A.; Doran, A.; Kunz, M.; Tamura, N.; Coppersmith, S. N.;

References
93 | P a g e
Gilbert, P. U. P. A., Mechanism of Calcite Co-Orientation in the Sea Urchin Tooth. Journal of
the American Chemical Society 2009, 131 (51), 18404-18409.
19. Su, X.; Kamat, S.; Heuer, A., The structure of sea urchin spines, large biogenic single
crystals of calcite. Journal of materials science 2000, 35 (22), 5545-5551.
20. Gilbert, P. U. P. A.; Metzler, R. A.; Zhou, D.; Scholl, A.; Doran, A.; Young, A.; Kunz,
M.; Tamura, N.; Coppersmith, S. N., Gradual Ordering in Red Abalone Nacre. Journal of the
American Chemical Society 2008, 130 (51), 17519-17527.
21. Addadi, L.; Raz, S.; Weiner, S., Taking Advantage of Disorder: Amorphous Calcium
Carbonate and Its Roles in Biomineralization. Adv. Mater. 2003, 15 (12), 959-970.
22. Weiner, S.; Levi-Kalisman, Y.; Raz, S.; Addadi, L., Biologically Formed Amorphous
Calcium Carbonate. Connect. Tissue Res. 2003, 44 (1), 214-218.
23. Weiner, S.; Sagi, I.; Addadi, L., Choosing the crystallization path less traveled.
Science 2005, 309 (5737), 1027-1028.
24. Sviben, S.; Gal, A.; Hood, M. A.; Bertinetti, L.; Politi, Y.; Bennet, M.;
Krishnamoorthy, P.; Schertel, A.; Wirth, R.; Sorrentino, A.; Pereiro, E.; Faivre, D.; Scheffel,
A., A vacuole-like compartment concentrates a disordered calcium phase in a key
coccolithophorid alga. Nat Commun 2016, 7.
25. Gal, A.; Kahil, K.; Vidavsky, N.; DeVol, R. T.; Gilbert, P. U. P. A.; Fratzl, P.; Weiner,
S.; Addadi, L., Particle Accretion Mechanism Underlies Biological Crystal Growth from an
Amorphous Precursor Phase. Advanced Functional Materials 2014, 24 (34), 5420-5426.
26. Falini, G.; Fermani, S., Nucleation and Growth from a Biomineralization Perspective.
In New Perspectives on Mineral Nucleation and Growth: From Solution Precursors to Solid
Materials, Van Driessche, A. E. S.; Kellermeier, M.; Benning, L. G.; Gebauer, D., Eds.
Springer International Publishing: Cham, 2017; pp 185-197.
27. Zou, Z.; Bertinetti, L.; Politi, Y.; Jensen, A. C. S.; Weiner, S.; Addadi, L.; Fratzl, P.;
Habraken, W. J. E. M., Opposite Particle Size Effect on Amorphous Calcium Carbonate
Crystallization in Water and during Heating in Air. Chem. Mater 2015, 27 (12), 4237-4246.
28. Beniash, E.; Addadi, L.; Weiner, S., Cellular Control Over Spicule Formation in Sea
Urchin Embryos: A Structural Approach. Journal of Structural Biology 1999, 125 (1), 50-62.
29. Politi, Y.; Levi‐Kalisman, Y.; Raz, S.; Wilt, F.; Addadi, L.; Weiner, S.; Sagi, I.,
Structural characterization of the transient amorphous calcium carbonate precursor phase in
sea urchin embryos. Adv. Funct. Mater. 2006, 16 (10), 1289-1298.
30. Gal, A.; Weiner, S.; Addadi, L., A perspective on underlying crystal growth
mechanisms in biomineralization: solution mediated growth versus nanosphere particle
accretion. CrystEngComm 2015, 17 (13), 2606-2615.
31. Gal, A.; Brumfeld, V.; Weiner, S.; Addadi, L.; Oron, D., Certain Biominerals in
Leaves Function as Light Scatterers. Advanced Materials 2012, 24 (10), OP77-OP83.
32. Reeder, R. J.; Tang, Y.; Schmidt, M. P.; Kubista, L. M.; Cowan, D. F.; Phillips, B. L.,
Characterization of Structure in Biogenic Amorphous Calcium Carbonate: Pair Distribution
Function and Nuclear Magnetic Resonance Studies of Lobster Gastrolith. Cryst. Growth &
Des. 2013, 13 (5), 1905-1914.
33. Levi-Kalisman, Y.; Raz, S.; Weiner, S.; Addadi, L.; Sagi, I., Structural differences
between biogenic amorphous calcium carbonate phases using X-ray absorption spectroscopy.
Adv. Funct. Mater. 2002, 12 (1), 43-48.
34. Fernandez-Martinez, A.; Lopez-Martinez, H.; Wang, D., Structural Characteristics and
the Occurrence of Polyamorphism in Amorphous Calcium Carbonate. In New Perspectives on
Mineral Nucleation and Growth: From Solution Precursors to Solid Materials, Van
Driessche, A. E. S.; Kellermeier, M.; Benning, L. G.; Gebauer, D., Eds. Springer International
Publishing: Cham, 2017; pp 77-92.

References
94 | P a g e
35. Gebauer, D.; Gunawidjaja, P. N.; Ko, J. Y. P.; Bacsik, Z.; Aziz, B.; Liu, L.; Hu, Y.;
Bergström, L.; Tai, C.-W.; Sham, T.-K.; Edén, M.; Hedin, N., Proto-Calcite and Proto-
Vaterite in Amorphous Calcium Carbonates. Angewandte Chemie 2010, 122 (47), 9073-9075.
36. Michel, F. M.; MacDonald, J.; Feng, J.; Phillips, B. L.; Ehm, L.; Tarabrella, C.; Parise,
J. B.; Reeder, R. J., Structural Characteristics of Synthetic Amorphous Calcium Carbonate.
Chem. Mater 2008, 20 (14), 4720-4728.
37. Farhadi Khouzani, M.; Chevrier, D. M.; Guttlein, P.; Hauser, K.; Zhang, P.; Hedin, N.;
Gebauer, D., Disordered amorphous calcium carbonate from direct precipitation.
CrystEngComm 2015, 17 (26), 4842-4849.
38. Radha, A. V.; Fernandez-Martinez, A.; Hu, Y.; Jun, Y.-S.; Waychunas, G. A.;
Navrotsky, A., Energetic and structural studies of amorphous Ca1−xMgxCO3·nH2O (0 ⩽ x
⩽ 1). Geochimica et Cosmochimica Acta 2012, 90, 83-95.
39. Rodriguez-Blanco, J. D.; Shaw, S.; Bots, P.; Roncal-Herrero, T.; Benning, L. G., The
role of pH and Mg on the stability and crystallization of amorphous calcium carbonate.
Journal of Alloys and Compounds 2012, 536, Supplement 1 (0), S477-S479.
40. Rodriguez-Blanco, J. D.; Shaw, S.; Bots, P.; Roncal-Herrero, T.; Benning, L. G., The
role of Mg in the crystallization of monohydrocalcite. Geochimica et Cosmochimica Acta
2014, 127, 204-220.
41. Nishiyama, R.; Munemoto, T.; Fukushi, K., Formation condition of monohydrocalcite
from CaCl2–MgCl2–Na2CO3 solutions. Geochimica et Cosmochimica Acta 2013, 100, 217-
231.
42. Yang, S.-Y.; Chang, H.-H.; Lin, C.-J.; Huang, S.-J.; Chan, J. C., Is Mg-stabilized
amorphous calcium carbonate a homogeneous mixture of amorphous magnesium carbonate
and amorphous calcium carbonate? Chemical Communications 2016, 52 (77), 11527-11530.
43. Cobourne, G.; Mountjoy, G.; Rodriguez-Blanco, J. D.; Benning, L. G.; Hannon, A. C.;
Plaisier, J. R., Neutron and X-ray diffraction and empirical potential structure refinement
modelling of magnesium stabilised amorphous calcium carbonate. J. Non-Cryst. Solids 2014,
401, 154-158.
44. Loste, E.; Wilson, R. M.; Seshadri, R.; Meldrum, F. C., The role of magnesium in
stabilising amorphous calcium carbonate and controlling calcite morphologies. Journal of
Crystal Growth 2003, 254 (1), 206-218.
45. Taylor, M. G.; Simkiss, K.; Greaves, G.; Okazaki, M.; Mann, S., An X-ray absorption
spectroscopy study of the structure and transformation of amorphous calcium carbonate from
plant cystoliths. Proc. Royal Soc. B 1993, 252 (1333), 75-80.
46. Levi-Kalisman, Y.; Raz, S.; Weiner, S.; Addadi, L.; Sagi, I., X-Ray absorption
spectroscopy studies on the structure of a biogenic "amorphous" calcium carbonate phase.
Dalton Trans. 2000, (21), 3977-3982.
47. Politi, Y.; Batchelor, D. R.; Zaslansky, P.; Chmelka, B. F.; Weaver, J. C.; Sagi, I.;
Weiner, S.; Addadi, L., Role of Magnesium Ion in the Stabilization of Biogenic Amorphous
Calcium Carbonate: A Structure−Function Investigation. Chemistry of Materials 2010, 22 (1),
161-166.
48. Becker, A.; Ziegler, A.; Epple, M., The mineral phase in the cuticles of two species of
Crustacea consists of magnesium calcite, amorphous calcium carbonate, and amorphous
calcium phosphate. Dalton Trans. 2005, (10), 1814-1820.
49. Marxen, J. C.; Becker, W.; Finke, D.; Hasse, B.; Epple, M., Early mineralization in
biomphalaria glabrata: microscopic and structural results. J. Molluscan Stud. 2003, 69 (2),
113-121.
50. Graf, D., Crystallographic tables for the rhombohedral carbonates. Am. Mineral 1961,
46 (11-2), 1283-1316.
51. De Villiers, J. P. R., Crystal structures of aragonite, strontianite and witherite. Am.
Mineral 1971, 56, 758-767.

References
95 | P a g e
52. Hesse, K.; Küppers, H.; Suess, E., Refinement of the structure of Ikaite, CaCO3-
6H2O. Z. Kristallogr. Cryst. Mater. 1983, 163 (1-4), 227-232.
53. Swainson, I. P., The structure of monohydrocalcite and the phase composition of the
beachrock deposits of Lake Butler and Lake Fellmongery, South Australia. Am. Mineral
2008, 93 (7), 1014-1018.
54. Kamhi, S., On the structure of vaterite CaCO3. Acta Cryst. 1963, 16 (8), 770-772.
55. Becker, A.; Bismayer, U.; Epple, M.; Fabritius, H.; Hasse, B.; Shi, J.; Ziegler, A.,
Structural characterisation of X-ray amorphous calcium carbonate (ACC) in sternal deposits
of the crustacea Porcellio scaber. Dalton Trans. 2003, (4), 551-555.
56. Ihli, J.; Wong, W. C.; Noel, E. H.; Kim, Y.-Y.; Kulak, A. N.; Christenson, H. K.;
Duer, M. J.; Meldrum, F. C., Dehydration and crystallization of amorphous calcium carbonate
in solution and in air. Nat Commun 2014, 5, 3169.
57. Kababya, S.; Gal, A.; Kahil, K.; Weiner, S.; Addadi, L.; Schmidt, A., Phosphate–
Water Interplay Tunes Amorphous Calcium Carbonate Metastability: Spontaneous Phase
Separation and Crystallization vs Stabilization Viewed by Solid State NMR. J. Am. Chem.
Soc. 2015, 137 (2), 990-998.
58. Nebel, H.; Neumann, M.; Mayer, C.; Epple, M., On the structure of amorphous
calcium carbonate A detailed study by solid-state NMR spectroscopy. Inorg. Chem. 2008,
47 (17), 7874-7879.
59. Schmidt, M. P.; Ilott, A. J.; Phillips, B. L.; Reeder, R. J., Structural Changes upon
Dehydration of Amorphous Calcium Carbonate. Cryst. Growth & Des. 2014, 14 (3), 938-951.
60. Henry, E. F.; Adrian, C. B.; Philip, S. S., Neutron and x-ray diffraction studies of
liquids and glasses. Reports on Progress in Physics 2006, 69 (1), 233.
61. Soper, A. K., Partial structure factors from disordered materials diffraction data: An
approach using empirical potential structure refinement. Phys. Rev. B 2005, 72 (10), 104204.
62. Egami, T.; Billinge, S. J., Underneath the Bragg peaks: structural analysis of complex
materials. Elsevier: 2003; Vol. 16.
63. Goodwin, A. L.; Michel, F. M.; Phillips, B. L.; Keen, D. A.; Dove, M. T.; Reeder, R.
J., Nanoporous Structure and Medium-Range Order in Synthetic Amorphous Calcium
Carbonate. Chem. Mater 2010, 22 (10), 3197-3205.
64. Singer, J. W.; Yazaydin, A. Ö.; Kirkpatrick, R. J.; Bowers, G. M., Structure and
Transformation of Amorphous Calcium Carbonate: A Solid-State 43Ca NMR and
Computational Molecular Dynamics Investigation. Chem. Mater 2012, 24 (10), 1828-1836.
65. Tobler, D. J.; Rodriguez Blanco, J. D.; Sørensen, H. O.; Stipp, S. L. S.; Dideriksen, K.,
Effect of pH on Amorphous Calcium Carbonate Structure and Transformation. Cryst. Growth
& Des. 2016, 16 (8), 4500-4508.
66. Wang, H.-W.; Daemen, L. L.; Cheshire, M. C.; Kidder, M. K.; Stack, A. G.; Allard, L.
F.; Neuefeind, J.; Olds, D.; Liu, J.; Page, K., Synthesis and structure of synthetically pure and
deuterated amorphous (basic) calcium carbonates. Chemical Communications 2017, 53 (20),
2942-2945.
67. Tomono, H.; Nada, H.; Zhu, F.; Sakamoto, T.; Nishimura, T.; Kato, T., Effects of
Magnesium Ions and Water Molecules on the Structure of Amorphous Calcium Carbonate: A
Molecular Dynamics Study. The Journal of Physical Chemistry B 2013, 117 (47), 14849-
14856.
68. Saharay, M.; James Kirkpatrick, R., Onset of Orientational Order in Amorphous
Calcium Carbonate (ACC) upon Dehydration. Chem. Phys. Lett. 2014, 591 (0), 287-291.
69. Bushuev, Y. G.; Finney, A. R.; Rodger, P. M., Stability and Structure of Hydrated
Amorphous Calcium Carbonate. Cryst. Growth & Des. 2015, 15 (11), 5269-5279.
70. Innocenti Malini, R.; Bushuev, Y. G.; Hall, S. A.; Freeman, C. L.; Rodger, P. M.;
Harding, J. H., Using simulation to understand the structure and properties of hydrated
amorphous calcium carbonate. CrystEngComm 2016, 18 (1), 92-101.

References
96 | P a g e
71. Raiteri, P.; Gale, J. D., Water Is the Key to Nonclassical Nucleation of Amorphous
Calcium Carbonate. Journal of the American Chemical Society 2010, 132 (49), 17623-17634.
72. Rodriguez-Blanco, J. D.; Shaw, S.; Benning, L. G., The kinetics and mechanisms of
amorphous calcium carbonate (ACC) crystallization to calcite, viavaterite. Nanoscale 2011, 3
(1), 265-271.
73. Bots, P.; Benning, L. G.; Rodriguez-Blanco, J.-D.; Roncal-Herrero, T.; Shaw, S.,
Mechanistic Insights into the Crystallization of Amorphous Calcium Carbonate (ACC).
Crystal Growth & Design 2012, 12 (7), 3806-3814.
74. Konrad, F.; Gallien, F.; Gerard, D. E.; Dietzel, M., Transformation of Amorphous
Calcium Carbonate in Air. Crystal Growth & Design 2016, 16 (11), 6310-6317.
75. Koga, N.; Nakagoe, Y.; Tanaka, H., Crystallization of amorphous calcium carbonate.
Thermochimica Acta 1998, 318 (1–2), 239-244.
76. Yoshino, T.; Maruyama, K.; Kagi, H.; Nara, M.; Kim, J. C., Pressure-Induced
Crystallization from Amorphous Calcium Carbonate. Crystal Growth & Design 2012, 12 (7),
3357-3361.
77. Maruyama, K.; Kagi, H.; Inoue, T.; Ohfuji, H.; Yoshino, T., In Situ Observation of
Pressure-induced Crystallization from Amorphous Calcium Carbonate by Time-resolved X-
ray Diffraction. Chemistry Letters 2015, 44 (4), 434-436.
78. Rodriguez-Blanco, J. D.; Shaw, S.; Benning, L. G., How to make ‘stable’ ACC:
protocol and preliminary structural characterization. Mineralogical Magazine 2008, 72 (1),
283-286.
79. Wolf, S. L. P.; Jahme, K.; Gebauer, D., Synergy of Mg2+ and poly(aspartic acid) in
additive-controlled calcium carbonate precipitation. CrystEngComm 2015.
80. Jensen, A. C. S.; Hinge, M.; Birkedal, H., Calcite nucleation on the surface of
PNIPAM-PAAc micelles studied by time resolved in situ PXRD. CrystEngComm 2015, 17
(36), 6940-6946.
81. Ihli, J.; Kim, Y.-Y.; Noel, E. H.; Meldrum, F. C., The Effect of Additives on
Amorphous Calcium Carbonate (ACC): Janus Behavior in Solution and the Solid State.
Advanced Functional Materials 2013, 23 (12), 1575-1585.
82. Sun, S.; Gebauer, D.; Colfen, H., A solvothermal method for synthesizing monolayer
protected amorphous calcium carbonate clusters. Chemical Communications 2016.
83. Kimura, T.; Koga, N., Monohydrocalcite in Comparison with Hydrated Amorphous
Calcium Carbonate: Precipitation Condition and Thermal Behavior. Crystal Growth & Design
2011, 11 (9), 3877-3884.
84. White, C. E.; Henson, N. J.; Daemen, L. L.; Hartl, M.; Page, K., Uncovering the True
Atomic Structure of Disordered Materials: The Structure of a Hydrated Amorphous
Magnesium Carbonate (MgCO3·3D2O). Chemistry of Materials 2014, 26 (8), 2693-2702.
85. Davis, K. J.; Dove, P. M.; De Yoreo, J. J., The role of Mg2+ as an impurity in calcite
growth. Science 2000, 290 (5494), 1134-1137.
86. Lin, C.-J.; Yang, S.-Y.; Huang, S.-J.; Chan, J. C. C., Structural Characterization of
Mg-Stabilized Amorphous Calcium Carbonate by Mg-25 Solid-State NMR Spectroscopy. The
Journal of Physical Chemistry C 2015, 119 (13), 7225-7233.
87. Xu, J.; Yan, C.; Zhang, F.; Konishi, H.; Xu, H.; Teng, H. H., Testing the cation-
hydration effect on the crystallization of Ca–Mg–CO(3) systems. Proceedings of the National
Academy of Sciences of the United States of America 2013, 110 (44), 17750-17755.
88. De Yoreo, J.; Zepeda-Ruiz, L.; Friddle, R.; Qiu, S.; Wasylenki, L.; Chernov, A.;
Gilmer, G.; Dove, P., Rethinking classical crystal growth models through molecular scale
insights: consequences of kink-limited kinetics. Crystal Growth & Design 2009, 9 (12), 5135-
5144.
89. Lippmann, F., Sedimentary carbonate minerals. Springer Science & Business Media:
2012; Vol. 6.

References
97 | P a g e
90. Munemoto, T.; Fukushi, K., Transformation kinetics of monohydrocalcite to aragonite
in aqueous solutions. Journal of Mineralogical and Petrological Sciences 2008, 103 (5), 345-
349.
91. Akao, M.; Iwai, S., The hydrogen bonding of hydromagnesite. Acta Crystallographica
Section B: Structural Crystallography and Crystal Chemistry 1977, 33 (4), 1273-1275.
92. Giester, G.; Lengauer, C.; Rieck, B., The crystal structure of nesquehonite, MgCO 3·
3H 2 O, from Lavrion, Greece. Mineralogy and Petrology 2000, 70 (3), 153-163.
93. Akao, M.; Iwai, S., The hydrogen bonding of artinite. Acta Crystallographica Section
B: Structural Crystallography and Crystal Chemistry 1977, 33 (12), 3951-3953.
94. BAI-NIAN, L.; XIANG-TING, Z.; XIU-SHAN, C.; JI-GANG, T., Synthesis of
lansfordite MgCO 3· 5H 2 O and its crystal structure investigation. Science in China Series B-
Chemistry, Life Sciences & Earth Sciences 1990, 33 (11), 1350-1356.
95. Lei, Z.; Sun, S.; Wu, P., Ultrafast, Scale-Up Synthesis of Pure and Stable Amorphous
Carbonate Mineral Nanoparticles. ACS Sustainable Chemistry & Engineering 2017, 5 (6),
4499-4504.
96. Giacovazzo, C., Fundamentals of crystallography. Oxford university press, USA:
2002; Vol. 7.
97. Bowron, D. T., Building Monte Carlo Models of Glasses Using Neutron and/or X-ray
Diffraction Data. Procedia Materials Science 2014, 7, 38-52.
98. Henderson, D.; Gutowsky, H. A nuclear magnetic resonance determination of the
hydrogen positions in Ca (OH) 2; ILLINOIS UNIV URBANA NOYES CHEMICAL LAB:
1962.
99. Barnes, A.; Lague, S.; Salmon, P.; Fischer, H., A determination of the structure of
liquid using neutron diffraction and isotopic substitution. Journal of Physics: Condensed
Matter 1997, 9 (29), 6159.
100. Mi, J.-L.; Jensen, K. M. O.; Tyrsted, C.; Bremholm, M.; Iversen, B. B., In situ total X-
ray scattering study of the formation mechanism and structural defects in anatase TiO2
nanoparticles under hydrothermal conditions. CrystEngComm 2015.
101. Farrow, C.; Juhas, P.; Liu, J.; Bryndin, D.; Božin, E.; Bloch, J.; Proffen, T.; Billinge,
S., PDFfit2 and PDFgui: computer programs for studying nanostructure in crystals. Journal of
Physics: Condensed Matter 2007, 19 (33), 335219.
102. Tyrsted, C.; Lock, N.; Jensen, K. M. O.; Christensen, M.; Bojesen, E. D.; Emerich, H.;
Vaughan, G.; Billinge, S. J. L.; Iversen, B. B., Evolution of atomic structure during
nanoparticle formation. IUCrJ 2014, 1 (3), 165-171.
103. Tyrsted, C.; Ørnsbjerg Jensen, K. M.; Bøjesen, E. D.; Lock, N.; Christensen, M.;
Billinge, S. J. L.; Brummerstedt Iversen, B., Understanding the Formation and Evolution of
Ceria Nanoparticles Under Hydrothermal Conditions. Angewandte Chemie International
Edition 2012, 51 (36), 9030-9033.
104. De Yoreo, J. J.; Gilbert, P. U. P. A.; Sommerdijk, N. A. J. M.; Penn, R. L.; Whitelam,
S.; Joester, D.; Zhang, H.; Rimer, J. D.; Navrotsky, A.; Banfield, J. F.; Wallace, A. F.;
Michel, F. M.; Meldrum, F. C.; Cölfen, H.; Dove, P. M., Crystallization by particle
attachment in synthetic, biogenic, and geologic environments. Science 2015, 349 (6247).
105. McGreevy, R.; Pusztai, L., Reverse Monte Carlo simulation: a new technique for the
determination of disordered structures. Molecular Simulation 1988, 1 (6), 359-367.
106. Mancinelli, R.; Botti, A.; Bruni, F.; Ricci, M. A.; Soper, A. K., Hydration of Sodium,
Potassium, and Chloride Ions in Solution and the Concept of Structure Maker/Breaker. The
Journal of Physical Chemistry B 2007, 111 (48), 13570-13577.
107. Imberti, S.; Botti, A.; Bruni, F.; Cappa, G.; Ricci, M. A.; Soper, A. K., Ions in water:
The microscopic structure of concentrated hydroxide solutions. The Journal of Chemical
Physics 2005, 122 (19), 194509.

References
98 | P a g e
108. Soper, A. K., The radial distribution functions of water and ice from 220 to 673 K and
at pressures up to 400 MPa. Chem. Phys. 2000, 258 (2–3), 121-137.
109. Alan, K. S., Boroxol rings from diffraction data on vitreous boron trioxide. Journal of
Physics: Condensed Matter 2011, 23 (36), 365402.
110. Soper, A. K., Network structure and concentration fluctuations in a series of
elemental, binary, and tertiary liquids and glasses. J. Phys. Condens Matter 2010, 22 (40),
404210.
111. Soper, A. K., Computer simulation as a tool for the interpretation of total scattering
data from glasses and liquids. Mol. Simul. 2012, 38 (14-15), 1171-1185.
112. Soper, A., On the uniqueness of structure extracted from diffraction experiments on
liquids and glasses. Journal of Physics: Condensed Matter 2007, 19 (41), 415108.
113. Soper, A. K., Tests of the empirical potential structure refinement method and a new
method of application to neutron diffraction data on water. Mol. Phys. 2001, 99 (17), 1503-
1516.
114. Soper, A. K., Empirical potential Monte Carlo simulation of fluid structure. Chemical
Physics 1996, 202 (2–3), 295-306.
115. Chupas, P. J.; Qiu, X.; Hanson, J. C.; Lee, P. L.; Grey, C. P.; Billinge, S. J., Rapid-
acquisition pair distribution function (RA-PDF) analysis. Journal of Applied Crystallography
2003, 36 (6), 1342-1347.
116. Keen, D. A., A comparison of various commonly used correlation functions for
describing total scattering. Journal of Applied Crystallography 2001, 34 (2), 172-177.
117. Soper, A., Rutherford Appleton Laboratory Technical Report RAL-TR-2011-013 2011.
118. Hannon, A.; Howells, W.; Soper, A. In ATLAS: A suite of programs for the analysis of
time-of-flight neutron diffraction data from liquid and amorphous samples, Inst. Phys. Conf.
Ser, 1990; pp 193-211.
119. Gabriel, J. C., Structure factor determination of amorphous materials by neutron
diffraction. Journal of Physics: Condensed Matter 2008, 20 (24), 244109.
120. Benmore, C.; Soper, A. The SANDALS manual. A guide to performing experiments on
the small angle neutron diffractometer for amorphous and liquid samples at ISIS; Council for
the Central Lab. of the Research Councils (CLRC): 1998.
121. Fischer, H.; Cuello, G.; Palleau, P.; Feltin, D.; Barnes, A.; Badyal, Y.; Simonson, J.,
D4c: A very high precision diffractometer for disordered materials. Applied Physics A:
Materials Science & Processing 2002, 74, s160-s162.
122. Jones, C. J., d-and f-Block Chemistry. 2001.
123. Hudson, B. S., Vibrational spectroscopy using inelastic neutron scattering: Overview
and outlook. Vibrational Spectroscopy 2006, 42 (1), 25-32.
124. Stewart, F. P.; Felix, F.-A.; Anibal, J. R.-C.; John, T.; Svemir, R.; Roberto, S. P.;
Giuseppe, G.; Javier Fernández, C., Recent and future developments on TOSCA at ISIS. J.
Phys. Conf. Ser. 2014, 554 (1), 012003.
125. Campbell, S. I.; Telling, M. T. F.; Carlile, C. J., The optimisation of analyser geometry
in near-backscattering spectrometers – IRIS on the ISIS-pulsed source. Physica B: Condensed
Matter 2000, 276–278, 206-207.
126. Li, J., Inelastic neutron scattering studies of hydrogen bonding in ices. J. Chem. Phys.
1996, 105 (16), 6733-6755.
127. Baddour-Hadjean, R.; Fillaux, F.; Floquet, N.; Belushkin, S.; Natkaniec, I.;
Desgranges, L.; Grebille, D., Inelastic neutron scattering study of proton dynamics in
Ca(OH)2 at 20 K. Chemical Physics 1995, 197 (1), 81-90.
128. Line, C. M. B.; Kearley, G. J., An inelastic incoherent neutron scattering study of
water in small-pored zeolites and other water-bearing minerals. J. Chem. Phys. 2000, 112
(20), 9058-9067.

References
99 | P a g e
129. Line, C. M. B.; Kearley, G. J.; Suard, E.; Fitch, A.; Swainson, I., Water in wairakite: A
water-zeolite model system. Physica B: Condensed Matter 1997, 234–236, 79-81.
130. Li, J.; Kolesnikov, A. I., Neutron spectroscopic investigation of dynamics of water ice.
Journal of Molecular Liquids 2002, 100 (1), 1-39.
131. G. Taylor, M.; Simkiss, K.; F. Parker, S.; C. H. Mitchell, P., Inelastic neutron
scattering studies of synthetic calcium phosphates. Physical Chemistry Chemical Physics
1999, 1 (13), 3141-3144.
132. Mitchell, P. C. H.; Parker, S. F.; Simkiss, J.; Simmons, J.; Taylor, M. G., Hydrated
sites in biogenic amorphous calcium phosphates: An infrared, Raman, and inelastic neutron
scattering study. J. Inorg. Biochem. 1996, 62 (3), 183-197.
133. Parker, S. F.; Refson, K.; Hannon, A. C.; Barney, E. R.; Robertson, S. J.; Albers, P.,
Characterization of Hydrous Palladium Oxide: Implications for Low-Temperature Carbon
Monoxide Oxidation. J. Phys. Chem. C 2010, 114 (33), 14164-14172.
134. Taylor, M. G.; Parker, S. F.; Simkiss, K.; Mitchell, P. C. H., Bone mineral: evidence
for hydroxy groups by inelastic neutron scattering. Physical Chemistry Chemical Physics
2001, 3 (8), 1514-1517.
135. Shepherd, P. D.; Kagunya, W. W.; Campbell, S. I.; Chapple, A. P.; Dreyer, J. W.;
Humphreys, R. J.; Kemali, M.; Mercer, M.; Ross, D. K., Water dynamics in Na zeolite P by
QENS. Physica B: Condensed Matter 1997, 234–236, 914-916.
136. Teixeira, J.; Bellissent-Funel, M. C.; Chen, S. H.; Dianoux, A. J., Experimental
determination of the nature of diffusive motions of water molecules at low temperatures.
Physical Review A 1985, 31 (3), 1913-1917.
137. Skipper, N. T.; Lock, P. A.; Titiloye, J. O.; Swenson, J.; Mirza, Z. A.; Howells, W. S.;
Fernandez-Alonso, F., The structure and dynamics of 2-dimensional fluids in swelling clays.
Chemical Geology 2006, 230 (3–4), 182-196.
138. Mamontov, E.; Cole, D. R.; Dai, S.; Pawel, M. D.; Liang, C. D.; Jenkins, T.;
Gasparovic, G.; Kintzel, E., Dynamics of water in LiCl and CaCl2 aqueous solutions confined
in silica matrices: A backscattering neutron spectroscopy study. Chemical Physics 2008, 352
(1–3), 117-124.
139. Bénézeth, P.; Saldi, G. D.; Dandurand, J.-L.; Schott, J., Experimental determination of
the solubility product of magnesite at 50 to 200 °C. Chemical Geology 2011, 286 (1–2), 21-
31.
140. De Visscher, A.; Vanderdeelen, J., Estimation of the Solubility Constant of Calcite,
Aragonite, and Vaterite at 25°C Based on Primary Data Using the Pitzer Ion Interaction
Approach. Monatshefte für Chemie / Chemical Monthly 2003, 134 (5), 769-775.
141. Pokrovsky, O. S.; Schott, J., Experimental study of brucite dissolution and
precipitation in aqueous solutions: surface speciation and chemical affinity control.
Geochimica et Cosmochimica Acta 2004, 68 (1), 31-45.
142. Lambert, I.; Clever, H. L., Alkaline earth hydroxides in water and aqueous solutions.
Elsevier: 2013; Vol. 52.
143. Sen, S.; Kaseman, D. C.; Colas, B.; Jacob, D. E.; Clark, S. M., Hydrogen bonding
induced distortion of CO3 units and kinetic stabilization of amorphous calcium carbonate:
results from 2D 13C NMR spectroscopy. Physical Chemistry Chemical Physics 2016.
144. Van Coung, P. K., Bjørn Kuznetsova, Tatiana Jensen, Bjørnar, The impact of short-
range force field parameters and temperature effect on selective adsorption of water and CO2
on calcite. wseas: 2012; Vol. 1.
145. Bruni, F.; Imberti, S.; Mancinelli, R.; Ricci, M. A., Aqueous solutions of divalent
chlorides: Ions hydration shell and water structure. J. Chem. Phys. 2012, 136 (6), 064520.
146. Hiemstra, T.; Rahnemaie, R.; van Riemsdijk, W. H., Surface complexation of
carbonate on goethite: IR spectroscopy, structure and charge distribution. J. Colloid Interface
Sci. 2004, 278 (2), 282-290.

References
100 | P a g e
147. Williams, D. F., I., Spectroscopic method in organic chemistry. 6th ed.; McGraw Hill:
2008.
148. Neumann, M.; Epple, M., Monohydrocalcite and Its Relationship to Hydrated
Amorphous Calcium Carbonate in Biominerals. Eur. J. Inorg. Chem. 2007, 2007 (14), 1953-
1957.
149. Rez, P.; Blackwell, A., Ca L23 Spectrum in Amorphous and Crystalline Phases of
Calcium Carbonate. J. Phys. Chem. B 2011, 115 (38), 11193-11198.
150. Rez, P.; Sinha, S.; Gal, A., Nanocrystallite model for amorphous calcium carbonate. J.
Appl. Cryst. 2014, 47 (5), 1651-1657.
151. Kohagen, M.; Mason, P. E.; Jungwirth, P., Accurate Description of Calcium Solvation
in Concentrated Aqueous Solutions. J. Phys. Chem. B 2014, 118 (28), 7902-7909.
152. Zou, Z.; Habraken, W. J. E. M.; Bertinetti, L.; Politi, Y.; Gal, A.; Weiner, S.; Addadi,
L.; Fratzl, P., On the Phase Diagram of Calcium Carbonate Solutions. Adv. Mater. Interfaces
2016, 4 (1), 1600076.
153. Faatz, M.; Gröhn, F.; Wegner, G., Amorphous Calcium Carbonate: Synthesis and
Potential Intermediate in Biomineralization. Adv. Mater. 2004, 16 (12), 996-1000.
154. Wallace, A. F.; Hedges, L. O.; Fernandez-Martinez, A.; Raiteri, P.; Gale, J. D.;
Waychunas, G. A.; Whitelam, S.; Banfield, J. F.; De Yoreo, J. J., Microscopic Evidence for
Liquid-Liquid Separation in Supersaturated CaCO3 Solutions. Science 2013, 341 (6148), 885-
889.
155. Poduska, K. M.; Regev, L.; Boaretto, E.; Addadi, L.; Weiner, S.; Kronik, L.;
Curtarolo, S., Decoupling Local Disorder and Optical Effects in Infrared Spectra:
Differentiating Between Calcites with Different Origins. Advanced Materials 2011, 23 (4),
550-554.
156. Zigan, F.; Rothbauer, R., Neutronenbeugungsmessungen am brucit. Neues Jahrbuch
für Mineralogie Monatshefte 1967, 1967, 137À143.
157. Hazen, R. M., Effects of temperature and pressure on the cell dimension and X-ray
temperature factors of periclase. American Mineralogist 1976, 61 (3), 266-71.
158. Wang, D.; Hamm, L. M.; Bodnar, R. J.; Dove, P. M., Raman spectroscopic
characterization of the magnesium content in amorphous calcium carbonates. Journal of
Raman Spectroscopy 2012, 43 (4), 543-548.
159. Swenson, J.; Bergman, R.; Howells, W. S., Quasielastic neutron scattering of two-
dimensional water in a vermiculite clay. The Journal of Chemical Physics 2000, 113 (7),
2873-2879.
160. Arnold, O.; Bilheux, J.-C.; Borreguero, J.; Buts, A.; Campbell, S. I.; Chapon, L.;
Doucet, M.; Draper, N.; Leal, R. F.; Gigg, M., Mantid—data analysis and visualization
package for neutron scattering and μ SR experiments. Nuclear Instruments and Methods in
Physics Research Section A: Accelerators, Spectrometers, Detectors and Associated
Equipment 2014, 764, 156-166.

Appendix
101 | P a g e
8 Appendix
The following pages contains the permissions to reprint the figures presented in chapter 1

Title: Structural Characteristics ofSynthetic Amorphous CalciumCarbonate
Author: F. Marc Michel, JasonMacDonald, Jian Feng, et al
Publication: Chemistry of MaterialsPublisher: American Chemical SocietyDate: Jul 1, 2008Copyright © 2008, American Chemical Society
If you're a copyright.comuser, you can login toRightsLink using yourcopyright.com credentials.Already a RightsLink user orwant to learn more?
PERMISSION/LICENSE IS GRANTED FOR YOUR ORDER AT NO CHARGE
This type of permission/license, instead of the standard Terms & Conditions, is sent to you because nofee is being charged for your order. Please note the following:
Permission is granted for your request in both print and electronic formats, and translations.If figures and/or tables were requested, they may be adapted or used in part.Please print this page for your records and send a copy of it to your publisher/graduateschool.Appropriate credit for the requested material should be given as follows: "Reprinted(adapted) with permission from (COMPLETE REFERENCE CITATION). Copyright(YEAR) American Chemical Society." Insert appropriate information in place of thecapitalized words.One-time permission is granted only for the use specified in your request. No additionaluses are granted (such as derivative works or other editions). For any other uses, pleasesubmit a new request.
If credit is given to another source for the material you requested, permission must be obtainedfrom that source.
Copyright © 2017 Copyright Clearance Center, Inc. All Rights Reserved. Privacy statement. Terms and Conditions.Comments? We would like to hear from you. E-mail us at [email protected]
Rightslink® by Copyright Clearance Center https://s100.copyright.com/AppDispatchServlet
1 of 1 23.10.2017 13:47

Title: Nanoporous Structure andMedium-Range Order inSynthetic Amorphous CalciumCarbonate
Author: Andrew L. Goodwin, F. MarcMichel, Brian L. Phillips, et al
Publication: Chemistry of MaterialsPublisher: American Chemical SocietyDate: May 1, 2010Copyright © 2010, American Chemical Society
If you're a copyright.comuser, you can login toRightsLink using yourcopyright.com credentials.Already a RightsLink user orwant to learn more?
PERMISSION/LICENSE IS GRANTED FOR YOUR ORDER AT NO CHARGE
This type of permission/license, instead of the standard Terms & Conditions, is sent to you because nofee is being charged for your order. Please note the following:
Permission is granted for your request in both print and electronic formats, and translations.If figures and/or tables were requested, they may be adapted or used in part.Please print this page for your records and send a copy of it to your publisher/graduateschool.Appropriate credit for the requested material should be given as follows: "Reprinted(adapted) with permission from (COMPLETE REFERENCE CITATION). Copyright(YEAR) American Chemical Society." Insert appropriate information in place of thecapitalized words.One-time permission is granted only for the use specified in your request. No additionaluses are granted (such as derivative works or other editions). For any other uses, pleasesubmit a new request.
If credit is given to another source for the material you requested, permission must be obtainedfrom that source.
Copyright © 2017 Copyright Clearance Center, Inc. All Rights Reserved. Privacy statement. Terms and Conditions.Comments? We would like to hear from you. E-mail us at [email protected]
Rightslink® by Copyright Clearance Center https://s100.copyright.com/AppDispatchServlet
1 of 1 23.10.2017 13:55

ELSEVIER LICENSETERMS AND CONDITIONS
Jan 02, 2018
This Agreement between Mr. Anders jensen ("You") and Elsevier ("Elsevier") consists ofyour license details and the terms and conditions provided by Elsevier and CopyrightClearance Center.
License Number 4260801447493
License date Jan 02, 2018
Licensed Content Publisher Elsevier
Licensed Content Publication Journal of Non-Crystalline Solids
Licensed Content Title Neutron and X-ray diffraction and empirical potential structurerefinement modelling of magnesium stabilised amorphous calciumcarbonate
Licensed Content Author G. Cobourne,G. Mountjoy,J.D. Rodriguez-Blanco,L.G. Benning,A.C.Hannon,J.R. Plaisier
Licensed Content Date Oct 1, 2014
Licensed Content Volume 401
Licensed Content Issue n/a
Licensed Content Pages 5
Start Page 154
End Page 158
Type of Use reuse in a thesis/dissertation
Portion figures/tables/illustrations
Number of figures/tables/illustrations
1
Format both print and electronic
Are you the author of thisElsevier article?
No
Will you be translating? No
Original figure numbers 1
Title of yourthesis/dissertation
Structure and dynamics of amorphous carbonates related tobiomineralization
Expected completion date Jan 2018
Estimated size (number ofpages)
100
Requestor Location Mr. Anders jensenCarl dahne str. 11 0.02
Potsdam, 14469GermanyAttn: Mr. Anders jensen
Publisher Tax ID GB 494 6272 12
Total 0.00 USD
Terms and Conditions
RightsLink Printable License https://s100.copyright.com/CustomerAdmin/PLF.jsp?ref=f2782a91-08...
1 of 6 02.01.2018 16:01

INTRODUCTION1. The publisher for this copyrighted material is Elsevier. By clicking "accept" inconnection with completing this licensing transaction, you agree that the following termsand conditions apply to this transaction (along with the Billing and Payment terms andconditions established by Copyright Clearance Center, Inc. ("CCC"), at the time that youopened your Rightslink account and that are available at any time athttp://myaccount.copyright.com).
GENERAL TERMS2. Elsevier hereby grants you permission to reproduce the aforementioned material subject tothe terms and conditions indicated.3. Acknowledgement: If any part of the material to be used (for example, figures) hasappeared in our publication with credit or acknowledgement to another source, permissionmust also be sought from that source. If such permission is not obtained then that materialmay not be included in your publication/copies. Suitable acknowledgement to the sourcemust be made, either as a footnote or in a reference list at the end of your publication, asfollows:"Reprinted from Publication title, Vol /edition number, Author(s), Title of article / title ofchapter, Pages No., Copyright (Year), with permission from Elsevier [OR APPLICABLESOCIETY COPYRIGHT OWNER]." Also Lancet special credit - "Reprinted from TheLancet, Vol. number, Author(s), Title of article, Pages No., Copyright (Year), withpermission from Elsevier."4. Reproduction of this material is confined to the purpose and/or media for whichpermission is hereby given.5. Altering/Modifying Material: Not Permitted. However figures and illustrations may bealtered/adapted minimally to serve your work. Any other abbreviations, additions, deletionsand/or any other alterations shall be made only with prior written authorization of ElsevierLtd. (Please contact Elsevier at [email protected]). No modifications can be madeto any Lancet figures/tables and they must be reproduced in full.6. If the permission fee for the requested use of our material is waived in this instance,please be advised that your future requests for Elsevier materials may attract a fee.7. Reservation of Rights: Publisher reserves all rights not specifically granted in thecombination of (i) the license details provided by you and accepted in the course of thislicensing transaction, (ii) these terms and conditions and (iii) CCC's Billing and Paymentterms and conditions.8. License Contingent Upon Payment: While you may exercise the rights licensedimmediately upon issuance of the license at the end of the licensing process for thetransaction, provided that you have disclosed complete and accurate details of your proposeduse, no license is finally effective unless and until full payment is received from you (eitherby publisher or by CCC) as provided in CCC's Billing and Payment terms and conditions. Iffull payment is not received on a timely basis, then any license preliminarily granted shall bedeemed automatically revoked and shall be void as if never granted. Further, in the eventthat you breach any of these terms and conditions or any of CCC's Billing and Paymentterms and conditions, the license is automatically revoked and shall be void as if nevergranted. Use of materials as described in a revoked license, as well as any use of thematerials beyond the scope of an unrevoked license, may constitute copyright infringementand publisher reserves the right to take any and all action to protect its copyright in thematerials.9. Warranties: Publisher makes no representations or warranties with respect to the licensedmaterial.10. Indemnity: You hereby indemnify and agree to hold harmless publisher and CCC, andtheir respective officers, directors, employees and agents, from and against any and all
RightsLink Printable License https://s100.copyright.com/CustomerAdmin/PLF.jsp?ref=f2782a91-08...
2 of 6 02.01.2018 16:01

claims arising out of your use of the licensed material other than as specifically authorizedpursuant to this license.11. No Transfer of License: This license is personal to you and may not be sublicensed,assigned, or transferred by you to any other person without publisher's written permission.12. No Amendment Except in Writing: This license may not be amended except in a writingsigned by both parties (or, in the case of publisher, by CCC on publisher's behalf).13. Objection to Contrary Terms: Publisher hereby objects to any terms contained in anypurchase order, acknowledgment, check endorsement or other writing prepared by you,which terms are inconsistent with these terms and conditions or CCC's Billing and Paymentterms and conditions. These terms and conditions, together with CCC's Billing and Paymentterms and conditions (which are incorporated herein), comprise the entire agreementbetween you and publisher (and CCC) concerning this licensing transaction. In the event ofany conflict between your obligations established by these terms and conditions and thoseestablished by CCC's Billing and Payment terms and conditions, these terms and conditionsshall control.14. Revocation: Elsevier or Copyright Clearance Center may deny the permissions describedin this License at their sole discretion, for any reason or no reason, with a full refund payableto you. Notice of such denial will be made using the contact information provided by you. Failure to receive such notice will not alter or invalidate the denial. In no event will Elsevieror Copyright Clearance Center be responsible or liable for any costs, expenses or damageincurred by you as a result of a denial of your permission request, other than a refund of theamount(s) paid by you to Elsevier and/or Copyright Clearance Center for deniedpermissions.
LIMITED LICENSEThe following terms and conditions apply only to specific license types:15. Translation: This permission is granted for non-exclusive world English rights onlyunless your license was granted for translation rights. If you licensed translation rights youmay only translate this content into the languages you requested. A professional translatormust perform all translations and reproduce the content word for word preserving theintegrity of the article.16. Posting licensed content on any Website: The following terms and conditions apply asfollows: Licensing material from an Elsevier journal: All content posted to the web site mustmaintain the copyright information line on the bottom of each image; A hyper-text must beincluded to the Homepage of the journal from which you are licensing athttp://www.sciencedirect.com/science/journal/xxxxx or the Elsevier homepage for books athttp://www.elsevier.com; Central Storage: This license does not include permission for ascanned version of the material to be stored in a central repository such as that provided byHeron/XanEdu.Licensing material from an Elsevier book: A hyper-text link must be included to the Elsevierhomepage at http://www.elsevier.com . All content posted to the web site must maintain thecopyright information line on the bottom of each image.
Posting licensed content on Electronic reserve: In addition to the above the followingclauses are applicable: The web site must be password-protected and made available only tobona fide students registered on a relevant course. This permission is granted for 1 year only.You may obtain a new license for future website posting.17. For journal authors: the following clauses are applicable in addition to the above:Preprints:A preprint is an author's own write-up of research results and analysis, it has not beenpeer-reviewed, nor has it had any other value added to it by a publisher (such as formatting,copyright, technical enhancement etc.).
RightsLink Printable License https://s100.copyright.com/CustomerAdmin/PLF.jsp?ref=f2782a91-08...
3 of 6 02.01.2018 16:01
Authors can share their preprints anywhere at any time. Preprints should not be added to orenhanced in any way in order to appear more like, or to substitute for, the final versions ofarticles however authors can update their preprints on arXiv or RePEc with their AcceptedAuthor Manuscript (see below).If accepted for publication, we encourage authors to link from the preprint to their formalpublication via its DOI. Millions of researchers have access to the formal publications onScienceDirect, and so links will help users to find, access, cite and use the best availableversion. Please note that Cell Press, The Lancet and some society-owned have differentpreprint policies. Information on these policies is available on the journal homepage.Accepted Author Manuscripts: An accepted author manuscript is the manuscript of anarticle that has been accepted for publication and which typically includes author-incorporated changes suggested during submission, peer review and editor-authorcommunications.Authors can share their accepted author manuscript:
immediatelyvia their non-commercial person homepage or blogby updating a preprint in arXiv or RePEc with the accepted manuscriptvia their research institute or institutional repository for internal institutionaluses or as part of an invitation-only research collaboration work-groupdirectly by providing copies to their students or to research collaborators fortheir personal usefor private scholarly sharing as part of an invitation-only work group oncommercial sites with which Elsevier has an agreement
After the embargo periodvia non-commercial hosting platforms such as their institutional repositoryvia commercial sites with which Elsevier has an agreement
In all cases accepted manuscripts should:
link to the formal publication via its DOIbear a CC-BY-NC-ND license - this is easy to doif aggregated with other manuscripts, for example in a repository or other site, beshared in alignment with our hosting policy not be added to or enhanced in any way toappear more like, or to substitute for, the published journal article.
Published journal article (JPA): A published journal article (PJA) is the definitive finalrecord of published research that appears or will appear in the journal and embodies allvalue-adding publishing activities including peer review co-ordination, copy-editing,formatting, (if relevant) pagination and online enrichment.Policies for sharing publishing journal articles differ for subscription and gold open accessarticles:Subscription Articles: If you are an author, please share a link to your article rather than thefull-text. Millions of researchers have access to the formal publications on ScienceDirect,and so links will help your users to find, access, cite, and use the best available version.Theses and dissertations which contain embedded PJAs as part of the formal submission canbe posted publicly by the awarding institution with DOI links back to the formalpublications on ScienceDirect.If you are affiliated with a library that subscribes to ScienceDirect you have additionalprivate sharing rights for others' research accessed under that agreement. This includes usefor classroom teaching and internal training at the institution (including use in course packs
RightsLink Printable License https://s100.copyright.com/CustomerAdmin/PLF.jsp?ref=f2782a91-08...
4 of 6 02.01.2018 16:01

and courseware programs), and inclusion of the article for grant funding purposes.Gold Open Access Articles: May be shared according to the author-selected end-userlicense and should contain a CrossMark logo, the end user license, and a DOI link to theformal publication on ScienceDirect.Please refer to Elsevier's posting policy for further information.18. For book authors the following clauses are applicable in addition to the above:Authors are permitted to place a brief summary of their work online only. You are notallowed to download and post the published electronic version of your chapter, nor may youscan the printed edition to create an electronic version. Posting to a repository: Authors arepermitted to post a summary of their chapter only in their institution's repository.19. Thesis/Dissertation: If your license is for use in a thesis/dissertation your thesis may besubmitted to your institution in either print or electronic form. Should your thesis bepublished commercially, please reapply for permission. These requirements includepermission for the Library and Archives of Canada to supply single copies, on demand, ofthe complete thesis and include permission for Proquest/UMI to supply single copies, ondemand, of the complete thesis. Should your thesis be published commercially, pleasereapply for permission. Theses and dissertations which contain embedded PJAs as part ofthe formal submission can be posted publicly by the awarding institution with DOI linksback to the formal publications on ScienceDirect.
Elsevier Open Access Terms and ConditionsYou can publish open access with Elsevier in hundreds of open access journals or in nearly2000 established subscription journals that support open access publishing. Permitted thirdparty re-use of these open access articles is defined by the author's choice of CreativeCommons user license. See our open access license policy for more information.Terms & Conditions applicable to all Open Access articles published with Elsevier:Any reuse of the article must not represent the author as endorsing the adaptation of thearticle nor should the article be modified in such a way as to damage the author's honour orreputation. If any changes have been made, such changes must be clearly indicated.The author(s) must be appropriately credited and we ask that you include the end userlicense and a DOI link to the formal publication on ScienceDirect.If any part of the material to be used (for example, figures) has appeared in our publicationwith credit or acknowledgement to another source it is the responsibility of the user toensure their reuse complies with the terms and conditions determined by the rights holder.Additional Terms & Conditions applicable to each Creative Commons user license:CC BY: The CC-BY license allows users to copy, to create extracts, abstracts and newworks from the Article, to alter and revise the Article and to make commercial use of theArticle (including reuse and/or resale of the Article by commercial entities), provided theuser gives appropriate credit (with a link to the formal publication through the relevantDOI), provides a link to the license, indicates if changes were made and the licensor is notrepresented as endorsing the use made of the work. The full details of the license areavailable at http://creativecommons.org/licenses/by/4.0.CC BY NC SA: The CC BY-NC-SA license allows users to copy, to create extracts,abstracts and new works from the Article, to alter and revise the Article, provided this is notdone for commercial purposes, and that the user gives appropriate credit (with a link to theformal publication through the relevant DOI), provides a link to the license, indicates ifchanges were made and the licensor is not represented as endorsing the use made of thework. Further, any new works must be made available on the same conditions. The fulldetails of the license are available at http://creativecommons.org/licenses/by-nc-sa/4.0.CC BY NC ND: The CC BY-NC-ND license allows users to copy and distribute the Article,provided this is not done for commercial purposes and further does not permit distribution of
RightsLink Printable License https://s100.copyright.com/CustomerAdmin/PLF.jsp?ref=f2782a91-08...
5 of 6 02.01.2018 16:01

the Article if it is changed or edited in any way, and provided the user gives appropriatecredit (with a link to the formal publication through the relevant DOI), provides a link to thelicense, and that the licensor is not represented as endorsing the use made of the work. Thefull details of the license are available at http://creativecommons.org/licenses/by-nc-nd/4.0.Any commercial reuse of Open Access articles published with a CC BY NC SA or CC BYNC ND license requires permission from Elsevier and will be subject to a fee.Commercial reuse includes:
Associating advertising with the full text of the ArticleCharging fees for document delivery or accessArticle aggregationSystematic distribution via e-mail lists or share buttons
Posting or linking by commercial companies for use by customers of those companies.
20. Other Conditions:
v1.9
Questions? [email protected] or +1-855-239-3415 (toll free in the US) or+1-978-646-2777.
RightsLink Printable License https://s100.copyright.com/CustomerAdmin/PLF.jsp?ref=f2782a91-08...
6 of 6 02.01.2018 16:01
Title: Stability and Structure ofHydrated Amorphous CalciumCarbonate
Author: Yuriy G. Bushuev, Aaron R.Finney, P. Mark Rodger
Publication: Crystal Growth and DesignPublisher: American Chemical SocietyDate: Nov 1, 2015Copyright © 2015, American Chemical Society
If you're a copyright.comuser, you can login toRightsLink using yourcopyright.com credentials.Already a RightsLink user orwant to learn more?
PERMISSION/LICENSE IS GRANTED FOR YOUR ORDER AT NO CHARGE
This type of permission/license, instead of the standard Terms & Conditions, is sent to you because nofee is being charged for your order. Please note the following:
Permission is granted for your request in both print and electronic formats, and translations.If figures and/or tables were requested, they may be adapted or used in part.Please print this page for your records and send a copy of it to your publisher/graduateschool.Appropriate credit for the requested material should be given as follows: "Reprinted(adapted) with permission from (COMPLETE REFERENCE CITATION). Copyright(YEAR) American Chemical Society." Insert appropriate information in place of thecapitalized words.One-time permission is granted only for the use specified in your request. No additionaluses are granted (such as derivative works or other editions). For any other uses, pleasesubmit a new request.
If credit is given to another source for the material you requested, permission must be obtainedfrom that source.
Copyright © 2017 Copyright Clearance Center, Inc. All Rights Reserved. Privacy statement. Terms and Conditions.Comments? We would like to hear from you. E-mail us at [email protected]
Rightslink® by Copyright Clearance Center https://s100.copyright.com/AppDispatchServlet
1 of 1 24.10.2017 13:54

Title: Effect of pH on AmorphousCalcium Carbonate Structureand Transformation
Author: Dominique J. Tobler, Juan DiegoRodriguez Blanco, Henning O.Sørensen, et al
Publication: Crystal Growth and DesignPublisher: American Chemical SocietyDate: Aug 1, 2016Copyright © 2016, American Chemical Society
Logged in as:
Anders jensen
Account #: 3001209177
PERMISSION/LICENSE IS GRANTED FOR YOUR ORDER AT NO CHARGE
This type of permission/license, instead of the standard Terms & Conditions, is sent to you because nofee is being charged for your order. Please note the following:
Permission is granted for your request in both print and electronic formats, and translations.If figures and/or tables were requested, they may be adapted or used in part.Please print this page for your records and send a copy of it to your publisher/graduateschool.Appropriate credit for the requested material should be given as follows: "Reprinted(adapted) with permission from (COMPLETE REFERENCE CITATION). Copyright(YEAR) American Chemical Society." Insert appropriate information in place of thecapitalized words.One-time permission is granted only for the use specified in your request. No additionaluses are granted (such as derivative works or other editions). For any other uses, pleasesubmit a new request.
If credit is given to another source for the material you requested, permission must be obtainedfrom that source.
Copyright © 2017 Copyright Clearance Center, Inc. All Rights Reserved. Privacy statement. Terms and Conditions.Comments? We would like to hear from you. E-mail us at [email protected]
Rightslink® by Copyright Clearance Center https://s100.copyright.com/AppDispatchServlet
1 of 1 24.10.2017 16:05

ELSEVIER LICENSETERMS AND CONDITIONS
Jan 02, 2018
This Agreement between Mr. Anders jensen ("You") and Elsevier ("Elsevier") consists ofyour license details and the terms and conditions provided by Elsevier and CopyrightClearance Center.
License Number 4260810189237
License date Jan 02, 2018
Licensed Content Publisher Elsevier
Licensed Content Publication Thermochimica Acta
Licensed Content Title Crystallization of amorphous calcium carbonate
Licensed Content Author Nobuyoshi Koga,Yuzou Nakagoe,Haruhiko Tanaka
Licensed Content Date Sep 7, 1998
Licensed Content Volume 318
Licensed Content Issue 1-2
Licensed Content Pages 6
Start Page 239
End Page 244
Type of Use reuse in a thesis/dissertation
Intended publisher of newwork
other
Portion figures/tables/illustrations
Number of figures/tables/illustrations
1
Format both print and electronic
Are you the author of thisElsevier article?
No
Will you be translating? No
Original figure numbers figure 3
Title of yourthesis/dissertation
Structure and dynamics of amorphous carbonates related tobiomineralization
Expected completion date Jan 2018
Estimated size (number ofpages)
100
Requestor Location Mr. Anders jensenCarl dahne str. 11 0.02
Potsdam, 14469GermanyAttn: Mr. Anders jensen
Publisher Tax ID GB 494 6272 12
Total 0.00 USD
Terms and Conditions
RightsLink Printable License https://s100.copyright.com/CustomerAdmin/PLF.jsp?ref=9940fb1d-21...
1 of 6 02.01.2018 16:05

INTRODUCTION1. The publisher for this copyrighted material is Elsevier. By clicking "accept" inconnection with completing this licensing transaction, you agree that the following termsand conditions apply to this transaction (along with the Billing and Payment terms andconditions established by Copyright Clearance Center, Inc. ("CCC"), at the time that youopened your Rightslink account and that are available at any time athttp://myaccount.copyright.com).
GENERAL TERMS2. Elsevier hereby grants you permission to reproduce the aforementioned material subject tothe terms and conditions indicated.3. Acknowledgement: If any part of the material to be used (for example, figures) hasappeared in our publication with credit or acknowledgement to another source, permissionmust also be sought from that source. If such permission is not obtained then that materialmay not be included in your publication/copies. Suitable acknowledgement to the sourcemust be made, either as a footnote or in a reference list at the end of your publication, asfollows:"Reprinted from Publication title, Vol /edition number, Author(s), Title of article / title ofchapter, Pages No., Copyright (Year), with permission from Elsevier [OR APPLICABLESOCIETY COPYRIGHT OWNER]." Also Lancet special credit - "Reprinted from TheLancet, Vol. number, Author(s), Title of article, Pages No., Copyright (Year), withpermission from Elsevier."4. Reproduction of this material is confined to the purpose and/or media for whichpermission is hereby given.5. Altering/Modifying Material: Not Permitted. However figures and illustrations may bealtered/adapted minimally to serve your work. Any other abbreviations, additions, deletionsand/or any other alterations shall be made only with prior written authorization of ElsevierLtd. (Please contact Elsevier at [email protected]). No modifications can be madeto any Lancet figures/tables and they must be reproduced in full.6. If the permission fee for the requested use of our material is waived in this instance,please be advised that your future requests for Elsevier materials may attract a fee.7. Reservation of Rights: Publisher reserves all rights not specifically granted in thecombination of (i) the license details provided by you and accepted in the course of thislicensing transaction, (ii) these terms and conditions and (iii) CCC's Billing and Paymentterms and conditions.8. License Contingent Upon Payment: While you may exercise the rights licensedimmediately upon issuance of the license at the end of the licensing process for thetransaction, provided that you have disclosed complete and accurate details of your proposeduse, no license is finally effective unless and until full payment is received from you (eitherby publisher or by CCC) as provided in CCC's Billing and Payment terms and conditions. Iffull payment is not received on a timely basis, then any license preliminarily granted shall bedeemed automatically revoked and shall be void as if never granted. Further, in the eventthat you breach any of these terms and conditions or any of CCC's Billing and Paymentterms and conditions, the license is automatically revoked and shall be void as if nevergranted. Use of materials as described in a revoked license, as well as any use of thematerials beyond the scope of an unrevoked license, may constitute copyright infringementand publisher reserves the right to take any and all action to protect its copyright in thematerials.9. Warranties: Publisher makes no representations or warranties with respect to the licensedmaterial.10. Indemnity: You hereby indemnify and agree to hold harmless publisher and CCC, andtheir respective officers, directors, employees and agents, from and against any and all
RightsLink Printable License https://s100.copyright.com/CustomerAdmin/PLF.jsp?ref=9940fb1d-21...
2 of 6 02.01.2018 16:05

claims arising out of your use of the licensed material other than as specifically authorizedpursuant to this license.11. No Transfer of License: This license is personal to you and may not be sublicensed,assigned, or transferred by you to any other person without publisher's written permission.12. No Amendment Except in Writing: This license may not be amended except in a writingsigned by both parties (or, in the case of publisher, by CCC on publisher's behalf).13. Objection to Contrary Terms: Publisher hereby objects to any terms contained in anypurchase order, acknowledgment, check endorsement or other writing prepared by you,which terms are inconsistent with these terms and conditions or CCC's Billing and Paymentterms and conditions. These terms and conditions, together with CCC's Billing and Paymentterms and conditions (which are incorporated herein), comprise the entire agreementbetween you and publisher (and CCC) concerning this licensing transaction. In the event ofany conflict between your obligations established by these terms and conditions and thoseestablished by CCC's Billing and Payment terms and conditions, these terms and conditionsshall control.14. Revocation: Elsevier or Copyright Clearance Center may deny the permissions describedin this License at their sole discretion, for any reason or no reason, with a full refund payableto you. Notice of such denial will be made using the contact information provided by you. Failure to receive such notice will not alter or invalidate the denial. In no event will Elsevieror Copyright Clearance Center be responsible or liable for any costs, expenses or damageincurred by you as a result of a denial of your permission request, other than a refund of theamount(s) paid by you to Elsevier and/or Copyright Clearance Center for deniedpermissions.
LIMITED LICENSEThe following terms and conditions apply only to specific license types:15. Translation: This permission is granted for non-exclusive world English rights onlyunless your license was granted for translation rights. If you licensed translation rights youmay only translate this content into the languages you requested. A professional translatormust perform all translations and reproduce the content word for word preserving theintegrity of the article.16. Posting licensed content on any Website: The following terms and conditions apply asfollows: Licensing material from an Elsevier journal: All content posted to the web site mustmaintain the copyright information line on the bottom of each image; A hyper-text must beincluded to the Homepage of the journal from which you are licensing athttp://www.sciencedirect.com/science/journal/xxxxx or the Elsevier homepage for books athttp://www.elsevier.com; Central Storage: This license does not include permission for ascanned version of the material to be stored in a central repository such as that provided byHeron/XanEdu.Licensing material from an Elsevier book: A hyper-text link must be included to the Elsevierhomepage at http://www.elsevier.com . All content posted to the web site must maintain thecopyright information line on the bottom of each image.
Posting licensed content on Electronic reserve: In addition to the above the followingclauses are applicable: The web site must be password-protected and made available only tobona fide students registered on a relevant course. This permission is granted for 1 year only.You may obtain a new license for future website posting.17. For journal authors: the following clauses are applicable in addition to the above:Preprints:A preprint is an author's own write-up of research results and analysis, it has not beenpeer-reviewed, nor has it had any other value added to it by a publisher (such as formatting,copyright, technical enhancement etc.).
RightsLink Printable License https://s100.copyright.com/CustomerAdmin/PLF.jsp?ref=9940fb1d-21...
3 of 6 02.01.2018 16:05

Authors can share their preprints anywhere at any time. Preprints should not be added to orenhanced in any way in order to appear more like, or to substitute for, the final versions ofarticles however authors can update their preprints on arXiv or RePEc with their AcceptedAuthor Manuscript (see below).If accepted for publication, we encourage authors to link from the preprint to their formalpublication via its DOI. Millions of researchers have access to the formal publications onScienceDirect, and so links will help users to find, access, cite and use the best availableversion. Please note that Cell Press, The Lancet and some society-owned have differentpreprint policies. Information on these policies is available on the journal homepage.Accepted Author Manuscripts: An accepted author manuscript is the manuscript of anarticle that has been accepted for publication and which typically includes author-incorporated changes suggested during submission, peer review and editor-authorcommunications.Authors can share their accepted author manuscript:
immediatelyvia their non-commercial person homepage or blogby updating a preprint in arXiv or RePEc with the accepted manuscriptvia their research institute or institutional repository for internal institutionaluses or as part of an invitation-only research collaboration work-groupdirectly by providing copies to their students or to research collaborators fortheir personal usefor private scholarly sharing as part of an invitation-only work group oncommercial sites with which Elsevier has an agreement
After the embargo periodvia non-commercial hosting platforms such as their institutional repositoryvia commercial sites with which Elsevier has an agreement
In all cases accepted manuscripts should:
link to the formal publication via its DOIbear a CC-BY-NC-ND license - this is easy to doif aggregated with other manuscripts, for example in a repository or other site, beshared in alignment with our hosting policy not be added to or enhanced in any way toappear more like, or to substitute for, the published journal article.
Published journal article (JPA): A published journal article (PJA) is the definitive finalrecord of published research that appears or will appear in the journal and embodies allvalue-adding publishing activities including peer review co-ordination, copy-editing,formatting, (if relevant) pagination and online enrichment.Policies for sharing publishing journal articles differ for subscription and gold open accessarticles:Subscription Articles: If you are an author, please share a link to your article rather than thefull-text. Millions of researchers have access to the formal publications on ScienceDirect,and so links will help your users to find, access, cite, and use the best available version.Theses and dissertations which contain embedded PJAs as part of the formal submission canbe posted publicly by the awarding institution with DOI links back to the formalpublications on ScienceDirect.If you are affiliated with a library that subscribes to ScienceDirect you have additionalprivate sharing rights for others' research accessed under that agreement. This includes usefor classroom teaching and internal training at the institution (including use in course packs
RightsLink Printable License https://s100.copyright.com/CustomerAdmin/PLF.jsp?ref=9940fb1d-21...
4 of 6 02.01.2018 16:05

and courseware programs), and inclusion of the article for grant funding purposes.Gold Open Access Articles: May be shared according to the author-selected end-userlicense and should contain a CrossMark logo, the end user license, and a DOI link to theformal publication on ScienceDirect.Please refer to Elsevier's posting policy for further information.18. For book authors the following clauses are applicable in addition to the above:Authors are permitted to place a brief summary of their work online only. You are notallowed to download and post the published electronic version of your chapter, nor may youscan the printed edition to create an electronic version. Posting to a repository: Authors arepermitted to post a summary of their chapter only in their institution's repository.19. Thesis/Dissertation: If your license is for use in a thesis/dissertation your thesis may besubmitted to your institution in either print or electronic form. Should your thesis bepublished commercially, please reapply for permission. These requirements includepermission for the Library and Archives of Canada to supply single copies, on demand, ofthe complete thesis and include permission for Proquest/UMI to supply single copies, ondemand, of the complete thesis. Should your thesis be published commercially, pleasereapply for permission. Theses and dissertations which contain embedded PJAs as part ofthe formal submission can be posted publicly by the awarding institution with DOI linksback to the formal publications on ScienceDirect.
Elsevier Open Access Terms and ConditionsYou can publish open access with Elsevier in hundreds of open access journals or in nearly2000 established subscription journals that support open access publishing. Permitted thirdparty re-use of these open access articles is defined by the author's choice of CreativeCommons user license. See our open access license policy for more information.Terms & Conditions applicable to all Open Access articles published with Elsevier:Any reuse of the article must not represent the author as endorsing the adaptation of thearticle nor should the article be modified in such a way as to damage the author's honour orreputation. If any changes have been made, such changes must be clearly indicated.The author(s) must be appropriately credited and we ask that you include the end userlicense and a DOI link to the formal publication on ScienceDirect.If any part of the material to be used (for example, figures) has appeared in our publicationwith credit or acknowledgement to another source it is the responsibility of the user toensure their reuse complies with the terms and conditions determined by the rights holder.Additional Terms & Conditions applicable to each Creative Commons user license:CC BY: The CC-BY license allows users to copy, to create extracts, abstracts and newworks from the Article, to alter and revise the Article and to make commercial use of theArticle (including reuse and/or resale of the Article by commercial entities), provided theuser gives appropriate credit (with a link to the formal publication through the relevantDOI), provides a link to the license, indicates if changes were made and the licensor is notrepresented as endorsing the use made of the work. The full details of the license areavailable at http://creativecommons.org/licenses/by/4.0.CC BY NC SA: The CC BY-NC-SA license allows users to copy, to create extracts,abstracts and new works from the Article, to alter and revise the Article, provided this is notdone for commercial purposes, and that the user gives appropriate credit (with a link to theformal publication through the relevant DOI), provides a link to the license, indicates ifchanges were made and the licensor is not represented as endorsing the use made of thework. Further, any new works must be made available on the same conditions. The fulldetails of the license are available at http://creativecommons.org/licenses/by-nc-sa/4.0.CC BY NC ND: The CC BY-NC-ND license allows users to copy and distribute the Article,provided this is not done for commercial purposes and further does not permit distribution of
RightsLink Printable License https://s100.copyright.com/CustomerAdmin/PLF.jsp?ref=9940fb1d-21...
5 of 6 02.01.2018 16:05

the Article if it is changed or edited in any way, and provided the user gives appropriatecredit (with a link to the formal publication through the relevant DOI), provides a link to thelicense, and that the licensor is not represented as endorsing the use made of the work. Thefull details of the license are available at http://creativecommons.org/licenses/by-nc-nd/4.0.Any commercial reuse of Open Access articles published with a CC BY NC SA or CC BYNC ND license requires permission from Elsevier and will be subject to a fee.Commercial reuse includes:
Associating advertising with the full text of the ArticleCharging fees for document delivery or accessArticle aggregationSystematic distribution via e-mail lists or share buttons
Posting or linking by commercial companies for use by customers of those companies.
20. Other Conditions:
v1.9
Questions? [email protected] or +1-855-239-3415 (toll free in the US) or+1-978-646-2777.
RightsLink Printable License https://s100.copyright.com/CustomerAdmin/PLF.jsp?ref=9940fb1d-21...
6 of 6 02.01.2018 16:05

ELSEVIER LICENSETERMS AND CONDITIONS
Jan 02, 2018
This Agreement between Mr. Anders jensen ("You") and Elsevier ("Elsevier") consists ofyour license details and the terms and conditions provided by Elsevier and CopyrightClearance Center.
License Number 4260810375312
License date Jan 02, 2018
Licensed Content Publisher Elsevier
Licensed Content Publication Geochimica et Cosmochimica Acta
Licensed Content Title Formation condition of monohydrocalcite from CaCl2–MgCl2–Na2CO3 solutions
Licensed Content Author Risa Nishiyama,Takashi Munemoto,Keisuke Fukushi
Licensed Content Date Jan 1, 2013
Licensed Content Volume 100
Licensed Content Issue n/a
Licensed Content Pages 15
Start Page 217
End Page 231
Type of Use reuse in a thesis/dissertation
Intended publisher of newwork
other
Portion figures/tables/illustrations
Number of figures/tables/illustrations
1
Format both print and electronic
Are you the author of thisElsevier article?
No
Will you be translating? No
Original figure numbers figure 8
Title of yourthesis/dissertation
Structure and dynamics of amorphous carbonates related tobiomineralization
Expected completion date Jan 2018
Estimated size (number ofpages)
100
Requestor Location Mr. Anders jensenCarl dahne str. 11 0.02
Potsdam, 14469GermanyAttn: Mr. Anders jensen
Publisher Tax ID GB 494 6272 12
Total 0.00 USD
Terms and Conditions
RightsLink Printable License https://s100.copyright.com/CustomerAdmin/PLF.jsp?ref=46bd1103-62...
1 of 6 02.01.2018 16:07
INTRODUCTION1. The publisher for this copyrighted material is Elsevier. By clicking "accept" inconnection with completing this licensing transaction, you agree that the following termsand conditions apply to this transaction (along with the Billing and Payment terms andconditions established by Copyright Clearance Center, Inc. ("CCC"), at the time that youopened your Rightslink account and that are available at any time athttp://myaccount.copyright.com).
GENERAL TERMS2. Elsevier hereby grants you permission to reproduce the aforementioned material subject tothe terms and conditions indicated.3. Acknowledgement: If any part of the material to be used (for example, figures) hasappeared in our publication with credit or acknowledgement to another source, permissionmust also be sought from that source. If such permission is not obtained then that materialmay not be included in your publication/copies. Suitable acknowledgement to the sourcemust be made, either as a footnote or in a reference list at the end of your publication, asfollows:"Reprinted from Publication title, Vol /edition number, Author(s), Title of article / title ofchapter, Pages No., Copyright (Year), with permission from Elsevier [OR APPLICABLESOCIETY COPYRIGHT OWNER]." Also Lancet special credit - "Reprinted from TheLancet, Vol. number, Author(s), Title of article, Pages No., Copyright (Year), withpermission from Elsevier."4. Reproduction of this material is confined to the purpose and/or media for whichpermission is hereby given.5. Altering/Modifying Material: Not Permitted. However figures and illustrations may bealtered/adapted minimally to serve your work. Any other abbreviations, additions, deletionsand/or any other alterations shall be made only with prior written authorization of ElsevierLtd. (Please contact Elsevier at [email protected]). No modifications can be madeto any Lancet figures/tables and they must be reproduced in full.6. If the permission fee for the requested use of our material is waived in this instance,please be advised that your future requests for Elsevier materials may attract a fee.7. Reservation of Rights: Publisher reserves all rights not specifically granted in thecombination of (i) the license details provided by you and accepted in the course of thislicensing transaction, (ii) these terms and conditions and (iii) CCC's Billing and Paymentterms and conditions.8. License Contingent Upon Payment: While you may exercise the rights licensedimmediately upon issuance of the license at the end of the licensing process for thetransaction, provided that you have disclosed complete and accurate details of your proposeduse, no license is finally effective unless and until full payment is received from you (eitherby publisher or by CCC) as provided in CCC's Billing and Payment terms and conditions. Iffull payment is not received on a timely basis, then any license preliminarily granted shall bedeemed automatically revoked and shall be void as if never granted. Further, in the eventthat you breach any of these terms and conditions or any of CCC's Billing and Paymentterms and conditions, the license is automatically revoked and shall be void as if nevergranted. Use of materials as described in a revoked license, as well as any use of thematerials beyond the scope of an unrevoked license, may constitute copyright infringementand publisher reserves the right to take any and all action to protect its copyright in thematerials.9. Warranties: Publisher makes no representations or warranties with respect to the licensedmaterial.10. Indemnity: You hereby indemnify and agree to hold harmless publisher and CCC, andtheir respective officers, directors, employees and agents, from and against any and all
RightsLink Printable License https://s100.copyright.com/CustomerAdmin/PLF.jsp?ref=46bd1103-62...
2 of 6 02.01.2018 16:07

claims arising out of your use of the licensed material other than as specifically authorizedpursuant to this license.11. No Transfer of License: This license is personal to you and may not be sublicensed,assigned, or transferred by you to any other person without publisher's written permission.12. No Amendment Except in Writing: This license may not be amended except in a writingsigned by both parties (or, in the case of publisher, by CCC on publisher's behalf).13. Objection to Contrary Terms: Publisher hereby objects to any terms contained in anypurchase order, acknowledgment, check endorsement or other writing prepared by you,which terms are inconsistent with these terms and conditions or CCC's Billing and Paymentterms and conditions. These terms and conditions, together with CCC's Billing and Paymentterms and conditions (which are incorporated herein), comprise the entire agreementbetween you and publisher (and CCC) concerning this licensing transaction. In the event ofany conflict between your obligations established by these terms and conditions and thoseestablished by CCC's Billing and Payment terms and conditions, these terms and conditionsshall control.14. Revocation: Elsevier or Copyright Clearance Center may deny the permissions describedin this License at their sole discretion, for any reason or no reason, with a full refund payableto you. Notice of such denial will be made using the contact information provided by you. Failure to receive such notice will not alter or invalidate the denial. In no event will Elsevieror Copyright Clearance Center be responsible or liable for any costs, expenses or damageincurred by you as a result of a denial of your permission request, other than a refund of theamount(s) paid by you to Elsevier and/or Copyright Clearance Center for deniedpermissions.
LIMITED LICENSEThe following terms and conditions apply only to specific license types:15. Translation: This permission is granted for non-exclusive world English rights onlyunless your license was granted for translation rights. If you licensed translation rights youmay only translate this content into the languages you requested. A professional translatormust perform all translations and reproduce the content word for word preserving theintegrity of the article.16. Posting licensed content on any Website: The following terms and conditions apply asfollows: Licensing material from an Elsevier journal: All content posted to the web site mustmaintain the copyright information line on the bottom of each image; A hyper-text must beincluded to the Homepage of the journal from which you are licensing athttp://www.sciencedirect.com/science/journal/xxxxx or the Elsevier homepage for books athttp://www.elsevier.com; Central Storage: This license does not include permission for ascanned version of the material to be stored in a central repository such as that provided byHeron/XanEdu.Licensing material from an Elsevier book: A hyper-text link must be included to the Elsevierhomepage at http://www.elsevier.com . All content posted to the web site must maintain thecopyright information line on the bottom of each image.
Posting licensed content on Electronic reserve: In addition to the above the followingclauses are applicable: The web site must be password-protected and made available only tobona fide students registered on a relevant course. This permission is granted for 1 year only.You may obtain a new license for future website posting.17. For journal authors: the following clauses are applicable in addition to the above:Preprints:A preprint is an author's own write-up of research results and analysis, it has not beenpeer-reviewed, nor has it had any other value added to it by a publisher (such as formatting,copyright, technical enhancement etc.).
RightsLink Printable License https://s100.copyright.com/CustomerAdmin/PLF.jsp?ref=46bd1103-62...
3 of 6 02.01.2018 16:07

Authors can share their preprints anywhere at any time. Preprints should not be added to orenhanced in any way in order to appear more like, or to substitute for, the final versions ofarticles however authors can update their preprints on arXiv or RePEc with their AcceptedAuthor Manuscript (see below).If accepted for publication, we encourage authors to link from the preprint to their formalpublication via its DOI. Millions of researchers have access to the formal publications onScienceDirect, and so links will help users to find, access, cite and use the best availableversion. Please note that Cell Press, The Lancet and some society-owned have differentpreprint policies. Information on these policies is available on the journal homepage.Accepted Author Manuscripts: An accepted author manuscript is the manuscript of anarticle that has been accepted for publication and which typically includes author-incorporated changes suggested during submission, peer review and editor-authorcommunications.Authors can share their accepted author manuscript:
immediatelyvia their non-commercial person homepage or blogby updating a preprint in arXiv or RePEc with the accepted manuscriptvia their research institute or institutional repository for internal institutionaluses or as part of an invitation-only research collaboration work-groupdirectly by providing copies to their students or to research collaborators fortheir personal usefor private scholarly sharing as part of an invitation-only work group oncommercial sites with which Elsevier has an agreement
After the embargo periodvia non-commercial hosting platforms such as their institutional repositoryvia commercial sites with which Elsevier has an agreement
In all cases accepted manuscripts should:
link to the formal publication via its DOIbear a CC-BY-NC-ND license - this is easy to doif aggregated with other manuscripts, for example in a repository or other site, beshared in alignment with our hosting policy not be added to or enhanced in any way toappear more like, or to substitute for, the published journal article.
Published journal article (JPA): A published journal article (PJA) is the definitive finalrecord of published research that appears or will appear in the journal and embodies allvalue-adding publishing activities including peer review co-ordination, copy-editing,formatting, (if relevant) pagination and online enrichment.Policies for sharing publishing journal articles differ for subscription and gold open accessarticles:Subscription Articles: If you are an author, please share a link to your article rather than thefull-text. Millions of researchers have access to the formal publications on ScienceDirect,and so links will help your users to find, access, cite, and use the best available version.Theses and dissertations which contain embedded PJAs as part of the formal submission canbe posted publicly by the awarding institution with DOI links back to the formalpublications on ScienceDirect.If you are affiliated with a library that subscribes to ScienceDirect you have additionalprivate sharing rights for others' research accessed under that agreement. This includes usefor classroom teaching and internal training at the institution (including use in course packs
RightsLink Printable License https://s100.copyright.com/CustomerAdmin/PLF.jsp?ref=46bd1103-62...
4 of 6 02.01.2018 16:07

and courseware programs), and inclusion of the article for grant funding purposes.Gold Open Access Articles: May be shared according to the author-selected end-userlicense and should contain a CrossMark logo, the end user license, and a DOI link to theformal publication on ScienceDirect.Please refer to Elsevier's posting policy for further information.18. For book authors the following clauses are applicable in addition to the above:Authors are permitted to place a brief summary of their work online only. You are notallowed to download and post the published electronic version of your chapter, nor may youscan the printed edition to create an electronic version. Posting to a repository: Authors arepermitted to post a summary of their chapter only in their institution's repository.19. Thesis/Dissertation: If your license is for use in a thesis/dissertation your thesis may besubmitted to your institution in either print or electronic form. Should your thesis bepublished commercially, please reapply for permission. These requirements includepermission for the Library and Archives of Canada to supply single copies, on demand, ofthe complete thesis and include permission for Proquest/UMI to supply single copies, ondemand, of the complete thesis. Should your thesis be published commercially, pleasereapply for permission. Theses and dissertations which contain embedded PJAs as part ofthe formal submission can be posted publicly by the awarding institution with DOI linksback to the formal publications on ScienceDirect.
Elsevier Open Access Terms and ConditionsYou can publish open access with Elsevier in hundreds of open access journals or in nearly2000 established subscription journals that support open access publishing. Permitted thirdparty re-use of these open access articles is defined by the author's choice of CreativeCommons user license. See our open access license policy for more information.Terms & Conditions applicable to all Open Access articles published with Elsevier:Any reuse of the article must not represent the author as endorsing the adaptation of thearticle nor should the article be modified in such a way as to damage the author's honour orreputation. If any changes have been made, such changes must be clearly indicated.The author(s) must be appropriately credited and we ask that you include the end userlicense and a DOI link to the formal publication on ScienceDirect.If any part of the material to be used (for example, figures) has appeared in our publicationwith credit or acknowledgement to another source it is the responsibility of the user toensure their reuse complies with the terms and conditions determined by the rights holder.Additional Terms & Conditions applicable to each Creative Commons user license:CC BY: The CC-BY license allows users to copy, to create extracts, abstracts and newworks from the Article, to alter and revise the Article and to make commercial use of theArticle (including reuse and/or resale of the Article by commercial entities), provided theuser gives appropriate credit (with a link to the formal publication through the relevantDOI), provides a link to the license, indicates if changes were made and the licensor is notrepresented as endorsing the use made of the work. The full details of the license areavailable at http://creativecommons.org/licenses/by/4.0.CC BY NC SA: The CC BY-NC-SA license allows users to copy, to create extracts,abstracts and new works from the Article, to alter and revise the Article, provided this is notdone for commercial purposes, and that the user gives appropriate credit (with a link to theformal publication through the relevant DOI), provides a link to the license, indicates ifchanges were made and the licensor is not represented as endorsing the use made of thework. Further, any new works must be made available on the same conditions. The fulldetails of the license are available at http://creativecommons.org/licenses/by-nc-sa/4.0.CC BY NC ND: The CC BY-NC-ND license allows users to copy and distribute the Article,provided this is not done for commercial purposes and further does not permit distribution of
RightsLink Printable License https://s100.copyright.com/CustomerAdmin/PLF.jsp?ref=46bd1103-62...
5 of 6 02.01.2018 16:07

the Article if it is changed or edited in any way, and provided the user gives appropriatecredit (with a link to the formal publication through the relevant DOI), provides a link to thelicense, and that the licensor is not represented as endorsing the use made of the work. Thefull details of the license are available at http://creativecommons.org/licenses/by-nc-nd/4.0.Any commercial reuse of Open Access articles published with a CC BY NC SA or CC BYNC ND license requires permission from Elsevier and will be subject to a fee.Commercial reuse includes:
Associating advertising with the full text of the ArticleCharging fees for document delivery or accessArticle aggregationSystematic distribution via e-mail lists or share buttons
Posting or linking by commercial companies for use by customers of those companies.
20. Other Conditions:
v1.9
Questions? [email protected] or +1-855-239-3415 (toll free in the US) or+1-978-646-2777.
RightsLink Printable License https://s100.copyright.com/CustomerAdmin/PLF.jsp?ref=46bd1103-62...
6 of 6 02.01.2018 16:07

ROYAL SOCIETY OF CHEMISTRY LICENSETERMS AND CONDITIONS
Jan 02, 2018
This Agreement between Mr. Anders jensen ("You") and Royal Society of Chemistry("Royal Society of Chemistry") consists of your license details and the terms and conditionsprovided by Royal Society of Chemistry and Copyright Clearance Center.
License Number 4260810620087
License date Jan 02, 2018
Licensed Content Publisher Royal Society of Chemistry
Licensed Content Publication CrystEngComm
Licensed Content Title In situ total X-ray scattering study of the formation mechanism andstructural defects in anatase TiO2 nanoparticles under hydrothermalconditions
Licensed Content Author Jian-Li Mi,Kirsten M. Ø. Jensen,Christoffer Tyrsted,MartinBremholm,Bo B. Iversen
Licensed Content Date Apr 20, 2015
Licensed Content Volume 17
Licensed Content Issue 36
Type of Use Thesis/Dissertation
Requestor type academic/educational
Portion figures/tables/images
Number of figures/tables/images
1
Format print and electronic
Distribution quantity 10
Will you be translating? no
Order reference number
Title of thethesis/dissertation
Structure and dynamics of amorphous carbonates related tobiomineralization
Expected completion date Jan 2018
Estimated size 100
Requestor Location Mr. Anders jensenCarl dahne str. 11 0.02
Potsdam, 14469GermanyAttn: Mr. Anders jensen
Billing Type Invoice
Billing Address Mr. Anders jensenCarl dahne str. 11 0.02
Potsdam, Germany 14469Attn: Mr. Anders jensen
Total 0.00 USD
RightsLink Printable License https://s100.copyright.com/CustomerAdmin/PLF.jsp?ref=18186736-0f...
1 of 4 02.01.2018 16:12

Terms and Conditions
This License Agreement is between {Requestor Name} (“You”) and The Royal Society ofChemistry (“RSC”) provided by the Copyright Clearance Center (“CCC”). The license consists ofyour order details, the terms and conditions provided by the Royal Society of Chemistry, and thepayment terms and conditions.RSC / TERMS AND CONDITIONSINTRODUCTIONThe publisher for this copyrighted material is The Royal Society of Chemistry. By clicking“accept” in connection with completing this licensing transaction, you agree that thefollowing terms and conditions apply to this transaction (along with the Billing and Paymentterms and conditions established by CCC, at the time that you opened your RightsLinkaccount and that are available at any time at .LICENSE GRANTEDThe RSC hereby grants you a non-exclusive license to use the aforementioned materialanywhere in the world subject to the terms and conditions indicated herein. Reproduction ofthe material is confined to the purpose and/or media for which permission is hereby given.RESERVATION OF RIGHTSThe RSC reserves all rights not specifically granted in the combination of (i) the licensedetails provided by your and accepted in the course of this licensing transaction; (ii) theseterms and conditions; and (iii) CCC’s Billing and Payment terms and conditions.REVOCATIONThe RSC reserves the right to revoke this license for any reason, including, but not limitedto, advertising and promotional uses of RSC content, third party usage, and incorrect sourcefigure attribution.THIRD-PARTY MATERIAL DISCLAIMERIf part of the material to be used (for example, a figure) has appeared in the RSC publicationwith credit to another source, permission must also be sought from that source. If the othersource is another RSC publication these details should be included in your RightsLinkrequest. If the other source is a third party, permission must be obtained from the third party.The RSC disclaims any responsibility for the reproduction you make of items owned by athird party.PAYMENT OF FEEIf the permission fee for the requested material is waived in this instance, please be advisedthat any future requests for the reproduction of RSC materials may attract a fee.ACKNOWLEDGEMENTThe reproduction of the licensed material must be accompanied by the followingacknowledgement:Reproduced (“Adapted” or “in part”) from {Reference Citation} (or Ref XX) withpermission of The Royal Society of Chemistry.If the licensed material is being reproduced from New Journal of Chemistry (NJC),Photochemical & Photobiological Sciences (PPS) or Physical Chemistry Chemical Physics(PCCP) you must include one of the following acknowledgements:For figures originally published in NJC:Reproduced (“Adapted” or “in part”) from {Reference Citation} (or Ref XX) withpermission of The Royal Society of Chemistry (RSC) on behalf of the European Society forPhotobiology, the European Photochemistry Association and the RSC.For figures originally published in PPS:Reproduced (“Adapted” or “in part”) from {Reference Citation} (or Ref XX) withpermission of The Royal Society of Chemistry (RSC) on behalf of the Centre National de laRecherche Scientifique (CNRS) and the RSC.For figures originally published in PCCP:
RightsLink Printable License https://s100.copyright.com/CustomerAdmin/PLF.jsp?ref=18186736-0f...
2 of 4 02.01.2018 16:12

Reproduced (“Adapted” or “in part”) from {Reference Citation} (or Ref XX) withpermission of the PCCP Owner Societies.HYPERTEXT LINKSWith any material which is being reproduced in electronic form, you must include ahypertext link to the original RSC article on the RSC’s website. The recommended form forthe hyperlink is http://dx.doi.org/10.1039/DOI suffix, for example in the linkhttp://dx.doi.org/10.1039/b110420a the DOI suffix is ‘b110420a’. To find the relevant DOIsuffix for the RSC article in question, go to the Journals section of the website and locate thearticle in the list of papers for the volume and issue of your specific journal. You will findthe DOI suffix quoted there.LICENSE CONTINGENT ON PAYMENTWhile you may exercise the rights licensed immediately upon issuance of the license at theend of the licensing process for the transaction, provided that you have disclosed completeand accurate details of your proposed use, no license is finally effective unless and until fullpayment is received from you (by CCC) as provided in CCC's Billing and Payment termsand conditions. If full payment is not received on a timely basis, then any licensepreliminarily granted shall be deemed automatically revoked and shall be void as if nevergranted. Further, in the event that you breach any of these terms and conditions or any ofCCC's Billing and Payment terms and conditions, the license is automatically revoked andshall be void as if never granted. Use of materials as described in a revoked license, as wellas any use of the materials beyond the scope of an unrevoked license, may constitutecopyright infringement and the RSC reserves the right to take any and all action to protect itscopyright in the materials.WARRANTIESThe RSC makes no representations or warranties with respect to the licensed material.INDEMNITYYou hereby indemnify and agree to hold harmless the RSC and the CCC, and theirrespective officers, directors, trustees, employees and agents, from and against any and allclaims arising out of your use of the licensed material other than as specifically authorizedpursuant to this licence.NO TRANSFER OF LICENSEThis license is personal to you or your publisher and may not be sublicensed, assigned, ortransferred by you to any other person without the RSC's written permission.NO AMENDMENT EXCEPT IN WRITINGThis license may not be amended except in a writing signed by both parties (or, in the caseof “Other Conditions, v1.2”, by CCC on the RSC's behalf).OBJECTION TO CONTRARY TERMSYou hereby acknowledge and agree that these terms and conditions, together with CCC'sBilling and Payment terms and conditions (which are incorporated herein), comprise theentire agreement between you and the RSC (and CCC) concerning this licensing transaction,to the exclusion of all other terms and conditions, written or verbal, express or implied(including any terms contained in any purchase order, acknowledgment, check endorsementor other writing prepared by you). In the event of any conflict between your obligationsestablished by these terms and conditions and those established by CCC's Billing andPayment terms and conditions, these terms and conditions shall control.JURISDICTIONThis license transaction shall be governed by and construed in accordance with the laws ofthe District of Columbia. You hereby agree to submit to the jurisdiction of the courts locatedin the District of Columbia for purposes of resolving any disputes that may arise inconnection with this licensing transaction.LIMITED LICENSE
RightsLink Printable License https://s100.copyright.com/CustomerAdmin/PLF.jsp?ref=18186736-0f...
3 of 4 02.01.2018 16:12

The following terms and conditions apply to specific license types:TranslationThis permission is granted for non-exclusive world English rights only unless your licensewas granted for translation rights. If you licensed translation rights you may only translatethis content into the languages you requested. A professional translator must perform alltranslations and reproduce the content word for word preserving the integrity of the article.IntranetIf the licensed material is being posted on an Intranet, the Intranet is to be password-protected and made available only to bona fide students or employees only. All contentposted to the Intranet must maintain the copyright information line on the bottom of eachimage. You must also fully reference the material and include a hypertext link as specifiedabove.Copies of Whole ArticlesAll copies of whole articles must maintain, if available, the copyright information line on thebottom of each page.Other Conditionsv1.2Gratis licenses (referencing $0 in the Total field) are free. Please retain this printable licensefor your reference. No payment is required.If you would like to pay for this license now, please remit this license along withyourpayment made payable to "COPYRIGHT CLEARANCE CENTER" otherwise you willbe invoiced within 48 hours of the license date. Payment should be in the form of a check ormoney order referencing your account number and this invoice number {Invoice Number}.Once you receive your invoice for this order, you may pay your invoice by credit card.Please follow instructions provided at that time.Make Payment To:Copyright Clearance Center29118 Network PlaceChicago, IL 60673-1291For suggestions or comments regarding this order, contact Rightslink Customer Support:[email protected] or +1-855-239-3415 (toll free in the US) or +1-978-646-2777.
Questions? [email protected] or +1-855-239-3415 (toll free in the US) or+1-978-646-2777.
RightsLink Printable License https://s100.copyright.com/CustomerAdmin/PLF.jsp?ref=18186736-0f...
4 of 4 02.01.2018 16:12


