Embed Size (px)
Citation preview
i
Studies in the Architecting of
Resilient Systems University of Southern California
Systems Architecting and Engineering
Viterbi School of Engineering
May 2009

ii
Preface
This report is a compilation of studies performed by the students in the graduate research class Architecting Resilient Systems within the Systems Architecting and Engineering program at the University of Southern California. The theses, supporting arguments and evidence, and conclu-sions are the products of the authors themselves. The papers in this report cover a broad range of topics: a wildlife management system, commercial aircraft in ditching situations, racing systems, tire pressure monitoring systems, the Exxon Valdez, the economic system, the Space Transporta-tion System, and the Katrina civil infrastructure. All of these systems had one thing in common: they were or could be subjected to a disruption, either external or internal, that could lead to a catastrophic event. These papers show the characteristics the systems either had or failed to have that would have enabled them to avoid, survive and/or recover from a disruption. These papers show how the elements of the system could be arranged, that is architected, to achieve these cha-racteristics. The achievement of these characteristics is called resilience.
Contents

iii
Article Author Page
An Analysis of a System to Manage Wildlife Populations Us-ing the Principles of Resilience
Jacob Bowden 1
A Comparison of Resilience Characteristics in Commercial Aircraft
Jennifer Maxwell 18
Analyzing the System Resilience of the Economic System
Robin Michener 43
Tire Pressure Monitoring Systems- Evaluation of Safety, Cost and System Resilience
Darin Mika 58
Exxon Valdez Disaster
Prasad Naik 79
Racing Increases Resilience
Edward Parleman 88
Political Factors in the Space Transportation System Resilience Architecting
Phan Phan 115
Katrina: Analysis of the Existence of Resilience in the City of New Orleans Disaster Support System
Anthony Williams 136

iv
1
An Analysis of a System to Manage Wildlife Populations Using the Principles of Resilience
Jacob L. Bowden, [email protected]
Abstract
Over the past 100 years there has been a shift in population numbers of wildlife in the United States. In the 1920’s, populations of some of Americas most well known wildlife species were at drastically low numbers. The Wild Turkey across the U.S. numbered only 30,000 and the Bison population was only 500 strong [14]. Wildlife populations dipped to such lows primarily due to un-regulated hunting. Since that time populations of these species and many others across Amer-ica have surged, with Wild Turkey numbers now exceeding 7 million[3], and Bison numbers greater than 350,000 [14]. The question is what enabled this rebound in wildlife populations? The answer: the establishment of a Wildlife Management System.
The Wildlife Management System in the United States did not come together all at once. Wildlife Conservation Organizations began forming in the mid to late 1800’s, followed by the establishment of State and Federal Wildlife Agencies. In the early 1900’s hunting and fishing licenses became a requirement in all states, and hunting seasons and regulations were imposed. Funding mechanisms were established for the wildlife agencies from hunting and fishing license sales as well as waterfowl, trout and migratory bird hunting stamps. This system was formed not by a single entity, but is represented by a culmination of elements with a common goal and pur-pose. The key elements of the Wildlife Management System in the United States are State and Federal Wildlife Agencies, Wildlife Conservation Organizations, and the Wildlife itself.
Considering the key elements of the system and other supporting system components, the system as a whole is a resilient system. One that has the ability to avoid, absorb, survive and re-cover from encountered disruptions. Disruptions to a Wildlife Management System are in the form of impacts to the wildlife populations. Examples of disruptions are habitat loss, habitat modification, un-regulated hunting, disease, human caused incidents, natural disasters, starva-tion, predation, old age and weather. Based on the system’s architecture, and by leveraging the natural resilience of wildlife populations, the system is able to absorb and respond to such dis-ruptions without significantly impacting overall wildlife populations.
The system exhibits key resilience attributes such as flexibility, capacity, expertise, and inter-element collaboration. These attributes prove to be invaluable in the system’s ability to manage disruptions. In addition to the resilience attributes, resilience heuristics categorized into three categories: mission and objective related, organizational, and operational heuristics were ga-thered from the system. These heuristics provide a window into what makes this system resilient, and the principles that future wildlife management systems should follow to architect a resilient system.
Introduction and History
Most species of wildlife exhibit behavioral characteristics that can be associated with resilience. Resilience can be defined as the ability to avoid, survive and recover from encountered disrup-tions. Most wildlife species have natural instincts to avoid danger, to forage for food, to find wa-ter, to secure shelter, to provide for their young, in essence, to survive. With the exception of a few species, most wildlife populations are very adaptable to situations and environments. Despite these facts, unregulated hunting in America for sustenance, sport and fur trade drastically dep-leted wildlife populations through the nineteenth century. In addition, growing human popula-

2
tions, farming, urbanization, and increasing numbers of domestic animals posed new challenges for the wildlife.
Flash forward to the twenty first century, where geese are so prevalent that they are literally colliding with aircraft, and the deer populations are so great in some areas of the nation that overpopulation is a concern. The following graph provides a view of the wildlife populations “then and now.”
Figure 1 Changes in Wildlife populations between 1920 and 2001 [14]
Figure 1 was produced in the year 2001. Population numbers for these species have continued to increase since that time. This graph indicates a surge in wildlife population over an 80 year pe-riod. The question is what enabled the populations to rebound and at such a rate? It started in the mid-nineteenth century with the help of individuals such as William T. Horna-day, Theodore Roosevelt, outdoorsmen, hunters, fishermen and others working to establish con-servation organizations and by pushing to establish hunting and fishing regulations [8]. Most of the wildlife conservation organizations and initiatives in history have been started by outdoor sportsmen, saving many species in the United States from extinction. In 1846, a seasonal regula-tion for waterfowl hunting was passed in Rhode Island [9]. In 1887, the Boone and Crocket Club was founded to conserve wildlife and their habitat. In 1903, Theodore Roosevelt established the first wildlife refuge in Florida [12]. Despite these efforts, wildlife populations continued to de-cline until their lowest point in history around the year 1920. As quoted by Burnett, “By 1928 every state had instituted a hunting license requirement, with the funds dedicated to wildlife

3
management” [9]. In 1934, the Duck Stamp Act was established requiring waterfowl hunters to purchase a stamp which revenue was directly applied to wetland projects. These efforts were put forth to save the remaining wildlife populations from extinction or further depletion, and to grow these wildlife populations back to sustainable numbers.
Since the first conservation organizations were created, hundreds more wildlife conservation organizations and state and federal wildlife agencies have been established to preserve, protect and replenish the wildlife and their habitats. Funding for these organizations and agencies comes from various sources. Funding for the state and federal wildlife agencies is received through ap-propriation from congress and from state Government channels [10] [11]. In addition, these agencies receive funding from the sales of hunting and fishing licenses, tags, permits, and stamps, as well as excise tax on firearms, ammunition, and archery equipment with the Pittman-Robertson Act of 1937 [13]. From 1923 to 2001, more than $10.2 billion has been raised through sales of licenses, and over $3.8 billion has been raised by the Pittman-Robertson Act supporting state fish and wildlife agencies [13]. These funds are directly allocated to manage wildlife at fed-eral and state levels.
The network of State and Federal Wildlife Agencies include such entities as the U.S. Fish and Wildlife Service, State Game and Fish Departments, Departments of Natural Resources, De-partment of the Interior, U.S. Forrest Service, Bureau of Land Management, to name a few. Wildlife Conservation Organizations are most commonly non-profit, funded primarily by mem-bership dues and donation. A few examples of Wildlife Conservation Organizations are: Boone and Crocket Club, Ducks Unlimited, Rocky Mountain Elk Foundation, National Wild Turkey Federation, U.S. Sportsman’s Alliance Foundation, Pheasants Forever, The Sierra Club, National Wildlife Federation, and The National Audubon Society.
Over the last hundred years, wildlife populations have made quite a comeback, but the jour-ney was not without adversity and it is not over yet. Although un-regulated hunting has been eliminated, wildlife populations are still threatened by habitat loss, habitat modification, natural disasters and weather, disease, predators, and human caused incidents. As a population, in order to absorb disruptions that are encountered, to be able to survive disruptions and eventually re-cover from the disruptions, the wildlife need the support of the Wildlife Agencies and Conserva-tion Organizations. Not only that, but given the history of where many wildlife species popula-tions have been within the last 100 years, this system must be resilient to historical disruptions and future disruptions yet to be encountered. A single wildlife organization or agency could not provide the level of resilience required by the diverse wildlife populations in America today. This paper will show that a Wildlife Management System including state and federal wildlife agencies, wildlife conservation organizations and the wildlife itself is a resilient system, one that enables wildlife populations to be resilient, significantly more so than the wildlife could achieve without external management.
System Definition
The primary components of a Wildlife Management System are the wildlife agencies, wildlife conservation organizations, and wildlife itself, but there are other elements in the system that must also be considered and understood. This includes entities such as tax-payers, hunters and fishermen, congress, volunteers, as well as sources to increase wildlife populations such as an-nual reproduction, wildlife habitat projects, and wildlife relocation projects, and sources that re-duce population numbers such as hunting and fishing, disease, predation, starvation, habitat loss,
4
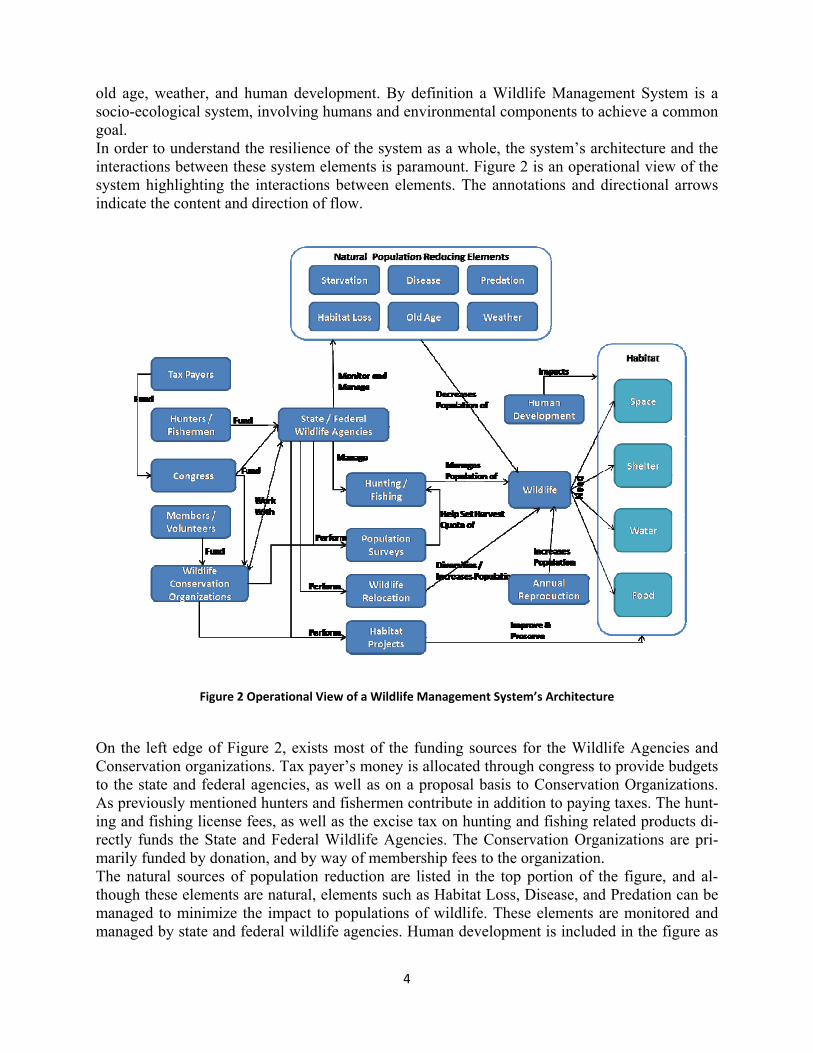
old age, weather, and human development. By definition a Wildlife Management System is a socio-ecological system, involving humans and environmental components to achieve a common goal. In order to understand the resilience of the system as a whole, the system’s architecture and the interactions between these system elements is paramount. Figure 2 is an operational view of the system highlighting the interactions between elements. The annotations and directional arrows indicate the content and direction of flow.
Figure 2 Operational View of a Wildlife Management System’s Architecture
On the left edge of Figure 2, exists most of the funding sources for the Wildlife Agencies and Conservation organizations. Tax payer’s money is allocated through congress to provide budgets to the state and federal agencies, as well as on a proposal basis to Conservation Organizations. As previously mentioned hunters and fishermen contribute in addition to paying taxes. The hunt-ing and fishing license fees, as well as the excise tax on hunting and fishing related products di-rectly funds the State and Federal Wildlife Agencies. The Conservation Organizations are pri-marily funded by donation, and by way of membership fees to the organization. The natural sources of population reduction are listed in the top portion of the figure, and al-though these elements are natural, elements such as Habitat Loss, Disease, and Predation can be managed to minimize the impact to populations of wildlife. These elements are monitored and managed by state and federal wildlife agencies. Human development is included in the figure as

5
an element that impacts habitat and in turn, is a likely source of population reduction. The com-ponents within the “Habitat” element on the right edge of the figure are the essential require-ments of any and all wildlife populations. If even one of the components of habitat are jeopar-dized, so is the wildlife population that depends on it. Hunting and Fishing are listed as elements that “Manage Populations of Wildlife” because although they reduce the population of wildlife, they are done so in a controlled manner for the overall benefit of the population. The Work of the State and Federal Wildlife Agencies is focused in the center of the figure, and includes Habitat Projects, Wildlife Relocation, Population Surveys, and Hunting and Fishing. The most important association on this diagram is the association between the Wildlife Conser-vation Organizations and the State and Federal Wildlife Organizations. The independence of these elements and their ability to collaborate is an aspect that begins to shine a light on the resi-lience of the system. Disruptions and Responses In terms of system resilience, the disruptions encountered by a Wildlife Management System are somewhat different than typical disruptions that occur in technological systems. Disruptions en-countered by a wildlife management system seem to be longer in duration, posing a long lasting effect on the wildlife populations. Many disruptions to wildlife management systems a subtle and gradually become apparent, as opposed to a single catastrophic event signaling a disruption. However, there have been and continue to be disruptions that are unexpected and their impact is immediately felt by the system. These disruptions typically have to do with natural disasters or human caused incidents. Most, if not all disruptions encountered by wildlife management system are Type A disruptions, that is, disruptions of input caused by outside intervention [1]. The fol-lowing table provides several historical (some continuing) disruptions encountered by the wild-life management system in the United States, and the response by the system to the disruption.
Disruption Name Cause Response
Habitat Loss Growing Human Population, Urbanization, Farming, Grazing, Re-Purposing Land
• Habitat Preservation, Pro-tection, and Restoration Projects
Habitat Modification Introduction of Roads, Fences, Culverts and/or Creek/Streak diversion.
• Construction of Wildlife Overpasses for Roads
• Work with Land Owners to modify fences to accom-modate wildlife traffic
• Replacement of culverts with bridges
• Remove fish passage blockages

6
Disruption Name Cause Response
Un-Regulated Hunting Meat, Fur, Sport • Establishment of State Wildlife Agencies to police un-regulated hunting
• Introduction of hunting li-cense requirement and hunting seasons.
Disease Naturally Occurring, Trans-mitted from domestic ani-mals
• Significant research, isola-tion, vaccination, and test-ing
• In some cases, termination is the response to preserve the remaining populations [15].
Human Caused Incidents Various • Immediate Action • Development of Disaster
Response Plans Natural Disasters Naturally Occurring • Post disaster habitat re-
habilitation • Wildlife re-introduction
Starvation Loss of Food sources due to overpopulation, and/or habi-tat loss or habitat modifica-tion
• Capture and Release of populations to new areas
• Increased Hunting Harvest Quota for the particular area impacted by such a disruption.
Predation Natural Food Chain, Al-though un-managed popula-tions of predators is upset-ting natural balance.
• Increased Predator Hunting and Trapping in affected areas
Old Age and Weather Naturally Occurring • Increasing populations through habitat improve-ments and restoration
• Wildlife Relocation - estab-lishing geographic diversity of populations
Table 1 - Disruptions, Causes and Historical Responses
The first disruption listed in Table 1, is the furthest reaching disruption and one that remains an issue that affects the resilience of wildlife populations. The historical response to this category of disruption comes from several sources. Wildlife Conservation Organizations such as the Rocky Mountain Elk Foundation work diligently to reduce habitat loss. The Rocky Mountain Elk Foun-dation has, in its 25 years of existence, conserved 5.7 million acres of elk habitat [17]. This land,

7
although only a small fraction of the American elk’s original range, will ensure that displaced Elk from further disruptions in habitat loss will have a place to go, and that there will always be Elk on the conserved land to be enjoyed by future generations.
Habitat Modification, the second item in Table 1, is in the same category of disruption as Habitat loss, but this disruption generally has to do with wildlife’s habitat space (one of the re-quired elements for wildlife survival) being subdivided by roads, fences, railways, culverts in rivers, etc. A natural part of wildlife survival is to be able to roam about their natural range to find food, water, and to mate or spawn. The introduction of roads that cross creeks or streams can often times disrupt the ability of fish to travel upstream to spawn or search for food. In Washington, where salmon commonly use inlet streams and creeks to spawn, the introduced roads crossing these creeks and streams has commonly disturbed the natural water flow. A road crossing McDonald Creek in Washington resulted in a culvert that was constructed six feet above the creek bottom, making it impassible by fish [18]. The response to this disruption was to con-struct a flume with a gradual gradient to the level of the culvert, which allowed fish to again tra-vel upstream [18].
Another example of Habitat Modification is fences subdividing wildlife habitat. For the North American Pronghorn Antelope, fences pose a serious barrier to migration. Pronghorns cannot jump a barbed wire fence like a deer or elk can. Pronghorn Antelope, being the second fastest land mammal in the world, are build for speed, not vertical leaping. Barbed wire fences litter the American west, subdividing grazing regions for cattle and other farm animals. Due to their verti-cally challenged status, the Antelope must find a location on a barbed wire fence to pass beneath it. Since 1974, the US Bureau of Land Management has recommended specifications for fences in Antelope regions as to not impede animal travel [6]. As reported by the University of Califor-nia, “Pronghorns sometimes migrate between their summer and winter ranges. Since they seldom jump over objects more than 3 feet (90 cm) high, most fences stop them unless they can go under or through them. The construction of many highways with parallel fencing has greatly altered the migratory patterns of pronghorns. Woven wire fences, in particular, are a barrier that impede pronghorn movements to water, wintering grounds, and essential forage” [6]. This quote truly describes the scope of the disruption caused by inadequately constructed fences in Antelope ha-bitat. In addition to the specification provided by the Bureau of Land Management dating back to 1974, frequent projects are performed by Antelope conservation organizations in conjunction with State and Federal wildlife agencies to modify existing fences to be more accommodating to Antelope movement [19].
Unregulated Hunting is a disruption that impacted wildlife populations more than any other known disruption in recent history. As was mentioned in the History section of this report, up until the late nineteenth century, hunting was not managed or regulated causing populations to decline to the levels indicated in figure 1. The primary response to this disruption was the estab-lishment of various components of the wildlife management system that are being described throughout this paper. The State and Federal Wildlife Agencies were started, which required hunting and fishing licenses, instituted hunting and fishing seasons and limitations on harvest or catch. Wildlife conservation organizations were also stood-up and continue to perform habitat projects to provide the wildlife a place to live and roam as the populations continue to grow and flourish.
Disease is a critical disruption. In some cases disease is a natural occurrence within a wildlife population, and in other cases disease has been transferred from captive populations of animals into wild populations. Chronic Wasting Disease (CWD) is a disease that infects cervids (e.g. deer and elk) and was originally identified in the 1967 in captive Mule Deer populations [20]. In re-

8
cent years CWD has begun to expand to wild populations. CWD is a disease that is fatal in all cases, and no cure has been identified. According to the Sustainable Resource Department of Al-berta: “Mortality does not seem to affect overall productivity in infected populations in the short term, although models applied to data collected in Colorado, and more recently in Wisconsin, suggest that deer populations at the heart of an affected area decline and disappear over the long term” [21]. Based on the results from the model mentioned in the previous statement, the cervid populations will continue to become infected eventually to the point of extinction if left unat-tended. Although no cures have been identified for CWD, the disease has received copious atten-tion from wildlife agencies and the US Congress. In 2003 congress passed a 4.2 million dollar bill for CWD research [20]. Methods have been established to test populations for CWD in post mortem and pre-mortem conditions to identify infected populations to study, isolate, and irra-diate if necessary.
Other diseases impacting the resilience of wildlife populations are Avian Cholera and Rabies. Avian Cholera may not so well-known but it is one of the most deadly. Mostly occurring in wa-terfowl populations (e.g. ducks and geese), where death can occur as early as 6 hours after expo-sure occurs [22]. Due to the severity of the disease, the typical response by wildlife management officials is to gather and burn carcasses daily to prevent further exposure and proliferation of the disease [16]. Rabies on the other hand is a very well known disease, dating back in natural popu-lations as far as 3000 BBC [15]. The transmission of the disease is typically by way of infected saliva through biting during the seven days that the infected animal is showing symptoms. Al-though there is a small transmission window which reduces the overall impact of the disease, prevention is not without cost. As reported in a Federation of American Scientists article, the an-nual cost of prevention through vaccinations of humans and pets in the United States is between $230Million and $1Billion [15]. This response through pet and human vaccinations has reduced the effect of the disease in domestic populations. In response to the disease in wild populations, wildlife managers in the United States have been providing oral rabies vaccinations to wild populations of raccoons, gray fox, and coyote through bait packets dropped by air and distributed by ground [24].
Human caused incidents such as the Exxon Valdez oil spill incident are catastrophic disrup-tions to wildlife populations and their habitat. The U.S. Fish and Wildlife Service and other agencies were on scene at the incident, and have since developed a disaster response plans for such incidents. The Fish and Wildlife Service reports, “The Departments of the Interior, Com-merce and Agriculture, together with Tribal governments, States, and other jurisdictions, are re-sponsible for protecting these natural resources. Because oil spills respect no boundaries, uni-form Federal policies and programs are essential” [23]. This quote shows the collaboration re-quired to handle such a dynamic and impactful disruption. Using the Exxon Valdez incident as an example, within a week of the incident, Dan Timm of the Alaska Department of Fish and Game reported the fatality count of “birds in the thousands, otters in the hundreds” [27]. Human caused incidents are some of the most catastrophic and quickly felt disruptions.
Other Naturally occurring disruptions such as natural disasters, predation, old age and starva-tion are disruptions that impact a wildlife population. Some elements of the natural ecosystem have been altered however, causing natural disruptions to be more impactful. As an example, wild fire management techniques over the last century (i.e. extinguishing fires) have allowed fo-rests to become denser and when that cannot be easily extinguished, cause blazes to be greater in magnitude. Controlled burns are a technique to reduce fuel for fires when they do occur. Howev-er, extinguishing fires doesn’t allow post-fire vegetation to grow, which provides excellent habi-tat and food for wildlife.

9
Predators are another source of population disruption. In some instances, predator numbers have grown to a level where they will not allow other populations of wildlife to grow, and in some cases populations of prey wildlife have declined significantly [16]. As a response, predator numbers can be reduced through hunting or relocation.
The above mentioned disruptions and responses indicate that a wildlife management system is needed to supplement the natural resilience of wildlife populations, given the changing envi-ronment that a growing human population is shaping. The fact of the matter is that a wildlife population’s essential habitat needs (food, water, shelter, and space) are continually jeopardized by increasing urbanization, development, pollution, and by the extraction of natural resources (mining, logging, etc). Wildlife have less space to roam, and in most cases, their habitat is parti-tioned by roads and fences in many cases inhibiting their access to food, water, and altering mi-gration patterns. Diseases have been translated from captive populations of cervids and birds into the wild populations, introducing a new set of disruptions and challenges. The disruptions and historical responses have provided insight into some challenges to a wildlife population’s resi-lience, but what makes the wildlife management system resilient has to do with the overall archi-tecture of the system and how it is able to operate and respond to encountered disruptions. Resilience Attributes and Capabilities There are many attributes and associated capabilities exhibited by a Wildlife Management Sys-tem that enable the system to be resilient. The resilience attributes and capabilities of Wildlife Management System will be presented in the following sections. Capacity One of the capabilities of Wildlife Management Systems that enables the system to be resilient is capacity. The resilience of endangered species populations is not nearly that of a species with a very large population; however, with the efforts of wildlife management, the populations of many endangered species have been stabilized and improved. With that said, efforts by wildlife agencies and organizations can help a population rebound and increase its resilience by way of capacity. The National Wild Turkey Federation (NWTF) reports, “During the early 1900s, the wild turkey had nearly disappeared due to the ax, the plow and subsistence hunting. However, because of the work of federal, state and provincial wildlife agencies and the NWTF's many vo-lunteers and partners, today there are nearly 7 million wild turkeys throughout North America” [3]. This is no doubt a great success story of the collaboration between system elements, but the result increases the resilience of the system with the capacity of the system to absorb disruptions. The wild Turkey can be found from Mexico to Canada and from California to Florida. They are so geographically distributed, that the system is able to absorb geographically specific disrup-tions with little impact the overall resilience of the system. In Technological systems (mechanical, electrical, software, etc) the concept of margin or redun-dancy is used to measure a system’s resilience. When considering wildlife populations as an ag-gregate, increased population numbers provides the margin necessary to absorb disruptions, whether previously encountered or not. The resilience due to capacity of the wildlife populations as an element of the Wildlife Management System enables the system as a whole to be able to absorb, survive and recover from disruptions.

10
Leveraging Feedback / Taking Corrective Action
A Wildlife Management System is something that is continuously operating, and therefore needs to leverage feedback obtained during operations to make future decisions. The State and Federal Wildlife Agencies perform a variety of population, and environmental surveys to understand wildlife distribution, population numbers, possible environmental challenges, as well as birth and death rate (naturally and from hunting). The sources of this feedback are from wildlife managers performing ground surveys, aerial surveys, tracking devices such as GPS and VHF collars, hunt-er harvest surveys, as well as analysis of wildlife damage and nuisance complaints [25]. Informa-tion from the above surveys and data collection methods will provide the wildlife agencies with data that can be used to make wildlife management decisions. One corrective action decision that can be made is the increase or decrease in hunting pressure of a particular area.
Hunting is a required part of Wildlife Management. Hunting helps maintain wildlife popula-tions at levels that are sustainable by the land on which they live. Each year hunting quotas are adjusted based on harvest information and population survey feedback. Each state is divided into a series of game management units that can be adjusted according to the population levels for that unit. As populations rise beyond the threshold established for a given area, increased hunting or transplant projects would be the corrective action. On the flip side, if populations decline, hunting will be reduced or eliminated for that particular area and the root cause of the decline will be researched and identified. The feedback loop provided by harvest information as well as population surveys allows for appropriate corrective action to manage wildlife populations. The ability for wildlife management systems to be able to collect and effectively use data collected enables the system to survive and recover from disruptions that may have cause wildlife popula-tions to increase or decline over a period of time. Flexibility Another key element of a system’s resilience is its ability to be flexible to changes in the envi-ronment and adapt quickly. A Wildlife Management System exhibits flexibility characteristics though organizational diversity and by leveraging the natural flexibility of wildlife itself. On the organization side, given the hundreds of conservation organizations and state and federal wildlife agencies, as well as their distributed funding sources, there is always an agency, organization, or partnerships of them available to address and minimize the effects of disruptions as they are en-countered. From the wildlife perspective, most wildlife species are flexible and adaptable to changes in their environments. Many species of wildlife are cohabitating with humans in rural areas within our cities. Many species have be relocated into areas that were within their natural range, such as elk being re-introduced into North Carolina [17], as well as areas that were histor-ically not within their range. 234 wild Turkeys were introduced into three locations in San Diego County in 1993 [26]. San Diego County was not part of wild turkey’s natural range, but due to the climate and habitat, San Diego was selected as an introduction site. With a partnership be-tween the National Wild Turkey Federation and the California Department of Fish and Game, the turkey’s were successfully introduced, and buy 2004 their population was estimated at over 30,000 birds in the county. This is an excellent example of the flexibility of wildlife to adapt to a new habitat and flourish. Managed hunting of these birds has been taking place since 1994, and while hunting has taken place, the populations have done very well.
11
Expertise Expertise is another capability that a Wildlife Management System exhibits which adds to its re-silience. Many of the Conservation organizations were started 50, 75, or 100 years ago. Many disruptions have been encountered and managed. Based on historical disruptions, mechanisms have been put in place to avoid many future disruptions all together. Some examples are the building of wildlife overpasses so that wildlife can safely cross roads due to an increasing num-ber of automobile collisions with deer and elk [5]. Projects like these are in direct response to the disruptions and serve a dual purpose, one, to benefit wildlife and their natural habits, and two, to reduce automobile accidents that have numbered as many as 200 human fatal collisions and thousands of more injured in a single year [5]. The history of encountered disruptions and res-ponses provides a virtual play-book for the wildlife agencies and conservation organizations. That knowledge and expertise allows for the agencies and organizations to respond decisively and smartly to previously encountered disruptions and newly encountered disruptions. The ex-pertise and longevity of these organizations enhances the resilience of the system. Inter-element Collaboration As defined by Jackson, “Inter Component Collaboration is more than communications. It is the ability of two components of a system, human or technological, to share information and re-sources, if possible, to solve a common problem, that is resilience to a disruption” (Jackson, 6-3). The human components within a Wildlife Management system work together to solve problems. In figure 2, the “work with” arrow connects the State and Federal Wildlife Agencies with the Wildlife Conservation Organizations. This arrow highlights possibly the most important interac-tion in a wildlife management system. The primary focus of both system components is to stabil-ize wildlife populations by habitat improvement, restoration, and preservation projects as well as wildlife relocation or introduction into new areas. The Arizona Game and Fish Department (i.e. a state wildlife agency) make it clear that much of the work that they do to help wildlife could not be accomplished without the help of federal partners and other non-governmental organizations (i.e. Wildlife conservation organizations), [4]. This aspect of resilience is easily obtainable be-cause all of the human components in the system have a common purpose, that common purpose enables the system as a whole to be responsive to disruptions. Most wildlife conservation projects involve more than a single organization or agency. For example, an Arizona Game and Fish Department publication describes the partnering for an Antelope habitat restoration and transplant project, “These improvements came through countless hours in the field and partner-ships with the Arizona Antelope Foundation, the U.S. Forest Service and others” [19]. The colla-boration between elements described for this particular project are the norm and with the help of volunteers, enable the system to be more resilient due to the partnerships and collaboration that takes place. Resilience Oriented Heuristics As described in the previous section, there are many attributes of a Wildlife Management System that make it resilient. Many resilience architecting heuristics can be drawn from such a system, be it that these resilience oriented heuristics were used to architect the system or that these heu-

12
ristics are lessons learned work already accomplished. The following sections will analyze some resilience heuristics that were used, or could be used in the future in a wildlife management sys-tem. Mission Oriented Heuristics In the 19th century when the first conservation organizations were established, the founders had a purpose, and that purpose remains the same today. The current mission statement of the U.S. Fish and Wildlife Service is as follows: “Our mission is working with others to conserve, protect, and enhance fish, wildlife, and plants and their habitats for the continuing benefit of the Ameri-can people” [7]. A mission like that of the Fish and Wildlife Service could not be achieved with unregulated hunting, logging, land development, etc. The following heuristics could be used to ensure that appropriate decisions would be made to enable the wildlife populations to be resi-lient. If we use it up today, it will not be here tomorrow The first phase of system resilience is disruption avoidance. In this context, a disruption can be defined as an event that would negatively impact wildlife populations, either directly or indirect-ly. The above heuristic will ensure that wildlife will be present in the system, and to achieve that, mechanisms must be put in place to ensure that disruptions are avoided. To avoid disruptions to wildlife populations, projects such as habitat preservation, restoration and even improvements (e.g. water tank construction for dry areas) are completed. Hunting is limited and managed such that populations are not negatively impacted. In addition, wildlife can be captured and relocated to areas that are either within their native range, or provide suitable habitat for their introduction. Predicting the future is impossible but ignoring it is irresponsible (Rechtin, 318). This heuristic emphasizes the importance of being prepared for what may occur in the future, whether it is a known disruption, or an unknown disruption. Understanding that we can’t fully prepare for what will come in the future, the system should be flexible enough to absorb a dis-ruption when encountered. A Wildlife Management System has the ability to absorb disruptions through population distributions (many species exist in various geographical locations), as well as substantial population numbers to accommodate a loss in population in any given location. Wildlife surveys are performed to understand the current population climate and can respond to overpopulation through hunting, and under population by restricting hunting, and identifying the cause of the population challenge. As mentioned previously, water tanks could be constructed if drought conditions are causing the population challenges, or if natural predators (coyotes, etc) are the problem, increased predator hunting can be utilized. State and Federal Wildlife Agencies such as the US Fish and Wildlife Service are continually looking towards the future, developing capabilities to be able to responsive to disruptions if and when they occur. Organizational Heuristics The way in which the Wildlife Management System is architected can aid to the resilience of wildlife populations. Most wildlife conservation organizations are independent of one another and were started to supplement the effort of state and federal wildlife agencies. These organiza-
13
tions work together in a loosely coupled way with significant inter-element collaboration. Inde-pendently funded and run, yet they collaborate on projects to enhance the resilience of wildlife populations. The following heuristics are more organizational in nature, and lead the systems’ architecture down a more resilient path. Many problems cannot be solved alone A population of wild animals exhibits some resilience attributes on its own, but most species have not evolved to be able to handle the environmental and ecological changes that humans have imposed upon them over the last several centuries. Many disruptions encountered in wild-life management are very large in scope, and state and federal budgets may not be able to fund the state and federal wildlife agencies projects. Dave Weedman from the Arizona Game and Fish Department states: “partnerships in wildlife conservation are the only way that the Arizona Game and Fish Department can accomplish some of our objectives. The fossil creek restoration project involved numerous federal partners, Arizona Public Service as a private entity, non-governmental organizations, environmental groups, all of these people have an interest and a stake in what happens to wild places and wild animals in Arizona. The only way we can manage them (wildlife) is working with them (partners) to help us formulate and make decisions on the future of wildlife in Arizona”[4]. Dave shows that without the collaboration of multiple entities in certain projects, they may never be able to be accomplished. The commonality between all of the entities of the system is the common mission and purpose that is the desire to preserve wild-life and wild places for generations to come. The organizational system shall allow for flexibility in organizational processes and decisions (Jackson, 8-10) This heuristic plays a role in how Wildlife Management Systems are structured and how they operate. Due to the fact that the organizations are mostly independent of one another, and each have their own organizational structure and management processes, it is not difficult to be res-ponsive and flexible to changes in the environment. Currently, state game and fish departments perform field surveys and hunter surveys to estimate wildlife populations in given areas. With data collected, adjustments can be made in the succeeding year’s harvest goals. In addition, Con-servation Organizations can be quite flexible because they typically are non-profit, and do not have the same decision making overhead that state and federal agencies do. In partitioning choose the elements so that they are as independent as possible, that is, elements with low external complexity and high internal complexity (Rechtin, 312). This heuristic is closely related to the previous heuristic. The independence of the organizations enables the system to be adaptable, flexible and responsive to disruptions. Some organizations have targeted a particular species (i.e. elk, turkey, quail, pheasant, waterfowl, etc.) which work with other groups and agencies in a loosely coupled manner. The fact that these organizations always have the ability to be responsive to disruptions regardless of what state and federal gov-ernment can afford, adds to the resilience of the system.

14
Operational Heuristics The way in which a Wildlife Management System operates can affect the resilience of the sys-tem. System operation is when the resilience principles that were architected into the system are actually used. The following heuristics would be helpful to guide the architecture to accommo-date operational behavior. Incorporate feedback mechanisms where possible. Base future decisions on analysis of the feed-back received. This heuristic shows the importance of information in decision making. Without knowledge of animal populations, how does a Wildlife Management System make good decisions? Mechan-isms should be put in place to collect and analyze the data. Currently, most state game and fish departments institute a drawing system for game animals. Issuing a certain number of permits to take a specific species in a specific area of the state based on information collected from field surveys and hunter surveys from the previous year. Field surveys can, for example, determine if a year is a double clutch year for turkeys (i.e. had two broods), thus drastically changing the population estimates for given areas. The information collected and analyzed is critical to the decision making of the organization. If field studies and hunter surveys were not conducted, it is possible that population numbers could surge or decline to a point where they could not recover. This feedback is an essential element of the system’s resilience. The system shall be capable of absorbing a disruption (Jackson, 8-4) This is a core heuristic of system resilience. Wildlife Management Systems must be able to ab-sorb disruptions. Disruptions could take the form of natural disasters, weather related impacts, introduction of roads, fences or edifices, habitat depletion, disease, and other unknown disrup-tions. Currently, Wildlife Management Systems are able to absorb such disruptions by popula-tion characteristics (size, distribution), by wildlife organization diversity (state, federal, non-profit), and by volunteers who care about preserving wildlife. In addition, the wildlife itself is resilient to a certain degree. Where possible, animals evacuate areas where wildfires are occur-ring, and many species will migrate great distances to locate more suitable habitat. The humans in this socio-ecological system are supplementing the wildlife’s natural ability to absorb disrup-tions.
The provided heuristics were gathered from the work that has been done over the last 2 cen-turies of wildlife conservation and management. These heuristics directly apply to a wildlife management system, but are absolutely applicable to other systems. Conclusions Given the current environmental climate in the United States, with our growing human popula-tions and development, wildlife species simply cannot flourish without the Wildlife Management System defined in this paper. All aspects of the system are critical to the success of these animals in the limited and ever constricting habitat. It has been shown that certain disruptions like disease can be catastrophic. Chronic Wasting Disease for instance, has the potential to be transferred to deer and elk populations across North America and eventually could lead to extinction if the dis-

15
ease is not researched and managed in the near term. In addition, wildlife populations in specific areas are already reaching or exceeding the carrying capacity of the available land. If portions of these populations were not removed by seasonal hunting or relocation, food source depletion causing starvation and inbreeding would be the likely results. The Wildlife Management System defined in this paper is itself a resilient system which en-hances the resilience of wildlife itself. The capacity of the system to absorb disruptions, the flex-ibility of the system to adapt to new environments and conditions and quickly respond to disrup-tions, the leveraging of feedback to make informed decisions with respect to management initia-tives, the expertise and knowledge that is leveraged from more than a century of wildlife man-agement trials and tribulations, and the inter-element collaboration between system components partnering on initiatives to reach common goals are all resilience characteristics of the system. Although this socio-ecological system that began forming over 150 years ago may be an unas-suming “resilient system” in the 21st century, it is indeed resilient, and much can be learned from how the system is architected and how it operates.
Resilience related heuristics have been gathered from the system, and may provide future guidance for architects looking at socio-ecological systems. Heuristics with respect to the sys-tem’s mission or objectives are critical to ensure that a common purpose and vision are estab-lished amongst the system elements. Heuristics regarding organizational aspects of the system highlight the importance of inter-element collaboration and loose coupling. Operational Heuris-tics press the importance of leveraging feedback mechanisms, as well as being able to absorb, survive and recover from disruptions. All of the heuristics extracted from the system’s architec-ture are resilience oriented, and prove further that the Wildlife Management System in the Unit-ed States is a Resilient System.
Above all, the common thread through all of the components within a Wildlife Management System is a common goal to conserve wildlife today, for wildlife tomorrow. Because each ele-ment of the system has the same mission, it makes partnering to benefit the wildlife a very natu-ral and easy thing to do. Enhancing the resilience of wildlife populations goes way beyond grow-ing a large population, but managing it so that the wildlife populations are in harmony with the land that is left for wildlife to exist on. This common goal and purpose is absolutely another attribute of resilience, one that enables this system to manage one of our greatest natural re-sources. Works Cited [1] Jackson, Scott. “Architecting Resilient Systems: Accident Avoidance and Survival and
Recovery from Disruptions. John Wiley & Sons, inc: N/A, 2008. [2] Rechtin, Eberhardt. “Systems Architecting – Creating & Building Complex Systems”
Prentice Hall PTR: 1991. [3] National Wild Turkey Federation. “Symposium Brings Wild Turkey Professionals To-
gether” < http://www.nwtf.org/nwtf_newsroom/press_releases.php?id=11700> [4] Weedman, Dave. “Arizona Wildlife Views.” Arizona Game and Fish Department. March
21, 2009. <http://www.youtube.com/watch?v=ebGpRgUaJXs&eurl=http%3A%2F%2Fwww.azgfd.gov%2Fvideo%2FArizonaWildlifeViews2008-5.shtml&feature=player_embedded>
[5] Wildlife and Highways: An Overview. March, 2009. <http://www.fhwa.dot.gov/environment/wildlifecrossings/overview.htm>

16
[6] University of California. “Pronghorn Antelope.” March, 2009. <http://www.extension.org/pages/Pronghorn_Antelope>
[7] United States Department of the Interior. “National Policy Issuance #99-01.” http://www.fws.gov/policy/npi99_01.html
[8] American Museum of Natural History. “permanent Exhibitions” <http://www.amnh.org/exhibitions/virtual/bison/history.php>
[9] Burnett, H. Sterling. “Hunters: Founders and Leaders of Wildlife Conservation.” National Center for Policy Analysis. March, 2009. < http://www.ncpa.org/pub/ba377>
[10] U.S. Fish and Wildlife Service – Division of Budget. “Budget, Planning, and Human Re-sources.” April, 2009. <http://www.fws.gov/budget/>
[11] California Department of Finance. “Governor’s Budget 2009-10 – Proposed Budget De-tail.” April 2009. <http://www.ebudget.ca.gov/StateAgencyBudgets/3000/3600/department.html>
[12] U.S. Department of the Interior. “DOI History.” April, 2009. <http://www.doi.gov/history.html>
[13] Washington Department of Fish and Wildlife. “Funding for Wildlife Management”. April, 2009. <http://www.hunter-ed.com/wa/course/11-10_funding.htm>
[14] National Center for Policy Analysis. “Changes in Wildlife Populations Since 1920’s.” March, 2009. <http://www.ncpa.org/images/1666.gif>
[15] Rupprecht, Charles E; Smith, Jean S; Fedkdu, Makonnen; Childs, James E. “The Ascen-sion of Wildlife Rabies: A Cause for Public Health Concern or Intervention?” 1995. Ac-cessed in April, 2009. <http://www.fas.org/ahead/docs/rabies.htm
[16] Montana Fish, Wildlife, and Parks. “Wildlife Management Practices.” April, 2009. <http://www.hunter-ed.com/mt/course/ch10_wildlife_management_practices.htm>
[17] Crockett, Dan. “Silver and Gold” Bugle Magazine, May/June 2009. Pg. 64-77. [18] Hall, Cliff. U.S. Department of Transportation – Federal Highway Administration, “Pro-
grams to Remove Fish Passage Barriers.” February, 2009. <http://www.fhwa.dot.gov/environment/wildlifecrossings/fish.htm>
[19] Christensen, Troy. “Volunteer Corner – Upcoming Activities.” Arizona Wildlife Views (Sept – Oct 2008). Pg 7.
[20] Chronic Wasting Disease Alliance. “Learn About CWD.” March, 2009. <http://www.cwd-info.org/index.php/fuseaction/about.timeline>
[21] Government of Alberta – Sustainable Resource Development. “Chronic Wasting Dis-ease.” April, 2009. <http://www.srd.alberta.ca/fishwildlife/livingwith/diseases/chronicwastingdisease.aspx>
[22] National Biological Information Infrastructure – Wildlife Disease Information Node. “Avian Cholera: Overview.” April, 2009. http://wildlifedisease.nbii.gov/diseasehome.jsp?disease=Avian%20Cholera&pagemode=submit/
[23] U.S. Fish and Wildlife Service – Environmental Contaminants Program. “Oil Spill Prepa-ration and Response.” April, 2009. < http://www.fws.gov/contaminants/Issues/OilSpill.cfm>
[24] United States Department of Agriculture – Animal and Plant Health Inspection Service. “Wildlife Damage Management.” April, 2009. <http://www.aphis.usda.gov/wildlife_damage/oral_rabies/rabies_vaccine_info.shtml>
[25] Wisconsin Department of Natural Resources. “Wildlife Research: Wildlife Surveys.” April, 2009. <http://www.dnr.state.wi.us/org/es/science/wildlife/survey.htm>

17
[26] Zieralski, Ed. “Call of the Wild Turkeys.” The San Diego Union-Tribune. April 1, 2006. <http://www.signonsandiego.com/uniontrib/20060401/news_lz1s1turkeys.html>
[27] Wohlforth, Charles. “State Biologists Say Death Toll Extensive.” Anchorage Daily News. 4/02/1989. Page A1. Accessed April, 2009. http://www.adn.com/evos/stories/EV246.html

18
A Comparison of Resilience Characteristics in Commercial Aircraft
by Jennifer Maxwell, [email protected] Systems Resilience is defined as the ability of a system to avoid, survive, and/or recover from a disruption in normal activities12. A resilient system is one that can ultimately return to its nomin-al or to a just slightly degraded functionality after a disruption. However, a brittle system is one in which disruption results in catastrophe. In his book Architecting Resilient Systems: Accident Avoidance and Survival and Recovery from Disruptions (draft) 12, Scott Jackson had identified a list of heuristics that may apply when architecting a system for resilience. Further work to be done in the field of resilience research is to characterize these heuristics as they apply to certain types of systems. This essay will classify the resilience characteristics that apply to a commercial airline system, first by comparing both resilient and brittle examples of the system in the face of the same type of disruption and then by extending the analysis to include a case that experienced a different disruption.
The analysis methods utilized in this paper are similar to those used by doctoral candidate Matt Richards of MIT in his empirical test of the design principles for survivability19. These me-thods are based on empiricism, the “theory that all knowledge originates in experience4.” Empi-ricism is an established doctrine in academic systems engineering research24. Each case dis-cussed in this paper will be empirically analyzed by mapping system features to a set of resi-lience heuristics.
The cases being analyzed will focus on commercial airliner ditch landing scenarios. In com-mercial aviation, water landings are a rare occurrence. Even less common and less understood are ”successful” water landing (i.e. ones in which all passengers and crew members survive). As an article in The Economist stated
“In the event of a landing on water, an unprecedented miracle will have occurred, be-cause in the history of aviation the number of wide-bodied aircraft that have made suc-cessful landings on water is zero5.”
US Airways’ successful water landing in the Hudson River on January 15, 2009 has changed this record and now serves as an example for the aviation safety industry to study. The resilience characteristics of three other ditch landing events in the last 15 years were com-pared to that of US Airways Flight 1589. In these cases, the number of deaths ultimately meas-ures the severity of an airplane crash. For this analysis the survival rate is used as the metric to determine the resilience or brittleness of the system. A survival rate of 80% or higher indicates a resilient system in the face of a disruption in nominal flight. A survival rate of 79% or below is brittle. The table below summarizes the four test cases that will be examined in this paper.
Table 2: Summary of Case Studies Resilient Systems Brittle Systems US Airways Flight 1549, Jan 15, 2009 -Root Cause: flock of large geese struck both engines causing dual engine failure shortly after takeoff - 100% survival rate
Tuninter Flight 1153, Aug 6, 2005 - Root Cause: incorrect fuel gauge indication caused both engines to fail after running out of fuel; mainten-ance error installed a fuel gauge for wrong aircraft - 51% survival rate
Garuda Flight 421, Jan 16, 2002 - Root Cause: flying in severe weather conditions caused engine flameout; failure to follow procedures resulted in engines not being restarted and APU not powered on
Ethiopian Airlines Flight 961, Nov 23, 1996 - Root Cause: hijackers wanted plane to reroute beyond its flyable range; pilots flew just off the African coast until fuel ran out causing dual engine failure

19
- 98% survival rate - 29% survival rate The cause of the ditch landings in all of these cases is multiple engine failure. While this is pri-marily a mechanical failure, it is important to note that a commercial airliner is not solely defined by the aircraft structure, avionics, and control mechanisms. This is a system of systems that in-cludes the flight system, the operating system, and the emergency response system as defined in Figure 1. The resilience characteristics that exist in all aspects of a commercial airline system will be ex-amined. Background on Ditch Landings Performing a successful ditch landing is not a well understood event and preparation for this has not always been a mandatory part of airline pilot training. The commonly agreed upon factors that can contribute to success in this scenario are sea conditions and weather, type of aircraft, and skill and technique of the pilot22. Calm water is the best scenario because the pilot can land into the wind to maximize resistance and slow down the aircraft. However, this is not usually the case, and the pilot must assess the direction of the wave swells, wind speed and direction to pre-pare for landing. The most desirable configuration is to land parallel to wave swells at the peak of one of the swells. Figure 2 shows the desirable attitudes when performing a ditch landing.
Due to the angle of attack of the wings on all aircraft at stall, a nose high tail low attitude should be flown to during initial impact with the water. However, if an aircraft has an upswept rear fuselage, it may experience a violent vertical pitch up just after impact. To avoid this, air-craft with straight fuselages are most desirable in this situation7. Low-winged aircraft are also advantageous in that they keep the passenger fuselage afloat after impact. More modern aircraft, such as the Airbus A320, also have what is known as a “ditching button” which can be pressed to close out all of the outtake valves to prevent water from flooding the cabin.
The pilot’s decision making skills are critical to a successful ditch landing. A good pilot can evaluate the emergency situation quickly and make a decision to perform a ditch landing as soon as possible. Once the decision has been made, the pilot can set the plane’s attitude to glide above water for as long as possible to provide maximum preparation time. In a ditching scenario, the most important concerns for the pilots are judging the conditions of the waves, notifying air traf-fic control (ATC) of location, and assessing the location of nearby boats that may provide rapid rescue. A pilot must maintain control over the aircraft throughout the entire landing. These four cases discussed in this paper will expose variations of this ideal scenario.
Flight System (Air-plane structure
and engine)
Operating System (Air traffic control,
aircraft crew)
Emergency Response System (passengers, nearby boats, rescue
crews)
Figure 3: System of systems definition

20
Figure 4: Ditching Procedures22
Resilience Background for All Cases Each case study will be examined first in the context of its individual resilience heuristics, identi-fied in italics. The resilience principles are also summarized in the tables in Appendix A for each case. Additional information about the resilience characteristics in general can be found in the draft of Scott Jackson’s book Architecting Resilient Systems: Accident Avoidance and Survival and Recovery from Disruptions12. Once the applicable heuristics have been identified for each case, a comparison of the most significant heuristics will be performed and the complete set of all applicable heuristics will be identified. US Airways Flight 154920 US Airways flight 1549 was coined the “Miracle on the Hudson14” for its remarkable 100% sur-vival rate in the face of difficult circumstances. A flock of large geese struck both engines of the Airbus 320 causing them to lose engine power on January 15, 2009. After ruling out other op-tions such as returning to New York’s LaGuardia Airport or landing at New Jersey’s Tetersboro Airport, Captain Sullenberger and his crew chose to ditch the plane into the Hudson River. The passengers aboard USAir 1549 were very fortunate. Their captain was a trained glider pilot and executed the water landing almost perfectly allowing the aircraft to settle on the surface of the river in-tact and unflooded. All passengers and crew were able to evacuate the aircraft and wait on the wings until nearby commuter ferries and rescue crews were able to assist them. The com-bination of favorable ditch landing conditions (i.e. nearby boats, still waters, etc), a skilled crew, and a well-trained and efficient emergency response system in NYC contributed to the resilience of this system.

21
Despite the resilience exhibited by this system, additional things could have been done to avoid this accident altogether. A bird protection system for the LaGuardia Airport could have prevented the US Airways flight from flying into the path of the flock of geese. Since the acci-dent, the Port Authority of New York and New Jersey has decided to extend the coverage of the bird protection system that they were deploying at the John F. Kennedy Airport to include La-Guardia and Newark18. In addition, the A320 could have been designed to absorb the impact of the large geese. Practicing the context spanning heuristic and modeling a flock of birds during aircraft design and testing could have contributed to structural changes that would have made this aircraft robust to this disruption. These two things may have been considered in aircraft design, but not implemented because they were not cost effective given the low probability of this event.
Aspects of the aircraft design also contribute to the survivability of this accident. When the engine power was lost a functionally redundant source provided power to the rest of the control mechanisms. In addition, the A320 was equipped with aforementioned “ditching button.” This factor combined with the calm waters allowed for a smooth impact and contributed to the grace-ful degradation exhibited by this system by allowing the aircraft structure to stay intact and float long enough for the passengers to evacuate.
Perhaps the most publicly celebrated factor in the resilience of this system was the incredible skill of Captain Sullenberger. The operating system of an aircraft ultimately practices a human-in-control heuristic to rely on the quick decision making skills only a human can posses. Very shortly after the birds struck the aircraft, the flight crew evaluated the problem, put the plane in a neutral state to glide for as long as possible, and then reorganized from nominal takeoff to emergency landing mode to evaluate their options. Captain Sullenberger is an excellent example of the wisdom behind the informed operator heuristic. His extensive training as a glider pilot provided instinct, skill, and experience that helped him make a smooth water landing.
This smooth landing was not a guarantee for survival. There was still a threat that passengers could drown if not rescued quickly from the water. It was a cold morning in New York on Janu-ary 15th, and the passengers were certainly at risk of hypothermia if left in the 40-degree waters too long. Due to the fact that this incident happened just after takeoff, the US Airways aircraft position was still monitored by ATC at LaGuardia. The aircraft went down near a very busy commuter ferry route on the Hudson River allowing civilian and rescue crews to watch the inci-dent. The knowledge between nodes heuristic was easily followed here because of the visual and automated monitoring of aircraft’s position by various rescue units. Additional support of the knowledge between nodes heuristic was in the inter-element collabora-tion by the rescue teams. The September 11, 2001 attack on the World Trade Center showed New York City the benefits of working across organizations to help save the city from emergen-cy situations. The infrastructure breakdown witnessed during the 2005 Hurricane Katrina recov-ery highlighted the chaos that can be caused when organizations cannot work cooperatively. There have been rehearsal events in New York City to help strengthen intra-organization rescue efforts amongst the FDNY and the National Guard, suggesting the high value placed on colla-borative efforts in that area10. In the case of USAir flight 1549, the NYPD, FDNY, US Coast Guard, and transport ferries worked together to rescue all 155 passengers quickly and safely. One passenger represented this success best in his quote during a CNN.com interview23, “…if you're going to go down in an incident, you want to be in New York, I promise you. Those people took care of us. The ferryboat drivers, the fire and rescue, they were on top of it, took us out.”

22
Table 3 in Appendix A summarizes the resilience principles that apply to this system, wheth-er they were present or missing in the system, and whether they applied to the flight system (FS), operating system (OS), or emergency rescue team (ER). Garuda Flight 42121 On January 16, 2002, Garuda Indonesian Airlines flight 421 experienced a loss of power caused by engine flameout while descending through heavy rain and hail. Pilots noticed the red thun-derstorm cells indicated on their on-board radar and notified flight control that they wanted to deviate from their current flight path to fly through a gap in the storm cells. Shortly after entering the thunderstorm en-route to this gap, both engines, operating at idle power, flamed out. The pi-lots made three unsuccessful attempts to restart the engines and then a failed attempt to start the auxiliary power unit (APU), an element of the functional redundancy in the power system that existed. The airplane made a ditch landing in the one meter deep waters of the Bengawan Solo River on the Indonesian island of Java. One flight attendant was killed because she did not have her life vest on and drowned during her attempt to board the life raft. All remaining passengers were rescued.
The Federal Aviation Administration (FAA) certification standards for hail conditions were based on service and atmospheric data gathered in 1980s but by 2002 had not updated based on significant technological advances in meteorology or increases in aircraft engine services. Prac-ticing the drift correction heuristic could have corrected this trend toward brittleness. In addition, expanding the context spanning flight scenarios during pilot training could have led to more commonly known practices when flying under these weather conditions. One of the most significant heuristics that was violated in this incident was the informed opera-tor heuristic. The pilots were not prepared to perform the recovery procedures necessary to avoid the disruption. In the National Transportation Safety Board’s (NTSB) safety recommendation21 it was noted that the pilots did not follow procedure by starting the APU and reestablishing power prior to restarting the engines. The pilots also violated the minimum wait time necessary for the engine to return to idle speed following an engine restart attempt. The NTSB also noted that dur-ing flights that experienced similar flameouts, the engines were restarted nominally when the idle speed was reached prior to the restart attempt.
There had been concern that the engines should not be operated at flight idle power during bad weather. An airworthiness directive (AD) was issued in 1988 which directed a certain mini-mum engine fan speed that must be maintained during flight through inclement weather. After engine modifications in 1993, the AD was superseded by one mandating the modifications and eliminating the minimum fan speed regulation. The engines on Garuda Airlines flight 421 had received these engine modifications, but this case suggested that the flight idle power setting should still be questioned.
In addition, there was no margin present in the operation of this aircraft under these condi-tions. This aircraft engine was flown at low power setting with ignition setting off. It has been shown that high power settings help the engine absorb all of the heavy rain by slinging water and ice away from the interior of the engine protecting the combustion system. Also, setting the en-gine to constant ignition could help prevent flameout. Even with their initial mistakes in restarting the engines or backup power, the pilots were able to reorganize fast enough to establish a neutral state for the aircraft once they determined they could not recover powered flight. This helped them choose a desirably shallow area of the Ben-gawan Solo River to land in allowing the aircraft to gracefully degrade by remaining structurally

23
intact and above water. The flight crew informed ATC of their location, exercising the know-ledge between nodes heuristic for rescue efforts. This was an overall resilient system because the plane was able to land in relatively shallow waters from which people could escape without drowning and await rescue crews.
Table 4 in Appendix A summarizes the resilience principles that apply to this system, wheth-er they were present or missing in the system, and whether they applied to the flight system, op-erating system, or emergency rescue team. Tuninter Flight 11533 On August 6, 2005, Tuninter flight 1153 made a ditch landing into the Mediterranean Sea just off the coast of Sicily about an hour after takeoff when both engines ran out of fuel. The wrong fuel quantity indicator (FQI) was installed on the plane the day before the flight giving the pilots an incorrect fuel reading. A number of things could have been done to avoid this incident altogeth-er. First, correct maintenance or detailed inspection by the flight crew could have prevented the wrong fuel gauge installation from going unnoticed before flight. The wrong part from an ATR-42 aircraft was easily installed into ATR-72 fuel gauge system because the configurations on both aircraft were similar and both parts looked almost identical8. The ATR-72 was not able to absorb having the wrong FQI installed because the fuel level calculation algorithms were differ-ent in the two parts. The NTSB recommended one way to avoid this accident would have been to have a functionally redundant fuel low level warning that did not depend on the algorithm in the FQI9.
Even with the incorrect fuel gauge system installed, there were still ways to avoid engine failure. Pilots who fly the same route often have an internal sense of how much fuel an aircraft uses throughout that flight. Since this was a commuter aircraft, that was likely the case. The pi-lots should have been able to detect the problem by monitoring the automatic system to see that the fuel level was not where they expected it to be. In further negligence, the pilots ignored the fuel low pressure warning. Practicing the human monitoring heuristic and requesting feedback from the operator when the warning sounded may have prevented this disregard. The flight crew was so panicked after both engines lost power that they spent much of their time trying to understand what had happened rather than regrouping, dealing with the circumstances, and exercising the emergency procedures. The captain was so flustered when he realized the emergency situation that he turned to prayer and handed control to the co-pilot, who was by na-ture of his position a less informed operator. The voice recorder from the cockpit reflected the confusion during the final moments of this flight, showing that the pilots were not in control and failed to establish a neutral state. Also, their communication with ATC was very panicked and spoken in four different languages, limiting the shared knowledge between nodes between the flight crew and air traffic control6. The pilot and other members of the flight and maintenance crew were convicted of manslaughter in March 2009 as a result of the mistakes made during the operation of this flight13.
The plane continued a steep descent rather than gliding smoothly into the water and entered the water with a very high vertical speed, a tail wind, and not parallel to the waves. This violent impact caused disintegration of the airframe killing many of the passengers on impact. Some passengers drowned after the accident, perhaps due to the high-winged design of the aircraft which caused the fuselage to float below water. While the design does not directly contribute to the structural integrity of the flight system, the high-winged design can be seen as an example of

24
the lack of hardness of the system. 16 out of 23 passengers and crew on board perished in this accident.
Table 5 in Appendix A summarizes the resilience principles that apply to this system, wheth-er they were present or missing in the system, and whether they applied to the flight system, op-erating system, or emergency rescue team. Ethiopian Airlines Flight 9611 On November 23, 1996, Ethiopian Airlines flight 961 was hijacked en-route to Kenya. The hi-jackers demanded the plane reroute to Australia. Had the preventive measures that exist in the post-9/11 aircrafts existed at that time, the hijackers never would have had access to the cockpit and the plane could have continued its scheduled flight. While not a very cost effective or prac-tical solution, another preventive measure could have been to fuel the plane with more gas than necessary for its scheduled flight allowing it to absorb the change in route to Australia.
Knowing that if he put the plane on path to Australia, they would certainly run out of fuel somewhere in the middle of the ocean, the pilot, an informed operator, avoided this fate by fly-ing just off the coast of Africa. When the engines lost power, the flight crew reorganized and headed toward the nearest land, the island of Comoros. The pilot headed toward the airport on the island, but a last minute fight with the hijackers disrupted the neutral state of the cockpit making it impossible to regroup and make it to the airport. Given the short notice, the pilot chose the best option he could – to make a water landing near a populated beach so that rescue crews could quickly come to the aid of the crash victims. There are conflicting accounts of the landing attitude. The first is that the fight with the hijackers left the plane in an uncontrolled state as it entered the water17. The second is that the plane touched down on the water smoothly but the en-gine caught on a piece of coral breaking the wing1. Given either case, the aircraft structure did not exhibit graceful degradation or hardness. Some passengers were thrown from the aircraft, but some were trapped in the upside-down fuselage. Many of the passengers drowned because they had prematurely inflated their life vests before landing and could not swim to the exit of the aircraft body. Improved organizational planning may have prevented this by placing a stronger emphasis during the pre-flight safety instructions on the importance of not inflating the life vest until after the aircraft structure has been exited.
The knowledge between nodes heuristic was likely not practiced significantly in this case. It is unclear if the ATC was notified of the quick decision to make a ditch landing. The primary knowledge of the aircraft position was that of the observers on the beach. Nearby tourists and resort staff exhibited good inter-element collaboration by arriving at the scene in minutes help-ing to fish bodies out of the ocean. Unfortunately, the scattered debris made it hard for rescue crews to access all parts of the accident scene. Only 50 of the 163 passengers survived, making this an example of a non-resilient system.
Table 6 in Appendix A summarizes the resilience principles that apply to this system, wheth-er they were present or missing in the system, and whether they applied to the flight system, op-erating system, or emergency rescue team. Resilience Characteristics Common to Ditch Landings Many heuristics apply in various areas of this system. However, four heuristics seem to most significantly contribute to resilience in a ditch landing. This conclusion is based on analysis of which heuristics were 1) missing in all cases or 2) present in the resilient cases and absent in the

25
brittle cases. This is not to say that only these four heuristics should be considered when archi-tecting a commercial aircraft to be resilient in ditch landings. Taking away current attributes that were present in all systems, such as the physically redundant engines or the human-in-control flight characteristics, would degrade the resilience of this system. Prevention All of these crashes could have been avoided. The first line of defense in these systems is the ability to detect a threat and change path to avoid the threat. In the case of US Airways 1549 and Garuda 421, systems could have been implemented to avoid the cause of their disruption alto-gether. A bird surveillance system could have detected the flock of birds in the flight path of the aircraft so that the pilot could have delayed takeoff, or adjusted the altitude or directions of the flight path. In the case of Garuda Flight 421, an updated model of how the system responds in harsh weather or better radar monitoring systems for detecting weather, could have prevented the initial engine flameout. Proper maintenance and installation of the correct fuel gauge8 or an in-dependent fuel gauging system and fuel level low warning9 would have prevented the loss of en-gine power of the Tuninter flight. And implementing the terrorist protection mechanisms now in place as a result of the 9/11 terrorist attacks could have prevented the Ethiopian Airlines disaster. Better context spanning scenarios used in system architecture, design, and operations could help build this protection into the infrastructure. In addition, performing drift correction in systems such as the US Airways 1549 or Garuda 421 flights could increase resilience by incorporating the latest technology into their infrastructure. Often in aviation systems, building in preventive measures would be more cost effective than making the structural system more robust to physical impact. Graceful Degradation
The graceful degradation of the ditch landing is characterized by the main passenger cabin remaining intact and afloat after impacting the water long enough for the passengers to evacuate. In the cases of the US Airways and Garuda incidents, minimal damage was done to the aircraft structure, and passengers were able to evacuate the aircraft by following the standard emergency procedures. In the case of the more brittle systems, Tuninter and Ethiopian Airlines, the aircraft broke apart and many people were killed during that disintegration or were trapped in the broken fuselage and drowned. A contributing environmental factor that is not within the control of the system is the favorable conditions of the water. In the US Airways case, the Hudson River was very calm the morning of January 15, 2009. In the Garuda case, the river was shallow creating less violent waves. Both Tuninter and Ethiopian Airlines crashes occurred in a more challenging ocean environment with rougher wave conditions. Those conditions made it hard for the pilots to assess and prepare for a proper ditch attitude. In the case of the Tuninter crash, the aircraft design also played a part in its disintegration because the high-wing design of the ATR-72 eliminated the passenger cabin floatation provided by the low-wing aircraft in the resilient cases. This design feature could be seen as part of the system hardness or absorption characteristics.
While the hardness of the aircrafts themselves, in particular their load capability and their structural stability, may have also played a part in increasing the graceful degradation of the re-silient systems, it is beyond the scope of this paper to understand the requirements, manufactur-ing methodologies, and verification methods used to build each type of flight system. As shown in Table 2, because three different manufacturers and four different types of aircrafts were in-

26
volved in these incidents, no conclusions can be made that one aircraft manufacturer is “harder” than the other or that the FAA should investigate strengthening the structural stability of certain types of aircraft.
Table 3: Type of Aircraft
USAir 1549 Garuda 421 Tuninter 1153 Ethiopian 961
Airbus A320 Boeing 737-3Q8 ATR-72 Boeing 767-260ER Each of these aircrafts should have met to the hardness requirements enforced by the FAA, how-ever, the verification of their hardness was likely done by analysis. Differences may have existed in the analysis methods resulting in variations in structural strength of these systems. While one option to address the hardness of a system is to design to increased requirements, the FAA prob-ably did a cost/benefit analysis and determined that the chances of a system needing to withstand an impact of this force was low enough that it was not cost effective. It may be more cost effec-tive to put into place more preventive systems such as a bird detection system to decrease the likelihood of a disruption occurring to the system. Reorganization The reorganization heuristic initially cited by Richards et al19 states that reorganization is the ability of the system to restructure itself in response to disruptions or in the anticipation of dis-ruptions. Because these cases primarily focus on the restructuring of the operating system, this is closely tied to the regroup heuristic that states that the system should be able to restructure itself after a disruption to recover some degree of functionality and performance12. In the resilient cas-es, the captains were able to quickly reorganize their flight control from nominal to emergency preparation. In the resilient cases, the flight crew was also able to establish a neutral state in which they could adequately prepare for the emergency. Captain Sullenberger and his team, as well as the crew on Garuda flight 421, made the choice to perform a ditch landing early enough to prepare for and complete the ditch landing procedure. This contributed to saving many lives because the landings were smoother allowing the aircraft structure to remain mostly intact after the impact. In the case of the Tuninter Airlines flight, reports suggest that the crew of this aircraft was unfocused and did not start the emergency procedure soon enough to have a successful ditch landing3. This was confirmed when the pilot was convicted of manslaughter13. The pilots of the Ethiopian Airlines flight were preparing to make an emergency landing at the airport on the isl-and of Comoros when the hijackers began an assault in the cockpit. The pilot realized too late that he would have to make a ditch landing. While some reports state that initially this landing was smooth, and a coral reef that caused the aircraft to break apart1 in the water, others claim that the hijackers were distracting the captains at the time of the landing, preventing him from putting the plane in a neutral state as it entered the water17. Knowledge between Nodes The knowledge between nodes heuristic states that a system should maximize knowledge be-tween nodes12. In the context of ditch landing cases, these nodes are that of the operations system on the troubled aircraft and that of the emergency rescue infrastructure. US Airways Flight 1549 maximized the chance of a quick rescue response by landing at a spot in the Hudson River fre-quented by many commuter ferries. These boats as well as the US Coast Guard, NYPD, and

27
FDNY emergency crews rapidly came to the rescue of the passengers onboard. The Garuda flight crew made the choice to increase their survival and rescue chances by landing in a very shallow part of the river. In this case, no reports were found on the length of time elapsed before emergency response arrived. The Ethiopian Airlines pilots, even though part of a relatively brit-tle system, increased its survival rate by ditching close to a busy beach where civilian and offi-cial rescue crews could arrive at the accident scene. In the case of Tuninter Airways flight, the crash happened 8 miles off shore. The voice recording of the final communication of position to air traffic control was also very unclear, often mixed between many different languages. While the rescue crews were notified of the impending accident, the distance from the shore and the time it took for emergency crews to come to the scene certainly contributed to the loss of life of those who drown in the water after the impact. In both of these latter cases, the scattered debris from the accident scene also made it harder for the emergency rescue teams to locate all of the passengers. While this resilience factor is characterized by the knowledge between nodes heuris-tic, it is also the proximity and accessibility of the accident scene to emergency rescue teams that is important for recovery. Summary In any one of these situation, there are many factors beyond these heuristics that also played a part in the level of severity of these accidents, such as the organizational culture and environ-mental factors. However, the four most notable heuristics that apply to the resilience of a com-mercial aircraft in a ditch landing are initial prevention of the disruption, reorganization of the flight crew to maintain control of the aircraft in an emergency, graceful degradation of the air-craft structure after impact, and shared knowledge between the flight crew and the emergency response system. Placing importance on these four heuristics during system architecture and de-sign would increase the resilience of commercial airlines to ditch landing scenarios.
While emphasis on the heuristics discussed above should be considered when designing a re-silient commercial airline system, a broader set should be practiced. By comparing Tables 3 through 6 in Appendix A, the full set of heuristics that apply in this situation was determined. This set includes the following heuristics:
• Absorption • Functional redundancy • Physical redundancy • Margin • Hardness • Context Spanning • Reorganization • Human-in-the-loop • Human-in-control • Predictability
• Graceful degradation • Drift correction • Neutral state • Organizational Planning • Prevention • Informed operator • Knowledge between nodes • Automated system monitoring • Organizational decision making • Human monitoring
Further Study The previous case studies compared the resilience principles of four similar systems facing the same type of disruption, engine failure over water. Both resilient and brittle systems were ex-amined to fully characterize the applicable heuristics. While some more significant than others,

28
there is a common set of heuristics that apply in those cases. To broaden the analysis, a cursory look at similar systems in the face of a different type of disruption was performed through one additional case study. By comparing the heuristics active in this system with those of the pre-vious four cases, a common set of heuristics can be proposed that apply to this type of system overall in the face of any disruption. JetBlue Airways 292 On September 21, 2005, JetBlue Airways flight 292, initially bound from Bob Hope Airport in Burbank, CA for New York’s JFK airport, made an emergency landing at Los Angeles Interna-tional Airport (LAX). Just after takeoff, the nosewheel on the landing gear of the Airbus A320 got stuck 90 degrees from where it should have been. The media coverage was particularly sen-sational while covering this emergency because the satellite video standard on all JetBlue air-crafts made it possible for the passengers onboard to watch as their own living drama unfolded on CNN. After burning off fuel by circling the Los Angeles area, the plane successfully landed at LAX emitting only some sparks from the nosegear as it dragged down the runway. No passen-gers or flight crew were injured during this incident, making it an example of a resilient system that performed a full recovery of essential capability (i.e. carrying passengers to safety on the ground) following a disruption.
The cause of the irregular nosewheel position was the fracture and separation of two of the four anti-rotation lugs caused by fatigue during prior testing. Two additional design features con-tributed to the incident. The logic of the brake steering control unit (BSCU) system prevented the nosewheels from being able to face the right direction. The NTSB preliminary report states
“…due to the sequencing of the nose and main landing gear and their respective doors, hydraulic pressure was shut off to the NLG steering valve. This lack of hydraulic power to the servo valve resulted in a lack of position feedback to the BSCU. After a 0.5-second monitoring time period, the BSCU detected this as a fault and deactivated the steering system so that the BSCU could not return the nose wheels to center. Failure of the nose-wheels to center initiated a WHEEL N/W STRG FAULT caution message on the ECAM. There were no approved procedures that allowed the flight crew to attempt to reset the BSCU system, which would have re-enabled the hydraulic system and could have re-sulted in the system recentering the nose wheels15.”
Because this flaw had occurred on other systems prior to this incident, the French company that manufactured the nose gear assembly, Messier-Dowty, issued a maintenance advisory to crews of the A320. Maintenance crews familiar with this system typically performed the fix to the BSCU to prevent this behavior16 and allow the system to absorb the design flaw. The Airbus A320 with this design flaw was nearing a brittle system. Following this incident, that advisory was turned into an airworthiness directive mandated on all systems to perform drift correction. In addition, the lack of approved procedures to re-enable the hydraulic system was an example of the lack of organizational planning. The manufacturer stated they had already redesigned this system to eliminate the flaws, but the design was still awaiting approval. A looser coupling of the formal approval process and the process to notify all A320 crews of the design flaw and im-pending change could have prevented this incident.
Despite the flaws in the nose gear system, some aspects of the A320 made it robust to this situation. The system is built with tricycle landing gear that can be landed without the nose wheel at all. The nose wheel is a physically redundant part of the wheel system that provides sta-bility and steering control. In addition, the nose wheel is functionally redundant because as long

29
as the system still has steering control through the differential breaking system and the hydrau-lics, it can land safely11. In addition, the structural integrity of the wheel strut to withstand being dragged down the runway without breaking off is an example of the hardness of the A320, engi-neered to withstand this scenario.
The flight crew and the maintenance personnel certainly deserve credit for maintaining the resilience of this system as well. The flight crew were notified of the problem by a set of warn-ings in the cockpit. These warnings did not tell the whole story about the crippled configuration of the landing gear. The flight crew relied heavily on inter-element collaboration by including members of the corporate maintenance team and air traffic control to diagnose the problem. Af-ter the fault was detected, the JetBlue pilot performed a low flyover at the Palmdale airport so that air traffic control could visually inspect the underbody of the airplane. Unable to fully diag-nose the situation, the aircraft rerouted to the Long Beach Airport (LBC) where corporate head-quarters and maintenance personnel were able to assess the situation16 from the ground. The maintenance team, corporate office, and the flight crew worked together to understand the dis-ruption that had occurred and determine the best chances for survival. The visual inspection by the ground crew is an example of both the human-in-the-loop and automated system monitoring heuristics as well because the maintenance personnel were able to perform an additional inspec-tion of what the automated system was reporting.
The pilot and his crew were excellent examples of an informed operator of this system. Not only was the pilot able to quickly reorganize his operations to include the ground crew, but he was also able to include the flight attendants in preparing for the emergency landing. The flight attendants helped reduce the load on the front tire by relocating as many passenger and as much carry-on baggage weight to the back of the aircraft16. In addition, the distorted wheel strut was given additional margin to withstand the landing stress when the pilot flew for three hours over the LAX area to burn fuel. This both reduced the risk of fire on the ground and lightened the air-plane. He also made the decision to land at LAX rather than LBC to provide additional landing distance margin due to the longer runway. The landing used a much larger portion of the availa-ble runway than in a typical landing validating the pilot’s decision to divert from Long Beach16.
The landing itself was almost textbook perfect, with the stub of the nosewheel resting square-ly on the centerline, something that could only be done by a human-in-control system. The pilot kept the plane on the rear tires for a very long time, decreasing the amount of time and stress that was put on the front strut. His ability to do this was due to his skill, but also the predictability of this scenario. Landing techniques like this are practiced as part of flight training demonstrating that flight training practices the context spanning heuristic. ABCNews.com stated, “the possibili-ty that anything serious might happen on the landing was less than 1 percent, especially after the crew had done such a thorough job of preparing itself and the aircraft, discussing the problems with the company maintenance personnel and coordinating with flight attendants to work as a polished team11.
As a continued example of the knowledge between nodes and inter-element collaboration the rescue team was waiting on the ground to put out any residual fires caused by the friction on the nosewheel. Per the FAA safety organization recommendation, the rescue team chose not to pre-foam the runway to prevent fires because this could have a hidden interaction with the brakes making them less effective2. The aircraft structure demonstrated graceful degradation by remain-ing intact and upright, supporting the weight of the aircraft on the front and back wheel stands.
JetBlue flight 292 is an example of a resilient system. While this scenario was common enough that the Airbus A320 was designed to withstand the nosewheel fault, there were other factors that contributed to this system that went above and beyond the engineering design. The
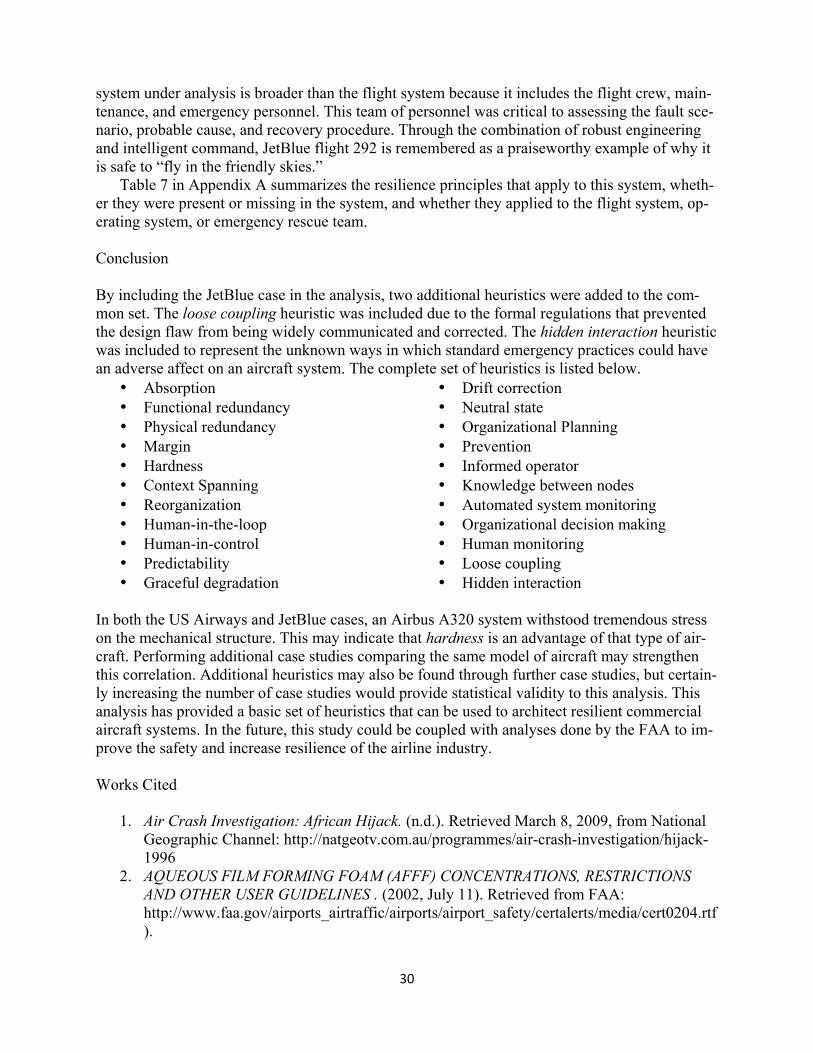
30
system under analysis is broader than the flight system because it includes the flight crew, main-tenance, and emergency personnel. This team of personnel was critical to assessing the fault sce-nario, probable cause, and recovery procedure. Through the combination of robust engineering and intelligent command, JetBlue flight 292 is remembered as a praiseworthy example of why it is safe to “fly in the friendly skies.”
Table 7 in Appendix A summarizes the resilience principles that apply to this system, wheth-er they were present or missing in the system, and whether they applied to the flight system, op-erating system, or emergency rescue team. Conclusion By including the JetBlue case in the analysis, two additional heuristics were added to the com-mon set. The loose coupling heuristic was included due to the formal regulations that prevented the design flaw from being widely communicated and corrected. The hidden interaction heuristic was included to represent the unknown ways in which standard emergency practices could have an adverse affect on an aircraft system. The complete set of heuristics is listed below.
• Absorption • Functional redundancy • Physical redundancy • Margin • Hardness • Context Spanning • Reorganization • Human-in-the-loop • Human-in-control • Predictability • Graceful degradation
• Drift correction • Neutral state • Organizational Planning • Prevention • Informed operator • Knowledge between nodes • Automated system monitoring • Organizational decision making • Human monitoring • Loose coupling • Hidden interaction
In both the US Airways and JetBlue cases, an Airbus A320 system withstood tremendous stress on the mechanical structure. This may indicate that hardness is an advantage of that type of air-craft. Performing additional case studies comparing the same model of aircraft may strengthen this correlation. Additional heuristics may also be found through further case studies, but certain-ly increasing the number of case studies would provide statistical validity to this analysis. This analysis has provided a basic set of heuristics that can be used to architect resilient commercial aircraft systems. In the future, this study could be coupled with analyses done by the FAA to im-prove the safety and increase resilience of the airline industry. Works Cited
1. Air Crash Investigation: African Hijack. (n.d.). Retrieved March 8, 2009, from National Geographic Channel: http://natgeotv.com.au/programmes/air-crash-investigation/hijack-1996
2. AQUEOUS FILM FORMING FOAM (AFFF) CONCENTRATIONS, RESTRICTIONS AND OTHER USER GUIDELINES . (2002, July 11). Retrieved from FAA: http://www.faa.gov/airports_airtraffic/airports/airport_safety/certalerts/media/cert0204.rtf).

31
3. Cenciotti, D. (2009, February 5). US Air 1549 vs Tuninter 1153; two differing ending ditchings. Retrieved from David Cenciotti's Weblog: Aviation from a different perspective: http://cencio4.wordpress.com/2009/02/05/us-air-1549-vs-tuninter-1153-two-differing-ending-ditchings/
4. empiricism. (2009). Retrieved 4 2009, March, from Merriam-Webster Online Dictionary: http://www.merriam-webster.com/dictionary/empiricism
5. Fear of Flying. (2006, September 7). Retrieved from Economist.com: http://www.economist.com/opinion/displaystory.cfm?story_id=7884654
6. Flankerphil. (2008, November 09). Tuninter Ditching Black Box. Retrieved from youtube.com: http://www.youtube.com/watch?v=rVPv_mrU95w
7. Flight Safety: Ditching Aircraft. (n.d.). Retrieved April 18, 2009, from pilotfriend.com: http://www.pilotfriend.com/safe/safety/ditching.htm
8. Franchi, B. (2005, September 6). ANSV Safety Recommendation. Retrieved from ANSV.it: http://www.ansv.it/cgi-bin/eng/TS-LBB%20RS%20ENG.pdf
9. Franchi, B. (2005, December 5). ANSV Safety Recommendation. Retrieved from ANSV.IT: http://www.ansv.it/cgi-bin/eng/ATR-72%20TS-LBB%20Safety%20recommendation%203.pdf
10. Gaskell, S. (2008, May 4). Exercise in teamwork for FDNY, Guard. Retrieved from New York Daily News: http://www.nydailynews.com/ny_local/2008/05/04/2008-05-04_exercise_in_teamwork_for_fdny_guard.html
11. Great Video, But Little Danger in Emergency Jet Landing. (2005, September 22). Retrieved from ABC News: http://abcnews.go.com/Business/print?id=1150873
12. Jackson, S. (2008). Architecting Resilient Systems: Accident Avoidance and Survival and Recovery from Disruptions (draft). John Wiley & Sons, Inc.
13. Mackey, R. (2009, March 25). Pilot Who Prayed Before Crash Sentenced in Italy. Retrieved from New York Times: http://thelede.blogs.nytimes.com/2009/03/25/court-in-italy-convicts-pilot-who-prayed-before-crash/?apage=2
14. Monek, S. (2009, January 17). Miracle on the Hudson. Retrieved from ABC Local News: http://abclocal.go.com/wabc/story?section=news/local&id=6606410
15. NSTB Identification: LAX05IA312. (2008, November 25). Retrieved from NTSB.gov: http://www.ntsb.gov/NTSB/brief.asp?ev_id=20050927X01540&key=1
16. Oldham, J. a. (2005, September 23). 7 Airbus Jets Had Landing Gear Trouble. Retrieved from LA Times: http://articles.latimes.com/2005/sep/23/local/me-jetblue23
17. Portratz, T. (2009, January 15). Airplane Water Landing and Ditching Statistics: Rates of Survival. Retrieved from nowpublic.com: http://www.nowpublic.com/world/airplane-water-landing-and-ditching-statistics-rates-survival
18. Press, T. A. (2009, January 23). Port Authority wants bird-detection system for NJ-NY airports. Retrieved from NJ.com: http://www.nj.com/news/index.ssf/2009/01/authorities_want_birddetection.html
19. Richards, M. G. (2008). Two Empirical Tests of Design Principles for Survivable System Architecture. 18th INCOSE International Symposium. Utrecht.
20. Romero, F. (2009, January 17). Learning from Flight 1549: How to Land on Water. Retrieved from Time.com: http://www.time.com/time/nation/article/0,8599,1872195,00.html?iid=sphere-inline-sidebar

32
21. Rosenker, M. V. (2005 , August 31). Safety Recommendation A-05-19 and -20. Retrieved from National Transportation Safety Board: http://www.ntsb.gov/Recs/letters/2005/A05_19_20.pdf
22. Scott757200, b. (n.d.). How to Ditch An Airplane. Retrieved April 18, 2009, from Hub Pages: http://hubpages.com/hub/How-To-Ditch-An-Airplane
23. Transcripts from January 16, 2009. (2009, January 16). Retrieved from CNN.com: http://transcripts.cnn.com/TRANSCRIPTS/0901/16/cnr.02.html
24. Valerdi, R. A. (2007). Empiricial Research in Systems Engineering: Challenges and Opportunities of a New Frontier. 5th INCOSE Conference on Systems Engineering Research. Hoboken.
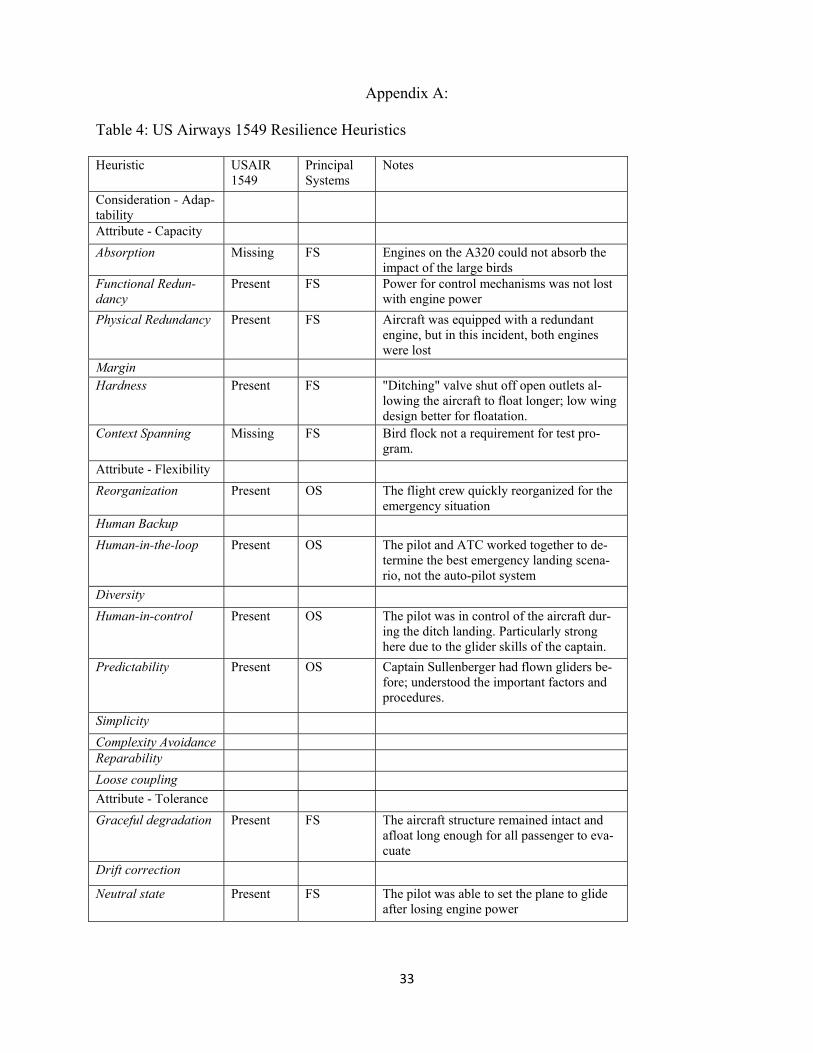
33
Appendix A: Table 4: US Airways 1549 Resilience Heuristics Heuristic USAIR
1549 Principal Systems
Notes
Consideration - Adap-tability
Attribute - Capacity
Absorption Missing FS Engines on the A320 could not absorb the impact of the large birds
Functional Redun-dancy
Present FS Power for control mechanisms was not lost with engine power
Physical Redundancy Present FS Aircraft was equipped with a redundant engine, but in this incident, both engines were lost
Margin Hardness Present FS "Ditching" valve shut off open outlets al-
lowing the aircraft to float longer; low wing design better for floatation.
Context Spanning Missing FS Bird flock not a requirement for test pro-gram.
Attribute - Flexibility
Reorganization Present OS The flight crew quickly reorganized for the emergency situation
Human Backup
Human-in-the-loop Present OS The pilot and ATC worked together to de-termine the best emergency landing scena-rio, not the auto-pilot system
Diversity
Human-in-control Present OS The pilot was in control of the aircraft dur-ing the ditch landing. Particularly strong here due to the glider skills of the captain.
Predictability Present OS Captain Sullenberger had flown gliders be-fore; understood the important factors and procedures.
Simplicity
Complexity Avoidance Reparability
Loose coupling
Attribute - Tolerance
Graceful degradation Present FS The aircraft structure remained intact and afloat long enough for all passenger to eva-cuate
Drift correction
Neutral state Present FS The pilot was able to set the plane to glide after losing engine power

34
Automatic function
Organizational deci-sion-making
Present ER NYC rescue agencies were able to deploy nearby commuter ferries and rescue crews in record time.
Organizational plan-ning
Mobility
Prevention Missing OS Bird detection system (just installed at NYC JFK) was not present at LaGuardia
Retaliation
Concealment
Deterrence
Attribute - Inter-element collabora-tion
Informed operator Present OS Pilot was trained to follow procedures for emergency landing as well as trained as a glider.
Hidden interaction Knowledge between nodes
Present ER Captain chose a spot to land in which rescue crews could quickly aid the passengers. Co-operative rescue effort by the USCG, NYPD, FDNY, and Port Authority.
Human monitoring Automated system monitoring
Intent awareness
Table 5: Garuda 421 Resilience Heuristics
Heuristic Garuda 421
Principal Systems
Notes
Consideration - Adaptability
Attribute - Capaci-ty
Absorption Missing FS Aircraft engine was flown at the wrong settings to absorb the water and protect the combustion system
Functional Re-dundancy
Missing FS-OS Backup power system (APU) was installed, but not activated due to pi-lot error
Physical Redun-dancy
Present FS Aircraft was equipped with a redun-dant engine, but in this incident, both engines were lost

35
Margin Missing OS Higher power and constant ignition settings on the engine could have in-creased its chances of withstanding the weather conditions
Hardness Present FS Low wing design better for floata-tion.
Context Spanning Missing OS Hail conditions faced exceeded the current FAA certification. FAA advi-sories for operating conditions should have been expanded to in-clude these conditions.
Attribute - Flex-ibility
Reorganization Present OS The flight crew quickly reorganized for the emergency situation
Human Backup Human-in-the-loop
Present OS The pilot and ATC worked together to determine the best emergency landing scenario, not the auto-pilot system
Diversity Human-in-control Present OS The pilot was in control of the air-
craft during the ditch landing. Weak here because pilot error did contri-bute to this accident.
Predictability
Simplicity Complexity Avoidance
Reparability Loose coupling Attribute - Toler-ance

36
Graceful degrada-tion
Present FS The aircraft structure remained intact for passenger to evacuate; shallow waters allowed for structure to re-main mostly above water
Drift correction Missing FS The certification standards for hail conditions were based on service and atmospheric data gathered in 1980s and were not updated based on sig-nificant technological advances in meteorology or increases in aircraft engine services.
Neutral state Present FS The pilot was able to set the plane to glide after losing engine power
Automatic func-tion
Organizational decision-making
Organizational planning
Mobility Prevention Missing FS Aircraft was equipped with radars to
detect weather conditions, but later meteorological information existed that could have better informed the crew how to avoid or operate under conditions
Retaliation Concealment Deterrence Attribute - Inter-element collabora-tion
Informed operator Missing OS Pilots did not follow procedure when starting the APU or attempting en-gine restart. Also did not follow rec-ommendations for engine power set-tings during inclement weather.
Hidden interac-tion

37
Knowledge be-tween nodes
Present ER The relatively shallow waters al-lowed for ease of emergency rescue, however it is unclear if emergency crews took a long time to arrive on the scene, leading to the death of the flight attendant
Human monitor-ing
Automated system monitoring
Intent awareness
Table 6: Tuninter 1153 Resilience Heuristics Heuristic Tuninter
1153 Principal Systems
Notes
Consideration - Adap-tability
Attribute - Capacity
Absorption Missing FS The aircraft could not absorb having the wrong FQI installed because the low fuel warning was not independent.
Functional Redun-dancy
Missing FS The fuel low level warning light is depen-dent on the fuel gauging system.
Physical Redundancy Present FS Aircraft was equipped with a redundant engine, but in this incident, both engines were lost
Margin Hardness Missing FS The aircraft broke apart upon impact with
the water. High-wing design caused passen-ger fuselage to be submerged in water.
Context Spanning Missing OS Design of part and maintenance crew did not design the ATR-42 part in such a way that it could not be installed in ATR-72
Attribute - Flexibility
Reorganization Missing OS The flight crew panicked and did not quick-ly reorganize for the emergency landing
Human Backup
Human-in-the-loop Present OS The pilot and ATC worked together during the emergency landing scenario; communi-cation was bad
Diversity
Human-in-control Present OS The pilot was in control of the aircraft dur-ing the ditch landing. Weak here because the panicked state of the flight crew caused them to make mistakes in emergency pro-cedures.

38
Predictability Missing OS Flight crew was distracted and did not start the ditching procedure early enough to complete it successfully and prepare for the ditch landing.
Simplicity
Complexity Avoidance
Reparability
Loose coupling
Attribute - Tolerance
Graceful degradation Missing FS The aircraft broke into pieces on impact. The part of the fuselage attached to the wings with the passengers on board was partially submerged.
Drift correction Neutral state Missing OS Flight crew did not establish a neutral state
after they ran out of fuel. They continued to try and understand why the engine shut down and perform other activities (pray) rather than prepare for the emergency
Automatic function Organizational deci-sion-making
Organizational plan-ning
Mobility
Prevention Missing OS Inspection of the proper FQI installation did not occur. Also, the ATR-42 and ATR-72 fuel gauges have the same dimensions and installation interfaces allowing improper installation.
Retaliation
Concealment
Deterrence
Attribute - Inter-element collaboration
Informed operator Missing OS The pilot did not check with the mainten-ance crew that the proper FQI was installed or perform an independent check of the in-stallation. Pilot handed over command to co-pilot.
Hidden interaction
Knowledge between nodes
Missing ER It took about 8 minutes for the coast guard to reach the aircraft. Because of the scat-tered debris, recovery was more difficult.

39
Human monitoring Missing FS The low pressure warning indicator for the fuel system was sounded, but the flight crew missed it. Should have continued to sound, for example, until feedback received from the human in control.
Automated system monitoring
Missing OS The pilot did not monitor the behavior of the fuel gauge to check for accuracy.
Intent awareness
Table 7: Ethiopian Airlines 961 Resilience Principles Heuristic ETH 961 Principal
Systems Notes
Consideration - Adap-tability
Attribute - Capacity
Absorption Missing FS Aircraft did not have enough fuel to absorb change in flight path to Australia
Functional Redun-dancy
Physical Redundancy Present FS Aircraft was equipped with a redundant engine, but in this incident, both engines were lost
Margin Missing FS Fuel onboard likely had some margin to allow for a longer flight, but not enough to get to the destination of the Hijackers
Hardness Missing FS The aircraft broke into pieces after an en-gine was caught on a coral reef. Because wing broke off, low wing design did not contribute to hardness in the end.
Context Spanning Missing FS Hijacker protection system not included as part of the aircraft design.
Attribute - Flexibility
Reorganization Missing OS The flight crew did not reorganized for the emergency situation due to distraction by the hijackers
Human Backup
Human-in-the-loop Present OS The pilot worked with ATC to notify them of the emergency situation as best he could given the hijacking situation
Diversity
Human-in-control Present OS The pilot was in control of the aircraft to the extent that he could be during the descent. Weak here because fight with hijackers may have disrupted this control.

40
Predictability Simplicity
Complexity Avoidance
Reparability
Loose coupling Attribute - Tolerance
Graceful degradation Missing FS The aircraft broke into pieces after an en-gine was caught on a coral reef (or violent impact with water). The main part of the fuselage with the passengers on board re-mained mostly intact but was upside down.
Drift correction Neutral state Missing FS According to some reports, there was a fight
with the hijackers that distracted the pilot just prior to landing. The attitude of the plane may have been affected by this fight, as the decision to ditch in the water was last minute.
Automatic function Organizational deci-sion-making
Organizational plan-ning
Missing ER Safety policies did not emphasize impor-tance of not inflating life jacket until after you exit the fuselage; Passengers drown b/c their lifevests trapped them inside the sink-ing structure.
Mobility
Prevention Missing OS 9/11 pilot protective measures were not yet in place
Retaliation
Concealment
Deterrence
Attribute - Inter-element collaboration
Informed operator Present OS The pilot understood how far he could go based on the amount of fuel he had on board, and rather than fly a route to Austral-ia, per the hijacker's demands, which would have had them crash far out in the ocean where chances of rescue were low, he flew to the nearest island he could find when the plane ran out of fuel and chose to put the plane down close to a populated area to in-crease rescue chances.
Hidden interaction
Knowledge between nodes
Missing ER Much of the initial emergency response relied on civilians at the beach and their boats. Not clear if ATC was notified of the landing location. Because of the scattered debris, recovery was more difficult.

41
Human monitoring Automated system monitoring
Intent awareness
Table 8: JetBlue 292 Resilience Heuristics
Heuristic JetBlue 292
Principal Systems
Notes
Consideration - Adap-tability
Attribute - Capacity
Absorption Missing FS Maintenance had not been performed to correct for design flaw in nosegear system
Functional Redun-dancy
Present FS Independent control of the differential breaking system and hydraulics allows the plane to have another mechanism for steer-ing and breaking besides the wheels
Physical Redundancy Present FS Tricycle landing gear allows plane to land without nosegear
Margin Present FS Longer runway increased landing distance margin; by dumping fuel, lightening the aircraft, and moving as much of the passen-ger load to the back of the plane as possible decrease chance of fire and lessen stress on landing gear
Hardness Present FS Aircraft structure able to handle friction on nosewheel (or surface of plane had that been the case)
Context Spanning Present OS Fight training included landing without a nosewheel
Attribute - Flexibility
Reorganization Present OS Pilot realized the flight crew could not fully determine the situation from their position in the cockpit. Reorganized (rearchitected) system to include maintenance personnel on the ground to help assess problem.
Human Backup
Human-in-the-loop Present OS Ground crew served as additional monitor of automated warning system by diagnosing the fault visually
Diversity
Human-in-control Present OS The pilot was in control of the aircraft dur-ing the ditch landing. Particularly strong here because the captain made a picture perfect landing.
Predictability Present OS Pilots trained to land without nosegear. Pre-dictable behavior in flight.
Simplicity
Complexity Avoidance
Reparability

42
Loose coupling Missing FS Airbus knew about problem with seals and BSCU but because the design change had not gone through formal approval, this plane flew with the faulty system.
Attribute - Tolerance
Graceful degradation Present FS Plane sparked when nosewheels hit the ground but did not break or burst into flames; System remained intact and passen-gers exited nominally.
Drift correction Missing FS Plane should have had maintenance per-formed to update the BSCU logic
Neutral state Present OS Flight crew calm and collected; treated it just like procedure
Automatic function Organizational deci-sion-making
Organizational plan-ning
Missing OS No approved procedure existed to restart the hydraulic system
Mobility
Prevention Missing FS Airbus aware of the defective part but it had not been approved yet or updated on this system
Retaliation
Concealment
Deterrence
Attribute - Inter-element collaboration
Informed operator Present OS Pilot decided to land at LAX because of longer runway; pilot performed landing technique well likely due to training
Hidden interaction Present OS Did not prefoam the runway to prevent fire because it could have interfered with the breaking system
Knowledge between nodes
Present OS Pilot discussed scenario with maintenance personnel, flight attendants, and ATC to be sure all were ready for worst case; Over-flight of LBC emphasized shared know-ledge of maintenance crews and flight crew
Human monitoring Automated system monitoring
Present FS Overflight at LBC allowed visual inspection of wheel system to determine what the problem was.
Intent awareness

43
Analyzing the System Resilience of the Economic System
by Robin Michener, [email protected]
Abstract
This paper analyzes the U.S. economic system in terms of the system resilience concepts pre-sented in course SAE-599 Architecting Resilient Systems. The severity of the current economic crisis is evidence of weakened system resilience within the U.S. economic system. While eco-nomic downturns, even recessions, are a normal (if undesirable) part of the economic cycle, this recession is more severe than normal and will have a longer duration than previous recessions. The housing market collapse and the subprime mortgage collapse were key disruptions the led to this economic collapse. The third disruption was the extreme tightening of the credit markets.
This paper analyses the impact of infrastructure and culture on the system resilience of the economic system. A number of resilience heuristics are addressed in the context of the economic system. This analysis considers the absorption heuristic, the reorganization heuristic, the diversi-ty heuristic, the hidden interaction heuristic, and the and a variation of the drift correction heuris-tic.
Introduction The severity of the current economic crisis is evidence of weakened system resilience within the U.S. economic system. While economic downturns, even recessions, are a normal (if undesira-ble) part of the economic cycle, this recession is more severe than normal and will have a longer duration than previous recessions.
This paper analyzes negative and positive contributions to system resilience from elements within the economic system. The context of this analysis includes events and responses observed in the current economic crisis. As the context of this paper is a crisis, more discussion is pre-sented on negative contributions towards system resilience than on positive contributions. Nega-tive contributions weaken the resilience of the system. This paper does not provide a detailed root cause analysis of the economic crisis since the objective of this paper is a discussion on sys-tem resilience. As a further step in limiting the scope of this analysis, the analysis focuses pri-marily on the financial sector of the U.S. economic system because that is where the crisis origi-nated.
System resilience can be viewed from three phases – avoidance, survival, and recovery. The avoidance phase of system resilience is “the ability to prevent something bad from happening”. [1] The survival phase of system resilience is “the ability to prevent something bad from be-coming even worse”. [1] The recovery phase of system resilience is “the ability to recover from something bad from becoming even worse than before”. [1] [16]
At the time of the writing of this paper, the U.S. economic system is in a severe economic re-cession. The time for disruption avoidance has past – the critical disruptions have already oc-curred. This recession has been determined to have started in December 2007 and has lasted 16 months to date. Current predictions for the end of this recession and the start of recovery vary widely, from late 2009 to the middle of 2010. For the discussion on system resilience, the eco-nomic system is currently in the survival phase – the time when actions are undertaken to “pre-vent something bad from becoming even worse.”[1] The challenge for the recovery phase (and

44
beyond the scope of this paper) will be the need to be very careful about changes made to the system in order to avoid “making something bad from becoming even worse than before”[1].
The system resilience analysis within this paper includes heuristic analysis. The heuristics of system resilience are categorized under four attributes. Jackson [1] defines four attributes of sys-tem resilience: capacity, flexibility, tolerance, and inter-element Collaboration. Jackson defines capacity as “the ability of system to absorb or adapt to a disruption without a total loss of per-formance or structure”. [1] Flexibility is defined as “a system’s ability to restructure itself in response to disruptions” [1]. [16] Tolerance is the ability of the system to adapt in response to disruption. The inter-element collaboration attribute deals with the internal system interactions in response to disruptions.
System resilience is the ability to respond acceptably to disruptions to the system. Jackson defines disruptions as “events that jeopardize the functionality of the system”. [1] The disrup-tions that are pertinent to this analysis of the economic system are Type B disruptions. Jackson defines Type B disruptions as “systemic disruptions of function, capability or capacity.”[1] Thus, Type B disruptions are internal to the system rather than externally imposed on the system.
The system under analysis within this paper is the U.S. economic system. The U.S. economy is huge. The Gross Domestic Product (GDP) of the United States is over $13 trillion dollars [23]. A detailed system description of the full economic system is beyond the scope of this paper. The analysis within this paper focuses on the financial sector as this is where the disruptions to the U.S. economic system have had significant impact.
The financial sector of the U.S. economic system consists of corporations, commercial banks, investment banks, insurance companies, investors (both individual and institutional), bold hold-ers, securities markets, credit markets, and also government organizations. Government organi-zations that have significant influence within the financial sector include Congress, the Federal Reserve System, the Treasury department, the Federal Deposit Insurance Corporation (FDIC), and the Securities Exchange Commission (SEC).
Further discussion of the economic system is presented throughout this paper’s analysis of the economic system with respect to the resilience concepts from the University of Southern Cal-ifornia (USC) course SAE-599 Architecting Resilient Systems. Evidence is presented to demon-strate aspects where the economic system has been resilient. Evidence is also presented to illu-strate aspects where the system resilience has been weakened. In sections where there may be evidence of both strong and weak system resilience, more discussion is presented on the weak system resilience aspects.
Disruptions in the Housing Market The initial disruption to the economic system that eventually triggered the current economic cri-sis was the collapse of the housing market. This does not mean that the housing market collapse is the root cause of this economic system crisis, only that it was the initial disruption to the sys-tem. As the housing sector is a key part of the economic system, this disruption is a Type B dis-ruption. As noted above, Type B disruptions are internal to the system.
The collapse of the housing market collapse triggered a closely related secondary disruption in the mortgage loan market, particularly within the subprime mortgage market. These two dis-ruptions reinforced each other on the way down, just as the housing market and mortgage market reinforced each other’s growth during the boom years. The housing market and subprime mort-gage market had enjoyed boom years prior to the collapse.

45
The housing market was superheated causing significant increases in home prices, necessitat-ing ever larger mortgages. Many of these new mortgages were subprime. Generally, subprime mortgages are mortgages given to those with weaker credit records or those with little to no down payments for the home purchases. Many of these were Adjustable Rate Mortgages (ARMs) that started out with a lower interest rate for the first few years followed by a much higher adjustable interest rate for the remainder of the loan. Thus, the increase in the subprime mortgage business was based on the (incorrect) assumption that home prices would continue to increase indefinitely with home owners refinancing the loans prior to the higher interest rates kicked in.
The loan “affordability” determination was usually made based on the initial “teaser” interest rate, not the higher interest rates that would kick in after a few years. Americans were typically looking for bigger and better homes, so the “affordability” threshold was effectively stretched. As a result, when the housing prices stopped increasing, people were unable to refinance out of mortgages that were now too expensive for their income. Thus, instead of more buyers running up home prices due to high demand, the market turned around an there were more sellers than buyers which decreased home prices. Decreasing prices meant an end to the expected quick growth in home equity and an end to the easy refinancing that was norm for subprime mortgages.
Once “affordable” mortgages became unaffordable which led to a significant increase in loan defaults and home foreclosures. The increase in home foreclosures put downward pressure on home pricing, eventually leading to further mortgage loan defaults, and the cycle continues. “During the second quarter of 2008 a record 1.2 million homes were in foreclosure, and total fo-reclosures for the entire year were expected to number 2.3 million, compared with an average of 1 million in previous years.” [23]
Disruptions in the Credit Market
Another major secondary disruption can be found in the extreme tightening of the credit markets. The credit markets are critical to the functioning of the U.S. economic system. The impact of lower levels of credit flowing through the economic system has been widespread. The contrac-tion in the credit markets is a secondary disruption because it was triggered by the subprime mortgage mess.
Subprime mortgages were usually packages into mortgage securities. “From 2000 to 2005 the amount of subprime mortgages involved in these securities increased from $56 billion to $508 billion. In 2006 investors bought at least $2.1 trillion in mortgage and other debt securities, a figure that declined only slightly to $1.6 trillion in 2007. Beginning in 2008 banks that held these securities began reporting huge losses as subprime borrowers defaulted. The banks suffered a reported $523 billion in losses.” [23]
“Banks and other financial institutions had also invested heavily in derivatives, complicated financial instruments that were supposed to help investors hedge against losses but that proved to be as toxic as mortgage securities.”[23] For example, one type of security is the Collateral Debt Obligation (CDO) securities. With respect to mortgages, CDO’s were built up from slices of in-dividual mortgages with the notional objective of reducing risk by spreading the risk from any one individual mortgage loan into multiple CDO’s. However, that notional risk reduction objec-tive failed when the inherent risk to the entire subprime mortgage category increased as defaults on subprime mortgages accelerated.

46
The Result
The result of these disruptions is the current economic recession. As of April 2009, this recession has been in progress for 16 months and still continuing. The recession length will soon be the longest recession since the Great Depression. Fortunately, few experts expect this recession to turn into a depression. Changes to the U.S. economic system since the Great Depression will prevent that occurrence. However, if the steps being taken to shore up the economic system don’t take hold soon, this recession could last another six months to a year with a subsequent slower than normal recovery phase.
The impact of these disruptions in the economic system has been widespread. As noted previously, the number of mortgage defaults and subsequent home foreclosures has more than doubled the normal annual rate. Due to loss in home equity, consumers are spending less, espe-cially on discretionary purchases. Consumer demand is a big driver for economic growth. When the retail industry declines in response to lower demand, that decline ripples out to other indus-tries in our economy. As the recession continues, job losses are increasing. In April 2009, “the jobless rate jumped to 8.5% from 8.1% -- and many forecasters expect it to top 10% by later this year.”[28] Prior to the start of the recession, the jobless rate was somewhere around 5%. The most significant increases in job losses have occurred since the credit markets locked up in the fall of 2008.
In September 2008, the credit markets locked up – banks are extremely reluctant to lend. Consumers are finding it very difficult to obtain loans, either mortgages or auto loans. While nominal mortgage interest rates are still low, the credit standards required to obtain the loans are much tougher – only those with high credit scores and at least 20% down-payments are getting mortgages at the lowest rates. Businesses are also finding it tough and more expensive to obtain the credit required for operations. Lending levels are still dropping. “According to a Wall Street Journal analysis [...], the biggest recipients of taxpayer aid made or refinances 23% new loans in February [2009] than in October [2008]”.[29]
A number of companies have failed as independent companies or on the verge of failure. The investment bank, Lehman Brothers, entered bankruptcy in September 2008. The government chose to bail out AIG, a giant insurance corporation; fearing that a collapse of AIG would trigger a world-wide systemic collapse. The U.S. automobile industry is in severe trouble due to the dramatic decrease in auto sales (in part due to consumer inability to obtain auto loans). The gov-ernment has provided billions in loans to General Motors (GM) and Chrysler, as these firms try to avoid bankruptcy.
Infrastructure
The U.S. economic system is very large and diverse. Goods and services produced are from a wide variety of industries, including the following: agriculture, mining, manufacturing, financial services, retail sales, government services, transportation, entertainment, and communications. [23] The preceding list is not exhaustive, merely a sampling to illustrate the breadth of the U.S. economic system. The breadth of the U.S. economic system promotes long term system resi-lience because declines in one industry are usually offset by growth in other industries.

47
However, the financial services industry plays a central role in the U.S. economy and other industries rely heavily on the services provided by the financial industry. The financial services industry includes “investment, commercial, and savings banks; credit unions; mortgage banks; insurance companies; mutual funds; real estate agencies; and various holdings and trusts.” [23] Both the original disruption and the secondary disruptions of the current economic crisis can be found within the financial services industry.
Government organizations that have significant influence within the financial sector include Congress, the Federal Reserve System, the Treasury department, the Federal Deposit Insurance Corporation (FDIC), and the Securities Exchange Commission (SEC). These government organ-izations set the policies and laws that relegate how the economic system operates. This capability lends itself to strengthening the system resilience of the economic system. While this capability is a positive contribution towards system resilience, bad policy decisions can undermine the resi-lience of economic system as well.
The Federal Reserve System plays a critical part in maintaining the economic system. “By far the most important function of the Federal Reserve System is controlling the nation’s money supply and the overall availability of credit in the economy.”[23] This ability to adjust the monetary policy in the response of crises is an infrastructure element that supports the system resilience of the economic system. Exact details on how monetary policy is implemented are beyond the scope of this paper. However, it is important to note that this capability is a double edged sword – while it has been an effective tool for responding to crises, it can also contribute to future problems as illustrated next.
In response to the economic crisis that occurred after the September 11, 2001 terrorist at-tacks, the Federal Reserve Chairman lowered prime interest rates in order to rekindle economic growth. One effect of this policy was the lowering mortgages interest rates. The lower rates fu-eled the housing boom, pushing housing prices higher and higher. Since the housing prices were rising much faster than incomes, eventually prospective home buyers could no longer afford them. [30] When fewer people could afford to buy the homes with the inflated prices, this was the start of the housing market collapse that was the first economic system disruption discussed previously. This is an example of the response from one crisis contributing to the next crisis.
Certainly existing regulations are not exhaustive as new financial products (e.g. Credit De-fault Swaps) can be developed that do not fall under existing regulations. In fact, a recent GAO report stated that the “U.S. financial system is more prone to systemic risk today because (1) the current U.S. financial regulatory system is not designed to adequately oversee today’s large and interconnected financial institutions, (2) not all financial activities and institutions fall under the direct purview of financial regulators, and (3) market innovations have lead the creation of new and sometime complex products that were not envisioned as the current regulatory system devel-oped.” [24]
Undervaluation of the risk involved in the subprime mortgage loans and subsequent deriva-tive products weakened the system resilience of the economic system. This undervaluation of product risk contributed to the adverse impact of the housing and mortgage market collapses.
The mortgage banking industry had relaxed the equity requirements for obtaining mortgages. During the boom period, prospective home owners could obtain mortgages with zero percent down payments, typically by taking out two mortgages. Mortgage originators allowed this based on the premise that home prices would continue to increase, thus quickly building equity into the process. However, this undervalued the risk of home price declines and subsequent walking away from the mortgage obligations.

48
Also, the industry undervalued the risk that mortgage holders could continue to afford their mortgages, particularly with the Adjustable Rate Mortgage (ARMs) that were very common in the subprime mortgage market. ARMs have a lower fixed interest rate for a period of 3-7 years (shorter periods had lower introductory interest rates), then the interest rates adjust to a signifi-cantly higher rate. What was affordable at the lower introductory rate could quickly become un-affordable at the higher rates. When such mortgage holders could no longer refinance these mortgages (into either new ARMs or fixed rate mortgages) due to declining home prices and tighter equity requirements, they began defaulting in increasing numbers.
Dealing with systemic risk is a critical issue for government policy makers. “A common fac-tor in the various definitions of systemic risk is that the trigger event, such as an economic shock or institutional failure, causes a chain of bad economic consequences – sometimes referred to as a domino effect.” [25] As the Great Depression illustrated, widespread bank failures are a form of systemic risk. “Historically, regulation of systemic risk has focused largely on preventing bank failures.” [25] However, further efforts for regulating systemic risk may be one eventual outcome of the current economic crisis. In 2007, “Congress [began] holding hearings on system-ic risk in response to the recent subprime mortgage crisis and its impact on the mortgage-backed securities and commercial paper markets.” [25]
This concern about systemic risk to the world’s interdependent economic systems is a key reason why the U.S. government stepped in with the multiple infusions of billions of dollars to prevent insurance giant AIG from failing. AIG’s biggest losses came from its Financial Products division that had significant exposure to Credit Default Swaps (CDS). Credit default swaps are insurance products that “transfer credit risks from one party to another.” [24]. These insurance products payout “if a specified credit event, such as default, occurs”. Unlike standard insurance products and equity securities, these products are not regulated. “As Bernanke explained recent-ly, "AIG exploited a huge gap in the regulatory system. There was no oversight of the Financial Products division. This was a hedge fund, basically, that was attached to a large and stable insur-ance company."” [2]
The lack of regulatory controls over the Credit Default Swap markets clearly weakens the economic system resilience. Adding regulatory controls over this market would enhance the eco-nomic system resilience by monitoring the systemic risk posed by this market. One objective of such regulatory policy would prevent such a condition as posed by the AIG Financial Products division from occurring in the future. Culture System resilience is influenced by culture for good or ill. Jackson identifies a number of cultural end-states that bolster system resilience and cultural paradigms that may be obstacles to system resilience [1]. This section analyzes a few culture elements with respect to its impact on the sys-tem resilience of the U.S. economic system. The culture elements selected for this paper are ones that have had negative impact on the system resilience of the economic system in light of the current economic crisis. The severity of the current economic crisis is the sign of the current weakness in the system resilience of the economic system. “Preoccupation with failure” [1] One “cultural end-state” for resilient system is a culture that “a pays attention to details, especial-ly those details that may result in failure.” [1] That cultural mindset was not present within the

49
U.S. financial system prior to the financial collapse in 2008. While the credit freeze up in the fall of 2008 may have appeared on the surface to be unexpected and sudden, the primary trigger, the housing market, had been declining since 2006. The housing market has had boom and bust cycles in the past, but none have triggered an economic crisis such as the current crisis. Usually the housing market declines are a response to (not a trigger of) economic troubles.
The difference is in the details. For example, the details about the extent to which some new financial products were dependent on a solid, growing mortgage base which underlies the hous-ing market. Collateral debt obligations (CDOs) are financial instruments “which use sliced-and-diced assets such as subprime-mortgage bonds to create customized products offering various levels of risk” [6]. When the housing bubble collapsed, an increasing number of homeowners defaulted on their mortgages which rippled into the CDO market. However, the CDOs “owner-ship” of the mortgages limits the ability of banks to modify defaulting mortgages. This is an ex-ample of lack of resilience within this segment of the financial market.
Eventually, the government will come up with new regulations that will be used to monitor and/or control these types of financial products so that they won’t cause future economic crises. But this is an ‘after the failure’ response. The real challenge to improving the system resilience of the financial system will be paying attention to the “details” of the next new financial product and its impact should they go bad as well – before the crisis, not afterwards. “Deference to expertise and a flexible culture” [1]
A system resilience culture is a flexible culture [1]. “A system resilience culture [ has been cha-racterized ] as one that defers to expertise [ to decide what way to go next ].”[1] The U.S. eco-nomic system definitely has a flexible culture which does lend itself in support of system resi-lience. However, in this case that flexibility is a double-edge sword. The financial experts are the very ones that developed the exotic financial products, such as collateral debt obligations (CDOs) and credit default swaps (CDS) contracts that have been key factors in making the eco-nomic crisis more difficult to get a handle on.
One big challenge for the regulatory response to this economic crisis is enacting regulations that provide more oversight to the CDO and CDS markets while still maintaining the flexibility inherent in our economic system. “The distancing paradigm” [1] The cultural distancing paradigm has been a contributing factor to the economic system’s current crisis. Jackson [1] relates the distancing paradigm to system safety. In the context of an econom-ic system, engineering safety translates to economic system stability. A stable economic system will have normal boom and bust cycles, but in stable economic systems the bust phase do not require massive government interventions to keep the economic system from screeching to a halt. That intervention is a sign of breakdown in the resilience of the economic system.
One example of the distancing paradigm within the lead-up to this economic crisis can be found within the mortgage loan origination business. The housing boom years were fueled, in part, to subprime loans that the lowered the normal credit worthiness considerations. These riskier loans were sold on the secondary market for mortgage securities and included in collateral debt obligations (CDOs). This transfer of risk from the mortgage originators to the secondary market is an example of the distancing paradigm.

50
“The individual responsibility paradigm” [1]
Another cultural paradigm at play within in the current housing bust is the individual responsibil-ity paradigm. Individuals, as consumers and investors, are part of the economic system and as such do affect the system resilience – at least in the aggregate as consumers or investors.
In the context of the economic system, Jackson’s [1] individual responsibility paradigm translates to the following: The opinion that financial risk is an individual responsibility and fo-cusing on systemic risk problems takes responsibility away from individuals. The housing and mortgage market decline was a trigger to the current economic crisis. With respect to the housing and mortgage crisis, there is debate over what level of responsibility for the various par-ties for the subprime mortgage mess – individuals who obtained mortgages they could not truly afford, or the organizations (public and private) which enabled those high risk subprime mort-gages. Both share responsibility for the mortgage subsystem breakdown, although the organiza-tions (the “experts”) take greater weight due to their advanced expertise.
System Resilience Heuristics
The following sections analyze the resilience of the economic system holistically by the applica-tion of heuristics. The selected heuristics are from Scott Jackson’s, Architecting Resilient Sys-tems [1]. For each heuristic, examples from the economic system are discussed.
“The absorption heuristic – The system should be capable of absorbing a disruption” [1] Note: This section contains material from my SAE-599 Essay #6 [16]. A key heuristic under the system resilience capacity attribute is “the absorption heuristic”, which “states that the system should be capable of absorbing a disruption.” [1] Historically, in recent decades, the U.S. economic system has generally been able to absorb disruptions without the ex-treme measures taken to survive current economic crisis. Successful Absorption of One Kind of Disruption within the Economic System
The FDIC is an example of a system component that lends itself to supporting the avoidance perspective of the resilience of the economic system. In resilience terms, the FDIC was created to prevent cascading bank failures arising from individual bank failure (the “disruption”). Les-sons learned from the Depression era led to the creation of the Federal Deposit Insurance Corpo-ration (FDIC). One characteristic of the Depression era was “the thousands of bank failures that occurred in the 1920s and early 1930s” [18]. That banking crisis was so severe that President Roosevelt had the temporarily closed all the banks to prevent additional runs on the remaining banks. [19] Out of this crisis was the creation of the FDIC. “The Federal Deposit Insurance Corporation (FDIC) is an independent agency created by the Congress that maintains the stabili-ty and public confidence in the nation’s financial system by insuring deposits, examining and supervising financial institutions, and managing receiverships.” [17]
The banking system is a critical component of the U.S. economic system. The ability of the federal banks to seize failing banks supports the resilience of the economic system, not the resi-lience of individual banks. Deposits of failed banks that are seized can either be sold to stronger banks or paid out from the FDIC. There have been notable bank seizures in the current economic crisis. The largest even bank seizure occurred in September 2008, with the seizure of Washing-
51
ton Mutual and its emergency sale to J.P. Morgan Chase. [20] Not everyone is saved when the FDIC moves in on a bank. While depositors are spared major losses, bank “shareholders and some bondholders will be wiped out”. [20]
Evidence of Failure to Absorb a Disruption in the Economic System Evidence of lack of absorption of a disruption to the U.S. economic system is found within the credit markets. The ability to obtain credit fuels the engine of the U.S. economic system. The credit markets are critical elements with the economic system. Within the credit markets, banks lend money to consumers via loans (e.g. mortgage loans, car loans) and also by issuing credit cards. Banks lend money to businesses for both day-to-day operations and for commercial mort-gages. Banks also lend money to each other.
For several years prior to 2006, there was a significant housing market boom period. This housing boom was fueled in part by subprime mortgages. Subprime mortgages are “riskier mort-gages made to people with less-than-perfect credit”. [21] These mortgages were repackaged into different forms and sold to investors on the securities market. This securities market “col-lapsed after these mortgages began defaulting at unexpectedly high rates” [21]. Financial institu-tions had invested heavily in mortgage-based securities. Therefore, the collapse of the mortgage-based security market had a cascade impact on the credit markets. In September 2008 this credit market effectively froze – the crisis “caused banks to stop lending money generally.” [21] This is an example of the economic system failure to meet the absorption heuristic criteria.
“The reorganization heuristic – The system should be able to restructure itself in response to dis-ruptions.” [1] The U.S. government is a key component of the U.S. economic system. Thus, special govern-ment action in response to the current economic crisis falls under the system resilience flexibility attribute. The action by the government falls under the survival perspective – the government is trying “to prevent something bad from becoming even worse” [1]. A few examples are presented here. The first example is the Troubled Asset Relief Program (TARP). The second example is the handling of the potential failure of American International Group (AIG). The third example of restructuring in the economic system involves the investment bank landscape.
The Troubled Asset Relief Program (TARP) was enacted via the “Emergency Economic Sta-bilization Act of 2008” [21]. The Treasury department established TARP as “a voluntary Capital Purchase Program to encourage U.S. financial institutions to build capital to increase the flow of financing to U.S. businesses and consumers and to support the U.S. economy.”[22] The ulti-mate effectiveness of this program is still undetermined. As of early 2009, there has not been suf-ficient easing of the credit markets to restore confidence in the system.
This TARP government program was clearly aimed at the weakness in the resilience of the economic system – namely the credit markets. This is a restructuring, of sorts, within the system. Under the TARP program, the government purchased “senior preferred shares on standardized terms” [22] leading to a government (i.e. tax-payer) ownership stake in the troubled banks who participate in the program. This is not intended to be a permanent “restructuring” – but it does illustrate some flexibility within the economic system as a mechanism for improving system resi-lience.

52
A more dramatic example of restructuring within the system is the case of American Interna-tional Group (AIG). AIG was “one of the world’s biggest companies.”[2] AIG is a huge insur-ance company – insuring both consumers and businesses. It was believed that a true failure of AIG would prove catastrophic to the U.S. In system resilience terms, the failure of AIG would be a disruption that could not be absorbed by the economic system. How AIG came to the brink of failure is symptomatic of the lack of resilience within certain areas of economic system but such discussion is beyond the scope of this paper. What is relevant to this paper is the fact that in March 2009, “the government owned 80% of the company, and [Treasury Secretary] Geithner had just orchestrated AIG's most recent handout — its fourth, if you are keeping score, for $30 billion on March 2 — to prevent the tee-tering insurance giant from going over the cliff and taking the rest of the global financial system with it.”[2] This restructuring of ownership in AIG from private ownership to majority public ownership is an example of the reorganization heuristic for system resilience. To date, the gov-ernment intervention in AIG has been reasonably successful at “preventing something bad from becoming even worse” [1]. As the economic crisis is still ongoing, history will eventually tell us whether these interventions are sufficient to maintain long term economic system resilience.
Another example of restructuring in response to a disruption can be found within the banking industry. The landscape of the financial services industry has significantly changed as a result of this economic collapse. “An investment bank is a financial institution that raises capital, trades in securities and manages corporate mergers and acquisitions.” [27] Commercial banks are banks that have deposits and make loans, both for consumers and businesses. Independent investment banks do not have the same regulatory requirements and oversight that the commer-cial banks do. Prior to the current economic crisis, there were 5 major independent investment banks in the United States. These were Bear Stearns, Lehman Brothers, Morgan Stanley, Merrill Lynch and Goldman Sachs. Today, as fallout of the economic crisis none are standalone invest-ment banks. Bear Stearns collapsed and sold itself to J.P. Morgan Chase in the spring of 2008. Lehman Brothers failed and went bankrupt in the fall of 2008. Merrill Lynch was bought by Bank of America. The other two, Morgan Stanley and Goldman Sachs, transformed themselves into bank holding companies subject to the same regulations as commercial banks. “The diversity heuristic – There should be diversity within systems.” [1] The U.S. economic system is very diverse which tends to support the resilience of the economic system over the long term. In the past this diversity has allowed the economy to recover quicker and limit the damage to the particular sectors impacted. However, in this economic recession di-versity is not providing the normal resilient effect. In this recession, all economic sectors are be-ing negatively impacted to some extent. The benefit from the diversity heuristic within the cur-rent economic crisis is not apparent because the biggest disruptions have occurred within the financial sector. While the original disruption was in the housing market, the resulting secondary disruption in the freeze up of the credit market has rippled out into all economic sectors. Since all sectors are dependent on the financial market in one manner or another, the diversity benefit to-wards system resilience has been negated by a common dependency. “The drift correction heuristic – Drift towards brittleness should be detected and corrected” [1] Note: This section contains reworked material from my Essay #4 [13] based on instructor grad-ing comments [14].

53
The drift correction heuristic should be applied to the economic system. One such drift towards brittleness is drift towards increased risk within the economic system. The topic of risk was dis-cussed earlier within this paper. Another type of drift to consider within the economic system is human reaction to economic problems.
Human reactions to crisis do impact the resilience of systems. While some human reactions are not entirely predictable to unexpected disruptions, others are at least somewhat predictable based on responses to similar disruptions. As we have seen with the current economic crisis, some systems are sensitive to “fear loops”. Fear loops occur when a human fear response to an ongoing system disruption makes the situation worse. The presence of fear loops may impede the process of system recovery from a crisis which weakens system resilience.
Addressing “fear loops” from a system resilience perspective yields a couple of specialized heuristics. The first heuristic focuses on prevention (the proactive heuristic) and the second heu-ristic focuses on containment (the reactive heuristic).
“Take preventive steps to assure that the effects of fear loops are minimized.” [14]
“Take steps to minimize the effects of the fear loop after it has begun.” [14]
One historical example of a “fear loop” causing systemic economic failure was the response to the stock market crash in October 1929. The response was a run on the banks by depositors try-ing to withdraw their money at the same time. “Many banks were unable to satisfy all these de-mands, causing them to fail and contracting the money supply. These failures, in turn, caused many otherwise solvent banks to default, and many companies, deprived of liquidity, were forced into bankruptcy.” [25]
In the case of the U.S. economic system, the current economic crisis illustrates a couple in-stances of “fear loops”, although not as damaging as during the Great Depression. In this eco-nomic collapse, fear has played a part in creating a negative feedback loop that extreme govern-ment action has (so far) not been able to break. Two fear loops have been observed in the current economic crisis – a consumer fear loop and an institutional fear loop. Consumer and institutional fear loops have worsened the disruptive effect of the credit market crisis. These are two distinct fear loops although these loops are not entirely independent.
In the current consumer spending fear loop, consumers are afraid to spend much beyond the necessities. While this behavior is significantly increasing personal U.S. savings (which sounds good), this same lack of consumer spending is hitting many businesses very hard, particularly retail businesses. Business contraction leads to corporate losses which lead to employee layoffs, which leads to more consumers reducing spending (which brings us back to the beginning of the loop).
Institutional fear is exhibited by the lack of credit extended (lending) by the commercial banks to consumers (e.g. home mortgages) and businesses. The banks fear of additional losses has led to a very tight credit market. Potential home buyers can’t get approved for mortgages which leads to further declines in the housing market; which leads to more loan defaults; and so on. In addition, U.S. businesses rely heavily on credit for normal day-to-day operations and for fueling growth. Banks have made such credit much more expensive and difficult to obtain, so weak businesses become worse off leading to layoffs (which also feeds the consumer fear loop) and to bankruptcies - which lead to more bank losses (bringing us back to the beginning of this loop).

54
The first heuristic addresses preventive measures for minimizing the harmful systemic effects of “fear loops”. One such preventive measure is the existence of the Federal Deposit Insurance Corporation (FDIC). Ultimately, the objective of the FDIC is to prevent the same kind of panic that lead to the runs on the banks during the Great Depression. Thus the FDIC improves the sys-tem resilience of the banking subsystem within the overall economic system. Banks are certainly in trouble during this economic crisis, but not in the manner of a fearful run on the banks by de-positors.
Another proactive mechanism for slowing down negative “fear loops” is the stock market circuit breakers. “The circuit breakers provide for cross-market trading halts during a severe market decline as measured by a single day decrease in the Dow Jones Industrial Average (DJIA). There are three circuit breaker thresholds—10%, 20%, and 30%—set by the markets at point levels that are calculated at the beginning of each quarter.”[15] Interestingly, these circuit breakers have not been triggered by the current economic crisis as the harshest stock market drops occurred over multiple days.
The second fear heuristic targets containment of the damage from “fear loops”. The resilient system would have a method to either break the “fear loops” or slow down the negative feedback impact. Slowing down the negative impact may allow the system to reach its new equilibrium or may just buy time to come up with way to break the loop.
The ability of governments to step in and close the stock markets in response to external dis-ruption is another example of a reactive mechanism. The closure of the stock markets is to pre-vent runaway declines in the market due to investor fear. One such example was the U. S. stock market closure for several days after the 9/11/2001 terrorist attacks.
In the current U. S. economic crisis, the government has taken a number of steps to break the credit market fear loop and the consumer spending fear loop. For example, the Troubled Assets Relief Program (TARP) is one mechanism the government has been using to break the credit market free.
Another government response to minimize the effects of the consumer fear loop was a spe-cial tax rebate program. In 2008, the government sent out tax rebate check trying to stimulate the consumer spending. To date, the government action has not been very successful, which is symp-tomatic of the current weakness of the economic system. Recipients of the tax rebates were more likely to put the money towards savings or pay down debt, which did little to help an economic recovery.
“The hidden interaction heuristic – Avoid hidden interactions” [1] For an economic system to be resilient, the economic system requires transparency. Transparen-cy is one mechanism for avoiding hidden interactions within the system. Lack of transparency within one significant area has contributed to the severity of the current economic crisis.
Credit Default Swaps are another exotic new financial product that is not truly transparent within the financial market. “Credit default swaps are insurance-like contracts that promise to cover losses on certain securities in the event of a default.” [9] In 2007, the credit default swap market was estimated at “more than $45 trillion” [9] and at the time, was “roughly twice the size of the U.S. stock market.” [9] The problem with the CDS market is that it is not transparent; there is no central clearing house for CDS contracts like there is for publically traded stocks. In part due to the lack of public market, and therefore lower liquidity mechanisms, credit default swaps have contributed to the credit market troubles.

55
Transparency is both a culture issue and a technical issue. Transparency is a cultural element within the economic system because the natural tendency is for secrecy in order to gain advan-tage over competitors. This tendency towards secrecy is overcome in part by regulations, such as the reporting requirements under the Securities and Exchange Committee (SEC) for publically traded stocks. The technical aspect to the transparency issue is the how to make the interactions visible. For publically traded stocks, the technical mechanism for achieving transparency is the stock exchanges.
Summary This paper analyzed system resilience concepts as they applied to the U.S. economic system. While the economic system has been resilient over the long term, the severity of the current eco-nomic crisis is the result of weakened system resilience in several key areas. Weakened system resilience of the economic system has contributed to the severity and extended duration of the current economic crisis.
The economic crisis was caused by several related disruptions. The initial disruption to the economic system that led to the current economic crisis was the housing market collapse. A closely related secondary disruption was the collapse in the subprime mortgage market. The sub-prime mortgage market crisis eventually triggered the tightened credit markets. These disruptions in the financial sector of the economic system have rippled through the entire economic system.
The analysis of the infrastructure of the economic system identified post positive and nega-tive contributions towards system resilience. The financial services industry plays a central role in the U.S. economic system. One positive contribution towards system resilience is the ability of government organizations set policies and laws that monitor and regulate the systemic risk with-in the economic system. Ensuring the resilience of the economic system requires dealing with system risk is critical. On the negative side, the lack of sufficient regulatory controls exists with-in the Credit Default Swaps market contributes towards systemic risk concerns.
Cultural aspects of system resilience of the economic system were analyzed within this pa-per. This section looked cultural elements that had negative contributions towards the resilience of the economic system. “The culture of the economic system is not one that has a “preoccupa-tion with failure” [1]. The “deference to expertise” cultural end state was illustrated to be a double edged sword for the system resilience of the economic system. “The distancing para-digm” [1] was shown to have weakened the system resilience of the economic system. The con-flict inherent in “the individual responsibility paradigm [1] contributed the mortgage crisis which was the trigger to the current economic crisis. ” [10]
A number of heuristics were used to analyze the system resilience of the economic system. Both positive and negative contributions towards system resilience were discussed in the analysis of the absorption heuristic. On the positive side, the ability of the U.S. government to take bold action was discussed under the reorganization heuristic. While the capability to restructure the elements within the economic system does benefit system resilience, only history will be able to tell the effectiveness of the steps taken in response to the economic system. The economic sys-tem diversity was briefly discussed under the heuristic that states “there should be diversity with-in systems”. [1] Addressing fear loops within the economic system was addressed under the drift correction heuristic. The last heuristic discussed was the hidden interactions heuristic.

56
References: [1] Jackson, Scott. 2008. Architecting Resilient Systems: Accident Avoidance and Survival and Recovery form Disruptions (12/15/2008 Draft). John Wiley & Sons, Inc. [2] Saporito, Bill. 2009. “How AIG Became Too Big to Fail”, TIME, Vol. 173, No. 12, March 30, 2009. [3] Hagerty, James R., 20 January 2009 9:32 A.M. ET, “Fannie, Freddie Strive to Serve Housing Market, Taxpayers”, Wall Street Journal Online, http://online.wsj.com/article/SB123240735507895707.html [4] Hagerty, James R., 28 July, 2007. “Fannie, Freddie Are Said To Suffer in Subprime Mess”, Wall Street Journal Online, http://online.wsj.com/article/SB118554604207880334.html [5] Patterson, Scott. 13 August 2007 “Default Swaps Could Magnify Credit Crisis”, Wall Street Journal Online, http://online.wsj.com/article/SB118696485313895568.html [6] Shwiff, Kathy. 18 March 2009 2:55 P.M. ET, “S&P Cuts Ratings on CDOs”, Wall Street Journal Online, http://online.wsj.com/article/SB123739495898172945.html [7] Taylor, John B., 9 February 2009, “How Government Created the Financial Crisis”, Wall Street Journal Online, http://online.wsj.com/article/SB123414310280561945.html [8] CRMPG III, 6 August 2008, “Containing Systemic Risk: The Road to Reform”, www.crmpolicygroup.org/docs/CRMPG-III.pdf [9] Morrissey, Janet. 17 March 2008, “Credit Default Swaps, the Next Crisis?” TIME, http://www.time.com/time/business/article/0,8599,1723152,00.html [10] Michener, Robin. 6 April 2009. SAE-599 Architecting System Resilience Essay #5, “Analy-sis of Culture Impact on the System Resilience of the Economic System”. [11] NYSE Group, Inc., June 2006, “A Guide to the NYSE Marketplace”, Edition II. http://www.nyse.com/pdfs/nyse_bluebook.pdf [12] Makinen, Gail (Coordinator). 27 September 2002. “The Economic Effects of 9/11: A Re-trospective Assessment.” Congressional Research Service. http://www.fas.org/irp/crs/RL31617.pdf [13] Michener, Robin. 23 March 2009. SAE-599 Spring Essay #4, “Introducing the Avoid Fear Heuristics for System Resilience.” [14] Jackson, Scott. March 2009. From grading comments made on my SAE-599 Essay #4 (ref-erence 13). [15] “Circuit Breakers and Other Market Volatility Procedures”, U.S. Securities and Exchange Commission, http://www.sec.gov/answers/circuit.htm, most recently accessed on 3/23/09 [16] Michener, Robin. 20 April 2009. SAE-599 Spring Essay #6. [17] FDIC Mission, Vision, and Values, http://www.fdic.gov/about/mission/index.html, last viewed: 4/19/09 [18] FDIC, “History of the FDIC”, http://www.fdic.gov/about/history/index.html, last viewed: 4/19/09. [19] Roosevelt, F.D., March 12, 1933. Transcript of Speech by President Franklin D. Roosevelt Regarding the Banking Crisis, http://www.fdic.gov/about/history/3-12-33transcript.html, Last Viewed: 4/19/09 [20] Dash, E., Sorkin, A.R., 25 September 2008 “Government Seizes WaMu and Sells Some As-sets”, New York Times, http://www.nytimes.com/2008/09/26/business/26wamu.html?hp, last viewed: 4/19/09 [21] Nothwehr, Erin. December 2008. “Emergency Economic Stabilization Act of 2008”, http://www.uiowa.edu/ifdebook/issues/bailouts/eesa.shtml, last viewed: 4/19/09

57
[22] HP-1207 Treasury Announces TARP Capital Purchase Program Description, October 14, 2008. http://www.treas.gov/press/releases/hp1207.htm. Last viewed: 4/19/09 [23] Watts, Michael, Ph.D. United States Economy, MSN Encarta. http://encarta.msn.com/text_1741500821___0/United_States_Economy.html, Text downloaded on 4/20/09 [24] Williams, Orice W., 5 March 2009, GAO-09-397T, Systemic Risk: Regulatory Oversight and Recent Initiatives to Address Risk Posed by Credit Default Swaps. http://www.gao.gov/new.items/d09397t.pdf [25] Schwarcz, Steven L., 2008, Systemic Risk, The Georgetown Law Journal, Vol. 97:193, http://www.georgetownlawjournal.org/issues/pdf/97-1/Schwarcz.PDF [26] Labaton, Stephen. 15 September 2008, “Wall St. in Worst Loss Since ’01 Despite Reassur-ances by Bush, The New York Times, http://www.nytimes.com/2008/09/16/business/16paulson.html [27] Definition obtained from http://en.wikipedia.org/wiki/Investment_banking. Viewed: 04/24/09 [28] Reddy, Sudeep. 15 April 2008. “Jobless Rate Hits 8.5%”, the Wall Street Journal. http://online.wsj.com/article/SB123876121625986405.html [29] Enrich, David, et al., 20 April 2009, “Bank Lending Keeps Dropping”, And The Wall Street Journal. [30] Faber, David. CNBC correspondent, “House of Cards”. Watched on March 15, 2009.

58
Tire Pressure Monitoring Systems - Evaluation of Safety, Cost and System Resilience by Darin Mika, [email protected] Abstract Tire Pressure Monitoring Systems (TPMS) are now mandated by Federal law for all new ve-hicles sold in the United States. This regulation, Federal Motor Vehicle Safety Standard (FMVSS) No. 138, defines requirements for systems intended to improved safety by enhancing operators’ awareness of their tire inflation pressure. Adequate tire pressure results in improved vehicle control and makes vehicles more resilient to other failure modes. Impact analyses per-formed by the National Highway Traffic Safety Administration (NHTSA) indicate these systems are not likely to be cost effective but will reduce injury and fatality rates. A review of existing systems as well as advanced systems currently in development was performed to determine which system solution is best considering safety, cost, and resilience to disruptions. Systems are evaluated and ranked using the NHTSA impact analysis with corrections to account for resi-lience to a variety of disruptions. The optimal system configuration is identified and recommen-dations are made to improve FMVSS 138 to best accomplish the intent of the Transportation Re-call Enhancement, Accountability, and Documentation (TREAD) Act. Introduction The TREAD Act was enacted by the US Congress in response to reports of 268 fatal crashes due to tread separation on certain Firestone tires installed on Ford Sport Utility Vehicles (SUVs) and trucks1. The TREAD Act established new safety requirements for tires and included a require-ment for the NHTSA to develop regulations for “a warning system in new motor vehicles to indi-cate to the operator when a tire is significantly underinflated”2.
Based on a survey conducted in February 2001, 26% of vehicles on the road have at least one significantly underinflated tire3. Underinflated tires contribute to an increased accident rate due to reduced vehicle control, increased stopping distances, reduced resistance to hydroplaning, and increased risk of flat tires and blowouts4.
Tire pressure monitoring systems have the potential to improve the resilience of the “vehicle system” by enhancing awareness of pressure condition and providing advanced warning before a tire becomes dangerously low on air. TPMS have the potential to positively impact all three of the disruption phases identified by Jackson5:
1. Avoidance: by providing the status of tire pressure in real-time to the operator, corrective action can be taken before the situation gets worse. This addresses the heuristic “the op-erator should be informed” and “drift towards brittleness should be detected and cor-rected”6.
2. Survival: a timely low pressure warning will help the operator take appropriate action be-fore the occupants and/or vehicle are harmed. This may entail installing a spare tire, changing the route, and/or driving more cautiously until the condition can be corrected.

59
3. Recovery: tires are relatively low cost and easy to replace. The sooner a leak is detected, the greater the chance that the tire can be repaired. Inexpensive recovery is much more likely with an early warning.
The NHTSA estimates that implementation of a Tire Pressure Monitoring System (TPMS) on all light vehicles will result in 121 fewer fatalities and eliminate or reduce the severity of 5,868 inju-ries each year4. NHTSA regulations require a TPMS to be installed on all new vehicles that have a gross vehicle weight rating of 10,000 lb or less, except those vehicles with dual wheels on an axle, per the phase-in schedule in Table 1.
Table 1: Tire Pressure Monitoring System Phase-In Schedule per FMVSS 1387 Manufacturer Type Excepted Sec-
tions Percentage Complying
Period of Production Vehicles Manufactured
Large Volume S4.4 & 4.5 (See note 1 be-low)
20% October 5, 2005 – August 31, 2006 70% September 1, 2006 – August 31, 2007
None All On and after September 1, 2007
Small volume NA 0% October 5, 2005 – August 31, 2006 None All On and after September 1, 2007
Final-stage and vehicle alterers
NA 0% October 5, 2005 – August 31, 2006 None All On and after September 1, 2008
Note 1: S4.4 refers to TPMS malfunction indicator functionality. S4.5 refers to written instructions describing TPMS malfunction indicator description to be included in the owner’s manual.8 The Federal Motor Vehicle Safety Standard (FMVSS) 138 was originally issued under a Notice of Proposed Rulemaking (NPRM) on July 2001. This prior issuance allowed for a reduced trig-ger threshold, 30%, and only required operation when one tire was underinflated. This would have allowed existing indirect systems to pass the standard. But a lawsuit brought about by the Center for Auto Safety and Public Citizen Inc. resulted in the following Court of Appeals deci-sion: tire pressure monitoring systems must be capable of detecting one or any combination of underinflated tires.4 This change resulted in first generation indirect systems to be non-compliant. However, in order to evaluate the efficacy of the court decision, a non-compliant first generation indirect system is included in this analysis.
The NHTSA final regulatory impact analysis performed for tire pressure monitoring systems is used as a basis for this analysis. While comprehensive in its traditional approach to safety and economics, the NHTSA analysis is lacking in the following ways:
1. Does not adequately address the impact of long term latent failure modes 2. Assumes operator will maintain system so that it is always operational 3. Does not account for the impact of tire maintenance services 4. Does not account for unusual, but expected, disruptions
A modification to the NHTSA analysis was performed to address these shortcomings. by ad-dressing these resilience issues, the true effectiveness of TPMS can be assessed and the system that best addresses the problem, underinflated tires, can be determined. Table 2 provides a brief overview of the TPMS configurations being evaluated for safety, cost, and resilience to disrup-tions.
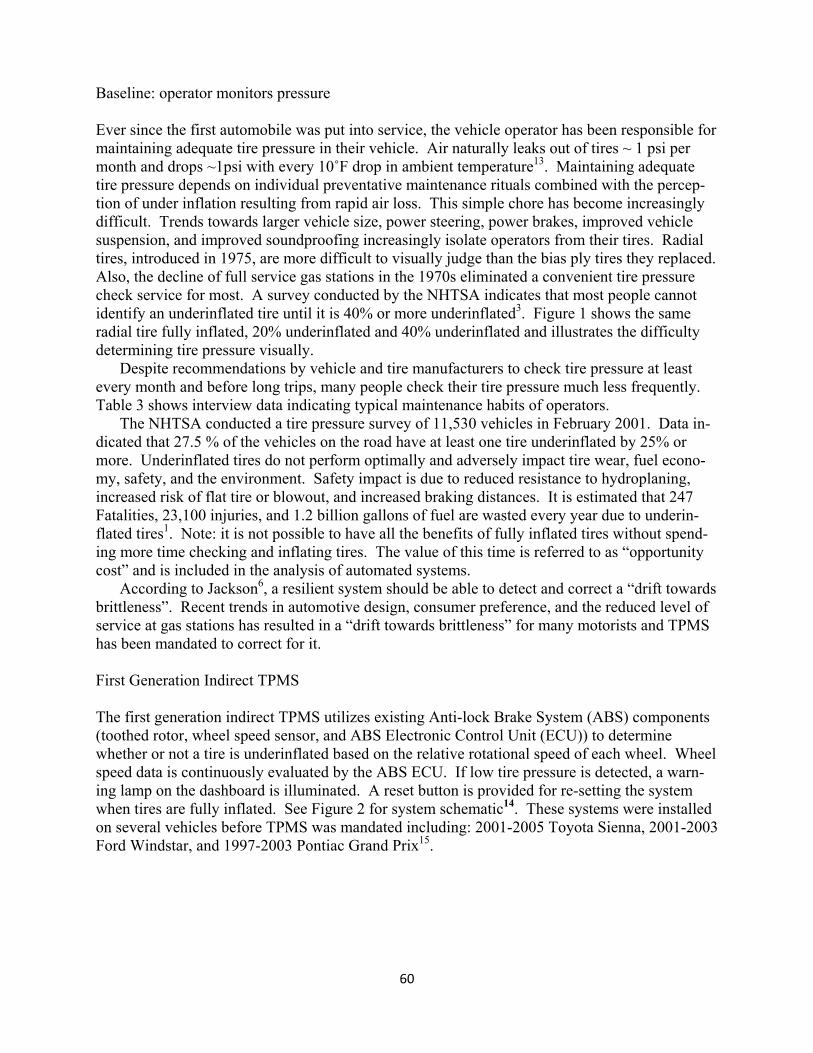
60
Baseline: operator monitors pressure Ever since the first automobile was put into service, the vehicle operator has been responsible for maintaining adequate tire pressure in their vehicle. Air naturally leaks out of tires ~ 1 psi per month and drops ~1psi with every 10˚F drop in ambient temperature13. Maintaining adequate tire pressure depends on individual preventative maintenance rituals combined with the percep-tion of under inflation resulting from rapid air loss. This simple chore has become increasingly difficult. Trends towards larger vehicle size, power steering, power brakes, improved vehicle suspension, and improved soundproofing increasingly isolate operators from their tires. Radial tires, introduced in 1975, are more difficult to visually judge than the bias ply tires they replaced. Also, the decline of full service gas stations in the 1970s eliminated a convenient tire pressure check service for most. A survey conducted by the NHTSA indicates that most people cannot identify an underinflated tire until it is 40% or more underinflated3. Figure 1 shows the same radial tire fully inflated, 20% underinflated and 40% underinflated and illustrates the difficulty determining tire pressure visually.
Despite recommendations by vehicle and tire manufacturers to check tire pressure at least every month and before long trips, many people check their tire pressure much less frequently. Table 3 shows interview data indicating typical maintenance habits of operators.
The NHTSA conducted a tire pressure survey of 11,530 vehicles in February 2001. Data in-dicated that 27.5 % of the vehicles on the road have at least one tire underinflated by 25% or more. Underinflated tires do not perform optimally and adversely impact tire wear, fuel econo-my, safety, and the environment. Safety impact is due to reduced resistance to hydroplaning, increased risk of flat tire or blowout, and increased braking distances. It is estimated that 247 Fatalities, 23,100 injuries, and 1.2 billion gallons of fuel are wasted every year due to underin-flated tires1. Note: it is not possible to have all the benefits of fully inflated tires without spend-ing more time checking and inflating tires. The value of this time is referred to as “opportunity cost” and is included in the analysis of automated systems.
According to Jackson6, a resilient system should be able to detect and correct a “drift towards brittleness”. Recent trends in automotive design, consumer preference, and the reduced level of service at gas stations has resulted in a “drift towards brittleness” for many motorists and TPMS has been mandated to correct for it. First Generation Indirect TPMS The first generation indirect TPMS utilizes existing Anti-lock Brake System (ABS) components (toothed rotor, wheel speed sensor, and ABS Electronic Control Unit (ECU)) to determine whether or not a tire is underinflated based on the relative rotational speed of each wheel. Wheel speed data is continuously evaluated by the ABS ECU. If low tire pressure is detected, a warn-ing lamp on the dashboard is illuminated. A reset button is provided for re-setting the system when tires are fully inflated. See Figure 2 for system schematic14. These systems were installed on several vehicles before TPMS was mandated including: 2001-2005 Toyota Sienna, 2001-2003 Ford Windstar, and 1997-2003 Pontiac Grand Prix15.

61
Table 2: TPMS Configurations to be evaluated System Description Features Example of
vehicle with system
Complies with
FMVSS 138?
Comments
NO TPMS Periodic manual check using pressure gage
N/A NO Baseline Case
1st generation Indirect
Measures tire pressure indirectly via tire rotational velocity change
2001-2005 Toyota Sien-
na9
NO Detects 20%-30% under inflation, one tire and diagonal tires
2nd generation Indirect
Measures tire pressure indirectly via tire rotational velocity and stability control system sensors
To be intro-duced on 2011
Audi10
YES In development. Identifies low tire(s)
Direct with low pres-sure warning
Measures tire pressure directly via sensor in tire
2006-2009 Toyota Prius11
YES Widely used now
Direct with digital pres-sure display
Measures tire pressure directly via sensor in tire
2009 Dodge Challenger,
EVIC* equipped12
YES Widely used now
Direct, battery-less with digital pressure display
No battery, very low profile TBD YES In development
* EVIC = Electronic Vehicle Information Center
Figure 1: Photos of Tire Fully Inflated and Underinflated13

62
Table 3: Results of Tire Pressure Check Frequency Survey3 Frequency of Tire Pressure Check Reported Percentage of Drivers surveyed
Weekly 9% Monthly 24%
When they seem low 25% When Serviced 28%
Before a Long Trip 2% Other 7% Never 5%
Figure 2: Schematic of 1st Generation Indirect TPMS First generation indirect systems have limitations: they cannot detect when all tires are equally underinflated, they cannot detect low pressure when two tires are low on the same side of the ve-hicle or two tires are low on the same axle, and the tire must experience a 20% to 30% pressure drop in order to be detected. Also these systems require 10-20 minutes of drive time to detect a pressure loss3. A 60.9% effectiveness factor was used in the following analysis in order to ac-count for not being able to detect multiple tires being underinflated. Calculation of this factor is as shown in Table 4. Data is based on a February 2001 NHTSA tire pressure survey3.
First generation indirect systems do not meet FMVSS 138 requirements because they cannot detect all possible under inflation scenarios. Automakers phased out these systems and replaced them with direct systems to meet the FMVSS 138 requirement. Second Generation Indirect TPMS The second generation indirect TPMS is similar to the first generation in that it relies on the ABS system for tire rotation speed data but also utilizes electronic stability control sensor data to as-sess tire inflation pressure. This system is fully compliant with FMVSS 138 requirements. It can identify which tire is low on air, works when any one or combination of tires are low on air and can detect a 25% pressure drop. A separate TPMS ECU is required to process the data. This system provides improved performance over the first generation system by improving soft-ware and hardware capability, but is more expensive due to more complex software and hard-ware. It is planned to be offered on all Audi vehicles by the 2011 model year.10 See figure 3 for a second generation indirect TPMS schematic.

63
Table 4: Probability of Various Combinations of Tires Being Underinflated
Condition Probability Detected? (Y/N) Prob. detected One tire underinflated 52.2% Y 52.2% Two tires underinflated- same side 8.7% N 0 Two tires underinflated- same axle 8.7% N 0 Two tires underinflated- diagonal 8.7% Y 8.7% Three tires underinflated 10.4% N 0 All four tires underinflated 11.3% N 0
Total: 100% 60.9%
Figure 3: Second Generation Indirect TPMS System Schematic
Direct TPMS- Battery Powered Sensor in Tire The typical direct TPMS consists of battery powered pressure sensors and transmitters mounted in each wheel, a receiver to read the sensor signals, a TPMS ECU, and a dashboard warning symbol that is illuminated to alert the operator of a low pressure condition. See Figure 4 for a typical TPMS schematic15.
Figure 4: Typical Direct TPMS Schematic

64
The direct TPMS has the advantage of quick response to pressure loss (~10 seconds), accuracy within ±1 psi, the ability to identify which tire is low on air, and the ability to display the actual pressure of each tire.
The direct TPMS is more accurate than indirect systems but is more complex, more expen-sive, and more prone to break down than the indirect systems because it has sensors in the harsh environment inside each tire, and each sensor utilizes limited life batteries. Other disadvantages:
• Higher maintenance costs due to limited life batteries. Batteries are expected to last 7 to 10 years. Entire sensor module must be replaced when batteries are depleted.
• Sensor/transmitters inside tire can be damaged due to o Tire removal / installation o Tire is run flat o Environmental exposure (stem is aluminum instead of rubber) o Dynamic & centrifugal loads
• Potential it will not work with replacement tires due to carbon content in tire and steel plies in sidewall.
• Battery life is adversely affected by extreme cold and extreme hot weather • If snow tires are used sensors/transmitters must be moved to the snow tires or additional
sensors installed in the snow tires. This increases seasonal tire change service fees. • Requires recalibration with special tool upon rotating tires or changing out sensor
Due to these disadvantages, the direct TPMS has lower reliability than the indirect systems. It is more likely to be inoperative at some time during the life of the vehicle. Direct TPMS- Without Batteries A direct TPMS that does not use batteries has been developed by ALPS Electric and is currently being set up for mass production 16. It is similar to the direct TPMS with batteries except the tire pressure sensor/transmitters inside the tires are replaced with tire pressure sensors/transponders and the tire pressure receiver is replaced with a tire pressure transceiver. Energy from the tran-sceiver is utilized by the transponders to measure tire pressure and transmit a signal back to the transceiver. See Figure 5 for direct TPMS schematic17.
Figure 5: Battery-less Direct TPMS Schematic

65
This system will have a higher initial cost than direct TPMS with batteries due to higher com-plexity but lower maintenance expense because there are no batteries to wear out. Also, the sen-sor module is lighter (6 grams vs. 28 grams for battery powered sensors18) so it is less prone to damage in the dynamic environment inside the tire and is less sensitive to temperature extremes. Overall, this system is an improvement over a direct TPMS with batteries, but still has many of the same disadvantages due to installation of sensors inside the tires:
• Sensor/transponders inside tire can be damaged due to o Tire removal / installation o Tire is run flat o Environmental exposure (stem is aluminum instead of rubber) o Dynamic & centrifugal loads
• Potential it will not work with replacement tires due to carbon content in tire and steel plies in sidewall.
• If snow tires are used sensors/transmitters must be moved to the snow tires or additional sensors installed in the snow tires. This increases seasonal tire change service fees.
• Requires recalibration with special tool upon rotating tires or changing out sensor Although improved over direct TPMS with batteries, this system will have a lower reliability and is more likely to be inoperative at some time during the life of the vehicle than indirect systems. Latent Failure Modes The primary rule for the design of any safety system is “First do no harm!” 19. Any add-on safe-ty system must not create harm out of proportion to the benefits it provides. Since tire pressure monitoring systems automate the chore of routine tire pressure checks, more operators will neg-lect tire maintenance since they believe that the TPMS would warn them if they needed to inflate their tires. This behavior will not have any adverse impact unless the system experiences a latent failure mode. For example, if the operator trusts the system to alert them when they need to add air and the system fails, the operator may not check tire pressure until after a serious problem occurs. The later condition is worse than before the safety system was added due to the operator having a false sense of security.
The requirement for a Malfunction Indicator Light (MIL) in FMVSS 138 directly addresses this issue but falls short in two areas: it does not specify how effective and reliable it must be, and it allows for a loophole during phase in. A MIL is not required on vehicles sold by large volume producers from Oct 5, 2005 to Aug 31, 2007. This extra time was allowed for incorpora-tion of a MIL because the NHTSA did not establish the requirement for a MIL until September 2004 and vehicle manufacturers needed more time to implement it into their production lines. Not wanting to delay the benefits of the tire pressure monitoring systems, the NHTSA allowed this exemption. By doing this they violated the automated system monitoring heuristic: “the hu-man operator should be able to monitor the automated system”.6
Assuming that manufacturers took advantage of this loophole, approximately 13.3 million vehicles may have been built without MIL capability. This calculation follows.
Calculation of the quantity of TPMS equipped vehicles that may have been built without a MIL:

66
Assumptions: 1. 17 M vehicles were sold each year (approx. 1.42 M vehicles per month) 2. 20% of vehicles produced between Oct 5, 2005 and August 31, 2006 had TPMS
without MIL capability (an 11 month time span) 3. 60% of vehicles produced between Sept 1, 2006 and August 31, 2007 had TPMS
without MIL capability (a 12 month time span)
Number of vehicles that probably were built without MIL capability = 1.42M vehicles per month x [(11 months x 20%) + (12months x 60%)] = 13.3M
The estimated 13.3 million vehicles on the road that have TPMS without MIL capability will en-joy safety benefits until the TPMS fails. Since this will be a latent failure mode, at that time these vehicles become less safe than vehicles without TPMS because their owners will be “trained” to rely on the system to monitor the pressure in their tires. This will be an increasing problem as these vehicles age and system failures increase. Corrective action should be taken to address this problem such as warning owners about the issue and advising owners to routinely check the functionality of their TPMS.
Assuming a malfunction indicator is provided with the TPMS, latent failure modes are not possible unless one of these conditions is present:
1. Malfunction indicator system itself fails 2. TPMS fails in a way that is undetected by the malfunction indicator system
It is not possible to accurately estimate the probability of either one of these conditions occurring because it is dependent on the specific vehicle manufacturer’s TPMS design. The NHTSA as-sumed in their impact analysis that an average of 1% of all TPMS will have one of these failures occur during its service life. They attempted to address the possibility of malfunction indicator system failures by requiring the following notice be included verbatim in the owner’s manual of vehicles with TPMS:
“Each tire, including the spare (if provided), should be checked monthly when cold and inflated to the inflation pressure recommended by the vehicle manufac-turer on the vehicle placard or tire inflation pressure label… Please note that the TPMS is not a substitute for proper tire maintenance, and it is the driver’s responsibility to maintain correct tire pressure, even if under-inflation has not reached the level to trigger illumination of the TPMS low tire pressure telltale.”4
It is unlikely that this notice in the owners’ manual will be effective at modifying the behavior of motorists by preventing them from relying on their TPMS. In response to these issues, minimum requirements for MIL system capability and reliability should be established by the NHTSA, and failure rates of MIL systems should be monitored so that unreliable systems can be identified and repaired. No adjustment to the NHTSA’s TPMS impact analysis results were made due to the potential for latent failure modes even though systems without a MIL capability are likely to be much more prone to latent failures than the 1% assumed by the NHTSA. The anomalous sys-tems without malfunction indicator capability are not considered further in this analysis.

67
Disabled Systems Reputable automotive service providers will not knowingly disable a TPMS because they know it is illegal for them to disable a federally mandated safety system. According to U.S.C 30122(b):
“A manufacturer, distributor, dealer, or motor vehicle repair business may not knowingly make inoperative any part of a device or element of design installed on or in a motor vehicle or motor vehicle equipment in compliance with an applica-ble motor vehicle safety standard” 4
Vehicle owners, however, may disable their TPMS for reasons as diverse as the people that own and operate vehicles. All it takes is a strategically placed 1/2 inch piece of black electrical tape. It is plausible that operators will disable their TPMS or ignore their TPMS warning light for the following reasons:
1. Not willing to pay for repairs after a. Out of warranty TPMS failure
i. Batteries wear out (direct systems only) ii. Pressure sensor module fracture (direct systems only)
iii. Valve stem failure (direct systems only) iv. Vehicle is near the end of its service life v. Other system failure
b. Drive on a flat tire (direct systems only) c. Operator uses aerosol tire inflation / sealant product to inflate tire (direct systems
only) 2. Not willing to pay for additional set of sensors to install in snow tires (direct systems on-
ly) 3. Installs incompatible tires (direct systems only) 4. Installs incompatible spare tire 5. Perceives that low pressure warning is erroneous and doesn’t get it diagnosed
a. Manual check fails to find low tire i. Uses inaccurate pressure gage
ii. Trigger pressure incorrect iii. TPMS malfunction
6. Operator is annoyed a. Pressure warning too often
i. Trigger pressure is too close to recommended (placard) pressure ii. TPMS malfunction
iii. Wide temperature change during operation 7. Attitude predisposed against government mandates
Several factors that improve the operational reliability of tire pressure monitoring systems are within the control of manufacturers and the NHTSA. The following actions would improve the probability that these systems will be operational:

68
1. Many of the TPMS failure modes are only applicable to direct systems. Therefore the NHTSA should incentivize manufacturers to use indirect tire pressure monitoring sys-tems because indirect systems have fewer failure modes. This can be accomplished by requiring manufacturers provide extended warranty coverage to consumers.
2. Pressure in tires will vary due to atmospheric conditions, ambient temperature changes, and rolling friction. If the TPMS warns the operator too frequently of low tire pressure when there is no serious condition that needs to be immediately corrected, the operator may ignore or disable the system out of frustration. The NHTSA should establish a min-imum threshold for low pressure warning. The optimal trigger pressure, with appropriate tolerance, should be established by the NHTSA based on behavioral studies and consid-eration of potential temperature extremes.
3. The probability that operators will repair their TPMS systems when it fails is inversely related to the cost of tire pressure monitoring components, especially tire mounted sen-sors. NHTSA should incentivize the automotive industry to establish design standards for direct tire pressure sensors to help minimize repair cost.
The NHTSA did not account for disabled systems in their final TPMS impact assessment. An estimate of the probability of these events occurring has been performed and is included in Ap-pendix A. Results of this analysis are summarized in Table 5.
Table 5: Estimate of Operator Disable Issues to TPMS Effectiveness System Configuration Ave. System Effectiveness over Vehicle Life
Indirect 92.6% Direct: battery-less 80.0% Direct: with battery 69.3%
Tire Service The automotive tire service industry is complex. There are many sales and service options avail-able: automobile dealers, department stores, major brand tire dealers, independent tire dealers, and service stations. Each option has a different level of oversight and control by the NHTSA and automobile manufacturer. Figure 6 illustrates the number of organizations involved in ser-vicing tires and tire pressure monitoring systems. It shows the potential for problems that could occur as aftermarket manufacturers enter the high volume direct pressure sensor market.
According to Jackson6, “the point of greatest potential weakness is at the interfaces”. In this case, many interfaces are weak due to limited oversight and poor requirements flow. Some of these organizations will not cooperate because they are in direct competition with each other. There are many weak interfaces leading to the aftermarket manufacturer that may result in TPMS performance and/or reliability problems. Direct tire pressure monitoring systems have the great-est risk of problems due to tire maintenance because the pressure sensors are vulnerable to dam-age during tire service and because they include limited-life batteries.
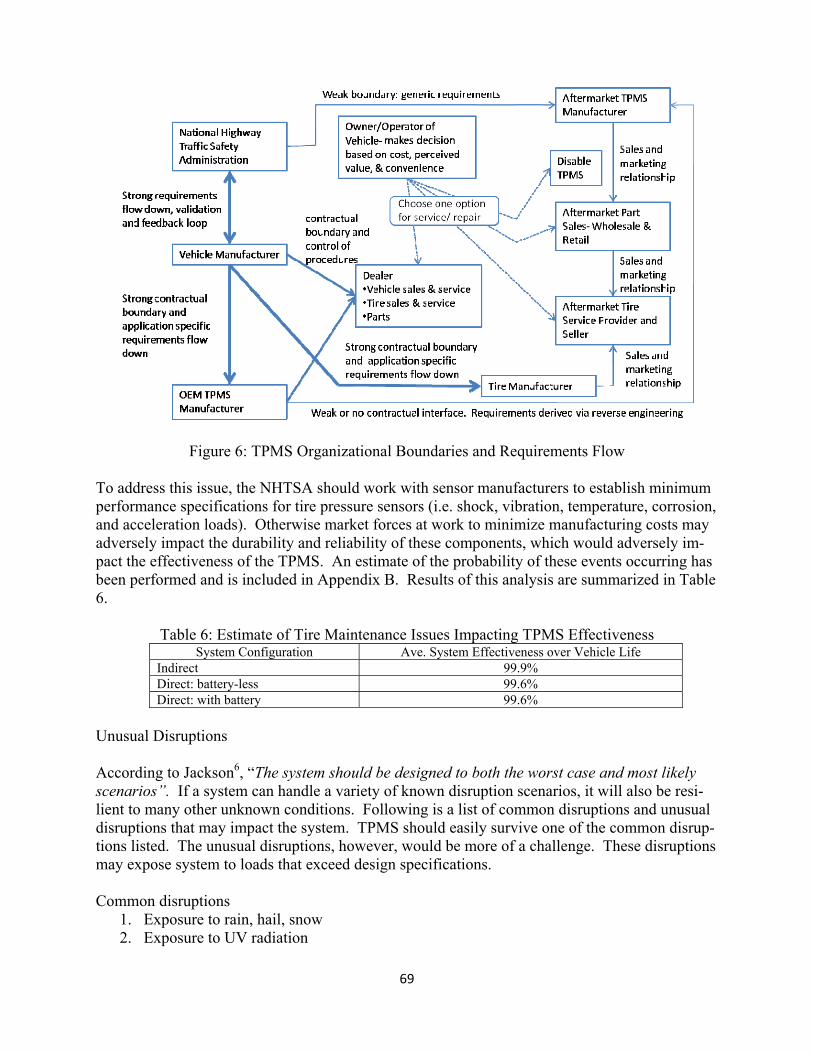
69
Figure 6: TPMS Organizational Boundaries and Requirements Flow To address this issue, the NHTSA should work with sensor manufacturers to establish minimum performance specifications for tire pressure sensors (i.e. shock, vibration, temperature, corrosion, and acceleration loads). Otherwise market forces at work to minimize manufacturing costs may adversely impact the durability and reliability of these components, which would adversely im-pact the effectiveness of the TPMS. An estimate of the probability of these events occurring has been performed and is included in Appendix B. Results of this analysis are summarized in Table 6.
Table 6: Estimate of Tire Maintenance Issues Impacting TPMS Effectiveness System Configuration Ave. System Effectiveness over Vehicle Life
Indirect 99.9% Direct: battery-less 99.6% Direct: with battery 99.6%
Unusual Disruptions According to Jackson6, “The system should be designed to both the worst case and most likely scenarios”. If a system can handle a variety of known disruption scenarios, it will also be resi-lient to many other unknown conditions. Following is a list of common disruptions and unusual disruptions that may impact the system. TPMS should easily survive one of the common disrup-tions listed. The unusual disruptions, however, would be more of a challenge. These disruptions may expose system to loads that exceed design specifications. Common disruptions
1. Exposure to rain, hail, snow 2. Exposure to UV radiation

70
3. Solar heating 4. Exposure to cleaning detergent and high pressure spray 5. Driving vehicle off-road 6. Temperature Cycling 7. Acceleration loads due to driving at maximum legal speed limits +20 mph
Unusual disruptions
1. Freezing rain while parked, then break free and drive off 2. Soak tire and rim repeatedly in water due to driving through wash and flood 3. Drive through 1 foot icy snow bank 4. Physical shock from curbing wheel 5. Extreme off-road use 6. Extreme high ambient temperatures 7. Vehicle parked near fire, exposed to heat and thermal radiation 8. Brake malfunction causing brake drag and brake overheat 9. Racing causing brake overheat 10. Drive at excessive speed
An estimate of the impact of these unusual disruptions was performed for indirect TPMS, direct TPMS with batteries, and direct TPMS without batteries. These estimates are based on discus-sions with local tire service departments and a sampling of TPMS problems reported by owners on the internet. Results of this evaluation are detailed in Appendix C and summarized in Table 7. This analysis shows that the indirect tire pressure monitoring systems have an advantage over direct systems when exposed to unusual disruptions.
Table 7: Estimate of TPMS Effectiveness Due to Other Disruptions System Configuration Ave. System Effectiveness over Vehicle Life
Indirect 99.7% Direct: battery-less 95.7% Direct: with battery 94.3%
Safety and Cost Effectiveness Table 8 summarizes effectiveness factors determined previously for each TPMS configuration and shows the NHTSA estimate of annual fatality reduction. Also shown is a corrected estimate of fatality reduction after accounting for the total effectiveness factor. According to this analy-sis, the NHTSA estimates published in reference 3 are overstated by approximately 30%.
The second generation indirect system has the highest safety benefit even though it is not ca-pable of displaying actual tire pressure data to the operator which the NHTSA believes will en-courage more diligent tire pressure maintenance. Direct systems without batteries and with digi-tal pressure display came in second place for safety benefit. The lowest performing system from a safety point of view is the 1st generation indirect system. This system is at a disadvantage be-cause it cannot detect all combinations of underinflated tires.
These calculations depend on the assumption that all effectiveness factors are independent and therefore can simply be multiplied together to determine their combined effect. There may actually be some overlap between these factors. For example, operators that disable their TPMS due to cold weather problems would not have to worry about the system failing due to cold tem-

71
peratures. Since two of the three factors are very close to 1.0, the impact of this error should be small.
Table 8: Comparison of TPMS Effectiveness Factors and Safety Benefits System De-
scription Effectiveness Factor: Resi-
lience to Oper-ator Disable
(a)
Effectiveness Factor: Resi-lience to Tire
Services (b)
Effectiveness Factor: Resi-
lience to Other Disruptions
(c)
Total ef-fective-
ness factor (axbxc) =
(d)
Fatalities prevented per
year per NHTSA im-pact analysis
(e)
Corrected estimate of
fatalities pre-vented per
year (d x e)
1st generation Indirect
92.6% 99.9% 99.7% 92.2% 72A 66
2nd generation Indirect
92.6% 99.9% 99.7% 92.2% 119 110
Direct with low pressure
warning 69.3% 99.6% 94.3% 65.1% 119 77
Direct with digital pressure
display 69.3% 99.6% 94.3% 65.1% 121 79
Direct, battery-less with digi-
tal pressure display
80.0% 99.6% 95.7% 76.3% 121 92
Note A: value includes additional effectiveness factor of 60.9% due to limited capability. Ref. Table 4. Table 9 summarizes the value of all TPMS benefits by system type. All benefits are shown in present value, 2001 dollars. A value of $3.5 million is used to estimate the financial value of preventing a fatality which is consistent with the approach used by the NHTSA in reference 3.
Cost estimates for each tire pressure monitoring system was also determined using the same approach used by the NHTSA in reference 3. Adjustments were made to account for two sys-tems not estimated by the NHTSA: direct battery-less and 2nd generation indirect systems. Since both of these systems have a higher complexity compared to the systems they are similar to, a value of $31 was added to each ($31 is the estimated cost of a TPMS ECU per reference 3). Consistent with the approach used by the NHTSA, the only maintenance cost included is to re-place wheel mounted sensors when batteries are depleted. Table 10 indicates the present value of TPMS costs for each system configuration.
The net benefit-cost is defined as the economic value of all benefits (such as fatalities pre-vented, injuries prevented, fuel saved, property damage prevented, and tire wear prevented) mi-nus the economic value of all costs (such as initial cost, maintenance costs, and opportunity costs). See Table 11 for a comparison of the net benefit-cost of the various tire pressure monitor-ing systems under review. The most cost effective system is the 1st generation indirect system. Even though this system does not meet the minimum performance requirements of FMVSS 138, the low cost and simplicity of this system make it the most cost effective. The most cost effec-tive system that complies with FMVSS 138 requirements is the 2nd generation indirect system. All direct systems have negative net benefit-costs. This conclusion was also reached by the NHTSA in reference 3.

72
Table 9: Present Value of TPMS Benefits A System Descrip-
tion PV of Fuel Savings per
Vehicle
PV of Tread Wear Savings per Vehicle
PV of Property and Travel De-
lay Savings
PV of Fatali-ties Prevented Per Vehicle
Total of Benefits Per Ve-
hicle
Total Bene-fits Per
17M Ve-hicles
1st generation In-direct
$10.71 $1.92 $4.32 $23.24 $40.19 $683M
2nd generation Indirect
$17.58 $3.15 $7.10 $38.15 $65.98 $1122M
Direct with low pressure warning
$12.41 $2.23 $5.01 $26.94 $46.59 $792M
Direct with digital pressure display
$15.03 $2.76 $5.07 $27.61 $50.47 $858M
Direct, battery-less with digital pressure display
$17.61 $3.24 $5.94 $32.36 $59.15 $1006M
Note A: All values include the total system effectiveness factor per table 8.
Table 10: Present Value of TPMS Costs System Description System Cost
per Vehicle Present Value of
Maintenance Cost Present Value of Opportunity Cost
C
Total Cost Per Vehicle
Total Cost Per 17M Vehicles
1st generation Indi-rect
$21.13 0 $4.71 $25.84 $439M
2nd generation Indi-rect
$52.13 A 0 $7.73 $59.86 $1018M
Direct with low pressure warning
$66.08 $55.98 $5.46 $127.52 $2168M
Direct with digital pressure display
$69.89 $55.98 $5.46 $131.33 $2233M
Direct, battery-less with digital pressure
display $100.89 B 0 $6.39 $107.28 $1824M
Note A: includes $31 for dedicated TPMS ECU per reference 3. Note B: assumes $31 additional cost due to higher complexity. Note C: Captures value of time spent filling tires with air. Total effectiveness factor was applied.
Table 11: Comparison of TPMS Benefit-Cost for Life of Vehicles System Description Present Value of all
Benefits per Table 9 (f)
Present Value of all Costs per Table 10
(g)
Net Benefit-Cost for 17M vehicles (f – g)
1st generation Indirect
$683M $439M $244M
2nd generation Indirect
$1122M $1018M $104M
Direct with low pressure warning
$792M $2168M -$1376M
Direct with digital pressure display
$858M $2233M -$1375M
Direct, battery-less with digital pressure display
$1006M $1824M -$818M

73
Conclusion Indirect tire pressure monitoring systems best meet the TREAD Act requirement to provide a “warning system in new motor vehicles to warn the operator when a tire is significantly underin-flated”2 because they are superior to direct systems in terms of cost, safety, and resilience to dis-ruptions. Unfortunately, indirect systems are not currently on the market because they don’t meet the guidelines established in FMVSS 138. In order to get an indirect system, consumers will either have to purchase a used car or wait for second generation systems which should be available in 2011.
This report documents an attempt to quantifying system resilience based on vulnerabilities to a limited set of disruptions. It is effectively a simulation of 17 million tire pressure monitoring systems in service. It predicts what will happen to them as they encounter disruptions during their service life. This approach has proven to be a useful method for incorporating a measure of resilience into trade studies. A more accurate assessment of system resilience is possible by in-creasing the number of disruptions considered, by involving a diverse team of experts in the as-sessment, and by performing component testing to quantify safety margins. However, there will no doubt be a point of diminishing returns. The level of analysis detail performed in support this paper is adequate to identify which system configuration is superior and by approximately how much.
By comparing five different TPMS configurations to the baseline case, no TPMS, it is clear that the current TPMS requirements have room for improvement. These requirements satisfy the TREAD Act, but they don’t do enough to ensure that the operator will be willing to maintain this system for the life of the vehicle. The NHTSA should have addressed system resilience in their impact analyses. If they had, some of these issues may have been addressed before FMVSS 138 was released.
The biggest resilience issue with direct TPMS is that owners may disable these systems if they fail prematurely or cause unnecessary maintenance. Second and third owners probably will not pay $200 to replace their tire sensors when the batteries go out since this function can easily be performed using a pressure gage. To minimize the problem of owners disabling their TPMS, manufacturers should be required to provide extended warranty coverage for these systems. Al-so the NHTSA should establish a minimum threshold for low pressure warning and encourage the industry to establish design standards for direct tire pressure sensors.
The NHTSA should take action to assess whether or not vehicles sold with a TPMS but without a malfunction indicator system are experiencing latent failures. Possible corrective ac-tions include advising owners to have their TPMS periodically checked. Also, NHTSA should establish minimum requirements for malfunction indication system capability and monitor fail-ure rates of malfunction indicator systems in service to determine if this is a problem. As stated by Joan Claybrook, “there is no need to look for dead bodies on the highway first” (Statement on Firestone Tire Defect and Ford Explorer Rollovers, September 12, 2000).

74
References:
1. Siggerud, Katherine A. “Underinflated Tires in the United States”, Document GAO-07-246R, written February 9, 2007. http://www.gao.gov/new.items/d07246r.pdf retrieved March 25, 2009.
2. “Transportation Recall Enhancement, Accountability, and Documentation (TREAD) Act” Public Law 106-414-November 1, 2000, Senate and House of Representatives of the United States of America in Congress http://www.citizen.org/documents/TREAD%20Act.pdf retrieved March 26, 2009.
3. “Tire Pressure Monitoring System, FMVSS no. 138”, Final Regulatory Impact Analysis, Office of Regulatory Analysis and Evaluation, NHTSA. March 2005. http://www.nhtsa.gov/staticfiles/DOT/NHTSA/Rulemaking/Rules/Associated%20Files/TPMS-2005-FMVSS-No138.pdf
4. “Tire Pressure Monitoring Systems; Controls and Displays; Final Rule”, National High-way and Traffic Safety Administration, April 8, 2005. http://www.tireindustry.org/pdf/TPMS_FinalRule_v3.pdf retrieved March 24, 2009.
5. Jackson, Scott “Architecting Resilient Systems” SAE 599 Module 1 lecture notes, Spring 2009, University of Southern California
6. Jackson, Scott “Architecting Resilient Systems” SAE 599 course reader, Spring 2009, University of Southern California
7. “Laboratory Test Procedure for FMVSS 138, Tire Pressure Monitoring Systems”, En-forcement Office of Vehicle Safety Compliance, U.S. Department of Transportation. Sep-tember 14, 2005 http://www.nhtsa.gov/staticfiles/DOT/NHTSA/Vehicle%20Safety/Test%20Procedures/Associated%20Files/TP-138-03.pdf
8. “Part 591 Federal Motor Vehicle Safety Standards” 49CFR571.138, Code of Federal Regulations, U. S. Government Printing Office. http://edocket.access.gpo.gov/cfr_2006/octqtr/49cfr571.138.htm
9. Inman, Hank “Over There” The Tire Review Online. Retrieved April 23, 2009 http://www.tirereview.com/?type=art&id=81377
10. Vasilash, Gary “Audi Rolls With Indirect TPMS” Automotive Design and Production, Gardner Publications Inc. Retrieved 4/22/2009 http://www.autofieldguide.com/articles/article_print1.cfm
11. “Toyota Prius TPMS Tire Pressure Monitoring System” Bartec USA www.youtube.com/watch?v=6RR6XTEE9SM
12. “2009 Dodge Challenger” Chrysler Corporation, retrieved April 23, 2009 http://www.dodge.com/en/2009/challenger/design/wheels/
13. “Interactive Tire Pressure Demo”, Bridgestone Americas Tire Operations, LLC. Retrieve April 23, 2009 http://www.tiresafety.com/
14. “Tire Pressure Monitoring Systems” 53rd GRRF, 3-4 February 2003, United Nations Economic Commission for Europe. Retrieved April 23, 2009 http://www.unece.org/trans/doc/2003/wp29grrf/TRANS-WP29-GRRF-53-20ebis.pdf
15. “Tire Pressure Monitoring Systems- TPMS” AA1 Car Auto Diagnostics Repair Help. Re-trieved April 23, 2009 http://www.aa1car.com/library/tire_monitors.htm
16. “ALPS Commences Mass Production of Batteryless Tire Pressure Monitoring System” Business Wire, October 30, 2003. Retrieved April 22, 2009 http://www.allbusiness.com/electronics/electronics-overview/5829696-1.html

75
17. Mochizuki, Atsushi “Tire Pressure Monitoring System Goes Batteryless” March 2004 Is-sue, Nikkei Electronics Asia. Retrieved April 23, 2009. http://techon.nikkeibp.co.jp/NEA/archive/200403/298989/
18. Hobbs, David "Check Your Air, Mister? SERVICING TIRE PRESSURE MONITOR-ING SYSTEMS". Motor. FindArticles.com. 26 Apr, 2009. http://findarticles.com/p/articles/mi_qa3828/is_200901/ai_n31426481/
19. Hann, Stu “Thoughts About System Safety Engineering Within Resilience Architecting”, SAE 599 Lecture Presentation, March 2, 2009, University of Southern California.

76
App
endi
x A
Im
pact
of
Dis
rupt
ions
Cau
sing
Ope
rato
r to
Dis
able
Sys
tem
Impa
ct o
f Dis
rupt
ions
Cau
sing
Ope
rato
r to
Dis
able
Sys
tem
Dis
rupt
ion
Basi
s of
Est
imat
e
perc
enta
ge
of v
ehic
les
expo
sed
year
ve
hicl
e is
lik
ely
to
enco
utne
r pr
oble
mIn
dire
ct
TPM
S
Dir
ect
TPM
S w
ba
tter
y
Dir
ect
TPM
S no
ba
tter
yIn
dire
ct
TPM
SD
irec
t TP
MS
w b
atte
ryD
irec
t TP
MS
no b
atte
ry1.
Not
will
ing
to p
ay fo
r re
pair
s af
ter
--
--
--
--
-
a. O
ut o
f war
rant
y TP
MS
failu
re-
--
--
--
--
i. B
atte
ries
wea
r ou
t (d
irec
t sys
tem
s on
ly)
assu
me
all b
atte
ries
wea
r ou
t af
ter
7 ye
ars
100.
00%
70%
20%
0%0
1,81
3,33
30
ii.
Pres
sure
sen
sor
mod
ule
frac
ture
(dir
ect
syst
ems
only
)as
sum
ed n
umbe
r ou
t of
cal
ibra
tion
or
defe
ctiv
e is
equ
ival
lent
to
4 si
gma
qual
ity
= 62
10 d
efec
ts p
er m
illio
n ht
tp:/
/en.
wik
iped
ia.o
rg/w
iki/
6_Si
gma
0.62
%7
0%20
%20
%0
11,2
6111
,261
iii.
Val
ve s
tem
failu
re (d
irec
t sy
stem
s on
ly)
in 2
004
ther
e w
ere
12.7
8 M
reg
iste
red
boat
s in
the
USA
. A
ssum
e th
at
25%
of t
hem
are
laun
ched
from
tra
iler.
Ass
ume
this
cau
ses
valv
e st
em
corr
osio
n6.
10%
50%
20%
20%
013
8,26
713
8,26
7
i
v. V
ehic
le is
nea
r th
e en
d of
its
serv
ice
life
(dir
ect
syst
em o
nly)
assu
me
that
40%
will
not
spe
nd m
oney
on
TPM
S fo
r a
10yr
old
car
. .8
16
surv
ival
pro
babi
lity
per
NH
TSA
impa
ct a
naly
sis,
1%
failu
re r
ate
0.82
%10
40%
40%
40%
18,4
9618
,496
18,4
96
v
. Oth
er T
PMSs
yste
m fa
ilure
failu
re m
ode
has
alre
ady
been
acc
ount
ed fo
r0.
00%
11%
1%1%
00
0
b. D
rive
on
a fla
t tir
e (d
irec
t sy
stem
s on
ly)
assu
mes
tha
t th
is h
appe
ns o
n 60
% o
f all
cars
60.0
0%5
0%20
%20
%0
1,36
0,00
01,
360,
000
c
. Ope
rato
r us
es a
eros
ol ti
re in
flati
on /
sea
lant
pr
oduc
t to
infla
te t
ire
(dir
ect
syst
ems
only
)G
ov't
repo
rt t
hat
9% o
f car
s ha
ve a
t lea
st o
ne b
ald
tire
ht
tp:/
/usg
ovin
fo.a
bout
.com
/lib
rary
/wee
kly/
aa12
0401
a.ht
m9.
00%
50%
20%
20%
020
4,00
020
4,00
02.
Not
will
ing
to p
ay fo
r ad
diti
onal
set
of s
enso
rs t
o in
stal
l in
snow
tir
es (d
irec
t sy
stem
s on
ly)
perc
enta
ge o
f US
popu
latio
n in
AK
and
Nor
ther
n bo
rder
sta
tes,
ass
ume
half
use
snow
tire
s in
win
ter
10.8
0%1
0%10
%10
%0
171,
360
171,
360
3. In
stal
ls in
com
patib
le t
ires
(dir
ect
syst
ems
only
)1%
inco
mpa
tibl
e ra
te a
ssum
ed b
y N
HTS
A1.
00%
50%
100%
100%
011
3,33
311
3,33
34.
Inst
alls
inco
mpa
tible
spa
re t
ire,
leav
es it
on
Gov
't re
port
tha
t 9%
of c
ars
have
at l
east
one
bal
d ti
re
http
://u
sgov
info
.abo
ut.c
om/l
ibra
ry/w
eekl
y/aa
1204
01a.
htm
9.00
%8
100%
100%
100%
714,
000
714,
000
714,
000
5. P
erce
ives
tha
t lo
w p
ress
ure
war
ning
is e
rron
eous
an
d do
esn’
t ge
t it
diag
nose
d-
--
--
--
--
a
. Man
ual c
heck
fails
to
find
low
tir
e-
--
--
--
--
i. U
ses
inac
cura
te p
ress
ure
gage
assu
med
num
ber
out
of c
alib
rati
on o
r de
fect
ive
is e
quiv
alle
nt t
o 4
sigm
a qu
alit
y =
6210
def
ects
per
mill
ion
http
://e
n.w
ikip
edia
.org
/wik
i/6_
Sigm
a 0.
62%
120
%20
%20
%19
,706
19,7
0619
,706
ii.
Trig
ger
pres
sure
inco
rrec
tas
sum
ed fa
ctor
y de
fect
rat
e is
equ
ival
lent
to
5 si
gma
qual
ity
= 23
0 de
fect
s pe
r m
illio
n ht
tp:/
/en.
wik
iped
ia.o
rg/w
iki/
6_Si
gma
0.02
%1
20%
20%
20%
730
730
730
iii.
TPM
S m
alfu
ncti
onfa
ilure
mod
e ha
s al
read
y be
en a
ccou
nted
for
0.00
%1
0%0%
0%0
00
6. O
pera
tor
is a
nnoy
ed-
--
--
--
--
a
. Pre
ssur
e w
arni
ng t
oo o
ften
--
--
--
--
-
i
. Tri
gger
pre
ssur
e is
too
clo
se t
o re
com
men
ded
(pla
card
) pre
ssur
eas
sum
e th
at 5
% o
f dir
ect
TPM
S ve
hicl
es a
re d
edig
ned
with
tri
gger
pr
essu
re t
oo c
lose
to
plac
ard
pres
sure
5.00
%1
0%20
%20
%0
158,
667
158,
667
ii.
TPM
S m
alfu
ncti
on1%
faul
ure
rate
ass
umed
by
NH
TSA
1.00
%1
20%
20%
20%
31,7
3331
,733
31,7
33
i
ii. W
ide
tem
pera
ture
cha
nge
duri
ng o
pera
tion
perc
enta
ge o
f US
popu
latio
n in
AK
and
Nor
ther
n bo
rder
sta
tes,
ass
ume
all h
ave
gara
ges
21.6
0%1
10%
10%
10%
342,
720
342,
720
342,
720
7. A
ttit
ude
pred
ispo
sed
agai
nst
gove
rnm
ent
man
date
spe
rcen
tage
of U
S re
side
nts
in p
riso
n on
June
200
8 ht
tp:/
/ww
w.o
jp.u
sdoj
.gov
/bjs
/pri
sons
.htm
0.77
%1
100%
100%
100%
122,
173
122,
173
122,
173
Tota
l # v
ehic
les
with
inop
erat
ive
TPM
S:1,
249,
559
5,21
9,78
03,
406,
446
Gen
eral
ass
umpt
ions
:%
of v
ehic
les
with
inop
erat
ive
TPM
S (a
vera
ge o
ver v
ehic
le li
fe):
7.35
%30
.70%
20.0
4%20
% o
f ow
ners
will
not
spe
nd t
ime
or m
oney
on
TPM
S%
of v
ehic
les
wit
h op
erat
ive
TPM
S (a
vera
ge o
ver v
ehic
le li
fe):
92.6
5%69
.30%
79.9
6%10
% o
f ow
ners
will
dis
able
sys
tem
so
they
don
’t h
ave
to lo
ok a
t fla
shin
g lig
ht
17 m
illio
n ne
w v
ehic
les
are
sold
eac
h ye
arve
hicl
e la
sts
for
15 y
ears
Prob
abili
ty th
at o
ccur
ance
lead
s to
inop
erat
ive
TPM
Snu
mbe
r of
veh
icle
s ad
vers
ely
affe
cted

77
App
endi
x B
Im
pact
of
Tir
e M
aint
enan
ce S
ervi
ces
on S
yste
m E
ffec
tive
ness
Impa
ct o
f Tir
e M
aint
enan
ce S
ervi
ces
on S
yste
m E
ffec
tive
ness
Dis
rupt
ion
Basi
s of
Est
imat
e
perc
enta
ge
of v
ehic
les
expo
sed
year
ve
hicl
e is
lik
ely
to
enco
utne
r pr
oble
mIn
dire
ct
TPM
S
Dir
ect
TPM
S w
ba
tter
y
Dir
ect
TPM
S no
ba
tter
yIn
dire
ct
TPM
SD
irec
t TPM
S w
bat
tery
Dir
ect T
PMS
no b
atte
ry1.
TPM
S no
n fu
nctio
nal a
fter
tire
ser
vice
--
--
--
--
-
a. S
ervi
ce p
rovi
der
not c
apab
le (i
.e.
emer
genc
y re
pair
, sm
all t
own)
assu
me
2% o
f tir
e re
pair
faci
litie
s ar
e no
t TPM
S ca
pabl
e, 5
0% c
hanc
e of
ha
ving
to
get
emer
genc
y se
rvic
e du
ring
veh
icle
life
1.00
%5
0%20
%20
%0
22,6
6722
,667
b
. Se
rvic
e pr
ovid
er d
oes
not f
ollo
w
man
ufac
ture
rs p
roce
dure
sas
sum
e 10
% d
o no
t fo
llow
pro
cedu
res,
10%
cha
nce
you
will
hav
e TP
MS
prob
lem
s be
caus
e of
it1.
00%
520
%20
%20
%22
,667
22,6
6722
,667
c
. Se
rvic
e pr
ovid
er in
stal
ls d
efec
tive
repl
acem
ent
part
as
sum
e 1/
100
chan
ce p
arts
are
def
ectiv
e an
d w
ill h
ave
TPM
S pr
oble
ms
afte
r se
rvic
e.
1.00
%5
0%20
%20
%0
22,6
6722
,667
d
. Se
rvic
e pr
ovid
er d
isab
les
syst
em
with
out o
pera
tor'
s kn
owle
dge
assu
me
1/10
sho
ps a
re u
nsru
pulo
us, 1
/200
cha
nce
beco
min
g a
vict
im
0.05
%5
20%
100%
100%
1,13
35,
667
5,66
7To
tal #
veh
icle
s w
ith in
oper
ativ
e TP
MS:
23,8
0073
,667
73,6
67G
ener
al a
ssum
ptio
ns:
% o
f veh
icle
s w
ith in
oper
ativ
e TP
MS
(ave
rage
ove
r veh
icle
life
):0.
14%
0.43
%0.
43%
20%
of o
wne
rs w
ill n
ot s
pend
mon
ey o
r tim
e to
fix
TPM
S pr
oble
m%
of v
ehic
les
with
ope
rativ
e TP
MS
(ave
rage
ove
r veh
icle
life
):99
.86%
99.5
7%99
.57%
10%
of o
wne
rs w
ill d
isab
le s
yste
m s
o th
ey d
on’t
have
to
look
at
flash
ing
light
17 m
illio
n ne
w v
ehic
les
are
sold
eac
h ye
arve
hicl
e la
sts
for
15 y
ears
Prob
abili
ty th
at o
ccur
ance
lead
s to
inop
erat
ive
TPM
Snu
mbe
r of
veh
icle
s ad
vers
ely
affe
cted

78
App
endi
x C
Im
pact
of
Unu
sual
Dis
rupt
ions
on
Sys
tem
Eff
ecti
vene
ss
Resi
lienc
e to
Unu
sual
Dis
rupt
ions
Dis
rupt
ion
Basi
s of
Est
imat
e
wha
t per
cent
age
of v
ehic
les
will
be
exp
osed
?
year
ve h
icle
is
likel
y to
en
cout
ner
this
pr
oble
mIn
dire
ct
TPM
S
Dir
ect
TPM
S w
ba
tter
y
Dir
ect
TPM
S no
ba
tter
yIn
dire
ct
TPM
SD
irec
t TPM
S w
bat
tery
Dir
ect T
PMS
no b
atte
ry1.
Env
iron
men
tal l
oads
--
--
--
--
-
a. F
reez
ing
rain
whi
le p
arke
d, th
en b
reak
fr
ee a
nd d
rive
off
perc
enta
ge o
f US
popu
latio
n in
AK
and
Nor
ther
n bo
rder
sta
tes,
ass
ume
25%
hav
e fe
ezin
g ra
in5.
40%
30
0.1
0.1
073
,440
73,4
40
b. S
oak
part
of t
ire
and
rim
in w
ater
due
to
flood
ing
and
driv
ing
thro
ugh
was
has
sum
e 5%
of t
he p
opul
atio
n ex
peri
ence
s th
is5.
00%
50
0.1
0.1
056
,667
56,6
67
c
. Dri
ve t
hrou
gh s
now
ban
k
perc
enta
ge o
f US
popu
latio
n in
AK
and
Nor
ther
n bo
rder
sta
tes,
ass
ume
all w
ill d
rive
thr
ough
sno
w21
.60%
10
0.1
0.1
034
2,72
034
2,72
02.
Sho
ck lo
ads
--
--
--
--
-
a
. sev
ere
curb
ing
of w
heel
Gov
't re
port
that
9%
of c
ars
have
at l
east
one
bal
d tir
e ht
tp:/
/usg
ovin
fo.a
bout
.com
/lib
rary
/wee
kly/
aa12
0401
a.ht
m9.
00%
50.
050.
150.
151
,000
153,
000
102,
000
b
. Ext
rem
e of
f-ro
ad u
se
assu
me
3% o
f the
pop
ulat
ion
does
this
3.00
%3
00.
150.
10
61,2
0040
,800
3. T
herm
al lo
ads
--
--
--
--
-
a
. Ext
rem
e hi
gh a
mbi
ent t
empe
ratu
res
6.3
mill
ion
peop
le li
ve in
Ari
zona
, ass
ume
this
re
pres
ents
num
ber
of p
eopl
e ex
pose
d to
sev
ere
dese
rt c
limat
e.
http
://q
uick
fact
s.ce
nsus
.gov
/qfd
/sta
tes/
0400
0.ht
ml
2.10
%5
00.
20
047
,600
0
b. P
arke
d ne
ar fi
re (e
xpos
ure
to h
eat a
nd
ther
mal
rad
iatio
n)as
sum
e .5
% o
f the
pop
ulat
ion
expe
rien
ces
this
0.50
%5
00.
20.
10
11,3
335,
667
c
. Bra
ke m
alfu
nctio
n re
sulti
ng in
red
-hot
br
ake
disk
assu
me
5% o
f the
pop
ulat
ion
expe
rien
ces
this
5.00
%8
00.
20.
10
79,3
3339
,667
d
. rac
ing
resu
lting
in r
ed-h
ot b
rake
dis
kas
sum
e 2%
of t
he p
opul
atio
n do
es th
is2.
00%
20
0.2
0.1
058
,933
29,4
674.
Dri
ve a
t exc
essi
ve s
peed
assu
me
3% o
f the
pop
ulat
ion
does
this
3.00
%2
00.
20.
10
88,4
0044
,200
Tota
l # v
ehic
les
with
inop
erat
ive
TPM
S:51
,000
972,
627
734,
627
Gen
eral
ass
umpt
ions
:%
of v
ehic
les
with
inop
erat
ive
TPM
S:0.
30%
5.72
%4.
32%
20%
of o
wne
rs w
ill n
ot s
pend
tim
e or
mon
ey o
n TP
MS
% o
f veh
icle
s w
ith o
pera
tive
TPM
S:99
.70%
94.2
8%95
.68%
10%
of o
wne
rs w
ill d
isab
le s
yste
m s
o th
ey d
on’t
hav
e to
look
at
flash
ing
light
17 m
illio
n ne
w v
ehic
les
are
sold
eac
h ye
arve
hicl
e la
sts
for
15 y
ears
Prob
abili
ty th
at o
ccur
ance
lead
s to
inop
erat
ive
TPM
Snu
mbe
r of
veh
icle
s ad
vers
ely
affe
cted

79
Exxon Valdez Disaster
by Prasad Naik, [email protected]
Introduction Disasters always have many problems in their aftermath, but environmental disasters can be especially dangerous. Environmental disasters that happen due to human error are often criti-cized; oil spills are the worst because without speedy attention, they can pollute the environ-ment with chemicals and wreck havoc on neighboring communities. Economic impacts result-ing from oil spills and the clean-up efforts can devastate the people living nearby. Oil spills can quickly turn into a nasty political issue as well.
The Trans-Alaska pipeline system is set to carry oil from the North Slope oil fields to Val-dez harbor. It is said to be the greatest system of pipelines in the World. The Exxon Valdez, which is a supertanker, became known as the largest oil spill in North America. The disaster revealed how human error and inadequate tools can lead to the destruction of a whole ecosys-tem and its inhabitants. The oil Pollution Act (OPA) passed by congress was a direct result of this. Unfortunately the people of Prince William Sound had already lost their way of life. The examination of the accident soon yielded conclusions about the cultural, economical, political and legal environments; and the flaws revealed the brittleness of the system and the clean-up efforts. Cause of Type B Disruption To analyze the cause of the disruption, we need to trace the events that led up to the oil spill.
On March 23, 1989 the Exxon Valdez supertanker left the port of Valdez around 9:30 PM. Captain Joseph Hazelwood, who was very experienced and knew the waters extremely well, was at the helm of the ship. Ed Murphy who was the harbor pilot was to steer the ship through the maze of islands, reefs and shoals that were in the Sound, and lead the ship into open waters. He knew where all the water currents and dangerous conditions were and he also knew the weather pattern. The chief mater was James Kunkel; he was in charge of docking and loading the ship. When Kunkel boarded the ship he was extremely tired. He was later relieved of duty by Third mate Gregory Cousins. The captain had gone away to his cabin to finish some paper-work, and as captain of the ship, by leaving the helm he was going against regulations. Ed Murphy had left the tanker afterwards and went back to shore after steering the tanker into Prince William Sound and open water. As the captain had gone back to his headquarters, he told the helmsman to turn the vessel into the incoming shipping lane. Now it does not seem smart to steer an outgoing tanker into the incoming tanker’s lane, but Captain Hazelwood wanted to avoid a field of icebergs that were in the way. Before he did this he had contacted the Coast Guard and asked for permission. The Coast Guard had assured the captain that no other ships were on their radars and that the lane was clear. He had also told the Third mate of the ship to turn the tanker back into its own shipping lane when the tanker had passed the field of icebergs. When the time came, the Third mate started to turn the tanker to the right and into its own shipping lane, but it was too late and the tanker had already crossed the incoming ship-ping lane and was headed straight into Bligh reef. A tanker as big as this has a huge turning radius and there was no way the tanker would have been able to turn without hitting the reef [6].

80
Now as we analyze the situation up to here we see that there have been numerous human errors already. First and foremost it was said that the captain of the tanker, Joseph Hazelwood, was a little intoxicated. He was not drunk, but the crew admitted that they had smelled alcohol on his breath; however they also said that he was not slurring or walking funny and had it not been for his breath, they would not have been able to tell that he had even one drink [1]. Witnesses say that they saw Captain Hazelwood having a few drinks at the local bar in Valdez before he boarded the tanker. This was obviously a break of regulations. It probably had nothing to do with the disaster, but it could definitely have been a factor; and it was during the civil case against him. Second, the captain of the tanker should not have left the helm and gone back to his cabin, again this was against regulations. Being the captain, he should be there to oversee everything. Even if he gives an order he needs to be there to make sure it is properly carried out.
Another crucial mistake was how the ship had come out of the incoming shipping lane. What was the reason for this? There was no clear answer to this question, but I do have a few hypotheses. First either the ship was turned at a slightly tighter angle when it was going from its own shipping lane into the incoming shipping lane. Or it could have been in the incoming shipping lane for too long and a curve in the lane must have thrown the tanker out of the lane. Whatever the problem was, in this case, the Third mate should have noticed that the ship was not in its lane anymore. He should have turned the ship into the outgoing lane much sooner. The captain however, is the person who the blame falls onto here.
I also think the Coast guard has a bit of blame on them. If the coast guard had radar, then why didn’t they inform the tanker that they were heading out of the incoming lane? Another question which I could not find a specific answer to. I know that it is not the job of the coast guard to constantly keep watch where the tanker is headed, but in this case it would have helped. They should have been tracking the tanker the whole time it was in the incoming ship-ping lane, especially since it was nearing midnight.
Eventually a few minutes past midnight on the morning of the 24th of March 1989, the tanker hit Bligh reef and oil started to spill at an alarming rate. The chief mate awoke from his sleep and immediately knew that something terrible had happened. As the oil started to spill out, there was a great danger that the hull of the ship would break under the pressure of the tanker and the water. This brought up the only system error, which was the single hull. The hull was an important part of the ship, as the picture on the next page illustrates. The use of a double hull would have been great in this situation and later it became a necessity, as we will find out in a later section. Fortunately for the crew the hull stayed intact. Had the hull broken, the crew would not have survived the cold and frigid waters. Poor Preparation There was absolutely no preparation for a disaster such as this. Nobody had any idea f what to do. The oil looked like waves of goo in the Sound. When a member of the coast guard had reached the tanker by a speed boat, he could instantly see that there was a huge problem. The coast guard representative along with a representative from Alaska’s department of environ-mental conservation boarded the tanker and immediately radioed the Alyeska pipeline company to send all the cleaning equipment possible. They said they would do it right away, but that was not true. In fact they didn’t even know where the equipment was. It turned out that all the cleanup equipment was buried somewhere in a warehouse. There was supposed to be a barge

81
that was to bring the equipment from the harbor to into the Sound, but even that was not in the water yet.
The barge happened to be in a dry dock because it needed repair. Since the Alyeska pipeline company is privately owned by a bunch of oil companies, their plan was to have a response team ready at all times, of course this was not the case [6]. Due to budget cuts the team was not in effect 24 hours a day and since it was late at night, the response team was not even around. At 5AM 39 workers which were supposed to be the response team, showed up at the Alyeska Valdez office [6]. They were supposed to be at the spill within five hours, but the five hours had already passed a long time ago. This was about the time that the Alyeska officials started to search for the clean-up equipment. This equipment was stored in the back of a ware-house and it was hard to get. The equipment was located one at a time and needed a forklift to carry it out to the barge, which was now on the water. Another operator was supposed to trans-port the equipment from the harbor onto the barge; the only problem was that there was only one operator to do both the jobs. There was definitely a lack of personnel in the area at the time. Lack of preparation led to a lack of personnel.
The equipment consisted of booms, which are like long plastic pipes that contain the oil in one area, and skimmers, which are like vacuums that suck up the oil. By the time the barge was leaving the dock the Exxon officials contacted the Alyeska people and told them that they needed lightering equipment as well. Lightering equipment was used to transport the oil re-maining on the tanker to another tanker. This meant that the equipment that was already on the barge needed to be taken off to make room for the lightering equipment. Due to all the delays the barge did not make it to the site of the spill until 13 hours had passed. As all the aforemen-tioned points explain, the preparation for this disaster was poor.

82
Decision Making When the tanker hit the reef there were some questionable decisions as well as some good deci-sions made. Some decisions seemed to be good, but turned bad due to unforeseen circums-tances. First some of the bad decisions that came from the tanker’s crew. For some reason the crew had decided to keep the rotors turning instead of shutting them down right away. It took a total of 13 minutes for the rotors to turn completely off. Another questionable decision came when the crew did not turn off the tanker’s engines for a whole hour. Their reasoning for this was because they were trying to take the tanker off of the reef. They should have just shut the engines off and waited for the tug boat to come along. By keeping the engines on the tanker churns the water forward; which could have made the leak worse. It was obvious that the crew did not think this all the way through.
Exxon decided to bring in another tanker to take the oil that was remaining on the original tanker out. This was the best decision made in this situation. Instead of spilling most of the 53 million gallons that it was carrying; then tanker only spilled 11 million [4]. But it was still enough to make it into the worst oil spill in North America.
The decision making during the clean up was poor as well. The cleaning of the oil slick was not going well. The plan was to set the oil slick on fire but there were tons of hazards to that. First, toxic fumes are released into the environment. Other boats and tankers need to be protected from the fire as well. When one part of the oil slick was put on fire, just as a test, it only burned off 15,000 gallons of oil and released a lot of chemicals and smoke into the envi-ronment [6]. Dispersants, which is a type of detergent that break up the oil particles so that they sink into the ocean, were planned to be dropped onto the oil. Special planes that release the dispersants were called in from other states. By the next day the first tests with dispersants were made. These caused an outrage with amongst environmentalists, since dispersants did release chemicals. They also take a toll on the marine life in the Sound. Due to the weather, the clean up was not going as planned. The wind, which I though became a disruption to the environment, was causing the dispersants to fly away from the oil and onto unaffected areas. It took almost 48 hours for the real clean-up effort to start because that’s how long it took to get everything set up.
After the first couple of days when the wind started to die down, some of the decisions that looked poor at first turned out to work quite well. For example, the dispersants worked well once they started to drop them on the areas that were separated by the booms. Due to the rough seas however, the oil started to turn into a mousse and then into a toxic goo. This toxic goo could no longer be burned or broken down by dispersants. If the clean-up efforts had started in time more of the oil would have been burned out of broken down[1]. Heuristics that were not followed During the disaster there were a number of heuristics which I felt were not followed. I believe that if the crew and the company had paid more attention to these “rules” then they would have either prevented this disaster of prevented such a horrific aftermath.
83
Capacity Heuristics Absorption heuristic – States that the system should be capable of absorbing a disruption. Whether or not hitting the reef was classified as a human error or not, the system in this case the tanker, should have been able to withstand the hit from the reef. This could have been pre-vented if the tanker was equipped with a double hull. Margin heuristic – States that the system should have adequate margin to absorb disruptions. The same argument about the double hull can apply here as well. Flexibility Heuristics The human in control heuristic – States that the human operator should be in command. Now technically someone was in command but it was not the right person. The captain of the tanker should have been at the helm at all times; not because of regulations, but because of safety for everyone on board. Inter-Element Collaboration Heuristic The informed operator heuristic – The human operator should be informed. If the captain was going to leave the helm, he should have given the helmsman all the information regarding the safety response teams. He should have been in contact with the coast guard as well since the helmsman was not supposed to be in command. Time There was also an issue with time. Each passing minute the oil was becoming into toxic goo which was spreading throughout the environment. The fumes were extremely strong and people thought they were going to collapse. Due to the lack of preparation, too much time was taken to get everything going. Not just the clean-up effort, but even the crew of the tanker had no idea of what to do and they wasted lots of time. The Effect on the Environment as a System When looking at the environment around Prince William Sound as a ecosystem, we can see that many wild birds, mammals and fish were its inhabitants. This disaster can be looked as a type A distribution to the ecosystem. It was not a natural disaster, but there was nothing the ecosys-tem could do to prevent it from happening. Many of the birds, mammals and fish were killed off during and after the disaster. It happened at a time when millions of birds flock there due to Spring. Millions of Salmon make their way into Prince William Sound to lay their eggs. Even the plants suffered due to the oil seeping its way onto the shores and into the sand. Eventually the oil made its way into the soil and af-fected the growth and health of the plant life. Nutrients that usually make the ecosystem thrive were now lost.

84
The Clean-up Costs (Financial and Political) When cleaning the nearby shores, Exxon hired and trained 11,000 men and women. They paid them $16.69 an hour, which is pretty good pay to just clean up beaches. Large barges had to be converted into living quarters so that the clean-up crews could stay there. Exxon also paid to charter clean-up crews, reporters, scientists, volunteers etc to help with the clean up. All of these expenses came out to $10 million and they were all paid by Exxon [5].
Foreign countries started to offer their help, but some were just too far away and the equipment could not reach Prince William Sound in time. A real dilemma came when Russia, which was the Soviet union at the time, offered to send its biggest skimmer ship to the Sound. The skimmer ship was called the Vaydaghubsky, and it was not as far as some of the other big skimmers were [6]. The US government was obviously not happy about letting a ship from a communist country enter US territory. After some thought however, the ship was allowed to enter the Alaskan waters. It was obviously a very desperate time and it called for a desperate measure. Cultural Environment Cordova was a town on Prince William Sound. The town can only be reached by a boat or a small plane. There is no road that goes in or out of town and the community is very close knit. They rely heavily on the fishing industry. The port of Cordova was ranked ninth in the nation for its commercial fish harvest before the oil spill. Everyone in the town knew that an oil spill would devastate their culture. They fought heavily in the 1970s to stop the building of the Trans-Alaska pipeline into Prince William Sound [3].
There were also many natives that were living around Prince William Sound. To them hunting and fishing was not done for money, it was done for survival. They were offered food by Exxon but most of the natives refused to eat it. Most of the natives had to get real jobs or help clean up the beaches so that they could buy food for their families [3]. But cleaning the beaches was torture and the natives were often harassed by other people. This in turn made the natives extremely frustrated and there were many claims about the oil companies lying about preventing spills. Also the reporters that were coming in from all over the country to put a face of innocence on the natives, came to be hated by them. The thought of so many strangers around them made them paranoid and changed their culture almost overnight. Political Environment The political environment was already stirring up individuals before the 1989 disaster even happened. People were constantly lobbying against the big oil companies, as well as congress to enact and pass laws that called for better protection of US soil and waters from oil spills. Many people from all over the nation started to call their representative in congress and soon members of congress were scrambling to find out laws that could be solutions to this problem. Finally in 1990, Congress passed the Oil Pollution Act (OPA) [1]. This law had two specifica-tions, first all US made tankers were to be made with a double hull. The double hull would act like a barrier or margin between the oil tanks and the outer hull. The picture below illustrates the difference.

85
The OPA would require that any US tanker with a single hull were to replace the hull with a double hull before the year of 2015 if the tanker wanted to stay operational in US waters [6]. The OPA also featured many other regulations. There were now stricter regulations when the tanker is docked as well. Booms had to be placed around the tanker when it is docked to pre-vent the oil from spreading in case there happens to be a leak. The law also toughened the li-censing of tanker personnel who were involved with drug or alcohol abuse. It also addressed plans to have emergency money and resources in the event that a spill like this occurs again. Basically this act was put into place to address the avoidance of a disaster such as this as well as the recovery.
Economic Environment Since many people came from around the nation and the globe to help the recovery effort the tow of Valdez started to boom. More people were staying in the town now, so the demand for everything from lodging and food went up. Exxon was also paying much higher ($16.69) wag-es then some of the local businesses were. So eventually all of these businesses lost their em-ployees. Valdez had been a small local town before, but now the population soared up to 11,000 almost four times the amount they had before the disaster. This also caused the rent for apartments to go up by about $500 [5]. The chart below depicts the personal savings from dis-posable income for the communities around Prince William Sound. Legal Environment By September of 1989, Exxon declared that the clean-up effort was over and all the money that Exxon was delivering to fund the effort had stopped suddenly. In 1991 Attorney General Dick Thornburgh said that Exxon would pay $900 million in clean up costs and an extra $100 mil-lion in environmental crime penalties to the state [2]. In 1994 however, many of the citizens

86
that were still in Prince William Sound sued Exxon in a class action lawsuit. Both Exxon and Captain Hazelwood had already been put on trial and prosecuted. Hazelwood had to pay $50,000 and was sentenced to 1000 hours of community service. Exxon had already paid up-wards of $1 billion. But in the 1994 lawsuit, the jury said that both Exxon and Captain Hazel-wood were reckless in their actions and Exxon was ordered to pay another $5 Billion [6]. Ob-viously Exxon official were furious with this verdict, but the judge was adamant on the verdict. Exxon however is fighting to the death to not pay the $5 Billion and as of 2004, the people in Prince William Sound have not seen a cent.
Other Improvements to the System We have already talked about some of the major improvements that have came along after the accident. The oil pollution act was one of them; we have also talked about double hulls. There were also many other improvements that came about which helped reinforce the resilience of the system. There were regulations that were put into play that split up the recovery efforts if an accident such as this were to ever happen again. The Coast Guard would certify the cleanup committee if an oil spill occurred in a waterway. The EPA or environmental protection agency would certify the cleanup team if the accident happened on land. Both of these systems would be under a nationwide system called NRP or national response plan. Also the NRP put into place sites where spill response equipment could be stored and maintained. There was also a

87
database that was set up to list equipment that was available and the personnel that were availa-ble. Prince William Sound has also put a vessel service or SERVS [6]. The purpose of SERVS is to prevent and respond to oil spills. They have a highly trained staff of 250 people and are considered to be the best oil spill prevention and recovery forces in the world. Conclusion The fact that this disaster even took place was unbelievable. There were many factors that con-tributed to the disaster, but it was mainly due to human error. The tanker which was its own system, disrupted another, in this case the environment. The local newspaper said it perfectly, “The oil spill in Prince William Sound is entirely different from other disasters. Rather than a single cataclysmic event, it is an ongoing progression of events.” References 1. Townsend, John. The Exxon Valdez 1989. Raintree. Chicago Ill. 2006. 2. Beech Ward, Linda. The Exxon Valdez’s Deadly Oil Spill. Bearport pub.
New York, New York. 2007. 3. Valdez Oil Spill Trustee Council. http://www.evostc.state.ak.us/facts/economic.cfm. Ac-
cessed Jan 20, 2009 4. “Exxon Valdez Oil Spill,” The Encyclopedia of Earth, August 28, 2006,
http://www.eoearth.org/article/Exxon_Valdez_oil_spill. Accessed Jan 20, 2009 5. Carson, Richard, T. Hanemann, Michael, W. “A Preliminary Economic Analysis of Recreational Fishing Losses Related to the Exxon Valdez Oil Spill. Dec. 18, 1992. 6. Leacock Elispeth. The Exxon Valdez Oil Spill. Facts on File Inc. New York. 2005.

88
Racing Increases Resilience
by
Edward Parleman, [email protected]
Abstract In 1970 I was fortunate enough to see a United States Auto Club race in Trenton, New Jersey. My older sister knew what a huge racing fan I was and took me to see Al Unser beat Mario Andretti that afternoon (much to my disappointment). Fast forward to today: both that race ve-nue and I are long gone from New Jersey, and much has changed in racing. Mario won a World Drivers Championship in a car that revolutionized racing and retired years ago; his grandson Marco is now following in his footsteps. He may or may not achieve the high level of success in motorsports that his grandfather did, but he is far less likely to be killed or se-riously injured during his career.
This paper discusses how racing increases resilience in various ways over the past several decades. It describes the basic racing system, and a discusses heuristics and their applicability to racing. Three major auto racing sanctioning bodies are reviewed, including how each organi-zation’s priorities have affected its resilience. Significant changes have taken place with regard to driver protection are also covered, highlighting a major Southern California connection. Racing vehicles also offer increasing amounts of protection; major design and performance im-provements are addressed in several parts of this paper. The tracks where the races are held are a major enabling system; their improvements are considered as well. Finally, cross-scale inte-ractions from the world of motor racing that affect our everyday lives, mostly by improving the cars we drive, are also examined. Introduction A Ferrari driver from the 1950s named Folian Gonzalez is attributed with one of the greatest quotes about the history of racing: "In the old days drivers were fat and tires were skinny."1 That is a surprisingly accurate description of the early years of racing – cars that people built in their garages were usually manhandled by burly drivers who were fearless (i.e. had very little risk aversion). As the years went by, the technology progressed and speeds increased. A prime example: when the Indianapolis 500 was first run, the speeds were in the 70 mph range, the speed many of us drive today on a typical freeway trip. Now drivers at the 500, with the same human reaction times, are driving three times as fast. Yet motor racing is much safer today, and the cars are more reliable.
This paper will discuss how racing has become more resilient over the past several decades. It begins with a description of the basic system of automobile racing, and a discussion of heu-ristics and their applicability to racing. A description of three of the major auto racing sanction-ing bodies follows. These three organizations will be examined to illustrate how organizational priorities affected their resilience. The paper reviews significant changes that have taken place with regard to driver protection and a major Southern California connection involved. The rac-
89
ing vehicles they drive also offer increasing amounts of protection; major design and perfor-mance improvements are addressed in several parts of this paper. Improvements to a major enabling system, the tracks where the races are held, that have taken place are covered next. Examples of cross-scale interactions from the world of motor racing into our everyday lives, mostly by improving the cars we drive, are summarized below. The paper concludes with a discussion of one of the more unusual cross-scale interactions resulting from racing that I have encountered. Basic System Description & Heuristics Auto racing could be thought of as the art of avoiding disruptions: accidents (both Type A, the driver’s mistake & Type B, someone else’s), system failures, even being passed are all disrup-tions to be avoided during a race. The mission of this system can be stated quite simply: to finish first, ahead of all of your competitors. The top level of the system can be considered to be the sanctioning bodies; three of the major organizations will be considered in this paper. The individual race teams are the next level, who field the car system in competition. The driver and race car combination can provide some of the most incredible demonstrations by highly trained, highly skilled, (and in some cases highly compensated) “humans at the sharp end of the system” that can be seen. The top Formula One teams are rumored to spend over $300M a year, and all that focus ends up on only two men each race: the team’s drivers – that is a very sharp system. Like all sports, racing can basically be described as entertainment; televi-sion has become a major enabling system. TV coverage of the races generates interest in the races, and publicity for companies that sponsor the race teams; it is another form of advertising. The higher the ratings for a particular racing series, the more money it generates for the spon-sors and the more money is available to enable the teams to compete. But it is far more than entertainment for those of us who have been “bitten by the racing bug” – it is a lifelong passion we go to great lengths to witness or participate in.
One of the key heuristics this paper will address is the capacity heuristic that the system should be capable of absorbing a disruption. The gains in safety that will be discussed were as a result of addressing specific types of repeated disruptions. Most of the improvements have been reactive in nature; in recent years much more proactive work has been done. In the course text, D’Ambrosio is quoted as saying “people’s attention to the possibility of failure increases greatly after a major accident”.2 This will be shown repeatedly below, that the increased atten-tion accomplished major changes that resulted in increased margins.
The human at the sharp end of the system is the key flexibility attribute of the system: a skilled driver can make an average car competitive, adapt to some system internal system drift or degradations, and keep a potentially unsafe car from fulfilling that potential. Tolerance is mostly handled by monitoring the system to detect any drift. This is accomplished by the driv-er ‘feel’ of the system, very similar to flying an aircraft by “seat of the pants”. This ‘feel’ is a critical skill, as well as the ability to communicate that information back to his crew in an effort to optimize the driver/vehicle system. Monitoring of the vehicle is also accomplished via in-formation displayed to the operator in the cockpit, or through telemetry back to the pits that is monitored by team members. Engine temperatures and pressures and even tire pressures can alert the crew to any system drift that needs to be addressed (e.g. a la the prevention heuristic, if a degradation is detected such as rising temperatures in the gearbox, use less engine rpm to re-duce stress on the drive train in an attempt to avoid a complete failure), or reassure the driver that the degradation he perceives is not in fact occurring (a tire which has picked up dirt can

90
feel similar to a tire deflating). Formula One cars send over one hundred channels of data back to their teams in their pit areas. Communication is a typical part of a race, as the race engineer is in radio contact with the driver keeping him informed of his situation – track conditions, his own status as well as information on other cars, strategy, potential changes – in keeping with the informed operator heuristic.
On the other hand, there is little functional or physical redundancy in racing. Weight is the enemy of speed and performance; providing redundant or multi-purpose components would increase weight and hinder system performance. Since these vehicles are designed for relative-ly short periods of use between maintenance, they depend on component reliability. The neu-tral state heuristic similarly has little applicability – as racing is all about minimizing time over distance, any time spent in neutral is time lost.
The reparability, loose coupling, and simplicity heuristics come together in unique fashion in motor racing. Concerns about aerodynamics of modern racing cars (NASCAR’s Car of Tomor-row being a notable exception) require systems to be packaged very close together; this leads to tight coupling, complexity, and lack of access to key components. However, these vehicles will often be mostly disassembled both before and after a race to check the condition of various vehicle systems and just to ensure the fasteners haven’t come loose. Proper maintenance is es-sential for racing vehicles: those teams that do not practice it, or cannot afford to replace com-ponents as often as other teams do will inevitably have failures (known as DNFs for Did Not Finish). But during a race even simple repairs will probably cost a team many positions, so racing vehicle designers have to balance maintainability considerations with aero concerns as well as deciding what types of disruptions are frequent enough to address during a race. One of the most common in an open wheeled car is hitting another car or a wall and damaging the front wings; cars are designed with this in mind and a nose can routinely be changed in about ten seconds.
A very powerful racing heuristic, though not specifically related to resilience, is “Win on Sunday, Sell on Monday”. This has motivated manufacturers in the United States since the lat-ter half of the 1950s and has led to countless millions of dollars spent on race car development. Even today, General Motors backs a pair of Corvettes that raced here at Long Beach nine days ago literally without any competition. The Corvette is seen as America’s premier sports car, and GM feels the cars need to be seen on the race tracks of America, and at major international races like the 24 Hours of LeMans to support that marketing image. Racing developments usually lead to improvements to the production versions of those cars: Car and Driver maga-zine has called “recent Corvettes the best high-performance sports-car buys on the planet”.3 Examples of other cross-scale interactions will be discussed as the final topic of the paper.
One resilience aspect of racing that is being reduced by the sanctioning bodies in an effort to control costs, especially in light of today’s economic situation, is testing. Testing, especially in the more technically complex cars like Formula One, allows teams to ‘learn’ the system, not only discovering any weak links but also how best to optimize its operation. Testing also shar-pens the skills of both the operator and his supporting team before system is ‘fielded’, i.e. when the season begins. But testing can be very costly (one Formula One team owns not one but two race tracks for private testing), and can put the smaller teams at a distinct disadvantage since they cannot match those kind of resources. So, in the name of reducing costs and increasing fairness, most sanctioning bodies (including the three addressed in this paper) have greatly re-duced testing. Like many rule changes addressing cost this has had mixed results: the larger teams with larger simulation budgets may now have an even greater advantage at the beginning of a new season.

91
Organizational Descriptions The three major racing sanctioning bodies in the last two decades are Formula One, Champion-ship Auto Racing Teams (CART), and National Association for Stock Car Auto Racing (NAS-CAR). These are the regulatory and enabling systems which provide the operating environ-ment for the cars and drivers to compete. They are similar systems in functional terms, but have exhibited very different priorities over the years with respect to resilience. Safety became a part of the organizational culture of Formula One and CART in the 1980s, while it took the death of its major star to prod NASCAR to change its culture in 2001. Figure 1 shows driver deaths from the three major racing series by decade from the 1960s through 2008. This chart tells only a partial story as serious driver injuries, fatalities among crew members and specta-tors, as well as those in supporting series races are also important data yet it would require much broader research which is beyond the scope of this paper. Nevertheless, driver fatalities are a valid indicator of the priority each series placed on safety. A description of the governing bodies discussed in this paper follows the figure.
0
2
4
6
8
10
12
14
16
1960s 1970s 1980s 1990s 2000-8
Decade
Driv
er D
eath
s
USAC/CART/IRL
Formula 1
NASCAR
Figure 1 Driver deaths in three major racing series (data from Motorsportmemorial.org) Formula One Formula One is arguably the pinnacle of motor racing. Their teams spend staggering amounts of time, effort, and resources to develop the most advanced racing cars in the world. A team must design, build, and develop a new chassis for each season, and also has the option of build-ing its own engine and gearbox as well. This form of racing has been at the forefront of many developments related to the resilience of the vehicle system as well.
One of the key heuristics this paper will address is the capacity heuristic: that the system should be capable of absorbing a disruption. The gains in safety were as a result of addressing

92
specific types of repeated disruptions. Formula One was initially focused on safety reactively, as was the case initially with all major forms of motor sports. In recent years more proactive work has been done.
One of the major turning points for the Formula One governing body was what Racer Mag-azine executive editor Andrew Crask called “the brutal season of ’82, when the sport was rocked by a series of tragedies – the deaths of Gilles Villenueve and Riccardo Paletti, and the serious injuries suffered by Villenueve’s Ferrari teammate Didier Pironi in separate inci-dents.…the shocks to the system that they delivered changed the game”.5
Since then Formula One has made safety a high priority; it has become part of their culture. Peter Wright quantifies the safety aspect in his excellent book Ferrari Formula One : “in the 60’s the chance of a driver being killed or seriously injured was 1 in 8 accidents, and in some years, 1 in 4; today it is better than 1 in 50”. Formula One Technical Regulations dealing with safety are Articles 13 through 18: Cockpit, Safety Equipment, Safety Structures, Impact Test-ing, Roll Structure Testing, and Static Load Testing. Wright states: “The philosophy behind these regulations is to define test conditions that must be met and to allow the designers to find the lightest and best way of meeting them, rather than specifying a construction that must be adhered to….More time and effort by all parties involved have gone into the development of these regulations than any other part. The work of the Formula One Technical Working Group on safety has now filtered down to the lower formulae, to the benefit of everyone who races.”6
A good example of Formula One’s learning culture in recent years were two crashes of Mi-chael Schumacher’s Ferrari. In 1999 his car’s rear brakes failed and the car ran straight into a wall, hitting it at about 66 mph. The nose absorbed impact energy as it was designed to do, but a tire hit the side of the car and broke the carbon fiber chassis monocoque. Schumacher suf-fered a broken leg as a result. Ferrari engineers used this crash, including data from the car’s accident data recorder (required since 1997) to improve the design of its next car, including adding Kevlar reinforcing side panels. This added capacity was shown in 2001 when Schu-macher had another high speed frontal impact during a test session. This time the monocoque did not fail, and the driver – arguably one of the sharpest humans ever at the sharp end of a sys-tem - walked away. The injury he suffered in the1999 crash cost him the drivers champion-ship; surviving the similar accident unscathed in 2001 allowed him to win the second in a series of five consecutive championships. Several figures related to frontal crash testing follow. They illustrate the analysis and testing required in Formula One with respect to driver safety.
Figure 2a Finite element analysis of the 2000 Ferrari monocoque undergoing the mandatory frontal impact test; red shows areas of highest stress

93
Figures 2b & 2c Before & After pictures of the mandatory frontal impact test – note the entire energy absorbing nose has been crushed but the monocoque suffered no damage CART Championship Auto Racing Teams (CART) was formed as a non-profit organization by a group of team owners in 1978 due to increasing dissatisfaction with how the previous govern-ing body (USAC) was running their sport. In 1979 CART took over running their series, which was the top level open-wheel racing series in North America. The CART board of directors was made up mainly of team owners, but also included driver and crewmember representatives, so that all of the primary participant stakeholders had a voice in the organization.7 They chose a respected former driver to act as Director of Competition, so someone with both driver and manager’s perspective could make the rapid and firm decisions required during a race event weekend. The series became very successful into the early 1990s; at that time it was consi-dered the most competitive racing series in the world. (Unfortunately it would not last; unhap-py with the amount of influence he could exert within CART, Indianapolis Motor Speedway CEO Tony George started the rival Indy Racing League or IRL in 1994. Reminiscent of both Douglas and Lockheed building tri-jet airliners in the 1970s, the market was not big enough for both series. Open wheel racing in America floundered due to this split. What remained of CART was absorbed by the IRL last year. This paper focuses on CART as the vast majority of resilience gains in the United States were made under its auspices.)
CART focused on safety from the beginning of its history; it was one of the areas of dissa-tisfaction under the previous governing body. One of the first major design changes it required of its cars addressed a major safety issue. CART required that the fuel tank be moved from the cars sidepods (the large areas on each side of the car between the wheels) to a position directly behind the driver in the center of the car. By adopting the Lotus design philosophy from their 1978 championship Formula One car, CART also moved the fuel tank to this much safer loca-tion. Open wheel racing’s history is full of fiery crashes; in an attempt to prevent these specta-

94
cular incidents as the result of relatively normal external disruptions, aircraft-type type bladders were added to the fuel tanks in the mid 1960s. This helped, but still did not prevent fuel spills in accidents where the car’s sidepods were damaged. Moving the fuel bladder to a position in the center of the car behind the driver all but eliminated crashes resulting in huge fireballs; now the main fire danger is when the cars are being refueled in the pits during a race.
CART, like Formula One, has long mandated that its pit crews wear full safety gear to combat this rare but dangerous events such as pit fires. The second picture below demonstrates the importance of that mandate. That fire was fed by the pressurized refueling system Formula One uses (made by a company that also makes helicopter refueling equipment) delivering near-ly three gallons of fuel per second. CART always used gravity fed refueling which is safer, cheaper, and more reliable, albeit slower; fuel spills that do occur are nearly always much smaller.
Figure 3a: Pit crew for Andy Granatelli’s STP turbine car at the 1967 Indy 500 - the only pro-tection they had were these loud uniforms
Figure 3b: Contrast the 1967 picture above with these two of a pit fire at the German Grand Prix in 1994; by this time CART and Formula One crews were required to wear protective suits. Six of sixteen mechanics in this brief but intense inferno suffered only minor burns.

95
Though they look somewhat similar to a casual observer and share a similar position of the fuel cell, CART is what is known as a ‘spec’ series, meaning the governing body produces a set of detailed specifications to which the cars must be built, in contrast with Formula One’s philoso-phy of providing a set of test conditions as discussed above. CART and Formula One cars are both made largely of carbon fiber construction and use the engine and gearbox as stressed members; the drive train is attached to a crushable structure behind the driver and carries rear suspension loads into the chassis. Outside companies manufactured the cars and sold them to CART race teams; teams could build their own cars but very few chose to. Engines were also developed by external suppliers within their own set of rules and leased to the teams. For the final season plus one race of CART’s history, a company in Georgia called Panoz constructed the most technologically advanced open wheel car ever built in the United States.
One of the major advances of this car was the changing of a major driver interface: the tra-ditional gear shift lever was done away with, and gear shifts were accomplished with a pair of paddles on the back of the steering wheel which electronically controlled the seven-speed transmission. This added to the resilience of the car in two ways: first, a driver is more effec-tive with two hands on the wheel, especially on a track where many gear changes are required each lap. Second, it also allowed the gear lever and associated linkage to be removed. This lessened the chances of injuries to the driver’s right leg by impacting the gear shift and linkage in an accident. (note: these cars became a casualty of CART’s “merger” with the IRL and were last raced one year ago in Long Beach as shown below; the IRL’s similar but less advanced cars are currently used)
Figure 4: Driver Nelson Phillipe turns his Panoz DP01 onto Shoreline Drive in the 2008 Long Beach Grand Prix; tire bundles are in foreground and background. Note similarity to a Formula One car, note also catch fencing and cutout for driver egress marked with pink ribbon One of the key support systems that was created by CART was its Safety Team. Created in 1984 and preceded in name by whatever company was sponsoring them at the time (Horton, Holmatro, even Simple Green, a local cleaning liquid manufacturer) the Safety Team became the world class model for sanctioning body safety organizations. The Team was created out of

96
an idea that the former driver and later CART chief steward Wally Dallenbach had, after seeing inconsistent levels of safety at the various tracks where the series competed compared to Indi-anapolis, which had its own infield hospital. Dr. Steve Olvey, CART’s medical director and a founding member of the Safety Team, used to volunteer at that hospital each May. The two talked, and eventually formed a dedicated team composed of a combination of doctors, EMTs, firemen, paramedics, and nurses that traveled with the series. They received specialized train-ing, as Dr Olvey noted that “The injuries that you get on the racetrack are very different, often, than what you get on the highway…Our crashes are more like what you see in plane crashes."8 In contrast, local safety personnel rarely had that type of training and usually only worked one or two races a year.
A team of certified specialists, which traveled to each event, was a major innovation in rac-ing. The Safety Team got to know the drivers and the drivers got to know them. Former driver Mario Andretti, who had seen the team in action for himself and for his three sons, commented “To see a friendly face when you can't move, when your ribs are all broken and bruised, and you see somebody you know, and you know he knows what he's doing, that's comfort with a capital C."9 The Team had their own trucks modified to carry medical, fire, and rescue equip-ment like the Hurst Jaws of Life hydraulic spreader / cutter tool. (a similar truck from another racing series that adapted this approach is shown in Figure 10) Beginning in 1988, the Team had their own mobile medical center traveling to each race as well. Over the years this facility was improved to where it had equipment, including an operating room, to perform all but the most major medical procedures.
One of the major examples of the impact the CART Safety Team has had is the horrendous accident Alex Zanardi suffered in September 2001. At an oval track in Germany in CART’s first race in that country, Zanardi was leading when he made his last pit stop. Returning to the track, the car spun out of control and into the path of another car that was traveling nearly 200 miles per hour. Modern open wheel cars are much safer than they used to be, but being speared in the cockpit area by another car at that speed was (and still is) outside their design envelope. The car was cut in two, as were Alex’s legs. Dr. Olvey described Zanardi’s situation: "Medical literature tells us that injuries like those suffered by Alex are 100 percent fatal. Usually, the injured person bleeds out, and Alex did lose about 70 percent of his blood. But most people are injured in car crashes or in places where help isn't less than one minute away."8
Dave Hollander, a firefighter from New Jersey who had been a team member for more than 300 consecutive races (second in seniority only to Dr. Olvey) was also part of the team that saved Alex’s life: "There was no panic, no commotion…Don't forget, we had two accident scenes. Tagliani's car was going about 200 when he hit Zanardi and he wound up a quarter of a mile away from Zanardi's car, and we didn't know how badly he was hurt. We had people working at both places. Hardly anybody talked. Everybody knew exactly what to do. They per-formed flawlessly."8 (note: Tagliani suffered only minor injuries)
Today, Zanardi is walking again with artificial legs, and has even resumed racing sedans in Europe (winning a 2005 race) with a combination of hand controls and traditional pedals. As he told fellow Italian driver Max Papis: “I owe the Safety Team my life”. NASCAR NASCAR has become extremely popular in the U S; some claim it to be this country’s most popular spectator sport. Organized in 1949 by William “Big Bill” France Sr., it is still run by the France family. Since 1982, when CBS first broadcast the Daytona 500 nationally, NAS-

97
CAR has by far made the best use of TV coverage to generate advertising revenue as an enabl-ing system. Five networks (Fox, ABC, ESPN, TNT, and Speed) vie for coverage of NASCAR races this season, in stark contrast the IRL season opening event was on Versus, which many people haven’t even heard of. Since NASCAR has generated much more money than CART, they could have done a lot more with regards to safety. Yet instead of choosing to do more, NASCAR chose to do much less. Why? Some of it stems from the cultural roots of NASCAR – drivers in souped-up cars driving moonshine through the back roads of the South. Given the macho image this form of racing came from, safety efforts were often looked upon as “unmanly or cowardly”7 according to author Rick Amabile, former race team member and grandson of the late Bill Vukovich (1953 & 54 Indy 500 winner who was killed during the 1955 race). Yet a major catastrophe for the sport, in this case involving only a single death, forced a paradigm shift onto NASCAR. A discussion of that event and how it forced the governing body to give safety a higher priority follows.
February 18, 2001 – The Daytona 500, NASCAR’s first race of the year and also its most important event, was just about to come to an exciting conclusion. Suddenly, the black #3 Chevrolet of Dale Earnhardt veers toward the outside wall and crashes into it. It is a violent crash, but one that doesn’t look worse than many the millions of fans watching on TV had seen before. Except this crash claims the life of the man who was the most successful driver taking part in that race: the seven-time series champion.
Mark Cipollini wrote the following as part of his editorial a few days later: “NASCAR is an incredibly successful sport. Everything they seem to touch turns golden. Their TV ratings are through the roof, their race attendance is second to none, their merchan-dising is stellar, their fans are extremely loyal, and their races are close and entertaining. Al-most anyway you measure it, NASCAR has done everything right. Except for safety. They get a big 'F' in that category.” He adds:
“It's a sad state of affairs to think it takes the death of a great driver like Dale Earnhardt before the racing industry wakes to the fact that more should be done in the way of safety. It's time for our industry to take their heads out of the sand.”10
Fast forward a year, to February 2002. Chris Jenkins wrote this article for the USA Today: “NASCAR turning the corner on safety”. Even the title suggests NASCAR has improved their failing grade. He states:
“Late last season NASCAR began requiring every driver to wear the HANS or the Hutchens device, a similar restraint — the most significant of the safety improvements NASCAR has made since Earnhardt's death.”
Forcing drivers to wear a restraint represented a major philosophical change for NASCAR. Perhaps reflecting a tendency to shrug off authority embedded in its moonshine-running roots, NASCAR was content for 50 years to leave most decisions about safety equipment to individu-al drivers. They generally used whatever felt the most comfortable. But the death of the sport's biggest icon prompted NASCAR to take a more active role in safe-ty. Seat-of-the-pants reckoning finally is being replaced by engineering, something that began happening in other forms of racing 30 years ago.”9

98
Figure 5 The HANS device, shown here in black, limits the acceleration on the head / helmet combination during an accident Why the sudden and rapid paradigm shift toward safety? What caused the cultural change in their organization, the “major philosophical change” referred to above?
32,000,000 fans watched the 2001 Daytona 500 on Fox. These fans’ expectations of safety would no longer tolerate the death of a major star of the sport, let alone the major star. Their expectations had increased since 1982 when CBS first broadcast the Daytona 500 live. They had increased since the 1994 race when another famous driver (Neil Bonnett) died in an acci-dent during the Daytona 500. They had further increased since the year before when the most famous driver in the sport’s history, Richard Petty, lost his grandson in a crash at a track in New Hampshire in 2000. The loss of “the sport’s biggest icon” less than a year later finally gave the sport a big enough black eye in the public’s mind for NASCAR to have to change.
Figure 6 below, from Mr. Jenkins’ article, shows a comparison of nine areas relating to safety among several major racing series. NASCAR has six of these nine items; five of them were mandated after the Earnhardt crash seen by those 32 million fans on TV. The sixth, hel-mets for pit crews, was mandated after a three crewman and a NASCAR official were struck during a pit stop in late 2001 and one of the crewmen suffered a serious head injury.
Compare this with CART and Formula One, the two main open-wheel series. The only ‘No’ in the table is Formula One not requiring the HANS device, and they did for the 2003 sea-son; the majority of their drivers were already using them. Additionally, it took until the 2002 season for NASCAR to actually require drivers to wear fireproof suits and helmets – prior to then these items were just recommended,11 as incredible as that may seem.
So why did NASCAR suddenly become so interested in safety? It certainly wasn’t because they were “the lead dog”, or even a part of the pack, since they were not even following the standards that other series had established. They were shamed into it after what was for them a huge tragedy, one that garnered attention far outside of the normal racing sphere of influence. To quote from Mr. Hann’s lecture on System Safety Engineering within Resilience Architect-ing: “Society’s expectations for systems, including their safety, continue to grow, so safety standards continue to become more stringent” and “Society’s expectations have done nothing but increase”12. The negative publicity generated after the death of the country’s biggest star driver was a reflection of those expectations, especially when NASCAR’s standards were shown to be lacking in comparison to CART or Formula One. Then and only then were changes made.

99
A comparison of how the different racing series rate in several areas of safety
NASCAR CART IRL Formula One
Requires head-and-neck re-straints?
Yes (new in mid '01) Yes No No
Requires helmets for pit crews? Yes(new for
'02) Yes No Yes
Has a series medical director? No Yes Yes Yes
Uses 'black box' crash data re-corders
Yes (new for '02)
Yes Yes Yes
Uses crash data to create comput-er models of accidents?
Yes (new for '02)
Yes Yes Yes
Approved carbon-fiber driver's seats?
Yes (new for '02)
Yes Yes Yes
Has a dedicated rescue team? No Yes Yes Yes
Uses an accident investigator? Yes (new for
'02) Yes Yes Yes
Requires full-face driver helmets? No Yes Yes Yes
Source: USA TODAY research
Figure 6 A February 2002 comparison of safety aspects from USA Today article by Chris Jen-kins. NASCAR still has does not have their own dedicated on-track medical and safety team; they remain the only major racing series not to have one. NASCAR has been a very successful over the past three decades; their focus was more on “growing the business” than on safety. Their success inevitably led to some “Titanic Effect”; like the Titanic sinking one event forced the series to change. Though they made many improvements in a relatively short time, the lack of a dedicated safety team shows that NASCAR still does not place a high enough priority on safety.
Also in stark contrast to Formula One and CART are the NASCAR cars themselves and the way they are constructed. The NASCAR “Car of Tomorrow” - an ironic name for cars built with steel tube frames, a technology that most other racing series abandoned decades ago - were required by the series for the 2007 season. NASCAR itself owns the design specifications of these cars. While NASCAR race cars look more like a car you see on the street, the COT as they are known are identical rear wheel drive tube frame chassis regardless whether they are painted to look like a Chevy, Ford, Dodge, or Toyota. Well-funded teams build over twenty of these cars for a single race season (Ferrari built only eight cars for both its drivers to share for the 2000 season). Surrounding the drivers with more steel tubing and strengthening their roll cages over the years is a double-edged sword: if the cars do roll over, the drivers are very well protected. But the far more common disruptions these cars endure are frontal or side impacts

100
with another car or a wall. In these impacts the energy tends to be transferred to the driver, as opposed to the crush zones which dissipate energy on modern open-wheel cars. One of the few technologies shared is the custom-molded seats; it was brought to the series by a CART team branching into stock car racing. The driver sits on a bag filled with foam and an activator is added; in a matter of minutes the foam cures, the bag is removed, and the driver has a seat insert which matches the contours of his body from the thighs to the shoulders. The in-sert provides better protection by limiting the driver’s movement in a crash. Another benefit is increased driver comfort during a race (the better a driver’s seat fits, the less “beat up” the driv-er will feel at the end of the day; I know this well from personal experience); a less-fatigued driver is nearly always a more effective driver.
Figure 7 The “Car of Tomorrow” shows the identical nature of these cars regardless of which automaker’s brand name or grill adorns them. Note that these cars bear little resemblance to open-wheel Formula One or CART cars Driver Protection The protective gear a driver wears can be both his first and last line of defense, depending on the nature of the disruption he experiences. Many differences are apparent from comparing the two images of Figure 9 below. The ‘vintage’ photograph shows the only real protection the driver carried was a pair of goggles to protect him from bugs or dirt getting in his eyes. The leather ‘helmet’ under the goggles offered little more protection than a baseball cap; a heavy shirt and no gloves rounded out Mr. Pingrey’s typical competitive attire of the period.
Contrast this with the photograph of the current Ferrari Formula One driver Raikkonen in Figure 9b. The first thing that stands out is that the driver has a helmet which offers real pro-tection (coupled to a HANS device), which includes a Lexan face shield for more robust and hi-tech bug protection. One of his gloves is also shown; these made with a fireproof material called Nomex as are his racing suit, socks, vella clava (a ‘sock’ for the driver’s head), shoes, and even his long underwear. Drivers have all but overcome the ‘nuisance’ or ‘Macho’ factors regarding safety devices that have been developed over time to protect them – that these devic-es restricted their movements, were uncomfortable, affected their performance, or even that they were for wimps. Gone is this paradigm from the days of the ‘fat driver / skinny tire’ men-tality.
The use of Nomex began with an unusual interaction. Astronaut Pete Conrad was also a racing fan, and in 1967 he introduced a man named Bill Simpson to this material that the Navy had used in its flight suits in 1965 and NASA adopted after the Apollo 1 fire. This humble be-ginning led to one of the largest single improvements in racing safety apparel history.

101
Simpson had begun making specialized braking parachutes for drag racers, after recovering from a pair of broken arms after he crashed his own dragster in 1958. He described his own epiphany: "Until then, I was like most drivers…the only time I thought about safety was after I'd been hurt. This time, I was hurt bad enough to do a lot of thinking." After his introduction to Nomex, a flame-resistant aramid fiber made by DuPont, he made a prototype of the first real-ly “fireproof” suit and took it to Indianapolis in May of 1967. To call his innovation a success would be a major understatement; Simpson described it like this when he was inducted into the Motorsports Hall of Fame: "Come race day, there were something like 30 Nomex suits on the grid (of 33 drivers starting the Indy 500 that year), and they all said 'Simpson' on the sleeve. I was pretty proud of that. Still am."13 By the next year he was selling his goods all over the world, and he moved to a larger building in Torrance. Simpson Race Products developed a full line of safety gear over the years; I bought my first helmet and driver suit from their Torrance shop in 1996. In 2002, only 35 years after Simpson introduced the Heat Shield Firesuit, NAS-CAR finally made firesuit use mandatory for its drivers.11
One recent innovation by Simpson was the introduction of CarbonX into their product line. This material contains oxidized polyacrylonitrile (O-PAN) fibers which are said to be similar to some aircraft brake materials. When they are exposed to heat and flames in use, the fibers char from the outside first while expanding, which takes up space of the air needed to keep the fire going.14 CarbonX has a flame retardant rating of just over twice that of Nomex; DuPont claims this is more protection than required in a normal atmospheric environment; time will tell if this new material will represent a paradigm shift in firesuit construction.
Figure 8 Torch testing results comparing CarbonX to Nomex, as tested by Chapman Innova-tions, makers of CarbonX material for firesuits Another famous name in racing safety also had its roots in Southern California. A former racer and car builder named Roy Richter bought a small company called Bell Auto Parts in 1945. A year later a friend was killed while racing and Richter, as Simpson, decided to work on making racing safer. In 1954 he produced the first helmet sold under the Bell name, the next year a Bell helmet was worn by a driver in the Indy 500. The first major innovation he makes was to incorporate a non-resilient polystyrene liner into a helmet in 1957. Two years later, when the LAPD required its motorcycle patrolmen to wear helmets, they became the first of more than 800 law enforcement agencies to use Bell helmets. This was their first venture outside of mo-tor racing.
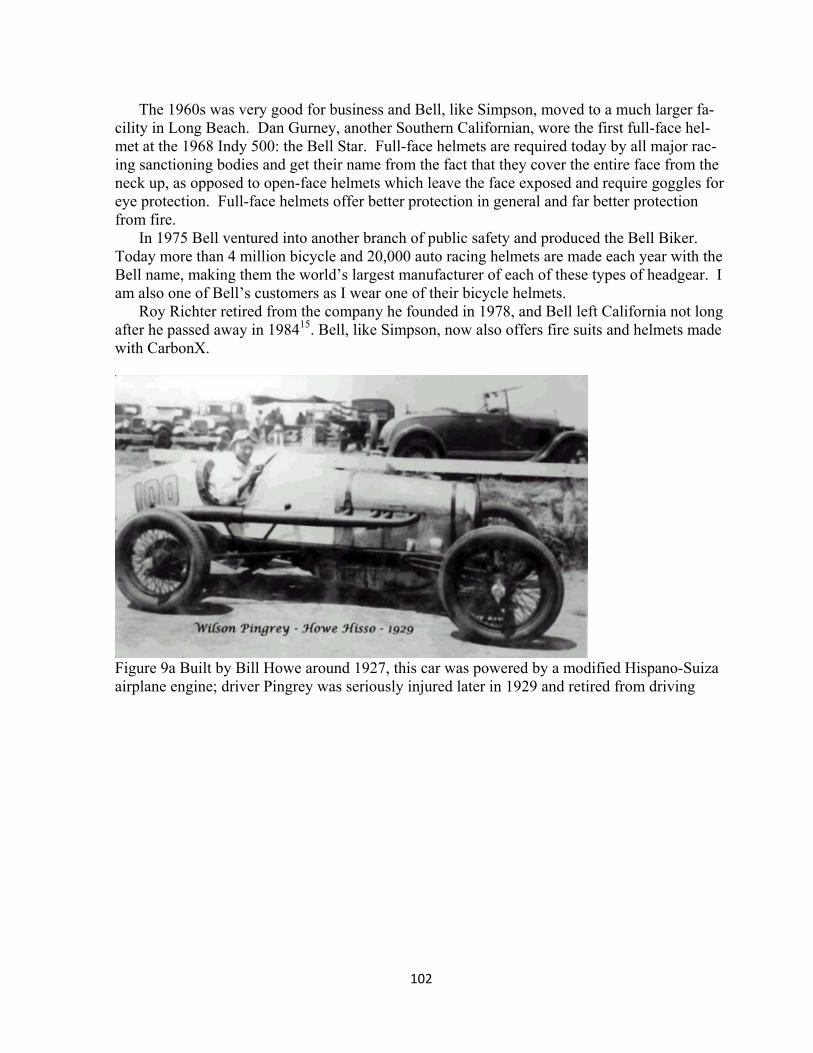
102
The 1960s was very good for business and Bell, like Simpson, moved to a much larger fa-cility in Long Beach. Dan Gurney, another Southern Californian, wore the first full-face hel-met at the 1968 Indy 500: the Bell Star. Full-face helmets are required today by all major rac-ing sanctioning bodies and get their name from the fact that they cover the entire face from the neck up, as opposed to open-face helmets which leave the face exposed and require goggles for eye protection. Full-face helmets offer better protection in general and far better protection from fire.
In 1975 Bell ventured into another branch of public safety and produced the Bell Biker. Today more than 4 million bicycle and 20,000 auto racing helmets are made each year with the Bell name, making them the world’s largest manufacturer of each of these types of headgear. I am also one of Bell’s customers as I wear one of their bicycle helmets.
Roy Richter retired from the company he founded in 1978, and Bell left California not long after he passed away in 198415. Bell, like Simpson, now also offers fire suits and helmets made with CarbonX.
Figure 9a Built by Bill Howe around 1927, this car was powered by a modified Hispano-Suiza airplane engine; driver Pingrey was seriously injured later in 1929 and retired from driving

103
Figure 9b Eighty years later and much has changed: the 2009 Ferrari F60 driven by 2007 World Champion Kimi Raikkonen Another major gain in protecting the driver has been the myriad of improvements in the design and construction of the car he drives. One of the best ways to protect the driver is to make the car around him more capable of absorbing disruptions; the photos in Figure 9 show the extreme contrast in design philosophies of their day, including how much more protected the driver is by the car he drives. One of the most obvious things missing from the ‘vintage’ picture (Figure 9a) is any type of seat belts. This is one of the earliest vehicle safety system improvements; they began being used at the Indianapolis 500 in the 1930s.7 Keeping the driver from sliding around in the seat provided a performance improvement as well as the obvious safety benefits of not flying out of or around inside the race car during a wreck. Seat belts were required for amateur racers by the Sports Car Club of America in 1954, their installation was not federally mandated in passenger cars until the early 1960s. The National Highway Traffic Safety Ad-ministration estimates seat belt use saved over 15,000 lives in 2006 in the United States alone.16 Another safety item taken for granted in cars for decades also had its beginnings in the early days of the Indianapolis 500: the rear view mirror.7 This is another simple invention that can greatly improve situational awareness on the race track or on public roads, and like seat belts can be very effective – if the humans involved choose to use them.
The Figure 9 photos above also show how much tires have changed over the years; they have done far more than simply go from skinny to fat. One problem that has been dealt with through the years is how tires fail. Most racing series now utilize tire pressure monitoring sys-tems as part of the data being sent by the race car to back to the team to identify tire problems as early as possible. Sudden tire failures or “blowouts” can be very dangerous - the driver can quickly become a passenger as the car takes him for a ride. On a crowded racetrack, this single failure can lead to an unpleasant disruption for many drivers. The sudden loss of grip from one corner of the car can cause it to react quickly and violently when the tire “equalizes” (a racing euphemism for the pressure inside the tire instantly becoming equal to ambient pressure). Stock car racing had many of this type of tire failures, as they were (and to this day still are) the heaviest racing vehicles of any major racing series in the 1960s: 3400 lb vs. a mere 1323 lb (600 kg) for a Formula One car. The extra weight combined with the high “banking” (sloping the pavement surface toward the inside of the turns which promotes higher cornering speeds) of

104
the longer oval tracks combined to put tremendous loads on the right side tires since American oval races are run counterclockwise.
Racing tire failures can lead to a lot of negative publicity, as well as being a major safety is-sue, so it is in the tire company’s best interest to fix any problems. To address the blowout problem, Goodyear developed a system that introduced a measure of gradual degradation into their tires. The “Lifeguard Inner Liner Safety Spare” was introduced in 1966. An inner liner is basically a tire within tire; if the main tire is compromised by wear or debris, the inner liner will maintain a reduced level of pressure in the tire. The driver has time to observe that his ve-hicle is operating at a reduced capacity, and slows down to pit and have the tire replaced. This system is quite effective; at the time Goodyear shared this technology with its main competitor Firestone. Sharing technology among competitors is extremely rare in motor sports, but when it occurs it is almost always in the name of safety. In 1990, Goodyear introduced a more effec-tive tubeless version of the inner liner.17 This innovation has not been widely adapted in road cars, due to the extra cost of this added safety system, and also because these tires have stiff ride characteristics that the average driver would find objectionable. Tire manufacturers like Goodyear (sole tire supplier to NASCAR) and Bridgestone and its subsidiary Firestone (sole suppliers to Formula One and the IRL respectively) continue to use racing as a ‘rolling devel-opment laboratory’ as well as a major marketing tool. Disc brakes are another significant resilience improvement that occurred through motor racing. The use of disc brakes in racing cars can be seen as one of the largest single improvements to the vehicle system. The idea wasn’t new: a form of disc brake had been patented 50 years be-fore Jaguar brought them to racing by an Englishman named Lanchester for cars that he built. Two American manufacturers, Chrysler on the large Crown Imperial and Crosely on the tiny Hot Shot model had limited offerings of disc brakes as an option in 1949-50, but nothing much came from either of those. Jaguar worked with Dunlop and Girling to perfect disc brakes; one Jaguar source states “the modern [automotive] disc brake was born in postwar England at the Dunlop Rubber Company”.18 After their installation on the C-Type Jaguar in 1952 (C stood for Competition), the paradigm shift in racing was on.
Disc brakes are somewhat more effective at stopping a vehicle once, but they have many other advantages over drum brakes. They are much less likely to fade: repeated hard usage heats up brake assembly, which causes drum brakes to lose stopping power (i.e. fade). This is the exact type of usage racing brake systems get, so disc brakes were a performance and safety improvement. Additional performance gains resulted from disc brakes being lighter than their drum brake counterparts. Also this weight is what’s known as ‘unsprung weight’: it is not sup-ported by the car’s springs or suspension. Unsprung weight is the best kind of weight to re-move from a vehicle to improve its handling, so this made the lighter disc brakes that much more of an improvement. Disc brake systems are also simpler, so they tend to be more reliable. And in endurance races like those the C-Type Jaguar was built for, it was easier and faster to replace a set of disc brake pads than it was to change drum brake shoes; endurance races like the 24 Hours of LeMans are often won by the car that spends the least time in the pits. Most endurance race cars today use carbon brake pads and rotors which can generate peak braking decelerations of up to five g's, need minimum temperatures of 500º C to work effectively, and can exceed 1000º C peak temperatures. The rotors take months of curing to manufacture and are designed to be used up during a single race; few of us need or would be willing to pay for this level of performance. So while disc brakes have become standard on automobiles today, very few production vehicles offer carbon brakes.

105
Race Tracks One of motor racing’s major enabling systems are the tracks where the teams race. These sup-porting systems have evolved over the years to keep participants as well as the spectators safer. The term “evolved” states once again that these changes were usually reactive in nature.
Taken last year near the finish line at the Long Beach Grand Prix, this picture illustrates what is known as ‘catch fencing’ – the silver fence immediately surrounding the track. This fencing is made up of large diameter posts, and is reinforced with four steel cables. The fence posts are anchored into eight ton concrete blocks. At times these blocks have been moved by accidents, but these barriers have never been breached. Note that the posts angle inward at the top as an added measure to contain debris from a crash. Note also that blocks are flat on both sides which allows cars to bounce off of them, unlike the k-rails used in highway construction, which are designed to invert a vehicle against the rail after a hard impact instead of allowing it to bounce. The race car can protect its occupant much better if it remains upright than it can inverted. The green fencing is a secondary fence which provides a buffer zone to further sepa-rate the fans from any mayhem on the track, which in this case is also Shoreline Drive. Over two hundred thousand people may have stared through the miles of this fencing last April dur-ing the last race weekend ever sanctioned by CART. It is unlikely many of them considered its safety aspects; they probably just wished it didn’t keep interfering with their view or pictures. Similar catch fencing has been installed at permanent race tracks. Oval ‘super speedway’ tracks like the Indianapolis Motor Speedway have taller catch fencing, as the cars are traveling faster and therefore contain more energy.
Figure 10: A broken race car stopped near a No Stopping Any Time sign Note the sanctioning body (IMSA in this case) dedicated safety truck and personnel. Even race track walls are becoming more resilient, in both contexts of the word. Impacts into concrete walls transfer a lot of energy into the car and the driver. A ‘softer’ wall would lessen the severity of this common incident. But how do you make a concrete wall softer? The de-

106
velopment of SAFER barrier system at Midwest Roadside Safety Facility at the University of Nebraska-Lincoln was undertaken to do just that. Installed in 2002 at Indianapolis, and most other major oval tracks in the United States between 2003 and 2005, SAFER (which stands for Steel and Foam Energy Reduction) barriers are designed to help absorb impact of a vehicle when it hits the barrier and distribute the energy along a larger portion of the wall. It also re-duces the chances of the car being bounced back out into the track, where it could become a major disruption for other drivers. The picture below illustrates the construction of the system: foam blocks are spaced along the existing concrete wall, and rectangular steel tubes are used to form a new wall inside of the track’s existing concrete walls.19 Parts of the barrier can be re-placed in sections when they become damaged in a crash, so that the racing can resume without too much delay. (NASCAR contributes funding toward the continuing development of SAFER – another of the effects of its paradigm shift regarding safety)
One of the original ‘soft wall’ concepts has been in use for decades: tire barriers. Tire bar-riers are essentially stacks of tires placed in front of a wall where cars might impact to absorb and dissipate the impact energy. Someone even labeled them “spherical energy absorbers”, perhaps to highlight their low-tech nature. Formula One technical expert Peter Wright de-scribes them as “an extremely practical way of building barriers in a variety of configurations and of providing a reasonable degree of protection. Used tires are plentiful in every country in which motor racing takes place, barriers can be assembled by unskilled labor…tires weather well and survive minor impacts without damage…All this adds up to a feasible, low cost bar-rier system. The only serious, practical problem I have heard of is that they collect rainwater and provide ideal breeding grounds for mosquitoes!”20 Even simple systems can have unin-tended consequences.
Figure 11 A section of SAFER barrier shown here at the Midwest Roadside Safety Facility; director Dr. Dean Sicking is third from right Though tire barriers are a simple system, they have also evolved over the years. It soon be-came apparent that the tires worked better as a connected system than as piles of individual tires, and were much less likely to be scattered in an accident becoming a potential debris ha-zard themselves, so they were bundled together with steel straps. Testing in the 1990s showed

107
they worked more effectively when bolted together as opposed to strapping them; this is how the tires barriers shown in Figure 4 are constructed. This picture shows one of the most effec-tive ways to utilize tire barriers: where cars are likely to impact them at low speeds. The car in the picture would impact the tires at less than 30 mph as this is the slowest corner they will en-counter over the entire racing season. At this speed, the car is unlikely to be damaged when hitting the tires, and the driver can recover from an embarrassing but relatively harmless error.
At natural terrain road courses - tracks that are laid out over the landscape that do not use public roads – a variety of simple but effective steps have been taken over the years to make them safer and more resilient. Most of these changes were reactive as well, and obvious in hindsight. If cars tended to go off the track in a certain area, perhaps it would be a good idea to cut down the trees in that area. Guard rails were added at many spots around a track, and then often moved back to allow the driver to recover the car, or at least allow it to dissipate more of its energy before impacting the barrier. These areas of extra space are known as runoff areas, and have led to many recoveries from both Type A and B disruptions for many drivers. Runoff areas allow for avoidance and gradual degradation: if the human in the loop makes an error, the car may get off of the track, the driver will have to slow down to recover control, and the tires will pick up dirt which will be a temporary performance degradation - but the car will still be operational. At a temporary street course like Long Beach (Figures 4 & 10) or an oval, the same error would likely result in contact with a wall, ending the day for the car and driver. Natural terrain courses are far less brittle enabling systems than ovals or temporary street courses. Most Formula One races are run on natural terrain road courses as were about half of CART’s races; NASCAR is an oval track series and only runs two races a year on road courses. In some cases where the cars have gotten “too fast for the track” as speeds increased over the years, chicanes have been added. A chicane is a combination of two tight adjacent turns, either left/right or right/left, and works basically the same way a speed bump in a parking lot works. Drivers cannot negotiate them without reducing speed; this reduces the maximum speed the car reaches on the straightaway before entering the next turn. If an accident were to occur, it would be at slower speed and involve less energy. This practice of adding chicanes has been used with varying success to adapt some decades-old enabling systems to the increasing levels of technology that have increased the speeds of the cars competing on that track. Cross-scale Interactions As this paper has already indicated, the increased level of resilience that motor racing has achieved has affected our everyday lives far more than the average individual realizes, mostly through improvements that have benefited the largest transportation system on earth: approx-imately one billion automobiles. Racing has been at the forefront of the development of the automobile for over a century; men have been racing cars for nearly as long as there have been cars. Addition examples of these improvements are summarized below.
The most obvious improvements in current road cars are those involving tires. In the 1950s both road and race cars ran on relatively narrow bias-ply tires; today these tires are only seen on old cars at shows. Radial tires lasting five times as long as those bias-ply tires have long since replaced them. Tire manufacturers have used racing to develop their products as long as the oil companies have, resulting in longer lasting and more effective tires due to improvements in construction, materials, and tread design. Two relatively recent developments directly from Goodyear’s involvement in racing are uni-directional tread patterns developed for rain tires for

108
CART which were introduced on the production Corvette; a later development was asymmetric tread designs from their Formula One rain tires which now are the standard for high perfor-mance street tires.17
Oil companies have long used racing as a developmental laboratory; a prime example is Shell and Ferrari. Enzo Ferrari used Shell oils as far back as 1927; when Ferrari won its first grand Prix in 1951 it was using Shell products. In 1996 Shell became a ‘technical partner’ with Ferrari for fuels, oil, and other lubricating products; the V-Power gasoline available today at the local Shell station was developed from its Formula One fuel.6
A little-known example of a major improvement through racing came from the Indianapolis 500 in the late 1930s. The Speedway implemented a rule that no oil could be added during a race; five hundred miles was a long way to go in those days without adding oil. This forced racing engine designers to reduce oil consumption; to reduce leakage from the engine and “blowby” into the combustion chambers. Soon afterwards most road cars could actually go longer than the distance it took to use a tank of gas before they had to add a quart of oil.
Other racing-derived improvements have made our automobiles more resilient that were discussed in this paper are seat belts and the rear view mirror, as well as the disc brake which is simpler, lighter, and more effective than the drum brake it replaced. Lighter aluminum engines are now far more common as well; my car has a Chevrolet-developed LS1 engine even though the car was built in Australia. Chevrolet built a relatively small number of aluminum racing engines in the 1960s, and then had numerous problems when the company mass-produced alu-minum engine blocks for the Vega in the 1970s. The company found out the hard way that they had not perfected aluminum engine technology. In the 1980s Chevrolet partnered to de-velop the aluminum Ilmor-Chevrolet engine for CART, and by 1988 these engines won all but one race that season. The knowledge gained from this successful design led to the LS series of engines introduced in 1997 which continue in production today.
Not that many safety items that a race driver wears carry over into our daily lives; very few people drive with helmets on. But many people who ride bicycles or motorcycles do wear helmets, and as discussed above, Bell is the largest manufacturer of bicycle helmets in the world. The company’s beginnings were in making motor racing helmets, and it leveraged its knowledge of design and materials into a very successful bike helmet business. Once again improvements derived from racing affected another one of the world’s largest transportation systems, at least for those of us who wear helmets while riding.
The last cross-scale connection to be discussed is one of the most unusual I have encoun-tered, between Formula One and a hospital emergency room. The textbook states: “Human-intensives may contain hardware and software, but the predominant elements are humans.”2 That certainly describes a hospital. It also describes a racing team. Though at first glance they seem to be totally unrelated, both consist of a large group of people have been gathered to focus on helping one single person, albeit the driver instead of the patient. A pair of British doctors noticed similarities while watching a race, and had an epiphany that led to better connectivity at their hospital.
After “a particularly bad day at the office" at the Great Ormond Street Hospital, as he de-scribed it, chief cardiac surgeon Martin Elliot sat down to unwind with fellow doctor Allan Goldman by watching a Formula One race on TV. Race fans already, they noticed on this par-ticular Sunday that there were similarities between the twenty-member pit crews that could change four tires, refuel the car, clean the air intakes, and send the driver back into the race (sometimes in less than seven seconds) and their own patient handoffs between the surgical

109
team and the Intensive Care Unit team. They saw the precision at work during the pit stops and thought the hospital could learn something from the racing world.
The doctors asked the nearby McLaren team (also in Britain) to “provide insights into pit-stop maneuvers”. The team gave a presentation which discussed their use of a human factors expert, and how their error recording system focused on small problems which might not get noticed, rather than the large ones which were obvious. (this is very reminiscent of two of our lecture topics: repeated audits, and focusing on the bottom right of the risk matrix). After that, the hospital contacted Ferrari. A team of doctors were invited to a practice session for the Brit-ish Grand Prix at Silverstone to see the pit crew in action first hand. Then, in early 2005, Drs. Elliot and Goldman traveled to Ferrari headquarters. The video they brought with them of their handover process did not impress Nigel Stepney, then racing technical director. Stepney couldn’t believe “how clumsy and informal the hospital handoff process appeared”. He pro-ceeded to explain to the doctors that each member of the pit crew has a particular job to do and that he has to do it silently, as they are all wearing fireproof helmets. The hospital footage he had just seen showed several simultaneous conversations as well as equipment being hooked up / unhooked somewhat randomly.
Two more major differences were pointed are that the pit crew tried to consider and train for ‘emergencies’ that might happen during a race; the hospital team was reactive only dealing with problems as they came up. Another major difference was no one on the surgical team had the specific responsibility to lead the handoff team. During a Formula One pit stop, there is one man with a round sign known as the lollypop whose sole responsibility is to ensure all the work is done correctly, the pressurized refueling hoses are disconnected from the car, and that there are no other cars coming. Only when he decides it is safe to send the car does he lift the sign up, and only then is the driver supposed to leave. Dr. Elliot and his colleagues began Operation Pit Stop at the end of 2003, trying to incorporate what they had learned from the Ferrari team. Doctors from the hospital wrote a paper on 23 handoffs before implementing Operation Pit Stop procedures and 27 handoffs afterwards. The study found errors dropped by over 40% and that communication problems decreased by nearly one half. There was also a drop in morbidity: illnesses the patient did not originally have. The handoffs also are slightly faster now – though not anywhere close to a seven second pit stop.
Dr. Nick Pigott summed up of Operation Pit Stop quite well: “…there is no doubt that it is our research with Ferrari that has honed our transfer from theatre to intensive care to the level of silent precision it is today”.21, 22 I recall when I first heard of this story while watching a Formula One race myself I thought this was a good idea. Now I have a better understanding of why it is a good idea: it improved cross-scale connectivity across a critical boundary between a pair of systems at a children’s hospital.

110
Figure 12 The high level of organization of a Formula One pit stop helped 18-month-old Alex-ander Barham’s handoff from surgery to recovery (seen here being wheeled into the ICU in August of 2006 at; he went home in less than a week) Summary and Conclusions The February 9th class lecture stated that “resilience is safety with a bigger view”.23 This paper examined racing with that larger view and showed that racing has increased resilience both within the sport and beyond. Motor racing, while still a dangerous endeavor, is much safer to-day than it was when I became a fan some four decades ago, not only for its drivers but for crewmembers and even the fans at the tracks. Racing’s increases in resilience has effects in the automotive world and beyond.
The two open wheel series discussed in this paper have done more with respect to resilience and have been more concerned with safety, so their participants are safer. Formula One has spent the most effort on safety and building resilience into their regulations on car construction and testing. Their Technical Working Group continues that effort. CART at one time was ar-guably the premier open wheeled racing series in the world; like Formula One they made safety an organizational priority. Similar to Formula One their sport became more resilient as they used past disruptions to improve their systems. Both these series employed modern design phi-losophies involving composite materials and crushable structures to produce more resilient race cars. The most notable resilience gain CART achieved for their sport was the creation of their Safety Team. This group was the ‘gold standard’ model that most series have tried to emulate. NASCAR has made progress, but still has not reached the standards of the other two organiza-tions discussed. NASCAR was still reactive long after Formula One and CART had become proactive about safety. Their “Car of Tomorrow” still embodies many of the design philoso-phies of yesterday. The bulk of the progress NASCAR achieved was after the death of their biggest star, during their biggest race. This also illustrates that safety must be a priority for the governing body, or resilience gains will be lacking.
Racing drivers at all levels are much more well protected, thanks in part to the efforts of two Southern Californians who made safety their life’s work. Racing has become more resi-lient because the operators have far more capable systems in today’s racing cars. The tracks where the races are held, a major enabling system, have had major resilience improvements as well.

111
In fact, we are all safer today because of the many advances that have been made through motor racing. Twenty-first century cars have seat belts, a rear view mirror, disc brakes, and roll on tires and burn fuels improved through years of racing. Racing developments have impacted today’s automobiles in far more ways than the average individual realizes. There are even areas outside the automotive world that have benefited from cross-scale interactions with motor racing. Racing truly has increased resilience.

112
References 1) Foilan Gonzalez quote. http://www.e-kmi.com/article.cfm?article_id=2478 2) Jackson, Scott, Architecting Resilient Systems, (Preliminary edition) John Wiley & Sons, 2008 3) Swan, Tony, “Blown Away, 2009 Chevrolet Corvette ZR1” Car and Driver magazine, February 2009, pgs 32-36 4) http://www.motorsportmemorial.org 5) Crask, Andrew, “DNA, Formula One’s periodic radical rule revisions have not altered the pecking order significantly” Racer magazine, April 2009, pg 74 6) Wright, Peter, Ferrari Formula One, David Bull Publishing, Phoenix AZ, 2003, ISBN-1-893618-29-3 7) Amabile, Rick, The Insider’s Guide to Indy Car Racing AM Cars, Fresno, CA, 1989 ISBN-0-9622382-0-1 8) “Crucial Crew, Safety team allows CART drivers to feel safer at work” October 17, 2001 http://sportsillustrated.cnn.com/motorsports/news/2001/10/17/safety_team_ap/ (no au-thor noted) 9) Jenkins, Chris, “NASCAR turning the corner on safety” February 10, 2002 http://www.usatoday.com/sports/motor/nascar/2002-02-10-safety-cover.htm 10) Cipolloni, Mark, “Safety - It's going to take more than just magic to fix” February 21, 2001 http://www.autoracing1.com/MarkC/2001/0221Safety.htm 11) Rodman, Dave, “NASCAR mandates helmets, fire suits in 2002” Turner Sports In-teractive, December 11, 2001 http://www.nascar.com/2001/NEWS/12/11/rodman_helmets/ 12) Hann, Stu , Thoughts About System Safety Engineering Within Resilience Architect-ing lecture, USC SAE 599a, March 2, 2009 13) http://www.mshf.com/index.htm?/hof/simpson_bill.htm 14) http://www.chapmaninnovations.com/products/carbonx.php 15) http://www.bellracinginfo/history.html 16) “Motor Vehicle Occupant Protection Facts” (revised August 2008), National High-way Traffic Safety Administration 17) http://www.racegoodyear.com/innovation/track_street.html 18) http://auto.howstuffworks.com/jaguar-c-type5.htm 19) http://www.jayski.com/pages/softwalls.htm 20) Wright, Peter,”Barriers”, July 21, 2001 http://www.grandprix.com/ft/ftpw016.html 21) Greaves, William, “Ferrari pit stop saves Alexander's life” London Daily Telegraph, August 29, 2006. http://www.telegraph.co.uk/news/1527497/Ferrari-pit-stop-saves-Alexander%27s-life.html 22) Gautam Naik, “New Formula - A Hospital Races to Learn Lessons of Ferrari Pit Stop” Wall Street Journal, November 14, 2006 http://www.post-gazette.com/pg/06318/738252-114.stm 23) Jackson, Scott, Case Histories and Capabilities lecture, USC SAE 599a, February 9, 2009

113
References - Photographs Ferrari FEA and crash test from Ferrari Formula One STP Pit Crew. http://www.lib.niu.edu/2002/ih090210.html German GP fire. http://www.atlasf1.com/2000/ger/preview/album/ Long Beach catch fencing and tire bundles by the author HANS device AP Photo, from Chris Jenkins USA Today article Car of Tomorrow. http://www.onebadwheel.com/images/car-of-tomorrow-05.jpg CarbonX torch testing. http://www.chapmaninnovations.com/products/carbonx.php Howe Hisso in 1929. http://winfield.50megs.com/Hisso.htm Ferrari F60 http://www.thescuderia.net/2009/Images/Testing/Mugello19-22Jan/ MugelloTest1922Jan.shtml Pit stop photo. http://auto.howstuffworks.com/ferrari-f1.htm/printable Hospital handoff team photo from London Daily Telegraph article

114
Political Factors in the Space Transportation System Resilience Architecting by Phan Phan, [email protected] Abstract In systems architecting, an architect may make technical choices but value judgment be-longs to the client. And for federally-funded systems, the ultimate client is the United States Congress, who, by our Constitution, authorizes and appropriates budget for their development, production or construction, operations and maintenance. In prioritizing and allocating limited national resources to a program, the Congress expresses value judg-ments in terms of benefits to its represented constituencies. As such, the political process, inherently complex and often divergent in a democracy, intimately interacts with the sys-tems architecting process. This interaction does not only affect a technological system’s mission requirements and design attributes but also its product-centered infrastructure’s organizational and technical capabilities. The Space Transportation System (STS), a.k.a. the Space Shuttle, has been no exception to these interactions between politics and sys-tems architecting. Given such inescapable environment, this paper examines how various political factors have impacted the STS resilience in general, and contributed to cata-strophic losses of Challenger and Columbia in particular. I. Introduction In systems architecting, an architect may make technical choices but value judgment be-longs to the client’s province. For federally-funded systems, the ultimate client is the United States Congress, who, by our Constitution, authorizes and appropriates budget for their development, production or construction, operations and maintenance. In prioritiz-ing and allocating limited national resources to a program, the Congress expresses value judgments in terms of benefits to its represented constituencies. As such, the political process, inherently complex and often divergent in a democracy, intimately interacts with the architecting process. This interaction does not only affect a technological system’s mission requirements and design attributes but also its product-centered infrastructure’s organizational and technical capabilities. Specifically, the political process can shape and influence the system architecting process as follows:
• Politics, not technology on its own merit, controls what technology is allowed to achieve by imposing, or relaxing, schedule, budget and regulatory con-straints on a program.
• Politics = money, i.e. cost rules. Proponents of the system have often over-
stated system benefits and under-estimated its costs to get their program started or sustained. And the budget approvers, trying to accommodate as
115
many constituencies’ programs as possible into a fiscal year, will invariably stretch out individual programs, and delay or delete some system capabilities.
• In order to win, and re-win, a fair share of the annual budget, it is essential to
build and maintain a strong constituency for enduring political support of the program. However, lack of coherence due to diverging interests will result in conflicting requirements and compromised system design.
• Technical problems become political problems. Highly visible accidents, mi-
shaps or critical reports are often politicized through the media to shape and influence public opinion, and thus value judgment, by both proponents and opponents of a program or system.
• Likewise, political problems can also become technical problems. To reflect
political mood or sentiment of the country, national priorities are ever shifting that often results in technical issues and challenges at the program level.
And the Space Transportation System (STS), a.k.a. the Space Shuttle, has been no excep-tion to these interactions between politics and systems architecting. Given such inescapa-ble environment, this paper will examine how the above political factors have impacted the STS resilience in general, and contributed to catastrophic losses of Challenger and Columbia in particular. 25 II. Politics controls what technology is allowed to achieve1
In large and highly visible government-funded programs such as the Space Shuttle, poli-cy decisions have invariably imposed fiscal, schedule and regulatory constraints on sys-tem architecting. These political constraints, or lack thereof, can significantly shape and influence strategic decisions made during the development phase. Throughout the system life cycle, these early decisions will cast far-reaching effects that are difficult, if not im-possible, to change. This section will examine how the above constraints had driven stra-tegic choices regarding the Shuttle’s architecture and its resultant resilience. A. Political reality and fiscal constraints For the post-Apollo era, NASA’s grand vision of its manned space flight program had encompassed a constellation of increasingly larger outposts in Earth orbit. Other space stations would be placed around and on the moon. Manned missions for exploration of Mars had also been planned. As part of this original system of systems (SoS), a vehicle design ferrying crews and supplies to and from low-Earth orbit was conceptualized. Some of the original strategic choices for this SoS architecture were to launch the space stations atop Apollo’s expendable Saturn V rockets, and to design the space shuttle as a fully reusable system, and for the single purpose of servicing the space stations.2, 4
Above strategic choices of expendable rockets and reusable vehicles had been based on cost/benefit judgment. For low usage as with most space launch systems, expendables would be preferable due to lower total life cycle cost and lesser cost risk. In this case, Sa-

116
turn V booster was a government-off-the-shelf component, whose development cost had already been paid for. Within a SoS architecture, expendables are also arguably more re-silient to failure as the loss of one unit would likely impact less on the total operation than that of a reusable one. For high usage as in the case of the Space Shuttle’s frequent servicing of the space stations as envisioned above, reusables would be more economical overall. Furthermore, one could attribute the strategic decision for a single-purpose ve-hicle to efficiency for such a design could be optimized for its focused mission. However, total investment at risk per use was inherently high. To minimize this risk, the system de-sign had to have more reliable components.3
Nevertheless, NASA’s high-flying ambition had little, if any, connection with earth-bound political reality then. With Apollo’s lunar landing, the U.S. had won the race, and all political support for another large-scale space program evaporated. The LBJ Adminis-tration had also been pre-occupied with the Vietnam War, with its other priority on Great Society programs. NASA’s budget was further mutilated by President Nixon’s Office of Management and Budget and the Congress. As a result, any space station was deferred, and Saturn V production cancelled. Due to election year politics and token international prestige, the Space Shuttle was the only manned space flight program saved, but with stringent constraints on both development budget and operating cost. 2, 4 (See Section III, Cost Rules, for detailed discussion of NASA shrinking and stretched budget.)
To stay within short-term fiscal constraints, NASA had to make some architectural trade-offs on the Space Shuttle design, often resulting in higher life cycle cost and lower system resilience. The original architecture of a two-stage fully reusable vehicle would have required more than half of NASA’s total budget in 1971 to implement, and was thus abandoned. Reusable fuel tanks were replaced by expendable ones.4 In this compromised configuration as seen today, insulation foam flaking off from the external tank and strik-ing thermal protection tiles on the Orbiter had been a chronic type-B disruption. Well known yet unavoidable and ignored from the very first flight of STS-1, this undesirable interaction between the two components eventually resulted in the loss of Columbia.
In another strategic design change, manned booster stages gave way to unmanned. 4 Exacerbating system vulnerability and higher operating cost was the decision to use solid propellant, instead of liquid fuel, to power strap-on rocket boosters, based largely on low-er development cost.2 The loss of Challenger has been directly attributed to the degrada-tion of a solid rocket booster O-ring seal in cold weather.5 Even though dismissible as a component failure by the first quick look, rigorous examination would reveal a multiple-agent disruption caused by O-ring misapplication, poorly designed joint, adjacent critical support strut, inopportune wind shear and aerodynamic pressure. 6
Last but not least, to achieve further savings, NASA had no meaningful provision for a crew escape system as part of the original concept of operations.2 Without this last layer of defense, a Space Shuttle crew would be rendered with no survival capability in case of emergency. There were a design intended only for developmental flight test, and another one implemented after the loss of Challenger. However, both systems had extremely li-mited capabilities, and never been used in any mission. 7 (See Section III, Cost Rules, for detailed discussion of delay and cancellation of vital system capabilities.) s B. Politically imposed schedule pressure

117
Much has been written about NASA’s illusion of concurrent engineering to stay within the Space Shuttle program schedule by cutting corners and delaying vital fixes at many levels. 9, 13 However, the root cause of schedule pressure had originated from the political process during the system conceptualization phase. In January 1972, President Nixon an-nounced that:
“The Shuttle would transform space frontier of the 1970s into familiar territory, easily accessible for human endeavor in the 1980s. It will revo-lutionize transportation into near space by routinizing it”.2
After Columbia’s fourth flight in July 1982, President Reagan declared the Space Shuttle fleet as fully operational. As celebratory of a national achievement as this milestone of Initial Operating Capability (IOC) might appear, this self-deception had detrimentally masked the true developmental nature of the program. There were well-known technical issues yet to be addressed satisfactorily. Post-flight inspection revealed that Columbia had sustained damage caused by excess Solid Rocket Booster (SRB) ignition pressure, and that many of its thermal protection tiles had been damaged or lost. 2 In effect, this mi-scharacterization virtually moved up the schedule and shortened the system integration and flight test phase, subjecting an already vulnerable design to ever higher risk.
Political motivation for premature declaration of IOC was two-fold. As long as the Space Shuttle was still under development, NASA could not secure Presidential approval to start a space station program, which had been delayed during the Nixon’s era. Second-ly, NASA found the Space Shuttle in competition against European Space Agency’s Ariane, an expendable vehicle, in the business of launching commercial satellites.2 In an uncertain market, pitching a reusable system still under development against a more ma-ture expendable one would be a precarious business proposition at best.
This undue schedule pressure and harmful mischaracterization, imposed by political imperatives and not conducive to resilience, had sowed the seed for a cavalier culture of acceptable deviance from the norm, which eventually permeated throughout the organiza-tion, and colored its decision-making process. 12
C. Regulatory governance, or lack thereof In government programs, there are often regulations, laws and policy that can markedly affect systems architecting and engineering. More commonly known are import-export rules regarding sensitive technologies, or security clearance requirements on classified projects. Often these would restrict the solution space and prohibit certain design choices that could otherwise improve system reliability, efficiency and effectiveness. However, for the Space Shuttle program governance, it was more of a case of under-constraint, ra-ther than over-constraint, which compromised its resilience.
In commercial or general aviation, there are independent governing bodies, such as the Federal Aviation Authority in the U.S. or the Civil Aviation Authority in Europe, to qualify and certify airworthiness of aircraft prior to being put in use, regulating flight op-erations, issuing and enforcing safety directives, providing oversight during maintenance, and investigating accidents. According to the author’s professional experience from working for more than 28 years in the aerospace industry, an aircraft manufacturer, oper-

118
ator or maintainer would have to positively substantiate airworthiness, by analysis, test-ing, demonstration, inspection or a combination thereof, to the authority before an aircraft can take to the air. However, NASA and the Space Shuttle program were mostly self-regulated organizations that lacked credible governance and independent oversight. Flawed flight readiness review, silent safety organization and unchecked decision-making had led to the losses of Challenger and Columbia. The Rogers Commission found that NASA had required “a contractor to prove that it was not safe to launch, rather than proving it was safe.” 8, 11 This undue optimism of “launch unless proven unsafe”, rather than a more cautious approach of “launch if proven safe”, was more common among NASA managers than engineers and scientists, who had been more in tune with the sys-tem’s true characteristics, capabilities and performance. 5, 10 Another unusual aspect of the Space Shuttle was its ability to launch commercial satel-lites. It has been rare that any publicly-funded program is allowed to participate in private business endeavor. This shows that NASA had expended extraordinary effort to sustain the program in convincing the political process of the Space Shuttle’s economic viability. In so succeeding, NASA had increased the design complexity to meet additional, and at times conflicting, system requirements. Furthermore, NASA had turned itself into a start-up commercial venture, a significant departure from its core competency of scientific ex-ploration, research and development. Such commercialization of the Space Shuttle, and NASA, could only bode ill for its resilience. After the loss of Challenger, a policy deci-sion was made to ban the Space Shuttle from engaging in commercial launch business. 8
(See Section IV, The Imperatives Of A Strong And Coherent Constituency, for detailed discussion of conflicting system requirements leading to a vulnerable design.) III. Cost rules1 A common practice among proponents of large government programs has been to over-estimate a system capabilities and to under-estimate its cost to gain starting approval or to sustain the program. On the same token, in order to fit the many nationally competing demands into a particular fiscal year, the political process would often stretch out budgets of large programs over a longer time horizon, i.e. level loading. Once started, the pro-gram would invariably run into difficult, if not impossible, budgetary constraints, partly because of the original cost under-estimation and partly because of scarce national re-sources. This section will examine how such political maneuvers, and resultant fiscal constraints, have impacted the STS resilience capabilities, and contributed to catastrophic losses of Challenger and Columbia. A. Over-estimated capabilities and under-estimated cost
In an effort to save the sole manned space flight program in 1972, NASA appealed to the Nixon Administration that, for a budget of $5.15B over five years, the Space Shuttle could be developed to meet all requirements, with a lifetime of 100 missions per vehicle and cost of $7.7M per flight. The central argument was economy of scale. These esti-mates had assumed that the Shuttle, besides carrying out NASA’s core missions of space exploration and scientific research, would launch all national security payloads for the

119
Department of Defense, as well as commercial satellites, at a rate of 50 flights per year. In 1982, the per-launch cost eventually rose to more than $120M.2, 4 The earlier assump-tions had two serious flaws. The first involved mischaracterization of the program nature; and the second had to do with misalignment of NASA’s core competency. 1. Mischaracterization of program nature The Shuttle design had been based on state-of-the-art technologies many of which were still born. Some of the first-time technologies included:
• Reusable launch vehicle; • Spacecraft with wings; • Reusable thermal protection system; • Reusable high-pressure hydrogen/oxygen engines; and • Winged vehicle to transition from orbital speed to a hypersonic glider. 2
As such, the Shuttle was inherently a technology research and demonstration effort, ra-ther than a vehicle development program. The difference might be subtle but crucial. It is difficult, if not impossible, to predict cost and schedule performance, or to ascertain any practical usefulness of basic research endeavors. In contrast, a system development pro-gram demands tangible results, within budget and on time. Unfortunately, the latter is more plausible to the political process than the former. And this predicament, coupled with over-ambition, has severely crippled NASA’s ability to manage technology, a key element of an organization’s resilience technical capabilities.
Applied research to investigate performance of O-ring seal materials in cold weather could have saved Challenger but the above overly optimistic estimates would not permit such as rigorous effort. The very reason for selecting a solid rocket booster design had been of lower development cost. 2, 4 As late as 1994, some 13 years after the first flight by Columbia, bonding chemistry of insulation foam and thermal protection tiles were still a technological risk.1 Apparently, this technology could never be perfected as evidenced by the loss of Columbia in 2003, attributed to insulation foam flaking off the external fuel tank and striking thermal protection tiles on the orbiter. 2
The common pattern of masking technology research for vehicle development pro-gram has occurred with not only the Shuttle but also failed attempts of its replacement. The National Aerospace Plane, a.k.a. the Orient Express, was cancelled in 1992 after $1.7B had been spent. The X-33 Venture Star and X-34 programs were halted in 2001 af-ter $1.3B expended. And the more recent Space Launch Initiative was also stopped in 2002 after $800M had been drained from NASA budget.16 These huge sums of money could have been arguably better invested to improve the Shuttle’s safety and reliability.
3. Misalignment of core competency
NASA is a federally-funded agency whose “mission is to pioneer the future in space ex-ploration, scientific discovery and aeronautics research.” 17 It does not anywhere resem-ble a high-volume business operation in the private sector, and it should not by nature and by charter. An endeavor to perfect still-born and risky technologies, commercialize an
120
integrated low-cost product based on these technologies, and dominate the market in five years is a dangerously ambitious proposition, even for the most successful start-up ven-tures. Attaining operational efficiency of 50 launches per year, or about once a week, as originally proposed demanded a stiff learning curve of which NASA would never be ca-pable. Besides its above chartered root, NASA inherently is not a learning organization.1 Undoubtedly, there have been other stellar accomplishments. However, the misalignment between NASA’s core competency and what was required to deliver on the Shuttle over-promises has been evident by the organization’s struggle to balance schedule, quality and cost.
Fundamentally, a higher launch frequency meant less preparation time between flights. This tempo is acceptable for a system based on mature technologies and tho-roughly tested in its operational environment, as seen in the airlines industry. However, from the beginning, this compressed cycle had stifled NASA’s capability to manage the Shuttle’s development schedule. When leaving factory in 1979, Columbia had only 80% of its thermal protection tiles installed. 2 At Kennedy Space Center, there was a rule im-posed on relatively under-paid technicians that rigidly set the number of tiles to be processed daily. One technician was spitting into the bonding agent to accelerate its cur-ing process. Moisture had been known to damage bond integrity. Some tiles had been held in place just by friction with adjacent tiles. As of 1994, about 75% of these original tiles were still in the Shuttle fleet. 1, 3 Also due to schedule pressure, there have been other well-known instances of compressed training and maintenance cycles, 8 risky decision making and flawed readiness reviews that contributed to the losses of Challenger and Co-lumbia. 5
In the early 1980s, NASA again adopted the tactics of over-selling capabilities and under-estimating costs. The Shuttle was marketed as “the most reliable, flexible and cost-effective launch system in the world” 2, providing commercial satellite launch services at $42M per launch. The actual costs, however, were more than three times this amount. Unable to raise price, NASA turned to cost reduction for closing budgetary gap. During the decade preceding the loss of Columbia, the instituted slogan had been “faster, better, cheaper.” 14 Consequently, engineering capabilities was shifted from the Shuttle to the International Space Station and Mars exploration programs. From 1991 to 1997, the Shut-tle’s staffing level had declined by ~40%, government employees and contractors alto-gether. Besides eroding critical in-house expertise and industry base, this large-scale reassignment created uncertainty and tension in the workforce. A hiring freeze also made it difficult to recruit younger people to sustain corporate knowledge between generations. By 2000, NASA leadership admitted that above personnel cut had gone too deep, resulted in “serious skill imbalances, overtaxed the remaining core workforce, and potentially im-pacted operational capacity and safety.” 15, 16 B. Level loading of budget to accommodate competing demands A compromised funding profile does not necessarily align with schedule milestones, re-quired system capabilities and timely application of resources. With less than optimum budget profile, the Space Shuttle program has often been forced to delay or defer imple-mentation of system capabilities into future years.

121
1. Fast shrinking budget and thinly stretched funding profile For the post-Apollo era, NASA had envisioned an ambitious space infrastructure that in-cluded, besides Shuttle-supported missions for both scientific and symbolic purposes, 30-ft diameter 12-man space stations (two in earth orbit, one in lunar orbit), lunar base, Sky-lab, continuing Saturn rockets production, Space Tug for orbits higher than low-earth or-bit, and nuclear stage for launch vehicle to Moon and Mars. 27 To fully implement this agenda, NASA’s funding profile would have required an annual growth rate of 10% over several coming decades. 14 However, fiscal, and political, reality simply could not support such a high level of demand for resources. Instead, NASA saw its funding level dropping from about 3.8% of the federal budget in 1965 to less than 1% in the mid-1970s due to lack of political support. 25 As a result, cancelled were Skylab, Apollo 18 and 19, Saturn production, space stations and Mars exploration. The Space Tug and nuclear stage were also delayed. Due to its supposedly low cost for access to space and election year politics, the Space Shuttle was barely saved. Vice President Agnew had to break a 50-50 tie in the Senate. 27 During the conceptual phase, development of a two-stage fully recoverable Shuttle had been originally estimated at $14B. However, President Nixon and NASA Ad-ministrator James Fletcher later agreed to a more politically feasible yet much lesser budget: $5.2B plus 20% reserve, based on 1970 dollars. 27 Further straining the program, this total ceiling would have to be spread out over five years. 26 Upon Nixon’s leaving of-fice in 1972, the White House’s Office of Management and Budget (OMB) nullified the 20% reserve. NASA Comptroller, under pressure from OMB, also disallowed inflation adjustment based on 1970 dollars. 27 In effect, OMB had removed any budget margin pre-viously earmarked for unknown risks, reasonably expected of any new development pro-gram, without fully understanding the technical consequences. Cost margin has been con-sidered a common approach to mitigate risks contagious throughout an organization. 28 2. Delayed and cancelled vital system capabilities 25 To stay within above fiscal limit, the Space Shuttle Program kicked off an intense six-month re-design period to look for ways to cut costs, dramatically. 26 At the detriment of system resilience, several capabilities were delayed or outright cancelled:
• Retractable turbojets were deleted from the STS architecture, and the Shuttle would become a glider during landing, i.e. the crew would only have one shot at the runway and there would be no go-around. 27 This deletion essentially removed the STS adaptability in terms of maneuvering flexibility in the face of a disruption such as last-minute weather changes at landing site, i.e. Kennedy Space Center (KSC). The coast of Florida is particularly vulnerable during hurricane season.
• The crew escape module was also cancelled. 27 Similar in concept to the ejection
seat design in a fighter jet, this was a vital capability during the survival phase of resilience. During an aborted launch such as the case of Challenger, this ability to survive could have prevented the accident from becoming worse. The Shuttle would be certainly lost but the crew could have a survival chance, i.e. the last layer of defense in the Swiss cheese model.

122
• Vital improvement of SRB O-ring seal performance was delayed until after the
fact of Challenger loss. 5 The deficiency had been well-known as reusable SRBs were recovered and examined after each launch.8 This design improvement would have enhanced the avoidance phase of resilience, i.e. preventing catastrophic dis-ruption through undesirable interfaces among system components where the SRB, subject to aerodynamic and structural vibration during launch, leaked hot gas to-wards the orbiter.
These additional layers of defense, crucial for an inherently vulnerable STS design, could have saved Challenger or her crew. The many decisions to delay or cancel resilience ca-pabilities, provided by relatively small components such as O-ring, have been partially attributed to the high-level problem paradigm and preoccupation with past success within NASA’s culture. 24 3. Shifting national priorities in a zero-sum game Similar to that Apollo’s lunar landing had marked the U.S. winning the space race, the fall of the Berlin Wall did not only signify our victory of the Cold War but also resulted in unintended consequences for the Space Shuttle Program. All of the political urgency that had helped to justify the Shuttle’s mission and existence were quickly evaporating. The Clinton Administration’s policy of buying Russian hardware and services overtook fiscal priority. The objective was to support President Boris Yeltsin’s fragile government and to halt proliferation of nuclear weapons and their delivery means. Congressional earmarks, i.e. political pork barrels, also cut and stretched NASA’s budget in the 1990s. For in-stance, NASA would need over $40B in FY 2000 but the agency only received $13.6B. During the decade leading up to the Columbia accident, NASA’s funding for human space flight had dropped from 48% to 38% of the total agency’s budget. 14, 25 Besides being marginalized by external political imperatives, the Shuttle were also losing in a zero-sum game against other programs within NASA. Most notably, its budget was continually be-ing raided to make up for cost overrun on the International Space Station (ISS). At this time, the ISS had become the primary system in an overall architecture. And the Shuttle was in a secondary role, enabling ISS construction and providing logistic support. From 1993 to 2003, the time of Columbia loss, Congressional appropriation for the Shuttle had decreased by 22% in real dollars. Considering inflation, the program’s purchasing power actually dropped by 40%, as compared to 13% for NASA overall. The Shuttle had to bear all these losses in fiscal priority and organizational status amidst increasing cost of repair and maintenance typically required for an aging system.21, 25
4. Reduced and outsourced safety-critical capabilities To stay within its funding profile, the Space Shuttle Program aimed to achieve economic efficiency through workforce downsizing, reducing and outsourcing various core func-tions, including safety oversight. 25 Perceived as costly and an over-reaction to the Rogers Commission’s recommendations after the Challenger loss, redundant pre-flight safety in-spections were cut and/or outsourced, at the critical protest by both the Aerospace Safety

123
Advisory Panel and senior members of KSC safety organization.15, 22 In March 2000, the Shuttle Independent Assessment Team (SIAT) noted that important domain areas were one-deep among reduced NASA technical staff. Perceiving an erosion of risk manage-ment capability by the program’s desire to reduce cost, the SIAT strongly asserted that the function of:
“Safety & Mission Assurance should be restored to its previous role of an in-dependent oversight body, and not be simply a safety auditor.” 23
Credible safety organization, sustained core in-house expertise, functional redundancy, independent review and risk management are some of the key managerial and technical capabilities in a multi-layers defense architecture against unpredictable disruptions. 29 As many of these capabilities were reduced, the avoidance phase of resilience was compro-mised and system risk increased accordingly. Between the times of Challenger and Co-lumbia losses, many findings and recommendations by the Roger Commission and other blue-ribbon panels were forgotten or ignored. 20 During the recovery phase of resilience, NASA, as a product-centered infrastructure system, has failed to improve its ability to re-cover after a catastrophic disruption, i.e. not a learning organization. 10 5. Deferred repair and maintenance, and neglected infrastructure 25 To enable and enhance resilience in terms of avoidance of and survival from disruptions, robust maintenance should be an essential part of an integrated architecture, including the technology system and its support infrastructure.30 Unfortunately, the STS repair and maintenance have also been a victim of ambivalent national policy, vacillating between replacement or continuing use, and thus upkeep, of the aging Shuttle Fleet and ground in-frastructure. Even before the loss of Challenger in 1986, investment in upgrades were re-peatedly deferred based on the circular logic that it would be a waste of resources if the Shuttle was to be retired soon.16
In terms of survival from disruption, crucial risk mitigation capabilities such as syste-matic and non-destructive testing to verify bond integrity of the Orbiter’s thermal protec-tive tiles had not been accorded the priority that they duly deserved. 18 Improved tile bonding integrity would provide for vital capacity to absorb structural damage caused by insulation foam flaking off from the SRBs and External Tank (ET) and striking the Orbi-ter’s most critical areas. Even after the loss of Columbia, in-orbit tile fixing capability, a necessary additional layer of defense for imperfect and vulnerable technology, was never fully implemented.19 Technology to improve securing of insulation foam, and thus capaci-ty to absorb structural and aerodynamic vibration during the launch and ascending phase, were also deferred or delayed.18 This improvement in disruption avoidance would reduce the probability of harmful transfer of kinetic energy across undesirable interface between the SRB/ET and the Orbiter.
Also of current concern for disruption avoidance is that, with the STS approaching the end of its life cycle, NASA has seemed reluctant to place high priority in either safety upkeep of the Orbiter or its deteriorating ground support infrastructure. 20 Inside the Ve-hicle Assembly Building at KSC, makeshift sub-roof and ceiling nets had to be installed to prevent falling roof concrete from directly hitting the Shuttle stack. Outside in the hu-

124
mid and salty environment of southern Florida coastline, launch pad structures are pro-tected with zinc primer for the purpose of corrosion control. However, rain would wash away some of the zinc, falling onto the Orbiter’s wing leading edge and causing pinholes in its reinforced carbon-carbon thermal shield. 23 OMB and NASA Headquarters have been constantly level-loading the Shuttle program budget by deferring system safety up-grades and improvement, while keeping pressure on operating costs.21 Prior to the Co-lumbia accident, a request for $600M to fund infrastructure initiative in FY02 had been deleted by the OMB in its budget submittal to the Congress. Eventually, $25M was ap-proved to repair the Vehicle Assembly Building, or about 4% of the original request. 23
IV. The imperatives of a strong and coherent constituency1
In order to win, and re-win, a fair share of the annual budget, it is essential to build and maintain a strong constituency for enduring political support of a program. Nevertheless, lack of coherence due to diverging interests will likely result in conflicting system re-quirements and organizational priorities. This section will examine several key top-level requirements imposed on the STS by a broad-based constituency that had affected a vul-nerable design, and contributed to eventual catastrophic losses of Challenger and Colum-bia. A. Multiple mission profiles During the Apollo era, there had been wide public support in the space race against the USSR. However, after Apollo’s lunar landing, this national unified quickly evaporated. Recognizing the need for new political support to save the Space Shuttle, NASA leader-ship turned to the Department of Defense (DOD) and the commercial satellites industry to shore up its STS business case. NASA was successful in marshalling together a strong constituency, which would seem, at the surface, to induce and foster inter-element colla-boration. However, with multiple clients often came different missions and unavoidably diverging interests. As part of the STS constituency, DOD agreed to put all national security payloads on the Shuttle if the system design would carry a 40K lbs payload in polar (north-south) earth orbit, and meet certain cost-per-flight target. 2, 27 This flight profile originated from the USAF’s mission requirement of Strategic Arms Limitation Talk (SALT) II verification under the Carter Administration. The STS would be employed mostly as a spacecraft, carrying highly sensitive reconnaissance equipment to monitor USSR’s nuclear weapon installations. 2
Industry partners also agreed to charter the Shuttle to launch all commercial satellites. 27 These payloads would not be as heavy as those of DOD, and demand a less expensive upper stage to be economically viable. Furthermore, minimizing operational cost per flight would be essential to compete against other expendable launch vehicles, e.g. Euro-pean Ariane. Commercial satellites would typically need be placed in an equatorial (east-west) orbit for maximum coverage over key markets of high population regions. Besides above external customers in DOD and commercial satellites industry, NASA’s core scientific community bought in to the constituency with the aim of using the STS for

125
space servicing, e.g. the Space Station and the Hubble telescope. It was hoped that, by spreading out developmental and overhead costs, the Space Shuttle would become a low-cost re-usable platform. 27
As such, the STS were architected as a multi-purpose system, a combination of spacecraft, launch vehicle and re-usable aircraft, to serve multiple clients. However, mul-ti-functions, especially to be performed in a cost effective manner, would invariably re-sult in enormous complexity. Higher number of system elements, and even exponentially higher number of technical and organizational interfaces, was required to provide myriad capabilities in support of a variety of mission profiles.
Some have argued that the Carter Administration, as part of its zero-base review poli-cy, had committed a strategic mistake by making the STS the one and only launch system without any back-up technology. 35 From an overall space infrastructure perspective, this was a risky decision that violated the resilience architecting heuristic of functional redun-dancy. 36 The risk apparently materialized upon the loss of Challenger. In the face of this major disruption, the U.S. simply did not have any other capacity for space launch, or the flexibility to restructure our strategic forces and space assets to counter threats. Capacity and flexibility were two key attributes of system resilience that suffered. This capability gap left our nation in a vulnerable position against Cold War adversaries. The USAF sub-sequently struggled through an arduous political battle in order to secure approval to de-velop a new family of expendable launch vehicles. Given the STS’ questionable reliabili-ty and limited availability, this augmenting capability was intended to restore some level of capacity and flexibility in space launch. 4, 35 B. Conflicting top-level requirements From multiple mission profiles above, a set of top-level requirements were evolved over times for the Space Shuttle. These functional and performance requirements included: • The Shuttle’s payload bay needed be 60-foot long to accommodate USAF special
equipment. The cargo bay must also be 15 feet in diameter to provide logistic sup-port to the Space Station. This was a volumetric increase of 130% from the original size requirement, only 40 feet in length and 12 feet in diameter. 27
• The Shuttle must be able to both deploy (40K lbs at lift off) and retrieve (35K lbs at
landing) payloads, doubling the original weight requirement of 20K lbs. 27 This re-quirement was unprecedented in that no previous space system had been required to return with such a heavy payload. Apollo had brought back three astronauts and some moon rock samples.
• The USAF’s single-orbit polar mission translated into a 1,500-mile cross range,
whereas the original concept was of only 400 miles. 2, 27 The reason for such a sig-nificantly larger cross range was simply due to orbital mechanics. While the earth rotating east-west, the Shuttle would be orbiting asynchronously north-south. A more common equatorial orbit, orthogonal to the polar flight path, for other mis-sions would require less energy to launch by leveraging the earth’s spin velocity.

126
• To maintain the required USAF’s operational tempo (timely retrieval, processing and review of intelligence data) and to achieve economy of scale for multiple clients, a 30-day turn around time before the next mission was also required. How-ever, this would not allow for sufficient post-flight maintenance of such a complex multi-purpose system as the Space Shuttle. 27
C. Compromised and vulnerable system design Implementation of above functional and performance requirements would depend exten-sively on several risky technologies still born at the time. And to do so within a tight cost constraint made for a compromised and vulnerable system design.
An open top was particularly challenging in terms of reduced torsional stiffness, and structural life, of the enlarged orbiter fuselage, a key airframe capability. Conventional monocoque design has only featured much smaller openings such as aft cargo ramp on military transport or side door of commercial cargo planes. This state-of-the-art design was undoubtedly pushing the limit of aero-structure material technology, and paying a significant weight penalty for structural inefficiency adjacent to the large opening.
The doubled payload size and weight requirement had driven two crucial system de-sign decisions: (a) the propulsion system and (b) the launch stack configuration.
Liquid O2/H2 main engine was selected for its highest specific impulse performance. With payload and engine type established, the amount of fuel required to reach earth orbit was determined accordingly. The resultant fuel amount could not be stored internally as in conventional wing tanks. Instead, an external tank had to be used. Cryogenic liquid O2/H2 fuel meant a disposal tank design, to be covered with external insulation. Internal insulation was prohibitively expensive, especially for a disposal tank. 27
The over-sized orbiter with its heavy payload could not be put on top of the stack, as in the case of Apollo-Saturn V design, due to column instability (buckling) under launch load. The resultant configuration is what has been seen today. The orbiter is placed in a vulnerable position relatively lower in the stack and susceptible to strike by insulation foam flaking off from the external tank. This latent condition is in violation of the resi-lience architecting heuristic of avoiding hidden or undesirable interactions. 33
The combined requirements of 30-day turn-around time, 1,500-mile cross range plus 35K lbs of return cargo could only be achieved with a delta-winged vehicle landing on a runway, 2, 27 rather than Apollo style parachute recovery. The short turn-around time also translated into a fully re-usable, non-ablative thermal protective system consisted of ce-ramic tiles, reinforced carbon-carbon shield and insulation blankets. Never before exist-ing on either Apollo or Mercury, this was another state-of-the-art technology, with its in-herent developmental nature and risk. 27 The resultant vulnerable configuration, with a large cross-sectioned and exposed orbiter placed lower in the launch stack, eventually led to the catastrophic loss of Columbia. 2 Instead of being designed to avoid disruption, the Shuttle was subject to insulation foam flaking off from the external tank, due to vibration, and striking, at high speed, thermal protective tiles in critical areas. Vibration has been a commonly undesirable, yet often overlooked, interaction that negatively affects systems in terms of structural fatigue and mechanical performance.

127
The heavier payload plus low cost requirements also drove the addition of re-usable solid rocket boosters (SRB) placed in a parallel configuration to supplement the main en-gine. This increase in number of system elements, and thus interfaces, did not per se vi-olate the complexity avoidance heuristic in architecting resilience since the additional complexity was dictated by the law of physics, and reflected what was demanded by sys-tem functionality. 34 A two-stage design was necessary as the concept of single stage to orbit would not be practical or feasible. The technological impossibility of a single-stage design was later re-affirmed, after billions of dollars expended, by the National Aero-space Plane program during the Reagan Administration. 4 A series configuration would make a heavy design even heavier, and result in less propulsion performance.
In both cases of Columbia and Challenger nevertheless, it could be argued that the heuristic of avoiding hidden and undesirable interactions had not been followed. 33 Di-rectly contributing to the loss of Columbia, a disruption involving multiple internal agents was initiated by undesirable vibration and transfer of kinetic energy across their hidden interface. For Challenger, a brittle O-ring seal had resulted from unexpected cold weather; and hot gas leaking from the SRB and pointing towards the orbiter was an unde-sirable transfer of thermal energy between two system components. D. Issues and challenges of managing complexity \The multi-purpose STS architecture had not been so much in violation of the complexity avoidance heuristic 34 but rather a case of the architect’s, i.e. NASA, inability to manage such complexity effectively.
Under political pressures, NASA became a fragmented organization, divided among Field Centers as well as space programs. Well-known inter-center rivalries for work packages and thus job security, even since the early days of Apollo, were unavoidable for they must share an increasingly tight budget. 10, 15 NASA Headquarters did not always have direct control over Field Centers with their own Congressional representatives. 4, 58 This internal political tension had sowed the seed of impediment against inter-element collaboration,32 as evident by NASA’s reluctant and uncoordinated probabilistic risk analysis effort in 1987 after the loss of Challenger. Instead of doing a complete top down analysis to review existing interfaces or to investigate hidden and potentially harmful ones, NASA opted for piecemeal risk assessments for the most worrisome sub-systems owned by individual Field Centers. The goal was mostly to show that the risks from each of the major components were acceptable, rather than a systematic approach. 25, 37
Inter-element collaboration was also lacking among the two main contractors due to competitive, legal and contractual reasons. Technical information that could be useful, if not essential, to the other was withheld or delayed. Different systems of the orbiter were processed independently by different activities, 19 ignoring the risk caused by unknown and undesirable interactions. V. Technical problems become political problems1 For large and complex public programs, technical problems can readily become political problems. 1 Competing for limited resources, opponents and proponents of a program are always looking to exploit technical reports or highly visible mishaps, often through the

128
media, for the purposes of shaping voters’ perception, influencing Congressional support, i.e. funding, and therefore clients’ value judgment.
In the early 1960s, a consultant had employed risk analysis methodologies and calcu-lated a very small probability of success of NASA’s lunar mission. Appreciating the po-litical fact of life that sensitive technical reports could be exploited by opportunistic op-ponents to erode public support and discourage Congressional funding, NASA took pre-emptive action to forbid the use of any formal probabilistic risk assessment (PRA) tech-nique. 38 At the time, that seemed to be a shrewd strategy for damage prevention and con-trol, in the interest of program survival. However, over the subsequent decades, this poli-cy had suppressed risk management, a critical capability for system resilience, within NASA’s product-centered infrastructure. Without a solid foundation of rigorous quantita-tive analysis, a culture of acceptance of ever increasing risk, unjustifiably based upon past successes, had permeated throughout the organization. 53 Prior to the Challenger ac-cident, NASA had gradually drifted to a riskier attitude of “launch unless proven un-safe”. 10 The loss of Challenger, a technical problem directly attributed to brittle Solid Rocket Boosters O-ring seal in cold weather, consequently became several political prob-lems for the STS program. In a policy change, the Reagan Administration banned the Shuttle from commercial satellite launches. The USAF also withdrew its national security payloads from the Shuttle’s mission. These were major political losses, and thus crucial economic support, that had been enabling development of the STS capabilities. 58 A. Tight coupling and colored decision making process Without above external customers, NASA had to cling onto the International Space Sta-tion (ISS) to justify existence of the Shuttle, already optimized for USAF missions. Vehemently determined to re-marry the STS with the ISS, NASA had exponentially in-creased the complexity of the overall system architecture. Numerous interfaces among the STS and the ISS programs, the astronaut office, flight surgeons and international partners have resulted in an inextricably tight coupling. Not only the frequency of Shuttle launches had to keep up with the 180-day limit on ISS crews but also the launch sequence had to align exactly with the ISS construction schedule. Organizationally, NASA was not prepared to manage this complexity; and technically the Shuttle’s developmental nature could never meet these operational demands. 56 Violating the loose coupling heuristic, 57 NASA managers’ rigid adherence to the ISS milestone of Node 2 Core Complete colored their decision making process in turning down engineers’ requests for in-orbit imagery, robbed the organization of flexibility to negotiate and adapt to disruption caused by sche-dule delay, and significantly contributed to the loss of Columbia. 12 B. System mischaracterization leading to weakened resilience capabilities Even though much had been warned by well-respected authors on NASA’s risky culture and deviance in the aftermath of Challenger, 5, 13 technical reports continued to be politi-cized. Most detrimental to STS resilience was the Kraft Report published in March 1995. Peculiar enough, this document was not funded or exploited by external opponents aim-ing to steal Congressional funding away from NASA but by internal leaders seeking to cut costs. The report mischaracterized the system maturity, reliability and safety as its

129
assumptions and recommendations were at odds with many, including NASA’s Aero-space Safety Advisory Panel then 53 and the Columbia Accident Investigation Board re-trospectively. 41 Some of the controversial, if not questionable and contradictory, findings and recommendations included:
• “The Shuttle has become a mature and reliable system . . . about as safe as today’s technology will provide.”
• “Given the maturity of the vehicle, a change to a new mode of management
with considerably less NASA oversight is possible at this time.”
• “The program remains in a quasi-development mode and yearly costs remain higher than required. NASA should freeze the current vehicle configuration, minimizing future modifications, with such modifications delivered in block updates. Future block updates should implement modifications required to make the vehicle more re-usable and operational.”
• “NASA should restructure and reduce the overall Safety, Reliability and
Quality Assurance elements – without reducing safety.” 46 C. Ignoring the dissenting, and prophetic, voice of independent experts As implemented, above recommendations would significantly eroded NASA’s system management capabilities by marginalizing managerial oversight, mission assurance func-tions and multi-tiered independent reviews. 45 They would also weaken in-house technical capabilities of safety, reliability and technology management of the Space Shuttle. 43 In architecting resilience, these capabilities would be crucial in minimizing the likelihood of another catastrophic accident such as that of the Challenger. In dissent, the Aerospace Safety Advisory Panel criticized the Kraft Report:
“The assumption of system maturity smacks of a complacency which may lead to serious mishaps. The fact is that the Space Shuttle may never be mature enough to freeze the design. The report dismisses concerns from many credible sources by labeling honest reservations and the people who have made them as partners in an unneeded safety shield conspiracy. Since only one more accident would kill the program and destroy far more than the spacecraft, it is extremely callous to make such an accusation.” 42
Nevertheless, the Kraft Report was aligned with the White House and the Congressional political vector, and resonated with Dan Goldin’s, then NASA Administrator, personal agenda for program priorities within NASA. 53 As such, NASA management accepted the report and, in August 1995, solicited industry bids for the Shuttle prime contractor, pav-ing the way for privatization.41 Above dissenting words proved prophetic upon the loss of Columbia less than 8 years later.

130
VI. Political problems become technical problems
For large government programs, political problems could also manifest into technical is-sues through which system architects and engineers are ever so challenged to navigate. There was a national push to downsize the government in the 1990s. Vice President Al Gore had started an initiative to reinvent government. A Republican-led House of Repre-sentatives was also seeking to balance the federal budget. Under pressure, managers of public programs were seeking new and creative ways to cut costs and improve efficiency. 47 One popular approach was privatization, in which significant government operations and responsibilities would be transferred to private contractors. To align with above polit-ical sentiment and under Goldin’s leadership, NASA served as a leading example for oth-er public agencies. The motto was “faster, better, cheaper”. 53 A. KISS, inter-element collaboration and system integration As part of the privatization effort, the Space Shuttle program was looking to consolidate its 86 separate contracts held with 56 different companies under a single prime contractor in United Space Alliance (USA), a 50/50 partnership between Lockheed Martin and Rockwell (now Boeing). 47 Arguably, this consolidation had promised several benefits:
• System management complexity would be reduced with a smaller number of sup-pliers and vendors (contractual elements), resulting in an even smaller number of interfaces, and breaking down numerous organizational barriers. This is in line with the complexity avoidance heuristic. 34
• With Lockheed Martin and Rockwell as equal USA partners, inter-element colla-
boration would be enhanced. 45 Inter-element collaboration had been lacking be-tween these two main contractors due to competitive, legal and contractual rea-sons. Technical information that could be useful, if not essential, to the other was withheld or delayed. 19, 55 This kind of communication barrier is aptly warned in the inter-element impediment heuristic. 54
• From a systems engineering perspective, it would be more effective to have a sin-
gle entity act as the prime system integrator. Presumably, NASA should, but could not, fill this role because it was a politically fragmented organization. 55 Thus USA was a more practical and workable solution.
In theory, NASA’s top leaders had hoped that privatization would increase effectiveness while cutting costs and that consolidation would further save redundant overhead ex-penses. In practice, however, the expected savings and integrated management goals never did materialize. 48 More importantly, there were unintended, yet serious, conse-quences that negatively affected the STS resilience as a result of the Space Flight Opera-tions Contract with USA. Privatization was not a bad strategy per se, but rather vexing issues and challenges had to do with the implementation of this strategy.

131
B. Cost-incentivized, not safety or quality performance-based, governance First and foremost, the Space Flight Operations Contract was designed to reward any cost reduction achieved by USA, with NASA taking 65% of any resultant savings and USA 35%. Thus, both the government and the contractor were jointly motivated to cut costs, at the expense of safety and quality inspection. 41 The fact that NASA would reap almost twice as much the benefits from cost savings as USA under such unusual, if not unprece-dented, incentive structure did not argue well for strong and independent governance. Safety responsibilities were substantially transferred from NASA to USA. Tens of thou-sands of Government Mandated Inspection Points were rolled back. Experienced NASA engineers also moved into the private sector, leaving civil servant positions subsequently filled by less experienced engineers. These transformations vastly eroded NASA in-house technical expertise, and further weakened its already problematic safety system. 49 Safety and expertise are two key system resilience technical capabilities that suffered signifi-cantly in the case of STS product-centered infrastructure. 50 C. Diminished checks and balance system Another aspect of governance that was lacking in the Space Shuttle privatization effort involved independent reviews and mission assurance.40 With diminishing in-house capa-bilities and resources, NASA had increasingly relied on USA and its sub-contractors to identify, track and solve problems while sacrificing authoritative checks and balance, es-pecially at the design and detailed levels. In a letter to President Clinton, dated 25 August 1995, senior engineer Jose Garcia from Kennedy Space Center (KSC) pleaded passio-nately:
“The biggest threat to the safety of the crew since the Challenger disaster is presently underway at NASA, concerning efforts to delete the checks and bal-ances system of processing Shuttles as a way of saving money. Historically, NASA has employed two engineering teams at KSC, one contractor and one government, to cross check each other and prevent catastrophic errors. Al-though this technique is expensive, it is effective, and the most important factor that sets the Shuttle’s success above that of any other launch vehicle. Anyone who doesn’t have a hidden agenda or fear of losing his job would admit that you can’t delete NASA’s checks and balances system of Shuttle processing without affecting the safety of the Shuttle and crew.” 41
In high-risk high-visibility technology programs such as the Space Shuttle, multiple lay-ers of defense against catastrophic disruptions, already happening once with the Challen-ger in this case, would enable and enhance resilient system architecture. Above testimony by Mr. Garcia validated the unavoidable imperfection in humans and man-made systems, i.e. holes in the Swiss cheese model. 39 Nevertheless, expert words of experience and wisdom went unheeded, again.

132
D. Over-compartmentalization of Foreign Object Debris Issues of weak governance and lax attention to details continued into 2001 as KSC and USA decomposed the definition of “foreign object damage” (FOD) into separate catego-ries of “processing debris” and “foreign object debris” with contractual effects: 44 “Processing debris” was defined as:
“Any material, product, substance, tool or aid generally used during the processing of flight hardware that remains in the work area when not directly in use, or that is left unattended in the work area for any length of time during the processing of tasks, or that is left remaining or forgotten in the work area after the completion of a task or at the end of a work shift. Also any item, ma-terial or substance in the work area that should be found and removed as part of standard housekeeping, Hazard Recognition and Inspection Program (HRIP) walk-downs, or as part of “Clean As You Go” practices.” 51
And “foreign object debris” then became:
“Processing debris becomes FOD when it poses a potential risk to the Shuttle or any of its components, and only occurs when the debris is found during or subsequent to a final flight Closeout Inspection, or subsequent to OMI S0007 ET Load SAF/FAC walk down.” 52
Peculiar to KSC and USA, these novel definitions were inconsistent with that by other NASA field centers, the Department of Defense and commercial aviation industry. To improve quality, safety and mission assurance, FOD prevention has been a widely-adopted standard practice in production, operation and maintenance of aerospace and weapon systems. However, metrics on “processing debris”, as compiled by KSC Mis-sion Assurance, did not directly impact USA’s award fee since it was portrayed as less significant and dangerous than “foreign object debris”. 44 This was a case of naïve over-simplification and harmful over-compartmentalization 53 as any FOD would have critical safety implications, regardless of its source. Above artificial definitions allowed many dangerous violations to be tolerated as USA’s statistics revealed the success rate of daily debris checks ranged only between 70-86%. With 18 problem reports on items lost during the processing of Columbia prior to her fatal mission, the need for a thorough and strin-gent FOD control program would be indisputable. 44 Nevertheless, system safety and quality assurance measurements were apparently manipulated in the interest of cost and profit. Ironically, Columbia was lost in early 2003 due to insulation foam debris striking thermal protective tiles on her wing leading edge. VII. Reflection and lessons learned

133
For large and complex publicly-funded systems, the representative government is the owner and client, who express its value judgment via the political process. A system’s mission, architecture and resilience capabilities are thus invariably dictated by politics at several levels. There are no such problems as purely technical problems. However, from this case study, some insight and strategies can help navigate through the unavoidable political-technical interactions, and architect a more resilient system:
• By imposing or relaxing budgetary, schedule and regulatory constraints, the polit-ical process can influence resilience architecting, with far-reaching effects on both the technological system and its support infrastructure. Over-constraint limits so-lution space, and forces less-than-optimal design choices, rendering a system inef-ficient, unreliable and vulnerable to disruptions. Laxed governance can also leave an organization operating unchecked, and thus increasing systemic risk.
• Forgetting its chartered root and core competency, NASA over-sold the Shuttle
capabilities to save the program. Out of political expediency, basic research was mischaracterized as system development, detrimental to NASA’s technology management ability and the Shuttle safety and reliability.
• The political process level loads budget to fit many competing and demands into a
fiscal year. With sub-optimal funding profile, a program had to delay or cancel vi-tal capabilities at the expense of system resilience. Within tight fiscal constraint, issues that are relatively small or not of immediate concern will often lose out in the hierarchy of priorities. But ignored problems do not get better with time.
• To mitigate risk, one should listen to the expert, though dissenting, words of wis-
dom and experience, and not over-stretch difficult cutting-edge technologies, and should use as many proven components and systems as possible. If having to resort to a new technology, one should have a back-up plan. 27
• To minimize conflict, one should keep requirements to a minimum. By nature, a
spacecraft is not an aircraft, which, in turn, is not a launch vehicle. Forcing mul-tiple divergent functions into a single platform makes for a brittle design. So does tight coupling. 27
• One should keep things simple but do not over-compartmentalize. Given our po-
litical environment, complexity is unavoidable, and it is the job of the systems architect and systems engineer to manage this complexity. Relationships among the elements are what give systems their added value; however, the greatest dan-gers are also at the interfaces. 31

134
References 1. Maier, M. W. And Rechtin, E. 2002. The Art of Systems Architecting. Boca Raton, FL:
CRC Press, pp. 235-248. 2. Columbia Accident Investigation Board 2003. Columbia Accident Investigation Re-
port. Vol. 1 (August). Burlington, Ontario, Canada: Apogee Books, pp. 21-25. 3. Rechtin, E. 1991. Systems Architecting: Creating & Building Complex Systems. Ingle-
wood Cliffs, NJ: Prentice Hall, pp 67-68. 4. Forman, B. and Cureton, K. 1995. Launch Systems: Shuttle, ALS & NLS. Los Angeles,
CA: University of Southern California, Department of Industrial and Systems Engi-neering, SAE-550 Engineering Management of Government-Funded Programs.
5. Feynman, R. P. 1988, “An outsider’s inside view of the Challenger Inquiry,” Physics Today, Vol. 41, No. 2 (February), pp. 26-37.
6. Rechtin, p. 152. 7. CAIB, pp. 214-215. 8. CAIB, p. 100. 9. Paté-Cornell, M. E. and Fischbeck, P. S. 1994, “Risk Management for the Tiles of the
Space Shuttle,” Interfaces, Vol. 24, No. 1 (January-February), pp. 64-86. 10. Paté-Cornell, p. 75. 11. Report of the Presidential Commission on the Space Shuttle Challenger Accident, 6
June 1986. Washington D.C.: Government Printing Office, 1986, Vol. I, pp. 82, 118. 12. CAIB, pp. 131-172. 13. Vaughan D. 1996. The Challenger launch decision: Risky technology, culture and
deviance at NASA. Chicago: University of Chicago Press. 14. CAIB, pp. 102-104. 15. CAIB, pp. 106-107. 16. CAIB, pp. 110-111. 17. NASA website: http://www.nasa.gov/about/highlights/what_does_nasa_do.html Ac-
cessed on 18 Feb 2009. 18. Paté-Cornell, pp. 77, 80. 19. Paté-Cornell, pp. 78-79. 20. CAIB, pp. 110-115. 21. CAIB, pp. 104-105. 22. CAIB, pp. 107-109. 23. CAIB, pp. 114-115. 24. Jackson, S. 2009. Architecting Resilient Systems: Accident Avoidance, Survival and
Recovery from Disruptions. Los Angeles, CA: University of Southern California, De-partment of Industrial and Systems Engineering, SAE-599 Course Reader, p. 5-4.
25. Phan, P. 2009. Political Factors in the Space Transportation System Resilience Archi-tecting [mid-term draft]. Los Angeles, CA: University of Southern California, Dept. of Industrial & Systems Engineering, SAE-599 Architecting Resilient Systems.
26. CAIB, p. 22. 27. Myers, D. 2005. The Shuttle Origin and the Making of a New Program. Cambridge,
MA: Massachusetts Institute of Technology, Department of Aeronautics and Astro-nautics, 16.885J / ESD.35J Aircraft Systems Engineering, Fall 2005.

135
28. Jackson, p. 5-14. 29. Jackson, pp. 6-6, 6-7, 6-18, 6-20. 30. Jackson, pp. 6-23 through 6-24. 31. Maier and Rechtin, p. 275. 32. Jackson, p. 6-13. 33. Jackson, p. 8-14. 34. Jackson, p. 8-9. 35. Aldridge, E. C. 2005. Assured Access: The Bureaucratic Space War. Cambridge,
MA: Massachusetts Institute of Technology, Department of Aeronautics and Astro-nautics, 16.885J / ESD.35J Aircraft Systems Engineering, Fall 2005.
36. Jackson, p. 8-3. 37. Paté-Cornell, p. 68. 38. Paté-Cornell, p. 67. 39. Jackson, p. 3-7. 40. Jackson, pp. 9-2 through 9-6. 41. CAIB, pp. 108. 42. Aerospace Safety Advisory Panel, “Review of the Space Shuttle Management Inde-
pendent Review Program,” May 1995. 43. Jackson, pp. 6-18, 6-19 and 6-23. 44. CAIB, p. 95. 45. Jackson, pp. 6-3, 6-5 and 6-6. 46. Report of the Space Shuttle Management Independent Review Team, Feb 1995, p. 3-18. 47. CAIB, p. 107. 48. CAIB, p. 109. 49. CAIB, p. 179. 50. Jackson, pp. 6-18 & 6-20. 51. Standard Operating Procedure, Foreign Object Debris Reporting, Rev. A, Doc. No.
SOP-O-0801-035, 1 Oct 2002, United Space Alliance, Kennedy Space Center, p. 3. 52. Ibid, p. 2. 53. Friedman, G. J. 2009. Management Aspects of Resilience. Los Angeles, CA: Univer-
sity of Southern California, Department of Industrial and Systems Engineering, SAE-599 Resilient Systems Architecting, pp. 4, 6, 18, 21 and 23.
54. Jackson, p. 8-16. 55. Phan, P. 2009. The Effect of Conflicting Requirements on the Space Transportation
System Resilience. Los Angeles, CA: University of Southern California, Department of Industrial and Systems Engineering, SAE-599 Architecting Resilient Systems.
56. Phan, P. 2008. Homework M: Final Report. Los Angeles, CA: University of Southern California, Department of Industrial and Systems Engineering, SAE-543 Case Studies in Systems Engineering and Management.
57. Jackson, p. 8-10. 58. Phan, P. 2008. Case Study #5: Launch Systems. Los Angeles, CA: University of
Southern California, Department of Industrial and Systems Engineering, SAE-550 Engineering Management of Government-Funded Programs.

136
Katrina: Analysis of the Existence of Resilience in the City of New Orleans Disaster Support System by Anthony Williams, [email protected] Abstract This paper will provide an analysis of the problems that prevented the city of New Or-leans from having a resilient disaster support system in place that could cope with the needs of the citizens of New Orleans prior to and after Hurricane Katrina. Subsequently, this paper will provide evidence that lack of leadership at all levels of government was at the heart of the disaster support systems inability to survive in the face of one of the worst natural disasters this country has ever encountered. This paper will begin by focus-ing on the type of disruptions that impacted the city of New Orleans emergency response system and the correlation to the collapse of the levee system, which attributed to the ina-bility of the system to effectively recover. Additionally the key agent, humans, which contributed to disruptions in the system, will be analyzed. Following on, the paper will analyze the capabilities that the author believes were necessary for the disaster support system in New Orleans to be resilient. The intent is that the aforementioned analysis will serve as proof that leaderships inability to adequately prepare beforehand, in addition to effectively managing the emergency support effort in the aftermath of Katrina played a major role in the disaster support systems ability to successfully mobilize in an effort to support the residents of New Orleans. As the paper progresses, the author will make the premise that attributes associated with adaptability were clearly absent in New Orleans emergency management system. Subsequently, the analysis of the elements of adaptabil-ity will be performed to make the case.
The author is of the belief that if one points out problems, he or she should assist in formulating a resolution. Therefore, the author will demonstrate, via steps that mitigate the impact of a disruption, had officials properly addressed elements in the three phases of resilience - avoidance, survival and recovery - prior to the Katrina, some level of resi-lience may have been attainable, at a minimum, for one of the phases. After reading this paper, one should ascertain that the key agent that contributed to the disruption in the New Orleans Disaster Support System was human. Resultantly, it should be clear from the information presented that many of the events (agents) that lead up to the disruption should have been foreseen and plans put into place and implemented in a timely fashion to serve as mitigating factor. The aforementioned may have aided in the systems ability to survive or at least recover a greater portion of its capability in the aftermath of Hurri-cane Katrina. 1.0 Introduction Hurricane Katrina struck the New Orleans region on August 29, 2005. It was one of the most destructive natural disasters to ever occur in the United States. Katrina made land-fall as category 3 hurricane, however it carried sustained winds in the Gulf Coast region

137
as that of a category 4 storm. Seven states were affected by flooding, they were Georgia, Florida, Alabama, Mississippi, Louisiana, Kentucky and Ohio. Kentucky and Ohio were impacted by the flooding of the Mississippi river. In the aftermath of Katrina 85% of greater New Orleans was flooded, 1863 people lost their lives, 705 people were deter-mined to be missing and approximately 100,000 people were displaced or became home-less. An estimated 400,000 jobs were lost in the Gulf Coast area as a result of the storm, which is contributed to having driven the region into financial crisis. The total cost of Katrina is estimated to be 110 billion dollars, making it the costliest natural disaster in American history. [1]
This paper will begin by discussing the core of the disruption to the New Orleans Disaster Recovery System during and following Hurricane Katrina. Subsequently, the internal and external factors, along with the key agent involved in the disruption will be outlined in the section of the paper labeled System Disruptions. Following, an examina-tion of the culture that contributed to the systems inability to effectively cope with the disaster will be covered in a section of the same name. In that discussion a close look at how culture impacts leadership, a key element to resilience, will be undertaken. As the paper progresses, the systems inability to adapt to the dynamics of the disruption will be analyzed. Based upon that analysis, the disaster support systems absence of ca-pacity and inter-element collaboration will be established; themselves essential elements of adaptability. Following on, the systems lack of resilience will be examined in the form of managerial and technical shortfalls under the heading of capability.
However, when highlighting shortfalls, one should offer alternatives or viable solu-tions. Therefore, a blueprint will be discussed for building resilience into New Orleans Disaster Support System under the heading of Architecting Resilience. In closing, a re-cap of all topics will be captured with final thoughts offered by the author.
2.0 System Disruptions The following passages highlight the types of disruptions that hindered the disaster sup-port system in New Orleans, along with identifying the primary agent that contributed to those disruptions. As alluded to, a multi-type disruption theory will be presented and evidence offered that demonstrates that the human element was the key agent in affecting the Emergency Management Agency’s ability to adequately respond to the needs of citi-zens during and following the disruption. 2.1 Type A Disruption Emergency management teams in New Orleans were ill prepared for the disaster as a whole, there is no argument on my part in that matter. However in the preparation that did take place, the human element of the system made preparations for responding to emergencies arising as a result of the active hurricane itself. No one anticipated that the real emergency would take place after the storm had passed. The teams anticipated that their services would be required prior to the eye of the storm falling over the city, where they anticipated participating in events such as rescuing individuals from flooding (not on the scale seen after the levee system gave way), fallen debris, and lack of utilities in the aftermath of the storm. The collapse of the levee system following the storm (Type B

138
disruption), whether natural or intentional (no evidence exists to prove it was intentional) and the resulting change in environment (water flooding most of the city outside of the quarter) was a disruption in the system no one anticipated. This unanticipated change in environment is why I believe the disruption in the disaster support system caused by the break in the levee system (mass flooding) can be considered Type A. [5] 2.2 Type B Disruption The lack of cooperation between local, state and federal government agencies also played a part in the slow or in some cases nonexistent assistance rendered to the many stranded citizens of New Orleans. The following passages will take a look at the key agent which contributed to the disruption in the disaster support system. Additionally, a discussion of whether the disruption in the levee system was due to a system or component failure will be undertaken. Furthermore, insight into one of the latent conditions, which can be said to have been a contributing factor in the internal disruption, will be discussed. 1. System vs. Component The levee system is not very complex. However, the levees were not designed to handle a storm above category 3. The problem with the design was clearly understood by the Army Corp of Engineers who for many years had a plan for draining the city should the need arise [5]. For that reason alone I will make the assessment that the failure happened at the component vice the system level. It was clearly a disruption of unreliability. 2. Latency The Army Corp of Engineers management oversight in reviewing the design of the levee system was not up to par and appears to have created an engineering mindset of “It’s good enough for government work”; which it clearly was not. The atmosphere created can be stated to have attributed to, what appears to be, non-adherence of policies and pro-cedures that govern how the agency conducts business. 2.3 Agent The human element was probably the most disruptive agent in the system and is key to understanding the inadequate responsiveness of New Orleans Disaster Support System in the face of Katrina. Most notably the failure of leadership at the local, state and federal levels of government to order the complete evacuation of the city in a timely manner and stress the importance of such an evacuation to the citizens of that region is arguably the “domino” that started the downward spiral impacting survival of the disaster support sys-tem during the disruptions. Despite adequate warning from the National Weather Ser-vice, 56 hours prior to landfall, that the region was about to experience one of the worst storms of the century and being informed that New Orleans was likely ground zero for landfall, Governor Kathleen Blanco and Mayor Ray Nagin delayed ordering the mandato-ry evacuation of New Orleans until 19 hours before the hurricane came ashore [2]. At the federal level, George W. Bush, Jr, then President of the United States, should have desig-

139
nated the highly probable impact of Katrina upon the Gulf Coast an Incident of National Significance (INS) at least two days prior to landfall [2]. By taking the lead and under-standing the impact that a category 5 storm would have upon the region, untimely deaths may have been prevented. An INS designation would have released federal resources to the state in a timely manner, among these coordination of incident management and emergency assistance services [9]. Furthermore, the Secretary of Homeland Security, Michael Chertoff, should have given the President sound counsel and convened the Inte-ragency Incident Management Team at least two days prior to Katrina hitting the Gulf Coast to allow the group time to analyze the consequence of the storm making landfall near a major metropolitan area, in addition to having adequate time to formulate an ade-quate response [2]. After Katrina made landfall and the levee system breached, recovery of capability in the disaster support system became virtually impossible. The literal dis-integration of local law enforcement and the failure of the Federal Emergency Manage-ment Agency (FEMA) to supply much needed resources to the area with any sense of ur-gency were major factors. The slow response of FEMA to react to the disruption in a timely manner is largely attributed to, what is widely believed, the lack of qualification of the head of the agency at the time. The appointment of a director to a position for which he was clearly not prepared to serve in can be contributed to the culture of “quid pro quo” in making political appointments that many believed to be prevalent in the Bush administration. This culture itself being a disruption in the recovery effort as a result of ineffective management in key positions. Culture will be discussed further in the next section. From the 30,000 ft view, the author tends to lean toward the idea that inaction by leadership during Katrina can be termed as emerging latent conditions appearing in the emergency management infrastructure at a critical hour, which contributed to the sys-tems inability to survive or recover from a major disruption.
Figure 5, Sortie over New Orleans in Air Force One - Post Katrina

140
3.0 Culture Culture may have been a significant factor in the way local and state leadership handled the preparation and response to Katrina. The local political structure could be deemed protectionist. As such, all political decisions are kept local for fear big brother, the state and federal government, may venture beyond the scope of the assistance requested. This could possibly be the reason, and I am hypothesizing, that Ray Nagan did not appear to have a sense of urgency in requesting assistance from either the local or the state level until some time after the storm had devastated the city. On the other hand it could be that leadership just did not understand the scope of the disruption that was about to impact their system.
One thing is clear; there were definitely too many cooks in the kitchen, which caused confusion and the inability of leadership to effectively make decisions [2]. With every-one wanting their voice to be heard and not wishing to appear to be outdone by another official in leadership, at times there was too much direction and other times not enough [2].
Another cultural phenomenon that contributed to the disruption in the disaster re-sponse system was the complacency of the residents of New Orleans, in and out of lea-dership, to the oncoming storm. Citizens of New Orleans were so use to experiencing seasonal storms that they had desensitized themselves to the lethal effects that a category 5 hurricane carried with it. The complacency with which some citizens viewed storms in the region can be seen in figure 2. However, the evacuations that did take place went well, thanks in part to an existing agreement between Mississippi, Louisiana and Ala-bama, which called for the conversion of all lanes on designated highways, such as I-10, into one way venues in the case of a mandatory evacuation for either of the cities. Yet, many of the citizens who had seen storms come and go decided to “ride out” the storm. Although the national weather center notified the governor of Louisiana and the mayor of Louisiana that the impending storm would probably leave the city virtually uninhabitable, neither leader stressed the need to evacuate the citizens of the city until it was far too late for an effective evacuation of the remaining citizens. As a result, many of those who de-cided to stay either remained in their homes or headed to the New Orleans Super Dome to “hunker down.” This absence of urgency in leadership at all levels of government to get as many citizens, without the means, out of the city as early as possible is a clear cut case of mismanagement. 4.0 Key Attribute Adaptability and two of its elements, capacity and inter-element collaboration are but a subset of the components that contribute to any system being deemed resilient. However, adaptability and the aforementioned associated elements are the key attributes that were most notability absent in the city of New Orleans Disaster Support System during the timeframe of Katrina. Therefore, the author has chosen them, among others, to discuss in this paper. Albeit the inability to adapt to the dynamics of the situation by officials re-sponsible for actions taken by the emergency management system was clearly evident, there was some emergence of adaptability demonstrated by individuals who were not members of that team. Neighbor came to the aid of neighbor and in untold cases met the

141
needs of total strangers. Ad hoc medical clinics were set up in the Superdome from sup-plies liberated from flooded pharmacies; all done in an effort to survive yet another day, itself a key ingredient to resilience. “What’s needed is a National Action Plan. Not a plan that says Washington will do eve-rything, but one that says, when all else fails, the federal government must do something…” - The Select Bipartisan Committee
Final Report of the Select Bipartisan Committee to Investigate the Prepa-ration for and Response to Hurricane Katrina
Figure 6, Complacency in Disaster Preparedness 4.1 Adaptability As stated previously, New Orleans Disaster Support System was not able to adapt to the dynamic situation that unfolded prior to Katrina making landfall and certainly not after-ward. One of the contributing factors was that the National Response Plan (NRP) was not adequately understood by first responders. Subsequently, many were overwhelmed by the events as they were unfolding and did not know where to focus their efforts. Ad-ditionally, the NRP did not provide for sustaining any initiatives undertaken by first res-ponders. Resultantly, any assistance rendered was finite as there was no guarantee that a first responder would adequately have the resources necessary to sustain a prolonged re-quirement for assistance. Furthermore, plans at all levels of government were rigid and inflexible, which in many cases was the cause of delay in first responders reacting to the crisis as it unfolded. [2]

142
4.1.1 Capacity The disaster support system in the city of New Orleans was not able to absorb or sustain itself during Katrina. Much of this had to do issues pointed out with the NRP in the sec-tion 4.1. Nevertheless, lessons learned following Katrina pointed to the fact that a Na-tional Action Plan (NAP) is needed vice a NRP if the system has any realistic hopes of ever being able to cope with a major disaster like Katrina again. A NAP would tell local, state, and federal agencies what they must do in a national emergency and give them the authority to do it vice an NRP which merely is a road map or recommendation of what each agency should be doing at each phase of a disruption [3]. 4.1.2 Inter-element collaboration The Disaster Response System was plagued with problems which affected effective col-laboration among government agencies. These problems ranged from local districts squabbles and the protecting of turf, which is believed to have contributed to the failure of the levees, in addition to communication that broke down at all levels of government.
Ownership and upkeep of a levee system is a precarious process, especially in New Orleans. Once the building of a levee system is complete the United States Army Corp of Engineers (USACE) process is to turn over the maintenance of the system to local au-thorities [4]. It is a shared process, thus various parishes (counties) in the New Orleans area control different segments of the levees; subsequently, in those parishes various dis-tricts (i.e. Reclamation district, Water and Sewage District) may be required to maintain different aspects of the levee system. For instance, the pumping stations may be under the control of one agency and district in a parish while the maintenance of leaks in the levee walls may be under the auspices of another. In the case of New Orleans the prob-lem with having so many local authorities involved in the maintenance of the levee sys-tem is that upkeep in various locales was either neglected due to questions of authority or in some cases due to old scores being kept as a result of petty agency squabbles. It is im-portant to note that residents in some of New Orleans parishes reported leaks at various segments of the levee system prior to Katrina ever coming on the city’s radar screen [5]. However, a significant number of the reports were never acted upon by the appropriate authorities. In some cases the reports were left unattended by the receiving parish be-cause the leak in question was at an adjoining section of a levee wall, which led to ques-tions of repair responsibility. Was the repair the responsibility of the parish receiving the report or the parish who maintained the opposite section of the adjoining wall? In far too many cases the resolution was to do nothing. In an investigation into the cause of the failure of the levee system following Katrina the USACE found that levee segments in some locales, which had clear violations such as tree and shrub growth, received accepta-ble ratings during the most recent inspection prior to Katrina [5]. In far too many cases, one being unacceptable, if a problem was found outside the responsibility of the district in question, it would go unreported to the appropriate office if that district happened to be one in which “bad blood” was shared [5].
Leadership had no clear picture of what was going on in the city during and after the storm. Situational awareness on the ground was clouded at best due to a number of fac-tors. Lack of interoperability between communication systems played a major factor in

143
local, state, and federal government agencies not being able to pass information between one another [4]. In addition, conventional communication via cell and land phones was sporadic as best following the storm. Subsequently, news agencies at the local and na-tional level assumed the role of first informers. Many of the reports of looting and law-lessness that streamed relentlessly from news agencies turned out to be unsubstantiated and in many cases salacious banter served up to boost ratings. The scenes that news out-lets, such as CNN, kept showing of lawless behavior turned out to be loops of the same scenes played over and over for days. Those horrendous scenes and the associated re-ports led those in charge of the response effort to hit the pause button for a time. The problem is such, since leadership, inclusive of all levels of government, were using news agencies as first informers, first responder’s ability to effectively react to the crisis in a timely manner was impacted for fear of their safety [4]. Those that did respond in spite of the reports came onto the scene armed to fight World War III. The aforementioned could be viewed by some as evolving the role of responder into that of defender; itself a latent disruption 5.0 Capability The following is an analysis of the managerial and technical capabilities that were needed to ensure New Orleans Disaster Support System was resilient, albeit lacking due to lea-dership challenges at the local, state and federal level. 5.1 Managerial Prior to Katrina there had been a recent changing of the guard at the local and state level of leadership. Ray Nagin had not been in his post as mayor of New Orleans long and Governor Kathleen Blanco was less than two years into her first term. Nevertheless, the lack of preparation for a storm of such magnitude for a major city whose southern border is the Gulf of Mexico demonstrated managerial incompetence at best. As has been men-tioned throughout this paper, nothing in leadership’s actions taken beforehand, as far as planning goes, hinted at preparation to avoid a major disruption, recover from one or sur-vive a natural disaster of Katrina’s magnitude. 5.2 Technical Technical capabilities primarily apply to the survival of a system. One has but only to reflect back on the hoards of individuals in the New Orleans Superdome, convention cen-ter, individuals sleeping on I-10 and families living with corpses for days on end to un-derstand that the disaster preparedness and response system in the city of New Orleans did not survive intact.
I offer that city officials should have used tools analogous to the Swiss Cheese Model or N2 diagram in planning for disasters. For instance, by using a tool analogous to the N2 diagram, appropriate for disaster preparedness, officials would have been aware of ob-vious disconnects in the support mechanism. The tool would have demonstrated that there was a problem with interagency communication at all levels of government. As has been mentioned, effective communication proved to be challenging in the aftermath of

144
the storm. This observation was quite apparent to those on the outside watching events unfold. 6.0 Architecting Resilience Experience is the hardest kind of teacher. It gives you the test first and the lesson after-ward
- Eberhardt Rechtin: Systems Architecting: Creating & Building Complex Systems This section of the paper outlines a blueprint that the author believes, if effectively im-plemented, will assist the disaster support system of New Orleans on the road to becom-ing resilient. Subsequently, a plan for how a disruption may be avoided, how to survive should a disruption surface, in addition to ensuring partial capability of the system re-mains intact after a disruption will be offered in the following passages.
6.1 Avoidance Avoidance is the ability of the engineer to design elements into the system engineering process that will allow a system to circumvent a disruption before it has an opportunity adversely impact the system. My original thoughts were that this aspect of resilience is impossibility in all cases due to the real problem of one having to clearly understand in-put variables that affect the system, for which some are unknown. However, over the course of conducting research for this paper, my thinking has evolved to the point where I now believe that the steps one takes to achieve the concept can contribute to the overall accomplishment of resilience in a system as well. To put it another way, the journey can be as much benefit to building resilience into a system as that of reaching the destination; achieving avoidance.
In July 2004 emergency officials from over 50 parishes in the state of Louisiana, in-cluding Mississippi’s Emergency Management Agency, took part in a joint disaster pre-paredness exercise termed “Hurricane Pam.” The purpose of the exercise was to assist officials in Louisiana in developing joint disaster response plans that would meet the needs of the state in during a disruption involving a catastrophic hurricane [7]. The Fed-eral Emergency Management Agency (FEMA) initiated the request for proposal (RFP) that was the catalyst for the contract to run the exercise, which was eventually awarded to a contractor in Baton Rouge. The planning process for Pam and execution time frame was shortened significantly, 53 days. FEMA and Louisiana officials hastened the com-mencement of the exercise because they felt that a level 5 hurricane impacting New Or-leans was highly probable and likely to be one of the most devastating disasters ever ex-perienced in the United States [7]. With the understanding that it could take upwards to 30 months to write the emergency plan following the exercise, train personnel on the process and issue the report, officials were anxious to have the exercise commence post-haste.
On the surface, the aforementioned events seemed admirable. From a distance it ap-peared as if officials were earnestly attempting to implement elements of resilience into the New Orleans Disaster Support System. However, a significant gap existed between

145
issues that were being addressed via workshops during the Hurricane Pam exercise and those that needed to be addressed in order to support the sustainment of the city’s disaster response system during a disruption as significant as Katrina.
The issue of how to handle evacuating a city before a hurricane makes landfall never came up for official discussion during the workshops [7]. The “assumption” was that evacuations, for individual who could not do so themselves, would be handled at the state and local level. However, anyone who followed events in the city before and after the storm clearly understands that was not the case. This oversight was a key element in the disruption that crippled the disaster support system in the city.
However to official’s credit, contra-flow was discussed in the workshops, subsequent-ly it was one of the disaster response measures taken up as a result of Pam that was a suc-cess during Katrina. Contra-flow involves shutting down highways and roads to bi-directional traffic, thus making all lanes flow one way. Bear in mind, contra-flow was only effective for individuals that had the means to leave the city. It did nothing for folks whose only recourse for survival, due to lack of economic means, was to take refuge on their roof, in their attic, or seek shelter at the New Orleans Super Dome. Figure 3 is an example of how the development of plans have no influence on a systems ability to avoid or survive a disruption if there is a failure in leadership when it comes to follow through and execution.
Figure 7, Coast Guard Rescue of Elderly Couple Post Katrina
The author’s recommendation, or blue print outline if you will, for ensuring that steps taken on the path to avoidance are successful for disruptions akin to Katrina, is to first evaluate lessons learned from similar occurrences. The officials who participated in the Hurricane Pam exercise found holes in their processes and procedures for dealing with category 3 and above hurricane events. However, up until the time of Katrina those les-sons learned were never acted upon to strengthen plans or provide resources where holes existed in the infrastructure (e.g. communications, search and rescue, etc…) [7].

146
The second step would be to have a thorough inspection process in place for the levee system with responsibility and accountability clearly outlined. New Orleans is basically a fish bowl that is kept dry by pumping stations and levee walls. The idea that the U.S. Army Corp of Engineers (USACE) process is to leave the inspection and maintenance of that system entirely in the hands of local agencies once development is complete is unfa-thomable given the consequences of a breach [4]. I would go so far as to say that the in-spection and proper maintenance of the New Orleans levee system is a matter of national security after the witnessing the horrendous condition of the city’s infrastructure and the displacement of its citizens in the aftermath of Katrina. Additionally, other cities and states felt the impact of the storm by way of a drain on their resources due to the large migration of Louisiana residents to other locales in an effort to obtain the basics needed for survival. Areas such as Houston and Dallas were not flexible enough to adapt to the sudden and extreme demands put on their local economies and housing infrastructures. Subsequently, there was a ripple effect in the form of a disruption to those cities emer-gency management systems as they scrambled to find shelter and jobs for the displaced. I don’t think a disruption such as a natural disaster can ever be entirely avoided, however in the case of Katrina the disruption could have been dampened if the levee system had been properly inspected and maintained. With the proper oversight, the 17th street canal levee may not have breached and the flooding of the city may have not been so severe. Subsequently, the ability of the city of New Orleans Disaster Support System to respond to citizens needs may not have been so gravely impacted. 6.2 Survival “It's awful down here, man” - Ray Nagin WWL-AM Radio Interview with Garland Robinette There are steps that the officials who were in charge of the disaster support effort could have taken to ensure the system continued to function effectively. The step the author will speak to in this paper, which also is inline with governance, is the need for the im-plementation of rigorous independent audits. These audits would have revealed that the plans and processes that were developed as a result of the Hurricane Pam exercise were never “beefed” up, as anticipated, in the months that followed. In laymen terms, the in-tricate details that needed to be added to the plans never got incoporated. Two of the plans that that fell into that category, and were directly related to the survival of the disas-ter support system, were those governing search and rescue and rapid assessment teams [7]. 6.3 Recovery The recoupment of any effective capability in the disaster response system was severely limited by official’s inability to shore up the breach to the 17th street canal in a timely manner. Additionally, the submergence of pumping station 6 may have led to many more deaths due to a severe increase in flood waters in the city as a result of its unavailability [8]. Mayor Nagin insists that he warned those in leadership at the state and federal levels

147
of the consequences of not being repairing the 17th street canal breach expeditiously and those associated with pumping station 6 going underwater; Nagin insists no one listened [8]. In light of the aforementioned, the recommendation that the author would provide to officials would be to change the culture of non-cooperation that exists between various agencies at all levels of government. The political spinning and grand standing before the cameras that took place following the storm did nothing to assist the recovery effort in the aftermath of Katrina. A National Action Plan would help to bring that culture of cooperation into play by instructing agencies of what they must do in times of crisis [3]. However, no plan will ever change the hearts and minds of individuals. For change to really take root it will have to start at the top, lead by example, and filter down into the trenches. 6.4 Risk Management A comprehensive risk management decision making process should be implemented at the local, state and federal levels of government to determine where funds should be ex-pended in shoring up capability for dealing with disruptions, the magnitude of Katrina that could possibly threaten the Gulf Coast in the future [10]. Had leadership developed and implemented such a process prior to Katrina, an unacceptable risk would have been identified with the respective local levee boards not having a warning system in place for the city of New Orleans [5]. A levee warning system would have potentially alerted authorities of a breach. Additionally, federal regulations mandate that a levee system be monitored when the potential for flooding is high [5]. Given the location of New Orleans and the high probability of seasonal hurricanes making landfall over or near the city (high), and given the consequence of storm impact (high), the failure by leadership in that state to identify and mitigate this particular risk is, in the opinion of the author, mind boggling. 6.5 Tools As mentioned previously, the use of a N2 diagram would have revealed where incompat-ible interfaces existed in the emergency management infrastructure, not only for New Or-leans, but the State of Louisiana as a whole. The use of a tool such as the Swiss Cheese Model would have demonstrated to leadership at all levels of government that their disas-ter preparedness effort was drifting toward brittleness. Figure 4 is but one example of how these models can and should be implemented. 6.6 Heuristics The heuristics discussed in this section are those the author believes can contribute to en-suring the disaster support system in New Orleans is resilient enough to withstand a dis-ruption, the magnitude of Hurricane Katrina, in the future. The premise being the inabili-ty of the system to adequately respond to the needs of the citizens during Hurricane Ka-trina can be, in part, attributed to a failure by leadership to recognize the importance of heuristics in the quest to develop a resilient system.

148
Leadership Inaction
Hurricane Katrina Swiss Cheese Model
Non-existence of Inter-element Collaboration
Inadequate Maintenance of Levee System
Lessons learned Ignored (Hurricane Pam)
Model based off Duke University Medical Center, Department of Community and Family Medicine Swiss Cheese Model
Disruption
Agents
Figure 8, Hurricane Katrina Swiss Cheese Model
The heuristics discussed herein will touch upon organizational decision making, repara-bility decisions, information sharing, drift detection, designing to the worst case scenario, and accounting for adequate margin in a system. 1. The organizational decision-making heuristic - Organizational decision-making should be monitored. [11] This heuristic speaks to governance or oversight into the decision making process of in-dividuals in a system. During Katrina, the absence of any decision making focal point was clear to those looking down the rabbit hole. The mayor wasn’t making critical deci-sions in a timely manner and neither was the governor of that state. Local law enforce-ment was overwhelmed and interjection into the crisis at the federal level of government was virtually non-existent. All direction, per the National Management Plan (NAP), should have come from the Principal Federal Official (PFO), which was the Secretary of Homeland Security [9]. Nonetheless, one individual did emerge out of the disruption as the unifying voice to harness resources and develop an effective recovery effort at all le-vels of government, Lt. General Russell Honore, Louisiana officials indicate the request for Lt. Gen Honore came directly from their Adjutant General without first coordinating the request with FEMA. Purportedly, this was done to bypass the bureaucratic tape that is said to have been involved with requesting federal assistance in the aftermath of the disruption [12]. The process itself, seemly, being an agent of latency. After witnessing the speed at which change, for the better, took root in the recovery effort, the author would recommend that the military be given ultimate authority in matters concerning dis-aster preparedness and recovery on the ground prior to and following a disruption of similar magnitude as that of Katrina. The question then, is this a recommendation to dec-lare martial law in such instances? For disruptions to any system stemming from such disasters, martial law may be a key element of the recovery effort.

149
2. The reparability heuristic - The system should be repairable. [11] A plan should be in place to repair levee breaches in a timely manner. The execution of that plan should be the responsibility of the United State Army Corp of Engineers (USACE). That agency should be granted executive authority to take the appropriate ac-tions to ensure that those breaches are contained expeditiously. 3. The knowledge between nodes heuristic – Maximize knowledge between nodes. [11] As have been discussed in previous papers, there was no sharing of information between nodes in the emergency management network at any level of government. Mayor Nagin was asked the following question by a personality from local radio station WWL-AM during an interview in the aftermath of Katrina, “Do you believe that the president is see-ing this, holding a news conference on it but can't do anything until Kathleen Blanco re-quested him to do it? And do you know whether or not she has made that request?”, the Mayors response was, “I have no idea what they're doing…” [8]. Maximizing know-ledge between nodes goes hand and hand with the attribute of inter-element collabora-tion. If lines of communication break down then disaster is on the horizon, as evidenced by the events that unfolded in New Orleans in the days following Katrina. The author’s recommendation again would be to have the one local emergency management Czar on the ground, analogous to Lt. Gen Honore, who would coordinate communication between all factions. Interestingly enough, the Department of Homeland Security had the respon-sibility to come in and perform the very function that Lt. Gen Honore found himself per-forming as coordinator of the recovery effort in the aftermath of Katrina. 4. The drift correction heuristic – Drift towards brittleness should be detected and cor-rected. [11] USACEs feet should be held to the fire as it pertains to ensuring the levee system in New Orleans is adequately inspected and preventative and corrective maintenance is per-formed in a timely manner. Inspections and audits to ensure those inspections were per-formed appropriately – a system of checks and balances - would allow officials to under-stand if they were heading towards a disruption in the levee system. The drift may have been evident prior to Katrina if closer scrutiny had been given to the inspection reports that districts filed, which later appear to have been “gundecked” in various cases [5]. The author would go so far as to recommend that oversight of the levees be reverted out of the hands of the local districts in New Orleans and turned over to USACE for maintenance and operation. USACE currently maintains and operates the Mississippi River levees, which for the most part withstood the impact of Katrina [5]. Additionally, a warning sys-tem should be put in place to alert officials of a breach or potential breach in levee walls. Such a system is not only essentially during an impending natural disaster, but serves to aid in avoidance of a disruption during times of “normalcy.”

150
5. The context spanning heuristic - The system should be designed to both the worst case and most likely scenarios. [11] The author would recommend USACE revisit all plans applicable to the levee system in New Orleans and do a comparative analysis on that system against the plans of systems throughout the U.S. that are known to be designed within federal guideline. Find the po-tential agents of disruption that Katrina didn’t reveal. Preliminary reports following Ka-trina into the reason for the levee failure indicated that the system was not designed to withstand the worst case storm, category 5. Though Katrina came ashore as a category 3, the sustained winds over the city were equal to the storms previous strength at category 4. The rational for not performing an analytical study and correcting deficiencies can not and should not be that monies are not available for such an undertaking. If that is the case, the author’s recommendation would be that photos of New Orleans, post Katrina, be prominently displayed in the office of any official who holds to that claim. 6. The margin heuristic – The system should have adequate margin to absorb disrup-tions. [11] This heuristic may be inline with the context spanning heuristic. The disaster support system, impacted by the levee breach, could not absorb the disruption as evidenced by individuals who were hovered inside the New Orleans Superdome unable to leave the city for days after the storm dissipated, largely due to inadequate resources. As has been mentioned in previous papers, a National Action Plan would identify the resources that should be made available, ensure they are strategically placed in staging areas, and assign authority for release. Implementing the aforementioned would ensure that some margin to absorb the impact of the disruption is built into the system. 7.0 Conclusion This paper was targeted towards academia and the general public. In reading this paper, one should have been left with understanding the key element that contributed to the dis-ruption in the city of New Orleans Disaster Response System was indeed human. Specif-ically, a lack of leadership should have been clearly demonstrated as the key component in the failure of resilience as it pertains to the city’s disaster response and recovery net-work. It was not the author’s intent to provide a hindsight view of the cause of the sys-tems inability to survive or recover from the disruptions associated with Katrina without offering recommendations that could contribute to ensuring the system is resilient enough to withstand future disruptions. Additionally, it was beyond the scope of this paper to provide a complete plan for avoidance, recovery, and survival. Nevertheless, after read-ing the section of this paper entitled Architecting Resilience, the reader should have come away with a better understanding of some of the tools and lessons learned that would be of benefit to the city of New Orleans in hardening their disaster recovery system. Eber-hardt Rechtin stated that, Experience is the hardest kind of teacher. It gives you the test first and the lesson afterward.” [13] However, some lessons are too costly to learn via trial and error, the disruptions that brought the city of New Orleans Disaster Support Sys-tem to its knees during Hurricane Katrina being among those lessons.

151
References 1. Seed R., et al. (July 31, 2006). Investigation of the Performance of the
New Orleans Flood Protection Systems in Hurricane Katrina on August 29, 2005. (Vol 1.) [Executive Summary] Report retrieved from the University of California Berkley - Civil and Environmental Engineering website April 19, 2009: http://www.ce.berkeley.edu/projects/neworleans/
2. U.S. House of Representatives. (February 15, 2006). A Failure of Initiative: Final Re-port of the Select Bipartisan Committee to Investigate the Preparation for and Re-sponse to Hurricane Katrina [Executive Summary] (H. Rpt.109-377). Washington, DC: U.S. Government Printing Office. Report retrieved from GPO website Feb 14, 2009: http://www.gpoaccess.gov/serialset/creports/katrina.html#zip
3. U.S. House of Representatives. (February 15, 2006). A Failure of Initiative: Final Re-port of the Select Bipartisan Committee to Investigate the Preparation for and Re-sponse to Hurricane Katrina [Preface] (H. Rpt.109-377). Washington, DC: U.S. Gov-ernment Printing Office. Report retrieved from GPO website Feb 14, 2009: http://www.gpoaccess.gov/serialset/creports/katrina.html#zip
4. U.S. House of Representatives. (February 15, 2006). A Failure of Initiative: Final Re-port of the Select Bipartisan Committee to Investigate the Preparation for and Re-sponse to Hurricane Katrina [Conclusion] (H. Rpt.109-377). Washington, DC: U.S. Government Printing Office. Report retrieved from GPO website Feb 14, 2009: http://www.gpoaccess.gov/serialset/creports/katrina.html#zip
5. U.S. House of Representatives. (February 15, 2006). A Failure of Initiative: Final Re-port of the Select Bipartisan Committee to Investigate the Preparation for and Re-sponse to Hurricane Katrina [Levees] (H. Rpt.109-377). Washington, DC: U.S. Gov-ernment Printing Office. Report retrieved from GPO website Feb 14, 2009: http://www.gpoaccess.gov/serialset/creports/katrina.html#zip
6. Jackson, S. (2009). [System Resilience and Related Concepts, SAE-599 Class Notes]. Unpublished data., (Available from University of Southern California, Los Angeles, CA 90089)
7. U.S. House of Representatives. (February 15, 2006). A Failure of Initiative: Final Re-port of the Select Bipartisan Committee to Investigate the Preparation for and Re-sponse to Hurricane Katrina [Pam] (H. Rpt.109-377). Washington, DC: U.S. Gov-ernment Printing Office. Report retrieved from GPO website Feb 14, 2009: http://www.gpoaccess.gov/serialset/creports/katrina.html#zip
8. Robinette, G. (2005). [Mayor to feds: 'Get off your asses']. Transcript of WWL-AM Interview,. (Available from CNN Online) Transcript retrieved from CNN website April 03, 2009: http://www.cnn.com/2005/US/09/02/nagin.transcript/
9. U.S. Department of Homeland Security. (2004). National Response Plan. Report re-trieved from FAS website April 16, 2009: http://www.fas.org/irp/agency/dhs/nrp.pdf
10. Walker D. (2006). Hurricane Katrina, GAO's Preliminary Observations Regarding Preparedness, Response, and Recovery (GAO-06-442T). Washington, DC: United States Government Accountability Office. Report retrieved from GAO website Mar 01, 2009: http://www.gao.gov/new.items/d06442t.pdf

152
11. Jackson, S. (2009). Architecting Resilient Systems: Accident Avoidance and Survival and Recovery from Disruptions (1st ed.). Hoboken, New Jersey: John Wiley & Sons, Inc. (Preliminary 2009) [Chap. 8]
12. U.S. House of Representatives. (February 15, 2006). A Failure of Initiative: Final Report of the Select Bipartisan Committee to Investigate the Preparation for and Re-sponse to Hurricane Katrina [Military] (H. Rpt.109-377). Washington, DC: U.S. Government Printing Office. Report retrieved from GPO website Feb 14, 2009: http://www.gpoaccess.gov/serialset/creports/katrina.html#zip
13. Rechtin E. (1991). Systems Architecting - Creating & Building Complex Systems. [pgs 269, 271] Upper Saddle River, New Jersey.: Prentice Hall PTR
Figures Cover photo - (House Bipartisan Committee Congressional Report: H. Rpt. 109-377, Feb 2006 ed.) retrieved 2009, Feb, 14 from GPO Access website: http://www.gpoaccess.gov/serialset/creports/katrina.html","http://www.gpoaccess.gov/serialset/creports/katrina.html#zip
1. Sortie Over New Orleans in Air Force One - Post Katrina…………………………….6 (Article on Hurricane Katrina). Retrieved 2009, Feb, 02 from Wikipedia website:
http://en.wikipedia.org/wiki/Hurricane_katrina 2. Complacency in Disaster Preparedness……………………………………………......8
(House Bipartisan Committee Congressional Report: H. Rpt. 109-377, Feb 2006 ed.) [Pre-landfall]. Retrieved 2009, Feb, 14 from GPO Access website: http://www.gpoaccess.gov/serialset/creports/katrina.html#zip
3. Coast Guard Rescue of Elderly Couple…………………………………...…………..13 (Tidewater Muse's Photo Stream) Retrieved 2009, April 17, from Flickr website: http://www.flickr.com/photos/tidewatermuse/41217885/in/set-866494/
4. Hurricane Katrina Swiss Cheese Model……………………………………………..15 Model based off Duke University Medical Center, Department of Community and Family Medicine Swiss Cheese Model

153
Biographies
Jacob Bowden is a Systems Engineer employed with BAE Systems, Inc. in San Diego, Califor-nia. Jacob received a bachelor’s degree in Systems Engineering from the University of Arizona in 2004 and is currently pursuing a Master’s Degree in Systems Architecting and Engineering from the University of Southern California. Jacob is an avid outdoorsman and is a member of the Rocky Mountain Elk Foundation and Ducks Unlimited. Jacob spends as much time as possible in the out-of-doors enjoying all of what nature has to offer. Jennifer Maxwell is currently enrolled in the PhD program in Systems Architecting and Engi-neering at USC. She also works as a Systems Engineer on the Mars Science Laboratory at Cal-tech's Jet Propulsion Laboratory. She has an M.S. in Aerospace Engineering from USC and a B.S. in Aeronautics and Astronautics from MIT. In her spare time, she enjoys running half-marathons, wine tasting, and spending time with her friends and family. She resides in sunny Venice, California. Robin Michener is a senior software engineer within the Integrated Defense Systems (IDS) divi-sion of the Boeing Company. Her current position is with Boeing’s Future Combat Systems (FCS) Warfighter Machine Interface Systems (WMIS) program in Springfield, Virginia. Robin Michener is pursuing a Master of Science in Systems Architecture and Engineering at University of Southern California (USC). She is attending classes via USC’s Distance Education Network (DEN). Robin Michener has Bachelor of Science in Electrical Engineering from Princeton Uni-versity (1990) and a Master of Business Administration from Washington University (1995). Af-ter graduating from Princeton University, Robin Michener joined the McDonnell Douglas Cor-poration (now The Boeing Company) in St. Louis Missouri, as an electrical engineer working on support systems for the F/A-18 jet. She relocated to Springfield, Virginia, in September 2006 to begin her current assignment on the FCS program. Robin Michener is a senior member of the Society of Women Engineers (SWE). She served one term as the St. Louis SWE Section Presi-dent (2005-2006), two terms as the St. Louis SWE Section Representative (2004-2004) and two terms as the St. Louis SWE SectDasion Secretary (1997-1999). Darin Mika is employed by Boeing Integrated Defense Systems in Mesa, Arizona. In his current assignment, Control Account Manager for the AH-64 Apache Block III Improved Drive System Development project, he was recognized by a Spotlight on Leadership award. Darin received a Bachelor's degree in Mechanical Engineering from the University of Arizona in 1987 and is cur-rently pursuing a Master's Degree in Systems Architecting and Engineering from the University of Southern California. Darin's engineering work experience includes C-17, MD-11 and AH-64 Apache airframe design as well as automotive air bag inflator design and testing. Darin was awarded three patents for dual stage air bag inflators. Edward Parleman has more than 25 years in the aerospace industry, working in the Aircraft Per-formance and Mass Properties disciplines on aircraft from today’s finest military transport (the C-17 Globemaster III) back through most of the Douglas Commercial series of aircraft (includ-ing the Douglas DC-3), and helicopters both commercial (Hughes Helicopters 500 and 300 se-ries) and military (AH-64 Apache and CH-47 Chinook). He also has extensive experience in the motorsports and automotive worlds, as a volunteer for Championship Auto Racing Teams

154
(CART) for 15 years, a kart racing driver since 1997, and as an owner of more than two dozen ‘muscle’ and performance cars over the past quarter century. Phan Phan is a licensed Professional Engineer in the state of California and has been working for more than 28 years, and performing various technical and managerial functions in the aerospace and defense industry. His education background includes a Bachelor of Science in Engineering, Master degrees in Engineering and Business Administration, and graduate study at the U.S. Na-val War College. He is currently enrolled in the Ph.D. degree program in Industrial and Systems Engineering at University of Southern California. A reserve Engineering Duty Officer in the U.S. Navy, Commander Phan is serving with Naval Sea Systems Command in San Diego, California. Anthony W. Williams holds a B.S. in Electrical Engineering from the University of Texas at Austin and a MBA from the University of Phoenix. He is currently a Systems Engineer with Lockheed Martin Aeronautics supporting Technology, Development and Integration, a group within the corporations Advance Development Program (ADP). Previous programs worked within Lockheed Martin Aeronautics include the F-35 Joint Strike Fighter (JSF), F-16 Block 60, Big Safari and Special Missions and Reconnaissance/Special Operational Forces programs.


