Embed Size (px)
Citation preview

Universidade do Algarve
Faculdade de Ciências do Mar e do Ambiente
*
Study of Perkinsus olseni infection mechanisms:
Identification and regulation of parasite genes differentially
expressed in response to host and environmental stress
*
Thesis for obtaining the degree of doctor in Biology, speciality of Molecular Biology
Rita Margarida Teixeira Ascenso
Supervisor: Doctor Maria Leonor Quintais Cancela da Fonseca Co-supervisor: Doutor Gerardo Vasta Juri President of the Juri: Doctor Rui Santos Vogals: Doctor Idilio Jorge Matias Pereira Pinto Dr. Domitília da Conceição Coutinha Matias Doctor João Carlos Serafim Varela Doctor Miguel João Baptista Gaspar Doctor Dina Cristina Fernandes Rodrigues da Costa Simes Doctor Maria Leonor Quintais Cancela da Fonseca
Faro (2008)

ii
The figure in the cover was adapted from a photography kindly provided by Professor Carlos Azevedo.

iii
Universidade do Algarve
Faculdade de Ciências do Mar e do Ambiente
*
Study of Perkinsus olseni infection mechanisms:
Identification and regulation of parasite genes differentially
expressed in response to host and environmental stress
*
Thesis for obtaining the degree of doctor in Biology, speciality of Molecular Biology
Rita Margarida Teixeira Ascenso
Supervisor: Doctor Maria Leonor Quintais Cancela da Fonseca Co-supervisor: Doutor Gerardo Vasta Juri President of the Juri: Doctor Rui Santos Vogals: Doctor Idilio Jorge Matias Pereira Pinto Dr. Domitília da Conceição Coutinha Matias Doctor João Carlos Serafim Varela Doctor Miguel João Baptista Gaspar Doctor Dina Cristina Fernandes Rodrigues da Costa Simes Doctor Maria Leonor Quintais Cancela da Fonseca
Faro (2008)
iv
Dedicated to all those are part of my life, in my heart, in my memory, by my side.
Dedicado a
todos os que fazem parte da minha vida, no meu coração, na minha memória, a meu lado.

v
NAME: Rita Margarida Teixeira Ascenso
FACULTY: Faculdade de Ciências do Mar e Ambiente
SUPERVISOR: Doctor Maria Leonor Cancela, Universidade do Algarve
CO-SUPERVISOR: Doctor Gerardo Vasta, Center of Marine Biotechnology, USA
DATE: 7th November, 2008
THESIS TITLE: Study of Perkinsus olseni infection mechanisms: Identification and
regulation of parasite genes differentially expressed in response to host and
environmental stress
Abstract
Host-parasite interaction is very common in nature. Perkinsus olseni was
described as the parasite of carpet-shell clam, Ruditapes decussatus, responsible for
heavy mortalities that occurred in the 80ies, in the Southern coast of Portugal, Ria
Formosa. The objective of this thesis was to contribute to better understand the
molecular mechanisms of infection of P. olseni through the identification of parasite
host-response genes differentially expressed in the presence of host hemolymph. From
two SSH approaches, 300 new P.olseni ESTs were identified, from which 98 were
selected for further studies. They were shown to present a pattern of response when the
parasite was exposed to hemolymph of permissive and non-permissive bivalves. Two
genes apparently relevant for parasite host-response were selected for further molecular
characterization and gene expression studies, namely those encoding a putative ion
transporter (PoNHE) and an adhesion-related protein (PoAdh). These genes showed an
inversion in their normal pattern of response when the parasite was challenged with
non-permissive compared to permissive bivalves and the permissive host, this one
economically relevant in Southern coast of Portugal. Their levels of expression upon
environmental stress conditions were also analysed. The EST most represented in the
library was also objective of study. It revealed a close relation to a pyrimidine- salvage
pathway protein (PoClhl). Lastly, efforts were also made towards defining a strategy to
develop a methodology for efficient transfection of P. olseni cells.
Key-words
Parasite, Perkinsus, host-parasite interaction, SSH, gene expression
vi
NOME: Rita Margarida Teixeira Ascenso
FACULDADE: Faculdade de Ciências do Mar e Ambiente
ORIENTADORA: Doutora Maria Leonor Cancela, Universidade do Algarve
CO-ORIENTADOR: Doutor Gerardo Vasta, Center of Marine Biotechnology, USA
DATA: 7 de Novembro de 2008
TÍTULO DA TESE: Estudo dos mecanismos de infecção do parasita P. olseni:
Identificação de genes e expressão genética diferencial em resposta ao hospedeiro e
condições de stress ambiental
Resumo
A interação parasita-hospedeiro é muito comum na natureza. Perkinsus olseni
foi descrito como o parasita responsável pelas mortalidades da amêijoa-boa, Ruditapes
decussatus, que ocorreram na costa do Sul de Portugal, Ria Formosa, nos anos 80. O
objectivo desta tese foi contribuir para uma melhor compreensão dos mecanismos
moleculares envolvidos no processo de infecção de P. olseni, através da identificação de
genes diferencialmente expressos pelo parasita na presença de hemolinfa do hospedeiro.
Foram utilizadas duas estratégias com base na técnica de SSH. Trezentos novos ESTs
foram identificados, dos quais foram selecionados 98 para estudos posteriores. Estes
apresentaram um padrão de resposta variável quando o parasita foi exposto a hemolinfa
de bivalves susceptíveis e não-susceptiveis à perkinsosis. Dois genes aparentemente
relevantes para a resposta do parasita ao hospedeiro foram selecionados para
caraterização molecular e estudos de expressão genética. A saber, um que codifica para
um possível transportador de iões (PoNHE) e outro que poderá estar relacionado com
adesão celular (PoAdh). Esses genes mostraram um padrão de resposta que se inverte
aquando da exposição do parasita a bivalves não-susceptiveis comparando com os
susceptíveis, nomeadamente o hospedeiro, o qual tem interesse económico na costa do
Sul de Portugal. Os seus níveis da expressão genética foram analisados em diferentes
condições de stress ambiental. O EST mais representado na biblioteca subtractiva foi
também objecto de caracterização e estudo. Este gene revelou algumas características
que indicam uma possível função no metabolismo salvage das pirimidinas. Por fim,
foram feitos esforços no sentido de desenvolver um método de transferência de ADN
para o interior das células de P. olseni.
Palavras-chave
Parasita, Perkinsus, interacção parasita-hospedeiro, SSH, expressão genética

vii
Aims of the Present Investigation
(i) To understand the molecular process involved in parasite response to host:
- Identification of parasite up-regulated genes involved in host response;
- Selection of genes with predicted functions related to host- parasite interaction;
- Investigation of parasite host-response up-regulated genes expression profile in
response to commercially relevant bivalves of Ria Formosa.
(ii) To comprehend the patterns of expression of specific parasite genes in response to
different types of bivalves and stressing environmental conditions:
- Molecular characterization of selected parasite genes highly expressed in
response to it’s’ host;
- Analysis of gene expression patterns of selected parasite genes in response to
permissive and non-permissive bivalves;
- Study of pattern of gene expression when parasite was exposed to simulated
stressing environmental conditions.
(iii) To perform application of a parasite gene in an exogenous system:
- Molecular characterization of the most represented EST among the parasite up-
regulated genes in response to its host;
- Characterization of a gene involved in organo-nitrogen compound catabolism;
- Expression of a parasite gene in an exogenous system.
(iv) To pursue the development of a methodology to transfer genes into P. olseni cells:
- Compilation of diverse strategies for parasite transfection;
- Testing of various methodologies for gene transfer;
- Construction of a genus specific transfection vector as a tool for further
transfection assays.

List of Communications, Publications and Submitted sequences
Listo of Communications, Publications and Submitted sequences
Oral Communications in Meetings
R. M. T. Ascenso, M. Leonor Cancela and Gerardo R. Vasta, Study of the infection mechanisms of the parasite Perkinsus atlanticus when interacting with its host, the clam Ruditapes decussatus: Identification and regulation of Perkinsus atlanticus genes differentially expressed in response to host and environmental Stress, Universidade do Algarve, PhD students annual seminar, 21 February, 2005
R. M. T. Ascenso, M. Leonor Cancela and Gerardo R. Vasta, Study of the mechanism of the parasite Perkinsus atlanticus when interacting with its host, the clam Ruditapes decussatus – Molecular characterization of Perkinsus atlanticus response to its host Ruditapes decussatus - Seminários Mar e Ambiente, Universidade do Algarve, Faculdade de Ciências do Mar e Ambiente, 18-21 May, 2006
R. M. T. Ascenso, R. B. Leite, R. Afonso, M. L. Cancela, Does P. olseni parasite respond differently to diverse bivalve challenge?, WOPER Workshop for the Analysis of the Impact of Perkinsosis to the European Shellfish Industry, Vigo, 12-14 Sepetember 2007
Poster Presentation
R. M. T. Ascenso, R. B. Leite and M. L. Cancela, Perkinsus atlanticus Host-Response Expressed Genes – A FUNCTIONAL APROACH –Vila Moura, ALgarve, Biochemistry Congress, 2-4 December, 2004
R. M. T. Ascenso and M. L. Cancela, Characterisation and regulation of Perkinsus atlanticus genes differentially expressed in response to host and environmental stress. University of Algarve, PhD students’ annual seminar, 18 June 2004
L. M. Elandalloussi, R. B. Leite, R. M. Ascenso, R. M. Afonso, and M. L. Cancela, Identification of differentially expressed genes in Perkinsus atlanticus exposed to pyrimethamine. Center for Marine Sciences-CCMAR, University of Algarve, Campus de Gambelas, 8005-139-Faro, Nice, France, 2004
R. M. T. Ascenso, R. Leite and M. L. Cancela, Cloning of the marine parasite suicide gene cytosine deaminase: a promising tool for negative selection. Second International Congress on Stress responses in Biology and Medicine, Tomar, 24-28September, 2005
R. M. T Ascenso and M. L. Cancela, Perkinsus olseni cytosine deaminase: expression vector construction for negative selection application, IX Congresso Ibérico de Parasitologia, Universidade de Coimbra, 25-28 October, 2005
R. B. Leite, L. Elandalloussi, R. Afonso, P. Rodrigues, R. Ascenso, M. L. Cancela “An Overview Of The Metabolic Pathways In The Protozoan Parasite Perkinsus Atlanticus/olseni: Identification Of Potential Targets For Therapeutic Drugs.” IX Congresso Ibérico of Parasitologia, Coimbra, 25-28 October
R. M.T. Ascenso, R. M. Afonso, R. B. Leite and M. L. Cancela, Identification of differentially expressed target genes involved in Perkinsus-host interaction: comparison of two alternative SSH methods, Genomic Perspectives to Host Pathogen Interactions, CSHL meeting, Hinxton, UK, 7-10 September, 2006
R. M. T. Ascenso, R. B. Leite, R. M. Afonso and M. L. Cancela, Does Perkinsus olseni express pathogenic factors?, XV National Congress of Biochemistry, Aveiro, 8-10 December 2006

List of Communications, Publications
ix
R. B. Leite, L. Fonseca, R. Afonso, M. Simão, R. M. T. Ascenso and M. L. Cancela, Clam Lectins: Species-specific patterns of expression upon Perkinsus exposure and Evolutionary considerations, MGE – final General Assembly, Faro, 13-16 May 2008
Articles in international refereed journals
R. M. T. Ascenso, R. B. Leite, R. M. Afonso and M. L. Cancela, 2007, Suppression-subtractive hybridization: A rapid and inexpensive detection methodology for up-regulated Perkinsus olseni genes, AJBR, 1, 24-28.
R. M. T. Ascenso and M. L. Cancela, 2007, Dissecting approaches for gene discovery – Using a mollusc parasite as example, Experimental Pathology and Health sciences, Research, Clinics, Teaching and Society, 1 (1) pp 44- 45.
Accepted for Publication in the Journal of Fish Disease: R. M. T. Ascenso, R. B. Leite, R. Afonso, M. L. Cancela, Expression pattern of Perkinsus olseni genes in response to bivalves with different susceptibility to Perkinsosis
In revision for Publication in the Experimental Parasitology: R. M. T. Ascenso, R. B. Leite, R. Afonso, M. L. Cancela, Molecular characterization of two novel Perkinsus olseni genes encoding putative Sodium Hydrogen Exchanger and Adhesion-related proteins.
Conferences Papers
R. M. Ascenso e M. L. Cancela, 2005, Perkinsus olseni cytosine deaminase: expression vector construction for negative selection application, Acta Parasitológica Portuguesa, 12 (1-2) p384.
R. M. T. Ascenso and M. L. Cancela, 2007, Dissecting approaches for gene discovery – Using a mollusc parasite as example, Experimental Pathology and Health Sciences, Research, Clinics, Teaching and Society, 1 (1) pp 44- 45.
António dos Anjos, Hamid Shahbazkia, Rita M. T. Ascenso, 2008, Automatic Macroarray Analysis - Tool and Methods, 21st International Conference on Computer Applications in Industry and Engineering, International Society for Computers and Their Applications (ISCA), March 23-25, 2006, Washington, USA
Publication in Book
Abstract “Does Perkinsus olseni parasite respond differently to diverse bivalve challenge? R.M.T. Ascenso, R.B. Leite, R. Afonso, M.L. Cancela at Villalba, A. (2008). Workshop for the analysis of the impact of Perkinsosis to the European Shellfish Industry. Vigo, Centro de Investigacións Mariñas, Conselleria de Pescas e Asuntos Marítimos da Xunta de Galicia; Centro Tecnológico del Mar - Fundación CETMAR.
Submissions to Nucleotide Sequence Databases
The P. olseni ESTs isolated from host hemolymph treated parasite, P. olseni forward cDNA subtractive library were submitted at DNA Data Bank of Japan (DDBJ) using Mass Submission System (MSS) with consecutive accession numbers from BB999049 to BB999146. The PoNHE and PoAdh were molecularly characterized in this thesis and were submitted to DDBJ/EMBL/GenBank nucleotide sequence databases and the nucleotide sequence data reported in this thesis will appear in the DDBJ/EMBL/GenBank nucleotide sequence databases with the accession numbers AB439284 and AB439285, respectively. PoUbq was publicized with the accession number DQ291152.

x

Acknowledgments
xi
Acknowledgments
Each and every person owes itself from the background, family… that gave me
life. To FAMILY I owe so many uncountable trust, faith, encouragement… not even all
good word in this or any other world could describe how much you, Mum and Dad,
Grandmother Maria and Grandfather José, Grandmother Agostinha, Brother, Paula and
Gui contributed for me, myself and I. My lovely beautiful nice Margarida (Gui) was
born… she is the purpose of frequent visits home, Alcogulhe de Cima, Maceira, where I
receive encouragement all the time. I also show appreciation to my friends and
colleagues from, Maceira, Leiria and Coimbra...
A person has so many aspects, from child to adult… I remember too little from
childhood, but… the story does starts there.
The privilege of living in a small village, Alcogulhe de Cima and the close
contact with familiar agriculture made me more sensitive to life… but the last straw that
led me to Biology was the staying in Angola, a country with a huge diversity, poorly
divulgated or known. At 8 years old, 15 days in family far away, in a place that looked
virgin, allowed me to observe crabs, green crabs, only cooked turn out to be red!!!, fish
and huge trees. I could have seen marine turtle if it were nowadays… at that time, there
was an enthusiasm of observation that came up to me…
The studying trail was just starting in elementary school with a single teacher,
Maria Arlete. Eugénia Cunha showed me the Natural Sciences when I was ten and I
loved the classes and the subject above all. Ana Margarida, later introduce the human
biology field and it was then that I decided to be a Natural Sciences and Biology
teacher. By the way you never answered my question, but I found the way (thanks any
way) and many other teachers, even Maths, Jorge Francisco and the actual school
director, Jorge Bajouco contributed to my growth in knowledge. Next step seemed

Acknowledgments
xii
bigger than my legs, even though I followed the Sciences closely. Earth and Life
Sciences was the favourite discipline among all the others, from the just arrived new
learning/ teaching system. Thanks Cândida. Biology Laboratory classes were an
obligatory choice for me with Idalina Gameiro teaching. I must acknowledge also
English teacher, Júlia Guarda Ribeiro, the continuation of English practice and learning
with such a rigorous teaching. The high School studies were very intense and social life
started to show the relevance I never felt before. Bárbara tried hard to show me, but now
I recognise how helpful it would have been… later I got there with other Friends help,
thanks to Sofia Pinto, Vanessa Santos, Inês Henriques and João Carvalheiro. These
were the solid rocks supporting me to live away from family during graduation and they
still do. From graduation in Biology I acknowledge all Professors and Researchers and
Assistants in University of Coimbra who contributed with lectures, practical classes and
seminars and Colleagues of those days and nights of study and… you all now what I
mean. The possibility of studying in Coimbra gave me an open mind and called my
attention to investigation. There was an increasing interest but the teaching took more
relevance at that time. Thank you all at Escola Secundária Quinta das Flores, mainly to
Isabel, the supervisor, Catarina, Vanessa and “my” students for the construction of
myself as a Teacher. I still needed some development… we always fell this… don’t you
agree? I touch one more year at Colégio Senhor dos Milagres being thankful to all those
that were there to teach and learn. Despite my move into research, I will keep feeling
that each student is still mine and each of us can learn from each other.
But I had not only this interest… research became a stronger will and the first
goal was helping in a novel project in Iberian Peninsula, a bivalves’ hatchery. Since the
project did not continue, I did: pure research in a PhD project. In this step I must
acknowledge the support and enthusiastic push from you, Doctor Professor Leonor

Acknowledgments
xiii
Cancela. Like you always say, from Teaching to Research it takes a hard work… and
we must be completely involved. I must THANK you. I acknowledge specially and
greatly the group team (Perkinsus Group) that received me, heading with Ricardo Leite,
Ricardo Afonso, Pedro Rodrigues, Patrícia Nunes. The order of the names is not chaos.
Then followed other members that came… and went… and stayed: Joana Patrícia,
Anabela, Márcio… and all Perkinsus fellows. Aside I thank you all from Molecular
Biology Laboratory (the 2.13 people) citing this way twice the Perkinsus group in
recognition for the friendship and shared knowledge; Carla, Marta Valente, Sandra,
Catarina, Vera, Asunción, Natércia, Gavaia, Vincent, Vanesa, Nuno, António, Sara,
Sofia, Brigite, Cátia, Marta, Nelson, Vânia, Daniel Tiago, Daniel, Bruno, Rui, Susana,
Rita, Cindy, Michael, Joana, Paulo, Rui, João, Luis e Celine, THANKS. I must thank
also the colleagues from second floor corridors, from all FCMA, namely the 2.28 and
2.51 laboratories people and other places of University of Algarve.
In scientific contexts I ACKNOWLEDGE for the third times to Doctor Professor
Leonor Cancela the main foundation of knowledge and best example of research, but
also to Doctor Professor Gerardo Vasta and PhD José António F. Robledo. Also thank
to Doctor Professor Dina Simes, Doctor Professor Paulo Martel, Doctor Professor Ester
Serrão, Doctor Vincent Laizé and Nuno Henriques for some practical and theoretical
knowledge. I express gratitude to JAF Robledo and Keiko for the welcome I had in
USA and my living place landlords, Lisa, Toshie and you also JAF. I am very thankful
to all colleagues of COMB, namely from the laboratory Erick Odom, Theresa, Wolf,
Erick , Hafiz, Ahmed, Satoshi and Nona, and also, for the second time, I thank Doctor
Professor Gerardo Vasta, José António and Keiko. I show my appreciation to Nagla,
Naomi and Frederico for their friendship. Far from home I felt intensely all new feelings
and experiences… I thank you all the sharing of happiness, sadness and “saudade”

Acknowledgments
xiv
moments, including princess, Toshie’s cat that waited for me to open my eyes every
morning at 5am. JAF, you know how much you contributed for the good times I spend
away from my family and my surroundings… even speaking a bit of Portuguese some
times… and eating once cod, salted cod.
In Algarve, away from my hometown I started enjoying driving my car, through
Ribatejo, Alentejo and Algarve. I show appreciation to those that were by my side at
living places in Gambelas, Paulo Silva, Luis Gonzaga, José António, Eduardo Carrano,
Adriano Benvenho, Susana Pereira, Nelson Coelho, Ana Gomes e Paula Silva,
Margarida, Pedro e José António Bentes. I am thankful for the possibility of continuing
some proximity with students in collaborative projects between the Center of Marine
Sciences and the Centro de Ciência Viva do Algarve, like “Os cientistas vão às
Escolas”. A special thank to Vasco for friendship and living lessons and ride home and
also Amadeu for all the support. Aside, so many other friends I met that I am thankful,
Marta Valente Bernardo, Sofia Cavaco and their families … and so many others for
support. Other colleagues that shared walking, riding bicycle and horse, watching
movies, dancing, kayaking, kite surfing, geo-caching, eating lunch and dinner and
conversing with me, I am grateful and sorry for the short time I spent doing all this
things with you. Thank you all around me.
In this fraction of this thesis, I tried to show my gratitude to all that have
contributed and still contribute to the development of what I am as an individual, a
professional and a researcher. There would be so many others to thank and so many
other circumstances to be reminded but there would be no words capable of it and I am
not able to do it also in writing, but I can feel it!

Acknowledgments
xv
The work plan depicted below is inserted into the mixed fellowship
(SFRH/BD/11130/2002) funded by for Science and Technology Foundation (FCT) and
was done as a collaboration between the two laboratories involved, through training and
exchange of research expertise and results, supervised by Doctor Professor M. Leonor
Cancela and Co-supervised by Doctor Professor Gerardo Vasta, to whom I am grateful.
I also had the possibility of visiting the Plant Genetic Engineering laboratory, so I am
thankful for the availability of facilities at ITQB and the knowledge of Doctor
Margarida Oliveira and Sónia Negrão.
This work was supported in part by grants from FCT PERKLAM
(PDCTM/M/Pmar/15308/1999), P-TARGET (POCI/CVT/57982/2004) and IsoPerk
(PTDC/CVT/72083/2006) including funding from POCI 2010 and UE funds from
FEDER and from DG-Pescas, Ambiperk (MARE/0092/2005/AT), and was performed
as a collaborative study between the Center of Marine Sciences (CCMAR) - University
of Algarve, Portugal and the Center of Marine Biotechnology (C.O.M.B.) - University
of Maryland, Baltimore, U.S.A.. Some work has taken advantage of preliminary data
analysis obtained from The Institute for Genomic Research through the website at
http://www.tigr.org, and from The Perkinsus marinus Genome Sequencing Project
accomplished with the support of the National Science Foundation (NSF).
I am so truly thankful to you, you all that liked me and took care of me, thanks.


Table of Contents
xvii
Table of Contents Abstract..............................................................................................................................v Key-words .........................................................................................................................v Resumo............................................................................................................................ vi Palavras-chave................................................................................................................. vi List of Communications, Publications and Submitted sequences ................................. viii
Oral Communications in Meetings............................................................................ viii Poster Presentation ................................................................................................ viii
Articles in international refereed journals ................................................................... ix Conferences Papers ..................................................................................................... ix Publication in Book ..................................................................................................... ix Submissions to Nucleotide Sequence Databases......................................................... ix
Acknowledgments ........................................................................................................... xi Table of Contents ......................................................................................................... xvii List of Figures..................................................................................................................xx List of Tables............................................................................................................... xxvi List of abbreviations .................................................................................................... xxvi CHAPTER I – GENERAL INTRODUCTION.................................................................1
I-1 Perkinsus, a worldwide distributed genus ...............................................................2 I-1.1 Perkinsus species and parasite hosts.................................................................2 I.1.2 Geographical distribution and environmental conditions of Perkinsosis..........6
I.2 Taxonomic classification of Perkinsus genus ........................................................10 I.3 Parasite characterization, life-cycle and phylogeny...............................................11 I.4 Host-parasite interactions.......................................................................................16 I.5 P. olseni affects carpet-shell clam in Ria Formosa ................................................21
CHAPTER II – GENERAL MATERIALS AND METHODS.......................................25 II-1 Eukaryotic and bacterial cell cultures...................................................................26 II-2 Extraction and purification of nucleic acids .........................................................27
II-2.1 Total RNA extraction ....................................................................................27 II-2.2 Poly+A RNA purification ..............................................................................27 II-2.3 Genomic DNA isolation ................................................................................28
II-3 Molecular cloning and characterization of selected cDNAs and genes ...............28 II-3.1 RACE-full length cDNA amplification.........................................................28 II-3.2 P. marinus Gene Racer library construction .................................................29 II-3.3 Gene cloning using the Universal Genome Walker library...........................29
Library construction ............................................................................................29 Upstream and downstream gene amplification ...................................................30
II-3.4 cDNA template for amplification..................................................................30 II-3.5 Genomic DNA as PCR template ...................................................................31 II-3.6 Ligation of DNA fragments...........................................................................31
II-4 Cloning before sequencing ...................................................................................31 II-5 cDNA sequencing.................................................................................................32 II-6 In silico sequence analysis....................................................................................32
II-6.1 Sequence characterization .............................................................................32 II-6.2 ORF prediction and cDNA structure.............................................................33 II-6.3 Definition of gene structure...........................................................................33 II-6.4 Promoter analysis ..........................................................................................34 II-6.5 Predicted polypeptide characterization..........................................................34
II-7 Gene expression analysis by northern blot, macroarray and Real-time qPCR.....34 II-7.1 Northern blot analysis....................................................................................35

Table of Contents
xviii
II-7.2 Real-time qPCR expression quantification ...................................................35 CHAPTER III – PARASITE HOST-RESPONSE..........................................................37
III-1 Introduction .........................................................................................................38 III-2 Specific materials and methods...........................................................................40
III-2.1 Differentially up-regulated genes (SSH)......................................................40 III-2.1.1 Parasite challenge..................................................................................41 III-2.1.2 P. olseni host response subtractive cDNA library construction............41
cDNA synthesis and RsaI digestion ................................................................42 Adaptor ligation and hybridization..................................................................43 PCR amplification of subtracted products.......................................................43
III-2.1.3 Construction of the Direct forward cDNA subtractive library (Dfsl) ...44 III-2.1.4 Construction of the enriched forward MOS library (efMOSl)..............44 III-2.1.5 Identification of differentially up-regulated genes................................45
III-2.2 In silico data analysis for gene characterization ..........................................46 III-3 Results and Discussion........................................................................................47
II-3.1 How to characterize the protozoan mollusc parasite transcriptome? ............47 III-3.2 Which SSH approach more profitable?........................................................48 III-3.4 Which parasite genes are up-regulated in response to host?........................52 III-3.5 Was diversity observed also evident through BLASTx protein hits? ..........55
III-4 Conclusions .........................................................................................................57 CHAPTER IV – MOLECULAR CHARACTERIZATION OF A CHLOROHYDROLASE-LIKE GENE ..........................................................................59
IV-1 Introduction.........................................................................................................60 IV-2 Specific materials and methods ..........................................................................63
IV-2.1 P. olseni Clhl cDNA and gene molecular characterization .........................63 IV-2.2 P. marinus Clhl cDNA and gene molecular characterization......................64 IV-2.3 Perkinsus spp. sensitivity to specific Clhl substrates and inhibitors ...........64
IV-2.3.1 P. olseni growth curve under Clhl substrates treatments ......................65 IV-2.4 Characterization of PoClhl gene expression pattern....................................66
IV-2.4.1 PoClhl expression in response to host hemolymph challenge ..............66 IV-2.4.2 PoClhl expression in media depleted of pyrimidine percursors ...........67 IV-2.4.3 PoClhl expression in response to various environmental conditions....68 IV-2.4.4 PoClhl expression following exposure to substrates and inhibitors .....68
IV-2.5 PoClhl in vitro transcription/ translation......................................................68 IV-2.6 PoClhl in vitro expression using a prokaryote system.................................69
IV-2.6.1 PoClhl protein activity in expressing colonies......................................71 IV-2.6.2 Chlorohydrolase substrate degradation in cell extract ..........................71 IV-2.6.3 PoClhl His- tag protein isolation following in vitro translation ...........72
IV-2.7 PoClhl in vitro expression using a eukaryote system ..................................73 IV-2.7.1 Construction of the expression vector PoClhlpcDNA3........................73 IV-2.7.2 Construction of vector directing expression of PoClhl protein fused to GFP (PoClhlpEGFP) ...........................................................................................74 IV-2.7.3 PoClhl expression using X. laevis A6 cell line .....................................75 IV-2.7.4 PoClhl in vitro protein expression and western blot confirmation .......76
IV-3 Results and Discussion .......................................................................................76 IV-3.1 Identification of the most represented EST in the SSH library ...................76 IV-3.2 Molecular characterization of Perkinsus spp. Chlorohydrolase-like ...........78 IV-3.3 Do 5-FC prodrug and 5-FU drug affect parasite growth?............................86 IV-3.4 How sensitive is P. olseni to other chlorohydrolases substrates/inhibitors?88 IV-3.5 Does exposure to R. philippinarum affects PoClhl gene expression? .........90

Table of Contents
xix
IV-3.6 Is PoClhl a CD enzyme involved in the pyrimidine salvage pathway?.......92 IV-3.7 Is PoClhl endogenous expression affected by specific substrates? .............96 IV-3.8 Was PoClhl in vitro expressed a functional protein?...................................97 IV-3.9 Is the PoClhl protein expressed and functional in the prokaryotic system? 98 IV-3.10 How was the PClhl expression and activity in the eukaryotic exogenous system? ..................................................................................................................101
IV-4 Conclusions.......................................................................................................105 CHAPTER V – PARASITE RESPONSE TO SURROUNDINGS ..............................107
V-1 Introduction ........................................................................................................108 V-2 Specific materials and methods..........................................................................110
V-2.1 Construction of cDNA macroarray .............................................................110 V-2.2 Differential gene expression in response to bivalve’s hemolymph.............111 V-2.3 Molecular characterization of genes of interest ..........................................112 V-2.4 P. olseni clonal culture and parasite cell treatments ...................................113 V-2.5 Gene expression analysis by Real Time qPCR ...........................................114 V-3.1 Does P. olseni respond differently to permissive & non-permissive bivalves?...............................................................................................................................116 V-3.2 Which genes were highly up-regulated in response to R. decussatus? .......119 V-3.3 What is the molecular architecture of the PoAdh and PoNHE genes? .......122
V-3.3.1 Characterization of PoAdh, a putative adhesion-related protein..........122 V-3.3.2 Characterization of PoNHE, a transporter-like protein........................124 V-3.3.3 In silico analysis suggests an intracellular localization for PoNHE.....129
V-3.4 How is gene expression pattern of parasite exposed to bivalves’ hemolymph? ..........................................................................................................132 V-3.5 How is parasite gene expression altered when exposed to stress conditions?...............................................................................................................................133
V-4 Conclusions ........................................................................................................136 CHAPTER VI – DEVELOPMENT AND OPTIMIZATION OF TRANSFECTION METHODOLOGY FOR PERKINSUS OLSENI...........................................................137
VI-1 Introduction.......................................................................................................138 VI-1.1 Transfection methodologies.......................................................................139 VI-1.2 Development of transfection methods for parasites...................................142 VI-1.3 Importance of the vector features for transfection.....................................144 VI-1.4 Aims of the work .......................................................................................145
VI-2 Materials and Methods......................................................................................145 VI-2.1 Transfection by chemical methodologies ..................................................145
VI-2.1.1 Calcium phosphate..............................................................................145 VI-2.1.2 Cationic polymer – PEI and TransPEI................................................146
VI-2.2 Physical methodologies for transfection....................................................147 VI-2.2.1 Electroporation....................................................................................147
Pre-treatment to improve transfection ...........................................................148 VI-2.2.2 Microparticle bombardment................................................................150 VI-2.2.3 MicroPoration .....................................................................................152
VI-3 Results and Discussion .....................................................................................153 VI-3.1 Which approach for P. olseni cells transfection?......................................153 VI-3.2 Selection of a reporter gene; how to confirm effective transfection? ........155 VI-3.3 Are chemical methodologies efficient for P. olseni cells transfection?.....158 VI-3.4 Is electroporation efficient to transfect P. olseni cells? .............................160 VI-3.5 How to increase the probability of transfection of P. olseni cells? ...........164 VI-3.6 Is Biolistic technique applicable to transfect P. olseni ? ...........................166

Table of Contents
xx
VI-3.7 Is Microporation technique applicable to transfect P. olseni ? ..................168 VI-3.8 Could a Perkinsus directed construct produce effective P. olseni transfection? ..........................................................................................................170
VI-4 Conclusions.......................................................................................................170 CHAPTER VIII- REFERENCES..................................................................................181 APPENDIX ...................................................................................................................247
List of Figures
Figure I- 1 World distribution of the seven species of the genus Perkinsus with respective date and host as shown in the first description of the species, P. olseni marked in dark red and the other species in blue (figure constructed based on web world map, http://www.bristolstories.org/site_images/big_world _map.jpg). ............................6
Figure I- 2 P. olseni life cycle stages. Optical microscopy: (A) Trophozoites and Schizonts life stages in in vitro cell culture (kindly provided by Professor Carlos Azevedo); (B) In vitro zoosporolation with Zoospores (*) and Pezoosporangia (+). Electron microscopy: Ultrastructure of Trophozoite, signet-ring (C) and Schizont (D), adapted from the electromicrographies kindly provided by Professor Carlos Azevedo. 12
Figure I- 3 Phylogenetic analysis of Perkinsus based on dxs gene from MEP pathway. Unrooted ML tree constructed using Phyml with WAG substitution matrix, based on a matrix comprising 55 OTUs and 497 sites. P. marinus dxs ortholog marked with arrow forming a highly supported clade with the Dinoflagellate. The scale bar indicates the number of substitutions per site (adapted from (Matsuzaki et al., 2008)........................15
Figure I- 4 R. decussatus clam and P. olseni parasite: (A) carpet-shell clam gills macroscopic observation with white nodules of P. olseni pustules and (B) P. olseni cell culture cells observed in electron microscope (kindly provided by Professor Carlos Azevedo)..........................................................................................................................17
Figure I- 5 Ria Formosa Natural Park localization in South Portugal (adapted from www.olhao.web.pt/ ParqueNatural.htm). ........................................................................22
Figure III- 1 Schematic representation of P. olseni cells (Po) exposure to bivalve hemolymph (He) in vitro performed in 24-wells plates (A, B). Concentrated P. olseni culture was placed in each well (A2, B2) and the hemolymph applied on the 0.4 µm filter (A3).........................................................................................................................41
Figure III- 2 cDNA subtractive library construction: tester and driver cDNA before and after digestion with RsaI restriction enzyme (A) and PCR amplification of forward subtracted library, first and second PCR amplification results (B). MOS of the cDNA subtractive library: forward and reverse library PCR products fractionation after enrichment using MOS (C). ............................................................................................48
Figure III- 3 Comparison of the two methodologies followed for construction of the subtracted libraries, represented in eight stages (adapted from Diatchenko (Diatchenko et al., 1996) and Rebrikov (Rebrikov et al., 2000). Dfsl, Direct forward subtractive library and efMOSl, enriched forward Mirror Orientation Selection library. .................49
Figure III- 4 Subtractive library cDNA fragments analysed. Distribution of the cloned cDNA fragments from each subtractive library, according to the sequence length for

Table of Contents
xxi
Direct forward subtractive library (Dfsl) and enriched forward MOS subtractive library efMOSl). ..........................................................................................................................51
Figure III- 5 GO results for Dfsl. The classes and subclasses are represented according to GO molecular function category of GOblet tool and the area is proportional to EST sequence number. Dfsl, Direct forward subtractive library. ...........................................54
Figure III- 6 GO results for efMOSl. The classes and subclasses are represented according to the molecular function category of GOblet tool and the area is proportional to EST sequence number. efMOSl, enriched forward Mirror Orientation Selection library. .............................................................................................................................54
Figure III- 7 Percentage of clones from efMOSl (A) and from Dfsl (B) approaches distributed by kingdoms of the represented organisms, Plantae, Animalia, Fungi, Bacteria and Protist..........................................................................................................56
Figure IV- 1 PoClhlpET3His-2 plasmid construct for exogenous PoClhl expression in a prokaryotic system...........................................................................................................70
Figure IV- 2 PoClhpcDNA3 plasmid construct for exogenous PoClhl expression in eukaryotic systems...........................................................................................................74
Figure IV- 3 PoClhpcDNA3 plasmid construct for exogenous PoClhl expression in eukaryotic systems...........................................................................................................75
Figure IV- 4 Nucleotide sequences of the cDNA molecule encoding P. olseni chlorohydrolase-like (PoClhl). Numbering on the right side is according to the 5’end of the longest cDNA obtained (identified as number 1). The stop codon is marked with asterisks, the intronic insertion positions are indicated with a vertical line. ...................79
Figure IV- 5 Nucleotide sequences of the cDNA molecule encoding P. marinus chlorohydrolase-like (PmClhl). Numbering on the right side is according to the 5’end of the longest cDNA obtained (identified as number 1). The stop codon is marked with asterisks, the intronic insertion positions are indicated with a vertical line. ...................80
Figure IV- 6 PoClhl and PmClhl gene organization. Comparison of PmClhl and PoClhl gene structures. The exons are numbered for both species. The first nucleotide identified as number 1 for each gene corresponds to the first nucleotide of the corresponding full length cDNA....................................................................................................................81
Figure IV- 7 Scheme of the predicted PoClhl polypeptide as deduced from in silico analysis using SignalP and Motif Scan (www.expasy.ch). .............................................82
Figure IV- 8 P. olseni and P. marinus Clhl alignment with amidohydrolase proteins performed with clustalW. The schematic presentation was constructed using WebLOGO. The highlighted residues are those which are relevant for the active site and those evolutionary conserved according to height in yy axes’. Numbering of the amino acid residues is referent to PoClhl. Amidohydrolase protein sequences were obtained from NCBI data base and accession numbers are those indicated in Table IV-4. ..........83
Figure IV- 9 P. olseni growth curve following exposure to various concentrations of the cytotoxic percursor 5-FC, during 12 days and monitored by absorbance at 600nm (A).Cell viability was checked in the 2nd and 12th day of treatment (B). Cell growth and viability under control conditions, in the absence of treatment and when treated with the vehicle solvent only. ........................................................................................................86

Table of Contents
xxii
Figure IV- 10 P. olseni growth curve under exposure to various cytotoxic concentrations of the drug 5-FU during 12 days and monitored by Absorbance at 600nm (A).Cells viability was checked in the 2nd and 12th day (B). Cell growth and viability under control conditions, in the absence of treatment and when treated with the control solvent only. ....................................................................................................................87
Figure IV- 11 P. olseni cells sensitivity to chlorohydrolases specific inhibitors (A) and specific substrates (B). The results came from 2 independent experiments with triplicates. ........................................................................................................................89
Figure IV- 12 PoClhl expression by RT-PCR. Total RNA was extracted after different times of P. olseni cell exposure to host serum (hemolymph cell-free): (A) exposed from 5 min to 2 days and (B) from 2 hours to 11 days. RT- PCR PoClhl gene expression was normalized to Po ubiquitin expression, used as housekeeping gene. ..............................91
Figure IV- 13 PoClhl expression by RT-PCR. Total RNA was extracted from P. olseni cell culture submitted to various concentrations of the prodrug, 5-FC and to the drug, 5-FU. Changes in expression of PoClhl gene were checked and compared to those of Po ubiquitin, chosen as housekeeping gene..........................................................................92
Figure IV- 14 PoClhl expression by northern analysis. Total RNA was extracted from P. olseni cells submitted to various treatments (Table IV-1). Five micrograms were electrophoresed, transferred to a nylon membrane, and hybridized with a 32P-labeled PoClhl cDNA and Po ubiquitin as housekeeping gene. Radioactivity signal density levels were determined to assess for relative gene expression after autoradiography, using QuantityOne (BioRad). ..........................................................................................93
Figure IV- 15 Influence of the glutamine and Hams nutrient mixture in the pyrimidine metabolic pathway. Grey thick arrows represent the CD up-regulation in presence of glutamine and of nutrient mixture components, which can supplement the basal levels of nitrogen through other metabolic pathways. Circled and curve legend refers to the pyrimidine salvage pathway and de novo pathway is delimited by discontinuous lined box. ..................................................................................................................................95
Figure IV- 16 PoClhl gene expression in response to Clhs specific substrates and inhibitors. The gene expression was analysed by Real Time pPCR, when the parasite cells were submitted to EC50 concentration of each chemical. PoClhl gene expression was determined and compared to expression of PoUbq, used as housekeeping gene (substrates: cyt states for cytosine, 5FC for 5- fluorocytosine, 5FU for 5-fluorouracil, CEIT for Atrazine, Mel for Melamine and inhibitors: 2HP states for 2- hydroxypyrimidine and Aza for Azacytosine). ...............................................................97
Figure IV- 17 TNT protein in vitro expression using the TNT quick coupled transcription and translation system (Promega) and SDS- PAGE in reductant conditions followed by CBB staining. M signs for SeeBlue protein Marker (Invitrogen). ..............98
Figure IV- 18 Protein activity observation in the BL21 transformants with PoClhlpET3His-2. Quantification of protein content using BCA protein assay (Pierce) along time (A) and preliminary results of measurement of substrates specific absorbance at 39 hours to check PoClhl activity (B). ........................................................................99
Figure IV- 19 PoClhl protein expression in prokaryotic system. PoClhlpET3His-2_41 expressed by BL21-pLys induced ON at RT by IPTG and electrophoresed in 4-12% polyacrilamide gel compared to BL21 induced (A) and PoClhlpET3His-2_41 and 45

Table of Contents
xxiii
SDS-PAGE and western blot with anti-his, SaBGP-his alfa primary antibody and anti- alkaline fosfatase secondary antibody (B).....................................................................100
Figure IV- 20 X. laevis kidney epithelial derivate cells sensitivity to prodrug, 5- FC and drug, 5- FU. ...................................................................................................................102
Figure IV- 21 Analysis of the A6 X. laevis derived cells transfected with PoClhlpcDNA3. Confirmation of the presence of the construct/ PoClhl expression (A) and analysis of the transfected cells sensitivity to PoClhl potential substrates and inhibitors (B). ................................................................................................................103
Figure IV- 22 Expression analysis of protein α by Western blot. A6 cells transfected with 0.5 µg of plasmid pEGFP-N1 (i) and PoClhlfusGFP, green bar indicates EGFP and black bar indicates protein PoClhl (ii) EGFP- fusion protein (A) was harvested at 48 h posttransfection and assayed using anti-GFP by Western blot analysis (B). Localization of EGFP-α fusion protein in transfected A6 cells. Cells were transfected with PoClhlfusGFP plasmid with Fugene6 (Roche). A6 cell expressing EGFP- fusion protein at 36 h posttransfection: image of nucleus stained with DAPI, image of mitochondria stained with Mitotraker and merged images. The merged image represents a superimposition of green, blue and red signals where areas of fluorescence co-localization are yellow-orange. The images were viewed with a Leica 550 IW fluorescence microscope and photographed in 200× amplification. .............................104
Figure V- 1 Scheme of the membrane containing the cDNA macroarray. Representation of all 98 cDNA clones included in the macroarray, organized according to molecular function according to the GO categories. The array also included both vectors used for EST cloning, reference genes (*) and three dilutions of one selected clone, as internal standard..........................................................................................................................110
Figure V- 2 Number of parasite genes up-regulated one undread fold or more (log≥2). The genes corresponding to parasite response to each bivalve’s hemolymph were counted. R.d. states for R. decussatus, R.p. for R. philippinarum and D.t. for D. trunculus. .......................................................................................................................118
Figure V- 3 P. olseni genes relative expression in log10 scale based on the macroarray hybridization. Parasite gene expression, in response to challenge with hemolymph from each bivalve, was quantified based on two hybridization of the cDNA macroarray and selected autoradiography exposures. The macroarray genes were classified by Gene Ontology (GO) and grouped by function in relation with host- parasite interaction. R.d. states for Ruditapes decussatus, R.p. states for R. philippinarum and D.t. for Donax trunculus. The control condition was the parasite not treated.......................................121
Figure V- 4 PoAdh cDNA and correspondent amino acid sequence. Location of primers used for PCR amplification are indicated by arrows. Stop codon is marked with an asterisk. ..........................................................................................................................123
Figure V- 5 PoNHE cDNA sequence with intron insertion marked with vertical lines and numbered I to XIV; grey boxes mark TM protein domains numbered 1 to 12. Location of primers used are indicated by arrows. Stop codon is marked with an asterisk. ..........................................................................................................................126
Figure V- 6 Molecular characterization of PoNHE. Scheme of genomic and transcripts sequence and predicted polypeptides size. PoNHE gene structure (black lines

Table of Contents
xxiv
corresponds to intronic sequences and grey rectangles to exon sequences), the various transcripts (grey boxes) and the corresponding polypeptide size (dark grey bars) are represented. Arrowhead marks the start codon and asterisk the STOP codon..............127
Figure V- 7 Characterization of PoNHE polypeptide. Hydropathy (y-axis) profile was calculated using TMprep server (www.ch.embnet.org/software/TMPRED_form.html) for identification of TM segments (A); in the same scale, is shown the schematic of PoNHE domains with predicted signal peptide (black box) and transmembrane domains (TM, grey boxes) of the predicted polypeptide (B); comparison of conserved residues in the 6th TM domain from PoNHE aligned with CPA1 proteins, noticing the most conserved residue, Glu (E) marked with arrowhead (C). For TM6 sequences comparison used 46 CAP1 proteins (Supplementary table 1) aligned in ClustalX, analysed using GeneDoc and scheme produced using WebLOGO. ......................................................128
Figure V- 8 Relative classification of the PoNHE protein within the CPA1 protein family. The linearized tree shows the phylogenetic relashionships between 46 monovalent cation proton antiporter 1 (CPA1) proteins (Supplementary table 1). Multiple alignments were performed using clustalX. Phylogenetic tree was prepared using the alignment region of full PoNHE sequence, according to neighbour- joining method using MEGA4, with 1000 replicates of bootstrapping and 45% cut-off (Bootstrap analysis showed a confidence value below 45 at the nodes indicated by the asterisk)..........................................................................................................................130
Figure V- 9 Expression of PoNHE and PoAdh genes upon exposure to different bivalves’ hemolymphs. Relative levels of gene expression (in log scale) of PoNHE (Panel A) and PoAdh (Panel B) after 6 hours of exposure of P. olseni to bivalves’ hemolymph: permissive host (white bars), the carpet-shell clam Ruditapes decussatus not infected (Rd), the clam R. philippinarum (Rp); and non permissive bivalves (grey bars): the oyster Crassostrea gigas (Cg), the wedge- shell clam, Donax trunculus (Dt) and the blue mussel, Mytilus galloprovincialis (Mg). All expression levels and ANOVA two ways statistical analysis are relative to results obtained for P. olseni exposed to infected type host hemolymph, R. decussatus...............................................................132
Figure V- 10 Expression of PoNHE and PoAdh genes upon exposure to different temperatures and salinities. Relative levels of gene expression (in log scale) of PoNHE (Panel A) and PoAdh (Panel B) after 3 days of exposure of P. olseni to treatment conditions simulating Ria Formosa environmental conditions. Growing temperatures (white boxes) corresponded to 15ºC and 22ºC and the growing salinities (grey boxes) corresponded to 26‰ and 37‰. All expression levels and ANOVA two ways statistical analysis are relative to results obtained for P. olseni in standard cell culture condition (28ºC and 30‰).............................................................................................................134
Figure VI- 1 Schematic summary of factors to take into account to develop a transfection methodology for P. olseni throphozoites...................................................153
Figure VI- 2 P. olseni trophozoites sensitivity to geneticin (G418, Invitrogen). Cell proliferation assay was performed to assess P. olseni cellular viability using 100 µl P. olseni cells in triplicates at least. This was evaluated using the Cell Titer 96 Aqueous Non-Radioactive Cell proliferation assay (Promega) measuring absorbance at 490 nm........................................................................................................................................155

Table of Contents
xxv
Figure VI- 3 Testing pβGAL_Basic plasmid for transfection efficiency observation. The transfection method used was the electroporation of P. olseni cells and β-galactosidase assay performed at 6th day after transfection (a and b refers to two independent experiments). .................................................................................................................156
Figure VI- 4 P. olseni cells submitted to calcium phosphate transfection assay. The results compared two ratios between DNA and calcium phosphate; two experiments were performed in duplicated and observed at different magnification under white and blue light. .......................................................................................................................158
Figure VI- 5 P. olseni cells submitted to polycationic polymer transfection assay using two different commercial products, PEI (Sigma Aldrich) and TransPEI (Eurogentec). The results compared two ratios between DNA and transfection reagent. Two independent experiments duplicated were performed and observed at different magnification at 48 and 72hours under white and blue light. .......................................159
Figure VI- 6 Viability of P. olseni cells submitted to electroporation. Observation through optical microscopy of P. olseni trophozoites viability checking for changes in morphology in the various media used for electroporation...........................................161
Figure VI- 7 Electroporation of P. olseni cells with two different amounts of purified plasmid DNA, (50 ng and 500 ng). ...............................................................................162
Figure VI- 8 Electroporation of P. olseni cells at various conditions of electro-pulse and cuvette size. ...................................................................................................................162
Figure VI- 9 P. olseni fluorescent schizont submitted to electroporation transfection assay. The electroporation assay did arching and the fluorescence was observed at 6th day after transfection using 400x magnification under fluorescence microspcope. .....163
Figure VI- 10 P. olseni cells submitted to electroporation assay at various conditions of electro-pulse, in 2 mm cuvette. RT-PCR was performed for each assay 15 days after transfection using pcDNA3s Po gene, specific amplification primers and PoClhl as reference gene for PCR amplification. ..........................................................................164
Figure VI- 11 Observation of P. olseni cell viability under a range of pronase concentration treatment, at 28ºC. Trypan blue was the procedure used to quantify the cellular viability and the cell counting was performed in photos taken to the cells homogeneously distributed in the heamocytometer observed at 10x magnification. ...165
Figure VI- 12 P. olseni cells submitted to calcium phosphate and PEI transfection and to electroporation, after pre-treatments with either DTT or Pronase. for cells permeabilization. Results were observed at 48h after transfection using 200x magnification under the inverted fluorescence microspcope. .......................................166
Figure VI- 13 P. olseni cells submitted to microporation and observed at 48h after transfection using 200x magnification under inverted fluorescence microscopy. ........169
Figure VII- 1 Model proposed for P. olseni response to host hemolymph exposure. Compilation of the diverse parasite genes identified by SSH according to the function and possible location in the parasite trophozoite cells when exposed to host hemolymph........................................................................................................................................175

Table of Contents
xxvi
List of Tables Table I- 1 Perkinsus spp and hosts identified....................................................................4
Table III- 1 GO analysis of molecular function determined using the GOblet server. ...50 Table III- 2 BLASTx analysis of P. olseni ESTs determined using the NCBI website..56
Table IV- 1 Different cell culture media prepared using DME (Gibco, Invitrogen Co), Hams F12 (Gibco, Invitrogen Co) and DME with glutamine. ........................................67 Table IV- 2 PoClhl and PmClhl gene organization. Clhl genes exon-intron boundaries are compared. The first nucleotide identified as number 1 for each gene corresponds to the first nucleotide of the corresponding full length cDNA. ...........................................81 Table IV-3 Putative regulatory motifs in PoClhl and PmClhl promoters. Gene promoter analysis in silico revealed three putative motifs (A, B and C), common to P. olseni and P. marinus species. Sequences were aligned using Clustal W and edited using WebLOGO. .....................................................................................................................82 Table IV- 4 P. olseni and P. marinus Clhl alignment with amidohydrolase proteins performed with clustalW and identity determined at Vector NTI...................................85 Table IV- 5 Quantitative data on (GDEPT) systems. Comparison of various systems for GDEPT based on the data from Springer and Niculescu-Duvaz (2000).......................105
Table V- 1 Culture conditions used in vitro to simulate P. olseni environmental stress conditions. .....................................................................................................................113 Table V- 2 Macroarray selected gene clones related to parasite host-response classified according to GO molecular function category (Appendix V-1), using GOblet server (http://goblet.molgen.mpg.de). ......................................................................................117 Table V- 3 PoNHE gene organization. PoNHE gene exon-intron boundaries, sizes of introns and exons and type of intron according to Pathy (Pathy, 1994). The nucleotide identified as +1 of the gene corresponds to the first nucleotide of the full length cDNA........................................................................................................................................126
Table VI- 1 PEI and TransPEI transfection reagent/ DNA ratio used for transfection........................................................................................................................................147 Table VI- 2 P. olseni transfection plan using calcium phosphate, PEI transfection and electroporation methods after P. olseni cells permeabilization with DTT and pronase pre-treatment..................................................................................................................149 Table VI- 3 Transfection of P. olseni by microparticle bombardment, distribution of assayed plates per experiment .......................................................................................151 Table VI- 4 Comparison of cell characteristics to allow selection of transfection methodology to apply for P. olseni cells (adapted from Dumont et al., 2004). ............154 Table VI- 5 Factors influencing transformation efficiency by microparticle bombardment of P. olseni (based on Rasco Gaunt, 2001). ...........................................166 Table VI- 6 Procedure for microparticle bombardment of P. olseni cells. ..................167
List of abbreviations aa Amino acids ATCC American Type Culture Collection BLAST Basic local alignment search tool

Table of Contents
xxvii
BLASTN Nucleotide-nucleotide BLAST BLASTP Protein-protein BLAST BLASTX Translated query vs. protein database BLAST BSA Bovine serum albumin CBB Comassie brilliant blue CD Cytosine deaminase CDD Conserved domain database cDNA Complementary DNA CDS Coding sequence Clhl Chlorohydrolase-like protein AtrzA Atrazine chlorohydrolase TrzA N-ethylameline hydrolase TrzA Triazine hydrolase EC Enzyme commission 5-FC 5- fluorocytosine 5-FU 5- fluorouracil CEIT 2-chloro-4-(ethylamine)-6-(isopropylamine)-s-triazine CAAT 2-chloro-4,6-diamino-1,3,5-s-triazine cDNA complementar deoxyribonucleotide acid DME Dublecco’s modified eagle medium Hams F12 Hams F12, mutrient mixture DMEM Dulbecco's modified Eagle's medium DMSO Dimethyl sulfoxide DNA Deoxyribonucleic acid dNTP Deoxyribonucleotide triphosphate FBS Fetal bovine serum EDTA Ethylenediaminetetraacetic acid ELISA Enzyme-linked immunosorbent assay EMBOSS The European Molecular Biology Open Software Suite EST Expressed sequence tag Et/Br Ethidium bromide FTM Fluid thioglycollate medium H2O2 Hydrogen peroxide HAM Ham’s nutrient mixture F12 HEPES 4-(2-hydroxyethyl)-1-piperazineethanesulfonic acid IPTG Isopropyl 1-thio-D-galactopyranoside LDS Lithium dodecyl sulphate
MTS [3-(4,5-dimethylthiazol-2-yl)-5-(3-Carboxymethoxyphenyl)-2-(4-Sulfophenyl)-2H-tetrazolium, inner salt
OD Optical density PAGE Polyacrylamide gel electrophoresis PBS Phosphate buffered saline (20 mM phosphate buffer, 150 mM NaCl, pH 7.2) PCR Polymerase chain reaction Pm Perkinsus marinus PMS Phenazine methosulfate Po Perkinsus olseni RACE-PCR Rapid amplification of cDNA ends by polymerase chain reaction SDS Sodium dodecyl sulfate SSH Suppression Subtractive Library

Table of Contents
xxviii
TIGR The Institute for Genomic Research TNT Transcription and translation system U Unit Ubq Polyubiquitin UTR Untranslated region

General Introduction CHAPTER I
CHAPTER I – GENERAL INTRODUCTION
“Parasitism involves an intimate association between two different kinds of organisms –
one, the host, providing food and shelter for the other, the parasite” by William Trager
from John Guardiola, L. Luzzatto and William Trager (1983) Molecular Biology of
Parasites, Raven Press

General Introduction CHAPTER I
2
I-1 Perkinsus, a worldwide distributed genus
I-1.1 Perkinsus species and parasite hosts
Perkinsus (P.) is the genus of a protozoan parasite affecting molluscs in the five
continents. Several species have been described to be responsible for disease in large
number of molluscan species, primarily bivalves, which are ecologically, and often also
commercially relevant. P. marinus, initially named Dermocystidium marinum, was first
described as infecting the native eastern oyster Crassostrea (C.) virginica in Louisiana,
although previous works indicated a wider distribution including the Gulf of Mexico
(Mackin et al., 1950). According to the first species designation, the disease was called
Dermo disease, in the specific case of USA. It was also named Labyrinthomyxa marina
(Mackin and Ray, 1966). Further ultrastructure examination of zoospores led to a
reclassification to P. marinus within the Family Perkinsidae, Class Perkinsasida, within
the Apicomplexa protozoan parasites (Levine, 1978).
Another member of the genus, P. olseni, was described as infecting two abalone
species (Haliotis (H.) rubra and H. laevigata) from Australia (Lester and Davis, 1981),
and later P. atlanticus was identified in the clam Ruditapes (R.) decussatus in Southern
Europe (Azevedo, 1989b). In 2002, P. atlanticus was synonymized to P. olseni (Murrell
et al., 2002)
In 1991, a new species (P. karlssoni) was described in the east coast of Canada
based on both morphological and epidemiological differences, where it was found to
infect the introduced bay scallop Agropecten irradians (McGladdery et al., 1991).
However, isolation and purification of both trophozoite and schizont stages of P.
karlssoni (Whyte et al., 1993) remained limited; later, it was suggested that this was not
a valid species because the prezoosporangias shape and structure and the movement and
life span were not consistent with the genus Perkinsus (Goggin et al., 1996).

General Introduction CHAPTER I
3
More recently, several additional species were described: (i) P. qugwadi
infecting the Japanese scallop Patinopecten yessoensis cultured in the West coast of
Canada (Blackbourn et al., 1998), (ii) P. andrewsi, found in the Atlantic coast of the
USA in both Macoma balthica and Mercenaria mercenaria clams, as well as in the
eastern oyster C. virginica (Coss et al., 2001a, Coss et al., 2001b, Kotob et al., 1999)
and P. chesapeaki infecting the clam Mya arenaria harvested in the Chesapeake Bay
(McLaughlin et al., 2000). In 2005, Burreson and collaborators proved that P. andrewsi
and P. chesapeaki were indistinguishable and thus declared synonyms, prevailing the
name P. chesapeaki according to the International Code of Zoological Nomenclature
rules of priority (Burreson et al., 2005).
Recently, other Perkinsus species were described: P. mediterraneous, found in
the Balearic Islands, infecting the European flat oyster Ostrea edulis (Casas et al.,
2004), P. honshuensis infecting Manila clams, Ruditapes (Tapes, Venerupis)
philippinarum (semidecussatus), collected in Gokasho Bay, Japan (Dungan and Reece,
2006) and lately P. beihaiensis (Moss et al., 2008). Altogether, there are seven valid
species described by now: P. marinus, P. olseni, P. qugwadi, P. chesapeaki, P.
mediterraneous, P. honshuensis and P. beihaiensis. Although the first description of
each species was associated with a certain host, there has been since then an update of
possible molluscs infected by Perkinsus species. P. marinus have been found not only
in C. virginica, but also in C. rhizophorae (Bushek et al., 2002a). Oysters such as C.
gigas and C. ariakensis (Calvo et al., 2001) and clams, M. arenaria and M. balthica
(Dungan et al., 2007) were also susceptible to experimental infection by exposure to P.
marinus and by mantle cavity inoculation of parasite cells, respectively.

General Introduction CHAPTER I
4
Table I- 1 Perkinsus spp and hosts identified.
Perkinsus species Type host Type location Other hosts
P. marinus Crassostrea virginica East and Gulf Coasts
of USA
Crassostrea rhizophorae;
C. ariakensis
P. olseni/
Atlanticus
Haliotis rubra,
Ruditapes decusatus
Australia,
New Zeland, Korea,
Japan, China, Portugal,
Spain, Italy, Uruguay
Anadara trapezia
Austrovenus stutchburyi
Chamus pacificus
Haliotis laevigata
Ruditapes philippinarum
Pitar rostrata
Protothaca jedoensis
C. ariakensis
C. hongkongensis
Pinctata margaritifera
P. martensii
H. laevigata
H. scalaris
H. cyclobates
Saccostrea cucullata
P. qugwadi Patinopecten
yessoensis
British Columbia,
Canada
P. chesapeaki/
andrewsi
Mya arenaria, Macoma
balthica
Chesapeake Bay,
Delaware Bay, USA
Crassostrea virginica
Mya arenaria
Macoma balthica
Mercenaria mercenaria
Tagelus plebeius
Tridacna maxima
Tridacna crocea
P. mediterraneus Ostrea edulis Balearic Islands, Spain
P. honshuensis R. philippinarum Gokasho Bay, Japan
P. beihaiensis C. hongkongensis,
C. Ariakensis
Fujian to Guangxi,
southern China
(Adapted from Villalba et al., 2004, Villalba, 2008)
P. olseni from Australia was found to infect various molluscs in the wild,
including abalones, H. rubra, H. laevigata (Lester and Davis, 1981), H. scalaris, H.
cyclobates), and clams, R. decussatus (Da Ros and Canzonier, 1985), R. philippinarum,
Venerupis (V.) aurea, V. pullastra (Villalba and Navas, 1988), Tridacna (T.) crocea, T.
maxima and T. gigas (Goggin and Lester, 1987). Experimentally, it was found that it
General Introduction CHAPTER I
5
could also infect oysters such as Pinctada sugillata, P. maxima, C. rhizophorae (Bushek
et al., 2002a) and cockles, Austrovenus stutchburyi, Macomona liliana, Barbatia novae-
zelandiae, Katelysia rhytiphora and Anadara trapezia (Goggin et al., 1989). P. olseni
was found to infect also Paphai undulata (Leethochavalit et al., 2004) and Pitar rostata
(Cremonte et al., 2005) and was identified in other molluscs, including C. gigas and P.
fucata martensii (Choi and Park, 1997). P. qugwadi infects mainly the aberrant host
Patinopecten yessonesis (Bower et al., 1998), being commonly designated as scallop
protistan X (SPX), and is probably enzootic in other native scallops such as Chlamys
rubida and C. hastate, which revealed to be resistant to infection. In contrast, P.
qugwadi has strong pathogenic effects in British Columbia, where its infection of
Patinopecten yessonesis is sporadically deathly causing up to 90% of losses in stocks
(Bower et al., 1999). P. chesapeaki, initially described in Chesapeake Bay infecting
Mya arenaria, is now known to also infect M. balthica and M. mercenaria (Coss et al.,
2001a), Tagelus Plebeius (Bushek et al., 2007b) as well as M. mercenaria, C. virginica,
T. maxima and T. crocea. Lately, P. beihaiensis, was described to parasitize the oysters
C. hongkongensis and C. ariakensis, as well as other bivalves in Southern China (Moss
et al., 2008).
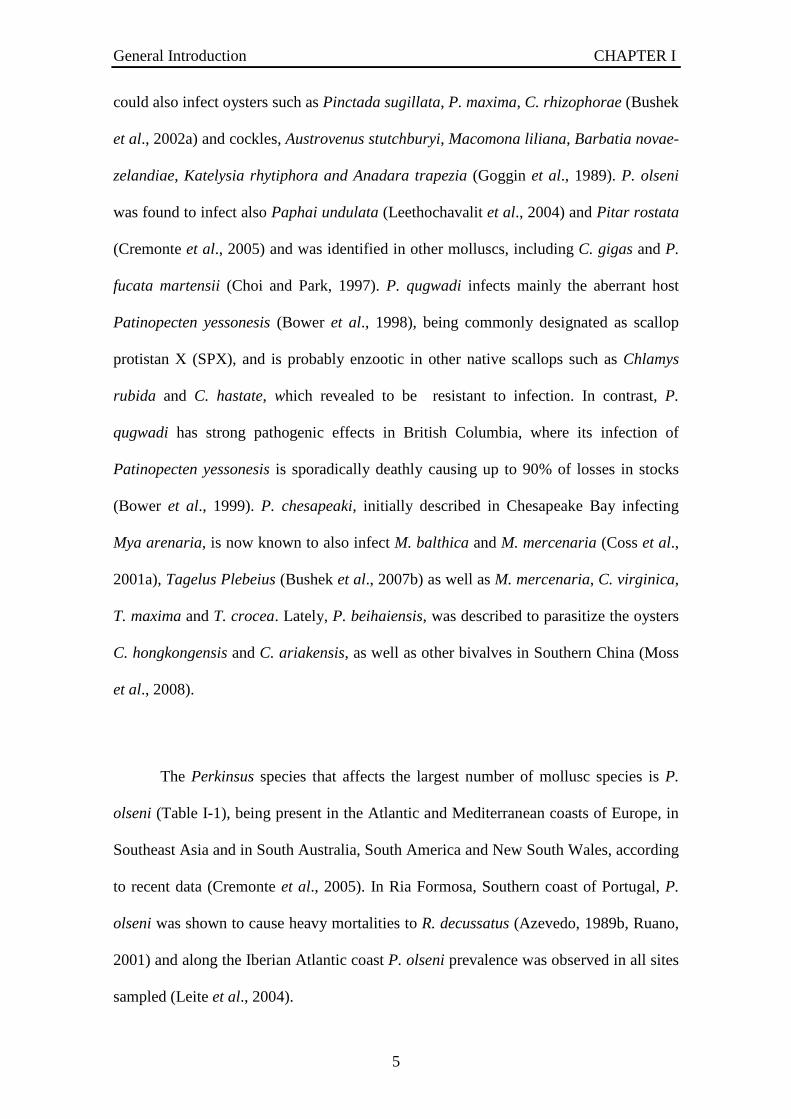
The Perkinsus species that affects the largest number of mollusc species is P.
olseni (Table I-1), being present in the Atlantic and Mediterranean coasts of Europe, in
Southeast Asia and in South Australia, South America and New South Wales, according
to recent data (Cremonte et al., 2005). In Ria Formosa, Southern coast of Portugal, P.
olseni was shown to cause heavy mortalities to R. decussatus (Azevedo, 1989b, Ruano,
2001) and along the Iberian Atlantic coast P. olseni prevalence was observed in all sites
sampled (Leite et al., 2004).

General Introduction CHAPTER I
6
More recently, P. atlanticus was found to be synonymous of P. olseni as
proposed by Murrell (Murrell et al., 2002), and since the name P. olseni (Lester and
Davis, 1981) has taxonomic priority, it prevailed.
I.1.2 Geographical distribution and environmental conditions of Perkinsosis
Perkinsus species affects molluscs all over the five continents, from temperate
through subtropical to tropical regions of the Atlantic and Pacific oceans (Perkins,
1996). Perkinsosis may result in high mortality of some mollusc species, leading to
huge economic and/or ecologic impacts. However, in some cases Perkinsus prevalence
and intensities do not cause disease in certain host molluscs.
Figure I- 1 World distribution of the seven species of the genus Perkinsus with respective date and host as shown in the first description of the species, P. olseni marked in dark red and the other species in blue (figure constructed based on web world map, http://www.bristolstories.org/site_images/big_world _map.jpg).
The two species better characterized are P. marinus and P. olseni. P. marinus
was described to be spread along the Atlantic coast of the United States, from Maine to
Florida (Andrews and Ray, 1988), along the Gulf of Mexico coast to the Yucutan
Peninsula (Burreson et al., 1994). The geographical distribution and abundance of P.
2005 Pitar rostrata

General Introduction CHAPTER I
7
marinus are mainly controlled by temperature and salinity; proliferation and prevalence
of this parasite increases dramatically during the summer when the temperature is over
20°C and salinity higher than 10‰ (Ragone and Burreson, 1993). Increases in sea-
surface temperatures and repeated introductions over many years are probably
responsible for its expansion into Delaware Bay, New Jersey and Cape Cod (Ford,
1996). Recently the northward spread of P. marinus associated with climate changes
corroborated the Dermo disease distribution from the Gulf of Mexico to Delaware Bay
and further north, into Maine (Brander, 2007). Studies on the role of temperature and
salinity in the Dermo disease were pursued, namely by observing apoptosis. Results
showed that higher salinity increased hemocyte apoptosis but had the opposite effect on
parasites, which showed significantly higher rates of apoptosis when cultured in low
salinities (17.1 ‰) at both low and high temperature tested (De Guise et al., 2005).
Dermo disease was also associated with temperature, with P. marinus described to be
the cause of oysters decimation at water temperatures above 25ºC (Fisher et al., 1992),
whereas it rarely caused advanced disease in waters below 18ºC (Chu and Greene,
1989). Pollution has been also hypothesized to contribute to some aquatic epizootics
(Chu and Hale, 1994) and estuarine contaminant mixtures have been shown to increase
oyster susceptibility to parasitism by P. marinus (Bushek et al., 2007a).
P. olseni has been reported to infect a large number of mollusc species from
Australian waters (Goggin and Lester, 1987) into the Pacific Ocean, South Korea (Choi
and Park, 1997), Japan (Hamaguchi et al., 1998) and China (Liang et al., 2001). P.
olseni affects different areas of the Atlantic and Mediterranean coasts of Portugal and
Spain (Azevedo, 1989b) as well as several European countries, including France
(Goggin, 1992), Italy (Da Ros and Canzonier, 1985) and Mediterranean coast of
Northern Africa, Tunisia (Hili et al., 2007), Morocco (Belhsen et al., 2007) and also
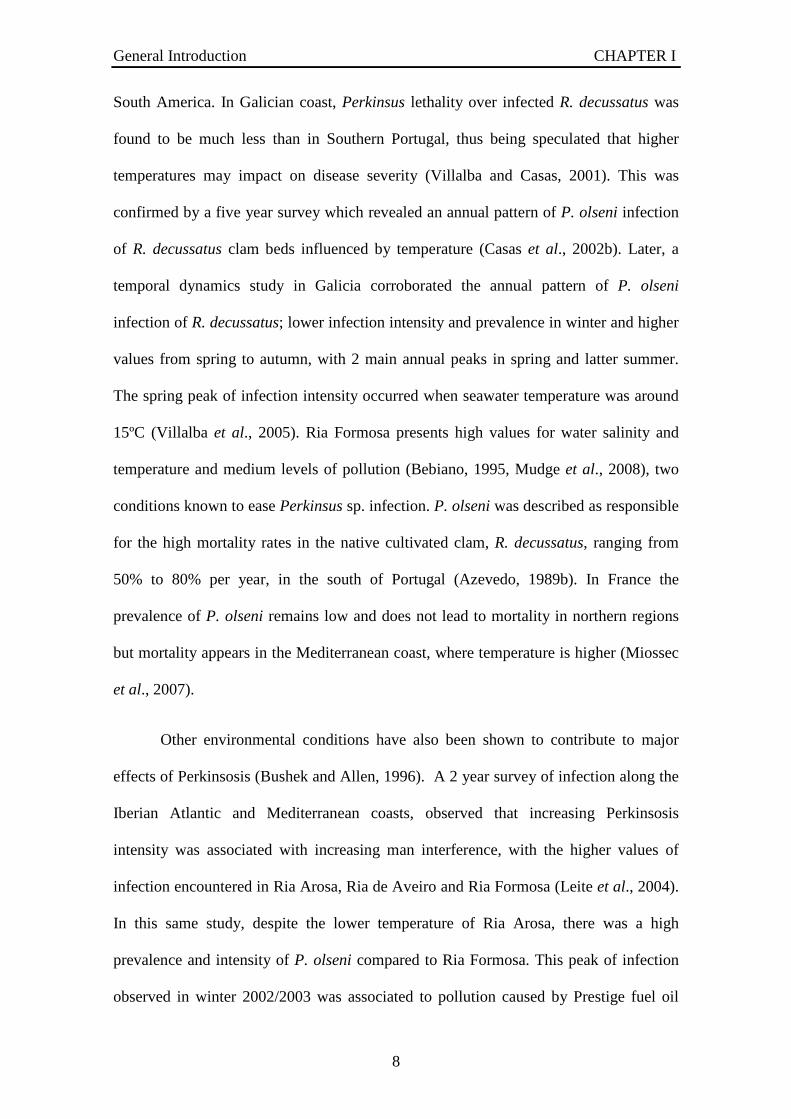
General Introduction CHAPTER I
8
South America. In Galician coast, Perkinsus lethality over infected R. decussatus was
found to be much less than in Southern Portugal, thus being speculated that higher
temperatures may impact on disease severity (Villalba and Casas, 2001). This was
confirmed by a five year survey which revealed an annual pattern of P. olseni infection
of R. decussatus clam beds influenced by temperature (Casas et al., 2002b). Later, a
temporal dynamics study in Galicia corroborated the annual pattern of P. olseni
infection of R. decussatus; lower infection intensity and prevalence in winter and higher
values from spring to autumn, with 2 main annual peaks in spring and latter summer.
The spring peak of infection intensity occurred when seawater temperature was around
15ºC (Villalba et al., 2005). Ria Formosa presents high values for water salinity and
temperature and medium levels of pollution (Bebiano, 1995, Mudge et al., 2008), two
conditions known to ease Perkinsus sp. infection. P. olseni was described as responsible
for the high mortality rates in the native cultivated clam, R. decussatus, ranging from
50% to 80% per year, in the south of Portugal (Azevedo, 1989b). In France the
prevalence of P. olseni remains low and does not lead to mortality in northern regions
but mortality appears in the Mediterranean coast, where temperature is higher (Miossec
et al., 2007).
Other environmental conditions have also been shown to contribute to major
effects of Perkinsosis (Bushek and Allen, 1996). A 2 year survey of infection along the
Iberian Atlantic and Mediterranean coasts, observed that increasing Perkinsosis
intensity was associated with increasing man interference, with the higher values of
infection encountered in Ria Arosa, Ria de Aveiro and Ria Formosa (Leite et al., 2004).
In this same study, despite the lower temperature of Ria Arosa, there was a high
prevalence and intensity of P. olseni compared to Ria Formosa. This peak of infection
observed in winter 2002/2003 was associated to pollution caused by Prestige fuel oil
General Introduction CHAPTER I
9
disaster which occurred at the end of Autumn 2002 (Leite et al., 2004). Thus, Perkinsus
sp. prevalence, intensity and lethality is associated not only with higher temperatures
and salinities but also to pollutants such as TBT and hydrocarbons (Anderson et al.,
1996), which appear to intensify host mortalities.
The geographical distribution of P. olseni species was also correlated to different
degrees of parasite pathogenicity, higher for R. decussatus and lower for R.
philippinarum. In Japan, a Perkinsus sp. purified from clam R. philippinarum
(Hamaguchi et al., 1998) showed to be intermediate between P. olseni from Australia,
and P. olseni/atlanticus from Spain and Portugal, denoting their close relationship
(Robledo et al., 1997). This facts suggested that the Manila clam or short-necked clam
was its natural host, and P. olseni was introduced in Europe from the
Pacific/Australasian/Southeast Asian region, where R. philippinarum is native (Cigarría
et al., 1997). So, P. olseni presents a wide distribution throughout Southeast Asia to
Europe (Robledo et al., 1997). The synonymy of P. olseni and P. atlanticus (Murrell et
al., 2002) also supported the hypothesis that P. olseni was transported by movement of
the clam host R. philippinarum from Asia to Europe (Hine and Thorne, 2000). In
Europe, France, England, Spain and Italy soon introduced the exotic R. philippinarum
because of its less susceptibility to disease (Cigarría et al., 1997). Despite the higher
susceptibility of R. decussatus to Perkinsosis, in Ria Formosa, a Natural Park and clam
bed situated in Southern Portugal, the cultivation of exotic introduced R. philippinarum
is performed in very small scale, separate from native clam species.
Albeit the prevalence and intensity of P. olseni, R. decussatus produced in south
Portugal constitutes 90% of Portuguese mollusc production (IPIMAR, 2003). Among
several bivalve species caught, the carpet-shell clam R. decussatus represents by far the
most important produced bivalve in Portugal, 38% (3,007 t) of total aquaculture

General Introduction CHAPTER I
10
production (7,829t), compared to mussels (4%) and oyster (5%) (http://www.fao.org/
fishery/countrysector/FI-CP_PT). Despite the decrease of production, in 2005, Portugal
was the second biggest producer of carpet-shell clam in Europe (http://www.fao.org/,
(Villalba, 2008). This production was deadly affected in the 80ies with heavy
mortalities (Azevedo, 1989b) deeply affecting the economy of Ria Formosa producers.
However, no other massive epizootic event was described since then. Perkinsosis is a
wide spread and complex disease and parasite-host mollusc interactions are difficult to
decipher, because they are related to environmental conditions which are in constant
changing.
I.2 Taxonomic classification of Perkinsus genus
Perkinsus species (Levine, 1978), Parvilucifera spp. and Cryptophagus spp.,
constitute the phylum Perkinsozoa (Norén et al., 1999). According to Systema Naturae
2000, the genus Perkinsus belongs to Family Perkinsidae (Levine, 1978), Order
Perkinsorida, Class Perkinsea, Infraphylum Protalveolata, Subphylum Dinozoa and
Phylum Myzozoa (Cavalier-Smith, 1999), Infrakingdom Alveolata, Subkingdom
Biciliata and Kingdom Protozoa of Eukaryota Domain. Over the years, the taxonomic
placement of Perkinsus has been problematic, so other than morphologic studies were
performed in order to clarify the phylogeny of these marine mollusc parasites.
Phylogenetic analyses based on the RNA gene from the small ribosomal subunit and the
actin gene indicated that the Perkinsasida may not belong to Phylum Apicomplexa
(Levine, 1978), but be one of the earliest diverging groups of the lineage leading to
Dinoflagellates (Goggin and Barker, 1993). Since Perkinsids share features with both
Dinoflagellates and Apicomplexans, they are described as a taxon within the Alveolata
group, with the phylum name of Perkinsozoa (Norén et al., 1999).

General Introduction CHAPTER I
11
I.3 Parasite characterization, life-cycle and phylogeny
The two Perkinsus species of interest are the two most characterized, P. marinus
and P. olseni, being included in the Aquatic Animal Health Code. Perkinsus sp.
trophozoite was firstly characterized as a spherical spore, 2-4 µm with a very large
eccentric vacuole and nucleus ordinarily oval observed in stained sections (Mackin et
al., 1950). In 1976, Perkins updated the description of trophozoites structure as cells
with a pair of centrioles in the invagination of nuclear envelope, a granular cell wall and
tubulovesicular mitochondria in the cytoplasm, which mature to have the described
signet-ring shape with 5-10 µm (Perkins, 1996). The life cycle of Perkinsus was
established in two species P. marinus (Perkins and Menzel, 1966) and P. olseni (Lester
and Davis, 1981). Four life stages, trophozoites, prezoosporangia, zoosporangia, and
biflagellated zoospore have been identified and described. The two first phases are host
tissue-associated, while the two latter are free in sea water and were defined on the basis
of in vitro observations. Life cycle was firstly characterized as consisting of vegetative
reproduction involving bipartition with alternating karyokinesis and cytokynesis. From
one trophozoite, called aplanospore, by successive bipartition, multiple cells formed the
sporangia, the schizont, from which each cell was released. Each cell matured to reach
the signet-ring mature trophozoite shape described in 1987 by Perkins, having a large
eccentric vacuole containing a vacuoplast and a peripheric nucleus with a central
endosome (Perkins, 1987). These P. marinus trophozoite cells enlarge to about 15 to 20
µm, called prezoosporangia, and have been found in moribund oysters. Its release into
water resulted in zoospore formation by bipartition. These biflagellated zoospores
presented a conoid in the anterior part of the cell, rhoptries and micronemes, found in
Apicomplexa, resembling the coccidian (Perkins, 1987).

General Introduction CHAPTER I
12
Figure I- 2 P. olseni life cycle stages. Optical microscopy: (A) Trophozoites and Schizonts life stages in in vitro cell culture (kindly provided by Professor Carlos Azevedo); (B) In vitro zoosporolation with Zoospores (*) and Prezoosporangia (+). Electron microscopy: Ultrastructure of Trophozoite, signet-ring (C) and Schizont (D), adapted from the electromicrographies kindly provided by Professor Carlos Azevedo.
In the early P. olseni description by Carlos Azevedo (1989) there were clear
differences relative to P. marinus description concerning dimensions and structure of
the zoospores and its flagella. There were no such details described by Lester (1981) for
comparison with P. olseni (Lester and Davis, 1981) and thus the morphological
characteristics were of taxonomic relevance at that time. P. marinus trophozoites
presented the same general morphology although with 3-10 µm compared to P. olseni
with 4.6- 16 µm (Robledo et al., 2002). Zoospores were described for both species as
elliptic cells with two different flagella located laterally and having an apical complex
A
B
C
D
+
*
General Introduction CHAPTER I
13
with a polar ring, rhoptries, micronemes, conoid and subpellicular microtubules
(Perkins, 1987). The flagellated zoospores contained an apical organelle with
similarities to the Apicomplexan leading to the conclusion that Perkinsus could
represent an early lineage of the Apicomplexans (Levine, 1978). In 1997, Siddall
described the ‘conoid’ structure as open along one side. This feature led to a
reinterpretation of the significance of the structure for the taxonomy of the genus
Perkinsus (Siddall et al., 1997) and made Perkinsids distinct from Apicomplexans
(Leander and Keeling, 2003). The presence of two dissimilar flagella inserted ventrally,
one with mastigonemes along one side of P. marinus, make this species closely related
with Dinoflagellates (Perkins, 1996). Ultrastructural observation of cell division in
Perkinsus also appeared to be Dinoflagellate-like because the nuclear envelope remains
intact during mitosis, with the mitotic spindle running through continuous channels and
attaching to kinetochore-like structures on the nuclear envelope (Perkins, 1996). In 1995
a second type of division, a schizogony-like division, was described for P. marinus
(Peyre et al., 1995), leading to formation of schizonts. In addition to the morphological
analysis, the molecular characterization of small-subunit (SSU) rRNA, actin, and α- and
β-tubulin sequences allowed the definition of a key ancestral taxonomic position and
defined the Perkinsus phylogeny in the divergence of Apicomplexans and
Dinoflagellates (Saldarriaga et al., 2003).
The development of in vitro pure cultures for each of these parasite species
provided an important tool to better characterize these parasites. P. marinus culture was
successfully developed simultaneously in different laboratories (Gauthier and Vasta,
1993, Peyre et al., 1993) both derived from trophozoites isolated from its oyster host
and later optimized (Gauthier and Vasta, 1995a, Peyre et al., 1995). For P. olseni,
continuous in vitro cultures were also developed at the same time, both derived from

General Introduction CHAPTER I
14
parasites infecting the carpet-shell clam, R. decussatus (Robledo et al., 2002, Casas et
al., 2002a). Deposited in the American Type Cell Culture, both P. marinus (ATCC
50983) and P. olseni clonal cultures (ATCC 50984) of trophozoites are maintained
independent of host and are important tools for in vitro studies and further
characterization. Molecular characterization of Perkinsus spp. has been used to support
Perkinsus species designations and to develop PCR-based assays specific to accurately
assess P. olseni epizootics in clam populations around the world (Goggin, 1994). These
tools have proven to be reliable to distinguish Perkinsus species from Europe, Australia,
and the Atlantic coast of North America (Goggin, 1994). After P. marinus SSU
sequence (Goggin, 1994), the ITS, SSU, and NTS rRNA sequences of a P. olseni isolate
from Galicia, Spain (Robledo et al., 2000) were reported. To clarify the phylogeny of
this genus the SSU rRNA, actin, α-tubulin and β-tubulin sequences were also
characterized (Kuvardina et al., 2002). Molecular analyses of nuclear encoded genes
pointed to a closer relationship of Perkinsozoa to Dinoflagellata (Reece et al., 1997,
Saldarriaga et al., 2003, Saldarriaga et al., 2004).
In terms of molecular characterization, cDNA and genome cloning from
Perkinsus spp. allowed the identification of several structural proteins such as actin (P.
marinus, AAB62065; P. olseni, ABF61886; P. chesapeaki, AAX82887; P.
mediterraneus, ABQ01414 and P. honshuensis, ABF61883), ribosomal proteins, P.
marinus 40S (ABV22180) and P. olseni L38 (AAW55921) and proteins belonging to
different metabolic pathways such as the P. marinus fatty acid metabolic pathway (delta
9-elongating activity protein (ABF58686), delta 5-desaturase (ABF58685), delta 8-
desaturase (ABF58684) responsible for arachidonic acid biosynthesis (Venegas-Calerón
et al., 2007) and acetyl CoA carboxylase (CAK51558) or the P. olseni de novo purine
biosynthesis pathway (Leite et al., 2008, Leite et al., 2004), including the

General Introduction CHAPTER I
15
phosphoribosylaninomidasole synthetase (AAT99016), phosphoribosylanino-midasole
formyltransferase (AAT46683) and HIF prolyl hydrolase (ABS82069) (Leite et al.,
2008).
Figure I- 3 Phylogenetic analysis of Perkinsus based on dxs gene from MEP pathway. Unrooted ML tree constructed using Phyml with WAG substitution matrix, based on a matrix comprising 55 OTUs and 497 sites. P. marinus dxs ortholog marked with arrow forming a highly supported clade with the Dinoflagellate. The scale bar indicates the number of substitutions per site (adapted from Matsuzaki et al., 2008).

General Introduction CHAPTER I
16
The P. marinus genome project, although not yet fully sequenced nor annotated,
has been a useful tool for molecular characterization studies. In May 2004 the first
preliminary contigs were released from Celera Assembler assembly of 163,052
sequences with mean length of 861 nt (www.tirg.org, www.umbi.umd.edu/comb). The
P. marinus karyotype has not been completely resolved, its size being estimated to be
28 Mb by CHEF gels, with the largest chromosomes size of 5-7 Mb and the lowest of 1-
2 Mb (www.tigr.org). In P. olseni, nine chromosomes were identified by pulsed field
gel electrophoresis (PFGE) combined with densitometry analysis. Eight distinct
chromosomal DNA bands were obtained: 0.15, 1.5, 2.1, 2.9, 3.4, 4.0, 5.4 and 6.5 Mb
and the whole genome size estimated in 28Mb (Teles-Grilo et al., 2007a). P. olseni
karyotype revealed a chromosome organization like that of the early branches of
Dinoflagellate lineage (Teles-Grilo et al., 2007a). Very recently the existence of a non-
photosynthetic secondary cryptic plastid in P. marinus ensured the close relation to
plastid-bearing Dinoflagellates (Figure I-3) and Apicomplexans (Matsuzaki et al.,
2008). Teles-Grilo and collaborators identified plastids in P. olseni in a region of the
apical end of zoospore by ultrastructural observations. This revealed also the existence
of a four membrane structure that resembled the Apicomplexans more than the
Dinoflagellates (Teles-Grilo et al., 2007a, Teles-Grilo et al., 2007b). The genomic,
transcriptomic and proteomic of P. olseni and P. marinus are areas in rapid
development, and the new data should contribute decisively to obtain a better
understanding of these two Perkinsus species.
I.4 Host-parasite interactions
Parasitic protozoans of the genus Perkinsus are among the most important
pathogens associated with disease outbreaks, both in cultivated and in natural mollusc

General Introduction CHAPTER I
17
populations all around the world, and for which an increasing prevalence has been
reported. In 1994, Kleinchuster and collaborators announced that the described P. olseni
infection of the clam R. decussatus could be appropriate to develop a model system to
study Perkinsus species/host interactions, because of this parasite ease of culturing
through in vitro life cycle (Kleinschuster et al., 1994). The relevance of this genus was
motivated by the massive mortalities described for the eastern oyster cultured in the
Atlantic coast of USA (Mackin et al., 1950) and for the carpet-shell clams in Southern
Portugal (Azevedo, 1989b), also because of the decrease in commercial value of
abalones in Australia (Lester and Davis, 1981) Though, both ecological and economical
impacts justified the careful characterization of these host-parasite systems.
Figure I- 4 R. decussatus clam and P. olseni parasite: (A) carpet-shell clam gills macroscopic observation with white nodules of P. olseni pustules and (B) P. olseni cell culture cells observed in electron microscope (kindly provided by Professor Carlos Azevedo).
The natural interaction of this parasite with its type host was described for each
species. P. marinus was often found intracellularly, phagocytosed by hemocytes
(Mackin et al., 1950), being thus designated as intracellular, albeit facultative. P.
marinus infections were described to progress rapidly in the hemolymph and other
tissues because parasite cells are avidly phagocytosed by the hemocytes and are
probably disseminated throughout the host via the circulation. Although hemocytes are
A B

General Introduction CHAPTER I
18
thought to be important microbicidal, they seem to have little ability to destroy P.
marinus, contributing instead to spread the infection (Anderson et al., 1995).
P. olseni infection was observed in the foot, mantle tissues and gill of carpet-
shell clams (Azevedo, 1989b) and in tissues of gill filaments in which several dense
host cells surrounded the parasite cells originating structures that could reach 1 mm
diameter, being macroscopically visible (Azevedo, 1989a). P. olseni infecting Haliotis
spp. formed pustules in the foot and mantle, up to 8 mm, which diminished the
commercial value of abalones in Australia (Goggin and Lester, 1995). At higher levels
of infection, Perkinsus were found in all types of tissues, including adductor muscle and
gonadal connective tissues (Choi et al., 1989). Morphological observation showed P.
olseni cells aggregated and surrounded by lysed dense hemocytes of R. decussatus
(Azevedo, 1989a) and R. semidecussatus (Sagristà et al., 1995). It was also found within
the hemocytes and both intracellular and extracellular in hemolymph of Saccostrea
cucullata (Hine and Thorne, 2000). This looked like the privileged way for Perkinsus
spp. to invade the host, affecting them from mantle to gonad tissues. In the west and
south coasts of Korea, clams exhibited pathologic symptoms such as digestive
epithelium atrophy, hemocyte infiltration and tissue inflammation caused by Perkinsus
heavy infection (Choi and Park, 1997). In Northern Mediterranean coast of Spain,
examination of R. philippinarum revealed a co-infection by P. olseni and bacteria and/or
viruses and these opportunistic pathogens were favoured by P. olseni infection (Montes
et al., 2001). Many pathogenic microorganisms can enter eukaryotic host cells, like
hemocytes, and use the normally hostile environment as a niche, evading the host
immune response. Several studies have aimed to characterize the close interaction
between the parasite and its host hemocytes/hemolymph. Microelectrode arrays and
impedance techniques have been used to show the interaction between R. decussatus

General Introduction CHAPTER I
19
hemocytes, the parasite P. olseni cells and its surroundings, identifying the cells, their
adhesion, coverage, and even cell motility (Gomes et al., 2004).
Although much progress has been made in elucidating the immunological
interactions and the molecular mechanisms involved in the process of immune evasion,
relevant in human and animal parasites (Gupta, 2005), little has been done to
characterize the system P. olseni-R. decussatus. The bivalve internal defence system
consists of non-specific cellular and humoral components. R. decussatus possesses two
main types of hemocytes, hyalinocytes and granulocytes, which are represented by three
types, basophilic, acidophilic and mixture (López et al., 1997). The defensive response
to P. olseni infection by R. decussatus and R. semidecussatus involves the
redifferentiation of recruited granulocytes and the expression de novo of polypeptide
p225, not observed when R. decussatus was exposed to inoculations of bacteria, algae
and non-viable P. olseni prezoosporangia (Montes et al., 1997).
P. marinus is known to promote different cellular immune responses according
to permissive and resistant oyster hosts. In addition, there was more phagocytosis in
infected C. virginica than in infected C. gigas three days post-infection (Goedken and
Guise, 2004). Another study investigating host response to parasite identified of C.
virginica plasma protein p35, an anti-protease (Oliver et al., 1999). Also, analysis of
oysters’ C. virginica and C. gigas molecular response to P. marinus by suppression
subtractive hybridization (SSH) has lead to the identification of 107 differentially
expressed gene sequences for C. virginica and 69 for C. gigas. Of these, nineteen genes
involved in immune system and cell communication, protein regulation and
transcription, cell cycle, respiratory chain and cytoskeleton from C. virginica were
characterized (Tanguy et al., 2004). Until now, only few studies have described the
parasite molecular response when interacting with its host, identifying a P. olseni cell

General Introduction CHAPTER I
20
wall protein (PWP-1) related to parasite protection (Montes et al., 2002) and subtilisin-
like serine protease (Brown and Reece, 2003).
The host-parasite interaction and the establishment of pathogen infection depend
upon the physiological status of the host and its defensive capabilities and the ability of
the pathogen to avoid/evade host defences and acquire the essential nutrients for its
development and growth. Food Salinity and temperature are environmental factors
involved in regulating P. marinus infection and thus the spreading of disease among C.
virginica populations (Hofmann et al., 1995). Intracellular pathogens must circumvent
host defences, acquire nutrients and either kill or maintain the host cell according to
their needs (Leirião et al., 2004). Nevertheless, the virulence factors and pathogenicity
mechanisms of Perkinsus spp. are still poorly understood. Ford and collaborators
observed that P. marinus parasites freshly isolated from infected C. virginica were
much more virulent than those maintained in an in vitro culture (Ford et al., 2002).
Supplementation of P. marinus cell culture with host plasma or tissue homogenate of
eastern oyster altered both cell size and proliferation, and also increased infectivity
(Earnhart et al., 2004). Among the several life stages of P. marinus, trophozoites have
been shown to be the most efficient in initiating serious mortalities (Volety and Chu,
1995). It was also hypothesized the existence of a certain level of specificity in the
recognition/endocytosis of P. marinus by its natural host species (Gauthier and Vasta,
2002).
Parasites can also represent sensitive biological indicators of various types of
pollutants in both freshwater and marine ecosystems (MacKenzie et al., 1995) though
host-parasite interaction is even more valuable. R. decussatus have been described as a
bioindicator, in particular when mussels are not available, and several biomarkers were
validated among which metallothioneins (MT), superoxide dismutase (SOD), catalase

General Introduction CHAPTER I
21
(CAT), glutathione peroxidases (GPx), lipid peroxidation, glutathione S-transferase
(GST) and acetylcholinesterase (AChE), measured in different tissues of the clam
(Bebianno et al., 2004). Other relevant biomarkers, including ferritin, HSP70 and
thioredoxin H, were analysed in parallel with metallothioneins when the clam R.
decussatus was submitted to P. olseni infection. Interestingly, both ferritin and HSP70
were up-regulated when the carpet-shell clams were infected by P. olseni (Leite et al.,
2007). Because the parasite determines the clam condition, analysis of the host-parasite
interaction can provide relevant information, both ecologically and economically,
especially in the lagoon system of Ria Formosa.
I.5 P. olseni affects carpet-shell clam in Ria Formosa
Ria Formosa is located in southern Portugal, extending for about 55 km of
lagoon area defined by a true barrier island system, which covers a total area of 163
km2, with 20 km2 occupied by salty marshes and aquaculture ponds. The main water
reservoir of the salty marshes and the extensive aquaculture ponds behaves like small
lagoons with openings to a tidal channel (Gamito, 1997) with an average depth of 4m
(Ruano, 1997). The sediment varies from sand/mud to coarse sand with water
temperatures ranging from 10 to 25ºC and salinity from 33.8 to 38‰ (Ruano, 1997),
being described as an important ecosystem acting as nursery and optimal habitat for
bivalves, with carpet-shell clam being the most used species for culture (IPIMAR,
2003). In addition, other bivalves are economically relevant in the south coast of
Portugal, including blue mussel, Mytilus (M.) edulis, Mediterranean mussel, M.
galloprovincialis, Portuguese oyster, C. angullata, Japanese oyster, C. gigas, other
clams such as Venerupis (V.) pullastra and V. rhomboides, cockle, Cerastoderma edule,
and the wedge clam, Donnax (D.) trunculus (Ruano, 1997). In the summer of 1983,

General Introduction CHAPTER I
22
heavy mortalities were described for the carpet-shell clams, and those substantial losses
continued throughout the 80ies, when they were finally associated with P. olseni
infection (Azevedo, 1989b).
Longitude
Latit
ude
Portugal
Spain
Ria Formosa
AtlanticOcean
LisboaLoulé
Serra de Monte Figo
Ancão
Cabo de Santa Maria
Faro
Olhão
Ilha da Armona
Ilha da Culatra
Ilha de Tavira
E.N. 125
Tavira
Sapal
Parque Natural
Manta Rota
Vila Real de Santo António
Longitude
Latit
ude
Portugal
Spain
Ria Formosa
AtlanticOcean
Longitude
Latit
ude
Portugal
Spain
Ria Formosa
AtlanticOcean
LisboaLoulé
Serra de Monte Figo
Ancão
Cabo de Santa Maria
Faro
Olhão
Ilha da Armona
Ilha da Culatra
Ilha de Tavira
E.N. 125
Tavira
Sapal
Parque Natural
Manta Rota
Vila Real de Santo António
Figure I- 5 Ria Formosa Natural Park localization in South Portugal (adapted from www.olhao.web.pt/ ParqueNatural.htm).
The bivalves’ collection has been important in this region ever since the Roman
occupation, from 140 b.C. to 400 a.C. until th XX century, with a broad distribution in
the Portuguese river estuaries and lagoon systems. Throughout time, there has been a
reduction in the natural beds and in bivalves’ diversity and the decline in bivalves’
production observed in the XXth century can be related to overharvesting and habitat
degradation (Ruano, 1997). In contrast to clam, production of oyster was more relevant
in the past, during the XXth century, albeit the varied production of R. decussatus, as
well as its economical and social importance, has always remained high thus the
relevance of controlling Perkinsosis. This disease, caused by heavy infection of clams

General Introduction CHAPTER I
23
with P. olseni, is an epidemic disease, and often infection intensity, as well as
prevalence, is positively correlated with the density of host organisms (Da Ros and
Canzonier, 1985). In the natural clam beds of Ria Formosa, farmers started preparing
culture beds to seed small clams, 5-10 mm, collected from natural beds, before the
development of hatcheries. These seeds grew in 1½ to 2 years to commercial size
(Ruano, 1997). These clams, when transferred into closely areas, gave no problems, but
the seed densities had to be maintained within a certain range, otherwise the epidemics
would cause huge losses and expenses. As in aquaculture, because of overcrowding,
severe parasitological problems frequently appear even in free waters, as P. marinus,
incerta sede parasitic organisms of almost all commercial bivalves (Perkins, 1996).
Bonamia spp., Mikrocytos mackini, and Perkinsus spp. transmit directly from one host
to another (Berthe, 2001) requiring care in managing the host. Transfer and introduction
of commercial species without a serious health control may support and spread parasitic
diseases from different countries. This was a common practice when R. philippinarum
was found out to be more resistant to plagues (Cigarría et al., 1997). In Portugal, other
bivalves then R. decussatus, living in the south coast, can also be infected by Perkinsus,
as was the case of C. angulata (Azevedo, 1989b), although not to the same extent nor
the same virulence as R. decussatus. This host-parasite system remains poorly
characterized for the particular case of Ria Formosa and thus constitutes an interesting
research objective.

General Introduction CHAPTER I
General Materials and Methods CHAPTER II
CHAPTER II – GENERAL MATERIALS AND METHODS
“Considering the complexity of host and environmental issues, study of the pathogen
offer an attractive system to learn more about the biology of disease” by Karen Joy
Shaw (2002) Pathogen Genomics Impact on Human Health, Humana Press

General Materials and Methods CHAPTER II
26
II-1 Eukaryotic and bacterial cell cultures
The clonal cell line from P. olseni used in this work was established from
trophozoites isolated directly from the infected host R. decussatus, (ATCC 50984-
ALG4; (Robledo et al., 2002) and resulted from a collaboration between the Molecular
Biology Laboratory of University of Algarve and the Center of Marine Biotechnology
of the University of Maryland (COMB). P. olseni cells were cultured in DME: Hams
F12 (1:2) medium supplemented with 5% fetal bovine serum (FBS) and 1% penicillin
and streptomycin (Pen/Strep) antibiotics (all Gibco, Grand Island, NY, USA), as
described (Robledo et al., 2002). The Perkinsus marinus cell line TXsc (ATCC 50983)
was supplied by Doctor Professor Gerardo Vasta from COMB and maintained in
DME:Ham’s F12 (1:2) with 5% FBS and antibiotics mix as described (Gauthier and
Vasta, 1995a).The Xenopus laevis cell line A6 (derived from kidney epithelial cells,
ATCC CCL102) was cultured at 22 °C in 60% L15 medium supplemented with 5%
fetal bovine serum and 1% Pen/Strep antibiotics (all Gibco). These cells were selected
as Eukaryote exogenous system because of its availability and transfectability.
E. coli DH5α competent cells (Invitrogen, Carlsbad, USA) were used for
cloning, being cultured at 37ºC in Luria-Bertani (LB) medium (Sambrook et al., 1989).
BL21 (DE3) pLysS cells (Strategene, La Jolla, CA) were used as prokaryotic system for
protein expression. They were grown in LB media in the presence of antibiotic
(ampicillin or chloramphenicol at 100 µg/ml). T7 polymerase was inducted by IPTG
(Invitrogen).

General Materials and Methods CHAPTER II
27
II-2 Extraction and purification of nucleic acids
II-2.1 Total RNA extraction
Total RNA was extracted from log phase cell cultures, grown in standard
medium. Since Perkinsus sp. cell culture presents a rosette multicellular morphology
and individual throphozoites with a cell wall, there was a need to improve cell
disruption. Cell lysis and homogenization were performed using a Glass/Teflon Potter
Elvehjem homogenizers and the resulting lysate was passed through a 21G needle to
increase cells disruption. Total RNA isolation was performed according to
Chomczynski and Sachi method (Chomczynski and Sacchi, 1987) or using a
commercial kit (RNeasy total RNA isolation Kit from Qiagen, Chatworth, USA),
according to the manufacturer’s procedure. Total RNA was quantified
spectrophotometrically at A260nm. Protein contamination was assessed by A260/A280nm
ratio. RNA was used if ratio was between 1.7 and 2.0. RNA integrity was evaluated by
the existence of clear and definable ribosomal RNA bands and the relative ratio of 18S
to 28S, ensuring that RNA was not degraded, following a formaldehyde/agarose gel
electrophoresis.
II-2.2 Poly+A RNA purification
Messenger RNA (mRNA) was purified from total RNA isolated from P. olseni
and P. marinus cells using the Oligotex mRNA Midi Kit (Qiagen), according to
manufacturer’s instructions. Quality of poly+A RNA obtained was evaluated following
denaturing gel electrophoresis and by amplification of the reference genes by PCR.

General Materials and Methods CHAPTER II
28
II-2.3 Genomic DNA isolation
DNeasy Tissue kit (Qiagen) was used for extraction of high molecular weight
(HMW) genomic DNA through advanced silica-gel–membrane technology allowing a
rapid and efficient purification following cell lysis through selective binding of DNA to
the DNeasy membrane. P. olseni or P. marinus cells collected from a stationary growth
phase were lysed using proteinase K and then loaded onto the DNeasy Mini spin
column using tips with larger tip diameter to reduce DNA fragmentation. DNA was
selectively bound to the DNeasy membrane and after two wash steps using brief
centrifugations, the HMW DNA was eluted in TE buffer. Purified DNA was quantified
by measuring A260nm and purity analysed by the A260/A280nm ratio and electrophoresis in
a low percentage agarose gel.
II-3 Molecular cloning and characterization of selected cDNAs and genes
The molecular characterization of a given gene comprises cloning and
sequencing of its full length cDNA and gene, identification of its gene organization and
prediction of the corresponding protein.
II-3.1 RACE-full length cDNA amplification
Rapid amplification of both 5' and 3' cDNA ends (RACE) from the same
template was achieved using a Marathon cDNA library (Clontech, Palo Alto, USA),
previously constructed and available at the Molecular Biology laboratory or a
GeneRacer Kit (Invitrogen) constructed in the laboratory of the Centre of Marine
Biotechnology. RACE amplification was selected based on our previous experience and
excellent results obtained for cloning full-length cDNAs from differentially expressed
ESTs (Expressed Sequence Tags) identified with the PCR Select™ cDNA Subtraction
Kit (Clontech). For each 5'- and 3'-RACE reactions, 36 µl of sterile H2O were placed in
a 0.5ml tube to which were added 5µl of cDNA PCR Reaction Buffer (10x), 1 µl dNTP
General Materials and Methods CHAPTER II
29
Mix (10 µM ea), 1 µl Advantage 2 Polymerase Mix (50x) completing 43 µl final
volume. Both 5’ and 3’ RACE PCR reactions were primed with an internal gene
specific primer (GSP) and the Marathon Adaptor Primer (AP1). The amplification was
performed in a Perkin Elmer GeneAmp System 2400 (Applied Biosystems, USA) using
the following conditions: 30 sec at 94°C (denaturation step), followed by 5 cycles of
94°C for 5 sec and 72°C for 4 min, followed by 5 cycles of 94°C for 5 sec and 70°C for
4 min and finally 25 cycles of 94°C for 5 sec and 68°C for 4 min. Amplification results
were analysed by gel electrophoresis using 5 µl from each PCR product along with
appropriate DNA size markers, on a 1.2% agarose/EtBr gel. PCR products were gel
band extracted and ligated into available cloning vectors.
II-3.2 P. marinus Gene Racer library construction
For P. marinus, the 5’ and 3’ UTR regions were amplified using the GeneRacer
Kit (Invitrogen) methodology following the instructions. cDNAs were oligo dT-primed
cDNAs that were synthesized with SuperScript II RT. This library follows the same
steps and principles as described for Marathon cDNA library, after first and second
cDNA strand synthesis, these were ligated to adaptors. The 5’ and 3’ cDNA ends of a
gene were obtained using the GeneRacer primers included in the kit and GSPs designed
specifically. RACE PCR products were cloned and sequenced.
II-3.3 Gene cloning using the Universal Genome Walker library
Library construction
The BD GenomeWalker™ Universal Kit (Clontech) was used because of our
previous experience where it proved to be a powerful method for gene amplification
from high molecular weight genomic DNA (HMW gDNA). The kit was used following

General Materials and Methods CHAPTER II
30
the manufacture’s procedures. The first step consisted on the construction of pools of
uncloned, adaptor-ligated genomic DNA fragments, which were obtained following
genomic DNA (gDNA) digestions with two selected restriction enzymes: two libraries
were constructed. For this, separated aliquots of 2.5 µg HMW gDNA were completely
digested with either EcoRV or StuI, two restriction enzymes that leave blunt ends. Each
batch of digested genomic DNA was ligated separately to the BD GenomeWalker
Adaptor. Finally, 10x diluted libraries were stored at -20ºC for gene characterization by
PCR-based DNA walking.
Upstream and downstream gene amplification
After construction of StuI and EcoRV libraries, two PCR amplifications per
library were performed using the outer Adaptor Primer (AP1) provided in the kit and a
pair of GSPs (forward and reverse, see Appendix II-1), each used separately to amplify
both downstream and upstream, from the starting gene sequence, respectively. If
needed, the primary PCR mixture was diluted and used as template for the nested PCR
with the nested Adaptor Primer (AP2) and the same GSP or nested GSP. The resulting
PCR bands of amplified DNA fragments were gel band extracted, cloned and
sequenced.
II-3.4 cDNA template for amplification
The availability of a cDNA library was used for cDNA amplification purpose,
but for regular amplifications for cDNA sequence confirmation, a reverse transcribed
cDNA using the dT adaptor was chosen. The PCR reaction was always performed in a
final volume of 25 µl, including 0.4 µM of each primer, 0.05 mM of each nucleotide
and 1U Taq DNA Polymerase (Invitrogen). After an initial denaturation step (4 min at
94ºC), amplification was performed for 25 to 30 cycles (each cycle: 30 sec at 94ºC, 30

General Materials and Methods CHAPTER II
31
sec at oligonucleotide melting temperature, 30 sec at 72ºC) with a final elongation step
at 72ºC with time adjusted according to the amplicon size. Amplification of complete
ORFs, for example to prepare expression constructs, was always performed using
Advantage cDNA Polymerase (Clontech) because of its proofreading properties and
amplification of significantly longer fragments.
II-3.5 Genomic DNA as PCR template
To confirm gene sequences, genomic DNA was frequently used as template for
PCR amplifications. These reactions were performed using 0.4 µM of each primer, 0.05
mM of each nucleotide and 2 U Taq DNA polymerase (Invitrogen). After an initial
denaturation step (10 min at 95ºC), amplification was performed for 30 cycles (one
cycle: 1 min at 95ºC, 1 min at 62ºC, 2 min at 72ºC) with a final elongation step of 10
min at 72ºC.
II-3.6 Ligation of DNA fragments
The cDNA fragments extracted from gel bands using GFX PCR DNA and Gel
Band Purification Kit were ligated to the appropriate cloning vector, pGEM®-T Easy
(Promega, Madison, USA) or pCR-II TOPO (Invitrogen), following manufacture’s
instructions. Taq DNA polymerase yields fragments with A (Adenine) overhangs
facilitating the T/A cloning; when using Advantage cDNA Polymerase, and to improve
ligation efficiency into a T/A cloning vector, 10 µl of purified PCR product was
submitted to dATP addition by performing a 15 minutes PCR step with Taq DNA
Polymerase (Invitrogen).
II-4 Cloning before sequencing
DH5α cells (Invitrogen) were transformed with the ligation product and then
spread in agar plates together with 100 µl X-gal (20 mg/ml) and 5 µl IPTG (100
mg/ml). Individual transformants of DH5α carrying exogenous cDNA fragments (white

General Materials and Methods CHAPTER II
32
colonies), were grown in LB with ampicillin (100 µg/ml). Plasmid DNA was isolated as
described (Sambrook et al., 1989) and positive clones confirmed by EcoRI digestion,
before sequencing.
II-5 cDNA sequencing
Positive clones were sequenced to confirm their identity and obtain the DNA
sequence for analysis. The sequencing was mainly performed at Macrogen (Macrogen,
South Korea), although some sequencing was also performed at the Max Planck
Institute of Berlin, within the MGE (Marine Genomics Europe) platform, and more
recently at the Center of Marine Sciences (CCMar, University of Algarve, Faro)
sequencing laboratory.
II-6 In silico sequence analysis
In order to deduce some of the characteristics that may help the molecular
characterization of Perkinsus sp. genes and predicted the corresponding polypeptides, in
silico analysis was performed; first sequences chromatograms were checked using
available software Chromas lite 2.01 and further treatments were performed using in
silico tools available at EXPASY (http://www.expasy.org). The online servers allowed
analysis and predictions that permit construction of accurate and comprehensible
representative schemes.
II-6.1 Sequence characterization
DNA sequences (either cDNA or gDNA) and predicted encoded polypeptides
were, as a first step, cleaned of adaptors and vector sequences, and then submitted for
homology search using the online databases, (EST, genome or proteins), namely at the
National Center for Biotechnology Information (NCBI, http://www.ncbi.nlm.nih.gov).
EST cDNA sequences from the cDNA forward subtractive library were submitted at
BLASTx search (Basic Local Alignment Search Tool, (Altschul et al., 1997) to identify

General Materials and Methods CHAPTER II
33
homologies between the translated cDNA and sequences in the protein database. Gene
sequence homologies were carried on by performing nucleotide searches both at NCBI
and at TIGR, against the P. marinus genome sequences available
(http://www.tigr.org/tdb/e2k1/pmg). Sometimes the BLASTx of genomic DNA
sequences allowed the clarification of intron-exon frontiers. When possible, the
predicted polypeptide sequences were compared by homology with the protein database
through BLASTp search.
II-6.2 ORF prediction and cDNA structure
To predict the ORF (open reading frame), the full length cDNA was submitted
to ORF Finder (http://www.ncbi.nlm.nih.gov) to predict the corresponding polypeptide.
This was confirmed by comparison with other described proteins comparing with
available databases (BLASTx). The final schematic drawing of the cDNA molecular
structure, including 5’ and 3’ untranslated (UTR) regions and ORF was performed
using the software for translation of a sequence for publication available through the
computer system BIOINFO, developed by HKUCC (The University of Hong Kong
Computer Centre), HKU-Pasteur Research Centre and Centre de Resources
INFOBIOGEN (France), and skill sharing from Centre de Resources INFOBIOGEN
(France), based on the BIOSUPPORT project (http://bioinfo.hku.hk).
II-6.3 Definition of gene structure
The gene sequence obtained through the previously described methods was
compared with the cloned cDNA sequence in order to identify the corresponding gene
structure. Finding 100% identity between these sequences allowed the identification of
exons using the Align 2 sequence tool at National Center for Biotechnology Information
server (http://www.ncbi.nlm.nih.gov). Then the translation of a sequence for publication
tool (http://bioinfo.hku.hk), previously mentioned, allowed the representation of the

General Materials and Methods CHAPTER II
34
gene structure with the identification of intron-exon frontiers, as well as the position,
size and type of introns.
II-6.4 Promoter analysis
The promoter sequence was analysed for the presence of putative transcription
factor binding sites using the MatInspector at Genomatix Server
(http://www.genomatix.de).
II-6.5 Predicted polypeptide characterization
After the identification by homology search of the putative protein, diverse
analyses were performed. Sometimes, the BLASTp search allows the recognition of
conserved domains and polypeptide classification in the respective protein family
(http://www.ncbi.nlm.nih.gov). With the vector NTI software, used as laboratory
database, it was possible to infer the molecular weight, the isoelectric point and charge
at pH 7. For certain polypeptides it was possible to predict the existence of possible
post-translational modification (http://www.expasy.ch/tools/), namely the signal peptide
(SignalP) as well as the hypothetical location of the predicted encoded proteins using
ChloroP to predict chloroplast transit peptides, MITOPROT for mitochondrial targeting
sequences and PATS for apicoplast targeted sequences. In the case of putative
membrane proteins it was possible to estimate the presence of transmembrane helices
(TMHMM) and compare it with the prediction of transmembrane regions and protein
orientation (TMpred). All proteomic tools used are available at ExPASy web site
(http://www.expasy.ch/tools/).
II-7 Gene expression analysis by northern blot, macroarray and Real-time qPCR
When parasite was exposed in vitro to various conditions the expression of
particular genes of interest was assessed with cDNA macroarray technology, which can
provide a rough measure of numerous genes expression profile. Results were confirmed

General Materials and Methods CHAPTER II
35
by using northern blotting and/or a more sensitive and more accurate gene expression
measurement, the analysis by Real-time qPCR.
II-7.1 Northern blot analysis
Gene expression was initially evaluated by Northern Blot analysis (Sambrook et
al., 1989). Five to ten µg of total RNA extracted from P. olseni cells to which different
environmental stress simulated conditions were applied, were size fractionated by
electrophoresis on a 1% agarose formaldehyde-containing gel and transferred onto a
HybondTM-XL nylon membrane (Amersham Biosciences, UK) by a capillary method
(Sambrook et al., 1989). The resulting blot was pre-hybridized at 42ºC in 10ml of
ULTRAhyb buffer for 1h. The DNA probe was labelled with α32P-dCTP using
RediPrimeTM II Kit (Amersham Pharmacia Biotech) and column purified from
unincorporated nucleotides with a MicroSpinTM S.200 HR column (Amersham
Pharmacia Biotech). The labelled probe was added to the prehybridization solution and
incubated overnight with the membrane, under the same conditions described for
prehybridization. Blots were then washed twice in 2xSSC (1xSSC:150mM NaCl,
15mM sodium citrate pH 7.0), 0.1% SDS at 42ºC for 5min and twice in 0.1xSSC,
0.1%SDS at 42ºC for 15min. Autoradiography was performed using Kodak BioMax
MS film (Kodak, USA) at -80ºC. Two independent hybridizations were performed and
at least three exposure times were developed per experiment.
II-7.2 Real-time qPCR expression quantification
Real-time qPCR was used to quantify expression of selected genes. Total RNA
isolated from treated and control P. olseni cells were used for expression analysis using
Real-time qPCR. First-strand synthesis was performed using 1µg of total RNA treated
with RQ1 RNase-Free DNase (Promega), gene specific reverse oligonucleotides
(Appendix II-1) and M-MLV reverse transcriptase. Real-time qPCR was performed in

General Materials and Methods CHAPTER II
36
an iCycler iQ system (Bio-Rad, Richmond, USA) using GSP primer sets (Appendix II-
1) for the genes in study. Each reaction was prepared by adding 2 µl of a 1:10 cDNA
dilution to reaction mix containing 0.5 µM of each primer and 10 µl of iQ SYBR green
Supermix, in a final volume of 20 µl. After some experiments iQ SYBR green
Supermix was substituted by ABsoluteTM Q PCR SYBR Green Flurescein mix
(ABgene, Surrey, UK), but the reaction and amplification conditions were optimized to
keep the same conditions. The qPCR program contained an initial cycle of 10 min at
95ºC and 60 cycles comprising an initial denaturation step at 95ºC for 30 sec, followed
by annealing and extension at 68ºC for 20 sec. The fluorescence was measured at the
end of each extension cycle in the FAM-490 channel. Relative levels of expression were
determined by comparing results of treatments with results obtained with control cells.
All experiments were performed at least twice, and with at least duplicate wells.

Parasite Host-Response CHAPTER III
CHAPTER III – PARASITE HOST-RESPONSE
“During the past years, functions have been discovered for several genes that were
previously of unknown function” by Karen Joy Shaw (2002) Pathogen Genomics Impact
on Human Health, Humana Press

Parasite Host-Response CHAPTER III
38
III-1 Introduction
The protozoan pathogen Perkinsus atlanticus (Azevedo, 1989b), recently
considered synonymous of P. olseni (Murrell et al., 2002), is the causative agent of
perkinsosis, a severe disease that affects the grooved carpet shell clam Ruditapes
(Tapes) decussatus (Linnaeus, 1758) and can be emphasized under certain
environmental conditions. Similarly, on the East Coast of the United States, P. marinus,
a parasite from the same genus, is responsible for devastating the populations of oyster
C. virginica (Burreson and Ragone Calvo, 1996) but the molecular mechanisms
underlying the pathogenicity of Perkinsus sp. were described to be poorly understood
(Anderson et al., 1996). Lately several studies have been published aiming at further
exploring these mechanisms. Biochemical analyses have shown the involvement of
parasite-associated extra-cellular proteins (ECP), especially proteases, in the
pathogenicity of P. marinus (Oliver et al., 1999), and more recently the P. marinus
serine protease gene, correlated with virulence / pathogenicity was described (Brown
and Reece, 2003), but much remains to be unveiled concerning the parasite molecular
responses to its host.
P. marinus karyotype has been resolved and its genome size was estimated by
CHEF gels indicating at least 28 Mb (http://www.tigr.org); this genome size value was
recently confirmed for P. olseni (Teles-Grilo et al., 2007a) and the karyotype was
determined (Teles-Grilo et al., 2007a). A preliminary sequence analysis of the P.
marinus genome from Celera Assembler was obtained through a whole genome shotgun
strategy using the strain (PmCV4CB5 2B3 D4) isolated from an infected oyster from
Bennet Point (Maryland, USA) and was released in May 2004
(http://www.tigr.org/tdb/e2k1/pmg/). This release contained the first contigs derived
from 163,052 sequences (mean length of 861 nt), and was not annotated. More recently,

Parasite Host-Response CHAPTER III
39
large insert cDNA library EST were released (Robledo et al., unpublished) completing
31,696 EST available in the GeneBank (http://www.ncbi.nlm.nih.gov/). Nevertheless, to
better comprehend the parasite answer to its host, the transcriptome must also be
studied.
Several strategies are available for analysis of differential gene expression at the
whole genome scale, each of them claiming specific advantages. However, and although
less discussed, they also have intrinsic disadvantages. Differential display approaches
(Liang et al., 1994) have been used for the less complex genomes but are also suitable
for those showing higher levels of complexity, ranging from prokaryotes to eukaryotes,
and including symbiontic interacting organisms such as Azorhizobium caulinodans and
Sesbania rostrata (Lievens et al., 2001). Microarray techniques (Heller, 2002) have
evolved lately, being a useful tool for differential gene expression and providing a large
pool of information useful to better comprehend host-parasite interactions (Koltai and
Weingarten-Baror, 2008). This technology is expensive and its use is frequently limited
to the most standardized models, for which an annotated genome is already available. In
contrast, the Suppression Subtractive Hybridization (SSH) method does not require
previous knowledge of the genome but in this case highly efficient methods for gene
identification are required to perform genome annotations and molecular
characterization of microbiological systems not yet fully characterized, like in the
unicellular mollusc parasite P. olseni. In SSH, subtraction and normalization are
performed simultaneously (Mahalingam et al., 2003) thus equalizing abundance of
target cDNAs in the subtracted population (Diatchenko et al., 1996). To decrease the
number of background clones in the libraries generated by SSH, a Mirror Orientated
Selection procedure (MOS) (Rebrikov et al., 2000) was developed although “false
positive” clones are not fully eliminated due to simultaneous use of PCR amplification.

Parasite Host-Response CHAPTER III
40
In the present work a cDNA forward subtraction library was constructed for
transcriptome analysis of the parasite exposed to hemolymph from its natural host, the
clam R. decussatus. Two different methodologies were used to uncover different non
redundant contigs correspondent to parasite up-regulated genes. Gene ontology was
used for characterization of the molecular function of the identified genes in order to
compare results obtained by these two different SSH approaches. The results allowed
identification of numerous and diverse parasite genes up-regulated in response to the
presence of its host hemolymph.
III-2 Specific materials and methods
III-2.1 Differentially up-regulated genes (SSH)
Although there are several different methods, the basic theory behind subtraction
hybridization is simple and a powerful technique for identification of cDNAs that refer
to specific transcripts expressed in a given condition (differentially expressed). Briefly,
this technique enables to compare two populations of mRNA and identify genes
differentially expressed by the two populations. Tester and driver cDNAs are
hybridized, and the hybrid sequences, corresponding to transcripts present in both
conditions under comparison are removed due to linear amplification. Consequently, the
remaining unhybridized cDNAs represent genes that were expressed in the tester, but
are absent from the driver mRNA and thus were amplified exponentially. In this work,
SSH was performed using the PCR Select™ cDNA Subtraction Kit (Clontech
Laboratories Inc., Palo Alto, CA), following the protocol recommended by the
company.

Parasite Host-Response CHAPTER III
41
III-2.1.1 Parasite challenge
The P. olseni log phase cell culture, previously expanded and grown in 100 ml
volumes at 28ºC, under shaking of 118 rpm for 2 days, was collected and centrifuged
for 6 minutes at 2,000 rpm, to reduce medium volume and then treatments were applied.
The parasite host-challenged condition was performed by incubating the parasite cells
exposed to host hemolymph for six hours using transwells (Costar, Cambridge, MA), as
exemplified in the scheme (Figure III-1). 100 ml P. olseni cell culture was submitted to
the same procedure but in absence of host hemolymph.
Figure III- 1 Schematic representation of P. olseni cells (Po) exposure to bivalve hemolymph (He) in vitro performed in 24-wells plates (A, B). Concentrated P. olseni culture was placed in each well (A2, B2) and the hemolymph applied on the 0.4 µm filter (A3).
III-2.1.2 P. olseni host response subtractive cDNA library construction
Clontech PCR-SelectTM cDNA Subtraction was the methodology used, based on
selective amplification of differentially expressed sequences, which overcomes
technical limitations of traditional subtraction methods (Diatchenko et al., 1996). For
Poo
Poo
Heo

Parasite Host-Response CHAPTER III
42
both cell culture conditions the respective mRNA populations were converted into
cDNA: (i) the “parasite host-response” cDNA that contains differentially expressed
transcripts made from mRNA of challenged P. olseni cell culture with host hemolymph,
designated as tester, and (ii) the “normal” cDNA from mRNA of unchallenged cells,
designated as driver. The final PCR mixture was enriched for differentially expressed
cDNAs. In addition, differentially expressed transcripts that varied in abundance in the
original mRNA sample should now be present in roughly equal proportions.
cDNA synthesis and RsaI digestion
First strand was synthesized with 1 µl cDNA synthesis primer (10 µM, Clontech)
in a mixture containing 1 µg of host-challenged and normal mRNA, 1 µl of dNTP Mix
(10 µM), 1 µl of AMV reverse transcriptase (20 U), 2 µl of 5× first strand buffer in a
final volume of 10 µl at 42ºC for 1.5 h. Then, second strand synthesis was carried out
using 10 µl first strand reaction volume, 4 µl of 20× second strand enzyme cocktail,
48.4 µl of sterile water, 1.6 µl of dNTP Mix (10 µM), 16 µl 5× second strand buffer
solution for 2 h at 16ºC. Polymeric reaction was performed at 16ºC for 0.5 h after 2 µl
(6 U) of T4 DNA polymerase was added into the above reaction volume. The second
strand synthesis was terminated adding 4 µl of 20× EDTA/Glycogen Mix (Clontech).
After was performed phenol:chloroform:isoamyl alcohol (25:24:1) phase separation and
chloroform:isoamyl alcohol (24:1) second extraction, and 4 M NH4OAc and 95 %
ethanol precipitation. The double stranded cDNA pellet was washed in 80 % ethanol, air
dried and dissolved in 50 µl of sterile H2O. Before digestion, 6 µl of undigested cDNA
was kept for prior agarose/EtBr gel electrophoresis analysis. The cDNA was digested
with 1.5 µl of RsaI (10 U) in a final volume of 50 µl at 37ºC for 1.5 h. Enzyme
digestion was terminated by adding 2.5 µl 20× EDTA/Glycogen Mix. After extraction
and precipitation of digested cDNAs, the pellet was washed in 80% ethanol, air dried
and dissolved in 5.5 µl of sterile water.
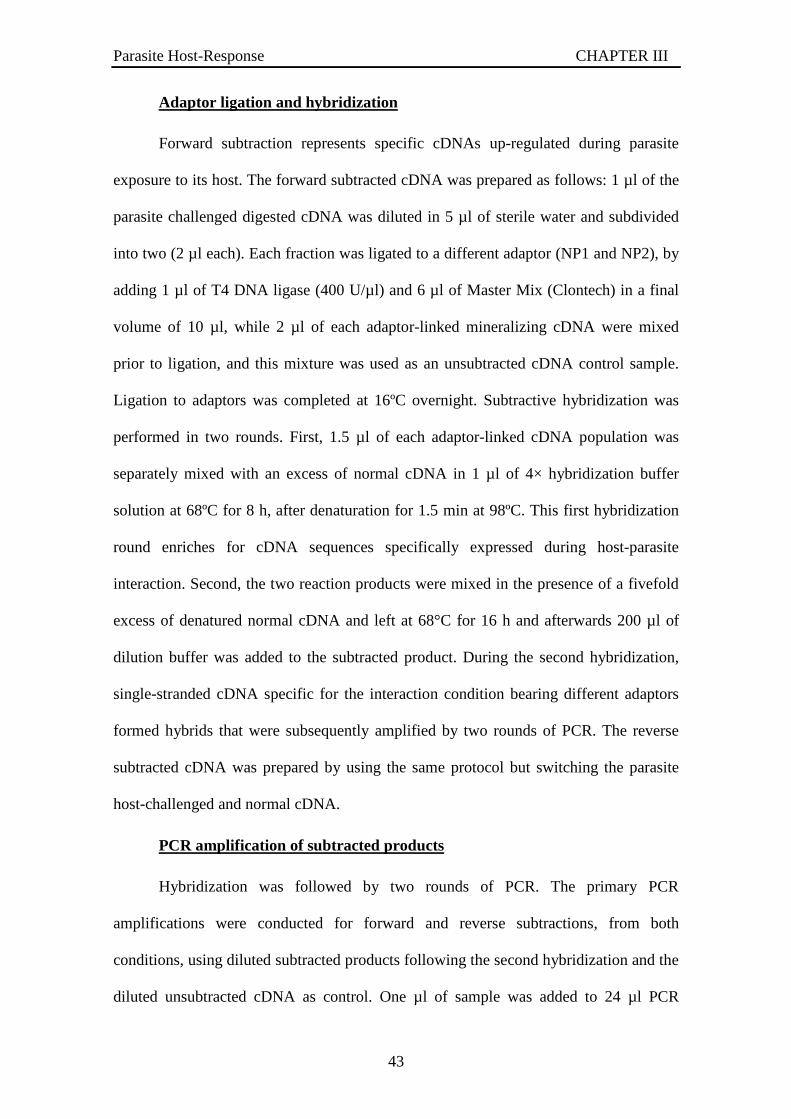
Parasite Host-Response CHAPTER III
43
Adaptor ligation and hybridization
Forward subtraction represents specific cDNAs up-regulated during parasite
exposure to its host. The forward subtracted cDNA was prepared as follows: 1 µl of the
parasite challenged digested cDNA was diluted in 5 µl of sterile water and subdivided
into two (2 µl each). Each fraction was ligated to a different adaptor (NP1 and NP2), by
adding 1 µl of T4 DNA ligase (400 U/µl) and 6 µl of Master Mix (Clontech) in a final
volume of 10 µl, while 2 µl of each adaptor-linked mineralizing cDNA were mixed
prior to ligation, and this mixture was used as an unsubtracted cDNA control sample.
Ligation to adaptors was completed at 16ºC overnight. Subtractive hybridization was
performed in two rounds. First, 1.5 µl of each adaptor-linked cDNA population was
separately mixed with an excess of normal cDNA in 1 µl of 4× hybridization buffer
solution at 68ºC for 8 h, after denaturation for 1.5 min at 98ºC. This first hybridization
round enriches for cDNA sequences specifically expressed during host-parasite
interaction. Second, the two reaction products were mixed in the presence of a fivefold
excess of denatured normal cDNA and left at 68°C for 16 h and afterwards 200 µl of
dilution buffer was added to the subtracted product. During the second hybridization,
single-stranded cDNA specific for the interaction condition bearing different adaptors
formed hybrids that were subsequently amplified by two rounds of PCR. The reverse
subtracted cDNA was prepared by using the same protocol but switching the parasite
host-challenged and normal cDNA.
PCR amplification of subtracted products
Hybridization was followed by two rounds of PCR. The primary PCR
amplifications were conducted for forward and reverse subtractions, from both
conditions, using diluted subtracted products following the second hybridization and the
diluted unsubtracted cDNA as control. One µl of sample was added to 24 µl PCR

Parasite Host-Response CHAPTER III
44
master mix prepared using the reagents supplied in the kit and cycling conditions
commenced as follows: 75°C for 5 min to extend the adaptors; 94°C for 25 sec; and 25
cycles at 94°C for 10 sec, 66°C for 30 sec, and 72°C for 1.5 min. Amplified products
were diluted 10 fold in sterile water and 1 µl of diluted primary PCR products were
added to 24 µl of secondary PCR master mix containing nested primers, NP1 and NP2R
using Advantage cDNA polymerase (Clontech), to ensure specific amplification of
double-stranded templates containing both adaptors. Considering the amount of
amplification of the first PCR, 10 cycles for secondary PCR were performed at 94°C for
10 sec, 68°C for 30 sec and 72°C for 1.5 min. Primary and secondary PCR products
were analyzed on a 2% agarose ethidium bromide gel.
III-2.1.3 Construction of the Direct forward cDNA subtractive library (Dfsl)
To target diverse up-regulated genes, P. olseni SSH cDNA forward subtractive
library was constructed using the PCR-SELECT cDNA Subtraction Kit (Clontech). Ten
µl of forward subtractive library PCR mixture was then submitted to dATP addition by
performing a 15 min PCR step with DNA polymerase (Invitrogen, Carlsbad, USA) to
improve T/A ligation efficiency into TOPO cloning vector (Invitrogen). The forward
subtractive library, consisting of cDNA fragments ligated into pCRII-TOPO, was used
to transform DH5α cells (Invitrogen) which were subsequently grown in agar plates
(144 cm2) with 100 µl X-gal (20 mg/ml) and 5 µl IPTG (100 mg/ml). To perform the
screening, the library was transferred to HybondTM-XLfilters (Amersham Biosciences,
Piscataway, USA) by bacterial plate lifts (Sambrook et al., 1989). Duplicate filters were
prepared for each master plate.
III-2.1.4 Construction of the enriched forward MOS library (efMOSl)
Mirror oriented selection (MOS) technique was performed in order to enrich the
library with differentially expressed genes (Rebrikov et al., 2000). Briefly, PCR product

Parasite Host-Response CHAPTER III
45
was purified using the GFX column PCR DNA clean (Amersham Biosciences) and
ressuspended in TE buffer (pH 8); 5 µl of this purified product was then XmaI-digested
(New England Biolabs, Ipswich, USA) to remove the NP1 adaptor and 1 µl of the 15 µl
of digestion inactivated product was denatured 1.5 min. at 98ºC and then hybridized for
12 h at 68ºC. One µl of a 40x dilution of hybridization product was used for PCR
amplification and 1 µl of the resulting product was inserted into the T/A cloning vector
pGEM®-T Easy (Promega, Madison, USA). Individual transformants of DH5α, carrying
exogenous cDNA fragments, were isolated from selected white colonies on X-gal/IPTG
agar plates, as previously described, being stored arrayed in 10 plates of 96-well format.
For screening, the 96-well plate MOS library clones grown in liquid LB were spotted (3
µl per spot) in duplicate membranes and processed by bacterial dot blot as described
(Fonseca et al., 2005).
III-2.1.5 Identification of differentially up-regulated genes
Differential screening was performed by double filter hybridization. After
digestion and neutralization in situ, each membrane was hybridized with a probe
consisting on the pool of cDNAs (i.e. the products of the second PCR) obtained in each
subtractive library (forward or reverse). These complex probes were carefully
synthesized by PCR. Briefly, four tubes of either forward or reverse subtracted
secondary PCRs were combined and purified using GFX column PCR DNA clean
(Amersham Biosciences) according to manufacturer instructions, reducing the volume
to 24 µl to concentrate the probes to 50 ng. Afterwards, removal of the adaptors was
performed by digesting first with RsaI (10 U) and EaeI (10 U) for 2 h at 37ºC and
secondly with SmaI (10 U) for 2 h at room temperature (New England Biolabs).
Separation was made through electrophoresis and DNA was recovered from the gel
band using Gel Band Purification KIT (Amersham Biosciences). Adaptor-free cDNAs

Parasite Host-Response CHAPTER III
46
from forward and reverse subtractions were radiolabeled with α-32P dCTP using the
random prime labeling kit (RediprimeTM II, Amersham Biosciences) and purified by
spin filtration (MicrospinTM S.200 HK columns, Amersham Biosciences), according to
manufacturer instructions. Pre-hybridization and hybridization using UltraHyb solution
(Ambion, Austin, USA) were carried out at 42ºC. Membranes were then washed twice
in 1x SSC, 0.1% SDS at 42ºC for 5 min, followed by two 10 min washes in a more
stringent solution (0.1x SSC, 0.1% SDS) at 42ºC. Autoradiography was performed with
Kodak X-Omat AR film. The impressed signals were quantified by densitometry
(QuantityOne, BioRad, Richmond, USA). Naked eye analysis was also performed.
DNA fragments in dots showing more than twofold difference in impressed signal
strength were further processed for sequence analysis.
III-2.2 In silico data analysis for gene characterization
Gene ontology annotation of the efMOSl library clones was performed after
removal of vector sequence and correction of obvious reading errors, using VecScreen
(http://www.ncbi.nlm.nih.gov), through GOblet server (http://goblet.molgen.mpg.de).
On the other hand, the Dfsl EST sequences were trimmed against the vector and
adaptors using the contig program included in Vector NTI (Invitrogen), and submitted
to GOblet (http://goblet.molgen.mpg.de). Sequence characterization used a format based
on server instructions (Groth et al., 2004), defining E value <1x10⁻¹ as cutoff value. The
information selected was the GO hits in the molecular function categories and
subcategories. Homology search against NCBI protein database (BLASTx) was
performed and protein hits and significance values recorded
(http://www.ncbi.nlm.nih.gov). A search of each hit function was performed in the
pathway maps for biological processes server of Kyoto Encyclopedia of Genes and

Parasite Host-Response CHAPTER III
47
Genomes (KEGG, http://www.genome.jp/kegg/). A BLASTn search was also
performed against P. marinus genome data base (http://www.tigr.org/tdb/e2k1/pmg/).
III-3 Results and Discussion
SSH analysis was used to uncover numerous and diverse parasite up-regulated
genes in response to its host hemolymph, permitting a better understanding of parasite
molecular host-response and supplementary information for eventual genome
annotation.
II-3.1 How to characterize the protozoan mollusc parasite transcriptome?
There are reports that certain pathogen genes are specifically expressed only
after host infection by the parasite (Kuboki et al., 2007). To identify genes differentially
expressed by the protozoan parasite P. olseni, upon challenge with its host hemolymph,
the SSH approach was chosen. For this, poly A+ RNA was purified from P. olseni cells
in culture and cells exposed to its host R. decussatus hemolymph, thus becoming the
driver and tester, respectively, for forward subtracted cDNA library construction.
The parasite library construction was followed step by step: (i) the expected
smear of cDNA was checked before and after RsaI digestion (Figure III-2A); (ii) the
products from first and second PCR, optimized to 10 cycles, were fractioned to confirm
the presence of cDNA smear (Figure III-2B). This direct approach of cDNA subtractive
library was designated direct forward subtractive library (Dfsl), where the second PCR
was directly cloned as described in materials and methods. In parallel, the reverse
cDNA subtractive library was also constructed and each step verified as well. Because
SSH has been described to originate false differentially expressed genes, the MOS
methodology was used to attempt to eliminate these false positives from the SSH-
generated libraries, which represents the non-differentially expressed genes (Rebrikov et
al., 2000), originating an enriched library (Figure III-2C) called enriched (efMOSl).

Parasite Host-Response CHAPTER III
48
Dfsl and efMOSl allowed the identification of 96 and 204 over-expressed clones,
respectively.
Figure III- 2 cDNA subtractive library construction: tester and driver cDNA before and after digestion with RsaI restriction enzyme (A) and PCR amplification of forward subtracted library, first and second PCR amplification results (B). MOS of the cDNA subtractive library: forward and reverse library PCR products fractionation after enrichment using MOS (C).
A similar SSH strategy was followed to test the hypothesis that African
trypanosomes could have in vivo specific genes for adaptation to host’s environment,
but in the order Kinetoplastida some genes are expressed polycistronically, and
regulated at post-transcriptional level. 328 clones were identified from the in vivo
library and 160 clones from the in vitro SSH library were analyzed, but none of the
genes showed differential expression (Kuboki et al., 2007).
III-3.2 Which SSH approach was more profitable?
The two different SSH-based approaches (efMOSI and DfsI) were tested in
parallel to determine which more profitable and allowed identification of a bigger set of
differentially expressed genes from the parasite P. olseni, in response to the presence of
A B C
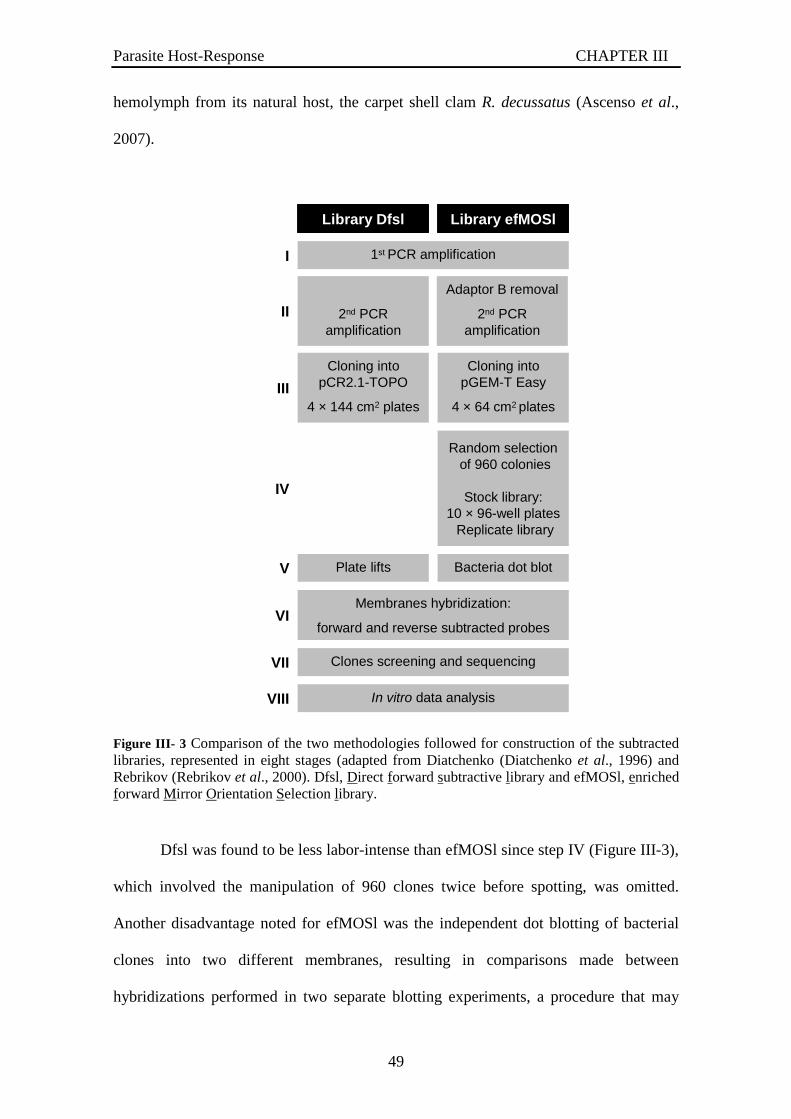
Parasite Host-Response CHAPTER III
49
hemolymph from its natural host, the carpet shell clam R. decussatus (Ascenso et al.,
2007).
Library efMOSlLibrary Dfsl
Random selectionof 960 colonies
Stock library:10 × 96-well plates
Replicate library
Plate lifts Bacteria dot blot
Membranes hybridization:
forward and reverse subtracted probesVI
VII
In vitro data analysis
Clones screening and sequencing
VIII
I
II
III
V
IV
Adaptor B removal
2nd PCR amplification
2nd PCR amplification
1st PCR amplification
Cloning into pGEM-T Easy
4 × 64 cm2 plates
Cloning into pCR2.1-TOPO
4 × 144 cm2 plates
Figure III- 3 Comparison of the two methodologies followed for construction of the subtracted libraries, represented in eight stages (adapted from Diatchenko (Diatchenko et al., 1996) and Rebrikov (Rebrikov et al., 2000). Dfsl, Direct forward subtractive library and efMOSl, enriched forward Mirror Orientation Selection library.
Dfsl was found to be less labor-intense than efMOSl since step IV (Figure III-3),
which involved the manipulation of 960 clones twice before spotting, was omitted.
Another disadvantage noted for efMOSl was the independent dot blotting of bacterial
clones into two different membranes, resulting in comparisons made between
hybridizations performed in two separate blotting experiments, a procedure that may

Parasite Host-Response CHAPTER III
50
introduce experimental and/or interpretation errors. In addition, the screening procedure
was simpler for eight Dfsl membranes then for twenty efMOSl bacteria dot blots
(Figure III-3). Furthermore, in silico analysis of the efMOSl-derived cDNA sequences
required individual cleaning from pGEM®T-easy vector sequence contamination prior
to storage in local database. In contrast, all Dfsl-derived cDNA sequences were
trimmed together in one single bioinformatics step, much less labor intensive. These
results were compiled into a short note (Ascenso et al., 2007) aiming at improving the
detection of differentially expressed genes (Appendix III-1 and Appendix III-2) quickly
and cost efficiently from non-standard models as the mollusc parasite, P. olseni.
III-3.3 Which SSH approach was more efficient in terms of GO diversity?
After cloning the two forward libraries, Dfsl and efMOSl, they were screened
and selected for genes up-regulated at least twice.
Table III- 1 GO analysis of molecular function determined using the GOblet server.
Two hundred and four clones were identified, sequenced and analyzed in silico
(Appendix III-3 and III-4) using Gene Ontology (GO) at Goblet server. The two
different SSH-based approaches (efMOSI and DfsI) were compared to determine which
one was more efficient and less redundant in the identification of parasite differentially
expressed genes in response to the presence of hemolymph from carpet shell clam. In
Library Dfsl efMOSl
Sequenced cDNA 96 204
Goblet submitted 96 108
GO subclasses 25 6
GO molecular function hit 44 21
No GO match 52 87

Parasite Host-Response CHAPTER III
51
the Dfsl procedure, all colonies were present in both replica filters through plate lifts
and for filter hybridization (Appendix III-1). Screening analysis was also more efficient
for Dfsl since 100% of the 96 clones selected resulted in useful sequences; while from
the 204 clones selected from efMOSl (Appendix III-2), resulted in only 108 quality
sequences (Table III.1, Ascenso et al., 2007).
Figure III- 4 Subtractive library cDNA fragments analysed. Distribution of the cloned cDNA fragments from each subtractive library, according to the sequence length for Direct forward subtractive library (Dfsl) and enriched forward MOS subtractive library efMOSl).
According to cDNA fragments size obtained, efMOSl presented a majority of
sequences ranging in size from 160 to 179nt, most corresponding to the same EST. On
the other hand, the Dfsl presented a much broader size distribution, from 240 to 800nt
(Figure III-4). The 96 cDNA sequences of Dfsl library were classified according to GO
(e-value of 0.1 of homology at GOblet server) in 27 different subcategories of molecular
functions (45.8% ESTs matched, Figure III-5). The diversity obtained was 61%. In
contrast, from the 204 clones selected by efMOSl, only 108 resulted in quality
sequences, allowing the identification of 6 different GO function subcategories (10.3%
ESTs matched, Figure III-5). The diversity obtained in terms of GO, was 2.1x higher in
Length of ESTs
Nu
mb
er o
f E
ST
s
0
10
20
30
40
50
60
70
80
90
100
40 120 200 280 360 440 520 600 680 760 840 920 1000
efMOSl
Dfsl

Parasite Host-Response CHAPTER III
52
Dfsl compared to efMOSl, corresponding to 4.2x increase in number of GO categories
in Dfsl compared to efMOSl.
There are few comparisons of SSH and MOS, but Lathia and collaborators
compared the results obtained in cDNA libraries derived from the spinal cord with those
derived from the visual cortex. This resulted in an overall representation of repeated
sequence reduction from 38 in SSH libraries to 22 in MOS libraries which makes this
procedure marginally useful in these complex subtractions. Although it was quite visible
a reduction in the diversity obtained by Lathia and collaborators, this comparison was
not specifically analysed. In that work, two libraries were compared in terms of SSH
and MOS approaches; resulting in a higher number of genes identified in the library
named 4-SSH than in the 4-MOS (Lathia et al., 2006), similarly to what was obtained
for P. olseni host-response libraries. This shows that MOS libraries result in larger
number of differentially expressed clones, but it is also more redundant in terms of
identity of genes obtained, associated with the second PCR performed in MOS
technique used for false positive elimination, a result that is in agreement with our data
(Ascenso et al., 2007).
III-3.4 Which parasite genes are up-regulated in response to host?
The 300 ESTs corresponding to the subtracted transcriptome (204 from efMOSl
and 96 from Dfsl) were further analysed on a Gene Ontology (GO) search engine. The
most represented molecular function class in clones obtained from the Dfsl approach
was binding activity (32% with 14 out of 44 different ESTs obtained). Altogether, the
forty four sequences matched the following GO molecular function categories: binding,
catalytic, transporter, chaperone activity, signal transducer, structural function,
transcription and translation activities (Figure III-5). 14 ESTs corresponding to binding
activity hits represented 7 different subclasses, indicating a higher diversity (Figure III-

Parasite Host-Response CHAPTER III
53
5) than with efMOSI, while for the GO class of catalytic activity; the resulting positive
16 ESTs were distributed into only two sub-classes (Figure III-6).
chap
ero
ne
transporter
translation
transcription
stru
ctura
l
mole
cule
sig
nal
tran
sdu
cer catalytic activity
binding activity
1
2
3
4
5
6
7
8
910
1112131415
16
18
20
21
22
23
24
2526 27
Dfslch
aper
on
e
transporter
translation
transcription
stru
ctura
l
mole
cule
sig
nal
tran
sdu
cer catalytic activity
binding activity
1
2
3
4
5
6
7
8
910
1112131415
16
18
20
21
22
23
24
2526 27
Dfsl
1 DNA binding (9,1%)
2 RNA binding (11,4%)
3 transcription factor binding (2,3%)
4 transition ion binding (2,3%)
5 purine nucleotide binding (2,3%)
6 cytoskeletal protein binding (2,3%)
7 androgen binding (2,3%)
8 ATP-dependent helicase activity (4,5%)
9 carbon-carbon lyase (2,3%)
oxidoreductase (2,3%)10
11 hydrolase on carbon-nitrogen bond (2,3%)
12 peptidase activity (2,3%)
13 forming carbon-nitrogen bonds (2,3%)
15 transferring one-carbon group (2,3%)
16 transmembrane receptor (4,5%)
18 ribosome structural molecule (15,9%)
20 transcription factor activity (4,5%)
21 translation initiation factor (2,3%)
transferring acyl groups (2,3%)14
22 translation termination factor (2,3%)
23 amino acid transporter (4,5%)
24 electrochemical transport (2,3%)
25 electron transporter (6,8%)
26 cation transporter activity (2,3%)
27 heat-shock protein activity (2,3%)
1 DNA binding (9,1%)1 DNA binding (9,1%)
2 RNA binding (11,4%)2 RNA binding (11,4%)
3 transcription factor binding (2,3%)3 transcription factor binding (2,3%)
4 transition ion binding (2,3%)4 transition ion binding (2,3%)
5 purine nucleotide binding (2,3%)5 purine nucleotide binding (2,3%)
6 cytoskeletal protein binding (2,3%)6 cytoskeletal protein binding (2,3%)
7 androgen binding (2,3%)7 androgen binding (2,3%)
8 ATP-dependent helicase activity (4,5%)8 ATP-dependent helicase activity (4,5%)
9 carbon-carbon lyase (2,3%)9 carbon-carbon lyase (2,3%)
oxidoreductase (2,3%)10 oxidoreductase (2,3%)10
11 hydrolase on carbon-nitrogen bond (2,3%)11 hydrolase on carbon-nitrogen bond (2,3%)
12 peptidase activity (2,3%)12 peptidase activity (2,3%)
13 forming carbon-nitrogen bonds (2,3%)13 forming carbon-nitrogen bonds (2,3%)
15 transferring one-carbon group (2,3%)15 transferring one-carbon group (2,3%)
16 transmembrane receptor (4,5%)16 transmembrane receptor (4,5%)
18 ribosome structural molecule (15,9%)18 ribosome structural molecule (15,9%)
20 transcription factor activity (4,5%)20 transcription factor activity (4,5%)
21 translation initiation factor (2,3%)21 translation initiation factor (2,3%)
transferring acyl groups (2,3%)14 transferring acyl groups (2,3%)14
22 translation termination factor (2,3%)22 translation termination factor (2,3%)
23 amino acid transporter (4,5%)23 amino acid transporter (4,5%)
24 electrochemical transport (2,3%)24 electrochemical transport (2,3%)
25 electron transporter (6,8%)25 electron transporter (6,8%)
26 cation transporter activity (2,3%)26 cation transporter activity (2,3%)
27 heat-shock protein activity (2,3%)27 heat-shock protein activity (2,3%)

Parasite Host-Response CHAPTER III
54
Figure III- 5 GO results for Dfsl. The classes and subclasses are represented according to GO molecular function category of GOblet tool and the area is proportional to EST sequence number. Dfsl, Direct forward subtractive library.
catalytic activity
obsolete
function
structu
ral
mo
lecule
bin
din
g a
ctiv
ity
4
11
14
17
1819
efMOSl
catalytic activity
obsolete
function
structu
ral
mo
lecule
bin
din
g a
ctiv
ity
4
11
14
17
1819
efMOSl
14
cell adhesion molecule activity (9,5%)17
transition ion binding (4,8%)4
ribosome structural molecule (4,8%)18
extracellular molecule constituent (4,8%)19
transfering acyl groups (9,5%)
hydrolase acting on carbon bonds (66,7%)11
Figure III- 6 GO results for efMOSl. The classes and subclasses are represented according to the molecular function category of GOblet tool and the area is proportional to EST sequence number. efMOSl, enriched forward Mirror Orientation Selection library.
In contrast, in data resulting from efMOSl approach, only twenty one sequences
were included in the GO categories of molecular functions, including binding, catalytic
activities, structural and obsolete function (Figure III-6). A total of 139 sequences
presented no match with GO molecular function in both libraries (Table III-1), being
designated as hypothetical. A percentage of hypothetical or unknown genes have also
been obtained in similar studies performed in other microorganisms as also other
categories of gene function associated with host-pathogen interaction. In Escherichia

Parasite Host-Response CHAPTER III
55
coli, several pathogenic genes were identified by selective capture of transcribed
sequences such as putative adhesins, lipopolysaccharide core synthesis, iron-responsive,
plasmid- and phage-encoded genes, are specifically expressed in response to host
(Dozois et al., 2003). In another a study using the protozoan parasite Trypanosoma
brucei gambiense, the SSH technique resulted in 328 clones arbitrarily picked up from
the in vivo library and 160 from the in vitro library resulting in 36 and 5 differentially
expressed unique genes, respectively. Based on homology to genes in the DNA
database, results from both in vivo and in vitro libraries resulted in nearly half as
unknown genes, the remaining belonging essentially to the categories of ribosomal
protein genes, RNA binding/transcription protein genes, protease genes, other functional
genes and conserved protein genes (Kuboki et al., 2007).
Altogether, and despite the lack of information on unicellular parasite genomes,
the results obtained allow a progressive unveiling of parasites transcriptome
contributing for a better understanding of host-parasite interaction. Furthermore, the
homology found among genes belonging to the various parasites genomes and present
in the various available databases helps to infer a molecular characterization of parasite
host-response.
III-3.5 Was diversity observed also evident through BLASTx protein hits?
Not all genes could be annotated. Those genes sharing similarities to known
proteins were named according to their database hits. Genes without significant peptide
similarity but with EST similarity were named as 'unknown' proteins. Genes without
protein or EST similarity are annotated as 'hypothetical' proteins.
The Perkinsus diversity was confirmed by individual BLASTx analysis,
resulting in 82 different hits were obtained from Dfsl (Appendix III-5 and III-7), while
27 singular hits out of the 108 tested from efMOSl (Appendix III-6 and III-8). As for

Parasite Host-Response CHAPTER III
56
GO, the BLASTx analysis resulted in an evident higher diversity in protein homology
hits for Dfsl (3x) compared to efMOSl. Based on the BLASTx homology hit results and
taking into account the organism hit, for efMOSl the majority of the clones (n=53,
representing 48% of total clones) were homologous to Protists while for Dfsl 32%
corresponded to Protist kingdom (Figure III-7).
Table III- 2 BLASTx analysis of P. olseni ESTs determined using the NCBI website.
27
95
109
204
82
6
90
96
efMOSl NCBI BLAST x results
ESTs sequenced
ESTs with hit
ESTs with no hit
BLASTx hits
BLASTx hits
ESTs with no hit
ESTs with hit
ESTs sequenced
Dfsl NCBI BLAST x results
27
95
109
204
82
6
90
96
efMOSl NCBI BLAST x results
ESTs sequenced
ESTs with hit
ESTs with no hit
BLASTx hits
BLASTx hits
ESTs with no hit
ESTs with hit
ESTs sequenced
Dfsl NCBI BLAST x results
A B
12%
5%
4%
31%
48%
23%
16%
14%15%
32%
Plantae
Animalia
Fungi
Bacteria
Protist
Figure III- 7 Percentage of clones from efMOSl (A) and from Dfsl (B) approaches distributed by kingdoms of the represented organisms, Plantae, Animalia, Fungi, Bacteria and Protist.

Parasite Host-Response CHAPTER III
57
It was thus possible to infer proximity with the Protozoans, especially with
parasites that are quite characterized as Plasmodium, Cryptosporidium and Entamoeba,
which were more represented in homology results.
Then the two most representative groups of organisms with hits are the Bacteria
and Plantae. Each EST was submitted to homology search against P. marinus genome
sequencing TIGR database. But the majority of cDNA fragments obtained had no
homology hit at NCBI neither at TIGR. This in silico analysis allowed the selection of
genes of interest for further molecular characterization, in an attempt to provide further
insight into our comprehension of parasite host-response.
III-4 Conclusions
In recent years, identification of pathogenic genes has been achieved by using a
number of different approaches. The most commonly used methods for bacterial
pathogens have included signature-tagged mutagenesis (Song et al. 2004) a negative-
selection method that involves comparative isolation of individual specifically tagged
transposon-generated mutants applied to Salmonella typhimurium (Hensel et al., 1995),
to Yersinia enterocolitica (Darwin and Miller, 1999) and selective capture of transcribed
sequences in Escherichia coli (Dozois et al., 2003). An alternative approach for
studying the role of genes in physiological, morphological and biochemical processes in
bacteria is to investigate changes in gene expression. For this, cDNA-amplified
fragment length polymorphism (cDNA-AFLP) was firstly reported to study differential
gene expression in Erwinia carotovora (Dellagi et al., 2000), but these authors already
suggest that SSH could allow the isolation of previously unidentified genes.
In this case, the SSH strategy was selected for the study of the non-standard
mollusc parasite P. olseni up-regulated genes when challenged with hemolymph from

Parasite Host-Response CHAPTER III
58
its host, the carpet-shell clam, R. decussatus. Likewise, SSH was the technique chosen
for studies of host parasite-response, like the detection of Eastern (Crassostrea
virginica) and Pacific (C. gigas) oysters genes expressed in response to P. marinus
(Tanguy et al., 2004) and identify new antimicrobial peptides in carpet-shell clam
hemocytes in response to bacterial stimulation (Gestal et al., 2007). Two approaches to
parasite subtracted transcriptome, direct SSH and an enriched library by MOS, were
compared to find out which one was less labour intensive, cheaper and able to provide
more genes with a higher diversity. The first approach (direct SSH or Dfsl) was found to
be less labour intensive and was recommended not only because of being faster, but also
because it allowed identification of a higher number of genes. The diversity obtained
with Dfsl in terms of GO molecular function was at least twice that obtained with
efMOSl, with the majority of the EST identified corresponding to Protist kingdom.

Molecular Characterization of a Chlorohydrolase-like Gene CHAPTER IV
CHAPTER IV – MOLECULAR CHARACTERIZATION OF A
CHLOROHYDROLASE-LIKE GENE
“Effective chemotherapy requires inhibition of critical molecular processes in the target
pathogen without significantly impinging on those of the host. This simple principle
requires that host and pathogen must be different in some aspect, usually in a metabolic
or structural pathway” by Karen Joy Shaw (2002) Pathogen Genomics Impact on
Human Health, Humana Press

Molecular Characterization of a Chlorohydrolase-like Gene CHAPTER IV
IV-1 Introduction
Perkinsus sp. is a poorly characterized molluscan parasite. Through a cDNA
subtractive library were identified those parasite genes up-regulated when challenged
with host hemolymph (see Chapter III). From these, the gene represented in more copies
was obtained from the efMOSl cDNA subtracted library and first identified, following
BLASTx analysis as a putative cytosine deaminase (CD) related to pyrimidine salvage
pathway. Later a higher homology was obtained with proteins from the chlorohydrolase
family.
The chlorohydrolase was shown to be firmly linked with a major
amidohydrolase protein superfamily (Seffernick et al., 2001). Members of the
amidohydrolase protein superfamily catalyze different reactions and are generally
divergent in their amino acid sequence, presenting less than 50% identity. However,
these superfamily members are known to share common tri-dimensional structure and
catalytic mechanisms. For example, Pseudomonas sp. strain NRRL B-12227 melamine
deaminase was described to be 98% identical to the enzyme atrazine chlorohydrolase
from the strain ADP, differing in 9 amino acids only (Seffernick et al., 2001) although
their function is quite different, thus confirming that proteins with high identity may
catalyze different reactions in different metabolic pathways.
Inference by homology is currently the most powerful computational method of
function assignment and structure prediction for the protein products of newly identified
genes (Holm and Sander, 1997). Homologous proteins catalyzing different reactions are
being discovered at an increasing rate with functional genomics focusing attention on
the interplay between molecular sequence and function. This amidohydrolase
superfamily comprehend some of the enzymes responsible for nitrogen recycle,
essential metabolites for DNA and nucleic acid synthesis (Seffernick et al., 2001),

Molecular Characterization of a Chlorohydrolase-like Gene CHAPTER IV
61
including 30% of the steps in four intermediate metabolic pathways (Holm and Sander,
1997). Cytosine deaminase (EC 3.5.4.1) is one of the proteins responsible for the
salvage pathway of pyrimidine, being related with parasitism mechanisms of nutrient
scavenge. It was found in a variety of bacteria and fungi, but not in other eukaryotes. It
functions in the pyrimidine salvage pathway during nutritional stress deaminating
cytosine to uracil (Danielsen et al., 1992). CD is also capable of catalyze the
deamination of 5-fluorocytosine to form 5-fluorouracil, being very useful as negative
selectable marker since CD has a very narrow range of substrates (Porter and Austin,
1993). Indeed, the enzyme prodrug CD/ 5-FC strategy was first used for selection
(Nishiyama et al., 1985), and since then has been applied to gene cancer therapy (Huber
et al., 1994), (Nyati et al., 2002), (Zhengwang et al., 2002), (Dabrowska et al., 2004),
(Lee et al., 2004), (Goblirsch et al., 2006) and (Chaszczewska-Markowska et al., 2008)
as well as for selection of parasitosis transfectants (Fox et al., 1999), (Duraisingh et al.,
2002) and (Davoudi et al., 2003).
Besides the enzymes responsible for deamination, there are those
chlorohydrolases that catalyse hydrolytic displacement of amino groups and chlorine
substitutives from s-triazine ring compounds (Holm and Sander, 1997). That is the case
of Atrazine chlorohydrolase (AtzA), N-ethylameline hydrolase or Triazine hydrolase
(TrzA), enzymes involved in detoxification of the pesticide atrazine. Atrazine, first
synthesized in Switzerland in 1955 for JR Geigy (CIBA-GEIGY Corporation), was first
licensed in the US in 1959. More than 2 billion pounds of the herbicide atrazine have
been applied to soils globally, and this has provided selective pressure for the evolution
of new metabolisms. The clearest example to date is atrazine chlorohydrolase, an
enzyme which has been shown to have evolved to allow the catabolism of atrazine.

Molecular Characterization of a Chlorohydrolase-like Gene CHAPTER IV
62
AtzA was shown to exclusively catalyse dehalogenation of halo-substitued
triazine ring compounds (Seffernick and Wackett, 2001), such as atrazine (2-chloro-4-
(ethylamine)-6-(isopropylamine)-s-triazine, CEIT). Although AtzA was not active with
any of the pyrimidine substrates (Seffernick et al., 2000) it dehalogenates atrazine. CD
catalyses specifically the deamination of cytosine to uracil and amonia (Danielsen et al.,
1992). N-ethylameline hydrolase (TrzA) from Rhodococcus corallinus NRRL B-
15444R catalyzes the deamination of unalkylated aminotriazines, such as melamine or
2-chloro-4,6-diamino-1,3,5-s-triazine (CAAT) but fails to catalyze either deamination or
dechlorination reactions with atrazine (CEIT) (Grossenbacher et al., 1984).
Bivalves behave like a biological filter therefore they can accumulate and
concentrate contaminants within their tissues (Gagnaire et al., 2004). Bivalves can
concentrate pollutants in their tissue at concentration greater than the ambient seawater
(El-Shenawy, 2004). In this context, it was described that atrazine affects the peroxidase
activity of the hemocytes thus interfering with the bivalve defense mechanisms
(Gagnaire et al., 2004).
The effect of drugs with different chemical properties and mode of action have
been shown to contribute significantly to increase our understanding of parasite biology
and physiology. Increasing information has became available on Perkinsus drug
susceptibility, and in particular P. olseni, which was highly susceptible to iron
deprivation as induced by iron-chelators desferrioxamine (DFO) and 2,2-bipyridyl (BIP)
(Elandalloussi et al., 2003). Also some compounds known for their antimalarial and
antiprotozoal properties showed in vitro inhibitory effect on Perkinsus proliferation,
namely cycloheximide, pyrimethamine, DFO and BIP (Elandalloussi et al., 2005).
Despite the lack of effect by PAHs in P. marinus in vitro proliferation (Bushek et al.,

Molecular Characterization of a Chlorohydrolase-like Gene CHAPTER IV
63
2007a), it was noteworthy the effects that these chemicals can have on oysters,
increasing haemocyte activity.
The P. olseni EST was identified, through in silico analysis, as being part of the
chlorohydrolase protein family, with significant hits for TrzA, AtzA and CD, and
named Chlorohydrolase-like protein (Clhl). Substrate specificity and protein
functionality were studied in order to distinguish and characterize this P. olseni protein.
Our findings suggest that either (i) another enzyme(s) is present which confers the
broader substrate range in Perkinsus or (ii) the Clhl itself has a broader substrate range.
The molecular characterization and functional analysis of this PoClhl allowed a better
definition of this novel parasite protein and contribute to understand its role in host-
parasite interaction.
IV-2 Specific materials and methods
IV-2.1 P. olseni Clhl cDNA and gene molecular characterization
A partial sequence of one clone from P. olseni chlorohydrolase-like protein
(PoClhl) was obtained by screening the subtractive cDNA library (see Chapter III) and
the complete cDNA was obtained by RACE-PCR using Marathon cDNA library and
PoClhl GSP, PoClhl Frw1 and PoClhl Rev1 (Appendix II-1) specific primers, as well as
the AP1 primer, according to previously described method (see Chapter II). The PoClhl
gene was obtained through a combination of PCR using specific primers (PoClhl GW
Frw1 and PoClhl GW Rev1; PoClhl gene Frw5 and PoClhl gene Rev5, Appendix II-1)
and the Universal Genome Walker commercial kit, as previously described (see Chapter
II). For identification of gene structure the resulting genomic sequence was aligned with
the sequence of the cloned PoClhl cDNA. There was 100% identity between the
common regions of both gene and cDNA sequences for PoClhl.

Molecular Characterization of a Chlorohydrolase-like Gene CHAPTER IV
64
IV-2.2 P. marinus Clhl cDNA and gene molecular characterization
A PmClhl gene sequence was identified by BLASTn analysis using the PoClhl
cDNA sequence against P. marinus genomic sequences available from its genome
sequencing project (http://tigrblast.tigr.org). A high homology hit identified a
preliminary genomic DNA fragment (#23200) which was used to design specific
primers (PmClhl Frw1 and PmClhl Rev1, Appendix II-1) which allowed amplification
of its partial cDNA. Amplification of the corresponding 5’ and 3’ cDNA regions was
achieved following the manufacture’s instructions using the GeneRacer Kit (Invitrogen)
methodology and specific primers PmClhl Frw3 and PmClhl Rev3 Rev (Appendix II-1).
The amplified cDNA fragments were cloned into pCR II TOPO T/A cloning vector
(Invitrogen) in One Shot Top10 Competent cells (Invitrogen). To eliminate internal
sequencing error, the ORF was re-sequenced using specific primers PmClhl Frw2 and
PmClhl Rev2 (Appendix II-1).
The complete sequence of the PmClhl gene was obtained by searching the
available P. marinus database with the sequence of the cloned full length PmClhl cDNA
and by comparison with the PoClhl gene. The PmClhl gene sequence was later
confirmed by amplification of P. marinus high molecular weight DNA using PmClhlg
Frw1 and PmClhlg Rev1 oligonucleotides (Appendix II-1). There was 100% identity
between the common regions of both gene and cDNA sequences for PmClhl.
IV-2.3 Perkinsus spp. sensitivity to specific Clhl substrates and inhibitors
To test the possibility of PoClhl behaving like a CD, P. olseni cells were
cultured in the presence of its specific substrates, prodrug, 5-FC and the respective drug
5-FU. Cellular proliferation was also assayed in the presence of the specific CD
substrate. Posterior BLASTx analysis revealed other hypothesis of protein hit above
CD, AtzA, TrzA. AtzA was shown to exclusively catalyse dehalogenation of atrazine

Molecular Characterization of a Chlorohydrolase-like Gene CHAPTER IV
65
(2-chloro-4-(ethylamine)-6-(isopropylamine)-s-triazine, CEIT). TrzA catalyzes the
deamination of unalkylated aminotriazines, such as melamine (Grossenbacher et al.,
1984). CD crystal structure was described in complexes with the inhibitor 2-
hydroxypyrimidine (Ko et al., 2003). AtzC competitive inhibitor is 5-azacytosine
(Shapir et al., 2002) being used as AtzA and TrzA inhibitors, also.
IV-2.3.1 P. olseni growth curve under Clhl substrates treatments
Cells from both Perkinsus species were cultured after adding the chemical
treatments, prodrug and drug, at various concentrations and incubated at 28ºC during 12
days. A similar experiment was performed using solely the vehicle used (0.2 %
dimethylsulfoxide (DMSO) as control. The growth was followed by absorbance
measured at 600 nm, along the 12 days of the experiment. This method tested each
chemical concentration, the blank control, with no treatment and solvent control,
measuring duplicates for each sampling. At the 2nd and 12th day 3 replicates of 100 µl
were sampled and used to perform the cellular viability assay. Cell proliferation assay
was performed after 72 hours exposure, adding 20 µl MTS/ PMS, allowing an
incubation of 2 hrs at 28ºC, protected from light, following Cell titter 96 aqueous non-
radioactive cell proliferation assay instructions (Promega). Absorbance was read at 490
nm with a microplate reader, preceded by 10 seconds agitation.
To screen other chlorohydrolases activities, all known substrates and inhibitors
were used. The chemicals cytosine, 5-FC, 5-FU, CEIT, melamine, azacytosine and
hydroxypirimidine were purchased from Sigma Aldrich. Azacytosine is a DNA
methylation inhibitor, a competitive inhibitor of N-Ethylameline (TrzA). 2-
Hydroxypirimidine was described as an inhibitor of recombinant yeast cytosine
deaminase. The concentration of each chemical responsible for 50% of cell viability
(EC50) was determined by nonlinear regression analysis of log dose response curves

Molecular Characterization of a Chlorohydrolase-like Gene CHAPTER IV
66
using GraphPad Prism v.4.00 software. These values were calculated from triplicates of
two independent experiments. The assays were carried out in 100µl of medium
containing the different factors to be tested and evaluation of cell proliferation was
determined after 72 hours, using a cell proliferation assay (Promega) according to
manufacturer instructions. A linear association (R2=0.9755) was previously found
between the proliferation assay signal and cell density, measured by 600nm absorbance,
confirming that the assay absorbance at 490nm was proportional to cell culture density
(Elandalloussi et al., 2003).
IV-2.4 Characterization of PoClhl gene expression pattern
In order to characterize the pattern of parasite gene expression, P. olseni cell
culture media was prepared using DME: Hams F12 (Gibco, Invitrogen Co)
supplemented with 5 % FBS and streptomycin/ampicilin antibiotics as the control
condition once is the standard medium. DME commercial medium can be found
supplemented or not with glutamine. The nutrient mixture Hams F12 contains basic
aminoacids and lipids including alanine, asparagine, proline, vitamine B12, putrescine,
lipoic and linoleic acids as well as nucleotide precursors (proline, hypoxanthine and
thymidine). The conditions prepared for P. olseni gene expression were thus designed
to prevent interference from specific components of the culture medium which are
known to be pyrimidine pathway precursors.
IV-2.4.1 PoClhl expression in response to host hemolymph challenge
PoClhl gene expression was observed by RT-PCR following in vitro exposure of
P. olseni cells to R. philippinarum serum (hemolymph cell free) along time. P. olseni
cells were grown in 250 cm2 Erlenmeyer. Hemolymph was withdrawn from the

Molecular Characterization of a Chlorohydrolase-like Gene CHAPTER IV
67
adductor muscle of R philippinarum without dissecting the clams, which were obtained
from North Eingstown, USA. Only cell-free hemolymph from non infected clams was
used. A number of 2x10⁷ trophozoites were resuspended in a minimum volume of 0.5
ml cell free-hemolymph to perform the parasite-host exposure. The serum was isolated
by centrifugation and hemocytes were used for DNA extraction and Perkinsus sp.
diagnose PCR assay. The serum quality was checked under the microscopy. Total RNA
was isolated using the RNeasy mini Kit (Qiagen). cDNA was synthesized using
SuperScript II RT (Invitrogen) and PoClhl relative gene expression was analysed by gel
electrophoresis of RT-PCR products, using P. olseni Polyubiquitin (PoUbq, accession
number DQ 291152) as reference gene.
IV-2.4.2 PoClhl expression in media depleted of pyrimidine percursors
Medium depleted of different nucleotide precursors was prepared using DME
medium with and without glutamine in various proportions in the absence or presence
of Hams F12 nutrient mix. Without Hams F12, nutrients as alanine, asparagine, proline,
hypoxanthine, thymidine, vitamine B12, putrescine and lipoic and linoleic acids are not
available, allowing to test the relevance of external nucleotides precursors (proline,
hypoxanthine and thymidine) availability in parasite salvage for the ribonucleotide
metabolism.
Table IV- 1 Different cell culture media prepared using DME (Gibco, Invitrogen Co), Hams F12 (Gibco, Invitrogen Co) and DME with glutamine.
+
-
-
-
+
+
-
-
+
-
+
-
+
+
+
- +
+
+
-
+
+
-
+
+
+
+
+
+
+
-
-
5-FC treatment
DME medium
Hams
Glutamine
A B C D GFE H Treatment
+
-
-
-
+
+
-
-
+
-
+
-
+
+
+
- +
+
+
-
+
+
-
+
+
+
+
+
+
+
-
-
5-FC treatment
DME medium
Hams
Glutamine
A B C D GFE H Treatment
The cells were cultured 3 days in the various media described, then collected for total
RNA isolation for further PoClhl gene expression study by Northern blot (Chapter II),
using PoUbq as reference gene.

Molecular Characterization of a Chlorohydrolase-like Gene CHAPTER IV
68
IV-2.4.3 PoClhl expression in response to various environmental conditions
The environmental stressing conditions were previously mentioned, temperature,
salinity and organic and inorganic pollutants (Table IV-1). The Northern blot was the
strategy used for gene expression study, using PoUbq as reference gene.
IV-2.4.4 PoClhl expression following exposure to substrates and inhibitors
P. olseni cells were cultured in 8ml medium and incubated with
chlorohydrolases substrate and inhibitors. For treatment with the prodrug 5-FC, the
EC50 dose (33.8 µM) was used, as also for treatment with the drug 5-FU (EC50, 4.15
µM). The other substrates: cytosine, CEIT, melamine and inhibitors Azacytosine and 2-
hydroxypirimidine; a final concentration of 100 µM was used. After 3 days, total RNA
was isolated using Denhardt’s solution as previously described (Chapter II). Cellular
viability was checked to ensure number and quality of cells using the previously
described methodology of cell proliferation assay (Promega).
IV-2.5 PoClhl in vitro transcription/ translation
The PoClhl ORF sequence was amplified by PCR using recommended
oligonucleotides (Appendix II-1). PCR product obtained was confirmed by DNA
sequence analysis to represent the correct amplified sequence prior to its use. The PCR
product was then transcribed and translated in vitro by TNT quick coupled transcription
and translation system (Promega) as described by the manufacturer, but in 25 µl final
volumes. The PoClhl synthesis products were then used for functional assays. To
confirm the in vitro protein expression, a control reaction was performed without
addition of DNA template for transcription/ translation. The polyacrylamide gradient
gel denaturing conditions were used to analyse the products of in vitro synthesis.
Aliquots of 1 and 2 µl were added to LDS sample buffer (Nupage, Invitrogen) reductant

Molecular Characterization of a Chlorohydrolase-like Gene CHAPTER IV
69
agent according to manufactures’ instructions (Nupage, Invitrogen). The sample mix
was heated to 90ºC for 10 min. Then the samples were electrophoresed in a commercial
gel of 1 mm x 12 columns, of 4-12 % SDS-polyacrylamide (Nupage, Invitrogen) with
0.1 % de SDS (Nupage, Invitrogen). This was performed using PowerPac (HC, Biorad)
under 200 V. To analyse the protein profile, the gel was fixated and coloured with the
CBB solution (Comassie Brilliant Blue, R-250 0.2 % (p/v) (Biorad), 10 % (p/v)
trichloroacetic acid and 10 % (p/v) sulfosalicilic acid) during 8 h, followed by de-
colouration with acetic acid (7.5 % (v/v) and methanol (10 % (v/v) solution. The scanned
result allowed the comparison between TNT in vitro PoClhl protein synthesis and
control.
IV-2.6 PoClhl in vitro expression using a prokaryote system
P. olseni Clhl cDNA was obtained by RT-PCR amplification from reverse
transcription of P. olseni RNA using M-MLV reverse transcriptase (Invitrogen),
according to the manufacture’s instructions. The amplification was performed using the
universal primer and a specific primer PoClhlFrw2 (Appendix II-1). Amplification
conditions were started with 5 min denaturation at 94ºC proceeding with 10 cycles of 40
sec at 94oC, 40 sec at 64oC and 1.5 min at 68oC, the followed by 35 cycles of 40 sec at
94ºC and 1.5 min at 68ºC and at last the extension of 7 min at 68oC, using Advantage
cDNA Polymerase (Clontech, BD). The 1.6 Kb PCR product of the CD gene was gel
band extracted after fractionation in agarose-ethidium bromide gel electrophoresis. The
DNA isolated was used as template in a reamplification of the gene using primers
specifically designed for expression PoClhl_exp_NotIF1 and PoClhl_exp_NotIR1, with
NotI enzyme restriction sites (Appendix II-1). Amplification conditions were as
follows: 5 min denaturation at 94ºC, 10 cycles of 30 sec at 94ºC, 2 min at 69ºC and 25

Molecular Characterization of a Chlorohydrolase-like Gene CHAPTER IV
70
cycles of 30 sec at 94ºC, 2 min at 6 ºC and the last 5 min at 68ºC, using a proofreading
polymerase (Advantage cDNA polymerase, Clontech BD). A 1.5 Kb amplicon was
isolated from gel band and digested using the NotI restriction enzyme. The pET3-His2
expression vector was similarly digested in order to perform the oriented cloning.
Figure IV- 1 PoClhlpET3His-2 plasmid construct for exogenous PoClhl expression in a prokaryotic system.
The resulting construct was designed PoClhlpET-3His and inserted firstly into
DH5α for direction and misleading polymerase synthesis sequence confirmation, then
was expressed as exogenous protein in BL21 pLys. The BL21 strain was selected for
protein expression due to its deficiency in lon protease3 as well as the ompT outer
membrane protease that can degrade proteins during purification. Their presence
reduces basal activity of T7 RNA polymerase in the uninduced state. The strain BL21-
Gold (DE3) [F– ompT hsdS(rB– mB–) dcm+ Tetr gal λ(DE3) endA Hte (pLysS Camr)]
carries a derivative of the plasmid pACYC184 which expresses the T7 lysozyme gene at
low levels. T7 lysozyme binds to T7 RNA polymerase and inhibits transcription by this
enzyme. In addition to inactivation of T7 RNA polymerase transcription, T7 lysozyme
has a second function involving specific cleavage of the peptidoglycan layer of the E.
coli outer wall. Upon IPTG induction, overproduction of the T7 RNA polymerase
renders low level inhibition by T7 lysozyme virtually ineffective and the protein of

Molecular Characterization of a Chlorohydrolase-like Gene CHAPTER IV
71
interest can be over-expressed. PoClhlpET3His-2 construct was used to transform the
BL21pLys by heat shock. For control of protein expression pET3His-2 vector (gently
provided by Marc Ohresser) was cloned also in BL21pLys. For control of the
transformation reaction, the pET3a vector was used (gently provided by Marc
Ohresser). The colony growth selection was performed with chloramphenicol antibiotic
and single colony growth was performed in LB broth containing 100 µg/ml of ampicilin
and 50µg/ml chloramphenicol and incubated with shaking at 220–250 rpm, at 37°C,
overnight. The rest of the culture was induced adding IPTG to a final concentration of 1
mM being incubated with shaking at 220–250 rpm at 37°C for 2 hours. The cultures
without induction constituted the uninduced control samples.
IV-2.6.1 PoClhl protein activity in expressing colonies
A simple resting cell assay was devised to measure the enzyme activity based on
a spectrophotometric assay described previously (Bouquard et al., 1997). A stationary
phase cell culture was obtained growing the pre-inoculum in N-free medium. Cells were
harvested by centrifugation and washed three times with phosphate-buffered saline
solution (10mM potassium phosphate). Then, cells were resuspended in N-free medium
and incubated with 5-FC, 5-FU, atrazine, melamine or cytosine as nitrogen source. 50 µl
of 10mM atrazine was added and the same was performed in parallel with each
substrate. Samples (500µl) were withdrawn at 5-min intervals and centrifuged
immediately for 3 min in a microcentrifuge at full speed. Substrate degradation was
controlled by decreasing absorbance (García-González, 2003) measured along time,
using a Helios gamma spectrophotometer (Thermo Electro Corporation).
IV-2.6.2 Chlorohydrolase substrate degradation in cell extract
Cultures were grown at 37°C overnight in Luria-Bertani medium and induced
with IPTG (1 mM). Induction of expression was studied taking in account the time of

Molecular Characterization of a Chlorohydrolase-like Gene CHAPTER IV
72
induction and IPTG concentration, ranging from 20 to 1mM. Cells were centrifuged at
14,000 × g for 2 min at 4°C. Cell pellets were resuspended in ice-cold phosphate buffer
after being twice washed. Cell suspensions were subjected to lysis by repeated freeze-
thaw cycles. Lysed cell suspensions were centrifuged at 14,000 × g for 15 min at 4°C to
obtain cell extracts. Saturated solutions of the various atrazine, melamine and cytosine
compounds were prepared in 100mM phosphate buffer (pH 7.0). All stock solutions at
100mM were filtered through a 0.2 µm syringe filter and diluted to 10mM in the
experimental condition. The atrazine, melamine and cytosine solutions were incubated
with 50 µl of cell extracts for 16 and 48 h at 28°C. Enzymatic reactions were stopped by
heating for 2 min at 95 to 100°C. Reactions were carried out in 1 ml of 10 mM
phosphate buffer, pH 7.0, containing atrazine, melamine or cytosine at 37°C. Control
samples without enzyme were handled in parallel with the enzyme- treated samples.
Enzyme activity was measured by monitoring the decrease in absorbance of atrazine,
melamine and cytosine throughout time. Readings were then taken at OD290 for 5-FC
and OD255 for 5-FU (Mahan et al., 2004), at OD225 for Atrazine (García- González et al.,
2003), at OD235 for Melamine (UNEP CAS Nº 108-78-1) and at OD275 for Cytosine
(Garriga et al., 1992). Substrate degradation by enzyme activity was measured by
decreasing in specific absorbance of each chemical along time using a Helios gamma
spectrophotometer (Thermo Electro Corporation).
IV-2.6.3 PoClhl His- tag protein isolation following in vitro translation
Two BL21- Lys transformants with PoClhl were grown at 37°C overnight in
Luria-Bertani medium and induced with IPTG (20 mM). Two experiments of protein
expression were performed:, (i) induction of a 2 hours recovered culture in 1 ml with 20
mM IPTG for 2 hours at 37ºC and (ii) induction of a 10 ml culture grown overnight at
room temperature. Both clones were prepared, PoClhlBL21-41 and PoClhlBL21-45 in
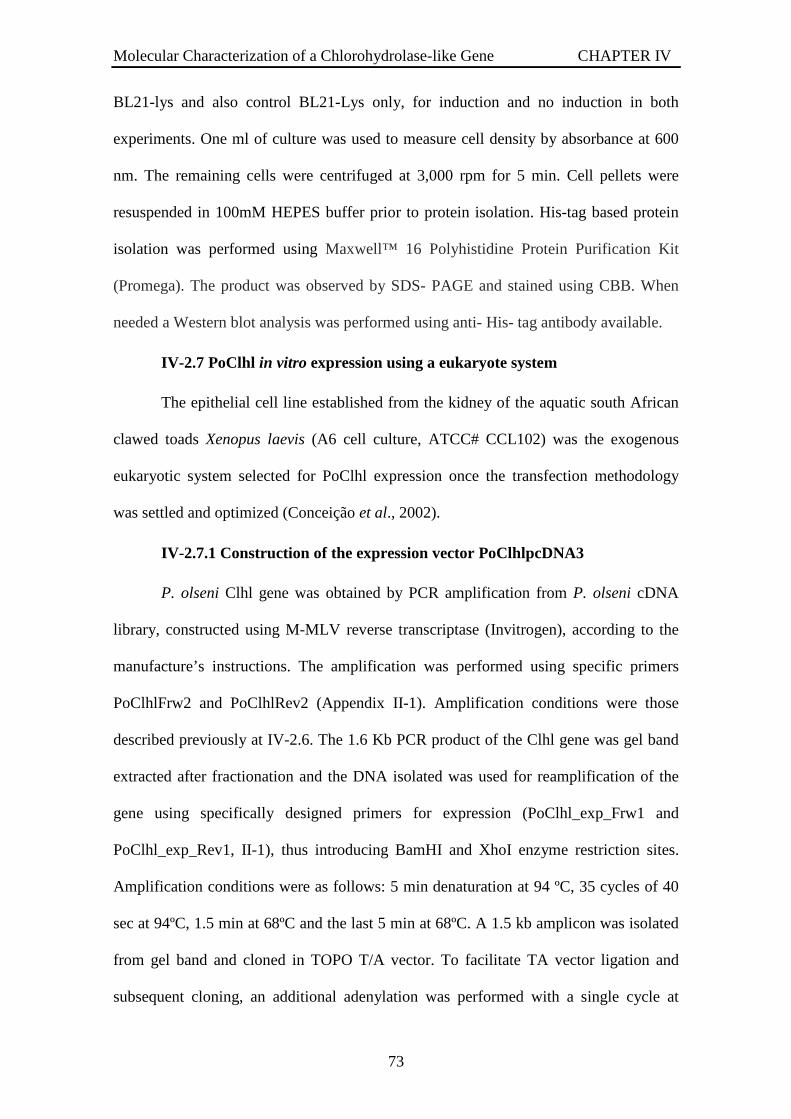
Molecular Characterization of a Chlorohydrolase-like Gene CHAPTER IV
73
BL21-lys and also control BL21-Lys only, for induction and no induction in both
experiments. One ml of culture was used to measure cell density by absorbance at 600
nm. The remaining cells were centrifuged at 3,000 rpm for 5 min. Cell pellets were
resuspended in 100mM HEPES buffer prior to protein isolation. His-tag based protein
isolation was performed using Maxwell™ 16 Polyhistidine Protein Purification Kit
(Promega). The product was observed by SDS- PAGE and stained using CBB. When
needed a Western blot analysis was performed using anti- His- tag antibody available.
IV-2.7 PoClhl in vitro expression using a eukaryote system
The epithelial cell line established from the kidney of the aquatic south African
clawed toads Xenopus laevis (A6 cell culture, ATCC# CCL102) was the exogenous
eukaryotic system selected for PoClhl expression once the transfection methodology
was settled and optimized (Conceição et al., 2002).
IV-2.7.1 Construction of the expression vector PoClhlpcDNA3
P. olseni Clhl gene was obtained by PCR amplification from P. olseni cDNA
library, constructed using M-MLV reverse transcriptase (Invitrogen), according to the
manufacture’s instructions. The amplification was performed using specific primers
PoClhlFrw2 and PoClhlRev2 (Appendix II-1). Amplification conditions were those
described previously at IV-2.6. The 1.6 Kb PCR product of the Clhl gene was gel band
extracted after fractionation and the DNA isolated was used for reamplification of the
gene using specifically designed primers for expression (PoClhl_exp_Frw1 and
PoClhl_exp_Rev1, II-1), thus introducing BamHI and XhoI enzyme restriction sites.
Amplification conditions were as follows: 5 min denaturation at 94 ºC, 35 cycles of 40
sec at 94ºC, 1.5 min at 68ºC and the last 5 min at 68ºC. A 1.5 kb amplicon was isolated
from gel band and cloned in TOPO T/A vector. To facilitate TA vector ligation and
subsequent cloning, an additional adenylation was performed with a single cycle at

Molecular Characterization of a Chlorohydrolase-like Gene CHAPTER IV
74
72ºC for 15 min with dATP, using Taq cDNA polymerase (Clontech). The plasmid was
amplified in E. coli DH5α, purified using plasmid miniprep Kit (Amersham
Biosciences) and sequenced to check for absence of misleading polymerase synthesis.
The fragment of interest was then amplified by PCR using a proofreading polymerase
and digested using the BamHI and XhoI restriction enzymes, as also the pcDNA3
expression vector in order to perform the oriented subcloning.
Figure IV- 2 PoClhpcDNA3 plasmid construct for exogenous PoClhl expression in eukaryotic systems.
The PoClhl ORF was subcloned into the multiple cloning site of eukaryotic
expression vector pcDNA3.0 to generate PoClhlpcDNA3_BamHI/XhoI plasmid.
Sequencing step was repeated to ensure the sequence quality, avoiding errors in protein
expression. This plasmid was named PoClhl-pcDNA3.
IV-2.7.2 Construction of vector directing expression of PoClhl protein fused
to GFP (PoClhlpEGFP)
The PoClhl ORF was cloned into the multiple cloning site of eukaryotic
expression vector pEGFP-N1 to generate PoClhlfusGFP_BamHI/ XhoI plasmid. A
sequencing step was repeated to ensure the sequence quality, avoiding errors in protein
expression. This plasmid was named PoClhl pEGFP-N1.

Molecular Characterization of a Chlorohydrolase-like Gene CHAPTER IV
75
Figure IV- 3 PoClhfusGFP plasmid construct for exogenous PoClhl expression in eukaryotic systems.
IV-2.7.3 PoClhl expression using X. laevis A6 cell line
The X. laevis A6 cell line (kidney epithelium derived cells) were seeded at 3x10⁵
cells/ ml the day before, to reach at the transfection moment 80 % confluence in 6- well
plates. Transient transfections were carried out in standard medium without FBS using
FuGene6 (Roche Diagnostics, Indianapolis, USA). The DNA/ transfection reagent
complexes were prepared in diluted medium and allowed to incubate 15 min at room
temperature. PoClhlfusGFP and PoClhlpEGFP-N1 constructs were used to transfect A6
cells. pEGFP-N1 empty vector were used as control. No DNA complexes were used as
transfection negative control. All experiments were repeated at least two times. The
transfection efficiency was observed by fluorescence microscopy under blue light after
48 hours. Transcription was checked by RT-PCR, after 5 days following total RNA
isolation and using gene specific primers and X. laevis actin GSP for control. For stable
transfection, pEGFP-N1 plasmid confers geneticin resistance to the cells modified with
this plasmid DNA. Geneticin (Gibco) dose response curve was constructed for A6 cells
to determine the lethal concentration (EC90= 2 mg/ml of geneticin) and selection
concentration (EC50=of 0.5 mg/ml) (r2 0.9444). To check the exogenous PoClhl
production and activity, the transfected A6 clones were seeded in triplicate in a 96-well

Molecular Characterization of a Chlorohydrolase-like Gene CHAPTER IV
76
plate (cells/ well), cultured for two hours and exposed to above mentioned substrates at
various concentrations (2 pM to 2 mM) for 3 to 5 days. Cell viability was determined by
MTS assay using cell titter aqueous non radioactive cell proliferation kit (Promega) as
previously described (Davoudi et al., 2003). These experiments were repeated at least
two times.
IV-2.7.4 PoClhl in vitro protein expression and western blot confirmation
X. laevis cells transfected with PoClhlfusGFP and expressing Clhl were obtained
and maintained under selection. The transformant cells were observed at 48 hours to
ensure transfection and partially collected at 72 hours for RT- PCR to verify the Clhl
transcription. Having enough cells, these were centrifuged at 3,000 rpm for 5 min and
crude extracts were prepared for SDS- PAGE analysis, stained using CCB. Crude
extracts were also prepared from X. laevis cells transfected with empty vector pEGFP-
N1 to be used as negative control for protein expression. To confirm expression a
Western blot was performed following established procedures and analysed using 1:500
anti-GFP antibody (Invitrogen) as primary antibody and anti-alkaline phosphatase as
secondary antibody.
IV-3 Results and Discussion
IV-3.1 Identification of the most represented EST in the SSH library
From the 300 EST resulting from both approaches of SSH, we chose to focus on
those highly represented. From Direct forward subtractive library (Dfsl) we identified 3
ESTs corresponding to a sequence sharing homology with Pisum sp. putative
senescence associated protein (Accession number BAB33421) and 3 ESTs for another
unknown sequence homologous to Nicotiana sp. cytochrome p450- like (Accession

Molecular Characterization of a Chlorohydrolase-like Gene CHAPTER IV
77
number BAA10929). In the enriched forward MOS library we identified 20 ESTs
corresponding to a sequence similar to Cryptosporidium sp. putative senescence
associated protein (Accession number EAL34999) and 15 ESTs corresponding to a
sequence sharing homology with the Moorella sp. cytosine deaminase (Accession
number ZP-00331135; see Chapter III).
This later sequence was chosen because it was previously well characterized in
several organisms and described to exist only in bacteria and lower eukaryotes as yeast.
In addition, it was thought to be relevant for negative selection, a useful property for
gene therapy. If confirmed, P. olseni would be the first protozoan described as
possessing a CD, a relevant enzyme in the pyrimidine salvage pathway, which enables
the organism to utilize exogenous pyrimidine bases and nucleosides, which are not
intermediate in the de novo pyrimidine synthesis. Pyrimidine and purine nucleotides are
fundamental to life as they are involved in nearly all biochemical processes.
Purine and pyrimidine salvage pathways are characteristic of prokaryotes and
lower eukaryotes and have been successfully used in the past as target pathways for
drugs used to treat microorganism-induced pathologies (Kilstrrup et al., 1989). This
EST was thus further characterized and the structure of its cDNA, gene and encoded
protein unveiled. However, while the partial sequence was firstly identified as CD, the
full cDNA and encoded protein was later considered broadly as a chlorohydrolase-like
protein (PoClhl) according to the significative homology hits in BLASTx. This protein
thus appeared to rather belong to the amidohydrolase protein superfamily, which
comprehends some of the enzymes responsible for nitrogen recycle of essential
metabolites required for DNA and nucleic acid synthesis.

Molecular Characterization of a Chlorohydrolase-like Gene CHAPTER IV
78
IV-3.2 Molecular characterization of Perkinsus spp. Chlorohydrolase-like
The molecular characterization of the cDNA and gene was the first step to
obtain the complete amino acid sequence of the predicted protein. The EST sequence
obtained from SSH spanned 234 base pairs and was used to design specific primers to
amplify the complete cDNA and allow its molecular characterization. The resulting full
length PoClhl cDNA spanned 1,446 bp and encoded a polypeptide with 457 amino acid
residues (Figure IV-4).
The corresponding PoClhl gene spanned 2,823 bp from putative site of
transcription initiation to the site corresponding to the 3’ end of the cDNA. The PmClhl
cDNA sequence was also fully cloned and found to span 1,459 bp and encode a 458
amino acid residue polypeptide (Figure IV-5).
The corresponding PmClhl gene was cloned and found to span 3,381 bp. Alignment
of the orthologous cDNA sequences with their corresponding genes identified an equal
number of 15 exons for each gene (Figure IV-6), all showing conserved canonical
splicing signals (GT/AG) but with different intron sizes and types (Table IV-2). The
PmClhl gene was the largest Clhl protein gene (3,381 bp) identified so far.
The promoter was carefully analysed in silico and its characteristics compared to
other Perkinsus spp. promoters. PoClhl and PmClhl had no canonical TATA box, but a
T- rich region was identified (Table IV-3). A comparable T-rich region was identified in
other Perkinsus gene promoters such as the PmSOD1 gene, which contains a proximal
TATA (TATTTTA) 34 bases from the transcription start point, a position typical of
many eukaryotic promoters (Schott et al., 2003b), while PmNramp has a putative
TATA box at -162 position (Robledo et al., 2004).

Molecular Characterization of a Chlorohydrolase-like Gene CHAPTER IV
79
gtcttacttgttctatccttactgacatc 29
M S S E I S T T S S G S G I T C I R A G W V I Q V D E E N S 30
ATG TCC AGC GAA ATC TCC ACC ACT TCA AGC GGC TCT GGA ATT ACC TGC ATT CGC GCT GGT TGG GTT ATC CAA GTC GAT GAA GAG AAT TCT 119
V I P D G C V V W D N E S H R I L N V C P F S E L P A D V E 60
GTC ATT CCC GAC GGT TGT GTC GTC TGG GAC AAC GAG TCC CAT CGA ATC CTC AAC GTT TGC CCT TTC TCT GAG CTC CCC GCT GAC GTC GAA 209
V T E H L P K H A I M P G M V N C H Q H T P M A P L R G Y S 90
GTG ACT GAG CAT CTT CCC AAG CAT GCC ATC ATG CCC GGC ATG GTC AAC TGC CAT CAA CAC ACC CCT ATG GCG CCT CTC AGA GGT TAC TCT 299
D D Q N L Q D W L Q Q Y V W P A E A K F L C S E Y V K L G T 120
GAT GAC CAG AAC TTG CAG GAC TGG CTC CAG CAG TAC GTC TGG CCT GCT GAA GCG AAG TTC CTC TGC TCG GAA TAT GTG AAG CTC GGA ACT 389
E L S V Y E M L L T G S T T F V D M Y Q F P H E T A E V A N 150
GAA CTT AGC GTC TAT GAG ATG CTT CTC ACC GGT TCG ACT ACA TTC GTC GAT ATG TAC CAG TTC CCC CAC GAA ACG GCC GAG GTT GCT AAC 479
A A H I R C F N G E S V M D L G D G T I D K M I D D G A E Y 180
GCT GCT CAT ATC AGG TGT TTC AAT GGC GAG TCA GTG ATG GAC CTT GGT GAC GGT ACC ATC GAC AAG ATG ATC GAC GAT GGT GCT GAA TAC 569
V N N K E N R S E M V T P L N I A H A T Y T V P K D K L K R 210
GTC AAC AAT AAA GAA AAT CGC AGC GAG ATG GTG ACT CCC TTG AAC ATC GCT CAT GCT ACT TAT ACG GTT CCC AAG GAT AAG CTG AAG AGA 659
I A A I A K P A G T L V H I H L N E S Q A E V D D Y F K Q H 240
ATC GCG GCA ATC GCT AAG CCA GCT GGA ACT CTA GTT CAT ATT CAT CTG AAC GAG TCA CAG GCC GAG GTT GAT GAT TAC TTC AAA CAG CAT 749
G E S A I D A I D E A G L L N D H L I A A H C V H M T D E E 270
GGC GAG TCT GCA ATT GAT GCC ATA GAC GAA GCG GGC TTG CTT AAC GAC CAC TTG ATC GCC GCC CAC TGT GTG CAC ATG ACT GAC GAG GAG 839
M A R F A K A G A S A V H C P R S N A K L A S G I A K V Q R 300
ATG GCC CGG TTC GCG AAA GCT GGC GCA AGC GCG GTT CAT TGC CCG CGC TCT AAT GCC AAG CTT GCG AGT GGC ATA GCT AAG GTA CAG AGG 929
M L D A G V N V C L G T D G P C S N N S V D M L Q E M Q Y A 330
ATG CTG GAT GCT GGT GTT AAC GTG TGC CTT GGT ACT GAT GGC CCC TGC AGC AAC AAC TCT GTG GAT ATG CTA CAG GAG ATG CAG TAC GCG 1019
S L L G K V A G P G M N P K A V N C Y T A V R M A T I N G A 360
AGT CTC TTA GGG AAG GTT GCA GGG CCC GGC ATG AAC CCT AAA GCC GTT AAC TGC TAC ACC GCC GTC CGT ATG GCA ACC ATA AAC GGT GCT 1109
R A V R R E S D L G S L E V G K L V D M I A I D L G R L E N 390
AGA GCT GTC AGG CGA GAG TCG GAC TTG GGA TCT CTT GAG GTC GGC AAG CTC GTC GAT ATG ATC GCC ATC GAC CTT GGC CGT CTG GAG AAT 1199
Q P V Y D P V S A I V Y T N Q R S V T D V W I G G D R V V Q 420
CAG CCC GTA TAC GAT CCT GTG TCA GCT ATT GTG TAC ACC AAC CAG AGA TCA GTG ACC GAC GTA TGG ATC GGA GGC GAC CGC GTC GTG CAG 1289
D R E V L S M R K P S A E K I A H Y Q K Q I A E F K A E R E 450
GAT AGA GAG GTT TTG TCG ATG CGC AAG CCT TCA GCT GAG AAG ATA GCG CAC TAC CAG AAG CAG ATA GCA GAG TTC AAG GCG GAG CGA GAG 1379
A V A A V Q A *** 457
GCC GTT GCG GCA GTA CAA GCA TAG tttttacttgctattttaccagcagattcggatttctcaatct 1446
Intron I
Intron II
Intron III Intron IV
Intron V
Intron VI Intron VII
Intron VIII
Intron XI
Intron X
Intron XI
Intron XII
Intron XIII
Intron IV
Figure IV- 4 Nucleotide sequences of the cDNA molecule encoding P. olseni chlorohydrolase-like (PoClhl). Numbering on the right side is according to the 5’end of the longest cDNA obtained (identified as number 1). The stop codon is marked with asterisks, the intronic insertion positions are indicated with a vertical line.

Molecular Characterization of a Chlorohydrolase-like Gene CHAPTER IV
80
ttcgtccctcccatcacaactgccgct 27
M S S E V S T K S S T A P V T C I R A G W V V Q V D E D N S 30
ATG TCA AGC GAA GTG TCC ACG AAA TCA AGT ACG GCC CCA GTC ACA TGC ATT CGT GCT GGG TGG GTG GTC CAA GTC GAT GAG GAT AAC TCT 117
V I P D G C V V W D N E S R R I L N V C P F S E L P A D F E 60
GTT ATT CCT GAC GGT TGT GTC GTT TGG GAC AAC GAG TCT CGC CGT ATC CTC AAC GTT TGC CCT TTT TCT GAG CTC CCG GCT GAT TTC GAG 207
V T E H L P E H A L M P G L I N C H T H S P M T P L R G Y S 90
GTC ACT GAG CAT TTG CCC GAG CAT GCC CTC ATG CCT GGC TTG ATC AAC TGC CAT ACA CAC TCC CCG ATG ACG CCC CTT AGA GGA TAT TCT 297
D D Q N L Q D W L Q K Y V W P A E G K F V C P E F V K L G S 120
GAT GAT CAG AAT TTG CAG GAT TGG CTT CAG AAG TAT GTC TGG CCT GCT GAA GGG AAG TTT GTT TGT CCA GAG TTT GTA AAG CTC GGC TCG 387
Q L G V Y E M L L S G S T A F V D M Y M F P H S V A E V A N 150
CAG CTC GGC GTG TAT GAG ATG CTC CTC TCT GGT TCT ACC GCC TTT GTG GAT ATG TAT ATG TTC CCT CAC TCA GTG GCT GAG GTA GCT AAT 477
A A H I R C F N G E A V M D I G D G S I D Q M I D A G A D Y 180
GCT GCA CAC ATC CGA TGC TTC AAT GGC GAA GCT GTG ATG GAT ATT GGC GAT GGC TCC ATC GAC CAG ATG ATC GAT GCT GGT GCT GAT TAT 567
V N N K D N R S D M V T P L N I A H T C Y T V P K D K L S R 210
GTC AAC AAC AAG GAT AAT CGC AGC GAC ATG GTT ACC CCC CTG AAC ATT GCA CAT ACC TGC TAC ACA GTG CCG AAG GAT AAG CTC AGC AGA 657
I S T I A E S A G T R V H V H L H E S Q A E V D D Y L K Q H 240
ATT TCT ACC ATT GCT GAA TCA GCC GGG ACC AGA GTT CAT GTC CAT CTT CAC GAA TCA CAG GCC GAG GTT GAC GAT TAC CTC AAG CAA CAC 747
G E S A I D A L D E A G L L N D H L I A A H C V H M T D D E 270
GGG GAG TCG GCT ATT GAT GCC TTG GAC GAA GCA GGC TTA CTT AAT GAC CAT CTT ATT GCG GCC CAC TGT GTG CAC ATG ACT GAT GAC GAG 837
I A R F A E A G A N A V H C P R S N A K L A S G I A K V Q R 300
ATT GCT CGG TTT GCT GAG GCG GGC GCT AAT GCT GTC CAC TGT CCA CGA TCG AAC GCC AAG CTT GCT AGT GGC ATA GCT AAG GTA CAG AGA 927
M L D A G V N V C L G T D G P C C N N S M D M L Q E M Q Y A 330
ATG CTG GAT GCT GGT GTG AAT GTG TGT CTT GGA ACT GAC GGA CCG TGT TGC AAC AAC TCG ATG GAT ATG CTA CAG GAG ATG CAA TAT GCA 1017
S L L G K V A G P V M S P K N V N C Y T A V R M A T I N G A 360
AGT CTA CTG GGA AAG GTT GCA GGA CCT GTT ATG AGC CCT AAG AAC GTC AAC TGT TAC ACT GCA GTT CGC ATG GCC ACT ATC AAC GGC GCT 1107
K A V G R E A D L G S L E A G K L V D M I A I D L G R L E N 390
AAG GCT GTT GGG AGA GAG GCG GAC CTG GGC TCA TTG GAA GCT GGT AAA CTC GTT GAT ATG ATC GCC ATC GAT CTG GGC CGT TTG GAG AAT 1197
Q P V Y D P V S S I V Y T N Q R S V T D V W I G A E R V V R 420
CAG CCC GTG TAT GAT CCT GTG TCA TCA ATT GTG TAC ACT AAT CAG AGG TCA GTG ACG GAT GTG TGG ATT GGG GCC GAG CGT GTT GTC CGA 1287
N R E V Q T M C K P S A E K L A E Y Q Q Q I A D F K A E R E 450
AAT AGA GAA GTT CAG ACC ATG TGT AAG CCA TCA GCC GAG AAG CTA GCT GAG TAC CAG CAG CAA ATA GCT GAT TTC AAG GCC GAA CGC GAG 1377
A A E S T A Q A *** 459
GCC GCT GAA TCT ACC GCA CAA GCT TAG tttcggactgttttgtttctactgrcaattctatcagctgagcctcgtgggagga 1459
Intron I
Intron II
Intron III
Intron IV
Intron V
Intron VI Intron VII
Intron VIII
Intron IX
Intron X
Intron XI
Intron XII
Intron XIII
Intron IV
Figure IV- 5 Nucleotide sequences of the cDNA molecule encoding P. marinus chlorohydrolase-like (PmClhl). Numbering on the right side is according to the 5’end of the longest cDNA obtained (identified as number 1). The stop codon is marked with asterisks, the intronic insertion positions are indicated with a vertical line.

Molecular Characterization of a Chlorohydrolase-like Gene CHAPTER IV
81
TAGATG
I II III IV V VI VII VIII IX X XI XII XIII XIV XV
Perkinsus olseni
Perkinsus marinus
100nt
TAG
I II III IV V VI VII VIII IX X XI XII XIII XIV XV
TAGATG
I II III IV V VI VII VIII IX X XI XII XIII XIV XV
Perkinsus olseni
Perkinsus marinus
100nt
TAG
I II III IV V VI VII VIII IX X XI XII XIII XIV XV
Figure IV- 6 PoClhl and PmClhl gene organization. Comparison of PmClhl and PoClhl gene structures. The exons are numbered for both species. The first nucleotide identified as number 1 for each gene corresponds to the first nucleotide of the corresponding full length cDNA.
Table IV- 2 PoClhl and PmClhl gene organization. Clhl genes exon-intron boundaries are compared. The first nucleotide identified as number 1 for each gene corresponds to the first nucleotide of the corresponding full length cDNA.
P. olseni P. marinus Exon Intron Exon Intron
No Size Position
Size Type Size Position
Size Type I 154 -29 - 1-125 93 1 153 1-152 48 1 II 136 219-354 81 2 136 201-336 323 2 III 130 436-565 209 0 65 660-724 55 1 IV 29 775-803 35 2 65 780-844 169 0 V 44 839-882 84 1 73 1014-1086 47 1 VI 89 967-1055 219 0 89 1134-1222 338 0 VII 53 1275-1327 75 2 53 1561-1613 72 1 VIII 98 1403-1500 56 0 112 1686-1797 31 2 IX 103 1557-1659 129 2 121 1829-1931 42 2 X 84 1787-1870 49 0 84 1981-2064 52 2 XI 121 1920-2040 49 2 121 2117-2237 44 0 XII 89 2090-2178 51 0 89 2282-2370 43 2 XIII 101 2230-2330 140 2 101 2414-2514 235 1 XIV 67 2471-2537 107 0 67 2750-2816 416 2 XV 149 2645-2792 163 3233-3395
For P. olseni this T- rich motif was located at -42 and for P. marinus at -29 nt. In
gene promoters from other chlorohydrolase family members, a Nitrogen- control motif
was described (Andersen et al., 1989) which appears to be present in both Po and
PmClhl genes at least twice (Table IV-3). The predicted PoClhl polypeptide also
presents the amidohydrolase domain (e- value 29.2 x10-67), as expected (InterPro Scan,
www.ebi.ac.uk).

Molecular Characterization of a Chlorohydrolase-like Gene CHAPTER IV
82
Table IV-3 Putative regulatory motifs in PoClhl and PmClhl promoters. Gene promoter analysis in silico revealed three putative motifs (A, B and C), common to P. olseni and P. marinus species. Sequences were aligned using Clustal W and edited using WebLOGO.
-42
-29
-105
-146
-52
-64
Localization
T-rich sequence
Putative NAC (ATA N9 TAT)
Type of motif
Motif CP. olseni
P. Marinus
Motif A
Motif B
P. olseni
P. Marinus
P. olseni
P. Marinus
Promoter motifMotif nameSpecies
-42
-29
-105
-146
-52
-64
Localization
T-rich sequence
Putative NAC (ATA N9 TAT)
Type of motif
Motif CP. olseni
P. Marinus
Motif A
Motif B
P. olseni
P. Marinus
P. olseni
P. Marinus
Promoter motifMotif nameSpecies
457aa
N-terminal C-terminal
Putative cyclin recognition sitePutative phosphorilation sitePutativeTyrosine sulfation site
Amidohydrolase domain
50 aa
1 aa
Figure IV- 7 Scheme of the predicted PoClhl polypeptide as deduced from in silico analysis using SignalP and Motif Scan (www.expasy.ch).
From in silico analysis, the PoClhl polypeptide appears as a non-secretory
protein as expected, a result confirmed by SignalP-NN analysis since no signal peptide
was identified. Motif Scan predicted various putative phosphorylation sites, one cyclin
recognition site and one putative tyrosine sulphating site (myhits.isb-sib.ch/cgi-
bin/motif_scan), as represented in figure IV-7. The comparison of the presently
described polypeptides with those from amidohydrolase family demonstrated a higher
similarity with the Proteobacteria, N. oceani, amidohydrolase (Table IV-4), described as
a cytosine deaminase and related metal-dependent hydrolase according to predicted
function. The in silico identification of PoClhl polypeptide as a member of the
amidohydrolase family remains to be confirmed by other type of analysis.

Molecular Characterization of a Chlorohydrolase-like Gene CHAPTER IV
83
Figure IV- 8 P. olseni and P. marinus Clhl alignment with amidohydrolase proteins performed with clustalW. The schematic presentation was constructed using WebLOGO. The highlighted residues are those which are relevant for the active site and those evolutionary conserved according to height in yy axes’. Numbering of the amino acid residues is referent to PoClhl. Amidohydrolase protein sequences were obtained from NCBI data base and accession numbers are those indicated in Table IV-4.
PoClhl and PmClhl presented the metal-dependent family domain and the motif
HxH, suggested to be coordinated by divalent-metals bound to specific residues. It also
contains the motif HxHxxE, relevant in substrate coordination at the active site (Figure
IV-8). The metal ligands, four histidines and one aspartic acid residue, are strictly
conserved in the three enzyme families, and define a subtle but sharp sequence signature
of a metal-dependent hydrolases superfamily (Holm and Sander, 1997). The N-terminal
HxH regions proposed to contain metal-coordinating histidine residues were reasonably
well conserved in all members of amidohydrolase protein family, which includes
dihydroorotase, adenine deaminase, ureases, cytosine deaminases, and s-triazine
hydrolase (Holm and Sander, 1997). For AtzA, this HxH motif was described to be
related to divalent cation coordination and was, accordingly, expected to be involved in
enzyme catalytic site, because the residues involved in its interaction with the substrate

Molecular Characterization of a Chlorohydrolase-like Gene CHAPTER IV
84
are also conserved (Sadowsky et al., 1998). These motifs were also described as
conserved for E. coli CD (Ireton et al., 2002). This metal ligand motif was found to be
well conserved in Perkinsus sp. Clhl (Figure IV-8), thus corroborating in silico analysis
which resolved PoClhl as part of superfamily of metal-dependent hydrolases. Among
the members of amidohydrolase superfamily there are a number of metalloenzymes.
From these, cytosine deaminase was identified as the most closely related to the atrazine
enzymes by sequence alignments (Shapir et al., 2005). However, the sequence identity
in pairwise comparisons among AtzA, AtzB, and AtzC was only on the order of 20%
(Sadowsky et al., 1998). PoClhl and PmClhl were also submitted to alignment to
highlight conserved residues between both sequences (Figure IV-8), revealing a
maximum identity of 35% with N. oceani amidohydrolase (Table IV-4).
The amidohydrolase superfamily is characterized by having a conserved (αβ) 8
barrel structure (Wilson and Quiocho, 1993). Accordingly, in silico analysis indicates
the same secondary structure for PoClhl and PmClhl. Comparison with amidohydrolase
family proteins from both bacterial and eukaryotic origin showed that both Perkinsus
Clhl proteins present conserved residues and motifs, although no conclusive proximity
to one functional protein neither its corresponding evolutionary distance can be
resolved. All known s-triazine catabolic enzymes that remove groups from an s-triazine
ring, including AtzB, AtzC, TrzA, TriA, TrzC, and TrzN, are evolutionarily related to
AtzA. Therefore, they are also members of the amidohydrolase superfamily as CD and
other enzymes that potentially bind catalytically essential metals (Seffernick and
Wackett, 2001). It was a surprise to find AtzA, AtzB, and AtzC placed in an ancient
class of amidohydrolases (Sadowsky et al., 1998). However, chlorohydrolase family
protein gene phylogenetic tree was not enough for meaningful in-group phylogenetic
analyses.

Molecular Characterization of a Chlorohydrolase-like Gene CHAPTER IV
85
Table IV- 4 P. olseni and P. marinus Clhl alignment with amidohydrolase proteins performed with clustalW and identity determined at Vector NTI.
Protein Organism
NCBI accession
no
% identity
% simil.
PoClh-l P.olseni 100 100 PmClh-l P. marinus 82 92 Amidohydrolase N. oceani ABA58753 35 68 Trza X. campestris YP_364306 32 68 Amidohydrolase M.flagellatus ZP_00566368 32 67 Amidohydrolase P.fluorescens ABA75817 31 67 Amidohydrolase N.multiformis ABB75479 33 67 Trza P.fluorescens YP_349808 31 67 Trza Halobacterium.sp AAG20370 33 67 Trza P.furiosus AAL81662 32 67 Chlorohydrolase/CD T.denitrificans AAZ96900 33 67 Trza P.syringae YP_236719 31 66 Atza C.tetanigi NP_782771 31 66 Atza D.desulfuricans YP_388304 30 66 Cytosine.deaminase P.aeruginosa ZP_00136515 31 66 Amidohydrolase M.burtoniigi ZP_00562287 29 65 Chlorohydrolase B.cereus YP_083276 30 65 Trza A.aeolicus G70352 28 65 Atza S.pombe T38111 28 64 Chlorohydrolase S.pneumoniae NP_345814 28 64 Chlorohydrolase M.maripaludis NP_988611 29 64 Trza O.sativa ABA98417 27 63 Trza H.marismortui AAV44960 22 62 Chlorohydrolase M.thermautotrophicus NP_276129 12 60 Trza RHOCO Q52725 21 58 Atza B.suis NP_700095 14 57 Chlorohydrolase H.pylori NP_207065 18 57 Atza P.fluorescens YP_346090 16 57 Atza P.syringae YP_233477 13 57 Atza Y.pseudotuberculosis YP_070485 12 56 Imidazolonepropionase B.bacteriovorusgi NP_969518 15 56 Atza X.campestris YP_363411 13 56 Trza B.bronchiseptica NP_886637 17 55 Haloalkane.dehalogenase LINB_PSEPA P51698 2 54 PcpA S.chlorophenolicumgi AAC64295 5 54 Hydrolase P.yoelii.yoelii XP_726045 1 53 Hydrolase C.hominis XP_666846 2 49 NAD.synthase P.chabaudi.chabaudi XP_745433 4 16 Glutamine-dependent synthetase
P.yoelii.yoelii XP_730516 9 13
Therefore it cannot provide important insights on the phylogenetic position of
Perkinsus sp. as a whole, on the identity of their close relatives and on specific
questions of evolutionary history. In addition to the molecular characterization,
functional analysis should be helpful to acquire a better description of this gene
function, followed by identification of the function of the corresponding protein and
improvement in the comprehension of Clhl activity.

Molecular Characterization of a Chlorohydrolase-like Gene CHAPTER IV
86
IV-3.3 Do 5-FC prodrug and 5-FU drug affect parasite growth?
In silico analysis indicated initially a higher homology to an amidohydrolase,
cytosine deaminase (CD) functionally related with a metal-dependent hydrolase.
A
0 2 4 6 8 10 120.0
0.2
0.4
0.6
0.8
1.0
1.2
1.4
1.6
no treatment controlsolvent control
100mM10mM
1mM
100uM
10uM
1uM
time (day)
gro
wth
(O
D 6
00 n
m)
B
2 6 120.0
0.5
1.0
1.5no treatmentsolvent control100mM10mM1mM100uM10uM1uM
time (day)
viab
ility
(O
D 4
90 n
m)
Figure IV- 9 P. olseni growth curve following exposure to various concentrations of the cytotoxic percursor 5-FC, during 12 days and monitored by absorbance at 600nm (A).Cell viability was checked in the 2nd and 12th day of treatment (B). Cell growth and viability under control conditions, in the absence of treatment and when treated with the vehicle solvent only.
Taking into account the specific characteristic of CD enzymes, we investigated
if this putative CD was active in a similar way in Perkinsus. 5-FC acts as an inhibitor of
both DNA and RNA synthesis through the intracytoplasmic conversion of 5-
fluorocytosine to 5-fluorouracil, the cytotoxic drug.

Molecular Characterization of a Chlorohydrolase-like Gene CHAPTER IV
87
A
0 2 4 6 8 10 120.0
0.2
0.4
0.6
0.8
1.0
1.2
1.4
1.6
no treatment controlsolvent control
1mM100uM
50uM10uM
1uM0.1uM
time (day)
gro
wth
(O
D 6
00 n
m)
B
2 6 120.0
0.5
1.0
1.5no treatmentsolvent control1mM100uM50uM10uM1uM0.1uM
time (day)
via
bil
ity
(OD
490
nm
)
Figure IV- 10 P. olseni growth curve under exposure to various cytotoxic concentrations of the drug 5-FU during 12 days and monitored by Absorbance at 600nm (A).Cells viability was checked in the 2nd and 12th day (B). Cell growth and viability under control conditions, in the absence of treatment and when treated with the control solvent only.
The prodrug is a cytosine analogue that is nontoxic to cells that lack the enzyme
cytosine deaminase (CD). To investigate the effect of CD specific substrates, the growth
of P. olseni culture was observed following treatment with various concentrations of the
prodrug (5-FC) and the drug (5-FU). Although P. olseni cell growth was apparently

Molecular Characterization of a Chlorohydrolase-like Gene CHAPTER IV
88
affected by 5-FC at a concentration of 10mM after a 3 days exposure (Figure IV-9A),
these differences were not confirmed by one-way ANOVA statistical analysis.
However, P. olseni proliferation was heavily compromised under the higher 5-FC
concentration (100mM). This fact was observed both after 2 and 12 days of treatment
(Figure IV-9B) although the cytoxicity may be resultant of CD activity leading to
deamination of 5-FC into the toxic product 5-FU. The statistical paired students t test
analysis revealed significant difference (P= 0.0152 *). The parasite trophozoite cell
culture growth was also affected by the direct cytoxicity of 5-FU at a concentration of
1mM and 10µM after 3 days exposure (Figure IV-10). In the case of P. olseni
sensitivity to the drug 5-FU, although the means did not show significant difference (P=
0.1014), the variances appeared to be significantly different (P< 0.0001 ***).
P. olseni cell culture was obviously more sensitive to the drug 5-FU. In the 4th
day of treatment the cell growth was significantly affected by the second lowest
concentration, i.e. 1µM (Figure IV-10A) and cell viability was already affected in the
2nd day of treatment at concentrations between 1mM and 50 µM. In the 12th day of
treatment the cells were severely affected by a range of lower concentrations, 1mM to 1
µM (Figure IV-10B) with significant differences (P= 0.0013 **) in proliferation
between cells grown in the presence or absence of drug treatment. This first approach
allowed the selection of the effective concentration range affecting cell growth and cell
viability. Although no direct conclusion about the possibility of Clhl being a CD could
be taken, it was possible to infer that this parasite possessed capability of deamination
5-FC to 5-FU, leading the prodrug to became cytotoxic.
IV-3.4 How sensitive is P. olseni to other chlorohydrolases
substrates/inhibitors?
The proliferation of parasite cells was tested in nitrogen-free medium when the
cells were submitted in vitro to specific enzyme substrate. In such nutrient stressing

Molecular Characterization of a Chlorohydrolase-like Gene CHAPTER IV
89
conditions, the provided substrate was the unique nitrogen source. Knowing the
substrate specificity of the hypothetical chlorohydrolases, these were tested to recognize
the protein function. In contrast to cytosine, the CD specific substrate, which led to an
increase in cell viability (Figure IV-11A) inducing a positive sigmoid growth- response
curve (r2=0.8378), the other substrates tested did not show any obvious utilization as
nitrogen source by the parasite cells. The same time of exposure to the substrate in
nitrogen-free medium, in the presence of increasing concentrations of atrazine
(r2=0.7217) and melamine (r2=0.9521) led to a decrease in cell proliferation according
to a sigmoid curve (Figure IV-11A).
A B
0 2 4 6 80
1
2
3
Log conc (log nM)
Cel
lula
r vi
abili
ty
2 4 6 8 100.00
0.25
0.50
0.75
1.00
Log conc (log nM)
Cel
lula
r vi
abili
ty
Figure IV- 11 P. olseni cells sensitivity to chlorohydrolases specific inhibitors (A) and specific substrates (B). The results came from 2 independent experiments with triplicates.
Sensitivity assays do not confirm the existence of an AtzA or a TrzA in P. olseni
parasite. TrzA was described to catalyze the deamination of melamine (Grossenbacher
et al., 1984) but in our experiments no change was observed in viability or proliferation
of P. olseni trophozoits induced by melamine. Both substrates had effects on
proliferation at the higher doses tested, probably associated with toxic concentration.
AzacytosineHydroxypyrimidine
MelamineAtrazineCytosine

Molecular Characterization of a Chlorohydrolase-like Gene CHAPTER IV
90
From the three possible substrates tested (cytosine, melamine and atrazine),
cytosine was the only one that increased cell proliferation in vitro (Figure IV-11A).
TrzA and AtzA inhibitor, azacytosine had no effect in the range of concentrations used
(deviation not significantly different from zero for P=0.9815). The cellular viability
decreased with increasing concentration of hydroxypyrimidine (r2=0.81), the CD
inhibitor (Figure IV-11B). This indicates the existence of enzymes able to metabolize
this single substrate as nitrogen source. By homology, P. olseni cells also deaminate the
prodrug 5-FC into the cytotoxic agent 5-FU (Figure IV-9 and Figure IV-10). Although
CD inhibitor was the only that decreased the cell proliferation, these facts could not
confirm if the observed endogenous activity of CD was due to the activity of PoClhl
enzyme. Altogether, our data corroborated the hypothesis of the existence of an
endogenous protein in P. olseni responsible for the utilization of cytosine as substrate
and inhibited by hydroxypyrimidine. However, the hypothesis of PoClhl being a CD
could not be answered and will need further studies.
IV-3.5 Does exposure to R. philippinarum affects PoClhl gene expression?
Since PoClhl was the most represented EST obtained in the cDNA subtractive
library constructed to identify P. olseni up-regulated genes in response to host
hemolymph, we analysed if PoClhl gene expression was altered upon exposure of
parasite trophozoites to cell- free hemolymph (serum) from the clam R. philippinarum, a
permissive host. These clams were obtained from North Eingstown (American Mussels
Harvesters, Inc) and were verified not to be infected by Perkinsus sps. using PCR
diagnosis assay.

Molecular Characterization of a Chlorohydrolase-like Gene CHAPTER IV
91
A
PoClhl
PoUbq
FBSSASW48 hours
24 hours
6 hours
2 hours
1 hour30 min5 minCtr
PoClhl
PoUbq
FBSSASW48 hours
24 hours
6 hours
2 hours
1 hour30 min5 minCtr
B
Ubq
Clhl
111098764210.1Days
Ubq
Clhl
111098764210.1Days
Figure IV- 12 PoClhl expression by RT-PCR. Total RNA was extracted after different times of P. olseni cell exposure to host serum (hemolymph cell-free): (A) exposed from 5 min to 2 days and (B) from 2 hours to 11 days. RT- PCR PoClhl gene expression was normalized to Po ubiquitin expression, used as housekeeping gene.
PoClhl gene expression was observed by RT- PCR during a 2 day challenge but
no differences where observed compared to control expression of polyubiquitin gene
(PoUbq) expression (Figure IV-12A). Later, the PoClhl gene expression was also
analysed in response to a longer 11 day exposure, and again no change was detected in
gene expression (Figure IV-12B). However, some pathogenic protozoa have the ability
to salvage pyrimidines under nutrient stressing conditions (Marr and Müller, 1995). If
Clhl was a CD there should be a relation between gene expression and the parasite
exposure to host. Based on the results of specific deamination of 5-FC and increased
cell proliferation by cytosine there were some evidence for the presence of an
endogenous CD enzyme.
From our gene expression studies it was clear that host presence did not have
any influence in PoClhl gene expression. Although the possibility of acquiring their
nucleotides from their host using salvage pathways (Marr and Müller, 1995) is of vital
importance for parasites, in silico evidence indicated the presence of de novo pyrimidine

Molecular Characterization of a Chlorohydrolase-like Gene CHAPTER IV
92
synthesis, corroborating the fact of Perkinsus being a facultative parasite. Under
nutrient stress conditions the parasite P. olseni probably can synthesize its pyrimidines
using either de novo pathway and/ or salvage pathway, according to surrounding
conditions. This may also explain the absence of gene regulation following host serum
treatment. So PoClhl presents no visible regulation in response to host exposure. Also
the fact of the parasites being maintained in just a reduced volume of cell culture
medium may explain a non- stressing nutrient condition, so the salvage pathway would
not be activated and no variations in gene expression would be observed.
IV-3.6 Is PoClhl a CD enzyme involved in the pyrimidine salvage pathway?
If PoClhl was a CD, its expression pattern would be influenced by 5-FC and 5-
FU when cells were exposed to 3 different concentrations of CD specific substrate.
These concentrations were tested and in all three cells survived allowing extraction of
total RNA for gene expression analysis. Results showed no visible difference in PoClhl
gene expression (Figure IV-13).
5-FU5-FC
PoClhl
PoUbq
(-)1 µM10 µM1mM1µM100 µM10mM
5-FU5-FC
PoClhl
PoUbq
(-)1 µM10 µM1mM1µM100 µM10mM
Figure IV- 13 PoClhl expression by RT-PCR. Total RNA was extracted from P. olseni cell culture submitted to various concentrations of the prodrug, 5-FC and to the drug, 5-FU. Changes in expression of PoClhl gene were checked and compared to those of Po ubiquitin, chosen as housekeeping gene.
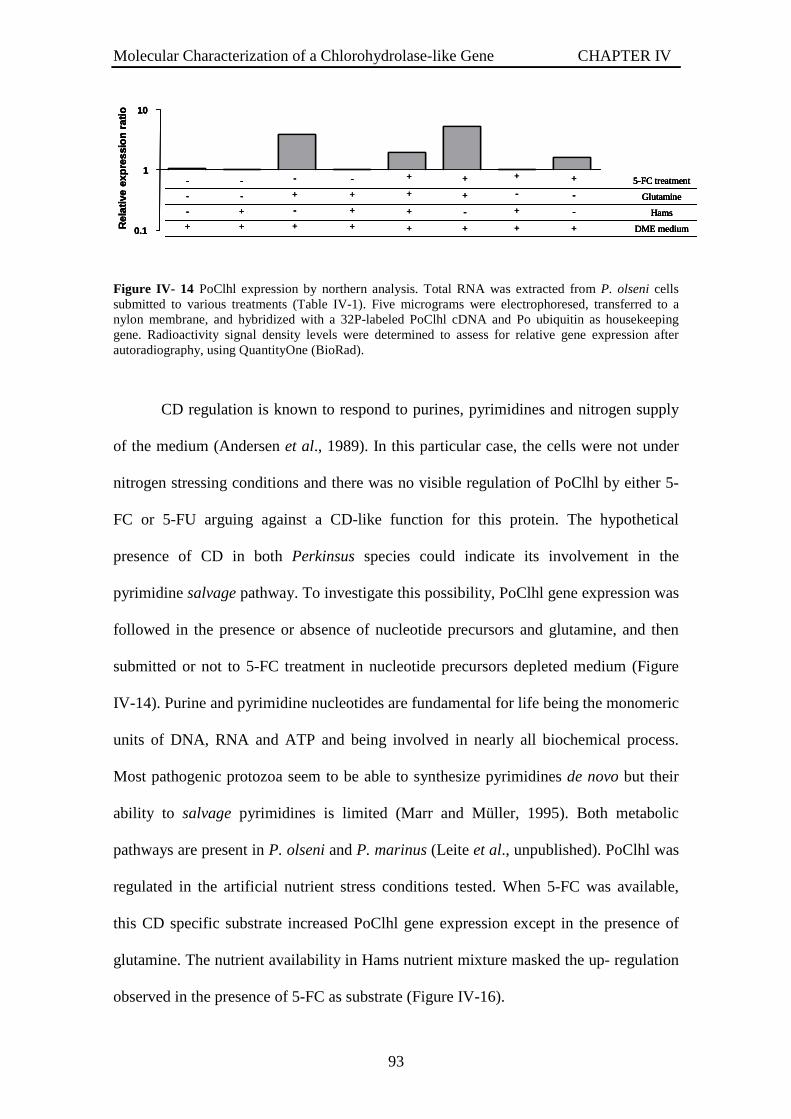
Molecular Characterization of a Chlorohydrolase-like Gene CHAPTER IV
93
0.1
1
10R
elat
ive
exp
ress
ion
rat
io
+
-
-
-
+
+
-
-
+
-
+
-
+
+
+
- +
+
+
-
+
+
-
+
+
+
+
+
+
+
-
-
5-FC treatment
DME medium
Hams
Glutamine
0.1
1
10R
elat
ive
exp
ress
ion
rat
io
0.1
1
10R
elat
ive
exp
ress
ion
rat
io
+
-
-
-
+
+
-
-
+
-
+
-
+
+
+
- +
+
+
-
+
+
-
+
+
+
+
+
+
+
-
-
5-FC treatment
DME medium
Hams
Glutamine
+
-
-
-
+
-
-
-
+
+
-
-
+
+
-
-
+
-
+
-
+
-
+
-
+
+
+
-
+
+
+
- +
+
+
-
+
+
+
-
+
+
-
+
+
+
-
+
+
+
+
+
+
+
+
+
+
+
-
-
+
+
-
-
5-FC treatment
DME medium
Hams
Glutamine
5-FC treatment
DME medium
Hams
Glutamine
Figure IV- 14 PoClhl expression by northern analysis. Total RNA was extracted from P. olseni cells submitted to various treatments (Table IV-1). Five micrograms were electrophoresed, transferred to a nylon membrane, and hybridized with a 32P-labeled PoClhl cDNA and Po ubiquitin as housekeeping gene. Radioactivity signal density levels were determined to assess for relative gene expression after autoradiography, using QuantityOne (BioRad).
CD regulation is known to respond to purines, pyrimidines and nitrogen supply
of the medium (Andersen et al., 1989). In this particular case, the cells were not under
nitrogen stressing conditions and there was no visible regulation of PoClhl by either 5-
FC or 5-FU arguing against a CD-like function for this protein. The hypothetical
presence of CD in both Perkinsus species could indicate its involvement in the
pyrimidine salvage pathway. To investigate this possibility, PoClhl gene expression was
followed in the presence or absence of nucleotide precursors and glutamine, and then
submitted or not to 5-FC treatment in nucleotide precursors depleted medium (Figure
IV-14). Purine and pyrimidine nucleotides are fundamental for life being the monomeric
units of DNA, RNA and ATP and being involved in nearly all biochemical process.
Most pathogenic protozoa seem to be able to synthesize pyrimidines de novo but their
ability to salvage pyrimidines is limited (Marr and Müller, 1995). Both metabolic
pathways are present in P. olseni and P. marinus (Leite et al., unpublished). PoClhl was
regulated in the artificial nutrient stress conditions tested. When 5-FC was available,
this CD specific substrate increased PoClhl gene expression except in the presence of
glutamine. The nutrient availability in Hams nutrient mixture masked the up- regulation
observed in the presence of 5-FC as substrate (Figure IV-16).

Molecular Characterization of a Chlorohydrolase-like Gene CHAPTER IV
94
PoClhl transcription was up-regulated in the presence of glutamine, the most
important metabolite in the pyrimidine pathway, which induces CD in order to balance
uracil/cytosine nitrogen bases. Nitrogen source was described to be responsible for the
regulation of codBA operon of Escherichia coli (Muse et al., 2003) corroborating our
results for PoClhl gene expression. In the absence of nutrient mixture, i.e. the Hams
medium that supplements the media with amino acids such as proline and alanine, and
in the presence of glutamine, there was a clear up-regulation of Clhl. In contrast, the
presence of nucleotide precursors in the medium reduced gene expression to the
constitutive levels (Figure IV-14). These results could be related to the fact that alanine
metabolism may lead to uracil synthesis. In alanine’s presence, as also for other
nucleotide precursors, thymidine and hypoxanthine alternative metabolic pathways
could be used to maintain nitrogen base levels in the cell, instead of using salvage
pathway (Figure IV-15). Hypoxanthine presence in the medium decreased PoClhl
expression (Figure IV-14) as was described for E. coli codBA expression (Muse et al.,
2003). PoClhl was up-regulated by 5-FC in the absence of Hams, consequently,
hypoxantine may explain a reduction of this gene expression in presence of 5-FC
(Figure IV-14). Surprisingly, in contrast with data observed for PoClhl and for E.coli
codBA, it was previously published that hypoxanthine increased K. pneumoniae gene
expression and increased also the sensitivity to fluorocytosine for K. pneumoniae (Muse
et al., 2003), a result difficult to explain in light of both P. olseni and E. coli available
data.
Figure IV-15 illustrates a possible hypothesis to interpret the results obtained
through a model diagram showing the up-regulation of Clhl in the presence of
glutamine, which is determinant in two steps of pyrimidine metabolism. So, data on
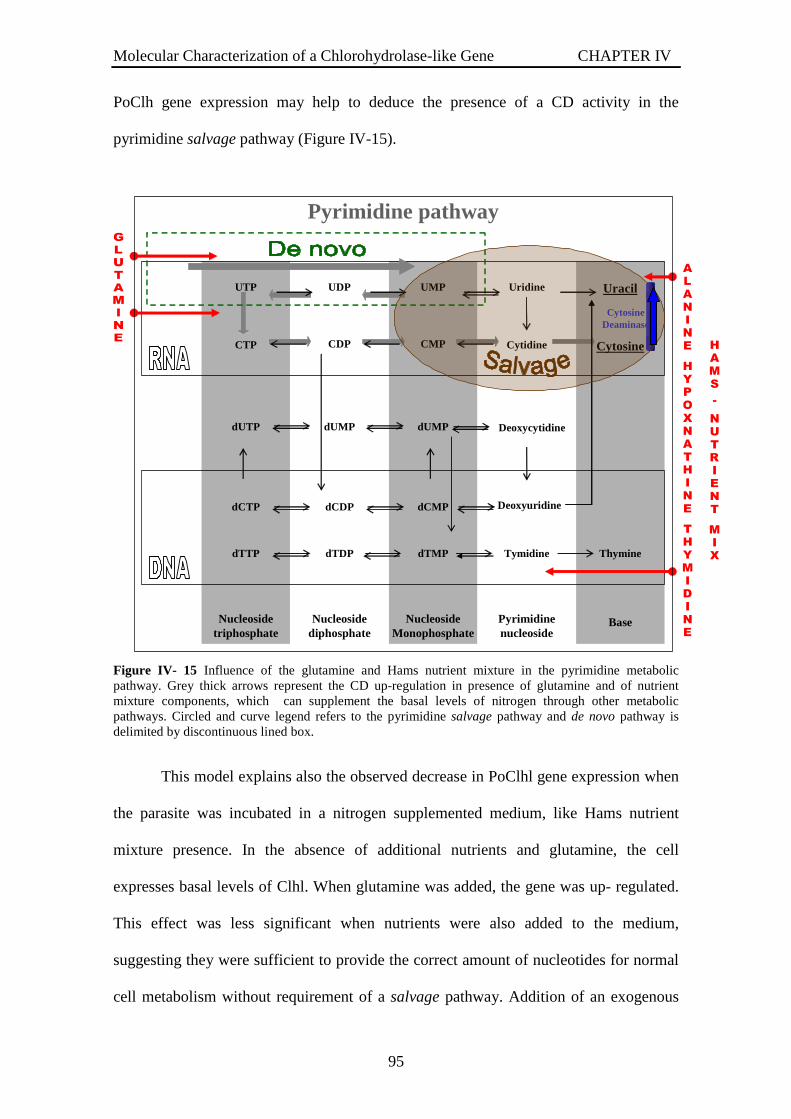
Molecular Characterization of a Chlorohydrolase-like Gene CHAPTER IV
95
PoClh gene expression may help to deduce the presence of a CD activity in the
pyrimidine salvage pathway (Figure IV-15).
Nucleoside triphosphate
Nucleoside diphosphate
Nucleoside Monophosphate
Pyrimidinenucleoside
Base
Uracil
Cytosine
ThymineTymidine
Cytidine
UridineUTP UDP UMP
CMPCDPCTP
dUMPdUMPdUTP
dCTP dCDP dCMP
dTMPdTDPdTTP
Cytosine Deaminase
Deoxycytidine
Deoxyuridine
Pyrimidine pathway
Figure IV- 15 Influence of the glutamine and Hams nutrient mixture in the pyrimidine metabolic pathway. Grey thick arrows represent the CD up-regulation in presence of glutamine and of nutrient mixture components, which can supplement the basal levels of nitrogen through other metabolic pathways. Circled and curve legend refers to the pyrimidine salvage pathway and de novo pathway is delimited by discontinuous lined box.
This model explains also the observed decrease in PoClhl gene expression when
the parasite was incubated in a nitrogen supplemented medium, like Hams nutrient
mixture presence. In the absence of additional nutrients and glutamine, the cell
expresses basal levels of Clhl. When glutamine was added, the gene was up- regulated.
This effect was less significant when nutrients were also added to the medium,
suggesting they were sufficient to provide the correct amount of nucleotides for normal
cell metabolism without requirement of a salvage pathway. Addition of an exogenous

Molecular Characterization of a Chlorohydrolase-like Gene CHAPTER IV
96
substrate such as 5-FC led to an additional increase in Clhl expression except when
nutrients were provided and glutamine was absent. According to the gene expression
pattern and by comparison with the pyrimidine metabolic pathways it was possible to
hypothesize that PoClhl behaved as a CD. This response could be related to the
presence of Ntr transcription regulation since a putative Nitrogen-control motif,
previously found in the promoter region of other chlorohydrolases, was also present in
Clhl promoter region for both species (Table IV-3). A similar situation was already
observed for E. coli codBA (Muse et al., 2003). Altogether, parasite cells responded in
agreement with the hypothesis that Clhl enzyme was involved in the pyrimidine salvage
metabolism. But additional gene expression studies were performed in order to clarify if
PoClhl was a CD or other member of the family of chlorohydrolase proteins.
IV-3.7 Is PoClhl endogenous expression affected by specific substrates?
PoClhl gene expression was analysed in response to the various specific
substrates and inhibitors of the potential chlorohydrolase proteins. There were no
significative differences in gene expression in response to any specific substrate tested
(Figure IV-16), only a slight up-regulation in response to cytosine, the CD substrate,
compared to not treated (basal line 1). PoClhl gene regulation was not significantly
associated with either pyrimidine precursors or with the specific substrates. Only CD
substrates showed a slight up-regulation effect (Figure IV-16).
After analysing all the data obtained, no clear conclusions could be taken from
the gene expression analysis. In a similar study, in two bacterial strains isolated from
soil, atz genes showed a basal expression, as observed for P. olseni, but in response to
atrazine treatment the gene was up-regulated (Devers et al., 2004), a result that was was
not observed for PoClhl. Since PoClhl gene expression indicated that P. olseni

Molecular Characterization of a Chlorohydrolase-like Gene CHAPTER IV
97
possessed an enzyme involved in nitrogen metabolism, it probably has no association
with atrazine degradation. Based on the effect of CD substrates and inhibitors on P.
olseni cells, further studies must be performed at the protein level to ascertain whether
the hypothesis of PoClhl being a CD is real.
0,1
1
10
cyt 5FC 5FU CEIT Mel 2HP Aza
Figure IV- 16 PoClhl gene expression in response to Clhs specific substrates and inhibitors. The gene expression was analysed by Real Time pPCR, when the parasite cells were submitted to EC50 concentration of each chemical. PoClhl gene expression was determined and compared to expression of PoUbq, used as housekeeping gene (substrates: cyt states for cytosine, 5FC for 5- fluorocytosine, 5FU for 5-fluorouracil, CEIT for Atrazine, Mel for Melamine and inhibitors: 2HP states for 2- hydroxypyrimidine and Aza for Azacytosine).
IV-3.8 Was PoClhl in vitro expressed a functional protein?
The TNT® Quick Coupled Transcription/Translation Systems (Promega) was
convenient for single-tube, coupled transcription/translation reactions to study in vitro
translation. In this case and to ensure the synthesis of PoClhl protein, two reactions,
experiment and control, were analysed by SDS-polyacrylamide gel electrophoresis
(SDS-PAGE) and compared. The predicted size expected for PoClhl was 50kD (Vector
NTI) but no protein band was visible at this MW making it impossible to ensure that it
had been indeed transcribed/translated. This did not allow us to investigate if there were
any differences between control and experiment (Figure IV-17). Since there is no
antibody available, there was no possibility of confirmation by western blot. The
functional assays were performed as an attempt to detect the activity of the protein even

Molecular Characterization of a Chlorohydrolase-like Gene CHAPTER IV
98
though there was no visible presence of the protein in 1 and 2 µl of reaction product.
For functional analysis, various concentrations of each substrate were observed under
all wave lengths and the expected results of decreasing absorbance with time were not
observed. So activity of the hypothetically translated PoClhl could not be confirmed.
188
kDa
62 49
38
28
18
14
6
3
Control PoClhl
1ul 2ul 1ul 2ul
M
Figure IV- 17 TNT protein in vitro expression using the TNT quick coupled transcription and translation system (Promega) and SDS- PAGE in reductant conditions followed by CBB staining. M signs for SeeBlue protein Marker (Invitrogen).
IV-3.9 Is the PoClhl protein expressed and functional in the prokaryotic
system?
PoClhl was successfully cloned in pET3His-2 vector kindly provided by Marc
Ohresser and BL21 competent cells were transformed with the construct
PoClhlpET3His-2. The construct PoClhlpET3His-2 was confirmed by sequence
analysis after being cloned in DH5-alpha and the isolated vector was later cloned in
BL21 p-Lys cells. Two clones were identified as positive, used to obtain the final

Molecular Characterization of a Chlorohydrolase-like Gene CHAPTER IV
99
construct, and then used for PoClhl protein functional assay. They were designated
PoClhlpET3His-2_BL21-41 and 45. These clones were stored in 50% glycerol at -80ºC.
First, no significant differences in the protein content were observed (P= 0.2998)
for BL21 cells, either transformed with the pET3a empty vector or with
PoClhlpET3His-2 (Figure IV-18A), as quantified by BCA protein assay (Pierce) and
during 3 hours.
A B
pET3a-B
L21
PoClhlp
ET3His
2_41
-BL21
PoClhlp
ET3His
2_45
-BL21
0.0
0.5
1.0
0 h2 h3 h
Ab
s 59
5 n
m
0.0
0.2
0.4
0.6ControlCEITMelamineCytosine
Abso
rban
ce
Control Clone 41 Clone 45 Figure IV- 18 Protein activity observation in the BL21 transformants with PoClhlpET3His-2. Quantification of protein content using BCA protein assay (Pierce) along time (A) and preliminary results of measurement of substrates specific absorbance at 39 hours to check PoClhl activity (B).
Although results showed no differences in protein expression between the
control, empty vector and the two clones with the construct, preliminary functional
assays were performed. The PoClhl protein activity was not visible using 1 mM of
IPTG inducting the reaction of substrate degradation. This was observed by decreasing
specific OD of each substrate (Figure IV-18B). The substrate degradation using the cell
extracts revealed no PoClhl activity also.

Molecular Characterization of a Chlorohydrolase-like Gene CHAPTER IV
100
kDa
188
62
49
38
28
1814
6
3
50kDa
BL21PoClhlBL21
Figure IV- 19 PoClhl protein expression in prokaryotic system. PoClhlpET3His-2_41 expressed by BL21-pLys induced ON at RT by IPTG and electrophoresed in 4-12% polyacrilamide gel compared to BL21 induced (A) and PoClhlpET3His-2_41 and 45 SDS-PAGE and western blot with anti-his, SaBGP-his alfa primary antibody and anti- alkaline fosfatase secondary antibody (B).
The positive clones maintained the construct but there was no observable protein
activity along time using the substrates mentioned. It were also performed resting cell
assays using the two clones and the control plated in N-free medium in order to observe
the growth of the clones cultured in presence or not of N-source and in presence of each
substrate as the only N-source. No differential growth was observed between the
various plates with different N-source substrates. The induction of protein expression in
the BL21 expressing clones (PoClhlpET3His-2_BL21-41 and 45) was tested using
different IPTG inductor concentration.
The induction and growth was then performed at 20mM IPTG. This was the
minimum concentration that resulted in the maximum increase in protein content. The
kDa
188
62
49
38
28
1814
6
3
4 3 2 1
M PoClhlBL21 X PoClhlBL21
60kDa
30kDa
1200kDa90kDa

Molecular Characterization of a Chlorohydrolase-like Gene CHAPTER IV
101
expected 50kDa protein was isolated by his- tag MaxWell system (Promega) from
BL21-pLys cells induced by 20mM IPTG, overnight (ON) at room temperature (RT)
and the protein production was checked by SDS-PAGE (Figure IV-21A). PoClhl
expression was confirmed using anti- his- tag antibody by western blot using crude
extracts and isolated proteins from induced cell cultures grown for 2 hours at 37ºC and
ON for both clones were obtained. It was observed a smaller protein of 30kDa and
typical aggregation of His-tagged protein with multiples size (Figure IV-19B). In
conclusion, although PoClhl was expressed in prokaryotic system, the protein function
was not observed in crude extracts.
IV-3.10 How was the PClhl expression and activity in the eukaryotic
exogenous system?
Clonogenic assays were performed in a eukaryotic system to express functional
PoClhl and assess the sensitivity of transformants to cytosine, melamine and atrazine in
nitrogen-free medium. The X. laevis epithelial cell line was used and previously assayed
for the enzyme activity to ensure no endogenous activity in presence of the substrates in
study.
X. laevis A6 cells responded in a sigmoid-dose response curve to 5-FU (0.9559)
while for 5-FC the linear regression reveals that the deviation from zero is not
significant (Figure IV-20). So although the prodrug was observed, no toxic effects were
detected since those eukaryotic cells do not possess the CD enzyme that converts the
prodrug 5-FC to the cytotoxic 5-FU. For this fact this model was used to check if the
PoClhl is a CD and identify its function. The presence of PoClhl transcripts in both
Perkinsus sp. suggested the existence, in these parasites, of a nitrogen active enzyme.
This hypothesis was supported by preliminary results suggesting that the Clhl behaves

Molecular Characterization of a Chlorohydrolase-like Gene CHAPTER IV
102
as CD when expressed in the eukaryotic exogenous system. The protein activity in
transient transfected cells confirmed the utilization of cytosine as substrate as also the
transformation of 5-FC into the cytotoxic drug 5-FU.
0 1 2 3 4 5 6 7 80.00
0.25
0.50
0.75
1.00
1.25
5-FC5-FU
log concentração (nM)
Cel
lula
r vi
abil
ity
Figure IV- 20 X. laevis kidney epithelial derivate cells sensitivity to prodrug, 5- FC and drug, 5- FU.
To confirm these preliminary results, we needed to develop stable clones
expressing PoClhl to make an activity assay. A6 cells transfected with PoClhlpcDNA3
were submitted to selection in order to try to develop clones that would have kept and
integrated the construct into their genome. The positive clones were stored in liquid
nitrogen and used to test for protein activity, by checking cells for their sensitivity to
specific substrates and inhibitors. Clone stability was observed by RT-PCR which
confirmed the presence of the construct and its transcription (Figure IV-21A). Although
not statistically significant, for clone 1 there appeared to be a slight decrease in cell
viability when they were submitted to 2-HP, the CD specific inhibitor (a result needing
confirmation). However the substrates that appeared to increase cells proliferation were
melamine and atrazine (CEIT, Figure IV-21B). No conclusive results could be taken

Molecular Characterization of a Chlorohydrolase-like Gene CHAPTER IV
103
after a second experiment that did not corroborated the first results. So, it was not
possible to infer if PoClhl was being expressed neither if PoClhl was active as a CD.
A second approach was performed cloning PoClhl fused to EGFP protein using
pEGFP-N1. A6 cells were definitely transfected with this construct. There was a
confirmation of protein expression in the eukaryote system by detection of the
fluorescent protein (Figure IV-22A). Western blot using the cell extract showed a band
of a size different from what was expected which could indicate that the expected
protein was displaying a different behaviour in the gel, appearing to run at a MW less
than the expected (Figure IV-22A).
A
(-) (+) Empty vector
Clone 1 Clone 2A6 cells
A6 transfected
B
0,1
1
10
no drug FU
FC
Cyt
CE
IT
Mel
2HP
Aza
cyt
no drug FU
FC
Cyt
CE
IT
Mel
2HP
Aza
cyt
empty vector clone 1
Cel
lula
r vi
abili
ty
Figure IV- 21 Analysis of the A6 X. laevis derived cells transfected with PoClhlpcDNA3. Confirmation of the presence of the construct/ PoClhl expression (A) and analysis of the transfected cells sensitivity to PoClhl potential substrates and inhibitors (B).
A careful observation of the fluorescence in the cells revealed a differential
localization of EGFP, mainly nuclear, while PoClhl-fused-EGFP was mainly

Molecular Characterization of a Chlorohydrolase-like Gene CHAPTER IV
104
cytoplasmatic (Figure IV-22B and Figure IV-22C). Despite the various tests of
functionality checking for substrates specificity, no further information was obtained in
terms of PoClhl activity, which could indicate that the fusion protein was not active.
One clone expressing EGFP and 6 clones expressing PoClhl-fused-EGFP were
cryopreserved and further studies must be performed using different strategies in order
to ascertain whether the expressed protein is functional or not. If it was proven to be a
cytosine deaminase, this P. olseni protein could then be tested for GDEPT after
calculating the degree of activation (Springer and Niculescu-Duvaz, 2000) According to
its characteristics this could be a potential tool for negative selection as previously
pointed out for other systems and compiled in Table IV-5.
A
B
62kDa
Cyt. Nuc X TotalM Total Nuc Cyt
iiI
62kDa
Cyt. Nuc X TotalM Total Nuc Cyt
iiI
i
ii
C
DAPIDIC EGFP MergedMito-tracker
ii
i
DAPIDIC EGFP MergedMito-tracker
ii
i
Figure IV- 22 Expression analysis of protein α by Western blot. A6 cells transfected with 0.5 µg of plasmid pEGFP-N1 (i) and PoClhlfusGFP, green bar indicates EGFP and black bar indicates protein

Molecular Characterization of a Chlorohydrolase-like Gene CHAPTER IV
105
PoClhl (ii) EGFP- fusion protein (A) was harvested at 48 h posttransfection and assayed using anti-GFP by Western blot analysis (B). Localization of EGFP-α fusion protein in transfected A6 cells. Cells were transfected with PoClhlfusGFP plasmid with Fugene6 (Roche). A6 cell expressing EGFP- fusion protein at 36 h posttransfection: image of nucleus stained with DAPI, image of mitochondria stained with Mitotraker and merged images. The merged image represents a superimposition of green, blue and red signals where areas of fluorescence co-localization are yellow-orange. The images were viewed with a Leica 550 IW fluorescence microscope and photographed in 200× amplification.
Table IV- 5 Quantitative data on (GDEPT) systems. Comparison of various systems for GDEPT based on the data from Springer and Niculescu-Duvaz (2000).
None?8.164.14933.884PoCD/5-FC12
2 70–1,000 100–8,000 5-FU: 4–23.5 26,000 CD/5-FC 11
None55–600 > 2,000 5-FUdR: 0.0023 > 2,000 VZV-TK/ara-M 10
k165 7000 3.7 17 TP/5¢-DFUR 9
None40 25–1,000 0.02N > 200 PNP/6-MePdR 8
None14–10,000 > 50,000 GCVTPK > 1,000NR/CB1954 7
> 21 20–1,000 K K GCV: 200–600SV-TK/GCV, ACV 6
None 2–100 K J 0.3–0.6 dCK/ara-C 5
1 5–60 50–100L K Doxorubicin: 0.012
CP, IF ~ 4,000 Cyt-450/CP, IF, ipomeanol, 2-AA 4
None CMDA: 10– 115; CMDA: 26– 390; Doxorubicin: 11 CMBA: 8–65;
CMDA: 1,700–3,125;CJS278: 0.256
CPG2/CMDA, CJS278H 3
None6-TX: >20; 6-TG: 10 K Ara-MTP < 1Q K 6-TX > 50; 6-TG =
0.5 XGPRT/6-TX, 6-TG 2
1 7–17 150–3,000 SN-38: 0.003–0.011
1.6–8.1 CA/CPT-11 1
Clinical trial
Degree of activationC (fold)
Potential of activationB (fold)Drug ProdrugEnzyme/ prodrug
systemno
Potency, IC50 (uM)
IV-4 Conclusions
P. olseni chlorohydrolase like protein was found to be the most represented
transcript from the cDNA subtractive library of parasite host- response. Both P. olseni
and P. marinus presented these novel described proteins and P. olseni gene was up-
regulated only in the presence of 5- FC as nitrogen source. PoClhl presented a basal
expression in several conditions studied, namely in response to host exposure and
environmental stressing conditions. PoClhl gene expression was increased in nutrient
stressing conditions in the presence of CD specific substrate, while the presence of CD
specific inhibitor resulted in decreased PoClhl gene expression, reinforcing the
hypothesis of PoClhl being a CD. This was a potentially important result since this

Molecular Characterization of a Chlorohydrolase-like Gene CHAPTER IV
106
protein was never described in protozoan parasites. Given the possibility that this gene
could be involved in nitrogen metabolism, and some preliminary evidence suggested
that PoClhl could be a CD enzyme involved in pyrimidine salvage, functional studies
were attempted using an exogenous system. However, no observable activity was
detected using the in vitro synthesized protein, nor in protein expressed in the BL21-
pLys prokaryotic system. These functional assays were based on substrate degradation
observed through the decreasing absorbance at each substrate specific wave length.
Another attempt was made using a eukaryotic system, but the results were again not
conclusive. Endogenously, both Perkinsus sp. parasite trophozoites revealed sensitivity
to 5-FC, the prodrug and CD specific substrate. P. olseni presented an increased cell
proliferation with cytosine as complementary source of nitrogen and was affected by
hydroxypirimidine, a CD specific inhibitor. All this corroborated the inference of
PoClhl being a CD but we could not confirm this data by functional assays and
therefore further studies are required. Interestingly, since the expression of PoClhl did
not appear to be affected in most of the conditions tested it could be used as a reference
gene for gene expression analysis in Perkinsus. In subsequent work in our laboratory we
have already used PoClhl as a housekeeping gene with success (Leite et al., 2008).
Parasite Response to Surroundings CHAPTER V
CHAPTER V – PARASITE RESPONSE TO SURROUNDINGS
“Host-parasite interaction is important to the parasite protozoa, since their survival
depends on the host cells that supply the environmental and nutritional requirements”
by William Trager from John Guardiola, L. Luzzatto and William Trager (1983)
Molecular Biology of Parasites, Raven Press

Parasite Response to Surroundings CHAPTER V
V-1 Introduction
The protozoan pathogen P. olseni (Lester & Davis, 1981) is known to infect
clam beds along southern Europe including French, Spanish and Portuguese coasts.
However, it has been associated with episodes of massive mortalities of the carpet-shell
clam Ruditapes (Tapes) decussatus (Linnaeus, 1758) essentially in southern Portugal, in
the 80ies (Azevedo, 1989b). Available data suggests that environmental conditions,
such as temperatures, salinities and pollutants, may be involved in this higher rate of
mortality, but until now there is insufficient knowledge concerning the molecular
response of this parasite to its host, thus precluding our understanding on how these
factors can affect infection. R. decussatus and R. philippinarum are both susceptible
bivalves to P. olseni infection but Perkinsosis does not significantly affect the wedge-
shell clam Donax trunculus (Linnaeus, 1767), the blue mussel Mytilus galloprovincialis
(Lamarck, 1919) or the Portuguese oyster Crassostrea angulata (Lamarck, 1819) and
Japanese oyster, C. gigas (Thunberg, 1873), which also constitute important fishing
resources. These bivalves have different habitats within the same coast, with D.
trunculus found in the open, wave exposed sites, while the other two species inhabit
more sheltered areas. The wedge-shell clam is known not to be infected by Perkinsus
although it may be affected by other parasites as Rickettsia (Comps and Chagot, 1987).
Similarly, C. gigas is not affected although on the East Coast of the United States;
although, populations of a closely related species, C. virginica, have been devastated by
another member of this parasite genus, P. marinus, for many years (Burreson and
Ragone Calvo, 1996).
In Europe, environmental conditions seem to be related to Perkinsus lethality.
Indeed, and in contrast with the high mortalities observed in Southern Portuguese coast,
Perkinsus infection does not appear to cause serious mortalities in the infected beds of

Parasite Response to Surroundings CHAPTER V
109
R. decussatus in the Galician coast, Northwest of Spain, being speculated that the higher
water temperatures in the southern regions may impact on disease severity (Villalba and
Casas, 2001). On the other hand, in Asia, Perkinsus sp. was considered to be the cause
of epizootic mortalities of R. philippinarum in Korea (Park et al., 1999), China (Liang et
al., 2001) and Japan (Hamaguchi et al., 1998). However, results of short-necked clam
disease surveys in Korea (Lee et al., 2001) indicated that caution should be applied
when determining a causal relationship between Perkinsus sp. infections and R.
philippinarum mortalities. Pollution has been also hypothesized to contribute to some
aquatic epizootics (Chu and Hale, 1994) and estuarine contaminant mixtures have been
shown to increase oyster susceptibility to parasitism by P. marinus (Bushek et al.,
2002b). Molecular characterizations of the parasite in response to these various factors
that affect the host-parasite interaction were not explored yet. Biochemical analyses
have been conducted showing the involvement of parasite-associated extra-cellular
proteins (ECP), especially proteases, in the pathogenicity of P. marinus (Oliver et al.,
1999, Peyre, 1996). In P. olseni, we have recently identified, through a subtractive
hybridization strategy, a set of parasite genes differentially expressed upon host
infection (Ascenso et al., 2007). As a continuation of that work (Chapter III), we next
evaluated their expression pattern in the presence of permissive, more or less
susceptible and nonpermissive bivalves. A selected set of these parasite genes were used
to construct a cDNA macroarray in order to compare their levels of expression when
Perkinsus was challenged with hemolymph from infected and non infected R.
decussatus. Two of them, up-regulated more than one hundred fold in response to the
presence of its non-infected host, were further analysed by cloning their full length
cDNAs and analysing the corresponding genes and encoded proteins. Their pattern of

Parasite Response to Surroundings CHAPTER V
110
expression was then analysed when P. olseni was challenged with hemolymph from
permissive and non permissive bivalves, or subjected to environmental stresses.
V-2 Specific materials and methods
V-2.1 Construction of cDNA macroarray
A series of cDNA macroarrays were constructed using a total of 98 cDNA
fragments identified from a previously constructed subtractive library (Ascenso et al.,
2007). To construct the macroarray, selected cDNAs cloned in pCR II TOPO vector
(Invitrogen, Carlsbad, USA) and pGEM T-easy (Promega, Madison, USA) as well as
control vectors, were purified, denatured, spotted onto a nylon membrane (Amersham
Biosciences, UK) manually and cross-linked by a 2 hour incubation at 80ºC.
Binding Catalytical Chaperone Signal transducer Structural moleculeTranscription Translation Transporter Cell adhesion Metabolism Cellular process
Unknown# Control ribosomal proteins and vectors used for cloning the cDNA.
D1_13
A1_d
A1_p
D1-26*
B1_3
H3G11
H10D7
D1_h
A1_o
B1_10
D1_7
H9D4
A1_j
D1_l
B1_p
C1_1
D1_30
100xH6H6#
pGEM#
H9H4
B1_6
D1_10
H5A8
H7D1
H8C9
D1_o
D1__30
H9D9
H2D11
B1_12
H5H3
H6H6
D1_5
D1_c
D1_19
D1_d
B1_4
B1_27
B1_e
H7F11
B1_2
H3B4
D1_33
A1_l
C1_k
D1_g
B1_11
D1_18
H6F6
H9G11
B1_k
C1_6
H3B1
H4D9
C1_b
A1_m
D1_m
D1_4
TOPO#
A1_a
H2H10
D1_24
D1_21
H4D8
H3C1
A1_i
A1_h B1_23D1_22
10xH6H6# 1xH6H6#
C1_a
B1_9
C1_3
A1_k D1_1
D1_20
H7E11
D1_27
H10C7
A1_r
C1_s
D1_n
D1-2
H8H12
D1_6
C1_p
B1_24
D1_b
B1_26
B1_7
B1_8
D1_a
D1_14*
B1_5
A1_g
H7G2 D1_p
H9H5
H10A4
D1_14 D1_23
D1_j
Figure V- 1 Scheme of the membrane containing the cDNA macroarray. Representation of all 98 cDNA clones included in the macroarray, organized according to molecular function according to the GO categories. The array also included both vectors used for EST cloning, reference genes (*) and three dilutions of one selected clone, as internal standard.

Parasite Response to Surroundings CHAPTER V
111
Four replica nylon membranes were constructed, each of them contained 98 unique
cDNA clones, the two empty plasmid vectors, possible reference genes, signed with (*)
and one clone spotted in three different dilutions as internal control (Figure V-1).
V-2.2 Differential gene expression in response to bivalve’s hemolymph
Ten micrograms of total RNA was labelled and used as probe to hybridize the
array filters. Each individual radioactive probe was obtained by reverse transcription in
were normal dCTP was substituted by α32P dCTP. In brief, the RNA was heated to 70°C
to remove secondary structures and labelled by reverse transcription for 1.5h at 37°C in
the presence of 50 µCi α 32P dCTP, 0.8mM each dATP, dTTP, and dGTP, and 400U M-
MLV reverse transcriptase (Invitrogen), added in two steps. cDNA synthesis reaction
was stopped by treatment at 70°C for 30 min with 5 µl of 0.5M EDTA and denaturation
performed with 10µl of 0.1M NaOH, and then equilibrated at room temperature for 15
min. Neutralization was performed by adding 25µl of 1M Tris–HCl. Unincorporated
nucleotides were removed by filtration using a microspin column (MicrospinTM S.200
HK columns, Amersham Biosciences, Piscataway, USA). Purified probes were
denatured for 5 min at 100°C, cooled on ice for 5 min, then added to hybridization
buffer (UltraHyb, Ambion, Austin, USA) and incubated with membranes overnight at
42°C. After hybridization, membranes were washed three times in 0.1x SSC, 0.1% SDS
(10min/wash) at 42°C, and then exposed to Kodak BioMax MS film (Kodak, USA) for
different periods to optimize signal intensity quantification. Two independent
hybridizations were performed to calculate the response of parasite genes to host
hemolymph challenge. Prior to re-hybridization, membranes were stripped with three
successive immersions in boiling 0.1% SDS for 15 min (Mazurais et al., 2005) and
probe removal confirmed by autoradiography. The impressed signals were quantified by

Parasite Response to Surroundings CHAPTER V
112
densitometry (QuantityOne, BioRad, Richmond, USA) and levels of gene expression
were calculated relative to expression of the same housekeeping genes in control
conditions.
V-2.3 Molecular characterization of genes of interest
Partial cDNA sequences of P. olseni genes of interest were obtained by
sequencing the clones resulting from screening the forward cDNA subtractive library.
Two ESTs (PoNHE and PoAdh) were identified as highly expressed (over 100 fold) in
parasites upon challenge with non-infected host hemolymph and thus selected to be
further characterized. Complete cDNAs were obtained through rapid amplification of
cDNA ends using a Marathon cDNA library (Clontech BD, Palo Alto, USA) previously
constructed in our laboratory (our unpublished data), using gene specific primers (Frw1
and Rev1, Appendix II-1). The resulting PCR products were inserted into pCR II TOPO
vector (Invitrogen), cloned in DH5- alpha cells (Sambrook et al., 1989) and final
identification achieved following DNA sequencing (Macrogen, South Korea) and
homology search using tBLASTx tool (http://www.ncbi.nlm.nih.gov). Gene structure
organization was achieved by amplification using two P. olseni Universal Genome
Walker libraries (Clontech) previously constructed in our laboratory (our unpublished
data). Then, using the gene specific (Frw1 and Rev1, Appendix II-1) and adaptor
specific primers, selected genes were PCR amplified upstream and downstream from
the known sequence, following manufacture recommendations. Resulting PCR products
were cloned and sequenced, as previously described. There was 100% identity between
PoNHE and PoAdh genes and the corresponding cloned cDNAs.

Parasite Response to Surroundings CHAPTER V
113
V-2.4 P. olseni clonal culture and parasite cell treatments
The clonal cell line of P. olseni (ATCC 50984) was cultured in DME:Hams F12
(1:2) medium supplemented with 5% Foetal Bovine Serum (FBS) according to the
method of Gauthier and Vasta (Gauthier and Vasta, 1995b, Robledo et al., 2002).
Cultures were maintained in exponential growth phase at 28ºC for 3 days with no
medium changes before treatment. P. olseni log phase cell cultures were expanded and
grown in 80ml medium at 28ºC, for 2 days, then pelleted to reduce the volume prior to
treatments. The parasite host-challenged condition was performed by incubating the
parasite cells in a 12-well plate exposed to bivalve hemolymph through a 0.4 µm
membrane (Transwell, Costar, Cambridge, MA), for six hours. Specifically, P. olseni
cells were challenged with infected and non infected hemolymph from either permissive
bivalves (R. decussatus and R. philippinarum) or perkinsosis-nonpermissive bivalves
(C. gigas, M. galloprovincialis and D. trunculus). Reference condition was the parasite
cells exposed to infected R. decussatus.
Table V- 1 Culture conditions used in vitro to simulate P. olseni environmental stress conditions.
Environmental conditions Temperature Salinity
Control condition 28ºC 30‰
28ºC 26‰
28ºC 37‰ Salinity stress conditions
28ºC 31‰
15ºC 30‰ Temperature stress conditions
20ºC 30‰
To study the response of Perkinsus to environmental xenobiotics, parasite
trophozoite cells were exposed to two types of pollutants, organic (PAH, PCB and TBT)
and inorganic (heavy metals, cadmium, copper and zinc). Pollutants were added to 8 ml

Parasite Response to Surroundings CHAPTER V
114
cell cultures; each compound was dissolved in DMSO solvent at concentrations of
10ng/ml for TBT, 360ng/ml for PCB, 145ng/ml for PAH, 500ng/ml for Cd, 150ng/ml
for copper and 250ng/ml for Zn. Incubation with cells was performed for 72h. The
adequate concentrations to be tested were obtained following toxicity curves developed
for each compound studied.
To study the response of Perkinsus to environmental conditions (Table V-1),
cells were acclimated for a week in the conditions to be tested, e.g. temperatures (15ºC
and 22ºC) and salinities (26‰ and 37‰). Then 1x10⁶ cells were transferred to a new
culture vessel with 8 ml of medium and incubated for 72h in the same conditions prior
to collection. Following total RNA extraction, gene expression was analyzed by Real
Time qPCR.
V-2.5 Gene expression analysis by Real Time qPCR
Reverse transcription-PCR was performed to further investigate and quantify
differential expression of genes of interest. Total RNA isolated from challenged and
control P. olseni cells were used for expression analysis using Real Time qPCR. First-
strand synthesis was performed after DNase treatment with RQ1 RNase-Free DNase
(Promega) using 1µg of total RNA, gene specific reverse oligonucleotides and M-MLV
reverse transcriptase (Invitrogen). Real-time PCR was performed in a iCycler iQ system
(Bio-Rad) with master mix for SYBR Green (ABgene, Surrey, UK), using the following
primer sets: (i) PoNHE Frw1/Rev2 to amplify PoNHE (accession number AB439284),
(ii) PoAdh Frw2/Rev1 to amplify PoAdh (accession number AB439285) and
(Chalikonda et al.) PoClhl Frw1/Rev1 to amplify PoClhl, the housekeeping gene used
for this study. Each sample was prepared by adding 2 µl of a 1:10 cDNA dilution to
reaction mix containing 0.5 µM of each primer and 10 µl of ABsoluteTM Q PCR SYBR

Parasite Response to Surroundings CHAPTER V
115
Green Flurescein mix (ABgene), in a final volume of 20 µl. The PCR program
comprised an initial cycle of 10 min at 95ºC followed by 60 cycles comprising an initial
denaturation step at 95ºC for 30 sec, and a step of annealing/extension at 68ºC for 20
sec. The fluorescence was measured at the end of each extension cycle in the FAM-490
channel. Relative levels of expression were determined by comparing results of
treatments with data from control cells. For relative gene expression determination, all
experiments were performed at least twice and in triplicate.
V-3 Results and Discussion
As part of our ongoing efforts to understand the molecular events involved in the
response of parasite P. olseni to the presence of its dedicated host, the carpet-shell clam
R. decussatus, 300 Perkinsus ESTs were previously identified (Ascenso et al., 2007)
following screening of a forward subtractive library and classified by Gene Ontology,
the majority without known counterparts in other organisms. From these, 98 were
further characterized in silico and their expression analyzed through macroarray
hybridization in response to challenge with hemolymph from permissive and
nonpermissive bivalves. Among these genes highly up- regulated (e.g. more than 100
fold) in the presence of host R. decussatus hemolymph, two were selected due to their
apparent homology to genes encoding electron transport and cell adhesion proteins, two
functions possibly involved in host-parasite interaction. The two genes identified were
further characterized as an attempt to provide clues suitable to unveil their function.

Parasite Response to Surroundings CHAPTER V
116
V-3.1 Does P. olseni respond differently to permissive & non-permissive
bivalves?
Variations in the population density of host species lead to variations in the parasite
burdens of host species; in some cases this allows pathogenic parasites to establish in
populations of hosts that would otherwise be too small to sustain them, as happens with
P. olseni, in R. decussatus population in Ria Formosa (Leite et al., 2004). In the Algarve
southwest coast there are various native commercially relevant bivalves, which include
the carpet-shell clam, the Pacific and Portuguese oyster, the blue mussel and the wedge-
shell clam, and these are not equally infected by the parasite P. olseni. The blue mussel
was never described as being infected while R. decussatus is its endemic host (Azevedo,
1989b). Therefore, in this work we investigated the molecular response of Perkinsus to
challenge with hemolymph of these various bivalves of interest using a cDNA
macroarray. A total of 98 cDNA fragments selected from the two P. olseni library
screenings, were used for construction of the macroarray (see chapter III for details), 72
from Dfsl and 26 from efMOSl (Table V-2). To study the parasite response to various
bivalves, the genes selected were those related to cell adhesion, binding, chaperone,
signal transducing, transport and cellular process because they are known to be involved
in host parasite interaction in other biological systems. In addition, cDNAs from genes
involved in transcription, translation, structural, catalysis and basal metabolism for
parasite survival were included. Furthermore, twenty one clones corresponding to
hypothetical parasite genes overexpressed in the presence of hemolymph from R.
decussatus, and showing no homology to any previously identified ESTs (Table V-2)
were also selected and included in the array. Through one step radioactive hybridization
of the macroarray, the relative expression of these selected parasite genes in response to
various bivalves’ hemolymph, was identified. After removal of the background, their

Parasite Response to Surroundings CHAPTER V
117
average relative gene expression was calculated and the number of genes up-regulated
one hundred fold or more in response to each bivalve (R. decussatus, R. philippinarum
and D. trunculus) hemolymph was counted and reported in Figure V-2. Fifty eight
genes were up-regulated in response to R. philippinarum hemolymph (59.2 %). The
majority of the genes presented an increased expression in response to D. trunculus
hemolymph (84 genes, 85.7 %). Only eight did not present this high expression level
(>100x), but they were still up-regulated when compared to control, the parasite
exposed to hemolymph from infected R. decussatus (Ascenso et al., unpublished a).
Table V- 2 Macroarray selected gene clones related to parasite host-response classified according to GO molecular function category (Appendix V-1), using GOblet server (http://goblet.molgen.mpg.de).
Genes related to host-parasite interaction GO molecular Function
Category Sub-category Occu-rrence
Obsolete Cell adhesion 2 Binding Purine nucleotide binding
Dna binding Rna binding Transition metal ion binding Cytoskeletal protein binding
9
Chaperone Chaperone 1 Signal transducer
Receptor activity Signaling molecule 7
Transporter Aminoacid transporter Electron transporter Cation transporter
7
Cellular process
Membrane transport Cell growth and death Cellular motility Cell communication Immune system
9
Genes related to basal metabolism Transcription Transcription regulator 1 Translation Translation regulator 4 Structural molecule
Ribosome component 5
Catalytic activity
Hydrolase Lyase Ligase Transferase Oxidoreductase
13
Metabolism Carbohydrate metabolism Energy metabolism Lipid metabolism Nucleotide metabolism Aminoacid metabolism Glycan metabolism Polyketides metabolism
19
Not classified: hypothetical, unknown 21
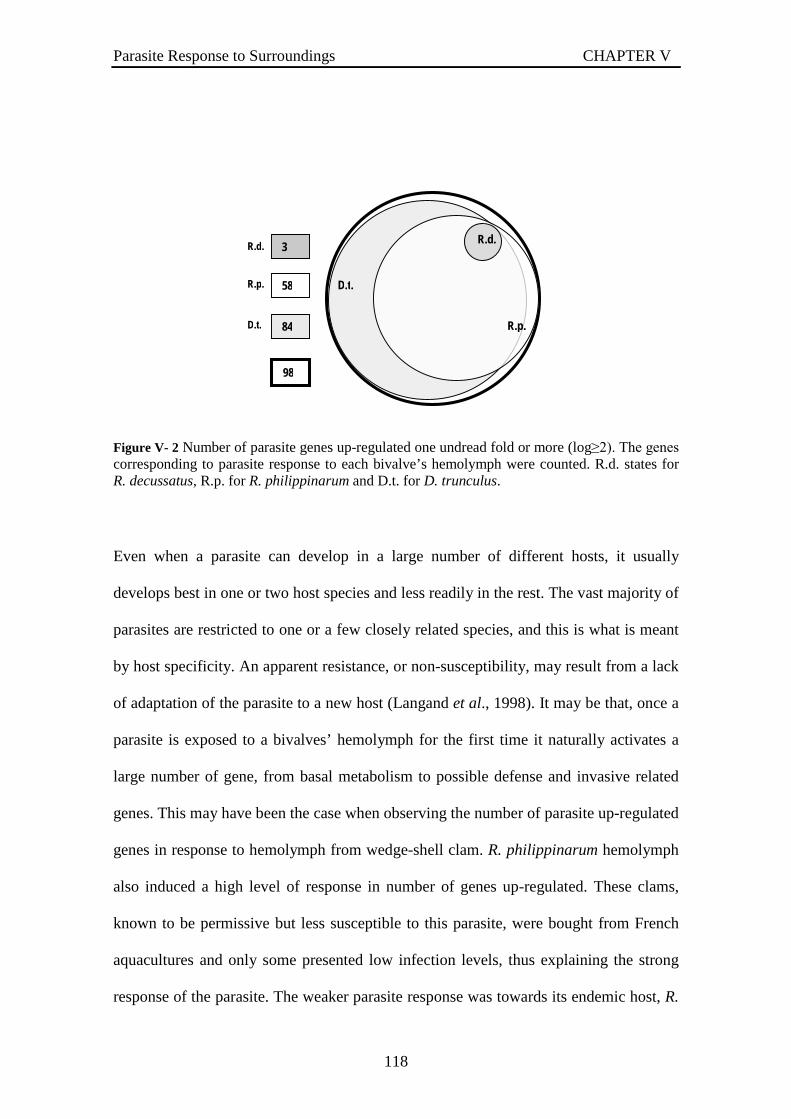
Parasite Response to Surroundings CHAPTER V
118
Figure V- 2 Number of parasite genes up-regulated one undread fold or more (log≥2). The genes corresponding to parasite response to each bivalve’s hemolymph were counted. R.d. states for R. decussatus, R.p. for R. philippinarum and D.t. for D. trunculus.
Even when a parasite can develop in a large number of different hosts, it usually
develops best in one or two host species and less readily in the rest. The vast majority of
parasites are restricted to one or a few closely related species, and this is what is meant
by host specificity. An apparent resistance, or non-susceptibility, may result from a lack
of adaptation of the parasite to a new host (Langand et al., 1998). It may be that, once a
parasite is exposed to a bivalves’ hemolymph for the first time it naturally activates a
large number of gene, from basal metabolism to possible defense and invasive related
genes. This may have been the case when observing the number of parasite up-regulated
genes in response to hemolymph from wedge-shell clam. R. philippinarum hemolymph
also induced a high level of response in number of genes up-regulated. These clams,
known to be permissive but less susceptible to this parasite, were bought from French
aquacultures and only some presented low infection levels, thus explaining the strong
response of the parasite. The weaker parasite response was towards its endemic host, R.
58
84
98
3 R.d.
R.p.
D.t.
D.t.
R.d.
R.p.

Parasite Response to Surroundings CHAPTER V
119
decussatus, that were collected from Ria Formosa, all heavily infected, which again
may explain the differences observed between the parasite response to R. decussatus
and R. philippinarum, since both bivalves are permissive to the parasite infection
(Ascenso et al., unpublished a). According to Navas and colaborators, the parasite, P.
olseni shows a special incidence in R. decussatus (Navas et al., 1992). In infecting its
permissive host, where the parasite is able to invade and infect easily, it looks like the
parasite spends less energy in gene expression machinery in response to its host
environment. In this case the fact of the clams being infected may have contributed as
an additional factor to diminish the host defences against the parasite and facilitate the
parasite invasion with fewer expenses. A non-permissive bivalve is resistant to the
parasite and either the parasite does not survive or exists only at a very low level of
parasitemia. This may imply an increase in parasite costs to invade and/ or defend from
host defences, corresponding to P. olseni active response to D. trunculus hemolymph.
From analysis of the host-parasite system Biomphalaria glabrata/Echinostoma caproni,
the host non-susceptibility was genetically determined (Langand et al., 1998). No
specific studies of parasite host-response involving permissive and non-permissive hosts
are known so a clarifying comparison could not be made.
V-3.2 Which genes were highly up-regulated in response to R. decussatus?
Parasite gene expression showed a differential response when challenged with
various bivalves but among these, our interest was focused on its dedicated host, the
carpet-shell clam. Macroarray screening by differential hybridization confirmed that 84
(85.7 %) of the 98 selected genes were up-regulated at least 2x (Figure V-3).
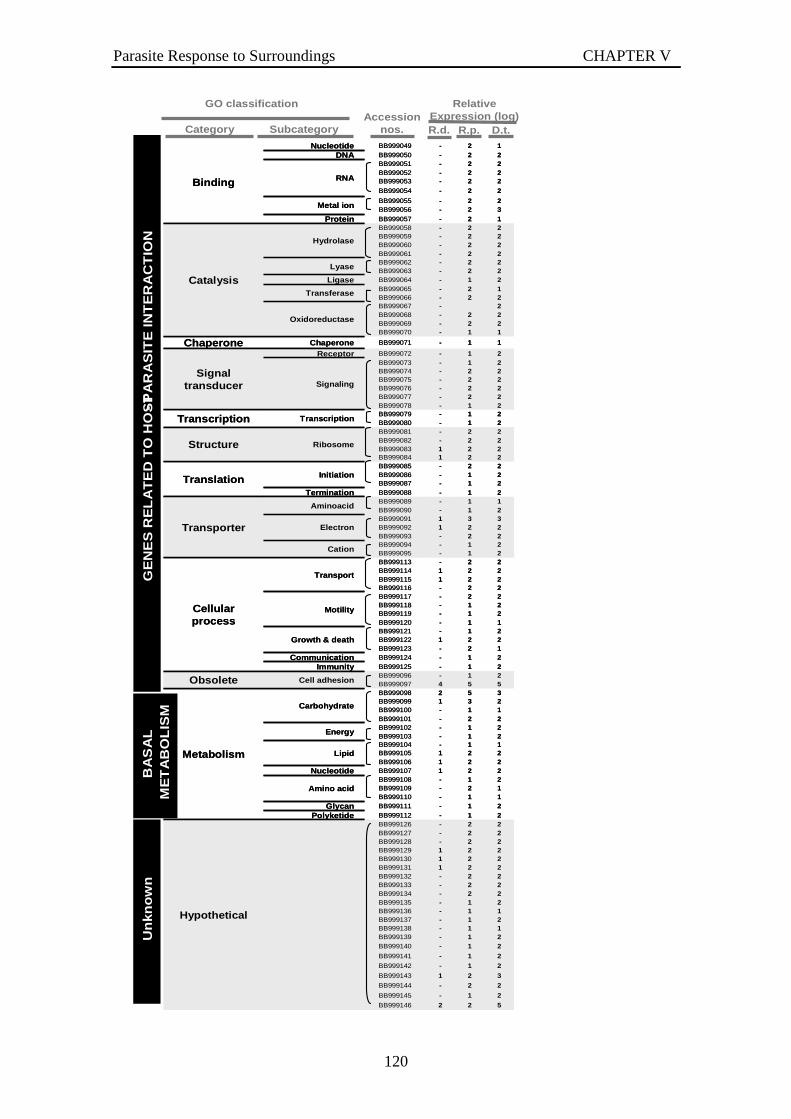
Parasite Response to Surroundings CHAPTER V
120
Accession nos.
Relative Expression (log)
R.p. D.t.
2
-
-
1
-
-
---------111--------111-----124----1------11----11------11-----------
-
--------------
--
-
-----
BB999146
BB999145
BB999144
BB999143
BB999142
BB999141
BB999140BB999139BB999138BB999137BB999136BB999135BB999134BB999133BB999132BB999131BB999130BB999129BB999128BB999127BB999126BB999112BB999111BB999110BB999109BB999108BB999107BB999106BB999105BB999104BB999103BB999102BB999101BB999100BB999099BB999098BB999097BB999096BB999125BB999124BB999123BB999122BB999121BB999120BB999119BB999118BB999117BB999116BB999115BB999114BB999113BB999095BB999094BB999093BB999092BB999091BB999090BB999089BB999088BB999087BB999086BB999085BB999084BB999083BB999082BB999081BB999080BB999079BB999078BB999077BB999076BB999075BB999074BB999073BB999072
BB999071
BB999070BB999069BB999068BB999067BB999066BB999065BB999064BB999063BB999062BB999061BB999060BB999059BB999058BB999057
BB999056BB999055
BB999054
BB999053BB999052BB999051BB999050BB999049
2
1
2
2
1
1
111111222222222111212221112135511122111122222112231111122222111222211
1
122
2212222222
22
2
22222
5
2
2
3
2
2
221212222222222221122221222123522212212222222222232122222222222222222
1
12222122222221
32
2
22221
PolyketideGlycan
Amino acid
Nucleotide
Lipid
Energy
Carbohydrate
Cell adhesion
ImmunityCommunication
Growth & death
Motility
Transport
Cation
Electron
Aminoacid
Termination
Initiation
Ribosome
Transcription
Signaling
ReceptorChaperone
Oxidoreductase
Transferase
Ligase
Lyase
Hydrolase
Protein
Metal ion
RNA
DNANucleotide
Hypothetical
Metabolism
Obsolete
Cellular process
Transporter
Translation
Structure
Transcription
Signal transducer
Chaperone
Catalysis
Binding
2
-
-
1
-
-
---------111--------111-----124----1------11----11------11-----------
-
--------------
--
-
-----
BB999146
BB999145
BB999144
BB999143
BB999142
BB999141
BB999140BB999139BB999138BB999137BB999136BB999135BB999134BB999133BB999132BB999131BB999130BB999129BB999128BB999127BB999126BB999112BB999111BB999110BB999109BB999108BB999107BB999106BB999105BB999104BB999103BB999102BB999101BB999100BB999099BB999098BB999097BB999096BB999125BB999124BB999123BB999122BB999121BB999120BB999119BB999118BB999117BB999116BB999115BB999114BB999113BB999095BB999094BB999093BB999092BB999091BB999090BB999089BB999088BB999087BB999086BB999085BB999084BB999083BB999082BB999081BB999080BB999079BB999078BB999077BB999076BB999075BB999074BB999073BB999072
BB999071
BB999070BB999069BB999068BB999067BB999066BB999065BB999064BB999063BB999062BB999061BB999060BB999059BB999058BB999057
BB999056BB999055
BB999054
BB999053BB999052BB999051BB999050BB999049
2
1
2
2
1
1
111111222222222111212221112135511122111122222112231111122222111222211
1
122
2212222222
22
2
22222
5
2
2
3
2
2
221212222222222221122221222123522212212222222222232122222222222222222
1
12222122222221
32
2
22221
PolyketideGlycan
Amino acid
Nucleotide
Lipid
Energy
Carbohydrate
Cell adhesion
ImmunityCommunication
Growth & death
Motility
Transport
Cation
Electron
Aminoacid
Termination
Initiation
Ribosome
Transcription
Signaling
ReceptorChaperone
Oxidoreductase
Transferase
Ligase
Lyase
Hydrolase
Protein
Metal ion
RNA
DNANucleotide
Hypothetical
Metabolism
Obsolete
Cellular process
Transporter
Translation
Structure
Transcription
Signal transducer
Chaperone
Catalysis
Binding
GO classification
Category Subcategory
GE
NE
S R
EL
AT
ED
TO
HO
ST-P
AR
AS
ITE
IN
TE
RA
CT
ION
BA
SA
L
ME
TA
BO
LIS
M
R.d.
Un
kn
ow
n

Parasite Response to Surroundings CHAPTER V
121
Figure V- 3 P. olseni genes relative expression in log10 scale based on the macroarray hybridization. Parasite gene expression, in response to challenge with hemolymph from each bivalve, was quantified based on two hybridization of the cDNA macroarray and selected autoradiography exposures. The macroarray genes were classified by Gene Ontology (GO) and grouped by function in relation with host- parasite interaction. R.d. states for Ruditapes decussatus, R.p. states for R. philippinarum and D.t. for Donax trunculus. The control condition was the parasite not treated.
From these, a cell adhesion-related gene showed the highest degree of
overexpression (more than 100x); four others where overexpressed at least 10x, one of
them appearing to be related to transport, two linked to carbohydrate metabolism and
one hypothetical (Figure V-3). Two genes were selected to be further characterized, the
Adhesion-related (P. olseni Adhesion-related protein, PoAdh, BB999097, recently
AB439285) and the transporter, Na+/H+ antiporter (P. olseni Na+/H+ antiporter, PoNHE,
BB999091, recently AB439284), since in addition to being strongly up-regulated by the
parasite when challenged with R. decussatus hemolymph (Ascenso et al., unpublished
b), they encode proteins which putative molecular functions may be related to host-
parasite interaction based on data known for other organisms (Table V-2). The other
genes appear to either be related to basal metabolism of the parasite or have unknown
functions, and thus may be interesting in future work when more information about this
group of parasites becomes available.
The two novel genes selected were therefore cloned and their architecture and
complete structure of the encoded proteins determined. The one which is the most
expressed shares no homology with known proteins present in the protein database, but
based on its putative features (Gene Ontology, GO:0007155), identified through in
silico analysis, we hypothesize that it might be involved in cell adhesion and so have
named accordingly: Adhesion-related protein (Figure V-1). The PoAdh gene was up-
regulated log 1000,000 times in response to hemolymph of R. philippinarum and to D.
trunculus (Figure V-3), but no further functional information can be inferred at this

Parasite Response to Surroundings CHAPTER V
122
time. PoNHE presented 1,000 fold augment in expression in response to R.
philippinarum hemolymph and to D. trunculus. Instead the PoNHE was identified and
belongs to cation proton antiporter (CPA) superfamily, being a transporter.
V-3.3 What is the molecular architecture of the PoAdh and PoNHE genes?
V-3.3.1 Characterization of PoAdh, a putative adhesion-related protein
The cell adhesion-related protein encoded by the clone with accession number
AB439285 (the nucleotide sequence data reported in this thesis will appear in the
DDBJ/EMBL/GenBank nucleotide sequence databases with the mentioned accession
number) had no homology in available protein databases, but according to Goblet hit
(GO:0007155, (Ascenso et al., 2007, Ascenso et al., unpublished b) it was designated as
P.olseni (Po) Adhesion- related gene (PoAdh). PoAdh cDNA spans 1,187 bp from the
longest 5’ end obtained to the site of insertion of the poly A tail and includes an ORF of
1,038 bp, encoding a 346 aa polypeptide (Figure V-4). No introns were found when the
cDNA was compared to the corresponding genomic DNA sequence. The predicted
protein had 41kDa and presented a putative isoelectric point of 8.62 (Vector NTI,
Invitrogen). In silico analysis revealed the presence of a tyrosine rich region spanning
from 163 to 337 aa (e-value 1.2e-8, MotifScan, http://myhits.isb-sib.ch) close to its C-
terminus. Eleven tyrosin residues were predicted to be phosphorilated using the in silico
analysis (score>0.9, http://www.cbs.dtu.dk/services/NetPhos/). In silico SignalP
(http://www.cbs.dtu.dk/-services/SignalP) suggests that PoAdh may be a secreted
protein, with a predicted signal peptide of 19-21 amino acids.
In an effort to find a possible function for this region as well as a possible
association with virulence and involvement in the parasite response to its host, we
searched for other proteins with similar structures, in particular a C- terminal tyrosine
rich region.

Parasite Response to Surroundings CHAPTER V
123
Figure V- 4 PoAdh cDNA and correspondent amino acid sequence. Location of primers used for PCR amplification are indicated by arrows. Stop codon is marked with an asterisk.
-28 tgctcaagttcatattctagcttctcga -1 M L Y A S L A A A L S F V A A A A A 18 ATG CTT TAC GCT TCA CTT GCC GCT GCA CTG TCG TTC GTT GCC GCC GCC GCC GCC 54 E A H C M A S Y V W Q Q D Y W T G K 36 GAG GCC CAC TGT ATG GCT TCC TAT GTA TGG CAA CAA GAC TAC TGG ACG GGT AAG 108 D S S Y D D F Y K A L R K D H K Y D 54 GAC TCG TCC TAC GAT GAC TTC TAC AAA GCC CTC CGC AAG GAC CAC AAG TAT GAT 162 D Y D C G D L Y V N V A D A S N Q G 72 GAT TAC GAT TGT GGT GAT CTC TAC GTC AAC GTT GCC GAT GCC TCC AAT CAG GGG 216 H L A N P K G L A K F M E D Y Y K H 90 CAC CTT GCT AAC CCC AAG GGA CTG GCC AAA TTC ATG GAA GAC TAC TAC AAG CAC 270 N S K G R V Y L F Y A G G A K G Y D 108 AAC AGC AAG GGA AGA GTG TAC CTG TTC TAC GCT GGT GGT GCC AAG GGG TAT GAT 324 D K K W A P E Y V K T Y T E F V Y K 126 GAC AAG AAG TGG GCA CCC GAG TAT GTG AAG ACG TAC ACG GAG TTC GTC TAC AAG 378 Y G P K Y H W G P I G I S F V D V E 144 TAC GGC CCC AAG TAC CAC TGG GGA CCC ATC GGT ATC AGC TTC GTT GAC GTC GAG 432 L D E H A W K D I F H H T D E M K H 162 CTT GAC GAG CAT GCA TGG AAG GAT ATT TTC CAT CAC ACT GAT GAG ATG AAA CAC 486 Y L Y K H Y K Y D V Y V D V H F Y Y 180 TAT CTT TAC AAG CAT TAT AAG TAC GAC GTT TAT GTT GAT GTG CAC TTC TAC TAC 540 N Y H Y K H L V E L Y M K R A D H V 198 AAC TAC CAC TAC AAG CAC CTG GTT GAA CTG TAC ATG AAG CGA GCT GAT CAC GTT 594 S V A T Y S N T Y E G L I K L Y K Y 216 AGT GTT GCC ACG TAC AGC AAC ACT TAC GAG GGT CTC ATC AAA CTT TAC AAG TAC 648 F F K Y T F P H A Y G K D Y Y K Y K 234 TTC TTC AAG TAT ACT TTC CCT CAT GCC TAC GGT AAG GAC TAC TAC AAA TAC AAG 702 A K I T F V G E G N C E S K H S C G 252 GCG AAG ATC ACC TTC GTT GGT GAG GGC AAC TGC GAG AGC AAG CAC TCC TGC GGG 756 K T S F C A Y Y S D K Y D D P K G G 270 AAG ACG TCC TTC TGT GCC TAT TAC TCT GAC AAA TAC GAT GAT CCC AAG GGC GGC 810 I R Y A Y D V F E K A D T Y V R R H 288 ATC CGC TAC GCT TAT GAC GTC TTC GAG AAG GCC GAC ACC TAC GTT CGC CGT CAC 864 I L S R K Q Y E H Y F E G Y G S K Y 306 ATC CTC TCA AGG AAG CAG TAC GAG CAT TAC TTC GAA GGT TAC GGC TCC AAG TAC 918 G L N Y F Y W V Q C Y Y G K D L W Y 324 GGC TTG AAC TAC TTC TAT TGG GTC CAG TGC TAT TAC GGT AAG GAC CTC TGG TAC 972 K A G L K H C R K Y R Y Y S D Q C R 342 AAG GCT GGC CTC AAG CAC TGT CGT AAG TAC CGT TAC TAC TCC GAC CAG TGC AGA 1026
R H Y * 346 CGT CAT TAC TAA ggacttgtctgatgctacgatgacagcgtgtgtagtctcttgtaacgaaactgta 1090 caagatatcttaccacgcgttaaatcttcacttcttcttttcaattttttgtagtagtcgattgattgcaag 1162 acgcttctcgatactcatcatccgc 1187

Parasite Response to Surroundings CHAPTER V
124
The association of these two characteristics was found in E. coli tyrosine
autokinase (Wzc). WzcCPS is a tyrosine autokinase essential for the assembly of a high-
molecular-weight (HMW) group 1 capsular polysaccharide in Escherichia coli
(Wugeditsch et al., 2001, Paiment et al., 2002). Capsular polysaccharides and
exopolysaccharides are important virulence determinants in many plant and animal
pathogens, but the biological role of this phosphorylation of the C-terminal tyrosine
residues has not been established (Paiment et al., 2002). This E. coli protein presents 7
C-terminal tyrosine residues concentrated in the last 17 amino acids. This feature is
similar to what has been described for another tyrosine autokinase from the bacteria K.
pneumoniae, responsible for capsular polysaccharide biosynthesis required for protein
envelope biogenesis, and directly related to pathogenesis (Preneta et al., 2002). PoAdh
presents a C-terminal tyrosine rich region with 31 tyrosine residues distributed in 174
amino acids in the C-terminal. The finding of similar motifs in PoAdh, together with the
fact that this protein is highly overexpressed by the parasite when in contact with its
host hemolymph suggests that it may also be involved in Perkinsus response to its host.
V-3.3.2 Characterization of PoNHE, a transporter-like protein
The protein encoded by the clone with accession number AB439284 (the
nucleotide sequence data reported in this thesis will appear in the DDBJ/EMBL/
GenBank nucleotide sequence databases with the mentioned accession number) had its
highest homology with a Na+/H+ antiporter (NHE) protein, being thus designated as a
putative PoNHE (Ascenso et al., unpublished b). In silico analysis of PoNHE using
available databases identified the presence of both transmembrane and ion transporter
domains, indicating that this gene is likely to encode a membrane transporter.

Parasite Response to Surroundings CHAPTER V
125
-8 tgattact -1 M A S L D D D A S A Y E S V V S V 17 ATG GCC TCA CTT GAT GAC GAC GCG TCC GCC TAT GAA AGC GTG GTA TCA GTA 51 N S V L F S A G L L L T F V W G Y 34 AAT TCT GTT CTC TTC TCT GCC GGC CTG TTG CTG ACC TTC GTA TGG GGG TAT 102 L V K T G R V K H I S Q S T G A V 51 CTC GTT AAC ACT GGT CGG GTC AAG CAC ATA TCA CAA TCG ACG GGG GCG GTT 153 L I G F I M G I V V R L L G V A D 68 TTA ATT GGC TTC ATA ATG GGC ATT GTG GTC AGG CTG CTG GGA GTT GCA GAC 204 R K E M L G M S A E L F Y F A L L 85 CGA AAG GAG ATG TTG GGC ATG AGC GCG GAA CTG TTC TAT TTT GCA CTC CTA 255 P P I I F D A S F S L K T N M F M 102 CCG CCA ATA ATA TTC GAC GCC AGC TTT TCG CTT AAC ACG AAC ATG TTC ATG 306 S K L T S I L T F A F I G T T I S 119 AGC AAC CTC ACT TCC ATT CTA ACA TTC GCG TTT ATC GGC ACA ACC ATA TCA 357 A Y V T S I G L W T F S T S W L V 136 GCC TAC GTC ACC TCA ATA GGG TTG TGG ACT TTC TCC ACT TCT TGG CTG GTG 408 G L K K T E A L R G Y C M T F G A 153 GGT CTG AAG AAC ACG GAA GCC CTC CGA GGA TAC TGC ATG ACG TTC GGT GCC 459 L I S S T D P V A V M A L M G G S 170 CTC ATA TCC AGT ACC GAT CCA GTG GCG GTG ATG GCC CTA ATG GGC GGG TCC 510 K Y R P N K T L H S L V F G E S V 187 AAG TAC AGA CCG AAT AAG ACC TTG CAT TCG CTG GTC TTC GGT GAG AGC GTT 561 L K D A V A I V L F A A Y Q Q A Y 204 CTT AAC GAT GCG GTG GCA ATC GTG CTC TTC GCG GCA TAC CAA CAG GCA TAT 612 F S A R G T S S G L A Q S P L L L 221 TTC AGC GCA CGA GGC ACC TCC TCT GGG TTA GCA CAG AGC CCG TTA CTG CTC 663 F L T V T F G S V I F G I L S G A 238 TTC TTA ACA GTT ACC TTC GGG TCC GTT ATA TTC GGT ATC CTC AGC GGA GCC 714 L V S A S Y R K S S L V S Y P K Y 255 CTC GTC AGC GCC AGC TAC CGT AAA TCG TCC CTG GTG TCC TAC CCC AAG TAC 765 E I A G M F L S I Y L T F S L A E 272 GAG ATC GCG GGT ATG TTT CTG TCG ATC TAC CTT ACT TTC TCT CTG GCG GAG 816 L L G L S G I M A I F F F G L M L 289 TTG TTG GGA CTG AGC GGA ATT ATG GCG ATA TTC TTT TTT GGC TTG ATG TTG 867 C R Y N F H L S K P S Q V A S K 306 TGT CGC TAT AAT TTC CAC AAC CTC TCC AAG CCC TCG CAA GTC GCA TCC AAA 918 L V F E T L A F F S E T L V F L Y 323 TTG GTC TTC GAG ACT CTA GCT TTC TTT TCC GAG ACG CTT GTT TTC CTC TAC 969 L G V V A C M S V G E Y H W K L G 340 CTC GGA GTT GTT GCC TGC ATG TCC GTA GGC GAG TAC CAT TGG AAC TTG GGG 1020 L I L F T L V L I V L A R A C K V 357 CTC ATA CTG TTC ACC CTC GTC CTC ATA GTG TTG GCC AGA GCG TGT AAT GTG 1071
I
II
III
IV
V
VI
VII
VIII
1
2
3
4 1
5 1
6
7
8
9
10
IX
X
XI
F P L S W L L N H S T R Y D P I S 374 TTC CCT CTG TCG TGG CTC CTC AAC CAC TCC ACC CGG TAC GAC CCC ATC AGT 1122 R N S Q I V L W L A G I R G A I A 391 AGG AAC TCA CAG ATA GTC TTG TGG CTA GCT GGT ATA AGA GGA GCG ATC GCC 1173 F V L M L R V P T R V G D D T R D 408 TTC GTG TTG ATG CTC CGG GTA CCC ACT AGA GTT GGT GAC GAT ACA CGA GAC 1224 L L V T T T I S V V F V T T L V G 425 CTC CTC GTT ACT ACA ACA ATA TCA GTT GTG TTC GTA ACG ACT CTG GTG GGA 1275 G S L V E H V A V M L G E L R P A 442 GGA TCT TTG GTG GAG CAC GTC GCT GTT ATG CTG GGG GAA CTT CGA CCT GCA 1326 A A P L P T Q E T S E P E I T I T 459 GCG GCG CCC CTG CCG ACG CAG GAG ACA AGC GAA CCC GAG ATT ACT ATA ACC 1377 D P S A I D P G L F Y V P P A A S 476 GAT CCT TCT GCT ATC GAC CCT GGC CTC TTC TAC GTA CCG CCG GCC GCG TCC 1428 S S R S A A G R V T L S T E L G E 493 TCG AGC AGG AGC GCG GCT GGT CGA GTG ACG CTG TCC ACG GAG CTT GGT GAG 1479 R L G G A L E H V D R T Y V Q Q H 510 AGG CTC GGT GGC GCG CTC GAG CAC GTT GAT CGG ACA TAC GTA CAG CAG CAT 1530 L G G A G V D S I G E G S H Q R D 527 CTC GGA GGG GCG GGA GTT GAC TCT ATC GGA GAG GGC AGC CAT CAA CGA GAC 1581 A I R G E H P A E P G I D I D T Y 544 GCG ATA CGT GGA GAG CAC CCT GCC GAG CCG GGA ATC GAT ATC GAC ACC TAT 1632 Y E D S E A K R L M M G R A V V F 561 TAT GAA GAT AGT GAA GCC AAA CGA TTG ATG ATG GGC CGA GCG GTG GTC TTC 1683 E * 562 GAG TGA tgacccattgcaaagcttgtcactcgcctgtctcgggttttgccccgcgtttattgcac 1758 tacgttta 1766
11
12
XII
XIII
XVI
XV

Parasite Response to Surroundings CHAPTER V
126
Figure V- 5 PoNHE cDNA sequence with intron insertion marked with vertical lines and numbered I to XIV; grey boxes mark TM protein domains numbered 1 to 12. Location of primers used are indicated by arrows. Stop codon is marked with an asterisk. Table V- 3 PoNHE gene organization. PoNHE gene exon-intron boundaries, sizes of introns and exons and type of intron according to Pathy (Pathy, 1994). The nucleotide identified as +1 of the gene corresponds to the first nucleotide of the full length cDNA.
IntronExon/intron junctionExon
Size Type5’donor 3’acceptorNo. Size Position
193ACGAGgtggg ctcagACGCG2596-2764169XV
2558-3054496XVI
043TCTACgtagc tctagGTACC2390-2552163XIV
071TATCAgtact tgcagGTTGT2208-2318111XIII
051AGATAgtagc ctgagGTCTT2065-215692XII
0115TCATAgtaag ttcagGTGTT1860-194990XI
053CGCTTgtaag accagGTTTT1712-180695X
049GCTTGgtgag ctcagATGTT1542-1662121IX
255AAATCgtgag atcagGTCCC1420-148667VIII
1264AACAGgtagt cgtagTTACC1087-115569VII
164CCAACgtaaa ttcagAGGCA889-1022134VI
144GTTCGgtgcc ggtagTACAC7179-823126V
175TATCGgtagt cccagGCACA555-64389IV
0150ATTTTgtgag actagGCACT366-40469III
038GCATTgtggg ttcagGTGGT214-19784II
243TGGGGgtact ttcagGTATC1-170170I
Sequence analysis revealed homology to NHEs from a number of organisms,
including mammals and plants. A direct BLASTn search into P. marinus genome
sequencing project using P. olseni sequence allowed identification of one single gene,

Parasite Response to Surroundings CHAPTER V
127
suggesting the presence of a single copy of the NHE gene in Perkinsus, in contrast with
other species where multiple copies were identified. The PoNHE gene presents 15
introns (Figure V-5), ranging from 43 to 263 bp in length, with all intron-exon frontiers
are corresponding to the canonical consensus (Table V-3). Alignment of the various
cDNA sequences obtained for PoNHE with the corresponding genomic sequence
identified three types of transcripts (Figure V-6).
gDNA 1 2,925500 1,000 1,500 2,000 2,500
I II III IV V VI VII VIII IX X XI XII XIII XIV XV XVI
1,721 *Transcripts
* *
Mature II IV VI X XIV
II IV VI II IV XX
*
Deletion of exon VIInclusion of introns VIII, IX, X, XI, XII788 418
Other
1
1
Mature polypeptide of 562 aa
Polypeptide of 251 aa Polypeptide of 161 aa
1
300 nt (100 aa)
Figure V- 6 Molecular characterization of PoNHE. Scheme of genomic and transcripts sequence and predicted polypeptides size. PoNHE gene structure (black lines corresponds to intronic sequences and grey rectangles to exon sequences), the various transcripts (grey boxes) and the corresponding polypeptide size (dark grey bars) are represented. Arrowhead marks the start codon and asterisk the STOP codon.
All identified variants appear to result from different alternative splicing events.
The longer transcript, considered the PoNHE mature mRNA, corresponds to the
putative functional protein with an ORF of 1,689 bp and encodes a polypeptide of 562
aa (Figure V-6), considered the PoNHE mature mRNA. The two smaller transcripts can
be explained by partially non-processed mRNAs, resulting in the use an intronic stop
codon and the other there was an alternative splicing event, splicing the 5th and 6th
intron with the 6th exon also, altering the reading frame. These premature stop codons
resulted in shorter peptides of 251 or 161 residues, respectively (Figure V-6). The
PoNHE predicted polypeptide sequence hydrophobicity was analysed using Kyte-

Parasite Response to Surroundings CHAPTER V
128
Doolittle algorithm (Kyte and Doolittle, 1982) and twelve putative transmembrane
regions (TM) were clearly identified and confirmed by TMprep (Figure V-7).
PoNHE
aa 1 562
A
B
100 aa
C
1
0
-1
-3
2
TM6
Hyd
rop
ath
ysc
ore
PoNHE
aa 1 562
A
B
100 aa
C
1
0
-1
-3
2
1
0
-1
-3
2
TM6
Hyd
rop
ath
ysc
ore
Figure V- 7 Characterization of PoNHE polypeptide. Hydropathy (y-axis) profile was calculated using TMprep server (www.ch.embnet.org/software/TMPRED_form.html) for identification of TM segments (A); in the same scale, is shown the schematic of PoNHE domains with predicted signal peptide (black box) and transmembrane domains (TM, grey boxes) of the predicted polypeptide (B); comparison of conserved residues in the 6th TM domain from PoNHE aligned with CPA1 proteins, noticing the most conserved residue, Glu (E) marked with arrowhead (C). For TM6 sequences comparison used 46 CAP1 proteins (Supplementary table 1) aligned in ClustalX, analysed using GeneDoc and scheme produced using WebLOGO.
This finding provides evidence for its identification as a NHE protein since all
known NHE isoforms have a similar topology with 10-12 conserved TMs (Brett et al.,
2005). Analysis of the identity and similarity among the 46 CAP1 proteins indicated a
higher value of 26% and 44% (identity/ similarity) of P. olseni with NHX4 from corn,

Parasite Response to Surroundings CHAPTER V
129
Z. mays. But if using only TM6 for comparison, this resulted in 59% and 77%, identity/
similarity with NHX3, 4, 5 and 6. The membrane-spanning segments shared a large
identity/ similarity, with corresponding segments present in the different CAP1 proteins.
It was also described that M6 and M7 were the most highly conserved (95% identity)
(Orlowski and Grinstein, 1997). Alignment of PoNHE with its orthologs (46 CAP1
proteins) from mammals, yeast, protozoan and bacteria confirmed the relative position
of the TM domains and high conservation of specific residues within the 3rd, 5th, 6th and
8th TM, as expected. Based on data obtained for all other known NHEs, where these
residues are always conserved, namely in TM6 (Figure V-7) there is a motif highly
conserved, L(nX)GE(nX)ND(nX)V, being E185 a residue conserved among all
described proteins (Figure V-7) suggesting that it may be crucial for three dimensional
conformation and protein function, as was described for NHE1 (Putney et al., 2002).
Altogether, available evidence indicates that PoNHE is indeed a NHE (Ascenso et al.,
unpublished b).
V-3.3.3 In silico analysis suggests an intracellular localization for PoNHE
PoNHE was identified as an intracellular protein using GOblet server analysis,
resolving a significative hit (6e-12 e-value, GO:0016021). Although the majority of
NHEs characterized have been localized in the plasma membrane, PoNHE showed
characteristics for this localization within the membrane but also sequences suggesting
it to be intracellular.
Therefore, to better understand the origin of this protein and provide insights
into its function we explored its evolutionary relationship through a phylogenetic
analysis of the transporters of the monovalent cation proton antiporter (CPA1)
superfamily.

Parasite Response to Surroundings CHAPTER V
130
Pla
sma
mem
bran
e
Rec
ycle
dR
esid
ent
CP
A1
End
osom
alV
acuo
lar
NH
E8-
like
Intr
acel
lula
r
Nh a PII
Pr
Eu
Nha
PS
OS
1E
NHE1Hsapi
NHE8Mmusc
BNHEOmyki
NHE2Hsapi
NHE2bDmel
NHE2aDmel
NHE5Hsapi
NHX6aCele
NHX6bCele
NHX2Celeg
NHX3Celeg
NHX9Celeg
NHX1Celeg
NHE8Hsapi
NHE1Dmela
NHX8aCele
NHX8bCele
NHX6Athal
NHX5Athal
NHX5bCele
NHX5aCele
NHE3bDmel
NHE3aDmel
NHE9Hsapi
NHE7Hsapi
NHE6Hsapi
NHEPolse
NHX5Zmays
NHX3Athal
NHX3Zmays
NHX4Zmays
NHX1Osati
NHX4Athal
NHX1Scorn
NHX1Athal
NHX2Athal
NHX2Zmays
NHX1Zmays
NHX6Zmays
NHX7Athal
SOS1Cparv
NhaPBsubt
YjcEEcoli
MCDVparvu
GCDAAferm100
100
100
100
100
100
100
100
100
100
100
100
99
99
99
99
100
45
46
76
98
86
100
92
98
100
95
93
50
99
54
99
100
60
76
100
93
91
68
33
27
94
*
*
Figure V- 8 Relative classification of the PoNHE protein within the CPA1 protein family. The linearized tree shows the phylogenetic relashionships between 46 monovalent cation proton

Parasite Response to Surroundings CHAPTER V
131
antiporter 1 (CPA1) proteins (Supplementary table 1). Multiple alignments were performed using clustalX. Phylogenetic tree was prepared using the alignment region of full PoNHE sequence, according to neighbour- joining method using MEGA4, with 1000 replicates of bootstrapping and 45% cut-off (Bootstrap analysis showed a confidence value below 45 at the nodes indicated by the asterisk).
Based on the evolutionary relationships among members of the superfamily
CPA, previously characterized in the review (Brett et al., 2005), we performed a study
exploring the localization of PoNHE in-between the defined clades, using comparative
biology to predict a putative function for this uncharacterized gene. Figure V-8 shows a
phylogram constructed with PoNHE and 45 additional protein sequences (Appendix V-
2) from diverse CPA1 members using ClustalX for alignment (ClustalX 1.83,
(Thompson et al., 1997) followed by phylogeny inferring using MEGA4
(http://www.megasoftware.net, (Tamura et al., 2007). The complete information on
accession numbers of individual genes can be found in Appendix V-2. Multiple
pairwise alignments and Neighbour Joining phylogenetic tree corroborated the CAP
phylogeny determined by Brett and collaborators, and provided insight towards
unveiling PoNHE function. The P. olseni NHE was included in the CAP1 clade thus
suggesting an intracellular location, with a close relationship to plant vacuolar NHEs
(Figure V-8). The so called “Endossomal/TNG” or “Plant vacuolar” are part of the
intracellular clade (Brett et al., 2005). In plants, vacuolar NHEs have been shown to be
related to salt tolerance (Fukuda et al., 2004) and in S. cerevisae, Nhx1 contributes to
osmotolerance after acute osmotic shock (Nass and Rao, 1999). Our results suggest that
PoNHE may be responsible for adjustment to different environmental conditions,
possibly responding to an osmotic shock related with the interface parasite-host. This
predicted property could also be related to salt tolerance as this protozoan parasite is a
facultative parasite and has a host-free life stage in marine waters, often in lagoons like
Ria Formosa, where osmolarity can vary quite significantly (13 ‰ to 36.5 ‰, (Newton

Parasite Response to Surroundings CHAPTER V
132
and Mudge, 2003). If a similar function was maintained in Perkinsus, PoNHE could be
involved in parasite adjustment to different environmental conditions such as the
osmotic stress that may occur at the interface parasite-host upon infection (Ascenso et
al., unpublished b).
V-3.4 How is gene expression pattern of parasite exposed to bivalves’
hemolymph?
When P. olseni cells were exposed to hemolymph from permissive hosts not
previously exposed to this parasite, there was an increase in expression of PoNHE gene
suggesting an involvement of this gene in host-parasite interaction process (Figure V-9,
Panel A).
A B
*
*
**** **
Rd Rp Cg Dt Mg
0.1
1
10
100
Rel
ativ
eg
ene
exp
ress
ion
*
*
**** **
Rd Rp Cg Dt Mg
0.1
1
10
100
Rel
ativ
eg
ene
exp
ress
ion
*
*
**** **
Rd Rp Cg Dt Mg
0.1
1
10
100
Rel
ativ
eg
ene
exp
ress
ion
*
*
**** **
Rd Rp Cg Dt Mg
0.1
1
10
100
Rel
ativ
eg
ene
exp
ress
ion
* *
**
**
**
0.1
1
10
100
Rel
ativ
eg
ene
exp
ress
ion
Rd Rp Cg Dt MgRd Rp Cg Dt Mg
* *
**
**
**
0.1
1
10
100
Rel
ativ
eg
ene
exp
ress
ion
Rd Rp Cg Dt MgRd Rp Cg Dt Mg
Figure V- 9 Expression of PoNHE and PoAdh genes upon exposure to different bivalves’ hemolymphs. Relative levels of gene expression (in log scale) of PoNHE (Panel A) and PoAdh (Panel B) after 6 hours of exposure of P. olseni to bivalves’ hemolymph: permissive host (white bars), the carpet-shell clam Ruditapes decussatus not infected (Rd), the clam R. philippinarum (Rp); and non permissive bivalves (grey bars): the oyster Crassostrea gigas (Cg), the wedge- shell clam, Donax trunculus (Dt) and the blue mussel, Mytilus galloprovincialis (Mg). All expression levels and ANOVA two ways statistical analysis are relative to results obtained for P. olseni exposed to infected type host hemolymph, R. decussatus.
Although the decreasing levels of expression are not significant, there is a clear
inversion of parasite PoNHE expression when the parasite is exposed to non-permissive
bivalves’ hemolymph (Figure V-9, Panel A). Accordingly, levels of PoNHE mRNA

Parasite Response to Surroundings CHAPTER V
133
appear to be significantly higher when the parasite is in the presence of hemolymph
from non-infected clams (Figure V-9, Panel A), suggesting an adjustment in preparation
for infection. In contrast, a down regulation was observed upon presence of hemolymph
from non permissive hosts. The correlation between NHE and infection has also been
shown in T. gondii, which possesses two NHEs. One of them (TgNHE2) was the first
NHE to be characterized as intracellular in a protozoan parasite and immunoflurescence
studies showed its localization in the rhoptries, secretory organelles being involved in
the invasion (Arrizabalaga et al., 2004, Karasov et al., 2005). Altogether, this suggests a
possible involvement of PoNHE in the host-parasite interaction with its’ overexpression
possibly associated with the infection of permissive hosts (Ascenso et al., unpublished
b).
On the other hand, the levels of PoAdh mRNA decreased 10x in the presence of
hemolymph from R decussatus not infected and from R. philippinarum, when compared
to levels observed in the presence of hemolymph from infected R. decussatus indicating
that this gene is mainly and significantly expressed when infection is effective (Figure
V-9, Panel B). This two parasite genes expression pattern is inverted when the parasite
is exposed in vitro to host hemolymph. Taking in account the presence of these two
genes the parasite interacts, probably with a certain level of specificity with permissive
bivalves when observing the PoAdh expression pattern. PoNHE may explain the high
tolerance of P. olseni parasite to variations at the moment of environment-host interface.
V-3.5 How is parasite gene expression altered when exposed to stress
conditions?
In Ria Formosa, water temperature ranges from 12ºC in winter to 27ºC in
summer and salinity from 13‰ to nearly 37‰ (Newton and Mudge, 2003) and it has

Parasite Response to Surroundings CHAPTER V
134
been suggested that this variation in environmental conditions may affect efficiency of
parasite infection since periods of higher salinities, associated with higher temperatures,
appear to favour infection. We have therefore investigated the effect of these
environmental parameters on expression of PoNHE and PoAdh genes. PoNHE relative
mRNA levels were up-regulated at 22ºC (Figure V-10, Panel A) while no effect was
detected at 15ºC, suggesting that 22ºC, a temperature closer to average natural bivalves
environmental temperature, can lead to PoNHE up-regulation when compared to
standard cell culture conditions of 28ºC. Culture of the parasite at lower then normal
salinities also affected expression, while no significant effect was observed at the higher
salinity (37‰) suggesting that an adjustment to lower salinities is probably more
stressful to the parasite, requiring adjustments to ion transport (Ascenso et al.,
unpublished b).
A B
***
***
15ºC 22ºC
26‰ 37‰
0.1
1
10
100
1000
Rel
ativ
eg
ene
exp
ress
ion
28ºC
30‰
***
***
15ºC 22ºC
26‰ 37‰
0.1
1
10
100
1000
Rel
ativ
eg
ene
exp
ress
ion
28ºC
30‰
***
***
0.1
1
10
100
1000
Rel
ativ
eg
ene
exp
ress
ion
15ºC 22ºC
26‰ 37‰
28ºC
30‰
***
***
0.1
1
10
100
1000
Rel
ativ
eg
ene
exp
ress
ion
15ºC 22ºC
26‰ 37‰
28ºC
30‰
Figure V- 10 Expression of PoNHE and PoAdh genes upon exposure to different temperatures and salinities. Relative levels of gene expression (in log scale) of PoNHE (Panel A) and PoAdh (Panel B) after 3 days of exposure of P. olseni to treatment conditions simulating Ria Formosa environmental conditions. Growing temperatures (white boxes) corresponded to 15ºC and 22ºC and the growing salinities (grey boxes) corresponded to 26‰ and 37‰. All expression levels and ANOVA two ways statistical analysis are relative to results obtained for P. olseni in standard cell culture condition (28ºC and 30‰).
Indeed, less favourable conditions tend to repress parasite infectiveness as
observed at 26‰ salinity. Relatively high prevalence and infection intensity observed in

Parasite Response to Surroundings CHAPTER V
135
summer along the Korea west and south coasts suggests that Perkinsus sp. has a wide
range of salinity tolerance and, although this tolerance range is not well known (Park
and Choi, 2001), expression of PoNHE may explain the high tolerance of P. olseni
parasite to salinity variations. Accordingly, available data confirms that infection by
Perkinsus is much more effective at sites of higher temperatures and salinities such as
Ria Formosa (Leite et al., 2004), where the highest host mortality episodes are
observed, then in regions of lower temperatures and salinities like the Ria de Arosa in
Galicia, Spain (Villalba and Casas, 2001). The transmembrane exchange of protons for
sodium ions is ubiquitous in organisms across all phyla and kingdoms, and suggests a
fundamental homeostatic mechanism to control these ions. PoNHE gene expression
pattern variation with salinity is in agreement with the observed evolutionary proximity
to “plant vacuolar” proteins, providing further evidence towards an involvement of this
protein with P. olseni salt tolerance, a possibility that should be the scope of future
work.
In contrast, temperature appeared to be the major factor responsible for changes
in relative levels of PoAdh mRNA which were already up-regulated at 15ºC and further
increased (up to 100 fold) at 22ºC (Figure V-10, Panel B), when compared to levels
expressed during normal in vitro culture conditions of 28ºC. Salinity appeared to only
moderately affect expression of this gene, and particularly at (37‰) (Figure V-10, Panel
B).
Temperature and salinity are prime environmental factors described to affect
spatial and temporal distribution of Perkinsus parasitism and periods of higher salinities
associated with higher temperatures appear to favour infection (Soniat, 1996, Burreson
and Ragone Calvo, 1996). Low salinity areas in the upper reaches of an estuary are
described to allow host population to survive even extreme Perkinsus epizootics

Parasite Response to Surroundings CHAPTER V
136
(Bushek and Allen, 1996). There were no significative effects of the pollutants studied
on these genes regulation. Our results may contribute to understand the higher survival
rate of similarly infected clams in Northern, cooler and less salty, versus Southern,
warmer and more salty, lagoons in Portugal, during the summer months (Leite et al.,
2004), if we hypothesize the possible relation of PoAdh and PoNHe with pathogenicity.
V-4 Conclusions
The sequences characterized in this work are newly identified in P. olseni
parasite and this data will complement those already obtained for the host studies
(Tanguy et al., 2004, Kang et al., 2006) and will provide more information for eventual
parasite genome annotation. The protein PoNHE characteristics allowed to infer that it
is related to the parasite host interaction process, namely in homeostasis. PoAdh
molecular characterization showed the inverse expression of PoNHE in response to
permissive host hemolymph at 6 hours exposure (Ascenso et al., unpublished b).
The molecular characteristics and gene expression patterns of PoNHE and
PoAdh permit to support the hypothesis that both genes are involved in host-parasite
interaction and in its adjustment to environmental conditions, in particular its tolerance
to salinity and temperature variations. Although little work has been done in this area
with such a model system, so little comparisons can be taken, PoNHE and PoAdh
appear to be novel genes described for this species and its expression pattern revealed
an involvement in parasite response to its host but with a clear interaction with
environmental conditions.
This work is a first step toward P. olseni overall host-response expression
mechanisms and should help us to understand this parasite’s infection mechanisms.

Development and Optimization of Transfection CHAPTER VI
CHAPTER VI – DEVELOPMENT AND OPTIMIZATION OF TRANSFECTION
METHODOLOGY FOR PERKINSUS OLSENI
“Within the last ten years, the application of modern molecular biological approaches
has provided a wealth of knowledge regarding gene structure, organization and
expression in parasitic organisms.” by Elisabetta Ullu and Timothy Nilsen (1995)
Molecular Biology of Protozoan and Helminth parasites at J. Joseph Marr and Miklós
Müller (1995) Biochemistry and Molecular Biology of Parasites, Academic Press

Development and Optimization of Transfection CHAPTER VI
VI-1 Introduction
When this PhD was initiated in 2003, no transfection protocol had ever been
described for P. olseni. However, a transfection methodology using the Nucleofector®
technology and its validation for P. marinus was recently reported (Fernández-Robledo
et al., 2008), although with a moderate efficiency (37.8%). This methodology was also
applied to P. olseni, where a similar fluorescence pattern was observed but with less
clear results, described by the authors as “intriguing” (Fernández-Robledo et al., 2008).
Little is known about the molecular biology of this mollusc parasite, but it is
easily cultured in vitro, independently of the host cells, making it a potentially useful
unicellular model for facultative parasites. Given its phylogenetic ancestry in the
Alveolata group (Saldarriaga et al., 2003), knowledge of its molecular mechanisms of
action and signalling pathways may provide important clues to better understand the
protozoans parasitism. Therefore, organisms within the Perkinsus genus are potentially
useful model systems to study interactions between the virulent form of the disease and
its host. This parasite is responsible for Perkinsosis, associated with heavy carpet-shell
clam mortalities (Azevedo, 1989b) and Dermo, deathly affecting the eastern oyster
(Mackin et al., 1950), so any developments contributing to delineate new strategies to
prevent or modulate growth of Perkinsus cells would be important. Within this line of
action, the possibility of genetic manipulation could provide a tool to better understand
the biology of this parasites and its interaction with their hosts. Many groups of
microorganisms have evolved natural mechanisms of transformation (Redfield, 1993)
but induced transfection was achieved much later with yeast, trypanosomatid parasites,
Leishmania, T. gondii, and E. histolytica. For malarial parasite, electroporation was
reported to be successful, first in P. gallinaceum (Goonewardene et al., 1993) and later

Development and Optimization of Transfection CHAPTER VI
139
in P. falciparum (Wu et al., 1995). In this work described in this chapter we have
attempted to transfect P. olseni cells using both chemical and physical approaches.
VI-1.1 Transfection methodologies
The ability to introduce nucleic acids into cells should contribute decisively to
improve our knowledge on genetic regulation and protein function in parasite cells. The
process of introducing nucleic acids into cells by non-viral methods is defined as
“transfection”, which is distinct from “infection” or viral transduction. There are various
methods of introducing foreign DNA into a cell. These methods can be broadly
classified in: 1) chemical-based methods: liposome-mediated, non-liposomal lipids,
dendrimers; 2) physical-based methods: electroporation, microparticle bombardment,
microinjection, heat shock, magnetic assisted and 3) viral-based methods: through the
use of retrovirus, adeno-associated virus and lentivirus (Müller et al., 2007).
The pioneering successful studies of Vaheri and Pagano led to the development
of the DEAE dextran-mediated transfection technique (Pagano and Vaheri, 1965),
paving the way for future experiments necessitating DNA transfer into cells cultured in
vitro.. Another of the first transfection methods to be developed and widely used for
many years is the calcium phosphate methodology, which is also one of the, cheapest
(Graham and Eb, 1973). A HEPES-buffered saline solution (HeBS) containing
phosphate ions combined with a calcium chloride solution can complex with exogenous
DNA upon mixing and then precipitates. The resulting precipitate covers the cells,
usually grown in a monolayer, which then can uptake some of the precipitate by a
process not entirely understood, and with it, the exogenous DNA. The reproducibility is
described as poor and dependent on the experimentalist. More recently, the original
method was greatly improved by developing a simple and reproducible method to

Development and Optimization of Transfection CHAPTER VI
140
prepare well-defined DNA-coated calcium phosphate nanoparticles, showing good
transfection efficiency, with complexes allowed to be stored for weeks without loss of
their transfection activity (Welzel et al., 2004).
Later, chemical transfection methodologies were developed, using lipid and
polymer-based carrier molecules. Mixtures of lipids, and certain polymers, are capable
of binding to RNA or DNA and creating liposomes, which can permeate the cellular
membrane and deliver DNA inside the cell. Depending upon the cell line, lipofection
has been described to be 5- to >100-fold more effective than either the calcium
phosphate or the DEAE dextran transfection techniques (Felgner et al., 1987). A very
efficient method is the inclusion of the DNA to be transfected in liposomes (Nabel et
al., 1993), small membrane-bounded bodies that mimics the structure of a cell and can
actually fuse with the cell membrane, releasing the DNA into the intracellular
compartment.
Cation-lipid based transfection (Lasic and Papahadjopoulos, 1995) is typically
used for eukaryotic cells, because these are more sensitive. Highly branched organic
compounds, called dendrimers, have been developed for transfection of cell lines hard-
to-transfect, as is the case of P. olseni. Another class of organic compounds,
polycationic polymers such as polyethyleneimine (PEI), was developed for delivering
biologically active compounds into a cell through a targeting group covalently bound to
its primary amine, which can interact with the surface of the cell (Kopatz et al., 2004).
Nowadays, numerous companies developed their own transfection methods versus
reagents and are commercially available, such as PEI (Sigma Aldrich) or TransPEI
(Eurogentec, Herstal, Belgium).
Physical transfection methods include the direct microinjection of materials by
electroporation, biolistic particle delivery and heat shock. Early experiments exposing

Development and Optimization of Transfection CHAPTER VI
141
cell membranes to strong electric fields involved diverse systems, ranging from nerve
fibre to bacteria. In 1958, the Ranvier nodes of nerves were reported to involve some
type of ‘‘breakdown’’; these results showed the development of strong electric field
pulses which in turn caused molecular transport across a biological membrane
(Neumann and Rosenheck, 1972). In electroporation, which mechanism involves ultra-
short and broad-band voltage pulses that modify membrane charge, transient
hydrophilic pores are created in the more fluid, lipid regions of a membrane due to both
electric field interactions and thermal fluctuations, thus allowing entrance of the
exogenous DNA (Weaver, 2003). Electroporation is regularly performed in a small
chamber with two parallel plane electrodes that use larger volumes and induces,
generally, damage to cells. The last advances eliminate many problems of
conventional electroporation, since the gap size between the two electrodes is
maximized and the surface area of electrode is minimized in a capillary
electroporation chamber compared to the cuvette type chamber, reducing the
cells damage. This is called microporation instead of electroporation (Chang et al.,
2005) and was developed by Digital Bio (www.microporator.com).
Biolistics, or particle bombardment, involves coupling the DNA to a
nanoparticle of an inert solid (commonly gold) which is then "shot" directly into the
target cell's nucleus. This has been used successfully to introduce nucleic acids into
plant cells, animal tissues or organs, and whole organisms that typically are not
amenable to transfection. This method was originally developed to use with plant cells,
where biolistics have been the most universally successful method for introduction of
nucleic acids. Biolistics provides also a practical method for in vivo studies using whole
organisms such as multicellular parasites, for which cell lines and transgenic methods
are currently not available. The first delivery by particle bombardment was developed
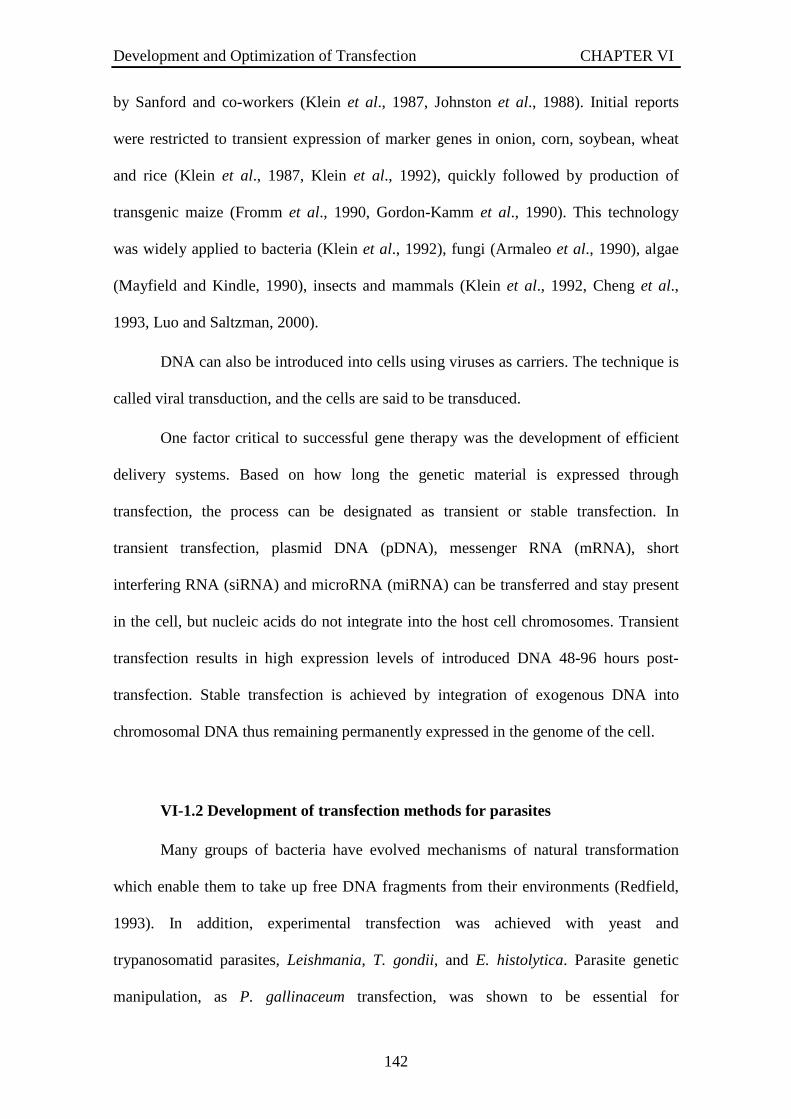
Development and Optimization of Transfection CHAPTER VI
142
by Sanford and co-workers (Klein et al., 1987, Johnston et al., 1988). Initial reports
were restricted to transient expression of marker genes in onion, corn, soybean, wheat
and rice (Klein et al., 1987, Klein et al., 1992), quickly followed by production of
transgenic maize (Fromm et al., 1990, Gordon-Kamm et al., 1990). This technology
was widely applied to bacteria (Klein et al., 1992), fungi (Armaleo et al., 1990), algae
(Mayfield and Kindle, 1990), insects and mammals (Klein et al., 1992, Cheng et al.,
1993, Luo and Saltzman, 2000).
DNA can also be introduced into cells using viruses as carriers. The technique is
called viral transduction, and the cells are said to be transduced.
One factor critical to successful gene therapy was the development of efficient
delivery systems. Based on how long the genetic material is expressed through
transfection, the process can be designated as transient or stable transfection. In
transient transfection, plasmid DNA (pDNA), messenger RNA (mRNA), short
interfering RNA (siRNA) and microRNA (miRNA) can be transferred and stay present
in the cell, but nucleic acids do not integrate into the host cell chromosomes. Transient
transfection results in high expression levels of introduced DNA 48-96 hours post-
transfection. Stable transfection is achieved by integration of exogenous DNA into
chromosomal DNA thus remaining permanently expressed in the genome of the cell.
VI-1.2 Development of transfection methods for parasites
Many groups of bacteria have evolved mechanisms of natural transformation
which enable them to take up free DNA fragments from their environments (Redfield,
1993). In addition, experimental transfection was achieved with yeast and
trypanosomatid parasites, Leishmania, T. gondii, and E. histolytica. Parasite genetic
manipulation, as P. gallinaceum transfection, was shown to be essential for

Development and Optimization of Transfection CHAPTER VI
143
understanding the complex biology of this group of pathogens and also to study
implications for both vaccine and drug development. Goonewardene and his group were
the first to describe the transient expression of luciferase in P. gallinaceum transfected
by electroporation (Goonewardene et al., 1993). Similar studies followed for P.
falciparum (Wu et al., 1995). Almost simultaneously, the first set of targeted
chromosomal integration events were reported confirming the stable transfection of P.
falciparum and P. berghei, (Wu et al., 1996, Waters et al., 1997), respectively.
Electroporation was usually the technique of choice for introducing DNA in P.
falciparum within infected red blood cells, following the methods of low voltage and
high capacitance (Fidock et al., 1998) or high voltage and low capacitance (Wu et al.,
1995). Electroporation of noninfected red blood cells allowed spontaneous uptake of
DNA by the erythrocyte-stage P. falciparum cells and was an alternative approach to
improve this parasite transfection efficiency, instead of direct transfection of parasite
cells in infected red blood cells (Deitsch et al., 2001). In parallel, other alternative
approaches have been documented but electroporation of infected red blood cells
generally remains the method of choice for introducing DNA into P. falciparum
(Skinner-Adams et al., 2003).
Classic RNAi approaches were used to reduce gene expression at multiple
Leishmania loci through improved protocols of transient and stable transfection
(Robinson and Beverley, 2003). Molecular characterization of the Leishmania genome
has been greatly facilitated by the development of stable transfection methods and
expression vectors. Gene knockout coupled to stable transfection of Leishmania and
trypanosomes requires the use of dominant selectable markers, and a number of
independent markers have been used successfully (Goyard and Beverley, 2000). In T.
brucei, equaly diploid, RNAi has proven a powerful tool for both forward and reverse

Development and Optimization of Transfection CHAPTER VI
144
genetic analysis introduced by electroporation (Bastin et al., 2000). For T. annulata
sporozoites a method to transiently transfect this cells was developed using lipid
transfection agent SuperFect™ (Adamson et al., 2004).
The physical methods for gene transfer are described as methodologies which
permit advantages and better performance compared to other transfection systems
(Mehier-Humberta and Guy, 2005).
VI-1.3 Importance of the vector features for transfection
Despite advances in gene transfer technology, some cases require an ideal vector
system specifically constructed. For T. annulata the transfection vectors were
constructed using a number of T. annulata 5’ gene flanking sequences linked to the
enhanced green fluorescence protein (eGFP) reporter gene (Adamson et al., 2004). The
selectable markers are determinant for use in genetic manipulations.
For protozoan parasites transfection, L. mexicana and T. brucei, mutant parasite
contain various well-established selectable marker genes which confer resistance to:
hygromycin (hygR), neomycin (neoR), phleomycin (bleR), puromycin (pacR) and
streptothricin acetyltransferase (sat). The gene encoding blasticidin S deaminase (BSD)
was used as a selectable marker gene for targeted chromosomal integration in
trypanosomatids (Brooks et al., 2000). Plasmid transfection vectors could carry other
selectable markers as gene locus encoding a drug-resistant form of the bifunctional
enzyme dihydrofolate reductase-thymidylate synthase (DHFR/TS) (Goonewardene et
al., 1993). The dhfr-ts genes, which confer resistance to pyrimethamine or WR99210,
came from either T. gondii (tgdhfr-ts) or human sources (hdhfr) (Wu et al., 1996)
(Fidock et al., 1998). Other selectable markers have also been successfully developed to
be used as transfection vectors such as geneticin (G418) (Mamoun et al., 1998)

Development and Optimization of Transfection CHAPTER VI
145
(Mamoun et al., 1999). In addition, here are several other selectable markers adjusted to
each experiment.
VI-1.4 Aims of the work
Advances in transfection technology suitable to allow genetic manipulation
have occurred regularly since 1990s but currently available transfection tools are
essentially useful for well explored model organisms, in particular parasites of
vertebrates. Progress in the development of new vectors could improve this situation
and hence our ability to understand the fundamental biology of other, less known
parasites such as Perkinsus. To overcome the lack of an efficient transfection
methodology for P. olseni, a compilation of possible methods to use was done through
an extended bibliographic search and several methods selected for testing using P.
olseni trophozoites maintained in suspension culture. The present work aimed (a) at
attempting to develop a transfection methodology for P. olseni by adapting and testing
various pre-existing techniques, (b) to demonstrate transformation of P. olseni and (c) to
optimize cell transfection conditions and examining some key parameters.
VI-2 Materials and Methods
VI-2.1 Transfection by chemical methodologies
VI-2.1.1 Calcium phosphate
DNA-calcium phosphate co-precipitate was used to introduce genetic material
into cells, based on a previously described method (Jordan and Wurm, 2004). The cell
culture was seeded with 1x10⁶ cells to allow exponential growth phase and obtain
approximately 3.5 x10⁶ cells/ml of medium after one day of culture. Then, cells were
washed and incubated in FBS-free cell culture medium prior to experiment. In 96-well

Development and Optimization of Transfection CHAPTER VI
146
plates, 50µl of cell suspension were plated per well immediately prior to transfection.
For each transfection assay, 0.5 µg pEGFP plasmid was prepared in 15 µl final volume
of sterile water. Five microlitters of CaCl2 1 M was added to DNA Just before
transfection 20 µl of the 2x phosphate buffer (0.5 M HEPES pH 7.1 , 3.0 M NaCl 1.0
M NaPO4 pH 7.1) was added and briefly mixed with the pipette to obtain the DNA/Ca
complexes. After 1 min incubation at room temperature, the 40 µl transfection cocktail
was added per well. A 1:1 and 1:1.2 ratio of DNA:transfection-reagent were tested. The
controls included DNA only, calcium phosphate cocktail only and no treatment at all.
The plate was incubated with shaking at 80rpm for 4 h at 28ºC before changing cell
medium to standard medium, DME/Hams (1:2) with 5% FBS. Transfection was
analysed after 16 and 48 hours by observation of 20µl sample replicates under the
microscope, excited by blue light (440-490nm).
VI-2.1.2 Cationic polymer – PEI and TransPEI
Another chemical transfection methodology was tested with the available cationic
polymers, PEI and TransPEI. Using the TransPEI (Eurogentec) the PEI nitrogen/DNA
phosphate ratio (N/P ratio) was calculated based on 7.5 mM of cation nitrogen of
TransPEI working solution. The N/P ratio was a measure of the ionic balance of the
complexes; it referred to the number of nitrogen residues of PEI per DNA phosphate.
The best transfection results were described for N/P = 5 to 10, expressed in nitrogen
residues and 1 µg of DNA contains 3 nmoles of anionic phosphate. PEI (Sigma Aldrich)
working solution was 1/25 dilution of stock solution. Immediately following plating
cells at 1x10⁶ cells/ml, transfection was performed with PEI and TransPEI in the
absence of FBS and then incubated 6 hours before changing to standard medium. 500
ng pEGFP DNA was prepared in 150 mM NaCl, to which was added the transfection

Development and Optimization of Transfection CHAPTER VI
147
reagent, incubated at room temperature and the complexes added drop wise to the cells.
Various N/P ratio were assayed in 96-well plate according to the following table, in a
final volume of 100 µl per well. The results were observed after 24 hours and 48 hours.
In another assay in 6-well plate involving PEI as transfection reagent, the ratio selected
was 1,4 in two ml cell culture.
Table VI- 1 PEI and TransPEI transfection reagent/ DNA ratio used for transfection.
Reagent Ratio Reagent/DNA
TransPEI* 1,5 3 5 6 10 16 20 32
PEI± 0,014 0,14 1,4 14,4 144,2 288,4 576,8 824
* Number of residues of nitrogen in PEI per DNA phosphate ± µg PEI to µg DNA
VI-2.2 Physical methodologies for transfection
Physical transfection methods in the present study include electroporation and
particle bombardment.
VI-2.2.1 Electroporation
The use of high-voltage pulses to introduce DNA into cultured cells is based on
the use of a short high-voltage pulse that causes the membrane potential of the cells to
break down. As a result, pores are formed through which macromolecules such as DNA
can enter. P. olseni cells were submitted to electroporation using a Gene pulser XcellTM
Electroporation system (BioRad). There are few variables defined; electroporation
media is recommended to be of high resistance. For that various transfection media
were tested: (a) 10 % glycerol, (b) cytomix (120 mM KCl, 0.15 mM CaCl2, 10 mM
K2HPO4-KH2PO4, 25 mM Hepes, 2 mM EDT and 5 mM MgCl2 at pH 7) and (c) 1 M
Sorbitol. According to the cuvette sizes (2 mm and 4 mm) it was used 40 and 80 µl,

Development and Optimization of Transfection CHAPTER VI
148
respectively. The cell culture used was at exponential growth phase with 2x10⁸ cells/ml
cell density. The cells were washed twice and resuspended in the electroporation media.
Increasing amount of DNA was tested, using 50 ng to 500 ng of purified plasmid DNA
in DNase- free water. pEGFP_N1, pcDNA3 and pβGal_Basic were the plasmids used
to analyse the introduction of foreign DNA in P. olseni cells allowing various methods
of verification of transfection efficiency. According to the cell type and some pre- set
protocols for electroporation of bacteria and yeast, resistance 200 W, capacitance 25 F,
voltage of 1500 v, 2500 v or 3000 v and pulse length from 1 ms to 5 ms were applied.
The results were checked at 48 hours observing the cells under the microscope with
fluorescence emission in blue wave length range (440-490 nm). Selection of
electroporated P. olseni cells using the geneticin resistant was performed with standard
medium containing 0.72 mg/ml geneticin (G418, Gibco), and initiated 48 hours after
transfection. Under continuous selection, geneticin-resistant-like cells were observed
and grown to be cryopreserved. The integration and expression of target DNA in
regenerated geneticin resistant cells was confirmed by RT-PCR using Geneticin
resistance gene specific primers. Results were observed and analysed accordingly.
Pre-treatment to improve transfection
Treatment of cells with pronase before application of the pulses abolishes the
ionic modulation of both electro-permeabilization and electrofusion and a rate of
expansion of permeabilization should be obtained.
The permeabilization assay was prepared testing a cell culture at 1x10⁷ cells/ml
of cell medium and various pronase concentrations, 20 mg/ml, 10 mg/ml, 5 mg/ml, 1
mg/ml, 200 µg/ml and 125 µg/ml, incubated at 37ºC and 28ºC. Other permeabilization
method used was the incubation with 25 mM DTT at 37ºC and 28ºC. The cells viability

Development and Optimization of Transfection CHAPTER VI
149
was assayed throughout time, at 5 min, 20 min, 1 hour, 2 hours and 24 hours using
trypan blue coloration observed under the microscope. After determination of the
minimal treatment for membrane permeabilization, this treatment was followed by
different methods of transfection, previously described and repeated twice.
The transfection methods used were those based on chemical methods (calcium-
phosphate and PEI) and on a physical method (electroporation). The conditions selected
were those according to the less aggressive state of the cells. This experiment was
repeated twice, including transfection reagent and DNA control conditions. The results
were based on the observation of cells under the fluorescence microscope.
Table VI- 2 P. olseni transfection plan using calcium phosphate, PEI transfection and electroporation methods after P. olseni cells permeabilization with DTT and pronase pre-treatment.
DNA Reagent
Met
ho
d
Ves
sel
Cel
l den
sity
Vo
lum
e/w
ell
Pla
smid
Am
ou
nt
Volume
Typ
e
Volume
Final
volume
0,5µg
5µl pcDNA3 + 5µl
pEGFP µg to 100µl
of 150mM NaCl PE
I
0,105µl in
600µl of
150mM
NaCl
330µl cells +
200µl
complexes
Che
mic
al
0,5µg
5µl pcDNA3 + 5µl
pEGFP and 55µl
sterile water
CaP
O4
22,2µl 1M
CaCl2
200µl 2x
phosphate
buffer
330µl cells +
200µl
complexes
Phy
sica
l
0,5µg
5µl pcDNA3 + 5µl
pEGFP
1M s
orbi
tol 1 pulse,
5ms, 2500v
330µl cells
No DNA 330µl cells
Con
trol
Thr
ee p
late
s of
12-
wel
l
1,4x
107 ce
lls/m
l
1ml
pcD
NA
3 an
d pE
GF
P
0,5µg
5µl pcDNA3 + 5µl
pEGFP Not transfection
330µl cells

Development and Optimization of Transfection CHAPTER VI
150
VI-2.2.2 Microparticle bombardment
Biolistics, or particle bombardment, has been used successfully to introduce
nucleic acids into plant cells, animal tissues or organs, and whole organisms that
typically are not amenable to more traditional methods of transfection. A biolistic based
transformation procedure was applied in the protozoan parasite, P. olseni trophozoite
cells during a short stay of visiting the laboratory of Plant Genetic Engineering, hosted
at ITQB/IBET. The parasite stock cell culture was prepared 4 days before at least. The
stock cells from small flasks were used to inoculate an 80 ml of 1x10⁶ cells/ ml cell
culture at least 2 day before transfection. Each plate for bombardment was seeded with
100 µl in the centre of 2x10⁹ and 2x10⁸ cells/ml cell density to get 2x10⁸ and 2x10⁷ cells
per plate, respectively. The preparation of the microparticles started by weighting 8 mg
gold particles (0.6 µm) counting 500 ng per bombardment. Those were washed firstly
with 70 % ethanol (400 µl), ressuspended by vortex 3-5 min and allowed to settle down
for 15 min. After that, the microparticles were collected in the bottom of the tube to
wash again with 100% ethanol. Finally the particles were washed twice with sterile
water, under the hood and were kept at 4ºC in 50 % glycerol, approximately 16.67 µl
per mg of gold (134 µl). The microcarrier- DNA complex preparation was produced by
addition of DNA to 50 µl microparticles and allowed to rest 2 min, followed by mixing.
Two sets were prepared for pcDNA3 plus pEGFP_N1 and for PoClhl_pcDNA3 plus
pEGFP. The control without DNA was also prepared. Then 50 µl CaCl2 (2.5 M) and 20
µl spermidine (0.1 M) previously prepared and sterilized by filtration (0.22 mm) were
added and incubated 10 min. To discard the supernatant the mix was vortexed for 2 min
and allowed to settle for 2 min before spinning down. Then followed by a wash with 70
% ethanol (200 µl) and then with 100 % ethanol. vortexing 2 min, allow to rest and spin
down. Starting with 50 µl microparticles and adding 21 µg DNA (3.3 µg pcDNA3 or
Development and Optimization of Transfection CHAPTER VI
151
PoClhlpcDNA3 and 0.2 µg pEGFP per bombardment) the complexes were resuspended
in 60 µl 100 % ethanol in order to load 8 µl of the macrocarrier with the microcarrier.
Before bombardment, the macro and microcarrier holders, the rupture disks and all the
equipment were pre-sterilize with 70% ethanol. The Petri dishes, paper and stopping
screens were previously sterilized. The chamber was sterilized and washed with 70%
ethanol.
Table VI- 3 Transfection of P. olseni by microparticle bombardment, distribution of assayed plates per experiment
Plasmid Control
Shoot Flying
distance
Cell
number
(100µl)
pEGFP+
pcDNA3
pEGFP+
PoClhlpcDNA3 No DNA No cells
No
shoot
2x10⁶ 1 6 9 15 1 mm
2x10⁷ 3 8 10 13
16
2x10⁶ 5 2 11 - 0.1 mm
2x10⁷ 7 4 12 14
-
Then, having the cells settled in the bombardment area, the bombardment
parameters for gap distance between the rupture disk and the microcarrier (0.1 mm and
1 mm) were adjusted as also the helium bottle pressure for 2000psi and the discharge
tube for 1600 psi, so a 1350 psi pressure shoot was performed at each bombardment.
The macrocarrier was loaded with 8 µl of well-homogenized complexes. Those were
pipetted to the macrocarrier center homogeneously distributed let the ethanol to
evaporate and place it in the macrocarrier holder. For each plate of cells was performed
a single bombardment according to the table VI-3. Immediately after the bombardment
the cells were incubated at 28ºC, kept on solid agar medium. Transfection result was
checked at 48 h by observation of each plate in inverted fluorescence microscope under
blue light (440-490 nm). Selection for geneticin resistant P. olseni cells of post-

Development and Optimization of Transfection CHAPTER VI
152
bombardment was performed after 48 hours with standard medium containing 0.72
mg/ml geneticin. Under continuous selection, geneticin-resistant-like cells were
observed and later inoculated in standard liquid medium with geneticin selection. The
integration and expression of target DNA in regenerated geneticin resistant cells was
confirmed by RT-PCR using specific primers.
VI-2.2.3 MicroPoration
Microporation (Digital Bio Technology, Suwon, Korea) was a novel
electroporation technique available in a demonstration for one test, allowing us to
continue to search and optimize the transfection condition for P. olseni. This produced
high-voltage pulses in a pipette tip as electroporation space creating uniform electric
field with minimal heat generation and oxide formation. The cell culture used was
incubated as described above to reach exponential growth phase and transferred 24
hours before transfection to medium without antibiotics. The cells were washed twice
and finally resuspended in the antibiotic-free medium. For an optimization assay in 24-
well plate a final cell number of 2,5x10⁶ cells, were used as recommended by
manufactures’ protocol (Digital Bio Technology). These cells were pelleted and
resuspended in Solution R, according to manufactures’ protocol (Digital Bio
Technology). Five hundred nanograms of purified plasmid DNA pEGFP_N1 in DNase-
free water was used per well, so 12 µg were added to the cells suspension and incubated
15 min at room temperature. According to the pre- set optimization protocol for
microporation, the voltage of the pulse ranged from 900 to 1700 volts in combination
with 20 to 30 ms pulse repeated from one to three times. Transfection results were
checked after 48 h by observation of each plate under the inverted microscope, excited
by blue light (440-490 nm).

Development and Optimization of Transfection CHAPTER VI
153
VI-3 Results and Discussion
VI-3.1 Which approach for P. olseni cells transfection?
To develop a transfection methodology for P. olseni cells, a bibliographic search
was performed to compile possible applicable strategies. Other unicellular organisms’
transfection methodologies were taken into account to search for techniques to be
applied for Perkinsus transfection, namely those used for other protozoan parasites
(Appendix VI-1). Among the collected information, two methods were chosen to try:
transfection and biolistic.
Biolistc
Strategy designed for cells transfection
cationicpolymer
CaPO4
chemical
electro-poration
physical
Transfection method
promoterreporter
gene
Vector
DNAamount
density
cell
volumephysico-chemical
characteristics
reagent recipes
Parameters
Figure VI- 1 Schematic summary of factors to take into account to develop a transfection methodology for P. olseni throphozoites.
For consistent results, it was important to maintain healthy proliferating cells;
therefore they were seeded at 1x10⁶ cells two days before the transfection attempt in
order to get trophozoites in exponential growth phase. In addition to cell conditions, the
following factors had to be taken into account in order to maximize transfection
efficiency: transfection reagent, its amount and/or transfection procedure, the plasmid
DNA, its concentration or ratio and cell medium for their incubation during and after
transfection (Figure VI-1). A comparison of some relevant characteristics between other

Development and Optimization of Transfection CHAPTER VI
154
organisms, for which successful transfection strategies were developed and P. olseni
parasite was performed. P. olseni trophozoites and schizonts are known to present a cell
wall which composition has not been fully described. According to surface/volume
(S/V) ratio the Perkinsus cells are more closely related to yeast (Table VI-4) and so we
analysed the methods used to introduce DNA into yeast cells over time.
Table VI- 4 Comparison of cell characteristics to allow selection of transfection methodology to apply for P. olseni cells (adapted from Dumont et al., 2004).
Reference Organism Type of
cell Shape
Mean
vola
(µm3)
S/V
ratio
(µm-1)
Description of cell wall
Robledo, 2002 P. olseni Protozoan Spherical* 65-
4188±
0,3-
0,07±
Montes, 2002 P. olseni Protozoan PWP-1 disulphide-rich
Afonso, unpublished
P. olseni Protozoan cell wall mannan protein /
chitin
Dumont, 2004 E. coli
Bacterium
gram
negative
Straight
rods 6 3.3 Very thin, high in lipid content
Dumont, 2004 S.
cerevisiae Yeast Ellipsoidal 250 0.7
Predominantly glucan,
mannan, and chitin polymers
Dumont, 2004 C. utilis Yeast Spherical 270 0.75 Primarily cellulose, mannan,
and glucan polymers
Dumont, 2004 K562 Leukemia
cell Spherical 523 0.6 No cell wall
* Based on the visible shape in the developed P. olseni trophozoites cell culture which exhibited size heterogeneity with tetrads and clusters consisting of
small cells (Robledo et al., 2002)
± Determined based on the described sizes for actively growing trophozoites, 4.6–16.0 µm (Robledo et al., 2002)
The procedures followed to attempt transfection of P, olseni cells were used to
obtain transient transfection only, and both chemical and physical techniques were
proposed. For the first one, carrier molecules as calcium phosphate and commercial
cationic polymers, polyethylenamine (PEI, Sigma) and TransPEI (Eurogentec) were
used. In the case of direct delivery, electroporation was performed using various

Development and Optimization of Transfection CHAPTER VI
155
protocols based on comparison with those used for other Alveolata parasites and Yeast
(Appendix VI-1). Biolistic was also tested.
VI-3.2 Selection of a reporter gene; how to confirm effective transfection?
To determine transfection efficiency, we used plasmid vectors available in the
laboratory such as pEGFP_N1 (Clontech), pcDNA3 (Invitogen) and pβGal_Basic
(Promega).
Vector pcDNA3 was chosen because it confers neomycin resistance
(Neor),allowing the selection of transformants clones under geneticin (G418, Gibco)
initially submitted to lethal concentration (EC90) and later by transformant growth
under EC50 concentration.
0 1 2 3 4 5 6 7 8 9 100.0
0.5
1.0
24 hours48 hours
Conc. (mg/ml)
Cel
lula
r vi
abili
ty
0 1 2 3 4 5 6 7 8 9 100.0
0.5
1.0
24 hours48 hours
Conc. (mg/ml)
Cel
lula
r vi
abili
ty
Figure VI- 2 P. olseni trophozoites sensitivity to geneticin (G418, Invitrogen). Cell proliferation assay was performed to assess P. olseni cellular viability using 100 µl P. olseni cells in triplicates at least. This was evaluated using the Cell Titer 96 Aqueous Non-Radioactive Cell proliferation assay (Promega) measuring absorbance at 490 nm.
Lethal (EC90) and selection (EC50) concentrations of geneticin were determined
by in vitro assay to identify P. olseni cells sensitivity (Figure VI-2). Briefly, log-phase

Development and Optimization of Transfection CHAPTER VI
156
cell culture was submitted to various concentrations of geneticin (0 to 9 mg/ml of active
antibiotic, G418 sulphate, Invitrogen) and cell viability assay performed at 24 and 48
hours. The sigmoid dose response curve constructed allowed the determination of EC50,
0.1 mg/ml and EC90, 0.72 mg/ml (r2= 0.9936). These were used as selection and lethal
concentrations, respectively, during transfection experiments.
Vector pβGal_Basic contains the gene that codes for β-galactosidase, which
enzyme activity direct assay resulted in activity of β-galactosidase in all conditions. The
expression of β-galactosidade reporter gene allowed degradation of the exogenous
substrate galactoside (o-nitrophenyl-beta-D-galactopyranoside) thus leading to the
identification of a blue product in all conditions tested, but also in control conditions
(Figure VI-3). Therefore, the possibility of using the gene β-galctosidase as reporter
gene was discarded. Indeed, the β-galactosidase gene was predicted to be present in P.
marinus genome by in silico analysis through BLASTn search at TIGR using E. coli
sequence for this enzyme.
baAssay
Control:
No electro-poration
Protocol
Electro-poration
DNA TestControlTest Control
baAssay
Control:
No electro-poration
Protocol
Electro-poration
DNA TestControlTest Control
Figure VI- 3 Testing pβGAL_Basic plasmid for transfection efficiency observation. The transfection method used was the electroporation of P. olseni cells and β-galactosidase assay performed at 6th day after transfection (a and b refers to two independent experiments).

Development and Optimization of Transfection CHAPTER VI
157
For pEFGFP-N1, it allowed a direct checking of the efficient entrance of
exogenous DNA into P. olseni cells through expression of green fluorescent protein
(GFP) because of its characteristic; emission of green fluorescence when excited by
blue light at wave length range 440-490 nm. Enhanced GFP expression was observed at
24, 48 or 72 hours under inverted fluorescence microscope (Olympus U-RFL-T),
according to the experiment design. To assay the efficiency of parasite transfection
another reporter gene, selected, the GFP at pEGFP_N1. In combination, pcDNA3 was
also used because it contained the Neor gene, thus allowing screening of the transfected
cells along time; both plasmids containing neomycin-resistance cassette (Neor). This
characteristic allowed the geneticin selection to be maintained in the transfected cells
throughout time.
Various selectable markers have been successfully developed for transfection
vectors but geneticin (Mamoun et al., 1999) was chosen to be used in our work. There
was no visible GFP expression in P. olseni cells submitted to transfection, so the green
fluorescence emission observed could not be associated with efficient transfection.
These difficulties at GFP observation were caused by a slight auto-fluorescence of the
P. olseni cells in response to excitation with blue light (440-490 nm). However, each
assay results were observed under fluorescent microscope, in parallel with the
application of geneticin selection at 48h after transfection and followed, when possible,
by RT-PCR assay to check for plasmid presence in the cells. Several methodologies
were performed using both pEGFP-N1 and pcDNA3.1 to check effective transfection in
the experiments.

Development and Optimization of Transfection CHAPTER VI
158
VI-3.3 Are chemical methodologies efficient for P. olseni cells transfection?
Transfection by calcium phosphate, originally discovered by S. Bacchetti and F.
L. Graham in 1973 was the first to be tested in P. olseni cells. In the experiments using
proportions of 1:1 and 1:1.2 of DNA: calcium phosphate, no fluorescence was observed
in the transfection assay in comparison to control at 16 hours or at 40 hours after
transfection. The complex precipitation condition is of decisive importance for cell
transfection efficiency and the parameters, pH, salt and DNA concentrations,
temperature, type of cells and the time between precipitation and transfection were
described as crucial (Bachetti and Graham, 1977). In these experiments like incubation
temperature parameter was adjusted to P. olseni cell type.
Exp
erie
nce
1 (3
2x)
Blu
e
W
hite
Control Transfection
no DNA 1:1 - DNA Ca: Pi 1:1.2 - DNA Ca: Pi
Exp
erie
nce
2 (1
0x)
Blu
e
Whi
te
Figure VI- 4 P. olseni cells submitted to calcium phosphate transfection assay. The results compared two ratios between DNA and calcium phosphate; two experiments were performed in duplicated and observed at different magnification under white and blue light.
Other chemical transfection methodologies were performed; two commercial
polyethylenimine polymers were tested: PEI (Sigma Aldrich) and TransPEI
(Eurogentec). PEI amount was added to DNA in various proportions recommended but

Development and Optimization of Transfection CHAPTER VI
159
any ratio of polycationic polymer reagent with DNA used to transfect the P. olseni cells
gave no significative emission of green fluorescence, either after 24, 48 and 72 hours
(Figure VI-5).
Control Transfection
no DNA Low reagent/ DNA ratio High reagent/ DNA ratio
PE
I (S
igm
a)
48h
72h
Blu
e
Wh
ite
Blu
e
Wh
ite
Tra
nsP
EI(
Eu
rog
ente
c)
Blu
e
Wh
ite
72h
Figure VI- 5 P. olseni cells submitted to polycationic polymer transfection assay using two different commercial products, PEI (Sigma Aldrich) and TransPEI (Eurogentec). The results compared two ratios between DNA and transfection reagent. Two independent experiments duplicated were performed and observed at different magnification at 48 and 72hours under white and blue light.
Linear PEI was considered one of the most efficient and popular compounds for
delivery of DNA into animal cells (Kopatz et al., 2004) being described that it is able to
cross the cells membrane carrying the exogenous DNA. However, presence of a cell
wall in P. olseni trophozoite cells (Ordas and Figueras, 1998 and Montes et al., 2002)
may interfere in the endocytosis of chemical agent/DNA complexes.

Development and Optimization of Transfection CHAPTER VI
160
PEI available in the laboratory was 25kDa MW but there are polyanionic
macromolecules smaller, with a number of polycationic fragments in the range from
about 8 to about 15, described to transfer DNA across biological barriers as a cell wall
or plasma membrane (US Patent 7060498). Other chemical transfection approaches
based on DEAE- dextran, polymer and lipid carrier molecules were mostly described to
be highly efficient in Eukaryotic cells. These techniques were not further pursued once
it was clear that the parasite trophozoites presented a cell-wall (Ordás and Figueras,
1998, Montes et al., 2002). The following approach was the transfer of DNA into the
cells by physical methods.
VI-3.4 Is electroporation efficient to transfect P. olseni cells?
Electroporation was the technique most used for transfection of parasites and other cell
wall-possessing organisms (Appendix VI-1), so it was also one of the methodologies
explored to transfer DNA into P. olseni cells. This physical method implied the
application of an electric pulse to the cells between two plate electrodes using BioRad
Gene Pulser. For this, the medium of cells is crucial. Different cell type medium for
electroporation were screened based on information available for other parasites
(Appendix VI-1), in order to get the most appropriate medium to perform the assays, for
a better pulse diffusion and to increase the rate of cell survival. The cells were observed
after each test in the various media and viability was checked for each assay.
FBS is one component of the cell culture standard medium that was avoided
because when used for electroporation, FBS caused electric circuit diffusion due to its
high salt content. Despite the removal of FBS from standard medium there were too
many salts that interfered with pulsing producing arching (Figure VI-6). Glycerol was
found to cause no disturbs in the electric pulse, however the cells were severely injured
and no recovery was observed in the trophozoite cells after electroporation (Figure VI-

Development and Optimization of Transfection CHAPTER VI
161
6). Cytomix was referred as a media for electroporation of P. knowlesi (van-der-Wel et
al., 1997) and E. histolytica (Nickel and Tannich, 1994) but frequently the pulse was not
constant and the system did arching when testing P. olseni cells. Parasite trophozoite
cells showed extended cell damages (Figure VI-6) compared to results obtained with
sorbitol 1M, the solution also described for yeast transfection (De-Backer et al., 1999).
In this media, P. olseni cells presented the same morphology as in their standard cell
culture medium (Figure VI-6) and recovered very well from electroporation. No arching
problems were observed using this medium. So electroporation assays were performed
in sterile 1M sorbitol medium and after, P. olseni cells were directly added to standard
culture medium and allowed to recover prior to observation for transfection efficiency.
DME:Hams without FBS 10% Glycerol
Cytomix 1M Sorbitol
Figure VI- 6 Viability of P. olseni cells submitted to electroporation. Observation through optical microscopy of P. olseni trophozoites viability checking for changes in morphology in the various media used for electroporation.

Development and Optimization of Transfection CHAPTER VI
162
1mm
Control Electroporation
No DNA Low DNA amount High DNA amount
2mm
Cu
vett
esi
ze
Blu
e
W
hit
e B
lue
Wh
ite
Figure VI- 7 Electroporation of P. olseni cells with two different amounts of purified plasmid DNA, (50 ng and 500 ng).
no DNA 1,5kv 2,3kv 2,5kv
Cuvette size
2 mm 4 mm
Control Electroporation
Blu
e
W
hit
e
Figure VI- 8 Electroporation of P. olseni cells at various conditions of electro-pulse and cuvette size.
In electroporation various quantities of plasmid DNA, various cell numbers
according to available cuvettes (1mm and 2mm) and a diversity of electroporation
conditions were tested as described in the materials and methods. The results were
observed after 24 and 48 hours but no fluorescence was observed in any condition
(Figure VI-7 and Figure VI-8).

Development and Optimization of Transfection CHAPTER VI
163
Figure VI-9 shows fluorescent schizonts six days after transfection; cels
appearedl viable and the GFP fluorescence was above background. This result was
obtained using one pulse of 2ms at 2.5 kv voltage, 25 µF capacitance, 200 W resistance,
but it also resulted in arching in the moment of electroporation. This arching means the
pulse was not constant and therefore no direct relation between this result and
transfection efficiency or conditions tested can be taken. Following this assay, the cells
were kept under selection for 12 days. During that time, fluorescence was not visible but
15 days after transfection, the cells looked viable and positive for the presence of
transfection vector.
White Blue
Figure VI- 9 P. olseni fluorescent schizont submitted to electroporation transfection assay. The electroporation assay did arching and the fluorescence was observed at 6th day after transfection using 400x magnification under fluorescence microspcope.
Although DNA transfers looked originally promising, electroporation conditions
were not characterized because of arching circumstances (Figure VI-10). Furthermore,
when the experiment was repeated, the same result was not obtained thus it was
considered to be an artefact of the first experiment.

Development and Optimization of Transfection CHAPTER VI
164
Po gene
pcDNA3
80ul cells200ng pcDNA3
Arching
40ul cells200ng pcDNA3
Arching
40ul cells200ng pcDNA3
No pulse
40ul cellsNo DNA
25uF; 5ms; 3kV
Test A
Po gene
pcDNA3
80ul cells200ng pcDNA3
Arching
40ul cells200ng pcDNA3
Arching
40ul cells200ng pcDNA3
No pulse
40ul cellsNo DNA
25uF; 5ms; 3kV
Test A
Figure VI- 10 P. olseni cells submitted to electroporation assay at various conditions of electro-pulse, in 2 mm cuvette. RT-PCR was performed for each assay 15 days after transfection using pcDNA3s Po gene, specific amplification primers and PoClhl as reference gene for PCR amplification.
Many described conditions were tested with no observed transfection of P.
olseni cells. The lack of confirmed transfection or the inability of the parasite cells to
express GFP, many issues remain to be studied. Having unacceptable results either with
PEI and TransPEI and Calcium phosphate tests or with electroporation it were
performed assays to determine the possibility to improve permeabilize of trophozoits
cell wall as a pre-treatment before transfection.
VI-3.5 How to increase the probability of transfection of P. olseni cells?
According to literature, cell permeabilization could improve transfection
effectiveness. Two approaches were selected; one based on enzymatic digestion, by
pronase and other by chemical stress, dithiothreitol (DTT). Reece and her collaborators
used pronase 125µg/ml to permeabilize Perkinsus sp. (Elston et al., 2004). So, for P.
olseni trophozoites, the permeabilization was assayed at 28ºC and 37ºC using pronase at
various concentrations (Figure VI-11). At 5 min incubation, 10mg/ml of pronase was
cytotoxic and the permeabilization condition was defined as the concentration before
the concentration for which there was a decrease in cell viability, in shorter time
incubation. So, 15 min incubation of the cells at 28ºC with 5mg/ml concentration
(Figure VI-11) was used from then on. Two more transfection attempts were performed
using three different methods previously tested, after cells pre-treatment
permeabilization with pronase or DTT. In S. pombe the efficiency transformation was

Development and Optimization of Transfection CHAPTER VI
165
enhanced with a pretreatment with 25mM DTT (Suga and Hatakeyama, 2001), so this
treatment was used also for P. olseni.
0.08 0.30 1.00 2.00 24.000.0
0.5
1.0
2.5mg/ml5mg/ml10mg/ml20mg/ml
0125ug/ml250ug/ml1mg/ml
Time (hours)
Cel
lula
r vi
abil
ity
Figure VI- 11 Observation of P. olseni cell viability under a range of pronase concentration treatment, at 28ºC. Trypan blue was the procedure used to quantify the cellular viability and the cell counting was performed in photos taken to the cells homogeneously distributed in the heamocytometer observed at 10x magnification.
DT
TP
ron
ase
Chemical Physical
Calcium phosphate PEI Electroporation
Blu
e
W
hit
eB
lue
Wh
ite

Development and Optimization of Transfection CHAPTER VI
166
Figure VI- 12 P. olseni cells submitted to calcium phosphate and PEI transfection and to electroporation, after pre-treatments with either DTT or Pronase. for cells permeabilization. Results were observed at 48h after transfection using 200x magnification under the inverted fluorescence microspcope.
From all experiments performed there was no visible fluorescence associated
with the diverse transfection methodologies tested (Figure VI-12), after
permeabilization treatment of parasite cells. This indicates that the pre-treatments tested
had no effect on the development of transfection method.
VI-3.6 Is Biolistic technique applicable to transfect P. olseni ?
Biolistics, or particle bombardment, has been used successfully to introduce
nucleic acids into plant cells, animal tissues or organs, and whole organisms that
typically are described not amenable to more traditional methods of transfection.
Microparticle bombardment was the alternative to electroporation method. These
experiments were performed in the laboratory of Plant Biotechnology at ITQB under
Dr. Margarida Oliveira supervision. For the application of this procedure it was taken
into account various conditions: pressure, DNA and gold amount per shoot (Table VI-
5).
Table VI- 5 Factors influencing transformation efficiency by microparticle bombardment of P. olseni (based on Rasco Gaunt, 2001).
2x10⁷ Cell number per 100µl
2x10⁸
0.1 Variable factors
Flying distance (cm) 1
Bombardment pressure (psi) 1,350
Amount of gold (mg/ shoot) 0.5 Constant factors
DNA amount (µg/ shoot) 3.5

Development and Optimization of Transfection CHAPTER VI
167
The parasite trophozoite cell culture was transported and acclimated to the
reference conditions and passed twice to ensure the good quality of the culture. A two
day cell culture was used to seed the previously prepared plates containing solidified
medium using 2% agar (W/ W). Cells were spread in the centre one third of a plate of
solid agar medium 1 hour before bombardment. Immediately after the bombardment the
cells were incubated at 28ºC, in solid agar medium for examination at 24 and 48 hours
but no fluorescence was observed.
Table VI- 6 Procedure for microparticle bombardment of P. olseni cells.
Day -31x106 cell culture
Day 0Sterilize paper,macrocarriers,
nests, petri dishesforceps, pipette tips
Prepare agar medium plates
Day 0Prepare gold
Prepare the DNAStart the complexes
Day 1Plate 100ul cells
2x10⁸c/ml2x109c/ml
Prepare complexesDNA-gold
Sterilize all equipmentBombardment
Day -11x106 cell culture
48h after transfectionCheck by GFP exp
Start geneticin selection
Until 3rd weekSelection 0.72mg/ml
Until 6th weekSelection 0.1mg/ml
6th weekPick 3 replica
colony (a# b# c#)Growth and selection
Of transformants
Until 6th monthNo growth
36 colonies picked
Until 6th monthNo growth
No transformantsNo transfection
observed
Microcarrier Bombardment
Selection Clone selection Transformant Store transformants
Biolistic equipmentCell Culture
After 48 hours, geneticin selection was started and the master plates were
maintained for 6 months to observe the growth of possible resistant colonies,
corresponding to positively transfected P. olseni trophozoites. Although fluorescence
was never observed, viable colonies of cells were transferred to liquid medium and
allowed to grow under geneticin selection. The plates were maintained protected from
Development and Optimization of Transfection CHAPTER VI
168
desiccation and contamination for transport back to EDGE laboratory. After 3-4 weeks
selection, the cells were tested for presence of the transferred DNA through RT-PCR
but no amplification was obtained with GFP gene specific primers. The first particle
delivery was developed by Sanford and co-workers in (Klein et al., 1987) (Johnston et
al., 1988). Despite the various attempts, integration and expression of target DNA in
geneticin resistant P. olseni cells was not confirmed since no exogenous DNA could be
detected in these conditions, indicating that cells were not successfully transfected.
VI-3.7 Is Microporation technique applicable to transfect P. olseni ?
Microporation (Digital Bio Technology, Suwon, Korea) is a recently developed
electroporation technique producing high-voltage pulses in a pipette tip as
electroporation space creats uniform electric field with minimal heat generation and
oxide formation. Various conditions were tested, from one to three pulses of various
voltage ranging from 900 to 1700 volts. After 48 hours there was no evidence of
fluorescence (Figure VI-13). However, this was a single experiment because the
equipment was not available for a additional trials. However, the absence of expected
fluorescence may be due to ineffective introduction of exogenous DNA into the cells or
the inability of the transfected cells to express EGFP. Although the advantages of this
technique are obvious, i.e the fact of being less aggressive than electroporation and use
a predefined transfection medium, there were no positive results for the development of
a transfection methodology for P. olseni cells.

Development and Optimization of Transfection CHAPTER VI
169
1250103
90030
110020
2
120040
110030
1700
1400
20
1
48hours after transfectionPulse voltage
Pulse with
Pulse nr
1250103
90030
110020
2
120040
110030
1700
1400
20
1
48hours after transfectionPulse voltage
Pulse with
Pulse nr
Con
trol
Figure VI- 13 P. olseni cells submitted to microporation and observed at 48h after transfection using 200x magnification under inverted fluorescence microscopy.

Development and Optimization of Transfection CHAPTER VI
170
VI-3.8 Could a Perkinsus directed construct produce effective P. olseni
transfection?
One attractive alternative involves the use of species specific constructs,
transfection vectors like it was designed for Theileria annulata using T. annulata 5’
gene flanking sequences linked to the enhanced green fluorescence protein (eGFP)
reporter gene (Adamson et al., 2004). This strategy was recently followed for P.
marinus parasite. A plasmid (pPmMOE-GFP) was engineered based on a P. marinus
identified gene, PmMOE. For P. marinus it was used Cell Line Optimization
Nucleofector Kit in the Nucleofector II (Amaxa) following the manufactures’
instructions resulting in the identification of a combination of transfection solution and
program that resulted in 37.8% efficiency of transfection (Fernández-Robledo et al.,
2008). Despite the evolutionary proximity of P. olseni with P. marinus, the results for
P. olseni were not shown and were described as intriguing. This was the first report of a
transfection methodology developed for a member of the Perkinsozoa but a successful
methodology for P. olseni is still missing. Therefore, we are presently trying to use a
similar methodology for P. olseni. A genus specific transfection construct was prepared
using a 600nt fragment containing the 5’ UTR of PmHSP70 and 600nt 3’UTR of
PoHSP70 flanking the eGFP ORF of the vector pEGFP-N1. The lack of availability of
electroporation apparatus was impeditive of testing this construct so far but further
studies remain to be addressed in order to develop an efficient methodology for P.
olseni cells transfection.
VI-4 Conclusions
Development of P. olseni transfection involved first the definition of a reporter
gene so the efficiency could be followed, according to available transfection vectors:

Development and Optimization of Transfection CHAPTER VI
171
pβGal- basic, pEGFP-N1 and pcDNA3. The assays screened the last two for regular use
since galactosidase was excluded because an ortholog gene was identified in silico in
the P. marinus genome.
To select a series of suitable possible methods to transfect P. olseni trophozoites,
a bibliography search was performed. Results were compiled but were also indicative of
the proximity of P. olseni to yeast in terms of methodology available. This was
validated when the best medium for electroporation was found to be 1M sorbitol,
already used for yeast transfection, and the more promising technique was
electroporation, largely used for Apicomplexans transfection. Various chemical
(calcium-phosphate and cationic polymers (PEI) and physical (electroporation,
microporation and microparticle bombardment) methodologies were tested as possible
transfection methodologies for P.olseni. However they all resulted in no visible
transfection of P. olseni cells. Very recently, a transfection procedure by electroporation
was finally developed for this genus, in particular for P. marinus (Fernández-Robledo et
al., 2008) through the use of a genus specific construct. A similar approach was taken
by the authors for P.olseni but was not very successful. We are in the process of
attempting to optimize this technique for P. olseni cells in culture using a similar genus-
-specific plasmid (5’UTR-PmHSP70pEGFP3’UTR-PoHSP70). This tool is available for
further experiments aiming at introducing exogenous DNA construct in P. olseni
trophozoites by a transfection strategy.

Development and Optimization of Transfection CHAPTER VI
General Conclusions and Perspectives CHAPTER VII
CHAPTER VII – GENERAL CONCLUSIONS AND PERSPECTIVES
“This interaction is not a game of solitaire but rather a complex game of chess, the
rules of which we are only just beginning to decipher” by Lakshmi Goyal, editor of
Cell: Host and Microbe

General Conclusions and Perspectives CHAPTER VII
174
This thesis was focused on the molecular characterization of the parasite, P.
olseni when interacting with its local host in Ria Formosa, the carpet- shell clam, R.
decussatus.
The study focused on the unveiling of P. olseni genes up-regulated when
challenged with hemolymph of its host, using a SSH strategy. Being a non-standard
system, little EST information was available at the beginning of this work which
justified the use of SSH, a widely used approach when other, more sophisticated and
highthroughput strategies such as microarrays are not available or too expensive. The
SSH approach has been previously used with success to identify differently expressed
genes in many other organisms, such as bacteria (Dwyer et al., 2004), plants (Bassani et
al., 2004), rodents (Kirsch et al., 2001), birds (Wang, 2006), and humans (Liang et al.,
2004) but in particular, to identify genes differently expressed in situations of host-
parasite interaction, such as the clam response to Perkinsus infection (Tanguy et al.,
2004, Kang et al., 2006), the response of clam hemocytes to bacterial stimulation
(Gestal et al., 2007), the Bonamia ostreae interaction with Ostrea edulis (Morga et al.,
2007) and the expression profile of genes from Sparus aurata brain in response to
nodavirus infection (Dios et al., 2007). These studies have contributed to identify the
genes expressed by an organism in response to a given stress (physiological,
environmental, exogenous infection, etc) allowing a “glimpse” into the responsive
mechanisms involved and permitting in particular a better understanding of the
molecular pathways involved in host-pathogen interactions.
For P. olseni, two strategies were followed to come up with the various diverse
genes involved in the parasite response to its host, both based on a forward subtractive
library (Ascenso et al., 2007). Our results allowed the identification of 300 new cDNA

General Conclusions and Perspectives CHAPTER VII
175
sequences providing a snapshot of the processes taking place in the parasite during its
relationship with its host and the environmental conditions that influence host-parasite
interaction. By analysing the resulting cDNA sequences with the GO program, we were
able to allocate to many of the predicted protein sequences a potential function, thus
contributing to better comprehend the parasite response to bivalves’ hemolymph
exposure (Ascenso et al., unpublished a, b).
Figure VII- 1 Model proposed for P. olseni response to host hemolymph exposure. Compilation of the diverse parasite genes identified by SSH according to the function and possible location in the parasite trophozoite cells when exposed to host hemolymph.
In many other pathogenic microorganisms, the use of SSH strategy allowed the
identification of a number of differences in gene expression including (1) Erwinia
amylovora, the causal agent of fire blight disease in various rosaceous species, namely
apple and pear, showed genomic differences between Erwinia strains with differing host
ranges including two type III secretion systems, putative tyrosine phosphatase effectors,
HOST
Interaction (chemotaxis)
Pathogenicity
Homeostasis
Basal metabolism
TransportersScavenge
Escape
PARASITE
P. olseni
Defense
P. olsenitrophozoit
Gene expression

General Conclusions and Perspectives CHAPTER VII
176
membrane transporters and polyssacaride biosynthesis (Triplett et al., 2006); or (2) B.
ostreae expressed actin, HSP90, cofilin and alpha tubulin genes in response to O. edulis
hemocytes (Morga et al., 2007). Similarly, our results showed that P. olseni responded
to host hemolymph by up- regulating a set of genes whose putative functions appear
to/could be related to host interaction, including binding activities, catalysis, chaperone,
signal transduction, transcritption and translation, transport, cellular processes and cell
adhesion. Some hypothetical, not annotated genes were also identified (Ascenso et al.,
2007), opening the way to additional studies. In figure VII-1 is proposed a cartoon
showing the diversity of parasite gene expression upon host interaction: (i) in the
defence mechanism it may be involved genes related to catalytic function, cell
communication and signalling, (ii) for escape/evasion, catalytic genes and one related
with the immune system, (iii) for homeostasis there are several genes associated with
transport, sorting and degradation, (iv) for transport there are several transporter genes
related, including membrane transporters. The scavenge activity of the parasite is
related with some transporters and catalysis of carbohydrates, lipids, nucleotides and
amino acids. Lipids are essential, the capacity of P. marinus to acquire and use host
lipids contributes directly to its pathogenicity. The incorporation, storage and
bioconversion of exogenous lipids, the de novo synthesis of fatty acids, were studied for
P. marinus and provided good insights into the metabolic abilities of the protozoan
parasite affecting the oyster C. virginica, which is able to sequester lipids from host to
its survival (Chu et al., 2000, Soucieta et al., 2000, Lund et al., 2007, Venegas-Calerón
et al., 2007).
The parasite P. olseni interactions with its host carpet- shell clam are mainly
associated with signalling and transduction genes and the pathogenicity may be
determined by several groups of genes previously mentioned combined with cell

General Conclusions and Perspectives CHAPTER VII
177
communication, cell motility and cell growth and death. Basal metabolism related genes
include the structural, transcription and translation associated functions annotated by
GO. P. olseni presented the up-regulation of chaperone related genes in response to host
hemolymph as was observed for B. ostreae in response to its host (Morga et al., 2007).
There are non-annotated genes which may bring up other functions relevant for
host-parasite interaction that were not described previously in any other species studied
until now. It has been known for some time that parasitic protozoa have capacity to
evade the immune system of their host, expressing numerous proteins of self defence, as
were already described for P. marinus (Schott et al., 2003a) (Schott et al., 2003b)
(Ahmed et al., 2003) (Pecher, 2007). Parasites have enormous advantages in their life
cycle and ability to alter themselves and their host to their own advantage. The
mechanism used by the parasite to adapt to their host and their own environment in
order to obtain essential nutrients for survival and growth and endure the complexity of
the interactions between parasites and their hosts, is one of the intriguing aspects of
parasitism that we begin to decipher in this non-model system of P. olseni that infects
various molluscs. This work is a first step toward P. olseni overall host-response
expression mechanisms and should help us understand the mechanisms involved in
parasite infection.
Gene-for-gene interactions between pathogen and host are little known for this
host-parasite interaction system but comparative genomic studies could enrich this
characterization; first approach was the identification of parasite candidate genes but the
analysis of their roles in host range and pathogenicity would be challenging.
For P. olseni it was followed the strategy of macroarray for closer analysis of
parasite response to permissive, resistant and non permissive bivalves using a selection
of 98 cDNA sequences from SSH results; those most expressed. SSH followed by

General Conclusions and Perspectives CHAPTER VII
178
macroarray was used to reveal differential gene expression profiles of S. aurata brain
infected with nodavirus (Dios et al., 2007). The pattern of gene expression was
clarifying of the up-regulation of the identified genes and some genes pointed a
differential expression in response to the various bivalves present in Ria Formosa,
namely, R. decussatus, type host susceptible, R. philippinarum a permissive, less
susceptible host and D. trunculus non-permissive to infection.
The highest up-regulated in the presence of host R. decussatus hemolymph and
differentially expressed in response to bivalves were further studied. PoNHE, encoding
a putative electron transporter and PoAdh, a putative cell adhesion associated protein
were characterized because of their functions. These genes revealed a pattern of
expression in response to environmental stresses, such as extreme salinities and
temperatures. But there was evidence that PoNHE gene expression increased with the
increasing level of infection of R. decussatus (Ascenso et al., unpublished b)
corroborating the fact that parasites may experience a wide range of environments and
nutrients availabilities for their episodes of growth and differentiation (Woo, 1998),
leading to different gene expression patterns. The effect of environmental modulation of
the virulence factors, the pathogenicity and the metabolism of P. olseni could be further
explored using a field approach comparing virulence and metabolism of parasites
purified and cultivated from infected molluscs coming from different sites.
Collaborative efforts would have a positive impact on our knowledge of the
parasite host-response and could contribute to understand outbreaks and evaluate their
impact on molluscs’ populations. Ultimately it could contribute to improve aquaculture,
namely crossing information about parasite and host separately and integrating it with
host- parasite interaction studies.

General Conclusions and Perspectives CHAPTER VII
179
The most represented gene from the forward cDNA subtractive library
constructed, PoClhl was further analysed. This gene, first classified as related to
catalysis of nucleotides, was thought to code for cytosine deaminase (CD), a pyrimidine
salvage pathway enzyme. This fact was considered very valuable because this pathway
has only been described to be present in bacteria, yeast and lower eukaryotes including,
now, the parasite Perkinsus. CD activity in the parasite led to further studies to compare
the system CD/5FC with other model systems, namely E. coli and yeast. Bacterial and
fungal cytosine deaminase are commonly used in gene-direct enzyme prodrug therapy
(GDEPT) based on their potential of activation (Springer and Niculescu-Duvaz, 2000).
PoClhl potential of activation was calculated around eight fold, representing a high
conversion of the nontoxic substrate to the toxic product.
To characterize a GDEPT system, another parameter must be taken into account,
the degree of activation (Springer and Niculescu-Duvaz, 2000). Therefore, further
studies should be performed to calculate the PoClhl degree of activation using a
transfected derivate cell line. Tests were performed using eukaryote and prokaryote
exogenous systems but no significant results could be achieved. Although the bacterial
CD is the most used until these days and has been improved for better cancer treatment
by gene therapy (Shieh et al., 2006) (Kaliberov et al., 2007), new models could be
valuable and deserve to be investigated, namely systems distant enough in terms of
metabolic pathways, to be satisfactory and effective when applied.
Secondly, the thesis has addressed the issue of development of a transfection
methodology, in order to enable the transfer of DNA into the parasite cells for gene
regulation studies. Although not achieved, several methods were screened, still many
new techniques were not tested and lately a transfection method was described
(Fernández-Robledo et al., 2008). The methodology used for P. olseni trophozoites

General Conclusions and Perspectives CHAPTER VII
180
transfection was developed using a specific construct, and although not highly efficient,
it should now serve as the basis to pursue the development/optimization of the
methodology for P. olseni trophozoites transfection. Further optimization studies must
be performed to improve the efficiency of transfection, which is required in order to use
P. olseni as a potential model of research.
To complement studies of parasite host- response and comprehend the functions
of the numerous non-annotated genes identified it would also be useful to develop gene-
specific knock-downs, as well as sub and sober-expression parasite cell lines. This
would lead us to a better comprehension of the molecular mechanisms involved in
protozoan parasite infection.

References CHAPTER VIII
CHAPTER VIII- REFERENCES

References CHAPTER VIII
182
ADAMSON, R., LYONS, K., SHARRARD, M., KINNAIRD, J., SWAN, D., GRAHAM, S., SHIELS, B. & HALL, R. (2004) Transient transfection of Theileria annulata. Molecular & Biochemical Parasitology, 114, 53-61.
AHMED, H., SCHOTT, E. J., GAUTHIER, J. D. & VASTA, G. R. (2003) Superoxide dismutases from the oyster parasite Perkinsus marinus: purification, biochemical characterization, and development of a plate microassay for activityq. Analytical Biochemistry, 318, 132-242.
ALTSCHUL, S. F., MADDEN, T. L., SCHÄFFER, A. A., ZHANG, J., ZHANG, Z., MILLER, W. & LIPMAN, D. J. (1997) Gapped BLAST and PSI-BLAST: a new generation of protein database search programs. Nucleic Acids Research, 25, 3389-3402.
ANDERSEN, L., KILSTRUP, M. & NEUHARD, J. (1989) Pyrimidine, purine and nitrogen control of cytosine deaminase synthesis in Escherichia coli K 12. Involvement of the glnLG and purR genes in the regulation of codA expression. Arch Microbiol, 152, 115-118.
ANDERSON, R. S., BURRESON, E. M. & PAYNTER, K. T. (1995) Defense responses of hemocytes withdrawn from Crassostrea virginica infected wth Perkinsus marinus. Journal of Invertebrate Pathology, 66, 82-889.
ANDERSON, R. S., UNGER, M. A. & BURRESON, E. M. (1996) Enhancement of Perkinsus marinus disease progression in TBT-exposed oysters (Crassostrea virginica). Marine Environmental Research, 42, 177-180.
ANDREWS, J. D. & RAY, S. M. (1988) Management strategies to control the disease caused by Perkinsus marinus. American Fisheries Society Special Publication, 18, 257-264.
ARMALEO, D., YE, G.-N., KLEIN, T. M., SHARK, K. B., SANFORD, J. C. & JOHNSTON, S. A. (1990) Biolistic nuclear transformation of Saccharomyces cerevisiae and other fungi Current genetics, 17, 97-103.
ARRIZABALAGA, G., RUIZ, F., MORENO, S. & BOOTHROYD, J. C. (2004) Ionophore-resistant mutant of Toxoplasma gondii reveals involvement of a sodium/hydrogen exchanger in calcium regulation. The Journal of Cell Biology, 165, 653-662.
ASCENSO, R. M. T., LEITE, R. B., AFONSO, R. & CANCELA, M. L. (2007) Suppression-subtractive hybridization: A rapid and inexpensive detection methodology for up-regulated Perkinsus olseni genes. African Journal of Biochemistry Research, 1 (3), 24-28.
ASCENSO, R. M. T., LEITE, R. B., AFONSO, R., CANCELA, M. L. (unpublished a) Expression pattern of Perkinsus olseni genes in response to bivalves with different susceptibility to Perkinsosis, Journal of Fish Disease, *,*-*
ASCENSO, R. M. T., LEITE, R. B., AFONSO, R. & CANCELA, M. L. (unpublished b) Molecular characterization of two novel Perkinsus olseni genes encoding putative Sodium Hydrogen Exchanger and Adhesion-related proteins. Experimental Parasitology, *, *-*.
AZEVEDO, C. (1989a) Fine structure of Perkinsus atlanticus n. sp. (Apicomplexa, Perkinsea) parasite of the clam Ruditapes decussatus from Portugal. J. Parasitol., 75, 627-635.
AZEVEDO, C. (1989b) Perkinsus atlanticus nova espécie protoparasita da ameijoa Ruditapes decussatus (Mollusca, Bivalvia). Pesca e Navegação.
BACHETTI, S. & GRAHAM, F. L. (1977) Transfer of the gene for thymidine kinase to thymidine kinase-deficient human cells by purified herpes simplex viral DNA. Proc. Natl. Acad. Sci. USA, 74, 1590-1594.

References CHAPTER VIII
183
BASSANI, M., NEUMANN, P. & GEPSTEIN, S. (2004) Differential expression profiles of growth-related genes in the elongation zone of maize primary roots. Plant Molecular Biology, 56, 367-380.
BASTIN, P., ELLIS, K., KOHL, L. & GULL, K. (2000) Flagellum ontogeny in trypanosomes studied via an inherited and regulated RNA interference system. Journal of Cell Science, 113, 3321-3328.
BEBIANNO, M. J., GÉRET, F., HOARAU, P., SERAFIM, M. A., COELHO, M. R., GNASSIA-BARELLI, M. & ROMÉO, M. (2004) Biomarkers in Ruditapes decussatus: a potential bioindicator species. Biomarkers, 9, 305-330.
BEBIANO, M. J. (1995) Effects of pollutants in the Ria Formosa lagoon, Portugal. The Science of the total environmental, 171.
BELHSEN, O., KODDAD, S., TALBAOUI, E. & ORBI, A. (2007) The Moroccan plan of zoo sanitary surveillance of shellfish. WOPER Workshop for the analysis of the impact to the European shellfish Industry. CETMAR, Vigo, Spain.
BERTHE, F. (2001) Report about mollusc diseases. IFREMER. BLACKBOURN, J., BOWER, S. M. & MEYER, G. R. (1998) Perkinsus qugwadi
sp.nov. (incertae sedis),a pathogenic protozoan parasite of japanese scallops, Patinopecten yessoensis, cultured in British Columbia, Canada. Can. J. Zool., 76, 942-953.
BOUQUARD, C., OUZZANI, J., PROMÉ, J.-C., MICHEL-BRIAND, Y. & PLÉSIAT, P. (1997) Dechlorination of Atrazine by a Rhizobium sp. Isolate. Applied and Environmental Microbiology, 63, 862-866.
BOWER, S. M., BLACKBOURN, J. & MEYER, G. R. (1998) Distribution, prevalence, and pathogenicity of the protozoan Perkinsus qugwadi in japanese scallops, Patinopecten yessoensis, cultured in British Columbia, Canada. Can. J. Zool., 76, 954-959.
BOWER, S. M., BLACKBOURN, J., MEYERL, G. R. & WELCH, D. W. (1999) Effect of Perkinsus qugwadi on various species and strains of scallops. Diseases of Aquatic Organisms, 36, 143-1511.
BRANDER, K. M. (2007) Global fish production and climate change. PNAS, 104, 19709-19714.
BRETT, C. L., DONOWITZ, M. & RAO, R. (2005) Evolutionary origins of eukaryotic sodium/proton exchangers. American Journal of Cell Physiology, 288, C223-C239.
BROOKS, D. R., MCCULLOCH, R., COOMBS, G. H. & MOTTRAM, J. C. (2000) Stable transformation of trypanosomatids through targeted chromosomal integration of the selectable marker gene encoding blasticidin S deaminase. FEMS Microbiology letters, 186, 287-291.
BROWN, G. D. & REECE, K. S. (2003) Isolation and characterization of serine protease gene(s) from Perkinsus. Diseases of Aquatic Organisms, 57, 117-126.
BURRESON, E. M., ALVAREZ, R. S., MARTINEZ, V. V. & MACEDO, L. A. (1994) Perkinsus marinus (Apicomplexa) as a potential source of oyster Crassostrea virginica mortality in coastal lagoons of Tabasco, Mexico. Dis. aquat. Org., 20, 77-82.
BURRESON, E. M. & RAGONE CALVO, L. M. (1996) Epizootiology of Perkinsus marinus disease of oysters in Chesapeake bay, with emphasis on data since 1985. Journal of Shellfish Research, 15, 17-34.
BURRESON, E. M., REECE, K. S. & DUNGAN, C. F. (2005) Molecular, Morphological, and Experimental Evidence Support the Synonymy of Perkinsus

References CHAPTER VIII
184
chesapeaki and Perkinsus andrewsi. The Journal of Eukaryotic Microbiology, 52, 258-270.
BUSHEK, D. & ALLEN, S. K., JR. (1996) Host-parasite interactions among broadly distributed populations of the eastern oyster Crassostrea virginica and the protozoan Perkinsus marinus. Mar. Ecol. Prog. Ser., 139, 127-141.
BUSHEK, D., FORD, S. E. & CHINTALA, M. M. (2002a) Comparison of in vitro-cultured and wild-type Perkinsus marinus. III. Fecal elimination and its role in transmission. Disease of Aquatic Organism, 51, 217-25.
BUSHEK, D., HEIDENREICH, M. & PORTER, D. (2007a) The effects of several common anthropogenic contaminants on proliferation of the parasitic oyster pathogen Perkinsus marinus. Marine Environmental Research, 64, 535-540.
BUSHEK, D., LANDAU, B., SCARPA, E., BURT, I. & DUNGAN, C. (2007b) First report of Perkinsus chesapeaki in Delaware Bay razor clams, Tagelus plebeius. Aquaculture. San Antonio, TX, USA.
BUSHEK, D., SCARPA, J. & LARAMORE, S. E. (2002b) Susceptibility of the Caribbean oyster Crassostrea rhizophorae to Perkinsus marinus. Journal of Shellfish Research, 21, 371-372.
CALVO, G. W., LUCKENBACH, M. W., STANDISH K. ALLEN, J. & BURRESON, E. M. (2001) A Comparative Field Study of Crassostrea ariakensis and Crassostrea virginica in Relation to Salinity in Virginia. Journal of Shellfish Research, 20, 221-229.
CASAS, S. M., GRAU, A., REECE, K. S., APAKUPAKUL, K., AZEVEDO, C. & VILLALBA, A. (2004) Perkinsus mediterraneus n. sp., a protistan parasite of the European flat oyster Ostrea edulis from the Balearic Islands, Mediterranean Sea. Diseases of Aquatic Organisms, 58, 231-244.
CASAS, S. M., PEYRE, J. F., REECE, K. S., AZEVEDO, C. & VILLALBA, A. (2002a) Continuous in vitro culture of the carpet shell clam Tapes decussatus protozoan parasite Perkinsus atlanticus. Dis Aquat Organ, 52, 217-231.
CASAS, S. M., VILLALBA, A. & REECE, K. S. (2002b) Study of Perkinsiosis in the carpet shell clam Tapes decussatus in Galicia (NW Spain). I.Identification of the aetiological agent and in vitro modulation of zoosporolation by temperature and salinity. Dis Aquat Organ, 50, 51-65.
CAVALIER-SMITH, T. (1999) Zooflagellate phylogeny and Systematics of Protozoa. Biol. Bull., 196, 393-396.
CHANG, J. G., CHUNG, C., CHO, K., SHIN, Y. S., KIM, J. A. & JUNG, Y. C. (2005) Electroporator Having an Elongated Hollow Member. IN TECHNOLOGY, D. B. (Ed.).
CHASZCZEWSKA-MARKOWSKA, M., STEBELSKA, K., SIKORSKI, A., MADEJ, J., OPOLSKI, A. & UGORSKI, M. (2008) Liposomal formulation of 5-fluorocytosine in suicide gene therapy with cytosine deaminase - for colorectal cancer. Cancer letters, 262, 164-172.
CHENG, L., ZIEGELHOFFER, P. R. & YANG, N.-S. (1993) In vivo promoter activity and transgene expression in mammalian somatic tissues evaluated by using particle bombardment. Proc. Natl. Acad. Sci. USA, 90, 4455-4459.
CHOI, K.-S. & PARK, K.-I. (1997) Report on the occurrence of Perkinsus sp. in the Manila clams, Ruditapes philippinarum in Korea. Journal of Aquaculture, 10, 227-237.
CHOI, K.-S., WILSON, E. A., LEWIS, D. H., POWELL, E. N. & RAY, S. M. (1989) The energetic cost of Perkinsus marinus parasitism in oysters: quantification of the thioglycollate method. Journal of Shellfish Research, 8, 125-131.

References CHAPTER VIII
185
CHOMCZYNSKI, P. & SACCHI, N. (1987) Single step method of RNA isolation by acid guanidinium thiocyanate-phenol-chloroform extraction. Anal. Biochem, 162, 156-159.
CHU, F.-L. E. & GREENE, K. H. (1989) Effect of temperature and salinity on in vitro culture of the oyster pathogen, Perkinsus marinus (Apicomplexa, Perkinsea). Journal of Invertebrate Pathology, 53, 260-268.
CHU, F.-L. E. & HALE, R. C. (1994) Relationship between pollution and susceptibility to infectious disease in the eastern oyster, Crassostrea virginica. Marine Environmental Research, 38, 243-256.
CHU, F., SOUDANT, P., VOLETY, A. & HUANG, Y. (2000) Uptake and interconversion of fluorescent lipid analogs in the protozoan parasite, Perkinsus marinus, of the oyster, Crassostrea virginica. Experimental Parasitology, 95, 240-251.
CIGARRÍA, J., RODRIGUEZ, C. & FERNÁNDEZ, J. M. (1997) Impact of Perkinsus sp. on Manila clam Ruditapes philippinarum beds. Diseases of Aquatic Organisms, 29, 117-120.
COMPS, M. & CHAGOT, D. (1987) Pathologie Animale - Une parasitose nouvelle chez la Palourde Ruditapes decussatus L. C. R. Acad. Sc. Paris, 304, 41-44.
CONCEIÇÃO, N., HENRIQUES, N. M., OHRESSER, M. C. P., HUBLITZ, P., SCHÜLE, R. & CANCELA, M. L. (2002) Molecular cloning of the Matrix Gla Protein gene from Xenopus laevis Functional analysis of the promoter identifies a calcium sensitive region required for basal activity. Eur. J. Biochem., 269, 1947-1956.
COSS, C. A., ROBLEDO, J. A. F., RUIZ, G. M. & VASTA, G. R. (2001a) Description of Perkinsus andrewsi n. sp. Isolated from the Baltic Clam (Macoma balthica) by Characterization of the Ribosomal RNA Locus, and Development of a Species-Specific PCR-Based Diagnostic Assay. The Journal of Eukaryotic Microbiology, 43, 52-61.
COSS, C. A., ROBLEDO, J. A. F. & VASTA, G. R. (2001b) Fine structure of clonally propagated in vitro life stages of a Perkinsus species isolated from Baltic Clam Macoma balthica. Journal of Eukaryotic Microbiology, 48, 31-51.
CREMONTE, F., BALSEIRO, P. and FIGUERAS, A. (2005) Occurrence of Perkinsus olseni (Protozoa: Apicomplexa) and other parasites in the venerid commercial clam Pitar rostrata from Uruguay, southwestern Atlantic coast. Diseases of Aquatic Organisms 64:85–90.
DA ROS, L. & CANZONIER, W. J. (1985) Perkinsus, a protistan threat to bivalve culture in the Mediterranean basin. Bull. Eur. Ass. Fish Pathol., 5, 23. DABROWSKA, A., SZARY, J. A., KOWALCZUK, M., SZALA, S. & UGORSKI, M.
(2004) CEA-negative glioblastoma and melanoma cells are sensitive to cytosine deaminase/5-fluorocytosine therapy directed by the carcinoembryonic antigen promoter. Acta Biochimica Polonica, 51, 723-732.
DANIELSEN, S., KILSTRUP, M., BARILLA, K., JOCHIMSEN, B. & NEUHARD, J. (1992) Characterization of the Escherichia coli codBA operon encoding cytosine permease and cytosine deaminase. Mol Microbiol, 6, 1335-1344.
DARWIN, A. J. & MILLER, V. L. (1999) Identification of Yersinia enterocolitica genes affecting survival in an animal host using signature-tagged transposon mutagenesis. Mol. Microbiol., 32, 51-62.
DAVOUDI, N., MAHBOUDI, F., AZIZI, M., ADELI, A. & MCMASTER, R. W. (2003) Introduction of Three Independent Selection Markers in Leishmania. Iran. Biomed. J., 7, 13-18.

References CHAPTER VIII
186
DE-BACKER, M. D., MAES, D., VANDONINCK, S., LOGGHE, M., CONTRERAS, R. & LUYTEN, W. H. M. L. (1999) Transformation of Candida albicans by Electroporation. Yeast, 15, 1609-1618.
DE GUISE, S., DUNGAN, C., GOEDKEN, M., MORSEY, B. & SUNILA, I. (2005) The effects of temperature and salinity on apoptosis of Crassostrea virginica hemocytes and Perkinsus marinus. Journal of Shellfish Research, 24, 177-183.
DEITSCH, K. W., DRISKILL, C. L. & WELLEMS, H. E. (2001) Transformation of malaria parasites by spontaneous uptake and expression of DNA from human erythrocytes. Nucleic Acids Research, 29, 850–853.
DELLAGI, A., BIRCH, P. R. J., HEILBRONN, J., LYON, G. D. & TOTH, I. K. (2000) cDNA-AFLP analysis of differential gene expression in the prokaryotic plant pathogen Erwinia carotovora. Microbiology, 146, 165-171.
DEVERS, M., SOULAS, G. & MARTIN-LAURENT, F. (2004) Real-time reverse transcription PCR analysis of expression of atrazine catabolism genes in two bacterial strains isolated from soil Journal of Microbiological Methods, 56, 3-15.
DIATCHENKO, L., LAU, Y.-F. C., CAMPBELL, A., CHENCHICK, A., MOQADAM, F., HUANG, B., LUKYANOV, S., LUKYANOV, K., GURSKAYA, N., SVERDLOV, E. D. & SIEBERT, P. D. (1996) Suppression subtractive hybridization: A method for generating differentially regulated or tissue-specific cDNA probes and libraries. PNAS, 93, 6025-6030.
DIOS, S., POISA-BEIRO, L., FIGUERAS, A. & NOVOA, B. (2007) Suppression subtraction hybridization (SSH) and macroarray techniques reveal differential gene expression profiles in brain of sea bream infected with nodavirus. Mol Immunol, 44, 2195-2204.
DOZOIS, C. M., DAIGLE, F. & CURTISS, R. (2003) Identification of pathogen-specific and conserved genes expressed in vivo by an avian pathogenic Escherichia coli strain. PNAS, 100, 247-252.
DUMONT, F., MARECHAL, P.-A. & GERVAIS, P. (2004) Cell Size and Water Permeability as Determining Factors for Cell Viability after Freezing at Different Cooling Rates. Applied and Environmental Microbiology, 70, 268-272.
DUNGAN, C. F. & REECE, K. S. (2006) In Vitro Propagation of Two Perkinsus spp. Parasites from Japanese Manila Clams Venerupis philippinarum and Description of Perkinsus honshuensis n. sp. . The Journal of Eukaryotic Microbiology, 53, 316-326.
DUNGAN, C. F., REECE, K. S., MOSS, J. A., STOCKES, N. A., HUDSON, K. L., HAMILTON, R. M. & BURRESON, E. M. (2007) Epidemiology evidence contradicts experimental results, and indicates consistent partitioning of hosts by two Perkinsus spp. that are co-endemic among sympatric chesapeake bay bivalve molluscs. WOPER. Vigo, Spain.
DURAISINGH, M. T., TRIGLIA, T. & COWMAN, A. F. (2002) Negative selection of Plasmodium falciparum reveals targeted gene deletion by double crossover recombination. International Journal for Parasitology, 32, 81-89.
DWYER, K., LAMONICA, J. & SCHUMACHER, J. (2004) Identification of Bacillus anthracis specific chromosomal sequences by suppressive subtractive hybridization. BMC Genomics, 5, 1-11.
EARNHART, C. G., VOGELBEIN, M. A., BROWN, G. D., REECE, K. S. & KAATTARI, S. L. (2004) Supplementation of Perkinsus marinus Cultures with

References CHAPTER VIII
187
Host Plasma or Tissue Homogenate Enhances Their Infectivity. Applied and Environmental Microbiology, 70, 421-431.
EL-SHENAWY, N. S. (2004) Heavy-Metal and Microbial Depuration of the Clam Ruditapes decussatus and Its Effect on Bivalve Behavior and Physiology. Wiley periodicals, Inc. Rnviron. Toxicol., 19, 143-153.
ELANDALLOUSSI, L. M., AFONSO, R., NUNES, P. A. & CANCELA, M. L. (2003) Effect of desferrioxamine and 2,2'-bipyridyl on the proliferation of Perkinsus atlanticus. Biomolecular Engeneering, 20, 349-354.
ELANDALLOUSSI, L. M., LEITE, R. B., RODRIGUES, P. M., AFONSO, R., NUNES, P. A. & CANCELA, M. L. (2005) Effect of antiprotozoal drugs on the proliferation of the bivalve parasite Perkinsus olseni. Aquaculture, 243, 9-17.
ELSTON, R. A., DUNGAN, C. F., MEYERS, T. R. & REECE, K. S. (2004) Perkinsus sp. infection risk for Manila clams, Venerupis philippinarum on the Pacific Coast of North and Central America. Journal of Shellfish Research, 23, 101-105.
FARZAN, M., CHOE, H., VACA, L., MARTIN, K., SUN, Y., DESJARDINS, E., RUFFING, N., WU, L., WYATT, R., GERARD, N., GERARD, C. & SODROSKI, J. (1998) A Tyrosine-Rich Region in the N Terminus of CCR5 Is Important for Human Immunodeficiency Virus Type 1 Entry and Mediates an Association between gp120 and CCR5. Journal of Virology, 72, 1160-1164.
FELGNER, P. L., GADEK, T. R., HOLM, M., ROMAN, R., CHAN, H. W., WENZ, M., NORTHROP, E. P., RINGOLD, G. M. & DANIELSEN, M. (1987) Lipofection: a highly efficient, lipid-mediated DNA-transfection procedure. Proc. Natl. Acad. Sci. USA, 84, 7413-7417.
FERNÁNDEZ-ROBLEDO, J. A., LIN, Z. & VASTA, G. R. (2008) Transfection of the protozoan parasite Perkinsus marinus. Molecular & Biochemical Parasitology, 157, 44-53.
FIDOCK, D. A., NOMURA, T. & WELLEMS, T. E. (1998) Cycloguanil and Its Parent Compound Proguanil Demonstrate Distinct Activities against Plasmodium falciparum Malaria Parasites Transformed with Human Dihydrofolate Reductase. Molecular pharmacology, 54, 1140-1147.
FISHER, W. S., GAUTHIER, J. D. & WINSTEAD, J. T. (1992) Infection intensity of Perkinsus marinus disease in Crassostrea virginica (Gmelin, 1791) from the Gulf of Mexico maintained under different laboratory conditions. Journal of Shellfish Research, 11, 363-369.
FONSECA, V. G., LAGO-LESTÓN, A., LAIZÉ, V. & CANCELA, M. L. (2005) Rapid Identification of Differentially Expressed Genes by In Situ Screening of Bacteria. Molecular Biotechnology, 30, 163-165.
FORD, S. (1996) Range Extension by the oyster parasite Perkinsus marinus into the Notheastern United States : Response to climate Change? Journal of Shellfish Research, 15, 45-56.
FORD, S. E., CHINTALA, M. M. & BUSHEK, D. (2002) Comparison of in vitro-cultured and wild-type Perkinsus marinus. I. Pathogen virulence. Dis Aquat Organ, 51, 187-201.
FOX, B. A., BELPERRON, A. A. & BZIK, D. J. (1999) Stable transformation of Toxoplasma gondii based on a pyrimethamine resistant trifunctional dihydrofolate reductase-cytosine deaminase-thymidylate synthase gene that confers sensitivity to 5-fluorocytosine. Molecular and Biochemical Parasitology, 98, 93-103.

References CHAPTER VIII
188
FROMM, M. E., MORRISH, F., ARMSTRONG, C., WILLIAMS, R., THOMAS, J. & KLEIN, T. M. (1990) Inheritance and expression of chimeric genes in the progeny of transgenic maize plants. Nature biotechnology, 8, 833-839.
FUKUDA, A., NAKAMURA, A., TAGIRI, A., TANAKA, H., MIYAO, A., HIROCHIKA, H. & TANAKA, Y. (2004) Function, Intracellular Localization and the Importance in Salt Tolerance of a Vacuolar Na+/H+ Antiporter from Rice. Plant and Cell Physiology, 45, 146-159.
GAGNAIRE, B., THOMAS-GUYON, H. & RENAULT, T. (2004) In vitro effects of cadmium and mercury on Pacific oyster, Crassostrea gigas (Thunberg), haemocytes Fish and Shellfish Immunology, 16, 501-512.
GAMITO, S. (1997) Sustainable management of a coastal lagoonal system (Ria Formosa, Portugal): An ecological model for extensive aquaculture. International Journal of Salt Lake Research, 6, 145-173.
GAUTHIER, J. & VASTA, G. R. (1995a) In vitro culture of the eastern oyster parasite Perkinsus marinus optimization of the methodology. Journal of Invertebrate Pathology, 66, 156-168.
GAUTHIER, J. D. & VASTA, G. R. (1993) Continuous in vitro culture of the eastern oyster parasite Perkinsus marinus. Journal of Invertebrate Pathology, 62, 321-323.
GAUTHIER, J. D. & VASTA, G. R. (1995b) In vitro culture of the eastern oyster parasite Perkinsus marinus: optimization of the methodology. Journal of Invertebrate Pathology, 66, 156-168.
GAUTHIER, J. D. & VASTA, G. R. (2002) Effects of plasma from bivalve mollusk species on the in vitro proliferation of the protistan parasite perkinsus marinus. Journal of Experimental Zoology, 221-230.
GESTAL, C., COSTA, M. M., FIGUERAS, A. & NOVOA, B. (2007) Analysis of differentially expressed genes in response to bacterial stimulation in hemocytes of the carpet-shell clam Ruditapes decussatus: identification of new antimicrobial peptides. Gene, 406, 134-143.
GOBLIRSCH, M., ZWOLAK, P., RAMNARAINE, M. L., WEIHONG PAN, LYNCH, C., ALAEI, P. & CLOHISY, D. R. (2006) Novel Cytosine Deaminase Fusion Gene Enhances the Effect of Radiation on Breast Cancer in Bone by Reducing Tumor Burden, Osteolysis, and Skeletal Fracture. Clinical Cancer Research, 12, 3168-3176.
GOEDKEN, M. & GUISE, S. D. (2004) Flow cytometry as a tool to quantify oyster defence mechanisms. Fish & Shellfish Immunology, 16, 532-559.
GOGGIN, C. L. (1992) occurrence of parasitism of the genus Perkinsus in France. Bull. Eur. Ass. Fish Pathol., 12, 174.
GOGGIN, C. L. (1994) Variation in the two internal transcribed spacers and 5.8S ribossomal RNA from five isolates of the marine parasite Perkinsus (Protista, Apicomplexa). Molecular and Biochemical Parasitology, 65, 179-182.
GOGGIN, C. L. & BARKER, S. C. (1993) Phylogenetic position of the genus Perkinsus (Protista, Apicomplexa) based on small subunit ribossomal RNA. Molecular and Biochemical Parasitology, 60, 65-70.
GOGGIN, C. L. & LESTER, R. J. G. (1987) Occurrence of Perkinsus species (Protozoa, Apicomplexa) in bivalves from the Great Barrier Reef. Dis. aquat. Org., 3, 113-117.
GOGGIN, C. L. & LESTER, R. J. G. (1995) Perkinsus, a protistan parasite of abalone in Australia: a review. Mar. Freshwater Res., 46, 639-646.

References CHAPTER VIII
189
GOGGIN, C. L., MCGLADDERY, S. E., E, S. K. W. H. Y. T. & CAWTHORN, R. J. (1996) An assessment of lesions in bay scallops Argopecten irradians attributed to Perkinsus karlssoni (Protozoa, Apicomplexa). Diseases of Aquatic Organisms, 24, 77-80.
GOGGIN, C. L., SEWELL, K. B. & LESTER, R. J. G. (1989) Cross-infection experiments with australian Perkinsus species. Dis. aquat. Org., 7, 55-59.
GOMES, H. L., LEITE, R. B., AFONSO, R., STALLINGA, P. & CANCELA, M. L. (2004) A Microelectrode impedance method to measure interaction of cells. Proceedings of IEEE, 2, 1011-1013.
GOONEWARDENE, R., DAILY, J., KASLOW, D., SULLIVAN, T. J., DUFFY, P., CARTER, R., MENDIS, K. & WIRTH, D. (1993) Transfection of the malaria parasite and expression of firefly luciferase. Proc. Natl. Acad. Sci. USA, 90, 5234-5236.
GORDON-KAMM, W. J., SPENCER, T. M., MANGANO, M. L., ADAMS, T. R., DAINES, R. J., START, W. G., O’BRIEN, J. V., CHAMBERS, S. A., WHITNEY R. ADAMS, J., WILLETTS, N. G., RICE, T. B., MACKEY, C. J., KRUEGER, R. W., KAUSCH, A. P. & LEMAUX, P. G. (1990) Transformation of Maize Cells and Regeneration of Fertile Transgenic Plants. The Plant Cell, 2, 603-618.
GOYARD, S. & BEVERLEY, S. M. (2000) Blasticidin resistance: a new independent marker for stable transfection of Leishmania. Molecular and Biochemical Parasitology, 108, 249-252.
GRAHAM, F. L. & EB, A. J. V. D. (1973) A new technique for the assay of infectivity of human adenovirus 5 DNA. Virology, 52, 456-467.
GROSSENBACHER, H., HORN, C., COOK, A. M. & HUTTER, R. (1984) 2-Chloro-4-Amino-1,3,5-Triazine-6(5H)-One: A New Intermediate in the Biodegradation of Chlorinated s-Triazines. Applied and Environmental Microbiology, 48, 451-453.
GROTH, D., LEHRACH, H. & HENNIG, S. (2004) GOblet: a platform for Gene Ontology annotation of anonymous sequence data. Nucleic Acids Research, 32, 313-317.
GUPTA, S. (2005) Parasite immune escape: new views into host–parasite interactions. Current Opinion in Microbiology, 8, 428-433.
HAMAGUCHI, M., SUZUKI, N., USUKI, H. & ISHIOKA, H. (1998) Perkinsus protozoan infection in short-necked clam Tapes (=Ruditapes) philippinarum in Japan. Fish Pathology, 33, 473-480.
HELLER, M. (2002) DNA microarray technology: devices, systems, and applications. Annual Reiew Biomed Eng, 4, 129-153.
HENSEL, M., SHEA, J. E., GLEESON, C., JONES, M. D., DALTON, E. & HOLDEN, D. W. (1995) Simultaneous identification of bacterial virulence genes by negative selection. Science, 269, 400-403.
HILI, H. A. E., SALAH, C. B., AYARI, W. & AMOR, N. B. (2007) Spatial and temporal distribution of Perkinsus olseni in clams Ruditapes decussatus from Medenine costal area (Southern Tunisia). WOPER Workshop for the analysis of the impact to the European shellfish Industry. CETMAR, Vigo, Spain.
HINE, P. M. & THORNE, T. (2000) A survey of some parasites and diseases of several species of bivalve mollusc in northern Western Australia. Disease of Aquatic Organism, 40, 67-78.

References CHAPTER VIII
190
HOFMANN, E. E., POWELL, E. N., KLINCK, J. M. & SAUNDERS, G. (1995) Modelling diseased oyster populations I. Modelling Perkinsus marinus infections in oysters. Journal of Shellfish Research, 14, 121-151.
HOLM, L. & SANDER, C. (1997) An Evolutionary Treasure: Unification of a Broad Set of Amidohydrolases Related to Urease. Proteins: structure, function and genetics, 28, 72-82.
HUBER, B. E., AUSTIN, E. A., RICHARDS, C. A., DAVIS, S. T. & GOOD, S. S. (1994) Metabolism of 5-fluorocytosine to 5-fluorouracil in human colorectal tumor cells transduced with the cytosine deaminase gene: Significant antitumor effects when only a small percentage of tumor cells express cytosine deaminase
Proc. Natl. Acad. Sci. USA, 91, 8302-8306. IPIMAR (2003) Relatório de actividades do IPIMAR. ipimar-iniap.ipimar.pt. IRETON, G. C., MCDERMOTT, G., BLACK, M. E. & STODDARD, B. L. (2002) The
Structure of Escherichia coli Cytosine Deaminase. J. Mol. Biol, 315, 687-697. JOHNSTON, S., ANZIANO, P., SHARK, K., SANFORD, J. & BUTOW, R. (1988)
Mitochondrial transformation in yeast by bombardment with microprojectiles. Science, 240, 1538-1548.
JORDAN, M. & WURM, F. (2004) Transfection of adherent and suspended cells by calcium phosphate Methods, 33, 136-143.
KALIBEROV, S., MARKET, J., GILLESPIE, G., KRENDELCHTCHIKOVA, V., MANNA, D. D., SELLERS, J., KALIBEROVA, L., BLACK, M. & BUCHSBAUM, D. (2007) Mutation of Escherichia coli cytosine deaminase significantly enhances molecular chemotherapy of human glioma. Gene Therapy, 14, 11111-11119.
KANG, Y.-S., KIM, Y.-M., PARK, K.-I., CHO, S. K., CHOI, K.-S. & CHO, M. (2006) Analysis of EST and lectin expressions in hemocytes of Manila clams (Ruditapes philippinarum) (Bivalvia: Mollusca) infected with Perkinsus olseni. Development and Comparative Immunology, 30, 1119-1131.
KARASOV, A. O., BOOTHROYD, J. C. & ARRIZABALAGA, G. (2005) Identification and disruption of a rhoptry-localized homologue of sodium hydrogen exchangers in Toxoplasma gondii. International Journal for Parasitology, 35, 285-291.
KILSTRRUP, M., MENG, L. M., NEUHARD, J. & NYGAARD, P. (1989) Genetic Evidence for a Repressor of Synthesis of Cytosine Deaminase and Purine Biosynthesis Enzymes in Escherichia coli. Journal of Bacteriology, 171, 21244-2127.
KIRSCH, T., WELLNER, M., LUFT, F., HALLER, H. & LIPPOLDT, A. (2001) Altered gene expression in cerebral capillaries of stroke-prone spontaneously hypertensive rats. Brain Research, 910, 106-115.
KLEIN, T. M., ARENTZEN, R., LEWIS, P. A. & FITZPATRICK-MCELLIGOTT, S. (1992) Transformation of Microbes, Plants and Animals by Particle Bombardment. Nature biotechnology, 10, 286-291.
KLEIN, T. M., WOLF, E. D., WU, R. & SANFORD, J. C. (1987) High-velocity microprojectiles for delivering nucleic acids into living cells. Nature Biotechnology, 327, 70-73.
KLEINSCHUSTER, S. J., PERKINS, F. O., DYKSTRA, M. J. & SWINK, S. L. (1999) The in vitro life cycle of Perkinsus species (Apicomplexa, Perkinsidae) isolated from Macoma balthica (Linnaeus, 1758). Journal of Shellfish Research, 13, 461-465.

References CHAPTER VIII
191
KO, T.-P., LIN, J.-J., HU, C.-Y., HSU, Y.-H., WANG, A. H.-J. & LIAW, S.-H. (2003) Crystal structure of yeast cytosine deaminase: Insights into Enzyme Metabolism and Evolution. The Journal of Biological Chemistry, 278, 19111-19117.
KOLTAI, H. & WEINGARTEN-BAROR, C. (2008) Specificity of DNA microarray hybridization: characterization, effectors and approaches for data correction. Nucleic Acids Research, 36, 2395-2405.
KOPATZ, I., REMY, J.-S. & BEHR, J.-P. (2004) A model for non-viral gene delivery: through syndecan adhesion molecules and powered by actin. The Journal of Gene Medicine, 6, 769-776.
KOTOB, S., MCLAUGHLIN, S., VANBERKUM, P. & FAISAL, M. (1999) Characterization of two Perkinsus spp. from the softshell clam, Mya arenaria using the small subunit ribosomal RNA gene. Journal of Eukaryotic Microbiology, 46, 439-444.
KUBOKI, N., KIBE, M. K., THEKISOE, O. M. M., SUGIMOTO, C. & INOUE, N. (2007) Transcriptional analyses of Trypanosoma brucei gambiense from infected mice and in vitro culture. Journal of Protozoology research, 17, 25-31.
KUVARDINA, O. N., LEANDER, B. S., ALESHIN, V. V., MYL'NIKOV, A. P., KEELING, P. J. & SIMDYANOV, T. G. (2002) The Phylogeny of Colpodellids (Alveolata) using Small Subunit rRna gene sequences sugest they are free-living sister group to Apicomplexa. J Eukaryot Microbiol, 49, 498-504.
KYTE, J. & DOOLITTLE, R. F. (1982) A Simple Method For Displaying the hydropahitic character of a protein. Journal of Molecular Biology, 157, 105-132.
LANGAND, J., JOURDANE, J., COUSTAU, C., DELAY, B. & MORAND, S. (1998) Cost of resistance, expressed as delayed maturity, detected in the host-parasite system Biomphalaria glabratal/ Echinostoma caproni. Heredity, 80, 320-325.
LASIC, D. & PAPAHADJOPOULOS, D. (1995) Liposomes revisited. Science, 267, 1275-1276.
LATHIA, K. B., YAN, Z. & CLAPSHAW, P. A. (2006) Spinal Cord Transcriptome Analysis Using Suppression Subtractive Hybridization and Mirror Orientation Selection. Cellular and Molecular Neurobiology, 26, 259-275.
LEANDER, B. S. & KEELING, P. J. (2003) Morphostasis in Alveolata evolution. Trends in Ecology evolution, 18, 395-402.
LEE, H., RYU, J., KIM, K.-A., LEE, K. I. S. O., LEEJA, J. Y., PARK, E.-B., PARK, J. & CHOI, S. Y. (2004) Transduction of yeast cytosine deaminase mediated by HIV-1 Tat basic domain into tumor cells induces chemosensitivity to 5-fluorocytosine. Experimental and Molecular Madicine, 36, 43-51.
LEE, M. K., CHO, B. Y., LEE, S. J., KANG, J. Y., JEONG, H. D., HUH, S. H. & HUH, M. D. (2001) Histopathological lesions of Manila clam, Tapes philippinarum, from Hadong and Namhae coastal areas of Korea. Aquaculture, 201, 199-209.
LEETHOCHAVALIT, S., CHALERMWAT, K., UPATHAM, E. S., KWANGSIK, C., SAWANGWONG, P. & KRUATRACHUE, M. (2004) Occurrence of Perkinsus sp. in undulated surf clams Paphia undulata from the Gulf of Thailand. Diseases of Aquatic Organisms, 60, 165-171.
LEIRIÃO, P., D.RODRIGUES, C., S.ALBUQUERQUE, S. & M.MOTA, M. (2004) Survival of protozoan intracellular parasites in host cells. EMBO Reports, 5, 1142–1147.
LEITE, R. B., AFONSO, R., ASCENSO, R., SIMÃO, M. & CANCELA, M. L. (2007) Effect of Perkinsus infection on expression of Ruditapes decussatus biomarkers
References CHAPTER VIII
192
genes in response to environmental pollutants. Marine Genomics International Congress. Sorrento, Italy.
LEITE, R. B., AFONSO, R. & CANCELA, M. L. (2004) Perkinsus sp. infestation in carpet-shell clams, Ruditapes decussatus (L), along the Portuguese coast. Results from a 2-year survey. Aquaculture, 240, 39-53.
LEITE, R. B., BRITO, A. B. & CANCELA, M. L. (2008) An Oxygen Molecular Sensor, the HIF Prolyl 4-Hydroxylase, in the Marine Protist Perkinsus olseni Protist, 159, 355-368.
LESTER, R. J. G. & DAVIS, G. H. G. (1981) A new Perkinsus species (Apicomplexa, Perkinsea) from the abalone Haliotis ruber. Journal of Invertebrate Pathology, 37, 181-187.
LEVINE, N. D. (1978) Perkinsus gen. n. and other new taxa in the protozoan phylum Apicomplexa. journal of Parasitology, 64, 549.
LIANG, G., ZHANG, X. D., WANG, L. J., SHA, Y. S., ZHANG, J. C., MIAO, S. Y., ZONG, S. D., WANG, L. F. & KOIDE, S. (2004) Identification of differentially expressed genes of primary spermatocyte against round spermatid isolated from human testis using the laser capture microdissection technique. Cell Research, 14, 507-512.
LIANG, P., ZHU, W., ZHANG, X., GUO, Z., P.O'CONNELI, R., AVERBOUKH, L., WANG, F. & B.PARDEEL, A. (1994) Differential display using one-base anchored oligo-dT primers. Nucleic Acids Research, 22, 5763-5764.
LIANG, Y. B., ZHANG, X. C., WANG, L. J., YANG, B., ZHANG, Y. & CAI., C. L. (2001) Prevalence of Perkinsus sp. in the Manila clam Ruditapes philippinarum along northern coast of Yellow Sea in China. Oceanologia et Limnologia Sinica, 32, 502-511.
LIEVENS, S., GOORMACHTIG, S. & HOLSTERS, M. (2001) A critical evaluation of differential display as a tool for identify genes involved in legume modulation: looking back and loocking forward. Nucleic Acids Research, 29, 3459-3468.
LÓPEZ, C., CARBALLAL, M. J., AZEVEDO, C. & VILLALBA, A. (1997) Morphological characterization of the hemocytes of the clam, Ruditapes decussatus (Mollusca: Bivalvia). J. Invert. Pathol., 69, 51-56.
LUND, E., CHU, F., SOUDANT, P. & HARVEY, E. (2007) Perkinsus marinus, a protozoan parasite of the eastern oyster, has a requirement for dietary sterols. Comp Biochem Physiol A Mol Integr Physiol, 146, 141-147.
LUO, D. & SALTZMAN, W. M. (2000) Synthetic DNA delivery systems. Natura biotechnology, 18, 33-37.
MACKENZIE, K., WILLIAMS, H. H., WILLIAMS, B., MCVICAR, A. H. & SIDDAL, R. (1995) Parasites as indicators of water quality and the potential use of helminth transmission in marine pollution studies. Advances in parasitology, 35, 86-144.
MACKIN, J. G., OWEN, H. M. & COLLIER, A. (1950) Preliminary note on the occurrence of a new protistan parasite, Dermocystidium marinum n. sp. in Crassostrea virginica (Gmelin). Science.
MACKIN, J. G. & RAY, S. M. (1966) The taxonomic relationships of Dermocystidium marinum Mackin, Owen and Collier. Journal of Invertebrate Pathology, 8, 544-545.
MAHALINGAM, R., GOMEZ-BUITRAGO, A., ECKARDT, N., SHAH, N., GUEVARA-GARCIA, A., DAY, R. R. P. & FEDOROFF, N. V. (2003) Characterizing the stress/defense transcriptome of Arabidopsis. Genome Biology, 4, 1-14.

References CHAPTER VIII
193
MAMOUN, C. B., DAVID J. SULLIVAN, J., BANERJEE, R. & GOLDBERG, D. E. (1998) Identification and Characterization of an Unusual Double Serine/Threonine Protein Phosphatase 2C in the Malaria Parasite Plasmodium falciparum. The Journal of Biological Chemestry, 273, 11241-11247.
MAMOUN, C. B., GLUZMAN, I. Y., GOYARD, S., BEVERLEY, S. M. & GOLDBERG, D. E. (1999) A set of independent selectable markers for transfection of the human malaria parasite Plasmodium falciparum. Proc. Natl. Acad. Sci. USA, 96, 8716-8720.
MARR, J. J. & MÜLLER, M. (1995) Biochemistry and Molecular Biology of Parasites, London, Academic Press Harcourt Brace & Company Publishers.
MATSUZAKI, M., KUROIWA, H., KUROIWA, T., KITA, K. & NOZAKI, H. (2008) A Cryptic Algal Group Unveiled: A Plastid Biosynthesis Pathway in the Oyster Parasite Perkinsus marinus. Molecular Biology and Evolution, 25, 1167-1179.
MAYFIELD, S. P. & KINDLE, K. L. (1990) Stable nuclear transformation of Chlamydomonas reinhardtii by using a C. reinhardtii gene as the selectable marker. Proc. Natl. Acad. Sci. USA, 87, 2087-2091.
MAZURAIS, D., MONTFORT, J., DELALANDE, C. & GAC, F. (2005) Transcriptional analysis of testis maturation using trout cDNA macroarrays. Gen Comp Endocrinol 142, 143-154.
MCGLADDERY, S. E., CAWTHORN, R. J. & BRADFORD, B. C. (1991) Perkinsus karlssoni n. sp. (Apicomplexa) in bay scallops Argopecten irradians. Dis. aquat. Org., 10, 127-137.
MCLAUGHLIN, S. M., TALL, B. D., SHAHEEN, A., ELSAYED, E. E. & FAISAL, M. (2000) Zoosporulation of a new Perkinsus species isolated from the gills of the softshell clam Mya arenaria. Parasite, 7, 115-122.
MEHIER-HUMBERTA, S. & GUY, R. H. (2005) Physical methods for gene transfer: Improving the kinetics of gene delivery into cells. Advanced Drug Delivery Reviews, 57, 733-753.
MIOSSEC, L., GARCIA, C., ARZUL, I., FRANÇOIS, C., JOLY, J. P., CHOLLET, B. & ROBERT, S. (2007) Results of the Perkinsosis survey in France (2004- 2005). WOPER Workshop for the analysis of the impact to the European shellfish Industry. CETMAR, Vigo, Spain.
MONTES, J. F., DEL RIO, J. A., DURFORT, M. & GARCIA-VALERO, J. (1997) The protozoan parasite Perkinsus atlanticus elicits a unique defensive response in the Tapes semidecussatus. Parasitology, 114, 339-349.
MONTES, J. F., DUFORT, M., LLADÓ, A. & GARCÍA-VALERO, J. (2002) Characterization and immunolocalization of a main proteinaceous component of the cell wall of the protozoan parasite Perkinsus atlanticus. Parasitology, 124, 477-484.
MONTES, J. F., DURFORT, M. & GARCÍA-VALERO, J. (2001) Parasitism by the protozoan Perkinsus atlanticus favours the development of opportunistic infections. Diseases of Aquatic Organisms, 46, 57-66.
MORGA, B., ARZUL, I., FAURY, N., GAGNAIRE, B., CHOLLET, B. & RENAULT, T. (2007) Study of interactions between flat oyster, Ostrea edulis, and the parasite Bonamia ostreae using flow cytometry and suppression subtractrive hybridization (SSH). 13th EAFP Internation Conference "Diseases of Fish and Shellfish" Grado, Italy, European Association of Fish Pathologists.
MOSS, J., XIAO, J., DUNGAN, C. & REECE, K. (2008) Description of Perkinsus beihaiensis n. sp., a new Perkinsus sp. parasite in oysters of Southern China. Journal of Eukaryotic Microbiology, 55, 117-130.

References CHAPTER VIII
194
MUDGE, S.M., ICELY, J.D., and NEWTON, A. (2008). Residence times in a hypersaline lagoon: Using salinity as a tracer. Estuarine, Coastal and Shelf Science 77, 278-284.
MÜLLER, O. J., KATUS, H. A. & BEKEREDJIAN, R. (2007) Targeting the heart with gene therapy-optimized gene delivery methods. Cardiovascular Research, 73, 453-462.
MURRELL, A., KLEEMAN, S. N., BARKER, S. C. & LESTER, R. J. G. (2002) Synonymy of Perkinsus olseni Lester & Davis, 1981 and Perkinsus atlanticus Azevedo, 1989 and an update on the phylogenetic position of the genus Prekinsus. Bulletin of the European Association of Fish Pathologists 22, 258-265.
MUSE, W. B., ROSARIO, C. J. & BENDER, R. A. (2003) Nitrogen Regulation of the codBA (Cytosine Deaminase) Operon from Escherichia coli by the Nitrogen Assimilation Control Protein, NAC. Journal of Bacteriology, 185, 2920–2926.
NABEL, G. J., NABEL, E. G., YANG, Z.-Y., FOX, B. A., PLAUTZ, G. E., GAO, X., HUANG, L., SHU, S., GORDON, D. & CHANG, A. E. (1993) Direct gene transfer with DNA-liposome complexes in melanoma: Expression, biologic activity, and lack of toxicity in humans. Proc. Natl. Acad. Sci. USA, 90, 11307-11311.
NASS, R. & RAO, R. (1999) The yeast endosomal Na+/H+ exchanger, Nhx1, confers osmotolerance following acute hypertonic shock. Microbiology, 145, 3221-3228.
NAVAS, J. I., CASTILLO, M. C., VERA, P. & RUIZ-RICO, M. (1992) Principal parasites observed in clams, Ruditapes decussatus (L.), Ruditapes philippinarum (Adams et Reeve), Venerupis pullastra (Montagu) and Venerupis aureus (Gmelin), from the Huelva coast (S.W. Spain). Aquaculture, 107, 193-199.
NEUMANN, E. & ROSENHECK, K. (1972) Permeability changes induced by electric impulses in vesicular membranes. Journal of Membrane Biology, 10, 279-290.
NEWTON, A. & MUDGE, S. M. (2003) Temperature and salinity regimes in a shallow, mesotidal lagoon, the Ria Formosa, Portugal. Estuarine, Coastal and Shelf Science, 56, 1-13.
NICKEL, R. & TANNICH, E. (1994) Transfection and transient expression of chloramphenicol acetyltransferase gene in the protozoan parasite Entamoeba histolytica. PNAS, 91, 7095-7098.
NISHIYAMA, T., KAWAMURA, Y., KAWAMOTO, K., MATSUMURA, H., YAMAMOTO, N., ITO, T., OHYAMA, A., KATSURAGI, T. & SAKAI, T. (1985) Antineoplastic effects in rats of 5-fluorocytosine in combination with cytosine deaminase capsules. Cancer Research, 45, 1753-1761.
NORÉN, F., MOESTRUP, Ø. & REHNSTAM-HOLM, A.-S. (1999) Parvilucifera infectans Norén et Moestrup gen. et sp. nov. (Perkinsozoa phylum nov.): a parasitic flagellate capable of killing toxic microalgae. European journal of protistology, 35, 233-254.
NYATI, M. K., SREEKUMAR, A., LI, S., ZHANG, M., RYNKIEWICZ, S. D., ARUL M. CHINNAIYAN, REHEMTULLA, A. & LAWRENCE, T. S. (2002) High and Selective Expression of Yeast Cytosine Deaminase under a Carcinoembryonic Antigen Promoter-Enhancer. Cancer Research, 62, 2337–2342.
OLIVER, J. L., LEWIS, T. D., FAISAL, M. & KAATTARI, S. L. (1999) Analysis of the Effects of Perkinsus marinus Proteases on Plasma Proteins of the Eastern

References CHAPTER VIII
195
Oyster (Crassostrea virginica) and the Pacific Oyster (Crassostrea gigas). Journal of Invertebrate Pathology, 74, 173-183.
ORDÁS, M. C. & FIGUERAS, A. (1998) In vitro culture of Perkinsus atlanticus, a parasite of the carpet shell clam Ruditapes decussatus. Dis. aquat. Org., 33, 129-136.
ORLOWSKI, J. & GRINSTEIN, S. (1997) Na+/H+ exchangers in mammalian cells. The Journal of Biological Chemistry, 272, 22373-22376.
PAGANO, J. S. & VAHERI, A. (1965) Enhancement of infectivity of poliovirus RNA with diethylaminoethyl-dextran (DEAE-D). Archives of Virology, 17, 456-464.
PAIMENT, A., HOCKING, J. & WHITFIELD, C. (2002) Impact of Phosphorylation of Specific Residues in the Tyrosine Autokinase, Wzc, on Its Activity in Assembly of Group 1 Capsules in Escherichia coli. journal of Bacteriology, 184, 6437-6447.
PARK, K.-I. & CHOI, K.-S. (2001) Spatial distribution of the protozoan parasite Perkinsus sp. found in the Manila clams, Ruditapes philippinarum, in Korea. Aquaculture, 203, 9-22.
PARK, K.-I., CHOI, K.-S. & CHOI, J.-W. (1999) Epizootiology of Perkinsus sp. found in the Manila clam, Ruditapes philippinarum in Komsoe Bay. Journal of the Korean Fisheries Society, 32, 303-309.
PATHY (1994) Introns and exons. Curr. Opinion in Structural Biology, 4, 383-392. PECHER, W. T. (2007) Host preference of Perkinsus species: epizootiological,
environmental, and molecular aspects. Center of Marine Biotechnology. Baltimore, University of Maryland Biotechnology Institute.
PERKINS, F. O. (1987) Protistan parasites of commercially significant marine bivalve molluscs - life cycles, ultrastructure and phylogeny. Aquaculture, 67, 240-243.
PERKINS, F. O. (1996) The structure of Perkinsus marinus (Mackin, Owen and Collier, 1950) Levine, 1978 with comments on taxonomy and phylogeny pf Perkinsus spp. Journal of Shellfish Research, 15, 67-87.
PERKINS, F. O. & MENZEL, R. W. (1966) Morphological and cultural studies of a motile stage in the life cycle of Dermocystidium marinum. Proceedings of the National Shellfisheries Association.
PEYRE, J. F. (1996) Propagation and in vitro studies of Perkinsus marinus. Journal of Shellfish Research, 15, 89-101.
PEYRE, J. F., FAISAL, M. & BURRESON, E. M. (1993) In vitro propagation of the protozoan Perkinsus marinus,a pathogen of the eastern oyster, Crassostrea virginica. J. Euk. Microbiol., 40, 304-310.
PEYRE, J. F. L., CHU, F.-L. E. & VOGELBEIN, W. K. (1995) In vitro interaction of Perkinsus marinus merozoites with eastern and pacific oyster hemocytes. Development and Comparative Immunology, 19, 291-304.
PORTER, D. J. T. & AUSTIN, E. A. (1993) Cytosine Deaminase The Roles os Divalent Metal Ions in Catalysis. The Journal of Biological Chemistry, 268, 24005-24011.
PRENETA, R., JARRAUD, S., VINCENT, C., DOUBLET, P., B. DUCLOSA, ETIENNE, J. & COZZONE, A. J. (2002) Isolation and characterization of a protein-tyrosine kinase and a phosphotyrosine-protein phosphatase from Klebsiella pneumoniae. Comparative Biochemistry and Physiology, 131, 103-112.
PROMEGA Transfection guide.

References CHAPTER VIII
196
PUTNEY, L. K., DENKER, S. P. & BARBER, D. L. (2002) The changing face of the Na+/H+ Exchanger, NHE1: Structure, Regulation, and Cellular Actions. Ann. Rev. Pharmacol. Toxicol., 42, 527-552.
RAGONE, L. M. & BURRESON, E. M. (1993) Effect of salinity on the infection progression and pathogenicity of Perkinsus marinus in eastern oyster, Crassostrea virginica (Gmelin). Journal of Shellfish Research, 12, 1-7.
REBRIKOV, D. V., BRITANOVA, O. V., GURSKAYA, N. G., LUKYANOV, K. A., TARABYKIN, V. S. & LUKYANOV, S. A. (2000) Mirror orientation selection (MOS): a method for eliminating false positive clones from libraries generated by suppression subtractive hybridization. Nucleic Acids Research, 28, 1-4.
REDFIELD, R. J. (1993) Evolution of Natural Transformation: Testing the DNA Repair Hypothesis in Bacillus subtilis and Haemophilus intuenzae. Genetics, 133, 755-761.
REECE, K. S., SIDDALL, M. E., BURRESON, E. M. & GRAVES, J. E. (1997) Phylogenetic analysis of Perkinsus based on actin gene sequences. J. Parasitol., 83, 417-423.
ROBINSON, K. A. & BEVERLEY, S. M. (2003) Improvements in transfection efficiency and tests of RNA interference (RNAi) approaches in the protozoan parasite Leishmania. Molecular & Biochemical Parasitology, 128, 217-228.
ROBLEDO, J.-A. F., COURVILLE, P., CELLIER, M. F. M. & VASTA, G. R. (2004) Gene organization and expression of the divalent cation transporter Nramp in the Protistan parasite Perkinsus marinus. J. Parasitol., 90, 1004-1014.
ROBLEDO, J. A. F., COSS, C. A. & VASTA, G. R. (2000) Characterization of the ribossomal RNA locus of Perkinsus atlanticus and development of a Polymerase Chain Reaction-based diagnostic assay. 7 pages.
ROBLEDO, J. A. F., GARDNER, M. J., EL-SAYED, N. M. & VASTA, G. R. (****) Expressed Sequence Tags from the early Dinoflagellate Perkinsus marinus. Unpublished.
ROBLEDO, J. A. F., NUNES, P. A., CANCELA, M. L. & VASTA, G. R. (2002) Development of an In Vitro Clonal Culture and Characterization of the rRNA Gene Cluster of Perkinsus atlanticus, a Protistan Parasite of the Clam Tapes decussatus. J Eukaryot Microbiol, 49, 414-422.
ROBLEDO, J. A. F., WRIGHT, A. C., COSS, C. A., VASTA, G. R. & GOGGIN, C. L. (1997) Further studies of conserved genes from Perkinsus isolates. Journal of Shellfish Research, 16, 342.
RUANO, F. (1997) Fisheries and farming of important marine bivalves in Portugal. NOOA Tech. Rep. NMFS, 129, 191-200.
RUANO, F. (2001). Doenças da Amêijoa-boa (Ruditapes decussatus) e implicações na sua cultura no Litoral Algarvio. In IPIMAR Divulgação.
SADOWSKY, M. J., TONG, Z., SOUZA, M. D. & WACKETT, L. P. (1998) AtzC Is a New Member of the Amidohydrolase Protein Superfamily and Is Homologous to Other Atrazine-Metabolizing Enzymes. Journal of Bacteriology, 180, 152-158.
SAGRISTÀ, E., DURFORT, M. & AZEVEDO, C. (1995) Perkinsus sp. (Phylum Apicomplexa) in Mediterranean clam Ruditapes semidecussatus: ultrastructural observations of the cellular response of the host. Aquaculture, 132, 153-160.
SALDARRIAGA, J. F., MCEWAN, M. L., FAST, N. M., TAYLOR, F. J. R. & KEELING, P. J. (2003) Multiple protein phylogenies show that Oxyrrhis marina and Perkinsus marinus are early branches of the dinoflagellates lineage. J. Syst. Evol. Microbiol., 53, 355-365.

References CHAPTER VIII
197
SALDARRIAGA, J. F., TAYLOR, F. J. R. M., CAVALIER-SMITH, T., MENDEN-DEUER, S. & KEELING, P. J. (2004) Molecular data and the evolutionary history of dinoflagellates. European Journal of Protistology, 40.
SAMBROOK, J., FRITSCH, E. F. & MANIATIS, T. (1989) Molecular Cloning: A Laboratory Manual. Cold Spring Harbor Press, Cold Spring Harbor, New York, USA.
SCHOTT, E. J., PECHER, W. T., OKAFOR, F. & VASTA, G. R. (2003a) The protistan parasite Perkinsus marinus is resistant to selected reactive oxygen species Experimental Parasitology, 103, 232-240.
SCHOTT, E. J., ROBLEDO, J. A. F., WRIGHT, A. C., SILVA, A. M. & VASTA, G. R. (2003b) Gene organization and homology modeling of two iron superoxide dismutases of the early branching protist Perkinsus marinus. gene, 309, 1-9.
SEFFERNICK, J. L., JOHNSON, G., SADOWSKY, M. J. & WACKETT, L. P. (2000) Substrate Specificity of Atrazine Chlorohydrolase and Atrazine-Catabolizing Bacteria. Applied and Environmental Microbiology, 66, 4247-4252.
SEFFERNICK, J. L., MERVYN L. DE SOUZA, SADOWSKY, M. J. & WACKETT, L. P. (2001) Melamine Deaminase and Atrazine Chlorohydrolase: 98 Percent Identical but Functionally Different. Journal of Bacteriology, 183, 2405-2410.
SEFFERNICK, J. L. & WACKETT, L. P. (2001) Rapid Evolution of Bacterial Catabolic Enzymes:A Case Study with Atrazine Chlorohydrolase. Biochemistry, 40.
SHAPIR, N., OSBORNE, J. P., JOHNSON, G., SADOWSKY, M. J. & WACKETT, L. P. (2002) Purification, Substrate Range, and Metal Center of AtzC: the N-Isopropylammelide Aminohydrolase Involved in Bacterial Atrazine Metabolism. Journal of Bacteriology, 184, 5376-5384.
SHAPIR, N., ROSENDAHL, C., JOHNSON, G., ANDREINA, M., SADOWSKY, M. J. & WACKETT, L. P. (2005) Substrate Specificity and Colorimetric Assay for Recombinant TrzN Derived from Arthrobacter aurescens TC1. Applied and Environmental Microbiology, 71, 2214-2220.
SHIEH, G.-S., SHIAU, A.-L., YO, Y.-T., LIN, P.-R., CHANG, C.-C., TZAI, T.-S. & WU, C.-L. (2006) Low-Dose Etoposide Enhances Telomerase-Dependent Adenovirus-Mediated Cytosine Deaminase Gene Therapy through Augmentation of Adenoviral Infection and Transgene Expression in a Syngeneic Bladder Tumor Model. Cancer Research, 66.
SIDDALL, M. E., REECE, K. S., GRAVES, J. E. & BURRESON, E. M. (1997) 'Total evidence' refutes the inclusion of Perkinsus species in the phyllum Apicomplexa. Parasitology, 115, 165-176.
SKINNER-ADAMS, T. S., LAWRIE, P. M., HAWTHORNE, P. L., GARDINER, D. L. & TRENHOLME, K. R. (2003) Comparison of Plasmodium falciparum transfection methods. Malaria Journal, 2.
SONG, J. L., HARRY, J. B., EASTMAN, R. T., OLIVER, B. G. & WHITE, T. C. (2004) The Candida albicans Lanosterol 14-� - Demethylase (ERG11) Gene Promoter Is Maximally Induced after Prolonged Growth with Antifungal Drugs. Antimicrob Agents Chemother, 48, 1136-1144.
SONIAT, T. M. (1996) Epizootiology of Perkinsus marinus disease of eastern oysters in the Gulf of Mexico. Journal of Shellfish Research, 15, 35-43.
SOUCIETA, J.-L., AIGLE, M., ARTIGUENAVE, F., BLANDIN, G., BOLOTIN-FUKUHARA, M., BON, E., BROTTIER, P., CASAREGOLA, S., MONTIGNY, J. D., DUJON, B., DURRENS, P., GAILLARDIN, C., LËPINGLE, A., LLORENTE, B., MALPERTUY, A., NEUVËGLISE, C.,

References CHAPTER VIII
198
OZIER-KALOGËROPOULOS, O., POTIER, S., SAURIN, W., TEKAIA, F., TO¡ANO-NIOCHE, C., WËSOLOWSKI-LOUVEL, M., WINCKER, P. & WEISSENBACH, J. (2000) A set of yeast species for molecular evolution studies. FEBS letters, 487, 3-12.
SPRINGER, C. J. & NICULESCU-DUVAZ, I. (2000) Prodrug-activating systems in suicide gene therapy. The journal of Clinical Investigation, 105, 1161-1167.
SUGA, M. & HATAKEYAMA, T. (2001) High efficiency transformation of Schizosaccharomyces pombe pretreated with thiol compounds by electroporation. yeast, 18, 1015-1021.
TAMURA, K., DUDLEY, J., NEI, M. & KUMAR, S. (2007) MEGA4: Molecular Evolutionary Genetics Analysis (MEGA) software version 4.0. Molecular Biology and Evolution, 24, 1596-1599.
TANGUY, A., GUO, X. & FORD, S. E. (2004) Discovery of genes expressed in response to Perkinsus marinus challenge in Eastern (Crassostrea virginica) and Pacific (C. gigas) oysters. Gene, 338, 121-131.
TELES-GRILO, M. L., DUARTE, S. M., TATO-COSTA, J., GASPAR-MAIA, A., OLIVEIRA, C., ROCHA, A. A., MARQUES, A., CORDEIRO-DA-SILVA, A. & AZEVEDO, C. (2007a) Molecular karyotype analysis of Perkinsus atlanticus (Phylum Perkinsozoa) by pulsed field gel electrophoresis. European journal of protistology, 43, 315-318.
TELES-GRILO, M. L., TATO-COSTA, J., DUARTE, S. M., MAIA, A., CASAL, G. & AZEVEDO, C. (2007b) Is there a plastid in Perkinsus atlanticus (Phylum Perkinsozoa)? European journal of protistology, 43, 163-167.
THOMPSON, J., GIBSON, T., PLEWNIAK, F., JEANMOUGIN, F. & HIGGINS, D. (1997) The CLUSTAL_X windows interface: flexible strategies for multiple sequence alignment aided by quality analysis tools. Nucleic Acids Research, 25, 4876- 4882.
TRIPLETT, L. R., ZHAO, Y. & SUNDIN, G. W. (2006) Genetic Differences between Blight-Causing Erwinia Species with Differing Host Specificities, Identified by Suppression Subtractive Hybridization. Appl. Environ. Microbiol., 72, 7359.7364.
VAN-DER-WEL, A. M., TOMÁS, A. M., KOCKEN, C. H. M., MALHOTRA, P., JANSE, C. J., WATERS, A. P. & THOMAS, A. W. (1997) Transfection of the Primate Malaria Parasite Plasmodium knowlesi using Entirely Heterologous Constructs. J. Exp. Med., 185, 1499-1503.
VENEGAS-CALERÓN, M., BEAUDOIN, F., SAYANOVA, O. & NAPIER, J. A. (2007) Co-transcribed Genes for Long Chain Polyunsaturated Fatty Acid Biosynthesis in the Protozoon Perkinsus marinus Include a Plant-like FAE1 3-Ketoacyl Coenzyme A Synthase. The Journal of Biological Chemistry, 282, 2996-3003.
VILLALBA, A. (2008) Workshop for the analysis of the impact of Perkinsosis to the European Shellfish Industry, Vigo, Centro de Investigacións Mariñas, Conselleria de Pescas e Asuntos Marítimos da Xunta de Galicia; Centro Tecnológico del Mar - Fundación CETMAR.
VILLALBA, A., CASAS, S., LOPEZ, C. & CARBALLAL, M. (2005) Study of perkinsosis in the carpet shell clam Tapes decussatus in Galicia (NW Spain). II. Temporal pattern of disease dynamics and association with clam mortality. Diseases of Aquatic Organisms, 65, 257-267.

References CHAPTER VIII
199
VILLALBA, A. & CASAS, S. M. (2001) Effect of perkinsosis on the energetic physiology of the clam Ruditapes decussatus. Journal of Shellfish Research, 20, 559-560.
VILLALBA, A. & NAVAS, J. I. (1988) Occurrence of Minchinia tapetis and a Perkinsus-like parasite in cultured clams, Ruditapes decussatus and R. philipppinarum, from south Atlantic coast of Spain. Preliminary results. 3rd. Internat. Colloq. Pathol. Marine Aquacult.
VILLALBA, A., REECE, K. S., ORDÁS, M. C., CASAS, S. M. & FIGUERAS, A. (2004) Perkinsosis in molluscs: A review. Aquat. Living Resour., 17, 411-432.
VOLETY, A. K. & CHU, F.-L. E. (1995) Supression of chemiluminescence of eastern oyster (Crassostrea virginica) hemocytes by the protozoan parasite Perkinsus marinus. Development and Comparative Immunology, 19, 135-142.
WANG, L. (2006) Polycationic water soluble copolymer and method for transferring polyanionic macromolecules across biological barriers. IN ISSUED, U. P. (Ed.) USA, Genta Salus LLC.
WATERS, A. P., DIJK, M. R. V., RAMESAR, J. & JANSE, C. J. (1997) Stable transfection of the blood stages of malarial parasites. Annals of Tropical Medicine and Parasitology, 91, 63.66.
WEAVER, J. C. (2003) Electroporation of Biological Membranes from Multicellular to Nano Scales. IEEE Transactiions on Dielectrics and Electrical Isolation, 10, 754-768.
WELZEL, T., RADTKE, MEYER-ZAIKA, W., HEUMANN, R. & EPPLE, M. (2004) Transfection of cells with custom-made calcium phosphate nanoparticles coated with DNA. Journal of Matererials Chemistry, 14, 2213-2217.
WHYTE, S. K., CAWTHORN, R. J., MACMILLAN, R. J. & DESPRES, B. (1993) Isolation and purification of developmental stages of Perkinsus karlssoni (Apicomplexa: Perkinsea), a parasite affecting bay scallops Argopecten irradians. Diseases of Aquatic Organisms, 15, 199-205.
WILSON, D. K. & QUIOCHO, F. A. (1993) A pre-transition-state mimic of an enzyme: X-ray structure of adenosine deaminase with bound 1-deazaadenosine and zinc-activated water. Biochemistry, 32, 1689-1694.
WOO, P. T. K. (1998) Protection against Cryptobia (Trypanoplasma) salmositica and Salmonid Cryptobiosis Parasitology Today, 14, 272-277.
WU, Y., KIRKMAN, L. A. & WELLEMS, T. E. (1996) Transformation of Plasmodium falciparum malaria parasites by homologous integration. Proc. Natl. Acad. Sci. USA, 93, 1130-1134.
WU, Y., SIFRI, C. D., LEI, H.-H., XIN-ZHUAN & WELLEMS, T. E. (1995) Transfection of Plasmodium falciparum within human red blood cells. PNAS, 92, 973-977.
WUGEDITSCH, T., PAIMENT, A., HOCKING, J., DRUMMELSMITH, J., FORRESTER, C. & WHITFIELDI, C. (2001) Phosphorylation of Wzc, a Tyrosine Autokinase, Is Essential for Assembly of Group 1 Capsular Polysaccharides in Escherichia coli. The Journal of Biological Chemistry, 276, 2361-2371.
ZHENGWANG, Z., LIANHUA, Y., YONGKANG, Z. & FENGDI, Z. (2002) In situ transduction of cytosine deaminase gene followed by systemic use of 5-fluorocytosine inhibits tumor growth and metastasis in orthotopic prostatae cancer mouse models. Chinese medical journal, 115, 227-231.

References CHAPTER VIII

Appendix
APPENDIX
Appendix II-1

Appendix
202
Appendix II-1
Table of oligonucleotides used in the molecular tasks performed. Oligonucleotides used
for PCR amplification of P. olseni selected genes (GSP, Gene Specific Primers)
and manufacturers’ Adaptor Primers (AP). Each pair organized by species and
by gene with the respective procedure of use described and the sequence.
CACGCGCGGCCGCCTATGCTTGTACTGCCGCPoClhl_exp_NotIR1
CCGCGGCCGCCatcgaaggtcgtATGTCCAGCGAAATCT
PoClhl_exp_NotIF1
Expression in Prokaryote system
cacgcggatccgcttgtactgccgcaacgPoClhl_exp_Rev1
ccgctcgagatgtccagcgaaatctccaccaPoClhl_exp_Frw1Expression in Eukaryote system
tgtagcgtgaagacgacagaaAP2
GTAATACGACTCACTATAGGGCAP1Adaptor primer
SSH
AGCGTGGTCGCGGCCGAGGTNested AP2R
TCGAGCGGCCGCCCGGGCAGGTNested AP1Nested AP
TATGTCAAGCGAAGTGTCCACGAAAPmClhl Frw3PCR/ Full cDNA
AGATTGCTCGGTTTGCTGAGGPmClhl Rev1
GTAGAAACAAAACGGTCCGAAACTAAGCPmClhl Rev3
GGTTACCCCCCTGAACATTGCPmClhl Frw1PCR/cDNA
PmClhl
P. marinus
CTATGGTATCCCCTTTCACCPmClhl Rev2
GCTATGTCAAGCGAAGTGTCCPmClhl Frw2PCR/ cDNA/ Gene
Manufacturers
P. olseni
Species
AP
PCR/Gene expression
PCR/ cDNA/ Gene
PCR/ Gene expression
PCR/ Gene expression
PCR/ Full cDNA
PCR/ Gene
PCR/Gene expression
AGAACGTCAAGGCGAAAATCCAAGACAAGGPoUb FrwPoUbq
TCACGGGGAAGACCATCACCCTCGATPoUb Rev
GCTACCGTAAATCGTCCCTGGTGTCCPoNHE Frw1
PoNHEAGACCAATTTGGATGCGACTTGCGAGPoNHE Rev1
AGTGACAAGCTTTGCAATGGGTCATCACTPoNHEfullRev2
TGATTACTATGGCCTCACTTGATGACGACGPoNHEfullFrw2
ATCTCCACCACTTCAAGCGGCTCTGGPoClhlGWRev1
AAAGCCGTTAACTGCTACACCGCCGTPoClhlGWFrw1
AGATTGAGAAATCCGAATCTGCTGGTAAPoClhlgeneRev2
CATGTCCAGCGAAATCTCCACCACPoClhlgeneFrw2
ACTCACTATAGGGCTCGAGCGGCAP2
CCATCCTAATACGACTCACTATAGGGCAP1Marathon/Genome walker
CTCCAATCAGGGGCACCTTGCTAACCPoAdh Rev1
ACTCGGGTGCCCACTTCTTGTCATCAPoAdh Frw2PoAdh
ACATGACTGACGAGGAGATGACCCGGTTPoClhl Rev1
CTTCAAACAGCATGGCGAGTCTGCAATTPoClhl Frw1
PoClhl
Sequence (5’-3’)OligonucleotideGene

Appendix
203
Appendix III-1

Appendix
204
Appendix III-1
Filters resulting from the hybridization of the Dfsl library, these were analysed to
identify the differentially expressed genes from.
Differentially expressed gene (48)More than twice up-regulated (Macroarray)
A1 A2
12
34
5 67 8
9
a
b
c
d
fg
hi
j
kl
m no
pq
r
s
t
uv
wx
y zabaa
aeac
ad
af ag ah
ai aj
akal am
anao
12
34
5 67 8
9
a
b
c
d
fg
hi
j
kl
m no
pq
r
s
t
uv
wx
y zabaa
aeac
ad
af ag ah
ai aj
akal am
anao
B2B1
Differentially expressed gene (19)More than twice up-regulated (Macroarray)
ba
c d
f g
hi
e
jk
l
nm
op
q
rs
21
43
6 5
87
9
1013
12
11
1416
15
17
19
18
20
2122
2423
2526
27
ba
c d
f g
hi
e
jk
l
nm
op
q
rs
21
43
6 5
87
9
1013
12
11
1416
15
17
19
18
20
2122
2423
2526
27

Appendix
205
C2C1
Differentially expressed gene (19)More than twice up-regulated (Macroarray)
1
ab
ce
d
gf
j
hi
kl
m
n
op
r
q
s
2
3
45
6
1
ab
ce
d
gf
j
hi
kl
m
n
op
r
q
s
2
3
45
6
D2D1
Differentially expressed gene (19)More than twice up-regulated (Macroarray)
a
b
c
de
fg
h
ij
k
l
m
on
p
3
12
4
5 6 78
11
9
1012
1314
15
1617
18
19
20
21
2223
24
2526
27 28 29
30
3132
3334
35
a
b
c
de
fg
h
ij
k
l
m
on
p
3
12
4
5 6 78
11
9
1012
1314
15
1617
18
19
20
21
2223
24
2526
27 28 29
30
3132
3334
35

Appendix
206

Appendix
Appendix III-2

208
Appendix III-2
Filters resulting from the hybridization of the Dfsl library, these were analysed to
identify the differentially expressed genes from.
H1(+) H1(-)
1 2 3 4 5 6 7 8 9 10 11 12
A
B
C
D
E
F
G
H
H2(+) H2(-)
H3(+) H3(-)
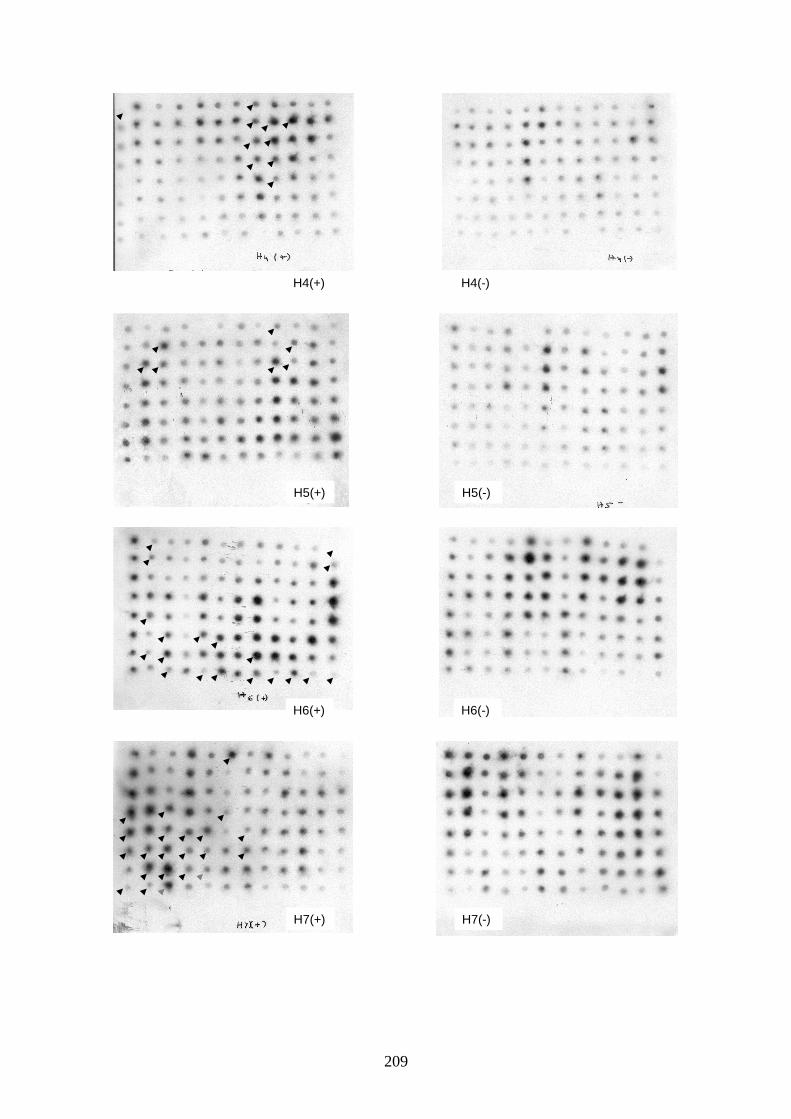
209
H4(+) H4(-)
H5(+) H5(-)
H6(+) H6(-)
H7(+) H7(-)

210
H8(+) H8(-)
H9(+) H9(-)
H10(+) H10(-)

211
Appendix III-3

212
Appendix III-3
GOblet in silico analysis and results for Dfsl. EST designation, size and the protein hits
results obtained from GO search at Goblet server are presented.
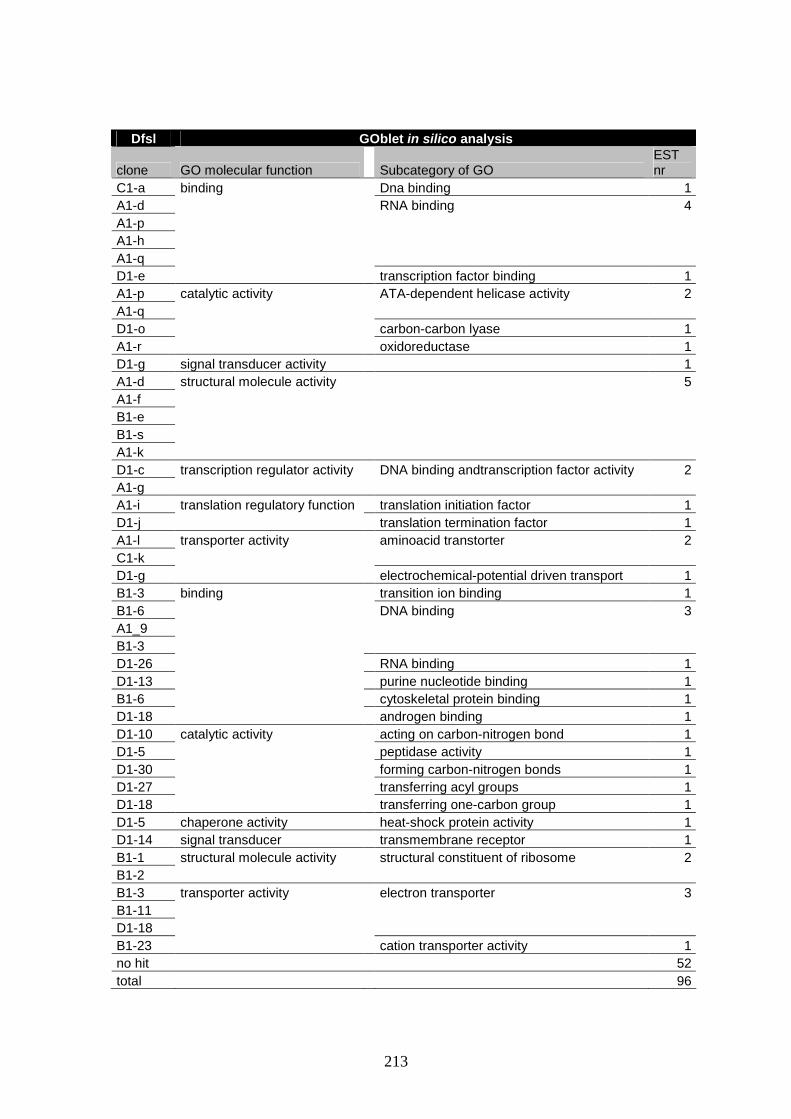
213
Dfsl GOblet in silico analysis
clone GO molecular function Subcategory of GO EST nr
C1-a binding Dna binding 1 A1-d RNA binding 4 A1-p A1-h A1-q D1-e transcription factor binding 1 A1-p catalytic activity ATA-dependent helicase activity 2 A1-q D1-o carbon-carbon lyase 1 A1-r oxidoreductase 1 D1-g signal transducer activity 1 A1-d structural molecule activity 5 A1-f B1-e B1-s A1-k D1-c transcription regulator activity DNA binding andtranscription factor activity 2 A1-g A1-i translation regulatory function translation initiation factor 1 D1-j translation termination factor 1 A1-l transporter activity aminoacid transtorter 2 C1-k D1-g electrochemical-potential driven transport 1 B1-3 binding transition ion binding 1 B1-6 DNA binding 3 A1_9 B1-3 D1-26 RNA binding 1 D1-13 purine nucleotide binding 1 B1-6 cytoskeletal protein binding 1 D1-18 androgen binding 1 D1-10 catalytic activity acting on carbon-nitrogen bond 1 D1-5 peptidase activity 1 D1-30 forming carbon-nitrogen bonds 1 D1-27 transferring acyl groups 1 D1-18 transferring one-carbon group 1 D1-5 chaperone activity heat-shock protein activity 1 D1-14 signal transducer transmembrane receptor 1 B1-1 structural molecule activity structural constituent of ribosome 2 B1-2 B1-3 transporter activity electron transporter 3 B1-11 D1-18 B1-23 cation transporter activity 1 no hit 52 total 96

214

215
Appendix III-4

216
Appendix III-4
GOblet in silico analysis and results for efMOSl. EST designation, size and the protein
hits results obtained from GO search at Goblet server are presented

217
efMOSl GOblet in silico analysis clone GO molecular function Subcategory of GO EST nr H9H4 binding activity metal ion binding activity 1 H10A2 Catalytic activity hydrolase activity 14 H10E7 H1D6 H1E7 H7D1 H8C9 H8D9 H8E5 H8F12 H8G10 H8G12 H9C5 H9F12 H9G6 H1G2 transferase activity 2 H2D11 H6F6 obsolete moleclar functuion cell adhesion melecule activity 2 H7G2 H3B4 structural molecule activity structural melecule of ribosome 1 H3C1 extracellular molecule consituent 1 no hit 183 total 204

218

219
Appendix III-5

220
Appendix III-5
NCBI in silico analysis and results for Dfsl. EST designation, size and the protein hits
results obtained from GO search at Goblet server are presented

Appendix
Dfsl NCBI database BLASTx clone size hit e-value accession number organism hit protein hit
A1.a 337 1,00E-29 BAB33421 Pisum sativum putative senescence-associated protein
A1.c 500 1.5 AAU44818 Thalassiosira pseudonana silaffin precursor Sil2p
A1.d 300 2,00E-17 XP_416225 Gallus gallus similar to NHP2-like protein 1 (High mobility group-like nuclear protein 2
A1.f 257 7,00E-12 CAI76286 Theileria annulata 60S ribosomal protein L36, putative
A1.g 532 2,00E-08 NP_191043 Arabidopsis thaliana amino acid permease/ amino acid-polyamine transporter
A1.h 442 6,00E-45 CAI76286 Theileria annulata 60S ribosomal protein L12, putative
A1.i 132 1,00E-07 AAX95709 Oryza sativa DEAD/DEAH box helicase, putative
A1.j 462 6,00E-13 XP_675686 Plasmodium berghei hypothetical protein PB106694.00.0
A1.k 316 3,00E-29 CAD1441 Crassostrea gigas ribosomal protein L19
A1.l 791 4,00E-09 EAN85393 Trypanosoma cruzi transmembrane amino acid transporter, putative
A1.m 224 1.2 NP_142962 Pyrococcus horikoshii OT3 hypothetical protein PH1053
A1.o 790 2,00E-04 CAF98772 Tetraodon nigroviridis unnamed protein product
A1.p 469 2,00E-49 NP_191790 Arabidopsis thaliana ATP binding / ATP-dependent helicase/ RNA helicase/ helicase/ nucleic acid binding
A1.q 470 1.8e-49 NP_191790 Arabidopsis thaliana ATP binding / ATP-dependent helicase/ RNA helicase/ helicase/ nucleic acid binding
A1.r 308 2,00E-09 ABA74211 Pseudomonas fluorescens Short-chain dehydrogenase/reductase SDR
B1.e 789 4,00E-67 BAD11816 Lentinula edodes putative S-phase specific ribosomal protein cyc07
B1.j 556 0.003 CAI76842 Theileria annulata 40S ribosomal protein S10, putative
B1.k 635 7,00E-20 AAZ09952 Leishmania major d-lactate dehydrogenase-like protein
B1.m 780 8,00E-27 BAB33421 Pisum sativum putative senescence-associated protein
B1.o 245 none
B1.p 271 1,00E-14 XP_679643 Plasmodium berghei hypothetical protein
B1.q 547 0.48 ABA56642 Nitrosococcus oceani Formate/nitrite transporter
B1.r 338 2,00E-29 BAB33421 Pisum sativum putative senescence-associated protein
B1.s 198 2,00E-07 CAA48558 Aplysia californica 40S ribosomal protein S3a (Lysine-rich protein KRP-A
C1.a 654 3,00E-10 XP_539198 Canis familiaris similar to Zinc finger CCCH-type domain containing protein3

222
C1.b 812 1,00E-14 XP_453836 Kluyveromyces lactis unnamed protein product
C1.c 796 1,00E-45 EAL34999 Cryptosporidium hominis senescence-associated protein
C1.d 636 7,00E-20 AAZ09952 Leishmania major d-lactate dehydrogenase-like protein
C1.k 392 2,00E-07 EAN89347 Trypanosoma cruzi transporter, putative
C1.m 429 6,40E-01 XP_729354 Plasmodium yoelii yoelii extragenic suppressor of the BimD6 mutation
C1.p 769 5,00E+00 BAD81020 uncultured bacterium ATPase component of ABC-type transport system
C1.s 590 4.9 EAA22428 Plasmodium yoelii yoelii SERA-3
D1.a 338 2,00E-29 BAB33421 Pisum sativum putative senescence-associated protein
D1.b 771 6.6 XP_650610 Entamoeba histolytica non-transporter ABC (ATP-binding cassette) protein
D1.c 259 4.4 AAZ09927 Leishmania major strain Friedlin protein kinase-like protein
D1.d 388 2.5 EAA03808 Anopheles gambiae str. PEST ENSANGP00000013418
D1.e 790 none
D1.g 574 4,00E-22 BAD93487 Rosa hybrid cultivar vacuolar Na+/H+ antiporter
D1.h 379 0.003 Rattus norvegicus similar to Ac1147
D1.i 314 3,00E-23 EAL34999 Cryptosporidium hominis senescence-associated protein
D1.j 411 1,00E-57 AAL17660 Chlamydomonas reinhardtii eukaryotic release factor 1
D1.l 558 4,00E-09 AAN37152 Plasmodium falciparum 3D7 hypothetical protein PF14_0539
D1.m 517 3.5 EAN78069 Trypanosoma brucei hypothetical protein, conserved
D1.n 262 1.5 AAO17380 Mus musculus zinc metalloendopeptidase
D1.o 491 5,00E-41 EAQ63662 Marinomonas sp transaldolase
D1.p 786 3 AAQ84157 Streptomyces sp. Plm2-3
A1.9 651 3,00E-10 XP_539198 Canis familiaris similar to Zinc finger CCCH-type domain containing protein3
B1.1 340 5,00E-19 Ixodes pacificus ribosomal protein S15
B1.2 788 4,00E-66 Lentinula edodes putative S-phase specific ribosomal protein cyc07
B1.3 791 4,00E-37 Q6BXH8 Debaryomyces hansenii 40S ribosomal protein S6
B1.4 368 1.9 NP_032506 Mus musculus laminin, alpha 1
B1.5 790 5,00E-09 XP_463583 Oryza sativa putative terminal ear1

223
B1.6 628 7,00E-16 AAP09047 Bacillus cereus hypothetical Membrane Spanning Protein
B1.7 603 0.12 XP_523076 Pan troglodytes tropomodulin 2 (neuronal)
B1.8 359 0.88 AAX80044 Trypanosoma brucei kinesin, putative
B1.9 801 0.007 XP_826696 Trypanosoma brucei sphingosine phosphate lyase-like protein
B1.10 769 8.5 AAW27075 Schistosoma japonicum SJCHGC01117 protein
B1.11 404 6,00E-10 NP_990458 Gallus gallus xanthine dehydrogenase
B1.12 787 7,00E-26 BAA10929 Nicotiana tabacum cytochrome P450 like_TBP
B1.12 759 7,00E-26 BAA10929 Nicotiana tabacum cytochrome P450 like_TBP
B1.13 592 6,00E-41 ABB32789 Geobacter metallireducens Fe-S type hydro-lyases tartrate/fumarate alpha region
B1.23 574 4,00E-22 BAD93487 Rosa hybrid cultivar vacuolar Na+/H+ antiporter
B1.24 463 1.2 YP_468931 Rhizobium etli putative mechanosensitive ion channel protein
B1.25 579 6.2 AAA29908 Schistosoma mansoni p48 eggshell protein
B1.26 791 2,00E-10 ZP_00242021 Rubrivivax gelatinosus ABC-type phosphate/phosphonate transport system, permease component
B1.27 377 2,00E-05 CAG70682 Datisca glomerata putative sucrose-H+ symporter
C1.1 471 3,00E-06 CAB38602 Schizosaccharomyces pombe hypothetical protein SPBC405.03c
C1.2 576 9,00E-12 XP_627364 Cryptosporidium parvum SSM4 like ring finger
C1.3 384 2.5 NP_176450 Arabidopsis thaliana disulfide oxidoreductase/ monooxygenase
C1.6 294 2.6 AAM35598 Xanthomonas axonopodis N-acetylglucosaminidase
D1.1 289 9.9 NP_956927 Danio rerio potassium channel, subfamily K, member 5
D1.2 79 9,00E-50 AAW70160 Phaeodactylum tricornutum condensing enzyme
D1.4 748 2.1 AAX88150 Haemophilus influenzae conserved hypothetical protein
D1.5 776 6,00E-67 AAM02971 Crypthecodinium cohnii BiP
D1.6 782 1.3 ABV27966 Hahella chejuensis Non-ribosomal peptide synthetase modules and related protein
D1.7 325 1.5 NP_915097 Oryza sativa B1099D03.20
D1.9 791 1,00E-17 XP_453836 Kluyveromyces lactis unnamed protein product
D1.10 432 1,00E-35 AAQ98879 Dictyostelium discoideum asparaginase
D1.12 595 0.091 AAB46781 human rai, ShcC=51.9 kda Shc-related protein

224
D1.13 605 5,00E-62 AAP13994 Litchi chinensis S-adenosylmethionine synthetase
D1.14 800 3,00E-17 EAN31411 [Theileria parva hypothetical protein, conserved, RNA regognition motif
D1.15 234 none
D1.17 382 4.4 NP_188870 Arabidopsis thaliana ATP binding / ATP-dependent helicase/ helicase/ nucleic acid binding
D1.18 791 5,00E-67 ZP_00794740 Yersinia pseudotuberculosis NAD-dependent aldehyde dehydrogenases
D1.19 431 1.1 XP_729354 Plasmodium yoelii yoelii extragenic suppressor of the BimD6 mutation
D1.20 285 5,00E-26 ABC23006 Rhodospirillum rubrum tartrate dehydrogenase
D1.21 558 0.27 YP_395662 Lactobacillus sakei hypothetical membrane protein
D1.22 537 1,00E-15 NP_916683 Oryza sativa putative MRP protein (ATP/GTP-binding protein)
D1.23 618 1.4 NP_900570 Chromobacterium violaceum hypothetical protein CV0900 Tetratricopeptide repeat domain
D1.24 517 3.5 ZP_00768811 Chloroflexus aurantiacus survival protein SurE
D1.26 257 4,00E-07 XP_667137 Cryptosporidium hominis RNA binding protein
D1.27 665 0.12 EAN97318 Trypanosoma cruzi diacylglycerol acyltransferase, putative
D1.28 288 3.4 XP_762299 Ustilago maydi hypothetical protein UM06152.1
D1.30 345 1,00E-30 XP_624223 Apis mellifera similar to CG6854-PC, isoform C
D1.32 788 8,00E-25 BAA10929 Nicotiana tabacum cytochrome P450 like_TBP
D1.33 300 0.40 ZP00972480 Pseudomonas aeruginosa GGDEF domain

Appendix
Appendix III-6

226
Appendix III-6
NCBI in silico analysis and results for efMOSl. EST designation, size and the protein
hits results obtained from GO search at Goblet server are presented
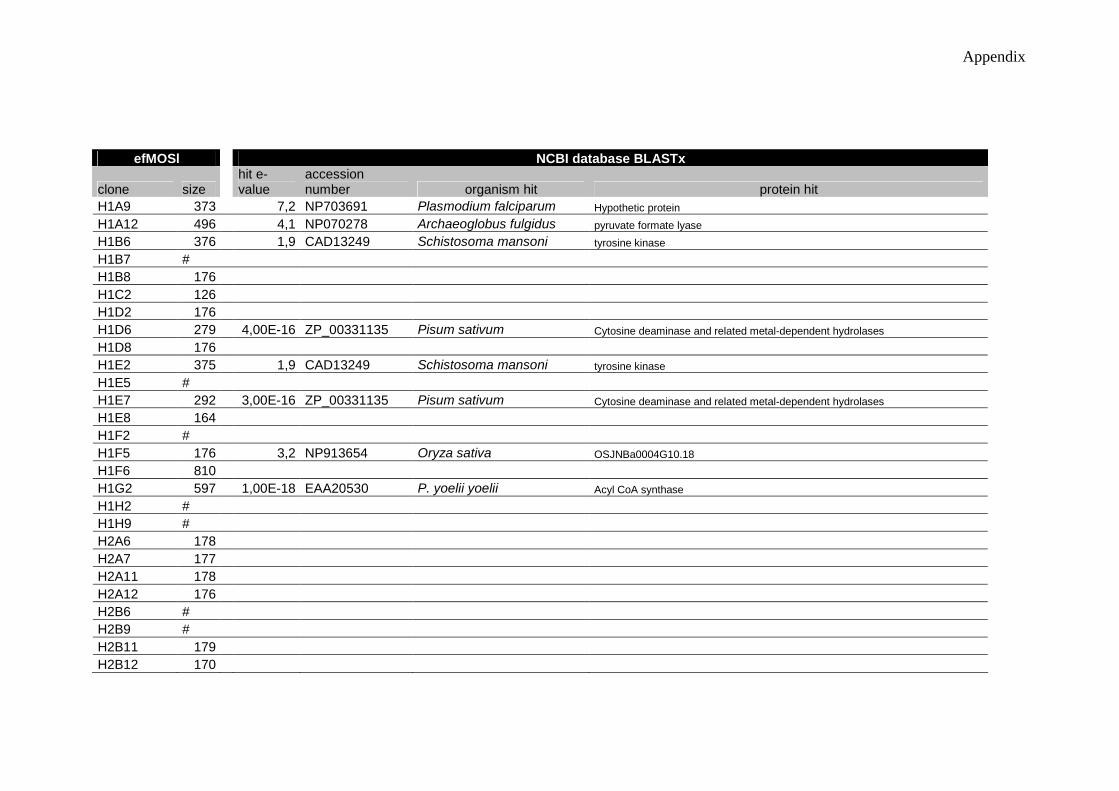
Appendix
efMOSl NCBI database BLASTx
clone size hit e-value
accession number organism hit protein hit
H1A9 373 7,2 NP703691 Plasmodium falciparum Hypothetic protein
H1A12 496 4,1 NP070278 Archaeoglobus fulgidus pyruvate formate lyase
H1B6 376 1,9 CAD13249 Schistosoma mansoni tyrosine kinase
H1B7 #
H1B8 176
H1C2 126
H1D2 176
H1D6 279 4,00E-16 ZP_00331135 Pisum sativum Cytosine deaminase and related metal-dependent hydrolases
H1D8 176
H1E2 375 1,9 CAD13249 Schistosoma mansoni tyrosine kinase
H1E5 #
H1E7 292 3,00E-16 ZP_00331135 Pisum sativum Cytosine deaminase and related metal-dependent hydrolases
H1E8 164
H1F2 #
H1F5 176 3,2 NP913654 Oryza sativa OSJNBa0004G10.18
H1F6 810
H1G2 597 1,00E-18 EAA20530 P. yoelii yoelii Acyl CoA synthase
H1H2 #
H1H9 #
H2A6 178
H2A7 177
H2A11 178
H2A12 176
H2B6 #
H2B9 #
H2B11 179
H2B12 170

228
H2C11 163 7,1 AAL59385 Citrobacter freundii Intl
H2C12 374 1,9 CAD13249 Schistosoma mansoni tyrosine kinase
H2D11 597 7,00E-18 cryptosporidium parvum Acyl CoA synthase
H2D12 176
H2E9 177
H2E12 176
H2F11 177
H2F12 176
H2G9 352 9,00E-30 EAL34999 cryptosporidium hominis putative senescence-associated protein
H2G10 176
H2G11 164
H2G12 565 4,00E-16 Zea maiz cytochrome P450 like_TBP
H2H9 377 1,9 CAD13249 Schistosoma mansoni tyrosine kinase
H2H10 363 9,00E-30 EAL34999 cryptosporidium hominis putative senescence-associated protein
H2H12 363 9,00E-30 EAL34999 cryptosporidium hominis putative senescence-associated protein
H3A4 496 4,10E+00 NP070278 Archaeoglobus fulgidus pyruvate formate lyase
H3A5 428 3,80E-01 EAL46739 Entamoeba histolytica protein kinase, putative
H3B1 475 7,20E-01 Plasmodium chabaudi Hypothetic protein
H3B3 344 3,00E-05 CAE76360 Neurospora crassa Related to ethanolaminephosphotransferase
H3B4 555 8,00E-34 1909359A ribosomal protein S19
H3C1 408
H3C3 40
H3D3 353 4,00E-27 BAB33421 Pisum sativum putative senescence-associated protein
H3E2 #
H3E3 496 2,1 AAH59336 Xenopus leavis MGC69088
H3F2 496 2,1 AAH59336 Xenopus leavis MGC69088
H3F3 362 4,00E-27 BAB33421 Pisum sativum putative senescence-associated protein
H3F8 176
H3F11 652 2,4 NP650778 Enterococcus faecium Predicted phosphosugar isomerase
H3G8 362 3,00E-18 NP182246 Arabidopsis thaliana long-chain fatty acid CoA ligase protein
H3G11 471 0,71 CAH82113 Plasmodium chabaudi Hypothetic protein
H4A1 177 0,042 AAC46904 Trypanosoma cruzi mucin like protein

229
H4A8 177
H4B8 176
H4B9 176
H4B10 178 9,2 NP913654 Oryza sativa hypothetical protein
H4C8 176
H4C9 176
H4D8 378 0,22 AAW29114 Homo sapiens MK2 non alergic IgE long chain
H4D9 377 1,1 NP703691 P. falciparum Hypothetic protein
H4E9 177
H5A9 178
H5B3 373 1,9 CAD13249 Schistosoma mansoni tyrosine kinase
H5B10 180 9,2 NP_913654 Oryza sativa OSJNBa0004G10.18
H5C2 373 1,9 CAD13249 Schistosoma mansoni tyrosine kinase
H5C3 176 *
H5C9 176 *
H5C10 178 *
H7A6 176
H7D1 291 3,00E-16 ZP_00331135 Moorella thermoacetica Cytosine deaminase and related metal-dependent hydrolases
H7D3 175
H7D6 363 4,00E-22 EAL34999 Cryptosporidium hominis senescence-associated protein
H7E1 498 4,2 NP070278 Archaeoglobus fulgidus pyruvate formate lyase
H7E3 179
H7E4 346 2,00E-04 AAL68843 Sorghum bicolor aminoalcoholphosphotransferase
H7E5 392 3,2 EAL46739 Entamoeba histolytica protein kinase, putative
H7E7 179
H7F1 179
H7F2 651 0,71 YP_172668 Synechococcus elongatus N-acetylmuramoyl-L-alanine amidase
H7F3 177
H7F4 176
H7F5 308 0,44 AAG00637 Moloch horridus NADH dehydrogenase
H7F7 378 1,9 CAD13249 Schistosoma mansoni tyrosine kinase

230
H7G2 630 1,00E-24 BAA10929 Nicotiana tabacum cytochrome P450 like_TBP
H7G3 378
H7G4 630 BAA10929 Nicotiana tabacum cytochrome P450 like_TBP
H7G5 #
H7H1 177 BAA10929 Nicotiana tabacum cytochrome P450 like_TBP
H7H2 176
H7H3 #
H8A1 #
H8A2 176
H8A3 178
H8A4 855 1,00E-24 BAA10929 Nicotiana tabacum cytochrome P450 like_TBP
H8A5 176
H8A6 345 2,00E-04 AAL68843 Sorghum bicolor aminoalcoholphosphotransferase
H8A7 428 4,2 EAL46739 Entamoeba histolytica protein kinase, putative
H8A8 #
H8A9 179
H8A12 176
H8B4 #
H8B5 176
H8B6 305 9,3 NP_907232 Wolinella succinogenes Magnesium and Cobalt Transport Protein
H8B7 177
H8B8 363
H8B9 178
H8B12 #
H8C6 176
H8C7 363 7,00E-30 BAB33421 Pisum sativum putative senescence-associated protein
H8C8 362 1,00E-29 BAB33421 Pisum sativum putative senescence-associated protein
H8C9 291 3,00E-16 ZP_00331135 Moorella thermoacetica Cytosine deaminase and related metal-dependent hydrolases
H8C12 179
H8D2 176
H8D5 176

231
H8D7 362 1,00E-29 BAB33421 Pisum sativum putative senescence-associated protein
H8D8 177
H8D9 291 3,00E-16 ZP_00331135 Moorella thermoacetica Cytosine deaminase and related metal-dependent hydrolases
H8D10 304 9,3 NP_907232 Wolinella succinogenes Magnesium and Cobalt Transport Protein
H8D11 353 1,00E-29 BAB33421 Pisum sativum putative senescence-associated protein
H8D12 176
H8E5 291 3,00E-16 ZP_00331135 Moorella thermoacetica Cytosine deaminase and related metal-dependent hydrolases
H8E7 303 9,3 NP_907232 Wolinella succinogenes Magnesium and Cobalt Transport Protein
H8E8 #
H8E9 364 1,00E-29 BAB33421 Pisum sativum putative senescence-associated protein
H8E10 363 1,00E-29 BAB33421 Pisum sativum putative senescence-associated protein
H8E11 463 1,9 CAD13249 Schistosoma mansoni tyrosine kinase
H8E12 353 1,00E-29 BAB33421 Pisum sativum putative senescence-associated protein
H8F7 179
H8F8 177
H8F9 180
H8F10 176
H8F11 177
H8F12 292 2,00E-13 ZP_00331135 Moorella thermoacetica Cytosine deaminase and related metal-dependent hydrolases
H8G7 176
H8G8 362 1,00E-29 BAB33421 Pisum sativum putative senescence-associated protein
H8G9 179
H8G10 291 3,00E-16 ZP_00331135 Moorella thermoacetica Cytosine deaminase and related metal-dependent hydrolases
H8G11 177
H8G12 291 3,00E-16 ZP_00331135 Moorella thermoacetica Cytosine deaminase and related metal-dependent hydrolases
H8H8 530 9,00E-14 T02955 maize probable cytochrome P450 monooxygenase
H8H9 177
H8H10 402 3,20E+00 EAL46739 Entamoeba histolytica protein kinase, putative
H8H11 177
H8H12 468 0,004 AAC46906 Trypanosoma cruzi mucin-like protein
H9A8 386 1,00E-29 BAB33421 Pisum sativum putative senescence-associated protein
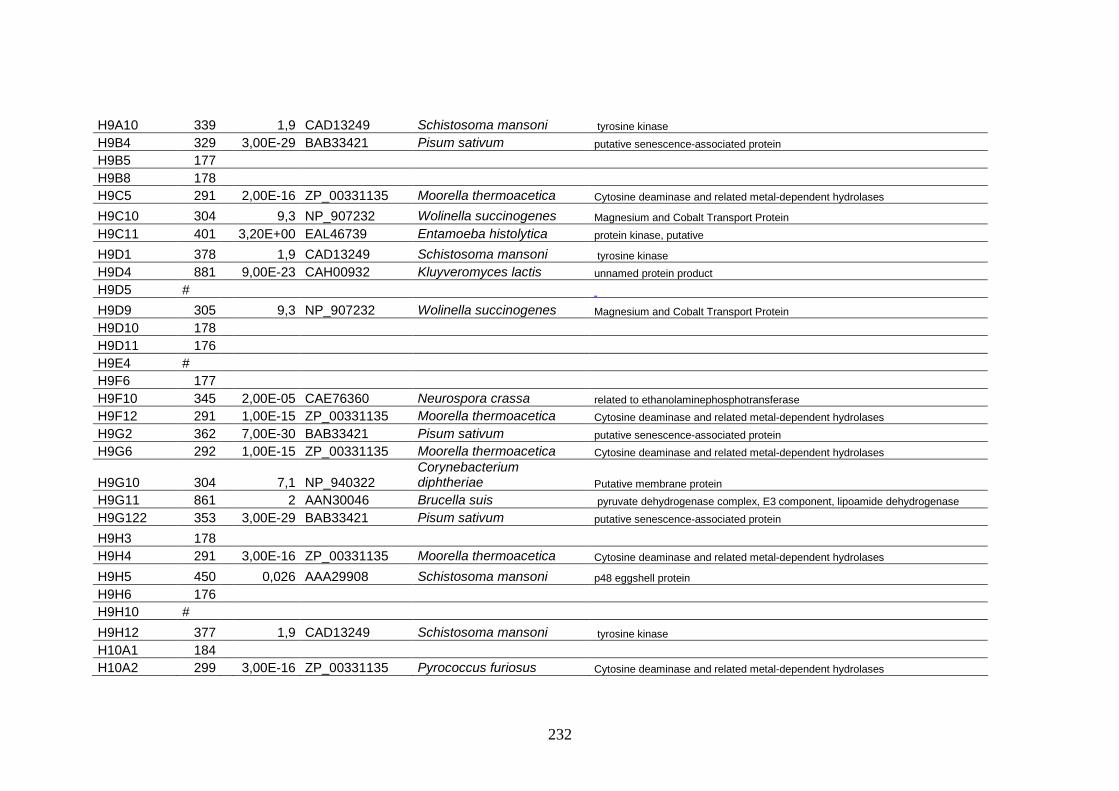
232
H9A10 339 1,9 CAD13249 Schistosoma mansoni tyrosine kinase
H9B4 329 3,00E-29 BAB33421 Pisum sativum putative senescence-associated protein
H9B5 177
H9B8 178
H9C5 291 2,00E-16 ZP_00331135 Moorella thermoacetica Cytosine deaminase and related metal-dependent hydrolases
H9C10 304 9,3 NP_907232 Wolinella succinogenes Magnesium and Cobalt Transport Protein
H9C11 401 3,20E+00 EAL46739 Entamoeba histolytica protein kinase, putative
H9D1 378 1,9 CAD13249 Schistosoma mansoni tyrosine kinase
H9D4 881 9,00E-23 CAH00932 Kluyveromyces lactis unnamed protein product
H9D5 #
H9D9 305 9,3 NP_907232 Wolinella succinogenes Magnesium and Cobalt Transport Protein
H9D10 178
H9D11 176
H9E4 #
H9F6 177
H9F10 345 2,00E-05 CAE76360 Neurospora crassa related to ethanolaminephosphotransferase
H9F12 291 1,00E-15 ZP_00331135 Moorella thermoacetica Cytosine deaminase and related metal-dependent hydrolases
H9G2 362 7,00E-30 BAB33421 Pisum sativum putative senescence-associated protein
H9G6 292 1,00E-15 ZP_00331135 Moorella thermoacetica Cytosine deaminase and related metal-dependent hydrolases
H9G10 304 7,1 NP_940322 Corynebacterium diphtheriae Putative membrane protein
H9G11 861 2 AAN30046 Brucella suis pyruvate dehydrogenase complex, E3 component, lipoamide dehydrogenase
H9G122 353 3,00E-29 BAB33421 Pisum sativum putative senescence-associated protein
H9H3 178
H9H4 291 3,00E-16 ZP_00331135 Moorella thermoacetica Cytosine deaminase and related metal-dependent hydrolases
H9H5 450 0,026 AAA29908 Schistosoma mansoni p48 eggshell protein
H9H6 176
H9H10 #
H9H12 377 1,9 CAD13249 Schistosoma mansoni tyrosine kinase
H10A1 184
H10A2 299 3,00E-16 ZP_00331135 Pyrococcus furiosus Cytosine deaminase and related metal-dependent hydrolases
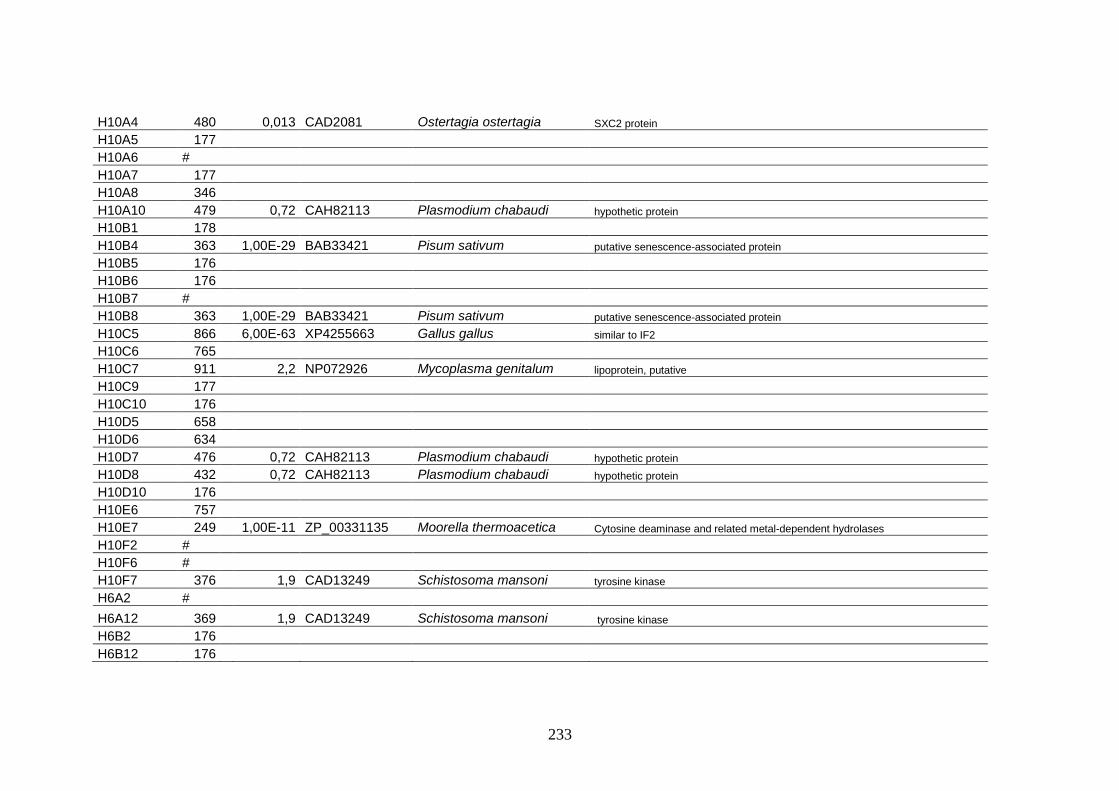
233
H10A4 480 0,013 CAD2081 Ostertagia ostertagia SXC2 protein
H10A5 177
H10A6 #
H10A7 177
H10A8 346
H10A10 479 0,72 CAH82113 Plasmodium chabaudi hypothetic protein
H10B1 178
H10B4 363 1,00E-29 BAB33421 Pisum sativum putative senescence-associated protein
H10B5 176
H10B6 176
H10B7 #
H10B8 363 1,00E-29 BAB33421 Pisum sativum putative senescence-associated protein
H10C5 866 6,00E-63 XP4255663 Gallus gallus similar to IF2
H10C6 765
H10C7 911 2,2 NP072926 Mycoplasma genitalum lipoprotein, putative
H10C9 177
H10C10 176
H10D5 658
H10D6 634
H10D7 476 0,72 CAH82113 Plasmodium chabaudi hypothetic protein
H10D8 432 0,72 CAH82113 Plasmodium chabaudi hypothetic protein
H10D10 176
H10E6 757
H10E7 249 1,00E-11 ZP_00331135 Moorella thermoacetica Cytosine deaminase and related metal-dependent hydrolases
H10F2 #
H10F6 #
H10F7 376 1,9 CAD13249 Schistosoma mansoni tyrosine kinase
H6A2 #
H6A12 369 1,9 CAD13249 Schistosoma mansoni tyrosine kinase
H6B2 176
H6B12 176

234
H6E2 373 1,9 CAD13249 Schistosoma mansoni tyrosine kinase
H6F3 177
H6F5 183
H6F6 390 0,5 AAG00637 Moloch horridus NADH dehydrogenase subunit 2
H6G2 395 3,2 EAL46739 Entamoeba histolytica protein kinase, putative
H6G3 177
H6G8 178
H6H3 175
H6H5 176
H6H6 944 2,00E-37 BAA10929 Nicotiana tabacum cytochrome P450 like_TBP
H6H8 502 2,00E-23 EAL34999 Cryptosporidium hominis senescence-associated protein
H6H9 177
H6H10 175
H6H11 176
H6H12 426 9,4 EAL36536 Cryptosporidium hominis importin-beta2

Appendix
Appendix III-7

236
Appendix III-7
Resume of NCBI data base in silico analysis and results for Dfsl. Number of EST and
the protein hits results obtained from BLASTx search at NCBI database
(http://www.ncbi.nlm.nih.gov).
Plasmodium SERA-3EAA224284.9
uncultured bacterium ATPase component of ABC-type transport systemBAD810205,00E+00
Plasmodium extragenic suppressor of the BimD6 mutationXP_7293546,40E-01
Trypanosoma transporter, putativeEAN893472,00E-07
Leishmania d-lactate dehydrogenase-like proteinAAZ099527,00E-20
Cryptosporidium senescence-associated proteinEAL349991,00E-45
Kluyveromyces unnamed protein productXP_453836 1,00E-14
Canis similar to Zinc finger CCCH-type domain containing protein3XP_5391983,00E-10
Aplysia 40S ribosomal protein S3a (Lysine-rich protein KRP-ACAA485582,00E-07
Nitrosococcus Formate/nitrite transporterABA566420.48
Plasmodium hypothetical proteinXP_6796431,00E-14
Pisum putative senescence-associated proteinBAB334218,00E-27
Leishmania d-lactate dehydrogenase-like proteinAAZ099527,00E-20
Lentinula putative S-phase specific ribosomal protein cyc07BAD118164,00E-67
Pseudomonas Short-chain dehydrogenase/reductase SDRABA742112,00E-09
Arabidopsis ATP binding / ATP-dependent helicaseNP_1917902,00E-49
Tetraodon unnamed protein productCAF987722,00E-04
Pyrococcus hypothetical protein PH1053NP_1429621.2
Trypanosoma transmembrane amino acid transporter, putativeEAN853934,00E-09
Crassostrea ribosomal protein L19CAD14413,00E-29
Plasmodium hypothetical proteinXP_6756866,00E-13
Oryza DEAD/DEAH box helicase, putativeAAX957091,00E-07
Theileria 60S ribosomal protein L36, putativeCAI762867,00E-12
Gallus similar to NHP2-like protein 1XP_4162252,00E-17
Thalassiosira silaffin precursor Sil2pAAU448181.5
Arabidopsis amino acid permease/ amino acid-polyamine transporterNP_1910432,00E-08
3Pisum putative senescence-associated proteinBAB334211,00E-29
ESTsProtein hitsAccessionnumbersE-valus
82BLASTx hits
6ESTs with no hit
90ESTs with hit
96ESTs sequenced
Dfsl NCBI BLAST x results

237
Appendix III-8

238
Appendix III-8
Resume of NCBI data base in silico analysis and results for efMOS. Number of EST
and the protein hits results obtained from BLASTx search at NCBI database
(http://www.ncbi.nlm.nih.gov).
109ESTs with hit
efMOSl NCBI BLAST x results
204ESTs sequenced
95ESTs with no hit
27BLASTx hits
1Corynebacterium putative membrane proteinNP_9403227,1
1Cryptosporidium Importin beta2EAL365369,4
1Gallus Similar to IF2XP42556636,00E-63
1Ostertagia SXC2 proteinCAD208120,013
1Schistosoma P48 eggshell proteinAAA299080,026
1Kluyveromyces Unnamed protein productCAH009329,00E-23
5Wolinella Magnesium and cobalt transport proteinNP_9072329,3
2Moloch NADH dehydrogenaseAAG006370,44
1Synechococcus N.acetylmuramoyl-L-alanini amidaseAAL688432,00E-04
2Sorghum AminoalcoholphosphotransferaseAAL688432,00E-04
1Homo MK2 non alergic IgE long chainAAW291142,20E-01
2Trypanosoma Mucin like proteinAAC469040,004
1Arabidopsis Long-chain fatty acid CoA ligase proteinNP1822463,00E-18
1Enterococcus Predicted phosphosugar isomeraseNP6507782,4
1Ribosomal protein S191909359A8,00E-34
3Neurostora Related to ethanolaminephosphotransferaseCAE763602,00E-05
7Nicotiana Cytochrome P450 monooxygenaseBAA109291,00E-24
20Cryptostoridium Putative senescence-associated proteinEAL349991,00E-29
1Citobacter IntI class1 integron integraseAAL593857,1
3Oryza hypothetical proteinNP9136543,2
2Plasmodium Acyl CoA synthaseEAA205301,00E-18
15Moorella Cytosine deaminaseZP_003311353,00E-16
6Entamoeba Protein kinaseEAL467393,2
14Schistosoma Tyrosine kinaseCAD13249 1,9
3Mycoplasm Lipoprotein, putativeNP0729262,2
1Brucella Pyruvate dehydrogenase, lipoamide dehydrogenaseAAN300462
5Archaeoglobus Pyruvate formate lyaseNP0702784,1
7Plasmodium Hypothetic proteinNP7036910,72
ESTsProtein hitsAccessionnumberse-value

239
Appendix V-1

240
Appendix V-1
Classification of Macroarray Sets according to in silico analysis, presenting the clone
designation associated with the submission name and the respective accession
number.

Appendix
Category Sub-category Clone Submission designation AccessionNumber
binding activity nucleotide binding purine nucleotide binding D1-13 ESTfrwSSHPo00002_D1_13-A1 BB999049
DNA binding C1-a ESTfrwSSHPo00003_C1_a-B1 BB999050
RNA binding B1_5 ESTfrwSSHPo00004_B1_5-C1 BB999051
A1-d ESTfrwSSHPo00005_A1_d-D1 BB999052
A1-p ESTfrwSSHPo00006_A1_p-E1 BB999053
D1-26* ESTfrwSSHPo00007_D1_26-F1 BB999054
metal ion binding activity transition metal ion binding B1-3 ESTfrwSSHPo00008_B1_3-G1 BB999055
transition metal ion binding H9H4 ESTfrwSSHPo00009_H9H4_H1 BB999056
protein binding cytoskeletal protein binding B1-6 ESTfrwSSHPo00010_B1_6-A2 BB999057
hydrolase activity acting on carbon-nitrogen bond D1-10 ESTfrwSSHPo00011_D1_10-B2 BB999058
H5A8 ESTfrwSSHPo00012_H5A8-C2 BB999059
H7D1 ESTfrwSSHPo00013_H7D1-D2 BB999060
catalytical activity H8C9 ESTfrwSSHPo00014_H8C9-E2 BB999061
lyase activity carbon-carbon lyase D1-o ESTfrwSSHPo00015_D1_o-F2 BB999062
B1_9 ESTfrwSSHPo00016_B1_9-G2 BB999063
ligase activity forming carbon-nitrogen bonds D1-30 ESTfrwSSHPo00017_D1_30-H2 BB999064
transferase activity transferase activity, transferring acyl groups H9D9 ESTfrwSSHPo00018_H9D9-A3 BB999065
H2D11 ESTfrwSSHPo00019_H2D11-B3 BB999066
oxidoreductase B1_12 ESTfrwSSHPo00020_B1_12-C3 BB999067
C1_3 ESTfrwSSHPo00021_C1_3-D3 BB999068
H5H3 ESTfrwSSHPo00022_H5H3-E3 BB999069
H6H6 ESTfrwSSHPo00023_H6H6-F3 BB999070
chaperone activity chaperone activity heat-shock protein activity D1-5 ESTfrwSSHPo00024_D1_5-G3 BB999071
signal transducer activity receptor activity transmembrane receptor D1-14* ESTfrwSSHPo00025_D1_14-H3 BB999072
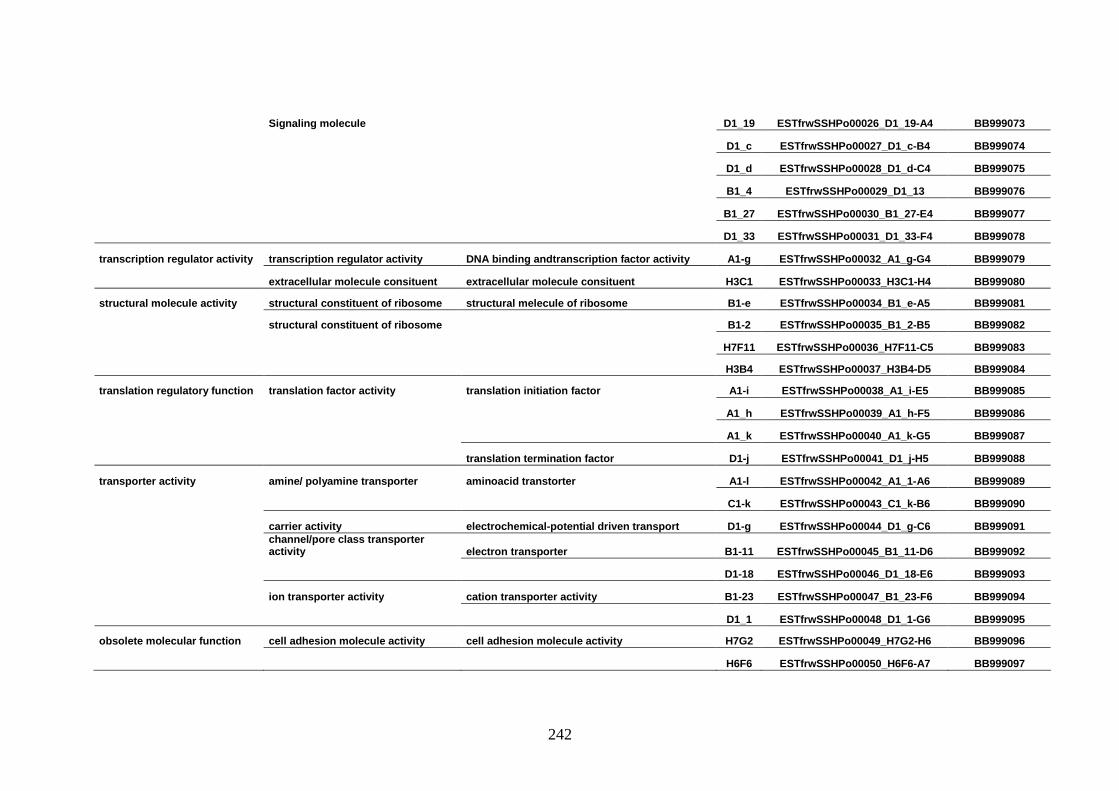
242
Signaling molecule D1_19 ESTfrwSSHPo00026_D1_19-A4 BB999073
D1_c ESTfrwSSHPo00027_D1_c-B4 BB999074
D1_d ESTfrwSSHPo00028_D1_d-C4 BB999075
B1_4 ESTfrwSSHPo00029_D1_13 BB999076
B1_27 ESTfrwSSHPo00030_B1_27-E4 BB999077
D1_33 ESTfrwSSHPo00031_D1_33-F4 BB999078
transcription regulator activity transcription regulator activity DNA binding andtranscription factor activity A1-g ESTfrwSSHPo00032_A1_g-G4 BB999079
extracellular molecule consituent extracellular molecule consituent H3C1 ESTfrwSSHPo00033_H3C1-H4 BB999080
structural molecule activity structural constituent of ribosome structural melecule of ribosome B1-e ESTfrwSSHPo00034_B1_e-A5 BB999081
structural constituent of ribosome B1-2 ESTfrwSSHPo00035_B1_2-B5 BB999082
H7F11 ESTfrwSSHPo00036_H7F11-C5 BB999083
H3B4 ESTfrwSSHPo00037_H3B4-D5 BB999084
translation regulatory function translation factor activity translation initiation factor A1-i ESTfrwSSHPo00038_A1_i-E5 BB999085
A1_h ESTfrwSSHPo00039_A1_h-F5 BB999086
A1_k ESTfrwSSHPo00040_A1_k-G5 BB999087
translation termination factor D1-j ESTfrwSSHPo00041_D1_j-H5 BB999088
transporter activity amine/ polyamine transporter aminoacid transtorter A1-l ESTfrwSSHPo00042_A1_1-A6 BB999089
C1-k ESTfrwSSHPo00043_C1_k-B6 BB999090
carrier activity electrochemical-potential driven transport D1-g ESTfrwSSHPo00044_D1_g-C6 BB999091
channel/pore class transporter activity electron transporter B1-11 ESTfrwSSHPo00045_B1_11-D6 BB999092
D1-18 ESTfrwSSHPo00046_D1_18-E6 BB999093
ion transporter activity cation transporter activity B1-23 ESTfrwSSHPo00047_B1_23-F6 BB999094
D1_1 ESTfrwSSHPo00048_D1_1-G6 BB999095
obsolete molecular function cell adhesion molecule activity cell adhesion molecule activity H7G2 ESTfrwSSHPo00049_H7G2-H6 BB999096
H6F6 ESTfrwSSHPo00050_H6F6-A7 BB999097

243
Metabolism Carbohydrate metabolism Citrate cycle (TCA cycle); Pyruvate metabolism H9G11 ESTfrwSSHPo00051_H9G11-B7 BB999098
B1_k ESTfrwSSHPo00052_B1_k-C7 BB999099
C1_6 ESTfrwSSHPo00053_C1_6-D7 BB999100
D1_20 ESTfrwSSHPo00054_D1_20-E7 BB999101
Energy metabolism Oxidative phosphorylation D1_22 ESTfrwSSHPo00055_D1_22-F7 BB999102
H7E11 ESTfrwSSHPo00056_H7E11-G7 BB999103
Lipid metabolism Glycerolipid metabolism D1_p ESTfrwSSHPo00057_D1_p-H7 BB999104
D1_27* ESTfrwSSHPo00058_D1_27-A8 BB999105
H10C7 ESTfrwSSHPo00059_H10C7-B8 BB999106
Nucleotide metabolism A1_r ESTfrwSSHPo00060_A1_r-C8 BB999107
Aminoacid metabolism C1_s ESTfrwSSHPo00061_C1_s-B8 BB999108
D1_n ESTfrwSSHPo00062_D1_n-E8 BB999109
D1_2 ESTfrwSSHPo00063_D1_2-F8 BB999110
Glycan biosynthesis and metabolism O-Glycan biosynthesis H8H12 ESTfrwSSHPo00064_H8H12-G8 BB999111
Biosynthesisof polyketides and nonribosomal peptides D1_6 ESTfrwSSHPo00065_D1_6-H8 BB999112
Cellular process Membrane transport C1_p ESTfrwSSHPo00066_C1_p-A9 BB999113
D1_b ESTfrwSSHPo00067_D1_b-B9 BB999114
B1_24 ESTfrwSSHPo00068_B1_24-C9 BB999115
B1_26 ESTfrwSSHPo00069_B1_26-D9 BB999116
Cell motility B1_7 ESTfrwSSHPo00070_B1_7-E9 BB999117
B1_8 ESTfrwSSHPo00071_B1_8-F9 BB999118
H9H5 ESTfrwSSHPo00072_H9H5-G9 BB999119
H10A4 ESTfrwSSHPo00073_H10A4-H9 BB999120
Cell growth and death A1_a ESTfrwSSHPo00074_A1_a-H10 BB999121
D1_24 ESTfrwSSHPo00075_D1_24-B10 BB999122

244
H2H10 ESTfrwSSHPo00076_H2H10-C10 BB999123
Cell comunication D1_21 ESTfrwSSHPo00077_D1_21-D10 BB999124
Imune system H4D8 ESTfrwSSHPo00078_H4D8-E10 BB999125
Unknown/ HypotheticalUnknown Unknown 1 H3B11 ESTfrwSSHPo00079_H3B11-A11 BB999126
Unknown 2 H3G11 ESTfrwSSHPo00080_H3G11-A12 BB999127
Unknown 3 H9D4 ESTfrwSSHPo00081_H9D4-A13 BB999128
Unknown 4 H4D9 ESTfrwSSHPo00082_H4D9-B11 BB999129
Unknown 5 H10D7 ESTfrwSSHPo00083_H10D7-B12 BB999130
Unknown 6 A1_j ESTfrwSSHPo00084_A1_j-B13 BB999131
Unknown 7 A1_m ESTfrwSSHPo00085_A1_m-C11 BB999132
Unknown 8 A1_o ESTfrwSSHPo00086_A1_o-C12 BB999133
Unknown 9 B1_p ESTfrwSSHPo00087_B1_p-C13 BB999134
Unknown 10 C1_b ESTfrwSSHPo00088_C1_b-D11 BB999135
Unknown 11 D1_a ESTfrwSSHPo00089_D1_a-D12 BB999136
Unknown 12 D1_h ESTfrwSSHPo00090_D1_h-D13 BB999137
Unknown 13 D1_l ESTfrwSSHPo00091_D1_l-E11 BB999138
Unknown 14 D1_m ESTfrwSSHPo00092_D1_m-E12 BB999139
Unknown 15 B1_10 ESTfrwSSHPo00093_B1_10-E13 BB999140
Unknown 16 C1_1 ESTfrwSSHPo00094_C1_1-F11 BB999141
Unknown 17 D1_4 ESTfrwSSHPo00095_D1_4-F12 BB999142
Unknown 18 D1_7 ESTfrwSSHPo00096_D1_7-F13 BB999143
Unknown 19 D1_14 ESTfrwSSHPo00097_D1_14-G11 BB999144
Unknown 20 D1_23 ESTfrwSSHPo00098_D1_23-G12 BB999145
Unknown 21 D1_30 ESTfrwSSHPo00099_D1_30-G13 BB999146

Appendix
Appendix V-2

Appendix
246
Appendix V-2
CAP1 protein family. Classification of CAP1 proteins with respective designation and
accession number.
AAP15178Suaeda maritime subsp. salsa (a sea blight)NHX1Scorn
NP_609064Drosophila melanogaster (fruit fly)NHE3aBmel
NP_391222Bacillus subtilis ATCC9372524 (a Gram +)NhaPBsubt
NhaPSOS1E
CAA80872Veillonella parvula (a gram-negative coccus)MCDVparvu
CAP1
Q06700 Acidaminococcus fermentans (a Gram - coccus)GCDAAfermNaT-DC Transporter Family(Prokaryotic)
Q01345Oncorhynchus mykiss (rainbow trout)βNHEOmyki
NP_683731Mus musculus (house mouse)NH8Mmusc
NP_003039Homo sapiens (Human)NHE2Hsapi
NP_003038Homo sapiens (Human)NHE1Hsapi
ResidentPM NHE
NP_004585Homo sapiens (Human)NHE5Hsapi
NP_610088Drosophila melanogaster (fruit fly)NHE2bDmel
NP_724311Drosophila melanogaster (fruit fly)NHE2aDmel
NP_502260Caenorhabditis elegans (a nematode)NHX9Celeg
NP_494035Caenorhabditis elegans (a nematode)NHX6aCele
NP_494035Caenorhabditis elegans (a nematode)NHX6aCele
NP_504943Caenorhabditis elegans (a nematode)NHX3Celeg
NP_495614Caenorhabditis elegans (a nematode)NHX2Celeg
NP_510622Caenorhabditis elegans (a nematode)NHX1Celeg
RecyclingPM NHE
Plasma MembraneNHE
AAP20433Zea mays (corn)NHX6Zmays
AAP20432Zea mays (corn)NHX5Zmays
AAP20431Zea mays (corn)NHX4Zmays
AAP20430Zea mays (corn)NHX3Zmays
AAP20429Zea mays (corn)NHX2Zmays
AAP20428Zea mays (corn)NHX1Zmays
AAQ63678Oryza sativa, japonica cultivar group (rice)NHX1Osati
NP_200358Arabidopsis thaliana (thale cress)NHX4Athal
NP_187288Arabidopsis thaliana (thale cress)NHX3Athal
NP_187154Arabidopsis thaliana (thale cress)NHX2Athal
NP_198067Arabidopsis thaliana (thale cress)NHX1Athal
PlantVacuolarNHE
NP_056081Homo sapiens (Human)NHE8Hspi
AAL39869Drosophila melanogaster (fruit fly)NHE1Dmela
NP_740923Caenorhabditis elegans (a nematode)NHX8bCele
NP_740923Caenorhabditis elegans (a nematode)NHX8aCele
NHE8-like NHE
NP_775924Homo sapiens (Human)NHE9Hsapi
NP_115980Homo sapiens (Human)NHE7Hsapi
NP_006350Homo sapiens (Human)NHE6Hsapi
NP_609064Drosophila melanogaster (fruit fly)NHE3bBmel
NP_741891Caenorhabditis elegans (a nematode)NHX5bCele
CAE60804Caenorhabditis briggsae (a nematode)NHX5aCele
NP_178079Arabidopsis thaliana (thale cress)NHX6Athal
NP_175839Arabidopsis thaliana (thale cress)NHX5Athal
Endosomal/Trans-GolgiNetworkNHE
IntracellularNHE
NHE
CAD98616Cryptosporidium parvum (a parasitic protozoan)SOS1Cparv
NP_178307Arabidopsis thaliana (thale cress)NHX7Athal Eukaryotic SOS1
NP_418489Escherichia coli K12 (a Gram -)YjcEEcoli
Prokaryotic Nha

Appendix
247
APPENDIX
Appendix VI-1

Appendix
248
Appendix VI-1
Table of transfection methods described for some organism of interest. This was a
selection of organisms and methodologies according to the objective of Chapter
VI.

Technology Vector
Name Methodology designation Promoter Gene Organism Source
PROTOZOANS
Electroporation Cytomix (120 mM KCl, 0.15 mM CaCl, 2 mM EGTA, 5 mM MgCl2, 10 mM K2HPO4/KH2PO4, 25 mM Hepes, pH 7.6)
p Bluescript
PHRP CAT
pCAT Basic DNA
lac promoter
5’ hrp3
SV40 promoter
Chloramphenicol acetyltransferase
P falciparum Wu et al., 1995
Electroporation pBluescript
pHRPCAT vector
Lac promoter
Promoter regions DHFR-TS
Hrp, hsp86, CAT Pf e luciferase
P falciparum Wu et al., 1996
Electroporation Wu et al., 1995 PGEM 4Z CAT
PCAT
pCAM
Lac promoter
hrp3; hrp2
DHR-TS Tg P. falciparum
Crabb et al., 1996
Electroporation RPMI 1640 + Glutamine (Life Technologies)
PHH-1 MMTV DHFR selectable
P falciparum Fidock, 1997
Electroporation Cytomix pD.D B .D. pD.D T .D. Plasmids
P. berghei or
P. falciparum
promoters
dhfr-ts from
Plasmodium or T. gondii
Plasmodium Knowlesi
Van der Well, 1997

Appendix
250
Electroporation PDT-Tg23 vector Pf Histidine-rich-protein III gene promoter
Pf DHFR P. falciparum
Mamoun et al., 1999
Electroporation pDB.DTm.DB./DB.AF.DB, pDB-DTm.DB./AB.AF.DB
pb66/ama-1 and dhfr-ts promoters
AMA-1 P. Knowlesi Kocken, 1998
Electroporation pPICZ A vector
oxidase (AOX1) gene promoter
Circumsporozoit protein T. gondii dhfr/ts flanked by P. berghei dhfr/ts
P. Knowlesi Kocken, 2002
Electroporation Plasmid
PHluc-3m
5’ flanking regions of gene encoding hrp3/ 2
Parasitophorous vacuolar membrane
P. falciparum
Burghaus et al., 2001
Electroporation Fidock et al., 1997 PHLH1 and pHD22Y Pf hrp3 promoter
DHFR P. falciparum/ erythrocytes
Deitsch et al., 2001
Electroporation
SuperFect Transfection Reagent
pBS-GFP
P. falciparum histidine
rich protein (HRP) III gene promoter
mutant T.
gondii dhfr/ts
or GFP
P. falciparum
Ben Mamoun, 2001
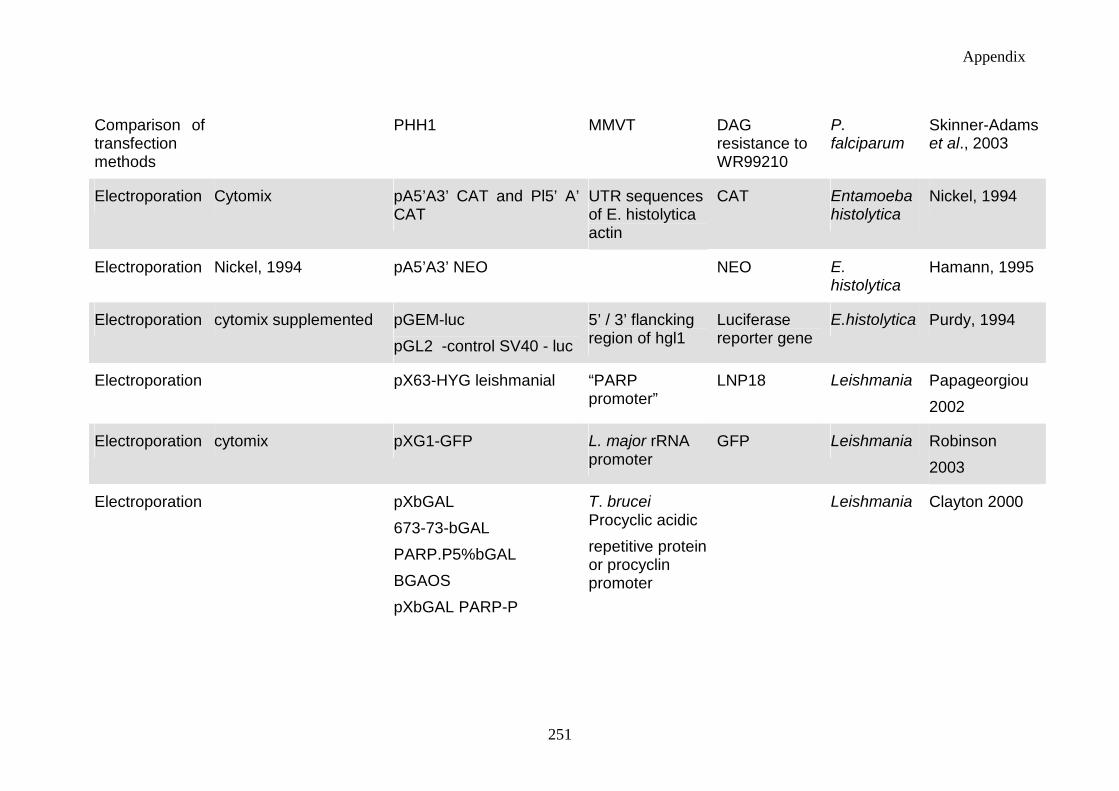
Appendix
251
Comparison of transfection methods
PHH1 MMVT DAG resistance to WR99210
P. falciparum
Skinner-Adams et al., 2003
Electroporation Cytomix pA5’A3’ CAT and Pl5’ A’ CAT
UTR sequences of E. histolytica actin
CAT Entamoeba histolytica
Nickel, 1994
Electroporation Nickel, 1994 pA5’A3’ NEO NEO E. histolytica
Hamann, 1995
Electroporation cytomix supplemented pGEM-luc
pGL2 -control SV40 - luc
5’ / 3’ flancking region of hgl1
Luciferase reporter gene
E.histolytica Purdy, 1994
Electroporation pX63-HYG leishmanial “PARP promoter”
LNP18 Leishmania Papageorgiou
2002
Electroporation cytomix pXG1-GFP L. major rRNA promoter
GFP Leishmania Robinson
2003
Electroporation pXbGAL
673-73-bGAL
PARP.P5%bGAL
BGAOS
pXbGAL PARP-P
T. brucei Procyclic acidic
repetitive protein or procyclin promoter
Leishmania Clayton 2000

Appendix
252
Electroporation pR-NEO 30-kilobase extrachromosomal amplified DNA
Dhfr/ts Leishmania major
Kapler, 1990
Electroporation L. seymouri mini-exon sequence
CAT gene Leptomonas seymouri
Bellofatto and Cross, 1989
Electroporation cytomix buffer supplemented
pSAG 1/trpB SAG 1 surface antigene gene sequences
tryptophan synthase B gene from E. coli
T. gondii Sibley, 1994
Electroporation pYX122(HIS3) yeast triose phosphate isomerase promote
Cryptosporidium mtHSP70 - GFP
Toxoplasma Slapeta, 2004
Electroporation intracellular buffer supplemented with 2mM ATP and 5mM glutathione
pDHFR-TS/M2M4 DHFR-TS promoter
CAT Toxoplasma gondii
Donald, 1993
Antisense RNA vector
antisense construct of clag9
Clag gene P. falciparum
Gardiner et al., 2000


