Embed Size (px)
Citation preview

677
Study of the influence of nozzle seat type on injectionrate and spray behaviourV Bermudez, R Payri*, F J Salvador, and A H PlazasUniversidad Politecnica de Valencia, CMT Motores Termicos, Valencia, Spain
The manuscript was received on 20 April 2004 and was accepted after revision for publication on 12 January 2005.
DOI: 10.1243/095440705X28303
Abstract: A deep analysis of the injection rate characteristics and spray behaviour of the most usednozzle types in diesel engines [microSAC and valve covered orifice (VCO)] has been carried out. Inorder to compare the injection characteristics and the spray behaviour of both nozzle types, severalexperimental installations were used, such as the steady flow test rig, injection rate test rig, spraymomentum test rig, and nitrogen test rig, to obtain a full hydrodynamic and spray characterization.The study of the flow in both nozzles was analysed under steady flow conditions in the steady flowtest rig and in real unsteady flow conditions in the injection rate test rig and the spray momentumtest rig. The macroscopic properties of the spray (tip penetration and spray cone angle) werecharacterized using a high-pressure test rig. From the point of view of the internal flow behaviour,the results showed interesting differences in the permeability of both nozzle geometries, with a higherdischarge coefficient in the microSAC nozzle. However, from the point of view of air entrainment, theresults showed a better quality of fuel–air mixing in the VCO nozzle. Besides the evidence from theexperimental results, a theoretical analysis was carried out in order to identify the most importantparameters that determine the spray behaviour and thus justify the different macroscopic behaviourof both nozzles.
Keywords: diesel, injection, common rail, injection rate, momentum, spray, valve covered orifice,microSAC
1 INTRODUCTION several studies have been carried out with the aimof characterizing the instantaneous fuel injectionprocess. However, owing to the small geometricalIn modern diesel engines, especially in high-speed
direct injection engines, the performance, efficiency, characteristic of the nozzles, it is rather difficult toobtain the parameters inside the nozzle such as thenoise, and pollutant emissions have a strong depen-
dency on the characteristics of the fuel injection pressure profile on the needle tip and the needledynamic. Several factors control the flow across theprocess. Nowadays, the amount of fuel injected is
not the only relevant characteristic of the injection nozzle, and for this reason it is advisable to sort theminto two categories: operating conditions and geo-process. The instantaneous fuel mass flowrate intro-
duced into the combustion chamber, the evolution metrical characteristics. The first category is definedby the flow type (steady or pulsating), the flow regi-of the spray, and its interaction with the air are also
important [1–3]. One important phenomenon in this men (Reynolds number), and, finally, whether the flowis cavitating or non-cavitating (cavitation number).process is the flow behaviour across the injector
nozzle, which is recognized as being influential on The second category includes the nozzle seat type(with sac volume or without sac), the inlet orificethe atomization of the fuel spray (droplet formation)
and the mixing of fuel with air [4–10]. diameter, the orifice conicity (convergent conical hole,divergent conical hole, or cylindrical hole), inletSince there is a strong relation between pollutantorifice rounding, and hole length.emissions, fuel injection features, and spray formation,
Several investigations have been carried out to* Corresponding author: Universidad Politecnica de Valencia, understand the different behaviour of the flow in theCMT Motores Termicos, Camino de Vera s/n, 46022, Valencia, most used nozzle types in diesel engines [microSAC
and valve covered orifice (VCO)] [9–18]. The aim ofSpain. email: [email protected]
D07704 © IMechE 2005 Proc. IMechE Vol. 219 Part D: J. Automobile Engineering

678 V Bermudez, R Payri, F J Salvador, and A H Plazas
Table 1 Nozzle characteristicsthe present investigation is to identify the relationshipbetween the injector dynamic (needle lift behaviour),
Nozzle seat type VCO microSACinjector nozzle seat type, instantaneous fuel mass
Conicity factor, k 1.5 1.5flowrate, and spray behaviour with the help of experi-Outside hole diameter (mm) 0.133 0.131
mental information. The internal flow across the Spray hole length (mm) 1 1Number of spray holes 5 5nozzles has been experimentally analysed under con-
tinuous and pulsating conditions. To avoid influenceson the internal flow owing to other geometrical 2.1 Steady flow test rigfactors (inlet orifice diameter, orifice conicity, inlet
The object of the steady flow test rig (SFTR) is toorifice rounding, and hole length), two five-holedetermine the mass flowrate in the orifices of annozzles with the same configuration, except the seatinjector nozzle under steady flow conditions. For thistype, have been used. The spray momentum flux haspurpose, the injector nozzle to be tested is installedbeen measured for each orifice in both nozzles towithout the needle in an injector holder, which hasobtain the effective discharge velocity, and the nitro-been modified to feed the nozzle where the needlegen test rig has been used in order to characterizewas placed. The needle is removed to avoid thethe macroscopic characteristics of the spray.pressure loss produced by the needle seat. ThisThe paper is divided into four sections. The firstmeans that the discharge coefficient of the holes cansection gives a brief description of the experimentalbe obtained.set-up. Next, the results obtained in the different test
The injection pressure is controlled using arigs for microSAC and VCO nozzles are shown andstandard pressure regulator and can be fixed atcompared with each other. The third section offersdifferent values, up to a maximum depending on thean analysis of the results based on the spray theory,maximum mass flow that the pump is able to supply.and finally a summary and the main conclusions ofThe injector is mounted in a 1 l vessel filled withthe paper are presented.fuel, where pressure is controlled, fixing the injectororifice outlet pressure. A sketch of the installation isshown in Fig. 1.
The pressure difference across the orifice can be2 EXPERIMENTAL SET-UP kept constant, and, since the geometry is also fixed,
steady flow conditions are achieved. In order toFour different test rigs have been used in this carry out the measurements at different pressureresearch in order to obtain the spray momentum differences, the injection pressure, P
i, which is the
flux, the fuel mass flowrate injected under steady flow, pressure at the orifice inlet, is kept constant, andthe instantaneous injection rate under pulsating the discharge pressure in the vessel, P
b, is varied.
flow, and the spray macroscopic characteristics. The In order to change the flow conditions in thedetails of these systems will be described in the injector orifice, tests were conducted at values offollowing sections. injection pressure, i.e. orifice inlet pressure, of 10 and
The injection system used in the experiments 20 MPa, while the pressure at the outlet was variedis a standard common rail system composed of a between minimum values of 0.01 MPa up to thehigh-pressure pump supplying the required injection injection pressure. After a short stabilization time,pressure at the rail, a fuelling system, a control sys- when steady flow conditions have been achieved, thetem, and an injector holder fitted with a needle lift mass flowrate across the injector is measured.sensor. The whole system is controlled by a Genotec The injection pressure is measured upstream withimpulse generator. The injector is the typical one an AVL piezoresistive sensor (reference 310P1200E-from a common rail, the three main components of 2.0). The discharge pressure is measured with a PMAwhich are a control valve, an intensifier plunger and GmbH sensor (reference P40). Both sensors werebarrel, and a nozzle. The valve is an electronically calibrated before the measurements were taken withcontrolled solenoid-poppet valve whose purpose is a deadweight pressure tester. The errors of the dis-to start and stop the injection process. The character- charge coefficient and theoretical Reynolds numberistics of the two nozzles used in the present study measurements were estimated using a standard pro-are shown in Table 1. The fuel used for this experi- cedure, as outlined by Holman [19]. The level ofment was Repsol CEC RF-06-99 with a density of uncertainty obtained for the discharge coefficient820.2 kg/m3 and a kinematic viscosity of 2.67 mm2/s, and theoretical Reynolds number were around 1.5
and 0.3 per cent respectively.both at 40 °C.
D07704 © IMechE 2005Proc. IMechE Vol. 219 Part D: J. Automobile Engineering

679Study of the influence of nozzle seat type on injection rate and spray behaviour
Fig. 1 Steady flow test rig
2.2 Injection rate test rig 2.3 Spray momentum test rig
With this experimental equipment, it is possible toThe test rig where the measurements of injection ratedetermine the impact force of the spray, which iswere carried out is a standard injection rate dischargeequivalent to the momentum flux of each nozzlecurve indicator (IRDCI) described in reference [20],orifice [21]. Figure 2 shows a sketch of the momentumand it enables the data describing the chronologicaltest rig. The chamber can be pressurized with nitro-sequence of an individual fuel injection event to begen up to 8 MPa to simulate discharge conditions indisplayed and recorded.the engine.To obtain a good estimation of the experimental
The force is measured with a piezoelectric pressureerrors, several repetitive measurements were carriedsensor calibrated to measure the force. The sensorout at the same test point (energizing time, railis placed at 5 mm from the hole exit. The frontalpressure, and backpressure), and the obtained dis-area of the sensor is high enough to catch allpersion was about 0.6 per cent, with proper calibrationthe frontal area of the spray. Owing to the conser-of the equipment.vation of momentum, it can be assumed that theIn order to determine the momentary meanforce measured by the sensor will be the same asquantity, an accumulative measurement processthe momentum flux at the orifice outlet, since themust therefore take place downstream of the IRDCI.
The mean quantity corresponds to the mean surfacearea of the pressure integral for a recorded sequenceof injection events.
Three injection pressure values, Pi, fixed at the
common rail, were used: 30, 80, and 130 MPa.The backpressure or pressure at the discharge of theinjector, P
b, was 4 MPa. For all the measurements
taken, the injector energizing time was set at 0.25,0.5, 1, and 3 ms. The first three are used to find outthe injection rate shape in a typical injection eventin that engine. The last one can produce a stableinjection process and thus obtain more consistentresults for injection rate characterization and analysis.
The injection rate, fuel injection pressure, needle lift,and energizing time intensity signals were recordedusing a data acquisition and display YOKOGAWAsystem and in-house developed TRATASA software
Fig. 2 Spray momentum test rigto obtain the injection rate curves.
D07704 © IMechE 2005 Proc. IMechE Vol. 219 Part D: J. Automobile Engineering

680 V Bermudez, R Payri, F J Salvador, and A H Plazas
pressure inside the chamber is constant and sur- obscure the windows and severely degrade therounds the entire spray. Taking this into account, quality of the images. Furthermore, it is importantit can be said that the density of the chamber to keep rig pressure P
band nitrogen temperature
fluid does not affect the measurements, so that any constant during each experiment. Two filters collectchamber pressure can be used without disturbing the fuel injected to keep the gas stream clean. Thethe results. Figure 3 shows a sketch of the spray and temperature of the nitrogen can be fixed between 15sensor used in the momentum test rig. and 50 °C in order to obtain the desired density inside
the chamber. The test rig operates in cold conditions2.4 Nitrogen test rig at all times, thus avoiding fuel evaporation. A sketch
of the high-pressure nitrogen test rig is shown inIn order to visualize the sprays, the nitrogen test rigFig. 4.is used. The test rig basically consists of a steel cube
The images are taken with a 12-bit colour CCDwith a chamber and various connecting flangescamera with a spatial resolution of 1280×1024 pixelsmachined into it. The design is modular, andand a minimum exposure time of 10 ms with a jitterancillaries can be added depending on the requiredof ±5 ms. Illumination is created with a conven-experiment [22]. The rig and ancillaries are designedtional electronic flash of controllable duration (setfor a maximum pressure of 8 MPa. The test rig hasfor far longer than the minimum camera gate) andan internal volume of 1 l.intensity. In spite of the fact that a conventional flashIt is necessary to circulate the nitrogen throughis used to present a shot-to-shot fluctuation that isthe rig because otherwise the injected diesel wouldhigher than more sophisticated light sources, theresults obtained with the software have proved tobe insensitive to fluctuations in the illuminationintensity within a reasonable range. All the experi-mental equipment (camera–flash–injection) has beensynchronized with a purpose-built electronic system,using the injector trigger signal as a reference signalto take the image sequences. In Fig. 5, the experi-mental set-up for the image acquisition is presented.
The images are digitally processed using purpose-developed software [23]. The segmentation algorithmused, based on the log-likelihood ratio test (LRT), hasthe advantage of using the three channels of RGB
Fig. 3 Spray momentum measurement system diagram images for a proper determination of boundaries that
Fig. 4 Nitrogen conditioning system
D07704 © IMechE 2005Proc. IMechE Vol. 219 Part D: J. Automobile Engineering

681Study of the influence of nozzle seat type on injection rate and spray behaviour
3 RESULTS
3.1 Steady flow test rig
The final results applying this methodology to thetwo nozzle seat types, microSAC and VCO, are pre-sented in Fig. 7, where the injection mass flowrateversus the square root of effective pressure lossacross the nozzle is plotted for two values of railpressure of 10 and 20 MPa. As explained before, thesemeasurements were taken in steady conditions ofinlet and outlet pressure.
As can be seen, there are small differences betweenthe amounts of fuel injected, the main differencebeing the curve slope. If the expression for fuel massflowrate injected by an injector nozzle, equation (1),is analysed, this difference means that both nozzleshave variations in permeability value (C
dNA
N).
Fig. 5 Visualization set-up
mN=CdNANrfC 2rf (Pi−Pb)D1/2 (1)
are not well defined, as in the case of sprays. Thismethod proved to be almost completely insensitiveto intensity fluctuations between pictures for thetested cases, and provided better results than someother algorithms checked. Prior to the systematicuse of the algorithm for parametric studies, theinfluence of the illumination quality on the resultswas evaluated in specific tests. Results demonstratedthat the algorithm properly detects the estimatedspray boundaries even in the case of reasonably poorillumination. Details of the image processing soft-ware are available in reference [23]. Figure 6 showsthe spray macroscopic characteristics obtained using
Fig. 7 Steady flow test rig resultsthis installation and the notation employed.
Fig. 6 Spray macroscopic characteristics
D07704 © IMechE 2005 Proc. IMechE Vol. 219 Part D: J. Automobile Engineering
682 V Bermudez, R Payri, F J Salvador, and A H Plazas
where mN
is the mass flowrate, CdN
is the nozzle dis-charge coefficient, A
Nis the nozzle area, r
fis the fluid
density, Pi
is the injection pressure, and Pb
is thebackpressure in the combustion chamber. The termof the square root is the theoretical velocity definedby Bernoulli, U
th.
To produce a better analysis, it is necessaryto plot the discharge coefficient, C
dN, against the
theoretical Reynolds number, l, as depicted in Fig. 8.The diameter used in the calculations is the outletorifice diameter, which is shown in Table 1.
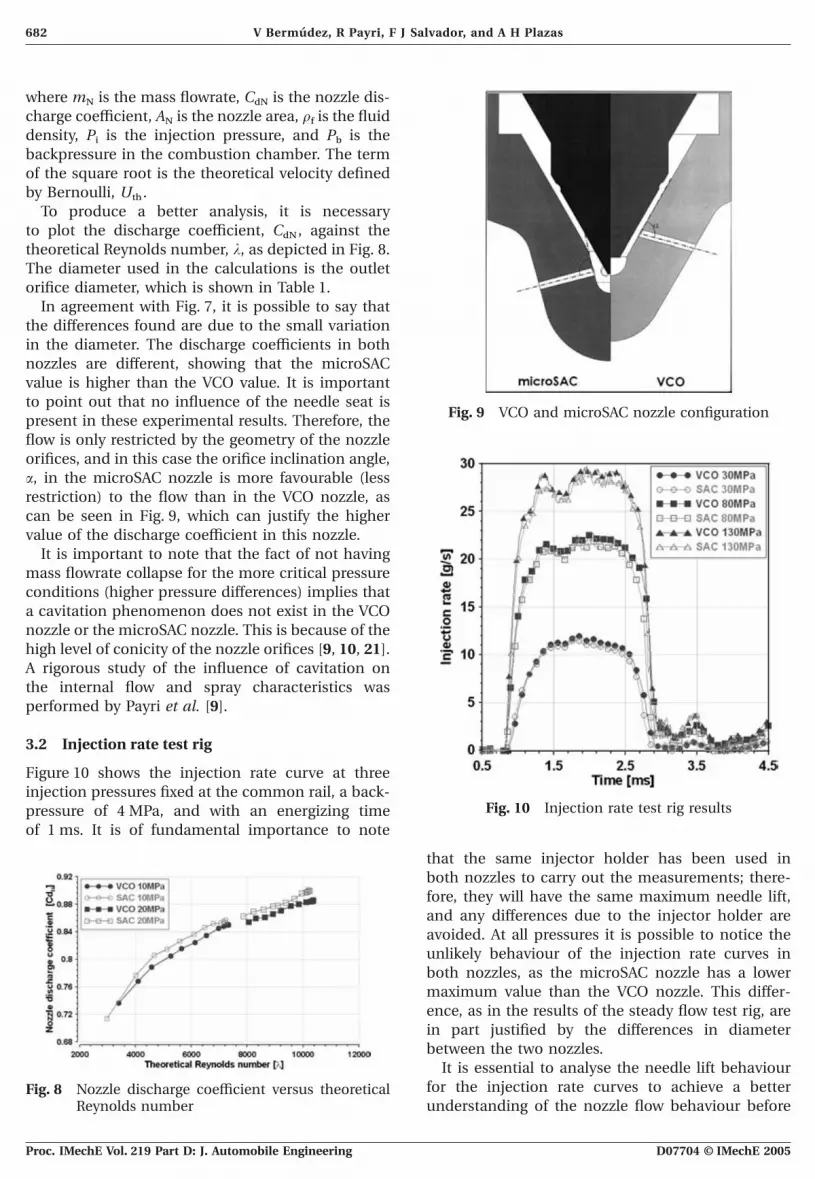
In agreement with Fig. 7, it is possible to say thatthe differences found are due to the small variationin the diameter. The discharge coefficients in bothnozzles are different, showing that the microSACvalue is higher than the VCO value. It is importantto point out that no influence of the needle seat is
Fig. 9 VCO and microSAC nozzle configurationpresent in these experimental results. Therefore, theflow is only restricted by the geometry of the nozzleorifices, and in this case the orifice inclination angle,a, in the microSAC nozzle is more favourable (lessrestriction) to the flow than in the VCO nozzle, ascan be seen in Fig. 9, which can justify the highervalue of the discharge coefficient in this nozzle.
It is important to note that the fact of not havingmass flowrate collapse for the more critical pressureconditions (higher pressure differences) implies thata cavitation phenomenon does not exist in the VCOnozzle or the microSAC nozzle. This is because of thehigh level of conicity of the nozzle orifices [9, 10, 21].A rigorous study of the influence of cavitation onthe internal flow and spray characteristics wasperformed by Payri et al. [9].
3.2 Injection rate test rig
Figure 10 shows the injection rate curve at threeinjection pressures fixed at the common rail, a back-
Fig. 10 Injection rate test rig resultspressure of 4 MPa, and with an energizing timeof 1 ms. It is of fundamental importance to note
that the same injector holder has been used inboth nozzles to carry out the measurements; there-fore, they will have the same maximum needle lift,and any differences due to the injector holder areavoided. At all pressures it is possible to notice theunlikely behaviour of the injection rate curves inboth nozzles, as the microSAC nozzle has a lowermaximum value than the VCO nozzle. This differ-ence, as in the results of the steady flow test rig, arein part justified by the differences in diameterbetween the two nozzles.
It is essential to analyse the needle lift behaviourfor the injection rate curves to achieve a betterFig. 8 Nozzle discharge coefficient versus theoretical
Reynolds number understanding of the nozzle flow behaviour before
D07704 © IMechE 2005Proc. IMechE Vol. 219 Part D: J. Automobile Engineering

683Study of the influence of nozzle seat type on injection rate and spray behaviour
making conjectures, since the needle does not reachthe maximum lift with an energizing time of 1 ms.This means that the amount of fuel injected dependson the lift that the needle can reach. Figure 11 showsthe needle behaviour in the microSAC and VCOnozzles.
It is feasible to discover that, when the injectionpressure is increased, the differences in the needlelift curves between microSAC and VCO increase,showing that the microSAC needle lift is lower thanthe VCO needle lift. The same result is obtained forother energizing times. These differences can beexplained by variations in the pressure profile on theneedle between the two nozzles, which means thatthe losses along the nozzle seat are higher in themicroSAC nozzle than in the VCO. Consequently,the force generated by the pressure profile on theneedle tip, which pulls the needle up, will be smallerin the microSAC than in the VCO nozzle, causing
Fig. 12 Nozzle discharge coefficient versus normalizeda slower needle lift and thus a smaller injectionneedle lift
rate [14].As the injection rate and the needle lift behaviour
discharge coefficient are more important at highare known, it is possible to obtain the curve of C
dN pressure (needle lift) in favour of the microSACagainst time as Fig. 12 shows. Small differences can
nozzle.be found in the discharge coefficient values betweenthe two nozzles, with the microSAC having a slightly
3.3 Spray momentum test righigher value than the VCO nozzle [14, 15]. Thesedifferences are more visible in the stationary part of Figure 13 shows the mean spray momentum fluxthe curves. Although for a small needle lift the losses (impact force) curves at three injection pressuresin the seat of the microSAC nozzle are bigger, this is fixed at the common rail, a backpressure of 4 MPa,in part compensated for by the less restriction of the and with an energizing time of 1 ms.flow owing to the smaller inclination of the orifices For the three pressures tested, as for the injectionin this nozzle (Fig. 9), especially for higher needle rate test rig, the instantaneous value of momentumlift (80 and 130 MPa). Thus, the differences in the flux is smaller in the microSAC than in the VCO. Since
Fig. 11 MicroSAC and VCO needle lift behaviour Fig. 13 Spray momentum test rig results
D07704 © IMechE 2005 Proc. IMechE Vol. 219 Part D: J. Automobile Engineering

684 V Bermudez, R Payri, F J Salvador, and A H Plazas
a turbulent flow without cavitation is considered, the these macroscopic parameters is very small. Themeasurements were obtained in the nitrogen test rigoutlet velocity profile can be assumed to be uniform
all along the outlet area of the hole. With this at three injection pressures fixed at the common rail,4 MPa of backpressure, and with 1 ms of energizingassumption, it is possible to estimate the effective
outlet velocity, Uo
[21], by dividing the momentum time. It is only possible to visualize the spray up toa maximum value of 42 mm because of optical accessflux, M
o, by the mass flow, m
owindow limitations.
From Figs 16 and 17 some conclusions can beUo=Momo
(2)drawn: the spray tip penetration for the microSACnozzle is higher than in the VCO nozzle, but the valueFigure 14 shows the instantaneous outlet velocity,of the spray angle, as with the spray volume, is higherU
o, during the needle opening stage. It can be
in the VCO nozzle than in the microSAC. In bothobserved that, in the case of 30 MPa, the value of thecases, when the injection pressure increases, theoutlet velocity in the microSAC nozzle is about 7 perdifferences between these values becomes higher.cent smaller than in the VCO nozzle (consideringThe rise in the spray angle is due to the fact that thethe stationary part), but nevertheless this tendencyspray momentum is more distributed in the radialradically changes when the injection pressuredirection than in the axial direction, which leads toincreases, with an effective velocity in the microSACmore important axial velocity decay. This smaller axialnozzle about 5 per cent higher than in the VCOvelocity results in a decreased spray penetration.nozzle for an injection pressure of 130 MPa. The
On the other hand, a higher spray angle is relatedreason for this is related to the behaviour of theto an increase in air entrainment. Figure 18 showsdischarge coefficient previously stated.the spray volume for each nozzle. As with the angle,the volume of the spray is a representative parameter3.4 Nitrogen test rigof the air entrainment process. This figure shows
Figure 15 shows some samples of images obtained in that the spray volume of the VCO nozzle is biggerthe nitrogen test rig. The picture shows the sprays than that of the microSAC nozzle. Combining thisfrom two nozzles at an injection pressure of 130 MPa, measurement with the fuel injection rate, it isand for a time after injection of 1000 ms. Figures 16 possible to estimate the fuel/air ratio, Wand 17 depict the values of the spray penetration andspray cone angle. The results shown correspond
W=moma
(3)to the mean value of five independent sprays. Thestandard deviation (not represented in order to
and thus determine which nozzle behaves better inclarify the figures) is small: the penetration has aterms of air entrainment.maximum standard deviation of around ±0.7 mm,
In Fig. 19 it can be observed that the value of W inand the cone angle has a maximum standardthe VCO nozzle, for a given time, is smaller thandeviation of ±1°. Therefore, the error determiningin the microSAC nozzle.
4 ANALYSIS OF THE RESULTS
4.1 Theoretical analysis
The studies dedicated, at least principally, to theexperimental or theoretical examination of free spraypenetration are incredibly numerous [23–29]. Manyconclude with the proposal of an empirical or semi-empirical equation that tries to estimate the instantspray penetration related to diverse parameters (outletvelocity, environment density, orifice geometry, etc.).Hay and Jones [24] carried out a critical revision ofthe proposed correlations in the bibliography fordiesel spray in the time period before 1972 andarrived at the conclusion that those that best fit the
Fig. 14 Outlet velocity at the needle opening stage experimental results were the proposals by Wakuri
D07704 © IMechE 2005Proc. IMechE Vol. 219 Part D: J. Automobile Engineering

685Study of the influence of nozzle seat type on injection rate and spray behaviour
Fig. 15 Spray images for both nozzles
Fig. 16 Mean spray penetration Fig. 18 Mean spray volume
Fig. 17 Mean spray angle Fig. 19 Air entrainment determination
D07704 © IMechE 2005 Proc. IMechE Vol. 219 Part D: J. Automobile Engineering

686 V Bermudez, R Payri, F J Salvador, and A H Plazas
et al. [25] and Dent [26]. In this way, as demonstrated The velocity coefficient, Cv, is defined as the relation-
ship between effective velocity and theoretical velocityby Wakuri et al., by applying the conservation of thequantity of movement in a constant cone angle hover a time period, where it is assumed that the Cv=
UoUth
(9)air/fuel mixture is homogeneous, an equation isobtained that according to Hay and Jones fits per- In order to quantify the differences observed, andfectly with the experimental data. Therefore, as a concerning the fuel–air mixing as well as the fuel–airreference in this analysis the expression proposed by ratio, one representative parameter is the mixingthem is used [25] time, t
m(W), which is defined as the time passed from
the beginning of the injection until a determinedfuel/air ratio has been obtained in the axis of the
S(t)a DP1/4r−1/4a D1/2o tanAh2B−1/2t1/2 (4) spray. An expression for the mixing time as a functionof the spray and flow parameters can be deduced.
The equation of momentum conservation alongwhere S(t) is the penetration as a function of time,the spray axis can be written asr
ais the air density, D
ois the diameter at the orifice
outlet, DP is the pressure differential, t is the time Mo=moUo=(mo+ma)Uaxis (10)from the start of injection, and h is the angle of the
with ma
is the mass of air entrained by the spray, andspray cone. The geometry of the orifices is taken intoU
axisis the velocity of the spray along the spray axis,account through the diameter of the orifice. As both
which is the derivation of penetration as a functionnozzles have the same orifice configuration, it isof time. Taking into account equations (5) to (9), theexpected that this constant will be the same for bothpenetration of the spray can be written asnozzles.
The penetration behaviour equation, which is estab-S(t)aAp4 C2vCaB1/4U1/2th D1/2o ArfraB1/4 tanAh2B−1/2t1/2lished by the theory of gaseous sprays [equation (4)],
can be written as(11)
Considering stabilized conditions, tan(h/2) is con-S(t)ar−1/4a M1/4o tanAh2B−1/2t1/2 (5)stant, and then, deriving equation (11), the expressionfor the velocity of the spray is obtained
where Mo
, is the momentum flux at the orifice outlet,equal to the mass flowrate per orifice multiplied by Uaxisa(C2vCa)1/4U1/2th D1/2o ArfraB1/4 tanAh2B−1/2t−1/2the velocity at the orifice outlet
(12)Mo=moUo (6)
Taking into accountTaking into account equation (1), the mass flowrate Mo=moCvUth (13)can be written as
and substituting equations (12) and (13) intoequation (10), the following expression is obtainedmo=CdNAo√2rf(Pi−Pb) (7)
where Ao
is the outlet area of one orifice in the nozzle. moCvUtha(mo+ma)(C2vCa)1/4U1/2th D1/2o ArfraB1/4In this equation, because all orifices have the samegeometrical characteristics, it is assumed that the
×tanAh2B−1/2t−1/2 (14)discharge coefficient of each orifice is the same asthe discharge coefficient of the nozzle, C
dN. The
Finding the value of t, and considering the fuel–airloss included in the discharge coefficient could beratio, W , the following expression is obtaineddivided into two parts [equation (8)]: the velocity
coefficient, Cv, which takes into account the loss in
tm(W)a(1+1/W)2C1/2a DoUthCv tan (h/2)
(15)terms of velocity, and the area coefficient, Ca, which
incorporates the loss of area owing to flow con-For a determined fuel/air ratio, the values obtainedtraction and the non-uniform velocity profiles at thefrom equation (15), which are proportional to theoutlet section of the hole [21, 30]mixing time, t
m(W), of the two nozzles at the three
injection pressures tested, are compared in Table 2.CdN=CaCv (8)
D07704 © IMechE 2005Proc. IMechE Vol. 219 Part D: J. Automobile Engineering

687Study of the influence of nozzle seat type on injection rate and spray behaviour
Table 2 Proportional values of the mixing time and without needle influence, showing that thevalue of the microSAC C
dNis greater than that of
~tm
(W)the VCO.
Nozzle type 30 MPa 80 MPa 130 MPa 2. The combination of momentum flux measure-ments and those obtained from mass flowratemicroSAC 1.38 1.31 1.16
VCO 1.12 (−18.8%) 1.07 (−18.3%) 1 (−13.79%) characterization has permitted the determinationof the spray outlet velocity, and the observedtendency is that, for the lower injection pressureof 30 MPa, the microSAC nozzle has a velocity
For calculation of the parameters, the guidelinesaround 7 per cent smaller than in the VCO nozzle.
below were followed.Nevertheless, this tendency radically changes when
1. The effective velocity is obtained from Fig. 14, the injection pressure increases, with an effectiveand, taking into account the theoretical velocity, velocity in the microSAC nozzle around 5 per centthe coefficient C
vcan be worked out. higher than in the VCO nozzle for an injection
2. The nozzle discharge coefficient can be obtained pressure of 130 MPa. This change in tendency isfrom Fig. 12, and, taking into account equation (8), due to the fact that, although for a small needlethe value of C
acan be worked out. Because there lift the losses in the seat of the microSAC nozzle
is no cavitation, the values of Ca
obtained for both are greater, this is in part compensated for by thenozzles are very similar and near to 1 [21]. smaller restriction of the inlet flow owing to the
3. The value of tan(h/2) can be obtained from Fig. 17 lower inclination of the orifices in this nozzle,(steady conditions). especially for higher needle lift.
3. As far as the influence on the macroscopicSubstituting the values obtained in equation (15),behaviour of the spray is concerned, it can be con-values that are proportional to the mixing time cancluded that the microSAC nozzle has a higherbe obtained. From this table it can be concluded thatspray penetration than the VCO nozzle, whereasthe VCO nozzle behaves better from the point of viewthe spray angle was higher in the VCO than in theof the fuel–air mixing process on account of themicroSAC, which partially explains the betterreduction in the mixing time. This reduction isfuel–air mixing process in the VCO nozzle.around 18 per cent for low injection pressures and it
4. In order to ascertain which flow and macroscopicis reduced to 14 per cent for the highest pressureparameters control the mechanism of fuel–airtested. The reduction in the mixing time with pressuremixing, a theoretical analysis, with the limitationsis due to the fact that the value of the velocity coeffi-that it assumes, has been made. In this study,cient, C
v, becomes higher in the microSAC nozzle
an expression for the mixing time was obtainedthan in the VCO nozzle for high injection pressures.by combining the results of the spray macro-Nevertheless, in spite of this increment in terms ofscopic study with the previously obtained non-velocity, the differences found in terms of the spraydimensional flow parameters. The main conclusioncone angle result in better fuel–air mixing (a shorterof this analysis is that the VCO nozzle behavesmixing time) for the VCO nozzle.better in the fuel mixing process. The differencesobserved in terms of spray cone angle result inthe VCO nozzle having lower mixing times than the5 SUMMARY AND CONCLUSIONSmicroSAC nozzle, despite having lower effectivevelocity values at high injection pressure.In the present study, an experimental investigation
was carried out in order to compare injection charac-teristics and the spray behaviour and to understandthe differences between two real five-hole vertical ACKNOWLEDGEMENTSVCO and microSAC nozzles.
From this study it is possible to draw the following The authors acknowledge that part of this work wasconclusions.
performed within the framework of the D-ISELEproject (GRD1-2000-25210) founded in part by the1. Two different installations were used to charac-European Commission and are grateful to Joseterize the flow across the nozzles under continuousEnrique del Rey and Daniel Lerida for the experi-and pulsating flow. The discharge coefficient ofmental measurements and to Natalie Holmes forthe nozzles was depicted as a function of the
theoretical Reynolds number, l, under steady flow helping to correct the English.
D07704 © IMechE 2005 Proc. IMechE Vol. 219 Part D: J. Automobile Engineering

688 V Bermudez, R Payri, F J Salvador, and A H Plazas
in the nozzle of a vertical multi hole diesel engineREFERENCESinjector. SAE paper 980811, 1998.
17 Afzal, H., Arcoumanis, C., Gavaises, M., and1 Hawley, J. G., Wallace, F. J., and Khalil-Arya, S.Kampanis, N. Internal flow in diesel injector nozzlesA fully analytical treatment of heat release in– modelling and experiments. Proc. Instn Mech.diesel engines. Proc. Instn Mech. Engrs, Part D:Engrs, Part D: J. Automobile Engineering, 1999,J. Automobile Engineering, 2003, 217, 701–717.S492/S2/99.2 Nishimura, T., Satoh, K., Takahashi, S., and
18 De Risi, A., Colangelo, G., and Laforgia, D. AnYokota, K. Effects of fuel injection rate on com-experimental study of high pressure nozzles in con-bustion and emission in a DI diesel engine. SAEsideration of hole-to-hole spray abnormalities. SAEpaper 981929, 1998.paper 2000-01-1250, 2000.3 Singh, I., Zhong, L., Lai, M. C., Henein, N. A.,
19 Holman, J. P. Experimental Methods for Engineers,and Bryzik, W. Effect of nozzle hole geometry on a4th edition, 1984 (McGraw-Hill, New York).HSDI diesel engine-out emissions. SAE paper
20 Bosch, W. The fuel rate indicator: a new measuring2003-01-0704, 2003.instrument for display of the characteristics of
4 Arcoumanis, C., Gavaises, M., and French, B. Effect individual injection. SAE paper 660749, 1966.of fuel injection processes on the structure of diesel 21 Desantes, J. M., Payri, R., Salvador, F. J., andsprays. SAE paper 970799, 1997. Gimeno, J. Measurements of spray momentum for
5 Koo, J. Y., Hong, S. T., Shakal, J. S., and Goto, S. the study of cavitation in diesel injection nozzles.Influence of fuel injector nozzle geometry on SAE paper 2003-01-0703, 2003.internal and external flow characteristics. SAE paper 22 Pastor, J. V., Payri, R., Lopez, J. J., and Julia, J. E.970354, 1997. Effect of injector nozzle geometry of diesel engines
6 Morgan, R., Wray, J., Kennaird, D. A., Crua, C., and on the macroscopic spray characteristics by meansHeikal, M. R. The influence of injector parameters of optical techniques. In Transactions 2003-2 ofon the formation and break-up of a diesel spray. SAE IMechE Two Day Conference on Fuel Injectionpaper 2001-01-0529, 2001. Systems, London, 26–27 November 2002, paper
7 Yu, J. and Bae, C. Dimethyl ether (DME) spray C610/014/2003, pp. 73–82 (Professional Engineeringcharacteristics in a common-rail fuel injection Publishing, Bury St Edmunds and London).system. Proc. Instn Mech. Engrs, Part D: J. Auto- 23 Pastor, J. V., Arregle, J., and Palomares, A. Dieselmobile Engineering, 2003, 217, 1135–1144. spray image segmentation with a likelihood ratio
8 Kampmann, S., Dittus, B., Mattes, P., and test. Appl. Optics, 2001, 40(17).Kirner, M. The influence of hydrogrinding at VCO 24 Hay, P. and Jones, P. L. Comparison of the variousnozzle on the mixture preparation in a DI diesel correlations for spray penetration. SAE paperengine. SAE paper 960867, 1996. 720776, 1972.
9 Payri, F., Bermudez, V., Payri, R., and Salvador, 25 Wakuri, Y., Fujii, M., Amitani, T., and Tsnumeya, R.F. J. The influence of cavitation on the internal flow Studies of the penetration of a fuel spray in a dieseland the spray characteristics in diesel injection engine. Bull. Jap. Soc. Mech. Engrs, 1960, 3(9),nozzles. Fuel, 2004, 83, 419–431. 123–130.
10 Macian, V., Payri, R., Margot, X., and Salvador, F. J. 26 Dent, J. C. A basis for comparison of various experi-A CFD analysis of the influence of diesel nozzle mental methods for studying spray penetration. SAEgeometry on the inception of cavitation. Atomization paper 710571, 1971.and Sprays, 2003, 13(5), 579–604. 27 Sazhin, S. S., Crua, C., Kennaird, D., and Heikal,
M. R. The initial stage of fuel spray penetration. Fuel,11 Andoh, H. and Shiraishi, K. Influence on injection2003, 82, 875–885.and combustion phenomena by elimination of hole
28 Sazhin, S. S., Feng, G., and Heikal, M. R. A modelnozzle sac volume. SAE paper 860416, 1986.for fuel spray penetration. Fuel, 2001, 80, 2171–2180.12 Bae, C. and Kang, J. Diesel spray development of
29 Lefebvre, A. H. Atomization and Sprays. Com-VCO nozzles for high-pressure direct injection. SAEbustion: An International Series, 1989 (Hemispherepaper 2000-01-1254, 2000.Publishing Corporation, New York).13 Bae, C., Yu, J., Kang, J., Kong, J., Cuenca, R.,
30 Siebers, D. Scaling liquid-phase penetration inand Lee, K. O. The influence of injector para-diesel based on mixing-limited vaporization. SAEmeters on diesel spray. In Proceedings of THIESELpaper 950290, 1995.International Conference, 10–13 September 2002,
pp. 55–66.14 Payri, R., Gil, A., Plazas, A. H., and Gimenez, B.
Influence of nozzle seat type on internal flow of con- APPENDIXvergent nozzles. SAE paper 2004-01-2010, 2004.
15 Klomp, E. D. Valve-covered-orifice (VCO) fuel Notationinjection nozzle delivery analysis. Atomization and
AN
total surface of the nozzle orificesSprays, 1999, 9, 541–579.A
osurface of one orifice at the outlet16 Arcoumanis, C., Gavaises, M., Nouri, J. M., Abdul-
Wahab, E., and Horrocks, R. W. Analysis of the flow Ca
contraction coefficient
D07704 © IMechE 2005Proc. IMechE Vol. 219 Part D: J. Automobile Engineering

689Study of the influence of nozzle seat type on injection rate and spray behaviour
CdN
nozzle discharge coefficient S(t) time dependent tip penetrationt timeC
vvelocity coefficient
Di
diameter of the orifice at the inlet tm
(W) mixing time to obtain the fuel–air ratio WU
axisvelocity on the spray axisD
odiameter of the orifice at the outlet
IRDCI injection rate discharge curve indicator Uo
effective outlet velocityU
ththeoretical velocityk conicity factor of the nozzle orifices
=[Di(mm)−D
o(mm)]/10
a orifice inclination angleLRT log-likelihood ratio testDP pressure differential=P
i−P
bm
amass flowrate of air
h angle of the spraymN
fuel mass flowrate through the nozzleh/2 half of the spray cone anglem
ofuel mass flowrate of one nozzle orifice
l theoretical Reynolds numberMo
momentum flux of one orificer
aair densityP
bbackpressure
rf
fuel densityPi
injection pressureSFTR steady flow test rig W fuel–air ratio
D07704 © IMechE 2005 Proc. IMechE Vol. 219 Part D: J. Automobile Engineering


